UNITED STATES
SECURITIES AND EXCHANGE COMMISSION
Washington, D.C. 20549
FORM N-CSR
CERTIFIED SHAREHOLDER REPORT OF REGISTERED
MANAGEMENT INVESTMENT COMPANIES
Investment Company Act file number 811-5361
Variable Insurance Products Fund V
(Exact name of registrant as specified in charter)
82 Devonshire St., Boston, Massachusetts 02109
(Address of principal executive offices) (Zip code)
Scott C. Goebel, Secretary
82 Devonshire St.
Boston, Massachusetts 02109
(Name and address of agent for service)
Registrant's telephone number, including area code: 617-563-7000
Date of fiscal year end: | December 31 |
| |
Date of reporting period: | December 31, 2010 |
This report on Form N-CSR relates solely to the Registrant's Asset Manager Portfolio, Asset Manager: Growth Portfolio, Freedom 2005 Portfolio, Freedom 2010 Portfolio, Freedom 2015 Portfolio, Freedom 2020 Portfolio, Freedom 2025 Portfolio, Freedom 2030 Portfolio, Freedom 2035 Portfolio, Freedom 2040 Portfolio, Freedom 2045 Portfolio, Freedom 2050 Portfolio, Freedom Income Portfolio, Freedom Lifetime Income I Portfolio, Freedom Lifetime Income II Portfolio, Freedom Lifetime Income III Portfolio, FundsManager 20% Portfolio, FundsManager 50% Portfolio, FundsManager 60%, FundsManager 70% Portfolio, FundsManager 85% Portfolio, Investment Grade Bond Portfolio, Investor Freedom 2005 Portfolio, Investor Freedom 2010 Portfolio, Investor Freedom 2015 Portfolio, Investor Freedom 2020 Portfolio, Investor Freedom 2025 Portfolio, Investor Freedom 2030 Portfolio, Investor Freedom Income Portfolio and Strategic Income Portfolio series (each, a "Fund" and collectively, the "Funds").
Item 1. Reports to Stockholders
Fidelity® Variable Insurance Products:
Asset Manager Portfolio
Annual Report
December 31, 2010
(2_fidelity_logos) (Registered_Trademark)
Contents
Performance | <Click Here> | How the fund has done over time. |
Management's Discussion of Fund Performance | <Click Here> | The Portfolio Manager's review of fund performance and strategy. |
Shareholder Expense Example | <Click Here> | An example of shareholder expenses. |
Investment Changes | <Click Here> | A summary of major shifts in the fund's investments over the past six months. |
Investments | <Click Here> | A complete list of the fund's investments with their market values. |
Financial Statements | <Click Here> | Statements of assets and liabilities, operations, and changes in net assets, as well as financial highlights. |
Notes | <Click Here> | Notes to the financial statements. |
Report of Independent Registered Public Accounting Firm | <Click Here> | |
Trustees and Officers | <Click Here> | |
Distributions | <Click Here> | |
Board Approval of Investment Advisory Contracts and Management Fees | <Click Here> | |
To view a fund's proxy voting guidelines and proxy voting record for the 12-month period ended June 30, visit http://www.fidelity.com/proxyvotingresults or visit the Securities and Exchange Commission's (SEC) web site at http://www.sec.gov. You may also call 1-877-208-0098 to request a free copy of the proxy voting guidelines.
Fidelity Variable Insurance Products are separate account options which are purchased through a variable insurance contract.
Standard & Poor's, S&P and S&P 500 are registered service marks of The McGraw-Hill Companies, Inc. and have been licensed for use by Fidelity Distributors Corporation.
Other third party marks appearing herein are the property of their respective owners.
All other marks appearing herein are registered or unregistered trademarks or service marks of FMR LLC or an affiliated company.
The general research services agreement with Fidelity Research & Analysis Company has been terminated and is no longer in effect for the fund.
This report and the financial statements contained herein are submitted for the general information of the shareholders of the fund. This report is not authorized for distribution to prospective investors in the fund unless preceded or accompanied by an effective prospectus.
A fund files its complete schedule of portfolio holdings with the SEC for the first and third quarters of each fiscal year on Form N-Q. Forms N-Q are available on the SEC's web site at http://www.sec.gov. A fund's Forms N-Q may be reviewed and copied at the SEC's Public Reference Room in Washington, DC. Information regarding the operation of the SEC's Public Reference Room may be obtained by calling 1-800-SEC-0330. For a complete list of a fund's portfolio holdings, view the most recent holdings listing, semiannual report, or annual report on Fidelity's web site at http://www.fidelity.com, http://www.advisor.fidelity.com, or http://www.401k.com, as applicable.
NOT FDIC INSURED • MAY LOSE VALUE • NO BANK GUARANTEE
Neither the fund nor Fidelity Distributors Corporation is a bank.
Annual Report
Average annual total return reflects the change in the value of an investment, assuming reinvestment of the class' distributions from dividend income and capital gains (the profits earned upon the sale of securities that have grown in value, if any) and assuming a constant rate of performance each year. During periods of reimbursement by Fidelity, a fund's total return will be greater than it would be had the reimbursement not occurred. Performance numbers are net of all underlying fund operating expenses, but do not include any insurance charges imposed by your insurance company's separate account. If performance information included the effect of these additional charges, the total returns would have been lower. How a fund did yesterday is no guarantee of how it will do tomorrow.
Average Annual Total Returns
Periods ended December 31, 2010 | Past 1
year | Past 5
years | Past 10
years |
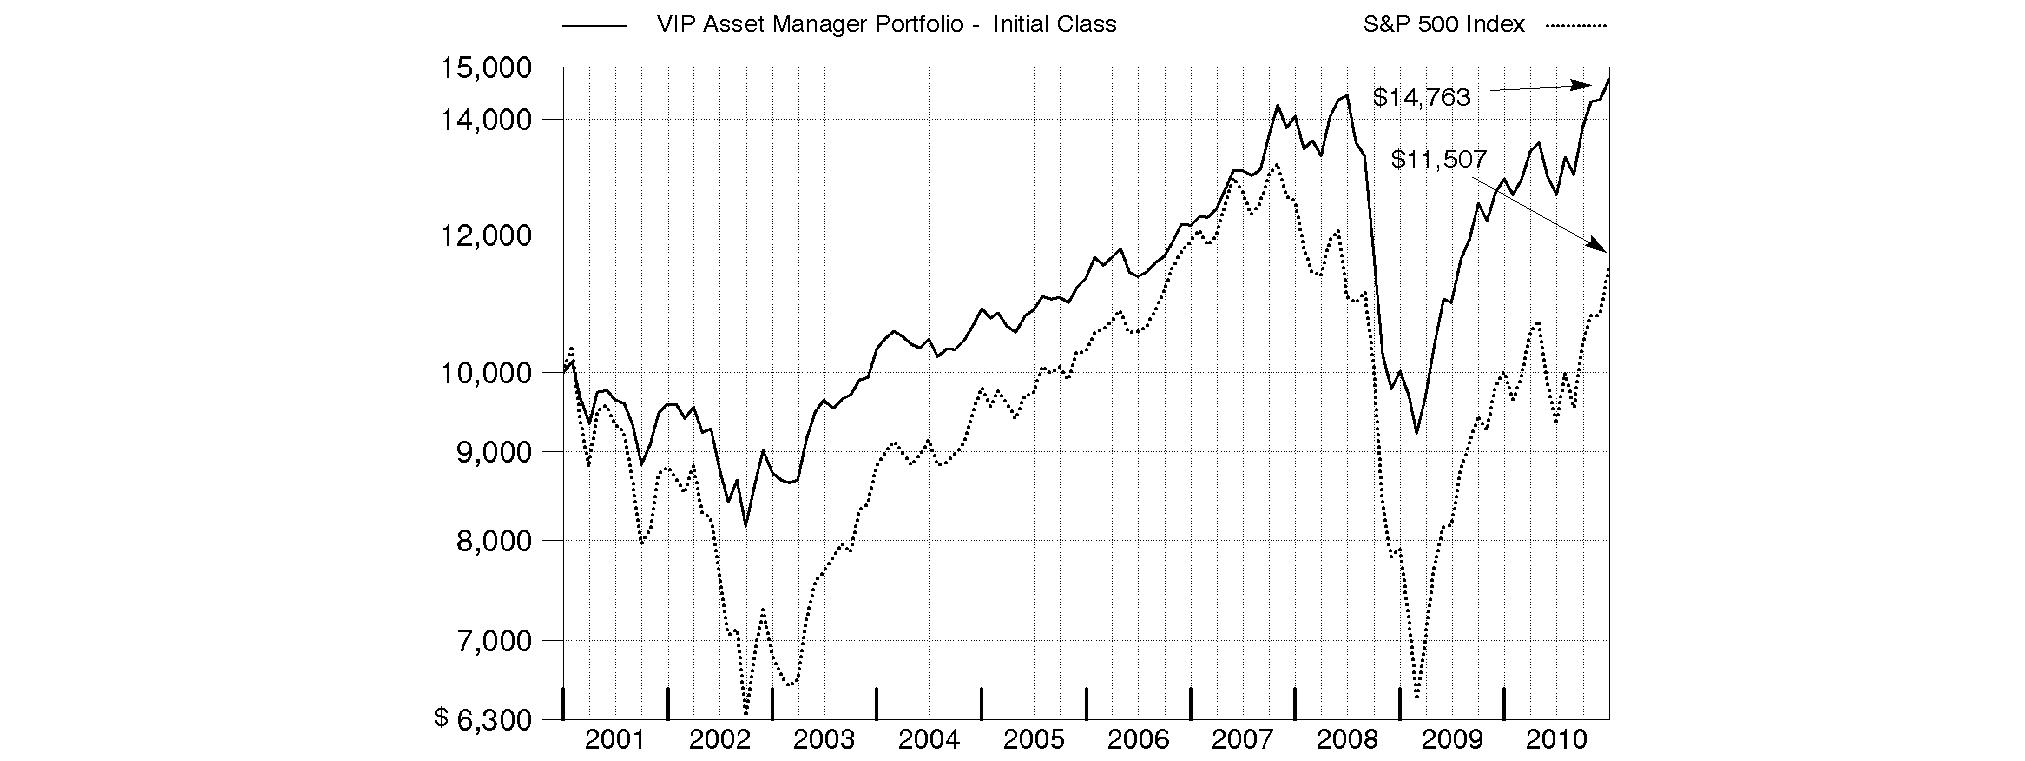
VIP Asset Manager Portfolio - Initial Class | 14.26% | 5.44% | 3.97% |
VIP Asset Manager Portfolio - Service Class | 14.14% | 5.32% | 3.86% |
VIP Asset Manager Portfolio - Service Class 2 | 13.96% | 5.17% | 3.70% |
VIP Asset Manager Portfolio - Investor Class A | 14.16% | 5.33% | 3.91% |
A The initial offering of Investor Class shares took place on July 21, 2005. Returns prior to July 21, 2005 are those of Initial Class. Had Investor Class's transfer agent fee been reflected, returns prior to July 21, 2005 would have been lower.
$10,000 Over 10 Years
Let's say hypothetically that $10,000 was invested in VIP Asset Manager Portfolio - Initial Class on December 31, 2000. The chart shows how the value of your investment would have changed, and also shows how the S&P 500® Index performed over the same period.
Annual Report
Market Recap: While market improvements around the world hit a speed bump in the first half of the 12-month period ending December 31, 2010, world economies re-accelerated in August, supported by a broadening recovery and low inflation in the U.S. Domestic stock markets recorded solid gains for the year, lifted by a strong second-half rally fueled by economic optimism, encouraging earnings reports and a wave of corporate mergers. The large-cap S&P 500® Index rose 15.06%, the blue-chip-laden Dow Jones Industrial AverageSM added 14.06% and the technology-heavy Nasdaq Composite® Index climbed 18.02%. Meanwhile, international stocks, as represented by the MSCI® ACWI® (All Country World Index) ex USA Index, gained 11.29%, boosted in part by a depreciating U.S. dollar. In the fixed-income arena, U.S. taxable investment-grade bonds generated positive results during 2010, as the Barclays Capital® U.S. Aggregate Bond Index gained 6.54%. With ultra-low interest rates bolstering nearly all fixed-income securities for most of the year, sectors in the index with higher yields and more credit risk generally fared best, while most high-quality bonds generated more-moderate returns. Meanwhile, high-yield bonds, as represented by The BofA Merrill LynchSM US High Yield Constrained Index, returned 15.07%, a result of improved economic data and strengthening investor demand. Overseas, foreign bond markets showed mixed results, with a sizable disparity between the 3.97% return of the Citigroup® Non-U.S. Group of 7 Index - which measures the performance of sovereign debt of the major global economies outside the U.S. - and the 12.04% advance of the JPMorgan Emerging Markets Bond Index Global (EMBI Global), which benefited from the rising overall credit quality of emerging-markets debt issuers.
Comments from Geoff Stein, Portfolio Manager of VIP Asset Manager Portfolio: For the year ending December 31, 2010, the fund's share classes significantly outperformed the 10.43% return of the Fidelity Asset Manager 50% Composite Index. (For specific portfolio results, please see the performance section of this report.) Strong security selection among domestic equities and favorable asset allocation drove the fund's return versus the benchmark. Regarding asset allocation, maintaining a somewhat riskier-than-benchmark positioning in a market environment that rewarded risk proved advantageous. Specifically, I modestly overweighted domestic equities, maintained out-of-benchmark stakes in high-yield bonds and emerging-markets equities, and underweighted the more defensive cash and investment-grade bond categories - all of which contributed significantly. Underweighting foreign developed-markets equities also helped. As for security selection, in addition to domestic equities, solid bond picking in the investment-grade bond central fund boosted performance. Within domestic equities, stock selection and an overweighting in the top-performing consumer discretionary sector - which increased as a percentage of assets - added the most. Stock picks in information technology also helped, as did positive overall positioning in health care, materials, industrials, consumer staples and utilities. Among individual holdings, leading contributors included overweightings in computer and mobile device maker Apple, truck-engine manufacturer Cummins, and footwear producer Deckers Outdoor, as well as a non-index investment in Chinese Internet search provider Baidu. We sold our position in Baidu during the period. In fixed income, beneficial sector positioning complemented strong security selection. Overweighting corporate bonds and commercial mortgage-backed securities, generally underweighting residential mortgage-backed securities and adjusting the allocation to U.S. Treasuries as the market environment changed during the year helped the investment-grade bond central fund beat its index. There were no major detractors during the period. Weak positioning in financials and a modest cash stake dampened the domestic equity subportfolio's performance somewhat. But the subportfolio still beat its index by a sizable margin. Individual holdings that disappointed included an out-of-benchmark investment in Canadian smart phone manufacturer Research In Motion and an overweighting in Internet search giant Google.
The views expressed above reflect those of the portfolio manager(s) only through the end of the period as stated on the cover of this report and do not necessarily represent the views of Fidelity or any other person in the Fidelity organization. Any such views are subject to change at any time based upon market or other conditions and Fidelity disclaims any responsibility to update such views. These views may not be relied on as investment advice and, because investment decisions for a Fidelity fund are based on numerous factors, may not be relied on as an indication of trading intent on behalf of any Fidelity fund.
Annual Report
As a shareholder of the Fund, you incur two types of costs: (1) transaction costs, and (2) ongoing costs, including management fees, distribution and/or service (12b-1) fees and other Fund expenses. This Example is intended to help you understand your ongoing costs (in dollars) of investing in the Fund and to compare these costs with the ongoing costs of investing in other mutual funds.
The Example is based on an investment of $1,000 invested at the beginning of the period and held for the entire period (July 1, 2010 to December 31, 2010).
Actual Expenses
The first line of the accompanying table for each class of the Fund provides information about actual account values and actual expenses. You may use the information in this line, together with the amount you invested, to estimate the expenses that you paid over the period. Simply divide your account value by $1,000.00 (for example, an $8,600 account value divided by $1,000.00 = 8.6), then multiply the result by the number in the first line for a class of the Fund under the heading entitled "Expenses Paid During Period" to estimate the expenses you paid on your account during this period. The estimate of expenses does not include any fees or other expenses of any variable annuity or variable life insurance product. If they were, the estimate of expenses you paid during the period would be higher, and your ending account value would be lower. In addition, the Fund, as a shareholder in the underlying Fidelity Central Funds, will indirectly bear its pro-rata share of the fees and expenses incurred by the underlying Fidelity Central Funds. These fees and expenses are not included in the Fund's annualized expense ratio used to calculate the expense estimate in the table below.
Hypothetical Example for Comparison Purposes
The second line of the accompanying table for each class of the Fund provides information about hypothetical account values and hypothetical expenses based on a Class' actual expense ratio and an assumed rate of return of 5% per year before expenses, which is not the Class' actual return. The hypothetical account values and expenses may not be used to estimate the actual ending account balance or expenses you paid for the period. You may use this information to compare the ongoing costs of investing in the Fund and other funds. To do so, compare this 5% hypothetical example with the 5% hypothetical examples that appear in the shareholder reports of the other funds. The estimate of expenses does not include any fees or other expenses of any variable annuity or variable life insurance product. If they were, the estimate of expenses you paid during the period would be higher, and your ending account value would be lower. In addition, the Fund, as a shareholder in the underlying Fidelity Central Funds, will indirectly bear its pro-rata share of the fees and expenses incurred by the underlying Fidelity Central Funds. These fees and expenses are not included in the Fund's annualized expense ratio used to calculate the expense estimate in the table below.
Please note that the expenses shown in the table are meant to highlight your ongoing costs only and do not reflect any transaction costs. Therefore, the second line of the table is useful in comparing ongoing costs only, and will not help you determine the relative total costs of owning different funds.
| Annualized Expense Ratio | Beginning
Account Value
July 1, 2010 | Ending
Account Value
December 31, 2010 | Expenses Paid
During Period*
July 1, 2010
to December 31, 2010 |
Initial Class | .62% | | | |
Actual | | $ 1,000.00 | $ 1,166.00 | $ 3.38 |
HypotheticalA | | $ 1,000.00 | $ 1,022.08 | $ 3.16 |
Service Class | .74% | | | |
Actual | | $ 1,000.00 | $ 1,164.90 | $ 4.04 |
HypotheticalA | | $ 1,000.00 | $ 1,021.48 | $ 3.77 |
Service Class 2 | .88% | | | |
Actual | | $ 1,000.00 | $ 1,164.20 | $ 4.80 |
HypotheticalA | | $ 1,000.00 | $ 1,020.77 | $ 4.48 |
Investor Class | .71% | | | |
Actual | | $ 1,000.00 | $ 1,165.90 | $ 3.88 |
HypotheticalA | | $ 1,000.00 | $ 1,021.63 | $ 3.62 |
A 5% return per year before expenses
* Expenses are equal to each Class' annualized expense ratio, multiplied by the average account value over the period, multiplied by 184/365 (to reflect the one-half year period). The fees and expenses of the underlying Fidelity Central Funds in which the Fund invests are not included in the Fund's annualized expense ratio.
Annual Report
Investment Changes (Unaudited)
The information in the following tables is based on the combined investments of the Fund and its pro-rata share of its investments in each of Fidelity's International Equity and Fixed-Income Central Funds. |
Top Five Stocks as of December 31, 2010 |
| % of fund's
net assets | % of fund's net assets
6 months ago |
Apple, Inc. | 2.1 | 1.6 |
Google, Inc. Class A | 1.2 | 0.0 |
Delta Air Lines, Inc. | 1.0 | 1.1 |
United Continental Holdings, Inc. | 0.8 | 0.9 |
Freeport-McMoRan Copper & Gold, Inc. | 0.7 | 0.0 |
| 5.8 | |
Top Five Bond Issuers as of December 31, 2010 |
(with maturities greater than one year) | % of fund's
net assets | % of fund's net assets
6 months ago |
Fannie Mae | 12.4 | 8.7 |
U.S. Treasury Obligations | 10.2 | 12.1 |
Ginnie Mae | 1.2 | 1.1 |
Freddie Mac | 1.0 | 1.0 |
Morgan Stanley | 0.3 | 0.4 |
| 25.1 | |
Top Five Market Sectors as of December 31, 2010 |
| % of fund's
net assets | % of fund's net assets
6 months ago |
Consumer Discretionary | 12.4 | 9.0 |
Financials | 12.1 | 14.2 |
Information Technology | 11.3 | 8.7 |
Industrials | 8.6 | 9.0 |
Materials | 7.0 | 3.6 |
Asset Allocation (% of fund's net assets) |
As of December 31, 2010 * | As of June 30, 2010 ** |
 | Stock class *** 54.2% | | | Stock class **** 48.2% | |
 | Bond class 40.7% | | | Bond class 41.7% | |
 | Short-term class 5.1% | | | Short-term class 10.1% | |
* Foreign investments | 23.6% | | ** Foreign investments | 19.5% | |

*** Includes Commodities & Related Investments of 1.6%.
**** Includes Commodities & Related Investments of 1.5%.
Asset allocations in the pie charts reflect the categorization of assets as defined in the fund's prospectus in effect as of the time periods indicated above. Financial Statement categorizations conform to accounting standards and will differ from the pie chart. Percentages are adjusted for the effect of futures contracts and swap contracts, if applicable.
A holdings listing for the Fund, which presents direct holdings as well as the pro-rata share of any securities and other investments held indirectly through its investment in underlying International Equity and Fixed-Income Central Funds, is available at advisor.fidelity.com.
Annual Report
Investments December 31, 2010
Showing Percentage of Net Assets
Common Stocks - 37.3% |
| Shares | | Value |
CONSUMER DISCRETIONARY - 8.3% |
Auto Components - 0.5% |
Autoliv, Inc. | 19,200 | | $ 1,515,648 |
BorgWarner, Inc. (a) | 73,200 | | 5,296,752 |
| | 6,812,400 |
Automobiles - 0.7% |
Bayerische Motoren Werke AG (BMW) | 84,657 | | 6,661,020 |
Daimler AG (Germany) (a) | 24,335 | | 1,650,546 |
General Motors Co. | 61,200 | | 2,255,832 |
| | 10,567,398 |
Diversified Consumer Services - 0.1% |
Anhanguera Educacional Participacoes SA | 46,000 | | 1,108,734 |
Hotels, Restaurants & Leisure - 0.8% |
Chipotle Mexican Grill, Inc. (a) | 15,800 | | 3,360,028 |
Las Vegas Sands Corp. (a) | 55,200 | | 2,536,440 |
Panera Bread Co. Class A (a) | 25,900 | | 2,621,339 |
Starwood Hotels & Resorts Worldwide, Inc. | 58,600 | | 3,561,708 |
| | 12,079,515 |
Household Durables - 0.4% |
Cyrela Brazil Realty SA | 155,000 | | 2,040,764 |
Gafisa SA sponsored ADR (d) | 285,400 | | 4,146,862 |
| | 6,187,626 |
Internet & Catalog Retail - 1.2% |
Amazon.com, Inc. (a) | 50,200 | | 9,036,000 |
E-Commerce China Dangdang, Inc. ADR | 34,600 | | 936,622 |
Expedia, Inc. | 98,900 | | 2,481,401 |
Priceline.com, Inc. (a) | 10,900 | | 4,355,095 |
| | 16,809,118 |
Leisure Equipment & Products - 0.1% |
Hasbro, Inc. | 32,500 | | 1,533,350 |
Media - 0.3% |
Discovery Communications, Inc. (a) | 41,300 | | 1,722,210 |
Grupo Televisa SA de CV (CPO) sponsored ADR | 76,300 | | 1,978,459 |
| | 3,700,669 |
Multiline Retail - 1.2% |
Dollarama, Inc. (a) | 20,500 | | 591,793 |
Droga Raia SA | 42,000 | | 643,837 |
Macy's, Inc. | 352,500 | | 8,918,250 |
Nordstrom, Inc. | 96,800 | | 4,102,384 |
Target Corp. | 45,900 | | 2,759,967 |
| | 17,016,231 |
Specialty Retail - 0.8% |
China ZhengTong Auto Services Holdings Ltd. | 566,000 | | 533,777 |
Tiffany & Co., Inc. | 73,000 | | 4,545,710 |
Williams-Sonoma, Inc. | 167,700 | | 5,985,213 |
| | 11,064,700 |
|
| Shares | | Value |
Textiles, Apparel & Luxury Goods - 2.2% |
Coach, Inc. | 118,200 | | $ 6,537,642 |
Deckers Outdoor Corp. (a) | 96,600 | | 7,702,884 |
Fossil, Inc. (a) | 59,900 | | 4,221,752 |
LVMH Moet Hennessy - Louis Vuitton | 6,330 | | 1,041,821 |
NIKE, Inc. Class B | 12,300 | | 1,050,666 |
Phillips-Van Heusen Corp. | 84,300 | | 5,311,743 |
Steven Madden Ltd. (a) | 35,900 | | 1,497,748 |
The Swatch Group AG (Bearer) | 4,990 | | 2,226,086 |
Vera Bradley, Inc. | 46,100 | | 1,521,300 |
| | 31,111,642 |
TOTAL CONSUMER DISCRETIONARY | | 117,991,383 |
CONSUMER STAPLES - 0.6% |
Beverages - 0.1% |
Hansen Natural Corp. (a) | 28,900 | | 1,510,892 |
Personal Products - 0.5% |
Estee Lauder Companies, Inc. Class A | 49,000 | | 3,954,300 |
Hengan International Group Co. Ltd. | 352,500 | | 3,040,865 |
| | 6,995,165 |
TOTAL CONSUMER STAPLES | | 8,506,057 |
ENERGY - 3.4% |
Energy Equipment & Services - 1.2% |
Dril-Quip, Inc. (a) | 29,600 | | 2,300,512 |
Saipem SpA | 47,758 | | 2,352,324 |
Schlumberger Ltd. | 111,213 | | 9,286,286 |
Transocean Ltd. (a) | 49,700 | | 3,454,647 |
| | 17,393,769 |
Oil, Gas & Consumable Fuels - 2.2% |
Alpha Natural Resources, Inc. (a) | 75,900 | | 4,556,277 |
Anadarko Petroleum Corp. | 37,900 | | 2,886,464 |
Cimarex Energy Co. | 26,600 | | 2,354,898 |
Concho Resources, Inc. (a) | 62,400 | | 5,470,608 |
OAO Gazprom sponsored ADR | 31,600 | | 803,904 |
Peabody Energy Corp. | 49,000 | | 3,135,020 |
Pioneer Natural Resources Co. | 63,500 | | 5,513,070 |
Tesoro Corp. | 43,700 | | 810,198 |
Uranium One, Inc. | 133,000 | | 634,794 |
Whiting Petroleum Corp. (a) | 47,000 | | 5,507,930 |
| | 31,673,163 |
TOTAL ENERGY | | 49,066,932 |
FINANCIALS - 2.0% |
Capital Markets - 0.4% |
BlackRock, Inc. Class A | 29,800 | | 5,679,284 |
Commercial Banks - 1.1% |
Banco do Brasil SA | 194,300 | | 3,678,651 |
BBVA Banco Frances SA sponsored ADR | 126,500 | | 1,467,400 |
Huntington Bancshares, Inc. | 23,200 | | 159,384 |
Common Stocks - continued |
| Shares | | Value |
FINANCIALS - continued |
Commercial Banks - continued |
Itau Unibanco Banco Multiplo SA ADR | 177,300 | | $ 4,256,973 |
Wells Fargo & Co. | 178,700 | | 5,537,913 |
| | 15,100,321 |
Diversified Financial Services - 0.5% |
Apollo Global Management LLC (e) | 315,200 | | 2,521,600 |
JPMorgan Chase & Co. | 121,800 | | 5,166,756 |
| | 7,688,356 |
TOTAL FINANCIALS | | 28,467,961 |
HEALTH CARE - 2.7% |
Biotechnology - 0.6% |
Gilead Sciences, Inc. (a) | 89,400 | | 3,239,856 |
United Therapeutics Corp. (a) | 77,200 | | 4,880,584 |
| | 8,120,440 |
Health Care Equipment & Supplies - 0.4% |
Edwards Lifesciences Corp. (a) | 47,100 | | 3,807,564 |
Volcano Corp. (a) | 98,300 | | 2,684,573 |
| | 6,492,137 |
Health Care Providers & Services - 1.3% |
Express Scripts, Inc. (a) | 165,400 | | 8,939,870 |
HMS Holdings Corp. (a) | 31,800 | | 2,059,686 |
Medco Health Solutions, Inc. (a) | 120,300 | | 7,370,781 |
| | 18,370,337 |
Health Care Technology - 0.1% |
SXC Health Solutions Corp. (a) | 39,100 | | 1,670,169 |
Pharmaceuticals - 0.3% |
Valeant Pharmaceuticals International, Inc. | 136,750 | | 3,877,760 |
TOTAL HEALTH CARE | | 38,530,843 |
INDUSTRIALS - 5.9% |
Aerospace & Defense - 0.5% |
BE Aerospace, Inc. (a) | 27,100 | | 1,003,513 |
Goodrich Corp. | 40,800 | | 3,593,256 |
Precision Castparts Corp. | 14,500 | | 2,018,545 |
| | 6,615,314 |
Air Freight & Logistics - 0.1% |
Air Lease Corp. Class A (a)(e) | 59,100 | | 1,211,550 |
Airlines - 1.8% |
Delta Air Lines, Inc. (a) | 1,113,725 | | 14,032,935 |
United Continental Holdings, Inc. (a) | 502,570 | | 11,971,217 |
| | 26,004,152 |
Construction & Engineering - 0.0% |
Fluor Corp. | 13,100 | | 868,006 |
Electrical Equipment - 0.2% |
Emerson Electric Co. | 48,600 | | 2,778,462 |
|
| Shares | | Value |
Machinery - 2.9% |
Caterpillar, Inc. | 90,700 | | $ 8,494,962 |
Changsha Zoomlion Heavy Industry Science & Technology Development Co. Ltd. (H Shares) | 414,600 | | 936,684 |
Cummins, Inc. | 71,900 | | 7,909,719 |
Dover Corp. | 64,300 | | 3,758,335 |
Kennametal, Inc. | 126,600 | | 4,995,636 |
MAN SE | 34,198 | | 4,068,865 |
PACCAR, Inc. | 32,900 | | 1,889,118 |
Parker Hannifin Corp. | 76,300 | | 6,584,690 |
Sandvik AB | 107,400 | | 2,095,508 |
Weg SA | 19,800 | | 260,095 |
| | 40,993,612 |
Road & Rail - 0.4% |
CSX Corp. | 43,300 | | 2,797,613 |
Union Pacific Corp. | 29,600 | | 2,742,736 |
| | 5,540,349 |
Trading Companies & Distributors - 0.0% |
Mills Estruturas e Servicos de Engenharia SA (a) | 49,000 | | 608,237 |
TOTAL INDUSTRIALS | | 84,619,682 |
INFORMATION TECHNOLOGY - 9.7% |
Communications Equipment - 1.4% |
HTC Corp. | 52,000 | | 1,604,388 |
Juniper Networks, Inc. (a) | 196,700 | | 7,262,164 |
Research In Motion Ltd. (a) | 115,700 | | 6,725,641 |
Riverbed Technology, Inc. (a) | 104,600 | | 3,678,782 |
| | 19,270,975 |
Computers & Peripherals - 3.0% |
Apple, Inc. (a) | 93,800 | | 30,256,129 |
EMC Corp. (a) | 152,700 | | 3,496,830 |
NetApp, Inc. (a) | 168,700 | | 9,271,752 |
| | 43,024,711 |
Internet Software & Services - 2.0% |
Akamai Technologies, Inc. (a) | 51,400 | | 2,418,370 |
eBay, Inc. (a) | 117,100 | | 3,258,893 |
Google, Inc. Class A (a) | 28,600 | | 16,987,542 |
Mail.ru Group Ltd. GDR unit (a)(e) | 10,500 | | 378,000 |
Rackspace Hosting, Inc. (a) | 26,300 | | 826,083 |
Tencent Holdings Ltd. | 175,300 | | 3,809,350 |
YouKu.com, Inc. ADR (a) | 29,400 | | 1,029,294 |
| | 28,707,532 |
IT Services - 0.5% |
Cognizant Technology Solutions Corp. Class A (a) | 103,200 | | 7,563,528 |
Semiconductors & Semiconductor Equipment - 1.4% |
ARM Holdings PLC sponsored ADR | 99,000 | | 2,054,250 |
Broadcom Corp. Class A | 195,800 | | 8,527,090 |
Marvell Technology Group Ltd. (a) | 267,400 | | 4,960,270 |
NVIDIA Corp. (a) | 55,600 | | 856,240 |
Common Stocks - continued |
| Shares | | Value |
INFORMATION TECHNOLOGY - continued |
Semiconductors & Semiconductor Equipment - continued |
NXP Semiconductors NV | 119,300 | | $ 2,496,949 |
TriQuint Semiconductor, Inc. (a) | 89,600 | | 1,047,424 |
| | 19,942,223 |
Software - 1.4% |
Citrix Systems, Inc. (a) | 61,900 | | 4,234,579 |
Informatica Corp. (a) | 179,800 | | 7,916,594 |
NCsoft Corp. | 4,413 | | 820,612 |
RealPage, Inc. | 56,600 | | 1,750,638 |
Rovi Corp. (a) | 13,800 | | 855,738 |
Solera Holdings, Inc. | 32,600 | | 1,673,032 |
Taleo Corp. Class A (a) | 68,500 | | 1,894,025 |
| | 19,145,218 |
TOTAL INFORMATION TECHNOLOGY | | 137,654,187 |
MATERIALS - 4.6% |
Chemicals - 3.0% |
Celanese Corp. Class A | 104,100 | | 4,285,797 |
CF Industries Holdings, Inc. | 56,400 | | 7,622,460 |
Dow Chemical Co. | 209,800 | | 7,162,572 |
Ferro Corp. (a) | 77,200 | | 1,130,208 |
FMC Corp. | 65,600 | | 5,240,784 |
LyondellBasell Industries NV Class A (a) | 201,100 | | 6,917,840 |
PPG Industries, Inc. | 67,100 | | 5,641,097 |
Rockwood Holdings, Inc. (a) | 72,600 | | 2,840,112 |
Uralkali JSC GDR (Reg. S) | 63,300 | | 2,324,376 |
| | 43,165,246 |
Metals & Mining - 1.6% |
Alcoa, Inc. | 323,400 | | 4,977,126 |
Anglo American PLC (United Kingdom) | 22,100 | | 1,150,058 |
Freeport-McMoRan Copper & Gold, Inc. | 78,100 | | 9,379,029 |
Stillwater Mining Co. (a) | 118,100 | | 2,521,435 |
United States Steel Corp. (d) | 68,800 | | 4,019,296 |
| | 22,046,944 |
TOTAL MATERIALS | | 65,212,190 |
TELECOMMUNICATION SERVICES - 0.1% |
Wireless Telecommunication Services - 0.1% |
NII Holdings, Inc. (a) | 49,500 | | 2,210,670 |
TOTAL COMMON STOCKS (Cost $391,462,439) | 532,259,905 |
Nonconvertible Preferred Stocks - 0.2% |
| Shares | | Value |
CONSUMER DISCRETIONARY - 0.2% |
Automobiles - 0.2% |
Volkswagen AG (Cost $2,221,499) | 14,600 | | $ 2,369,752 |
Fixed-Income Funds - 41.6% |
| | | |
Fidelity Floating Rate Central Fund (g) | 458,055 | | 45,723,024 |
Fidelity High Income Central Fund 1 (g) | 544,214 | | 52,973,765 |
Fidelity VIP Investment Grade Central Fund (g) | 4,701,507 | | 494,551,472 |
TOTAL FIXED-INCOME FUNDS (Cost $576,599,687) | 593,248,261 |
Equity Funds - 16.2% |
| | | |
Commodity Funds - 1.6% |
Fidelity Commodity Strategy Central Fund (g) | 1,804,742 | | 22,829,987 |
International Equity Funds - 14.6% |
Fidelity Emerging Markets Equity Central Fund (g) | 198,436 | | 44,864,395 |
Fidelity International Equity Central Fund (g) | 2,284,088 | | 162,878,293 |
TOTAL INTERNATIONAL EQUITY FUNDS | | 207,742,688 |
TOTAL EQUITY FUNDS (Cost $224,711,669) | 230,572,675 |
Money Market Funds - 5.0% |
| | | |
Fidelity Cash Central Fund, 0.19% (b) | 33,232,414 | | 33,232,414 |
Fidelity Money Market Central Fund, 0.40% (b) | 30,296,089 | | 30,296,089 |
Fidelity Securities Lending Cash Central Fund, 0.21% (b)(c) | 7,701,750 | | 7,701,750 |
TOTAL MONEY MARKET FUNDS (Cost $71,230,253) | 71,230,253 |
U.S. Treasury Obligations - 0.1% |
| Principal Amount | | |
U.S. Treasury Bills, yield at date of purchase 0.12% 1/13/11 (f)
(Cost $849,963) | | $ 850,000 | | 849,992 |
TOTAL INVESTMENT PORTFOLIO - 100.4% (Cost $1,267,075,510) | 1,430,530,838 |
NET OTHER ASSETS (LIABILITIES) - (0.4)% | (5,293,361) |
NET ASSETS - 100% | $ 1,425,237,477 |
Futures Contracts |
| Expiration Date | | Underlying Face Amount at Value | | Unrealized Appreciation/(Depreciation) |
Purchased |
Equity Index Contracts |
98 CME E-mini MSCI EAFE Index Contracts | March 2011 | | $ 8,138,900 | | $ 152,832 |
|
The face value of futures purchased as a percentage of net assets is 0.6% |
Legend |
(a) Non-income producing |
(b) Affiliated fund that is available only to investment companies and other accounts managed by Fidelity Investments. The rate quoted is the annualized seven-day yield of the fund at period end. A complete unaudited listing of the fund's holdings as of its most recent quarter end is available upon request. In addition, each Fidelity Central Fund's financial statements, which are not covered by the Fund's Report of Independent Registered Public Accounting Firm, are available on the SEC's website or upon request. |
(c) Investment made with cash collateral received from securities on loan. |
(d) Security or a portion of the security is on loan at period end. |
(e) Security exempt from registration under Rule 144A of the Securities Act of 1933. These securities may be resold in transactions exempt from registration, normally to qualified institutional buyers. At the end of the period, the value of these securities amounted to $4,111,150 or 0.3% of net assets. |
(f) Security or a portion of the security was pledged to cover margin requirements for futures contracts. At the period end, the value of securities pledged amounted to $849,992. |
(g) Affiliated fund that is available only to investment companies and other accounts managed by Fidelity Investments. A complete unaudited schedule of portfolio holdings for each Fidelity Central Fund is filed with the SEC for the first and third quarters of each fiscal year on Form N-Q and is available upon request or at the SEC's web site at www.sec.gov. An unaudited holdings listing for the Fund, which presents direct holdings as well as the pro rata share of securities and other investments held indirectly through its investment in underlying Fidelity International Equity and Fixed-Income Central Funds, is available at advisor.fidelity.com. In addition, each Fidelity Central Fund's financial statements, which are not covered by the Fund's Report of Independent Registered Public Accounting Firm, are available on the SEC's web site or upon request. |
Affiliated Central Funds |
Information regarding fiscal year to date income earned by the Fund from investments in Fidelity Central Funds is as follows: |
Fund | Income earned |
Fidelity Cash Central Fund | $ 135,312 |
Fidelity Commodity Strategy Central Fund | 9,949 |
Fidelity Emerging Markets Equity Central Fund | 455,866 |
Fidelity Floating Rate Central Fund | 1,105,803 |
Fidelity High Income Central Fund 1 | 4,342,306 |
Fidelity International Equity Central Fund | 3,512,665 |
Fidelity Money Market Central Fund | 35,703 |
Fidelity Securities Lending Cash Central Fund | 40,279 |
Fidelity VIP Investment Grade Central Fund | 18,465,953 |
Total | $ 28,103,836 |
Additional information regarding the Fund's fiscal year to date purchases and sales, including the ownership percentage, of the non Money Market Central Funds is as follows: |
Fund | Value,
beginning of period | Purchases | Sales
Proceeds | Value,
end of period | % ownership, end of period |
Fidelity Commodity Strategy Central Fund | $ 14,116,056 | $ 13,688,876 | $ 7,053,476 | $ 22,829,987 | 8.4% |
Fidelity Emerging Markets Equity Central Fund | 29,539,978 | 8,032,959 | - | 44,864,395 | 9.2% |
Fidelity Floating Rate Central Fund | 16,359,922 | 27,111,567 | - | 45,723,024 | 1.6% |
Fidelity High Income Central Fund 1 | 55,262,376 | 4,342,305 | 10,014,368 | 52,973,765 | 9.0% |
Fidelity International Equity Central Fund | 162,876,514 | 3,512,665 | 15,404,010 | 162,878,293 | 9.2% |
Fidelity VIP Investment Grade Central Fund | 504,626,110 | 55,409,571 | 70,115,786 | 494,551,472 | 13.2% |
Total | $ 782,780,956 | $ 112,097,943 | $ 102,587,640 | $ 823,820,936 | |
Other Information |
The following is a summary of the inputs used, as of December 31, 2010, involving the Fund's assets and liabilities carried at fair value. The inputs or methodology used for valuing securities may not be an indication of the risk associated with investing in those securities. For more information on valuation inputs, and their aggregation into the levels used in the tables below, please refer to the Security Valuation section in the accompanying Notes to Financial Statements. |
Valuation Inputs at Reporting Date: |
Description | Total | Level 1 | Level 2 | Level 3 |
Investments in Securities: | | | | |
Equities: | | | | |
Consumer Discretionary | $ 120,361,135 | $ 120,361,135 | $ - | $ - |
Consumer Staples | 8,506,057 | 8,506,057 | - | - |
Energy | 49,066,932 | 49,066,932 | - | - |
Financials | 28,467,961 | 25,946,361 | 2,521,600 | - |
Health Care | 38,530,843 | 38,530,843 | - | - |
Industrials | 84,619,682 | 83,408,132 | - | 1,211,550 |
Information Technology | 137,654,187 | 137,654,187 | - | - |
Materials | 65,212,190 | 65,212,190 | - | - |
Telecommunication Services | 2,210,670 | 2,210,670 | - | - |
U.S. Government and Government Agency Obligations | 849,992 | - | 849,992 | - |
Fixed-Income Funds | 593,248,261 | 593,248,261 | - | - |
Money Market Funds | 71,230,253 | 71,230,253 | - | - |
Equity Funds | 230,572,675 | 230,572,675 | - | - |
Total Investments in Securities: | $ 1,430,530,838 | $ 1,425,947,696 | $ 3,371,592 | $ 1,211,550 |
Derivative Instruments: | | | | |
Assets | | | | |
Futures Contracts | $ 152,832 | $ 152,832 | $ - | $ - |
The following is a reconciliation of Investments in Securities for which Level 3 inputs were used in determining value: |
Investments in Securities: | |
Beginning Balance | $ - |
Total Realized Gain (Loss) | - |
Total Unrealized Gain (Loss) | 29,550 |
Cost of Purchases | 1,182,000 |
Proceeds of Sales | - |
Amortization/Accretion | - |
Transfers in to Level 3 | - |
Transfers out of Level 3 | - |
Ending Balance | $ 1,211,550 |
The change in unrealized gain (loss) for the period attributable to Level 3 securities held at December 31, 2010 | $ 29,550 |
The information used in the above reconciliation represents fiscal year to date activity for any Investments in Securities identified as using Level 3 inputs at either the beginning or the end of the current fiscal period. Transfers in or out of Level 3 represent the beginning value of any Security or Instrument where a change in the pricing level occurred from the beginning to the end of the period. The cost of purchases and the proceeds of sales may include securities received or delivered through corporate actions or exchanges. Realized and unrealized gains (losses) disclosed in the reconciliation are included in Net Gain (Loss) on the Fund's Statement of Operations. |
Value of Derivative Instruments |
The following table is a summary of the Fund's value of derivative instruments by risk exposure as of December 31, 2010. For additional information on derivative instruments, please refer to the Derivative Instruments section in the accompanying Notes to Financial Statements. |
Risk Exposure /
Derivative Type | Value |
| Asset | Liability |
Equity Risk | | |
Futures Contracts (a) | $ 152,832 | $ - |
Total Equity Risk | $ 152,832 | $ - |
(a) Reflects cumulative appreciation/(depreciation) on futures contracts as disclosed on the Schedule of Investments. Only the period end variation margin is separately disclosed on the Statement of Assets and Liabilities. |
The information in the following tables is based on the combined investments of the Fund and its pro-rata share of its investments of Fidelity's International Equity and Fixed-Income Central Funds. |
The composition of credit quality ratings as a percentage of net assets is as follows (Unaudited): |
U.S. Government and U.S. Government Agency Obligations | 25.1% |
AAA,AA,A | 6.7% |
BBB | 4.7% |
BB | 2.9% |
B | 2.8% |
CCC,CC,C | 0.8% |
Not Rated | 1.1% |
Equities | 54.2% |
Short-Term Investments and Net Other Assets | 1.7% |
| 100.0% |
We have used ratings from Moody's Investors Service, Inc. Where Moody's® ratings are not available, we have used S&P® ratings. All ratings are as of the report date and do not reflect subsequent changes. Percentages are adjusted for the effect of futures contracts, if applicable. |
Distribution of investments by country of issue, as a percentage of total net assets, is as follows: (Unaudited) |
United States of America | 76.4% |
United Kingdom | 3.1% |
Germany | 1.9% |
Japan | 1.8% |
Brazil | 1.7% |
Canada | 1.7% |
France | 1.5% |
Netherlands | 1.4% |
Switzerland | 1.3% |
Cayman Islands | 1.1% |
Others (Individually Less Than 1%) | 8.1% |
| 100.0% |
Income Tax Information |
At December 31, 2010, the Fund had a capital loss carryforward of approximately $137,245,675 of which $103,924,134 and $33,321,541 will expire in fiscal 2016 and 2017, respectively. Capital loss carryforwards are only available to offset future capital gains of the Fund to the extent provided by regulations and may be limited. |
See accompanying notes which are an integral part of the financial statements.
Annual Report
Statement of Assets and Liabilities
| December 31, 2010 |
| | |
Assets | | |
Investment in securities, at value (including securities loaned of $7,463,725) - See accompanying schedule: Unaffiliated issuers (cost $394,533,901) | $ 535,479,649 | |
Fidelity Central Funds (cost $872,541,609) | 895,051,189 | |
Total Investments (cost $1,267,075,510) | | $ 1,430,530,838 |
Cash | | 458 |
Receivable for investments sold | | 3,698,785 |
Receivable for fund shares sold | | 542,171 |
Dividends receivable | | 169,975 |
Distributions receivable from Fidelity Central Funds | | 7,191 |
Receivable for daily variation on futures contracts | | 54,880 |
Prepaid expenses | | 3,303 |
Other receivables | | 87,764 |
Total assets | | 1,435,095,365 |
| | |
Liabilities | | |
Payable for investments purchased | $ 837,501 | |
Payable for fund shares redeemed | 483,617 | |
Accrued management fee | 598,520 | |
Distribution and service plan fees payable | 8,810 | |
Other affiliated payables | 133,401 | |
Other payables and accrued expenses | 94,289 | |
Collateral on securities loaned, at value | 7,701,750 | |
Total liabilities | | 9,857,888 |
| | |
Net Assets | | $ 1,425,237,477 |
Net Assets consist of: | | |
Paid in capital | | $ 1,377,508,895 |
Undistributed net investment income | | 13,054 |
Accumulated undistributed net realized gain (loss) on investments and foreign currency transactions | | (115,893,636) |
Net unrealized appreciation (depreciation) on investments and assets and liabilities in foreign currencies | | 163,609,164 |
Net Assets | | $ 1,425,237,477 |
Statement of Assets and Liabilities - continued
| December 31, 2010 |
| | |
Initial Class:
Net Asset Value, offering price and redemption price per share ($1,279,305,624 ÷ 87,973,537 shares) | | $ 14.54 |
| | |
Service Class:
Net Asset Value, offering price and redemption price per share ($8,612,637 ÷ 595,943 shares) | | $ 14.45 |
| | |
Service Class 2:
Net Asset Value, offering price and redemption price per share ($39,148,045 ÷ 2,737,406 shares) | | $ 14.30 |
| | |
Investor Class:
Net Asset Value, offering price and redemption price per share ($98,171,171 ÷ 6,776,723 shares) | | $ 14.49 |
See accompanying notes which are an integral part of the financial statements.
Annual Report
Statement of Operations
| Year ended December 31, 2010 |
| | |
Investment Income | | |
Dividends | | $ 3,632,214 |
Interest | | 974 |
Income from Fidelity Central Funds | | 28,103,836 |
Total income | | 31,737,024 |
| | |
Expenses | | |
Management fee | $ 6,907,190 | |
Transfer agent fees | 1,096,425 | |
Distribution and service plan fees | 105,070 | |
Accounting and security lending fees | 549,535 | |
Custodian fees and expenses | 53,033 | |
Independent trustees' compensation | 5,286 | |
Appreciation in deferred trustee compensation account | 180 | |
Audit | 49,329 | |
Legal | 10,968 | |
Miscellaneous | 19,681 | |
Total expenses before reductions | 8,796,697 | |
Expense reductions | (240,576) | 8,556,121 |
Net investment income (loss) | | 23,180,903 |
Realized and Unrealized Gain (Loss) Net realized gain (loss) on: | | |
Investment securities: | | |
Unaffiliated issuers | 86,630,513 | |
Fidelity Central Funds | 5,709,782 | |
Foreign currency transactions | (131,113) | |
Futures contracts | 2,252,824 | |
Capital gain distributions from Fidelity Central Funds | 17,137,643 | |
Total net realized gain (loss) | | 111,599,649 |
Change in net unrealized appreciation (depreciation) on: Investment securities | 46,729,651 | |
Assets and liabilities in foreign currencies | (3,843) | |
Futures contracts | 152,832 | |
Total change in net unrealized appreciation (depreciation) | | 46,878,640 |
Net gain (loss) | | 158,478,289 |
Net increase (decrease) in net assets resulting from operations | | $ 181,659,192 |
Statement of Changes in Net Assets
| Year ended December 31, 2010 | Year ended December 31, 2009 |
Increase (Decrease) in Net Assets | | |
Operations | | |
Net investment income (loss) | $ 23,180,903 | $ 28,241,405 |
Net realized gain (loss) | 111,599,649 | (15,677,068) |
Change in net unrealized appreciation (depreciation) | 46,878,640 | 301,781,112 |
Net increase (decrease) in net assets resulting from operations | 181,659,192 | 314,345,449 |
Distributions to shareholders from net investment income | (22,808,550) | (29,225,472) |
Distributions to shareholders from net realized gain | (6,928,726) | (2,058,644) |
Total distributions | (29,737,276) | (31,284,116) |
Share transactions - net increase (decrease) | (91,985,209) | (106,930,344) |
Total increase (decrease) in net assets | 59,936,707 | 176,130,989 |
| | |
Net Assets | | |
Beginning of period | 1,365,300,770 | 1,189,169,781 |
End of period (including undistributed net investment income of $13,054 and undistributed net investment income of $510,507, respectively) | $ 1,425,237,477 | $ 1,365,300,770 |
See accompanying notes which are an integral part of the financial statements.
Annual Report
Financial Highlights - Initial Class
Years ended December 31, | 2010 | 2009 | 2008 | 2007 | 2006 |
Selected Per-Share Data | | | | | |
Net asset value, beginning of period | $ 13.00 | $ 10.31 | $ 16.58 | $ 15.71 | $ 15.04 |
Income from Investment Operations | | | | | |
Net investment income (loss) C | .23 | .26 | .36 | .44 | .44 |
Net realized and unrealized gain (loss) | 1.62 | 2.73 | (4.75) | 1.88 | .64 |
Total from investment operations | 1.85 | 2.99 | (4.39) | 2.32 | 1.08 |
Distributions from net investment income | (.24) | (.28) | (.37) | (1.00) | (.41) |
Distributions from net realized gain | (.07) | (.02) | (1.51) | (.45) | - |
Total distributions | (.31) | (.30) | (1.88) | (1.45) | (.41) |
Net asset value, end of period | $ 14.54 | $ 13.00 | $ 10.31 | $ 16.58 | $ 15.71 |
Total Return A, B | 14.26% | 29.11% | (28.76)% | 15.57% | 7.32% |
Ratios to Average Net Assets D, F | | | | | |
Expenses before reductions | .63% | .67% | .63% | .63% | .65% |
Expenses net of fee waivers, if any | .63% | .67% | .63% | .63% | .65% |
Expenses net of all reductions | .62% | .66% | .63% | .62% | .63% |
Net investment income (loss) | 1.72% | 2.31% | 2.62% | 2.75% | 2.90% |
Supplemental Data | | | | | |
Net assets, end of period (000 omitted) | $ 1,279,306 | $ 1,249,955 | $ 1,093,133 | $ 1,791,647 | $ 2,080,545 |
Portfolio turnover rate E | 54% | 95% | 90% | 99% | 173% |
A Total returns do not reflect charges attributable to your insurance company's separate account. Inclusion of these charges would reduce the total returns shown.
B Total returns would have been lower had certain expenses not been reduced during the periods shown.
C Calculated based on average shares outstanding during the period.
D Fees and expenses of the underlying Fidelity Central Funds are not included in the Fund's expense ratio. The Fund indirectly bears its proportionate share of the expenses of any underlying Fidelity Central Funds.
E Amount does not include the portfolio activity of any underlying Fidelity Central Funds.
F Expense ratios reflect operating expenses of the class. Expenses before reductions do not reflect amounts reimbursed by the investment adviser or reductions from brokerage service arrangements or reductions from other expense offset arrangements and do not represent the amount paid by the class during periods when reimbursements or reductions occur. Expenses net of fee waivers reflect expenses after reimbursement by the investment adviser but prior to reductions from brokerage service arrangements or other expense offset arrangements. Expenses net of all reductions represent the net expenses paid by the class.
Financial Highlights - Service Class
Years ended December 31, | 2010 | 2009 | 2008 | 2007 | 2006 |
Selected Per-Share Data | | | | | |
Net asset value, beginning of period | $ 12.92 | $ 10.25 | $ 16.48 | $ 15.61 | $ 14.94 |
Income from Investment Operations | | | | | |
Net investment income (loss) C | .22 | .25 | .34 | .42 | .42 |
Net realized and unrealized gain (loss) | 1.60 | 2.71 | (4.71) | 1.86 | .64 |
Total from investment operations | 1.82 | 2.96 | (4.37) | 2.28 | 1.06 |
Distributions from net investment income | (.22) | (.27) | (.35) | (.96) | (.39) |
Distributions from net realized gain | (.07) | (.02) | (1.51) | (.45) | - |
Total distributions | (.29) | (.29) | (1.86) | (1.41) | (.39) |
Net asset value, end of period | $ 14.45 | $ 12.92 | $ 10.25 | $ 16.48 | $ 15.61 |
Total Return A, B | 14.14% | 28.94% | (28.82)% | 15.36% | 7.24% |
Ratios to Average Net Assets D, F | | | | | |
Expenses before reductions | .75% | .79% | .75% | .74% | .76% |
Expenses net of fee waivers, if any | .74% | .79% | .75% | .74% | .76% |
Expenses net of all reductions | .73% | .78% | .75% | .74% | .74% |
Net investment income (loss) | 1.60% | 2.18% | 2.50% | 2.63% | 2.79% |
Supplemental Data | | | | | |
Net assets, end of period (000 omitted) | $ 8,613 | $ 8,230 | $ 7,413 | $ 13,530 | $ 24,021 |
Portfolio turnover rate E | 54% | 95% | 90% | 99% | 173% |
A Total returns do not reflect charges attributable to your insurance company's separate account. Inclusion of these charges would reduce the total returns shown.
B Total returns would have been lower had certain expenses not been reduced during the periods shown.
C Calculated based on average shares outstanding during the period.
D Fees and expenses of the underlying Fidelity Central Funds are not included in the Fund's expense ratio. The Fund indirectly bears its proportionate share of the expenses of any underlying Fidelity Central Funds.
E Amount does not include the portfolio activity of any underlying Fidelity Central Funds.
F Expense ratios reflect operating expenses of the class. Expenses before reductions do not reflect amounts reimbursed by the investment adviser or reductions from brokerage service arrangements or reductions from other expense offset arrangements and do not represent the amount paid by the class during periods when reimbursements or reductions occur. Expenses net of fee waivers reflect expenses after reimbursement by the investment adviser but prior to reductions from brokerage service arrangements or other expense offset arrangements. Expenses net of all reductions represent the net expenses paid by the class.
See accompanying notes which are an integral part of the financial statements.
Annual Report
Financial Highlights - Service Class 2
Years ended December 31, | 2010 | 2009 | 2008 | 2007 | 2006 |
Selected Per-Share Data | | | | | |
Net asset value, beginning of period | $ 12.79 | $ 10.15 | $ 16.34 | $ 15.47 | $ 14.82 |
Income from Investment Operations | | | | | |
Net investment income (loss) C | .19 | .23 | .32 | .39 | .39 |
Net realized and unrealized gain (loss) | 1.59 | 2.68 | (4.67) | 1.85 | .63 |
Total from investment operations | 1.78 | 2.91 | (4.35) | 2.24 | 1.02 |
Distributions from net investment income | (.20) | (.25) | (.33) | (.92) | (.37) |
Distributions from net realized gain | (.07) | (.02) | (1.51) | (.45) | - |
Total distributions | (.27) | (.27) | (1.84) | (1.37) | (.37) |
Net asset value, end of period | $ 14.30 | $ 12.79 | $ 10.15 | $ 16.34 | $ 15.47 |
Total Return A, B | 13.96% | 28.76% | (28.95)% | 15.24% | 7.06% |
Ratios to Average Net Assets D, F | | | | | |
Expenses before reductions | .90% | .93% | .90% | .89% | .92% |
Expenses net of fee waivers, if any | .89% | .93% | .90% | .89% | .92% |
Expenses net of all reductions | .88% | .92% | .89% | .89% | .90% |
Net investment income (loss) | 1.46% | 2.04% | 2.36% | 2.48% | 2.64% |
Supplemental Data | | | | | |
Net assets, end of period (000 omitted) | $ 39,148 | $ 39,475 | $ 37,360 | $ 59,670 | $ 55,585 |
Portfolio turnover rate E | 54% | 95% | 90% | 99% | 173% |
A Total returns do not reflect charges attributable to your insurance company's separate account. Inclusion of these charges would reduce the total returns shown.
B Total returns would have been lower had certain expenses not been reduced during the periods shown.
C Calculated based on average shares outstanding during the period.
D Fees and expenses of the underlying Fidelity Central Funds are not included in the Fund's expense ratio. The Fund indirectly bears its proportionate share of the expenses of any underlying Fidelity Central Funds.
E Amount does not include the portfolio activity of any underlying Fidelity Central Funds.
F Expense ratios reflect operating expenses of the class. Expenses before reductions do not reflect amounts reimbursed by the investment adviser or reductions from brokerage service arrangements or reductions from other expense offset arrangements and do not represent the amount paid by the class during periods when reimbursements or reductions occur. Expenses net of fee waivers reflect expenses after reimbursement by the investment adviser but prior to reductions from brokerage service arrangements or other expense offset arrangements. Expenses net of all reductions represent the net expenses paid by the class.
Financial Highlights - Investor Class
Years ended December 31, | 2010 | 2009 | 2008 | 2007 | 2006 |
Selected Per-Share Data | | | | | |
Net asset value, beginning of period | $ 12.96 | $ 10.28 | $ 16.53 | $ 15.67 | $ 15.03 |
Income from Investment Operations | | | | | |
Net investment income (loss) C | .22 | .25 | .34 | .42 | .42 |
Net realized and unrealized gain (loss) | 1.61 | 2.73 | (4.72) | 1.87 | .63 |
Total from investment operations | 1.83 | 2.98 | (4.38) | 2.29 | 1.05 |
Distributions from net investment income | (.23) | (.28) | (.36) | (.98) | (.41) |
Distributions from net realized gain | (.07) | (.02) | (1.51) | (.45) | - |
Total distributions | (.30) | (.30) | (1.87) | (1.43) | (.41) |
Net asset value, end of period | $ 14.49 | $ 12.96 | $ 10.28 | $ 16.53 | $ 15.67 |
Total Return A, B | 14.16% | 29.01% | (28.79)% | 15.38% | 7.16% |
Ratios to Average Net Assets D, F | | | | | |
Expenses before reductions | .72% | .77% | .73% | .75% | .78% |
Expenses net of fee waivers, if any | .71% | .77% | .73% | .75% | .78% |
Expenses net of all reductions | .70% | .76% | .72% | .74% | .76% |
Net investment income (loss) | 1.63% | 2.21% | 2.53% | 2.63% | 2.77% |
Supplemental Data | | | | | |
Net assets, end of period (000 omitted) | $ 98,171 | $ 67,641 | $ 51,264 | $ 46,555 | $ 27,092 |
Portfolio turnover rate E | 54% | 95% | 90% | 99% | 173% |
A Total returns do not reflect charges attributable to your insurance company's separate account. Inclusion of these charges would reduce the total returns shown.
B Total returns would have been lower had certain expenses not been reduced during the periods shown.
C Calculated based on average shares outstanding during the period.
D Fees and expenses of the underlying Fidelity Central Funds are not included in the Fund's expense ratio. The Fund indirectly bears its proportionate share of the expenses of any underlying Fidelity Central Funds.
E Amount does not include the portfolio activity of any underlying Fidelity Central Funds.
F Expense ratios reflect operating expenses of the class. Expenses before reductions do not reflect amounts reimbursed by the investment adviser or reductions from brokerage service arrangements or reductions from other expense offset arrangements and do not represent the amount paid by the class during periods when reimbursements or reductions occur. Expenses net of fee waivers reflect expenses after reimbursement by the investment adviser but prior to reductions from brokerage service arrangements or other expense offset arrangements. Expenses net of all reductions represent the net expenses paid by the class.
See accompanying notes which are an integral part of the financial statements.
Annual Report
Notes to Financial Statements
For the period ended December 31, 2010
1. Organization.
VIP Asset Manager Portfolio (the Fund) is a fund of Variable Insurance Products Fund V (the Trust) and is authorized to issue an unlimited number of shares. The Trust is registered under the Investment Company Act of 1940, as amended (the 1940 Act), as an open-end management investment company organized as a Massachusetts business trust. Shares of the Fund may only be purchased by insurance companies for the purpose of funding variable annuity or variable life insurance contracts. The Fund offers the following classes of shares: Initial Class shares, Service Class shares, Service Class 2 shares and Investor Class shares. All classes have equal rights and voting privileges, except for matters affecting a single class. Investment income, realized and unrealized capital gains and losses, the common expenses of the Fund, and certain fund-level expense reductions, if any, are allocated on a pro-rata basis to each class based on the relative net assets of each class to the total net assets of the Fund. Each class differs with respect to transfer agent and distribution and service plan fees incurred. Certain expense reductions may also differ by class.
2. Investments in Fidelity Central Funds.
The Fund may invest in Fidelity Central Funds, which are open-end investment companies available only to other investment companies and accounts managed by Fidelity Management & Research Company (FMR) and its affiliates. The Fund's Schedule of Investments lists each of the Fidelity Central Funds held as of period end, if any, as an investment of the Fund, but does not include the underlying holdings of each Fidelity Central Fund. As an Investing Fund, the Fund indirectly bears its proportionate share of the expenses of the underlying Fidelity Central Funds.
Based on their investment objective, each Fidelity Central Fund may invest or participate in various investment vehicles or strategies that are similar to those of the Fund. These strategies are consistent with the investment objectives of the Fund and may involve certain economic risks which may cause a decline in value of each of the Fidelity Central Funds and thus a decline in the value of the Fund. The following summarizes the Fund's investment in each Fidelity Central Fund.
Fidelity Central Fund | Investment Manager | Investment Objective | Investment Practices |
Fidelity Commodity Strategy Central Fund | FMR Co., Inc. (FMRC) | Seeks to provide investment returns that correspond to the performance of the commodities market. | Investment in wholly-owned subsidiary organized under the laws of the Cayman Islands Futures Repurchase Agreements Swap Agreements |
Fidelity Emerging Markets Equity Central Fund | FMRC | Seeks capital appreciation by investing primarily in equity securities of issuers in emerging markets. | Foreign Securities Repurchase Agreements Restricted Securities |
Fidelity International Equity Central Fund | FMRC | Seeks capital appreciation by investing primarily in non-U.S. based common stocks, including securities of issuers located in emerging markets. | Foreign Securities Repurchase Agreements |
Fidelity Floating Rate Central Fund | FMRC | Seeks a high level of income by normally investing in floating rate loans and other floating rate securities. | Loans & Direct Debt Instruments Repurchase Agreements Restricted Securities |
Fidelity High Income Central Fund 1 | FMRC | Seeks a high level of income and may also seek capital appreciation by investing primarily in debt securities, preferred stocks, and convertible securities, with an emphasis on lower-quality debt securities. | Loans & Direct Debt Instruments Repurchase Agreements Restricted Securities |
VIP Investment Grade Central Fund | Fidelity Investments Money Management, Inc. (FIMM) | Seeks a high level of current income by normally investing in investment-grade debt securities and repurchase agreements. | Delayed Delivery & When Issued Securities Loans & Direct Debt Instruments Repurchase Agreements Restricted Securities Swap Agreements |
Fidelity Money Market Central Funds | FIMM | Seeks to obtain a high level of current income consistent with the preservation of capital and liquidity. | Short-Term Investments |
An unaudited holdings listing for the Fund, which presents direct holdings as well as the pro-rata share of any securities and other investments held indirectly through its investment in each of Fidelity's International Equity and Fixed-Income Central Funds, is available at advisor.fidelity.com. A complete unaudited list of holdings for each Fidelity Central Fund is available upon request or at the Securities and Exchange Commission (the SEC) web site at www.sec.gov. In addition, the financial statements of the Fidelity Central Funds which contain the significant accounting policies (including security valuation policies) of those funds, which are not covered by the Fund's Report of Independent Registered Public Accounting Firm, are available on the SEC web site or upon request.
Annual Report
Notes to Financial Statements - continued
3. Significant Accounting Policies.
The financial statements have been prepared in conformity with accounting principles generally accepted in the United States of America (GAAP), which require management to make certain estimates and assumptions at the date of the financial statements. Actual results could differ from those estimates. Subsequent events, if any, through the date that the financial statements were issued have been evaluated in the preparation of the financial statements. The following summarizes the significant accounting policies of the Fund:
Security Valuation. Investments are valued as of 4:00 p.m. Eastern time on the last calendar day of the period. The Fund uses independent pricing services approved by the Board of Trustees to value its investments. When current market prices or quotations are not readily available or reliable, valuations may be determined in good faith in accordance with procedures adopted by the Board of Trustees. Factors used in determining value may include market or security specific events. The frequency with which these procedures are used cannot be predicted and they may be utilized to a significant extent. The value used for net asset value (NAV) calculation under these procedures may differ from published prices for the same securities.
The Fund categorizes the inputs to valuation techniques used to value its investments into a disclosure hierarchy consisting of three levels as shown below.
Level 1 - quoted prices in active markets for identical investments
Level 2 - other significant observable inputs (including quoted prices for similar investments, interest rates, prepayment speeds, etc.)
Level 3 - unobservable inputs (including the Fund's own assumptions based on the best information available)
Changes in valuation techniques may result in transfers in or out of an assigned level within the disclosure hierarchy. The aggregate value of investments by input level, as of December 31, 2010, as well as a roll forward of Level 3 securities, is included at the end of the Fund's Schedule of Investments. Valuation techniques used to value the Fund's investments by major category are as follows.
Equity securities, including restricted securities, for which market quotations are readily available, are valued at the last reported sale price or official closing price as reported by an independent pricing service on the primary market or exchange on which they are traded and are categorized as Level 1 in the hierarchy. In the event there were no sales during the day or closing prices are not available, securities are valued at the last quoted bid price or may be valued using the last available price and are generally categorized as Level 2 in the hierarchy. For foreign equity securities, when significant market or security specific events arise, comparisons to the valuation of American Depositary Receipts (ADRs), futures contracts, Exchange-traded funds (ETFs) and certain indexes as well as quoted prices for similar securities are used and are categorized as Level 2 in the hierarchy in these circumstances. Utilizing these techniques may result in transfers between Level 1 and Level 2. For restricted equity securities and private placements where observable inputs are limited, assumptions about market activity and risk are used and are categorized as Level 3 in the hierarchy.
Futures contracts are valued at the settlement price established each day by the board of trade or exchange on which they are traded and are categorized as Level 1 in the hierarchy. Investments in open-end mutual funds, including the Fidelity Central Funds, are valued at their closing net asset value each business day and are categorized as Level 1 in the hierarchy. Short-term securities with remaining maturities of sixty days or less for which quotations are not readily available are valued at amortized cost, which approximates fair value and are categorized as Level 2 in the hierarchy.
Foreign Currency. The Fund uses foreign currency contracts to facilitate transactions in foreign-denominated securities. Gains and losses from these transactions may arise from changes in the value of the foreign currency or if the counterparties do not perform under the contracts' terms.
Foreign-denominated assets, including investment securities, and liabilities are translated into U.S. dollars at the exchange rate at period end. Purchases and sales of investment securities, income and dividends received and expenses denominated in foreign currencies are translated into U.S. dollars at the exchange rate in effect on the transaction date.
The effects of exchange rate fluctuations on investments are included with the net realized and unrealized gain (loss) on investment securities. Other foreign currency transactions resulting in realized and unrealized gain (loss) are disclosed separately.
Investment Transactions and Income. For financial reporting purposes, the Fund's investment holdings and NAV include trades executed through the end of the last business day of the period. The NAV per share for processing shareholder transactions is calculated as of the close of business of the New York Stock Exchange (NYSE), normally 4:00 p.m. Eastern time and includes trades executed through the end of the prior business day. Gains and losses on securities sold are determined on the basis of identified cost and may include proceeds received from litigation. Dividend income is recorded on the ex-dividend date, except for certain dividends from foreign securities where the ex-dividend date may have passed, which are recorded as soon as the Fund is informed of the ex-dividend date. Non-cash dividends included in dividend income, if any, are recorded at the fair market value of the securities received. Distributions received on securities that represent a return of capital or capital gain are recorded as a reduction of cost of investments and/or as a realized gain. The Fund estimates the components of distributions received that may be considered return of capital distributions or capital gain distributions. Interest income and distributions from the Fidelity Central Funds are accrued as earned. Interest income includes coupon interest and amortization of premium and accretion of discount on debt securities. Investment income is recorded net of foreign taxes withheld where recovery of such taxes is uncertain.
Annual Report
3. Significant Accounting Policies - continued
Expenses. Expenses directly attributable to a fund are charged to that fund. Expenses attributable to more than one fund are allocated among the respective funds on the basis of relative net assets or other appropriate methods. Expense estimates are accrued in the period to which they relate and adjustments are made when actual amounts are known.
Deferred Trustee Compensation. Under a Deferred Compensation Plan (the Plan), independent Trustees may elect to defer receipt of a portion of their annual compensation. Deferred amounts are invested in a cross-section of Fidelity funds, are marked-to-market and remain in the Fund until distributed in accordance with the Plan. The investment of deferred amounts and the offsetting payable to the Trustees are included in the accompanying Statement of Assets and Liabilities.
Income Tax Information and Distributions to Shareholders. Each year the Fund intends to qualify as a regulated investment company, including distributing substantially all of its taxable income and realized gains under Subchapter M of the Internal Revenue Code and filing its U.S. federal tax return. As a result, no provision for income taxes is required. As of December 31, 2010, the Fund did not have any unrecognized tax benefits in the accompanying financial statements. A fund's federal tax return is subject to examination by the Internal Revenue Service (IRS) for a period of three years. Foreign taxes are provided for based on the Fund's understanding of the tax rules and rates that exist in the foreign markets in which it invests.
Distributions are declared and recorded on the ex-dividend date. Income dividends and capital gain distributions are declared separately for each class. Income and capital gain distributions are determined in accordance with income tax regulations, which may differ from GAAP.
Capital accounts within the financial statements are adjusted for permanent book-tax differences. These adjustments have no impact on net assets or the results of operations. Temporary book-tax differences will reverse in a subsequent period.
Book-tax differences are primarily due to the short-term gain distributions from the Fidelity Central Funds, in-kind transactions, futures transactions, foreign currency transactions, market discount, partnerships (including allocations from Fidelity Central Funds), deferred trustee compensation, capital loss carryforwards and losses deferred due to wash sales.
The federal tax cost of investment securities and unrealized appreciation (depreciation) as of period end were as follows:
Gross unrealized appreciation | $ 230,493,102 |
Gross unrealized depreciation | (31,784,245) |
Net unrealized appreciation (depreciation) | $ 198,708,857 |
| |
Tax Cost | $ 1,231,821,981 |
The tax-based components of distributable earnings as of period end were as follows:
Undistributed ordinary income | $ 289,114 |
Capital loss carryforward | $ (137,245,675) |
Net unrealized appreciation (depreciation) | $ 198,709,861 |
The tax character of distributions paid was as follows:
| December 31, 2010 | December 31, 2009 |
Ordinary Income | $ 29,737,276 | $ 31,284,116 |
4. Operating Policies.
Restricted Securities. The Fund may invest in securities that are subject to legal or contractual restrictions on resale. These securities generally may be resold in transactions exempt from registration or to the public if the securities are registered. Disposal of these securities may involve time-consuming negotiations and expense, and prompt sale at an acceptable price may be difficult. Information regarding restricted securities is included at the end of the Fund's Schedule of Investments.
Annual Report
Notes to Financial Statements - continued
5. Derivative Instruments.
Risk Exposures and the Use of Derivative Instruments. The Fund uses derivative instruments (derivatives), including futures contracts in order to meet its investment objectives. The strategy is to use derivatives to increase returns and to manage exposure to certain risks as defined below. The success of any strategy involving derivatives depends on analysis of numerous economic factors, and if the strategies for investment do not work as intended, the Fund may not achieve its objectives.
The Fund's use of derivatives may increase or decrease its exposure to the following risk:
Equity Risk | Equity risk relates to the fluctuations in the value of financial instruments as a result of changes in market prices (other than those arising from interest rate risk or foreign exchange risk), whether caused by factors specific to an individual investment, its issuer, or all factors affecting all instruments traded in a market or market segment. |
The Fund is also exposed to additional risks from investing in derivatives, such as liquidity risk and counterparty credit risk. Liquidity risk is the risk that the Fund will be unable to sell the derivative in the open market in a timely manner. Counterparty credit risk is the risk that the counterparty will not be able to fulfill its obligation to the Fund. The Fund's maximum risk of loss from counterparty credit risk is generally the aggregate unrealized appreciation and unpaid counterparty fees in excess of any collateral pledged by the counterparty to the Fund. Counterparty risk related to exchange-traded futures contracts is minimal because of the protection provided by the exchange on which they trade. Risk of loss may exceed the amounts recognized in the Statement of Assets and Liabilities.
Futures Contracts. A futures contract is an agreement between two parties to buy or sell a specified underlying instrument for a fixed price at a specified future date. The Fund uses futures contracts to manage its exposure to the stock market.
Upon entering into a futures contract, a fund is required to deposit either cash or securities (initial margin) with a clearing broker in an amount equal to a certain percentage of the face value of the contract. Futures contracts are marked-to-market daily and subsequent payments (variation margin) are made or received by a fund depending on the daily fluctuations in the value of the futures contracts and are recorded as unrealized appreciation or (depreciation). Realized gain or (loss) is recorded upon the expiration or closing of a futures contract.
The underlying face amount at value of open futures contracts at period end is shown in the Schedule of Investments under the caption "Futures Contracts." This amount reflects each contract's exposure to the underlying instrument at period end and is representative of activity for the period. Securities deposited to meet initial margin requirements are identified in the Schedule of Investments. The receivable and/or payable for the variation margin are reflected in the Statement of Assets and Liabilities.
Certain risks may arise upon entering into futures contracts, including the risk that an illiquid market may limit the ability to close out a futures contract prior to settlement date.
During the period the Fund recognized net realized gain (loss) of $2,252,824 and a change in net unrealized appreciation (depreciation) of $152,832 related to its investment in futures contracts. These amounts are included in the Statement of Operations.
6. Purchases and Sales of Investments.
Purchases and sales of securities, other than short-term securities, aggregated $686,556,121 and $779,465,842, respectively.
7. Fees and Other Transactions with Affiliates.
Management Fee. FMR and its affiliates provide the Fund with investment management related services for which the Fund pays a monthly management fee. The management fee is the sum of an individual fund fee rate that is based on an annual rate of .25% of the Fund's average net assets and a group fee rate that averaged .26% during the period. The group fee rate is based upon the average net assets of all the mutual funds advised by FMR. The group fee rate decreases as assets under management increase and increases as assets under management decrease. For the period, the total annual management fee rate was .51% of the Fund's average net assets.
The Fund has invested in the Fidelity Commodity Strategy Central Fund, which in turn invests in a wholly-owned subsidiary that invests in commodity-linked derivative instruments. FMR has contractually agreed to waive the Fund's management fee in an amount equal to its proportionate share of the management fee paid to FMR by the subsidiary based on the Fund's proportionate ownership of the Fidelity Commodity Strategy Central Fund. Fees waived totaled $8,290 for the period.
Annual Report
7. Fees and Other Transactions with Affiliates - continued
Distribution and Service Plan Fees. In accordance with Rule 12b-1 of the 1940 Act, the Fund has adopted separate 12b-1 Plans for each Service Class of shares. Each Service Class pays Fidelity Distributors Corporation (FDC), an affiliate of FMR, a service fee. For the period, the service fee is based on an annual rate of .10% of Service Class' average net assets and .25% of Service Class 2's average net assets.
For the period, total fees, all of which were re-allowed to insurance companies for the distribution of shares and providing shareholder support services were as follows:
Service Class | $ 8,664 |
Service Class 2 | 96,406 |
| $ 105,070 |
Transfer Agent Fees. Fidelity Investments Institutional Operations Company, Inc. (FIIOC), an affiliate of FMR, is the Fund's transfer, dividend disbursing, and shareholder servicing agent. FIIOC receives an asset-based fee with respect to each class. Each class (with the exception of Investor Class) pays a transfer agent fee, excluding out of pocket expenses, equal to an annual rate of .07% of average net assets. Investor Class pays a monthly asset-based transfer agent fee of .15% of average net assets. In addition, FIIOC receives an asset-based fee of .01% of average net assets for typesetting, printing and mailing of shareholder reports, except proxy statements. FIIOC has agreed to voluntarily waive this fee until December 31, 2010. (See Note 10: Expense Reductions.) For the period, transfer agent fees for each class, including printing and out of pocket expenses, were as follows:
Initial Class | $ 930,855 |
Service Class | 7,983 |
Service Class 2 | 34,211 |
Investor Class | 123,376 |
| $ 1,096,425 |
Accounting and Security Lending Fees. Fidelity Service Company, Inc. (FSC), an affiliate of FMR, maintains the Fund's accounting records. The accounting fee is based on the level of average net assets for the month. Under a separate contract, FSC administers the security lending program. The security lending fee is based on the number and duration of lending transactions.
Brokerage Commissions. The Fund placed a portion of its portfolio transactions with brokerage firms which are affiliates of the investment adviser. The commissions paid to these affiliated firms were $14,327 for the period.
8. Committed Line of Credit.
The Fund participates with other funds managed by FMR or an affiliate in a $3.75 billion credit facility (the "line of credit") to be utilized for temporary or emergency purposes to fund shareholder redemptions or for other short-term liquidity purposes. The Fund has agreed to pay commitment fees on its pro-rata portion of the line of credit, which amounted to $5,316 and is reflected in Miscellaneous expenses on the Statement of Operations. During the period, there were no borrowings on this line of credit.
9. Security Lending.
The Fund lends portfolio securities through a lending agent from time to time in order to earn additional income. The lending agent may loan securities to certain qualified borrowers, including Fidelity Capital Markets (FCM), a broker-dealer affiliated with the Fund. On the settlement date of the loan, the Fund receives collateral (in the form of U.S. Treasury obligations, letters of credit and/or cash) against the loaned securities and maintains collateral in an amount not less than 100% of the market value of the loaned securities during the period of the loan. The market value of the loaned securities is determined at the close of business of the Fund and any additional required collateral is delivered to the Fund on the next business day. If the borrower defaults on its obligation to return the securities loaned because of insolvency or other reasons, a fund could experience delays and costs in recovering the securities loaned or in gaining access to the collateral. Any cash collateral received is invested in the Fidelity Securities Lending Cash Central Fund. The value of loaned securities and cash collateral at period end are disclosed on the Fund's Statement of Assets and Liabilities. Security lending income represents the income earned on investing cash collateral, less rebates paid to borrowers and lending agent fees associated with the loan, plus any premium payments received for lending certain types of securities. Security lending income is presented in the Statement of Operations as a component of income from Fidelity Central Funds. Total security lending income during the period amounted to $40,279. During the period, there were no securities loaned to FCM.
Annual Report
Notes to Financial Statements - continued
10. Expense Reductions.
FMR or its affiliates agreed to waive certain fees during the period as noted in the table below.
Initial Class | $ 89,473 |
Service Class | 628 |
Service Class 2 | 2,795 |
Investor Class | 5,504 |
| $ 98,400 |
Many of the brokers with whom FMR places trades on behalf of the Fund provided services to the Fund in addition to trade execution. These services included payments of certain expenses on behalf of the Fund totaling $133,870 for the period. In addition, through arrangements with the Fund's custodian, credits realized as a result of uninvested cash balances were used to reduce the Fund's expenses. During the period, these credits reduced the Fund's custody expenses by $16.
11. Distributions to Shareholders.
Distributions to shareholders of each class were as follows:
Years ended December 31, | 2010 | 2009 |
From net investment income | | |
Initial Class | $ 20,670,020 | $ 26,891,577 |
Service Class | 130,466 | 169,095 |
Service Class 2 | 539,940 | 773,072 |
Investor Class | 1,468,124 | 1,391,728 |
Total | $ 22,808,550 | $ 29,225,472 |
From net realized gain | | |
Initial Class | $ 6,228,074 | $ 1,883,866 |
Service Class | 42,354 | 12,475 |
Service Class 2 | 193,184 | 60,915 |
Investor Class | 465,114 | 101,388 |
Total | $ 6,928,726 | $ 2,058,644 |
12. Share Transactions.
Transactions for each class of shares were as follows:
| Shares | Dollars |
Years ended December 31, | 2010 | 2009 | 2010 | 2009 |
Initial Class | | | | |
Shares sold | 2,953,816 | 3,094,632 | $ 40,305,021 | $ 36,278,491 |
Reinvestment of distributions | 1,875,132 | 2,267,624 | 26,898,094 | 28,775,443 |
Shares redeemed | (12,990,962) | (15,262,713) | (175,862,426) | (169,609,788) |
Net increase (decrease) | (8,162,014) | (9,900,457) | $ (108,659,311) | $ (104,555,854) |
Service Class | | | | |
Shares sold | 217,938 | 165,414 | $ 2,870,314 | $ 1,916,594 |
Reinvestment of distributions | 12,117 | 14,416 | 172,820 | 181,570 |
Shares redeemed | (270,940) | (266,270) | (3,659,374) | (3,042,535) |
Net increase (decrease) | (40,885) | (86,440) | $ (616,240) | $ (944,371) |
Service Class 2 | | | | |
Shares sold | 317,970 | 781,888 | $ 4,248,620 | $ 9,131,267 |
Reinvestment of distributions | 51,977 | 66,945 | 733,124 | 833,987 |
Shares redeemed | (718,587) | (1,444,406) | (9,598,684) | (16,443,612) |
Net increase (decrease) | (348,640) | (595,573) | $ (4,616,940) | $ (6,478,358) |
Investor Class | | | | |
Shares sold | 2,175,761 | 1,221,053 | $ 30,128,589 | $ 14,777,890 |
Reinvestment of distributions | 135,106 | 117,966 | 1,933,238 | 1,493,116 |
Shares redeemed | (754,597) | (1,106,415) | (10,154,545) | (11,222,767) |
Net increase (decrease) | 1,556,270 | 232,604 | $ 21,907,282 | $ 5,048,239 |
Annual Report
13. Other.
The Fund's organizational documents provide former and current trustees and officers with a limited indemnification against liabilities arising in connection with the performance of their duties to the Fund. In the normal course of business, the Fund may also enter into contracts that provide general indemnifications. The Fund's maximum exposure under these arrangements is unknown as this would be dependent on future claims that may be made against the Fund. The risk of material loss from such claims is considered remote.
At the end of the period, FMR or its affiliates were the owners of record of 31% of the total outstanding shares of the Fund and two otherwise unaffiliated shareholders were the owners of record of 28% of the total outstanding shares of the Fund.
Annual Report
Report of Independent Registered Public Accounting Firm
To the Trustees of Variable Insurance Products Fund V and Shareholders of VIP Asset Manager Portfolio:
We have audited the accompanying statement of assets and liabilities of VIP Asset Manager Portfolio (the Fund), a fund of Variable Insurance Products Fund V, including the schedule of investments, as of December 31, 2010, and the related statement of operations for the year then ended, the statement of changes in net assets for each of the two years in the period then ended, and the financial highlights for each of the five years in the period then ended. These financial statements and financial highlights are the responsibility of the Fund's management. Our responsibility is to express an opinion on these financial statements and financial highlights based on our audits.
We conducted our audits in accordance with the standards of the Public Company Accounting Oversight Board (United States). Those standards require that we plan and perform the audit to obtain reasonable assurance about whether the financial statements and financial highlights are free of material misstatement. The Fund is not required to have, nor were we engaged to perform, an audit of its internal control over financial reporting. Our audits included consideration of internal control over financial reporting as a basis for designing audit procedures that are appropriate in the circumstances, but not for the purpose of expressing an opinion on the effectiveness of the Fund's internal control over financial reporting. Accordingly, we express no such opinion. An audit also includes examining, on a test basis, evidence supporting the amounts and disclosures in the financial statements, assessing the accounting principles used and significant estimates made by management, as well as evaluating the overall financial statement presentation. Our procedures included confirmation of securities owned as of December 31, 2010, by correspondence with the custodians and brokers; where replies were not received from brokers, we performed other auditing procedures. We believe that our audits provide a reasonable basis for our opinion.
In our opinion, the financial statements and financial highlights referred to above present fairly, in all material respects, the financial position of VIP Asset Manager Portfolio as of December 31, 2010, the results of its operations for the year then ended, the changes in its net assets for each of the two years in the period then ended, and the financial highlights for each of the five years in the period then ended, in conformity with accounting principles generally accepted in the United States of America.
/s/ Deloitte & Touche LLP
DELOITTE & TOUCHE LLP
Boston, Massachusetts
February 23, 2011
Annual Report
The Trustees and executive officers of the trust and fund as applicable, are listed below. The Board of Trustees governs the fund and is responsible for protecting the interests of shareholders. The Trustees are experienced executives who meet periodically throughout the year to oversee the fund's activities, review contractual arrangements with companies that provide services to the fund, oversee management of the risks associated with such activities and contractual arrangements, and review the fund's performance. Except for James C. Curvey, each of the Trustees oversees 189 funds advised by FMR or an affiliate. Mr. Curvey oversees 408 funds advised by FMR or an affiliate.
The Trustees hold office without limit in time except that (a) any Trustee may resign; (b) any Trustee may be removed by written instrument, signed by at least two-thirds of the number of Trustees prior to such removal; (c) any Trustee who requests to be retired or who has become incapacitated by illness or injury may be retired by written instrument signed by a majority of the other Trustees; and (d) any Trustee may be removed at any special meeting of shareholders by a two-thirds vote of the outstanding voting securities of the trust Each Trustee who is not an interested person (as defined in the 1940 Act) (Independent Trustee), shall retire not later than the last day of the calendar year in which his or her 75th birthday occurs. The Independent Trustees may waive this mandatory retirement age policy with respect to individual Trustees. The executive officers hold office without limit in time, except that any officer may resign or may be removed by a vote of a majority of the Trustees at any regular meeting or any special meeting of the Trustees. Except as indicated, each individual has held the office shown or other offices in the same company for the past five years.
Experience, Skills, Attributes, and Qualifications of the Fund's Trustees. The Governance and Nominating Committee has adopted a statement of policy that describes the experience, qualifications, attributes, and skills that are necessary and desirable for potential Independent Trustee candidates (Statement of Policy). The Board believes that each Trustee satisfied at the time he or she was initially elected or appointed a Trustee, and continues to satisfy, the standards contemplated by the Statement of Policy. The Governance and Nominating Committee also engages professional search firms to help identify potential Independent Trustee candidates who have the experience, qualifications, attributes, and skills consistent with the Statement of Policy. From time to time, additional criteria based on the composition and skills of the current Independent Trustees, as well as experience or skills that may be appropriate in light of future changes to board composition, business conditions, and regulatory or other developments, have also been considered by the professional search firms and the Governance and Nominating Committee. In addition, the Board takes into account the Trustees' commitment and participation in Board and committee meetings, as well as their leadership of standing and ad hoc committees throughout their tenure.
In determining that a particular Trustee was and continues to be qualified to serve as a Trustee, the Board has considered a variety of criteria, none of which, in isolation, was controlling. The Board believes that, collectively, the Trustees have balanced and diverse experience, qualifications, attributes, and skills, which allow the Board to operate effectively in governing the fund and protecting the interests of shareholders. Information about the specific experience, skills, attributes, and qualifications of each Trustee, which in each case led to the Board's conclusion that the Trustee should serve (or continue to serve) as a trustee of the fund, is provided below.
Board Structure and Oversight Function. Abigail P. Johnson is an interested person (as defined in the 1940 Act) and currently serves as Chairman. The Trustees have determined that an interested Chairman is appropriate and benefits shareholders because an interested Chairman has a personal and professional stake in the quality and continuity of services provided to the fund. Independent Trustees exercise their informed business judgment to appoint an individual of their choosing to serve as Chairman, regardless of whether the Trustee happens to be independent or a member of management. The Independent Trustees have determined that they can act independently and effectively without having an Independent Trustee serve as Chairman and that a key structural component for assuring that they are in a position to do so is for the Independent Trustees to constitute a substantial majority for the Board. The Independent Trustees also regularly meet in executive session. Kenneth L. Wolfe serves as Chairman of the Independent Trustees and as such (i) acts as a liaison between the Independent Trustees and management with respect to matters important to the Independent Trustees and (ii) with management prepares agendas for Board meetings.
Fidelity funds are overseen by different Boards of Trustees. The fund's Board oversees Fidelity's investment-grade bond, money market, and asset allocation funds and another Board oversees Fidelity's equity and high income funds. The asset allocation funds may invest in Fidelity funds that are overseen by such other Board. The use of separate Boards, each with its own committee structure, allows the Trustees of each group of Fidelity funds to focus on the unique issues of the funds they oversee, including common research, investment, and operational issues. On occasion, the separate Boards establish joint committees to address issues of overlapping consequences for the Fidelity funds overseen by each Board.
The Trustees operate using a system of committees to facilitate the timely and efficient consideration of all matters of importance to the Trustees, the fund, and fund shareholders and to facilitate compliance with legal and regulatory requirements and oversight of the fund's activities and associated risks. The Board, acting through its committees, has charged FMR and its affiliates with (i) identifying events or circumstances the occurrence of which could have demonstrably adverse effects on the fund's business and/or reputation; (ii) implementing processes and controls to lessen the possibility that such events or circumstances occur or to mitigate the effects of such events or circumstances if they do occur; and (iii) creating and maintaining a system designed to evaluate continuously business and market conditions in order to facilitate the identification and implementation processes described in (i) and (ii) above. Because the day-to-day operations and activities of the fund are carried out by or through FMR, its affiliates and other service providers, the fund's exposure to risks is mitigated but not eliminated by the processes overseen by the Trustees. While each of the Board's committees has responsibility for overseeing different aspects of the fund's activities, oversight is exercised primarily through the Operations and Audit Committees. Appropriate personnel, including but not limited to the fund's Chief Compliance Officer (CCO), FMR's internal auditor, the independent accountants, the fund's Treasurer and portfolio management personnel, make periodic reports to the Board's committees, as appropriate. The responsibilities of each committee, including their oversight responsibilities, are described further under "Standing Committees of the Fund's Trustees."
Annual Report
The fund's Statement of Additional Information (SAI) includes more information about the Trustees. To request a free copy, call Fidelity at 1-877-208-0098.
Interested Trustees*:
Correspondence intended for each Trustee who is an interested person may be sent to Fidelity Investments, 82 Devonshire Street, Boston, Massachusetts 02109.
Abigail P. Johnson (49) |
| Year of Election or Appointment: 2009 Ms. Johnson is Trustee and Chairman of the Board of Trustees of certain Trusts. Ms. Johnson serves as President of Personal, Workplace and Institutional Services (2005-present). Ms. Johnson is the Vice Chairman and Director (2007-present) of FMR LLC. Previously, Ms. Johnson served as President and a Director of FMR (2001-2005), a Trustee of other investment companies advised by FMR, Fidelity Investments Money Management, Inc., and FMR Co., Inc. (2001-2005), Senior Vice President of the Fidelity funds (2001-2005), and managed a number of Fidelity funds. Ms. Abigail P. Johnson and Mr. Arthur E. Johnson are not related. |
James C. Curvey (75) |
| Year of Election or Appointment: 2007 Mr. Curvey also serves as Trustee (2007-present) of other investment companies advised by FMR. Mr. Curvey is a Director of Fidelity Investments Money Management, Inc. (2009-present), Director of Fidelity Research & Analysis Co. (2009-present) and Director of FMR and FMR Co., Inc. (2007-present). Mr. Curvey is also Vice Chairman (2007-present) and Director of FMR LLC. In addition, Mr. Curvey serves as an Overseer for the Boston Symphony Orchestra and a member of the Trustees of Villanova University. Previously, Mr. Curvey was the Vice Chairman (2006-2007) and Director (2000-2007) of FMR Corp. |
* Trustees have been determined to be "Interested Trustees" by virtue of, among other things, their affiliation with the trust or various entities under common control with FMR.
+ The information above includes each Trustee's principal occupation during the last five years and other information relating to the experience, attributes, and skills relevant to each Trustee's qualifications to serve as a Trustee, which led to the conclusion that each Trustee should serve as a Trustee for the fund.
Independent Trustees:
Correspondence intended for each Independent Trustee (that is, the Trustees other than the Interested Trustees) may be sent to Fidelity Investments, P.O. Box 55235, Boston, Massachusetts 02205-5235.
Name, Age; Principal Occupations and Other Relevant Experience+ |
Albert R. Gamper, Jr. (68) |
| Year of Election or Appointment: 2006 Prior to his retirement in December 2004, Mr. Gamper served as Chairman of the Board of CIT Group Inc. (commercial finance). During his tenure with CIT Group Inc. Mr. Gamper served in numerous senior management positions, including Chairman (1987-1989; 1999-2001; 2002-2004), Chief Executive Officer (1987-2004), and President (2002-2003). He also served as President and Chief Executive Officer of Tyco Capital Corporation (2001-2002). Mr. Gamper currently serves as a member of the Board of Directors of Public Service Enterprise Group (utilities, 2000-present), a member of the Board of Trustees, Rutgers University (2004-present), and Chairman of the Board of Saint Barnabas Health Care System. Previously, Mr. Gamper served as Chairman of the Board of Governors, Rutgers University (2004-2007). |
Robert F. Gartland (59) |
| Year of Election or Appointment: 2010 Mr. Gartland is a partner and investor of Vietnam Partners LLC (investments and consulting, 2008-present) and is Chairman and an investor in Gartland and Mellina Group Corp. (consulting, 2009-present). Prior to his retirement, Mr. Gartland held a variety of positions at Morgan Stanley (financial services, 1979-2007) including Managing Director (1987-2007). |
Arthur E. Johnson (63) |
| Year of Election or Appointment: 2008 Mr. Johnson serves as a member of the Board of Directors of Eaton Corporation (diversified power management, 2009-present) and AGL Resources, Inc. (holding company). Prior to his retirement, Mr. Johnson served as Senior Vice President of Corporate Strategic Development of Lockheed Martin Corporation (defense contractor, 1999-2009). He previously served on the Board of Directors of IKON Office Solutions, Inc. (1999-2008) and Delta Airlines (2005-2007). Mr. Arthur E. Johnson and Ms. Abigail P. Johnson are not related. |
Michael E. Kenneally (56) |
| Year of Election or Appointment: 2009 Previously, Mr. Kenneally served as a Member of the Advisory Board for certain Fidelity Fixed Income and Asset Allocation Funds (2008-2009). Prior to his retirement, Mr. Kenneally served as Chairman and Global Chief Executive Officer of Credit Suisse Asset Management (2003-2005). Mr. Kenneally was a Director of the Credit Suisse Funds (U.S. mutual funds, 2004-2008) and certain other closed-end funds (2004-2005) and was awarded the Chartered Financial Analyst (CFA) designation in 1991. |
James H. Keyes (70) |
| Year of Election or Appointment: 2007 Mr. Keyes serves as a member of the Boards of Navistar International Corporation (manufacture and sale of trucks, buses, and diesel engines, since 2002) and Pitney Bowes, Inc. (integrated mail, messaging, and document management solutions, since 1998). Prior to his retirement, Mr. Keyes served as Chairman and Chief Executive Officer of Johnson Controls (automotive, building, and energy, 1998-2002) and as a member of the Board of LSI Logic Corporation (semiconductor technologies, 1984-2008). |
Marie L. Knowles (64) |
| Year of Election or Appointment: 2001 Prior to Ms. Knowles' retirement in June 2000, she served as Executive Vice President and Chief Financial Officer of Atlantic Richfield Company (ARCO) (diversified energy, 1996-2000). From 1993 to 1996, she was a Senior Vice President of ARCO and President of ARCO Transportation Company. She served as a Director of ARCO from 1996 to 1998. Ms. Knowles currently serves as a Director and Chairman of the Audit Committee of McKesson Corporation (healthcare service, since 2002). Ms. Knowles is an Honorary Trustee of the Brookings Institution and a member of the Board of the Catalina Island Conservancy and of the Santa Catalina Island Company (2009-present). She also serves as a member of the Advisory Board for the School of Engineering of the University of Southern California and the Foundation Board of the School of Architecture at the University of Virginia (2007-present). Previously, Ms. Knowles served as a Director of Phelps Dodge Corporation (copper mining and manufacturing, 1994-2007). |
Kenneth L. Wolfe (71) |
| Year of Election or Appointment: 2007 Mr. Wolfe is Chairman of the Independent Trustees of the Fixed Income and Asset Allocation Funds (2008-present). Prior to his retirement, Mr. Wolfe served as Chairman and a Director (2007-2009) and Chairman and Chief Executive Officer (1994-2001) of Hershey Foods Corporation. He also served as a member of the Boards of Adelphia Communications Corporation (telecommunications, 2003-2006), Bausch & Lomb, Inc. (medical/pharmaceutical, 1993-2007), and Revlon, Inc. (personal care products, 2004-2009). |
+ The information above includes each Trustee's principal occupation during the last five years and other information relating to the experience, attributes, and skills relevant to each Trustee's qualifications to serve as a Trustee, which led to the conclusion that each Trustee should serve as a Trustee for the fund.
Executive Officers:
Correspondence intended for each executive officer may be sent to Fidelity Investments, 82 Devonshire Street, Boston, Massachusetts 02109.
Name, Age; Principal Occupation |
John R. Hebble (52) |
| Year of Election or Appointment: 2008 President and Treasurer of Fidelity's Fixed Income and Asset Allocation Funds. Mr. Hebble also serves as Treasurer and Chief Financial Officer of The North Carolina Capital Management Trust: Cash and Term Portfolio (2008-present), Assistant Treasurer of other Fidelity funds (2009-present) and is an employee of Fidelity Investments. |
Boyce I. Greer (54) |
| Year of Election or Appointment: 2005 Vice President of Fidelity's Fixed Income Funds and Asset Allocation Funds (2005). Mr. Greer is also a Trustee of other investment companies advised by FMR. Mr. Greer is President of The North Carolina Capital Management Trust: Cash and Term Portfolio (2003-present), the Asset Allocation Division (2008-present), President and a Director of Strategic Advisers, Inc. (2008-present), President of FIMM 130/30 LLC (2008-present), Director of Ballyrock Investment Advisors LLC (2006-present), and an Executive Vice President of FMR (2005-present). Previously, Mr. Greer served as Executive Vice President of FMR Co., Inc. (2005-2009), President and Director of Fidelity Investments Money Management, Inc. (2007-2009) and as a Director and Managing Director of Strategic Advisers, Inc. (2002-2005). |
Derek L. Young (46) |
| Year of Election or Appointment: 2009 Vice President of Fidelity's Asset Allocation Funds. Mr. Young also serves as Chief Investment Officer of the Global Asset Allocation Group (2009-present). Previously, Mr. Young served as a portfolio manager. |
Scott C. Goebel (42) |
| Year of Election or Appointment: 2008 Secretary and Chief Legal Officer (CLO) of the Fidelity funds. Mr. Goebel also serves as Secretary and CLO of The North Carolina Capital Management Trust: Cash and Term Portfolio (2008-present); General Counsel, Secretary, and Senior Vice President of FMR (2008-present) and FMR Co., Inc. (2008-present); Deputy General Counsel of FMR LLC; Chief Legal Officer of Fidelity Management & Research (Hong Kong) Limited (2008-present) and Assistant Secretary of Fidelity Management & Research (Japan) Inc. (2008-present), Fidelity Investments Money Management, Inc. (2008-present), Fidelity Management & Research (U.K.) Inc. (2008-present), and Fidelity Research and Analysis Company (2008-present). Previously, Mr. Goebel served as Assistant Secretary of the Funds (2007-2008) and as Vice President and Secretary of Fidelity Distributors Corporation (FDC) (2005-2007). |
David J. Carter (37) |
| Year of Election or Appointment: 2010 Assistant Secretary of Fidelity's Fixed Income and Asset Allocation Funds. Mr. Carter also serves as Vice President, Associate General Counsel (2010-present) and is an employee of Fidelity Investments (2005-present). |
Holly C. Laurent (56) |
| Year of Election or Appointment: 2008 Anti-Money Laundering (AML) Officer of the Fidelity funds. Ms. Laurent also serves as AML Officer of The North Carolina Capital Management Trust: Cash and Term Portfolio (2008-present) and is an employee of Fidelity Investments. Previously, Ms. Laurent was Senior Vice President and Head of Legal for Fidelity Business Services India Pvt. Ltd. (2006-2008), and Senior Vice President, Deputy General Counsel and Group Head for FMR LLC (2005-2006). |
Christine Reynolds (52) |
| Year of Election or Appointment: 2008 Chief Financial Officer of the Fidelity funds. Ms. Reynolds became President of Fidelity Pricing and Cash Management Services (FPCMS) in August 2008. Ms. Reynolds served as Chief Operating Officer of FPCMS (2007-2008). Previously, Ms. Reynolds served as President, Treasurer, and Anti-Money Laundering officer of the Fidelity funds (2004-2007). |
Michael H. Whitaker (43) |
| Year of Election or Appointment: 2008 Chief Compliance Officer of Fidelity's Fixed Income and Asset Allocation Funds. Mr. Whitaker also serves as Chief Compliance Officer of The North Carolina Capital Management Trust: Cash and Term Portfolio (2008-present). Mr. Whitaker is an employee of Fidelity Investments (2007-present). Prior to joining Fidelity Investments, Mr. Whitaker worked at MFS Investment Management where he served as Senior Vice President and Chief Compliance Officer (2004-2006), and Assistant General Counsel. |
Jeffrey S. Christian (49) |
| Year of Election or Appointment: 2009 Deputy Treasurer of the Fidelity funds. Mr. Christian is an employee of Fidelity Investments. Previously, Mr. Christian served as Chief Financial Officer (2008-2009) of certain Fidelity funds and Senior Vice President of Fidelity Pricing and Cash Management Services (FPCMS) (2004-2009). |
Bryan A. Mehrmann (49) |
| Year of Election or Appointment: 2005 Deputy Treasurer of the Fidelity funds. Mr. Mehrmann is an employee of Fidelity Investments. |
Stephanie J. Dorsey (41) |
| Year of Election or Appointment: 2008 Deputy Treasurer of Fidelity's Fixed Income and Asset Allocation Funds. Ms. Dorsey also serves as Assistant Treasurer of other Fidelity funds (2010-present) and is an employee of Fidelity Investments (2008-present). Previously, Ms. Dorsey served as Treasurer (2004-2008) of the JPMorgan Mutual Funds and Vice President (2004-2008) of JPMorgan Chase Bank. |
Adrien E. Deberghes (43) |
| Year of Election or Appointment: 2010 Assistant Treasurer of Fidelity's Fixed Income and Asset Allocation Funds. Mr. Deberghes also serves as Deputy Treasurer of other Fidelity funds (2008-present) and is an employee of Fidelity Investments (2008-present). Previously, Mr. Deberghes served as Senior Vice President of Mutual Fund Administration at State Street Corporation (2007-2008), Senior Director of Mutual Fund Administration at Investors Bank & Trust (2005-2007), and Director of Finance for Dunkin' Brands (2000-2005). |
Kenneth B. Robins (41) |
| Year of Election or Appointment: 2009 Assistant Treasurer of the Fidelity Fixed Income and Asset Allocation Funds. Mr. Robins also serves as President and Treasurer of other Fidelity funds (2008-present; 2010-present) and is an employee of Fidelity Investments (2004-present). Previously, Mr. Robins served as Deputy Treasurer of the Fidelity funds (2005-2008) and Treasurer and Chief Financial Officer of The North Carolina Capital Management Trust: Cash and Term Portfolios (2006-2008). |
Gary W. Ryan (52) |
| Year of Election or Appointment: 2005 Assistant Treasurer of the Fidelity funds. Mr. Ryan is an employee of Fidelity Investments. Previously, Mr. Ryan served as Vice President of Fund Reporting in Fidelity Pricing and Cash Management Services (FPCMS) (1999-2005). |
Jonathan Davis (42) |
| Year of Election or Appointment: 2010 Assistant Treasurer of the Fidelity funds. Mr. Davis is an employee of Fidelity Investments. Previously, Mr. Davis served as Vice President and Associate General Counsel of FMR LLC (2003-2010). |
Annual Report
The Board of Trustees of VIP Asset Manager Portfolio voted to pay to shareholders of record at the opening of business on record date, the following distributions per share derived from capital gains realized from sales of portfolio securities:
Fund | Pay Date | Record Date | Capital Gains |
Initial Class | 02/11/11 | 02/11/11 | $0.005 |
Service Class | 02/11/11 | 02/11/11 | $0.005 |
Service Class 2 | 02/11/11 | 02/11/11 | $0.005 |
Investor Class | 02/11/11 | 02/11/11 | $0.005 |
A total of 6.87% of the dividends during the fiscal year was derived from interest on U.S. Government securities which is generally exempt from state income tax.
Initial Class designates 6% and 9%; Service Class designates 6% and 10%; Service Class 2 designates 6% and 11%; and Investor Class designates 6% and 10%; of the dividends distributed in February and December, respectively during the fiscal year as qualifying for the dividends-received deduction for corporate shareholders.
Annual Report
Board Approval of Investment Advisory Contracts and Management Fees
VIP Asset Manager Portfolio
Each year, the Board of Trustees, including the Independent Trustees (together, the Board), votes on the renewal of the management contract and sub-advisory agreements (together, the Advisory Contracts) for the fund. The Board, assisted by the advice of fund counsel and Independent Trustees' counsel, requests and considers a broad range of information relevant to the renewal of the Advisory Contracts throughout the year.
The Board meets regularly and considers at each of its meetings factors that are relevant to its annual consideration of the renewal of the fund's Advisory Contracts, including the services and support provided to the fund and its shareholders. The Board has established three standing committees, each composed of Independent Trustees with varying backgrounds, to which the Board has assigned specific subject matter responsibilities in order to enhance effective decision-making by the Board. The Operations Committee, of which all of the Independent Trustees are members, meets regularly throughout the year and, among other matters, considers matters specifically related to the annual consideration of the renewal of the fund's Advisory Contracts. The Board, acting directly and through its Committees, requests and receives information concerning the annual consideration of the renewal of the fund's Advisory Contracts. The Board also meets as needed to consider matters specifically related to the Board's annual consideration of the renewal of Advisory Contracts. Members of the Board may also meet with trustees of other Fidelity funds through ad hoc joint committees to discuss certain matters relevant to the Fidelity funds.
At its September 2010 meeting, the Board of Trustees, including the Independent Trustees, unanimously determined to renew the fund's Advisory Contracts. In reaching its determination, the Board considered all factors it believed relevant, including (i) the nature, extent, and quality of the services to be provided to the fund and its shareholders (including the investment performance of the fund); (ii) the competitiveness of the fund's management fee and total expenses; (iii) the total costs of the services to be provided by and the profits to be realized by Fidelity from its relationship with the fund; (iv) the extent to which economies of scale would be realized as the fund grows; and (v) whether fee levels reflect these economies of scale, if any, for the benefit of fund shareholders.
In considering whether to renew the Advisory Contracts for the fund, the Board reached a determination, with the assistance of fund counsel and Independent Trustees' counsel and through the exercise of its business judgment, that the renewal of the Advisory Contracts is in the best interests of the fund and its shareholders and that the compensation to be received by Fidelity under the management contract is fair and reasonable. The Board's decision to renew the Advisory Contracts was not based on any single factor, but rather was based on a comprehensive consideration of all the information provided to the Board at its meetings throughout the year. The Board, in reaching its determination to renew the Advisory Contracts, is aware that shareholders in the fund have a broad range of investment choices available to them, including a wide choice among mutual funds offered by Fidelity's competitors, and that the fund's shareholders, with the opportunity to review and weigh the disclosure provided by the fund in its prospectus and other public disclosures, have chosen to invest in this fund, managed by Fidelity.
Nature, Extent, and Quality of Services Provided. The Board considered the staffing within the investment adviser, FMR, and the sub-advisers (together, the Investment Advisers), including the backgrounds of the fund's investment personnel and the fund's investment objective and discipline. The Independent Trustees also had discussions with senior management of Fidelity's investment operations and investment groups. The Board considered the structure of the portfolio manager compensation program and whether this structure provides appropriate incentives to act in the best interest of the fund.
Resources Dedicated to Investment Management and Support Services. The Board reviewed the size, education, and experience of the Investment Advisers' investment staff, their use of technology, and the Investment Advisers' approach to recruiting, training, and retaining portfolio managers and other research, advisory, and management personnel. The Board noted that Fidelity's analysts have access to a variety of technological tools and market and securities data that enable them to perform both fundamental and quantitative analysis and to specialize in various disciplines. The Board considered Fidelity's extensive global research capabilities that enable the Investment Advisers to aggregate data from various sources in an effort to produce positive investment results. The Board also considered that Fidelity's portfolio managers and analysts have access to daily portfolio attribution that allows for monitoring of a fund's portfolio, as well as an electronic communication system that provides immediate real-time access to research concerning issuers and credit enhancers. The Board noted FMR's continued focus on strengthening the organization and discipline of equity portfolio management and research.
Shareholder and Administrative Services. The Board considered (i) the nature, extent, quality, and cost of advisory, administrative, and shareholder services performed by the Investment Advisers and their affiliates under the Advisory Contracts and under separate agreements covering transfer agency, pricing and bookkeeping, and securities lending services for the fund; (ii) the nature and extent of the investment adviser's supervision of third party service providers, principally custodians and subcustodians; and (iii) the resources devoted to, and the record of compliance with, the fund's compliance policies and procedures. The Board also reviewed the allocation of fund brokerage, including allocations to brokers affiliated with the Investment Advisers, the use of brokerage commissions to pay fund expenses, and the use of "soft" commission dollars to pay for research services.
The Board noted that the growth of fund assets over time across the complex allows Fidelity to reinvest in the development of services designed to enhance the value or convenience of the Fidelity funds as investment vehicles. These services include 24-hour access to account information and market information through telephone representatives and over the Internet, and investor education materials and asset allocation tools.
Annual Report
Investment in a Large Fund Family. The Board considered the benefits to shareholders of investing in a Fidelity fund, including the benefits of investing in a fund that is part of a large family of funds offering a variety of investment disciplines and providing a large variety of mutual fund investor services. The Board noted that Fidelity had taken, or had made recommendations that resulted in the Fidelity funds taking, a number of actions over the previous year that benefited particular funds, including (i) dedicating additional resources to investment research and restructuring and broadening the focus of the investment research teams; (ii) bolstering the senior management team that oversees asset management; (iii) launching Class F of certain funds as a lower-fee class available to Freedom K and Freedom Index Funds; (iv) lowering the initial investment minimums and ongoing balance requirements for Real Estate High Income Fund; (v) eliminating subsequent purchase minimums for all funds and adding a waiver of the investment minimum requirement for new accounts opened with the proceeds of a systematic withdrawal plan; (vi) eliminating the withdrawal minimum and maximum limits for systematic withdrawals from Advisor funds; (vii) expanding sales load waivers on Class A shares for Destiny Planholders and expanding Institutional Class eligibility for Class O Destiny Planholders; and (viii) changing certain Class A and Class T sales charge structures to further align them with industry practices.
Investment Performance. The Board considered whether the fund has operated in accordance with its investment objective, as well as its record of compliance with its investment restrictions. It also reviewed the fund's absolute investment performance for each class, as well as the fund's relative investment performance for each class measured over multiple periods against (i) a proprietary custom index, and (ii) a peer group of mutual funds deemed appropriate by Fidelity and reviewed by the Board. The following charts considered by the Board show, over the one-, three-, and five-year periods ended December 31, 2009, the cumulative total returns of Initial Class and Service Class 2 of the fund, the cumulative total returns of a proprietary custom index ("benchmark"), and a range of cumulative total returns of a peer group of mutual funds identified by Morningstar, Inc. as having an investment style similar to that of the fund based on underlying portfolio holdings. The returns of Initial Class and Service Class 2 show the performance of the highest and lowest performing classes, respectively (based on five-year performance). The box within each chart shows the 25th percentile return (bottom of box) and the 75th percentile return (top of box) of the peer group. Returns shown above the box are in the first quartile and returns shown below the box are in the fourth quartile. The percentage beaten numbers noted below each chart correspond to the percentile box and represent the percentage of funds in the peer group whose performance was equal to or lower than that of the class indicated. The fund's proprietary custom index is an index developed by FMR that represents the performance of the fund's three asset classes according to their respective weightings in the fund's neutral mix.
VIP Asset Manager Portfolio
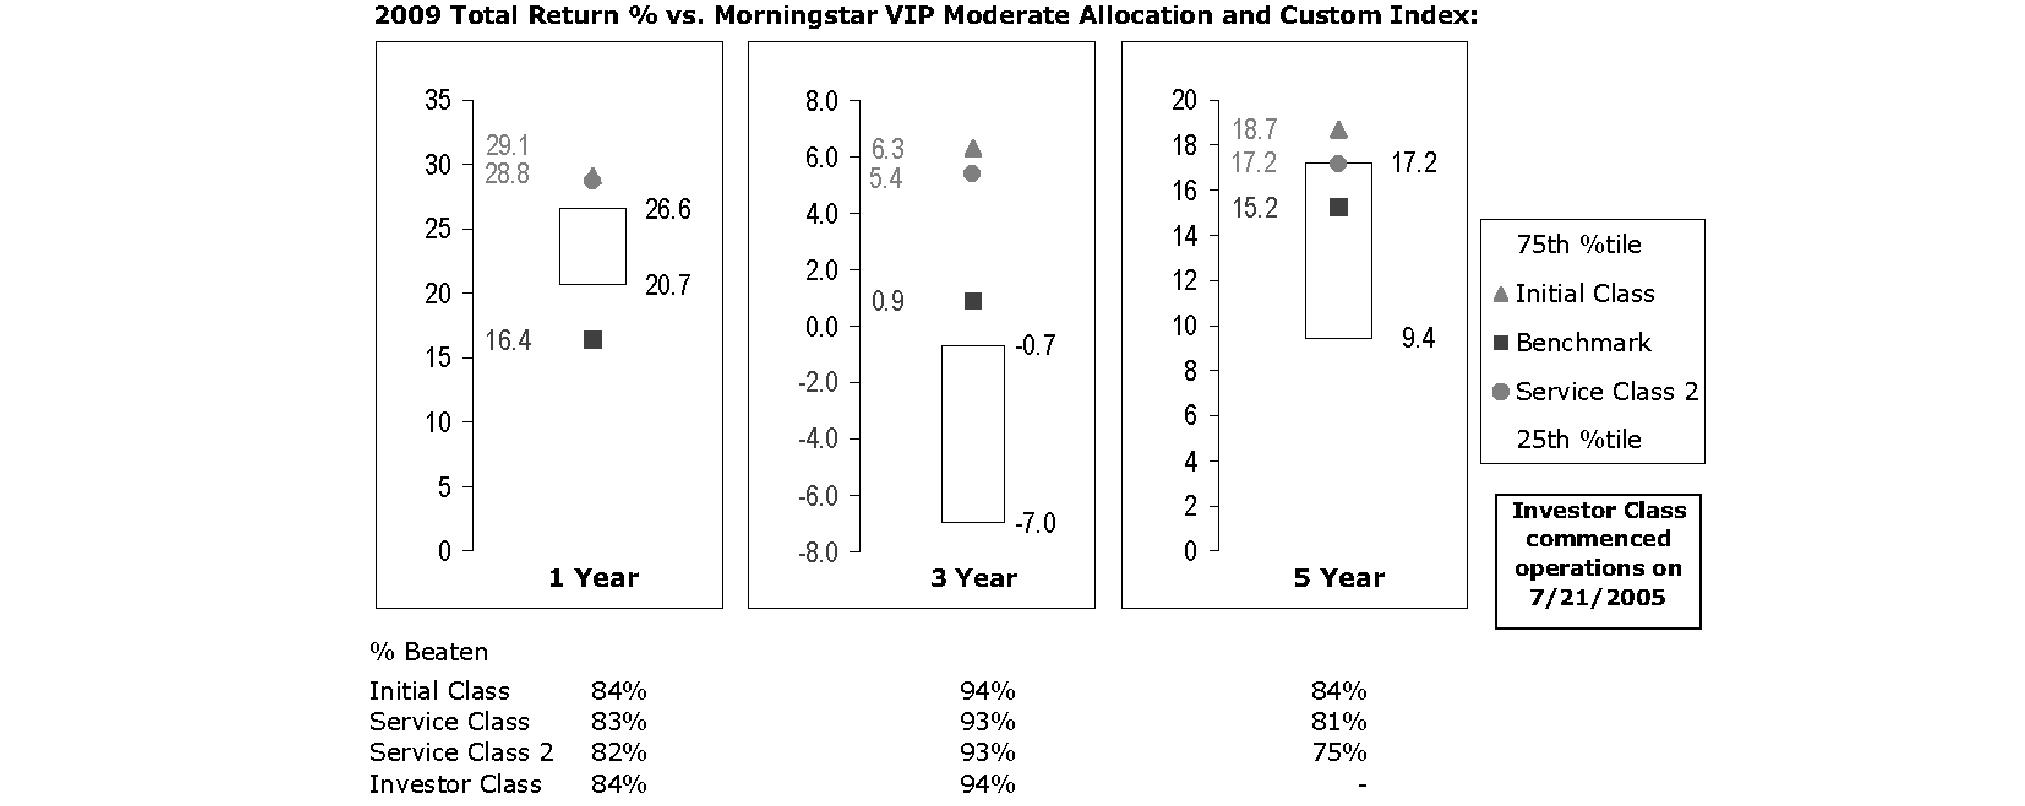
The Board reviewed the fund's relative investment performance against its peer group and noted that the performance of Initial Class of the fund was in the first quartile for all the periods shown. The Board also noted that the investment performance of Initial Class of the fund compared favorably to its benchmark for all the periods shown. The Board considered that the variations in performance among the fund's classes reflect the variations in class expenses, which result in lower performance for higher expense classes. The Board also reviewed the fund's performance since inception as well as performance in the current year.
Based on its review, and giving particular weight to the nature and quality of the resources dedicated by the Investment Advisers to maintain and improve relative performance and factoring in the unprecedented market events in recent years, the Board concluded that the nature, extent, and quality of investment management and support services and of shareholder and administrative services provided to the fund will benefit the fund's shareholders, particularly in light of the Board's view that the fund's shareholders benefit from investing in a fund that is part of a large family of funds offering a variety of investment disciplines and services.
Annual Report
Board Approval of Investment Advisory Contracts and Management Fees - continued
Competitiveness of Management Fee and Total Fund Expenses. The Board considered the fund's management fee and total expenses compared to "mapped groups" of competitive funds and classes. Fidelity creates "mapped groups" by combining similar Lipper investment objective categories that have comparable management fee characteristics. Combining Lipper investment objective categories aids the Board's management fee and total expense comparisons by broadening the competitive group used for comparison and by reducing the number of universes to which various Fidelity funds are compared.
Management Fee. The Board considered two proprietary management fee comparisons for the 12-month periods shown in the chart below. The group of Lipper funds used by the Board for management fee comparisons is referred to below as the "Total Mapped Group." The Total Mapped Group comparison focuses on a fund's standing relative to the total universe of comparable funds available to investors, in terms of gross management fees before expense reimbursements or caps. "TMG %" represents the percentage of funds in the Total Mapped Group that had management fees that were lower than the fund's. For example, a TMG % of 24% means that 76% of the funds in the Total Mapped Group had higher management fees than the fund. The "Asset-Size Peer Group" (ASPG) comparison focuses on a fund's standing relative to non-Fidelity funds similar in size to the fund within the Total Mapped Group. The ASPG represents at least 15% of the funds in the Total Mapped Group with comparable asset size and management fee characteristics, subject to a minimum of 50 funds (or all funds in the Total Mapped Group if fewer than 50). Additional information, such as the ASPG quartile in which the fund's management fee ranked, is also included in the chart and considered by the Board.
VIP Asset Manager Portfolio
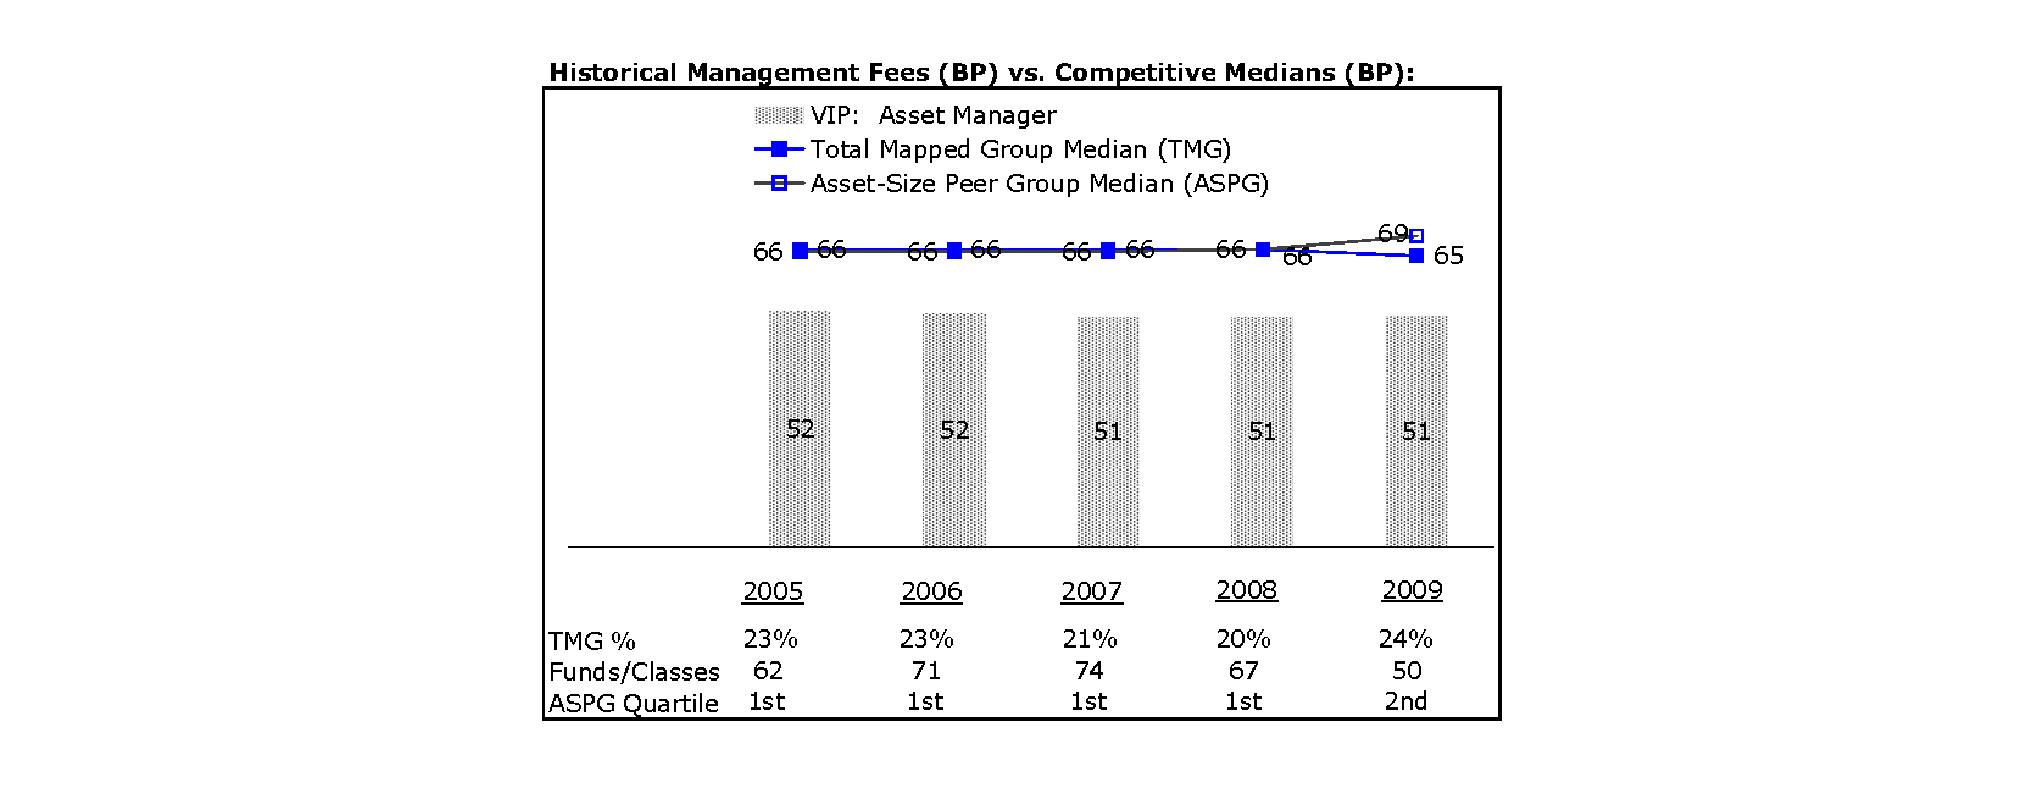
The Board noted that the fund's management fee ranked below the median of its Total Mapped Group and below the median of its ASPG for 2009.
Based on its review, the Board concluded that the fund's management fee is fair and reasonable in light of the services that the fund receives and the other factors considered.
Total Expenses. In its review of each class's total expenses, the Board considered the fund's management fee as well as other fund or class expenses, as applicable, such as transfer agent fees, pricing and bookkeeping fees, fund-paid 12b-1 fees, and custodial, legal, and audit fees. The Board also noted the effects of any waivers and reimbursements on fees and expenses. As part of its review, the Board also considered current and historical total expenses of each class of the fund compared to competitive fund median expenses. Each class of the fund is compared to those funds and classes in the Total Mapped Group (used by the Board for management fee comparisons) that have a similar sales load structure.
The Board noted that the total expenses of each of Initial Class, Investor Class, and Service Class ranked below its competitive median for 2009 and the total expenses of Service Class 2 ranked above its competitive median for 2009. The Board noted that the total expenses of Service Class 2 were above the median due to 12b-1 fees and that the funds and classes in the Total Mapped Group that have a similar sales load structure included classes with no 12b-1 fees. Excluding the 12b-1 fees, the total expenses of Service Class 2 ranked below its competitive median for 2009. The Board noted that the fund offers multiple classes, each of which has a different 12b-1 fee structure, and that the multiple structures are intended to offer a range of pricing options for the intermediary market. The Board also noted that the total expenses of the classes vary primarily by the level of their 12b-1 fees, although differences in transfer agent fees may also cause expenses to vary from class to class.
Annual Report
Fees Charged to Other Fidelity Clients. The Board also considered Fidelity fee structures and other information with respect to clients of FMR and its affiliates, such as other mutual funds advised or subadvised by FMR or its affiliates, pension plan clients, and other institutional clients. In March 2010, the Board created an ad hoc joint committee with the board of other Fidelity funds (the Committee) to review and compare Fidelity's institutional investment advisory business with its business of providing services to the Fidelity funds, including the differences in services provided, fees charged, and costs incurred, as well as competition in their respective marketplaces.
Based on its review of total expenses and fees charged to other Fidelity clients, the Board concluded that the total expenses of each class of the fund were reasonable, although in one case above the median of the universe presented for comparison, in light of the services that the fund and its shareholders receive and the other factors considered, including the findings of the Committee.
Costs of the Services and Profitability. The Board considered the revenues earned and the expenses incurred by Fidelity in conducting the business of developing, marketing, distributing, managing, administering and servicing the fund and its shareholders. The Board also considered the level of Fidelity's profits in respect of all the Fidelity funds.
On an annual basis, FMR presents to the Board Fidelity's profitability for the fund. Fidelity calculates the profitability for each fund, as well as aggregate profitability for groups of Fidelity funds and all Fidelity funds, using a series of detailed revenue and cost allocation methodologies which originate with the audited books and records of Fidelity. The Audit Committee of the Board reviews any significant changes from the prior year's methodologies.
PricewaterhouseCoopers LLP (PwC), independent registered public accounting firm and auditor to Fidelity and certain Fidelity funds, has been engaged annually by the Board as part of the Board's assessment of Fidelity's profitability analysis. PwC's engagement includes the review and assessment of Fidelity's methodologies used in determining the revenues and expenses attributable to Fidelity's mutual fund business, and completion of agreed-upon procedures surrounding the mathematical accuracy of fund profitability and its conformity to allocation methodologies. After considering PwC's reports issued under the engagement and information provided by Fidelity, the Board believes that while other allocation methods may also be reasonable, Fidelity's profitability methodologies are reasonable in all material respects.
The Board has also reviewed Fidelity's non-fund businesses and fall-out benefits related to the mutual fund business as well as cases where Fidelity's affiliates may benefit from or be related to the fund's business.
The Board considered the costs of the services provided by and the profits realized by Fidelity in connection with the operation of the fund and were satisfied that the profitability was not excessive in the circumstances.
Economies of Scale. The Board considered whether there have been economies of scale in respect of the management of the Fidelity funds, whether the Fidelity funds (including the fund) have appropriately benefited from any such economies of scale, and whether there is potential for realization of any further economies of scale. The Board considered the extent to which the fund will benefit from economies of scale through increased services to the fund, through waivers or reimbursements, or through fee or expense reductions.
In February 2009, the Board and the board of other Fidelity funds created an ad hoc committee (the Economies of Scale Committee) to analyze whether FMR attains economies of scale in respect of the management and servicing of the Fidelity funds, whether the Fidelity funds have appropriately benefited from such economies of scale, and whether there is potential for realization of any further economies of scale.
The Board recognized that the fund's management contract incorporates a "group fee" structure, which provides for lower group fee rates as total fund assets under FMR's management increase, and for higher group fee rates as total fund assets under FMR's management decrease. FMR calculates the group fee rates based on a tiered asset "breakpoint" schedule that varies based on asset class. The Board considered that the group fee is designed to deliver the benefits of economies of scale to fund shareholders when total Fidelity fund assets increase, even if assets of any particular fund are unchanged or have declined, because some portion of Fidelity's costs are attributable to services provided to all Fidelity funds, and all funds benefit if those costs can be allocated among more assets. The Board concluded that, given the group fee structure, fund shareholders will benefit from lower management fees as assets under FMR's management increase at the fund complex level, regardless of whether Fidelity achieves any such economies of scale.
The Board concluded, considering the findings of the Economies of Scale Committee, that any potential economies of scale are being appropriately shared between fund shareholders and Fidelity.
Additional Information Requested by the Board. In order to develop fully the factual basis for consideration of the Fidelity funds' Advisory Contracts, the Board requested and received additional information on certain topics, including (i) fund performance trends, actions to be taken by FMR to improve certain funds' overall performance, and Fidelity's long-term strategies for certain funds; (ii) Fidelity's fund profitability methodology and profitability trends for certain funds; (iii) portfolio manager changes that have occurred during the past year and the amount of the investment that each portfolio manager has made in the Fidelity fund(s) that he or she manages; (iv) Fidelity's compensation structure for portfolio managers, research analysts, and other key personnel, including its effects on fund profitability, the rationale for the compensation structure, and the extent to which current market conditions have affected retention and recruitment; (v) the compensation paid by FMR to fund sub-advisers on behalf of the Fidelity funds; (vi) Fidelity's fee structures and rationale for recommending different fees among different categories of funds and classes, as well as Fidelity's voluntary waiver of fees to maintain minimum yields for certain funds and classes; (vii) the rationale for any differences between fund fee structures and fee structures in place for other Fidelity clients; and (viii) explanations regarding the relative total expenses borne by certain funds and classes, total expense competitive trends, and actions that might be taken by FMR to reduce total expenses for certain funds and classes or to achieve further economies of scale.
Annual Report
Board Approval of Investment Advisory Contracts and Management Fees - continued
Based on its evaluation of all of the conclusions noted above, and after considering all factors it believed relevant, the Board ultimately concluded that the advisory fee structures are fair and reasonable, and that the fund's Advisory Contracts should be renewed.
Annual Report
Investment Adviser
Fidelity Management & Research Company
Boston, MA
Investment Sub-Advisers
FMR Co., Inc.
Fidelity Management & Research (U.K.) Inc.
Fidelity Investments Money Management, Inc.
Fidelity Management & Research
(Hong Kong) Limited
Fidelity Management & Research
(Japan) Inc.
General Distributor
Fidelity Distributors Corporation
Boston, MA
Transfer and Service Agents
Fidelity Investments Institutional Operations Company, Inc.
Boston, MA
Fidelity Service Company, Inc.
Boston, MA
Custodian
JPMorgan Chase Bank
New York, NY
VIPAM-ANN-0211
1.540206.113
Fidelity® Variable Insurance Products:
Asset Manager: Growth Portfolio
Annual Report
December 31, 2010
(2_fidelity_logos) (Registered_Trademark)
Contents
Performance | <Click Here> | How the fund has done over time. |
Management's Discussion of Fund Performance | <Click Here> | The Portfolio Manager's review of fund performance and strategy. |
Shareholder Expense Example | <Click Here> | An example of shareholder expenses. |
Investment Changes | <Click Here> | A summary of major shifts in the fund's investments over the past six months. |
Investments | <Click Here> | A complete list of the fund's investments with their market values. |
Financial Statements | <Click Here> | Statements of assets and liabilities, operations, and changes in net assets, as well as financial highlights. |
Notes | <Click Here> | Notes to the financial statements. |
Report of Independent Registered Public Accounting Firm | <Click Here> | |
Trustees and Officers | <Click Here> | |
Distributions | <Click Here> | |
Board Approval of Investment Advisory Contracts and Management Fees | <Click Here> | |
To view a fund's proxy voting guidelines and proxy voting record for the 12-month period ended June 30, visit http://www.fidelity.com/proxyvotingresults or visit the Securities and Exchange Commission's (SEC) web site at http://www.sec.gov. You may also call 1-877-208-0098 to request a free copy of the proxy voting guidelines.
Fidelity Variable Insurance Products are separate account options which are purchased through a variable insurance contract.
Standard & Poor's, S&P and S&P 500 are registered service marks of The McGraw-Hill Companies, Inc. and have been licensed for use by Fidelity Distributors Corporation.
Other third party marks appearing herein are the property of their respective owners.
All other marks appearing herein are registered or unregistered trademarks or service marks of FMR LLC or an affiliated company.
The general research services agreement with Fidelity Research & Analysis Company has been terminated and is no longer in effect for the fund.
This report and the financial statements contained herein are submitted for the general information of the shareholders of the fund. This report is not authorized for distribution to prospective investors in the fund unless preceded or accompanied by an effective prospectus.
A fund files its complete schedule of portfolio holdings with the SEC for the first and third quarters of each fiscal year on Form N-Q. Forms N-Q are available on the SEC's web site at http://www.sec.gov. A fund's Forms N-Q may be reviewed and copied at the SEC's Public Reference Room in Washington, DC. Information regarding the operation of the SEC's Public Reference Room may be obtained by calling 1-800-SEC-0330. For a complete list of a fund's portfolio holdings, view the most recent holdings listings, semiannual report, or annual report on Fidelity's web site at http://www.fidelity.com, http://www.advisor.fidelity.com, or http://www.401k.com as applicable.
NOT FDIC INSURED • MAY LOSE VALUE • NO BANK GUARANTEE
Neither the fund nor Fidelity Distributors Corporation is a bank.
Annual Report
Average annual total return reflects the change in the value of an investment, assuming reinvestment of the class' distributions from dividend income and capital gains (the profits earned upon the sale of securities that have grown in value, if any) and assuming a constant rate of performance each year. During periods of reimbursement by Fidelity, a fund's total return will be greater than it would be had the reimbursement not occurred. Performance numbers are net of all underlying fund operating expenses, but do not include any insurance charges imposed by your insurance company's separate account. If performance information included the effect of these additional charges, the total returns would have been lower. How a fund did yesterday is no guarantee of how it will do tomorrow.
Average Annual Total Returns
Periods ended December 31, 2010 | Past 1
year | Past 5
years | Past 10
years |
VIP Asset Manager: Growth Portfolio - Initial Class | 16.34% | 4.79% | 2.99% |
VIP Asset Manager: Growth Portfolio - Service Class | 16.18% | 4.67% | 2.87% |
VIP Asset Manager: Growth Portfolio - Service Class 2 | 16.02% | 4.47% | 2.68% |
VIP Asset Manager: Growth Portfolio - Investor Class A | 16.25% | 4.65% | 2.91% |
A The initial offering of Investor Class shares took place on July 21, 2005. Returns prior to July 21, 2005 are those of Initial Class. Had Investor Class's transfer agent fee been reflected, returns prior to July 21, 2005 would have been lower.
$10,000 Over 10 Years
Let's say hypothetically that $10,000 was invested in VIP Asset Manager: Growth Portfolio - Initial Class on December 31, 2000. The chart shows how the value of your investment would have changed, and also shows how the S&P 500® Index performed over the same period.
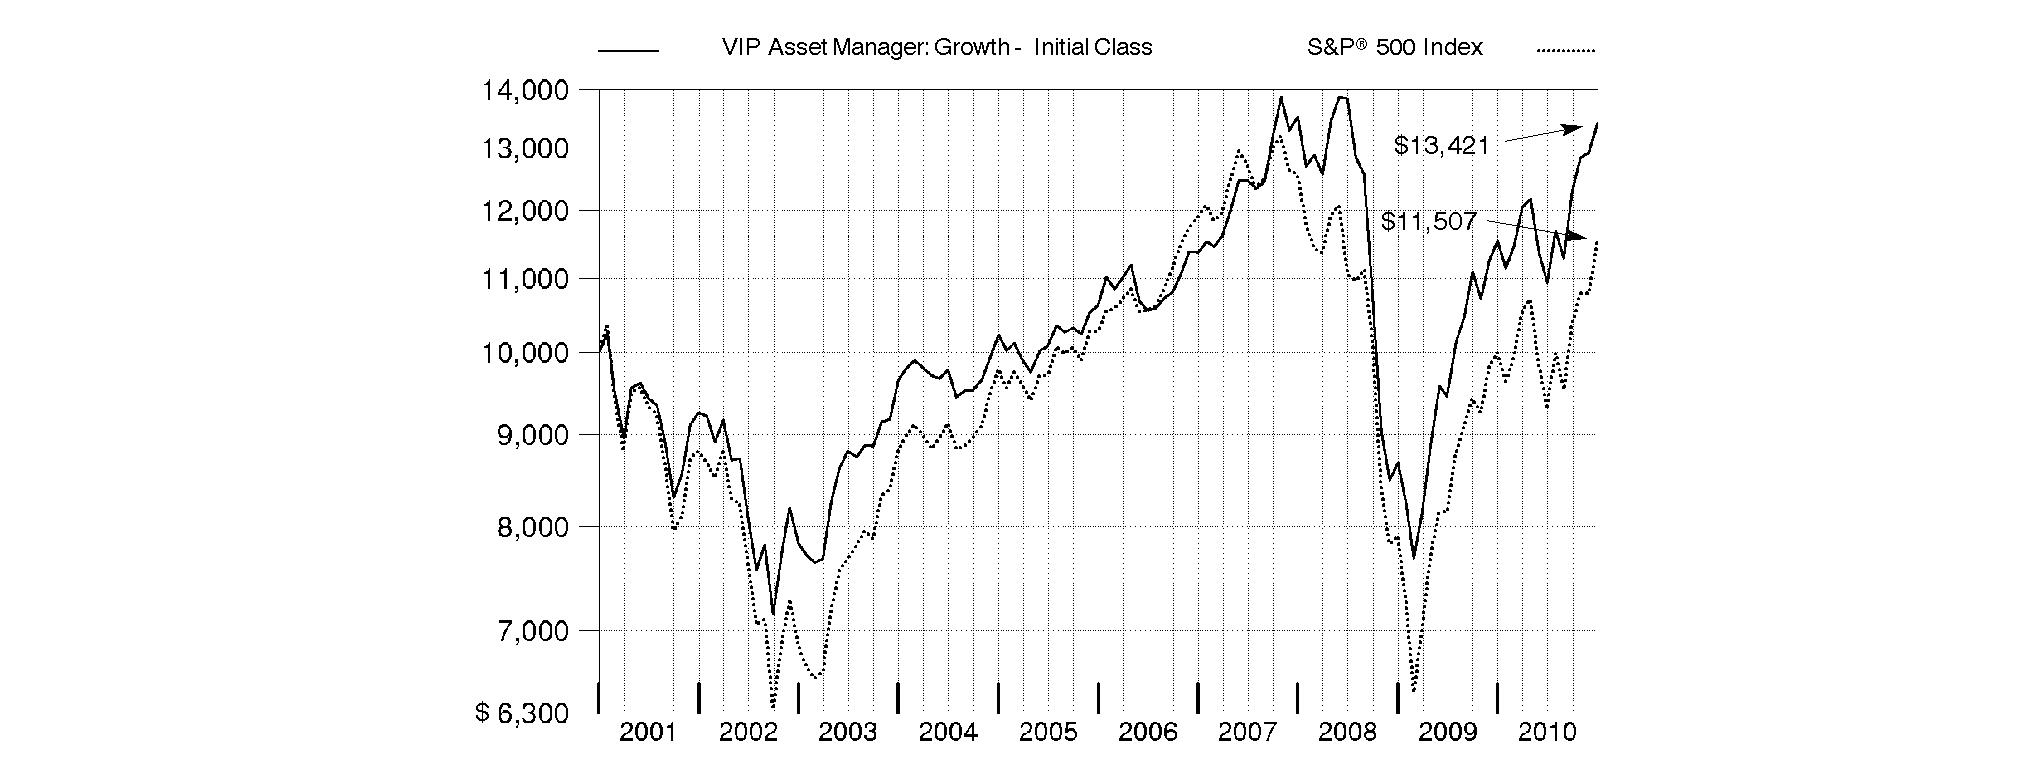
Annual Report
Market Recap: While market improvements around the world hit a speed bump in the first half of the 12-month period ending December 31, 2010, world economies re-accelerated in August, supported by a broadening recovery and low inflation in the U.S. Domestic stock markets recorded solid gains for the year, lifted by a strong second-half rally fueled by economic optimism, encouraging earnings reports and a wave of corporate mergers. The large-cap S&P 500® Index rose 15.06%, the blue-chip-laden Dow Jones Industrial AverageSM added 14.06% and the technology-heavy Nasdaq Composite® Index climbed 18.02%. Meanwhile, international stocks, as represented by the MSCI® ACWI® (All Country World Index) ex USA Index, gained 11.29%, boosted in part by a depreciating U.S. dollar. In the fixed-income arena, U.S. taxable investment-grade bonds generated positive results during 2010, as the Barclays Capital® U.S. Aggregate Bond Index gained 6.54%. With ultra-low interest rates bolstering nearly all fixed-income securities for most of the year, sectors in the index with higher yields and more credit risk generally fared best, while most high-quality bonds generated more-moderate returns. Meanwhile, high-yield bonds, as represented by The BofA Merrill LynchSM US High Yield Constrained Index, returned 15.07%, a result of improved economic data and strengthening investor demand. Overseas, foreign bond markets showed mixed results, with a sizable disparity between the 3.97% return of the Citigroup® Non-U.S. Group of 7 Index - which measures the performance of sovereign debt of the major global economies outside the U.S. - and the 12.04% advance of the JPMorgan Emerging Markets Bond Index Global (EMBI Global), which benefited from the rising overall credit quality of emerging-markets debt issuers.
Comments from Geoff Stein, Portfolio Manager of VIP Asset Manager: Growth Portfolio: For the year ending December 31, 2010, the fund's share classes significantly outperformed the 12.32% return of the Fidelity Asset Manager 70% Composite Index. (For specific portfolio results, please see the performance section of this report.) Strong security selection among domestic equities and favorable asset allocation drove the fund's return versus the benchmark. Regarding asset allocation, maintaining a somewhat riskier-than-benchmark positioning in a market environment that rewarded risk proved advantageous. Specifically, I modestly overweighted domestic equities, maintained out-of-benchmark stakes in high-yield bonds and emerging-markets equities, and underweighted the more defensive cash and investment-grade bond categories - all of which contributed significantly. Underweighting foreign developed-markets equities also helped. As for security selection, in addition to domestic equities, solid bond picking in the investment-grade bond central fund boosted performance. Within domestic equities, stock selection and an overweighting in the top-performing consumer discretionary sector - which increased as a percentage of assets - added the most. Stock picks in information technology also helped, as did positive overall positioning in health care, materials, industrials, consumer staples and utilities. Among individual holdings, leading contributors included overweightings in computer and mobile device maker Apple, truck-engine manufacturer Cummins, and footwear producer Deckers Outdoor, as well as a non-index investment in Chinese Internet search provider Baidu. We sold our position in Baidu during the period. In fixed income, beneficial sector positioning complemented strong security selection. Overweighting corporate bonds and commercial mortgage-backed securities, generally underweighting residential mortgage-backed securities and adjusting the allocation to U.S. Treasuries as the market environment changed during the year helped the investment-grade bond central fund beat its index. There were no major detractors during the period. Our small position in floating-rate bank-loan securities detracted slightly. Adverse security selection in foreign developed-markets equities was more than offset by underweighting the category. Weak positioning in financials and a modest cash stake dampened the domestic equity subportfolio's performance somewhat, but it still beat its index by a sizable margin. Individual holdings that disappointed included an out-of-benchmark investment in Canadian smart phone manufacturer Research In Motion and an overweighting in Internet search giant Google.
The views expressed above reflect those of the portfolio manager(s) only through the end of the period as stated on the cover of this report and do not necessarily represent the views of Fidelity or any other person in the Fidelity organization. Any such views are subject to change at any time based upon market or other conditions and Fidelity disclaims any responsibility to update such views. These views may not be relied on as investment advice and, because investment decisions for a Fidelity fund are based on numerous factors, may not be relied on as an indication of trading intent on behalf of any Fidelity fund.
Annual Report
As a shareholder of the Fund, you incur two types of costs: (1) transaction costs, and (2) ongoing costs, including management fees, distribution and/or service (12b-1) fees and other Fund expenses. This Example is intended to help you understand your ongoing costs (in dollars) of investing in the Fund and to compare these costs with the ongoing costs of investing in other mutual funds.
The Example is based on an investment of $1,000 invested at the beginning of the period and held for the entire period (July 1, 2010 to December 31, 2010).
Actual Expenses
The first line of the accompanying table for each class of the Fund provides information about actual account values and actual expenses. You may use the information in this line, together with the amount you invested, to estimate the expenses that you paid over the period. Simply divide your account value by $1,000.00 (for example, an $8,600 account value divided by $1,000.00 = 8.6), then multiply the result by the number in the first line for a class of the Fund under the heading entitled "Expenses Paid During Period" to estimate the expenses you paid on your account during this period. The estimate of expenses does not include any fees or other expenses of any variable annuity or variable life insurance product. If they were, the estimate of expenses you paid during the period would be higher, and your ending account value would be lower. In addition, the Fund, as a shareholder in the underlying Fidelity Central Funds, will indirectly bear its pro-rata share of the fees and expenses incurred by the underlying Fidelity Central Funds. These fees and expenses are not included in the Fund's annualized expense ratio used to calculate the expense estimate in the table below.
Hypothetical Example for Comparison Purposes
The second line of the accompanying table for each class of the Fund provides information about hypothetical account values and hypothetical expenses based on a Class' actual expense ratio and an assumed rate of return of 5% per year before expenses, which is not the Class' actual return. The hypothetical account values and expenses may not be used to estimate the actual ending account balance or expenses you paid for the period. You may use this information to compare the ongoing costs of investing in the Fund and other funds. To do so, compare this 5% hypothetical example with the 5% hypothetical examples that appear in the shareholder reports of the other funds. The estimate of expenses does not include any fees or other expenses of any variable annuity or variable life insurance product. If they were, the estimate of expenses you paid during the period would be higher, and your ending account value would be lower. In addition, the Fund, as a shareholder in the underlying Fidelity Central Funds, will indirectly bear its pro-rata share of the fees and expenses incurred by the underlying Fidelity Central Funds. These fees and expenses are not included in the Fund's annualized expense ratio used to calculate the expense estimate in the table below.
Please note that the expenses shown in the table are meant to highlight your ongoing costs only and do not reflect any transaction costs. Therefore, the second line of the table is useful in comparing ongoing costs only, and will not help you determine the relative total costs of owning different funds.
| Annualized
Expense Ratio | Beginning
Account Value
July 1, 2010 | Ending
Account Value
December 31, 2010 | Expenses Paid
During Period*
July 1, 2010
to December 31, 2010 |
Initial Class | .73% | | | |
Actual | | $ 1,000.00 | $ 1,226.40 | $ 4.10 |
HypotheticalA | | $ 1,000.00 | $ 1,021.53 | $ 3.72 |
Service Class | .83% | | | |
Actual | | $ 1,000.00 | $ 1,225.10 | $ 4.66 |
HypotheticalA | | $ 1,000.00 | $ 1,021.02 | $ 4.23 |
Service Class 2 | 1.01% | | | |
Actual | | $ 1,000.00 | $ 1,223.80 | $ 5.66 |
HypotheticalA | | $ 1,000.00 | $ 1,020.11 | $ 5.14 |
Investor Class | .82% | | | |
Actual | | $ 1,000.00 | $ 1,225.70 | $ 4.60 |
HypotheticalA | | $ 1,000.00 | $ 1,021.07 | $ 4.18 |
A 5% return per year before expenses
* Expenses are equal to each Class' annualized expense ratio, multiplied by the average account value over the period, multiplied by 184/365 (to reflect the one-half year period). The fees and expenses of the underlying Fidelity Central Funds in which the Fund invests are not included in the Fund's annualized expense ratio.
Annual Report
Investment Changes (Unaudited)
The information in the following tables is based on the combined investments of the Fund and its pro-rata share of its investments in each of Fidelity's International Equity and Fixed-Income Central Funds. |
Top Ten Stocks as of December 31, 2010 |
| % of fund's
net assets | % of fund's net assets
6 months ago |
Apple, Inc. | 2.9 | 2.3 |
Google, Inc. Class A | 1.6 | 0.0 |
Delta Air Lines, Inc. | 1.3 | 1.6 |
United Continental Holdings, Inc. | 1.1 | 1.3 |
Freeport-McMoRan Copper & Gold, Inc. | 0.9 | 0.0 |
NetApp, Inc. | 0.9 | 0.0 |
Schlumberger Ltd. | 0.9 | 0.6 |
Amazon.com, Inc. | 0.9 | 0.6 |
Macy's, Inc. | 0.8 | 0.7 |
Express Scripts, Inc. | 0.8 | 0.9 |
| 12.1 | |
Market Sectors as of December 31, 2010 |
(stocks only) | % of fund's
net assets | % of fund's net assets
6 months ago |
Information Technology | 14.6 | 12.0 |
Consumer Discretionary | 13.1 | 9.7 |
Industrials | 10.2 | 11.1 |
Materials | 8.8 | 4.0 |
Financials | 7.4 | 12.6 |
Energy | 6.6 | 5.9 |
Health Care | 4.9 | 5.0 |
Consumer Staples | 2.5 | 2.4 |
Telecommunication Services | 1.3 | 1.5 |
Utilities | 0.9 | 0.9 |
Asset Allocation (% of fund's net assets) |
As of December 31, 2010* | As of June 30, 2010** |
 | Stock class*** 72.2% | | | Stock class**** 69.6% | |
 | Bond class 25.9% | | | Bond class 26.5% | |
 | Short-Term class 1.9% | | | Short-Term class 3.9% | |
* Foreign investments | 31.0% | | ** Foreign investments | 25.2% | |

*** Includes Commodities & Related Investments of 1.6%.
**** Includes Commodities & Related Investments of 1.5%.
Asset allocations in the pie charts reflect the categorization of assets as defined in the fund's prospectus in effect as of the time periods indicated above. Financial Statement categorizations conform to accounting standards and will differ from the pie chart. Percentages are adjusted for the effect of futures contracts and swap contracts, if applicable.
A holdings listing for the Fund, which presents direct holdings as well as the pro-rata share of securities and other investments held indirectly through its investment in underlying Fidelity International Equity and Fixed Income Fidelity Central Funds, is available at advisor.fidelity.com.
Annual Report
Investments December 31, 2010
Showing Percentage of Net Assets
Common Stocks - 50.4% |
| Shares | | Value |
CONSUMER DISCRETIONARY - 11.1% |
Auto Components - 0.6% |
Autoliv, Inc. | 3,200 | | $ 252,608 |
BorgWarner, Inc. (a) | 12,500 | | 904,500 |
| | 1,157,108 |
Automobiles - 1.0% |
Bayerische Motoren Werke AG (BMW) | 14,478 | | 1,139,165 |
Daimler AG (Germany) (a) | 4,153 | | 281,681 |
General Motors Co. | 10,700 | | 394,402 |
| | 1,815,248 |
Diversified Consumer Services - 0.1% |
Anhanguera Educacional Participacoes SA | 7,000 | | 168,720 |
Hotels, Restaurants & Leisure - 1.2% |
Chipotle Mexican Grill, Inc. (a) | 3,000 | | 637,980 |
Las Vegas Sands Corp. (a) | 9,400 | | 431,930 |
Panera Bread Co. Class A (a) | 4,600 | | 465,566 |
Starwood Hotels & Resorts Worldwide, Inc. | 10,000 | | 607,800 |
| | 2,143,276 |
Household Durables - 0.6% |
Cyrela Brazil Realty SA | 26,400 | | 347,588 |
Gafisa SA sponsored ADR (d) | 48,800 | | 709,064 |
| | 1,056,652 |
Internet & Catalog Retail - 1.6% |
Amazon.com, Inc. (a) | 8,600 | | 1,548,000 |
E-Commerce China Dangdang, Inc. ADR | 5,800 | | 157,006 |
Expedia, Inc. | 16,900 | | 424,021 |
Priceline.com, Inc. (a) | 1,900 | | 759,145 |
| | 2,888,172 |
Leisure Equipment & Products - 0.2% |
Hasbro, Inc. | 5,700 | | 268,926 |
Media - 0.3% |
Discovery Communications, Inc. (a) | 7,000 | | 291,900 |
Grupo Televisa SA de CV (CPO) sponsored ADR | 13,100 | | 339,683 |
| | 631,583 |
Multiline Retail - 1.6% |
Dollarama, Inc. (a) | 3,800 | | 109,698 |
Droga Raia SA | 7,000 | | 107,306 |
Macy's, Inc. | 60,300 | | 1,525,590 |
Nordstrom, Inc. | 16,500 | | 699,270 |
Target Corp. | 8,000 | | 481,040 |
| | 2,922,904 |
Specialty Retail - 1.0% |
China ZhengTong Auto Services Holdings Ltd. | 98,000 | | 92,421 |
Tiffany & Co., Inc. | 12,500 | | 778,375 |
Williams-Sonoma, Inc. | 28,700 | | 1,024,303 |
| | 1,895,099 |
|
| Shares | | Value |
Textiles, Apparel & Luxury Goods - 2.9% |
Coach, Inc. | 20,500 | | $ 1,133,855 |
Deckers Outdoor Corp. (a) | 16,500 | | 1,315,710 |
Fossil, Inc. (a) | 11,000 | | 775,280 |
LVMH Moet Hennessy - Louis Vuitton | 1,106 | | 182,031 |
NIKE, Inc. Class B | 2,100 | | 179,382 |
Phillips-Van Heusen Corp. | 14,400 | | 907,344 |
Steven Madden Ltd. (a) | 6,200 | | 258,664 |
The Swatch Group AG (Bearer) | 870 | | 388,115 |
Vera Bradley, Inc. | 6,100 | | 201,300 |
| | 5,341,681 |
TOTAL CONSUMER DISCRETIONARY | | 20,289,369 |
CONSUMER STAPLES - 0.8% |
Beverages - 0.1% |
Hansen Natural Corp. (a) | 5,000 | | 261,400 |
Personal Products - 0.7% |
Estee Lauder Companies, Inc. Class A | 8,400 | | 677,880 |
Hengan International Group Co. Ltd. | 64,000 | | 552,100 |
| | 1,229,980 |
TOTAL CONSUMER STAPLES | | 1,491,380 |
ENERGY - 4.6% |
Energy Equipment & Services - 1.6% |
Dril-Quip, Inc. (a) | 5,000 | | 388,600 |
Saipem SpA | 8,168 | | 402,316 |
Schlumberger Ltd. | 19,014 | | 1,587,669 |
Transocean Ltd. (a) | 8,600 | | 597,786 |
| | 2,976,371 |
Oil, Gas & Consumable Fuels - 3.0% |
Alpha Natural Resources, Inc. (a) | 13,000 | | 780,390 |
Anadarko Petroleum Corp. | 6,500 | | 495,040 |
Cimarex Energy Co. | 4,600 | | 407,238 |
Concho Resources, Inc. (a) | 10,600 | | 929,302 |
OAO Gazprom sponsored ADR | 5,400 | | 137,376 |
Peabody Energy Corp. | 8,500 | | 543,830 |
Pioneer Natural Resources Co. | 10,900 | | 946,338 |
Tesoro Corp. | 7,500 | | 139,050 |
Uranium One, Inc. | 24,900 | | 118,845 |
Whiting Petroleum Corp. (a) | 8,000 | | 937,520 |
| | 5,434,929 |
TOTAL ENERGY | | 8,411,300 |
FINANCIALS - 2.7% |
Capital Markets - 0.6% |
BlackRock, Inc. Class A | 5,100 | | 971,958 |
Commercial Banks - 1.4% |
Banco do Brasil SA | 33,200 | | 628,570 |
BBVA Banco Frances SA sponsored ADR | 22,100 | | 256,360 |
Huntington Bancshares, Inc. | 4,000 | | 27,480 |
Common Stocks - continued |
| Shares | | Value |
FINANCIALS - continued |
Commercial Banks - continued |
Itau Unibanco Banco Multiplo SA ADR | 30,300 | | $ 727,503 |
Wells Fargo & Co. | 30,500 | | 945,195 |
| | 2,585,108 |
Diversified Financial Services - 0.7% |
Apollo Global Management LLC (e) | 50,700 | | 405,600 |
JPMorgan Chase & Co. | 20,800 | | 882,336 |
| | 1,287,936 |
TOTAL FINANCIALS | | 4,845,002 |
HEALTH CARE - 3.7% |
Biotechnology - 0.8% |
Gilead Sciences, Inc. (a) | 15,200 | | 550,848 |
United Therapeutics Corp. (a) | 13,200 | | 834,504 |
| | 1,385,352 |
Health Care Equipment & Supplies - 0.6% |
Edwards Lifesciences Corp. (a) | 8,300 | | 670,972 |
Volcano Corp. (a) | 16,800 | | 458,808 |
| | 1,129,780 |
Health Care Providers & Services - 1.7% |
Express Scripts, Inc. (a) | 28,200 | | 1,524,210 |
HMS Holdings Corp. (a) | 5,400 | | 349,758 |
Medco Health Solutions, Inc. (a) | 20,600 | | 1,262,162 |
| | 3,136,130 |
Health Care Technology - 0.2% |
SXC Health Solutions Corp. (a) | 7,300 | | 311,822 |
Pharmaceuticals - 0.4% |
Valeant Pharmaceuticals International, Inc. | 25,006 | | 709,084 |
TOTAL HEALTH CARE | | 6,672,168 |
INDUSTRIALS - 8.0% |
Aerospace & Defense - 0.6% |
BE Aerospace, Inc. (a) | 4,600 | | 170,338 |
Goodrich Corp. | 7,000 | | 616,490 |
Precision Castparts Corp. | 2,500 | | 348,025 |
| | 1,134,853 |
Air Freight & Logistics - 0.1% |
Air Lease Corp. Class A (a)(e) | 10,900 | | 223,450 |
Airlines - 2.4% |
Delta Air Lines, Inc. (a) | 190,500 | | 2,400,300 |
United Continental Holdings, Inc. (a) | 85,185 | | 2,029,107 |
| | 4,429,407 |
Construction & Engineering - 0.1% |
Fluor Corp. | 2,300 | | 152,398 |
Electrical Equipment - 0.3% |
Emerson Electric Co. | 8,300 | | 474,511 |
|
| Shares | | Value |
Machinery - 3.9% |
Caterpillar, Inc. | 15,500 | | $ 1,451,730 |
Changsha Zoomlion Heavy Industry Science & Technology Development Co. Ltd. (H Shares) | 71,200 | | 160,858 |
Cummins, Inc. | 12,300 | | 1,353,123 |
Dover Corp. | 11,000 | | 642,950 |
Kennametal, Inc. | 21,700 | | 856,282 |
MAN SE | 5,849 | | 695,912 |
PACCAR, Inc. | 5,600 | | 321,552 |
Parker Hannifin Corp. | 13,000 | | 1,121,900 |
Sandvik AB | 18,600 | | 362,909 |
Weg SA | 3,500 | | 45,976 |
| | 7,013,192 |
Road & Rail - 0.5% |
CSX Corp. | 7,400 | | 478,114 |
Union Pacific Corp. | 5,100 | | 472,566 |
| | 950,680 |
Trading Companies & Distributors - 0.1% |
Mills Estruturas e Servicos de
Engenharia SA (a) | 8,000 | | 99,304 |
TOTAL INDUSTRIALS | | 14,477,795 |
INFORMATION TECHNOLOGY - 13.1% |
Communications Equipment - 1.9% |
HTC Corp. | 9,000 | | 277,683 |
Juniper Networks, Inc. (a) | 33,600 | | 1,240,512 |
Research In Motion Ltd. (a) | 21,100 | | 1,226,543 |
Riverbed Technology, Inc. (a) | 18,000 | | 633,060 |
| | 3,377,798 |
Computers & Peripherals - 4.1% |
Apple, Inc. (a) | 16,400 | | 5,289,985 |
EMC Corp. (a) | 26,100 | | 597,690 |
NetApp, Inc. (a) | 28,900 | | 1,588,344 |
| | 7,476,019 |
Internet Software & Services - 2.7% |
Akamai Technologies, Inc. (a) | 8,800 | | 414,040 |
eBay, Inc. (a) | 19,900 | | 553,817 |
Google, Inc. Class A (a) | 4,900 | | 2,910,453 |
Mail.ru Group Ltd. GDR unit (a)(e) | 1,800 | | 64,800 |
Rackspace Hosting, Inc. (a) | 4,700 | | 147,627 |
Tencent Holdings Ltd. | 32,000 | | 695,375 |
YouKu.com, Inc. ADR (a) | 3,900 | | 136,539 |
| | 4,922,651 |
IT Services - 0.7% |
Cognizant Technology Solutions Corp. Class A (a) | 17,600 | | 1,289,904 |
Semiconductors & Semiconductor Equipment - 1.9% |
ARM Holdings PLC sponsored ADR | 17,400 | | 361,050 |
Broadcom Corp. Class A | 33,400 | | 1,454,570 |
Marvell Technology Group Ltd. (a) | 45,700 | | 847,735 |
NVIDIA Corp. (a) | 9,700 | | 149,380 |
Common Stocks - continued |
| Shares | | Value |
INFORMATION TECHNOLOGY - continued |
Semiconductors & Semiconductor Equipment - continued |
NXP Semiconductors NV | 20,800 | | $ 435,344 |
TriQuint Semiconductor, Inc. (a) | 15,600 | | 182,364 |
| | 3,430,443 |
Software - 1.8% |
Citrix Systems, Inc. (a) | 10,500 | | 718,305 |
Informatica Corp. (a) | 31,400 | | 1,382,542 |
NCsoft Corp. | 769 | | 142,998 |
RealPage, Inc. | 8,900 | | 275,277 |
Rovi Corp. (a) | 2,400 | | 148,824 |
Solera Holdings, Inc. | 5,800 | | 297,656 |
Taleo Corp. Class A (a) | 11,700 | | 323,505 |
| | 3,289,107 |
TOTAL INFORMATION TECHNOLOGY | | 23,785,922 |
MATERIALS - 6.2% |
Chemicals - 4.1% |
Celanese Corp. Class A | 17,800 | | 732,826 |
CF Industries Holdings, Inc. | 9,900 | | 1,337,985 |
Dow Chemical Co. | 35,900 | | 1,225,626 |
Ferro Corp. (a) | 13,100 | | 191,784 |
FMC Corp. | 11,600 | | 926,724 |
LyondellBasell Industries NV Class A (a) | 34,400 | | 1,183,360 |
PPG Industries, Inc. | 11,500 | | 966,805 |
Rockwood Holdings, Inc. (a) | 12,400 | | 485,088 |
Uralkali JSC GDR (Reg. S) | 11,600 | | 425,952 |
| | 7,476,150 |
Metals & Mining - 2.1% |
Alcoa, Inc. | 57,000 | | 877,230 |
Anglo American PLC (United Kingdom) | 4,100 | | 213,359 |
Freeport-McMoRan Copper & Gold, Inc. | 13,400 | | 1,609,206 |
Stillwater Mining Co. (a) | 20,400 | | 435,540 |
United States Steel Corp. (d) | 11,800 | | 689,356 |
| | 3,824,691 |
TOTAL MATERIALS | | 11,300,841 |
TELECOMMUNICATION SERVICES - 0.2% |
Wireless Telecommunication Services - 0.2% |
NII Holdings, Inc. (a) | 8,400 | | 375,144 |
TOTAL COMMON STOCKS (Cost $67,550,283) | 91,648,921 |
Nonconvertible Preferred Stocks - 0.2% |
| Shares | | Value |
CONSUMER DISCRETIONARY - 0.2% |
Automobiles - 0.2% |
Volkswagen AG (Cost $364,931) | 2,400 | | $ 389,548 |
Fixed-Income Funds - 26.7% |
| | | |
Fidelity Floating Rate Central Fund (g) | 54,260 | | 5,416,203 |
Fidelity High Income Central Fund 1 (g) | 69,534 | | 6,768,440 |
Fidelity VIP Investment Grade Central Fund (g) | 344,615 | | 36,250,066 |
TOTAL FIXED-INCOME FUNDS (Cost $46,582,110) | 48,434,709 |
Equity Funds - 20.5% |
| | | |
Commodity Funds - 1.6% |
Fidelity Commodity Strategy Central Fund (g) | 229,825 | | 2,907,291 |
International Equity Funds - 18.9% |
Fidelity Emerging Markets Equity Central Fund (g) | 34,759 | | 7,858,662 |
Fidelity International Equity Central Fund (g) | 371,089 | | 26,462,332 |
TOTAL INTERNATIONAL EQUITY FUNDS | | 34,320,994 |
TOTAL EQUITY FUNDS (Cost $39,090,173) | 37,228,285 |
Money Market Funds - 2.9% |
| | | |
Fidelity Cash Central Fund, 0.19% (b) | 3,876,732 | | 3,876,732 |
Fidelity Securities Lending Cash Central Fund, 0.21% (b)(c) | 1,393,250 | | 1,393,250 |
TOTAL MONEY MARKET FUNDS (Cost $5,269,982) | 5,269,982 |
U.S. Treasury Obligations - 0.2% |
| Principal Amount | | Value |
U.S. Treasury Bills, yield at date of purchase 0.1% 1/13/11 (f)
(Cost $449,982) | | $ 450,000 | | $ 449,996 |
TOTAL INVESTMENT PORTFOLIO - 100.9% (Cost $159,307,461) | | 183,421,441 |
NET OTHER ASSETS (LIABILITIES) - (0.9)% | | (1,697,855) |
NET ASSETS - 100% | $ 181,723,586 |
Futures Contracts |
| Expiration Date | | Underlying Face Amount at Value | | Unrealized Appreciation/(Depreciation) |
Purchased |
Equity Index Contracts |
33 CME E-mini MSCI EAFE Index Contracts | March 2011 | | $ 2,740,650 | | $ 51,463 |
|
The face value of futures purchased as a percentage of net assets is 1.5% |
Legend |
(a) Non-income producing |
(b) Affiliated fund that is available only to investment companies and other accounts managed by Fidelity Investments. The rate quoted is the annualized seven-day yield of the fund at period end. A complete unaudited listing of the fund's holdings as of its most recent quarter end is available upon request. In addition, each Fidelity Central Fund's financial statements, which are not covered by the Fund's Report of Independent Registered Public Accounting Firm, are available on the SEC's website or upon request. |
(c) Investment made with cash collateral received from securities on loan. |
(d) Security or a portion of the security is on loan at period end. |
(e) Security exempt from registration under Rule 144A of the Securities Act of 1933. These securities may be resold in transactions exempt from registration, normally to qualified institutional buyers. At the end of the period, the value of these securities amounted to $693,850 or 0.4% of net assets. |
(f) Security or a portion of the security was pledged to cover margin requirements for futures contracts. At the period end, the value of securities pledged amounted to $449,996. |
(g) Affiliated fund that is available only to investment companies and other accounts managed by Fidelity Investments. A complete unaudited schedule of portfolio holdings for each Fidelity Central Fund is filed with the SEC for the first and third quarters of each fiscal year on Form N-Q and is available upon request or at the SEC's web site at www.sec.gov. An unaudited holdings listing for the Fund, which presents direct holdings as well as the pro rata share of securities and other investments held indirectly through its investment in underlying International Equity and Fixed Income Fidelity Central Funds, is available at advisor.fidelity.com. In addition, each Fidelity Central Fund's financial statements, which are not covered by the Fund's Report of Independent Registered Public Accounting Firm, are available on the SEC's web site or upon request. |
Affiliated Central Funds |
Information regarding fiscal year to date income earned by the Fund from investments in Fidelity Central Funds is as follows: |
Fund | Income earned |
Fidelity Cash Central Fund | $ 13,077 |
Fidelity Commodity Strategy Central Fund | 1,152 |
Fidelity Emerging Markets Equity Central Fund | 89,792 |
Fidelity Floating Rate Central Fund | 137,943 |
Fidelity High Income Central Fund 1 | 540,457 |
Fidelity International Equity Central Fund | 546,270 |
Fidelity Securities Lending Cash Central Fund | 10,548 |
Fidelity VIP Investment Grade Central Fund | 1,320,816 |
Total | $ 2,660,055 |
Additional information regarding the Fund's fiscal year to date purchases and sales, including the ownership percentage, of the non Money Market Central Funds is as follows: |
Fund | Value, beginning of period | Purchases | Sales Proceeds | Value, end
of period | % ownership, end of period |
Fidelity Commodity Strategy Central Fund | $ 2,625,759 | $ 1,027,324 | $ 1,008,089 | $ 2,907,291 | 1.0% |
Fidelity Emerging Markets Equity Central Fund | 5,984,150 | 498,168 | - | 7,858,662 | 2.0% |
Fidelity Floating Rate Central Fund | 2,194,656 | 2,944,584 | - | 5,416,203 | 0.2% |
Fidelity High Income Central Fund 1 | 6,801,191 | 540,457 | 997,672 | 6,768,440 | 1.1% |
Fidelity International Equity Central Fund | 25,242,554 | 546,270 | 1,201,485 | 26,462,332 | 1.5% |
Fidelity VIP Investment Grade Central Fund | 36,173,232 | 5,573,900 | 5,767,220 | 36,250,066 | 1.0% |
Total | $ 79,021,542 | $ 11,130,703 | $ 8,974,466 | $ 85,662,994 | |
Other Information |
The following is a summary of the inputs used, as of December 31, 2010, involving the Fund's assets and liabilities carried at fair value. The inputs or methodology used for valuing securities may not be an indication of the risk associated with investing in those securities. For more information on valuation inputs, and their aggregation into the levels used in the tables below, please refer to the Security Valuation section in the accompanying Notes to Financial Statements. |
Valuation Inputs at Reporting Date: |
Description | Total | Level 1 | Level 2 | Level 3 |
Investments in Securities: | | | | |
Equities: | | | | |
Consumer Discretionary | $ 20,678,917 | $ 20,678,917 | $ - | $ - |
Consumer Staples | 1,491,380 | 1,491,380 | - | - |
Energy | 8,411,300 | 8,411,300 | - | - |
Financials | 4,845,002 | 4,439,402 | 405,600 | - |
Health Care | 6,672,168 | 6,672,168 | - | - |
Industrials | 14,477,795 | 14,254,345 | - | 223,450 |
Information Technology | 23,785,922 | 23,785,922 | - | - |
Materials | 11,300,841 | 11,300,841 | - | - |
Telecommunication Services | 375,144 | 375,144 | - | - |
U.S. Government and Government Agency Obligations | 449,996 | - | 449,996 | - |
Fixed-Income Funds | 48,434,709 | 48,434,709 | - | - |
Money Market Funds | 5,269,982 | 5,269,982 | - | - |
Equity Funds | 37,228,285 | 37,228,285 | - | - |
Total Investments in Securities: | $ 183,421,441 | $ 182,342,395 | $ 855,596 | $ 223,450 |
Derivative Instruments: | | | | |
Assets | | | | |
Futures Contracts | $ 51,463 | $ 51,463 | $ - | $ - |
The following is a reconciliation of Investments in Securities for which Level 3 inputs were used in determining value: |
Investments in Securities: | |
Beginning Balance | $ - |
Total Realized Gain (Loss) | - |
Total Unrealized Gain (Loss) | 5,450 |
Cost of Purchases | 218,000 |
Proceeds of Sales | - |
Amortization/Accretion | - |
Transfers in to Level 3 | - |
Transfers out of Level 3 | - |
Ending Balance | $ 223,450 |
The change in unrealized gain (loss) for the period attributable to Level 3 securities held at December 31, 2010 | $ 5,450 |
The information used in the above reconciliation represents fiscal year to date activity for any Investments in Securities identified as using Level 3 inputs at either the beginning or the end of the current fiscal period. Transfers in or out of Level 3 represent the beginning value of any Security or Instrument where a change in the pricing level occurred from the beginning to the end of the period. The cost of purchases and the proceeds of sales may include securities received or delivered through corporate actions or exchanges. Realized and unrealized gains (losses) disclosed in the reconciliation are included in Net Gain (Loss) on the Fund's Statement of Operations. |
Value of Derivative Instruments |
The following table is a summary of the Fund's value of derivative instruments by risk exposure as of December 31, 2010. For additional information on derivative instruments, please refer to the Derivative Instruments section in the accompanying Notes to Financial Statements. |
Risk Exposure /
Derivative Type | Value |
| Asset | Liability |
Equity Risk (a) | | |
Futures Contracts | $ 51,463 | $ - |
Total Value of Derivatives | $ 51,463 | $ - |
(a) Reflects cumulative appreciation/(depreciation) on futures contracts as disclosed on the Schedule of Investments. Only the period end variation margin is separately disclosed on the Statement of Assets and Liabilities. |
Other Information |
The information in the following tables is based on the combined investments of the Fund and its pro-rata share of its investments of Fidelity's International Equity and Fixed-Income Central Funds. |
The composition of credit quality ratings as a percentage of net assets is as follows (Unaudited): |
U.S. Government and U.S. Government Agency Obligations | 14.5% |
AAA,AA,A | 3.7% |
BBB | 2.8% |
BB | 2.5% |
B | 2.8% |
CCC,CC,C | 0.8% |
Not Rated | 0.9% |
Equities | 72.2% |
Short-Term Investments and Net Other Assets | (0.2)% |
| 100.0% |
We have used ratings from Moody's Investors Service, Inc. Where Moody's® ratings are not available, we have used S&P® ratings. All ratings are as of the report date and do not reflect subsequent changes. Percentages are adjusted for the effect of futures contracts, if applicable. |
Distribution of investments by country of issue, as a percentage of total net assets, is as follows: (Unaudited) |
United States of America | 69.0% |
United Kingdom | 3.8% |
Germany | 2.5% |
Brazil | 2.4% |
Canada | 2.2% |
Japan | 2.1% |
Netherlands | 1.7% |
Switzerland | 1.6% |
France | 1.6% |
Cayman Islands | 1.4% |
Russia | 1.0% |
Bermuda | 1.0% |
Korea (South) | 1.0% |
Others (Individually Less Than 1%) | 8.7% |
| 100.0% |
Income Tax Information |
At December 31, 2010, the Fund had a capital loss carryforward of approximately $47,330,506 of which $1,637,275, $24,334,072 and $21,359,159 will expire in fiscal 2011, 2016 and 2017, respectively. Capital loss carryforwards are only available to offset future capital gains of the Fund to the extent provided by regulations and may be limited. |
See accompanying notes which are an integral part of the financial statements.
Annual Report
Statement of Assets and Liabilities
| December 31, 2010 |
Assets | | |
Investment in securities, at value (including securities loaned of $1,350,231) - See accompanying schedule: Unaffiliated issuers (cost $68,365,196) | $ 92,488,465 | |
Fidelity Central Funds (cost $90,942,265) | 90,932,976 | |
Total Investments (cost $159,307,461) | | $ 183,421,441 |
Cash | | 47,991 |
Foreign currency held at value
(cost $1) | | 2 |
Receivable for investments sold | | 368,167 |
Receivable for fund shares sold | | 1,512 |
Dividends receivable | | 31,653 |
Distributions receivable from Fidelity Central Funds | | 676 |
Receivable for daily variation on futures contracts | | 20,159 |
Prepaid expenses | | 410 |
Other receivables | | 5,806 |
Total assets | | 183,897,817 |
| | |
Liabilities | | |
Payable for investments purchased | $ 145,108 | |
Payable for fund shares redeemed | 495,058 | |
Accrued management fee | 83,964 | |
Distribution and service plan fees payable | 1,570 | |
Other affiliated payables | 19,683 | |
Other payables and accrued
expenses | 35,598 | |
Collateral on securities loaned, at value | 1,393,250 | |
Total liabilities | | 2,174,231 |
| | |
Net Assets | | $ 181,723,586 |
Net Assets consist of: | | |
Paid in capital | | $ 198,306,606 |
Distributions in excess of net investment income | | (7,498) |
Accumulated undistributed net realized gain (loss) on investments and foreign currency transactions | | (40,741,386) |
Net unrealized appreciation (depreciation) on investments and assets and liabilities in foreign
currencies | | 24,165,864 |
Net Assets | | $ 181,723,586 |
Statement of Assets and Liabilities - continued
| December 31, 2010 |
Initial Class:
Net Asset Value, offering price and redemption price per share ($138,051,432 ÷ 9,509,290 shares) | | $ 14.52 |
| | |
Service Class:
Net Asset Value, offering price and redemption price per share ($3,998,948 ÷ 277,258 shares) | | $ 14.42 |
| | |
Service Class 2:
Net Asset Value, offering price and redemption price per share ($6,045,951 ÷ 420,910 shares) | | $ 14.36 |
| | |
Investor Class:
Net Asset Value, offering price and redemption price per share ($33,627,255 ÷ 2,324,998 shares) | | $ 14.46 |
See accompanying notes which are an integral part of the financial statements.
Annual Report
Financial Statements - continued
Statement of Operations
| Year ended December 31, 2010 |
Investment Income | | |
Dividends | | $ 636,194 |
Interest | | 1,737 |
Income from Fidelity Central Funds | | 2,660,055 |
Total income | | 3,297,986 |
| | |
Expenses | | |
Management fee | $ 961,184 | |
Transfer agent fees | 165,062 | |
Distribution and service plan fees | 22,681 | |
Accounting and security lending fees | 84,908 | |
Custodian fees and expenses | 39,525 | |
Independent trustees' compensation | 662 | |
Registration fees | 57 | |
Audit | 50,142 | |
Legal | 1,669 | |
Miscellaneous | 1,772 | |
Total expenses before reductions | 1,327,662 | |
Expense reductions | (36,421) | 1,291,241 |
Net investment income (loss) | | 2,006,745 |
Realized and Unrealized Gain (Loss) Net realized gain (loss) on: | | |
Investment securities: | | |
Unaffiliated issuers | 13,824,544 | |
Fidelity Central Funds | 486,796 | |
Foreign currency transactions | (20,971) | |
Futures contracts | 355,557 | |
Capital gain distributions from Fidelity Central Funds | 1,260,199 | |
Total net realized gain (loss) | | 15,906,125 |
Change in net unrealized appreciation (depreciation) on: Investment securities | 7,996,414 | |
Assets and liabilities in foreign currencies | (1,445) | |
Futures contracts | 37,723 | |
Total change in net unrealized appreciation (depreciation) | | 8,032,692 |
Net gain (loss) | | 23,938,817 |
Net increase (decrease) in net assets resulting from operations | | $ 25,945,562 |
Statement of Changes in Net Assets
| Year ended
December 31, 2010 | Year ended
December 31, 2009 |
Increase (Decrease) in Net Assets | | |
Operations | | |
Net investment income (loss) | $ 2,006,745 | $ 2,369,031 |
Net realized gain (loss) | 15,906,125 | (3,626,092) |
Change in net unrealized appreciation (depreciation) | 8,032,692 | 45,201,288 |
Net increase (decrease) in net assets resulting
from operations | 25,945,562 | 43,944,227 |
Distributions to shareholders from net investment income | (1,957,332) | (2,373,235) |
Distributions to shareholders from net realized gain | (557,354) | (313,149) |
Total distributions | (2,514,686) | (2,686,384) |
Share transactions - net increase (decrease) | (16,470,726) | (14,759,164) |
Total increase (decrease) in net assets | 6,960,150 | 26,498,679 |
| | |
Net Assets | | |
Beginning of period | 174,763,436 | 148,264,757 |
End of period (including distributions in excess of net investment income of $7,498 and undistributed net investment income of $0, respectively) | $ 181,723,586 | $ 174,763,436 |
See accompanying notes which are an integral part of the financial statements.
Annual Report
Financial Highlights - Initial Class
Years ended December 31, | 2010 | 2009 | 2008 | 2007 | 2006 |
Selected Per-Share Data | | | | | |
Net asset value, beginning of period | $ 12.66 | $ 9.68 | $ 15.51 | $ 13.60 | $ 12.97 |
Income from Investment Operations | | | | | |
Net investment income (loss)C | .16 | .17 | .26 | .29 | .26 |
Net realized and unrealized gain (loss) | 1.91 | 3.01 | (5.82) | 2.24 | .63 |
Total from investment operations | 2.07 | 3.18 | (5.56) | 2.53 | .89 |
Distributions from net investment income | (.16) | (.18) | (.26) | (.62) | (.26) |
Distributions from net realized gain | (.05) | (.02) | (.01) | - | - |
Total distributions | (.21) | (.20) | (.27) | (.62) | (.26) |
Net asset value, end of period | $ 14.52 | $ 12.66 | $ 9.68 | $ 15.51 | $ 13.60 |
Total ReturnA,B | 16.34% | 32.91% | (35.81)% | 18.97% | 6.99% |
Ratios to Average Net AssetsD,F | | | | | |
Expenses before reductions | .74% | .78% | .74% | .74% | .77% |
Expenses net of fee waivers, if any | .73% | .78% | .74% | .74% | .77% |
Expenses net of all reductions | .72% | .77% | .73% | .73% | .73% |
Net investment income (loss) | 1.20% | 1.57% | 1.90% | 1.98% | 2.01% |
Supplemental Data | | | | | |
Net assets, end of period (000 omitted) | $ 138,051 | $ 136,479 | $ 118,672 | $ 211,867 | $ 212,222 |
Portfolio turnover rateE | 68% | 126% | 110% | 132% | 233% |
A Total returns do not reflect charges attributable to your insurance company's separate account. Inclusion of these charges would reduce the total returns shown.
B Total returns would have been lower had certain expenses not been reduced during the periods shown.
C Calculated based on average shares outstanding during the period.
D Fees and expenses of the underlying Fidelity Central Funds are not included in the Fund's expense ratio. The Fund indirectly bears its proportionate share of the expenses of any underlying Fidelity Central Funds.
E Amount does not include the portfolio activity of any underlying Fidelity Central Funds.
F Expense ratios reflect operating expenses of the class. Expenses before reductions do not reflect amounts reimbursed by the investment adviser or reductions from brokerage service arrangements or reductions from other expense offset arrangements and do not represent the amount paid by the class during periods when reimbursements or reductions occur. Expenses net of fee waivers reflect expenses after reimbursement by the investment adviser but prior to reductions from brokerage service arrangements or other expense offset arrangements. Expenses net of all reductions represent the net expenses paid by the class.
Financial Highlights - Service Class
Years ended December 31, | 2010 | 2009 | 2008 | 2007 | 2006 |
Selected Per-Share Data | | | | | |
Net asset value, beginning of period | $ 12.58 | $ 9.62 | $ 15.41 | $ 13.51 | $ 12.88 |
Income from Investment Operations | | | | | |
Net investment income (loss)C | .14 | .16 | .24 | .27 | .25 |
Net realized and unrealized gain (loss) | 1.89 | 2.99 | (5.77) | 2.22 | .63 |
Total from investment operations | 2.03 | 3.15 | (5.53) | 2.49 | .88 |
Distributions from net investment income | (.15) | (.17) | (.25) | (.59) | (.25) |
Distributions from net realized gain | (.05) | (.02) | (.01) | - | - |
Total distributions | (.19)G | (.19) | (.26) | (.59) | (.25) |
Net asset value, end of period | $ 14.42 | $ 12.58 | $ 9.62 | $ 15.41 | $ 13.51 |
Total ReturnA,B | 16.18% | 32.79% | (35.88)% | 18.79% | 6.93% |
Ratios to Average Net AssetsD,F | | | | | |
Expenses before reductions | .84% | .88% | .84% | .84% | .87% |
Expenses net of fee waivers, if any | .84% | .88% | .84% | .84% | .87% |
Expenses net of all reductions | .82% | .87% | .83% | .83% | .83% |
Net investment income (loss) | 1.09% | 1.47% | 1.80% | 1.88% | 1.91% |
Supplemental Data | | | | | |
Net assets, end of period (000 omitted) | $ 3,999 | $ 3,838 | $ 2,911 | $ 5,113 | $ 4,977 |
Portfolio turnover rateE | 68% | 126% | 110% | 132% | 233% |
A Total returns do not reflect charges attributable to your insurance company's separate account. Inclusion of these charges would reduce the total returns shown.
B Total returns would have been lower had certain expenses not been reduced during the periods shown.
C Calculated based on average shares outstanding during the period.
D Fees and expenses of the underlying Fidelity Central Funds are not included in the Fund's expense ratio. The Fund indirectly bears its proportionate share of the expenses of any underlying Fidelity Central Funds.
E Amount does not include the portfolio activity of any underlying Fidelity Central Funds.
F Expense ratios reflect operating expenses of the class. Expenses before reductions do not reflect amounts reimbursed by the investment adviser or reductions from brokerage service arrangements or reductions from other expense offset arrangements and do not represent the amount paid by the class during periods when reimbursements or reductions occur. Expenses net of fee waivers reflect expenses after reimbursement by the investment adviser but prior to reductions from brokerage service arrangements or other expense offset arrangements. Expenses net of all reductions represent the net expenses paid by the class.
G Total distributions of $.19 per share is comprised of distributions from net investment income of $.148 and distributions from net realized gain of $.045 per share.
See accompanying notes which are an integral part of the financial statements.
Annual Report
Financial Highlights - Service Class 2
Years ended December 31, | 2010 | 2009 | 2008 | 2007 | 2006 |
Selected Per-Share Data | | | | | |
Net asset value, beginning of period | $ 12.51 | $ 9.57 | $ 15.34 | $ 13.42 | $ 12.81 |
Income from Investment Operations | | | | | |
Net investment income (loss)C | .12 | .14 | .22 | .25 | .22 |
Net realized and unrealized gain (loss) | 1.88 | 2.97 | (5.75) | 2.21 | .62 |
Total from investment operations | 2.00 | 3.11 | (5.53) | 2.46 | .84 |
Distributions from net investment income | (.11) | (.15) | (.23) | (.54) | (.23) |
Distributions from net realized gain | (.05) | (.02) | (.01) | - | - |
Total distributions | (.15)G | (.17) | (.24) | (.54) | (.23) |
Net asset value, end of period | $ 14.36 | $ 12.51 | $ 9.57 | $ 15.34 | $ 13.42 |
Total ReturnA,B | 16.02% | 32.55% | (36.05)% | 18.68% | 6.64% |
Ratios to Average Net AssetsD,F | | | | | |
Expenses before reductions | 1.02% | 1.06% | 1.01% | 1.02% | 1.05% |
Expenses net of fee waivers, if any | 1.02% | 1.06% | 1.01% | 1.02% | 1.05% |
Expenses net of all reductions | 1.00% | 1.05% | 1.01% | 1.01% | 1.02% |
Net investment income (loss) | .91% | 1.29% | 1.62% | 1.70% | 1.73% |
Supplemental Data | | | | | |
Net assets, end of period (000 omitted) | $ 6,046 | $ 8,139 | $ 6,545 | $ 8,622 | $ 6,205 |
Portfolio turnover rateE | 68% | 126% | 110% | 132% | 233% |
A Total returns do not reflect charges attributable to your insurance company's separate account. Inclusion of these charges would reduce the total returns shown.
B Total returns would have been lower had certain expenses not been reduced during the periods shown.
C Calculated based on average shares outstanding during the period.
D Fees and expenses of the underlying Fidelity Central Funds are not included in the Fund's expense ratio. The Fund indirectly bears its proportionate share of the expenses of any underlying Fidelity Central Funds.
E Amount does not include the portfolio activity of any underlying Fidelity Central Funds.
F Expense ratios reflect operating expenses of the class. Expenses before reductions do not reflect amounts reimbursed by the investment adviser or reductions from brokerage service arrangements or reductions from other expense offset arrangements and do not represent the amount paid by the class during periods when reimbursements or reductions occur. Expenses net of fee waivers reflect expenses after reimbursement by the investment adviser but prior to reductions from brokerage service arrangements or other expense offset arrangements. Expenses net of all reductions represent the net expenses paid by the class.
G Total distributions of $.15 per share is comprised of distributions from net investment income of $.108 and distributions from net realized gain of $.045 per share.
Financial Highlights - Investor Class
Years ended December 31, | 2010 | 2009 | 2008 | 2007 | 2006 |
Selected Per-Share Data | | | | | |
Net asset value, beginning of period | $ 12.61 | $ 9.65 | $ 15.46 | $ 13.56 | $ 12.96 |
Income from Investment Operations | | | | | |
Net investment income (loss)C | .15 | .16 | .24 | .27 | .24 |
Net realized and unrealized gain (loss) | 1.90 | 2.99 | (5.78) | 2.23 | .63 |
Total from investment operations | 2.05 | 3.15 | (5.54) | 2.50 | .87 |
Distributions from net investment income | (.15) | (.17) | (.26) | (.60) | (.27) |
Distributions from net realized gain | (.05) | (.02) | (.01) | - | - |
Total distributions | (.20) | (.19) | (.27) | (.60) | (.27) |
Net asset value, end of period | $ 14.46 | $ 12.61 | $ 9.65 | $ 15.46 | $ 13.56 |
Total ReturnA,B | 16.25% | 32.68% | (35.85)% | 18.78% | 6.80% |
Ratios to Average Net AssetsD,F | | | | | |
Expenses before reductions | .83% | .89% | .83% | .86% | .92% |
Expenses net of fee waivers, if any | .82% | .89% | .83% | .86% | .92% |
Expenses net of all reductions | .81% | .87% | .83% | .86% | .89% |
Net investment income (loss) | 1.11% | 1.47% | 1.81% | 1.86% | 1.86% |
Supplemental Data | | | | | |
Net assets, end of period (000 omitted) | $ 33,627 | $ 26,307 | $ 20,137 | $ 16,370 | $ 6,882 |
Portfolio turnover rateE | 68% | 126% | 110% | 132% | 233% |
A Total returns do not reflect charges attributable to your insurance company's separate account. Inclusion of these charges would reduce the total returns shown.
B Total returns would have been lower had certain expenses not been reduced during the periods shown.
C Calculated based on average shares outstanding during the period.
D Fees and expenses of the underlying Fidelity Central Funds are not included in the Fund's expense ratio. The Fund indirectly bears its proportionate share of the expenses of any underlying Fidelity Central Funds.
E Amount does not include the portfolio activity of any underlying Fidelity Central Funds.
F Expense ratios reflect operating expenses of the class. Expenses before reductions do not reflect amounts reimbursed by the investment adviser or reductions from brokerage service arrangements or reductions from other expense offset arrangements and do not represent the amount paid by the class during periods when reimbursements or reductions occur. Expenses net of fee waivers reflect expenses after reimbursement by the investment adviser but prior to reductions from brokerage service arrangements or other expense offset arrangements. Expenses net of all reductions represent the net expenses paid by the class.
See accompanying notes which are an integral part of the financial statements.
Annual Report
Notes to Financial Statements
For the period ended December 31, 2010
1. Organization.
VIP Asset Manager: Growth Portfolio (the Fund) is a fund of Variable Insurance Products Fund V (the Trust) and is authorized to issue an unlimited number of shares. The Trust is registered under the Investment Company Act of 1940, as amended (the 1940 Act), as an open-end management investment company organized as a Massachusetts business trust. Shares of the Fund may only be purchased by insurance companies for the purpose of funding variable annuity or variable life insurance contracts. The Fund offers the following classes of shares: Initial Class shares, Service Class shares, Service Class 2 shares and Investor Class shares. All classes have equal rights and voting privileges, except for matters affecting a single class. Investment income, realized and unrealized capital gains and losses, the common expenses of the Fund, and certain fund-level expense reductions, if any, are allocated on a pro-rata basis to each class based on the relative net assets of each class to the total net assets of the Fund. Each class differs with respect to transfer agent and distribution and service plan fees incurred. Certain expense reductions may also differ by class. The Fund's investments in emerging markets can be subject to social, economic, regulatory, and political uncertainties and can be extremely volatile.
2. Investments in Fidelity Central Funds.
The Fund may invest in Fidelity Central Funds, which are open-end investment companies available only to other investment companies and accounts managed by Fidelity Management & Research Company (FMR) and its affiliates. The Fund's Schedule of Investments lists each of the Fidelity Central Funds held as of period end, if any, as an investment of the Fund, but does not include the underlying holdings of each Fidelity Central Fund. As an Investing Fund, the Fund indirectly bears its proportionate share of the expenses of the underlying Fidelity Central Funds.
Based on their investment objective, each Fidelity Central Fund may invest or participate in various investment vehicles or strategies that are similar to those of the Fund. These strategies are consistent with the investment objectives of the Fund and may involve certain economic risks which may cause a decline in value of each of the Fidelity Central Funds and thus a decline in the value of the Fund. The following summarizes the Fund's investment in each Fidelity Central Fund.
Fidelity Central Fund | Investment Manager | Investment Objective | Investment Practices |
Fidelity Commodity Strategy Central Fund | FMR Co., Inc. (FMRC) | Seeks to provide investment returns that correspond to the performance of the commodities market. | Investment in wholly-owned subsidiary organized under the laws of the Cayman Islands Futures Repurchase Agreements Swap Agreements |
Fidelity Emerging Markets Equity Central Fund | FMRC | Seeks capital appreciation by investing primarily in equity securities of issuers in emerging markets. | Foreign Securities Repurchase Agreements Restricted Securities |
Fidelity International Equity Central Fund | FMRC | Seeks capital appreciation by investing primarily in non-U.S. based common stocks, including securities of issuers located in emerging markets. | Foreign Securities Repurchase Agreements |
Fidelity Floating Rate Central Fund | FMRC | Seeks a high level of income by normally investing in floating rate loans and other floating rate securities. | Loans & Direct Debt Instruments Repurchase Agreements Restricted Securities |
Fidelity High Income Central Fund 1 | FMRC | Seeks a high level of income and may also seek capital appreciation by investing primarily in debt securities, preferred stocks, and convertible securities, with an emphasis on lower-quality debt securities. | Loans & Direct Debt Instruments Repurchase Agreements Restricted Securities |
VIP Investment Grade Central Fund | Fidelity Investments Money Management, Inc. (FIMM) | Seeks a high level of current income by normally investing in investment-grade debt securities and repurchase agreements. | Delayed Delivery & When Issued Securities Repurchase Agreements Restricted Securities Swap Agreements |
Fidelity Money Market Central Funds | FIMM | Seeks to obtain a high level of current income consistent with the preservation of capital and liquidity. | Short-term Investments |
Annual Report
2. Investments in Fidelity Central Funds - continued
An unaudited holdings listing for the Fund, which presents direct holdings as well as the pro-rata share of any securities and other investments held indirectly through its investment in each of Fidelity's International and Fixed-Income Central Funds, is available at advisor.fidelity.com. A complete unaudited list of holdings for each Fidelity Central Fund is available upon request or at the Securities and Exchange Commission (the SEC) web site at www.sec.gov. In addition, the financial statements of the Fidelity Central Funds which contain the significant accounting policies (including security valuation policies) of those funds, which are not covered by the Fund's Report of Independent Registered Public Accounting Firm, are available on the SEC web site or upon request.
3. Significant Accounting Policies.
The financial statements have been prepared in conformity with accounting principles generally accepted in the United States of America (GAAP), which require management to make certain estimates and assumptions at the date of the financial statements. Actual results could differ from those estimates. Subsequent events, if any, through the date that the financial statements were issued have been evaluated in the preparation of the financial statements. The following summarizes the significant accounting policies of the Fund:
Security Valuation. Investments are valued as of 4:00 p.m. Eastern time on the last calendar day of the period. The Fund uses independent pricing services approved by the Board of Trustees to value its investments. When current market prices or quotations are not readily available or reliable, valuations may be determined in good faith in accordance with procedures adopted by the Board of Trustees. Factors used in determining value may include market or security specific events. The frequency with which these procedures are used cannot be predicted and they may be utilized to a significant extent. The value used for net asset value (NAV) calculation under these procedures may differ from published prices for the same securities.
The Fund categorizes the inputs to valuation techniques used to value its investments into a disclosure hierarchy consisting of three levels as shown below.
Level 1 - quoted prices in active markets for identical investments
Level 2 - other significant observable inputs (including quoted prices for similar investments, interest rates, prepayment speeds, etc.)
Level 3 - unobservable inputs (including the Fund's own assumptions based on the best information available)
Changes in valuation techniques may result in transfers in or out of an assigned level within the disclosure hierarchy. The aggregate value of investments by input level, as of December 31, 2010, as well as a roll forward of Level 3 securities, is included at the end of the Fund's Schedule of Investments. Valuation techniques used to value the Fund's investments by major category are as follows.
Equity securities, including restricted securities, for which market quotations are readily available, are valued at the last reported sale price or official closing price as reported by an independent pricing service on the primary market or exchange on which they are traded and are categorized as Level 1 in the hierarchy. In the event there were no sales during the day or closing prices are not available, securities are valued at the last quoted bid price or may be valued using the last available price and are generally categorized as Level 2 in the hierarchy. For foreign equity securities, when significant market or security specific events arise, comparisons to the valuation of American Depositary Receipts (ADRs), futures contracts, Exchange-traded funds (ETFs) and certain indexes as well as quoted prices for similar securities are used and are categorized as Level 2 in the hierarchy in these circumstances. Utilizing these techniques may result in transfers between Level 1 and Level 2. For restricted equity securities and private placements where observable inputs are limited, assumptions about market activity and risk are used and are categorized as Level 3 in the hierarchy.
Futures contracts are valued at the settlement price established each day by the board of trade or exchange on which they are traded and are categorized as Level 1 in the hierarchy. Investments in open-end mutual funds, including the Fidelity Central Funds, are valued at their closing net asset value each business day and are categorized as Level 1 in the hierarchy. Short-term securities with remaining maturities of sixty days or less for which quotations are not readily available are valued at amortized cost, which approximates fair value and are categorized as Level 2 in the hierarchy.
Foreign Currency. The Fund uses foreign currency contracts to facilitate transactions in foreign-denominated securities. Gains and losses from these transactions may arise from changes in the value of the foreign currency or if the counterparties do not perform under the contracts' terms.
Foreign-denominated assets, including investment securities, and liabilities are translated into U.S. dollars at the exchange rate at period end. Purchases and sales of investment securities, income and dividends received and expenses denominated in foreign currencies are translated into U.S. dollars at the exchange rate in effect on the transaction date.
The effects of exchange rate fluctuations on investments are included with the net realized and unrealized gain (loss) on investment securities. Other foreign currency transactions resulting in realized and unrealized gain (loss) are disclosed separately.
Annual Report
Notes to Financial Statements - continued
3. Significant Accounting Policies - continued
Investment Transactions and Income. For financial reporting purposes, the Fund's investment holdings and NAV include trades executed through the end of the last business day of the period. The NAV per share for processing shareholder transactions is calculated as of the close of business of the New York Stock Exchange (NYSE), normally 4:00 p.m. Eastern time and includes trades executed through the end of the prior business day. Gains and losses on securities sold are determined on the basis of identified cost and may include proceeds received from litigation. Dividend income is recorded on the ex-dividend date, except for certain dividends from foreign securities where the ex-dividend date may have passed, which are recorded as soon as the Fund is informed of the ex-dividend date. Non-cash dividends included in dividend income, if any, are recorded at the fair market value of the securities received. Distributions received on securities that represent a return of capital or capital gain are recorded as a reduction of cost of investments and/or as a realized gain. The Fund estimates the components of distributions received that may be considered return of capital distributions or capital gain distributions. Interest income and distributions from the Fidelity Central Funds are accrued as earned. Interest income includes coupon interest and amortization of premium and accretion of discount on debt securities. Investment income is recorded net of foreign taxes withheld where recovery of such taxes is uncertain.
Expenses. Expenses directly attributable to a fund are charged to that fund. Expenses attributable to more than one fund are allocated among the respective funds on the basis of relative net assets or other appropriate methods. Expense estimates are accrued in the period to which they relate and adjustments are made when actual amounts are known.
Income Tax Information and Distributions to Shareholders. Each year the Fund intends to qualify as a regulated investment company, including distributing substantially all of its taxable income and realized gains under Subchapter M of the Internal Revenue Code and filing its U.S. federal tax return. As a result, no provision for income taxes is required. As of December 31, 2010, the Fund did not have any unrecognized tax benefits in the accompanying financial statements. A fund's federal tax return is subject to examination by the Internal Revenue Service (IRS) for a period of three years. Foreign taxes are provided for based on the Fund's understanding of the tax rules and rates that exist in the foreign markets in which it invests.
Distributions are declared and recorded on the ex-dividend date. Income dividends and capital gain distributions are declared separately for each class. Income and capital gain distributions are determined in accordance with income tax regulations, which may differ from GAAP.
Capital accounts within the financial statements are adjusted for permanent book-tax differences. These adjustments have no impact on net assets or the results of operations. Temporary book-tax differences will reverse in a subsequent period.
Book-tax differences are primarily due to the short-term gain distributions from the Fidelity Central Funds, in-kind transactions, futures transactions, foreign currency transactions, partnerships (including allocations from Fidelity Central Funds), capital loss carryforwards and losses deferred due to wash sales and excise tax regulations.
The federal tax cost of investment securities and unrealized appreciation (depreciation) as of period end were as follows:
Gross unrealized appreciation | $ 37,728,096 |
Gross unrealized depreciation | (6,554,136) |
Net unrealized appreciation (depreciation) | $ 31,173,960 |
| |
Tax Cost | $ 152,247,481 |
The tax-based components of distributable earnings as of period end were as follows:
Capital loss carryforward | $ (47,330,506) |
Net unrealized appreciation (depreciation) | $ 31,174,381 |
The tax character of distributions paid was as follows:
| December 31, 2010 | December 31, 2009 |
Ordinary Income | $ 2,514,686 | $ 2,686,384 |
4. Operating Policies.
Restricted Securities. The Fund may invest in securities that are subject to legal or contractual restrictions on resale. These securities generally may be resold in transactions exempt from registration or to the public if the securities are registered. Disposal of these securities may involve time-consuming negotiations and expense, and prompt sale at an acceptable price may be difficult. Information regarding restricted securities is included at the end of the Fund's Schedule of Investments.
Annual Report
5. Derivative Instruments.
Risk Exposures and the Use of Derivative Instruments. The Fund uses derivative instruments (derivatives), including futures contracts in order to meet its investment objectives. The strategy is to use derivatives to increase returns and to manage exposure to certain risks as defined below. The success of any strategy involving derivatives depends on analysis of numerous economic factors, and if the strategies for investment do not work as intended, the Fund may not achieve its objectives.
The Fund's use of derivatives may increase or decrease its exposure to the following risk:
Equity Risk | Equity risk relates to the fluctuations in the value of financial instruments as a result of changes in market prices (other than those arising from interest rate risk or foreign exchange risk), whether caused by factors specific to an individual investment, its issuer, or all factors affecting all instruments traded in a market or market segment. |
The Fund is also exposed to additional risks from investing in derivatives, such as liquidity risk and counterparty credit risk. Liquidity risk is the risk that the Fund will be unable to sell the derivative in the open market in a timely manner. Counterparty credit risk is the risk that the counterparty will not be able to fulfill its obligation to the Fund. The Fund's maximum risk of loss from counterparty credit risk is generally the aggregate unrealized appreciation and unpaid counterparty fees in excess of any collateral pledged by the counterparty to the Fund. Counterparty risk related to exchange-traded futures contracts is minimal because of the protection provided by the exchange on which they trade. Risk of loss may exceed the amounts recognized in the Statement of Assets and Liabilities.
Futures Contracts. A futures contract is an agreement between two parties to buy or sell a specified underlying instrument for a fixed price at a specified future date. The Fund uses futures contracts to manage its exposure to the stock market.
Upon entering into a futures contract, a fund is required to deposit either cash or securities (initial margin) with a clearing broker in an amount equal to a certain percentage of the face value of the contract. Futures contracts are marked-to-market daily and subsequent payments (variation margin) are made or received by a fund depending on the daily fluctuations in the value of the futures contracts and are recorded as unrealized appreciation or (depreciation). Realized gain or (loss) is recorded upon the expiration or closing of a futures contract.
The underlying face amount at value of open futures contracts at period end is shown in the Schedule of Investments under the caption "Futures Contracts." This amount reflects each contract's exposure to the underlying instrument at period end and is representative of activity for the period. Securities deposited to meet initial margin requirements are identified in the Schedule of Investments. The receivable and/or payable for the variation margin are reflected in the Statement of Assets and Liabilities.
Certain risks may arise upon entering into futures contracts, including the risk that an illiquid market may limit the ability to close out a futures contract prior to settlement date.
During the period the Fund recognized net realized gain (loss) of $355,557 and a change in net unrealized appreciation (depreciation) of $37,723 related to its investment in futures contracts. These amounts are included in the Statement of Operations.
6. Purchases and Sales of Investments.
Purchases and sales of securities (including the Equity and Fixed-Income Central Funds), other than short-term securities, aggregated $111,486,073 and $123,592,365, respectively.
7. Fees and Other Transactions with Affiliates.
Management Fee. FMR and its affiliates provide the Fund with investment management related services for which the Fund pays a monthly management fee. The management fee is the sum of an individual fund fee rate that is based on an annual rate of .30% of the Fund's average net assets and a group fee rate that averaged .26% during the period. The group fee rate is based upon the average net assets of all the mutual funds advised by FMR. The group fee rate decreases as assets under management increase and increases as assets under management decrease. For the period, the total annual management fee rate was .56% of the Fund's average net assets.
The Fund has invested in the Fidelity Commodity Strategy Central Fund, which in turn invests in a wholly-owned subsidiary that invests in commodity-linked derivative instruments. FMR has contractually agreed to waive the Fund's management fee in an amount equal to its proportionate share of the management fee paid to FMR by the subsidiary based on the Fund's proportionate ownership of the Fidelity Commodity Strategy Central Fund. Fees waived totaled $1,031 for the period.
Annual Report
Notes to Financial Statements - continued
7. Fees and Other Transactions with Affiliates - continued
Distribution and Service Plan Fees. In accordance with Rule 12b-1 of the 1940 Act, the Fund has adopted separate 12b-1 Plans for each Service Class of shares. Each Service Class pays Fidelity Distributors Corporation (FDC), an affiliate of FMR, a service fee. For the period, the service fee is based on an annual rate of .10% of Service Class' average net assets and .25% of Service Class 2's average net assets.
For the period, total fees, all of which were re-allowed to insurance companies for the distribution of shares and providing shareholder support services were as follows:
Service Class | $ 3,753 | |
Service Class 2 | 18,928 | |
| $ 22,681 | |
Transfer Agent Fees. Fidelity Investments Institutional Operations Company, Inc. (FIIOC), an affiliate of FMR, is the Fund's transfer, dividend disbursing, and shareholder servicing agent. FIIOC receives an asset-based fee with respect to each class. Each class (with the exception of Investor Class) pays a transfer agent fee, excluding out of pocket expenses, equal to an annual rate of .07% of average net assets. Investor Class pays a monthly asset-based transfer agent fee of .15% of average net assets. In addition, FIIOC receives an asset-based fee of .01% of average net assets for typesetting, printing and mailing of shareholder reports, except proxy statements. FIIOC has agreed to voluntarily waive this fee until December 31, 2010. (See Note 10: Expense Reductions.) For the period, transfer agent fees for each class, including printing and out of pocket expenses, were as follows:
Initial Class | $ 105,840 | |
Service Class | 3,081 | |
Service Class 2 | 8,457 | |
Investor Class | 47,684 | |
| $ 165,062 | |
Accounting and Security Lending Fees. Fidelity Service Company, Inc. (FSC), an affiliate of FMR, maintains the Fund's accounting records. The accounting fee is based on the level of average net assets for the month. Under a separate contract, FSC administers the security lending program. The security lending fee is based on the number and duration of lending transactions.
Brokerage Commissions. The Fund placed a portion of its portfolio transactions with brokerage firms which are affiliates of the investment adviser. The commissions paid to these affiliated firms were $3,526 for the period.
8. Committed Line of Credit.
The Fund participates with other funds managed by FMR or an affiliate in a $3.75 billion credit facility (the "line of credit") to be utilized for temporary or emergency purposes to fund shareholder redemptions or for other short-term liquidity purposes. The Fund has agreed to pay commitment fees on its pro-rata portion of the line of credit, which amounted to $674 and is reflected in Miscellaneous expenses on the Statement of Operations. During the period, there were no borrowings on this line of credit.
9. Security Lending.
The Fund lends portfolio securities through a lending agent from time to time in order to earn additional income. The lending agent may loan securities to certain qualified borrowers, including Fidelity Capital Markets (FCM), a broker-dealer affiliated with the Fund. On the settlement date of the loan, the Fund receives collateral (in the form of U.S. Treasury obligations, letters of credit and/or cash) against the loaned securities and maintains collateral in an amount not less than 100% of the market value of the loaned securities during the period of the loan. The market value of the loaned securities is determined at the close of business of the Fund and any additional required collateral is delivered to the Fund on the next business day. If the borrower defaults on its obligation to return the securities loaned because of insolvency or other reasons, a fund could experience delays and costs in recovering the securities loaned or in gaining access to the collateral. Any cash collateral received is invested in the Fidelity Securities Lending Cash Central Fund. The value of loaned securities and cash collateral at period end are disclosed on the Fund's Statement of Assets and Liabilities. Security lending income represents the income earned on investing cash collateral, less rebates paid to borrowers and lending agent fees associated with the loan, plus any premium payments received for lending certain types of securities. Security lending income is presented in the Statement of Operations as a component of income from Fidelity Central Funds. Total security lending income during the period amounted to $10,548. During the period, there were no securities loaned to FCM.
Annual Report
10. Expense Reductions.
FMR or its affiliates agreed to waive certain fees during the period as noted in the table below.
Many of the brokers with whom FMR places trades on behalf of the Fund provided services to the Fund in addition to trade execution. These services included payments of certain expenses on behalf of the Fund totaling $22,921 for the period.
11. Distributions to Shareholders.
Distributions to shareholders of each class were as follows:
Years ended December 31, | 2010 | 2009 |
From net investment income | | |
Initial Class | $ 1,524,495 | $ 1,895,178 |
Service Class | 40,585 | 50,128 |
Service Class 2 | 44,899 | 95,786 |
Investor Class | 347,353 | 332,143 |
Total | $ 1,957,332 | $ 2,373,235 |
From net realized gain | | |
Initial Class | $ 423,471 | $ 245,240 |
Service Class | 12,340 | 6,924 |
Service Class 2 | 18,708 | 14,984 |
Investor Class | 102,835 | 46,001 |
Total | $ 557,354 | $ 313,149 |
12. Share Transactions.
Transactions for each class of shares were as follows:
| Shares | Dollars |
Years ended December 31, | 2010 | 2009 | 2010 | 2009 |
Initial Class | | | | |
Shares sold | 314,056 | 350,542 | $ 4,175,708 | $ 3,746,567 |
Reinvestment of distributions | 135,558 | 173,751 | 1,947,966 | 2,140,418 |
Shares redeemed | (1,723,443) | (2,002,699) | (22,677,836) | (20,833,637) |
Net increase (decrease) | (1,273,829) | (1,478,406) | $ (16,554,162) | $ (14,946,652) |
Service Class | | | | |
Shares sold | 27,481 | 62,715 | $ 366,364 | $ 622,397 |
Reinvestment of distributions | 3,706 | 4,662 | 52,925 | 57,052 |
Shares redeemed | (59,096) | (64,785) | (772,171) | (674,309) |
Net increase (decrease) | (27,909) | 2,592 | $ (352,882) | $ 5,140 |
Service Class 2 | | | | |
Shares sold | 229,882 | 271,353 | $ 3,022,061 | $ 2,822,295 |
Reinvestment of distributions | 4,473 | 9,100 | 63,607 | 110,770 |
Shares redeemed | (463,914) | (313,536) | (6,116,111) | (3,220,944) |
Net increase (decrease) | (229,559) | (33,083) | $ (3,030,443) | $ (287,879) |
Investor Class | | | | |
Shares sold | 645,314 | 445,595 | $ 8,630,814 | $ 5,121,887 |
Reinvestment of distributions | 31,438 | 30,780 | 450,188 | 378,144 |
Shares redeemed | (437,500) | (477,991) | (5,614,241) | (5,029,804) |
Net increase (decrease) | 239,252 | (1,616) | $ 3,466,761 | $ 470,227 |
Annual Report
Notes to Financial Statements - continued
13. Other.
The Fund's organizational documents provide former and current trustees and officers with a limited indemnification against liabilities arising in connection with the performance of their duties to the Fund. In the normal course of business, the Fund may also enter into contracts that provide general indemnifications. The Fund's maximum exposure under these arrangements is unknown as this would be dependent on future claims that may be made against the Fund. The risk of material loss from such claims is considered remote.
At the end of the period, FMR or its affiliates were the owners of 76% of the total outstanding shares of the Fund.
Annual Report
Report of Independent Registered Public Accounting Firm
To the Trustees of Variable Insurance Products Fund V and Shareholders of VIP Asset Manager: Growth Portfolio:
We have audited the accompanying statement of assets and liabilities of VIP Asset Manager: Growth Portfolio (the Fund), a fund of Variable Insurance Products Fund V, including the schedule of investments, as of December 31, 2010, and the related statement of operations for the year then ended, the statement of changes in net assets for each of the two years in the period then ended, and the financial highlights for each of the five years in the period then ended. These financial statements and financial highlights are the responsibility of the Fund's management. Our responsibility is to express an opinion on these financial statements and financial highlights based on our audits.
We conducted our audits in accordance with the standards of the Public Company Accounting Oversight Board (United States). Those standards require that we plan and perform the audit to obtain reasonable assurance about whether the financial statements and financial highlights are free of material misstatement. The Fund is not required to have, nor were we engaged to perform, an audit of its internal control over financial reporting. Our audits included consideration of internal control over financial reporting as a basis for designing audit procedures that are appropriate in the circumstances, but not for the purpose of expressing an opinion on the effectiveness of the Fund's internal control over financial reporting. Accordingly, we express no such opinion. An audit also includes examining, on a test basis, evidence supporting the amounts and disclosures in the financial statements, assessing the accounting principles used and significant estimates made by management, as well as evaluating the overall financial statement presentation. Our procedures included confirmation of securities owned as of December 31, 2010, by correspondence with the custodians and brokers; where replies were not received from brokers, we performed other auditing procedures. We believe that our audits provide a reasonable basis for our opinion.
In our opinion, the financial statements and financial highlights referred to above present fairly, in all material respects, the financial position of VIP Asset Manager: Growth Portfolio as of December 31, 2010, the results of its operations for the year then ended, the changes in its net assets for each of the two years in the period then ended, and the financial highlights for each of the five years in the period then ended, in conformity with accounting principles generally accepted in the United States of America.
/s/ Deloitte & Touche LLP
DELOITTE & TOUCHE LLP
Boston, Massachusetts
February 23, 2011
Annual Report
The Trustees and executive officers of the trust and funds, as applicable, are listed below. The Board of Trustees governs each fund and is responsible for protecting the interests of shareholders. The Trustees are experienced executives who meet periodically throughout the year to oversee each fund's activities, review contractual arrangements with companies that provide services to each fund, oversee management of the risks associated with such activities and contractual arrangements, and review each fund's performance. Except for James C. Curvey, each of the Trustees oversees 189 funds advised by FMR or an affiliate. Mr. Curvey oversees 408 funds advised by FMR or an affiliate.
The Trustees hold office without limit in time except that (a) any Trustee may resign; (b) any Trustee may be removed by written instrument, signed by at least two-thirds of the number of Trustees prior to such removal; (c) any Trustee who requests to be retired or who has become incapacitated by illness or injury may be retired by written instrument signed by a majority of the other Trustees; and (d) any Trustee may be removed at any special meeting of shareholders by a two-thirds vote of the outstanding voting securities of the trust. Each Trustee who is not an interested person (as defined in the 1940 Act) (Independent Trustee), shall retire not later than the last day of the calendar year in which his or her 75th birthday occurs. The Independent Trustees may waive this mandatory retirement age policy with respect to individual Trustees. The executive officers hold office without limit in time, except that any officer may resign or may be removed by a vote of a majority of the Trustees at any regular meeting or any special meeting of the Trustees. Except as indicated, each individual has held the office shown or other offices in the same company for the past five years.
Experience, Skills, Attributes, and Qualifications of the Fund's Trustees. The Governance and Nominating Committee has adopted a statement of policy that describes the experience, qualifications, attributes, and skills that are necessary and desirable for potential Independent Trustee candidates (Statement of Policy). The Board believes that each Trustee satisfied at the time he or she was initially elected or appointed a Trustee, and continues to satisfy, the standards contemplated by the Statement of Policy. The Governance and Nominating Committee also engages professional search firms to help identify potential Independent Trustee candidates who have the experience, qualifications, attributes, and skills consistent with the Statement of Policy. From time to time, additional criteria based on the composition and skills of the current Independent Trustees, as well as experience or skills that may be appropriate in light of future changes to board composition, business conditions, and regulatory or other developments, have also been considered by the professional search firms and the Governance and Nominating Committee. In addition, the Board takes into account the Trustees' commitment and participation in Board and committee meetings, as well as their leadership of standing and ad hoc committees throughout their tenure.
In determining that a particular Trustee was and continues to be qualified to serve as a Trustee, the Board has considered a variety of criteria, none of which, in isolation, was controlling. The Board believes that, collectively, the Trustees have balanced and diverse experience, qualifications, attributes, and skills, which allow the Board to operate effectively in governing each fund and protecting the interests of shareholders. Information about the specific experience, skills, attributes, and qualifications of each Trustee, which in each case led to the Board's conclusion that the Trustee should serve (or continue to serve) as a trustee of the funds, is provided below.
Board Structure and Oversight Function. Abigail P. Johnson is an interested person (as defined in the 1940 Act) and currently serves as Chairman. The Trustees have determined that an interested Chairman is appropriate and benefits shareholders because an interested Chairman has a personal and professional stake in the quality and continuity of services provided to the funds. Independent Trustees exercise their informed business judgment to appoint an individual of their choosing to serve as Chairman, regardless of whether the Trustee happens to be independent or a member of management. The Independent Trustees have determined that they can act independently and effectively without having an Independent Trustee serve as Chairman and that a key structural component for assuring that they are in a position to do so is for the Independent Trustees to constitute a substantial majority for the Board. The Independent Trustees also regularly meet in executive session. Kenneth L. Wolfe serves as Chairman of the Independent Trustees and as such (i) acts as a liaison between the Independent Trustees and management with respect to matters important to the Independent Trustees and (ii) with management prepares agendas for Board meetings.
Fidelity funds are overseen by different Boards of Trustees. The funds' Board oversees Fidelity's investment-grade bond, money market, and asset allocation funds and another Board oversees Fidelity's equity and high income funds. The asset allocation funds may invest in Fidelity funds that are overseen by such other Board. The use of separate Boards, each with its own committee structure, allows the Trustees of each group of Fidelity funds to focus on the unique issues of the funds they oversee, including common research, investment, and operational issues. On occasion, the separate Boards establish joint committees to address issues of overlapping consequences for the Fidelity funds overseen by each Board.
The Trustees operate using a system of committees to facilitate the timely and efficient consideration of all matters of importance to the Trustees, each fund, and fund shareholders and to facilitate compliance with legal and regulatory requirements and oversight of the funds' activities and associated risks. The Board, acting through its committees, has charged FMR and its affiliates with (i) identifying events or circumstances the occurrence of which could have demonstrably adverse effects on the funds' business and/or reputation; (ii) implementing processes and controls to lessen the possibility that such events or circumstances occur or to mitigate the effects of such events or circumstances if they do occur; and (iii) creating and maintaining a system designed to evaluate continuously business and market conditions in order to facilitate the identification and implementation processes described in (i) and (ii) above. Because the day-to-day operations and activities of the funds are carried out by or through FMR, its affiliates and other service providers, the funds' exposure to risks is mitigated but not eliminated by the processes overseen by the Trustees. While each of the Board's committees has responsibility for overseeing different aspects of the funds' activities, oversight is exercised primarily through the Operations and Audit Committees. Appropriate personnel, including but not limited to the funds' Chief Compliance Officer (CCO), FMR's internal auditor, the independent accountants, the funds' Treasurer and portfolio management personnel, make periodic reports to the Board's committees, as appropriate. The responsibilities of each committee, including their oversight responsibilities, are described further under "Standing Committees of the Fund's Trustees."
Annual Report
The funds' Statement of Additional Information (SAI) includes more information about the Trustees. To request a free copy, call Fidelity at 1-877-208-0098.
Interested Trustees*:
Correspondence intended for each Trustee who is an interested person may be sent to Fidelity Investments, 82 Devonshire Street, Boston, Massachusetts 02109.
Name, Age; Principal Occupations and Other Relevant Experience+ |
Abigail P. Johnson (49) |
| Year of Election or Appointment: 2009 Ms. Johnson is Trustee and Chairman of the Board of Trustees of certain Trusts. Ms. Johnson serves as President of Personal, Workplace and Institutional Services (2005-present). Ms. Johnson is the Vice Chairman and Director (2007-present) of FMR LLC. Previously, Ms. Johnson served as President and a Director of FMR (2001-2005), a Trustee of other investment companies advised by FMR, Fidelity Investments Money Management, Inc., and FMR Co., Inc. (2001-2005), Senior Vice President of the Fidelity funds (2001-2005), and managed a number of Fidelity funds. Ms. Abigail P. Johnson and Mr. Arthur E. Johnson are not related. |
James C. Curvey (75) |
| Year of Election or Appointment: 2007 Mr. Curvey also serves as Trustee (2007-present) of other investment companies advised by FMR. Mr. Curvey is a Director of Fidelity Investments Money Management, Inc. (2009-present), Director of Fidelity Research & Analysis Co. (2009-present) and Director of FMR and FMR Co., Inc. (2007-present). Mr. Curvey is also Vice Chairman (2007-present) and Director of FMR LLC. In addition, Mr. Curvey serves as an Overseer for the Boston Symphony Orchestra and a member of the Trustees of Villanova University. Previously, Mr. Curvey was the Vice Chairman (2006-2007) and Director (2000-2007) of FMR Corp. |
* Trustees have been determined to be "Interested Trustees" by virtue of, among other things, their affiliation with the trust or various entities under common control with FMR.
+ The information above includes each Trustee's principal occupation during the last five years and other information relating to the experience, attributes, and skills relevant to each Trustee's qualifications to serve as a Trustee, which led to the conclusion that each Trustee should serve as a Trustee for each fund.
Independent Trustees:
Correspondence intended for each Independent Trustee (that is, the Trustees other than the Interested Trustees) may be sent to Fidelity Investments, P.O. Box 55235, Boston, Massachusetts 02205-5235.
Name, Age; Principal Occupations and Other Relevant Experience+ |
Albert R. Gamper, Jr. (68) |
| Year of Election or Appointment: 2007 Prior to his retirement in December 2004, Mr. Gamper served as Chairman of the Board of CIT Group Inc. (commercial finance). During his tenure with CIT Group Inc. Mr. Gamper served in numerous senior management positions, including Chairman (1987-1989; 1999-2001; 2002-2004), Chief Executive Officer (1987-2004), and President (2002-2003). He also served as President and Chief Executive Officer of Tyco Capital Corporation (2001-2002). Mr. Gamper currently serves as a member of the Board of Directors of Public Service Enterprise Group (utilities, 2000-present), a member of the Board of Trustees, Rutgers University (2004-present), and Chairman of the Board of Saint Barnabas Health Care System. Previously, Mr. Gamper served as Chairman of the Board of Governors, Rutgers University (2004-2007). |
Robert F. Gartland (59) |
| Year of Election or Appointment: 2010 Mr. Gartland is a partner and investor of Vietnam Partners LLC (investments and consulting, 2008-present) and is Chairman and an investor in Gartland and Mellina Group Corp. (consulting, 2009-present). Prior to his retirement, Mr. Gartland held a variety of positions at Morgan Stanley (financial services, 1979-2007) including Managing Director (1987-2007). |
Arthur E. Johnson (63) |
| Year of Election or Appointment: 2008 Mr. Johnson serves as a member of the Board of Directors of Eaton Corporation (diversified power management, 2009-present) and AGL Resources, Inc. (holding company). Prior to his retirement, Mr. Johnson served as Senior Vice President of Corporate Strategic Development of Lockheed Martin Corporation (defense contractor, 1999-2009). He previously served on the Board of Directors of IKON Office Solutions, Inc. (1999-2008) and Delta Airlines (2005-2007). Mr. Arthur E. Johnson and Ms. Abigail P. Johnson are not related. |
Michael E. Kenneally (56) |
| Year of Election or Appointment: 2009 Previously, Mr. Kenneally served as a Member of the Advisory Board for certain Fidelity Fixed Income and Asset Allocation Funds (2008-2009). Prior to his retirement, Mr. Kenneally served as Chairman and Global Chief Executive Officer of Credit Suisse Asset Management (2003-2005). Mr. Kenneally was a Director of the Credit Suisse Funds (U.S. mutual funds, 2004-2008) and certain other closed-end funds (2004-2005) and was awarded the Chartered Financial Analyst (CFA) designation in 1991. |
James H. Keyes (70) |
| Year of Election or Appointment: 2007 Mr. Keyes serves as a member of the Boards of Navistar International Corporation (manufacture and sale of trucks, buses, and diesel engines, since 2002) and Pitney Bowes, Inc. (integrated mail, messaging, and document management solutions, since 1998). Prior to his retirement, Mr. Keyes served as Chairman and Chief Executive Officer of Johnson Controls (automotive, building, and energy, 1998-2002) and as a member of the Board of LSI Logic Corporation (semiconductor technologies, 1984-2008). |
Marie L. Knowles (64) |
| Year of Election or Appointment: 2001 Prior to Ms. Knowles' retirement in June 2000, she served as Executive Vice President and Chief Financial Officer of Atlantic Richfield Company (ARCO) (diversified energy, 1996-2000). From 1993 to 1996, she was a Senior Vice President of ARCO and President of ARCO Transportation Company. She served as a Director of ARCO from 1996 to 1998. Ms. Knowles currently serves as a Director and Chairman of the Audit Committee of McKesson Corporation (healthcare service, since 2002). Ms. Knowles is an Honorary Trustee of the Brookings Institution and a member of the Board of the Catalina Island Conservancy and of the Santa Catalina Island Company (2009-present). She also serves as a member of the Advisory Board for the School of Engineering of the University of Southern California and the Foundation Board of the School of Architecture at the University of Virginia (2007-present). Previously, Ms. Knowles served as a Director of Phelps Dodge Corporation (copper mining and manufacturing, 1994-2007). |
Kenneth L. Wolfe (71) |
| Year of Election or Appointment: 2007 Mr. Wolfe is Chairman of the Independent Trustees of the Fixed Income and Asset Allocation Funds (2008-present). Prior to his retirement, Mr. Wolfe served as Chairman and a Director (2007-2009) and Chairman and Chief Executive Officer (1994-2001) of Hershey Foods Corporation. He also served as a member of the Boards of Adelphia Communications Corporation (telecommunications, 2003-2006), Bausch & Lomb, Inc. (medical/pharmaceutical, 1993-2007), and Revlon, Inc. (personal care products, 2004-2009). |
+ The information above includes each Trustee's principal occupation during the last five years and other information relating to the experience, attributes, and skills relevant to each Trustee's qualifications to serve as a Trustee, which led to the conclusion that each Trustee should serve as a Trustee for each fund.
Executive Officers:
Correspondence intended for each executive officer may be sent to Fidelity Investments, 82 Devonshire Street, Boston, Massachusetts 02109.
Name, Age; Principal Occupation |
John R. Hebble (52) |
| Year of Election or Appointment: 2008 President and Treasurer of Fidelity's Fixed Income and Asset Allocation Funds. Mr. Hebble also serves as Treasurer and Chief Financial Officer of The North Carolina Capital Management Trust: Cash and Term Portfolio (2008-present), Assistant Treasurer of other Fidelity funds (2009-present) and is an employee of Fidelity Investments. |
Boyce I. Greer (54) |
| Year of Election or Appointment: 2005 Vice President of Fidelity's Fixed Income Funds and Asset Allocation Funds (2005). Mr. Greer is also a Trustee of other investment companies advised by FMR. Mr. Greer is President of The North Carolina Capital Management Trust: Cash and Term Portfolio (2003-present), the Asset Allocation Division (2008-present), President and a Director of Strategic Advisers, Inc. (2008-present), President of FIMM 130/30 LLC (2008-present), Director of Ballyrock Investment Advisors LLC (2006-present), and an Executive Vice President of FMR (2005-present). Previously, Mr. Greer served as Executive Vice President of FMR Co., Inc. (2005-2009), President and Director of Fidelity Investments Money Management, Inc. (2007-2009) and as a Director and Managing Director of Strategic Advisers, Inc. (2002-2005). |
Derek L. Young (46) |
| Year of Election or Appointment: 2009 Vice President of Fidelity's Asset Allocation Funds. Mr. Young also serves as Chief Investment Officer of the Global Asset Allocation Group (2009-present). Previously, Mr. Young served as a portfolio manager. |
Scott C. Goebel (42) |
| Year of Election or Appointment: 2008 Secretary and Chief Legal Officer (CLO) of the Fidelity funds. Mr. Goebel also serves as Secretary and CLO of The North Carolina Capital Management Trust: Cash and Term Portfolio (2008-present); General Counsel, Secretary, and Senior Vice President of FMR (2008-present) and FMR Co., Inc. (2008-present); Deputy General Counsel of FMR LLC; Chief Legal Officer of Fidelity Management & Research (Hong Kong) Limited (2008-present) and Assistant Secretary of Fidelity Management & Research (Japan) Inc. (2008-present), Fidelity Investments Money Management, Inc. (2008-present), Fidelity Management & Research (U.K.) Inc. (2008-present), and Fidelity Research and Analysis Company (2008-present). Previously, Mr. Goebel served as Assistant Secretary of the Funds (2007-2008) and as Vice President and Secretary of Fidelity Distributors Corporation (FDC) (2005-2007). |
David J. Carter (37) |
| Year of Election or Appointment: 2010 Assistant Secretary of Fidelity's Fixed Income and Asset Allocation Funds. Mr. Carter also serves as Vice President, Associate General Counsel (2010-present) and is an employee of Fidelity Investments (2005-present). |
Holly C. Laurent (56) |
| Year of Election or Appointment: 2008 Anti-Money Laundering (AML) Officer of the Fidelity funds. Ms. Laurent also serves as AML Officer of The North Carolina Capital Management Trust: Cash and Term Portfolio (2008-present) and is an employee of Fidelity Investments. Previously, Ms. Laurent was Senior Vice President and Head of Legal for Fidelity Business Services India Pvt. Ltd. (2006-2008), and Senior Vice President, Deputy General Counsel and Group Head for FMR LLC (2005-2006). |
Christine Reynolds (52) |
| Year of Election or Appointment: 2008 Chief Financial Officer of the Fidelity funds. Ms. Reynolds became President of Fidelity Pricing and Cash Management Services (FPCMS) in August 2008. Ms. Reynolds served as Chief Operating Officer of FPCMS (2007-2008). Previously, Ms. Reynolds served as President, Treasurer, and Anti-Money Laundering officer of the Fidelity funds (2004-2007). |
Michael H. Whitaker (43) |
| Year of Election or Appointment: 2008 Chief Compliance Officer of Fidelity's Fixed Income and Asset Allocation Funds. Mr. Whitaker also serves as Chief Compliance Officer of The North Carolina Capital Management Trust: Cash and Term Portfolio (2008-present). Mr. Whitaker is an employee of Fidelity Investments (2007-present). Prior to joining Fidelity Investments, Mr. Whitaker worked at MFS Investment Management where he served as Senior Vice President and Chief Compliance Officer (2004-2006), and Assistant General Counsel. |
Jeffrey S. Christian (49) |
| Year of Election or Appointment: 2009 Deputy Treasurer of the Fidelity funds. Mr. Christian is an employee of Fidelity Investments. Previously, Mr. Christian served as Chief Financial Officer (2008-2009) of certain Fidelity funds and Senior Vice President of Fidelity Pricing and Cash Management Services (FPCMS) (2004-2009). |
Bryan A. Mehrmann (49) |
| Year of Election or Appointment: 2005 Deputy Treasurer of the Fidelity funds. Mr. Mehrmann is an employee of Fidelity Investments. |
Stephanie J. Dorsey (41) |
| Year of Election or Appointment: 2008 Deputy Treasurer of Fidelity's Fixed Income and Asset Allocation Funds. Ms. Dorsey also serves as Assistant Treasurer of other Fidelity funds (2010-present) and is an employee of Fidelity Investments (2008-present). Previously, Ms. Dorsey served as Treasurer (2004-2008) of the JPMorgan Mutual Funds and Vice President (2004-2008) of JPMorgan Chase Bank. |
Adrien E. Deberghes (43) |
| Year of Election or Appointment: 2010 Assistant Treasurer of Fidelity's Fixed Income and Asset Allocation Funds. Mr. Deberghes also serves as Deputy Treasurer of other Fidelity funds (2008-present) and is an employee of Fidelity Investments (2008-present). Previously, Mr. Deberghes served as Senior Vice President of Mutual Fund Administration at State Street Corporation (2007-2008), Senior Director of Mutual Fund Administration at Investors Bank & Trust (2005-2007), and Director of Finance for Dunkin' Brands (2000-2005). |
Kenneth B. Robins (41) |
| Year of Election or Appointment: 2009 Assistant Treasurer of the Fidelity Fixed Income and Asset Allocation Funds. Mr. Robins also serves as President and Treasurer of other Fidelity funds (2008-present; 2010-present) and is an employee of Fidelity Investments (2004-present). Previously, Mr. Robins served as Deputy Treasurer of the Fidelity funds (2005-2008) and Treasurer and Chief Financial Officer of The North Carolina Capital Management Trust: Cash and Term Portfolios (2006-2008). |
Gary W. Ryan (52) |
| Year of Election or Appointment: 2005 Assistant Treasurer of the Fidelity funds. Mr. Ryan is an employee of Fidelity Investments. Previously, Mr. Ryan served as Vice President of Fund Reporting in Fidelity Pricing and Cash Management Services (FPCMS) (1999-2005). |
Jonathan Davis (42) |
| Year of Election or Appointment: 2010 Assistant Treasurer of the Fidelity funds. Mr. Davis is an employee of Fidelity Investments. Previously, Mr. Davis served as Vice President and Associate General Counsel of FMR LLC (2003-2010). |
Annual Report
Initial Class designates 19%, Service Class designates 20%, Service Class 2 designates 26%, and Investor Class designates 20%, of the dividends distributed in December 2010 as qualifying for the dividends-received deduction for corporate shareholders.
A total of 5.23% of the dividends distributed during the fiscal year was derived from interest on U.S. Government securities which is generally exempt from state income tax.
Annual Report
Board Approval of Investment Advisory Contracts and Management Fees
VIP Asset Manager: Growth Portfolio
Each year, the Board of Trustees, including the Independent Trustees (together, the Board), votes on the renewal of the management contract and sub-advisory agreements (together, the Advisory Contracts) for the fund. The Board, assisted by the advice of fund counsel and Independent Trustees' counsel, requests and considers a broad range of information relevant to the renewal of the Advisory Contracts throughout the year.
The Board meets regularly and considers at each of its meetings factors that are relevant to its annual consideration of the renewal of the fund's Advisory Contracts, including the services and support provided to the fund and its shareholders. The Board has established three standing committees, each composed of Independent Trustees with varying backgrounds, to which the Board has assigned specific subject matter responsibilities in order to enhance effective decision-making by the Board. The Operations Committee, of which all of the Independent Trustees are members, meets regularly throughout the year and, among other matters, considers matters specifically related to the annual consideration of the renewal of the fund's Advisory Contracts. The Board, acting directly and through its Committees, requests and receives information concerning the annual consideration of the renewal of the fund's Advisory Contracts. The Board also meets as needed to consider matters specifically related to the Board's annual consideration of the renewal of Advisory Contracts. Members of the Board may also meet with trustees of other Fidelity funds through ad hoc joint committees to discuss certain matters relevant to the Fidelity funds.
At its September 2010 meeting, the Board of Trustees, including the Independent Trustees, unanimously determined to renew the fund's Advisory Contracts. In reaching its determination, the Board considered all factors it believed relevant, including (i) the nature, extent, and quality of the services to be provided to the fund and its shareholders (including the investment performance of the fund); (ii) the competitiveness of the fund's management fee and total expenses; (iii) the total costs of the services to be provided by and the profits to be realized by Fidelity from its relationship with the fund; (iv) the extent to which economies of scale would be realized as the fund grows; and (v) whether fee levels reflect these economies of scale, if any, for the benefit of fund shareholders.
In considering whether to renew the Advisory Contracts for the fund, the Board reached a determination, with the assistance of fund counsel and Independent Trustees' counsel and through the exercise of its business judgment, that the renewal of the Advisory Contracts is in the best interests of the fund and its shareholders and that the compensation to be received by Fidelity under the management contract is fair and reasonable. The Board's decision to renew the Advisory Contracts was not based on any single factor, but rather was based on a comprehensive consideration of all the information provided to the Board at its meetings throughout the year. The Board, in reaching its determination to renew the Advisory Contracts, is aware that shareholders in the fund have a broad range of investment choices available to them, including a wide choice among mutual funds offered by Fidelity's competitors, and that the fund's shareholders, with the opportunity to review and weigh the disclosure provided by the fund in its prospectus and other public disclosures, have chosen to invest in this fund, managed by Fidelity.
Nature, Extent, and Quality of Services Provided. The Board considered the staffing within the investment adviser, FMR, and the sub-advisers (together, the Investment Advisers), including the backgrounds of the fund's investment personnel and the fund's investment objective and discipline. The Independent Trustees also had discussions with senior management of Fidelity's investment operations and investment groups. The Board considered the structure of the portfolio manager compensation program and whether this structure provides appropriate incentives to act in the best interest of the fund.
Resources Dedicated to Investment Management and Support Services. The Board reviewed the size, education, and experience of the Investment Advisers' investment staff, their use of technology, and the Investment Advisers' approach to recruiting, training, and retaining portfolio managers and other research, advisory, and management personnel. The Board noted that Fidelity's analysts have access to a variety of technological tools and market and securities data that enable them to perform both fundamental and quantitative analysis and to specialize in various disciplines. The Board considered Fidelity's extensive global research capabilities that enable the Investment Advisers to aggregate data from various sources in an effort to produce positive investment results. The Board also considered that Fidelity's portfolio managers and analysts have access to daily portfolio attribution that allows for monitoring of a fund's portfolio, as well as an electronic communication system that provides immediate real-time access to research concerning issuers and credit enhancers. The Board noted FMR's continued focus on strengthening the organization and discipline of equity portfolio management and research.
Shareholder and Administrative Services. The Board considered (i) the nature, extent, quality, and cost of advisory, administrative, and shareholder services performed by the Investment Advisers and their affiliates under the Advisory Contracts and under separate agreements covering transfer agency, pricing and bookkeeping, and securities lending services for the fund; (ii) the nature and extent of the investment adviser's supervision of third party service providers, principally custodians and subcustodians; and (iii) the resources devoted to, and the record of compliance with, the fund's compliance policies and procedures. The Board also reviewed the allocation of fund brokerage, including allocations to brokers affiliated with the Investment Advisers, the use of brokerage commissions to pay fund expenses, and the use of "soft" commission dollars to pay for research services.
The Board noted that the growth of fund assets over time across the complex allows Fidelity to reinvest in the development of services designed to enhance the value or convenience of the Fidelity funds as investment vehicles. These services include 24-hour access to account information and market information through telephone representatives and over the Internet, and investor education materials and asset allocation tools.
Annual Report
Investment in a Large Fund Family. The Board considered the benefits to shareholders of investing in a Fidelity fund, including the benefits of investing in a fund that is part of a large family of funds offering a variety of investment disciplines and providing a large variety of mutual fund investor services. The Board noted that Fidelity had taken, or had made recommendations that resulted in the Fidelity funds taking, a number of actions over the previous year that benefited particular funds, including (i) dedicating additional resources to investment research and restructuring and broadening the focus of the investment research teams; (ii) bolstering the senior management team that oversees asset management; (iii) launching Class F of certain funds as a lower-fee class available to Freedom K and Freedom Index Funds; (iv) lowering the initial investment minimums and ongoing balance requirements for Real Estate High Income Fund; (v) eliminating subsequent purchase minimums for all funds and adding a waiver of the investment minimum requirement for new accounts opened with the proceeds of a systematic withdrawal plan; (vi) eliminating the withdrawal minimum and maximum limits for systematic withdrawals from Advisor funds; (vii) expanding sales load waivers on Class A shares for Destiny Planholders and expanding Institutional Class eligibility for Class O Destiny Planholders; and (viii) changing certain Class A and Class T sales charge structures to further align them with industry practices.
Investment Performance. The Board considered whether the fund has operated in accordance with its investment objective, as well as its record of compliance with its investment restrictions. It also reviewed the fund's absolute investment performance for each class, as well as the fund's relative investment performance for each class measured over multiple periods against (i) a proprietary custom index, and (ii) a peer group of mutual funds deemed appropriate by Fidelity and reviewed by the Board. The following charts considered by the Board show, over the one-, three-, and five-year periods ended December 31, 2009, the cumulative total returns of Initial Class and Service Class 2 of the fund, the cumulative total returns of a proprietary custom index ("benchmark"), and a range of cumulative total returns of a peer group of mutual funds identified by Morningstar, Inc. as having an investment style similar to that of the fund based on underlying portfolio holdings. The returns of Initial Class and Service Class 2 show the performance of the highest and lowest performing classes, respectively (based on five-year performance). The box within each chart shows the 25th percentile return (bottom of box) and the 75th percentile return (top of box) of the peer group. Returns shown above the box are in the first quartile and returns shown below the box are in the fourth quartile. The percentage beaten numbers noted below each chart correspond to the percentile box and represent the percentage of funds in the peer group whose performance was equal to or lower than that of the class indicated. The fund's proprietary custom index is an index developed by FMR that represents the performance of the fund's three asset classes according to their respective weightings in the fund's neutral mix.
VIP Asset Manager: Growth Portfolio
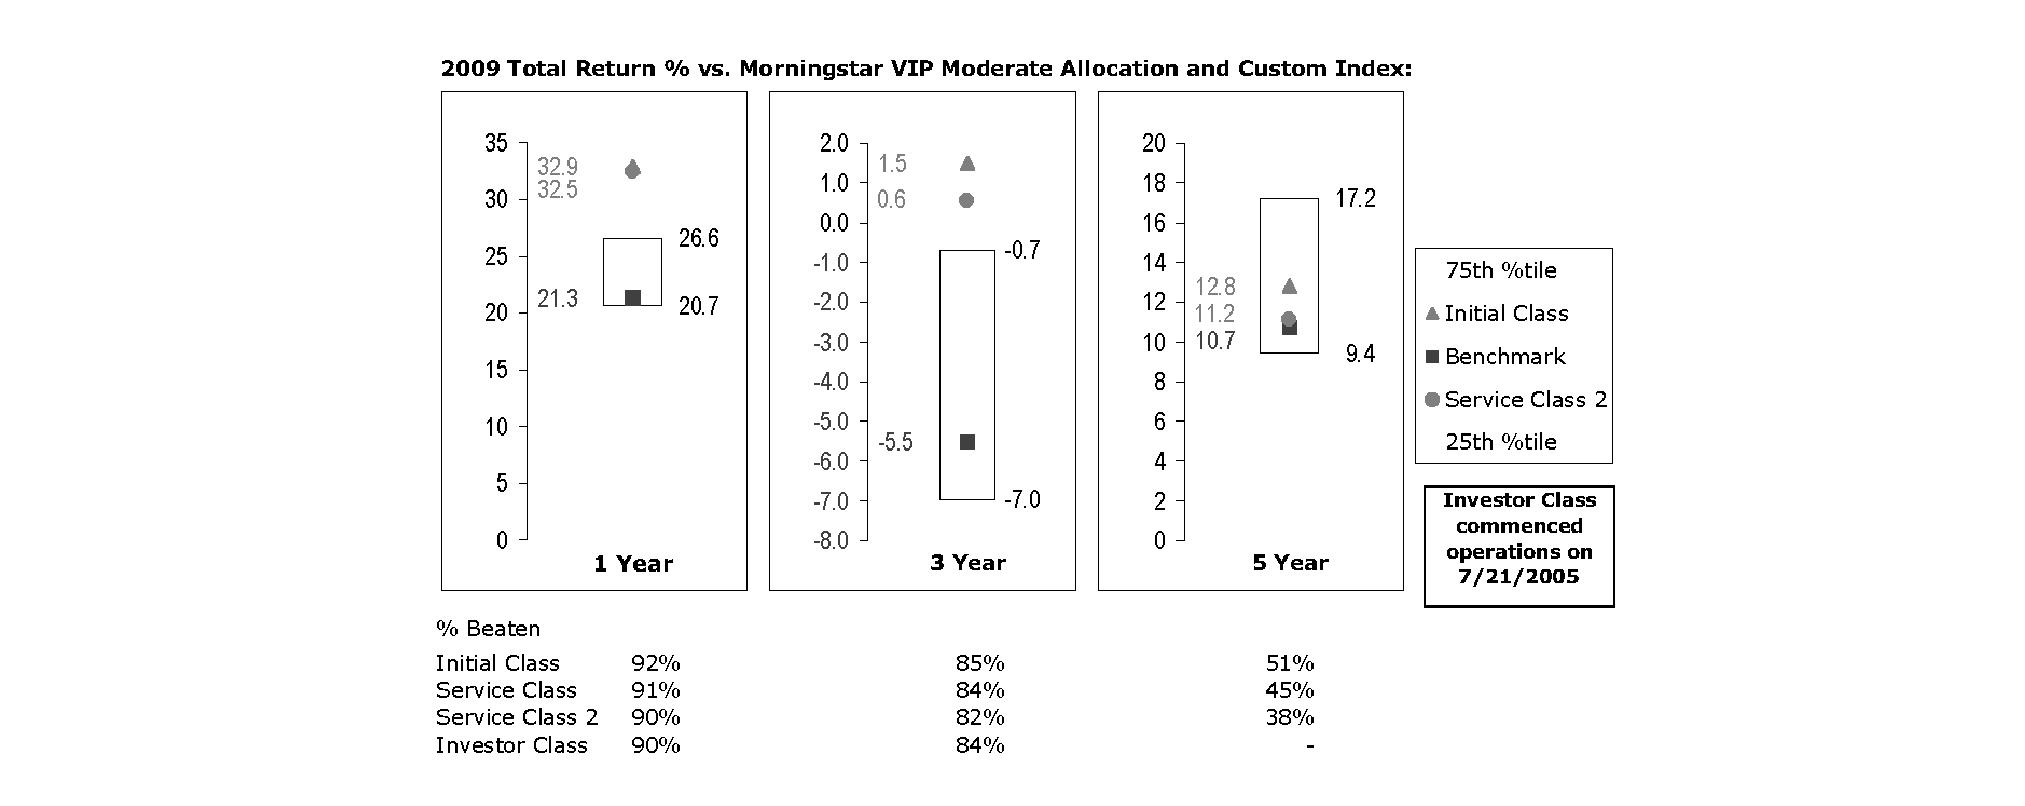
The Board reviewed the fund's relative investment performance against its peer group and noted that the performance of Initial Class of the fund was in the first quartile for the one- and three-year periods and the second quartile for the five-year period. The Board also noted that the investment performance of Initial Class of the fund compared favorably to its benchmark for all the periods shown. The Board considered that the variations in performance among the fund's classes reflect the variations in class expenses, which result in lower performance for higher expense classes. The Board also reviewed the fund's performance since inception as well as performance in the current year.
Based on its review, and giving particular weight to the nature and quality of the resources dedicated by the Investment Advisers to maintain and improve relative performance and factoring in the unprecedented market events in recent years, the Board concluded that the nature, extent, and quality of investment management and support services and of shareholder and administrative services provided to the fund will benefit the fund's shareholders, particularly in light of the Board's view that the fund's shareholders benefit from investing in a fund that is part of a large family of funds offering a variety of investment disciplines and services.
Annual Report
Board Approval of Investment Advisory Contracts and Management Fees - continued
Competitiveness of Management Fee and Total Fund Expenses. The Board considered the fund's management fee and total expenses compared to "mapped groups" of competitive funds and classes. Fidelity creates "mapped groups" by combining similar Lipper investment objective categories that have comparable management fee characteristics. Combining Lipper investment objective categories aids the Board's management fee and total expense comparisons by broadening the competitive group used for comparison and by reducing the number of universes to which various Fidelity funds are compared.
Management Fee. The Board considered two proprietary management fee comparisons for the 12-month periods shown in the chart below. The group of Lipper funds used by the Board for management fee comparisons is referred to below as the "Total Mapped Group." The Total Mapped Group comparison focuses on a fund's standing relative to the total universe of comparable funds available to investors, in terms of gross management fees before expense reimbursements or caps. "TMG %" represents the percentage of funds in the Total Mapped Group that had management fees that were lower than the fund's. For example, a TMG % of 31% means that 69% of the funds in the Total Mapped Group had higher management fees than the fund. The "Asset-Size Peer Group" (ASPG) comparison focuses on a fund's standing relative to non-Fidelity funds similar in size to the fund within the Total Mapped Group. The ASPG represents at least 15% of the funds in the Total Mapped Group with comparable asset size and management fee characteristics, subject to a minimum of 50 funds (or all funds in the Total Mapped Group if fewer than 50). Additional information, such as the ASPG quartile in which the fund's management fee ranked, is also included in the chart and considered by the Board.
VIP Asset Manager: Growth Portfolio
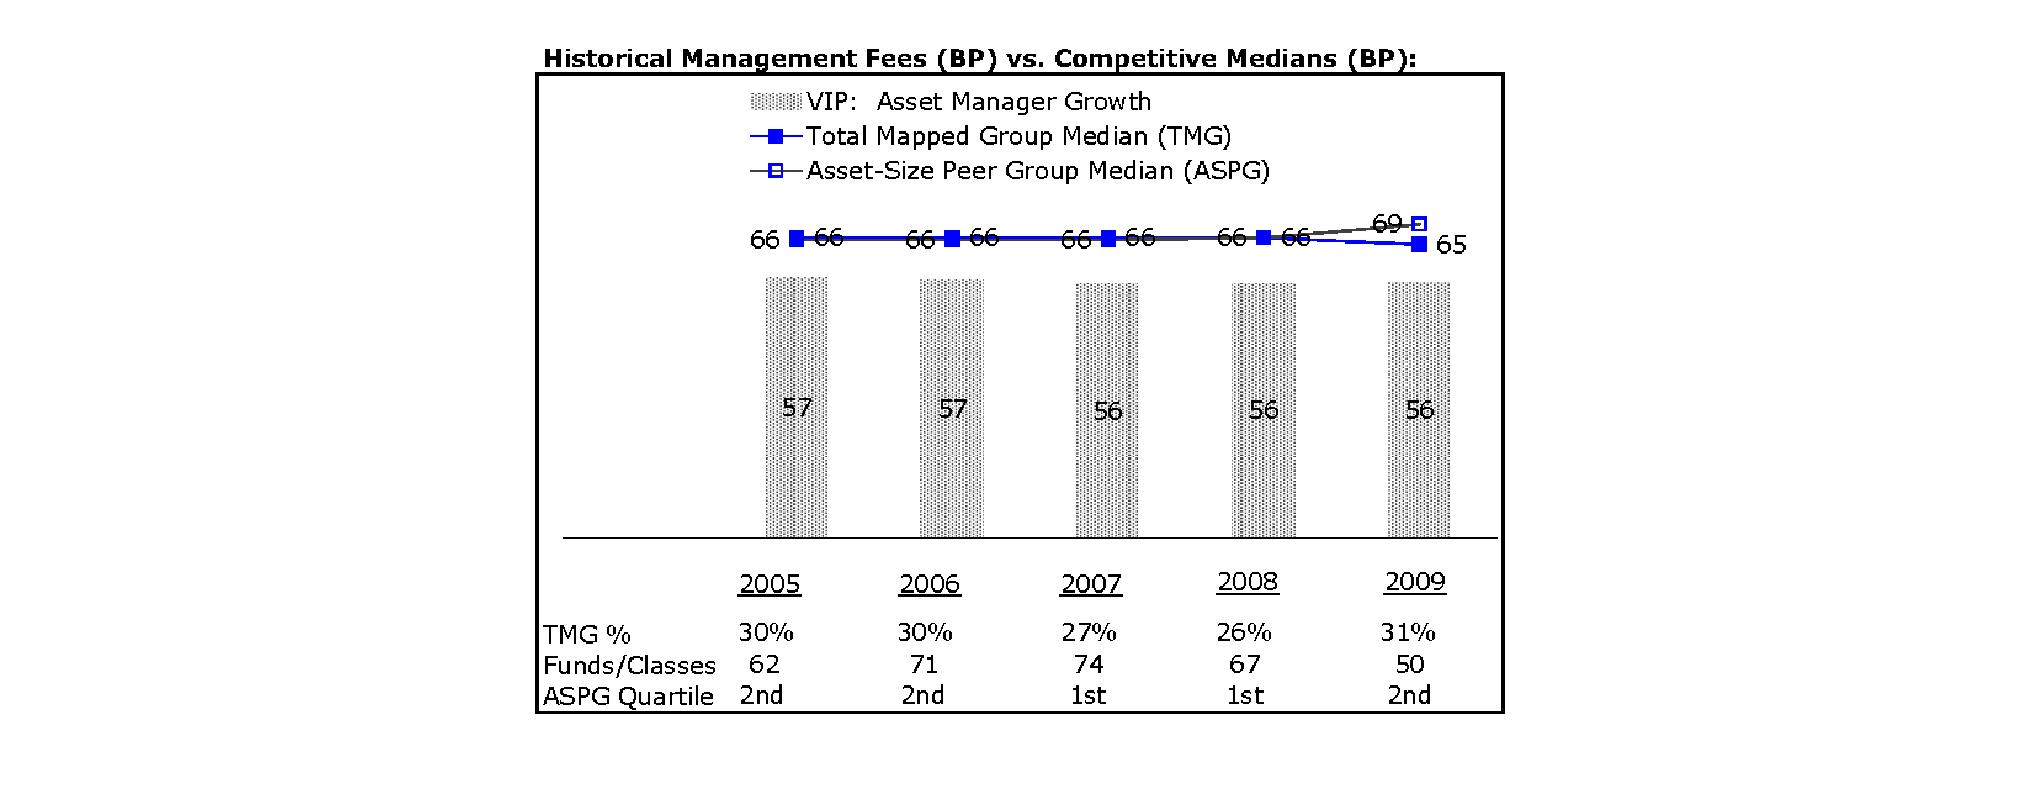
The Board noted that the fund's management fee ranked below the median of its Total Mapped Group and below the median of its ASPG for 2009.
Based on its review, the Board concluded that the fund's management fee is fair and reasonable in light of the services that the fund receives and the other factors considered.
Total Expenses. In its review of each class's total expenses, the Board considered the fund's management fee as well as other fund or class expenses, as applicable, such as transfer agent fees, pricing and bookkeeping fees, fund-paid 12b-1 fees, and custodial, legal, and audit fees. The Board also noted the effects of any waivers and reimbursements on fees and expenses. As part of its review, the Board also considered current and historical total expenses of each class of the fund compared to competitive fund median expenses. Each class of the fund is compared to those funds and classes in the Total Mapped Group (used by the Board for management fee comparisons) that have a similar sales load structure.
The Board noted that the total expenses of Initial Class ranked below its competitive median for 2009 and the total expenses of each of Investor Class, Service Class, and Service Class 2 ranked above its competitive median for 2009. The Board noted that the total expenses of each of Investor Class, Service Class, and Service Class 2 were above the median due to relatively smaller fund size, resulting in higher non-management expenses. The Board noted that the fund offers multiple classes, each of which has a different 12b-1 fee structure, and that the multiple structures are intended to offer a range of pricing options for the intermediary market. The Board also noted that the total expenses of the classes vary primarily by the level of their 12b-1 fees, although differences in transfer agent fees may also cause expenses to vary from class to class.
Annual Report
Fees Charged to Other Fidelity Clients. The Board also considered Fidelity fee structures and other information with respect to clients of FMR and its affiliates, such as other mutual funds advised or subadvised by FMR or its affiliates, pension plan clients, and other institutional clients. In March 2010, the Board created an ad hoc joint committee with the board of other Fidelity funds (the Committee) to review and compare Fidelity's institutional investment advisory business with its business of providing services to the Fidelity funds, including the differences in services provided, fees charged, and costs incurred, as well as competition in their respective marketplaces.
Based on its review of total expenses and fees charged to other Fidelity clients, the Board concluded that the total expenses of each class of the fund were reasonable, although in some cases above the median of the universe presented for comparison, in light of the services that the fund and its shareholders receive and the other factors considered, including the findings of the Committee.
Costs of the Services and Profitability. The Board considered the revenues earned and the expenses incurred by Fidelity in conducting the business of developing, marketing, distributing, managing, administering and servicing the fund and its shareholders. The Board also considered the level of Fidelity's profits in respect of all the Fidelity funds.
On an annual basis, FMR presents to the Board Fidelity's profitability for the fund. Fidelity calculates the profitability for each fund, as well as aggregate profitability for groups of Fidelity funds and all Fidelity funds, using a series of detailed revenue and cost allocation methodologies which originate with the audited books and records of Fidelity. The Audit Committee of the Board reviews any significant changes from the prior year's methodologies.
PricewaterhouseCoopers LLP (PwC), independent registered public accounting firm and auditor to Fidelity and certain Fidelity funds, has been engaged annually by the Board as part of the Board's assessment of Fidelity's profitability analysis. PwC's engagement includes the review and assessment of Fidelity's methodologies used in determining the revenues and expenses attributable to Fidelity's mutual fund business, and completion of agreed-upon procedures surrounding the mathematical accuracy of fund profitability and its conformity to allocation methodologies. After considering PwC's reports issued under the engagement and information provided by Fidelity, the Board believes that while other allocation methods may also be reasonable, Fidelity's profitability methodologies are reasonable in all material respects.
The Board has also reviewed Fidelity's non-fund businesses and fall-out benefits related to the mutual fund business as well as cases where Fidelity's affiliates may benefit from or be related to the fund's business.
The Board considered the costs of the services provided by and the profits realized by Fidelity in connection with the operation of the fund and were satisfied that the profitability was not excessive in the circumstances.
Economies of Scale. The Board considered whether there have been economies of scale in respect of the management of the Fidelity funds, whether the Fidelity funds (including the fund) have appropriately benefited from any such economies of scale, and whether there is potential for realization of any further economies of scale. The Board considered the extent to which the fund will benefit from economies of scale through increased services to the fund, through waivers or reimbursements, or through fee or expense reductions.
In February 2009, the Board and the board of other Fidelity funds created an ad hoc committee (the Economies of Scale Committee) to analyze whether FMR attains economies of scale in respect of the management and servicing of the Fidelity funds, whether the Fidelity funds have appropriately benefited from such economies of scale, and whether there is potential for realization of any further economies of scale.
The Board recognized that the fund's management contract incorporates a "group fee" structure, which provides for lower group fee rates as total fund assets under FMR's management increase, and for higher group fee rates as total fund assets under FMR's management decrease. FMR calculates the group fee rates based on a tiered asset "breakpoint" schedule that varies based on asset class. The Board considered that the group fee is designed to deliver the benefits of economies of scale to fund shareholders when total Fidelity fund assets increase, even if assets of any particular fund are unchanged or have declined, because some portion of Fidelity's costs are attributable to services provided to all Fidelity funds, and all funds benefit if those costs can be allocated among more assets. The Board concluded that, given the group fee structure, fund shareholders will benefit from lower management fees as assets under FMR's management increase at the fund complex level, regardless of whether Fidelity achieves any such economies of scale.
The Board concluded, considering the findings of the Economies of Scale Committee, that any potential economies of scale are being appropriately shared between fund shareholders and Fidelity.
Additional Information Requested by the Board. In order to develop fully the factual basis for consideration of the Fidelity funds' Advisory Contracts, the Board requested and received additional information on certain topics, including (i) fund performance trends, actions to be taken by FMR to improve certain funds' overall performance, and Fidelity's long-term strategies for certain funds; (ii) Fidelity's fund profitability methodology and profitability trends for certain funds; (iii) portfolio manager changes that have occurred during the past year and the amount of the investment that each portfolio manager has made in the Fidelity fund(s) that he or she manages; (iv) Fidelity's compensation structure for portfolio managers, research analysts, and other key personnel, including its effects on fund profitability, the rationale for the compensation structure, and the extent to which current market conditions have affected retention and recruitment; (v) the compensation paid by FMR to fund sub-advisers on behalf of the Fidelity funds; (vi) Fidelity's fee structures and rationale for recommending different fees among different categories of funds and classes, as well as Fidelity's voluntary waiver of fees to maintain minimum yields for certain funds and classes; (vii) the rationale for any differences between fund fee structures and fee structures in place for other Fidelity clients; and (viii) explanations regarding the relative total expenses borne by certain funds and classes, total expense competitive trends, and actions that might be taken by FMR to reduce total expenses for certain funds and classes or to achieve further economies of scale.
Annual Report
Board Approval of Investment Advisory Contracts and Management Fees - continued
Based on its evaluation of all of the conclusions noted above, and after considering all factors it believed relevant, the Board ultimately concluded that the advisory fee structures are fair and reasonable, and that the fund's Advisory Contracts should be renewed.
Annual Report
Investment Adviser
Fidelity Management & Research Company
Boston, MA
Investment Sub-Advisers
FMR Co., Inc.
Fidelity Management & Research (U.K.) Inc.
Fidelity Management & Research (Hong Kong) Limited
Fidelity Management & Research (Japan) Inc.
Fidelity Investments Money Management, Inc.
General Distributor
Fidelity Distributors Corporation
Boston, MA
Transfer and Service Agents
Fidelity Investments Institutional Operations Company, Inc.
Boston, MA
Fidelity Service Company, Inc.
Boston, MA
Custodian
JPMorgan Chase Bank
New York, NY
VIPAMG-ANN-0211
1.540207.113
Fidelity® Variable Insurance Products:
Freedom Funds -
Income, 2005, 2010, 2015, 2020, 2025, 2030, 2035, 2040, 2045, 2050
Annual Report
December 31, 2010
(2_fidelity_logos) (Registered_Trademark)
Contents
To view a fund's proxy voting guidelines and proxy voting record for the 12-month period ended June 30, visit http://www.fidelity.com/proxyvotingresults or visit the Securities and Exchange Commission's (SEC) web site at http://www.sec.gov. You may also call 1-877-208-0098 to request a free copy of the proxy voting guidelines.
Annual Report
Fidelity Variable Insurance Products are separate account options which are purchased through a variable insurance contract.
Standard & Poor's, S&P and S&P 500 are registered service marks of The McGraw-Hill Companies, Inc. and have been licensed for use by Fidelity Distributors Corporation.
Other third party marks appearing herein are the property of their respective owners.
All other marks appearing herein are registered or unregistered trademarks or service marks of FMR LLC or an affiliated company.
This report and the financial statements contained herein are submitted for the general information of the shareholders of the funds. This report is not authorized for distribution to prospective investors in the funds unless preceded or accompanied by an effective prospectus.
A fund files its complete schedule of portfolio holdings with the SEC for the first and third quarters of each fiscal year on Form N-Q. Forms N-Q are available on the SEC's web site at http://www.sec.gov. A fund's Forms N-Q may be reviewed and copied at the SEC's Public Reference Room in Washington, DC. Information regarding the operation of the SEC's Public Reference Room may be obtained by calling 1-800-SEC-0330. For a complete list of a fund's portfolio holdings, view the most recent holdings listing, semiannual report, or annual report on Fidelity's web site at http://www.fidelity.com, http://www.advisor.fidelity.com, or http://www.401k.com, as applicable.
NOT FDIC INSURED • MAY LOSE VALUE • NO BANK GUARANTEE
Neither the funds nor Fidelity Distributors Corporation is a bank.
Annual Report
VIP Freedom Income Portfolio
Average annual total return reflects the change in the value of an investment, assuming reinvestment of the class' distributions from dividend income and capital gains (the profits earned upon the sale of securities that have grown in value, if any) and assuming a constant rate of performance each year. During periods of reimbursement by Fidelity, a fund's total return will be greater than it would be had the reimbursement not occurred. Performance numbers are net of all underlying fund operating expenses, but do not include any insurance charges imposed by your insurance company's separate account. If performance information included the effect of these additional charges, the total returns would have been lower. How a fund did yesterday is no guarantee of how it will do tomorrow.
Average Annual Total Returns
Periods ended December 31, 2010 | Past 1
year | Past 5
years | Life of
FundA |
VIP Freedom Income PortfolioSM - Initial Class | 7.49% | 4.66% | 4.91% |
VIP Freedom Income Portfolio - Service Class | 7.46% | 4.55% | 4.80% |
VIP Freedom Income Portfolio - Service Class 2 | 7.25% | 4.39% | 4.64% |
A From April 26, 2005.
$10,000 Over Life of Fund
Let's say hypothetically that $10,000 was invested in VIP Freedom Income Portfolio - Initial Class on April 26, 2005, when the fund started. The chart shows how the value of your investment would have changed, and also shows how the Barclays Capital® U.S. Aggregate Bond Index performed over the same period.
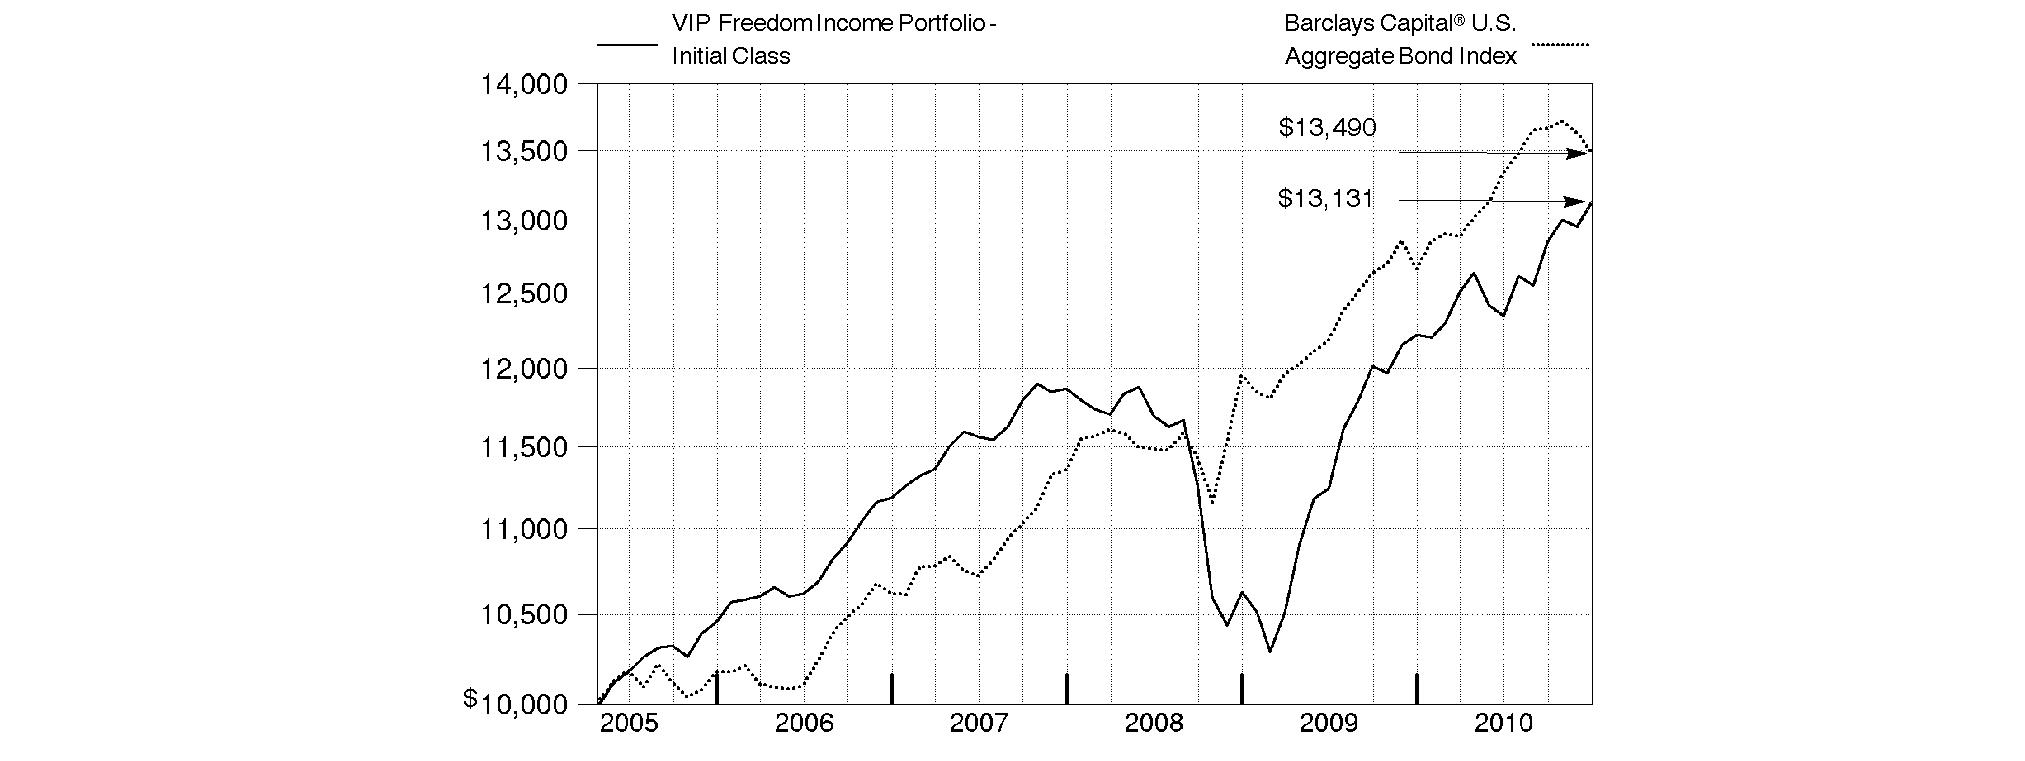
Annual Report
VIP Freedom 2005 Portfolio
Performance: The Bottom Line
Average annual total return reflects the change in the value of an investment, assuming reinvestment of the class' distributions from dividend income and capital gains (the profits earned upon the sale of securities that have grown in value, if any) and assuming a constant rate of performance each year. During periods of reimbursement by Fidelity, a fund's total return will be greater than it would be had the reimbursement not occurred. Performance numbers are net of all underlying fund operating expenses, but do not include any insurance charges imposed by your insurance company's separate account. If performance information included the effect of these additional charges, the total returns would have been lower. How a fund did yesterday is no guarantee of how it will do tomorrow.
Average Annual Total Returns
Periods ended December 31, 2010 | Past 1
year | Past 5
years | Life of
FundA |
VIP Freedom 2005 PortfolioSM - Initial Class | 11.34% | 4.44% | 5.30% |
VIP Freedom 2005 Portfolio - Service Class | 11.24% | 4.34% | 5.21% |
VIP Freedom 2005 Portfolio - Service Class 2 | 11.06% | 4.17% | 5.03% |
A From April 26, 2005.
$10,000 Over Life of Fund
Let's say hypothetically that $10,000 was invested in VIP Freedom 2005 Portfolio - Initial Class on April 26, 2005, when the fund started. The chart shows how the value of your investment would have changed, and also shows how the Barclays Capital U.S. Aggregate Bond Index performed over the same period.
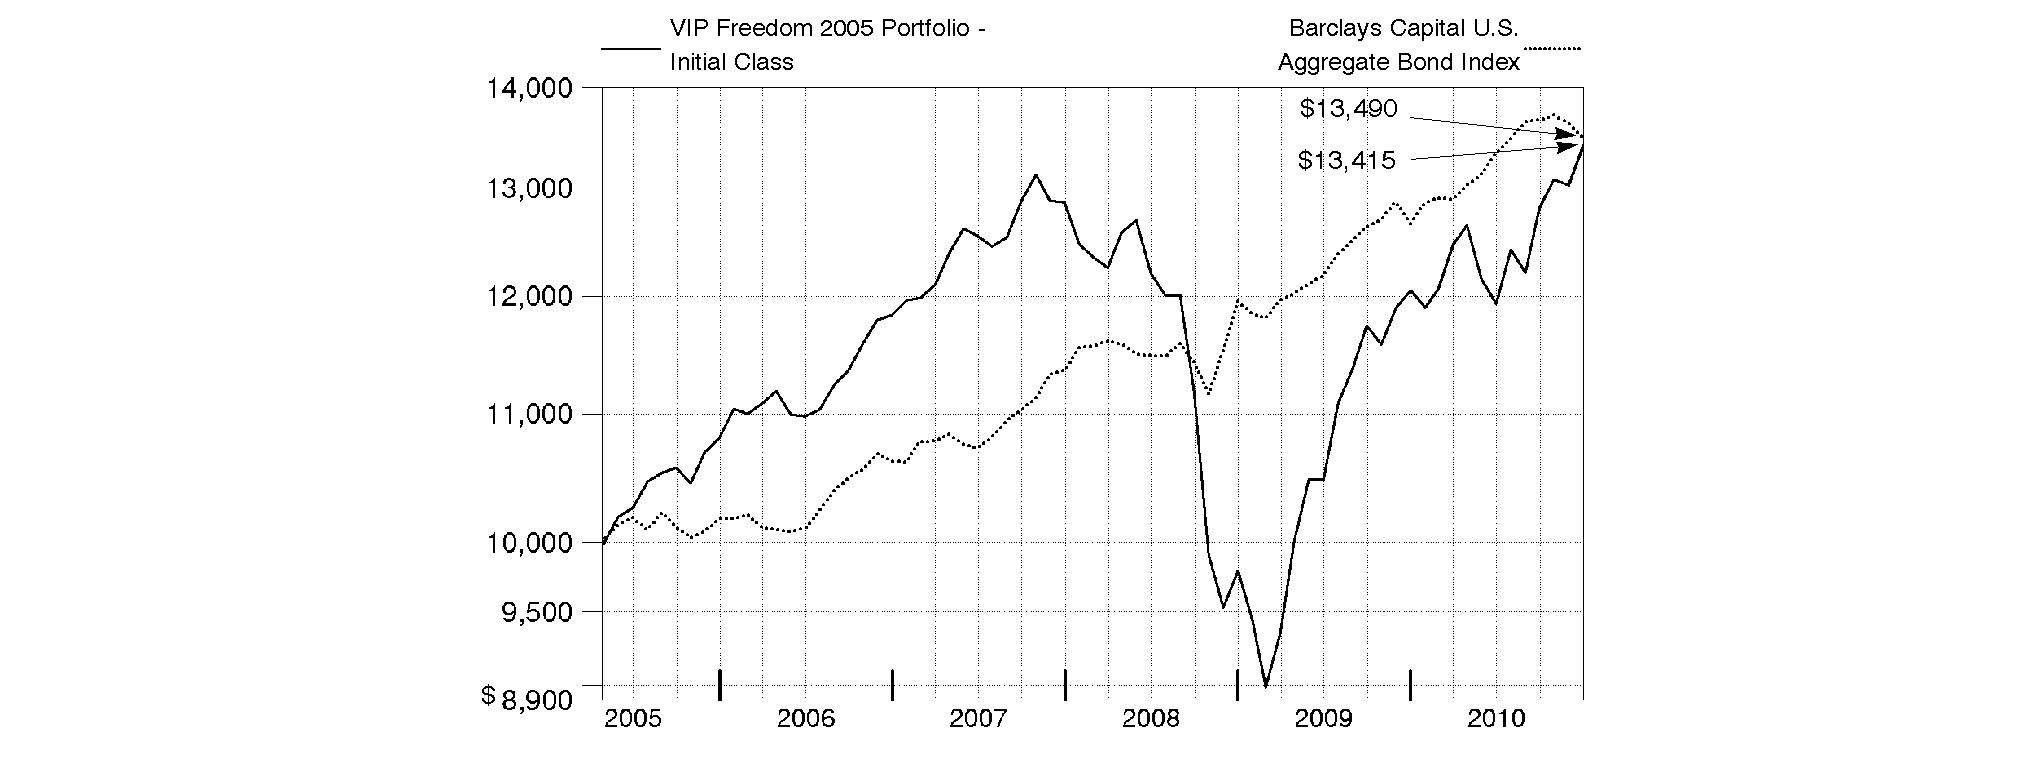
Annual Report
VIP Freedom 2010 Portfolio
Performance: The Bottom Line
Average annual total return reflects the change in the value of an investment, assuming reinvestment of the class' distributions from dividend income and capital gains (the profits earned upon the sale of securities that have grown in value, if any) and assuming a constant rate of performance each year. During periods of reimbursement by Fidelity, a fund's total return will be greater than it would be had the reimbursement not occurred. Performance numbers are net of all underlying fund operating expenses, but do not include any insurance charges imposed by your insurance company's separate account. If performance information included the effect of these additional charges, the total returns would have been lower. How a fund did yesterday is no guarantee of how it will do tomorrow.
Average Annual Total Returns
Periods ended December 31, 2010 | Past 1
year | Past 5
years | Life of
FundA |
VIP Freedom 2010 PortfolioSM - Initial Class | 12.95% | 4.67% | 5.57% |
VIP Freedom 2010 Portfolio - Service Class | 12.74% | 4.58% | 5.46% |
VIP Freedom 2010 Portfolio - Service Class 2 | 12.55% | 4.40% | 5.29% |
A From April 26, 2005.
$10,000 Over Life of Fund
Let's say hypothetically that $10,000 was invested in VIP Freedom 2010 Portfolio - Initial Class on April 26, 2005, when the fund started. The chart shows how the value of your investment would have changed, and also shows how the Barclays Capital U.S. Aggregate Bond Index performed over the same period.
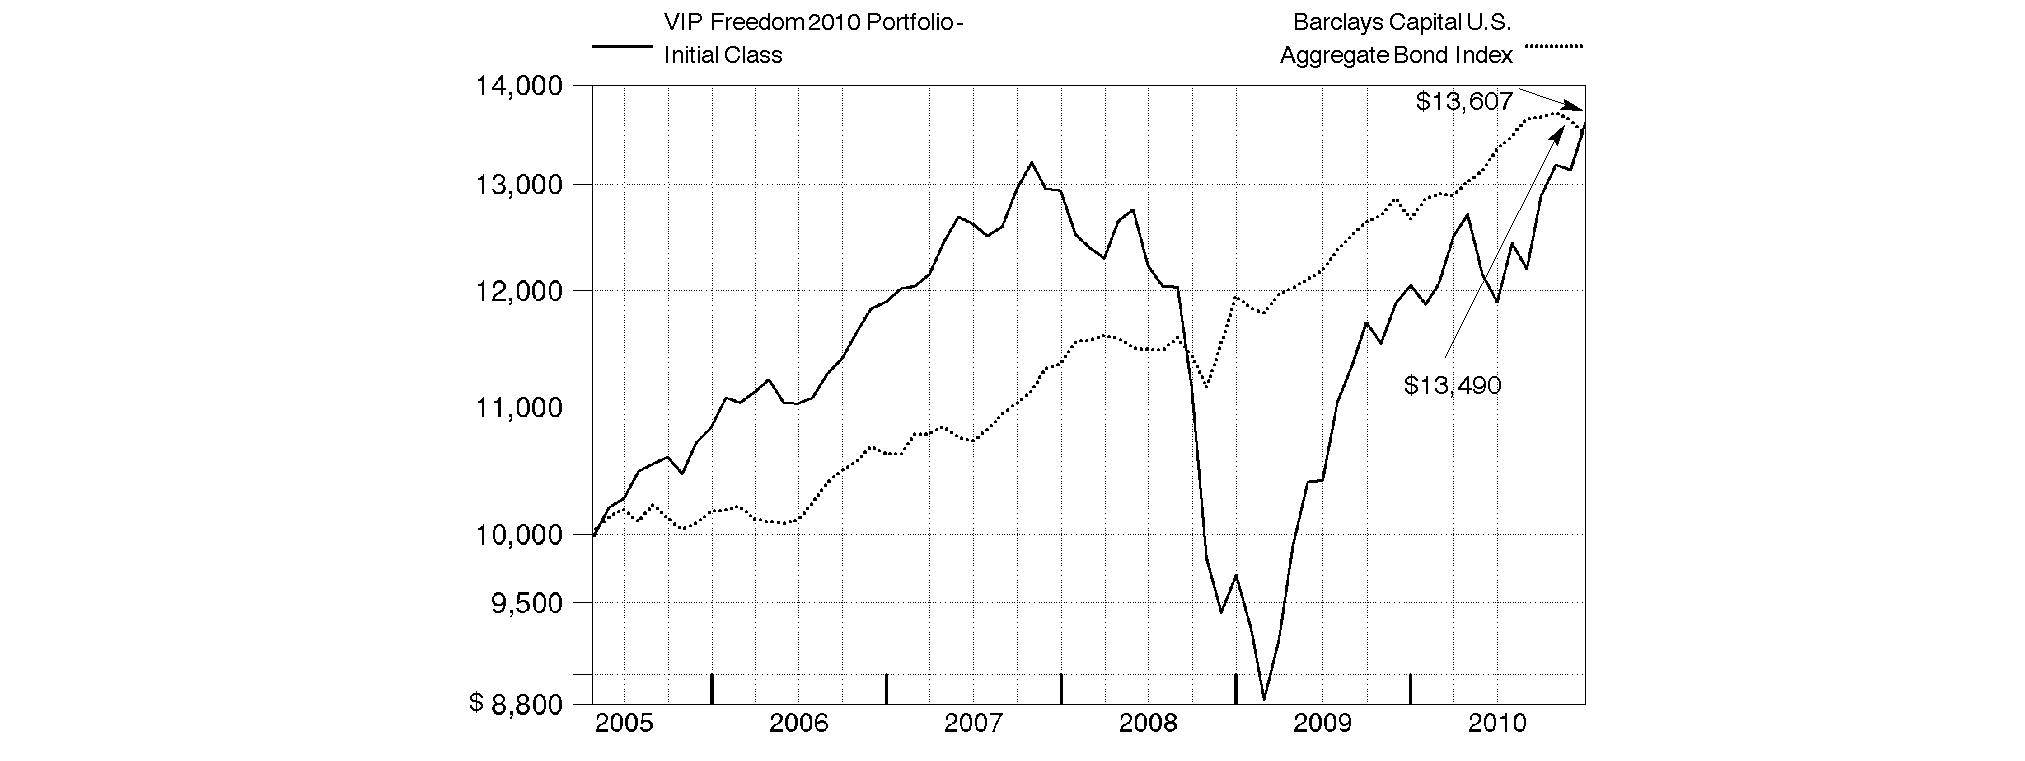
Annual Report
VIP Freedom 2015 Portfolio
Performance: The Bottom Line
Average annual total return reflects the change in the value of an investment, assuming reinvestment of the class' distributions from dividend income and capital gains (the profits earned upon the sale of securities that have grown in value, if any) and assuming a constant rate of performance each year. During periods of reimbursement by Fidelity, a fund's total return will be greater than it would be had the reimbursement not occurred. Performance numbers are net of all underlying fund operating expenses, but do not include any insurance charges imposed by your insurance company's separate account. If performance information included the effect of these additional charges, the total returns would have been lower. How a fund did yesterday is no guarantee of how it will do tomorrow.
Average Annual Total Returns
Periods ended December 31, 2010 | Past 1
year | Past 5
years | Life of
FundA |
VIP Freedom 2015 PortfolioSM - Initial Class | 13.09% | 4.65% | 5.86% |
VIP Freedom 2015 Portfolio - Service Class | 13.00% | 4.54% | 5.74% |
VIP Freedom 2015 Portfolio - Service Class 2 | 12.79% | 4.39% | 5.59% |
A From April 26, 2005.
$10,000 Over Life of Fund
Let's say hypothetically that $10,000 was invested in VIP Freedom 2015 Portfolio - Initial Class on April 26, 2005, when the fund started. The chart shows how the value of your investment would have changed, and also shows how the S&P 500® Index performed over the same period.
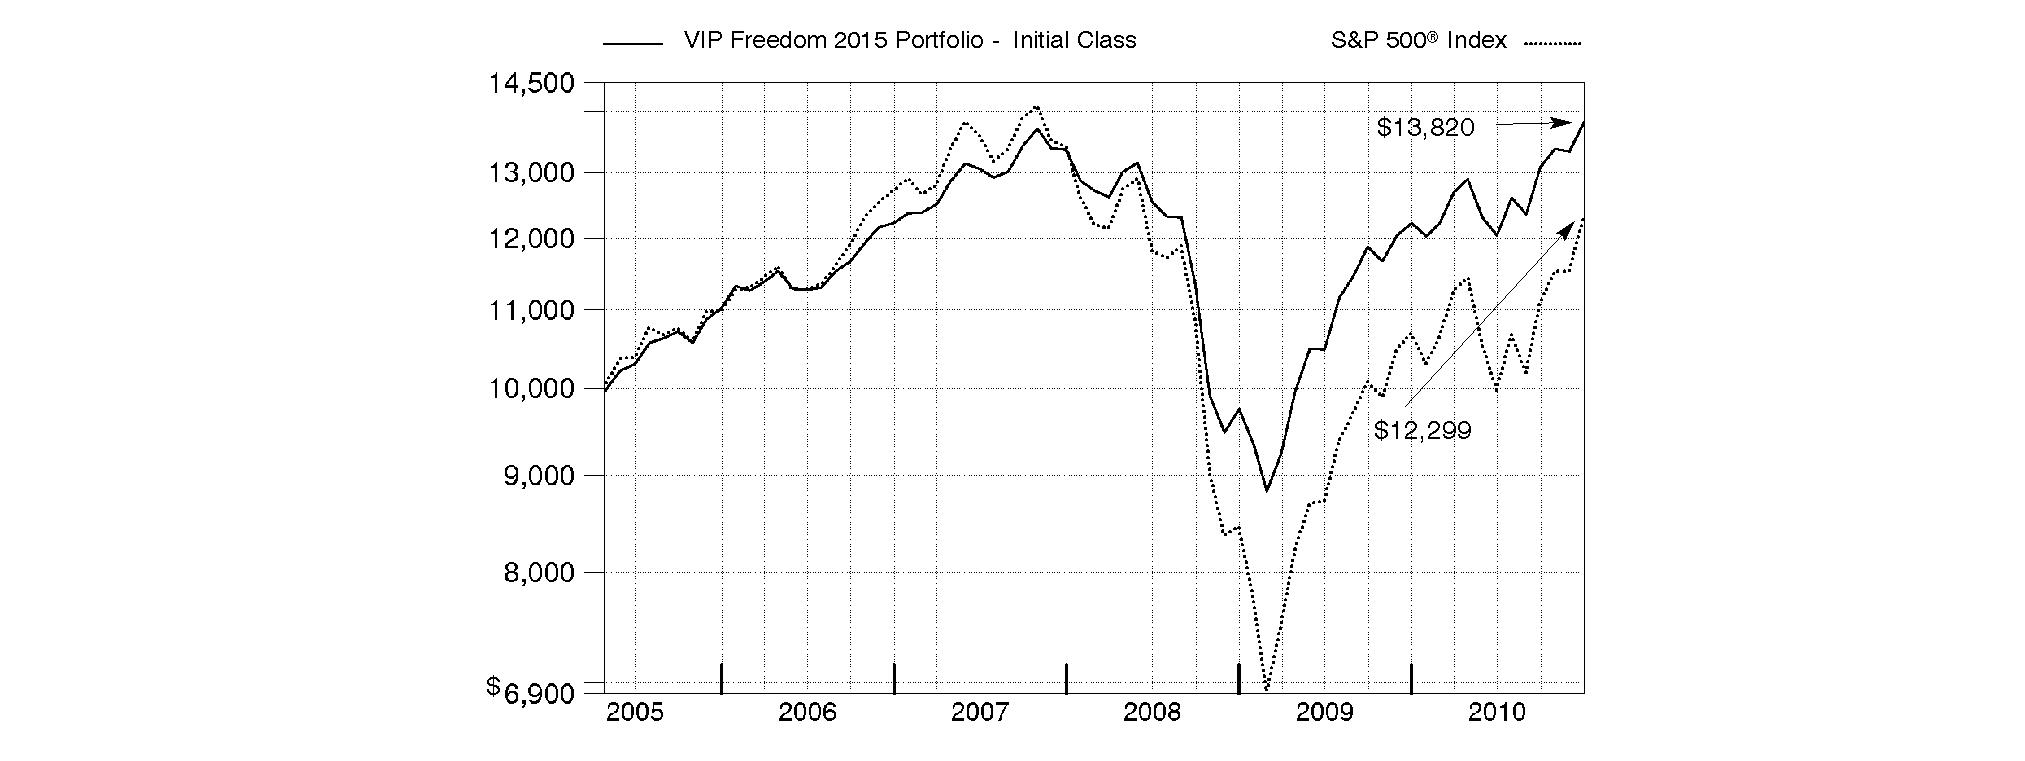
Annual Report
VIP Freedom 2020 Portfolio
Performance: The Bottom Line
Average annual total return reflects the change in the value of an investment, assuming reinvestment of the class' distributions from dividend income and capital gains (the profits earned upon the sale of securities that have grown in value, if any) and assuming a constant rate of performance each year. During periods of reimbursement by Fidelity, a fund's total return will be greater than it would be had the reimbursement not occurred. Performance numbers are net of all underlying fund operating expenses, but do not include any insurance charges imposed by your insurance company's separate account. If performance information included the effect of these additional charges, the total returns would have been lower. How a fund did yesterday is no guarantee of how it will do tomorrow.
Average Annual Total Returns
Periods ended December 31, 2010 | Past 1
year | Past 5
years | Life of
FundA |
VIP Freedom 2020 PortfolioSM - Initial Class | 14.49% | 4.20% | 5.66% |
VIP Freedom 2020 Portfolio - Service Class | 14.52% | 4.10% | 5.56% |
VIP Freedom 2020 Portfolio - Service Class 2 | 14.33% | 3.94% | 5.40% |
A From April 26, 2005.
$10,000 Over Life of Fund
Let's say hypothetically that $10,000 was invested in VIP Freedom 2020 Portfolio - Initial Class on April 26, 2005, when the fund started. The chart shows how the value of your investment would have changed, and also shows how the S&P 500 Index performed over the same period.
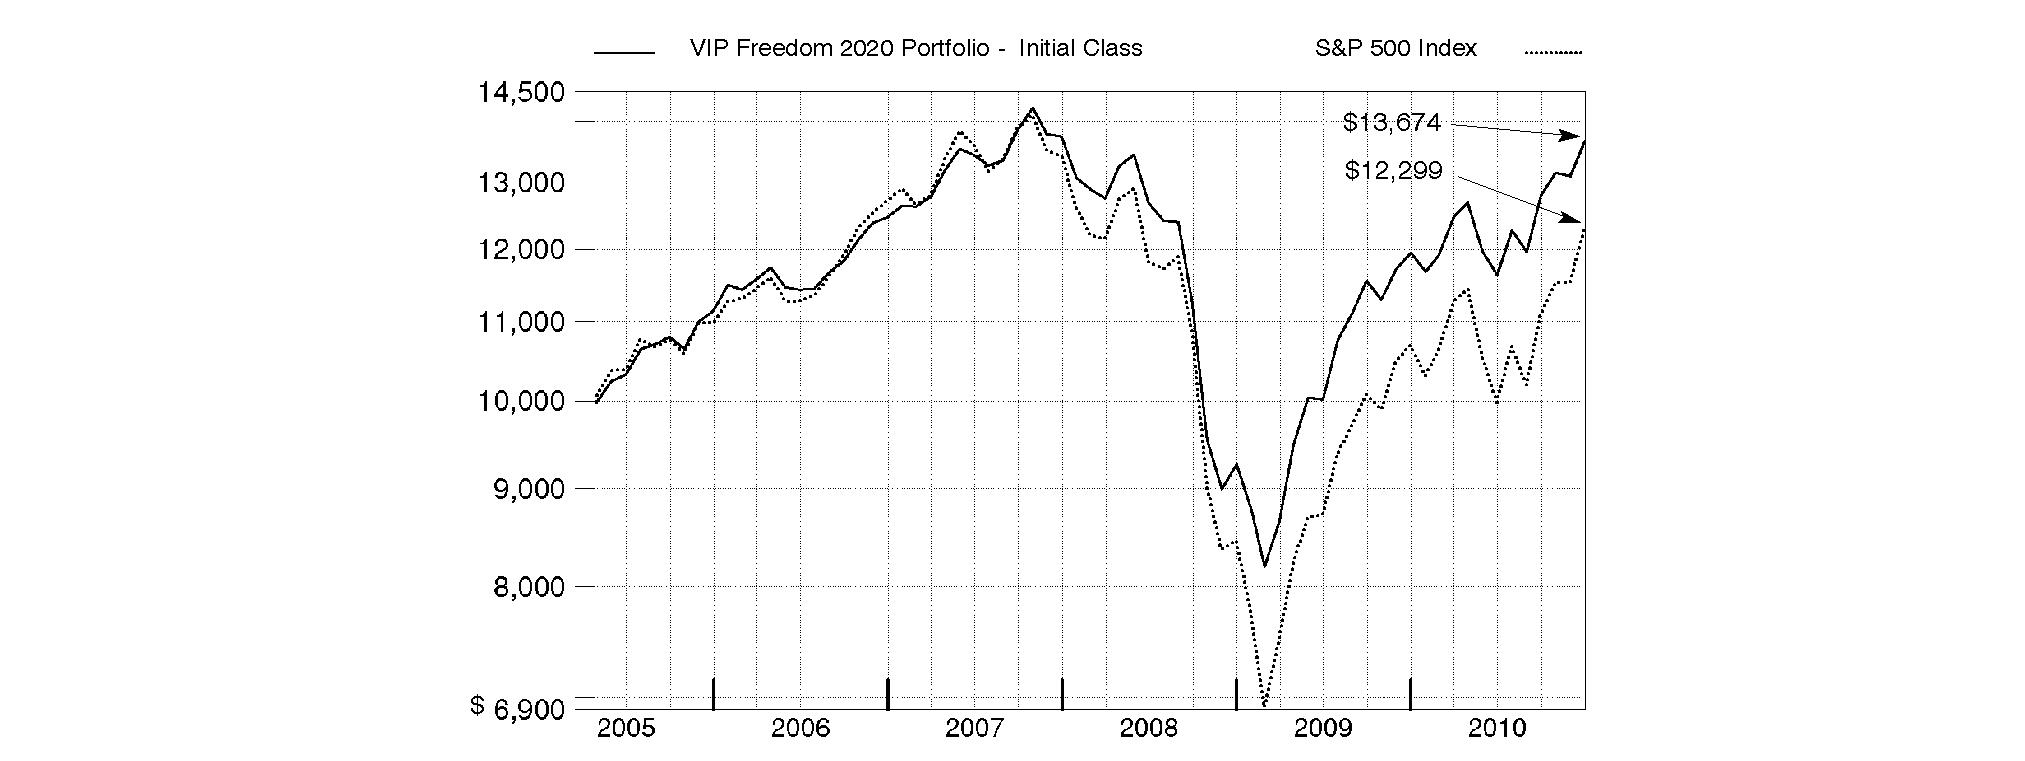
Annual Report
VIP Freedom 2025 Portfolio
Performance: The Bottom Line
Average annual total return reflects the change in the value of an investment, assuming reinvestment of the class' distributions from dividend income and capital gains (the profits earned upon the sale of securities that have grown in value, if any) and assuming a constant rate of performance each year. During periods of reimbursement by Fidelity, a fund's total return will be greater than it would be had the reimbursement not occurred. Performance numbers are net of all underlying fund operating expenses, but do not include any insurance charges imposed by your insurance company's separate account. If performance information included the effect of these additional charges, the total returns would have been lower. How a fund did yesterday is no guarantee of how it will do tomorrow.
Average Annual Total Returns
Periods ended December 31, 2010 | Past 1
year | Past 5
years | Life of
FundA |
VIP Freedom 2025 PortfolioSM - Initial Class | 15.79% | 4.27% | 5.87% |
VIP Freedom 2025 Portfolio - Service Class | 15.70% | 4.17% | 5.77% |
VIP Freedom 2025 Portfolio - Service Class 2 | 15.47% | 4.00% | 5.61% |
A From April 26, 2005.
$10,000 Over Life of Fund
Let's say hypothetically that $10,000 was invested in VIP Freedom 2025 Portfolio - Initial Class on April 26, 2005, when the fund started. The chart shows how the value of your investment would have changed, and also shows how the S&P 500 Index performed over the same period.
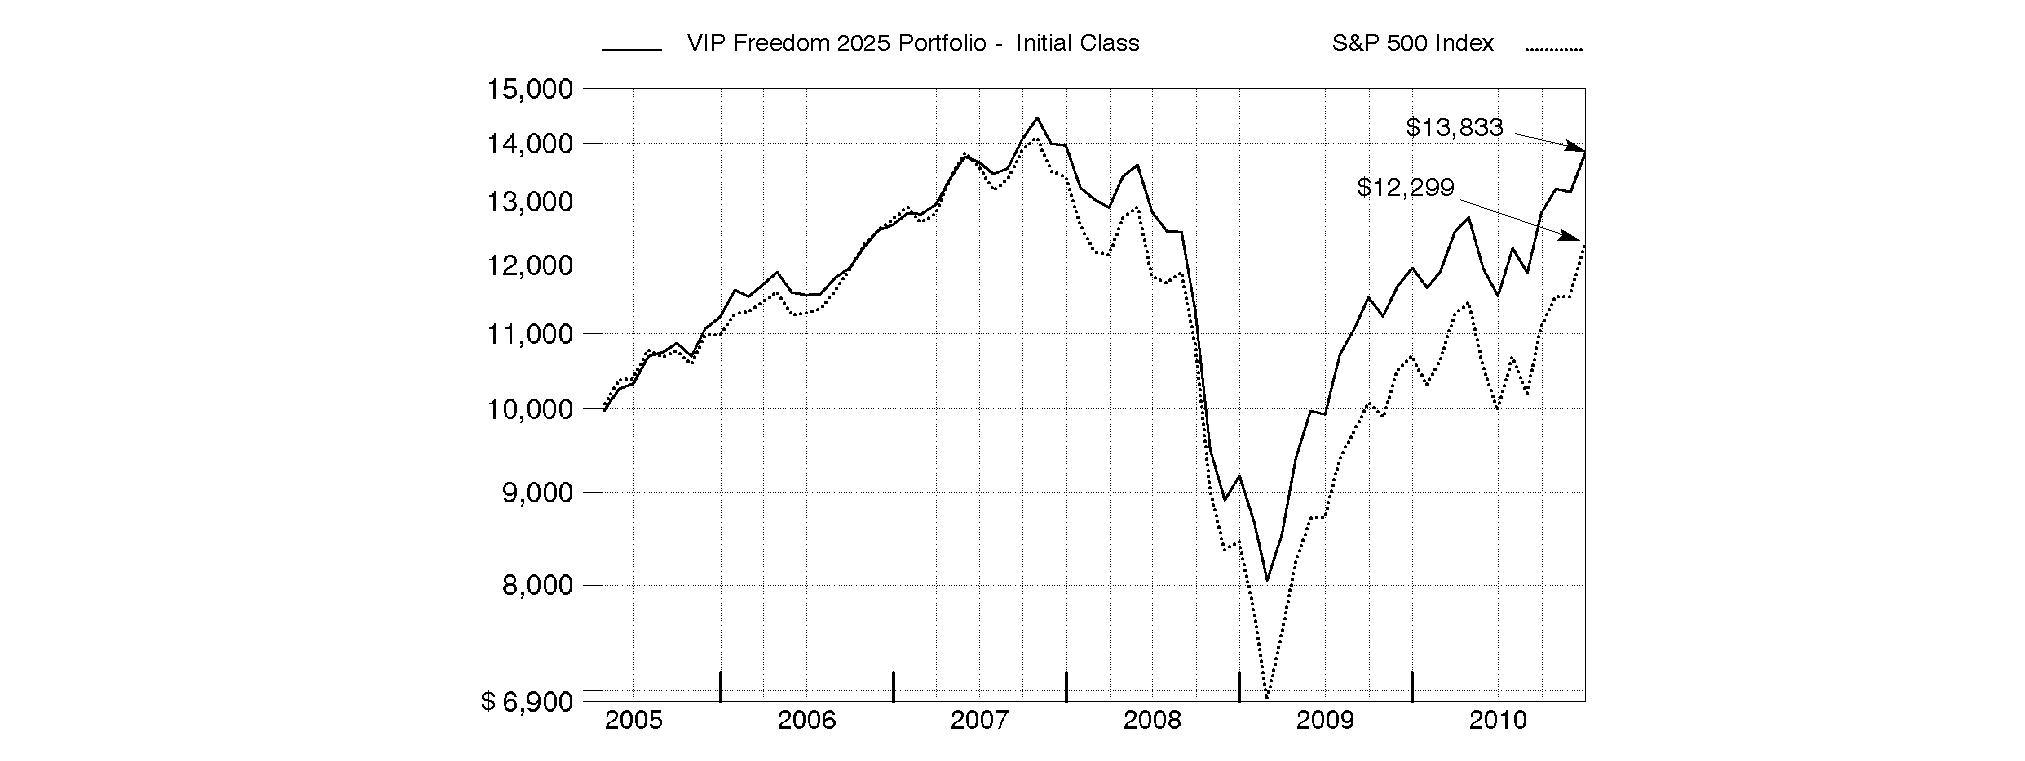
Annual Report
VIP Freedom 2030 Portfolio
Performance: The Bottom Line
Average annual total return reflects the change in the value of an investment, assuming reinvestment of the class' distributions from dividend income and capital gains (the profits earned upon the sale of securities that have grown in value, if any) and assuming a constant rate of performance each year. During periods of reimbursement by Fidelity, a fund's total return will be greater than it would be had the reimbursement not occurred. Performance numbers are net of all underlying fund operating expenses, but do not include any insurance charges imposed by your insurance company's separate account. If performance information included the effect of these additional charges, the total returns would have been lower. How a fund did yesterday is no guarantee of how it will do tomorrow.
Average Annual Total Returns
Periods ended December 31, 2010 | Past 1
year | Past 5
years | Life of
FundA |
VIP Freedom 2030 PortfolioSM - Initial Class | 16.08% | 3.61% | 5.46% |
VIP Freedom 2030 Portfolio - Service Class | 16.00% | 3.50% | 5.36% |
VIP Freedom 2030 Portfolio - Service Class 2 | 15.89% | 3.35% | 5.20% |
A From April 26, 2005.
$10,000 Over Life of Fund
Let's say hypothetically that $10,000 was invested in VIP Freedom 2030 Portfolio - Initial Class on April 26, 2005, when the fund started. The chart shows how the value of your investment would have changed, and also shows how the S&P 500 Index performed over the same period.
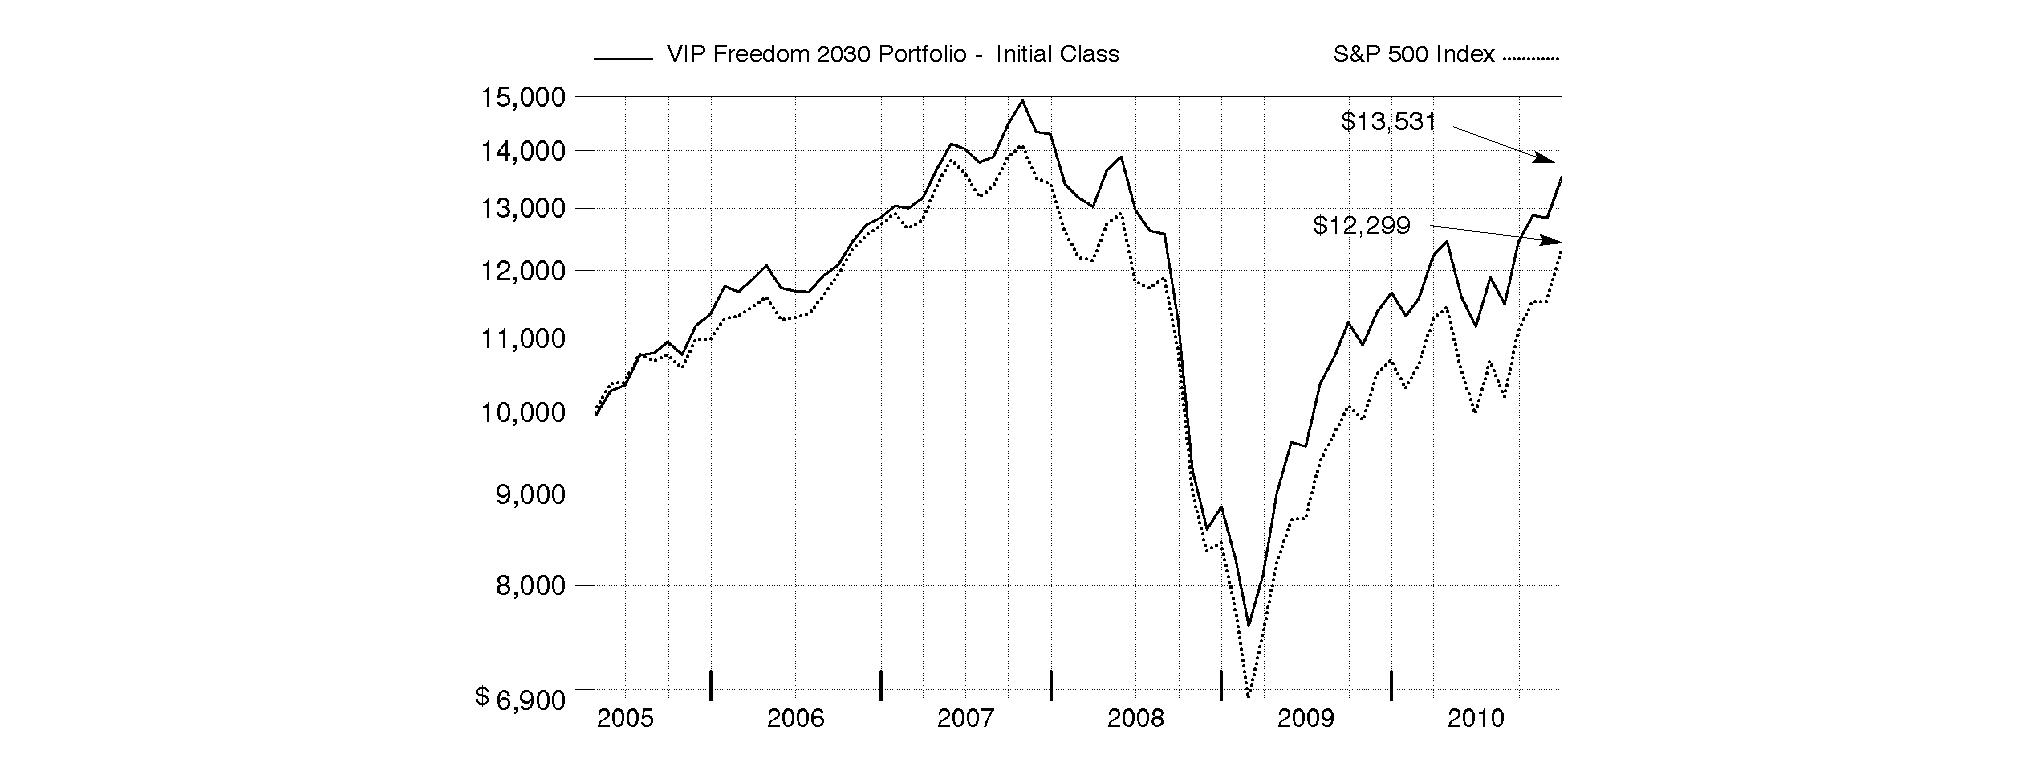
Annual Report
VIP Freedom 2035 Portfolio
Performance: The Bottom Line
Average annual total return reflects the change in the value of an investment, assuming reinvestment of the class' distributions from dividend income and capital gains (the profits earned upon the sale of securities that have grown in value, if any) and assuming a constant rate of performance each year. During periods of reimbursement by Fidelity, a fund's total return will be greater than it would be had the reimbursement not occurred. Performance numbers are net of all underlying fund operating expenses, but do not include any insurance charges imposed by your insurance company's separate account. If performance information included the effect of these additional charges, the total returns would have been lower. How a fund did yesterday is no guarantee of how it will do tomorrow.
Average Annual Total Returns
Periods ended December 31, 2010 | Past 1
year | Life of
FundA |
VIP Freedom 2035 PortfolioSM - Initial Class | 17.01% | 33.00% |
VIP Freedom 2035 Portfolio - Service Class | 16.97% | 32.86% |
VIP Freedom 2035 Portfolio - Service Class 2 | 16.76% | 32.65% |
A From April 8, 2009.
$10,000 Over Life of Fund
Let's say hypothetically that $10,000 was invested in VIP Freedom 2035 Portfolio - Initial Class on April 8, 2009, when the fund started. The chart shows how the value of your investment would have changed, and also shows how the S&P 500 Index performed over the same period.
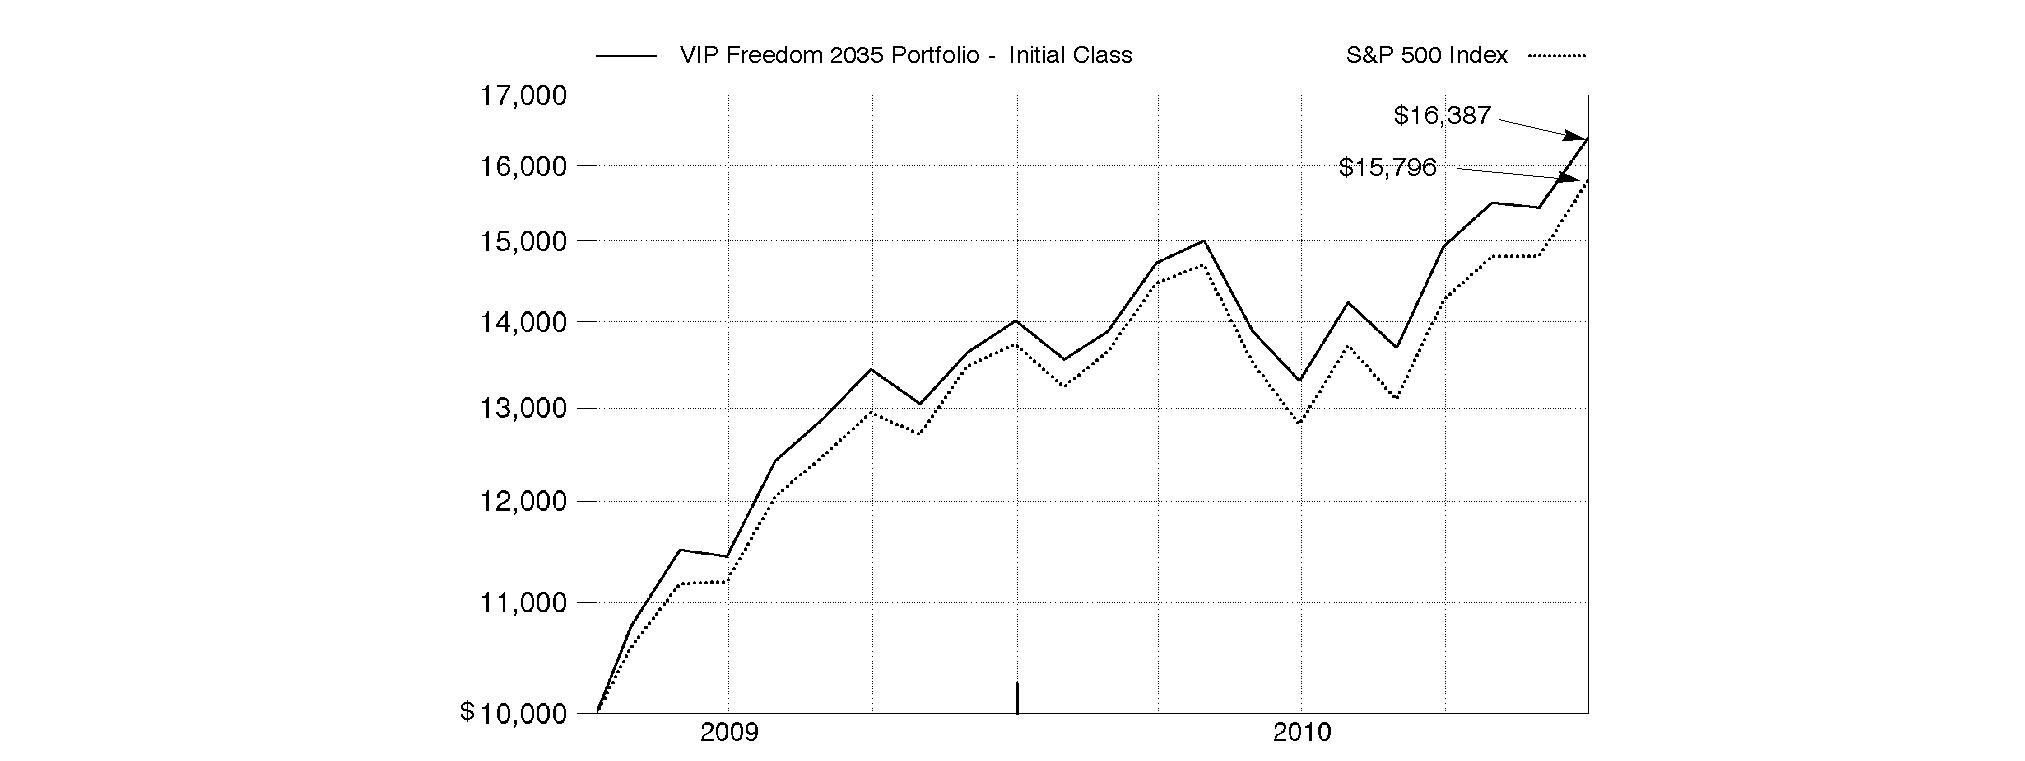
Annual Report
VIP Freedom 2040 Portfolio
Performance: The Bottom Line
Average annual total return reflects the change in the value of an investment, assuming reinvestment of the class' distributions from dividend income and capital gains (the profits earned upon the sale of securities that have grown in value, if any) and assuming a constant rate of performance each year. During periods of reimbursement by Fidelity, a fund's total return will be greater than it would be had the reimbursement not occurred. Performance numbers are net of all underlying fund operating expenses, but do not include any insurance charges imposed by your insurance company's separate account. If performance information included the effect of these additional charges, the total returns would have been lower. How a fund did yesterday is no guarantee of how it will do tomorrow.
Average Annual Total Returns
Periods ended December 31, 2010 | Past 1
year | Life of
FundA |
VIP Freedom 2040 PortfolioSM - Initial Class | 17.19% | 33.58% |
VIP Freedom 2040 Portfolio - Service Class | 17.05% | 33.44% |
VIP Freedom 2040 Portfolio - Service Class 2 | 16.92% | 33.27% |
A From April 8, 2009.
$10,000 Over Life of Fund
Let's say hypothetically that $10,000 was invested in VIP Freedom 2040 Portfolio - Initial Class on April 8, 2009, when the fund started. The chart shows how the value of your investment would have changed, and also shows how the S&P 500 Index performed over the same period.
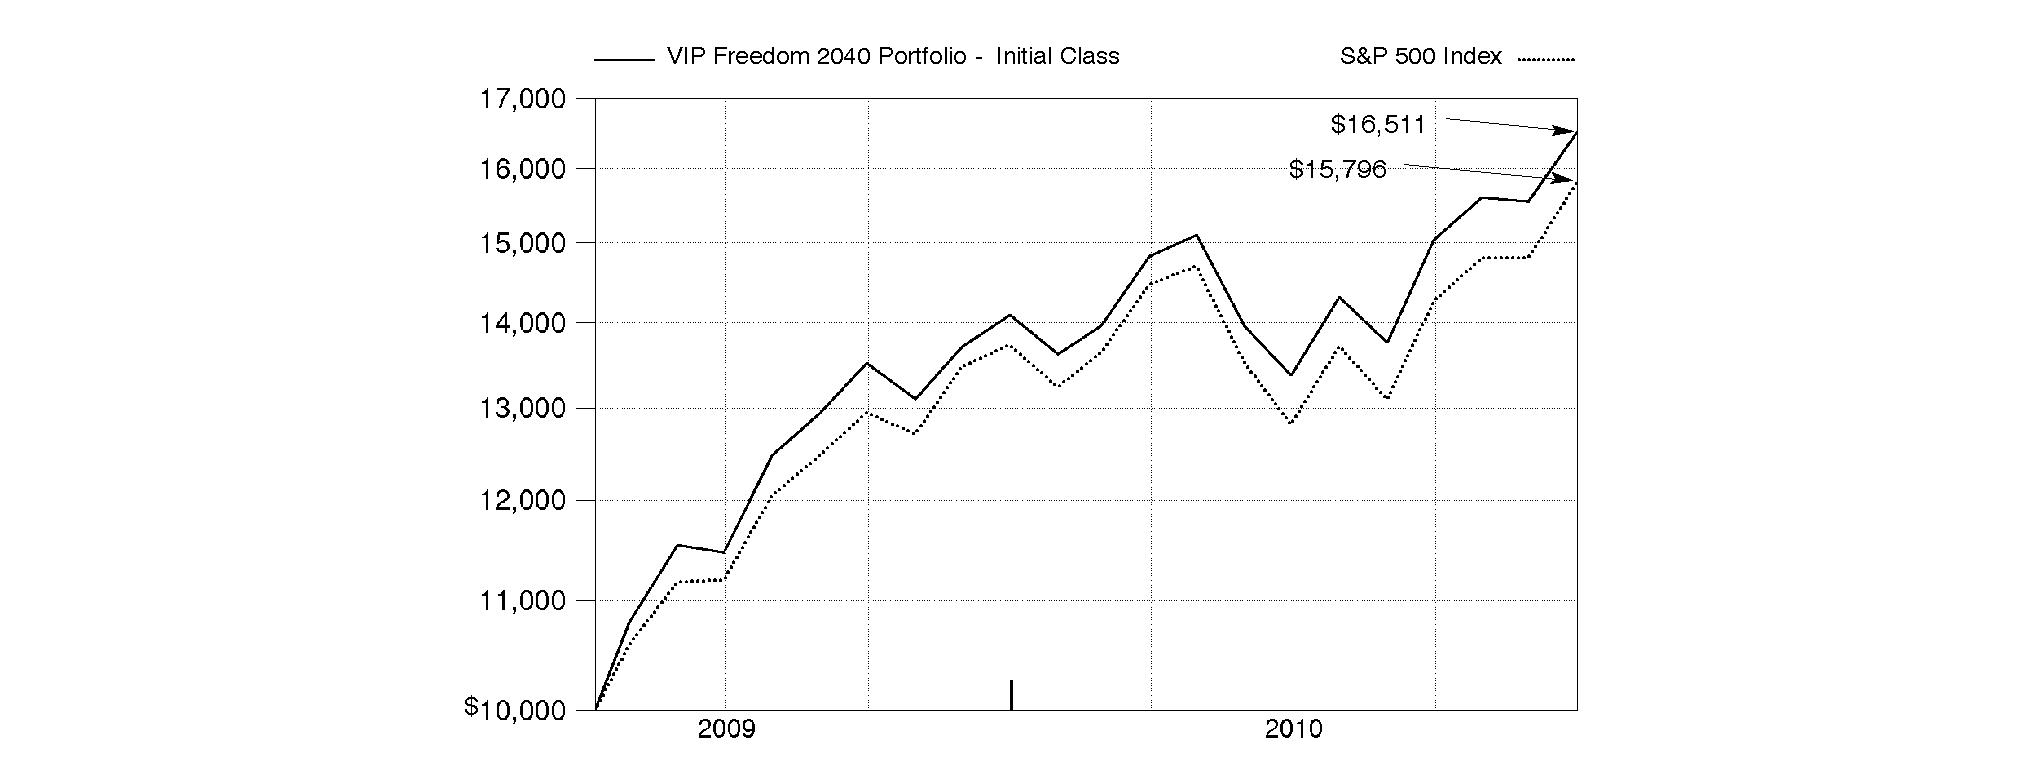
Annual Report
VIP Freedom 2045 Portfolio
Performance: The Bottom Line
Average annual total return reflects the change in the value of an investment, assuming reinvestment of the class' distributions from dividend income and capital gains (the profits earned upon the sale of securities that have grown in value, if any) and assuming a constant rate of performance each year. During periods of reimbursement by Fidelity, a fund's total return will be greater than it would be had the reimbursement not occurred. Performance numbers are net of all underlying fund operating expenses, but do not include any insurance charges imposed by your insurance company's separate account. If performance information included the effect of these additional charges, the total returns would have been lower. How a fund did yesterday is no guarantee of how it will do tomorrow.
Average Annual Total Returns
Periods ended December 31, 2010 | Past 1
year | Life of
FundA |
VIP Freedom 2045 PortfolioSM - Initial Class | 17.37% | 33.91% |
VIP Freedom 2045 Portfolio - Service Class | 17.23% | 33.77% |
VIP Freedom 2045 Portfolio - Service Class 2 | 17.15% | 33.59% |
A From April 8, 2009.
$10,000 Over Life of Fund
Let's say hypothetically that $10,000 was invested in VIP Freedom 2045 Portfolio - Initial Class on April 8, 2009, when the fund started. The chart shows how the value of your investment would have changed, and also shows how the S&P 500 Index performed over the same period.
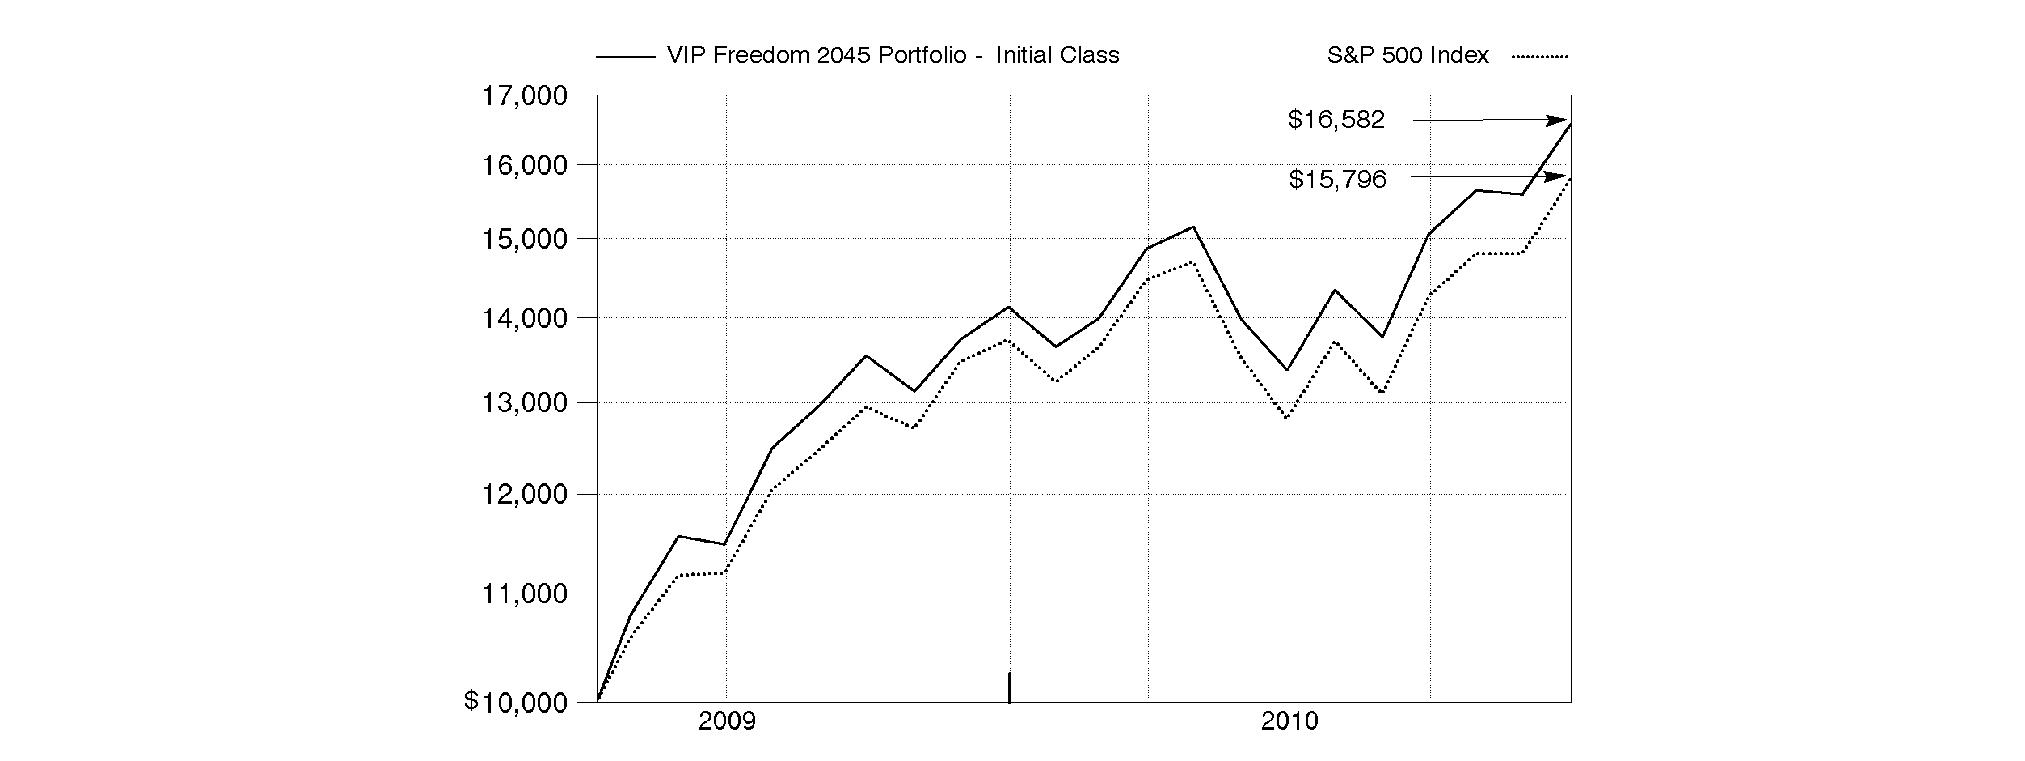
Annual Report
VIP Freedom 2050 Portfolio
Performance: The Bottom Line
Average annual total return reflects the change in the value of an investment, assuming reinvestment of the class' distributions from dividend income and capital gains (the profits earned upon the sale of securities that have grown in value, if any) and assuming a constant rate of performance each year. During periods of reimbursement by Fidelity, a fund's total return will be greater than it would be had the reimbursement not occurred. Performance numbers are net of all underlying fund operating expenses, but do not include any insurance charges imposed by your insurance company's separate account. If performance information included the effect of these additional charges, the total returns would have been lower. How a fund did yesterday is no guarantee of how it will do tomorrow.
Average Annual Total Returns
Periods ended December 31, 2010 | Past 1
year | Life of
FundA |
VIP Freedom 2050 PortfolioSM - Initial Class | 17.58% | 34.83% |
VIP Freedom 2050 Portfolio - Service Class | 17.53% | 34.69% |
VIP Freedom 2050 Portfolio - Service Class 2 | 17.30% | 34.46% |
A From April 8, 2009.
$10,000 Over Life of Fund
Let's say hypothetically that $10,000 was invested in VIP Freedom 2050 Portfolio - Initial Class on April 8, 2009, when the fund started. The chart shows how the value of your investment would have changed, and also shows how the S&P 500 Index performed over the same period.
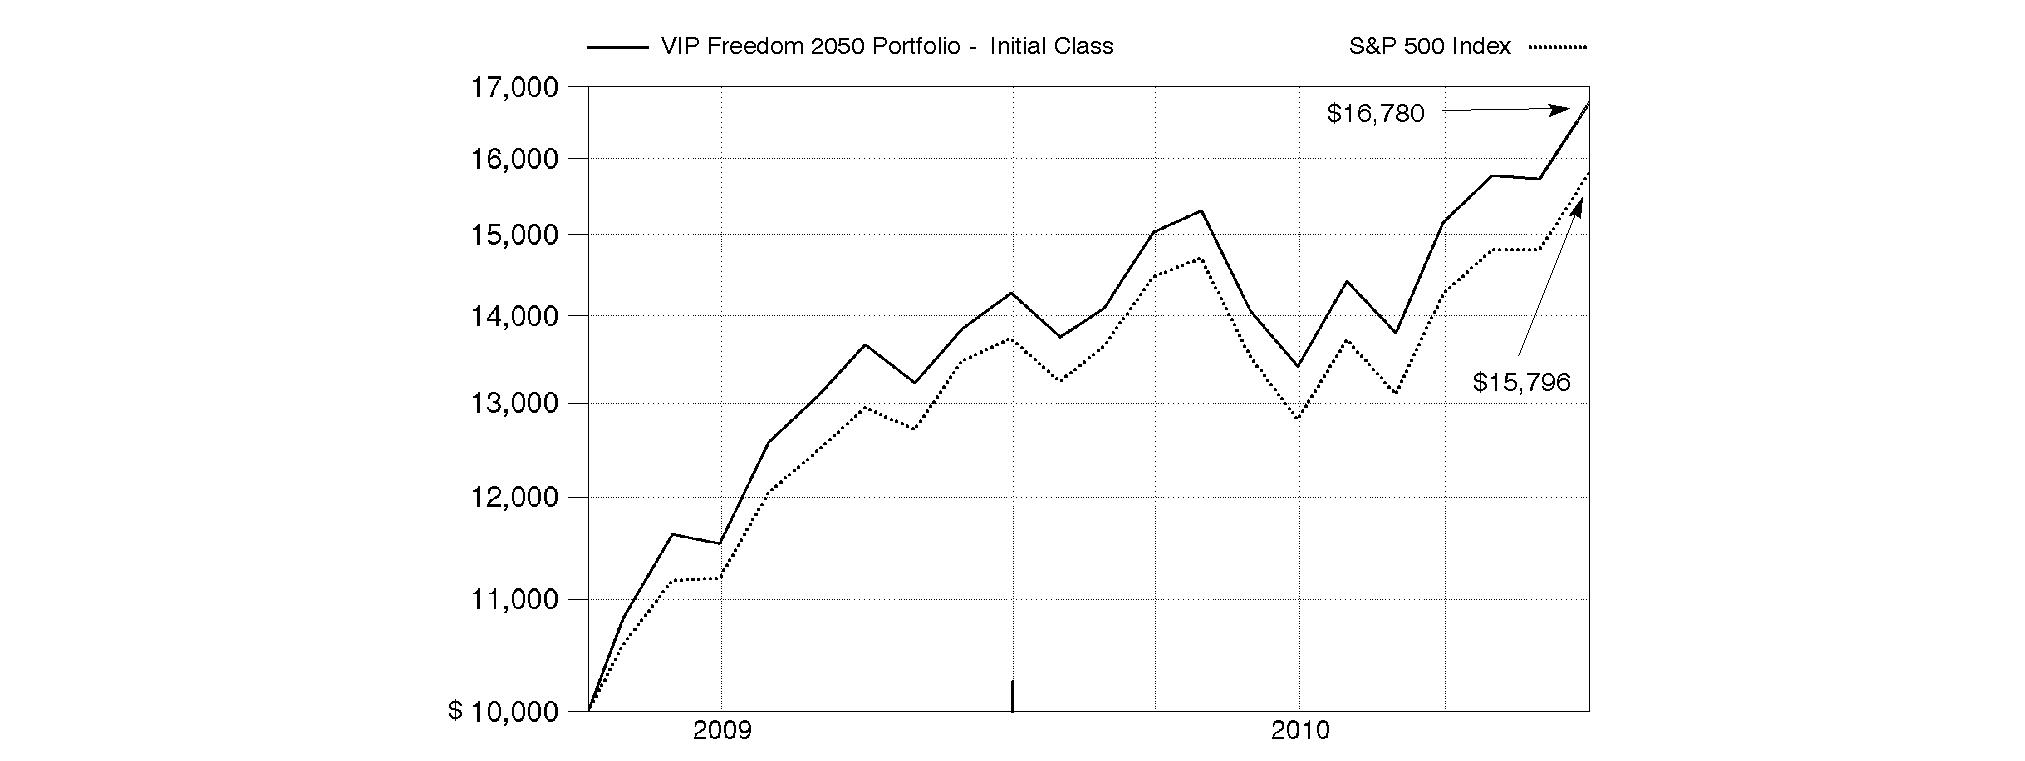
Annual Report
Market Recap: While market improvements around the world hit a speed bump in the first half of the 12-month period ending December 31, 2010, world economies re-accelerated in August, supported by a broadening recovery and low inflation in the U.S. Domestic stock markets recorded solid gains for the year, lifted by a strong second-half rally fueled by economic optimism, encouraging earnings reports and a wave of corporate mergers. The large-cap S&P 500® Index rose 15.06%, the blue-chip-laden Dow Jones Industrial AverageSM added 14.06% and the technology-heavy Nasdaq Composite® Index climbed 18.02%. Meanwhile, international stocks, as represented by the MSCI® ACWI® (All Country World Index) ex USA Index, gained 11.29%, boosted in part by a depreciating U.S. dollar. In the fixed-income arena, U.S. taxable investment-grade bonds generated positive results during 2010, as the Barclays Capital® U.S. Aggregate Bond Index gained 6.54%. With ultra-low interest rates bolstering nearly all fixed-income securities for most of the year, sectors in the index with higher yields and more credit risk generally fared best, while most high-quality bonds generated more-moderate returns. Meanwhile, high-yield bonds, as represented by The BofA Merrill LynchSM US High Yield Constrained Index, returned 15.07%, a result of improved economic data and strengthening investor demand. Overseas, foreign bond markets showed mixed results, with a sizable disparity between the 3.97% return of the Citigroup® Non-U.S. Group of 7 Index - which measures the performance of sovereign debt of the major global economies outside the U.S. - and the 12.04% advance of the JPMorgan Emerging Markets Bond Index Global (EMBI Global), which benefited from the rising overall credit quality of emerging-markets debt issuers.
Comments from Jonathan Shelon and Christopher Sharpe, Co-Portfolio Managers of VIP Freedom Funds: For the year ending December 31, 2010, each of the four asset classes represented in the VIP Freedom Funds' portfolios - U.S. equity, non-U.S. equity, fixed income and short-term debt investments - posted positive absolute results. However, it was the allocation to equities and investment-grade debt that provided the biggest boost to their year-end results. Consequently, each of the VIP Freedom Funds delivered exceptional returns for investors, with VIP Freedom Income - the most-conservative, shortest-dated Fund - gaining a solid single digit increase while the longer-dated, more-equity-focused Funds rose into the low- to mid-teens. The Funds' U.S. equity class solidly outpaced the broad-based Dow Jones U.S. Total Stock Market IndexSM, which rose 17.49% for the one-year period ending December 31, 2010. Four of the seven underlying domestic equity funds beat the Dow Jones index, with underlying funds focusing on smaller-capitalization stocks - such as VIP Mid Cap Portfolio and VIP Value Strategies Portfolio - delivering the highest absolute results. VIP Growth Portfolio and VIP Value Portfolio, which invest more heavily in larger-capitalization stocks, also significantly contributed to the Funds' performance. The Funds' non-U.S. equity asset class, which handily outperformed the 7.88% gain of the MSCI® EAFE® (Europe, Australasia, Far East) Index, also bolstered absolute results. VIP Overseas Portfolio anchored the Funds' performance in the non-U.S. equity class, while VIP Emerging Markets Portfolio - benefiting from an increase in consumer spending in emerging markets - posted a near 18% return for the year. U.S. investors also gained from a generally weaker dollar, which lifted foreign stock returns. Turning to bonds, the Funds' fixed-income asset class handily beat the Barclays Capital® U.S. Aggregate Bond Index. Buoyed by its allocation to credit-related securities, which performed well for most of the year, VIP Investment Grade Bond Portfolio solidly contributed to the Funds' performance, while VIP High Income Portfolio roared past the broader bond market. Lastly, the Funds' short-term debt holding, VIP Money Market Portfolio, performed roughly in line with the Barclays Capital U.S. 3 Month Treasury Bellwether Index, which increased 0.15%.
The views expressed above reflect those of the portfolio manager(s) only through the end of the period as stated on the cover of this report and do not necessarily represent the views of Fidelity or any other person in the Fidelity organization. Any such views are subject to change at any time based upon market or other conditions and Fidelity disclaims any responsibility to update such views. These views may not be relied on as investment advice and, because investment decisions for a Fidelity fund are based on numerous factors, may not be relied on as an indication of trading intent on behalf of any Fidelity fund.
Annual Report
As a shareholder of a Fund, you incur two types of costs: (1) transaction costs, and (2) ongoing costs, including distribution and/or service (12b-1) fees and other Fund expenses. This Example is intended to help you understand your ongoing costs (in dollars) of investing in the Funds and to compare these costs with the ongoing costs of investing in other mutual funds.
The Example is based on an investment of $1,000 invested at the beginning of the period and held for the entire period (July 1, 2010 to December 31, 2010).
Actual Expenses
The first line of the accompanying table for each class of each fund provides information about actual account values and actual expenses. You may use the information in this line, together with the amount you invested, to estimate the expenses that you paid over the period. Simply divide your account value by $1,000.00 (for example, an $8,600 account value divided by $1,000.00 = 8.6), then multiply the result by the number in the first line for a class of the fund under the heading entitled "Expenses Paid During Period" to estimate the expenses you paid on your account during this period. The estimate of expenses does not include any fees or other expenses of any variable annuity or variable life insurance product. If they were, the estimate of expenses you paid during the period would be higher, and your ending account value would be lower. In addition, each Fund, as a shareholder in underlying Fidelity Funds, will indirectly bear its pro-rata share of the fees and expenses incurred by the underlying Fidelity Funds. These fees and expenses are not included in each Fund's annualized expense ratio used to calculate the expense estimates in the table below.
Hypothetical Example for Comparison Purposes
The second line of the accompanying table for each class of each fund provides information about hypothetical account values and hypothetical expenses based on a Class' actual expense ratio and an assumed rate of return of 5% per year before expenses, which is not the Class' actual return. The hypothetical account values and expenses may not be used to estimate the actual ending account balance or expenses you paid for the period. You may use this information to compare the ongoing costs of investing in the Fund and other funds. To do so, compare this 5% hypothetical example with the 5% hypothetical examples that appear in the shareholder reports of the other funds. The estimate of expenses does not include any fees or other expenses of any variable annuity or variable life insurance product. If they were, the estimate of expenses you paid during the period would be higher, and your ending account value would be lower. In addition, each Fund, as a shareholder in underlying Fidelity Funds, will indirectly bear its pro-rata share of the fees and expenses incurred by the underlying Fidelity Funds. These fees and expenses are not included in each Fund's annualized expense ratio used to calculate the expense estimates in the table below.
Please note that the expenses shown in the table are meant to highlight your ongoing costs only and do not reflect any transaction costs. Therefore, the second line of the table is useful in comparing ongoing costs only, and will not help you determine the relative total costs of owning different funds.
| Annualized
Expense
Ratio | Beginning
Account Value
July 1, 2010 | Ending
Account Value
December 31, 2010 | Expenses Paid
During Period*
July 1, 2010 to
December 31, 2010 |
VIP Freedom Income | | | | |
Initial Class | .00% | | | |
Actual | | $ 1,000.00 | $ 1,063.70 | $ .00 |
HypotheticalA | | $ 1,000.00 | $ 1,025.21 | $ .00 |
Service Class | .10% | | | |
Actual | | $ 1,000.00 | $ 1,063.40 | $ .52 |
HypotheticalA | | $ 1,000.00 | $ 1,024.70 | $ .51 |
Service Class 2 | .25% | | | |
Actual | | $ 1,000.00 | $ 1,062.40 | $ 1.30 |
HypotheticalA | | $ 1,000.00 | $ 1,023.95 | $ 1.28 |
VIP Freedom 2005 | | | | |
Initial Class | .00% | | | |
Actual | | $ 1,000.00 | $ 1,124.20 | $ .00 |
HypotheticalA | | $ 1,000.00 | $ 1,025.21 | $ .00 |
Service Class | .10% | | | |
Actual | | $ 1,000.00 | $ 1,124.40 | $ .54 |
HypotheticalA | | $ 1,000.00 | $ 1,024.70 | $ .51 |
Service Class 2 | .25% | | | |
Actual | | $ 1,000.00 | $ 1,122.60 | $ 1.34 |
HypotheticalA | | $ 1,000.00 | $ 1,023.95 | $ 1.28 |
| Annualized
Expense
Ratio | Beginning
Account Value
July 1, 2010 | Ending
Account Value
December 31, 2010 | Expenses Paid
During Period*
July 1, 2010 to
December 31, 2010 |
VIP Freedom 2010 | | | | |
Initial Class | .00% | | | |
Actual | | $ 1,000.00 | $ 1,143.60 | $ .00 |
HypotheticalA | | $ 1,000.00 | $ 1,025.21 | $ .00 |
Service Class | .10% | | | |
Actual | | $ 1,000.00 | $ 1,143.70 | $ .54 |
HypotheticalA | | $ 1,000.00 | $ 1,024.70 | $ .51 |
Service Class 2 | .25% | | | |
Actual | | $ 1,000.00 | $ 1,141.90 | $ 1.35 |
HypotheticalA | | $ 1,000.00 | $ 1,023.95 | $ 1.28 |
VIP Freedom 2015 | | | | |
Initial Class | .00% | | | |
Actual | | $ 1,000.00 | $ 1,147.90 | $ .00 |
HypotheticalA | | $ 1,000.00 | $ 1,025.21 | $ .00 |
Service Class | .10% | | | |
Actual | | $ 1,000.00 | $ 1,147.10 | $ .54 |
HypotheticalA | | $ 1,000.00 | $ 1,024.70 | $ .51 |
Service Class 2 | .25% | | | |
Actual | | $ 1,000.00 | $ 1,146.10 | $ 1.35 |
HypotheticalA | | $ 1,000.00 | $ 1,023.95 | $ 1.28 |
VIP Freedom 2020 | | | | |
Initial Class | .00% | | | |
Actual | | $ 1,000.00 | $ 1,175.80 | $ .00 |
HypotheticalA | | $ 1,000.00 | $ 1,025.21 | $ .00 |
Service Class | .10% | | | |
Actual | | $ 1,000.00 | $ 1,174.90 | $ .55 |
HypotheticalA | | $ 1,000.00 | $ 1,024.70 | $ .51 |
Service Class 2 | .25% | | | |
Actual | | $ 1,000.00 | $ 1,174.30 | $ 1.37 |
HypotheticalA | | $ 1,000.00 | $ 1,023.95 | $ 1.28 |
VIP Freedom 2025 | | | | |
Initial Class | .00% | | | |
Actual | | $ 1,000.00 | $ 1,198.50 | $ .00 |
HypotheticalA | | $ 1,000.00 | $ 1,025.21 | $ .00 |
Service Class | .10% | | | |
Actual | | $ 1,000.00 | $ 1,198.90 | $ .55 |
HypotheticalA | | $ 1,000.00 | $ 1,024.70 | $ .51 |
Service Class 2 | .25% | | | |
Actual | | $ 1,000.00 | $ 1,196.70 | $ 1.38 |
HypotheticalA | | $ 1,000.00 | $ 1,023.95 | $ 1.28 |
VIP Freedom 2030 | | | | |
Initial Class | .00% | | | |
Actual | | $ 1,000.00 | $ 1,212.60 | $ .00 |
HypotheticalA | | $ 1,000.00 | $ 1,025.21 | $ .00 |
Service Class | .10% | | | |
Actual | | $ 1,000.00 | $ 1,211.80 | $ .56 |
HypotheticalA | | $ 1,000.00 | $ 1,024.70 | $ .51 |
Service Class 2 | .25% | | | |
Actual | | $ 1,000.00 | $ 1,210.70 | $ 1.39 |
HypotheticalA | | $ 1,000.00 | $ 1,023.95 | $ 1.28 |
| Annualized
Expense
Ratio | Beginning
Account Value
July 1, 2010 | Ending
Account Value
December 31, 2010 | Expenses Paid
During Period*
July 1, 2010 to
December 31, 2010 |
VIP Freedom 2035 | | | | |
Initial Class | .00% | | | |
Actual | | $ 1,000.00 | $ 1,231.80 | $ .00 |
HypotheticalA | | $ 1,000.00 | $ 1,025.21 | $ .00 |
Service Class | .10% | | | |
Actual | | $ 1,000.00 | $ 1,231.30 | $ .56 |
HypotheticalA | | $ 1,000.00 | $ 1,024.70 | $ .51 |
Service Class 2 | .25% | | | |
Actual | | $ 1,000.00 | $ 1,230.00 | $ 1.41 |
HypotheticalA | | $ 1,000.00 | $ 1,023.95 | $ 1.28 |
VIP Freedom 2040 | | | | |
Initial Class | .00% | | | |
Actual | | $ 1,000.00 | $ 1,234.70 | $ .00 |
HypotheticalA | | $ 1,000.00 | $ 1,025.21 | $ .00 |
Service Class | .10% | | | |
Actual | | $ 1,000.00 | $ 1,234.20 | $ .56 |
HypotheticalA | | $ 1,000.00 | $ 1,024.70 | $ .51 |
Service Class 2 | .25% | | | |
Actual | | $ 1,000.00 | $ 1,233.70 | $ 1.41 |
HypotheticalA | | $ 1,000.00 | $ 1,023.95 | $ 1.28 |
VIP Freedom 2045 | | | | |
Initial Class | .00% | | | |
Actual | | $ 1,000.00 | $ 1,240.10 | $ .00 |
HypotheticalA | | $ 1,000.00 | $ 1,025.21 | $ .00 |
Service Class | .10% | | | |
Actual | | $ 1,000.00 | $ 1,239.70 | $ .56 |
HypotheticalA | | $ 1,000.00 | $ 1,024.70 | $ .51 |
Service Class 2 | .25% | | | |
Actual | | $ 1,000.00 | $ 1,238.90 | $ 1.41 |
HypotheticalA | | $ 1,000.00 | $ 1,023.95 | $ 1.28 |
VIP Freedom 2050 | | | | |
Initial Class | .00% | | | |
Actual | | $ 1,000.00 | $ 1,251.90 | $ .00 |
HypotheticalA | | $ 1,000.00 | $ 1,025.21 | $ .00 |
Service Class | .10% | | | |
Actual | | $ 1,000.00 | $ 1,251.40 | $ .57 |
HypotheticalA | | $ 1,000.00 | $ 1,024.70 | $ .51 |
Service Class 2 | .25% | | | |
Actual | | $ 1,000.00 | $ 1,249.90 | $ 1.42 |
HypotheticalA | | $ 1,000.00 | $ 1,023.95 | $ 1.28 |
A 5% return per year before expenses
* Expenses are equal to each Class' annualized expense ratio, multiplied by the average account value over the period, multiplied by 184/365 (to reflect the one-half year period). The fees and expenses of the underlying Fidelity Funds in which the Fund invests are not included in each Class' annualized expense ratio.
Annual Report
VIP Freedom Income Portfolio
Investment Changes (Unaudited)
Fund Holdings as of December 31, 2010 |
| % of fund's
net assets | % of fund's net assets
6 months ago |
Domestic Equity Funds | | |
VIP Contrafund Portfolio Initial Class | 2.5 | 2.6 |
VIP Equity-Income PortfolioSM Initial Class | 2.9 | 3.0 |
VIP Growth & Income Portfolio Initial Class | 2.9 | 3.0 |
VIP Growth Portfolio Initial Class | 2.9 | 3.0 |
VIP Mid Cap Portfolio Initial Class | 1.0 | 1.1 |
VIP Value Portfolio Initial Class | 2.5 | 2.6 |
VIP Value Strategies Portfolio Initial Class | 1.1 | 1.1 |
| 15.8 | 16.4 |
Developed International Equity Funds | | |
VIP Overseas Portfolio Initial Class | 4.6 | 3.2 |
Emerging Markets Equity Funds | | |
VIP Emerging Markets Portfolio Initial Class | 0.7 | 0.3 |
High Yield Bond Funds | | |
VIP High Income Portfolio Initial Class | 5.0 | 5.0 |
Investment Grade Bond Funds | | |
VIP Investment Grade Bond Portfolio Initial Class | 34.2 | 35.1 |
Short-Term Funds | | |
VIP Money Market Portfolio Initial Class | 39.6 | 40.1 |
Net Other Assets (Liabilities) | 0.1 | (0.1) |
| 100.0 | 100.0 |
Asset Allocation (% of fund's net assets) |
Current |
 | Domestic Equity Funds | 15.8% | |
 | Developed International Equity Funds | 4.6% | |
 | Emerging Markets Equity Funds | 0.7% | |
 | High Yield Bond Funds | 5.0% | |
 | Investment Grade Bond Funds | 34.2% | |
 | Short-Term Funds | 39.6% | |
 | Net Other Assets | 0.1% | |

Six months ago |
| Domestic Equity Funds | 16.4% | |
| Developed International Equity Funds | 3.2% | |
| Emerging Markets Equity Funds | 0.3% | |
| High Yield Bond Funds | 5.0% | |
| Investment Grade Bond Funds | 35.1% | |
| Short-Term Funds | 40.1% | |
| Net Other Assets † | (0.1)% | |

Expected |
| Domestic Equity Funds | 14.6% | |
| Developed International Equity Funds | 4.6% | |
| Emerging Markets Equity Funds | 0.8% | |
| High Yield Bond Funds | 5.0% | |
 | Investment Grade Bond Funds | 35.0% | |
| Short-Term Funds | 40.0% | |

The six months ago allocation is based on the fund's holdings as of June 30, 2010. The current allocation is based on the fund's holdings as of December 31, 2010. The expected allocation represents the fund's anticipated allocation at June 30, 2011. |
† Net Other Assets are not included in the pie chart. |
Annual Report
VIP Freedom Income Portfolio
Investments December 31, 2010
Showing Percentage of Net Assets
Domestic Equity Funds - 15.8% |
| Shares | | Value |
Domestic Equity Funds - 15.8% |
VIP Contrafund Portfolio Initial Class | 19,473 | | $ 465,018 |
VIP Equity-Income PortfolioSM Initial Class | 28,642 | | 544,763 |
VIP Growth & Income Portfolio Initial Class | 42,843 | | 541,102 |
VIP Growth Portfolio Initial Class | 14,667 | | 544,008 |
VIP Mid Cap Portfolio Initial Class | 5,766 | | 188,487 |
VIP Value Portfolio Initial Class | 42,325 | | 465,576 |
VIP Value Strategies Portfolio Initial Class | 20,280 | | 197,527 |
TOTAL DOMESTIC EQUITY FUNDS (Cost $3,245,166) | 2,946,481 |
International Equity Funds - 5.3% |
| | | |
Developed International Equity Funds - 4.6% |
VIP Overseas Portfolio Initial Class | 50,947 | | 854,389 |
Emerging Markets Equity Funds - 0.7% |
VIP Emerging Markets Portfolio Initial Class | 14,386 | | 142,569 |
TOTAL INTERNATIONAL EQUITY FUNDS (Cost $833,609) | 996,958 |
Bond Funds - 39.2% |
| Shares | | Value |
High Yield Bond Funds - 5.0% |
VIP High Income Portfolio Initial Class | 166,444 | | $ 927,091 |
Investment Grade Bond Funds - 34.2% |
VIP Investment Grade Bond Portfolio Initial Class | 497,524 | | 6,383,231 |
TOTAL BOND FUNDS (Cost $7,181,204) | 7,310,322 |
Short-Term Funds - 39.6% |
| | | |
VIP Money Market Portfolio Initial Class
(Cost $7,377,118) | 7,377,118 | | 7,377,118 |
TOTAL INVESTMENT PORTFOLIO - 99.9% (Cost $18,637,097) | | 18,630,879 |
NET OTHER ASSETS (LIABILITIES) - 0.1% | | 19,611 |
NET ASSETS - 100% | $ 18,650,490 |
Other Information |
All investments are categorized as Level 1 under the Fair Value Hierarchy. The inputs or methodology used for valuing securities may not be an indication of the risk associated with investing in those securities. For more information on valuation inputs, please refer to the Security Valuation section in the accompanying Notes to Financial Statements. |
See accompanying notes which are an integral part of the financial statements.
Annual Report
VIP Freedom Income Portfolio
Statement of Assets and Liabilities
| December 31, 2010 |
| | |
Assets | | |
Investment in securities, at value (cost $18,637,097) - See accompanying schedule | | $ 18,630,879 |
Cash | | 15,399 |
Receivable for investments sold | | 201 |
Receivable for fund shares sold | | 21,301 |
Total assets | | 18,667,780 |
| | |
Liabilities | | |
Payable for investments purchased | $ 15,426 | |
Payable for fund shares redeemed | 326 | |
Distribution and service plan fees payable | 1,538 | |
Total liabilities | | 17,290 |
| | |
Net Assets | | $ 18,650,490 |
Net Assets consist of: | | |
Paid in capital | | $ 18,757,963 |
Accumulated undistributed net realized gain (loss) on investments | | (101,255) |
Net unrealized appreciation (depreciation) on investments | | (6,218) |
Net Assets | | $ 18,650,490 |
Statement of Assets and Liabilities - continued
| December 31, 2010 |
| | |
Initial Class:
Net Asset Value, offering price and redemption price per share ($11,165,323 ÷ 1,087,074 shares) | | $ 10.27 |
| | |
Service Class:
Net Asset Value, offering price and redemption price per share ($172,202 ÷ 16,748 shares) | | $ 10.28 |
| | |
Service Class 2:
Net Asset Value, offering price and redemption price per share ($7,312,965 ÷ 714,195 shares) | | $ 10.24 |
See accompanying notes which are an integral part of the financial statements.
Annual Report
Statement of Operations
| Year ended December 31, 2010 |
| | |
Investment Income | | |
Income distributions from underlying funds | | $ 341,677 |
| | |
Expenses | | |
Distribution and service plan fees | $ 17,429 | |
Independent trustees' compensation | 65 | |
Total expenses before reductions | 17,494 | |
Expense reductions | (65) | 17,429 |
Net investment income (loss) | | 324,248 |
Realized and Unrealized Gain (Loss) Realized gain (loss) on sale of underlying fund shares | 376,710 | |
Capital gain distributions from underlying funds | 76,978 | |
Total net realized gain (loss) | | 453,688 |
Change in net unrealized appreciation (depreciation) on underlying funds | | 547,661 |
Net gain (loss) | | 1,001,349 |
Net increase (decrease) in net assets resulting from operations | | $ 1,325,597 |
Statement of Changes in Net Assets
| Year ended December 31, 2010 | Year ended December 31, 2009 |
Increase (Decrease) in Net Assets | | |
Operations | | |
Net investment income (loss) | $ 324,248 | $ 643,136 |
Net realized gain (loss) | 453,688 | 204,551 |
Change in net unrealized appreciation (depreciation) | 547,661 | 1,442,211 |
Net increase (decrease) in net assets resulting from operations | 1,325,597 | 2,289,898 |
Distributions to shareholders from net investment income | (329,236) | (651,988) |
Distributions to shareholders from net realized gain | (476,604) | (251,371) |
Total distributions | (805,840) | (903,359) |
Share transactions - net increase (decrease) | (1,464,915) | 4,138,154 |
Total increase (decrease) in net assets | (945,158) | 5,524,693 |
| | |
Net Assets | | |
Beginning of period | 19,595,648 | 14,070,955 |
End of period | $ 18,650,490 | $ 19,595,648 |
See accompanying notes which are an integral part of the financial statements.
Annual Report
Financial Highlights - Initial Class
Years ended December 31, | 2010 | 2009 | 2008 | 2007 | 2006 |
Selected Per-Share Data | | | | | |
Net asset value, beginning of period | $ 10.00 | $ 9.14 | $ 10.80 | $ 10.71 | $ 10.36 |
Income from Investment Operations | | | | | |
Net investment income (loss) C | .19 | .39 | .36 | .43 | .40 |
Net realized and unrealized gain (loss) | .56 | .96 | (1.48) | .22 | .32 |
Total from investment operations | .75 | 1.35 | (1.12) | .65 | .72 |
Distributions from net investment income | (.20) | (.35) | (.37) | (.44) | (.32) |
Distributions from net realized gain | (.28) | (.15) | (.17) | (.12) | (.05) |
Total distributions | (.48) | (.49) F | (.54) | (.56) | (.37) |
Net asset value, end of period | $ 10.27 | $ 10.00 | $ 9.14 | $ 10.80 | $ 10.71 |
Total Return A,B | 7.49% | 14.95% | (10.45)% | 6.10% | 6.94% |
Ratios to Average Net Assets D,E | | | | | |
Expenses before reductions | .00% | .00% | .00% | .00% | .00% |
Expenses net of fee waivers, if any | .00% | .00% | .00% | .00% | .00% |
Expenses net of all reductions | .00% | .00% | .00% | .00% | .00% |
Net investment income (loss) | 1.88% | 4.00% | 3.50% | 3.93% | 3.75% |
Supplemental Data | | | | | |
Net assets, end of period (000 omitted) | $ 11,165 | $ 12,679 | $ 8,976 | $ 10,035 | $ 9,398 |
Portfolio turnover rate | 41% | 32% | 55% | 56% | 44% |
A Total returns do not reflect charges attributable to your insurance company's separate account. Inclusion of these charges would reduce the total returns shown.
B Total returns would have been lower had certain expenses not been reduced during the periods shown.
C Calculated based on average shares outstanding during the period.
D Amounts do not include the activity of the underlying funds.
E Expense ratios reflect operating expenses of the class. Expenses before reductions do not reflect amounts reimbursed by the investment adviser or reductions from expense offset arrangements and do not represent the amount paid by the class during periods when reimbursements or reductions occur. Expenses net of fee waivers reflect expenses after reimbursement by the investment adviser but prior to reductions from expense offset arrangements. Expenses net of all reductions represent the net expenses paid by the class but do not include expenses of the investment companies in which the Fund invests.
F Total distributions of $.49 per share is comprised of distributions from net investment income of $.347 and distributions from net realized gain of $.146 per share.
Financial Highlights - Service Class
Years ended December 31, | 2010 | 2009 | 2008 | 2007 | 2006 |
Selected Per-Share Data | | | | | |
Net asset value, beginning of period | $ 10.00 | $ 9.14 | $ 10.81 | $ 10.71 | $ 10.36 |
Income from Investment Operations | | | | | |
Net investment income (loss) C | .18 | .37 | .35 | .42 | .39 |
Net realized and unrealized gain (loss) | .56 | .97 | (1.50) | .23 | .32 |
Total from investment operations | .74 | 1.34 | (1.15) | .65 | .71 |
Distributions from net investment income | (.19) | (.33) | (.35) | (.43) | (.31) |
Distributions from net realized gain | (.28) | (.15) | (.17) | (.12) | (.05) |
Total distributions | (.46) G | (.48) F | (.52) | (.55) | (.36) |
Net asset value, end of period | $ 10.28 | $ 10.00 | $ 9.14 | $ 10.81 | $ 10.71 |
Total Return A,B | 7.46% | 14.81% | (10.65)% | 6.10% | 6.83% |
Ratios to Average Net Assets D,E | | | | | |
Expenses before reductions | .10% | .10% | .10% | .10% | .10% |
Expenses net of fee waivers, if any | .10% | .10% | .10% | .10% | .10% |
Expenses net of all reductions | .10% | .10% | .10% | .10% | .10% |
Net investment income (loss) | 1.78% | 3.90% | 3.40% | 3.83% | 3.65% |
Supplemental Data | | | | | |
Net assets, end of period (000 omitted) | $ 172 | $ 163 | $ 258 | $ 414 | $ 391 |
Portfolio turnover rate | 41% | 32% | 55% | 56% | 44% |
A Total returns do not reflect charges attributable to your insurance company's separate account. Inclusion of these charges would reduce the total returns shown.
B Total returns would have been lower had certain expenses not been reduced during the periods shown.
C Calculated based on average shares outstanding during the period.
D Amounts do not include the activity of the underlying funds.
E Expense ratios reflect operating expenses of the class. Expenses before reductions do not reflect amounts reimbursed by the investment adviser or reductions from expense offset arrangements and do not represent the amount paid by the class during periods when reimbursements or reductions occur. Expenses net of fee waivers reflect expenses after reimbursement by the investment adviser but prior to reductions from expense offset arrangements. Expenses net of all reductions represent the net expenses paid by the class but do not include expenses of the investment companies in which the Fund invests.
F Total distributions of $.48 per share is comprised of distributions from net investment income of $.334 and distributions from net realized gain of $.146 per share.
G Total distributions of $.46 per share is comprised of distributions from net investment income of $.189 and distributions from net realized gain of $.275 per share.
See accompanying notes which are an integral part of the financial statements.
Annual Report
Financial Highlights - Service Class 2
Years ended December 31, | 2010 | 2009 | 2008 | 2007 | 2006 |
Selected Per-Share Data | | | | | |
Net asset value, beginning of period | $ 9.97 | $ 9.12 | $ 10.78 | $ 10.69 | $ 10.36 |
Income from Investment Operations | | | | | |
Net investment income (loss) C | .17 | .36 | .33 | .40 | .37 |
Net realized and unrealized gain (loss) | .55 | .96 | (1.48) | .23 | .32 |
Total from investment operations | .72 | 1.32 | (1.15) | .63 | .69 |
Distributions from net investment income | (.18) | (.33) | (.34) | (.42) | (.31) |
Distributions from net realized gain | (.28) | (.15) | (.17) | (.12) | (.05) |
Total distributions | (.45) G | (.47) F | (.51) | (.54) | (.36) |
Net asset value, end of period | $ 10.24 | $ 9.97 | $ 9.12 | $ 10.78 | $ 10.69 |
Total Return A,B | 7.25% | 14.64% | (10.70)% | 5.92% | 6.61% |
Ratios to Average Net Assets D,E | | | | | |
Expenses before reductions | .25% | .25% | .25% | .25% | .25% |
Expenses net of fee waivers, if any | .25% | .25% | .25% | .25% | .25% |
Expenses net of all reductions | .25% | .25% | .25% | .25% | .25% |
Net investment income (loss) | 1.63% | 3.76% | 3.25% | 3.68% | 3.50% |
Supplemental Data | | | | | |
Net assets, end of period (000 omitted) | $ 7,313 | $ 6,753 | $ 4,836 | $ 3,589 | $ 1,061 |
Portfolio turnover rate | 41% | 32% | 55% | 56% | 44% |
A Total returns do not reflect charges attributable to your insurance company's separate account. Inclusion of these charges would reduce the total returns shown.
B Total returns would have been lower had certain expenses not been reduced during the periods shown.
C Calculated based on average shares outstanding during the period.
D Amounts do not include the activity of the underlying funds.
E Expense ratios reflect operating expenses of the class. Expenses before reductions do not reflect amounts reimbursed by the investment adviser or reductions from expense offset arrangements and do not represent the amount paid by the class during periods when reimbursements or reductions occur. Expenses net of fee waivers reflect expenses after reimbursement by the investment adviser but prior to reductions from expense offset arrangements. Expenses net of all reductions represent the net expenses paid by the class but do not include expenses of the investment companies in which the Fund invests.
F Total distributions of $.47 per share is comprised of distributions from net investment income of $.326 and distributions from net realized gain of $.146 per share.
G Total distributions of $.45 per share is comprised of distributions from net investment income of $.176 and distributions from net realized gain of $.275 per share.
See accompanying notes which are an integral part of the financial statements.
Annual Report
VIP Freedom 2005 Portfolio
Investment Changes (Unaudited)
Fund Holdings as of December 31, 2010 |
| % of fund's
net assets | % of fund's net assets
6 months ago |
Domestic Equity Funds | | |
VIP Contrafund Portfolio Initial Class | 5.2 | 5.3 |
VIP Equity-Income Portfolio Initial Class | 6.1 | 6.2 |
VIP Growth & Income Portfolio Initial Class | 6.0 | 6.1 |
VIP Growth Portfolio Initial Class | 6.1 | 6.2 |
VIP Mid Cap Portfolio Initial Class | 2.1 | 2.2 |
VIP Value Portfolio Initial Class | 5.2 | 5.3 |
VIP Value Strategies Portfolio Initial Class | 2.2 | 2.2 |
| 32.9 | 33.5 |
Developed International Equity Funds | | |
VIP Overseas Portfolio Initial Class | 9.7 | 9.0 |
Emerging Markets Equity Funds | | |
VIP Emerging Markets Portfolio Initial Class | 1.6 | 0.8 |
High Yield Bond Funds | | |
VIP High Income Portfolio Initial Class | 4.9 | 5.0 |
Investment Grade Bond Funds | | |
VIP Investment Grade Bond Portfolio Initial Class | 30.2 | 31.9 |
Short-Term Funds | | |
VIP Money Market Portfolio Initial Class | 20.7 | 19.8 |
Net Other Assets (Liabilities)* | 0.0 | 0.0 |
| 100.0 | 100.0 |
* Amount represents less than 0.1%. |
Asset Allocation (% of fund's net assets) |
Current |
| Domestic Equity Funds | 32.9% | |
| Developed International Equity Funds | 9.7% | |
| Emerging Markets Equity Funds | 1.6% | |
| High Yield Bond Funds | 4.9% | |
| Investment Grade Bond Funds | 30.2% | |
| Short-Term Funds | 20.7% | |

Six months ago |
| Domestic Equity Funds | 33.5% | |
| Developed International Equity Funds | 9.0% | |
| Emerging Markets Equity Funds | 0.8% | |
| High Yield Bond Funds | 5.0% | |
| Investment Grade Bond Funds | 31.9% | |
| Short-Term Funds | 19.8% | |

Expected |
| Domestic Equity Funds | 29.7% | |
| Developed International Equity Funds | 9.2% | |
| Emerging Markets Equity Funds | 1.6% | |
| High Yield Bond Funds | 5.0% | |
| Investment Grade Bond Funds | 30.6% | |
| Short-Term Funds | 23.9% | |

The fund invests according to an asset allocation strategy that becomes increasingly conservative over time. The six months ago allocation is based on the fund's holdings as of June 30, 2010. The current allocation is based on the fund's holdings as of December 31, 2010. The expected allocation represents the fund's anticipated allocation at June 30, 2011. |
Annual Report
VIP Freedom 2005 Portfolio
Investments December 31, 2010
Showing Percentage of Net Assets
Domestic Equity Funds - 32.9% |
| Shares | | Value |
Domestic Equity Funds - 32.9% |
VIP Contrafund Portfolio Initial Class | 13,193 | | $ 315,038 |
VIP Equity-Income Portfolio Initial Class | 19,392 | | 368,841 |
VIP Growth & Income Portfolio Initial Class | 29,058 | | 367,005 |
VIP Growth Portfolio Initial Class | 9,912 | | 367,654 |
VIP Mid Cap Portfolio Initial Class | 3,887 | | 127,069 |
VIP Value Portfolio Initial Class | 28,737 | | 316,102 |
VIP Value Strategies Portfolio Initial Class | 13,749 | | 133,917 |
TOTAL DOMESTIC EQUITY FUNDS (Cost $2,267,603) | 1,995,626 |
International Equity Funds - 11.3% |
| | | |
Developed International Equity Funds - 9.7% |
VIP Overseas Portfolio Initial Class | 34,969 | | 586,432 |
Emerging Markets Equity Funds - 1.6% |
VIP Emerging Markets Portfolio Initial Class | 9,902 | | 98,129 |
TOTAL INTERNATIONAL EQUITY FUNDS (Cost $758,021) | 684,561 |
Bond Funds - 35.1% |
| Shares | | Value |
High Yield Bond Funds - 4.9% |
VIP High Income Portfolio Initial Class | 53,354 | | $ 297,181 |
Investment Grade Bond Funds - 30.2% |
VIP Investment Grade Bond Portfolio Initial Class | 142,714 | | 1,831,015 |
TOTAL BOND FUNDS (Cost $2,104,080) | 2,128,196 |
Short-Term Funds - 20.7% |
| | | |
VIP Money Market Portfolio Initial Class
(Cost $1,259,745) | 1,259,745 | | 1,259,745 |
TOTAL INVESTMENT PORTFOLIO - 100.0% (Cost $6,389,449) | | 6,068,128 |
NET OTHER ASSETS (LIABILITIES) - 0.0% | | (42) |
NET ASSETS - 100% | $ 6,068,086 |
Other Information |
All investments are categorized as Level 1 under the Fair Value Hierarchy. The inputs or methodology used for valuing securities may not be an indication of the risk associated with investing in those securities. For more information on valuation inputs, please refer to the Security Valuation section in the accompanying Notes to Financial Statements. |
Income Tax Information |
At December 31, 2010, the Fund had a capital loss carryforward of approximately $86,373 all of which will expire in fiscal 2018. Capital loss carryforwards are only available to offset future capital gains of the Fund to the extent provided by regulations and may be limited. |
See accompanying notes which are an integral part of the financial statements.
Annual Report
VIP Freedom 2005 Portfolio
Statement of Assets and Liabilities
| December 31, 2010 |
| | |
Assets | | |
Investment in securities, at value (cost $6,389,449) - See accompanying schedule | | $ 6,068,128 |
Receivable for investments sold | | 131 |
Total assets | | 6,068,259 |
| | |
Liabilities | | |
Payable for fund shares redeemed | $ 126 | |
Distribution and service plan fees payable | 47 | |
Total liabilities | | 173 |
| | |
Net Assets | | $ 6,068,086 |
Net Assets consist of: | | |
Paid in capital | | $ 6,599,127 |
Accumulated undistributed net realized gain (loss) on investments | | (209,720) |
Net unrealized appreciation (depreciation) on investments | | (321,321) |
Net Assets | | $ 6,068,086 |
Statement of Assets and Liabilities - continued
| December 31, 2010 |
| | |
Initial Class:
Net Asset Value, offering price and redemption price per share ($5,732,949 ÷ 569,223 shares) | | $ 10.07 |
| | |
Service Class:
Net Asset Value, offering price and redemption price per share ($178,586 ÷ 17,724 shares) | | $ 10.08 |
| | |
Service Class 2:
Net Asset Value, offering price and redemption price per share ($156,551 ÷ 15,524 shares) | | $ 10.08 |
See accompanying notes which are an integral part of the financial statements.
Annual Report
Statement of Operations
| Year ended December 31, 2010 |
| | |
Investment Income | | |
Income distributions from underlying funds | | $ 118,397 |
| | |
Expenses | | |
Distribution and service plan fees | $ 529 | |
Independent trustees' compensation | 23 | |
Total expenses before reductions | 552 | |
Expense reductions | (23) | 529 |
Net investment income (loss) | | 117,868 |
Realized and Unrealized Gain (Loss) Realized gain (loss) on sale of underlying fund shares | (78,773) | |
Capital gain distributions from underlying funds | 24,364 | |
Total net realized gain (loss) | | (54,409) |
Change in net unrealized appreciation (depreciation) on underlying funds | | 602,863 |
Net gain (loss) | | 548,454 |
Net increase (decrease) in net assets resulting from operations | | $ 666,322 |
Statement of Changes in Net Assets
| Year ended
December 31, 2010 | Year ended December 31, 2009 |
Increase (Decrease) in Net Assets | | |
Operations | | |
Net investment income (loss) | $ 117,868 | $ 259,416 |
Net realized gain (loss) | (54,409) | 156,333 |
Change in net unrealized appreciation (depreciation) | 602,863 | 944,768 |
Net increase (decrease) in net assets resulting from operations | 666,322 | 1,360,517 |
Distributions to shareholders from net investment income | (118,355) | (259,101) |
Distributions to shareholders from net realized gain | (79,802) | (199,216) |
Total distributions | (198,157) | (458,317) |
Share transactions - net increase (decrease) | (1,588,370) | (227,175) |
Total increase (decrease) in net assets | (1,120,205) | 675,025 |
| | |
Net Assets | | |
Beginning of period | 7,188,291 | 6,513,266 |
End of period (including undistributed net investment income of $0 and undistributed net investment income
of $723, respectively) | $ 6,068,086 | $ 7,188,291 |
See accompanying notes which are an integral part of the financial statements.
Annual Report
Financial Highlights - Initial Class
Years ended December 31, | 2010 | 2009 | 2008 | 2007 | 2006 |
Selected Per-Share Data | | | | | |
Net asset value, beginning of period | $ 9.34 | $ 8.14 | $ 11.59 | $ 11.41 | $ 10.74 |
Income from Investment Operations | | | | | |
Net investment income (loss) C | .18 | .34 | .34 | .38 | .31 |
Net realized and unrealized gain (loss) | .87 | 1.48 | (3.06) | .60 | .72 |
Total from investment operations | 1.05 | 1.82 | (2.72) | .98 | 1.03 |
Distributions from net investment income | (.20) | (.35) | (.34) | (.34) | (.31) |
Distributions from net realized gain | (.12) | (.26) | (.39) | (.47) | (.05) |
Total distributions | (.32) | (.62) G | (.73) | (.80) F | (.36) |
Net asset value, end of period | $ 10.07 | $ 9.34 | $ 8.14 | $ 11.59 | $ 11.41 |
Total Return A,B | 11.34% | 23.02% | (23.83)% | 8.65% | 9.59% |
Ratios to Average Net Assets D,E | | | | | |
Expenses before reductions | .00% | .00% | .00% | .00% | .00% |
Expenses net of fee waivers, if any | .00% | .00% | .00% | .00% | .00% |
Expenses net of all reductions | .00% | .00% | .00% | .00% | .00% |
Net investment income (loss) | 1.90% | 3.95% | 3.29% | 3.20% | 2.82% |
Supplemental Data | | | | | |
Net assets, end of period (000 omitted) | $ 5,733 | $ 6,833 | $ 5,993 | $ 9,203 | $ 7,871 |
Portfolio turnover rate | 42% | 50% | 51% | 51% | 56% |
A Total returns do not reflect charges attributable to your insurance company's separate account. Inclusion of these charges would reduce the total returns shown.
B Total returns would have been lower had certain expenses not been reduced during the periods shown.
C Calculated based on average shares outstanding during the period.
D Amounts do not include the activity of the underlying funds.
E Expense ratios reflect operating expenses of the class. Expenses before reductions do not reflect amounts reimbursed by the investment adviser or reductions from expense offset arrangements and do not represent the amount paid by the class during periods when reimbursements or reductions occur. Expenses net of fee waivers reflect expenses after reimbursement by the investment adviser but prior to reductions from expense offset arrangements. Expenses net of all reductions represent the net expenses paid by the class but do not include expenses of the investment companies in which the Fund invests.
F Total distributions of $.80 per share is comprised of distributions from net investment income of $.335 and distributions from net realized gain of $.465 per share.
G Total distributions of $.62 per share is comprised of distributions from net investment income of $.353 and distributions from net realized gain of $.262 per share.
Financial Highlights - Service Class
Years ended December 31, | 2010 | 2009 | 2008 | 2007 | 2006 |
Selected Per-Share Data | | | | | |
Net asset value, beginning of period | $ 9.35 | $ 8.14 | $ 11.59 | $ 11.41 | $ 10.74 |
Income from Investment Operations | | | | | |
Net investment income (loss) C | .17 | .33 | .33 | .37 | .30 |
Net realized and unrealized gain (loss) | .87 | 1.48 | (3.06) | .60 | .72 |
Total from investment operations | 1.04 | 1.81 | (2.73) | .97 | 1.02 |
Distributions from net investment income | (.19) | (.34) | (.33) | (.32) | (.30) |
Distributions from net realized gain | (.12) | (.26) | (.39) | (.47) | (.05) |
Total distributions | (.31) | (.60) G | (.72) | (.79) F | (.35) |
Net asset value, end of period | $ 10.08 | $ 9.35 | $ 8.14 | $ 11.59 | $ 11.41 |
Total Return A,B | 11.24% | 23.00% | (23.95)% | 8.55% | 9.48% |
Ratios to Average Net Assets D,E | | | | | |
Expenses before reductions | .10% | .10% | .10% | .10% | .10% |
Expenses net of fee waivers, if any | .10% | .10% | .10% | .10% | .10% |
Expenses net of all reductions | .10% | .10% | .10% | .10% | .10% |
Net investment income (loss) | 1.80% | 3.85% | 3.19% | 3.10% | 2.72% |
Supplemental Data | | | | | |
Net assets, end of period (000 omitted) | $ 179 | $ 172 | $ 250 | $ 449 | $ 414 |
Portfolio turnover rate | 42% | 50% | 51% | 51% | 56% |
A Total returns do not reflect charges attributable to your insurance company's separate account. Inclusion of these charges would reduce the total returns shown.
B Total returns would have been lower had certain expenses not been reduced during the periods shown.
C Calculated based on average shares outstanding during the period.
D Amounts do not include the activity of the underlying funds.
E Expense ratios reflect operating expenses of the class. Expenses before reductions do not reflect amounts reimbursed by the investment adviser or reductions from expense offset arrangements and do not represent the amount paid by the class during periods when reimbursements or reductions occur. Expenses net of fee waivers reflect expenses after reimbursement by the investment adviser but prior to reductions from expense offset arrangements. Expenses net of all reductions represent the net expenses paid by the class but do not include expenses of the investment companies in which the Fund invests.
F Total distributions of $.79 per share is comprised of distributions from net investment income of $.323 and distributions from net realized gain of $.465 per share.
G Total distributions of $.60 per share is comprised of distributions from net investment income of $.341 and distributions from net realized gain of $.262 per share.
See accompanying notes which are an integral part of the financial statements.
Annual Report
Financial Highlights - Service Class 2
Years ended December 31, | 2010 | 2009 | 2008 | 2007 | 2006 |
Selected Per-Share Data | | | | | |
Net asset value, beginning of period | $ 9.35 | $ 8.14 | $ 11.59 | $ 11.41 | $ 10.74 |
Income from Investment Operations | | | | | |
Net investment income (loss) C | .16 | .32 | .31 | .35 | .29 |
Net realized and unrealized gain (loss) | .86 | 1.48 | (3.06) | .60 | .71 |
Total from investment operations | 1.02 | 1.80 | (2.75) | .95 | 1.00 |
Distributions from net investment income | (.18) | (.32) | (.31) | (.31) | (.28) |
Distributions from net realized gain | (.12) | (.26) | (.39) | (.47) | (.05) |
Total distributions | (.29) H | (.59) G | (.70) | (.77) F | (.33) |
Net asset value, end of period | $ 10.08 | $ 9.35 | $ 8.14 | $ 11.59 | $ 11.41 |
Total Return A,B | 11.06% | 22.78% | (24.12)% | 8.40% | 9.34% |
Ratios to Average Net Assets D,E | | | | | |
Expenses before reductions | .25% | .25% | .25% | .25% | .25% |
Expenses net of fee waivers, if any | .25% | .25% | .25% | .25% | .25% |
Expenses net of all reductions | .25% | .25% | .25% | .25% | .25% |
Net investment income (loss) | 1.65% | 3.70% | 3.04% | 2.95% | 2.57% |
Supplemental Data | | | | | |
Net assets, end of period (000 omitted) | $ 157 | $ 183 | $ 271 | $ 456 | $ 413 |
Portfolio turnover rate | 42% | 50% | 51% | 51% | 56% |
A Total returns do not reflect charges attributable to your insurance company's separate account. Inclusion of these charges would reduce the total returns shown.
B Total returns would have been lower had certain expenses not been reduced during the periods shown.
C Calculated based on average shares outstanding during the period.
D Amounts do not include the activity of the underlying funds.
E Expense ratios reflect operating expenses of the class. Expenses before reductions do not reflect amounts reimbursed by the investment adviser or reductions from expense offset arrangements and do not represent the amount paid by the class during periods when reimbursements or reductions occur. Expenses net of fee waivers reflect expenses after reimbursement by the investment adviser but prior to reductions from expense offset arrangements. Expenses net of all reductions represent the net expenses paid by the class but do not include expenses of the investment companies in which the Fund invests.
F Total distributions of $.77 per share is comprised of distributions from net investment income of $.306 and distributions from net realized gain of $.465 per share.
G Total distributions of $.59 per share is comprised of distributions from net investment income of $.324 and distributions from net realized gain of $.262 per share.
H Total distributions of $.29 per share is comprised of distributions from net investment income of $.177 and distributions from net realized gain of $.117 per share.
See accompanying notes which are an integral part of the financial statements.
Annual Report
VIP Freedom 2010 Portfolio
Investment Changes (Unaudited)
Fund Holdings as of December 31, 2010 |
| % of fund's
net assets | % of fund's net assets
6 months ago |
Domestic Equity Funds | | |
VIP Contrafund Portfolio Initial Class | 6.0 | 5.9 |
VIP Equity-Income Portfolio Initial Class | 7.1 | 6.9 |
VIP Growth & Income Portfolio Initial Class | 7.0 | 6.9 |
VIP Growth Portfolio Initial Class | 7.0 | 6.9 |
VIP Mid Cap Portfolio Initial Class | 2.4 | 2.5 |
VIP Value Portfolio Initial Class | 6.1 | 5.9 |
VIP Value Strategies Portfolio Initial Class | 2.6 | 2.5 |
| 38.2 | 37.5 |
Developed International Equity Funds | | |
VIP Overseas Portfolio Initial Class | 11.3 | 11.0 |
Emerging Markets Equity Funds | | |
VIP Emerging Markets Portfolio Initial Class | 1.9 | 1.0 |
High Yield Bond Funds | | |
VIP High Income Portfolio Initial Class | 4.9 | 5.0 |
Investment Grade Bond Funds | | |
VIP Investment Grade Bond Portfolio Initial Class | 33.5 | 35.1 |
Short-Term Funds | | |
VIP Money Market Portfolio Initial Class | 10.2 | 10.4 |
Net Other Assets (Liabilities)* | 0.0 | 0.0 |
| 100.0 | 100.0 |
* Amount represents less than 0.1%. |
Asset Allocation (% of fund's net assets) |
Current |
| Domestic Equity Funds | 38.2% | |
| Developed International Equity Funds | 11.3% | |
| Emerging Markets Equity Funds | 1.9% | |
| High Yield Bond Funds | 4.9% | |
| Investment Grade Bond Funds | 33.5% | |
| Short-Term Funds | 10.2% | |

Six months ago |
| Domestic Equity Funds | 37.5% | |
| Developed International Equity Funds | 11.0% | |
| Emerging Markets Equity Funds | 1.0% | |
| High Yield Bond Funds | 5.0% | |
| Investment Grade Bond Funds | 35.1% | |
| Short-Term Funds | 10.4% | |

Expected |
| Domestic Equity Funds | 36.2% | |
| Developed International Equity Funds | 11.2% | |
| Emerging Markets Equity Funds | 2.0% | |
| High Yield Bond Funds | 5.0% | |
| Investment Grade Bond Funds | 34.8% | |
| Short-Term Funds | 10.8% | |

The fund invests according to an asset allocation strategy that becomes increasingly conservative over time. The six months ago allocation is based on the fund's holdings as of June 30, 2010. The current allocation is based on the fund's holdings as of December 31, 2010. The expected allocation represents the fund's anticipated allocation at June 30, 2011. |
Annual Report
VIP Freedom 2010 Portfolio
Investments December 31, 2010
Showing Percentage of Net Assets
Domestic Equity Funds - 38.2% |
| Shares | | Value |
Domestic Equity Funds - 38.2% |
VIP Contrafund Portfolio Initial Class | 403,715 | | $ 9,640,703 |
VIP Equity-Income Portfolio Initial Class | 593,301 | | 11,284,584 |
VIP Growth & Income Portfolio Initial Class | 889,229 | | 11,230,958 |
VIP Growth Portfolio Initial Class | 303,487 | | 11,256,318 |
VIP Mid Cap Portfolio Initial Class | 119,196 | | 3,896,533 |
VIP Value Portfolio Initial Class | 879,058 | | 9,669,641 |
VIP Value Strategies Portfolio Initial Class | 419,321 | | 4,084,186 |
TOTAL DOMESTIC EQUITY FUNDS (Cost $65,563,835) | 61,062,923 |
International Equity Funds - 13.2% |
| | | |
Developed International Equity Funds - 11.3% |
VIP Overseas Portfolio Initial Class | 1,080,567 | | 18,121,112 |
Emerging Markets Equity Funds - 1.9% |
VIP Emerging Markets Portfolio Initial Class | 305,124 | | 3,023,778 |
TOTAL INTERNATIONAL EQUITY FUNDS (Cost $22,424,343) | 21,144,890 |
Bond Funds - 38.4% |
| Shares | | Value |
High Yield Bond Funds - 4.9% |
VIP High Income Portfolio Initial Class | 1,399,239 | | $ 7,793,759 |
Investment Grade Bond Funds - 33.5% |
VIP Investment Grade Bond Portfolio Initial Class | 4,168,840 | | 53,486,221 |
TOTAL BOND FUNDS (Cost $60,997,484) | 61,279,980 |
Short-Term Funds - 10.2% |
| | | |
VIP Money Market Portfolio Initial Class
(Cost $16,336,688) | 16,336,688 | | 16,336,688 |
TOTAL INVESTMENT PORTFOLIO - 100.0% (Cost $165,322,350) | | 159,824,481 |
NET OTHER ASSETS (LIABILITIES) - 0.0% | | (26,233) |
NET ASSETS - 100% | $ 159,798,248 |
Other Information |
All investments are categorized as Level 1 under the Fair Value Hierarchy. The inputs or methodology used for valuing securities may not be an indication of the risk associated with investing in those securities. For more information on valuation inputs, please refer to the Security Valuation section in the accompanying Notes to Financial Statements. |
See accompanying notes which are an integral part of the financial statements.
Annual Report
VIP Freedom 2010 Portfolio
Statement of Assets and Liabilities
| December 31, 2010 |
| | |
Assets | | |
Investment in securities, at value (cost $165,322,350) - See accompanying schedule | | $ 159,824,481 |
Receivable for investments sold | | 270,291 |
Receivable for fund shares sold | | 977 |
Total assets | | 160,095,749 |
| | |
Liabilities | | |
Payable to custodian bank | $ 92,697 | |
Payable for fund shares redeemed | 178,973 | |
Distribution and service plan fees payable | 25,831 | |
Total liabilities | | 297,501 |
| | |
Net Assets | | $ 159,798,248 |
Net Assets consist of: | | |
Paid in capital | | $ 166,143,857 |
Undistributed net investment income | | 7,845 |
Accumulated undistributed net realized gain (loss) on investments | | (855,585) |
Net unrealized appreciation (depreciation) on investments | | (5,497,869) |
Net Assets | | $ 159,798,248 |
Statement of Assets and Liabilities - continued
| December 31, 2010 |
| | |
Initial Class:
Net Asset Value, offering price and redemption price per share ($22,572,758 ÷ 2,128,269 shares) | | $ 10.61 |
| | |
Service Class:
Net Asset Value, offering price and redemption price per share ($19,259,145 ÷ 1,817,294 shares) | | $ 10.60 |
| | |
Service Class 2:
Net Asset Value, offering price and redemption price per share ($117,966,345 ÷ 11,170,139 shares) | | $ 10.56 |
See accompanying notes which are an integral part of the financial statements.
Annual Report
VIP Freedom 2010 Portfolio
Financial Statements - continued
Statement of Operations
| Year ended December 31, 2010 |
| | |
Investment Income | | |
Income distributions from underlying funds | | $ 3,290,005 |
Interest | | 5 |
Total income | | 3,290,010 |
| | |
Expenses | | |
Distribution and service plan fees | $ 262,524 | |
Independent trustees' compensation | 483 | |
Total expenses before reductions | 263,007 | |
Expense reductions | (483) | 262,524 |
Net investment income (loss) | | 3,027,486 |
Realized and Unrealized Gain (Loss) Realized gain (loss) on sale of underlying fund shares | 1,415,397 | |
Capital gain distributions from underlying funds | 679,031 | |
Total net realized gain (loss) | | 2,094,428 |
Change in net unrealized appreciation (depreciation) on underlying funds | | 11,980,452 |
Net gain (loss) | | 14,074,880 |
Net increase (decrease) in net assets resulting from operations | | $ 17,102,366 |
Statement of Changes in Net Assets
| Year ended December 31, 2010 | Year ended December 31, 2009 |
Increase (Decrease) in Net Assets | | |
Operations | | |
Net investment income (loss) | $ 3,027,486 | $ 4,477,224 |
Net realized gain (loss) | 2,094,428 | 1,326,323 |
Change in net unrealized appreciation (depreciation) | 11,980,452 | 18,322,740 |
Net increase (decrease) in net assets resulting from operations | 17,102,366 | 24,126,287 |
Distributions to shareholders from net investment income | (3,027,992) | (4,479,938) |
Distributions to shareholders from net realized gain | (2,711,578) | (871,550) |
Total distributions | (5,739,570) | (5,351,488) |
Share transactions - net increase (decrease) | 20,210,504 | 980,260 |
Total increase (decrease) in net assets | 31,573,300 | 19,755,059 |
| | |
Net Assets | | |
Beginning of period | 128,224,948 | 108,469,889 |
End of period (including undistributed net investment income of $7,845 and undistributed net investment income
of $8,529, respectively) | $ 159,798,248 | $ 128,224,948 |
See accompanying notes which are an integral part of the financial statements.
Annual Report
Financial Highlights - Initial Class
Years ended December 31, | 2010 | 2009 | 2008 | 2007 | 2006 |
Selected Per-Share Data | | | | | |
Net asset value, beginning of period | $ 9.77 | $ 8.23 | $ 11.96 | $ 11.59 | $ 10.78 |
Income from Investment Operations | | | | | |
Net investment income (loss) C | .24 | .38 | .35 | .36 | .28 |
Net realized and unrealized gain (loss) | 1.02 | 1.60 | (3.32) | .64 | .78 |
Total from investment operations | 1.26 | 1.98 | (2.97) | 1.00 | 1.06 |
Distributions from net investment income | (.23) | (.37) | (.31) | (.30) | (.20) |
Distributions from net realized gain | (.19) | (.07) | (.45) | (.33) | (.05) |
Total distributions | (.42) | (.44) | (.76) | (.63) | (.25) |
Net asset value, end of period | $ 10.61 | $ 9.77 | $ 8.23 | $ 11.96 | $ 11.59 |
Total Return A,B | 12.95% | 24.27% | (25.05)% | 8.71% | 9.82% |
Ratios to Average Net Assets D,E | | | | | |
Expenses before reductions | .00% | .00% | .00% | .00% | .00% |
Expenses net of fee waivers, if any | .00% | .00% | .00% | .00% | .00% |
Expenses net of all reductions | .00% | .00% | .00% | .00% | .00% |
Net investment income (loss) | 2.38% | 4.22% | 3.27% | 2.95% | 2.48% |
Supplemental Data | | | | | |
Net assets, end of period (000 omitted) | $ 22,573 | $ 21,197 | $ 24,962 | $ 26,629 | $ 20,992 |
Portfolio turnover rate | 29% | 28% | 34% | 21% | 24% |
A Total returns do not reflect charges attributable to your insurance company's separate account. Inclusion of these charges would reduce the total returns shown.
B Total returns would have been lower had certain expenses not been reduced during the periods shown.
C Calculated based on average shares outstanding during the period.
D Amounts do not include the activity of the underlying funds.
E Expense ratios reflect operating expenses of the class. Expenses before reductions do not reflect amounts reimbursed by the investment adviser or reductions from expense offset arrangements and do not represent the amount paid by the class during periods when reimbursements or reductions occur. Expenses net of fee waivers reflect expenses after reimbursement by the investment adviser but prior to reductions from expense offset arrangements. Expenses net of all reductions represent the net expenses paid by the class but do not include expenses of the investment companies in which the Fund invests.
Financial Highlights - Service Class
Years ended December 31, | 2010 | 2009 | 2008 | 2007 | 2006 |
Selected Per-Share Data | | | | | |
Net asset value, beginning of period | $ 9.77 | $ 8.23 | $ 11.95 | $ 11.58 | $ 10.77 |
Income from Investment Operations | | | | | |
Net investment income (loss) C | .23 | .37 | .33 | .35 | .27 |
Net realized and unrealized gain (loss) | 1.01 | 1.60 | (3.30) | .64 | .78 |
Total from investment operations | 1.24 | 1.97 | (2.97) | .99 | 1.05 |
Distributions from net investment income | (.21) | (.36) | (.30) | (.29) | (.19) |
Distributions from net realized gain | (.19) | (.07) | (.45) | (.33) | (.05) |
Total distributions | (.41) F | (.43) | (.75) | (.62) | (.24) |
Net asset value, end of period | $ 10.60 | $ 9.77 | $ 8.23 | $ 11.95 | $ 11.58 |
Total Return A,B | 12.74% | 24.15% | (25.08)% | 8.65% | 9.78% |
Ratios to Average Net Assets D,E | | | | | |
Expenses before reductions | .10% | .10% | .10% | .10% | .10% |
Expenses net of fee waivers, if any | .10% | .10% | .10% | .10% | .10% |
Expenses net of all reductions | .10% | .10% | .10% | .10% | .10% |
Net investment income (loss) | 2.28% | 4.12% | 3.17% | 2.85% | 2.39% |
Supplemental Data | | | | | |
Net assets, end of period (000 omitted) | $ 19,259 | $ 19,238 | $ 17,137 | $ 19,295 | $ 5,984 |
Portfolio turnover rate | 29% | 28% | 34% | 21% | 24% |
A Total returns do not reflect charges attributable to your insurance company's separate account. Inclusion of these charges would reduce the total returns shown.
B Total returns would have been lower had certain expenses not been reduced during the periods shown.
C Calculated based on average shares outstanding during the period.
D Amounts do not include the activity of the underlying funds.
E Expense ratios reflect operating expenses of the class. Expenses before reductions do not reflect amounts reimbursed by the investment adviser or reductions from expense offset arrangements and do not represent the amount paid by the class during periods when reimbursements or reductions occur. Expenses net of fee waivers reflect expenses after reimbursement by the investment adviser but prior to reductions from expense offset arrangements. Expenses net of all reductions represent the net expenses paid by the class but do not include expenses of the investment companies in which the Fund invests.
F Total distributions of $.41 per share is comprised of distributions from net investment income of $.214 and distributions from net realized gain of $.191 per share.
See accompanying notes which are an integral part of the financial statements.
Annual Report
Financial Highlights - Service Class 2
Years ended December 31, | 2010 | 2009 | 2008 | 2007 | 2006 |
Selected Per-Share Data | | | | | |
Net asset value, beginning of period | $ 9.74 | $ 8.21 | $ 11.92 | $ 11.56 | $ 10.76 |
Income from Investment Operations | | | | | |
Net investment income (loss) C | .22 | .35 | .32 | .33 | .25 |
Net realized and unrealized gain (loss) | .99 | 1.60 | (3.29) | .64 | .78 |
Total from investment operations | 1.21 | 1.95 | (2.97) | .97 | 1.03 |
Distributions from net investment income | (.20) | (.35) | (.29) | (.28) | (.18) |
Distributions from net realized gain | (.19) | (.07) | (.45) | (.33) | (.05) |
Total distributions | (.39) | (.42) | (.74) | (.61) | (.23) |
Net asset value, end of period | $ 10.56 | $ 9.74 | $ 8.21 | $ 11.92 | $ 11.56 |
Total Return A,B | 12.55% | 23.95% | (25.17)% | 8.42% | 9.58% |
Ratios to Average Net Assets D,E | | | | | |
Expenses before reductions | .25% | .25% | .25% | .25% | .25% |
Expenses net of fee waivers, if any | .25% | .25% | .25% | .25% | .25% |
Expenses net of all reductions | .25% | .25% | .25% | .25% | .25% |
Net investment income (loss) | 2.13% | 3.97% | 3.02% | 2.70% | 2.24% |
Supplemental Data | | | | | |
Net assets, end of period (000 omitted) | $ 117,966 | $ 87,791 | $ 66,370 | $ 62,510 | $ 38,662 |
Portfolio turnover rate | 29% | 28% | 34% | 21% | 24% |
A Total returns do not reflect charges attributable to your insurance company's separate account. Inclusion of these charges would reduce the total returns shown.
B Total returns would have been lower had certain expenses not been reduced during the periods shown.
C Calculated based on average shares outstanding during the period.
D Amounts do not include the activity of the underlying funds.
E Expense ratios reflect operating expenses of the class. Expenses before reductions do not reflect amounts reimbursed by the investment adviser or reductions from expense offset arrangements and do not represent the amount paid by the class during periods when reimbursements or reductions occur. Expenses net of fee waivers reflect expenses after reimbursement by the investment adviser but prior to reductions from expense offset arrangements. Expenses net of all reductions represent the net expenses paid by the class but do not include expenses of the investment companies in which the Fund invests.
See accompanying notes which are an integral part of the financial statements.
Annual Report
VIP Freedom 2015 Portfolio
Investment Changes (Unaudited)
Fund Holdings as of December 31, 2010 |
| % of fund's
net assets | % of fund's net assets
6 months ago |
Domestic Equity Funds | | |
VIP Contrafund Portfolio Initial Class | 6.2 | 6.1 |
VIP Equity-Income Portfolio Initial Class | 7.3 | 7.1 |
VIP Growth & Income Portfolio Initial Class | 7.2 | 7.1 |
VIP Growth Portfolio Initial Class | 7.2 | 7.1 |
VIP Mid Cap Portfolio Initial Class | 2.5 | 2.6 |
VIP Value Portfolio Initial Class | 6.2 | 6.1 |
VIP Value Strategies Portfolio Initial Class | 2.6 | 2.5 |
| 39.2 | 38.6 |
Developed International Equity Funds | | |
VIP Overseas Portfolio Initial Class | 11.7 | 11.3 |
Emerging Markets Equity Funds | | |
VIP Emerging Markets Portfolio Initial Class | 1.9 | 1.1 |
High Yield Bond Funds | | |
VIP High Income Portfolio Initial Class | 5.0 | 5.1 |
Investment Grade Bond Funds | | |
VIP Investment Grade Bond Portfolio Initial Class | 33.1 | 34.6 |
Short-Term Funds | | |
VIP Money Market Portfolio Initial Class | 9.1 | 9.3 |
Net Other Assets (Liabilities)* | 0.0 | 0.0 |
| 100.0 | 100.0 |
* Amount represents less than 0.1%. |
Asset Allocation (% of fund's net assets) |
Current |
| Domestic Equity Funds | 39.2% | |
| Developed International Equity Funds | 11.7% | |
| Emerging Markets Equity Funds | 1.9% | |
| High Yield Bond Funds | 5.0% | |
| Investment Grade Bond Funds | 33.1% | |
| Short-Term Funds | 9.1% | |

Six months ago |
| Domestic Equity Funds | 38.6% | |
| Developed International Equity Funds | 11.3% | |
| Emerging Markets Equity Funds | 1.1% | |
| High Yield Bond Funds | 5.1% | |
| Investment Grade Bond Funds | 34.6% | |
| Short-Term Funds | 9.3% | |

Expected |
| Domestic Equity Funds | 37.0% | |
| Developed International Equity Funds | 11.5% | |
| Emerging Markets Equity Funds | 2.0% | |
| High Yield Bond Funds | 5.1% | |
| Investment Grade Bond Funds | 34.7% | |
| Short-Term Funds | 9.7% | |

The fund invests according to an asset allocation strategy that becomes increasingly conservative over time. The six months ago allocation is based on the fund's holdings as of June 30, 2010. The current allocation is based on the fund's holdings as of December 31, 2010. The expected allocation represents the fund's anticipated allocation at June 30, 2011. |
Annual Report
VIP Freedom 2015 Portfolio
Investments December 31, 2010
Showing Percentage of Net Assets
Domestic Equity Funds - 39.2% |
| Shares | | Value |
Domestic Equity Funds - 39.2% |
VIP Contrafund Portfolio Initial Class | 255,136 | | $ 6,092,639 |
VIP Equity-Income Portfolio Initial Class | 375,105 | | 7,134,502 |
VIP Growth & Income Portfolio Initial Class | 562,226 | | 7,100,917 |
VIP Growth Portfolio Initial Class | 191,896 | | 7,117,427 |
VIP Mid Cap Portfolio Initial Class | 75,125 | | 2,455,846 |
VIP Value Portfolio Initial Class | 555,511 | | 6,110,618 |
VIP Value Strategies Portfolio Initial Class | 265,315 | | 2,584,171 |
TOTAL DOMESTIC EQUITY FUNDS (Cost $38,837,119) | 38,596,120 |
International Equity Funds - 13.6% |
| | | |
Developed International Equity Funds - 11.7% |
VIP Overseas Portfolio Initial Class | 683,559 | | 11,463,287 |
Emerging Markets Equity Funds - 1.9% |
VIP Emerging Markets Portfolio Initial Class | 192,691 | | 1,909,572 |
TOTAL INTERNATIONAL EQUITY FUNDS (Cost $13,485,236) | 13,372,859 |
Bond Funds - 38.1% |
| Shares | | Value |
High Yield Bond Funds - 5.0% |
VIP High Income Portfolio Initial Class | 875,925 | | $ 4,878,900 |
Investment Grade Bond Funds - 33.1% |
VIP Investment Grade Bond Portfolio Initial Class | 2,539,430 | | 32,580,883 |
TOTAL BOND FUNDS (Cost $37,083,791) | 37,459,783 |
Short-Term Funds - 9.1% |
| | | |
VIP Money Market Portfolio Initial Class
(Cost $8,952,482) | 8,952,482 | | 8,952,482 |
TOTAL INVESTMENT PORTFOLIO - 100.0% (Cost $98,358,628) | | 98,381,244 |
NET OTHER ASSETS (LIABILITIES) - 0.0% | | (11,708) |
NET ASSETS - 100% | $ 98,369,536 |
Other Information |
All investments are categorized as Level 1 under the Fair Value Hierarchy. The inputs or methodology used for valuing securities may not be an indication of the risk associated with investing in those securities. For more information on valuation inputs, please refer to the Security Valuation section in the accompanying Notes to Financial Statements. |
See accompanying notes which are an integral part of the financial statements.
Annual Report
VIP Freedom 2015 Portfolio
Statement of Assets and Liabilities
| December 31, 2010 |
| | |
Assets | | |
Investment in securities, at value (cost $98,358,628) - See accompanying schedule | | $ 98,381,244 |
Cash | | 146 |
Receivable for investments sold | | 995 |
Receivable for fund shares sold | | 12,657 |
Total assets | | 98,395,042 |
| | |
Liabilities | | |
Payable for investments purchased | $ 7,466 | |
Payable for fund shares redeemed | 6,378 | |
Distribution and service plan fees payable | 11,662 | |
Total liabilities | | 25,506 |
| | |
Net Assets | | $ 98,369,536 |
Net Assets consist of: | | |
Paid in capital | | $ 98,852,281 |
Accumulated undistributed net realized gain (loss) on investments | | (505,361) |
Net unrealized appreciation (depreciation) on investments | | 22,616 |
Net Assets | | $ 98,369,536 |
Statement of Assets and Liabilities - continued
| December 31, 2010 |
| | |
Initial Class:
Net Asset Value, offering price and redemption price per share ($39,534,794 ÷ 3,696,288 shares) | | $ 10.70 |
| | |
Service Class:
Net Asset Value, offering price and redemption price per share ($2,722,875 ÷ 254,705 shares) | | $ 10.69 |
| | |
Service Class 2:
Net Asset Value, offering price and redemption price per share ($56,111,867 ÷ 5,267,563 shares) | | $ 10.65 |
See accompanying notes which are an integral part of the financial statements.
Annual Report
Statement of Operations
| Year ended December 31, 2010 |
| | |
Investment Income | | |
Income distributions from underlying funds | | $ 2,025,670 |
Interest | | 5 |
Total income | | 2,025,675 |
| | |
Expenses | | |
Distribution and service plan fees | $ 123,231 | |
Independent trustees' compensation | 308 | |
Total expenses before reductions | 123,539 | |
Expense reductions | (308) | 123,231 |
Net investment income (loss) | | 1,902,444 |
Realized and Unrealized Gain (Loss) Realized gain (loss) on sale of underlying fund shares | 451,696 | |
Capital gain distributions from underlying funds | 414,315 | |
Total net realized gain (loss) | | 866,011 |
Change in net unrealized appreciation (depreciation) on underlying funds | | 8,117,654 |
Net gain (loss) | | 8,983,665 |
Net increase (decrease) in net assets resulting from operations | | $ 10,886,109 |
Statement of Changes in Net Assets
| Year ended December 31, 2010 | Year ended December 31, 2009 |
Increase (Decrease) in Net Assets | | |
Operations | | |
Net investment income (loss) | $ 1,902,444 | $ 2,636,979 |
Net realized gain (loss) | 866,011 | 778,497 |
Change in net unrealized appreciation (depreciation) | 8,117,654 | 11,395,277 |
Net increase (decrease) in net assets resulting from operations | 10,886,109 | 14,810,753 |
Distributions to shareholders from net investment income | (1,907,875) | (2,643,534) |
Distributions to shareholders from net realized gain | (1,118,696) | (904,007) |
Total distributions | (3,026,571) | (3,547,541) |
Share transactions - net increase (decrease) | 9,160,517 | 17,317,820 |
Total increase (decrease) in net assets | 17,020,055 | 28,581,032 |
| | |
Net Assets | | |
Beginning of period | 81,349,481 | 52,768,449 |
End of period (including undistributed net investment income of $0 and undistributed net investment income
of $9,777, respectively) | $ 98,369,536 | $ 81,349,481 |
See accompanying notes which are an integral part of the financial statements.
Annual Report
Financial Highlights - Initial Class
Years ended December 31, | 2010 | 2009 | 2008 | 2007 | 2006 |
Selected Per-Share Data | | | | | |
Net asset value, beginning of period | $ 9.78 | $ 8.19 | $ 12.29 | $ 11.93 | $ 10.95 |
Income from Investment Operations | | | | | |
Net investment income (loss) C | .23 | .38 | .33 | .37 | .27 |
Net realized and unrealized gain (loss) | 1.04 | 1.67 | (3.61) | .73 | .94 |
Total from investment operations | 1.27 | 2.05 | (3.28) | 1.10 | 1.21 |
Distributions from net investment income | (.23) | (.34) | (.30) | (.36) | (.14) |
Distributions from net realized gain | (.13) | (.12) | (.52) | (.38) | (.09) |
Total distributions | (.35) G | (.46) | (.82) F | (.74) | (.23) |
Net asset value, end of period | $ 10.70 | $ 9.78 | $ 8.19 | $ 12.29 | $ 11.93 |
Total Return A,B | 13.09% | 25.28% | (27.03)% | 9.33% | 11.04% |
Ratios to Average Net Assets D,E | | | | | |
Expenses before reductions | .00% | .00% | .00% | .00% | .00% |
Expenses net of fee waivers, if any | .00% | .00% | .00% | .00% | .00% |
Expenses net of all reductions | .00% | .00% | .00% | .00% | .00% |
Net investment income (loss) | 2.30% | 4.21% | 3.11% | 2.93% | 2.34% |
Supplemental Data | | | | | |
Net assets, end of period (000 omitted) | $ 39,535 | $ 37,291 | $ 25,977 | $ 33,780 | $ 23,712 |
Portfolio turnover rate | 30% | 23% | 27% | 18% | 24% |
A Total returns do not reflect charges attributable to your insurance company's separate account. Inclusion of these charges would reduce the total returns shown.
B Total returns would have been lower had certain expenses not been reduced during the periods shown.
C Calculated based on average shares outstanding during the period.
D Amounts do not include the activity of the underlying funds.
E Expense ratios reflect operating expenses of the class. Expenses before reductions do not reflect amounts reimbursed by the investment adviser or reductions from expense offset arrangements and do not represent the amount paid by the class during periods when reimbursements or reductions occur. Expenses net of fee waivers reflect expenses after reimbursement by the investment adviser but prior to reductions from expense offset arrangements. Expenses net of all reductions represent the net expenses paid by the class but do not include expenses of the investment companies in which the Fund invests.
F Total distributions of $.82 per share is comprised of distributions from net investment income of $.302 and distributions from net realized gain of $.515 per share.
G Total distributions of $.35 per share is comprised of distributions from net investment income of $.227 and distributions from net realized gain of $.127 per share.
Financial Highlights - Service Class
Years ended December 31, | 2010 | 2009 | 2008 | 2007 | 2006 |
Selected Per-Share Data | | | | | |
Net asset value, beginning of period | $ 9.77 | $ 8.19 | $ 12.29 | $ 11.93 | $ 10.95 |
Income from Investment Operations | | | | | |
Net investment income (loss) C | .22 | .37 | .31 | .35 | .26 |
Net realized and unrealized gain (loss) | 1.05 | 1.66 | (3.60) | .74 | .94 |
Total from investment operations | 1.27 | 2.03 | (3.29) | 1.09 | 1.20 |
Distributions from net investment income | (.22) | (.33) | (.29) | (.35) | (.13) |
Distributions from net realized gain | (.13) | (.12) | (.52) | (.38) | (.09) |
Total distributions | (.35) | (.45) | (.81) F | (.73) | (.22) |
Net asset value, end of period | $ 10.69 | $ 9.77 | $ 8.19 | $ 12.29 | $ 11.93 |
Total Return A,B | 13.00% | 25.06% | (27.10)% | 9.23% | 10.94% |
Ratios to Average Net Assets D,E | | | | | |
Expenses before reductions | .10% | .10% | .10% | .10% | .10% |
Expenses net of fee waivers, if any | .10% | .10% | .10% | .10% | .10% |
Expenses net of all reductions | .10% | .10% | .10% | .10% | .10% |
Net investment income (loss) | 2.20% | 4.12% | 3.01% | 2.83% | 2.24% |
Supplemental Data | | | | | |
Net assets, end of period (000 omitted) | $ 2,723 | $ 1,524 | $ 936 | $ 477 | $ 427 |
Portfolio turnover rate | 30% | 23% | 27% | 18% | 24% |
A Total returns do not reflect charges attributable to your insurance company's separate account. Inclusion of these charges would reduce the total returns shown.
B Total returns would have been lower had certain expenses not been reduced during the periods shown.
C Calculated based on average shares outstanding during the period.
D Amounts do not include the activity of the underlying funds.
E Expense ratios reflect operating expenses of the class. Expenses before reductions do not reflect amounts reimbursed by the investment adviser or reductions from expense offset arrangements and do not represent the amount paid by the class during periods when reimbursements or reductions occur. Expenses net of fee waivers reflect expenses after reimbursement by the investment adviser but prior to reductions from expense offset arrangements. Expenses net of all reductions represent the net expenses paid by the class but do not include expenses of the investment companies in which the Fund invests.
F Total distributions of $.81 per share is comprised of distributions from net investment income of $.294 and distributions from net realized gain of $.515 per share.
See accompanying notes which are an integral part of the financial statements.
Annual Report
Financial Highlights - Service Class 2
Years ended December 31, | 2010 | 2009 | 2008 | 2007 | 2006 |
Selected Per-Share Data | | | | | |
Net asset value, beginning of period | $ 9.74 | $ 8.16 | $ 12.26 | $ 11.91 | $ 10.94 |
Income from Investment Operations | | | | | |
Net investment income (loss) C | .21 | .35 | .30 | .33 | .24 |
Net realized and unrealized gain (loss) | 1.03 | 1.67 | (3.61) | .74 | .95 |
Total from investment operations | 1.24 | 2.02 | (3.31) | 1.07 | 1.19 |
Distributions from net investment income | (.20) | (.32) | (.28) | (.34) | (.13) |
Distributions from net realized gain | (.13) | (.12) | (.52) | (.38) | (.09) |
Total distributions | (.33) | (.44) | (.79) F | (.72) | (.22) |
Net asset value, end of period | $ 10.65 | $ 9.74 | $ 8.16 | $ 12.26 | $ 11.91 |
Total Return A,B | 12.79% | 25.02% | (27.30)% | 9.07% | 10.84% |
Ratios to Average Net Assets D,E | | | | | |
Expenses before reductions | .25% | .25% | .25% | .25% | .25% |
Expenses net of fee waivers, if any | .25% | .25% | .25% | .25% | .25% |
Expenses net of all reductions | .25% | .25% | .25% | .25% | .25% |
Net investment income (loss) | 2.05% | 3.97% | 2.86% | 2.68% | 2.09% |
Supplemental Data | | | | | |
Net assets, end of period (000 omitted) | $ 56,112 | $ 42,534 | $ 25,855 | $ 24,497 | $ 9,984 |
Portfolio turnover rate | 30% | 23% | 27% | 18% | 24% |
A Total returns do not reflect charges attributable to your insurance company's separate account. Inclusion of these charges would reduce the total returns shown.
B Total returns would have been lower had certain expenses not been reduced during the periods shown.
C Calculated based on average shares outstanding during the period.
D Amounts do not include the activity of the underlying funds.
E Expense ratios reflect operating expenses of the class. Expenses before reductions do not reflect amounts reimbursed by the investment adviser or reductions from expense offset arrangements and do not represent the amount paid by the class during periods when reimbursements or reductions occur. Expenses net of fee waivers reflect expenses after reimbursement by the investment adviser but prior to reductions from expense offset arrangements. Expenses net of all reductions represent the net expenses paid by the class but do not include expenses of the investment companies in which the Fund invests.
F Total distributions of $.79 per share is comprised of distributions from net investment income of $.279 and distributions from net realized gain of $.515 per share.
See accompanying notes which are an integral part of the financial statements.
Annual Report
VIP Freedom 2020 Portfolio
Investment Changes (Unaudited)
Fund Holdings as of December 31, 2010 |
| % of fund's
net assets | % of fund's net assets
6 months ago |
Domestic Equity Funds | | |
VIP Contrafund Portfolio Initial Class | 7.3 | 7.4 |
VIP Equity-Income Portfolio Initial Class | 8.6 | 8.6 |
VIP Growth & Income Portfolio Initial Class | 8.5 | 8.6 |
VIP Growth Portfolio Initial Class | 8.6 | 8.6 |
VIP Mid Cap Portfolio Initial Class | 3.0 | 3.1 |
VIP Value Portfolio Initial Class | 7.3 | 7.3 |
VIP Value Strategies Portfolio Initial Class | 3.1 | 3.0 |
| 46.4 | 46.6 |
Developed International Equity Funds | | |
VIP Overseas Portfolio Initial Class | 13.8 | 13.7 |
Emerging Markets Equity Funds | | |
VIP Emerging Markets Portfolio Initial Class | 2.3 | 1.3 |
High Yield Bond Funds | | |
VIP High Income Portfolio Initial Class | 6.5 | 6.9 |
Investment Grade Bond Funds | | |
VIP Investment Grade Bond Portfolio Initial Class | 27.6 | 28.5 |
Short-Term Funds | | |
VIP Money Market Portfolio Initial Class | 3.4 | 3.0 |
Net Other Assets (Liabilities)* | 0.0 | 0.0 |
| 100.0 | 100.0 |
* Amount represents less than 0.1%. |
Asset Allocation (% of fund's net assets) |
Current |
| Domestic Equity Funds | 46.4% | |
| Developed International Equity Funds | 13.8% | |
| Emerging Markets Equity Funds | 2.3% | |
| High Yield Bond Funds | 6.5% | |
| Investment Grade Bond Funds | 27.6% | |
| Short-Term Funds | 3.4% | |

Six months ago |
| Domestic Equity Funds | 46.6% | |
| Developed International Equity Funds | 13.7% | |
| Emerging Markets Equity Funds | 1.3% | |
| High Yield Bond Funds | 6.9% | |
| Investment Grade Bond Funds | 28.5% | |
| Short-Term Funds | 3.0% | |

Expected |
| Domestic Equity Funds | 43.3% | |
| Developed International Equity Funds | 13.4% | |
| Emerging Markets Equity Funds | 2.4% | |
| High Yield Bond Funds | 6.4% | |
| Investment Grade Bond Funds | 30.1% | |
| Short-Term Funds | 4.4% | |

The fund invests according to an asset allocation strategy that becomes increasingly conservative over time. The six months ago allocation is based on the fund's holdings as of June 30, 2010. The current allocation is based on the fund's holdings as of December 31, 2010. The expected allocation represents the fund's anticipated allocation at June 30, 2011. |
Annual Report
VIP Freedom 2020 Portfolio
Investments December 31, 2010
Showing Percentage of Net Assets
Domestic Equity Funds - 46.4% |
| Shares | | Value |
Domestic Equity Funds - 46.4% |
VIP Contrafund Portfolio Initial Class | 1,193,213 | | $ 28,493,917 |
VIP Equity-Income Portfolio Initial Class | 1,753,476 | | 33,351,121 |
VIP Growth & Income Portfolio Initial Class | 2,625,383 | | 33,158,593 |
VIP Growth Portfolio Initial Class | 897,476 | | 33,287,392 |
VIP Mid Cap Portfolio Initial Class | 352,015 | | 11,507,366 |
VIP Value Portfolio Initial Class | 2,597,371 | | 28,571,076 |
VIP Value Strategies Portfolio Initial Class | 1,242,033 | | 12,097,401 |
TOTAL DOMESTIC EQUITY FUNDS (Cost $177,748,336) | 180,466,866 |
International Equity Funds - 16.1% |
| | | |
Developed International Equity Funds - 13.8% |
VIP Overseas Portfolio Initial Class | 3,197,062 | | 53,614,736 |
Emerging Markets Equity Funds - 2.3% |
VIP Emerging Markets Portfolio Initial Class | 901,514 | | 8,934,000 |
TOTAL INTERNATIONAL EQUITY FUNDS (Cost $62,166,335) | 62,548,736 |
Bond Funds - 34.1% |
| Shares | | Value |
High Yield Bond Funds - 6.5% |
VIP High Income Portfolio Initial Class | 4,519,317 | | $ 25,172,596 |
Investment Grade Bond Funds - 27.6% |
VIP Investment Grade Bond Portfolio Initial Class | 8,378,422 | | 107,495,158 |
TOTAL BOND FUNDS (Cost $132,724,801) | 132,667,754 |
Short-Term Funds - 3.4% |
| | | |
VIP Money Market Portfolio Initial Class
(Cost $13,107,721) | 13,107,721 | | 13,107,721 |
Cash Equivalents - 0.0% |
| Maturity
Amount | | |
Investments in repurchase agreements in a joint trading account at 0.20%, dated 12/31/10 due 1/3/11 (Collateralized by U.S. Treasury Obligations) #
(Cost $94,000) | $ 94,002 | | $ 94,000 |
TOTAL INVESTMENT PORTFOLIO - 100.0% (Cost $385,841,193) | | 388,885,077 |
NET OTHER ASSETS (LIABILITIES) - 0.0% | | (160,547) |
NET ASSETS - 100% | $ 388,724,530 |
Other Information |
All investments are categorized as Level 1 under the Fair Value Hierarchy with the exception of Cash Equivalents which are categorized as Level 2. The inputs or methodology used for valuing securities may not be an indication of the risk associated with investing in those securities. For more information on valuation inputs, please refer to the Security Valuation section in the accompanying Notes to Financial Statements. |
# Additional information on each counterparty to the repurchase agreement is as follows: |
Repurchase Agreement / Counterparty | Value |
$94,000 due 1/03/11 at 0.20% |
BNP Paribas Securities Corp. | $ 11,114 |
Barclays Capital, Inc. | 22,178 |
Citigroup Global Markets, Inc. | 7,153 |
Credit Agricole Securities (USA), Inc. | 14,307 |
Deutsche Bank Securities, Inc. | 2,861 |
HSBC Securities (USA), Inc. | 8,433 |
J.P. Morgan Securities, Inc. | 7,153 |
Merrill Lynch, Pierce, Fenner & Smith, Inc. | 2,146 |
Mizuho Securities USA, Inc. | 12,161 |
RBS Securities, Inc. | 3,991 |
Societe Generale, New York Branch | 1,788 |
Wells Fargo Securities LLC | 715 |
| $ 94,000 |
See accompanying notes which are an integral part of the financial statements.
Annual Report
VIP Freedom 2020 Portfolio
Statement of Assets and Liabilities
| December 31, 2010 |
| | |
Assets | | |
Investment in securities, at value (including repurchase agreements of $94,000) (cost $385,841,193) - See accompanying schedule | | $ 388,885,077 |
Cash | | 34 |
Receivable for investments sold | | 263,289 |
Receivable for fund shares sold | | 81,497 |
Total assets | | 389,229,897 |
| | |
Liabilities | | |
Payable for fund shares redeemed | $ 439,551 | |
Distribution and service plan fees payable | 65,816 | |
Total liabilities | | 505,367 |
| | |
Net Assets | | $ 388,724,530 |
Net Assets consist of: | | |
Paid in capital | | $ 387,764,015 |
Accumulated undistributed net realized gain (loss) on investments | | (2,083,369) |
Net unrealized appreciation (depreciation) on investments | | 3,043,884 |
Net Assets | | $ 388,724,530 |
Statement of Assets and Liabilities - continued
| December 31, 2010 |
| | |
Initial Class:
Net Asset Value, offering price and redemption price per share ($45,225,182 ÷ 4,268,920 shares) | | $ 10.59 |
| | |
Service Class:
Net Asset Value, offering price and redemption price per share ($33,243,985 ÷ 3,142,728 shares) | | $ 10.58 |
| | |
Service Class 2:
Net Asset Value, offering price and redemption price per share ($310,255,363 ÷ 29,407,368 shares) | | $ 10.55 |
See accompanying notes which are an integral part of the financial statements.
Annual Report
Statement of Operations
| Year ended December 31, 2010 |
| | |
Investment Income | | |
Income distributions from underlying funds | | $ 8,029,103 |
Interest | | 14 |
Total income | | 8,029,117 |
| | |
Expenses | | |
Distribution and service plan fees | $ 619,004 | |
Independent trustees' compensation | 1,053 | |
Total expenses before reductions | 620,057 | |
Expense reductions | (1,053) | 619,004 |
Net investment income (loss) | | 7,410,113 |
Realized and Unrealized Gain (Loss) Realized gain (loss) on sale of underlying fund shares | 188,827 | |
Capital gain distributions from underlying funds | 1,438,204 | |
Total net realized gain (loss) | | 1,627,031 |
Change in net unrealized appreciation (depreciation) on underlying funds | | 35,177,912 |
Net gain (loss) | | 36,804,943 |
Net increase (decrease) in net assets resulting from operations | | $ 44,215,056 |
Statement of Changes in Net Assets
| Year ended December 31, 2010 | Year ended December 31, 2009 |
Increase (Decrease) in Net Assets | | |
Operations | | |
Net investment income (loss) | $ 7,410,113 | $ 7,106,002 |
Net realized gain (loss) | 1,627,031 | 1,690,863 |
Change in net unrealized appreciation (depreciation) | 35,177,912 | 40,995,174 |
Net increase (decrease) in net assets resulting from operations | 44,215,056 | 49,792,039 |
Distributions to shareholders from net investment income | (7,414,198) | (7,104,782) |
Distributions to shareholders from net realized gain | (2,619,651) | (2,396,745) |
Total distributions | (10,033,849) | (9,501,527) |
Share transactions - net increase (decrease) | 100,585,667 | 55,723,199 |
Total increase (decrease) in net assets | 134,766,874 | 96,013,711 |
| | |
Net Assets | | |
Beginning of period | 253,957,656 | 157,943,945 |
End of period (including undistributed net investment income of $0 and undistributed net investment income
of $6,585, respectively) | $ 388,724,530 | $ 253,957,656 |
See accompanying notes which are an integral part of the financial statements.
Annual Report
Financial Highlights - Initial Class
Years ended December 31, | 2010 | 2009 | 2008 | 2007 | 2006 |
Selected Per-Share Data | | | | | |
Net asset value, beginning of period | $ 9.52 | $ 7.71 | $ 12.63 | $ 12.10 | $ 11.07 |
Income from Investment Operations | | | | | |
Net investment income (loss) C | .26 | .33 | .32 | .35 | .26 |
Net realized and unrealized gain (loss) | 1.11 | 1.88 | (4.38) | .88 | 1.06 |
Total from investment operations | 1.37 | 2.21 | (4.06) | 1.23 | 1.32 |
Distributions from net investment income | (.22) | (.29) | (.28) | (.27) | (.18) |
Distributions from net realized gain | (.08) | (.11) | (.59) | (.43) | (.11) |
Total distributions | (.30) | (.40) H | (.86) G | (.70) F | (.29) |
Net asset value, end of period | $ 10.59 | $ 9.52 | $ 7.71 | $ 12.63 | $ 12.10 |
Total Return A,B | 14.49% | 28.97% | (32.60)% | 10.23% | 11.95% |
Ratios to Average Net Assets D,E | | | | | |
Expenses before reductions | .00% | .00% | .00% | .00% | .00% |
Expenses net of fee waivers, if any | .00% | .00% | .00% | .00% | .00% |
Expenses net of all reductions | .00% | .00% | .00% | .00% | .00% |
Net investment income (loss) | 2.61% | 3.93% | 3.07% | 2.76% | 2.21% |
Supplemental Data | | | | | |
Net assets, end of period (000 omitted) | $ 45,225 | $ 38,330 | $ 33,089 | $ 31,465 | $ 21,356 |
Portfolio turnover rate | 21% | 18% | 24% | 12% | 21% |
A Total returns do not reflect charges attributable to your insurance company's separate account. Inclusion of these charges would reduce the total returns shown.
B Total returns would have been lower had certain expenses not been reduced during the periods shown.
C Calculated based on average shares outstanding during the period.
D Amounts do not include the activity of the underlying funds.
E Expense ratios reflect operating expenses of the class. Expenses before reductions do not reflect amounts reimbursed by the investment adviser or reductions from expense offset arrangements and do not represent the amount paid by the class during periods when reimbursements or reductions occur. Expenses net of fee waivers reflect expenses after reimbursement by the investment adviser but prior to reductions from expense offset arrangements. Expenses net of all reductions represent the net expenses paid by the class but do not include expenses of the investment companies in which the Fund invests.
F Total distributions of $.70 per share is comprised of distributions from net investment income of $.273 and distributions from net realized gain of $.425 per share.
G Total distributions of $.86 per share is comprised of distributions from net investment income of $.279 and distributions from net realized gain of $.585 per share.
H Total distributions of $.40 per share is comprised of distributions from net investment income of $.293 and distributions from net realized gain of $.107 per share.
Financial Highlights - Service Class
Years ended December 31, | 2010 | 2009 | 2008 | 2007 | 2006 |
Selected Per-Share Data | | | | | |
Net asset value, beginning of period | $ 9.50 | $ 7.70 | $ 12.62 | $ 12.09 | $ 11.07 |
Income from Investment Operations | | | | | |
Net investment income (loss) C | .25 | .32 | .31 | .34 | .25 |
Net realized and unrealized gain (loss) | 1.12 | 1.87 | (4.38) | .88 | 1.06 |
Total from investment operations | 1.37 | 2.19 | (4.07) | 1.22 | 1.31 |
Distributions from net investment income | (.21) | (.29) | (.27) | (.26) | (.18) |
Distributions from net realized gain | (.08) | (.11) | (.59) | (.43) | (.11) |
Total distributions | (.29) | (.39) H | (.85) G | (.69) F | (.29) |
Net asset value, end of period | $ 10.58 | $ 9.50 | $ 7.70 | $ 12.62 | $ 12.09 |
Total Return A,B | 14.52% | 28.78% | (32.71)% | 10.17% | 11.81% |
Ratios to Average Net Assets D,E | | | | | |
Expenses before reductions | .10% | .10% | .10% | .10% | .10% |
Expenses net of fee waivers, if any | .10% | .10% | .10% | .10% | .10% |
Expenses net of all reductions | .10% | .10% | .10% | .10% | .10% |
Net investment income (loss) | 2.51% | 3.83% | 2.97% | 2.66% | 2.11% |
Supplemental Data | | | | | |
Net assets, end of period (000 omitted) | $ 33,244 | $ 25,941 | $ 18,325 | $ 19,881 | $ 6,555 |
Portfolio turnover rate | 21% | 18% | 24% | 12% | 21% |
A Total returns do not reflect charges attributable to your insurance company's separate account. Inclusion of these charges would reduce the total returns shown.
B Total returns would have been lower had certain expenses not been reduced during the periods shown.
C Calculated based on average shares outstanding during the period.
D Amounts do not include the activity of the underlying funds.
E Expense ratios reflect operating expenses of the class. Expenses before reductions do not reflect amounts reimbursed by the investment adviser or reductions from expense offset arrangements and do not represent the amount paid by the class during periods when reimbursements or reductions occur. Expenses net of fee waivers reflect expenses after reimbursement by the investment adviser but prior to reductions from expense offset arrangements. Expenses net of all reductions represent the net expenses paid by the class but do not include expenses of the investment companies in which the Fund invests.
F Total distributions of $.69 per share is comprised of distributions from net investment income of $.264 and distributions from net realized gain of $.425 per share.
G Total distributions of $.85 per share is comprised of distributions from net investment income of $.269 and distributions from net realized gain of $.585 per share.
H Total distributions of $.39 per share is comprised of distributions from net investment income of $.285 and distributions from net realized gain of $.107 per share.
See accompanying notes which are an integral part of the financial statements.
Annual Report
Financial Highlights - Service Class 2
Years ended December 31, | 2010 | 2009 | 2008 | 2007 | 2006 |
Selected Per-Share Data | | | | | |
Net asset value, beginning of period | $ 9.48 | $ 7.69 | $ 12.60 | $ 12.08 | $ 11.06 |
Income from Investment Operations | | | | | |
Net investment income (loss) C | .23 | .31 | .30 | .32 | .23 |
Net realized and unrealized gain (loss) | 1.12 | 1.86 | (4.37) | .87 | 1.07 |
Total from investment operations | 1.35 | 2.17 | (4.07) | 1.19 | 1.30 |
Distributions from net investment income | (.20) | (.28) | (.26) | (.25) | (.17) |
Distributions from net realized gain | (.08) | (.11) | (.59) | (.43) | (.11) |
Total distributions | (.28) | (.38) H | (.84) G | (.67) F | (.28) |
Net asset value, end of period | $ 10.55 | $ 9.48 | $ 7.69 | $ 12.60 | $ 12.08 |
Total Return A,B | 14.33% | 28.55% | (32.80)% | 9.97% | 11.70% |
Ratios to Average Net Assets D,E | | | | | |
Expenses before reductions | .25% | .25% | .25% | .25% | .25% |
Expenses net of fee waivers, if any | .25% | .25% | .25% | .25% | .25% |
Expenses net of all reductions | .25% | .25% | .25% | .25% | .25% |
Net investment income (loss) | 2.36% | 3.68% | 2.82% | 2.51% | 1.96% |
Supplemental Data | | | | | |
Net assets, end of period (000 omitted) | $ 310,255 | $ 189,686 | $ 106,530 | $ 119,395 | $ 56,810 |
Portfolio turnover rate | 21% | 18% | 24% | 12% | 21% |
A Total returns do not reflect charges attributable to your insurance company's separate account. Inclusion of these charges would reduce the total returns shown.
B Total returns would have been lower had certain expenses not been reduced during the periods shown.
C Calculated based on average shares outstanding during the period.
D Amounts do not include the activity of the underlying funds.
E Expense ratios reflect operating expenses of the class. Expenses before reductions do not reflect amounts reimbursed by the investment adviser or reductions from expense offset arrangements and do not represent the amount paid by the class during periods when reimbursements or reductions occur. Expenses net of fee waivers reflect expenses after reimbursement by the investment adviser but prior to reductions from expense offset arrangements. Expenses net of all reductions represent the net expenses paid by the class but do not include expenses of the investment companies in which the Fund invests.
F Total distributions of $.67 per share is comprised of distributions from net investment income of $.249 and distributions from net realized gain of $.425 per share.
G Total distributions of $.84 per share is comprised of distributions from net investment income of $.255 and distributions from net realized gain of $.585 per share.
H Total distributions of $.38 per share is comprised of distributions from net investment income of $.275 and distributions from net realized gain of $.107 per share.
See accompanying notes which are an integral part of the financial statements.
Annual Report
VIP Freedom 2025 Portfolio
Investment Changes (Unaudited)
Fund Holdings as of December 31, 2010 |
| % of fund's
net assets | % of fund's net assets
6 months ago |
Domestic Equity Funds | | |
VIP Contrafund Portfolio Initial Class | 8.3 | 8.4 |
VIP Equity-Income Portfolio Initial Class | 9.7 | 9.7 |
VIP Growth & Income Portfolio Initial Class | 9.7 | 9.7 |
VIP Growth Portfolio Initial Class | 9.7 | 9.7 |
VIP Mid Cap Portfolio Initial Class | 3.4 | 3.5 |
VIP Value Portfolio Initial Class | 8.3 | 8.3 |
VIP Value Strategies Portfolio Initial Class | 3.5 | 3.5 |
| 52.6 | 52.8 |
Developed International Equity Funds | | |
VIP Overseas Portfolio Initial Class | 15.7 | 15.5 |
Emerging Markets Equity Funds | | |
VIP Emerging Markets Portfolio Initial Class | 2.6 | 1.5 |
High Yield Bond Funds | | |
VIP High Income Portfolio Initial Class | 7.3 | 7.5 |
Investment Grade Bond Funds | | |
VIP Investment Grade Bond Portfolio Initial Class | 21.7 | 22.7 |
Short-Term Funds | | |
VIP Money Market Portfolio Initial Class | 0.1 | 0.0 |
Net Other Assets (Liabilities)* | 0.0 | 0.0 |
| 100.0 | 100.0 |
* Amount represents less than 0.1%. |
Asset Allocation (% of fund's net assets) |
Current |
| Domestic Equity Funds | 52.6% | |
| Developed International Equity Funds | 15.7% | |
| Emerging Markets Equity Funds | 2.6% | |
| High Yield Bond Funds | 7.3% | |
| Investment Grade Bond Funds | 21.7% | |
| Short-Term Funds | 0.1% | |

Six months ago |
| Domestic Equity Funds | 52.8% | |
| Developed International Equity Funds | 15.5% | |
| Emerging Markets Equity Funds | 1.5% | |
 | High Yield Bond Funds | 7.5% | |
| Investment Grade Bond Funds | 22.7% | |

Expected |
| Domestic Equity Funds | 50.6% | |
| Developed International Equity Funds | 15.6% | |
| Emerging Markets Equity Funds | 2.8% | |
| High Yield Bond Funds | 7.5% | |
| Investment Grade Bond Funds | 23.3% | |
| Short-Term Funds | 0.2% | |

The fund invests according to an asset allocation strategy that becomes increasingly conservative over time. The six months ago allocation is based on the fund's holdings as of June 30, 2010. The current allocation is based on the fund's holdings as of December 31, 2010. The expected allocation represents the fund's anticipated allocation at June 30, 2011. |
Annual Report
VIP Freedom 2025 Portfolio
Investments December 31, 2010
Showing Percentage of Net Assets
Domestic Equity Funds - 52.6% |
| Shares | | Value |
Domestic Equity Funds - 52.6% |
VIP Contrafund Portfolio Initial Class | 144,863 | | $ 3,459,319 |
VIP Equity-Income Portfolio Initial Class | 212,912 | | 4,049,589 |
VIP Growth & Income Portfolio Initial Class | 318,615 | | 4,024,109 |
VIP Growth Portfolio Initial Class | 108,743 | | 4,033,281 |
VIP Mid Cap Portfolio Initial Class | 42,704 | | 1,395,989 |
VIP Value Portfolio Initial Class | 315,298 | | 3,468,279 |
VIP Value Strategies Portfolio Initial Class | 150,420 | | 1,465,086 |
TOTAL DOMESTIC EQUITY FUNDS (Cost $22,106,768) | 21,895,652 |
International Equity Funds - 18.3% |
| | | |
Developed International Equity Funds - 15.7% |
VIP Overseas Portfolio Initial Class | 389,229 | | 6,527,365 |
Emerging Markets Equity Funds - 2.6% |
VIP Emerging Markets Portfolio Initial Class | 110,702 | | 1,097,052 |
TOTAL INTERNATIONAL EQUITY FUNDS (Cost $7,688,075) | 7,624,417 |
Bond Funds - 29.0% |
| Shares | | Value |
High Yield Bond Funds - 7.3% |
VIP High Income Portfolio Initial Class | 540,973 | | $ 3,013,220 |
Investment Grade Bond Funds - 21.7% |
VIP Investment Grade Bond Portfolio Initial Class | 704,786 | | 9,042,405 |
TOTAL BOND FUNDS (Cost $12,244,257) | 12,055,625 |
Short-Term Funds - 0.1% |
| | | |
VIP Money Market Portfolio Initial Class
(Cost $27,893) | 27,893 | | 27,893 |
TOTAL INVESTMENT PORTFOLIO - 100.0% (Cost $42,066,993) | | 41,603,587 |
NET OTHER ASSETS (LIABILITIES) - 0.0% | | (4,357) |
NET ASSETS - 100% | $ 41,599,230 |
Other Information |
All investments are categorized as Level 1 under the Fair Value Hierarchy. The inputs or methodology used for valuing securities may not be an indication of the risk associated with investing in those securities. For more information on valuation inputs, please refer to the Security Valuation section in the accompanying Notes to Financial Statements. |
See accompanying notes which are an integral part of the financial statements.
Annual Report
VIP Freedom 2025 Portfolio
Statement of Assets and Liabilities
| December 31, 2010 |
| | |
Assets | | |
Investment in securities, at value (cost $42,066,993) - See accompanying schedule | | $ 41,603,587 |
Cash | | 2,221 |
Receivable for investments sold | | 3,213 |
Receivable for fund shares sold | | 3,204 |
Total assets | | 41,612,225 |
| | |
Liabilities | | |
Payable for investments purchased | $ 3,002 | |
Payable for fund shares redeemed | 5,570 | |
Distribution and service plan fees payable | 4,423 | |
Total liabilities | | 12,995 |
| | |
Net Assets | | $ 41,599,230 |
Net Assets consist of: | | |
Paid in capital | | $ 42,340,241 |
Accumulated undistributed net realized gain (loss) on investments | | (277,605) |
Net unrealized appreciation (depreciation) on investments | | (463,406) |
Net Assets | | $ 41,599,230 |
Statement of Assets and Liabilities - continued
| December 31, 2010 |
| | |
Initial Class:
Net Asset Value, offering price and redemption price per share ($17,387,875 ÷ 1,657,199 shares) | | $ 10.49 |
| | |
Service Class:
Net Asset Value, offering price and redemption price per share ($1,429,179 ÷ 136,273 shares) | | $ 10.49 |
| | |
Service Class 2:
Net Asset Value, offering price and redemption price per share ($22,782,176 ÷ 2,181,244 shares) | | $ 10.44 |
See accompanying notes which are an integral part of the financial statements.
Annual Report
VIP Freedom 2025 Portfolio
Financial Statements - continued
Statement of Operations
| Year ended December 31, 2010 |
| | |
Investment Income | | |
Income distributions from underlying funds | | $ 827,824 |
| | |
Expenses | | |
Distribution and service plan fees | $ 30,185 | |
Independent trustees' compensation | 96 | |
Total expenses before reductions | 30,281 | |
Expense reductions | (96) | 30,185 |
Net investment income (loss) | | 797,639 |
Realized and Unrealized Gain (Loss) Realized gain (loss) on sale of underlying fund shares | 29,716 | |
Capital gain distributions from underlying funds | 129,963 | |
Total net realized gain (loss) | | 159,679 |
Change in net unrealized appreciation (depreciation) on underlying funds | | 3,475,839 |
Net gain (loss) | | 3,635,518 |
Net increase (decrease) in net assets resulting from operations | | $ 4,433,157 |
Statement of Changes in Net Assets
| Year ended December 31, 2010 | Year ended December 31, 2009 |
Increase (Decrease) in Net Assets | | |
Operations | | |
Net investment income (loss) | $ 797,639 | $ 674,709 |
Net realized gain (loss) | 159,679 | 143,781 |
Change in net unrealized appreciation (depreciation) | 3,475,839 | 4,000,337 |
Net increase (decrease) in net assets resulting from operations | 4,433,157 | 4,818,827 |
Distributions to shareholders from net investment income | (799,512) | (691,955) |
Distributions to shareholders from net realized gain | (217,768) | (250,694) |
Total distributions | (1,017,280) | (942,649) |
Share transactions - net increase (decrease) | 14,354,269 | 4,858,814 |
Total increase (decrease) in net assets | 17,770,146 | 8,734,992 |
| | |
Net Assets | | |
Beginning of period | 23,829,084 | 15,094,092 |
End of period (including undistributed net investment income of $0 and undistributed net investment income
of $2,322, respectively) | $ 41,599,230 | $ 23,829,084 |
See accompanying notes which are an integral part of the financial statements.
Annual Report
Financial Highlights - Initial Class
Years ended December 31, | 2010 | 2009 | 2008 | 2007 | 2006 |
Selected Per-Share Data | | | | | |
Net asset value, beginning of period | $ 9.30 | $ 7.49 | $ 12.71 | $ 12.18 | $ 11.16 |
Income from Investment Operations | | | | | |
Net investment income (loss) C | .28 | .32 | .31 | .38 | .23 |
Net realized and unrealized gain (loss) | 1.19 | 1.89 | (4.58) | .89 | 1.17 |
Total from investment operations | 1.47 | 2.21 | (4.27) | 1.27 | 1.40 |
Distributions from net investment income | (.21) | (.29) | (.28) | (.27) | (.21) |
Distributions from net realized gain | (.06) | (.12) | (.67) | (.47) | (.17) |
Total distributions | (.28) G | (.40) F | (.95) | (.74) | (.38) |
Net asset value, end of period | $ 10.49 | $ 9.30 | $ 7.49 | $ 12.71 | $ 12.18 |
Total Return A,B | 15.79% | 30.05% | (34.16)% | 10.50% | 12.49% |
Ratios to Average Net Assets D,E | | | | | |
Expenses before reductions | .00% | .00% | .00% | .00% | .00% |
Expenses net of fee waivers, if any | .00% | .00% | .00% | .00% | .00% |
Expenses net of all reductions | .00% | .00% | .00% | .00% | .00% |
Net investment income (loss) | 2.91% | 3.84% | 2.90% | 2.95% | 1.95% |
Supplemental Data | | | | | |
Net assets, end of period (000 omitted) | $ 17,388 | $ 14,888 | $ 11,015 | $ 15,197 | $ 8,363 |
Portfolio turnover rate | 25% | 30% | 36% | 20% | 49% |
A Total returns do not reflect charges attributable to your insurance company's separate account. Inclusion of these charges would reduce the total returns shown.
B Total returns would have been lower had certain expenses not been reduced during the periods shown.
C Calculated based on average shares outstanding during the period.
D Amounts do not include the activity of the underlying funds.
E Expense ratios reflect operating expenses of the class. Expenses before reductions do not reflect amounts reimbursed by the investment adviser or reductions from expense offset arrangements and do not represent the amount paid by the class during periods when reimbursements or reductions occur. Expenses net of fee waivers reflect expenses after reimbursement by the investment adviser but prior to reductions from expense offset arrangements. Expenses net of all reductions represent the net expenses paid by the class but do not include expenses of the investment companies in which the Fund invests.
F Total distributions of $.40 per share is comprised of distributions from net investment income of $.285 and distributions from net realized gain of $.117 per share.
G Total distributions of $.28 per share is comprised of distributions from net investment income of $.214 and distributions from net realized gain of $.061 per share.
Financial Highlights - Service Class
Years ended December 31, | 2010 | 2009 | 2008 | 2007 | 2006 |
Selected Per-Share Data | | | | | |
Net asset value, beginning of period | $ 9.30 | $ 7.49 | $ 12.70 | $ 12.18 | $ 11.16 |
Income from Investment Operations | | | | | |
Net investment income (loss) C | .27 | .31 | .29 | .37 | .22 |
Net realized and unrealized gain (loss) | 1.19 | 1.90 | (4.56) | .87 | 1.16 |
Total from investment operations | 1.46 | 2.21 | (4.27) | 1.24 | 1.38 |
Distributions from net investment income | (.21) | (.28) | (.27) | (.25) | (.19) |
Distributions from net realized gain | (.06) | (.12) | (.67) | (.47) | (.17) |
Total distributions | (.27) | (.40) F | (.94) | (.72) | (.36) |
Net asset value, end of period | $ 10.49 | $ 9.30 | $ 7.49 | $ 12.70 | $ 12.18 |
Total Return A,B | 15.70% | 29.96% | (34.20)% | 10.31% | 12.39% |
Ratios to Average Net Assets D,E | | | | | |
Expenses before reductions | .10% | .10% | .10% | .10% | .10% |
Expenses net of fee waivers, if any | .10% | .10% | .10% | .10% | .10% |
Expenses net of all reductions | .10% | .10% | .10% | .10% | .10% |
Net investment income (loss) | 2.81% | 3.74% | 2.80% | 2.85% | 1.85% |
Supplemental Data | | | | | |
Net assets, end of period (000 omitted) | $ 1,429 | $ 679 | $ 403 | $ 497 | $ 441 |
Portfolio turnover rate | 25% | 30% | 36% | 20% | 49% |
A Total returns do not reflect charges attributable to your insurance company's separate account. Inclusion of these charges would reduce the total returns shown.
B Total returns would have been lower had certain expenses not been reduced during the periods shown.
C Calculated based on average shares outstanding during the period.
D Amounts do not include the activity of the underlying funds.
E Expense ratios reflect operating expenses of the class. Expenses before reductions do not reflect amounts reimbursed by the investment adviser or reductions from expense offset arrangements and do not represent the amount paid by the class during periods when reimbursements or reductions occur. Expenses net of fee waivers reflect expenses after reimbursement by the investment adviser but prior to reductions from expense offset arrangements. Expenses net of all reductions represent the net expenses paid by the class but do not include expenses of the investment companies in which the Fund invests.
F Total distributions of $.40 per share is comprised of distributions from net investment income of $.278 and distributions from net realized gain of $.117 per share.
See accompanying notes which are an integral part of the financial statements.
Annual Report
Financial Highlights - Service Class 2
Years ended December 31, | 2010 | 2009 | 2008 | 2007 | 2006 |
Selected Per-Share Data | | | | | |
Net asset value, beginning of period | $ 9.27 | $ 7.47 | $ 12.68 | $ 12.17 | $ 11.16 |
Income from Investment Operations | | | | | |
Net investment income (loss) C | .26 | .30 | .28 | .35 | .20 |
Net realized and unrealized gain (loss) | 1.17 | 1.89 | (4.57) | .89 | 1.16 |
Total from investment operations | 1.43 | 2.19 | (4.29) | 1.24 | 1.36 |
Distributions from net investment income | (.20) | (.27) | (.25) | (.26) | (.18) |
Distributions from net realized gain | (.06) | (.12) | (.67) | (.47) | (.17) |
Total distributions | (.26) | (.39) F | (.92) | (.73) | (.35) |
Net asset value, end of period | $ 10.44 | $ 9.27 | $ 7.47 | $ 12.68 | $ 12.17 |
Total Return A,B | 15.47% | 29.79% | (34.36)% | 10.26% | 12.18% |
Ratios to Average Net Assets D,E | | | | | |
Expenses before reductions | .25% | .25% | .25% | .25% | .25% |
Expenses net of fee waivers, if any | .25% | .25% | .25% | .25% | .25% |
Expenses net of all reductions | .25% | .25% | .25% | .25% | .25% |
Net investment income (loss) | 2.67% | 3.59% | 2.65% | 2.70% | 1.70% |
Supplemental Data | | | | | |
Net assets, end of period (000 omitted) | $ 22,782 | $ 8,262 | $ 3,676 | $ 3,998 | $ 556 |
Portfolio turnover rate | 25% | 30% | 36% | 20% | 49% |
A Total returns do not reflect charges attributable to your insurance company's separate account. Inclusion of these charges would reduce the total returns shown.
B Total returns would have been lower had certain expenses not been reduced during the periods shown.
C Calculated based on average shares outstanding during the period.
D Amounts do not include the activity of the underlying funds.
E Expense ratios reflect operating expenses of the class. Expenses before reductions do not reflect amounts reimbursed by the investment adviser or reductions from expense offset arrangements and do not represent the amount paid by the class during periods when reimbursements or reductions occur. Expenses net of fee waivers reflect expenses after reimbursement by the investment adviser but prior to reductions from expense offset arrangements. Expenses net of all reductions represent the net expenses paid by the class but do not include expenses of the investment companies in which the Fund invests.
F Total distributions of $.39 per share is comprised of distributions from net investment income of $.270 and distributions from net realized gain of $.117 per share.
See accompanying notes which are an integral part of the financial statements.
Annual Report
VIP Freedom 2030 Portfolio
Investment Changes (Unaudited)
Fund Holdings as of December 31, 2010 |
| % of fund's
net assets | % of fund's net assets
6 months ago |
Domestic Equity Funds | | |
VIP Contrafund Portfolio Initial Class | 8.9 | 9.0 |
VIP Equity-Income Portfolio Initial Class | 10.4 | 10.5 |
VIP Growth & Income Portfolio Initial Class | 10.3 | 10.5 |
VIP Growth Portfolio Initial Class | 10.4 | 10.5 |
VIP Mid Cap Portfolio Initial Class | 3.6 | 3.8 |
VIP Value Portfolio Initial Class | 8.9 | 9.0 |
VIP Value Strategies Portfolio Initial Class | 3.8 | 3.7 |
| 56.3 | 57.0 |
Developed International Equity Funds | | |
VIP Overseas Portfolio Initial Class | 16.7 | 16.7 |
Emerging Markets Equity Funds | | |
VIP Emerging Markets Portfolio Initial Class | 2.8 | 1.6 |
High Yield Bond Funds | | |
VIP High Income Portfolio Initial Class | 7.2 | 7.5 |
Investment Grade Bond Funds | | |
VIP Investment Grade Bond Portfolio Initial Class | 17.0 | 17.2 |
Net Other Assets (Liabilities)* | 0.0 | 0.0 |
| 100.0 | 100.0 |
* Amount represents less than 0.1%. |
Asset Allocation (% of fund's net assets) |
Current |
| Domestic Equity Funds | 56.3% | |
| Developed International Equity Funds | 16.7% | |
| Emerging Markets Equity Funds | 2.8% | |
| High Yield Bond Funds | 7.2% | |
| Investment Grade Bond Funds | 17.0% | |

Six months ago |
| Domestic Equity Funds | 57.0% | |
| Developed International Equity Funds | 16.7% | |
| Emerging Markets Equity Funds | 1.6% | |
| High Yield Bond Funds | 7.5% | |
| Investment Grade Bond Funds | 17.2% | |

Expected |
| Domestic Equity Funds | 53.3% | |
| Developed International Equity Funds | 16.5% | |
| Emerging Markets Equity Funds | 2.9% | |
| High Yield Bond Funds | 7.5% | |
| Investment Grade Bond Funds | 19.8% | |

The fund invests according to an asset allocation strategy that becomes increasingly conservative over time. The six months ago allocation is based on the fund's holdings as of June 30, 2010. The current allocation is based on the fund's holdings as of December 31, 2010. The expected allocation represents the fund's anticipated allocation at June 30, 2011. |
Annual Report
VIP Freedom 2030 Portfolio
Investments December 31, 2010
Showing Percentage of Net Assets
Domestic Equity Funds - 56.3% |
| Shares | | Value |
Domestic Equity Funds - 56.3% |
VIP Contrafund Portfolio Initial Class | 378,315 | | $ 9,034,173 |
VIP Equity-Income Portfolio Initial Class | 555,409 | | 10,563,879 |
VIP Growth & Income Portfolio Initial Class | 831,977 | | 10,507,871 |
VIP Growth Portfolio Initial Class | 284,195 | | 10,540,781 |
VIP Mid Cap Portfolio Initial Class | 111,516 | | 3,645,467 |
VIP Value Portfolio Initial Class | 823,280 | | 9,056,080 |
VIP Value Strategies Portfolio Initial Class | 393,163 | | 3,829,405 |
TOTAL DOMESTIC EQUITY FUNDS (Cost $59,346,035) | 57,177,656 |
International Equity Funds - 19.5% |
| | | |
Developed International Equity Funds - 16.7% |
VIP Overseas Portfolio Initial Class | 1,012,931 | | 16,986,846 |
Emerging Markets Equity Funds - 2.8% |
VIP Emerging Markets Portfolio Initial Class | 285,447 | | 2,828,778 |
TOTAL INTERNATIONAL EQUITY FUNDS (Cost $20,501,492) | 19,815,624 |
Bond Funds - 24.2% |
| Shares | | Value |
High Yield Bond Funds - 7.2% |
VIP High Income Portfolio Initial Class | 1,311,666 | | $ 7,305,982 |
Investment Grade Bond Funds - 17.0% |
VIP Investment Grade Bond Portfolio Initial Class | 1,351,571 | | 17,340,660 |
TOTAL BOND FUNDS (Cost $24,938,846) | 24,646,642 |
TOTAL INVESTMENT PORTFOLIO - 100.0% (Cost $104,786,373) | | 101,639,922 |
NET OTHER ASSETS (LIABILITIES) - 0.0% | | (12,028) |
NET ASSETS - 100% | $ 101,627,894 |
Other Information |
All investments are categorized as Level 1 under the Fair Value Hierarchy. The inputs or methodology used for valuing securities may not be an indication of the risk associated with investing in those securities. For more information on valuation inputs, please refer to the Security Valuation section in the accompanying Notes to Financial Statements. |
See accompanying notes which are an integral part of the financial statements.
Annual Report
VIP Freedom 2030 Portfolio
Statement of Assets and Liabilities
| December 31, 2010 |
| | |
Assets | | |
Investment in securities, at value (cost $104,786,373) - See accompanying schedule | | $ 101,639,922 |
Cash | | 3,926 |
Receivable for investments sold | | 31,757 |
Receivable for fund shares sold | | 82,840 |
Total assets | | 101,758,445 |
| | |
Liabilities | | |
Payable for investments purchased | $ 40,616 | |
Payable for fund shares redeemed | 78,091 | |
Distribution and service plan fees payable | 11,844 | |
Total liabilities | | 130,551 |
| | |
Net Assets | | $ 101,627,894 |
Net Assets consist of: | | |
Paid in capital | | $ 105,833,590 |
Accumulated undistributed net realized gain (loss) on investments | | (1,059,245) |
Net unrealized appreciation (depreciation) on investments | | (3,146,451) |
Net Assets | | $ 101,627,894 |
Statement of Assets and Liabilities - continued
| December 31, 2010 |
| | |
Initial Class:
Net Asset Value, offering price and redemption price per share ($28,917,112 ÷ 2,832,051 shares) | | $ 10.21 |
| | |
Service Class:
Net Asset Value, offering price and redemption price per share ($23,136,926 ÷ 2,268,219 shares) | | $ 10.20 |
| | |
Service Class 2:
Net Asset Value, offering price and redemption price per share ($49,573,856 ÷ 4,870,551 shares) | | $ 10.18 |
See accompanying notes which are an integral part of the financial statements.
Annual Report
Statement of Operations
| Year ended December 31, 2010 |
| | |
Investment Income | | |
Income distributions from underlying funds | | $ 1,895,196 |
Interest | | 2 |
Total income | | 1,895,198 |
| | |
Expenses | | |
Distribution and service plan fees | $ 119,727 | |
Independent trustees' compensation | 291 | |
Total expenses before reductions | 120,018 | |
Expense reductions | (291) | 119,727 |
Net investment income (loss) | | 1,775,471 |
Realized and Unrealized Gain (Loss) Realized gain (loss) on sale of underlying fund shares | 198,708 | |
Capital gain distributions from underlying funds | 273,887 | |
Total net realized gain (loss) | | 472,595 |
Change in net unrealized appreciation (depreciation) on underlying funds | | 10,749,816 |
Net gain (loss) | | 11,222,411 |
Net increase (decrease) in net assets resulting from operations | | $ 12,997,882 |
Statement of Changes in Net Assets
| Year ended December 31, 2010 | Year ended December 31, 2009 |
Increase (Decrease) in Net Assets | | |
Operations | | |
Net investment income (loss) | $ 1,775,471 | $ 1,666,252 |
Net realized gain (loss) | 472,595 | 36,942 |
Change in net unrealized appreciation (depreciation) | 10,749,816 | 13,789,670 |
Net increase (decrease) in net assets resulting from operations | 12,997,882 | 15,492,864 |
Distributions to shareholders from net investment income | (1,775,488) | (1,389,018) |
Distributions to shareholders from net realized gain | (668,951) | (719,544) |
Total distributions | (2,444,439) | (2,108,562) |
Share transactions - net increase (decrease) | 16,267,172 | 12,259,496 |
Total increase (decrease) in net assets | 26,820,615 | 25,643,798 |
| | |
Net Assets | | |
Beginning of period | 74,807,279 | 49,163,481 |
End of period (including undistributed net investment income of $0 and undistributed net investment income
of $1,318, respectively) | $ 101,627,894 | $ 74,807,279 |
See accompanying notes which are an integral part of the financial statements.
Annual Report
Financial Highlights - Initial Class
Years ended December 31, | 2010 | 2009 | 2008 | 2007 | 2006 |
Selected Per-Share Data | | | | | |
Net asset value, beginning of period | $ 9.03 | $ 7.12 | $ 13.02 | $ 12.44 | $ 11.27 |
Income from Investment Operations | | | | | |
Net investment income (loss) C | .21 | .24 | .28 | .34 | .24 |
Net realized and unrealized gain (loss) | 1.24 | 1.96 | (5.14) | 1.06 | 1.25 |
Total from investment operations | 1.45 | 2.20 | (4.86) | 1.40 | 1.49 |
Distributions from net investment income | (.20) | (.18) | (.25) | (.28) | (.19) |
Distributions from net realized gain | (.07) | (.11) | (.80) | (.54) | (.13) |
Total distributions | (.27) | (.29) | (1.04) F | (.82) | (.32) |
Net asset value, end of period | $ 10.21 | $ 9.03 | $ 7.12 | $ 13.02 | $ 12.44 |
Total Return A,B | 16.08% | 31.66% | (38.04)% | 11.37% | 13.20% |
Ratios to Average Net Assets D,E | | | | | |
Expenses before reductions | .00% | .00% | .00% | .00% | .00% |
Expenses net of fee waivers, if any | .00% | .00% | .00% | .00% | .00% |
Expenses net of all reductions | .00% | .00% | .00% | .00% | .00% |
Net investment income (loss) | 2.25% | 3.13% | 2.69% | 2.56% | 2.05% |
Supplemental Data | | | | | |
Net assets, end of period (000 omitted) | $ 28,917 | $ 23,836 | $ 19,592 | $ 23,767 | $ 14,298 |
Portfolio turnover rate | 25% | 24% | 23% | 17% | 32% |
A Total returns do not reflect charges attributable to your insurance company's separate account. Inclusion of these charges would reduce the total returns shown.
B Total returns would have been lower had certain expenses not been reduced during the periods shown.
C Calculated based on average shares outstanding during the period.
D Amounts do not include the activity of the underlying funds.
E Expense ratios reflect operating expenses of the class. Expenses before reductions do not reflect amounts reimbursed by the investment adviser or reductions from expense offset arrangements and do not represent the amount paid by the class during periods when reimbursements or reductions occur. Expenses net of fee waivers reflect expenses after reimbursement by the investment adviser but prior to reductions from expense offset arrangements. Expenses net of all reductions represent the net expenses paid by the class but do not include expenses of the investment companies in which the Fund invests.
F Total distributions of $1.04 per share is comprised of distributions from net investment income of $.245 and distributions from net realized gain of $.795 per share.
Financial Highlights - Service Class
Years ended December 31, | 2010 | 2009 | 2008 | 2007 | 2006 |
Selected Per-Share Data | | | | | |
Net asset value, beginning of period | $ 9.02 | $ 7.12 | $ 13.01 | $ 12.44 | $ 11.27 |
Income from Investment Operations | | | | | |
Net investment income (loss) C | .20 | .24 | .27 | .33 | .23 |
Net realized and unrealized gain (loss) | 1.24 | 1.94 | (5.13) | 1.05 | 1.25 |
Total from investment operations | 1.44 | 2.18 | (4.86) | 1.38 | 1.48 |
Distributions from net investment income | (.19) | (.17) | (.24) | (.27) | (.18) |
Distributions from net realized gain | (.07) | (.11) | (.80) | (.54) | (.13) |
Total distributions | (.26) | (.28) | (1.03) F | (.81) | (.31) |
Net asset value, end of period | $ 10.20 | $ 9.02 | $ 7.12 | $ 13.01 | $ 12.44 |
Total Return A,B | 16.00% | 31.40% | (38.08)% | 11.21% | 13.15% |
Ratios to Average Net Assets D,E | | | | | |
Expenses before reductions | .10% | .10% | .10% | .10% | .10% |
Expenses net of fee waivers, if any | .10% | .10% | .10% | .10% | .10% |
Expenses net of all reductions | .10% | .10% | .10% | .10% | .10% |
Net investment income (loss) | 2.15% | 3.03% | 2.59% | 2.46% | 1.95% |
Supplemental Data | | | | | |
Net assets, end of period (000 omitted) | $ 23,137 | $ 16,162 | $ 10,298 | $ 12,884 | $ 3,867 |
Portfolio turnover rate | 25% | 24% | 23% | 17% | 32% |
A Total returns do not reflect charges attributable to your insurance company's separate account. Inclusion of these charges would reduce the total returns shown.
B Total returns would have been lower had certain expenses not been reduced during the periods shown.
C Calculated based on average shares outstanding during the period.
D Amounts do not include the activity of the underlying funds.
E Expense ratios reflect operating expenses of the class. Expenses before reductions do not reflect amounts reimbursed by the investment adviser or reductions from expense offset arrangements and do not represent the amount paid by the class during periods when reimbursements or reductions occur. Expenses net of fee waivers reflect expenses after reimbursement by the investment adviser but prior to reductions from expense offset arrangements. Expenses net of all reductions represent the net expenses paid by the class but do not include expenses of the investment companies in which the Fund invests.
F Total distributions of $1.03 per share is comprised of distributions from net investment income of $.235 and distributions from net realized gain of $.795 per share.
See accompanying notes which are an integral part of the financial statements.
Annual Report
Financial Highlights - Service Class 2
Years ended December 31, | 2010 | 2009 | 2008 | 2007 | 2006 |
Selected Per-Share Data | | | | | |
Net asset value, beginning of period | $ 9.00 | $ 7.11 | $ 12.99 | $ 12.42 | $ 11.26 |
Income from Investment Operations | | | | | |
Net investment income (loss) C | .19 | .23 | .26 | .31 | .21 |
Net realized and unrealized gain (loss) | 1.24 | 1.93 | (5.12) | 1.05 | 1.25 |
Total from investment operations | 1.43 | 2.16 | (4.86) | 1.36 | 1.46 |
Distributions from net investment income | (.17) | (.16) | (.22) | (.25) | (.17) |
Distributions from net realized gain | (.07) | (.11) | (.80) | (.54) | (.13) |
Total distributions | (.25) F | (.27) | (1.02) G | (.79) | (.30) |
Net asset value, end of period | $ 10.18 | $ 9.00 | $ 7.11 | $ 12.99 | $ 12.42 |
Total Return A,B | 15.89% | 31.18% | (38.17)% | 11.08% | 12.92% |
Ratios to Average Net Assets D,E | | | | | |
Expenses before reductions | .25% | .25% | .25% | .25% | .25% |
Expenses net of fee waivers, if any | .25% | .25% | .25% | .25% | .25% |
Expenses net of all reductions | .25% | .25% | .25% | .25% | .25% |
Net investment income (loss) | 2.01% | 2.88% | 2.44% | 2.31% | 1.80% |
Supplemental Data | | | | | |
Net assets, end of period (000 omitted) | $ 49,574 | $ 34,809 | $ 19,273 | $ 24,148 | $ 15,774 |
Portfolio turnover rate | 25% | 24% | 23% | 17% | 32% |
A Total returns do not reflect charges attributable to your insurance company's separate account. Inclusion of these charges would reduce the total returns shown.
B Total returns would have been lower had certain expenses not been reduced during the periods shown.
C Calculated based on average shares outstanding during the period.
D Amounts do not include the activity of the underlying funds.
E Expense ratios reflect operating expenses of the class. Expenses before reductions do not reflect amounts reimbursed by the investment adviser or reductions from expense offset arrangements and do not represent the amount paid by the class during periods when reimbursements or reductions occur. Expenses net of fee waivers reflect expenses after reimbursement by the investment adviser but prior to reductions from expense offset arrangements. Expenses net of all reductions represent the net expenses paid by the class but do not include expenses of the investment companies in which the Fund invests.
F Total distributions of $.25 per share is comprised of distributions from net investment income of $.173 and distributions from net realized gain of $.072 per share.
G Total distributions of $1.02 per share is comprised of distributions from net investment income of $.221 and distributions from net realized gain of $.795 per share.
See accompanying notes which are an integral part of the financial statements.
Annual Report
Fidelity VIP Freedom 2035 Portfolio
Investment Changes (Unaudited)
Fund Holdings as of December 31, 2010 |
| % of fund's
net assets | % of fund's net assets
6 months ago |
Domestic Equity Funds | | |
VIP Contrafund Portfolio Initial Class | 9.8 | 9.8 |
VIP Equity-Income Portfolio Initial Class | 11.5 | 11.5 |
VIP Growth & Income Portfolio Initial Class | 11.4 | 11.5 |
VIP Growth Portfolio Initial Class | 11.4 | 11.5 |
VIP Mid Cap Portfolio Initial Class | 4.0 | 4.1 |
VIP Value Portfolio Initial Class | 9.8 | 9.8 |
VIP Value Strategies Portfolio Initial Class | 4.2 | 4.1 |
| 62.1 | 62.3 |
Developed International Equity Funds | | |
VIP Overseas Portfolio Initial Class | 18.4 | 18.3 |
Emerging Markets Equity Funds | | |
VIP Emerging Markets Portfolio Initial Class | 3.0 | 1.7 |
High Yield Bond Funds | | |
VIP High Income Portfolio Initial Class | 7.1 | 7.6 |
Investment Grade Bond Funds | | |
VIP Investment Grade Bond Portfolio Initial Class | 9.4 | 10.1 |
Net Other Assets (Liabilities)* | 0.0 | 0.0 |
| 100.0 | 100.0 |
* Amount represents less than 0.1%. |
Asset Allocation (% of fund's net assets) |
Current |
| Domestic Equity Funds | 62.1% | |
| Developed International Equity Funds | 18.4% | |
| Emerging Markets Equity Funds | 3.0% | |
| High Yield Bond Funds | 7.1% | |
| Investment Grade Bond Funds | 9.4% | |

Six months ago |
| Domestic Equity Funds | 62.3% | |
| Developed International Equity Funds | 18.3% | |
| Emerging Markets Equity Funds | 1.7% | |
| High Yield Bond Funds | 7.6% | |
| Investment Grade Bond Funds | 10.1% | |

Expected |
| Domestic Equity Funds | 60.4% | |
| Developed International Equity Funds | 18.7% | |
| Emerging Markets Equity Funds | 3.3% | |
| High Yield Bond Funds | 7.5% | |
| Investment Grade Bond Funds | 10.1% | |

The fund invests according to an asset allocation strategy that becomes increasingly conservative over time. The six months ago allocation is based on the fund's holdings as of June 30, 2010. The current allocation is based on the fund's holdings as of December 31, 2010. The expected allocation represents the fund's anticipated allocation at June 30, 2011. |
Annual Report
Fidelity VIP Freedom 2035 Portfolio
Investments December 31, 2010
Showing Percentage of Net Assets
Domestic Equity Funds - 62.1% |
| Shares | | Value |
Domestic Equity Funds - 62.1% |
VIP Contrafund Portfolio Initial Class | 1,837 | | $ 43,866 |
VIP Equity-Income Portfolio Initial Class | 2,699 | | 51,338 |
VIP Growth & Income Portfolio Initial Class | 4,042 | | 51,050 |
VIP Growth Portfolio Initial Class | 1,380 | | 51,179 |
VIP Mid Cap Portfolio Initial Class | 541 | | 17,677 |
VIP Value Portfolio Initial Class | 4,003 | | 44,033 |
VIP Value Strategies Portfolio Initial Class | 1,911 | | 18,614 |
TOTAL DOMESTIC EQUITY FUNDS (Cost $178,172) | 277,757 |
International Equity Funds - 21.4% |
| | | |
Developed International Equity Funds - 18.4% |
VIP Overseas Portfolio Initial Class | 4,908 | | 82,304 |
Emerging Markets Equity Funds - 3.0% |
VIP Emerging Markets Portfolio Initial Class | 1,382 | | 13,699 |
TOTAL INTERNATIONAL EQUITY FUNDS (Cost $67,866) | 96,003 |
Bond Funds - 16.5% |
| Shares | | Value |
High Yield Bond Funds - 7.1% |
VIP High Income Portfolio Initial Class | 5,729 | | $ 31,908 |
Investment Grade Bond Funds - 9.4% |
VIP Investment Grade Bond Portfolio Initial Class | 3,272 | | 41,978 |
TOTAL BOND FUNDS (Cost $64,909) | 73,886 |
TOTAL INVESTMENT PORTFOLIO - 100.0% (Cost $310,947) | | 447,646 |
NET OTHER ASSETS (LIABILITIES) - 0.0% | | (58) |
NET ASSETS - 100% | $ 447,588 |
Other Information |
All investments are categorized as Level 1 under the Fair Value Hierarchy. The inputs or methodology used for valuing securities may not be an indication of the risk associated with investing in those securities. For more information on valuation inputs, please refer to the Security Valuation section in the accompanying Notes to Financial Statements. |
See accompanying notes which are an integral part of the financial statements.
Annual Report
Fidelity VIP Freedom 2035 Portfolio
Statement of Assets and Liabilities
| December 31, 2010 |
| | |
Assets | | |
Investment in securities, at value (cost $310,947) - See accompanying schedule | | $ 447,646 |
Receivable for investments sold | | 19 |
Total assets | | 447,665 |
| | |
Liabilities | | |
Payable for fund shares redeemed | $ 22 | |
Distribution and service plan fees payable | 55 | |
Total liabilities | | 77 |
| | |
Net Assets | | $ 447,588 |
Net Assets consist of: | | |
Paid in capital | | $ 310,471 |
Accumulated undistributed net realized gain (loss) on investments | | 418 |
Net unrealized appreciation (depreciation) on investments | | 136,699 |
Net Assets | | $ 447,588 |
Statement of Assets and Liabilities - continued
| December 31, 2010 |
| | |
Initial Class:
Net Asset Value, offering price and redemption price per share ($120,642 ÷ 8,185 shares) | | $ 14.74 |
| | |
Service Class:
Net Asset Value, offering price and redemption price per share ($115,591 ÷ 7,842 shares) | | $ 14.74 |
| | |
Service Class 2:
Net Asset Value, offering price and redemption price per share ($211,355 ÷ 14,356 shares) | | $ 14.72 |
See accompanying notes which are an integral part of the financial statements.
Annual Report
Fidelity VIP Freedom 2035 Portfolio
Financial Statements - continued
Statement of Operations
| Year ended December 31, 2010 |
| | |
Investment Income | | |
Income distributions from underlying funds | | $ 7,945 |
| | |
Expenses | | |
Distribution and service plan fees | $ 497 | |
Total expenses | | 497 |
Net investment income (loss) | | 7,448 |
Realized and Unrealized Gain (Loss) Realized gain (loss) on sale of underlying fund shares | 24,993 | |
Capital gain distributions from underlying funds | 946 | |
Total net realized gain (loss) | | 25,939 |
Change in net unrealized appreciation (depreciation) on underlying funds | | 27,693 |
Net gain (loss) | | 53,632 |
Net increase (decrease) in net assets resulting from operations | | $ 61,080 |
Statement of Changes in Net Assets
| Year ended December 31, 2010 | For the period
April 8, 2009 (commencement of operations) to December 31, 2009 |
Increase (Decrease) in Net Assets | | |
Operations | | |
Net investment income (loss) | $ 7,448 | $ 7,374 |
Net realized gain (loss) | 25,939 | 4,237 |
Change in net unrealized appreciation (depreciation) | 27,693 | 109,006 |
Net increase (decrease) in net assets resulting from operations | 61,080 | 120,617 |
Distributions to shareholders from net investment income | (7,448) | (7,372) |
Distributions to shareholders from net realized gain | (29,333) | (427) |
Total distributions | (36,781) | (7,799) |
Share transactions - net increase (decrease) | (3,350) | 313,821 |
Total increase (decrease) in net assets | 20,949 | 426,639 |
| | |
Net Assets | | |
Beginning of period | 426,639 | - |
End of period (including undistributed net investment income of $0 and undistributed net investment income
of $2, respectively) | $ 447,588 | $ 426,639 |
See accompanying notes which are an integral part of the financial statements.
Annual Report
Financial Highlights - Initial Class
Years ended December 31, | 2010 | 2009 F |
Selected Per-Share Data | | |
Net asset value, beginning of period | $ 13.74 | $ 10.00 |
Income from Investment Operations | | |
Net investment income (loss) D | .27 | .25 |
Net realized and unrealized gain (loss) | 2.04 | 3.76 |
Total from investment operations | 2.31 | 4.01 |
Distributions from net investment income | (.28) | (.25) |
Distributions from net realized gain | (1.03) | (.01) |
Total distributions | (1.31) | (.27) H |
Net asset value, end of period | $ 14.74 | $ 13.74 |
Total Return B,C | 17.01% | 40.04% |
Ratios to Average Net Assets E,G | | |
Expenses before reductions | .00% | .00% A |
Expenses net of fee waivers, if any | .00% | .00% A |
Expenses net of all reductions | .00% | .00% A |
Net investment income (loss) | 1.92% | 2.78% A |
Supplemental Data | | |
Net assets, end of period (000 omitted) | $ 121 | $ 144 |
Portfolio turnover rate | 38% | 5% A |
A Annualized
B Total returns for periods of less than one year are not annualized.
C Total returns do not reflect charges attributable to your insurance company's separate account. Inclusion of these charges would reduce the total returns shown.
D Calculated based on average shares outstanding during the period.
E Amounts do not include the activity of the underlying funds.
F For the period April 8, 2009 (commencement of operations) to December 31, 2009.
G Expense ratios reflect operating expenses of the class. Expenses before reductions do not reflect amounts reimbursed by the investment adviser or reductions from expense offset arrangements and do not represent the amount paid by the class during periods when reimbursements or reductions occur. Expenses net of fee waivers reflect expenses after reimbursement by the investment adviser but prior to reductions from expense offset arrangements. Expenses net of all reductions represent the net expenses paid by the class but do not include expenses of the investment companies in which the Fund invests.
H Total distributions of $.27 per share is comprised of distributions from net investment income of $.252 and distributions from net realized gain of $.014 per share.
Financial Highlights - Service Class
Years ended December 31, | 2010 | 2009 F |
Selected Per-Share Data | | |
Net asset value, beginning of period | $ 13.73 | $ 10.00 |
Income from Investment Operations | | |
Net investment income (loss) D | .26 | .24 |
Net realized and unrealized gain (loss) | 2.04 | 3.75 |
Total from investment operations | 2.30 | 3.99 |
Distributions from net investment income | (.26) | (.24) |
Distributions from net realized gain | (1.03) | (.01) |
Total distributions | (1.29) | (.26) H |
Net asset value, end of period | $ 14.74 | $ 13.73 |
Total Return B,C | 16.97% | 39.85% |
Ratios to Average Net Assets E,G | | |
Expenses before reductions | .10% | .10% A |
Expenses net of fee waivers, if any | .10% | .10% A |
Expenses net of all reductions | .10% | .10% A |
Net investment income (loss) | 1.82% | 2.68% A |
Supplemental Data | | |
Net assets, end of period (000 omitted) | $ 116 | $ 140 |
Portfolio turnover rate | 38% | 5% A |
A Annualized
B Total returns for periods of less than one year are not annualized.
C Total returns do not reflect charges attributable to your insurance company's separate account. Inclusion of these charges would reduce the total returns shown.
D Calculated based on average shares outstanding during the period.
E Amounts do not include the activity of the underlying funds.
F For the period April 8, 2009 (commencement of operations) to December 31, 2009.
G Expense ratios reflect operating expenses of the class. Expenses before reductions do not reflect amounts reimbursed by the investment adviser or reductions from expense offset arrangements and do not represent the amount paid by the class during periods when reimbursements or reductions occur. Expenses net of fee waivers reflect expenses after reimbursement by the investment adviser but prior to reductions from expense offset arrangements. Expenses net of all reductions represent the net expenses paid by the class but do not include expenses of the investment companies in which the Fund invests.
H Total distributions of $.26 per share is comprised of distributions from net investment income of $.243 and distributions from net realized gain of $.014 per share.
See accompanying notes which are an integral part of the financial statements.
Annual Report
Financial Highlights - Service Class 2
Years ended December 31, | 2010 | 2009 F |
Selected Per-Share Data | | |
Net asset value, beginning of period | $ 13.73 | $ 10.00 |
Income from Investment Operations | | |
Net investment income (loss) D | .24 | .23 |
Net realized and unrealized gain (loss) | 2.03 | 3.74 |
Total from investment operations | 2.27 | 3.97 |
Distributions from net investment income | (.26) | (.23) |
Distributions from net realized gain | (1.03) | (.01) |
Total distributions | (1.28) H | (.24) I |
Net asset value, end of period | $ 14.72 | $ 13.73 |
Total Return B,C | 16.76% | 39.72% |
Ratios to Average Net Assets E,G | | |
Expenses before reductions | .25% | .25% A |
Expenses net of fee waivers, if any | .25% | .25% A |
Expenses net of all reductions | .25% | .25% A |
Net investment income (loss) | 1.67% | 2.53% A |
Supplemental Data | | |
Net assets, end of period (000 omitted) | $ 211 | $ 143 |
Portfolio turnover rate | 38% | 5% A |
A Annualized
B Total returns for periods of less than one year are not annualized.
C Total returns do not reflect charges attributable to your insurance company's separate account. Inclusion of these charges would reduce the total returns shown.
D Calculated based on average shares outstanding during the period.
E Amounts do not include the activity of the underlying funds.
F For the period April 8, 2009 (commencement of operations) to December 31, 2009.
G Expense ratios reflect operating expenses of the class. Expenses before reductions do not reflect amounts reimbursed by the investment adviser or reductions from expense offset arrangements and do not represent the amount paid by the class during periods when reimbursements or reductions occur. Expenses net of fee waivers reflect expenses after reimbursement by the investment adviser but prior to reductions from expense offset arrangements. Expenses net of all reductions represent the net expenses paid by the class but do not include expenses of the investment companies in which the Fund invests.
H Total distributions of $1.28 per share is comprised of distributions from net investment income of $.255 and distributions from net realized gain of $1.029 per share.
I Total distributions of $.24 per share is comprised of distributions from net investment income of $.230 and distributions from net realized gain of $.014 per share.
See accompanying notes which are an integral part of the financial statements.
Annual Report
Fidelity VIP Freedom 2040 Portfolio
Investment Changes (Unaudited)
Fund Holdings as of December 31, 2010 |
| % of fund's
net assets | % of fund's net assets
6 months ago |
Domestic Equity Funds | | |
VIP Contrafund Portfolio Initial Class | 9.9 | 10.0 |
VIP Equity-Income Portfolio Initial Class | 11.5 | 11.6 |
VIP Growth & Income Portfolio Initial Class | 11.5 | 11.6 |
VIP Growth Portfolio Initial Class | 11.5 | 11.6 |
VIP Mid Cap Portfolio Initial Class | 4.0 | 4.2 |
VIP Value Portfolio Initial Class | 9.9 | 10.0 |
VIP Value Strategies Portfolio Initial Class | 4.2 | 4.2 |
| 62.5 | 63.2 |
Developed International Equity Funds | | |
VIP Overseas Portfolio Initial Class | 18.6 | 18.5 |
Emerging Markets Equity Funds | | |
VIP Emerging Markets Portfolio Initial Class | 3.2 | 1.8 |
High Yield Bond Funds | | |
VIP High Income Portfolio Initial Class | 8.1 | 8.8 |
Investment Grade Bond Funds | | |
VIP Investment Grade Bond Portfolio Initial Class | 7.6 | 7.7 |
Net Other Assets (Liabilities)* | 0.0 | 0.0 |
| 100.0 | 100.0 |
* Amount represents less than 0.1%. |
Asset Allocation (% of fund's net assets) |
Current |
| Domestic Equity Funds | 62.5% | |
| Developed International Equity Funds | 18.6% | |
| Emerging Markets Equity Funds | 3.2% | |
| High Yield Bond Funds | 8.1% | |
| Investment Grade Bond Funds | 7.6% | |

Six months ago |
| Domestic Equity Funds | 63.2% | |
| Developed International Equity Funds | 18.5% | |
| Emerging Markets Equity Funds | 1.8% | |
| High Yield Bond Funds | 8.8% | |
| Investment Grade Bond Funds | 7.7% | |

Expected |
| Domestic Equity Funds | 60.9% | |
| Developed International Equity Funds | 18.9% | |
| Emerging Markets Equity Funds | 3.3% | |
| High Yield Bond Funds | 8.1% | |
| Investment Grade Bond Funds | 8.8% | |

The fund invests according to an asset allocation strategy that becomes increasingly conservative over time. The six months ago allocation is based on the fund's holdings as of June 30, 2010. The current allocation is based on the fund's holdings as of December 31, 2010. The expected allocation represents the fund's anticipated allocation at June 30, 2011. |
Annual Report
Fidelity VIP Freedom 2040 Portfolio
Investments December 31, 2010
Showing Percentage of Net Assets
Domestic Equity Funds - 62.5% |
| Shares | | Value |
Domestic Equity Funds - 62.5% |
VIP Contrafund Portfolio Initial Class | 2,228 | | $ 53,208 |
VIP Equity-Income Portfolio Initial Class | 3,273 | | 62,260 |
VIP Growth & Income Portfolio Initial Class | 4,901 | | 61,898 |
VIP Growth Portfolio Initial Class | 1,672 | | 62,028 |
VIP Mid Cap Portfolio Initial Class | 658 | | 21,506 |
VIP Value Portfolio Initial Class | 4,849 | | 53,344 |
VIP Value Strategies Portfolio Initial Class | 2,314 | | 22,534 |
TOTAL DOMESTIC EQUITY FUNDS (Cost $227,946) | 336,778 |
International Equity Funds - 21.8% |
| | | |
Developed International Equity Funds - 18.6% |
VIP Overseas Portfolio Initial Class | 5,981 | | 100,296 |
Emerging Markets Equity Funds - 3.2% |
VIP Emerging Markets Portfolio Initial Class | 1,702 | | 16,868 |
TOTAL INTERNATIONAL EQUITY FUNDS (Cost $86,193) | 117,164 |
Bond Funds - 15.7% |
| Shares | | Value |
High Yield Bond Funds - 8.1% |
VIP High Income Portfolio Initial Class | 7,826 | | $ 43,592 |
Investment Grade Bond Funds - 7.6% |
VIP Investment Grade Bond Portfolio Initial Class | 3,187 | | 40,894 |
TOTAL BOND FUNDS (Cost $75,740) | 84,486 |
TOTAL INVESTMENT PORTFOLIO - 100.0% (Cost $389,879) | | 538,428 |
NET OTHER ASSETS (LIABILITIES) - 0.0% | | (41) |
NET ASSETS - 100% | $ 538,387 |
Other Information |
All investments are categorized as Level 1 under the Fair Value Hierarchy. The inputs or methodology used for valuing securities may not be an indication of the risk associated with investing in those securities. For more information on valuation inputs, please refer to the Security Valuation section in the accompanying Notes to Financial Statements. |
See accompanying notes which are an integral part of the financial statements.
Annual Report
Fidelity VIP Freedom 2040 Portfolio
Statement of Assets and Liabilities
| December 31, 2010 |
| | |
Assets | | |
Investment in securities, at value (cost $389,879) - See accompanying schedule | | $ 538,428 |
Receivable for investments sold | | 38 |
Receivable for fund shares sold | | 708 |
Total assets | | 539,174 |
| | |
Liabilities | | |
Payable for investments purchased | $ 679 | |
Payable for fund shares redeemed | 68 | |
Distribution and service plan fees payable | 40 | |
Total liabilities | | 787 |
| | |
Net Assets | | $ 538,387 |
Net Assets consist of: | | |
Paid in capital | | $ 390,809 |
Accumulated undistributed net realized gain (loss) on investments | | (971) |
Net unrealized appreciation (depreciation) on investments | | 148,549 |
Net Assets | | $ 538,387 |
Statement of Assets and Liabilities - continued
| December 31, 2010 |
| | |
Initial Class:
Net Asset Value, offering price and redemption price per share ($278,086 ÷ 19,830 shares) | | $ 14.02 |
| | |
Service Class:
Net Asset Value, offering price and redemption price per share ($116,488 ÷ 8,306 shares) | | $ 14.02 |
| | |
Service Class 2:
Net Asset Value, offering price and redemption price per share ($143,813 ÷ 10,258 shares) | | $ 14.02 |
See accompanying notes which are an integral part of the financial statements.
Annual Report
Statement of Operations
| Year ended December 31, 2010 |
| | |
Investment Income | | |
Income distributions from underlying funds | | $ 9,237 |
| | |
Expenses | | |
Distribution and service plan fees | $ 475 | |
Total expenses | | 475 |
Net investment income (loss) | | 8,762 |
Realized and Unrealized Gain (Loss) Realized gain (loss) on sale of underlying fund shares | 55,794 | |
Capital gain distributions from underlying funds | 981 | |
Total net realized gain (loss) | | 56,775 |
Change in net unrealized appreciation (depreciation) on underlying funds | | 37,318 |
Net gain (loss) | | 94,093 |
Net increase (decrease) in net assets resulting from operations | | $ 102,855 |
Statement of Changes in Net Assets
| Year ended December 31, 2010 | For the period
April 8, 2009 (commencement of operations) to December 31, 2009 |
Increase (Decrease) in Net Assets | | |
Operations | | |
Net investment income (loss) | $ 8,762 | $ 7,469 |
Net realized gain (loss) | 56,775 | 4,686 |
Change in net unrealized appreciation (depreciation) | 37,318 | 111,231 |
Net increase (decrease) in net assets resulting from operations | 102,855 | 123,386 |
Distributions to shareholders from net investment income | (8,846) | (7,467) |
Distributions to shareholders from net realized gain | (62,347) | (424) |
Total distributions | (71,193) | (7,891) |
Share transactions - net increase (decrease) | 80,183 | 311,047 |
Total increase (decrease) in net assets | 111,845 | 426,542 |
| | |
Net Assets | | |
Beginning of period | 426,542 | - |
End of period (including undistributed net investment income of $0 and undistributed net investment income
of $2, respectively) | $ 538,387 | $ 426,542 |
See accompanying notes which are an integral part of the financial statements.
Annual Report
Financial Highlights - Initial Class
Years ended December 31, | 2010 | 2009 F |
Selected Per-Share Data | | |
Net asset value, beginning of period | $ 13.82 | $ 10.00 |
Income from Investment Operations | | |
Net investment income (loss) D | .20 | .26 |
Net realized and unrealized gain (loss) | 2.15 | 3.83 |
Total from investment operations | 2.35 | 4.09 |
Distributions from net investment income | (.28) | (.26) |
Distributions from net realized gain | (1.87) | (.01) |
Total distributions | (2.15) | (.27) H |
Net asset value, end of period | $ 14.02 | $ 13.82 |
Total Return B,C | 17.19% | 40.89% |
Ratios to Average Net Assets E,G | | |
Expenses before reductions | .00% | .00% A |
Expenses net of fee waivers, if any | .00% | .00% A |
Expenses net of all reductions | .00% | .00% A |
Net investment income (loss) | 1.46% | 2.81% A |
Supplemental Data | | |
Net assets, end of period (000 omitted) | $ 278 | $ 145 |
Portfolio turnover rate | 194% | 5% A |
A Annualized
B Total returns for periods of less than one year are not annualized.
C Total returns do not reflect charges attributable to your insurance company's separate account. Inclusion of these charges would reduce the total returns shown.
D Calculated based on average shares outstanding during the period.
E Amounts do not include the activity of the underlying funds.
F For the period April 8, 2009 (commencement of operations) to December 31, 2009.
G Expense ratios reflect operating expenses of the class. Expenses before reductions do not reflect amounts reimbursed by the investment adviser or reductions from expense offset arrangements and do not represent the amount paid by the class during periods when reimbursements or reductions occur. Expenses net of fee waivers reflect expenses after reimbursement by the investment adviser but prior to reductions from expense offset arrangements. Expenses net of all reductions represent the net expenses paid by the class but do not include expenses of the investment companies in which the Fund invests.
H Total distributions of $.27 per share is comprised of distributions from net investment income of $.257 and distributions from net realized gain of $.014 per share.
Financial Highlights - Service Class
Years ended December 31, | 2010 | 2009 F |
Selected Per-Share Data | | |
Net asset value, beginning of period | $ 13.82 | $ 10.00 |
Income from Investment Operations | �� | |
Net investment income (loss) D | .19 | .25 |
Net realized and unrealized gain (loss) | 2.14 | 3.83 |
Total from investment operations | 2.33 | 4.08 |
Distributions from net investment income | (.26) | (.25) |
Distributions from net realized gain | (1.87) | (.01) |
Total distributions | (2.13) | (.26) H |
Net asset value, end of period | $ 14.02 | $ 13.82 |
Total Return B,C | 17.05% | 40.80% |
Ratios to Average Net Assets E,G | | |
Expenses before reductions | .10% | .10% A |
Expenses net of fee waivers, if any | .10% | .10% A |
Expenses net of all reductions | .10% | .10% A |
Net investment income (loss) | 1.36% | 2.71% A |
Supplemental Data | | |
Net assets, end of period (000 omitted) | $ 116 | $ 141 |
Portfolio turnover rate | 194% | 5% A |
A Annualized
B Total returns for periods of less than one year are not annualized.
C Total returns do not reflect charges attributable to your insurance company's separate account. Inclusion of these charges would reduce the total returns shown.
D Calculated based on average shares outstanding during the period.
E Amounts do not include the activity of the underlying funds.
F For the period April 8, 2009 (commencement of operations) to December 31, 2009.
G Expense ratios reflect operating expenses of the class. Expenses before reductions do not reflect amounts reimbursed by the investment adviser or reductions from expense offset arrangements and do not represent the amount paid by the class during periods when reimbursements or reductions occur. Expenses net of fee waivers reflect expenses after reimbursement by the investment adviser but prior to reductions from expense offset arrangements. Expenses net of all reductions represent the net expenses paid by the class but do not include expenses of the investment companies in which the Fund invests.
H Total distributions of $.26 per share is comprised of distributions from net investment income of $.248 and distributions from net realized gain of $.014 per share.
See accompanying notes which are an integral part of the financial statements.
Annual Report
Financial Highlights - Service Class 2
Years ended December 31, | 2010 | 2009 F |
Selected Per-Share Data | | |
Net asset value, beginning of period | $ 13.82 | $ 10.00 |
Income from Investment Operations | | |
Net investment income (loss) D | .17 | .23 |
Net realized and unrealized gain (loss) | 2.14 | 3.84 |
Total from investment operations | 2.31 | 4.07 |
Distributions from net investment income | (.24) | (.23) |
Distributions from net realized gain | (1.87) | (.01) |
Total distributions | (2.11) | (.25) H |
Net asset value, end of period | $ 14.02 | $ 13.82 |
Total Return B,C | 16.92% | 40.66% |
Ratios to Average Net Assets E,G | | |
Expenses before reductions | .25% | .25% A |
Expenses net of fee waivers, if any | .25% | .25% A |
Expenses net of all reductions | .25% | .25% A |
Net investment income (loss) | 1.21% | 2.56% A |
Supplemental Data | | |
Net assets, end of period (000 omitted) | $ 144 | $ 141 |
Portfolio turnover rate | 194% | 5% A |
A Annualized
B Total returns for periods of less than one year are not annualized.
C Total returns do not reflect charges attributable to your insurance company's separate account. Inclusion of these charges would reduce the total returns shown.
D Calculated based on average shares outstanding during the period.
E Amounts do not include the activity of the underlying funds.
F For the period April 8, 2009 (commencement of operations) to December 31, 2009.
G Expense ratios reflect operating expenses of the class. Expenses before reductions do not reflect amounts reimbursed by the investment adviser or reductions from expense offset arrangements and do not represent the amount paid by the class during periods when reimbursements or reductions occur. Expenses net of fee waivers reflect expenses after reimbursement by the investment adviser but prior to reductions from expense offset arrangements. Expenses net of all reductions represent the net expenses paid by the class but do not include expenses of the investment companies in which the Fund invests.
H Total distributions of $.25 per share is comprised of distributions from net investment income of $.234 and distributions from net realized gain of $.014 per share.
See accompanying notes which are an integral part of the financial statements.
Annual Report
Fidelity VIP Freedom 2045 Portfolio
Investment Changes (Unaudited)
Fund Holdings as of December 31, 2010 |
| % of fund's
net assets | % of fund's net assets
6 months ago |
Domestic Equity Funds | | |
VIP Contrafund Portfolio Initial Class | 10.1 | 10.2 |
VIP Equity-Income Portfolio Initial Class | 11.8 | 11.8 |
VIP Growth & Income Portfolio Initial Class | 11.7 | 11.8 |
VIP Growth Portfolio Initial Class | 11.8 | 11.8 |
VIP Mid Cap Portfolio Initial Class | 4.0 | 4.2 |
VIP Value Portfolio Initial Class | 10.1 | 10.2 |
VIP Value Strategies Portfolio Initial Class | 4.3 | 4.2 |
| 63.8 | 64.2 |
Developed International Equity Funds | | |
VIP Overseas Portfolio Initial Class | 18.9 | 18.9 |
Emerging Markets Equity Funds | | |
VIP Emerging Markets Portfolio Initial Class | 3.1 | 1.8 |
High Yield Bond Funds | | |
VIP High Income Portfolio Initial Class | 9.5 | 10.1 |
Investment Grade Bond Funds | | |
VIP Investment Grade Bond Portfolio Initial Class | 4.7 | 5.0 |
Net Other Assets (Liabilities)* | 0.0 | 0.0 |
| 100.0 | 100.0 |
* Amount represents less than 0.1%. |
Asset Allocation (% of fund's net assets) |
Current |
| Domestic Equity Funds | 63.8% | |
| Developed International Equity Funds | 18.9% | |
| Emerging Markets Equity Funds | 3.1% | |
| High Yield Bond Funds | 9.5% | |
| Investment Grade Bond Funds | 4.7% | |

Six months ago |
| Domestic Equity Funds | 64.2% | |
| Developed International Equity Funds | 18.9% | |
| Emerging Markets Equity Funds | 1.8% | |
| High Yield Bond Funds | 10.1% | |
| Investment Grade Bond Funds | 5.0% | |

Expected |
| Domestic Equity Funds | 62.3% | |
| Developed International Equity Funds | 19.3% | |
| Emerging Markets Equity Funds | 3.4% | |
| High Yield Bond Funds | 10.0% | |
| Investment Grade Bond Funds | 5.0% | |

The fund invests according to an asset allocation strategy that becomes increasingly conservative over time. The six months ago allocation is based on the fund's holdings as of June 30, 2010. The current allocation is based on the fund's holdings as of December 31, 2010. The expected allocation represents the fund's anticipated allocation at June 30, 2011. |
Annual Report
Fidelity VIP Freedom 2045 Portfolio
Investments December 31, 2010
Showing Percentage of Net Assets
Domestic Equity Funds - 63.8% |
| Shares | | Value |
Domestic Equity Funds - 63.8% |
VIP Contrafund Portfolio Initial Class | 1,535 | | $ 36,657 |
VIP Equity-Income Portfolio Initial Class | 2,255 | | 42,898 |
VIP Growth & Income Portfolio Initial Class | 3,378 | | 42,670 |
VIP Growth Portfolio Initial Class | 1,155 | | 42,822 |
VIP Mid Cap Portfolio Initial Class | 452 | | 14,767 |
VIP Value Portfolio Initial Class | 3,345 | | 36,791 |
VIP Value Strategies Portfolio Initial Class | 1,597 | | 15,553 |
TOTAL DOMESTIC EQUITY FUNDS (Cost $139,250) | 232,158 |
International Equity Funds - 22.0% |
| | | |
Developed International Equity Funds - 18.9% |
VIP Overseas Portfolio Initial Class | 4,101 | | 68,778 |
Emerging Markets Equity Funds - 3.1% |
VIP Emerging Markets Portfolio Initial Class | 1,155 | | 11,444 |
TOTAL INTERNATIONAL EQUITY FUNDS (Cost $53,214) | 80,222 |
Bond Funds - 14.2% |
| Shares | | Value |
High Yield Bond Funds - 9.5% |
VIP High Income Portfolio Initial Class | 6,185 | | $ 34,453 |
Investment Grade Bond Funds - 4.7% |
VIP Investment Grade Bond Portfolio Initial Class | 1,329 | | 17,049 |
TOTAL BOND FUNDS (Cost $42,014) | 51,502 |
TOTAL INVESTMENT PORTFOLIO - 100.0% (Cost $234,478) | | 363,882 |
NET OTHER ASSETS (LIABILITIES) - 0.0% | | (34) |
NET ASSETS - 100% | $ 363,848 |
Other Information |
All investments are categorized as Level 1 under the Fair Value Hierarchy. The inputs or methodology used for valuing securities may not be an indication of the risk associated with investing in those securities. For more information on valuation inputs, please refer to the Security Valuation section in the accompanying Notes to Financial Statements. |
See accompanying notes which are an integral part of the financial statements.
Annual Report
Fidelity VIP Freedom 2045 Portfolio
Statement of Assets and Liabilities
| December 31, 2010 |
| | |
Assets | | |
Investment in securities, at value (cost $234,478) - See accompanying schedule | | $ 363,882 |
Receivable for investments sold | | 19 |
Total assets | | 363,901 |
| | |
Liabilities | | |
Payable for fund shares redeemed | $ 16 | |
Distribution and service plan fees payable | 37 | |
Total liabilities | | 53 |
| | |
Net Assets | | $ 363,848 |
Net Assets consist of: | | |
Paid in capital | | $ 226,825 |
Accumulated undistributed net realized gain (loss) on investments | | 7,619 |
Net unrealized appreciation (depreciation) on investments | | 129,404 |
Net Assets | | $ 363,848 |
Statement of Assets and Liabilities - continued
| December 31, 2010 |
| | |
Initial Class:
Net Asset Value, offering price and redemption price per share ($120,735 ÷ 8,261.4 shares) | | $ 14.61 |
| | |
Service Class:
Net Asset Value, offering price and redemption price per share ($117,015 ÷ 8,006.7 shares) | | $ 14.61 |
| | |
Service Class 2:
Net Asset Value, offering price and redemption price per share ($126,098 ÷ 8,630.0 shares) | | $ 14.61 |
See accompanying notes which are an integral part of the financial statements.
Annual Report
Fidelity VIP Freedom 2045 Portfolio
Financial Statements - continued
Statement of Operations
| Year ended December 31, 2010 |
| | |
Investment Income | | |
Income distributions from underlying funds | | $ 6,616 |
| | |
Expenses | | |
Distribution and service plan fees | $ 465 | |
Total expenses | | 465 |
Net investment income (loss) | | 6,151 |
Realized and Unrealized Gain (Loss) Realized gain (loss) on sale of underlying fund shares | 34,301 | |
Capital gain distributions from underlying funds | 604 | |
Total net realized gain (loss) | | 34,905 |
Change in net unrealized appreciation (depreciation) on underlying funds | | 16,858 |
Net gain (loss) | | 51,763 |
Net increase (decrease) in net assets resulting from operations | | $ 57,914 |
Statement of Changes in Net Assets
| Year ended December 31, 2010 | For the period
April 8, 2009 (commencement of operations) to December 31, 2009 |
Increase (Decrease) in Net Assets | | |
Operations | | |
Net investment income (loss) | $ 6,151 | $ 7,535 |
Net realized gain (loss) | 34,905 | 4,335 |
Change in net unrealized appreciation (depreciation) | 16,858 | 112,546 |
Net increase (decrease) in net assets resulting from operations | 57,914 | 124,416 |
Distributions to shareholders from net investment income | (6,187) | (7,534) |
Distributions to shareholders from net realized gain | (31,255) | (333) |
Total distributions | (37,442) | (7,867) |
Share transactions - net increase (decrease) | (84,084) | 310,911 |
Total increase (decrease) in net assets | (63,612) | 427,460 |
| | |
Net Assets | | |
Beginning of period | 427,460 | - |
End of period | $ 363,848 | $ 427,460 |
See accompanying notes which are an integral part of the financial statements.
Annual Report
Financial Highlights - Initial Class
Years ended December 31, | 2010 | 2009 F |
Selected Per-Share Data | | |
Net asset value, beginning of period | $ 13.86 | $ 10.00 |
Income from Investment Operations | | |
Net investment income (loss) D | .24 | .26 |
Net realized and unrealized gain (loss) | 2.14 | 3.87 |
Total from investment operations | 2.38 | 4.13 |
Distributions from net investment income | (.29) | (.26) |
Distributions from net realized gain | (1.34) | (.01) |
Total distributions | (1.63) | (.27) |
Net asset value, end of period | $ 14.61 | $ 13.86 |
Total Return B,C | 17.37% | 41.28% |
Ratios to Average Net Assets E,G | | |
Expenses before reductions | .00% | .00% A |
Expenses net of fee waivers, if any | .00% | .00%A |
Expenses net of all reductions | .00% | .00%A |
Net investment income (loss) | 1.65% | 2.83%A |
Supplemental Data | | |
Net assets, end of period (000 omitted) | $ 121 | $ 145 |
Portfolio turnover rate | 17% | 5%A |
A Annualized
B Total returns for periods of less than one year are not annualized.
C Total returns do not reflect charges attributable to your insurance company's separate account. Inclusion of these charges would reduce the total returns shown.
D Calculated based on average shares outstanding during the period.
E Amounts do not include the activity of the underlying funds.
F For the period April 8, 2009 (commencement of operations) to December 31, 2009.
G Expense ratios reflect operating expenses of the class. Expenses before reductions do not reflect amounts reimbursed by the investment adviser or reductions from expense offset arrangements and do not represent the amount paid by the class during periods when reimbursements or reductions occur. Expenses net of fee waivers reflect expenses after reimbursement by the investment adviser but prior to reductions from expense offset arrangements. Expenses net of all reductions represent the net expenses paid by the class but do not include expenses of the investment companies in which the Fund invests.
Financial Highlights - Service Class
Years ended December 31, | 2010 | 2009 F |
Selected Per-Share Data | | |
Net asset value, beginning of period | $ 13.86 | $ 10.00 |
Income from Investment Operations | | |
Net investment income (loss) D | .22 | .25 |
Net realized and unrealized gain (loss) | 2.14 | 3.87 |
Total from investment operations | 2.36 | 4.12 |
Distributions from net investment income | (.28) | (.25) |
Distributions from net realized gain | (1.34) | (.01) |
Total distributions | (1.61) H | (.26) |
Net asset value, end of period | $ 14.61 | $ 13.86 |
Total Return B,C | 17.23% | 41.19% |
Ratios to Average Net Assets E,G | | |
Expenses before reductions | .10% | .10%A |
Expenses net of fee waivers, if any | .10% | .10%A |
Expenses net of all reductions | .10% | .10%A |
Net investment income (loss) | 1.55% | 2.73%A |
Supplemental Data | | |
Net assets, end of period (000 omitted) | $ 117 | $ 141 |
Portfolio turnover rate | 17% | 5%A |
A Annualized
B Total returns for periods of less than one year are not annualized.
C Total returns do not reflect charges attributable to your insurance company's separate account. Inclusion of these charges would reduce the total returns shown.
D Calculated based on average shares outstanding during the period.
E Amounts do not include the activity of the underlying funds.
F For the period April 8, 2009 (commencement of operations) to December 31, 2009.
G Expense ratios reflect operating expenses of the class. Expenses before reductions do not reflect amounts reimbursed by the investment adviser or reductions from expense offset arrangements and do not represent the amount paid by the class during periods when reimbursements or reductions occur. Expenses net of fee waivers reflect expenses after reimbursement by the investment adviser but prior to reductions from expense offset arrangements. Expenses net of all reductions represent the net expenses paid by the class but do not include expenses of the investment companies in which the Fund invests.
H Total distributions of $1.61 per share is comprised of distributions from net investment income of $.276 and distributions from net realized gain of $1.335 per share.
See accompanying notes which are an integral part of the financial statements.
Annual Report
Financial Highlights - Service Class 2
Years ended December 31, | 2010 | 2009 F |
Selected Per-Share Data | | |
Net asset value, beginning of period | $ 13.85 | $ 10.00 |
Income from Investment Operations | | |
Net investment income (loss) D | .20 | .24 |
Net realized and unrealized gain (loss) | 2.15 | 3.86 |
Total from investment operations | 2.35 | 4.10 |
Distributions from net investment income | (.25) | (.24) |
Distributions from net realized gain | (1.34) | (.01) |
Total distributions | (1.59) | (.25) |
Net asset value, end of period | $ 14.61 | $ 13.85 |
Total Return B,C | 17.15% | 40.96% |
Ratios to Average Net Assets E,G | | |
Expenses before reductions | .25% | .25%A |
Expenses net of fee waivers, if any | .25% | .25%A |
Expenses net of all reductions | .25% | .25%A |
Net investment income (loss) | 1.40% | 2.58%A |
Supplemental Data | | |
Net assets, end of period (000 omitted) | $ 126 | $ 141 |
Portfolio turnover rate | 17% | 5%A |
A Annualized
B Total returns for periods of less than one year are not annualized.
C Total returns do not reflect charges attributable to your insurance company's separate account. Inclusion of these charges would reduce the total returns shown.
D Calculated based on average shares outstanding during the period.
E Amounts do not include the activity of the underlying funds.
F For the period April 8, 2009 (commencement of operations) to December 31, 2009.
G Expense ratios reflect operating expenses of the class. Expenses before reductions do not reflect amounts reimbursed by the investment adviser or reductions from expense offset arrangements and do not represent the amount paid by the class during periods when reimbursements or reductions occur. Expenses net of fee waivers reflect expenses after reimbursement by the investment adviser but prior to reductions from expense offset arrangements. Expenses net of all reductions represent the net expenses paid by the class but do not include expenses of the investment companies in which the Fund invests.
See accompanying notes which are an integral part of the financial statements.
Annual Report
Fidelity VIP Freedom 2050 Portfolio
Investment Changes (Unaudited)
Fund Holdings as of December 31, 2010 |
| % of fund's
net assets | % of fund's net assets
6 months ago |
Domestic Equity Funds | | |
VIP Contrafund Portfolio Initial Class | 10.5 | 10.6 |
VIP Equity-Income Portfolio Initial Class | 12.3 | 12.3 |
VIP Growth & Income Portfolio Initial Class | 12.3 | 12.3 |
VIP Growth Portfolio Initial Class | 12.3 | 12.3 |
VIP Mid Cap Portfolio Initial Class | 4.2 | 4.4 |
VIP Value Portfolio Initial Class | 10.6 | 10.6 |
VIP Value Strategies Portfolio Initial Class | 4.5 | 4.4 |
| 66.7 | 66.9 |
Developed International Equity Funds | | |
VIP Overseas Portfolio Initial Class | 19.8 | 20.5 |
Emerging Markets Equity Funds | | |
VIP Emerging Markets Portfolio Initial Class | 3.3 | 2.0 |
High Yield Bond Funds | | |
VIP High Income Portfolio Initial Class | 9.5 | 10.1 |
Investment Grade Bond Funds | | |
VIP Investment Grade Bond Portfolio Initial Class | 0.7 | 0.5 |
Net Other Assets (Liabilities)* | 0.0 | 0.0 |
| 100.0 | 100.0 |
* Amount represents less than 0.1%. |
Asset Allocation (% of fund's net assets) |
Current |
| Domestic Equity Funds | 66.7% | |
| Developed International Equity Funds | 19.8% | |
| Emerging Markets Equity Funds | 3.3% | |
| High Yield Bond Funds | 9.5% | |
| Investment Grade Bond Funds | 0.7% | |

Six months ago |
| Domestic Equity Funds | 66.9% | |
| Developed International Equity Funds | 20.5% | |
| Emerging Markets Equity Funds | 2.0% | |
| High Yield Bond Funds | 10.1% | |
| Investment Grade Bond Funds | 0.5% | |

Expected |
| Domestic Equity Funds | 65.0% | |
| Developed International Equity Funds | 20.1% | |
| Emerging Markets Equity Funds | 3.6% | |
| High Yield Bond Funds | 10.0% | |
| Investment Grade Bond Funds | 1.3% | |

The fund invests according to an asset allocation strategy that becomes increasingly conservative over time. The six months ago allocation is based on the fund's holdings as of June 30, 2010. The current allocation is based on the fund's holdings as of December 31, 2010. The expected allocation represents the fund's anticipated allocation at June 30, 2011. |
Annual Report
Fidelity VIP Freedom 2050 Portfolio
Investments December 31, 2010
Showing Percentage of Net Assets
Domestic Equity Funds - 66.7% |
| Shares | | Value |
Domestic Equity Funds - 66.7% |
VIP Contrafund Portfolio Initial Class | 4,083 | | $ 97,503 |
VIP Equity-Income Portfolio Initial Class | 5,998 | | 114,088 |
VIP Growth & Income Portfolio Initial Class | 8,986 | | 113,492 |
VIP Growth Portfolio Initial Class | 3,068 | | 113,801 |
VIP Mid Cap Portfolio Initial Class | 1,202 | | 39,277 |
VIP Value Portfolio Initial Class | 8,895 | | 97,848 |
VIP Value Strategies Portfolio Initial Class | 4,246 | | 41,358 |
TOTAL DOMESTIC EQUITY FUNDS (Cost $456,155) | 617,367 |
International Equity Funds - 23.1% |
| | | |
Developed International Equity Funds - 19.8% |
VIP Overseas Portfolio Initial Class | 10,953 | | 183,675 |
Emerging Markets Equity Funds - 3.3% |
VIP Emerging Markets Portfolio Initial Class | 3,085 | | 30,570 |
TOTAL INTERNATIONAL EQUITY FUNDS (Cost $166,152) | 214,245 |
Bond Funds - 10.2% |
| Shares | | Value |
High Yield Bond Funds - 9.5% |
VIP High Income Portfolio Initial Class | 15,710 | | $ 87,503 |
Investment Grade Bond Funds - 0.7% |
VIP Investment Grade Bond Portfolio Initial Class | 536 | | 6,883 |
TOTAL BOND FUNDS (Cost $87,408) | 94,386 |
TOTAL INVESTMENT PORTFOLIO - 100.0% (Cost $709,715) | | 925,998 |
NET OTHER ASSETS (LIABILITIES) - 0.0% | | (38) |
NET ASSETS - 100% | $ 925,960 |
Other Information |
All investments are categorized as Level 1 under the Fair Value Hierarchy. The inputs or methodology used for valuing securities may not be an indication of the risk associated with investing in those securities. For more information on valuation inputs, please refer to the Security Valuation section in the accompanying Notes to Financial Statements. |
See accompanying notes which are an integral part of the financial statements.
Annual Report
Fidelity VIP Freedom 2050 Portfolio
Statement of Assets and Liabilities
| December 31, 2010 |
| | |
Assets | | |
Investment in securities, at value (cost $709,715) - See accompanying schedule | | $ 925,998 |
Cash | | 1 |
Receivable for investments sold | | 22 |
Receivable for fund shares sold | | 569 |
Total assets | | 926,590 |
| | |
Liabilities | | |
Payable for investments purchased | $ 562 | |
Payable for fund shares redeemed | 28 | |
Distribution and service plan fees payable | 40 | |
Total liabilities | | 630 |
| | |
Net Assets | | $ 925,960 |
Net Assets consist of: | | |
Paid in capital | | $ 704,798 |
Accumulated undistributed net realized gain (loss) on investments | | 4,879 |
Net unrealized appreciation (depreciation) on investments | | 216,283 |
Net Assets | | $ 925,960 |
Statement of Assets and Liabilities - continued
| December 31, 2010 |
| | |
Initial Class:
Net Asset Value, offering price and redemption price per share ($665,654 ÷ 42,082 shares) | | $ 15.82 |
| | |
Service Class:
Net Asset Value, offering price and redemption price per share ($118,379 ÷ 7,483 shares) | | $ 15.82 |
| | |
Service Class 2:
Net Asset Value, offering price and redemption price per share ($141,927 ÷ 8,975 shares) | | $ 15.81 |
See accompanying notes which are an integral part of the financial statements.
Annual Report
Statement of Operations
| Year ended December 31, 2010 |
| | |
Investment Income | | |
Income distributions from underlying funds | | $ 15,636 |
| | |
Expenses | | |
Distribution and service plan fees | $ 489 | |
Total expenses | | 489 |
Net investment income (loss) | | 15,147 |
Realized and Unrealized Gain (Loss) Realized gain (loss) on sale of underlying fund shares | 21,086 | |
Capital gain distributions from underlying funds | 1,041 | |
Total net realized gain (loss) | | 22,127 |
Change in net unrealized appreciation (depreciation) on underlying funds | | 95,990 |
Net gain (loss) | | 118,117 |
Net increase (decrease) in net assets resulting from operations | | $ 133,264 |
Statement of Changes in Net Assets
| Year ended
December 31, 2010 | For the period
April 8, 2009 (commencement of operations) to
December 31, 2009 |
Increase (Decrease) in Net Assets | | |
Operations | | |
Net investment income (loss) | $ 15,147 | $ 7,526 |
Net realized gain (loss) | 22,127 | 2,166 |
Change in net unrealized appreciation (depreciation) | 95,990 | 120,293 |
Net increase (decrease) in net assets resulting from operations | 133,264 | 129,985 |
Distributions to shareholders from net investment income | (15,204) | (7,532) |
Distributions to shareholders from net realized gain | (18,973) | (378) |
Total distributions | (34,177) | (7,910) |
Share transactions - net increase (decrease) | 378,806 | 325,992 |
Total increase (decrease) in net assets | 477,893 | 448,067 |
| | |
Net Assets | | |
Beginning of period | 448,067 | - |
End of period | $ 925,960 | $ 448,067 |
See accompanying notes which are an integral part of the financial statements.
Annual Report
Financial Highlights - Initial Class
Years ended December 31, | 2010 | 2009 F |
Selected Per-Share Data | | |
Net asset value, beginning of period | $ 14.01 | $ 10.00 |
Income from Investment Operations | | |
Net investment income (loss) D | .39 | .26 |
Net realized and unrealized gain (loss) | 2.06 | 4.01 |
Total from investment operations | 2.45 | 4.27 |
Distributions from net investment income | (.28) | (.25) |
Distributions from net realized gain | (.36) | (.01) |
Total distributions | (.64) | (.26) |
Net asset value, end of period | $ 15.82 | $ 14.01 |
Total Return B,C | 17.58% | 42.70% |
Ratios to Average Net Assets E,G | | |
Expenses before reductions | .00% | .00% A |
Expenses net of fee waivers, if any | .00% | .00% A |
Expenses net of all reductions | .00% | .00% A |
Net investment income (loss) | 2.64% | 2.76% A |
Supplemental Data | | |
Net assets, end of period (000 omitted) | $ 666 | $ 159 |
Portfolio turnover rate | 50% | 4% A |
A Annualized
B Total returns for periods of less than one year are not annualized.
C Total returns do not reflect charges attributable to your insurance company's separate account. Inclusion of these charges would reduce the total returns shown.
D Calculated based on average shares outstanding during the period.
E Amounts do not include the activity of the underlying funds.
F For the period April 8, 2009 (commencement of operations) to December 31, 2009.
G Expense ratios reflect operating expenses of the class. Expenses before reductions do not reflect amounts reimbursed by the investment adviser or reductions from expense offset arrangements and do not represent the amount paid by the class during periods when reimbursements or reductions occur. Expenses net of fee waivers reflect expenses after reimbursement by the investment adviser but prior to reductions from expense offset arrangements. Expenses net of all reductions represent the net expenses paid by the class but do not include expenses of the investment companies in which the Fund invests.
Financial Highlights - Service Class
Years ended December 31, | 2010 | 2009 F |
Selected Per-Share Data | | |
Net asset value, beginning of period | $ 14.00 | $ 10.00 |
Income from Investment Operations | | |
Net investment income (loss) D | .37 | .25 |
Net realized and unrealized gain (loss) | 2.07 | 4.00 |
Total from investment operations | 2.44 | 4.25 |
Distributions from net investment income | (.26) | (.24) |
Distributions from net realized gain | (.36) | (.01) |
Total distributions | (.62) | (.25) |
Net asset value, end of period | $ 15.82 | $ 14.00 |
Total Return B,C | 17.53% | 42.51% |
Ratios to Average Net Assets E,G | | |
Expenses before reductions | .10% | .10% A |
Expenses net of fee waivers, if any | .10% | .10% A |
Expenses net of all reductions | .10% | .10% A |
Net investment income (loss) | 2.54% | 2.66% A |
Supplemental Data | | |
Net assets, end of period (000 omitted) | $ 118 | $ 143 |
Portfolio turnover rate | 50% | 4% A |
A Annualized
B Total returns for periods of less than one year are not annualized.
C Total returns do not reflect charges attributable to your insurance company's separate account. Inclusion of these charges would reduce the total returns shown.
D Calculated based on average shares outstanding during the period.
E Amounts do not include the activity of the underlying funds.
F For the period April 8, 2009 (commencement of operations) to December 31, 2009.
G Expense ratios reflect operating expenses of the class. Expenses before reductions do not reflect amounts reimbursed by the investment adviser or reductions from expense offset arrangements and do not represent the amount paid by the class during periods when reimbursements or reductions occur. Expenses net of fee waivers reflect expenses after reimbursement by the investment adviser but prior to reductions from expense offset arrangements. Expenses net of all reductions represent the net expenses paid by the class but do not include expenses of the investment companies in which the Fund invests.
See accompanying notes which are an integral part of the financial statements.
Annual Report
Financial Highlights - Service Class 2
Years ended December 31, | 2010 | 2009 F |
Selected Per-Share Data | | |
Net asset value, beginning of period | $ 14.00 | $ 10.00 |
Income from Investment Operations | | |
Net investment income (loss) D | .35 | .23 |
Net realized and unrealized gain (loss) | 2.06 | 4.01 |
Total from investment operations | 2.41 | 4.24 |
Distributions from net investment income | (.24) | (.23) |
Distributions from net realized gain | (.36) | (.01) |
Total distributions | (.60) | (.24) |
Net asset value, end of period | $ 15.81 | $ 14.00 |
Total Return B,C | 17.30% | 42.37% |
Ratios to Average Net Assets E,G | | |
Expenses before reductions | .25% | .25% A |
Expenses net of fee waivers, if any | .25% | .25% A |
Expenses net of all reductions | .25% | .25% A |
Net investment income (loss) | 2.39% | 2.51% A |
Supplemental Data | | |
Net assets, end of period (000 omitted) | $ 142 | $ 147 |
Portfolio turnover rate | 50% | 4% A |
A Annualized
B Total returns for periods of less than one year are not annualized.
C Total returns do not reflect charges attributable to your insurance company's separate account. Inclusion of these charges would reduce the total returns shown.
D Calculated based on average shares outstanding during the period.
E Amounts do not include the activity of the underlying funds.
F For the period April 8, 2009 (commencement of operations) to December 31, 2009.
G Expense ratios reflect operating expenses of the class. Expenses before reductions do not reflect amounts reimbursed by the investment adviser or reductions from expense offset arrangements and do not represent the amount paid by the class during periods when reimbursements or reductions occur. Expenses net of fee waivers reflect expenses after reimbursement by the investment adviser but prior to reductions from expense offset arrangements. Expenses net of all reductions represent the net expenses paid by the class but do not include expenses of the investment companies in which the Fund invests.
See accompanying notes which are an integral part of the financial statements.
Annual Report
Notes to Financial Statements
For the period ended December 31, 2010
1. Organization.
VIP Freedom Income Portfolio, VIP Freedom 2005 Portfolio, VIP Freedom 2010 Portfolio, VIP Freedom 2015 Portfolio, VIP Freedom 2020 Portfolio, VIP Freedom 2025 Portfolio, VIP Freedom 2030 Portfolio, VIP Freedom 2035 Portfolio, VIP Freedom 2040 Portfolio, VIP Freedom 2045 Portfolio and VIP Freedom 2050 Portfolio (the Funds) are funds of Variable Insurance Products Fund V. Variable Insurance Products Fund V (the Trust) (referred to in this report as Fidelity Variable Insurance Products) is registered under the Investment Company Act of 1940, as amended (the 1940 Act), as an open-end management investment company organized as a Massachusetts business trust. Each Fund is authorized to issue an unlimited number of shares. The Funds invest primarily in a combination of other VIP equity, bond, and short-term funds (the Underlying Funds) managed by Fidelity Management & Research Company (FMR). Shares of each Fund may only be purchased by insurance companies for the purpose of funding variable annuity or variable life insurance contracts. Each Fund offers three classes of shares: Initial Class shares, Service Class shares and Service Class 2 shares. All classes have equal rights and voting privileges, except for matters affecting a single class. Investment income, realized and unrealized capital gains and losses, the common expenses of the Fund, and certain fund-level expense reductions, if any, are allocated on a pro-rata basis to each class based on the relative net assets of each class to the total net assets of the Fund. Each class differs with respect to distribution and service plan fees incurred. Certain expense reductions may also differ by class.
2. Significant Accounting Policies.
The financial statements have been prepared in conformity with accounting principles generally accepted in the United States of America (GAAP), which require management to make certain estimates and assumptions at the date of the financial statements. Actual results could differ from those estimates. Subsequent events, if any, through the date that the financial statements were issued have been evaluated in the preparation of the financial statements. The following summarizes the significant accounting policies of the Funds:
Security Valuation. Investments are valued as of 4:00 p.m. Eastern time on the last calendar day of the period. Each Fund categorizes the inputs to valuation techniques used to value their investments into a disclosure hierarchy consisting of three levels as shown below.
Level 1 - quoted prices in active markets for identical investments
Level 2 - other significant observable inputs (including quoted prices for similar investments, interest rates, prepayment speeds, etc.)
Level 3 - unobservable inputs (including the Fund's own assumptions based on the best information available)
Valuation techniques used to value each Fund's investments by major category are as follows. Investments in the Underlying Funds are valued at their closing net asset value (NAV) each business day and are categorized as Level 1 in the hierarchy. Short-term securities with remaining maturities of sixty days or less for which quotations are not readily available are valued at amortized cost, which approximates fair value and are categorized as Level 2 in the hierarchy.
Investment Transactions and Income. For financial reporting purposes, the Funds' investment holdings and NAV include trades executed through the end of the last business day of the period. The NAV per share for processing shareholder transactions is calculated as of the close of business of the New York Stock Exchange (NYSE), normally 4:00 p.m. Eastern time and includes trades executed through the end of the prior business day. Gains and losses on securities sold are determined on the basis of identified cost. Income and capital gain distributions from the Underlying Funds, if any, are recorded on the ex-dividend date. Interest income is accrued as earned. Interest income includes coupon interest and amortization of premium and accretion of discount on debt securities.
Expenses. Expenses directly attributable to a fund are charged to that fund. Expenses attributable to more than one fund are allocated among the respective funds on the basis of relative net assets or other appropriate methods. Expenses included in the accompanying financial statements reflect the expenses of the Fund and do not include any expenses associated with the Underlying Funds. Expense estimates are accrued in the period to which they relate and adjustments are made when actual amounts are known.
Income Tax Information and Distributions to Shareholders. Each year each Fund intends to qualify as a regulated investment company, including distributing substantially all of its taxable income and realized gains under Subchapter M of the Internal Revenue Code and filing its U.S. federal tax return. As a result, no provision for income taxes is required. As of December 31, 2010, each Fund did not have any unrecognized tax benefits in the accompanying financial statements. A fund's federal tax return is subject to examination by the Internal Revenue Service (IRS) for a period of three years.
Distributions are declared and recorded on the ex-dividend date. Income dividends and capital gain distributions are declared separately for each class. Income and capital gain distributions are determined in accordance with income tax regulations, which may differ from GAAP.
Capital accounts within the financial statements are adjusted for permanent book-tax differences. These adjustments have no impact on net assets or the results of operations. Temporary book-tax differences will reverse in a subsequent period.
Annual Report
2. Significant Accounting Policies - continued
Income Tax Information and Distributions to Shareholders - continued
Book-tax differences are primarily due to the short-term gain distributions from the Underlying Funds, capital loss carryforwards and losses deferred due to wash sales and excise tax regulations.
The federal tax cost of investment securities and unrealized appreciation (depreciation) as of period end were as follows for each Fund:
| Tax cost | Gross unrealized appreciation | Gross unrealized depreciation | Net unrealized appreciation (depreciation) |
VIP Freedom Income | $ 18,736,759 | $ 466,611 | $ (572,491) | $ (105,880) |
VIP Freedom 2005 | 6,506,099 | 120,006 | (557,977) | (437,971) |
VIP Freedom 2010 | 166,214,935 | 6,374,288 | (12,764,742) | (6,390,454) |
VIP Freedom 2015 | 98,863,989 | 6,630,191 | (7,112,936) | (482,745) |
VIP Freedom 2020 | 387,924,562 | 29,283,738 | (28,323,223) | 960,515 |
VIP Freedom 2025 | 42,344,598 | 2,503,673 | (3,244,684) | (741,011) |
VIP Freedom 2030 | 105,845,618 | 6,599,242 | (10,804,938) | (4,205,696) |
VIP Freedom 2035 | 311,498 | 137,054 | (906) | 136,148 |
VIP Freedom 2040 | 390,850 | 148,924 | (1,346) | 147,578 |
VIP Freedom 2045 | 234,635 | 129,278 | (31) | 129,247 |
VIP Freedom 2050 | 710,138 | 217,738 | (1,878) | 215,860 |
The tax-based components of distributable earnings as of period end were as follows for each Fund:
| Undistributed ordinary income | Undistributed long-term capital gain | Capital loss carryforward | Net unrealized appreciation (depreciation) |
VIP Freedom Income | $ - | $ - | $ - | $ (105,880) |
VIP Freedom 2005 | - | - | (86,373) | (437,971) |
VIP Freedom 2010 | 31,273 | 13,572 | - | (6,390,454) |
VIP Freedom 2015 | - | - | - | (482,745) |
VIP Freedom 2020 | - | - | - | 960,515 |
VIP Freedom 2025 | - | - | - | (741,011) |
VIP Freedom 2030 | - | - | - | (4,205,696) |
VIP Freedom 2035 | 543 | 426 | - | 136,148 |
VIP Freedom 2040 | - | - | - | 147,578 |
VIP Freedom 2045 | - | 7,776 | - | 129,247 |
VIP Freedom 2050 | 5,302 | - | - | 215,860 |
The tax character of distributions paid was as follows:
December 31, 2010 | Ordinary Income | Long-term Capital Gains | Total |
VIP Freedom Income | $ 513,223 | $ 292,617 | $ 805,840 |
VIP Freedom 2005 | 198,157 | - | 198,157 |
VIP Freedom 2010 | 4,963,086 | 776,484 | 5,739,570 |
VIP Freedom 2015 | 2,892,227 | 134,344 | 3,026,571 |
VIP Freedom 2020 | 9,854,211 | 179,638 | 10,033,849 |
VIP Freedom 2025 | 1,001,759 | 15,521 | 1,017,280 |
VIP Freedom 2030 | 2,346,989 | 97,450 | 2,444,439 |
VIP Freedom 2035 | 15,387 | 21,394 | 36,781 |
VIP Freedom 2040 | 54,058 | 17,135 | 71,193 |
VIP Freedom 2045 | 13,928 | 23,514 | 37,442 |
VIP Freedom 2050 | 23,223 | 10,954 | 34,177 |
Annual Report
Notes to Financial Statements - continued
2. Significant Accounting Policies - continued
Income Tax Information and Distributions to Shareholders - continued
The tax character of distributions paid was as follows: - continued
December 31, 2009 | Ordinary Income | Long-term Capital Gains | Total |
VIP Freedom Income | $ 841,096 | $ 62,263 | $ 903,359 |
VIP Freedom 2005 | 389,568 | 68,749 | 458,317 |
VIP Freedom 2010 | 5,351,488 | - | 5,351,488 |
VIP Freedom 2015 | 3,277,116 | 270,425 | 3,547,541 |
VIP Freedom 2020 | 8,702,259 | 799,268 | 9,501,527 |
VIP Freedom 2025 | 846,284 | 96,365 | 942,649 |
VIP Freedom 2030 | 2,089,890 | 18,672 | 2,108,562 |
VIP Freedom 2035 | 7,799 | - | 7,799 |
VIP Freedom 2040 | 7,891 | - | 7,891 |
VIP Freedom 2045 | 7,867 | - | 7,867 |
VIP Freedom 2050 | 7,910 | - | 7,910 |
3. Operating Policies.
Repurchase Agreements. FMR has received an Exemptive Order from the Securities and Exchange Commission (the SEC) which permits certain Funds and other affiliated entities of FMR to transfer uninvested cash balances into joint trading accounts which are then invested in repurchase agreements. Certain Funds may also invest directly with institutions in repurchase agreements. Repurchase agreements are collateralized by government or non-government securities. Upon settlement date, collateral is held in segregated accounts with custodian banks and may be obtained in the event of a default of the counterparty. Each applicable Fund monitors, on a daily basis, the value of the collateral to ensure it is at least equal to the principal amount of the repurchase agreement (including accrued interest). In the event of a default by the counterparty, realization of the collateral proceeds could be delayed, during which time the value of the collateral may decline.
4. Purchases and Sales of Investments.
Purchases and redemptions of the Underlying Fund shares are noted in the table below.
| Purchases ($) | Redemptions ($) |
VIP Freedom Income | 7,430,371 | 9,320,921 |
VIP Freedom 2005 | 2,618,467 | 4,262,782 |
VIP Freedom 2010 | 57,697,694 | 39,513,724 |
VIP Freedom 2015 | 34,781,421 | 26,327,790 |
VIP Freedom 2020 | 164,050,377 | 64,623,224 |
VIP Freedom 2025 | 21,258,138 | 6,990,326 |
VIP Freedom 2030 | 37,027,707 | 21,150,383 |
VIP Freedom 2035 | 156,686 | 188,388 |
VIP Freedom 2040 | 1,140,713 | 1,121,950 |
VIP Freedom 2045 | 65,811 | 180,567 |
VIP Freedom 2050 | 652,671 | 291,818 |
5. Fees and Other Transactions with Affiliates.
Management Fee. Strategic Advisers, Inc. (Strategic Advisers), an affiliate of FMR, provides the Funds with investment management related services. The Funds do not pay any fees for these services.
Other Transactions. Strategic Advisers has entered into an administration agreement with FMR under which FMR provides management and administrative services (other than investment advisory services) necessary for the operation of each Fund. Pursuant to this agreement, FMR pays all expenses of each Fund, excluding the distribution and service fees, the compensation of the independent Trustees and certain other expenses such as interest expense. FMR also contracts with other Fidelity companies to perform the services necessary for the operation of each Fund. The Funds do not pay any fees for these services.
Distribution and Service Plan Fees. In accordance with Rule 12b-1 of the 1940 Act, the Funds have adopted separate 12b-1 Plans for each Service Class of shares. Each Service Class pays Fidelity Distributors Corporation (FDC), an affiliate of FMR, a service fee. For the period, the service fee is based on an annual rate of .10% of Service Class' average net assets and .25% of Service Class 2's average net assets.
Annual Report
5. Fees and Other Transactions with Affiliates - continued
Distribution and Service Plan Fees - continued
For the period, total fees, all of which were reallowed to insurance companies for the distribution of shares and providing shareholder support services were as follows:
| Service Class | Service Class 2 | Total |
VIP Freedom Income | $ 203 | $ 17,226 | $ 17,429 |
VIP Freedom 2005 | 152 | 377 | 529 |
VIP Freedom 2010 | 19,617 | 242,907 | 262,524 |
VIP Freedom 2015 | 2,102 | 121,129 | 123,231 |
VIP Freedom 2020 | 29,332 | 589,672 | 619,004 |
VIP Freedom 2025 | 1,025 | 29,160 | 30,185 |
VIP Freedom 2030 | 18,625 | 101,102 | 119,727 |
VIP Freedom 2035 | 131 | 366 | 497 |
VIP Freedom 2040 | 132 | 343 | 475 |
VIP Freedom 2045 | 131 | 334 | 465 |
VIP Freedom 2050 | 133 | 356 | 489 |
6. Expense Reductions.
FMR voluntarily agreed to reimburse funds to the extent annual operating expenses exceeded certain levels of average net assets as noted in the table below. Some expenses, for example interest expense, are excluded from this reimbursement.
The following classes of each applicable Fund were in reimbursement during the period:
| Expense
Limitations | Reimbursement
from adviser |
VIP Freedom Income | | |
Initial Class | -% | $ 40 |
Service Class | .10% | - |
Service Class 2 | .25% | 25 |
VIP Freedom 2005 | | |
Initial Class | -% | 23 |
Service Class | .10% | - |
Service Class 2 | .25% | - |
VIP Freedom 2010 | | |
Initial Class | -% | 74 |
Service Class | .10% | 69 |
Service Class 2 | .25% | 340 |
VIP Freedom 2015 | | |
Initial Class | -% | 131 |
Service Class | .10% | 7 |
Service Class 2 | .25% | 170 |
VIP Freedom 2020 | | |
Initial Class | -% | 142 |
Service Class | .10% | 101 |
Service Class 2 | .25% | 810 |
VIP Freedom 2025 | | |
Initial Class | -% | 53 |
Service Class | .10% | 3 |
Service Class 2 | .25% | 40 |
VIP Freedom 2030 | | |
Initial Class | -% | 86 |
Service Class | .10% | 65 |
Service Class 2 | .25% | 140 |
Annual Report
Notes to Financial Statements - continued
7. Distributions to Shareholders.
Distributions to shareholders of each class were as follows:
Years ended December 31, | 2010 | 2009 |
VIP Freedom Income | | |
From net investment income | | |
Initial Class | $ 210,386 | $ 418,571 |
Service Class | 3,035 | 5,244 |
Service Class 2 | 115,815 | 228,173 |
Total | $ 329,236 | $ 651,988 |
From net realized gain | | |
Initial Class | $ 290,719 | $ 158,860 |
Service Class | 4,582 | 3,186 |
Service Class 2 | 181,303 | 89,325 |
Total | $ 476,604 | $ 251,371 |
VIP Freedom 2005 | | |
From net investment income | | |
Initial Class | $ 112,320 | $ 246,999 |
Service Class | 3,344 | 6,010 |
Service Class 2 | 2,691 | 6,092 |
Total | $ 118,355 | $ 259,101 |
From net realized gain | | |
Initial Class | $ 76,130 | $ 185,049 |
Service Class | 2,040 | 6,807 |
Service Class 2 | 1,632 | 7,360 |
Total | $ 79,802 | $ 199,216 |
VIP Freedom 2010 | | |
From net investment income | | |
Initial Class | $ 463,722 | $ 775,255 |
Service Class | 377,308 | 682,497 |
Service Class 2 | 2,186,962 | 3,022,186 |
Total | $ 3,027,992 | $ 4,479,938 |
From net realized gain | | |
Initial Class | $ 398,603 | $ 154,282 |
Service Class | 350,127 | 143,134 |
Service Class 2 | 1,962,848 | 574,134 |
Total | $ 2,711,578 | $ 871,550 |
VIP Freedom 2015 | | |
From net investment income | | |
Initial Class | $ 813,676 | $ 1,243,073 |
Service Class | 54,230 | 49,152 |
Service Class 2 | 1,039,969 | 1,351,309 |
Total | $ 1,907,875 | $ 2,643,534 |
From net realized gain | | |
Initial Class | $ 461,272 | $ 432,114 |
Service Class | 28,463 | 15,773 |
Service Class 2 | 628,961 | 456,120 |
Total | $ 1,118,696 | $ 904,007 |
VIP Freedom 2020 | | |
From net investment income | | |
Initial Class | $ 930,464 | $ 1,130,083 |
Service Class | 654,671 | 761,045 |
Service Class 2 | 5,829,063 | 5,213,654 |
Total | $ 7,414,198 | $ 7,104,782 |
From net realized gain | | |
Initial Class | $ 331,668 | $ 386,129 |
Service Class | 235,505 | 272,235 |
Service Class 2 | 2,052,478 | 1,738,381 |
Total | $ 2,619,651 | $ 2,396,745 |
Annual Report
7. Distributions to Shareholders - continued
Distributions to shareholders of each class were as follows: - continued
Years ended December 31, | 2010 | 2009 |
VIP Freedom 2025 | | |
From net investment income | | |
Initial Class | $ 346,092 | $ 440,844 |
Service Class | 27,402 | 19,456 |
Service Class 2 | 426,018 | 231,655 |
Total | $ 799,512 | $ 691,955 |
From net realized gain | | |
Initial Class | $ 98,389 | $ 169,810 |
Service Class | 7,360 | 7,444 |
Service Class 2 | 112,019 | 73,440 |
Total | $ 217,768 | $ 250,694 |
VIP Freedom 2030 | | |
From net investment income | | |
Initial Class | $ 539,256 | $ 468,196 |
Service Class | 411,502 | 303,407 |
Service Class 2 | 824,730 | 617,415 |
Total | $ 1,775,488 | $ 1,389,018 |
From net realized gain | | |
Initial Class | $ 194,726 | $ 259,161 |
Service Class | 151,508 | 164,844 |
Service Class 2 | 322,717 | 295,539 |
Total | $ 668,951 | $ 719,544 |
VIP Freedom 2035 A | | |
From net investment income | | |
Initial Class | $ 2,136 | $ 2,596 |
Service Class | 1,918 | 2,430 |
Service Class 2 | 3,394 | 2,346 |
Total | $ 7,448 | $ 7,372 |
From net realized gain | | |
Initial Class | $ 8,162 | $ 144 |
Service Class | 7,842 | 140 |
Service Class 2 | 13,329 | 143 |
Total | $ 29,333 | $ 427 |
VIP Freedom 2040 A | | |
From net investment income | | |
Initial Class | $ 4,811 | $ 2,647 |
Service Class | 1,884 | 2,480 |
Service Class 2 | 2,151 | 2,340 |
Total | $ 8,846 | $ 7,467 |
From net realized gain | | |
Initial Class | $ 31,376 | $ 144 |
Service Class | 13,997 | 140 |
Service Class 2 | 16,974 | 140 |
Total | $ 62,347 | $ 424 |
VIP Freedom 2045 A | | |
From net investment income | | |
Initial Class | $ 2,203 | $ 2,664 |
Service Class | 2,006 | 2,500 |
Service Class 2 | 1,978 | 2,370 |
Total | $ 6,187 | $ 7,534 |
From net realized gain | | |
Initial Class | $ 10,391 | $ 113 |
Service Class | 10,084 | 110 |
Service Class 2 | 10,780 | 110 |
Total | $ 31,255 | $ 333 |
Annual Report
Notes to Financial Statements - continued
7. Distributions to Shareholders - continued
Distributions to shareholders of each class were as follows: - continued
Years ended December 31, | 2010 | 2009 |
VIP Freedom 2050 A | | |
From net investment income | | |
Initial Class | $ 11,275 | $ 2,785 |
Service Class | 1,872 | 2,410 |
Service Class 2 | 2,057 | 2,337 |
Total | $ 15,204 | $ 7,532 |
From net realized gain | | |
Initial Class | $ 12,930 | $ 134 |
Service Class | 2,793 | 120 |
Service Class 2 | 3,250 | 124 |
Total | $ 18,973 | $ 378 |
A For the period April 8, 2009 (commencement of operations) to December 31, 2009.
8. Share Transactions.
Transactions for each class of shares were as follows:
| Shares | Dollars |
Years ended December 31, | 2010 | 2009 | 2010 | 2009 |
VIP Freedom Income | | | | |
Initial Class | | | | |
Shares sold | 258,557 | 462,871 | $ 2,671,849 | $ 4,540,087 |
Reinvestment of distributions | 48,930 | 58,723 | 501,105 | 577,431 |
Shares redeemed | (488,726) | (235,490) | (5,003,766) | (2,259,914) |
Net increase (decrease) | (181,239) | 286,104 | $ (1,830,812) | $ 2,857,604 |
Service Class | | | | |
Shares sold | 14,564 | - | $ 146,987 | $ - |
Reinvestment of distributions | 743 | 870 | 7,617 | 8,430 |
Shares redeemed | (14,887) | (12,809) | (152,852) | (122,754) |
Net increase (decrease) | 420 | (11,939) | $ 1,752 | $ (114,324) |
Service Class 2 | | | | |
Shares sold | 357,073 | 370,977 | $ 3,636,152 | $ 3,515,784 |
Reinvestment of distributions | 29,093 | 32,349 | 297,118 | 317,497 |
Shares redeemed | (349,472) | (256,214) | (3,569,125) | (2,438,407) |
Net increase (decrease) | 36,694 | 147,112 | $ 364,145 | $ 1,394,874 |
VIP Freedom 2005 | | | | |
Initial Class | | | | |
Shares sold | 134,064 | 290,653 | $ 1,286,624 | $ 2,449,103 |
Reinvestment of distributions | 19,288 | 49,902 | 188,450 | 432,048 |
Shares redeemed | (315,687) | (345,358) | (3,018,853) | (2,882,842) |
Net increase (decrease) | (162,335) | (4,803) | $ (1,543,779) | $ (1,691) |
Service Class | | | | |
Shares sold | 6,760 | 2,046 | $ 68,354 | $ 16,221 |
Reinvestment of distributions | 549 | 1,524 | 5,384 | 12,817 |
Shares redeemed | (7,984) | (15,887) | (77,087) | (137,264) |
Net increase (decrease) | (675) | (12,317) | $ (3,349) | $ (108,226) |
Service Class 2 | | | | |
Shares sold | 9,995 | 5,431 | $ 93,487 | $ 49,354 |
Reinvestment of distributions | 440 | 1,603 | 4,323 | 13,452 |
Shares redeemed | (14,517) | (20,647) | (139,052) | (180,064) |
Net increase (decrease) | (4,082) | (13,613) | $ (41,242) | $ (117,258) |
Annual Report
8. Share Transactions - continued
Transactions for each class of shares were as follows: - continued
| Shares | Dollars |
Years ended December 31, | 2010 | 2009 | 2010 | 2009 |
VIP Freedom 2010 | | | | |
Initial Class | | | | |
Shares sold | 436,778 | 414,253 | $ 4,483,599 | $ 3,587,514 |
Reinvestment of distributions | 82,723 | 98,751 | 862,325 | 929,536 |
Shares redeemed | (559,697) | (1,376,013) | (5,705,979) | (11,582,032) |
Net increase (decrease) | (40,196) | (863,009) | $ (360,055) | $ (7,064,982) |
Service Class | | | | |
Shares sold | 560,883 | 652,734 | $ 5,683,418 | $ 5,604,015 |
Reinvestment of distributions | 69,957 | 87,885 | 727,435 | 825,631 |
Shares redeemed | (783,131) | (853,771) | (8,010,814) | (7,408,613) |
Net increase (decrease) | (152,291) | (113,152) | $ (1,599,961) | $ (978,967) |
Service Class 2 | | | | |
Shares sold | 3,191,303 | 2,238,155 | $ 32,493,399 | $ 20,056,230 |
Reinvestment of distributions | 398,872 | 382,353 | 4,149,810 | 3,596,320 |
Shares redeemed | (1,434,821) | (1,691,306) | (14,472,689) | (14,628,341) |
Net increase (decrease) | 2,155,354 | 929,202 | $ 22,170,520 | $ 9,024,209 |
VIP Freedom 2015 | | | | |
Initial Class | | | | |
Shares sold | 670,873 | 1,338,816 | $ 6,860,434 | $ 11,871,466 |
Reinvestment of distributions | 120,777 | 177,040 | 1,274,948 | 1,675,187 |
Shares redeemed | (909,179) | (874,628) | (9,208,564) | (7,788,149) |
Net increase (decrease) | (117,529) | 641,228 | $ (1,073,182) | $ 5,758,504 |
Service Class | | | | |
Shares sold | 156,503 | 186,764 | $ 1,583,510 | $ 1,594,834 |
Reinvestment of distributions | 7,803 | 6,818 | 82,693 | 64,924 |
Shares redeemed | (65,542) | (151,939) | (664,170) | (1,277,662) |
Net increase (decrease) | 98,764 | 41,643 | $ 1,002,033 | $ 382,096 |
Service Class 2 | | | | |
Shares sold | 1,421,812 | 1,825,483 | $ 14,400,184 | $ 16,491,260 |
Reinvestment of distributions | 158,545 | 190,952 | 1,668,930 | 1,807,428 |
Shares redeemed | (678,716) | (817,202) | (6,837,448) | (7,121,468) |
Net increase (decrease) | 901,641 | 1,199,233 | $ 9,231,666 | $ 11,177,220 |
VIP Freedom 2020 | | | | |
Initial Class | | | | |
Shares sold | 920,774 | 1,419,778 | $ 9,150,944 | $ 12,010,755 |
Reinvestment of distributions | 120,936 | 166,674 | 1,262,132 | 1,516,212 |
Shares redeemed | (799,922) | (1,850,345) | (7,947,958) | (14,702,993) |
Net increase (decrease) | 241,788 | (263,893) | $ 2,465,118 | $ (1,176,026) |
Service Class | | | | |
Shares sold | 1,051,011 | 1,026,253 | $ 10,406,571 | $ 8,455,394 |
Reinvestment of distributions | 85,322 | 114,098 | 890,176 | 1,033,280 |
Shares redeemed | (722,926) | (790,200) | (7,208,777) | (6,544,951) |
Net increase (decrease) | 413,407 | 350,151 | $ 4,087,970 | $ 2,943,723 |
Service Class 2 | | | | |
Shares sold | 10,438,161 | 7,102,672 | $ 103,574,788 | $ 61,675,414 |
Reinvestment of distributions | 756,007 | 762,886 | 7,881,541 | 6,952,035 |
Shares redeemed | (1,785,393) | (1,718,729) | (17,423,750) | (14,671,947) |
Net increase (decrease) | 9,408,775 | 6,146,829 | $ 94,032,579 | $ 53,955,502 |
Annual Report
Notes to Financial Statements - continued
8. Share Transactions - continued
Transactions for each class of shares were as follows: - continued
| Shares | Dollars |
Years ended December 31, | 2010 | 2009 | 2010 | 2009 |
VIP Freedom 2025 | | | | |
Initial Class | | | | |
Shares sold | 210,663 | 327,202 | $ 2,056,243 | $ 2,758,614 |
Reinvestment of distributions | 42,774 | 70,858 | 444,481 | 610,654 |
Shares redeemed | (197,611) | (267,455) | (1,893,385) | (2,131,038) |
Net increase (decrease) | 55,826 | 130,605 | $ 607,339 | $ 1,238,230 |
Service Class | | | | |
Shares sold | 96,750 | 51,579 | $ 938,977 | $ 416,959 |
Reinvestment of distributions | 3,336 | 3,116 | 34,762 | 26,900 |
Shares redeemed | (36,867) | (35,412) | (368,024) | (288,761) |
Net increase (decrease) | 63,219 | 19,283 | $ 605,715 | $ 155,098 |
Service Class 2 | | | | |
Shares sold | 1,456,760 | 764,019 | $ 14,706,194 | $ 6,727,650 |
Reinvestment of distributions | 51,796 | 34,775 | 538,037 | 305,096 |
Shares redeemed | (218,947) | (399,076) | (2,103,016) | (3,567,260) |
Net increase (decrease) | 1,289,609 | 399,718 | $ 13,141,215 | $ 3,465,486 |
VIP Freedom 2030 | | | | |
Initial Class | | | | |
Shares sold | 775,263 | 980,714 | $ 7,430,999 | $ 7,765,974 |
Reinvestment of distributions | 73,020 | 93,578 | 733,982 | 727,357 |
Shares redeemed | (656,437) | (1,185,290) | (6,157,596) | (8,386,523) |
Net increase (decrease) | 191,846 | (110,998) | $ 2,007,385 | $ 106,808 |
Service Class | | | | |
Shares sold | 826,988 | 620,610 | $ 7,926,058 | $ 4,751,421 |
Reinvestment of distributions | 56,031 | 60,175 | 563,009 | 468,251 |
Shares redeemed | (406,449) | (336,231) | (3,785,635) | (2,580,003) |
Net increase (decrease) | 476,570 | 344,554 | $ 4,703,432 | $ 2,639,669 |
Service Class 2 | | | | |
Shares sold | 1,644,957 | 1,650,447 | $ 15,476,635 | $ 13,384,707 |
Reinvestment of distributions | 114,453 | 116,202 | 1,147,447 | 912,954 |
Shares redeemed | (754,936) | (612,226) | (7,067,727) | (4,784,642) |
Net increase (decrease) | 1,004,474 | 1,154,423 | $ 9,556,355 | $ 9,513,019 |
VIP Freedom 2035 A | | | | |
Initial Class | | | | |
Shares sold | 169 | 10,303 | $ 2,393 | $ 103,286 |
Reinvestment of distributions | 710 | 198 | 10,298 | 2,739 |
Shares redeemed | (3,191) | (4) | (45,336) | (54) |
Net increase (decrease) | (2,312) | 10,497 | $ (32,645) | $ 105,971 |
Service Class | | | | |
Shares sold | - | 10,001 | $ - | $ 100,010 |
Reinvestment of distributions | 673 | 186 | 9,760 | 2,570 |
Shares redeemed | (3,018) | - | (42,843) | - |
Net increase (decrease) | (2,345) | 10,187 | $ (33,083) | $ 102,580 |
Service Class 2 | | | | |
Shares sold | 6,219 | 10,201 | $ 94,194 | $ 102,785 |
Reinvestment of distributions | 1,147 | 180 | 16,723 | 2,489 |
Shares redeemed | (3,391) | - | (48,539) | (4) |
Net increase (decrease) | 3,975 | 10,381 | $ 62,378 | $ 105,270 |
Annual Report
8. Share Transactions - continued
Transactions for each class of shares were as follows: - continued
| Shares | Dollars |
Years ended December 31, | 2010 | 2009 | 2010 | 2009 |
VIP Freedom 2040 A | | | | |
Initial Class | | | | |
Shares sold | 70,337 | 10,356 | $ 989,272 | $ 103,923 |
Reinvestment of distributions | 2,586 | 200 | 36,187 | 2,790 |
Shares redeemed | (63,590) | (59) | (920,096) | (786) |
Net increase (decrease) | 9,333 | 10,497 | $ 105,363 | $ 105,927 |
Service Class | | | | |
Shares sold | - | 10,001 | $ - | $ 100,010 |
Reinvestment of distributions | 1,138 | 188 | 15,881 | 2,620 |
Shares redeemed | (3,021) | - | (43,092) | - |
Net increase (decrease) | (1,883) | 10,189 | $ (27,211) | $ 102,630 |
Service Class 2 | | | | |
Shares sold | 1,870 | 10,001 | $ 28,133 | $ 100,010 |
Reinvestment of distributions | 1,370 | 178 | 19,125 | 2,480 |
Shares redeemed | (3,161) | - | (45,227) | - |
Net increase (decrease) | 79 | 10,179 | $ 2,031 | $ 102,490 |
VIP Freedom 2045 A | | | | |
Initial Class | | | | |
Shares sold | 38 | 10,285 | $ 576 | $ 103,051 |
Reinvestment of distributions | 872 | 199 | 12,594 | 2,776 |
Shares redeemed | (3,131) | (2) | (44,833) | (26) |
Net increase (decrease) | (2,221) | 10,482 | $ (31,663) | $ 105,801 |
Service Class | | | | |
Shares sold | - | 10,001 | $ - | $ 100,010 |
Reinvestment of distributions | 837 | 187 | 12,090 | 2,610 |
Shares redeemed | (3,018) | - | (43,180) | - |
Net increase (decrease) | (2,181) | 10,188 | $ (31,090) | $ 102,620 |
Service Class 2 | | | | |
Shares sold | 617 | 10,001 | $ 9,521 | $ 100,010 |
Reinvestment of distributions | 883 | 178 | 12,757 | 2,480 |
Shares redeemed | (3,049) | - | (43,609) | - |
Net increase (decrease) | (1,549) | 10,179 | $ (21,331) | $ 102,490 |
VIP Freedom 2050 A | | | | |
Initial Class | | | | |
Shares sold | 38,491 | 11,146 | $ 556,062 | $ 114,029 |
Reinvestment of distributions | 1,539 | 207 | 24,205 | 2,918 |
Shares redeemed | (9,291) | (10) | (141,310) | (130) |
Net increase (decrease) | 30,739 | 11,343 | $ 438,957 | $ 116,817 |
Service Class | | | | |
Shares sold | - | 10,001 | $ - | $ 100,010 |
Reinvestment of distributions | 302 | 179 | 4,665 | 2,530 |
Shares redeemed | (2,999) | - | (43,436) | - |
Net increase (decrease) | (2,697) | 10,180 | $ (38,771) | $ 102,540 |
Service Class 2 | | | | |
Shares sold | 1,782 | 10,297 | $ 26,095 | $ 104,181 |
Reinvestment of distributions | 343 | 174 | 5,307 | 2,461 |
Shares redeemed | (3,620) | (1) | (52,782) | (7) |
Net increase (decrease) | (1,495) | 10,470 | $ (21,380) | $ 106,635 |
A For the period April 8, 2009 (commencement of operations) to December 31, 2009.
Annual Report
Notes to Financial Statements - continued
9. Other.
The Funds' organizational documents provide former and current trustees and officers with a limited indemnification against liabilities arising in connection with the performance of their duties to the Funds. In the normal course of business, the Funds may also enter into contracts that provide general indemnifications. The Funds' maximum exposure under these arrangements is unknown as this would be dependent on future claims that may be made against the Funds. The risk of material loss from such claims is considered remote.
The Funds do not invest in the Underlying Funds for the purpose of exercising management or control; however, investments by the Funds within their principal investment strategies may represent a significant portion of the Underlying Fund's net assets. At the end of the period, VIP Freedom 2020 was the owner of record of approximately 19% of the total outstanding shares of VIP Value Portfolio.
The Funds, in aggregate, were the owners of record of approximately 38% of the total outstanding shares of VIP Value Portfolio.
In addition, at the end of the period, FMR or its affiliates and certain otherwise unaffiliated shareholders each were owners of record of more than 10% of the outstanding shares of the following funds:
| Affiliated % | Number of
Unaffiliated Shareholders | Unaffiliated Shareholders % |
VIP Freedom Income | 57% | 1 | 19% |
VIP Freedom 2005 | 94% | - | - |
VIP Freedom 2010 | 12% | 1 | 69% |
VIP Freedom 2015 | 34% | 1 | 39% |
VIP Freedom 2020 | - | 2 | 79% |
VIP Freedom 2025 | 34% | 2 | 45% |
VIP Freedom 2030 | 15% | 2 | 57% |
VIP Freedom 2035 | 76% | 1 | 21% |
VIP Freedom 2040 | 43% | 3 | 49% |
VIP Freedom 2045 | 96% | - | - |
VIP Freedom 2050 | 28% | 2 | 66% |
Annual Report
Report of Independent Registered Public Accounting Firm
To the Trustees of Variable Insurance Products V and the Shareholders of VIP Freedom Income Portfolio, VIP Freedom 2005 Portfolio, VIP Freedom 2010 Portfolio, VIP Freedom 2015 Portfolio, VIP Freedom 2020 Portfolio, VIP Freedom 2025 Portfolio, VIP Freedom 2030 Portfolio, VIP Freedom 2035 Portfolio, VIP Freedom 2040 Portfolio, VIP Freedom 2045 Portfolio and VIP Freedom 2050 Portfolio:
We have audited the accompanying statements of assets and liabilities of VIP Freedom Income Portfolio, VIP Freedom 2005 Portfolio, VIP Freedom 2010 Portfolio, VIP Freedom 2015 Portfolio, VIP Freedom 2020 Portfolio, VIP Freedom 2025 Portfolio, VIP Freedom 2030 Portfolio, VIP Freedom 2035 Portfolio, VIP Freedom 2040 Portfolio, VIP Freedom 2045 Portfolio and VIP Freedom 2050 Portfolio (the Funds), each a fund of Variable Insurance Products V Trust, including the schedules of investments, as of December 31, 2010, and the related statements of operations for the year then ended, and the statements of changes in net assets and the financial highlights for each of the periods presented. These financial statements and financial highlights are the responsibility of the Funds' management. Our responsibility is to express an opinion on these financial statements and financial highlights based on our audits.
We conducted our audits in accordance with the standards of the Public Company Accounting Oversight Board (United States). Those standards require that we plan and perform the audit to obtain reasonable assurance about whether the financial statements and financial highlights are free of material misstatement. The Funds are not required to have, nor were we engaged to perform, an audit of their internal control over financial reporting. Our audits included consideration of internal control over financial reporting as a basis for designing audit procedures that are appropriate in the circumstances, but not for the purpose of expressing an opinion on the effectiveness of the Fund's internal control over financial reporting. Accordingly, we express no such opinion. An audit also includes examining, on a test basis, evidence supporting the amounts and disclosures in the financial statements, assessing the accounting principles used and significant estimates made by management, as well as evaluating the overall financial statement presentation. Our procedures included confirmation of securities owned as of December 31, 2010, by correspondence with the transfer agent. We believe that our audits provide a reasonable basis for our opinion.
In our opinion, the financial statements and financial highlights referred to above present fairly, in all material respects, the financial position of VIP Freedom Income Portfolio, VIP Freedom 2005 Portfolio, VIP Freedom 2010 Portfolio, VIP Freedom 2015 Portfolio, VIP Freedom 2020 Portfolio, VIP Freedom 2025 Portfolio, VIP Freedom 2030 Portfolio, VIP Freedom 2035 Portfolio, VIP Freedom 2040 Portfolio, VIP Freedom 2045 Portfolio and VIP Freedom 2050 Portfolio as of December 31, 2010, the results of their operations for the year then ended, and the changes in their net assets and the financial highlights for each of the periods presented, in conformity with accounting principles generally accepted in the United States of America.
/s/ Deloitte & Touche LLP
DELOITTE & TOUCHE LLP
Boston, Massachusetts
February 22, 2011
Annual Report
The Trustees and executive officers of the trust and funds, as applicable, are listed below. The Board of Trustees governs each VIP Freedom Fund and is responsible for protecting the interests of shareholders. The Trustees are experienced executives who meet periodically throughout the year to oversee each VIP Freedom Fund's activities, review contractual arrangements with companies that provide services to each VIP Freedom Fund, oversee management of the risks associated with such activities and contractual arrangements, and review each VIP Freedom Fund's performance. If the interests of a VIP Freedom Fund and an underlying Fidelity fund were to diverge, a conflict of interest could arise and affect how the Trustees fulfill their fiduciary duties to the affected funds. Strategic Advisers has structured the VIP Freedom Funds to avoid these potential conflicts, although there may be situations where a conflict of interest is unavoidable. In such instances, Strategic Advisers and the Trustees would take reasonable steps to minimize and, if possible, eliminate the conflict. Except for James C. Curvey, each of the Trustees oversees 189 funds advised by FMR or an affiliate. Mr. Curvey oversees 408 funds advised by FMR or an affiliate.
The Trustees hold office without limit in time except that (a) any Trustee may resign; (b) any Trustee may be removed by written instrument, signed by at least two-thirds of the number of Trustees prior to such removal; (c) any Trustee who requests to be retired or who has become incapacitated by illness or injury may be retired by written instrument signed by a majority of the other Trustees; and (d) any Trustee may be removed at any special meeting of shareholders by a two-thirds vote of the outstanding voting securities of the trust. Each Trustee who is not an interested person (as defined in the 1940 Act) (Independent Trustee), shall retire not later than the last day of the calendar year in which his or her 75th birthday occurs. The Independent Trustees may waive this mandatory retirement age policy with respect to individual Trustees. The executive officers hold office without limit in time, except that any officer may resign or may be removed by a vote of a majority of the Trustees at any regular meeting or any special meeting of the Trustees. Except as indicated, each individual has held the office shown or other offices in the same company for the past five years.
Experience, Skills, Attributes, and Qualifications of the Funds' Trustees. The Governance and Nominating Committee has adopted a statement of policy that describes the experience, qualifications, attributes, and skills that are necessary and desirable for potential Independent Trustee candidates (Statement of Policy). The Board believes that each Trustee satisfied at the time he or she was initially elected or appointed a Trustee, and continues to satisfy, the standards contemplated by the Statement of Policy. The Governance and Nominating Committee also engages professional search firms to help identify potential Independent Trustee candidates who have the experience, qualifications, attributes, and skills consistent with the Statement of Policy. From time to time, additional criteria based on the composition and skills of the current Independent Trustees, as well as experience or skills that may be appropriate in light of future changes to board composition, business conditions, and regulatory or other developments, have also been considered by the professional search firms and the Governance and Nominating Committee. In addition, the Board takes into account the Trustees' commitment and participation in Board and committee meetings, as well as their leadership of standing and ad hoc committees throughout their tenure.
In determining that a particular Trustee was and continues to be qualified to serve as a Trustee, the Board has considered a variety of criteria, none of which, in isolation, was controlling. The Board believes that, collectively, the Trustees have balanced and diverse experience, qualifications, attributes, and skills, which allow the Board to operate effectively in governing each fund and protecting the interests of shareholders. Information about the specific experience, skills, attributes, and qualifications of each Trustee, which in each case led to the Board's conclusion that the Trustee should serve (or continue to serve) as a trustee of the funds, is provided below.
Board Structure and Oversight Function. Abigail P. Johnson is an interested person (as defined in the 1940 Act) and currently serves as Chairman. The Trustees have determined that an interested Chairman is appropriate and benefits shareholders because an interested Chairman has a personal and professional stake in the quality and continuity of services provided to the funds. Independent Trustees exercise their informed business judgment to appoint an individual of their choosing to serve as Chairman, regardless of whether the Trustee happens to be independent or a member of management. The Independent Trustees have determined that they can act independently and effectively without having an Independent Trustee serve as Chairman and that a key structural component for assuring that they are in a position to do so is for the Independent Trustees to constitute a substantial majority for the Board. The Independent Trustees also regularly meet in executive session. Kenneth L. Wolfe serves as Chairman of the Independent Trustees and as such (i) acts as a liaison between the Independent Trustees and management with respect to matters important to the Independent Trustees and (ii) with management prepares agendas for Board meetings.
Fidelity funds are overseen by different Boards of Trustees. The funds' Board oversees Fidelity's investment-grade bond, money market, and asset allocation funds and another Board oversees Fidelity's equity and high income funds. The asset allocation funds may invest in Fidelity funds that are overseen by such other Board. The use of separate Boards, each with its own committee structure, allows the Trustees of each group of Fidelity funds to focus on the unique issues of the funds they oversee, including common research, investment, and operational issues. On occasion, the separate Boards establish joint committees to address issues of overlapping consequences for the Fidelity funds overseen by each Board.
The Trustees operate using a system of committees to facilitate the timely and efficient consideration of all matters of importance to the Trustees, each fund, and fund shareholders and to facilitate compliance with legal and regulatory requirements and oversight of the funds' activities and associated risks. The Board, acting through its committees, has charged FMR and its affiliates with (i) identifying events or circumstances the occurrence of which could have demonstrably adverse effects on the funds' business and/or reputation; (ii) implementing processes and controls to lessen the possibility that such events or circumstances occur or to mitigate the effects of such events or circumstances if they do occur; and (iii) creating and maintaining a system designed to evaluate continuously business and market conditions in order to facilitate the identification and implementation processes described in (i) and (ii) above. Because the day-to-day operations and activities of the funds are carried out by or through FMR, its affiliates and other service providers, the funds' exposure to risks is mitigated but not eliminated by the processes overseen by the Trustees. While each of the Board's committees has responsibility for overseeing different aspects of the funds' activities, oversight is exercised primarily through the Operations and Audit Committees. Appropriate personnel, including but not limited to the funds' Chief Compliance Officer (CCO), FMR's internal auditor, the independent accountants, the funds' Treasurer and portfolio management personnel, make periodic reports to the Board's committees, as appropriate. The responsibilities of each committee, including their oversight responsibilities, are described further under "Standing Committees of the Funds' Trustees."
Annual Report
Trustees and Officers - continued
The fund's Statement of Additional Information (SAI) includes more information about the Trustees. To request a free copy, call Fidelity at 1-877-208-0098.
Interested Trustees*:
Correspondence intended for each Trustee who is an interested person may be sent to Fidelity Investments, 82 Devonshire Street, Boston, Massachusetts 02109.
Name, Age; Principal Occupations and Other Relevant Experience+ |
Abigail P. Johnson (49) |
| Year of Election or Appointment: 2009 Ms. Johnson is Trustee and Chairman of the Board of Trustees of certain Trusts. Ms. Johnson serves as President of Personal, Workplace and Institutional Services (2005-present). Ms. Johnson is the Vice Chairman and Director (2007-present) of FMR LLC. Previously, Ms. Johnson served as President and a Director of FMR (2001-2005), a Trustee of other investment companies advised by FMR, Fidelity Investments Money Management, Inc., and FMR Co., Inc. (2001-2005), Senior Vice President of the Fidelity funds (2001-2005), and managed a number of Fidelity funds. Ms. Abigail P. Johnson and Mr. Arthur E. Johnson are not related. |
James C. Curvey (75) |
| Year of Election or Appointment: 2007 Mr. Curvey also serves as Trustee (2007-present) of other investment companies advised by FMR. Mr. Curvey is a Director of Fidelity Investments Money Management, Inc. (2009-present), Director of Fidelity Research & Analysis Co. (2009-present) and Director of FMR and FMR Co., Inc. (2007-present). Mr. Curvey is also Vice Chairman (2007-present) and Director of FMR LLC. In addition, Mr. Curvey serves as an Overseer for the Boston Symphony Orchestra and a member of the Trustees of Villanova University. Previously, Mr. Curvey was the Vice Chairman (2006-2007) and Director (2000-2007) of FMR Corp. |
* Trustees have been determined to be "Interested Trustees" by virtue of, among other things, their affiliation with the trust or various entities under common control with FMR.
+ The information above includes each Trustee's principal occupation during the last five years and other information relating to the experience, attributes, and skills relevant to each Trustee's qualifications to serve as a Trustee, which led to the conclusion that each Trustee should serve as a Trustee for each fund.
Independent Trustees:
Correspondence intended for each Independent Trustee (that is, the Trustees other than the Interested Trustees) may be sent to Fidelity Investments, P.O. Box 55235, Boston, Massachusetts 02205-5235.
Name, Age; Principal Occupations and Other Relevant Experience+ |
Albert R. Gamper, Jr. (68) |
| Year of Election or Appointment: 2007 Prior to his retirement in December 2004, Mr. Gamper served as Chairman of the Board of CIT Group Inc. (commercial finance). During his tenure with CIT Group Inc. Mr. Gamper served in numerous senior management positions, including Chairman (1987-1989; 1999-2001; 2002-2004), Chief Executive Officer (1987-2004), and President (2002-2003). He also served as President and Chief Executive Officer of Tyco Capital Corporation (2001-2002). Mr. Gamper currently serves as a member of the Board of Directors of Public Service Enterprise Group (utilities, 2000-present), a member of the Board of Trustees, Rutgers University (2004-present), and Chairman of the Board of Saint Barnabas Health Care System. Previously, Mr. Gamper served as Chairman of the Board of Governors, Rutgers University (2004-2007). |
Robert F. Gartland (59) |
| Year of Election or Appointment: 2010 Mr. Gartland is a partner and investor of Vietnam Partners LLC (investments and consulting, 2008-present) and is Chairman and an investor in Gartland and Mellina Group Corp. (consulting, 2009-present). Prior to his retirement, Mr. Gartland held a variety of positions at Morgan Stanley (financial services, 1979-2007) including Managing Director (1987-2007). |
Arthur E. Johnson (63) |
| Year of Election or Appointment: 2008 Mr. Johnson serves as a member of the Board of Directors of Eaton Corporation (diversified power management, 2009-present) and AGL Resources, Inc. (holding company). Prior to his retirement, Mr. Johnson served as Senior Vice President of Corporate Strategic Development of Lockheed Martin Corporation (defense contractor, 1999-2009). He previously served on the Board of Directors of IKON Office Solutions, Inc. (1999-2008) and Delta Airlines (2005-2007). Mr. Arthur E. Johnson and Ms. Abigail P. Johnson are not related. |
Michael E. Kenneally (56) |
| Year of Election or Appointment: 2009 Previously, Mr. Kenneally served as a Member of the Advisory Board for certain Fidelity Fixed Income and Asset Allocation Funds (2008-2009). Prior to his retirement, Mr. Kenneally served as Chairman and Global Chief Executive Officer of Credit Suisse Asset Management (2003-2005). Mr. Kenneally was a Director of the Credit Suisse Funds (U.S. mutual funds, 2004-2008) and certain other closed-end funds (2004-2005) and was awarded the Chartered Financial Analyst (CFA) designation in 1991. |
James H. Keyes (70) |
| Year of Election or Appointment: 2007 Mr. Keyes serves as a member of the Boards of Navistar International Corporation (manufacture and sale of trucks, buses, and diesel engines, since 2002) and Pitney Bowes, Inc. (integrated mail, messaging, and document management solutions, since 1998). Prior to his retirement, Mr. Keyes served as Chairman and Chief Executive Officer of Johnson Controls (automotive, building, and energy, 1998-2002) and as a member of the Board of LSI Logic Corporation (semiconductor technologies, 1984-2008). |
Marie L. Knowles (64) |
| Year of Election or Appointment: 2001 Prior to Ms. Knowles' retirement in June 2000, she served as Executive Vice President and Chief Financial Officer of Atlantic Richfield Company (ARCO) (diversified energy, 1996-2000). From 1993 to 1996, she was a Senior Vice President of ARCO and President of ARCO Transportation Company. She served as a Director of ARCO from 1996 to 1998. Ms. Knowles currently serves as a Director and Chairman of the Audit Committee of McKesson Corporation (healthcare service, since 2002). Ms. Knowles is an Honorary Trustee of the Brookings Institution and a member of the Board of the Catalina Island Conservancy and of the Santa Catalina Island Company (2009-present). She also serves as a member of the Advisory Board for the School of Engineering of the University of Southern California and the Foundation Board of the School of Architecture at the University of Virginia (2007-present). Previously, Ms. Knowles served as a Director of Phelps Dodge Corporation (copper mining and manufacturing, 1994-2007). |
Kenneth L. Wolfe (71) |
| Year of Election or Appointment: 2007 Mr. Wolfe is Chairman of the Independent Trustees of the Fixed Income and Asset Allocation Funds (2008-present). Prior to his retirement, Mr. Wolfe served as Chairman and a Director (2007-2009) and Chairman and Chief Executive Officer (1994-2001) of Hershey Foods Corporation. He also served as a member of the Boards of Adelphia Communications Corporation (telecommunications, 2003-2006), Bausch & Lomb, Inc. (medical/pharmaceutical, 1993-2007), and Revlon, Inc. (personal care products, 2004-2009). |
+ The information above includes each Trustee's principal occupation during the last five years and other information relating to the experience, attributes, and skills relevant to each Trustee's qualifications to serve as a Trustee, which led to the conclusion that each Trustee should serve as a Trustee for each fund.
Executive Officers:
Correspondence intended for each executive officer may be sent to Fidelity Investments, 82 Devonshire Street, Boston, Massachusetts 02109.
Name, Age; Principal Occupation |
John R. Hebble (52) |
| Year of Election or Appointment: 2008 President and Treasurer of Fidelity's Fixed Income and Asset Allocation Funds. Mr. Hebble also serves as Treasurer and Chief Financial Officer of The North Carolina Capital Management Trust: Cash and Term Portfolio (2008-present), Assistant Treasurer of other Fidelity funds (2009-present) and is an employee of Fidelity Investments. |
Boyce I. Greer (54) |
| Year of Election or Appointment: 2005 Vice President of Fidelity's Fixed Income Funds and Asset Allocation Funds (2005). Mr. Greer is also a Trustee of other investment companies advised by FMR. Mr. Greer is President of The North Carolina Capital Management Trust: Cash and Term Portfolio (2003-present), the Asset Allocation Division (2008-present), President and a Director of Strategic Advisers, Inc. (2008-present), President of FIMM 130/30 LLC (2008-present), Director of Ballyrock Investment Advisors LLC (2006-present), and an Executive Vice President of FMR (2005-present). Previously, Mr. Greer served as Executive Vice President of FMR Co., Inc. (2005-2009), President and Director of Fidelity Investments Money Management, Inc. (2007-2009) and as a Director and Managing Director of Strategic Advisers, Inc. (2002-2005). |
Derek L. Young (46) |
| Year of Election or Appointment: 2009 Vice President of Fidelity's Asset Allocation Funds. Mr. Young also serves as Chief Investment Officer of the Global Asset Allocation Group (2009-present). Previously, Mr. Young served as a portfolio manager. |
Scott C. Goebel (42) |
| Year of Election or Appointment: 2008 Secretary and Chief Legal Officer (CLO) of the Fidelity funds. Mr. Goebel also serves as Secretary and CLO of The North Carolina Capital Management Trust: Cash and Term Portfolio (2008-present); General Counsel, Secretary, and Senior Vice President of FMR (2008-present) and FMR Co., Inc. (2008-present); Deputy General Counsel of FMR LLC; Chief Legal Officer of Fidelity Management & Research (Hong Kong) Limited (2008-present) and Assistant Secretary of Fidelity Management & Research (Japan) Inc. (2008-present), Fidelity Investments Money Management, Inc. (2008-present), Fidelity Management & Research (U.K.) Inc. (2008-present), and Fidelity Research and Analysis Company (2008-present). Previously, Mr. Goebel served as Assistant Secretary of the Funds (2007-2008) and as Vice President and Secretary of Fidelity Distributors Corporation (FDC) (2005-2007). |
David J. Carter (37) |
| Year of Election or Appointment: 2010 Assistant Secretary of Fidelity's Fixed Income and Asset Allocation Funds. Mr. Carter also serves as Vice President, Associate General Counsel (2010-present) and is an employee of Fidelity Investments (2005-present). |
Holly C. Laurent (56) |
| Year of Election or Appointment: 2008 Anti-Money Laundering (AML) Officer of the Fidelity funds. Ms. Laurent also serves as AML Officer of The North Carolina Capital Management Trust: Cash and Term Portfolio (2008-present) and is an employee of Fidelity Investments. Previously, Ms. Laurent was Senior Vice President and Head of Legal for Fidelity Business Services India Pvt. Ltd. (2006-2008), and Senior Vice President, Deputy General Counsel and Group Head for FMR LLC (2005-2006). |
Christine Reynolds (52) |
| Year of Election or Appointment: 2008 Chief Financial Officer of the Fidelity funds. Ms. Reynolds became President of Fidelity Pricing and Cash Management Services (FPCMS) in August 2008. Ms. Reynolds served as Chief Operating Officer of FPCMS (2007-2008). Previously, Ms. Reynolds served as President, Treasurer, and Anti-Money Laundering officer of the Fidelity funds (2004-2007). |
Michael H. Whitaker (43) |
| Year of Election or Appointment: 2008 Chief Compliance Officer of Fidelity's Fixed Income and Asset Allocation Funds. Mr. Whitaker also serves as Chief Compliance Officer of The North Carolina Capital Management Trust: Cash and Term Portfolio (2008-present). Mr. Whitaker is an employee of Fidelity Investments (2007-present). Prior to joining Fidelity Investments, Mr. Whitaker worked at MFS Investment Management where he served as Senior Vice President and Chief Compliance Officer (2004-2006), and Assistant General Counsel. |
Jeffrey S. Christian (49) |
| Year of Election or Appointment: 2009 Deputy Treasurer of the Fidelity funds. Mr. Christian is an employee of Fidelity Investments. Previously, Mr. Christian served as Chief Financial Officer (2008-2009) of certain Fidelity funds and Senior Vice President of Fidelity Pricing and Cash Management Services (FPCMS) (2004-2009). |
Bryan A. Mehrmann (49) |
| Year of Election or Appointment: 2005 Deputy Treasurer of the Fidelity funds. Mr. Mehrmann is an employee of Fidelity Investments. |
Stephanie J. Dorsey (41) |
| Year of Election or Appointment: 2008 Deputy Treasurer of Fidelity's Fixed Income and Asset Allocation Funds. Ms. Dorsey also serves as Assistant Treasurer of other Fidelity funds (2010-present) and is an employee of Fidelity Investments (2008-present). Previously, Ms. Dorsey served as Treasurer (2004-2008) of the JPMorgan Mutual Funds and Vice President (2004-2008) of JPMorgan Chase Bank. |
Adrien E. Deberghes (43) |
| Year of Election or Appointment: 2010 Assistant Treasurer of Fidelity's Fixed Income and Asset Allocation Funds. Mr. Deberghes also serves as Deputy Treasurer of other Fidelity funds (2008-present) and is an employee of Fidelity Investments (2008-present). Previously, Mr. Deberghes served as Senior Vice President of Mutual Fund Administration at State Street Corporation (2007-2008), Senior Director of Mutual Fund Administration at Investors Bank & Trust (2005-2007), and Director of Finance for Dunkin' Brands (2000-2005). |
Kenneth B. Robins (41) |
| Year of Election or Appointment: 2009 Assistant Treasurer of the Fidelity Fixed Income and Asset Allocation Funds. Mr. Robins also serves as President and Treasurer of other Fidelity funds (2008-present; 2010-present) and is an employee of Fidelity Investments (2004-present). Previously, Mr. Robins served as Deputy Treasurer of the Fidelity funds (2005-2008) and Treasurer and Chief Financial Officer of The North Carolina Capital Management Trust: Cash and Term Portfolios (2006-2008). |
Gary W. Ryan (52) |
| Year of Election or Appointment: 2005 Assistant Treasurer of the Fidelity funds. Mr. Ryan is an employee of Fidelity Investments. Previously, Mr. Ryan served as Vice President of Fund Reporting in Fidelity Pricing and Cash Management Services (FPCMS) (1999-2005). |
Jonathan Davis (42) |
| Year of Election or Appointment: 2010 Assistant Treasurer of the Fidelity funds. Mr. Davis is an employee of Fidelity Investments. Previously, Mr. Davis served as Vice President and Associate General Counsel of FMR LLC (2003-2010). |
Annual Report
The Board of Trustees of each portfolio voted to pay to shareholders of record at the opening of business on record date, the following distributions per share derived from capital gains realized from sales of portfolio securities:
| Pay Date | Record Date | Capital Gains |
VIP Freedom Income Portfolio | | | |
Initial Class | 02/11/11 | 02/11/11 | $0.000 |
Service Class | 02/11/11 | 02/11/11 | $0.000 |
Service Class 2 | 02/11/11 | 02/11/11 | $0.000 |
VIP Freedom 2005 Portfolio | | | |
Initial Class | 02/11/11 | 02/11/11 | $0.000 |
Service Class | 02/11/11 | 02/11/11 | $0.000 |
Service Class 2 | 02/11/11 | 02/11/11 | $0.000 |
VIP Freedom 2010 Portfolio | | | |
Initial Class | 02/11/11 | 02/11/11 | $0.005 |
Service Class | 02/11/11 | 02/11/11 | $0.005 |
Service Class 2 | 02/11/11 | 02/11/11 | $0.005 |
VIP Freedom 2015 Portfolio | | | |
Initial Class | 02/11/11 | 02/11/11 | $0.000 |
Service Class | 02/11/11 | 02/11/11 | $0.000 |
Service Class 2 | 02/11/11 | 02/11/11 | $0.000 |
VIP Freedom 2020 Portfolio | | | |
Initial Class | 02/11/11 | 02/11/11 | $0.000 |
Service Class | 02/11/11 | 02/11/11 | $0.000 |
Service Class 2 | 02/11/11 | 02/11/11 | $0.000 |
VIP Freedom 2025 Portfolio | | | |
Initial Class | 02/11/11 | 02/11/11 | $0.000 |
Service Class | 02/11/11 | 02/11/11 | $0.000 |
Service Class 2 | 02/11/11 | 02/11/11 | $0.000 |
VIP Freedom 2030 Portfolio | | | |
Initial Class | 02/11/11 | 02/11/11 | $0.000 |
Service Class | 02/11/11 | 02/11/11 | $0.000 |
Service Class 2 | 02/11/11 | 02/11/11 | $0.000 |
VIP Freedom 2035 Portfolio | | | |
Initial Class | 02/11/11 | 02/11/11 | $0.030 |
Service Class | 02/11/11 | 02/11/11 | $0.030 |
Service Class 2 | 02/11/11 | 02/11/11 | $0.030 |
VIP Freedom 2040 Portfolio | | | |
Initial Class | 02/11/11 | 02/11/11 | $0.000 |
Service Class | 02/11/11 | 02/11/11 | $0.000 |
Service Class 2 | 02/11/11 | 02/11/11 | $0.000 |
VIP Freedom 2045 Portfolio | | | |
Initial Class | 02/11/11 | 02/11/11 | $0.315 |
Service Class | 02/11/11 | 02/11/11 | $0.315 |
Service Class 2 | 02/11/11 | 02/11/11 | $0.315 |
VIP Freedom 2050 Portfolio | | | |
Initial Class | 02/11/11 | 02/11/11 | $0.090 |
Service Class | 02/11/11 | 02/11/11 | $0.090 |
Service Class 2 | 02/11/11 | 02/11/11 | $0.090 |
Annual Report
The funds hereby designate as capital gain dividend the amounts noted below for the taxable year ended December 31, 2010, or, if subsequently determined to be different, the net capital gain of such year.
VIP Freedom Income Portfolio | $281,294 |
VIP Freedom 2010 Portfolio | $790,057 |
VIP Freedom 2015 Portfolio | $145,335 |
VIP Freedom 2020 Portfolio | $106,711 |
VIP Freedom 2025 Portfolio | $13,032 |
VIP Freedom 2030 Portfolio | $80,583 |
VIP Freedom 2035 Portfolio | $21,820 |
VIP Freedom 2040 Portfolio | $16,713 |
VIP Freedom 2045 Portfolio | $31,300 |
VIP Freedom 2050 Portfolio | $10,949 |
A percentage of the dividends distributed during the fiscal year for the following funds was derived from interest on U.S. Government securities which is generally exempt from state income tax.
VIP Freedom Income Portfolio | |
Initial Class | 4.60% |
Service Class | 4.60% |
Service Class 2 | 4.60% |
VIP Freedom 2005 Portfolio | |
Initial Class | 3.67% |
Service Class | 3.67% |
Service Class 2 | 3.67% |
VIP Freedom 2010 Portfolio | |
Initial Class | 3.89% |
Service Class | 3.89% |
Service Class 2 | 3.89% |
VIP Freedom 2015 Portfolio | |
Initial Class | 4.07% |
Service Class | 4.07% |
Service Class 2 | 4.07% |
VIP Freedom 2020 Portfolio | |
Initial Class | 3.85% |
Service Class | 3.85% |
Service Class 2 | 3.85% |
VIP Freedom 2025 Portfolio | |
Initial Class | 3.31% |
Service Class | 3.31% |
Service Class 2 | 3.31% |
VIP Freedom 2030 Portfolio | |
Initial Class | 2.68% |
Service Class | 2.68% |
Service Class 2 | 2.68% |
A percentage of the dividends distributed during the fiscal year for the following funds qualify for the dividends-received deduction for corporate shareholders:
| February
2010 | December
2010 |
VIP Freedom Income Portfolio | | |
Initial Class | - | 6% |
Service Class | - | 6% |
Service Class 2 | - | 7% |
Annual Report
Distributions (Unaudited) - continued
A percentage of the dividends distributed during the fiscal year for the following funds qualify for the dividends-received deduction for corporate shareholders: - continued
| February
2010 | December
2010 |
VIP Freedom 2005 Portfolio | | |
Initial Class | 1% | 14% |
Service Class | 1% | 15% |
Service Class 2 | 1% | 16% |
VIP Freedom 2010 Portfolio | | |
Initial Class | 1% | 13% |
Service Class | 1% | 14% |
Service Class 2 | 1% | 15% |
VIP Freedom 2015 Portfolio | | |
Initial Class | 3% | 14% |
Service Class | 3% | 14% |
Service Class 2 | 3% | 15% |
VIP Freedom 2020 Portfolio | | |
Initial Class | 4% | 18% |
Service Class | 4% | 19% |
Service Class 2 | 4% | 20% |
VIP Freedom 2025 Portfolio | | |
Initial Class | 2% | 22% |
Service Class | 2% | 22% |
Service Class 2 | 2% | 23% |
VIP Freedom 2030 Portfolio | | |
Initial Class | 3% | 25% |
Service Class | 3% | 26% |
Service Class 2 | 3% | 27% |
VIP Freedom 2035 Portfolio | | |
Initial Class | 1% | 24% |
Service Class | 1% | 25% |
Service Class 2 | 1% | 25% |
VIP Freedom 2040 Portfolio | | |
Initial Class | - | 7% |
Service Class | - | 7% |
Service Class 2 | - | 7% |
VIP Freedom 2045 Portfolio | | |
Initial Class | - | 24% |
Service Class | - | 24% |
Service Class 2 | - | 26% |
VIP Freedom 2050 Portfolio | | |
Initial Class | 2% | 29% |
Service Class | 2% | 30% |
Service Class 2 | 2% | 32% |
Annual Report
Board Approval of Investment Advisory Contracts and Management Fees
VIP Freedom Funds
Each year, the Board of Trustees, including the Independent Trustees (together, the Board), votes on the renewal of the management contract and administration agreement (together, the Advisory Contracts) for each fund. The Board, assisted by the advice of fund counsel and Independent Trustees' counsel, requests and considers a broad range of information relevant to the renewal of the Advisory Contracts throughout the year.
The Board meets regularly and considers at each of its meetings factors that are relevant to its annual consideration of the renewal of each fund's Advisory Contracts, including the services and support provided to each fund and its shareholders. The Board has established three standing committees, each composed of Independent Trustees with varying backgrounds, to which the Board has assigned specific subject matter responsibilities in order to enhance effective decision-making by the Board. The Operations Committee, of which all of the Independent Trustees are members, meets regularly throughout the year and, among other matters, considers matters specifically related to the annual consideration of the renewal of each fund's Advisory Contracts. The Board, acting directly and through its Committees, requests and receives information concerning the annual consideration of the renewal of each fund's Advisory Contracts. The Board also meets as needed to consider matters specifically related to the Board's annual consideration of the renewal of Advisory Contracts. Members of the Board may also meet with trustees of other Fidelity funds through ad hoc joint committees to discuss certain matters relevant to the Fidelity funds.
At its September 2010 meeting, the Board of Trustees, including the Independent Trustees, unanimously determined to renew each fund's Advisory Contracts. In reaching its determination, the Board considered all factors it believed relevant and reached a determination, with the assistance of fund counsel and Independent Trustees' counsel and through the exercise of its business judgment, that the renewal of the Advisory Contracts is in the best interests of each fund and its shareholders and that the lack of compensation to be received by Fidelity under the management contracts is fair and reasonable. The Board's decision to renew the Advisory Contracts was not based on any single factor, but rather was based on a comprehensive consideration of all the information provided to the Board at its meetings throughout the year. In reaching its determination, the Board is aware that shareholders in each fund have a broad range of investment choices available to them, including a wide choice among mutual funds offered by Fidelity's competitors, and that each fund's shareholders, with the opportunity to review and weigh the disclosure provided by the fund in its prospectus and other public disclosures, have chosen to invest in that fund, managed by Fidelity.
Nature, Extent, and Quality of Services Provided. The Board considered the staffing within the investment adviser, Strategic Advisers, Inc. (Strategic Advisers), and the administrator, FMR, including the backgrounds of the funds' investment personnel and the funds' investment objectives and disciplines. The Independent Trustees also had discussions with senior management of Fidelity's investment operations and investment groups. The Board considered the structure of the portfolio manager compensation program and whether this structure provides appropriate incentives to act in the best interest of each fund.
Resources Dedicated to Investment Management and Support Services. The Board reviewed the size, education, and experience of Strategic Advisers' investment staff, their use of technology, and Strategic Advisers' and FMR's approach to recruiting, training, and retaining portfolio managers and other research, advisory, and management personnel. The Board noted that Fidelity's analysts have access to a variety of technological tools and market and securities data that enable them to perform both fundamental and quantitative analysis and to specialize in various disciplines. The Board noted FMR's continued focus on strengthening the organization and discipline of equity portfolio management and research.
Shareholder and Administrative Services. The Board considered (i) the nature, extent, quality, and cost of advisory, administrative, and shareholder services performed by FMR and its affiliates under the Advisory Contracts and under separate agreements covering transfer agency, pricing and bookkeeping, and securities lending services for each fund; (ii) the nature and extent of FMR's supervision of third party service providers, principally custodians and subcustodians; and (iii) the resources devoted to, and the record of compliance with, each fund's compliance policies and procedures.
The Board noted that the growth of fund assets over time across the complex allows Fidelity to reinvest in the development of services designed to enhance the value or convenience of the Fidelity funds as investment vehicles. These services include 24-hour access to account information and market information through telephone representatives and over the Internet, and investor education materials and asset allocation tools.
Investment in a Large Fund Family. The Board considered the benefits to shareholders of investing in a Fidelity fund, including the benefits of investing in a fund that is part of a large family of funds offering a variety of investment disciplines and providing a large variety of mutual fund investor services. The Board noted that Fidelity had taken, or had made recommendations that resulted in the Fidelity funds taking, a number of actions over the previous year that benefited particular funds, including (i) dedicating additional resources to investment research and restructuring and broadening the focus of the investment research teams; (ii) bolstering the senior management team that oversees asset management; (iii) launching Class F of certain funds as a lower-fee class available to Freedom K and Freedom Index Funds; (iv) lowering the initial investment minimums and ongoing balance requirements for Real Estate High Income Fund; (v) eliminating subsequent purchase minimums for all funds and adding a waiver of the investment minimum requirement for new accounts opened with the proceeds of a systematic withdrawal plan; (vi) eliminating the withdrawal minimum and maximum limits for systematic withdrawals from Advisor funds; (vii) expanding sales load waivers on Class A shares for Destiny Planholders and expanding Institutional Class eligibility for Class O Destiny Planholders; and (viii) changing certain Class A and Class T sales charge structures to further align them with industry practices.
Annual Report
Board Approval of Investment Advisory Contracts and Management Fees - continued
Investment Performance (except for VIP Freedom 2035 Portfolio, VIP Freedom 2040 Portfolio, VIP Freedom 2045 Portfolio, and VIP Freedom 2050 Portfolio). The Board considered whether each fund has operated in accordance with its investment objective, as well as its record of compliance with its investment restrictions. It also reviewed each fund's absolute investment performance for each class, as well as each fund's relative investment performance for each class measured over multiple periods against a proprietary custom index. The Board noted that FMR does not believe that a meaningful peer group exists against which to compare any of the funds' performance. Because each fund had been in existence less than five calendar years, for each fund the following charts considered by the Board show, over the one- and three-year periods ended December 31, 2009, the cumulative total returns of Initial Class and Service Class 2 of the fund and the cumulative total returns of a proprietary custom index ("benchmark"). The returns of Initial Class and Service Class 2 show the performance of the highest and lowest performing classes, respectively (based on three-year performance).
For each fund, the proprietary custom index is an index developed by FMR that represents the performance of the fund's asset classes according to their respective weightings, adjusted on June 30 and December 31 of each calendar year to reflect the fund's increasingly conservative asset allocations (for each fund other than VIP Freedom Income Portfolio).
VIP Freedom 2005 Portfolio
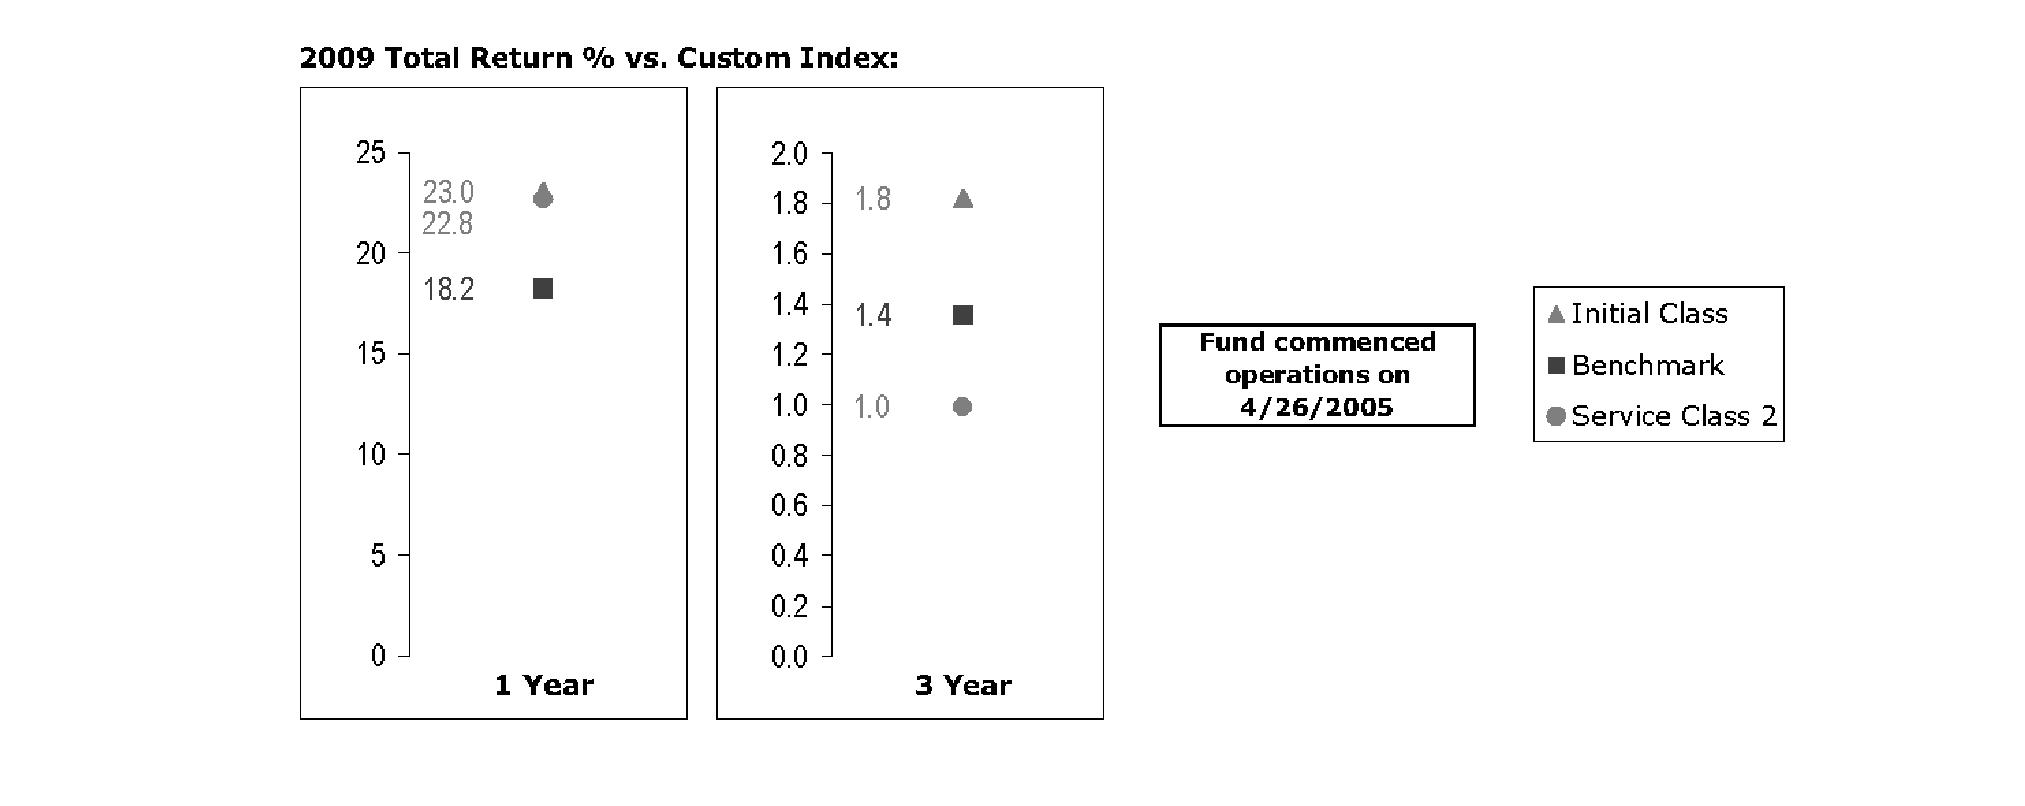
The Board noted that the investment performance of Initial Class of the fund compared favorably to its benchmark for all the periods shown. The Board considered that the variations in performance among the fund's classes reflect the variations in class expenses, which result in lower performance for higher expense classes. The Board also reviewed the fund's performance since inception as well as performance in the current year.
Annual Report
VIP Freedom 2010 Portfolio
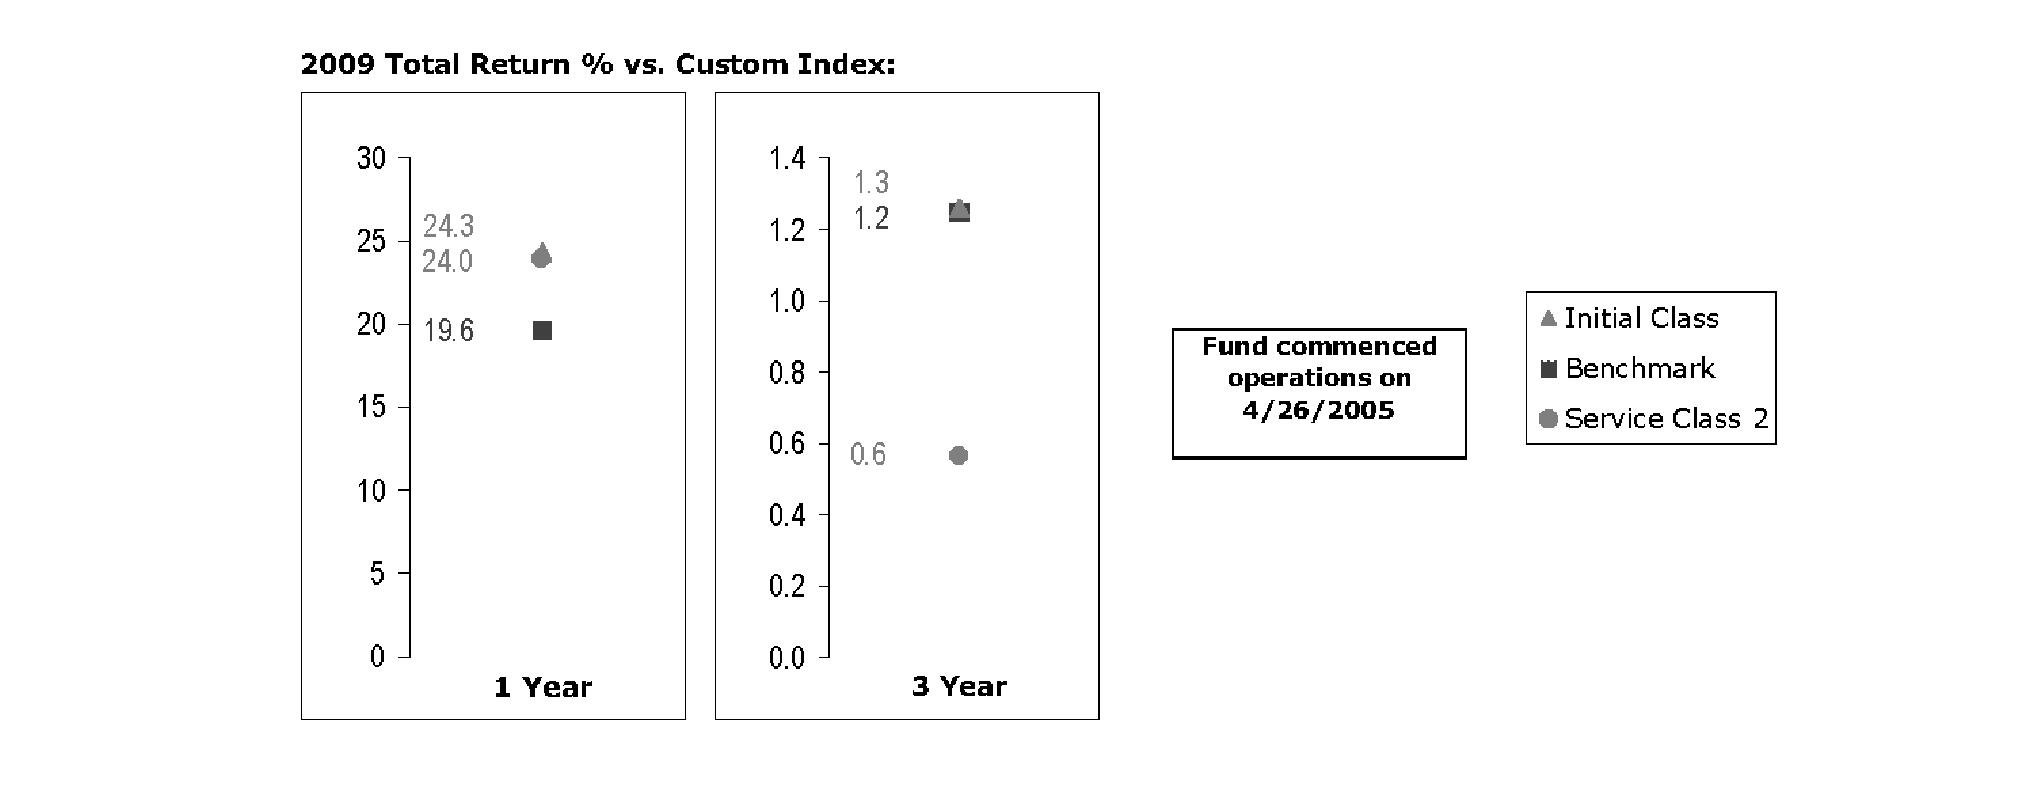
The Board noted that the investment performance of Initial Class of the fund compared favorably its benchmark for all the periods shown. The Board considered that the variations in performance among the fund's classes reflect the variations in class expenses, which result in lower performance for higher expense classes. The Board also reviewed the fund's performance since inception as well as performance in the current year.
VIP Freedom 2015 Portfolio
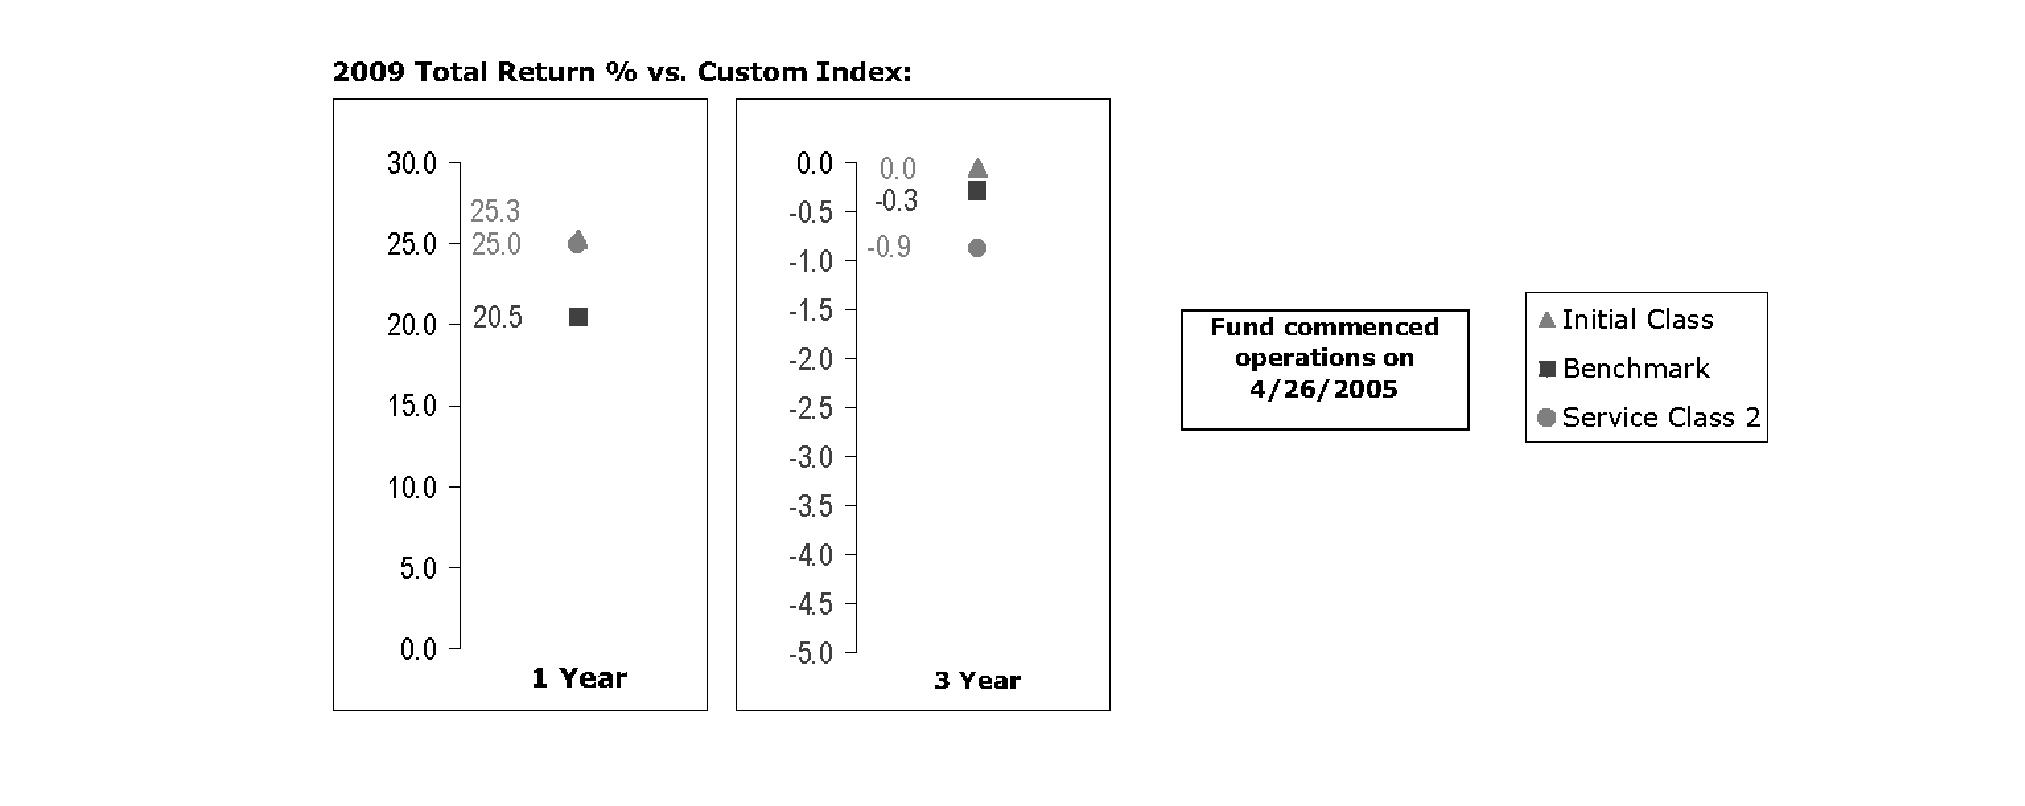
The Board noted that the investment performance of Initial Class of the fund compared favorably to its benchmark for all the periods shown. The Board considered that the variations in performance among the fund's classes reflect the variations in class expenses, which result in lower performance for higher expense classes. The Board also reviewed the fund's performance since inception as well as performance in the current year.
Annual Report
Board Approval of Investment Advisory Contracts and Management Fees - continued
VIP Freedom 2020 Portfolio
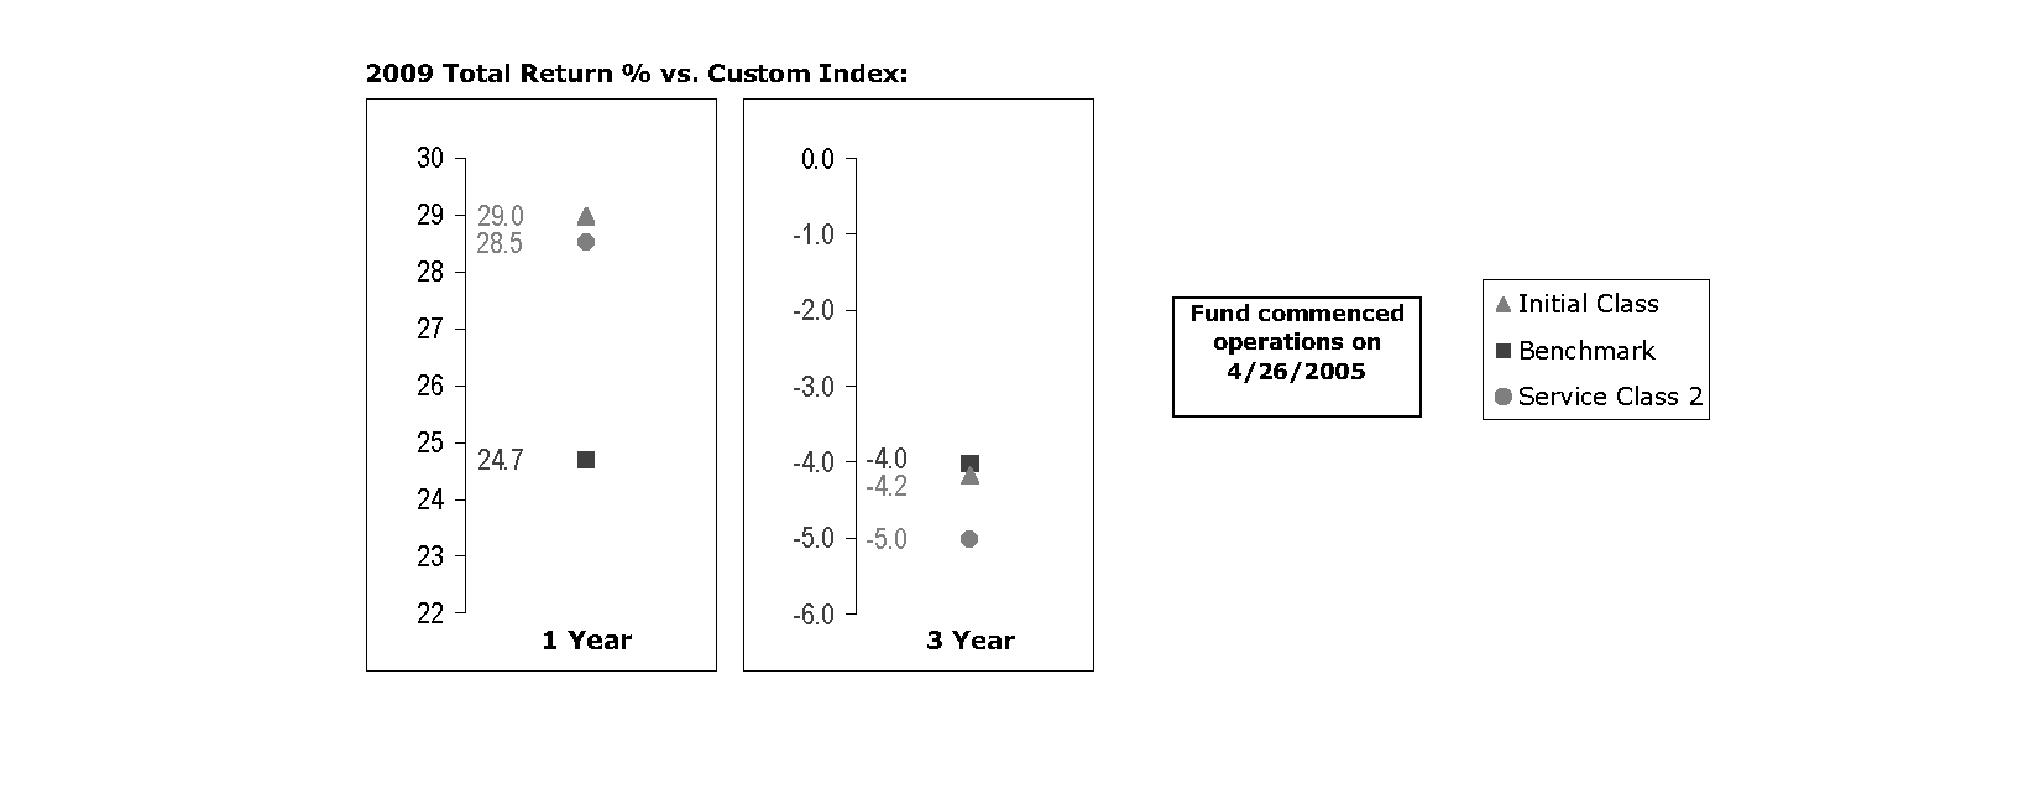
The Board noted that the investment performance of Initial Class of the fund compared favorably to its benchmark for the one-year period, although the fund's three-year cumulative total return was lower than its benchmark. The Board considered that the variations in performance among the fund's classes reflect the variations in class expenses, which result in lower performance for higher expense classes. The Board also reviewed the fund's performance since inception as well as performance in the current year.
VIP Freedom 2025 Portfolio
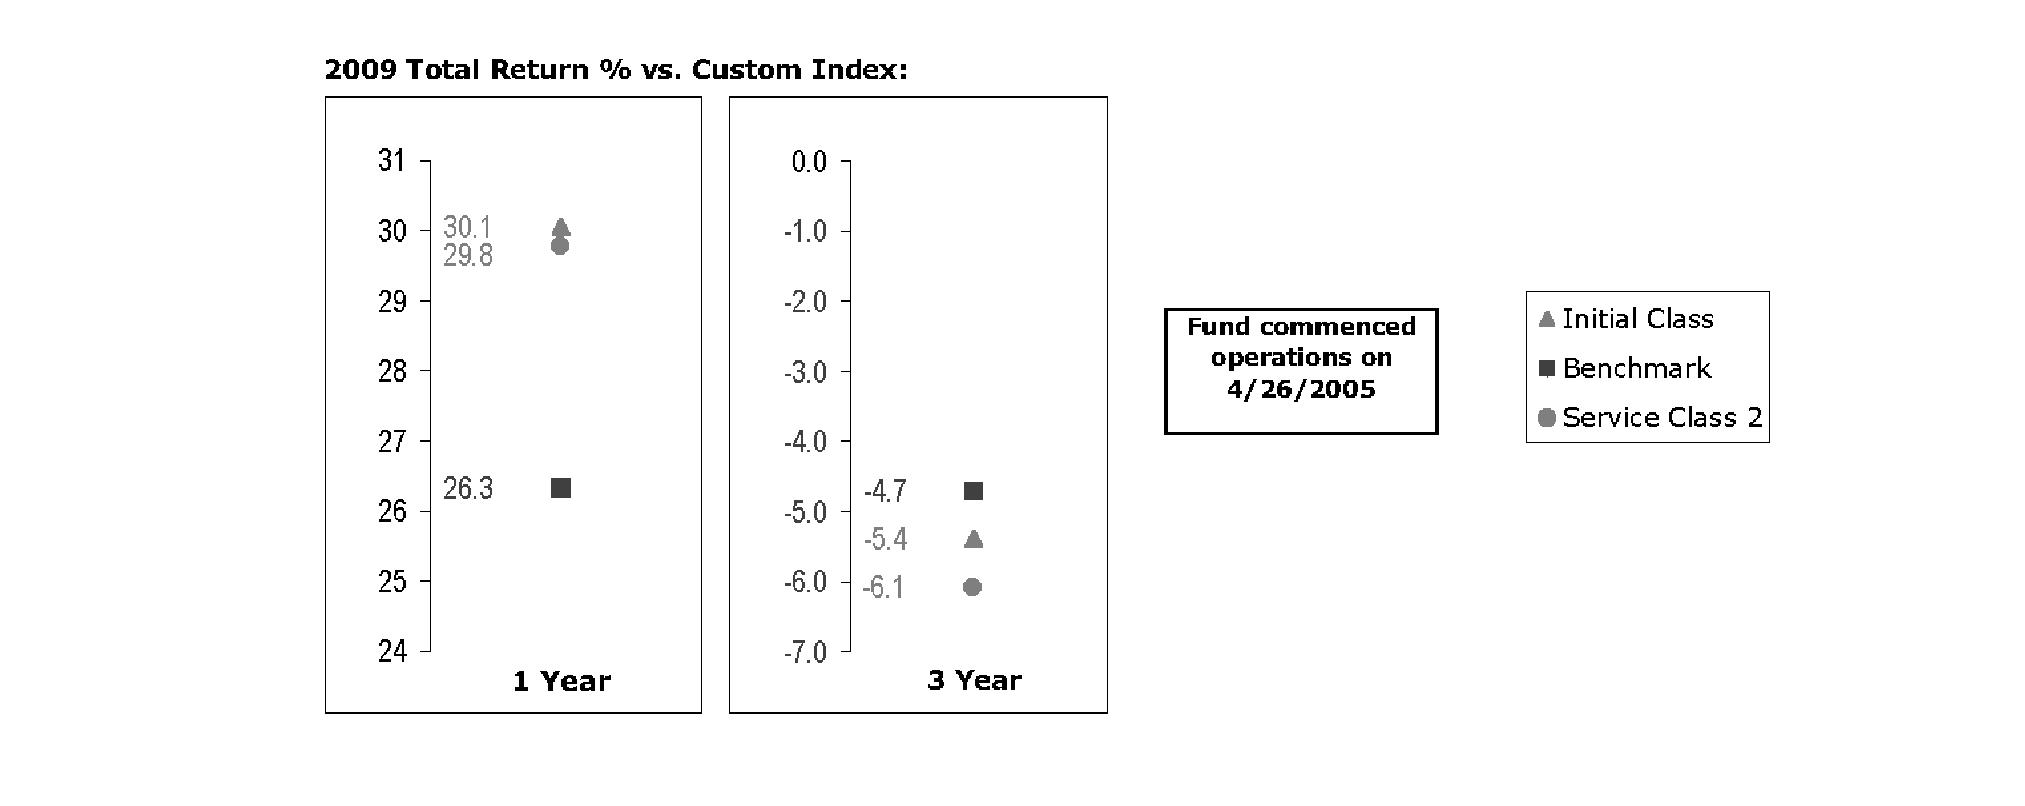
The Board noted that the investment performance of Initial Class of the fund compared favorably to its benchmark for the one-year period, although the fund's three-year cumulative total return was lower than its benchmark. The Board considered that the variations in performance among the fund's classes reflect the variations in class expenses, which result in lower performance for higher expense classes. The Board also reviewed the fund's performance since inception as well as performance in the current year.
Annual Report
VIP Freedom 2030 Portfolio
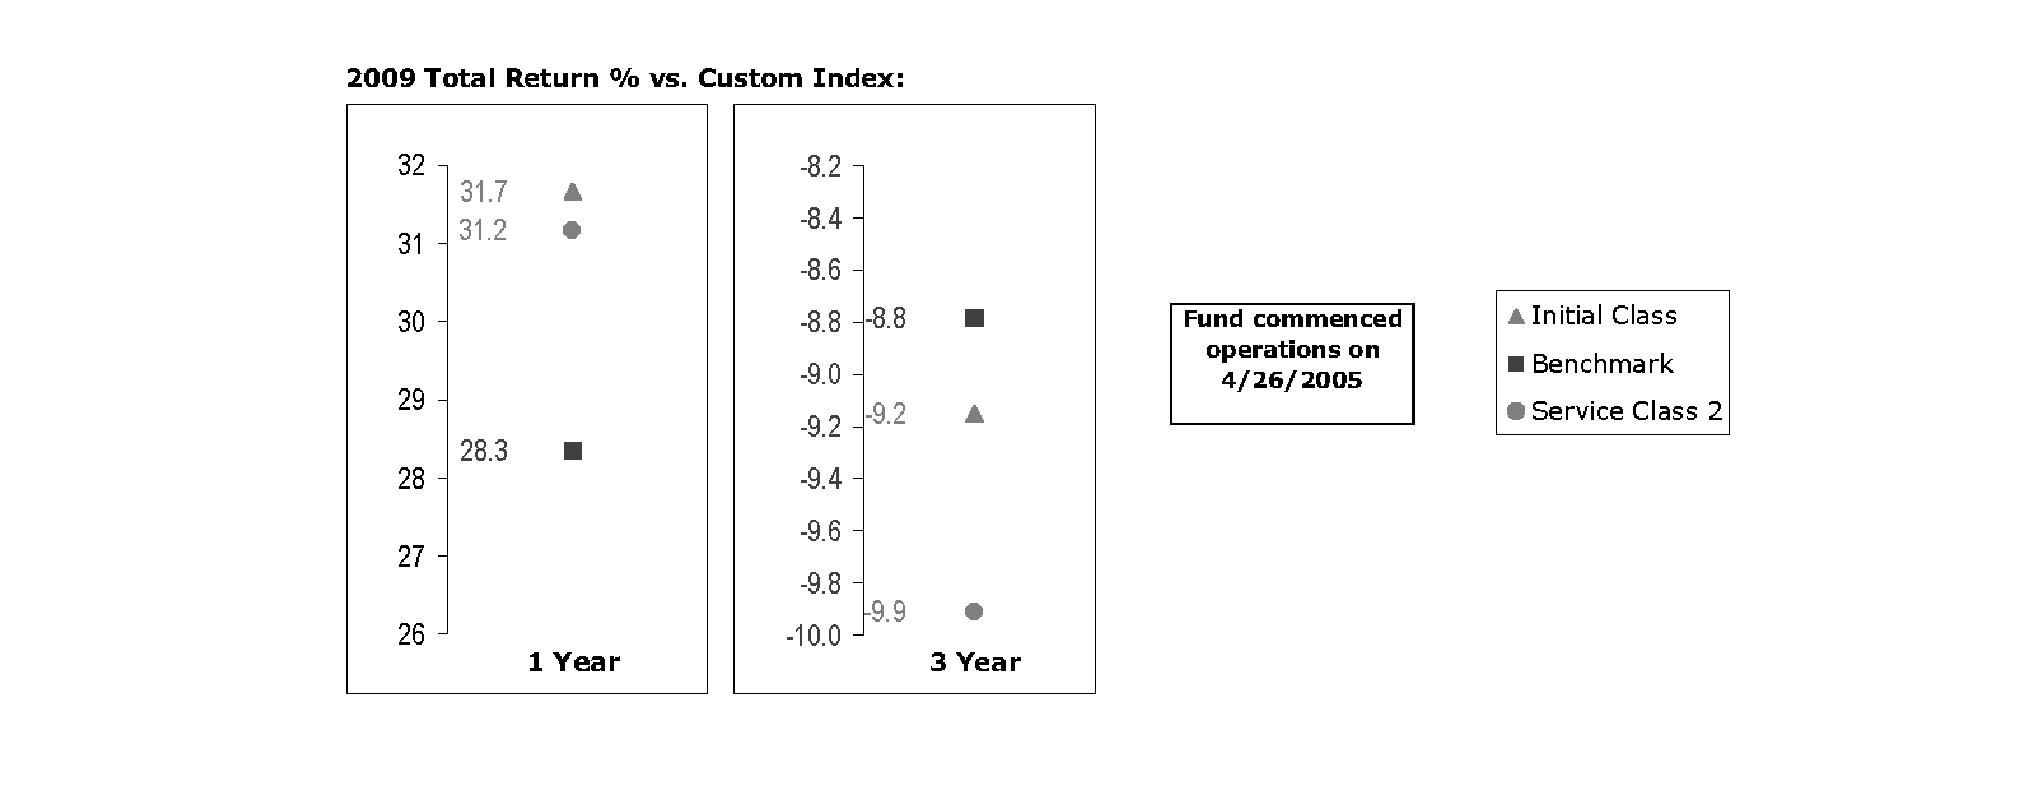
The Board noted that the investment performance of Initial Class of the fund compared favorably to its benchmark for the one-year period, although the fund's three-year cumulative total return was lower than its benchmark. The Board considered that the variations in performance among the fund's classes reflect the variations in class expenses, which result in lower performance for higher expense classes. The Board also reviewed the fund's performance since inception as well as performance in the current year.
VIP Freedom Income Portfolio
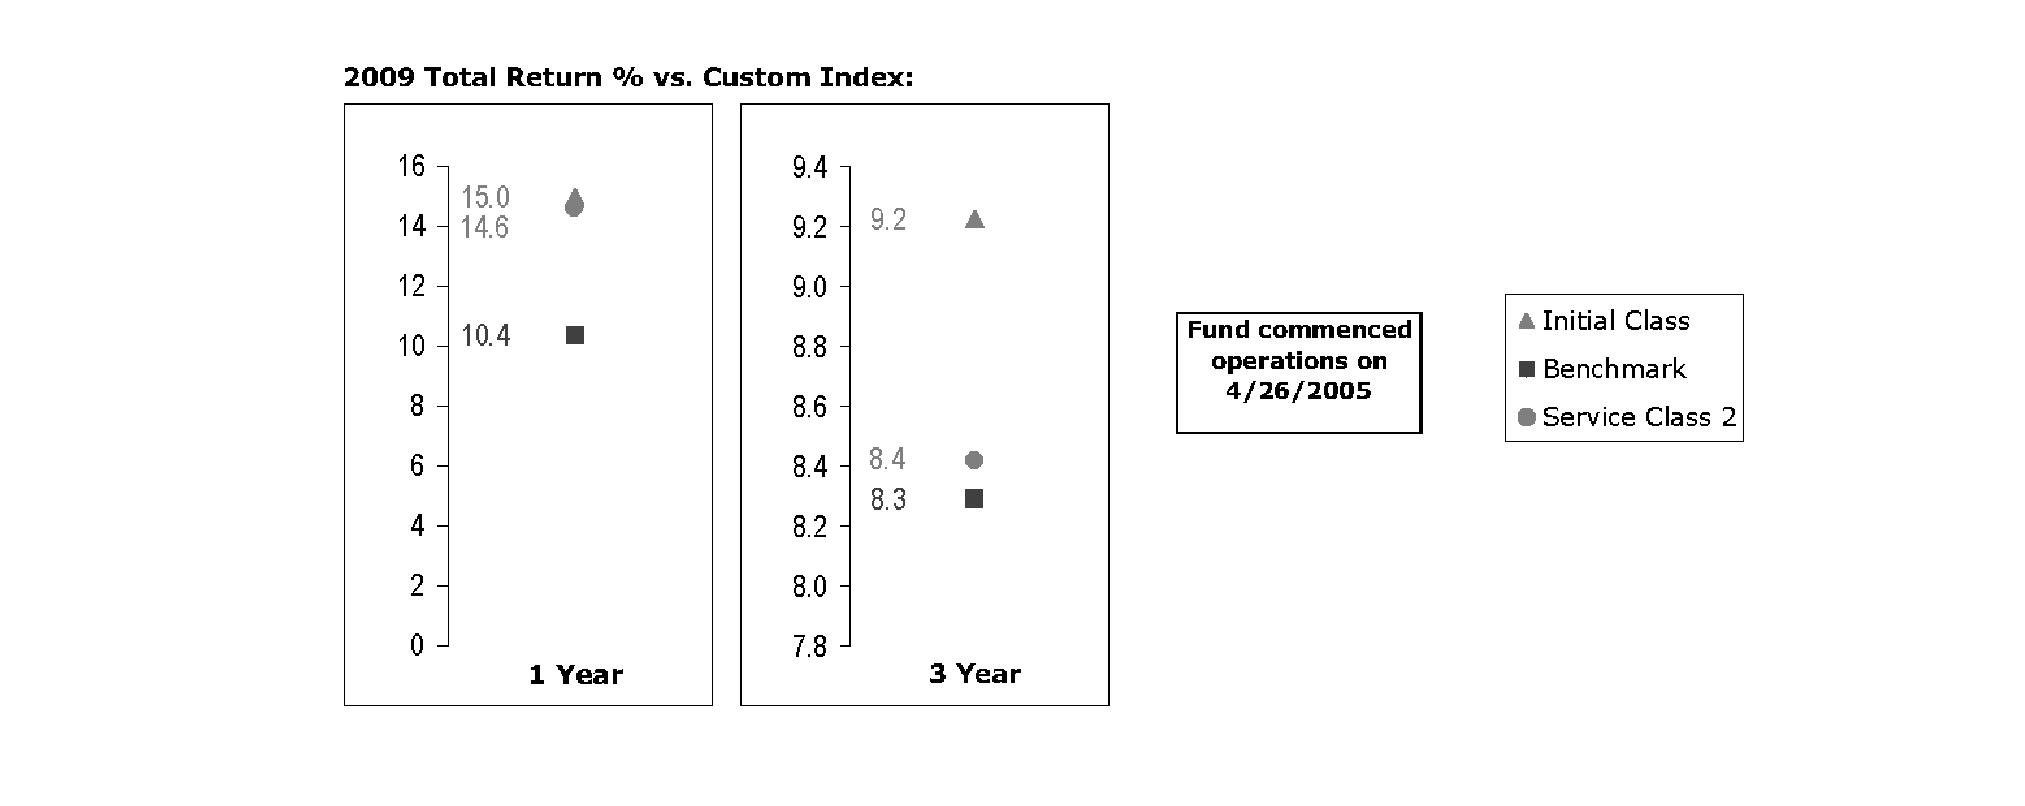
The Board noted that the investment performance of Initial Class of the fund compared favorably to its benchmark for all the periods shown. The Board considered that the variations in performance among the fund's classes reflect the variations in class expenses, which result in lower performance for higher expense classes. The Board also reviewed the fund's performance since inception as well as performance in the current year.
Investment Performance (VIP Freedom 2035 Portfolio, VIP Freedom 2040 Portfolio, VIP Freedom 2045 Portfolio, and VIP Freedom 2050 Portfolio). The Board considered whether each fund has operated in accordance with its investment objective, as well as its record of compliance with its investment restrictions. The Board noted that it is not possible to evaluate performance in any comprehensive fashion because each fund had been in operation for less than one calendar year. Once a fund has been in operation for at least one calendar year, the Board will review the fund's absolute investment performance for each class, as well as the fund's relative investment performance for each class measured against a proprietary custom index.
Annual Report
Board Approval of Investment Advisory Contracts and Management Fees - continued
Based on its review, and giving particular weight to the nature and quality of the resources dedicated by Strategic Advisers and FMR to maintain and improve relative performance and factoring in the unprecedented market events in recent years, the Board concluded that the nature, extent, and quality of investment management and support services and of shareholder and administrative services provided to each fund will benefit each fund's shareholders, particularly in light of the Board's view that each fund's shareholders benefit from investing in a fund that is part of a large family of funds offering a variety of investment disciplines and services.
Competitiveness of Management Fee and Total Fund Expenses. The Board noted that the funds do not pay Strategic Advisers a management fee for investment advisory services. The Board considered each fund's management fee and total expenses (which include the fees and expenses of underlying funds) compared to "mapped groups" of competitive funds and classes. Fidelity creates "mapped groups" by combining similar Lipper investment objective categories that have comparable management fee characteristics. Combining Lipper investment objective categories aids the Board's management fee and total expense comparisons by broadening the competitive group used for comparison and by reducing the number of universes to which various Fidelity funds are compared.
Management Fee. The Board considered two proprietary management fee comparisons for the 12-month (or shorter) periods shown in the charts below. The group of Lipper funds used by the Board for management fee comparisons is referred to below as the "Total Mapped Group." The Total Mapped Group comparison focuses on a fund's standing relative to the total universe of comparable funds available to investors, in terms of gross management fees before expense reimbursements or caps. "TMG %" represents the percentage of funds in the Total Mapped Group that had management fees that were lower than a fund's. For example, a TMG % of 0% means that 100% of the funds in the Total Mapped Group had higher management fees than a fund. The "Asset-Size Peer Group" (ASPG) comparison focuses on a fund's standing relative to non-Fidelity funds similar in size to the fund within the Total Mapped Group. The ASPG represents at least 15% of the funds in the Total Mapped Group with comparable asset size and management fee characteristics, subject to a minimum of 50 funds (or all funds in the Total Mapped Group if fewer than 50). Additional information, such as the ASPG quartile in which a fund's management fee ranked, is also included in the charts and considered by the Board.
VIP Freedom 2005 Portfolio
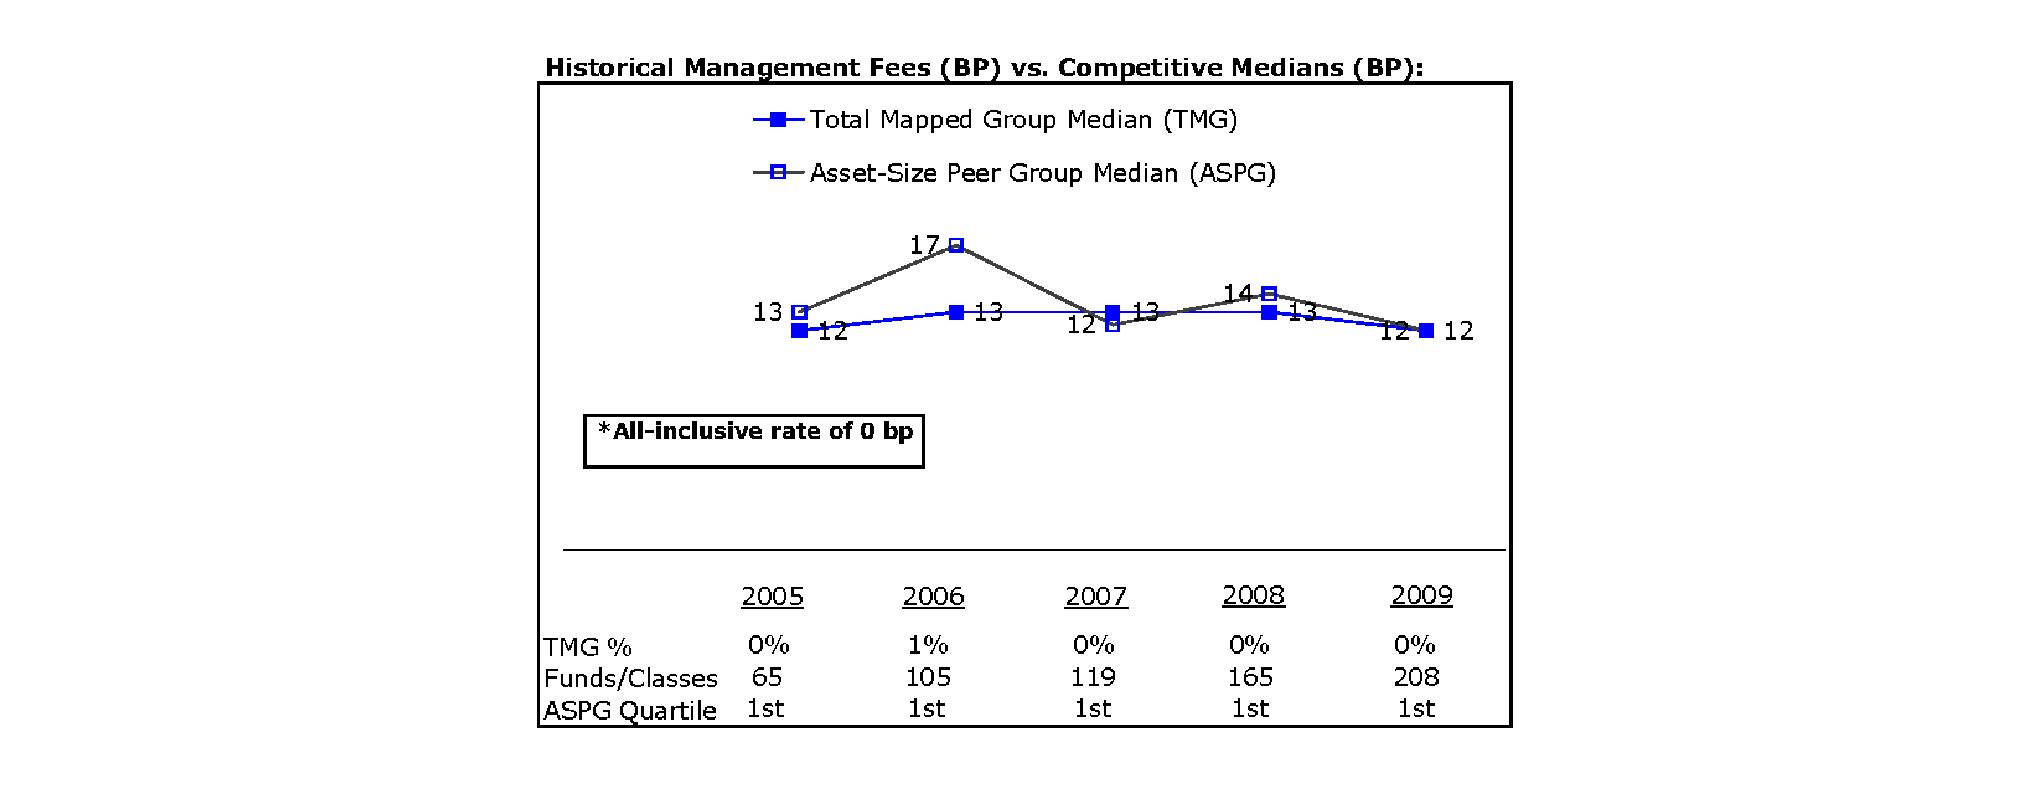
Annual Report
VIP Freedom 2010 Portfolio
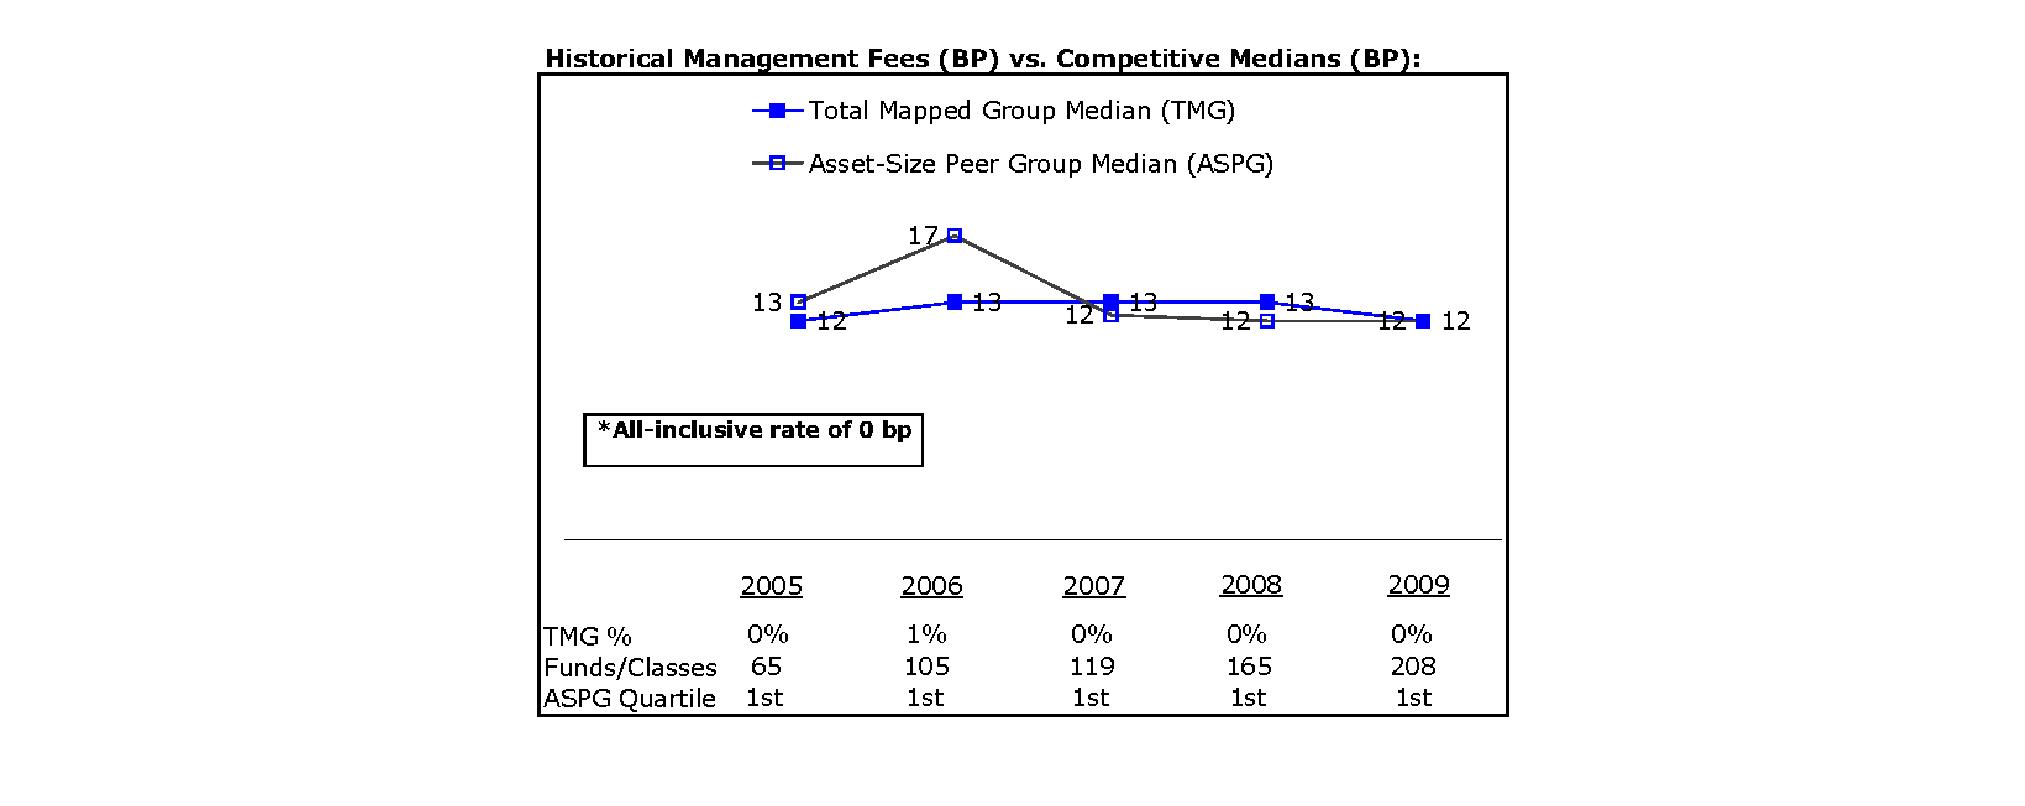
VIP Freedom 2015 Portfolio

Annual Report
Board Approval of Investment Advisory Contracts and Management Fees - continued
VIP Freedom 2020 Portfolio

VIP Freedom 2025 Portfolio
Annual Report
VIP Freedom 2030 Portfolio

VIP Freedom 2035 Portfolio
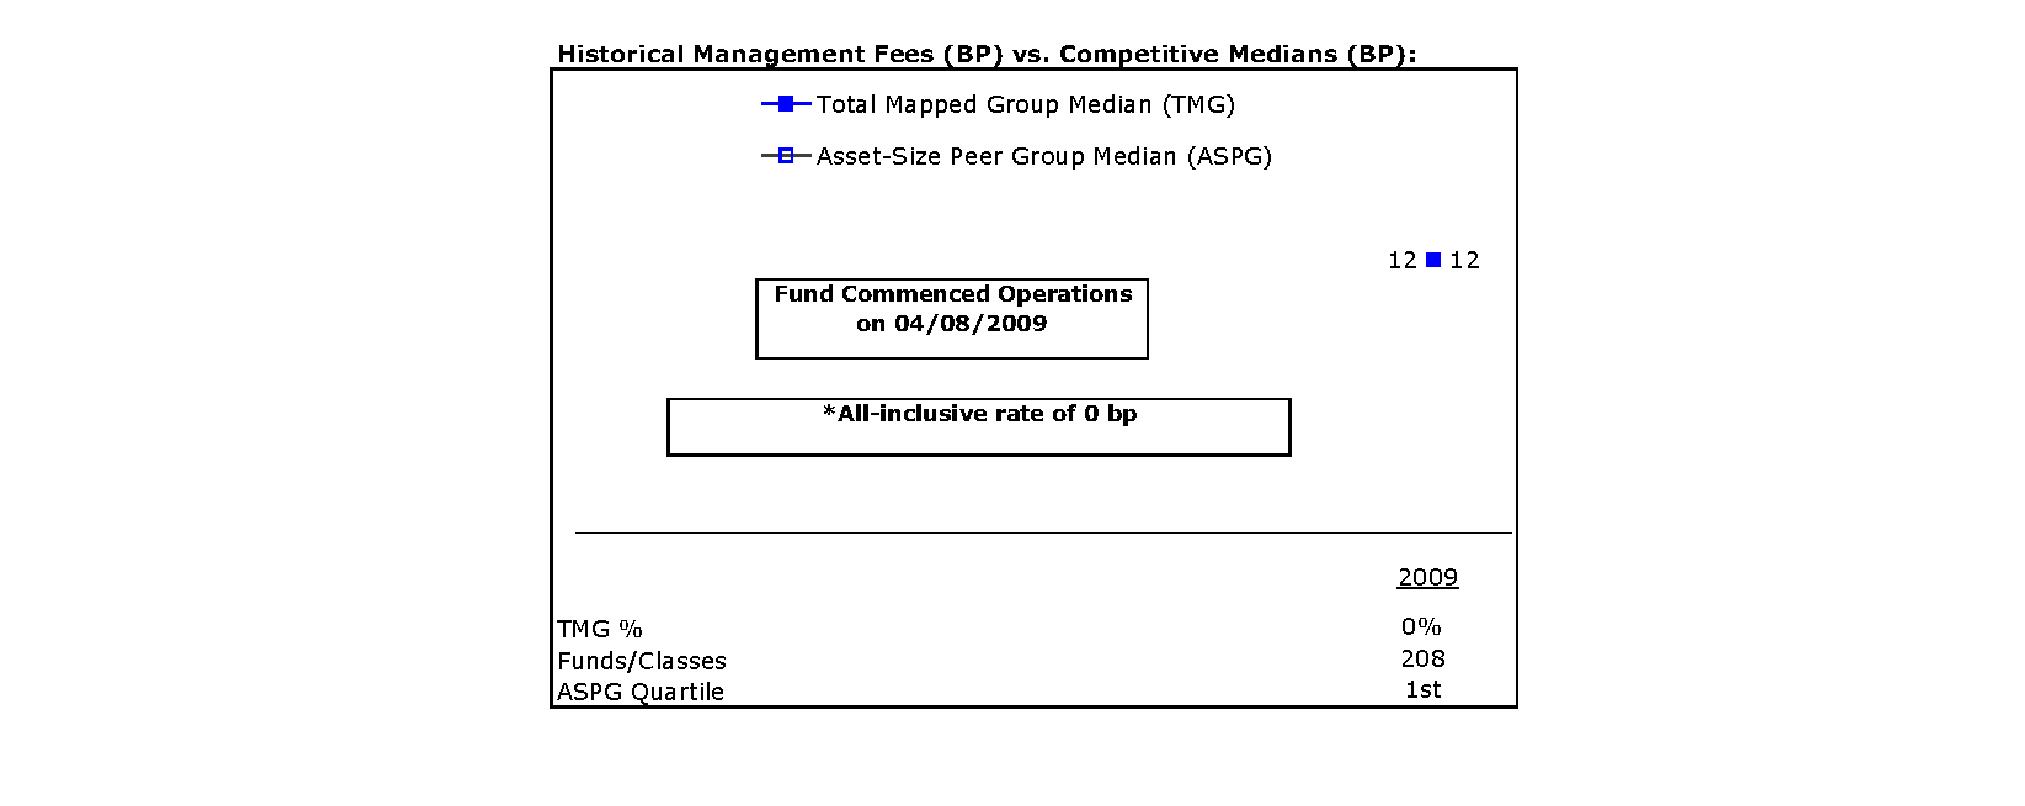
Annual Report
Board Approval of Investment Advisory Contracts and Management Fees - continued
VIP Freedom 2040 Portfolio
VIP Freedom 2045 Portfolio
Annual Report
VIP Freedom 2050 Portfolio
VIP Freedom Income Portfolio
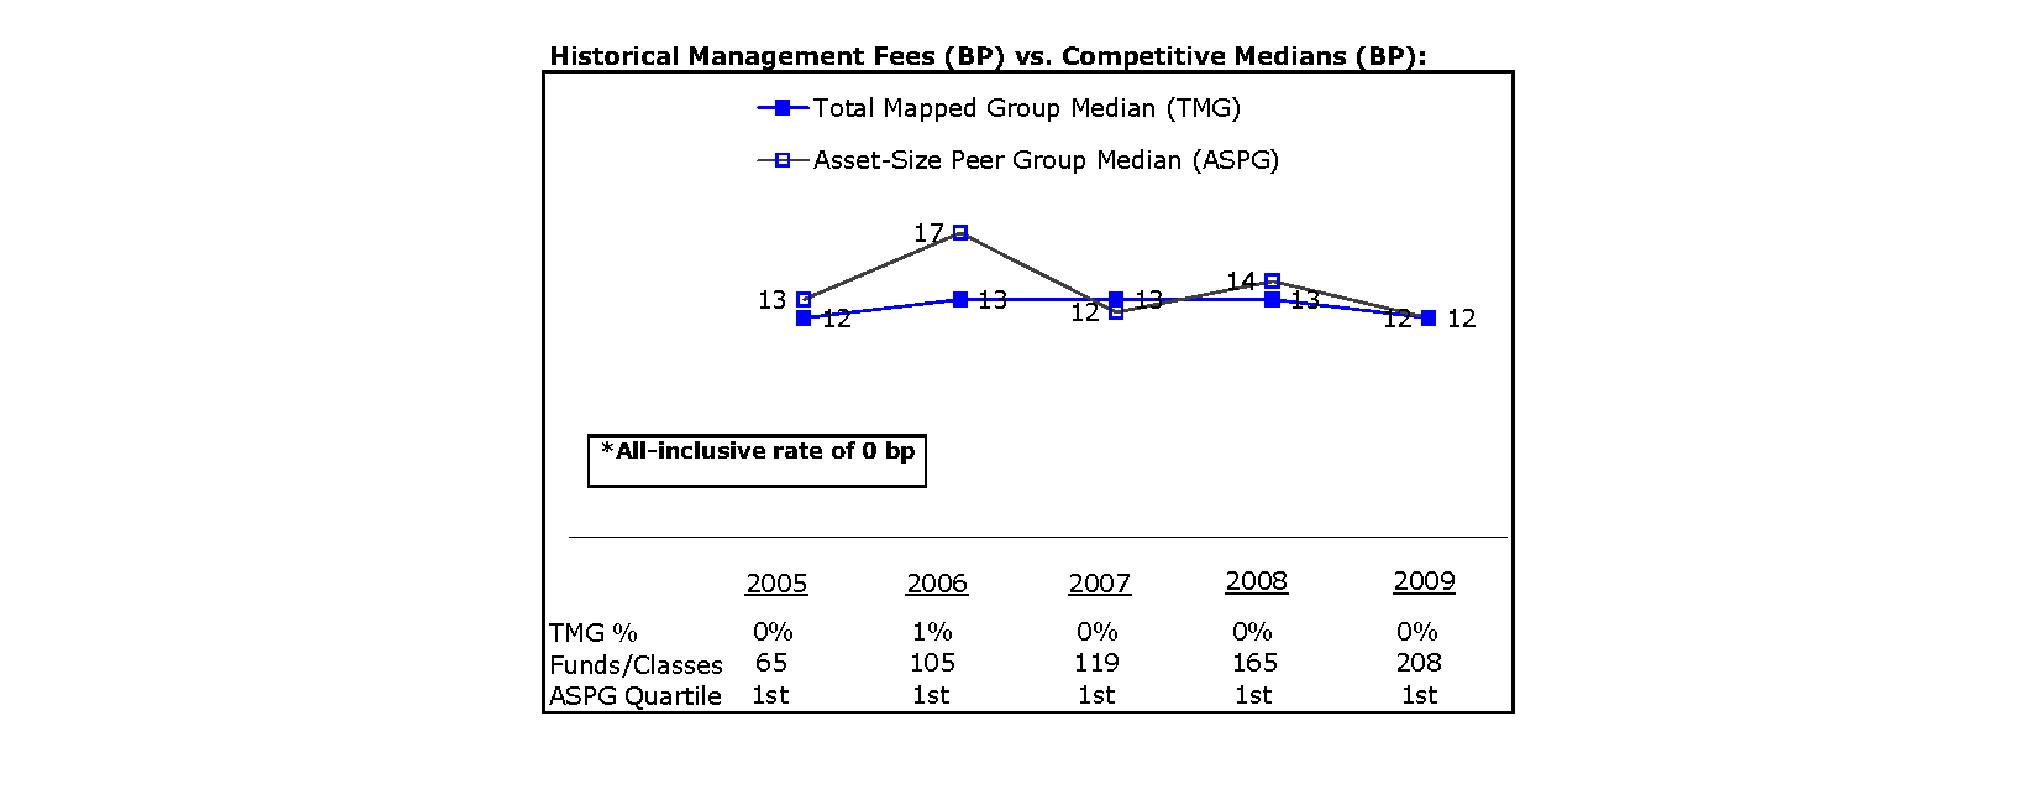
The Board noted that each fund's management fee ranked below the median of its Total Mapped Group and below the median of its ASPG for 2009.
Based on its review, the Board concluded that each fund's management fee is fair and reasonable in light of the services that the fund receives and the other factors considered.
Total Expenses. In its review of the total expenses of each class of each fund, the Board noted that each fund invests in Initial Class of the underlying fund to avoid charging fund-paid 12b-1 fees at both fund levels. The Board considered that the funds do not pay transfer agent fees. Instead, Initial Class of each underlying fund bears its pro rata portion of each fund's transfer agent fee according to the percentage of each fund's assets invested in that underlying fund. The Board further noted that FMR pays all other expenses of each fund, with limited exceptions.
The Board noted that the total expenses of each of Initial Class and Service Class of each fund ranked below its competitive median for 2009 and the total expenses of Service Class 2 ranked equal to its competitive median for 2009.
Fees Charged to Other Fidelity Clients. The Board also considered Fidelity fee structures and other information with respect to clients of FMR and its affiliates, such as other mutual funds advised or subadvised by FMR or its affiliates, pension plan clients, and other institutional clients. In March 2010, the Board created an ad hoc joint committee with the board of other Fidelity funds (the Committee) to review and compare Fidelity's institutional investment advisory business with its business of providing services to the Fidelity funds, including the differences in services provided, fees charged, and costs incurred, as well as competition in their respective marketplaces.
Annual Report
Board Approval of Investment Advisory Contracts and Management Fees - continued
Based on its review of total expenses and fees charged to other Fidelity clients, the Board concluded that the total expenses of each class of each fund were reasonable in light of the services that the fund and its shareholders receive and the other factors considered, including the findings of the Committee.
Costs of the Services and Profitability. The Board considered the level of Fidelity's profits in respect of all the Fidelity funds.
PricewaterhouseCoopers LLP (PwC), independent registered public accounting firm and auditor to Fidelity and certain Fidelity funds, has been engaged annually by the Board as part of the Board's assessment of Fidelity's profitability analysis. PwC's engagement includes the review and assessment of Fidelity's methodologies used in determining the revenues and expenses attributable to Fidelity's mutual fund business, and completion of agreed-upon procedures surrounding the mathematical accuracy of fund profitability and its conformity to allocation methodologies. After considering PwC's reports issued under the engagement and information provided by Fidelity, the Board believes that while other allocation methods may also be reasonable, Fidelity's profitability methodologies are reasonable in all material respects.
The Board has also reviewed Fidelity's non-fund businesses and fall-out benefits related to the mutual fund business as well as cases where Fidelity's affiliates may benefit from or be related to the funds' business.
The Board concluded that the costs of the services provided by and the profits realized by Fidelity in connection with the operation of each fund were not relevant to the renewal of each fund's Advisory Contracts because the funds do not pay management fees and FMR pays all other expenses of each fund, with limited exceptions.
Economies of Scale. The Board concluded that because the funds do not pay management fees and FMR pays all other expenses of each fund, with limited exceptions, economies of scale cannot be realized by the funds, but may be realized by the other Fidelity funds in which each fund invests.
Additional Information Requested by the Board. In order to develop fully the factual basis for consideration of the Fidelity funds' Advisory Contracts, the Board requested and received additional information on certain topics, including (i) fund performance trends, actions to be taken by FMR to improve certain funds' overall performance, and Fidelity's long-term strategies for certain funds; (ii) Fidelity's fund profitability methodology and profitability trends for certain funds; (iii) portfolio manager changes that have occurred during the past year and the amount of the investment that each portfolio manager has made in the Fidelity fund(s) that he or she manages; (iv) Fidelity's compensation structure for portfolio managers, research analysts, and other key personnel, including its effects on fund profitability, the rationale for the compensation structure, and the extent to which current market conditions have affected retention and recruitment; (v) the compensation paid by FMR to fund sub-advisers on behalf of the Fidelity funds; (vi) Fidelity's fee structures and rationale for recommending different fees among different categories of funds and classes, as well as Fidelity's voluntary waiver of fees to maintain minimum yields for certain funds and classes; (vii) the rationale for any differences between fund fee structures and fee structures in place for other Fidelity clients; and (viii) explanations regarding the relative total expenses borne by certain funds and classes, total expense competitive trends, and actions that might be taken by FMR to reduce total expenses for certain funds and classes or to achieve further economies of scale.
Based on its evaluation of all of the conclusions noted above, and after considering all factors it believed relevant, the Board ultimately concluded that the advisory fee structures are fair and reasonable, and that each fund's Advisory Contracts should be renewed.
Annual Report
Investment Adviser
Strategic Advisers, Inc.
Boston, MA
General Distributor
Fidelity Distributors Corporation
Boston, MA
Transfer and Service Agents
Fidelity Investments Institutional Operations Company, Inc.
Boston, MA
Fidelity Service Company, Inc.
Boston, MA
Custodian
The Bank of New York Mellon
New York, NY
VIPFF2K-ANN-0211
1.826371.106
Fidelity® Variable Insurance Products:
Freedom Lifetime Income Funds -
Portfolios I, II, & III
Annual Report
December 31, 2010
(2_fidelity_logos) (Registered_Trademark)
Contents
To view a fund's proxy voting guidelines and proxy voting record for the 12-month period ended June 30, visit http://www.fidelity.com/proxyvotingresults or visit the Securities and Exchange Commission's (SEC) web site at http://www.sec.gov. You may also call 1-877-208-0098 to request a free copy of the proxy voting guidelines.
Fidelity Variable Insurance Products are separate account options which are purchased through a variable insurance contract.
Standard & Poor's, S&P and S&P 500 are registered service marks of The McGraw-Hill Companies, Inc. and have been licensed for use by Fidelity Distributors Corporation.
Other third party marks appearing herein are the property of their respective owners.
All other marks appearing herein are registered or unregistered trademarks or service marks of FMR LLC or an affiliated company.
This report and the financial statements contained herein are submitted for the general information of the shareholders of the funds. This report is not authorized for distribution to prospective investors in the funds unless preceded or accompanied by an effective prospectus.
A fund files its complete schedule of portfolio holdings with the SEC for the first and third quarters of each fiscal year on Form N-Q. Forms N-Q are available on the SEC's web site at http://www.sec.gov. A fund's Forms N-Q may be reviewed and copied at the SEC's Public Reference Room in Washington, DC. Information regarding the operation of the SEC's Public Reference Room may be obtained by calling 1-800-SEC-0330. For a complete list of a fund's portfolio holdings, view the most recent holdings listing, semiannual report, or annual report on Fidelity's web site at http://www.fidelity.com, http://www.advisor.fidelity.com, or http://www.401k.com, as applicable.
NOT FDIC INSURED • MAY LOSE VALUE • NO BANK GUARANTEE
Neither the funds nor Fidelity Distributors Corporation is a bank.
Annual Report
VIP Freedom Lifetime Income® I Portfolio
Performance: The Bottom Line
Average annual total return reflects the change in the value of an investment, assuming reinvestment of the fund's distributions from dividend income and capital gains (the profits earned upon the sale of securities that have grown in value, if any) and assuming a constant rate of performance each year. During periods of reimbursement by Fidelity, a fund's total return will be greater than it would be had the reimbursement not occurred. Performance numbers are net of all underlying fund operating expenses, but do not include any insurance charges imposed by your insurance company's separate account. If performance information included the effect of these additional charges, the total returns would have been lower. How a fund did yesterday is no guarantee of how it will do tomorrow.
Average Annual Total Returns
Periods ended December 31, 2010 | Past 1
year | Past 5
years | Life of fund A |
VIP Freedom Lifetime Income® I Portfolio | 11.84% | 4.62% | 4.91% |
A From July 26, 2005.
$10,000 Over Life of Fund
Let's say hypothetically that $10,000 was invested in VIP Freedom Lifetime Income I Portfolio on July 26, 2005, when the fund started. The chart shows how the value of your investment would have changed, and also shows how the S&P 500® Index performed over the same period.
Annual Report
VIP Freedom Lifetime Income II Portfolio
Performance: The Bottom Line
Average annual total return reflects the change in the value of an investment, assuming reinvestment of the fund's distributions from dividend income and capital gains (the profits earned upon the sale of securities that have grown in value, if any) and assuming a constant rate of performance each year. During periods of reimbursement by Fidelity, a fund's total return will be greater than it would be had the reimbursement not occurred. Performance numbers are net of all underlying fund operating expenses, but do not include any insurance charges imposed by your insurance company's separate account. If performance information included the effect of these additional charges, the total returns would have been lower. How a fund did yesterday is no guarantee of how it will do tomorrow.
Average Annual Total Returns
Periods ended December 31, 2010 | Past 1
year | Past 5
years | Life of fund A |
VIP Freedom Lifetime Income II Portfolio | 12.99% | 4.53% | 5.10% |
A From July 26, 2005.
$10,000 Over Life of Fund
Let's say hypothetically that $10,000 was invested in VIP Freedom Lifetime Income II Portfolio on July 26, 2005, when the fund started. The chart shows how the value of your investment would have changed, and also shows how the S&P 500 Index performed over the same period.
Annual Report
VIP Freedom Lifetime Income III Portfolio
Performance: The Bottom Line
Average annual total return reflects the change in the value of an investment, assuming reinvestment of the fund's distributions from dividend income and capital gains (the profits earned upon the sale of securities that have grown in value, if any) and assuming a constant rate of performance each year. During periods of reimbursement by Fidelity, a fund's total return will be greater than it would be had the reimbursement not occurred. Performance numbers are net of all underlying fund operating expenses, but do not include any insurance charges imposed by your insurance company's separate account. If performance information included the effect of these additional charges, the total returns would have been lower. How a fund did yesterday is no guarantee of how it will do tomorrow.
Average Annual Total Returns
Periods ended December 31, 2010 | Past 1
year | Past 5
years | Life of fund A |
VIP Freedom Lifetime Income III Portfolio | 15.98% | 4.12% | 4.92% |
A From July 26, 2005.
$10,000 Over Life of Fund
Let's say hypothetically that $10,000 was invested in VIP Freedom Lifetime Income III Portfolio on July 26, 2005, when the fund started. The chart shows how the value of your investment would have changed, and also shows how the S&P 500 Index performed over the same period.
Annual Report
Market Recap: While market improvements around the world hit a speed bump in the first half of the 12-month period ending December 31, 2010, world economies re-accelerated in August, supported by a broadening recovery and low inflation in the U.S. Domestic stock markets recorded solid gains for the year, lifted by a strong second-half rally fueled by economic optimism, encouraging earnings reports and a wave of corporate mergers. The large-cap S&P 500® Index rose 15.06%, the blue-chip-laden Dow Jones Industrial AverageSM added 14.06% and the technology-heavy Nasdaq Composite® Index climbed 18.02%. Meanwhile, international stocks, as represented by the MSCI® ACWI® (All Country World Index) ex USA Index, gained 11.29%, boosted in part by a depreciating U.S. dollar. In the fixed-income arena, U.S. taxable investment-grade bonds generated positive results during 2010, as the Barclays Capital® U.S. Aggregate Bond Index gained 6.54%. With ultra-low interest rates bolstering nearly all fixed-income securities for most of the year, sectors in the index with higher yields and more credit risk generally fared best, while most high-quality bonds generated more-moderate returns. Meanwhile, high-yield bonds, as represented by The BofA Merrill LynchSM US High Yield Constrained Index, returned 15.07%, a result of improved economic data and strengthening investor demand. Overseas, foreign bond markets showed mixed results, with a sizable disparity between the 3.97% return of the Citigroup® Non-U.S. Group of 7 Index - which measures the performance of sovereign debt of the major global economies outside the U.S. - and the 12.04% advance of the JPMorgan Emerging Markets Bond Index Global (EMBI Global), which benefited from the rising overall credit quality of emerging-markets debt issuers.
Comments from Jonathan Shelon and Christopher Sharpe, Co-Portfolio Managers of VIP Freedom Lifetime Income® Funds: For the year ending December 31, 2010, each of the four asset classes represented in the VIP Freedom Lifetime Income Funds' portfolios - U.S. equity, non-U.S. equity, fixed income and short-term debt investments - posted positive absolute results. However, it was the Funds' allocation to equities and investment-grade debt that provided the biggest boost to their year-end results. Consequently, each of the VIP Freedom Lifetime Income Funds delivered exceptional returns for investors, with VIP Freedom Lifetime Income I - the most-conservative Fund - showing a low-double-digit increase, while the more-equity-focused VIP Freedom Lifetime Income II and II posted returns roughly in the low- to mid-teens. The Funds' U.S. equity class solidly outpaced the broad-based Dow Jones U.S. Total Stock Market IndexSM, which rose 17.49% for the one-year period ending December 31, 2010. Four of the seven underlying domestic equity funds beat the Dow Jones index, with underlying funds focusing on smaller-capitalization stocks - such as VIP Mid Cap Portfolio and VIP Value Strategies Portfolio - delivering the highest absolute results. VIP Growth Portfolio and VIP Value Portfolio, which invest more heavily in larger-capitalization stocks, also significantly contributed to the Funds' performance. The Funds' non-U.S. equity asset class, which handily outperformed the 7.88% gain of the MSCI® EAFE® (Europe, Australasia, Far East) Index, also bolstered absolute results. VIP Overseas Portfolio anchored the Funds' performance in the non-U.S. equity class, while VIP Emerging Markets Portfolio - benefiting from an increase in consumer spending in emerging markets - posted a near 18% return for the year. U.S. investors also gained from a generally weaker dollar, which lifted foreign stock returns. Turning to bonds, the Funds' fixed-income asset class handily beat the Barclays Capital® U.S. Aggregate Bond Index. Buoyed by its allocation to credit-related securities, which performed well for most of the year, VIP Investment Grade Bond Portfolio solidly contributed to the Funds' performance, while VIP High Income Portfolio roared past the broader bond market. Lastly, the Funds' short-term debt holding, VIP Money Market Portfolio, performed roughly in line with the Barclays Capital U.S. 3 Month Treasury Bellwether Index, which increased 0.15%.
The views expressed above reflect those of the portfolio manager(s) only through the end of the period as stated on the cover of this report and do not necessarily represent the views of Fidelity or any other person in the Fidelity organization. Any such views are subject to change at any time based upon market or other conditions and Fidelity disclaims any responsibility to update such views. These views may not be relied on as investment advice and, because investment decisions for a Fidelity fund are based on numerous factors, may not be relied on as an indication of trading intent on behalf of any Fidelity fund.
Annual Report
As a shareholder of a Fund, you incur two types of costs: (1) transaction costs, and (2) ongoing costs, including other Fund expenses. This Example is intended to help you understand your ongoing costs (in dollars) of investing in the Funds and to compare these costs with the ongoing costs of investing in other mutual funds.
The Example is based on an investment of $1,000 invested at the beginning of the period and held for the entire period (July 1, 2010 to December 31, 2010).
Actual Expenses
The first line of the accompanying table for each fund provides information about actual account values and actual expenses. You may use the information in this line, together with the amount you invested, to estimate the expenses that you paid over the period. Simply divide your account value by $1,000.00 (for example, an $8,600 account value divided by $1,000.00 = 8.6), then multiply the result by the number in the first line for a fund under the heading entitled "Expenses Paid During Period" to estimate the expenses you paid on your account during this period. The estimate of expenses does not include any fees or other expenses of any variable annuity or variable life insurance product. If they were, the estimate of expenses you paid during the period would be higher, and your ending account value would be lower. In addition, each Fund, as a shareholder in underlying Fidelity Funds, will indirectly bear its pro-rata share of the fees and expenses incurred by the underlying Fidelity Funds. These fees and expenses are not included in each Fund's annualized expense ratio used to calculate the expense estimates in the table below.
Hypothetical Example for Comparison Purposes
The second line of the accompanying table for each fund provides information about hypothetical account values and hypothetical expenses based on a fund's actual expense ratio and an assumed rate of return of 5% per year before expenses, which is not the Fund's actual return. The hypothetical account values and expenses may not be used to estimate the actual ending account balance or expenses you paid for the period. You may use this information to compare the ongoing costs of investing in the Fund and other funds. To do so, compare this 5% hypothetical example with the 5% hypothetical examples that appear in the shareholder reports of the other funds. The estimate of expenses does not include any fees or other expenses of any variable annuity or variable life insurance product. If they were, the estimate of expenses you paid during the period would be higher, and your ending account value would be lower. In addition, each Fund, as a shareholder in underlying Fidelity Funds, will indirectly bear its pro-rata share of the fees and expenses incurred by the underlying Fidelity Funds. These fees and expenses are not included in each Fund's annualized expense ratio used to calculate the expense estimates in the table below.
Please note that the expenses shown in the table are meant to highlight your ongoing costs only and do not reflect any transaction costs. Therefore, the second line of the table is useful in comparing ongoing costs only, and will not help you determine the relative total costs of owning different funds.
| Annualized
Expense Ratio | Beginning
Account Value
July 1, 2010 | Ending
Account Value
December 31, 2010 | Expenses Paid
During Period*
July 1, 2010 to
December 31, 2010 |
VIP Freedom Lifetime Income I | .00% | | | |
Actual | | $ 1,000.00 | $ 1,127.00 | $ .00 |
HypotheticalA | | $ 1,000.00 | $ 1,025.21 | $ .00 |
VIP Freedom Lifetime Income II | .00% | | | |
Actual | | $ 1,000.00 | $ 1,144.70 | $ .00 |
HypotheticalA | | $ 1,000.00 | $ 1,025.21 | $ .00 |
VIP Freedom Lifetime Income III | .00% | | | |
Actual | | $ 1,000.00 | $ 1,199.70 | $ .00 |
HypotheticalA | | $ 1,000.00 | $ 1,025.21 | $ .00 |
A 5% return per year before expenses
* Expenses are equal to each Fund's annualized expense ratio, multiplied by the average account value over the period, multiplied by 184/365 (to reflect the one-half year period). The fees and expenses of the underlying Fidelity Funds in which each Fund invests are not included in each Fund's annualized expense ratio.
Annual Report
VIP Freedom Lifetime Income I Portfolio
Investment Changes (Unaudited)
Fund Holdings as of December 31, 2010 |
| % of fund's
net assets | % of fund's net assets
6 months ago |
Domestic Equity Funds | | |
VIP Contrafund Portfolio Investor Class | 5.3 | 5.2 |
VIP Equity-Income Portfolio Investor Class | 6.2 | 6.1 |
VIP Growth & Income Portfolio Investor Class | 6.1 | 6.1 |
VIP Growth Portfolio Investor Class | 6.2 | 6.1 |
VIP Mid Cap Portfolio Investor Class | 2.1 | 2.2 |
VIP Value Portfolio Investor Class | 5.3 | 5.2 |
VIP Value Strategies Portfolio Investor Class | 2.2 | 2.2 |
| 33.4 | 33.1 |
Developed International Equity Funds | | |
VIP Overseas Portfolio Investor Class R | 9.9 | 9.4 |
Emerging Markets Equity Funds | | |
VIP Emerging Markets Portfolio Investor Class R | 1.6 | 0.9 |
High Yield Bond Funds | | |
VIP High Income Portfolio Investor Class | 4.9 | 5.0 |
Investment Grade Bond Funds | | |
VIP Investment Grade Bond Portfolio Investor Class | 35.6 | 36.5 |
Short-Term Funds | | |
VIP Money Market Portfolio Investor Class | 14.6 | 15.1 |
Net Other Assets (Liabilities)* | | |
| 0.0 | 0.0 |
| 100.0 | 100.0 |
* Amount represents less than .01% |
Asset Allocation (% of fund's net assets) |
Current |
| Domestic Equity Funds | 33.4% | |
| Developed International Equity Funds | 9.9% | |
| Emerging Markets Equity Funds | 1.6% | |
| High Yield Bond Funds | 4.9% | |
| Investment Grade Bond Funds | 35.6% | |
| Short-Term Funds | 14.6% | |

Six months ago |
| Domestic Equity Funds | 33.1% | |
| Developed International Equity Funds | 9.4% | |
| Emerging Markets Equity Funds | 0.9% | |
| High Yield Bond Funds | 5.0% | |
| Investment Grade Bond Funds | 36.5% | |
| Short-Term Funds | 15.1% | |

Expected |
| Domestic Equity Funds | 30.9% | |
| Developed International Equity Funds | 9.6% | |
| Emerging Markets Equity Funds | 1.7% | |
| High Yield Bond Funds | 5.0% | |
| Investment Grade Bond Funds | 37.8% | |
| Short-Term Funds | 15.0% | |

The fund invests according to an asset allocation strategy that becomes increasingly conservative over time. The six months ago allocation is based on the fund's holdings as of June 30, 2010. The current allocation is based on the fund's holdings as of December 31, 2010. The expected allocation represents the fund's anticipated allocation at June 30, 2011. |
Annual Report
VIP Freedom Lifetime Income I Portfolio
Investments December 31, 2010
Showing Percentage of Net Assets
Domestic Equity Funds - 33.4% |
| Shares | | Value |
Domestic Equity Funds - 33.4% |
VIP Contrafund Portfolio Investor Class | 22,931 | | $ 545,767 |
VIP Equity-Income Portfolio Investor Class | 33,602 | | 637,431 |
VIP Growth & Income Portfolio Investor Class | 50,309 | | 633,899 |
VIP Growth Portfolio Investor Class | 17,200 | | 636,411 |
VIP Mid Cap Portfolio Investor Class | 6,743 | | 219,820 |
VIP Value Portfolio Investor Class | 49,782 | | 547,109 |
VIP Value Strategies Portfolio Investor Class | 23,894 | | 231,769 |
TOTAL DOMESTIC EQUITY FUNDS (Cost $3,977,650) | 3,452,206 |
International Equity Funds - 11.5% |
| | | |
Developed International Equity Funds - 9.9% |
VIP Overseas Portfolio Investor Class R | 60,934 | | 1,019,433 |
Emerging Markets Equity Funds - 1.6% |
VIP Emerging Markets Portfolio Investor Class R | 17,201 | | 170,113 |
TOTAL INTERNATIONAL EQUITY FUNDS (Cost $1,328,221) | 1,189,546 |
Bond Funds - 40.5% |
| | | |
High Yield Bond Funds - 4.9% |
VIP High Income Portfolio Investor Class | 91,240 | | 507,296 |
Investment Grade Bond Funds - 35.6% |
VIP Investment Grade Bond Portfolio Investor Class | 287,788 | | 3,683,690 |
TOTAL BOND FUNDS (Cost $4,214,098) | 4,190,986 |
Short-Term Funds - 14.6% |
| | | |
VIP Money Market Portfolio Investor Class
(Cost $1,512,153) | 1,512,153 | | 1,512,153 |
TOTAL INVESTMENT PORTFOLIO - 100.0% (Cost $11,032,122) | | 10,344,891 |
NET OTHER ASSETS (LIABILITIES) - 0.0% | | (1) |
NET ASSETS - 100% | $ 10,344,890 |
Other Information |
All investments are categorized as Level 1 under the Fair Value Hierarchy. The inputs or methodology used for valuing securities may not be an indication of the risk associated with investing in those securities. For more information on valuation inputs, please refer to the Security Valuation section in the accompanying Notes to Financial Statements. |
See accompanying notes which are an integral part of the financial statements.
Annual Report
VIP Freedom Lifetime Income I Portfolio
Statement of Assets and Liabilities
| December 31, 2010 |
Assets | | |
Investment in securities, at value (cost $11,032,122) - See accompanying schedule | | $ 10,344,891 |
Receivable for investments sold | | 170 |
Total assets | | 10,345,061 |
| | |
Liabilities | | |
Payable to custodian bank | $ 1 | |
Payable for fund shares redeemed | 170 | |
Total liabilities | | 171 |
| | |
Net Assets | | $ 10,344,890 |
Net Assets consist of: | | |
Paid in capital | | $ 11,083,112 |
Accumulated undistributed net realized gain (loss) on investments | | (50,991) |
Net unrealized appreciation (depreciation) on investments | | (687,231) |
Net Assets, for 1,047,202 shares outstanding | | $ 10,344,890 |
Net Asset Value, offering price and redemption price per share ($10,344,890 ÷ 1,047,202 shares) | | $ 9.88 |
Statement of Operations
| Year ended December 31, 2010 |
Investment Income | | |
Income distributions from underlying funds | | $ 212,825 |
| | |
Expenses | | |
Independent trustees' compensation | $ 33 | |
Total expenses before reductions | 33 | |
Expense reduction | (33) | 0 |
Net investment income (loss) | | 212,825 |
Realized and Unrealized Gain (Loss) Realized gain (loss) on sale of underlying fund shares | 63,856 | |
Capital gain distributions from underlying funds | 46,368 | |
Total net realized gain (loss) | | 110,224 |
Change in net unrealized appreciation (depreciation) on underlying funds | | 753,750 |
Net gain (loss) | | 863,974 |
Net increase (decrease) in net assets resulting from operations | | $ 1,076,799 |
See accompanying notes which are an integral part of the financial statements.
Annual Report
Fund Name
Financial Statements - continued
Statement of Changes in Net Assets
| Year ended
December 31, 2010 | Year ended
December 31, 2009 |
Increase (Decrease) in Net Assets | | |
Operations | | |
Net investment income (loss) | $ 212,825 | $ 334,506 |
Net realized gain (loss) | 110,224 | 90,279 |
Change in net unrealized appreciation (depreciation) | 753,750 | 1,133,654 |
Net increase (decrease) in net assets resulting from operations | 1,076,799 | 1,558,439 |
Distributions to shareholders from net investment income | (222,558) | (332,639) |
Distributions to shareholders from net realized gain | (110,575) | (76,060) |
Total distributions | (333,133) | (408,699) |
Share transactions
Proceeds from sales of shares | 1,364,399 | 773,369 |
Reinvestment of distributions | 333,133 | 408,699 |
Cost of shares redeemed | (869,595) | (1,206,057) |
Net increase (decrease) in net assets resulting from share transactions | 827,937 | (23,989) |
Total increase (decrease) in net assets | 1,571,603 | 1,125,751 |
| | |
Net Assets | | |
Beginning of period | 8,773,287 | 7,647,536 |
End of period (including undistributed net investment income of $0 and undistributed net investment income of $6,217, respectively) | $ 10,344,890 | $ 8,773,287 |
Other Information Shares | | |
Sold | 143,545 | 85,671 |
Issued in reinvestment of distributions | 33,844 | 46,276 |
Redeemed | (91,110) | (149,828) |
Net increase (decrease) | 86,279 | (17,881) |
Financial Highlights
Years ended December 31, | 2010 | 2009 | 2008 | 2007 | 2006 |
Selected Per-Share Data | | | | | |
Net asset value, beginning of period | $ 9.13 | $ 7.81 | $ 11.21 | $ 10.98 | $ 10.27 |
Income from Investment Operations | | | | | |
Net investment income (loss) C | .21 | .36 | .33 | .36 | .27 |
Net realized and unrealized gain (loss) | .87 | 1.40 | (2.85) | .53 | .67 |
Total from investment operations | 1.08 | 1.76 | (2.52) | .89 | .94 |
Distributions from net investment income | (.22) | (.36) | (.37) | (.34) | (.18) |
Distributions from net realized gain | (.11) | (.08) | (.51) | (.32) | (.05) |
Total distributions | (.33) | (.44) | (.88) | (.66) | (.23) |
Net asset value, end of period | $ 9.88 | $ 9.13 | $ 7.81 | $ 11.21 | $ 10.98 |
Total Return A, B | 11.84% | 22.76% | (22.68)% | 8.16% | 9.15% |
Ratios to Average Net Assets D, F | | | | | |
Expenses before reductions E | -% | -% | -% | -% | -% |
Expenses net of fee waivers, if any | -% | -% | -% | -% | -% |
Expenses net of all reductions | -% | -% | -% | -% | -% |
Net investment income (loss) | 2.26% | 4.28% | 3.31% | 3.15% | 2.50% |
Supplemental Data | | | | | |
Net assets, end of period (000 omitted) | $ 10,345 | $ 8,773 | $ 7,648 | $ 12,533 | $ 10,106 |
Portfolio turnover rate | 26% | 20% | 25% | 16% | 28% |
A Total returns do not reflect charges attributable to your insurance company's separate account. Inclusion of these charges would reduce the total returns shown.
B Total returns would have been lower had certain expenses not been reduced during the periods shown.
C Calculated based on average shares outstanding during the period.
D Amounts do not include the activity of the underlying funds.
E Amount represents less than .01%.
F Expense ratios reflect operating expenses of the Fund. Expenses before reductions do not reflect amounts reimbursed by the investment adviser or reductions from expense offset arrangements and do not represent the amount paid by the Fund during periods when reimbursements or reductions occur. Expenses net of fee waivers reflect expenses after reimbursement by the investment adviser but prior to reductions from expense offset arrangements. Expenses net of all reductions represent the net expenses paid by the Fund but do not include expenses of the investment companies in which the Fund invests.
See accompanying notes which are an integral part of the financial statements.
Annual Report
VIP Freedom Lifetime Income II Portfolio
Investment Changes (Unaudited)
Fund Holdings as of December 31, 2010 |
| % of fund's
net assets | % of fund's net assets
6 months ago |
Domestic Equity Funds | | |
VIP Contrafund Portfolio Investor Class | 6.0 | 6.0 |
VIP Equity-Income Portfolio Investor Class | 7.0 | 6.9 |
VIP Growth & Income Portfolio Investor Class | 7.0 | 7.0 |
VIP Growth Portfolio Investor Class | 7.0 | 7.0 |
VIP Mid Cap Portfolio Investor Class | 2.4 | 2.5 |
VIP Value Portfolio Investor Class | 6.0 | 6.0 |
VIP Value Strategies Portfolio Investor Class | 2.6 | 2.5 |
| 38.0 | 37.9 |
Developed International Equity Funds | | |
VIP Overseas Portfolio Investor Class R | 11.3 | 11.1 |
Emerging Markets Equity Funds | | |
VIP Emerging Markets Portfolio Investor Class R | 1.9 | 1.1 |
High Yield Bond Funds | | |
VIP High Income Portfolio Investor Class | 5.3 | 5.5 |
Investment Grade Bond Funds | | |
VIP Investment Grade Bond Portfolio Investor Class | 35.9 | 37.0 |
Short-Term Funds | | |
VIP Money Market Portfolio Investor Class | 7.6 | 7.4 |
Net Other Assets (Liabilities)* | | |
| 0.0 | 0.0 |
| 100.0 | 100.0 |
* Amount represents less than .01% |
Asset Allocation (% of fund's net assets) |
Current |
| Domestic Equity Funds | 38.0% | |
| Developed International Equity Funds | 11.3% | |
| Emerging Markets Equity Funds | 1.9% | |
| High Yield Bond Funds | 5.3% | |
| Investment Grade Bond Funds | 35.9% | |
| Short-Term Funds | 7.6% | |

Six months ago |
 | Domestic Equity Funds | 37.9% | |
| Developed International Equity Funds | 11.1% | |
| Emerging Markets Equity Funds | 1.1% | |
| High Yield Bond Funds | 5.5% | |
| Investment Grade Bond Funds | 37.0% | |
| Short-Term Funds | 7.4% | |

Expected |
| Domestic Equity Funds | 35.1% | |
| Developed International Equity Funds | 10.9% | |
| Emerging Markets Equity Funds | 1.9% | |
| High Yield Bond Funds | 5.3% | |
| Investment Grade Bond Funds | 38.3% | |
| Short-Term Funds | 8.5% | |

The fund invests according to an asset allocation strategy that becomes increasingly conservative over time. The six months ago allocation is based on the fund's holdings as of June 30, 2010. The current allocation is based on the fund's holdings as of December 31, 2010. The expected allocation represents the fund's anticipated allocation at June 30, 2011. |
Annual Report
VIP Freedom Lifetime Income II Portfolio
Investments December 31, 2010
Showing Percentage of Net Assets
Domestic Equity Funds - 38.0% |
| Shares | | Value |
Domestic Equity Funds - 38.0% |
VIP Contrafund Portfolio Investor Class | 36,997 | | $ 880,536 |
VIP Equity-Income Portfolio Investor Class | 54,278 | | 1,029,660 |
VIP Growth & Income Portfolio Investor Class | 81,161 | | 1,022,632 |
VIP Growth Portfolio Investor Class | 27,754 | | 1,026,892 |
VIP Mid Cap Portfolio Investor Class | 10,861 | | 354,072 |
VIP Value Portfolio Investor Class | 80,299 | | 882,485 |
VIP Value Strategies Portfolio Investor Class | 38,463 | | 373,090 |
TOTAL DOMESTIC EQUITY FUNDS (Cost $6,741,794) | 5,569,367 |
International Equity Funds - 13.2% |
| | | |
Developed International Equity Funds - 11.3% |
VIP Overseas Portfolio Investor Class R | 98,785 | | 1,652,674 |
Emerging Markets Equity Funds - 1.9% |
VIP Emerging Markets Portfolio Investor Class R | 27,841 | | 275,352 |
TOTAL INTERNATIONAL EQUITY FUNDS (Cost $2,330,733) | 1,928,026 |
Bond Funds - 41.2% |
| | | |
High Yield Bond Funds - 5.3% |
VIP High Income Portfolio Investor Class | 139,589 | | 776,114 |
Investment Grade Bond Funds - 35.9% |
VIP Investment Grade Bond Portfolio Investor Class | 410,404 | | 5,253,168 |
TOTAL BOND FUNDS (Cost $6,038,834) | 6,029,282 |
Short-Term Funds - 7.6% |
| Shares | | Value |
| | | |
VIP Money Market Portfolio Investor Class
(Cost $1,110,569) | 1,110,569 | | $ 1,110,569 |
TOTAL INVESTMENT PORTFOLIO - 100.0% (Cost $16,221,930) | | 14,637,244 |
NET OTHER ASSETS (LIABILITIES) - 0.0% | | (2) |
NET ASSETS - 100% | $ 14,637,242 |
Other Information |
All investments are categorized as Level 1 under the Fair Value Hierarchy. The inputs or methodology used for valuing securities may not be an indication of the risk associated with investing in those securities. For more information on valuation inputs, please refer to the Security Valuation section in the accompanying Notes to Financial Statements. |
Income Tax Information |
At December 31, 2010, the Fund had a capital loss carryforward of approximately $792,228 of which $503,057 and $289,171 will expire in fiscal 2017 and 2018, respectively. Capital loss carryforwards are only available to offset future capital gains of the Fund to the extent provided by regulations and may be limited. |
See accompanying notes which are an integral part of the financial statements.
Annual Report
VIP Freedom Lifetime Income II Portfolio
Statement of Assets and Liabilities
| December 31, 2010 |
Assets | | |
Investment in securities, at value (cost $16,221,930) - See accompanying schedule | | $ 14,637,244 |
Receivable for investments sold | | 241 |
Total assets | | 14,637,485 |
| | |
Liabilities | | |
Payable for fund shares redeemed | $ 243 | |
Total liabilities | | 243 |
| | |
Net Assets | | $ 14,637,242 |
Net Assets consist of: | | |
Paid in capital | | $ 17,161,202 |
Accumulated undistributed net realized gain (loss) on investments | | (939,274) |
Net unrealized appreciation (depreciation) on investments | | (1,584,686) |
Net Assets, for 1,494,370 shares outstanding | | $ 14,637,242 |
Net Asset Value, offering price and redemption price per share ($14,637,242 ÷ 1,494,370 shares) | | $ 9.79 |
Statement of Operations
| Year ended December 31, 2010 |
Investment Income | | |
Income distributions from underlying funds | | $ 314,795 |
| | |
Expenses | | |
Independent trustees' compensation | $ 51 | |
Total expenses before reductions | 51 | |
Expense reduction | (51) | 0 |
Net investment income (loss) | | 314,795 |
Realized and Unrealized Gain (Loss) Realized gain (loss) on sale of underlying fund shares | (300,986) | |
Capital gain distributions from underlying funds | 66,773 | |
Total net realized gain (loss) | | (234,213) |
Change in net unrealized appreciation (depreciation) on underlying funds | | 1,664,188 |
Net gain (loss) | | 1,429,975 |
Net increase (decrease) in net assets resulting from operations | | $ 1,744,770 |
See accompanying notes which are an integral part of the financial statements.
Annual Report
Fund Name
Financial Statements - continued
Statement of Changes in Net Assets
| Year ended
December 31, 2010 | Year ended
December 31, 2009 |
Increase (Decrease) in Net Assets | | |
Operations | | |
Net investment income (loss) | $ 314,795 | $ 543,711 |
Net realized gain (loss) | (234,213) | (339,797) |
Change in net unrealized appreciation (depreciation) | 1,664,188 | 2,797,474 |
Net increase (decrease) in net assets resulting from operations | 1,744,770 | 3,001,388 |
Distributions to shareholders from net investment income | (312,980) | (553,060) |
Distributions to shareholders from net realized gain | (73,409) | (152,952) |
Total distributions | (386,389) | (706,012) |
Share transactions
Proceeds from sales of shares | 407,181 | 997,756 |
Reinvestment of distributions | 386,389 | 706,011 |
Cost of shares redeemed | (1,687,084) | (2,718,682) |
Net increase (decrease) in net assets resulting from share transactions | (893,514) | (1,014,915) |
Total increase (decrease) in net assets | 464,867 | 1,280,461 |
| | |
Net Assets | | |
Beginning of period | 14,172,375 | 12,891,914 |
End of period (including undistributed net investment income of $0 and undistributed net investment income of $1,783, respectively) | $ 14,637,242 | $ 14,172,375 |
Other Information Shares | | |
Sold | 44,625 | 117,471 |
Issued in reinvestment of distributions | 39,603 | 84,626 |
Redeemed | (182,338) | (346,280) |
Net increase (decrease) | (98,110) | (144,183) |
Financial Highlights
Years ended December 31, | 2010 | 2009 | 2008 | 2007 | 2006 |
Selected Per-Share Data | | | | | |
Net asset value, beginning of period | $ 8.90 | $ 7.42 | $ 11.68 | $ 11.36 | $ 10.37 |
Income from Investment Operations | | | | | |
Net investment income (loss) C | .21 | .34 | .29 | .32 | .23 |
Net realized and unrealized gain (loss) | .95 | 1.59 | (3.57) | .77 | .95 |
Total from investment operations | 1.16 | 1.93 | (3.28) | 1.09 | 1.18 |
Distributions from net investment income | (.22) | (.36) | (.34) | (.30) | (.14) |
Distributions from net realized gain | (.05) | (.09) | (.64) | (.48) | (.05) |
Total distributions | (.27) | (.45) | (.98) | (.77) G | (.19) |
Net asset value, end of period | $ 9.79 | $ 8.90 | $ 7.42 | $ 11.68 | $ 11.36 |
Total Return A, B | 12.99% | 26.44% | (28.49)% | 9.67% | 11.38% |
Ratios to Average Net Assets D, F | | | | | |
Expenses before reductions E | -% | -% | -% | -% | -% |
Expenses net of fee waivers, if any | -% | -% | -% | -% | -% |
Expenses net of all reductions | -% | -% | -% | -% | -% |
Net investment income (loss) | 2.22% | 4.25% | 2.91% | 2.67% | 2.12% |
Supplemental Data | | | | | |
Net assets, end of period (000 omitted) | $ 14,637 | $ 14,172 | $ 12,892 | $ 22,701 | $ 17,221 |
Portfolio turnover rate | 23% | 21% | 25% | 18% | 16% |
A Total returns do not reflect charges attributable to your insurance company's separate account. Inclusion of these charges would reduce the total returns shown.
B Total returns would have been lower had certain expenses not been reduced during the periods shown.
C Calculated based on average shares outstanding during the period.
D Amounts do not include the activity of the underlying funds.
E Amount represents less than .01%.
F Expense ratios reflect operating expenses of the Fund. Expenses before reductions do not reflect amounts reimbursed by the investment adviser or reductions from expense offset arrangements and do not represent the amount paid by the Fund during periods when reimbursements or reductions occur. Expenses net of fee waivers reflect expenses after reimbursement by the investment adviser but prior to reductions from expense offset arrangements. Expenses net of all reductions represent the net expenses paid by the Fund but do not include expenses of the investment companies in which the Fund invests.
G Total distributions of $.77 per share is comprised of distributions from net investment income of $.295 and distributions from net realized gain of $.475 per share.
See accompanying notes which are an integral part of the financial statements.
Annual Report
VIP Freedom Lifetime Income III Portfolio
Investment Changes (Unaudited)
Fund Holdings as of December 31, 2010 |
| % of fund's
net assets | % of fund's net assets
6 months ago |
Domestic Equity Funds | | |
VIP Contrafund Portfolio Investor Class | 8.4 | 8.4 |
VIP Equity-Income Portfolio Investor Class | 9.9 | 9.7 |
VIP Growth & Income Portfolio Investor Class | 9.8 | 9.7 |
VIP Growth Portfolio Investor Class | 9.8 | 9.8 |
VIP Mid Cap Portfolio Investor Class | 3.4 | 3.5 |
VIP Value Portfolio Investor Class | 8.4 | 8.4 |
VIP Value Strategies Portfolio Investor Class | 3.6 | 3.5 |
| 53.3 | 53.0 |
Developed International Equity Funds | | |
VIP Overseas Portfolio Investor Class R | 15.8 | 15.6 |
Emerging Markets Equity Funds | | |
VIP Emerging Markets Portfolio Investor Class R | 2.6 | 1.5 |
High Yield Bond Funds | | |
VIP High Income Portfolio Investor Class | 7.2 | 7.5 |
Investment Grade Bond Funds | | |
VIP Investment Grade Bond Portfolio Investor Class | 21.1 | 22.4 |
Net Other Assets (Liabilities)* | | |
| 0.0 | 0.0 |
| 100.0 | 100.0 |
* Amount represents less than .01% |
Asset Allocation (% of fund's net assets) |
Current |
| Domestic Equity Funds | 53.3% | |
| Developed International Equity Funds | 15.8% | |
| Emerging Markets Equity Funds | 2.6% | |
| High Yield Bond Funds | 7.2% | |
| Investment Grade Bond Funds | 21.1% | |

Six months ago |
| Domestic Equity Funds | 53.0% | |
| Developed International Equity Funds | 15.6% | |
| Emerging Markets Equity Funds | 1.5% | |
| High Yield Bond Funds | 7.5% | |
| Investment Grade Bond Funds | 22.4% | |

Expected |
| Domestic Equity Funds | 51.4% | |
| Developed International Equity Funds | 15.9% | |
| Emerging Markets Equity Funds | 2.8% | |
| High Yield Bond Funds | 7.5% | |
| Investment Grade Bond Funds | 22.4% | |

The fund invests according to an asset allocation strategy that becomes increasingly conservative over time. The six months ago allocation is based on the fund's holdings as of June 30, 2010. The current allocation is based on the fund's holdings as of December 31, 2010. The expected allocation represents the fund's anticipated allocation at June 30, 2011. |
Annual Report
VIP Freedom Lifetime Income III Portfolio
Investments December 31, 2010
Showing Percentage of Net Assets
Domestic Equity Funds - 53.3% |
| Shares | | Value |
Domestic Equity Funds - 53.3% |
VIP Contrafund Portfolio Investor Class | 23,839 | | $ 567,365 |
VIP Equity-Income Portfolio Investor Class | 34,979 | | 663,542 |
VIP Growth & Income Portfolio Investor Class | 52,350 | | 659,604 |
VIP Growth Portfolio Investor Class | 17,891 | | 661,961 |
VIP Mid Cap Portfolio Investor Class | 7,008 | | 228,458 |
VIP Value Portfolio Investor Class | 51,776 | | 569,016 |
VIP Value Strategies Portfolio Investor Class | 24,855 | | 241,089 |
TOTAL DOMESTIC EQUITY FUNDS (Cost $4,239,756) | 3,591,035 |
International Equity Funds - 18.4% |
| | | |
Developed International Equity Funds - 15.8% |
VIP Overseas Portfolio Investor Class R | 63,692 | | 1,065,569 |
Emerging Markets Equity Funds - 2.6% |
VIP Emerging Markets Portfolio Investor Class R | 17,904 | | 177,069 |
TOTAL INTERNATIONAL EQUITY FUNDS (Cost $1,455,918) | 1,242,638 |
Bond Funds - 28.3% |
| | | |
High Yield Bond Funds - 7.2% |
VIP High Income Portfolio Investor Class | 87,341 | | 485,613 |
Investment Grade Bond Funds - 21.1% |
VIP Investment Grade Bond Portfolio Investor Class | 111,038 | | 1,421,291 |
TOTAL BOND FUNDS (Cost $1,945,298) | 1,906,904 |
TOTAL INVESTMENT PORTFOLIO - 100.0% (Cost $7,640,972) | | 6,740,577 |
NET OTHER ASSETS (LIABILITIES) - 0.0% | | (3) |
NET ASSETS - 100% | $ 6,740,574 |
Other Information |
All investments are categorized as Level 1 under the Fair Value Hierarchy. The inputs or methodology used for valuing securities may not be an indication of the risk associated with investing in those securities. For more information on valuation inputs, please refer to the Security Valuation section in the accompanying Notes to Financial Statements. |
Income Tax Information |
At December 31, 2010, the Fund had a capital loss carryforward of approximately $96,950 all of which will expire in fiscal 2018. Capital loss carryforwards are only available to offset future capital gains of the Fund to the extent provided by regulations and may be limited. |
See accompanying notes which are an integral part of the financial statements.
Annual Report
VIP Freedom Lifetime Income III Portfolio
Statement of Assets and Liabilities
| December 31, 2010 |
Assets | | |
Investment in securities, at value (cost $7,640,972) - See accompanying schedule | | $ 6,740,577 |
Receivable for investments sold | | 111 |
Total assets | | 6,740,688 |
| | |
Liabilities | | |
Payable to custodian bank | $ 1 | |
Payable for fund shares redeemed | 113 | |
Total liabilities | | 114 |
| | |
Net Assets | | $ 6,740,574 |
Net Assets consist of: | | |
Paid in capital | | $ 7,795,274 |
Accumulated undistributed net realized gain (loss) on investments | | (154,305) |
Net unrealized appreciation (depreciation) on investments | | (900,395) |
Net Assets, for 719,367 shares outstanding | | $ 6,740,574 |
Net Asset Value, offering price and redemption price per share ($6,740,574 ÷ 719,367 shares) | | $ 9.37 |
Statement of Operations
| Year ended December 31, 2010 |
Investment Income | | |
Income distributions from underlying funds | | $ 131,619 |
| | |
Expenses | | |
Independent trustees' compensation | $ 23 | |
Total expenses before reductions | 23 | |
Expense reduction | (23) | 0 |
Net investment income (loss) | | 131,619 |
Realized and Unrealized Gain (Loss) Realized gain (loss) on sale of underlying fund shares | (103,831) | |
Capital gain distributions from underlying funds | 21,313 | |
Total net realized gain (loss) | | (82,518) |
Change in net unrealized appreciation (depreciation) on underlying funds | | 919,548 |
Net gain (loss) | | 837,030 |
Net increase (decrease) in net assets resulting from operations | | $ 968,649 |
See accompanying notes which are an integral part of the financial statements.
Annual Report
Fund Name
Financial Statements - continued
Statement of Changes in Net Assets
| Year ended
December 31, 2010 | Year ended
December 31, 2009 |
Increase (Decrease) in Net Assets | | |
Operations | | |
Net investment income (loss) | $ 131,619 | $ 194,683 |
Net realized gain (loss) | (82,518) | 126,982 |
Change in net unrealized appreciation (depreciation) | 919,548 | 1,269,902 |
Net increase (decrease) in net assets resulting from operations | 968,649 | 1,591,567 |
Distributions to shareholders from net investment income | (133,615) | (200,408) |
Distributions to shareholders from net realized gain | (29,512) | (137,423) |
Total distributions | (163,127) | (337,831) |
Share transactions
Proceeds from sales of shares | 87,477 | 80,366 |
Reinvestment of distributions | 163,127 | 337,830 |
Cost of shares redeemed | (945,584) | (461,358) |
Net increase (decrease) in net assets resulting from share transactions | (694,980) | (43,162) |
Total increase (decrease) in net assets | 110,542 | 1,210,574 |
| | |
Net Assets | | |
Beginning of period | 6,630,032 | 5,419,458 |
End of period | $ 6,740,574 | $ 6,630,032 |
Other Information Shares | | |
Sold | 9,419 | 10,878 |
Issued in reinvestment of distributions | 17,634 | 44,489 |
Redeemed | (108,174) | (60,863) |
Net increase (decrease) | (81,121) | (5,496) |
Financial Highlights
Years ended December 31, | 2010 | 2009 | 2008 | 2007 | 2006 |
Selected Per-Share Data | | | | | |
Net asset value, beginning of period | $ 8.28 | $ 6.72 | $ 11.90 | $ 11.56 | $ 10.48 |
Income from Investment Operations | | | | | |
Net investment income (loss) C | .18 | .24 | .24 | .29 | .19 |
Net realized and unrealized gain (loss) | 1.14 | 1.76 | (4.36) | .96 | 1.15 |
Total from investment operations | 1.32 | 2.00 | (4.12) | 1.25 | 1.34 |
Distributions from net investment income | (.19) | (.26) | (.27) | (.29) | (.15) |
Distributions from net realized gain | (.04) | (.18) | (.79) | (.62) | (.11) |
Total distributions | (.23) | (.44) | (1.06) | (.91) | (.26) |
Net asset value, end of period | $ 9.37 | $ 8.28 | $ 6.72 | $ 11.90 | $ 11.56 |
Total Return A, B | 15.98% | 30.34% | (35.25)% | 10.88% | 12.78% |
Ratios to Average Net Assets D, F | | | | | |
Expenses before reductions E | -% | -% | -% | -% | -% |
Expenses net of fee waivers, if any | -% | -% | -% | -% | -% |
Expenses net of all reductions | -% | -% | -% | -% | -% |
Net investment income (loss) | 2.03% | 3.33% | 2.43% | 2.41% | 1.76% |
Supplemental Data | | | | | |
Net assets, end of period (000 omitted) | $ 6,741 | $ 6,630 | $ 5,419 | $ 11,085 | $ 8,835 |
Portfolio turnover rate | 20% | 10% | 20% | 11% | 15% |
A Total returns do not reflect charges attributable to your insurance company's separate account. Inclusion of these charges would reduce the total returns shown.
B Total returns would have been lower had certain expenses not been reduced during the periods shown.
C Calculated based on average shares outstanding during the period.
D Amounts do not include the activity of the underlying funds.
E Amount represents less than .01%.
F Expense ratios reflect operating expenses of the Fund. Expenses before reductions do not reflect amounts reimbursed by the investment adviser or reductions from expense offset arrangements and do not represent the amount paid by the Fund during periods when reimbursements or reductions occur. Expenses net of fee waivers reflect expenses after reimbursement by the investment adviser but prior to reductions from expense offset arrangements. Expenses net of all reductions represent the net expenses paid by the Fund but do not include expenses of the investment companies in which the Fund invests.
See accompanying notes which are an integral part of the financial statements.
Annual Report
Notes to Financial Statements
For the period ended December 31, 2010
1. Organization.
VIP Freedom Lifetime Income I Portfolio, VIP Freedom Lifetime Income II Portfolio, and VIP Freedom Lifetime Income III Portfolio (the Funds) are funds of Variable Insurance Products Fund V. The Variable Insurance Products Fund V (the Trust) (referred to in this report as Fidelity Variable Insurance Products) is registered under the Investment Company Act of 1940, as amended (the 1940 Act), as an open-end management investment company organized as a Massachusetts business trust. Each Fund is authorized to issue an unlimited number of shares. The Funds invest primarily in a combination of other VIP equity, bond, and short-term funds (the Underlying Funds) managed by Fidelity Management & Research Company (FMR). Shares of each Fund may only be purchased by insurance companies for the purpose of funding variable annuity or variable life insurance contracts.
2. Significant Accounting Policies.
The financial statements have been prepared in conformity with accounting principles generally accepted in the United States of America (GAAP), which require management to make certain estimates and assumptions at the date of the financial statements. Actual results could differ from those estimates. Subsequent events, if any, through the date that the financial statements were issued have been evaluated in the preparation of the financial statements. The following summarizes the significant accounting policies of the Funds:
Security Valuation. Investments are valued as of 4:00 p.m. Eastern time on the last calendar day of the period. Each Fund categorizes the inputs to valuation techniques used to value their investments into a disclosure hierarchy consisting of three levels as shown below.
Level 1 - quoted prices in active markets for identical investments
Level 2 - other significant observable inputs (including quoted prices for similar investments, interest rates, prepayment speeds, etc.)
Level 3 - unobservable inputs (including the Fund's own assumptions based on the best information available)
Valuation techniques used to value each Fund's investments by major category are as follows. Investments in the Underlying Funds are valued at their closing net asset value (NAV) each business day and are categorized as Level 1 in the hierarchy.
Investment Transactions and Income. For financial reporting purposes, the Funds' investment holdings and NAV include trades executed through the end of the last business day of the period. The NAV per share for processing shareholder transactions is calculated as of the close of business of the New York Stock Exchange (NYSE), normally 4:00 p.m. Eastern time and includes trades executed through the end of the prior business day. Gains and losses on securities sold are determined on the basis of identified cost. Income and capital gain distributions from the Underlying Funds, if any, are recorded on the ex-dividend date.
Expenses. Expenses directly attributable to a fund are charged to that fund. Expenses attributable to more than one fund are allocated among the respective funds on the basis of relative net assets or other appropriate methods. Expenses included in the accompanying financial statements reflect the expenses of the Fund and do not include any expenses associated with the Underlying Funds. Expense estimates are accrued in the period to which they relate and adjustments are made when actual amounts are known.
Income Tax Information and Distributions to Shareholders. Each year each Fund intends to qualify as a regulated investment company, including distributing substantially all of its taxable income and realized gains under Subchapter M of the Internal Revenue Code and filing its U.S. federal tax return. As a result, no provision for income taxes is required. As of December 31, 2010, each Fund did not have any unrecognized tax benefits in the accompanying financial statements. A fund's federal tax return is subject to examination by the Internal Revenue Service (IRS) for a period of three years.
Distributions are declared and recorded on the ex-dividend date. Income and capital gain distributions are determined in accordance with income tax regulations, which may differ from GAAP.
Capital accounts within the financial statements are adjusted for permanent book-tax differences. These adjustments have no impact on net assets or the results of operations. Temporary book-tax differences will reverse in a subsequent period.
Book-tax differences are primarily due to short-term gain distributions from the Underlying Funds, capital loss carryforwards and losses deferred due to wash sales and excise tax regulations.
Annual Report
Notes to Financial Statements - continued
2. Significant Accounting Policies - continued
Income Tax Information and Distributions to Shareholders - continued
The federal tax cost of investment securities and unrealized appreciation (depreciation) as of period end were as follows for each Fund:
| Tax cost | Gross unrealized
appreciation | Gross unrealized
depreciation | Net unrealized
appreciation
(depreciation) |
VIP Freedom Lifetime Income I | $ 11,085,956 | $ 208,847 | $ (949,912) | $ (741,065) |
VIP Freedom Lifetime Income II | 16,352,727 | 246,304 | (1,961,787) | (1,715,483) |
VIP Freedom Lifetime Income III | 7,685,924 | 151,634 | (1,096,981) | (945,347) |
The tax-based components of distributable earnings as of period end were as follows for each Fund:
| Undistributed
ordinary
income | Capital loss
carryforward | Net unrealized appreciation
(depreciation) |
VIP Freedom Lifetime Income I | $ 2,842 | $ - | $ (741,065) |
VIP Freedom Lifetime Income II | - | (792,228) | (1,715,483) |
VIP Freedom Lifetime Income III | - | (96,950) | (945,347) |
The tax character of distributions paid was as follows:
December 31, 2010 | | | |
| Ordinary
Income | Long-term
Capital Gains | Total |
VIP Freedom Lifetime Income I | $ 330,090 | $ 3,043 | $ 333,133 |
VIP Freedom Lifetime Income II | 386,389 | - | 386,389 |
VIP Freedom Lifetime Income III | 163,127 | - | 163,127 |
December 31, 2009 | | | |
| Ordinary
Income | Long-term
Capital Gains | Total |
VIP Freedom Lifetime Income I | $ 392,532 | $ 16,167 | $ 408,699 |
VIP Freedom Lifetime Income II | 619,901 | 86,111 | 706,012 |
VIP Freedom Lifetime Income III | 273,827 | 64,004 | 337,831 |
3. Purchases and Sales of Investments.
Purchases and redemptions of the Underlying Fund shares are noted in the table below.
| Purchases ($) | Redemptions ($) |
VIP Freedom Lifetime Income I | 3,203,301 | 2,449,342 |
VIP Freedom Lifetime Income II | 3,300,444 | 4,198,786 |
VIP Freedom Lifetime Income III | 1,264,350 | 1,969,526 |
4. Fees and Other Transactions with Affiliates.
Management Fee. Strategic Advisers, Inc. (Strategic Advisers), an affiliate of FMR, provides the Funds with investment management related services. The Funds do not pay any fees for these services.
Other Transactions. Strategic Advisers has entered into an administration agreement with FMR under which FMR provides management and administrative services (other than investment advisory services) necessary for the operation of each Fund. Pursuant to this agreement, FMR pays all expenses of each Fund, excluding the compensation of the independent Trustees and certain other expenses such as interest expense. FMR also contracts with other Fidelity companies to perform the services necessary for the operation of each Fund. The Funds do not pay any fees for these services.
Annual Report
5. Expense Reductions.
FMR voluntarily agreed to reimburse Funds to the extent annual operating expenses exceeded certain levels of average net assets as noted in the table below. Some expenses, for example interest expense, are excluded from this reimbursement.
The following Funds were in reimbursement during the period:
| Expense
Limitations | Reimbursement
from adviser |
VIP Freedom Lifetime Income I | .00% | $ 33 |
VIP Freedom Lifetime Income II | .00% | $ 51 |
VIP Freedom Lifetime Income III | .00% | $ 23 |
6. Other.
The Funds' organizational documents provide former and current trustees and officers with a limited indemnification against liabilities arising in connection with the performance of their duties to the Funds. In the normal course of business, the Funds may also enter into contracts that provide general indemnifications. The Funds' maximum exposure under these arrangements is unknown as this would be dependent on future claims that may be made against the Funds. The risk of material loss from such claims is considered remote.
At the end of the period, FMR or its affiliates were owners of record of all of the outstanding shares of the Funds.
Annual Report
Report of Independent Registered Public Accounting Firm
To the Trustees of Variable Insurance Products Fund V and the Shareholders of VIP Freedom Lifetime Income I Portfolio, VIP Freedom Lifetime Income II Portfolio, VIP Freedom Lifetime Income III Portfolio:
We have audited the accompanying statements of assets and liabilities of VIP Freedom Lifetime Income I Portfolio, VIP Freedom Lifetime Income II Portfolio, VIP Freedom Lifetime Income III Portfolio (the Funds), each a fund of Variable Insurance Products Fund V, including the schedules of investments, as of December 31, 2010, and the related statements of operations for the year then ended, the statements of changes in net assets for each of the two years in the period then ended, and the financial highlights for each of the five years in the period then ended. These financial statements and financial highlights are the responsibility of the Funds' management. Our responsibility is to express an opinion on these financial statements and financial highlights based on our audits.
We conducted our audits in accordance with the standards of the Public Company Accounting Oversight Board (United States). Those standards require that we plan and perform the audit to obtain reasonable assurance about whether the financial statements and financial highlights are free of material misstatement. The Funds are not required to have, nor were we engaged to perform, an audit of its internal control over financial reporting. Our audits included consideration of internal control over financial reporting as a basis for designing audit procedures that are appropriate in the circumstances, but not for the purpose of expressing an opinion on the effectiveness of the Fund's internal control over financial reporting. Accordingly, we express no such opinion. An audit also includes examining, on a test basis, evidence supporting the amounts and disclosures in the financial statements, assessing the accounting principles used and significant estimates made by management, as well as evaluating the overall financial statement presentation. Our procedures included confirmation of securities owned as of December 31, 2010, by correspondence with the transfer agent. We believe that our audits provide a reasonable basis for our opinion.
In our opinion, the financial statements and financial highlights referred to above present fairly, in all material respects, the financial position of VIP Freedom Lifetime Income I Portfolio, VIP Freedom Lifetime Income II Portfolio, VIP Freedom Lifetime Income III Portfolio as of December 31, 2010, the results of their operations for the year then ended, the changes in their net assets for each of the two years in the period then ended, and the financial highlights for each of the five years in the period then ended, in conformity with accounting principles generally accepted in the United States of America.
/s/ Deloitte & Touche LLP
DELOITTE & TOUCHE LLP
Boston, Massachusetts
February 22, 2011
Annual Report
The Trustees and executive officers of the trust and funds, as applicable, are listed below. The Board of Trustees governs each VIP Freedom Lifetime Income Fund and is responsible for protecting the interests of shareholders. The Trustees are experienced executives who meet periodically throughout the year to oversee each VIP Freedom Lifetime Income Fund's activities, review contractual arrangements with companies that provide services to each VIP Freedom Lifetime Income Fund, oversee management of the risks associated with such activities and contractual arrangements, and review each VIP Freedom Lifetime Income Fund's performance. If the interests of a VIP Freedom Lifetime Income Fund and an underlying Fidelity fund were to diverge, a conflict of interest could arise and affect how the Trustees fulfill their fiduciary duties to the affected funds. Strategic Advisers has structured the VIP Freedom Lifetime Income Funds to avoid these potential conflicts, although there may be situations where a conflict of interest is unavoidable. In such instances, Strategic Advisers and the Trustees would take reasonable steps to minimize and, if possible, eliminate the conflict. Except for James C. Curvey, each of the Trustees oversees 189 funds advised by FMR or an affiliate. Mr. Curvey oversees 408 funds advised by FMR or an affiliate.
The Trustees hold office without limit in time except that (a) any Trustee may resign; (b) any Trustee may be removed by written instrument, signed by at least two-thirds of the number of Trustees prior to such removal; (c) any Trustee who requests to be retired or who has become incapacitated by illness or injury may be retired by written instrument signed by a majority of the other Trustees; and (d) any Trustee may be removed at any special meeting of shareholders by a two-thirds vote of the outstanding voting securities of the trust. Each Trustee who is not an interested person (as defined in the 1940 Act) (Independent Trustee), shall retire not later than the last day of the calendar year in which his or her 75th birthday occurs. The Independent Trustees may waive this mandatory retirement age policy with respect to individual Trustees. The executive officers hold office without limit in time, except that any officer may resign or may be removed by a vote of a majority of the Trustees at any regular meeting or any special meeting of the Trustees. Except as indicated, each individual has held the office shown or other offices in the same company for the past five years.
Experience, Skills, Attributes, and Qualifications of the Funds' Trustees. The Governance and Nominating Committee has adopted a statement of policy that describes the experience, qualifications, attributes, and skills that are necessary and desirable for potential Independent Trustee candidates (Statement of Policy). The Board believes that each Trustee satisfied at the time he or she was initially elected or appointed a Trustee, and continues to satisfy, the standards contemplated by the Statement of Policy. The Governance and Nominating Committee also engages professional search firms to help identify potential Independent Trustee candidates who have the experience, qualifications, attributes, and skills consistent with the Statement of Policy. From time to time, additional criteria based on the composition and skills of the current Independent Trustees, as well as experience or skills that may be appropriate in light of future changes to board composition, business conditions, and regulatory or other developments, have also been considered by the professional search firms and the Governance and Nominating Committee. In addition, the Board takes into account the Trustees' commitment and participation in Board and committee meetings, as well as their leadership of standing and ad hoc committees throughout their tenure.
In determining that a particular Trustee was and continues to be qualified to serve as a Trustee, the Board has considered a variety of criteria, none of which, in isolation, was controlling. The Board believes that, collectively, the Trustees have balanced and diverse experience, qualifications, attributes, and skills, which allow the Board to operate effectively in governing each fund and protecting the interests of shareholders. Information about the specific experience, skills, attributes, and qualifications of each Trustee, which in each case led to the Board's conclusion that the Trustee should serve (or continue to serve) as a trustee of the funds, is provided below.
Board Structure and Oversight Function. Abigail P. Johnson is an interested person (as defined in the 1940 Act) and currently serves as Chairman. The Trustees have determined that an interested Chairman is appropriate and benefits shareholders because an interested Chairman has a personal and professional stake in the quality and continuity of services provided to the funds. Independent Trustees exercise their informed business judgment to appoint an individual of their choosing to serve as Chairman, regardless of whether the Trustee happens to be independent or a member of management. The Independent Trustees have determined that they can act independently and effectively without having an Independent Trustee serve as Chairman and that a key structural component for assuring that they are in a position to do so is for the Independent Trustees to constitute a substantial majority for the Board. The Independent Trustees also regularly meet in executive session. Kenneth L. Wolfe serves as Chairman of the Independent Trustees and as such (i) acts as a liaison between the Independent Trustees and management with respect to matters important to the Independent Trustees and (ii) with management prepares agendas for Board meetings.
Fidelity funds are overseen by different Boards of Trustees. The funds' Board oversees Fidelity's investment-grade bond, money market, and asset allocation funds and another Board oversees Fidelity's equity and high income funds. The asset allocation funds may invest in Fidelity funds that are overseen by such other Board. The use of separate Boards, each with its own committee structure, allows the Trustees of each group of Fidelity funds to focus on the unique issues of the funds they oversee, including common research, investment, and operational issues. On occasion, the separate Boards establish joint committees to address issues of overlapping consequences for the Fidelity funds overseen by each Board.
The Trustees operate using a system of committees to facilitate the timely and efficient consideration of all matters of importance to the Trustees, each fund, and fund shareholders and to facilitate compliance with legal and regulatory requirements and oversight of the funds' activities and associated risks. The Board, acting through its committees, has charged FMR and its affiliates with (i) identifying events or circumstances the occurrence of which could have demonstrably adverse effects on the funds' business and/or reputation; (ii) implementing processes and controls to lessen the possibility that such events or circumstances occur or to mitigate the effects of such events or circumstances if they do occur; and (iii) creating and maintaining a system designed to evaluate continuously business and market conditions in order to facilitate the identification and implementation processes described in (i) and (ii) above. Because the day-to-day operations and activities of the funds are carried out by or through FMR, its affiliates and other service providers, the funds' exposure to risks is mitigated but not eliminated by the processes overseen by the Trustees. While each of the Board's committees has responsibility for overseeing different aspects of the funds' activities, oversight is exercised primarily through the Operations and Audit Committees. Appropriate personnel, including but not limited to the funds' Chief Compliance Officer (CCO), FMR's internal auditor, the independent accountants, the funds' Treasurer and portfolio management personnel, make periodic reports to the Board's committees, as appropriate. The responsibilities of each committee, including their oversight responsibilities, are described further under "Standing Committees of the Funds' Trustees."
Annual Report
Trustees and Officers - continued
The fund's Statement of Additional Information (SAI) includes more information about the Trustees. To request a free copy, call Fidelity at 1-877-208-0098.
Interested Trustees*:
Correspondence intended for each Trustee who is an interested person may be sent to Fidelity Investments, 82 Devonshire Street, Boston, Massachusetts 02109.
Name, Age; Principal Occupations and Other Relevant Experience+ |
Abigail P. Johnson (49) |
| Year of Election or Appointment: 2009 Ms. Johnson is Trustee and Chairman of the Board of Trustees of certain Trusts. Ms. Johnson serves as President of Personal, Workplace and Institutional Services (2005-present). Ms. Johnson is the Vice Chairman and Director (2007-present) of FMR LLC. Previously, Ms. Johnson served as President and a Director of FMR (2001-2005), a Trustee of other investment companies advised by FMR, Fidelity Investments Money Management, Inc., and FMR Co., Inc. (2001-2005), Senior Vice President of the Fidelity funds (2001-2005), and managed a number of Fidelity funds. Ms. Abigail P. Johnson and Mr. Arthur E. Johnson are not related. |
James C. Curvey (75) |
| Year of Election or Appointment: 2007 Mr. Curvey also serves as Trustee (2007-present) of other investment companies advised by FMR. Mr. Curvey is a Director of Fidelity Investments Money Management, Inc. (2009-present), Director of Fidelity Research & Analysis Co. (2009-present) and Director of FMR and FMR Co., Inc. (2007-present). Mr. Curvey is also Vice Chairman (2007-present) and Director of FMR LLC. In addition, Mr. Curvey serves as an Overseer for the Boston Symphony Orchestra and a member of the Trustees of Villanova University. Previously, Mr. Curvey was the Vice Chairman (2006-2007) and Director (2000-2007) of FMR Corp. |
* Trustees have been determined to be "Interested Trustees" by virtue of, among other things, their affiliation with the trust or various entities under common control with FMR.
+ The information above includes each Trustee's principal occupation during the last five years and other information relating to the experience, attributes, and skills relevant to each Trustee's qualifications to serve as a Trustee, which led to the conclusion that each Trustee should serve as a Trustee for each fund.
Independent Trustees:
Correspondence intended for each Independent Trustee (that is, the Trustees other than the Interested Trustees) may be sent to Fidelity Investments, P.O. Box 55235, Boston, Massachusetts 02205-5235.
Name, Age; Principal Occupations and Other Relevant Experience+ |
Albert R. Gamper, Jr. (68) |
| Year of Election or Appointment: 2007 Prior to his retirement in December 2004, Mr. Gamper served as Chairman of the Board of CIT Group Inc. (commercial finance). During his tenure with CIT Group Inc. Mr. Gamper served in numerous senior management positions, including Chairman (1987-1989; 1999-2001; 2002-2004), Chief Executive Officer (1987-2004), and President (2002-2003). He also served as President and Chief Executive Officer of Tyco Capital Corporation (2001-2002). Mr. Gamper currently serves as a member of the Board of Directors of Public Service Enterprise Group (utilities, 2000-present), a member of the Board of Trustees, Rutgers University (2004-present), and Chairman of the Board of Saint Barnabas Health Care System. Previously, Mr. Gamper served as Chairman of the Board of Governors, Rutgers University (2004-2007). |
Robert F. Gartland (59) |
| Year of Election or Appointment: 2010 Mr. Gartland is a partner and investor of Vietnam Partners LLC (investments and consulting, 2008-present) and is Chairman and an investor in Gartland and Mellina Group Corp. (consulting, 2009-present). Prior to his retirement, Mr. Gartland held a variety of positions at Morgan Stanley (financial services, 1979-2007) including Managing Director (1987-2007). |
Arthur E. Johnson (63) |
| Year of Election or Appointment: 2008 Mr. Johnson serves as a member of the Board of Directors of Eaton Corporation (diversified power management, 2009-present) and AGL Resources, Inc. (holding company). Prior to his retirement, Mr. Johnson served as Senior Vice President of Corporate Strategic Development of Lockheed Martin Corporation (defense contractor, 1999-2009). He previously served on the Board of Directors of IKON Office Solutions, Inc. (1999-2008) and Delta Airlines (2005-2007). Mr. Arthur E. Johnson and Ms. Abigail P. Johnson are not related. |
Michael E. Kenneally (56) |
| Year of Election or Appointment: 2009 Previously, Mr. Kenneally served as a Member of the Advisory Board for certain Fidelity Fixed Income and Asset Allocation Funds (2008-2009). Prior to his retirement, Mr. Kenneally served as Chairman and Global Chief Executive Officer of Credit Suisse Asset Management (2003-2005). Mr. Kenneally was a Director of the Credit Suisse Funds (U.S. mutual funds, 2004-2008) and certain other closed-end funds (2004-2005) and was awarded the Chartered Financial Analyst (CFA) designation in 1991. |
James H. Keyes (70) |
| Year of Election or Appointment: 2007 Mr. Keyes serves as a member of the Boards of Navistar International Corporation (manufacture and sale of trucks, buses, and diesel engines, since 2002) and Pitney Bowes, Inc. (integrated mail, messaging, and document management solutions, since 1998). Prior to his retirement, Mr. Keyes served as Chairman and Chief Executive Officer of Johnson Controls (automotive, building, and energy, 1998-2002) and as a member of the Board of LSI Logic Corporation (semiconductor technologies, 1984-2008). |
Marie L. Knowles (64) |
| Year of Election or Appointment: 2001 Prior to Ms. Knowles' retirement in June 2000, she served as Executive Vice President and Chief Financial Officer of Atlantic Richfield Company (ARCO) (diversified energy, 1996-2000). From 1993 to 1996, she was a Senior Vice President of ARCO and President of ARCO Transportation Company. She served as a Director of ARCO from 1996 to 1998. Ms. Knowles currently serves as a Director and Chairman of the Audit Committee of McKesson Corporation (healthcare service, since 2002). Ms. Knowles is an Honorary Trustee of the Brookings Institution and a member of the Board of the Catalina Island Conservancy and of the Santa Catalina Island Company (2009-present). She also serves as a member of the Advisory Board for the School of Engineering of the University of Southern California and the Foundation Board of the School of Architecture at the University of Virginia (2007-present). Previously, Ms. Knowles served as a Director of Phelps Dodge Corporation (copper mining and manufacturing, 1994-2007). |
Kenneth L. Wolfe (71) |
| Year of Election or Appointment: 2007 Mr. Wolfe is Chairman of the Independent Trustees of the Fixed Income and Asset Allocation Funds (2008-present). Prior to his retirement, Mr. Wolfe served as Chairman and a Director (2007-2009) and Chairman and Chief Executive Officer (1994-2001) of Hershey Foods Corporation. He also served as a member of the Boards of Adelphia Communications Corporation (telecommunications, 2003-2006), Bausch & Lomb, Inc. (medical/pharmaceutical, 1993-2007), and Revlon, Inc. (personal care products, 2004-2009). |
+ The information above includes each Trustee's principal occupation during the last five years and other information relating to the experience, attributes, and skills relevant to each Trustee's qualifications to serve as a Trustee, which led to the conclusion that each Trustee should serve as a Trustee for each fund.
Executive Officers:
Correspondence intended for each executive officer may be sent to Fidelity Investments, 82 Devonshire Street, Boston, Massachusetts 02109.
Name, Age; Principal Occupation |
John R. Hebble (52) |
| Year of Election or Appointment: 2008 President and Treasurer of Fidelity's Fixed Income and Asset Allocation Funds. Mr. Hebble also serves as Treasurer and Chief Financial Officer of The North Carolina Capital Management Trust: Cash and Term Portfolio (2008-present), Assistant Treasurer of other Fidelity funds (2009-present) and is an employee of Fidelity Investments. |
Boyce I. Greer (54) |
| Year of Election or Appointment: 2005 Vice President of Fidelity's Fixed Income Funds and Asset Allocation Funds (2005). Mr. Greer is also a Trustee of other investment companies advised by FMR. Mr. Greer is President of The North Carolina Capital Management Trust: Cash and Term Portfolio (2003-present), the Asset Allocation Division (2008-present), President and a Director of Strategic Advisers, Inc. (2008-present), President of FIMM 130/30 LLC (2008-present), Director of Ballyrock Investment Advisors LLC (2006-present), and an Executive Vice President of FMR (2005-present). Previously, Mr. Greer served as Executive Vice President of FMR Co., Inc. (2005-2009), President and Director of Fidelity Investments Money Management, Inc. (2007-2009) and as a Director and Managing Director of Strategic Advisers, Inc. (2002-2005). |
Derek L. Young (46) |
| Year of Election or Appointment: 2009 Vice President of Fidelity's Asset Allocation Funds. Mr. Young also serves as Chief Investment Officer of the Global Asset Allocation Group (2009-present). Previously, Mr. Young served as a portfolio manager. |
Scott C. Goebel (42) |
| Year of Election or Appointment: 2008 Secretary and Chief Legal Officer (CLO) of the Fidelity funds. Mr. Goebel also serves as Secretary and CLO of The North Carolina Capital Management Trust: Cash and Term Portfolio (2008-present); General Counsel, Secretary, and Senior Vice President of FMR (2008-present) and FMR Co., Inc. (2008-present); Deputy General Counsel of FMR LLC; Chief Legal Officer of Fidelity Management & Research (Hong Kong) Limited (2008-present) and Assistant Secretary of Fidelity Management & Research (Japan) Inc. (2008-present), Fidelity Investments Money Management, Inc. (2008-present), Fidelity Management & Research (U.K.) Inc. (2008-present), and Fidelity Research and Analysis Company (2008-present). Previously, Mr. Goebel served as Assistant Secretary of the Funds (2007-2008) and as Vice President and Secretary of Fidelity Distributors Corporation (FDC) (2005-2007). |
David J. Carter (37) |
| Year of Election or Appointment: 2010 Assistant Secretary of Fidelity's Fixed Income and Asset Allocation Funds. Mr. Carter also serves as Vice President, Associate General Counsel (2010-present) and is an employee of Fidelity Investments (2005-present). |
Holly C. Laurent (56) |
| Year of Election or Appointment: 2008 Anti-Money Laundering (AML) Officer of the Fidelity funds. Ms. Laurent also serves as AML Officer of The North Carolina Capital Management Trust: Cash and Term Portfolio (2008-present) and is an employee of Fidelity Investments. Previously, Ms. Laurent was Senior Vice President and Head of Legal for Fidelity Business Services India Pvt. Ltd. (2006-2008), and Senior Vice President, Deputy General Counsel and Group Head for FMR LLC (2005-2006). |
Christine Reynolds (52) |
| Year of Election or Appointment: 2008 Chief Financial Officer of the Fidelity funds. Ms. Reynolds became President of Fidelity Pricing and Cash Management Services (FPCMS) in August 2008. Ms. Reynolds served as Chief Operating Officer of FPCMS (2007-2008). Previously, Ms. Reynolds served as President, Treasurer, and Anti-Money Laundering officer of the Fidelity funds (2004-2007). |
Michael H. Whitaker (43) |
| Year of Election or Appointment: 2008 Chief Compliance Officer of Fidelity's Fixed Income and Asset Allocation Funds. Mr. Whitaker also serves as Chief Compliance Officer of The North Carolina Capital Management Trust: Cash and Term Portfolio (2008-present). Mr. Whitaker is an employee of Fidelity Investments (2007-present). Prior to joining Fidelity Investments, Mr. Whitaker worked at MFS Investment Management where he served as Senior Vice President and Chief Compliance Officer (2004-2006), and Assistant General Counsel. |
Jeffrey S. Christian (49) |
| Year of Election or Appointment: 2009 Deputy Treasurer of the Fidelity funds. Mr. Christian is an employee of Fidelity Investments. Previously, Mr. Christian served as Chief Financial Officer (2008-2009) of certain Fidelity funds and Senior Vice President of Fidelity Pricing and Cash Management Services (FPCMS) (2004-2009). |
Bryan A. Mehrmann (49) |
| Year of Election or Appointment: 2005 Deputy Treasurer of the Fidelity funds. Mr. Mehrmann is an employee of Fidelity Investments. |
Stephanie J. Dorsey (41) |
| Year of Election or Appointment: 2008 Deputy Treasurer of Fidelity's Fixed Income and Asset Allocation Funds. Ms. Dorsey also serves as Assistant Treasurer of other Fidelity funds (2010-present) and is an employee of Fidelity Investments (2008-present). Previously, Ms. Dorsey served as Treasurer (2004-2008) of the JPMorgan Mutual Funds and Vice President (2004-2008) of JPMorgan Chase Bank. |
Adrien E. Deberghes (43) |
| Year of Election or Appointment: 2010 Assistant Treasurer of Fidelity's Fixed Income and Asset Allocation Funds. Mr. Deberghes also serves as Deputy Treasurer of other Fidelity funds (2008-present) and is an employee of Fidelity Investments (2008-present). Previously, Mr. Deberghes served as Senior Vice President of Mutual Fund Administration at State Street Corporation (2007-2008), Senior Director of Mutual Fund Administration at Investors Bank & Trust (2005-2007), and Director of Finance for Dunkin' Brands (2000-2005). |
Kenneth B. Robins (41) |
| Year of Election or Appointment: 2009 Assistant Treasurer of the Fidelity Fixed Income and Asset Allocation Funds. Mr. Robins also serves as President and Treasurer of other Fidelity funds (2008-present; 2010-present) and is an employee of Fidelity Investments (2004-present). Previously, Mr. Robins served as Deputy Treasurer of the Fidelity funds (2005-2008) and Treasurer and Chief Financial Officer of The North Carolina Capital Management Trust: Cash and Term Portfolios (2006-2008). |
Gary W. Ryan (52) |
| Year of Election or Appointment: 2005 Assistant Treasurer of the Fidelity funds. Mr. Ryan is an employee of Fidelity Investments. Previously, Mr. Ryan served as Vice President of Fund Reporting in Fidelity Pricing and Cash Management Services (FPCMS) (1999-2005). |
Jonathan Davis (42) |
| Year of Election or Appointment: 2010 Assistant Treasurer of the Fidelity funds. Mr. Davis is an employee of Fidelity Investments. Previously, Mr. Davis served as Vice President and Associate General Counsel of FMR LLC (2003-2010). |
Annual Report
The Board of Trustees of each fund voted to pay to shareholders of record at the opening of business on record date, the following distributions per share derived from capital gains realized from sales of portfolio securities:
Fund | Pay Date | Record Date | Capital Gains |
VIP Freedom Lifetime Income I | 02/11/11 | 02/11/11 | $0.005 |
VIP Freedom Lifetime Income II | 02/11/11 | 02/11/11 | $0.000 |
VIP Freedom Lifetime Income III | 02/11/11 | 02/11/11 | $0.000 |
The funds hereby designate as capital gain dividends the amounts noted below for the taxable year ended December 31, 2010, or, if subsequently determined to be different, the net capital gain of such year.
VIP Freedom Lifetime Income I | $2,691 |
A percentage of the dividends distributed during the fiscal year for the following funds was derived from interest on U.S. Government securities which is generally exempt from state income tax:
Fund | |
VIP Freedom Lifetime Income I | 4.34% |
VIP Freedom Lifetime Income II | 4.98% |
VIP Freedom Lifetime Income III | 3.35% |
A percentage of the dividends distributed during the fiscal year for the following funds qualifies for the dividends-received deduction for corporate shareholders:
Fund | February, 2010 | December, 2010 |
VIP Freedom Lifetime Income I | 1% | 10% |
VIP Freedom Lifetime Income II | 8% | 14% |
VIP Freedom Lifetime Income III | 5% | 22% |
Annual Report
Board Approval of Investment Advisory Contracts and Management Fees
VIP Freedom Lifetime Income Funds
Each year, the Board of Trustees, including the Independent Trustees (together, the Board), votes on the renewal of the management contract and administration agreement (together, the Advisory Contracts) for each fund. The Board, assisted by the advice of fund counsel and Independent Trustees' counsel, requests and considers a broad range of information relevant to the renewal of the Advisory Contracts throughout the year.
The Board meets regularly and considers at each of its meetings factors that are relevant to its annual consideration of the renewal of each fund's Advisory Contracts, including the services and support provided to each fund and its shareholders. The Board has established three standing committees, each composed of Independent Trustees with varying backgrounds, to which the Board has assigned specific subject matter responsibilities in order to enhance effective decision-making by the Board. The Operations Committee, of which all of the Independent Trustees are members, meets regularly throughout the year and, among other matters, considers matters specifically related to the annual consideration of the renewal of each fund's Advisory Contracts. The Board, acting directly and through its Committees, requests and receives information concerning the annual consideration of the renewal of each fund's Advisory Contracts. The Board also meets as needed to consider matters specifically related to the Board's annual consideration of the renewal of Advisory Contracts. Members of the Board may also meet with trustees of other Fidelity funds through ad hoc joint committees to discuss certain matters relevant to the Fidelity funds.
At its September 2010 meeting, the Board of Trustees, including the Independent Trustees, unanimously determined to renew each fund's Advisory Contracts. In reaching its determination, the Board considered all factors it believed relevant and reached a determination, with the assistance of fund counsel and Independent Trustees' counsel and through the exercise of its business judgment, that the renewal of the Advisory Contracts is in the best interests of each fund and its shareholders and that the lack of compensation to be received by Fidelity under the management contracts is fair and reasonable. The Board's decision to renew the Advisory Contracts was not based on any single factor, but rather was based on a comprehensive consideration of all the information provided to the Board at its meetings throughout the year. In reaching its determination, the Board is aware that shareholders in each fund have a broad range of investment choices available to them, including a wide choice among mutual funds offered by Fidelity's competitors, and that each fund's shareholders, with the opportunity to review and weigh the disclosure provided by the fund in its prospectus and other public disclosures, have chosen to invest in that fund, managed by Fidelity.
Nature, Extent, and Quality of Services Provided. The Board considered the staffing within the investment adviser, Strategic Advisers, Inc. (Strategic Advisers), and the administrator, FMR, including the backgrounds of the funds' investment personnel and the funds' investment objectives and disciplines. The Independent Trustees also had discussions with senior management of Fidelity's investment operations and investment groups. The Board considered the structure of the portfolio manager compensation program and whether this structure provides appropriate incentives to act in the best interest of each fund.
Resources Dedicated to Investment Management and Support Services. The Board reviewed the size, education, and experience of Strategic Advisers' investment staff, their use of technology, and Strategic Advisers' and FMR's approach to recruiting, training, and retaining portfolio managers and other research, advisory, and management personnel. The Board noted that Fidelity's analysts have access to a variety of technological tools and market and securities data that enable them to perform both fundamental and quantitative analysis and to specialize in various disciplines. The Board noted FMR's continued focus on strengthening the organization and discipline of equity portfolio management and research.
Shareholder and Administrative Services. The Board considered (i) the nature, extent, quality, and cost of advisory, administrative, and shareholder services performed by FMR and its affiliates under the Advisory Contracts and under separate agreements covering transfer agency, pricing and bookkeeping, and securities lending services for each fund; (ii) the nature and extent of FMR's supervision of third party service providers, principally custodians and subcustodians; and (iii) the resources devoted to, and the record of compliance with, each fund's compliance policies and procedures.
The Board noted that the growth of fund assets over time across the complex allows Fidelity to reinvest in the development of services designed to enhance the value or convenience of the Fidelity funds as investment vehicles. These services include 24-hour access to account information and market information through telephone representatives and over the Internet, and investor education materials and asset allocation tools.
Investment in a Large Fund Family. The Board considered the benefits to shareholders of investing in a Fidelity fund, including the benefits of investing in a fund that is part of a large family of funds offering a variety of investment disciplines and providing a large variety of mutual fund investor services. The Board noted that Fidelity had taken, or had made recommendations that resulted in the Fidelity funds taking, a number of actions over the previous year that benefited particular funds, including (i) dedicating additional resources to investment research and restructuring and broadening the focus of the investment research teams; (ii) bolstering the senior management team that oversees asset management; (iii) launching Class F of certain funds as a lower-fee class available to Freedom K and Freedom Index Funds; (iv) lowering the initial investment minimums and ongoing balance requirements for Real Estate High Income Fund; (v) eliminating subsequent purchase minimums for all funds and adding a waiver of the investment minimum requirement for new accounts opened with the proceeds of a systematic withdrawal plan; (vi) eliminating the withdrawal minimum and maximum limits for systematic withdrawals from Advisor funds; (vii) expanding sales load waivers on Class A shares for Destiny Planholders and expanding Institutional Class eligibility for Class O Destiny Planholders; and (viii) changing certain Class A and Class T sales charge structures to further align them with industry practices.
Annual Report
Board Approval of Investment Advisory Contracts and Management Fees - continued
Investment Performance. The Board considered whether each fund has operated in accordance with its investment objective, as well as its record of compliance with its investment restrictions. It also reviewed each fund's absolute investment performance, as well as each fund's relative investment performance measured over multiple periods against a proprietary custom index. The Board noted that FMR does not believe that a meaningful peer group exists against which to compare any of the funds' performance. Because each fund had been in existence less than five calendar years, for each fund the following charts considered by the Board show, over the one- and three-year periods ended December 31, 2009, the fund's cumulative total returns and the cumulative total returns of a proprietary custom index ("benchmark").
For each fund, the proprietary custom index is an index developed by FMR that represents the performance of the fund's asset classes according to their respective weightings, adjusted on June 30 and December 31 of each calendar year to reflect the fund's increasingly conservative asset allocations.
VIP Freedom Lifetime Income I Portfolio

The Board noted that the investment performance of the fund compared favorably to its benchmark for the one-year period, although the fund's three-year cumulative total return was lower than its benchmark. The Board also reviewed the fund's performance since inception as well as performance in the current year.
VIP Freedom Lifetime Income II Portfolio
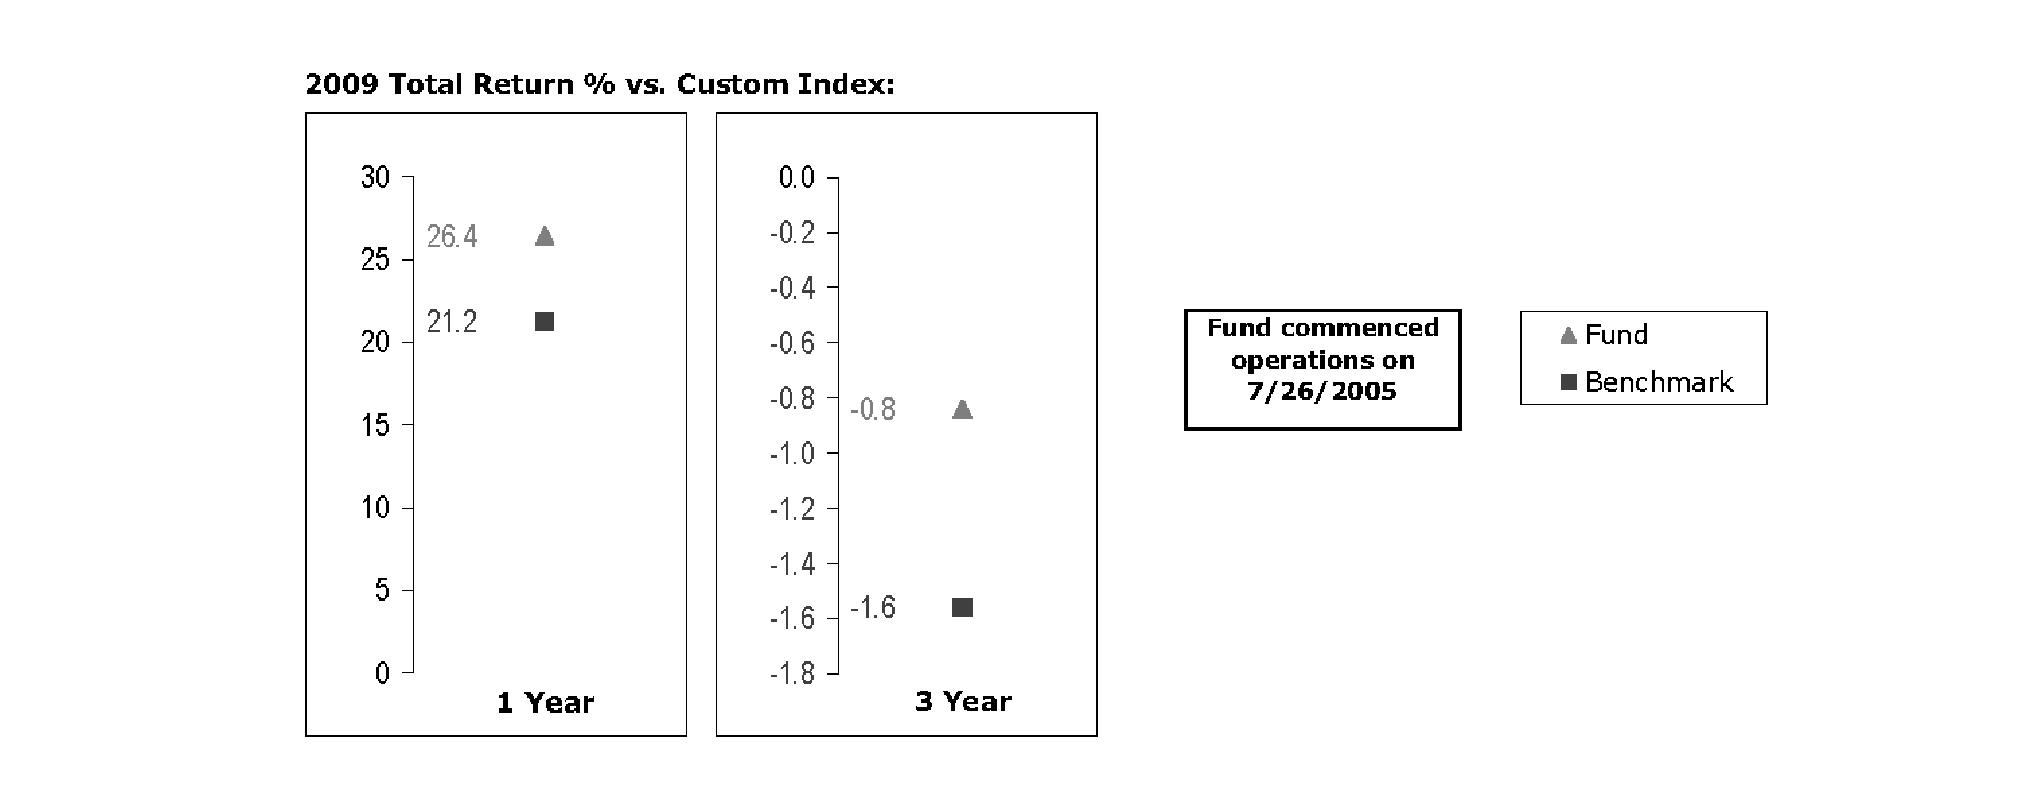
The Board noted that the investment performance of the fund compared favorably to its benchmark for all the periods shown. The Board also reviewed the fund's performance since inception as well as performance in the current year.
Annual Report
VIP Freedom Lifetime Income III Portfolio
The Board noted that the investment performance of the fund compared favorably to its benchmark for the one-year period, although the fund's three-year cumulative total return was lower than its benchmark. The Board also reviewed the fund's performance since inception as well as performance in the current year.
Based on its review, and giving particular weight to the nature and quality of the resources dedicated by Strategic Advisers and FMR to maintain and improve relative performance and factoring in the unprecedented market events in recent years, the Board concluded that the nature, extent, and quality of investment management and support services and of shareholder and administrative services provided to each fund will benefit each fund's shareholders, particularly in light of the Board's view that each fund's shareholders benefit from investing in a fund that is part of a large family of funds offering a variety of investment disciplines and services.
Competitiveness of Management Fee and Total Fund Expenses. The Board noted that the funds do not pay Strategic Advisers a management fee for investment advisory services. The Board considered each fund's management fee and total expenses (which include the fees and expenses of underlying funds) compared to "mapped groups" of competitive funds and classes. Fidelity creates "mapped groups" by combining similar Lipper investment objective categories that have comparable management fee characteristics. Combining Lipper investment objective categories aids the Board's management fee and total expense comparisons by broadening the competitive group used for comparison and by reducing the number of universes to which various Fidelity funds are compared.
Management Fee. The Board considered two proprietary management fee comparisons for the 12-month (or shorter) periods shown in the charts below. The group of Lipper funds used by the Board for management fee comparisons is referred to below as the "Total Mapped Group." The Total Mapped Group comparison focuses on a fund's standing relative to the total universe of comparable funds available to investors, in terms of gross management fees before expense reimbursements or caps. "TMG %" represents the percentage of funds in the Total Mapped Group that had management fees that were lower than a fund's. For example, a TMG % of 0% means that 100% of the funds in the Total Mapped Group had higher management fees than a fund. The "Asset-Size Peer Group" (ASPG) comparison focuses on a fund's standing relative to non-Fidelity funds similar in size to the fund within the Total Mapped Group. The ASPG represents at least 15% of the funds in the Total Mapped Group with comparable asset size and management fee characteristics, subject to a minimum of 50 funds (or all funds in the Total Mapped Group if fewer than 50). Additional information, such as the ASPG quartile in which a fund's management fee ranked, is also included in the charts and considered by the Board.
Annual Report
Board Approval of Investment Advisory Contracts and Management Fees - continued
VIP Freedom Lifetime Income I Portfolio
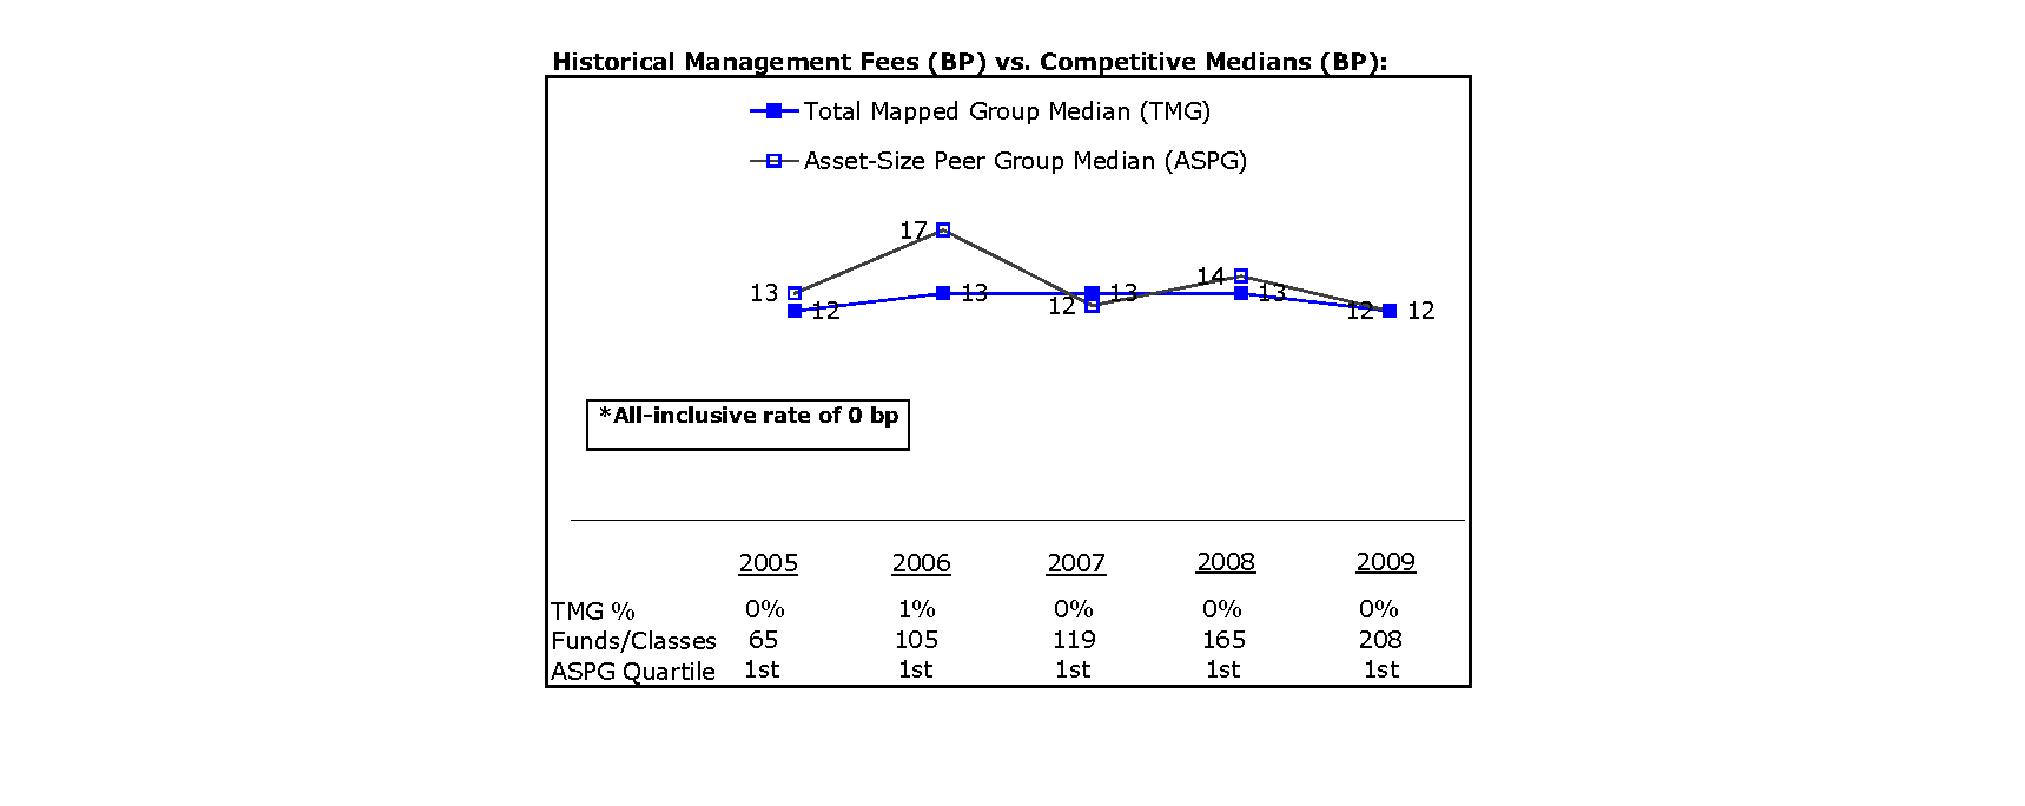
VIP Freedom Lifetime Income II Portfolio
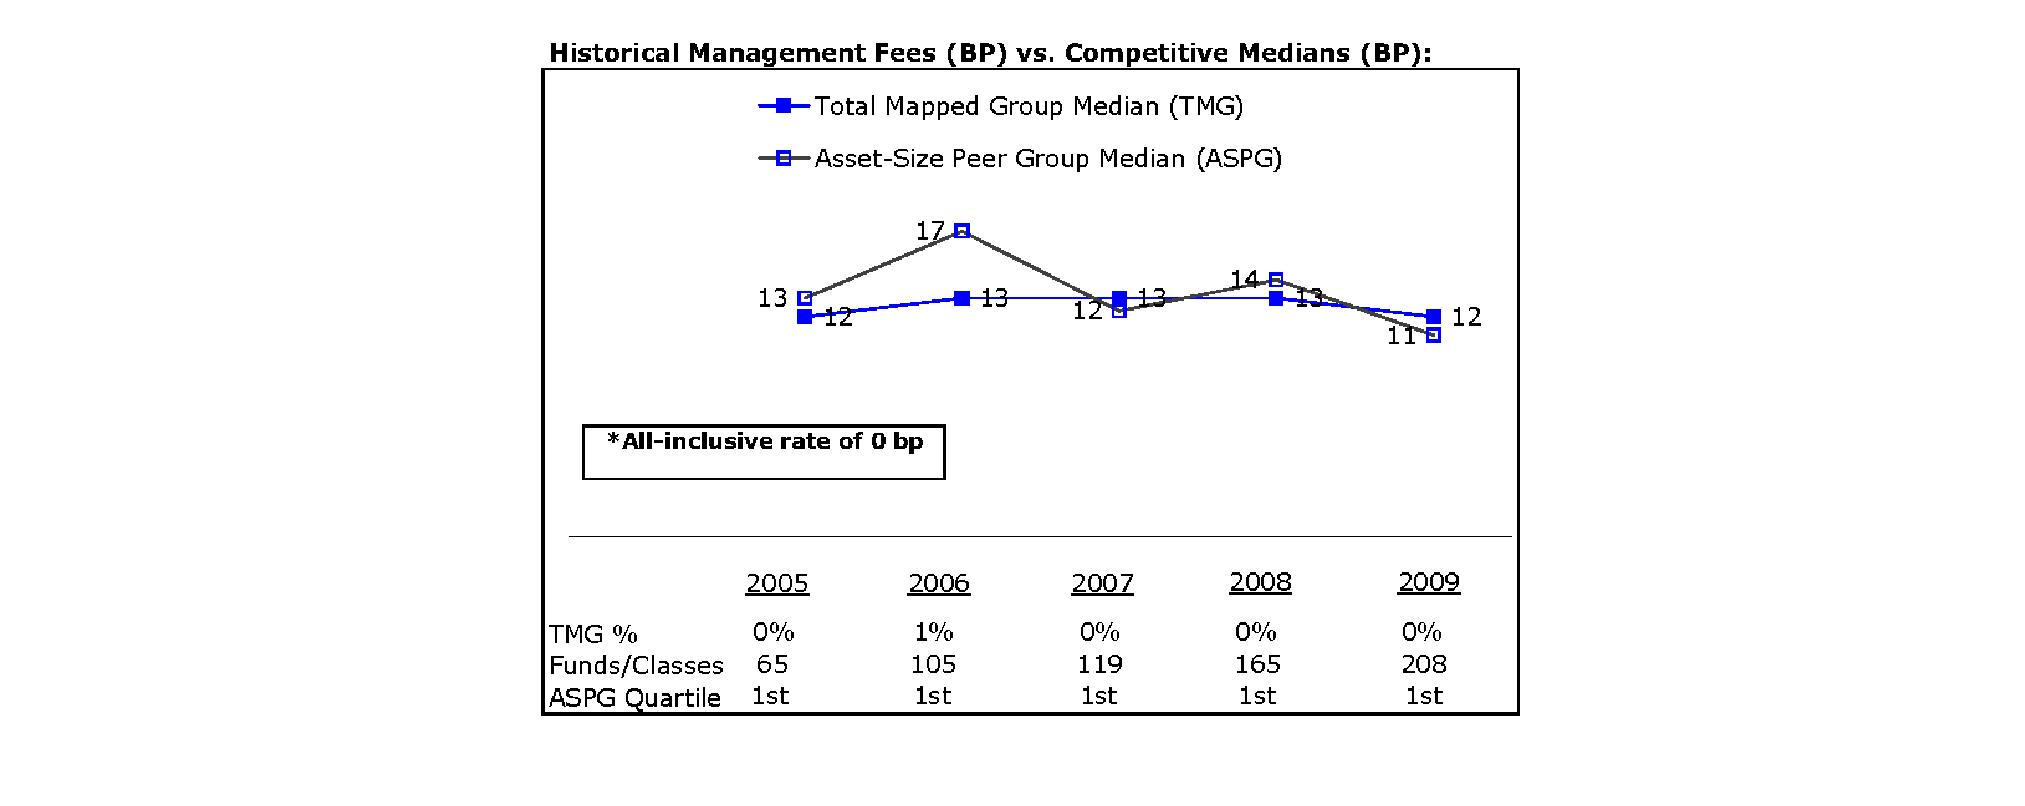
Annual Report
VIP Freedom Lifetime Income III Portfolio

The Board noted that each fund's management fee ranked below the median of its Total Mapped Group and below the median of its ASPG for 2009.
Total Expenses. In its review of each fund's total expenses, the Board noted that each fund invests in Investor Class of the underlying fund to avoid charging fund-paid 12b-1 fees at both fund levels. The Board considered that the funds do not pay transfer agent fees. Instead, Investor Class of each underlying fund bears its pro rata portion of each fund's transfer agent fee according to the percentage of each fund's assets invested in that underlying fund. The Board further noted that FMR pays all other expenses of each fund, with limited exceptions.
The Board noted that each fund's total expenses ranked below its competitive median for 2009.
Fees Charged to Other Fidelity Clients. The Board also considered Fidelity fee structures and other information with respect to clients of FMR and its affiliates, such as other mutual funds advised or subadvised by FMR or its affiliates, pension plan clients, and other institutional clients. In March 2010, the Board created an ad hoc joint committee with the board of other Fidelity funds (the Committee) to review and compare Fidelity's institutional investment advisory business with its business of providing services to the Fidelity funds, including the differences in services provided, fees charged, and costs incurred, as well as competition in their respective marketplaces.
Based on its review of management fees, total expenses, and fees charged to other Fidelity clients, the Board concluded that each fund's management fee and the total expenses of each fund were fair and reasonable in light of the services that the fund and its shareholders receive and the other factors considered, including the findings of the Committee.
Costs of the Services and Profitability. The Board considered the level of Fidelity's profits in respect of all the Fidelity funds.
PricewaterhouseCoopers LLP (PwC), independent registered public accounting firm and auditor to Fidelity and certain Fidelity funds, has been engaged annually by the Board as part of the Board's assessment of Fidelity's profitability analysis. PwC's engagement includes the review and assessment of Fidelity's methodologies used in determining the revenues and expenses attributable to Fidelity's mutual fund business, and completion of agreed-upon procedures surrounding the mathematical accuracy of fund profitability and its conformity to allocation methodologies. After considering PwC's reports issued under the engagement and information provided by Fidelity, the Board believes that while other allocation methods may also be reasonable, Fidelity's profitability methodologies are reasonable in all material respects.
The Board has also reviewed Fidelity's non-fund businesses and fall-out benefits related to the mutual fund business as well as cases where Fidelity's affiliates may benefit from or be related to the funds' business.
The Board concluded that the costs of the services provided by and the profits realized by Fidelity in connection with the operation of each fund were not relevant to the renewal of each fund's Advisory Contracts because the funds do not pay management fees and FMR pays all other expenses of each fund, with limited exceptions.
Economies of Scale. The Board concluded that because the funds do not pay management fees and FMR pays all other expenses of each fund, with limited exceptions, economies of scale cannot be realized by the funds, but may be realized by the other Fidelity funds in which each fund invests.
Annual Report
Board Approval of Investment Advisory Contracts and Management Fees - continued
Additional Information Requested by the Board. In order to develop fully the factual basis for consideration of the Fidelity funds' Advisory Contracts, the Board requested and received additional information on certain topics, including (i) fund performance trends, actions to be taken by FMR to improve certain funds' overall performance, and Fidelity's long-term strategies for certain funds; (ii) Fidelity's fund profitability methodology and profitability trends for certain funds; (iii) portfolio manager changes that have occurred during the past year and the amount of the investment that each portfolio manager has made in the Fidelity fund(s) that he or she manages; (iv) Fidelity's compensation structure for portfolio managers, research analysts, and other key personnel, including its effects on fund profitability, the rationale for the compensation structure, and the extent to which current market conditions have affected retention and recruitment; (v) the compensation paid by FMR to fund sub-advisers on behalf of the Fidelity funds; (vi) Fidelity's fee structures and rationale for recommending different fees among different categories of funds and classes, as well as Fidelity's voluntary waiver of fees to maintain minimum yields for certain funds and classes; (vii) the rationale for any differences between fund fee structures and fee structures in place for other Fidelity clients; and (viii) explanations regarding the relative total expenses borne by certain funds and classes, total expense competitive trends, and actions that might be taken by FMR to reduce total expenses for certain funds and classes or to achieve further economies of scale.
Based on its evaluation of all of the conclusions noted above, and after considering all factors it believed relevant, the Board ultimately concluded that the advisory fee structures are fair and reasonable, and that each fund's Advisory Contracts should be renewed.
Annual Report
Investment Adviser
Strategic Advisers, Inc.
Boston, MA
General Distributor
Fidelity Distributors Corporation
Boston, MA
Transfer and Service Agents
Fidelity Investments Institutional Operations Company, Inc.
Boston, MA
Fidelity Service Company, Inc.
Boston, MA
Custodian
The Bank of New York Mellon
New York, NY
VIPFLI-ANN-0211
1.816199.105
Fidelity® Variable Insurance Products:
FundsManager - 20%, 50%, 60%, 70%, 85% Portfolio
Annual Report
December 31, 2010
(2_fidelity_logos) (Registered_Trademark)
Contents
To view a fund's proxy voting guidelines and proxy voting record for the 12-month period ended June 30, visit http://www.fidelity.com/proxyvotingresults or visit the Securities and Exchange Commission's (SEC) web site at http://www.sec.gov. You may also call 1-877-208-0098 to request a free copy of the proxy voting guidelines.
Fidelity Variable Insurance Products are separate account options which are purchased through a variable insurance contract.
Standard & Poor's, S&P and S&P 500 are registered service marks of The McGraw-Hill Companies, Inc. and have been licensed for use by Fidelity Distributors Corporation.
Other third party marks appearing herein are the property of their respective owners.
All other marks appearing herein are registered or unregistered trademarks or service marks of FMR LLC or an affiliated company.
This report and the financial statements contained herein are submitted for the general information of the shareholders of the funds. This report is not authorized for distribution to prospective investors in the funds unless preceded or accompanied by an effective prospectus.
A fund files its complete schedule of portfolio holdings with the SEC for the first and third quarters of each fiscal year on Form N-Q. Forms N-Q are available on the SEC's web site at http://www.sec.gov. A fund's Forms N-Q may be reviewed and copied at the SEC's Public Reference Room in Washington, DC. Information regarding the operation of the SEC's Public Reference Room may be obtained by calling 1-800-SEC-0330. For a complete list of a fund's portfolio holdings, view the most recent holdings listing, semiannual report, or annual report on Fidelity's web site at http://www.fidelity.com, http://www.advisor.fidelity.com, or http://www.401k.com, as applicable.
NOT FDIC INSURED • MAY LOSE VALUE • NO BANK GUARANTEE
Neither the funds nor Fidelity Distributors Corporation is a bank.
Annual Report
VIP FundsManager 20% Portfolio
Performance: The Bottom Line
Average annual total return reflects the change in the value of an investment, assuming reinvestment of the class' distributions from dividend income and capital gains (the profits earned upon the sale of securities that have grown in value, if any) and assuming a constant rate of performance each year. During periods of reimbursement by Fidelity, a fund's total return will be greater than it would be had the reimbursement not occurred. Performance numbers are net of all underlying fund operating expenses, but do not include any insurance charges imposed by your insurance company's separate account. If performance information included the effect of these additional charges, the total returns would have been lower. How a fund did yesterday is no guarantee of how it will do tomorrow.
Average Annual Total Returns
Periods ended December 31, 2010 | | Past 1
year | Life of fund A |
VIP FundsManager® 20% Portfolio - Investor Class | | 7.47% | 4.21% |
VIP FundsManager 20% Portfolio - Service Class | | 7.36% | 4.21% |
VIP FundsManager 20% Portfolio - Service Class 2 | | 7.24% | 4.05% |
A From April 13, 2006.
$10,000 Over Life of Fund
Let's say hypothetically that $10,000 was invested in VIP FundsManager 20% Portfolio - Investor Class on April 13, 2006, when the fund started. The chart shows how the value of your investment would have changed, and also shows how the Barclays Capital® U.S. Aggregate Bond Index performed over the same period.
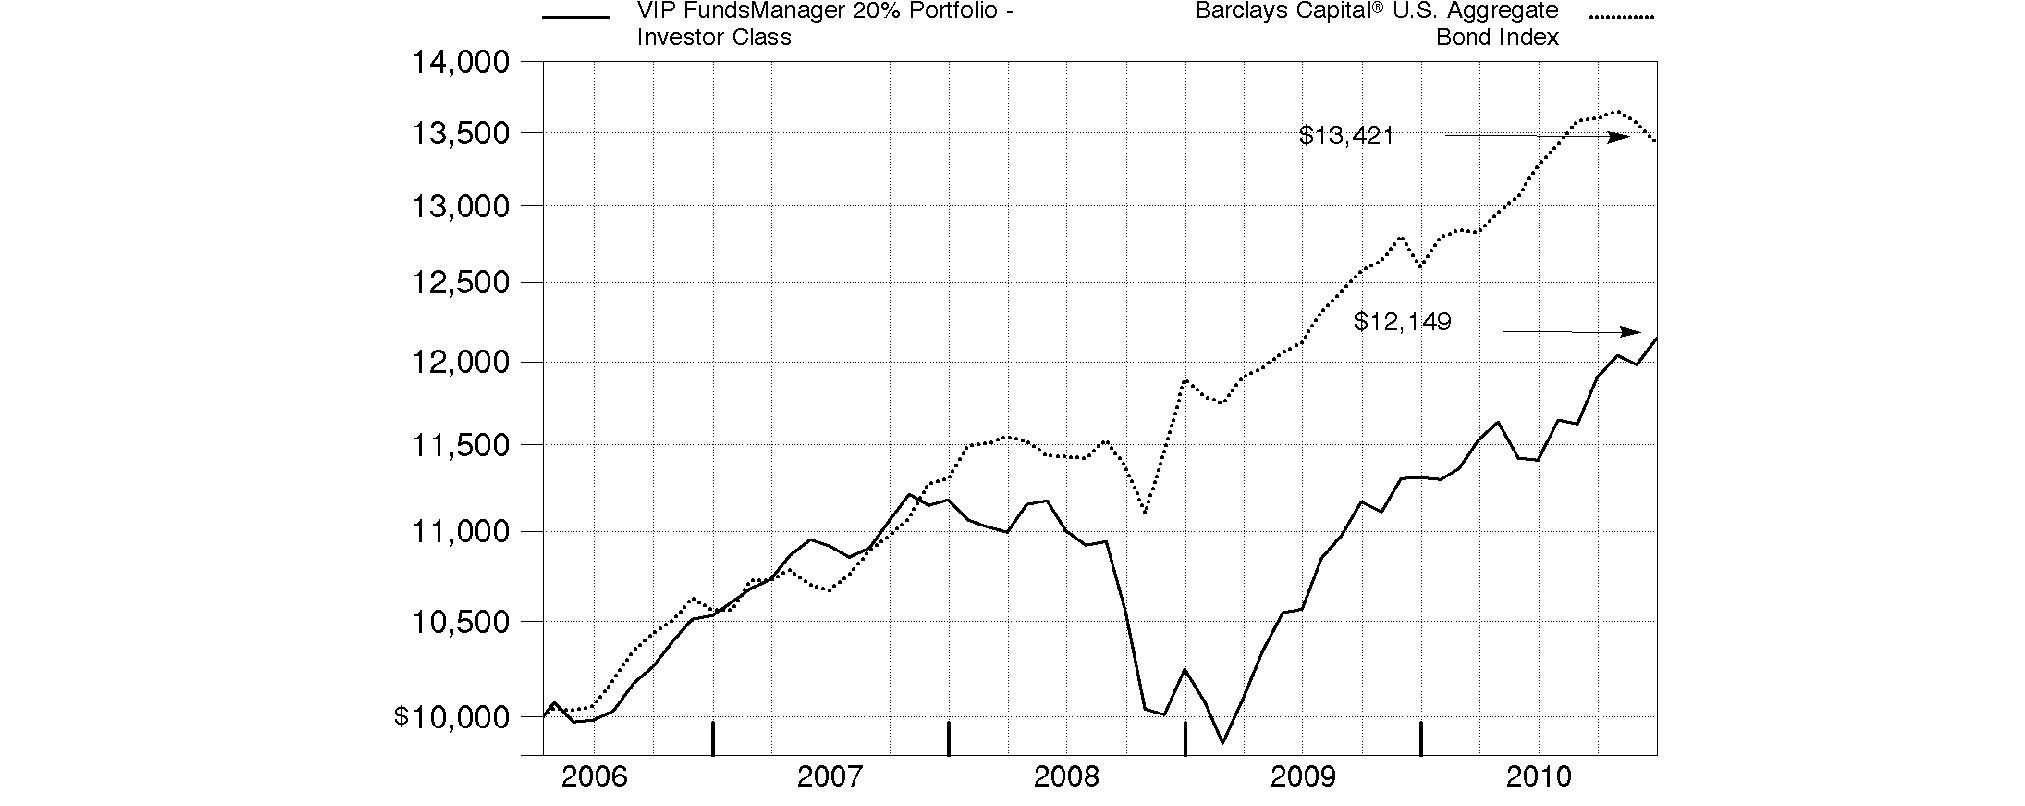
Annual Report
VIP FundsManager 50% Portfolio
Performance: The Bottom Line
Average annual total return reflects the change in the value of an investment, assuming reinvestment of the class' distributions from dividend income and capital gains (the profits earned upon the sale of securities that have grown in value, if any) and assuming a constant rate of performance each year. During periods of reimbursement by Fidelity, a fund's total return will be greater than it would be had the reimbursement not occurred. Performance numbers are net of all underlying fund operating expenses, but do not include any insurance charges imposed by your insurance company's separate account. If performance information included the effect of these additional charges, the total returns would have been lower. How a fund did yesterday is no guarantee of how it will do tomorrow.
Average Annual Total Returns
Periods ended December 31, 2010 | | Past 1
year | Life of fund A |
VIP FundsManager 50% Portfolio - Investor Class | | 11.89% | 3.63% |
VIP FundsManager 50% Portfolio - Service Class | | 11.89% | 3.63% |
VIP FundsManager 50% Portfolio - Service Class 2 | | 11.75% | 3.49% |
A From April 13, 2006.
$10,000 Over Life of Fund
Let's say hypothetically that $10,000 was invested in VIP FundsManager 50% Portfolio - Investor Class on April 13, 2006, when the fund started. The chart shows how the value of your investment would have changed, and also shows how the S&P 500® Index performed over the same period.
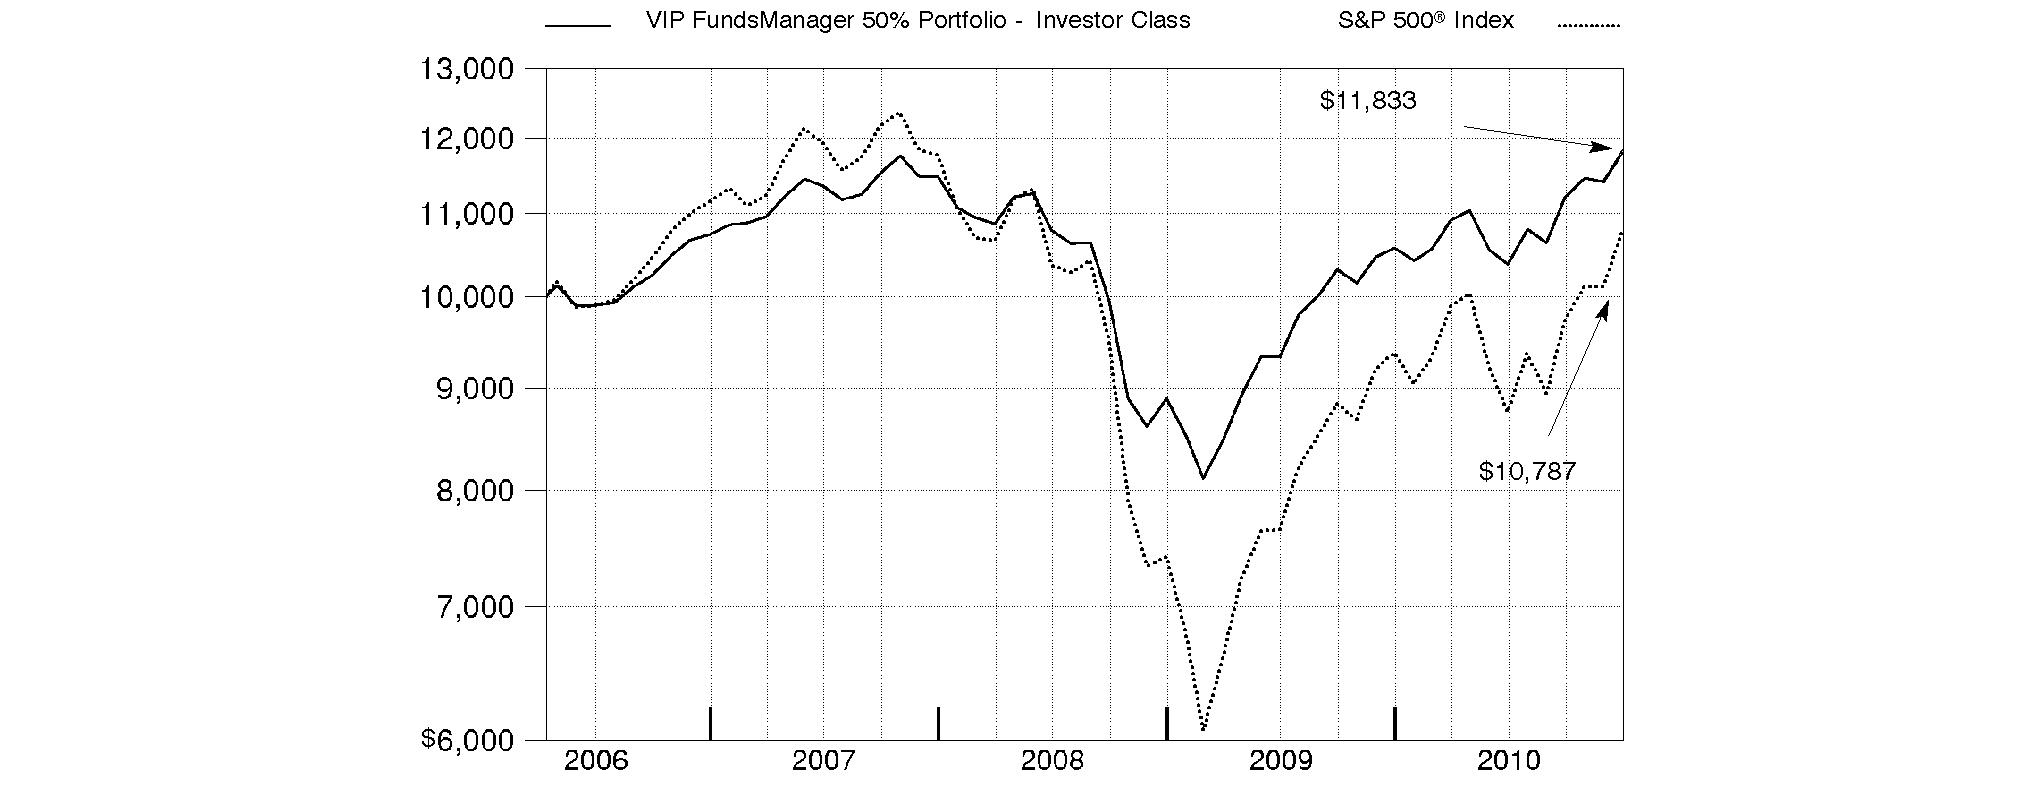
Annual Report
VIP FundsManager 60% Portfolio
Performance: The Bottom Line
Average annual total return reflects the change in the value of an investment, assuming reinvestment of the class' distributions from dividend income and capital gains (the profits earned upon the sale of securities that have grown in value, if any) and assuming a constant rate of performance each year. During periods of reimbursement by Fidelity, a fund's total return will be greater than it would be had the reimbursement not occurred. Performance numbers are net of all underlying fund operating expenses, but do not include any insurance charges imposed by your insurance company's separate account. If performance information included the effect of these additional charges, the total returns would have been lower. How a fund did yesterday is no guarantee of how it will do tomorrow.
Average Annual Total Returns
Periods ended December 31, 2010 | | Past 1
year | Life of fund A |
VIP FundsManager 60% Portfolio - Investor Class | | 13.62% | 1.70% |
VIP FundsManager 60% Portfolio - Service Class | | 13.49% | 1.70% |
VIP FundsManager 60% Portfolio - Service Class 2 | | 13.35% | 1.55% |
A From August 22, 2007.
$10,000 Over Life of Fund
Let's say hypothetically that $10,000 was invested in VIP FundsManager 60% Portfolio - Investor Class on August 22, 2007, when the fund started. The chart shows how the value of your investment would have changed, and also shows how the S&P 500 Index performed over the same period.
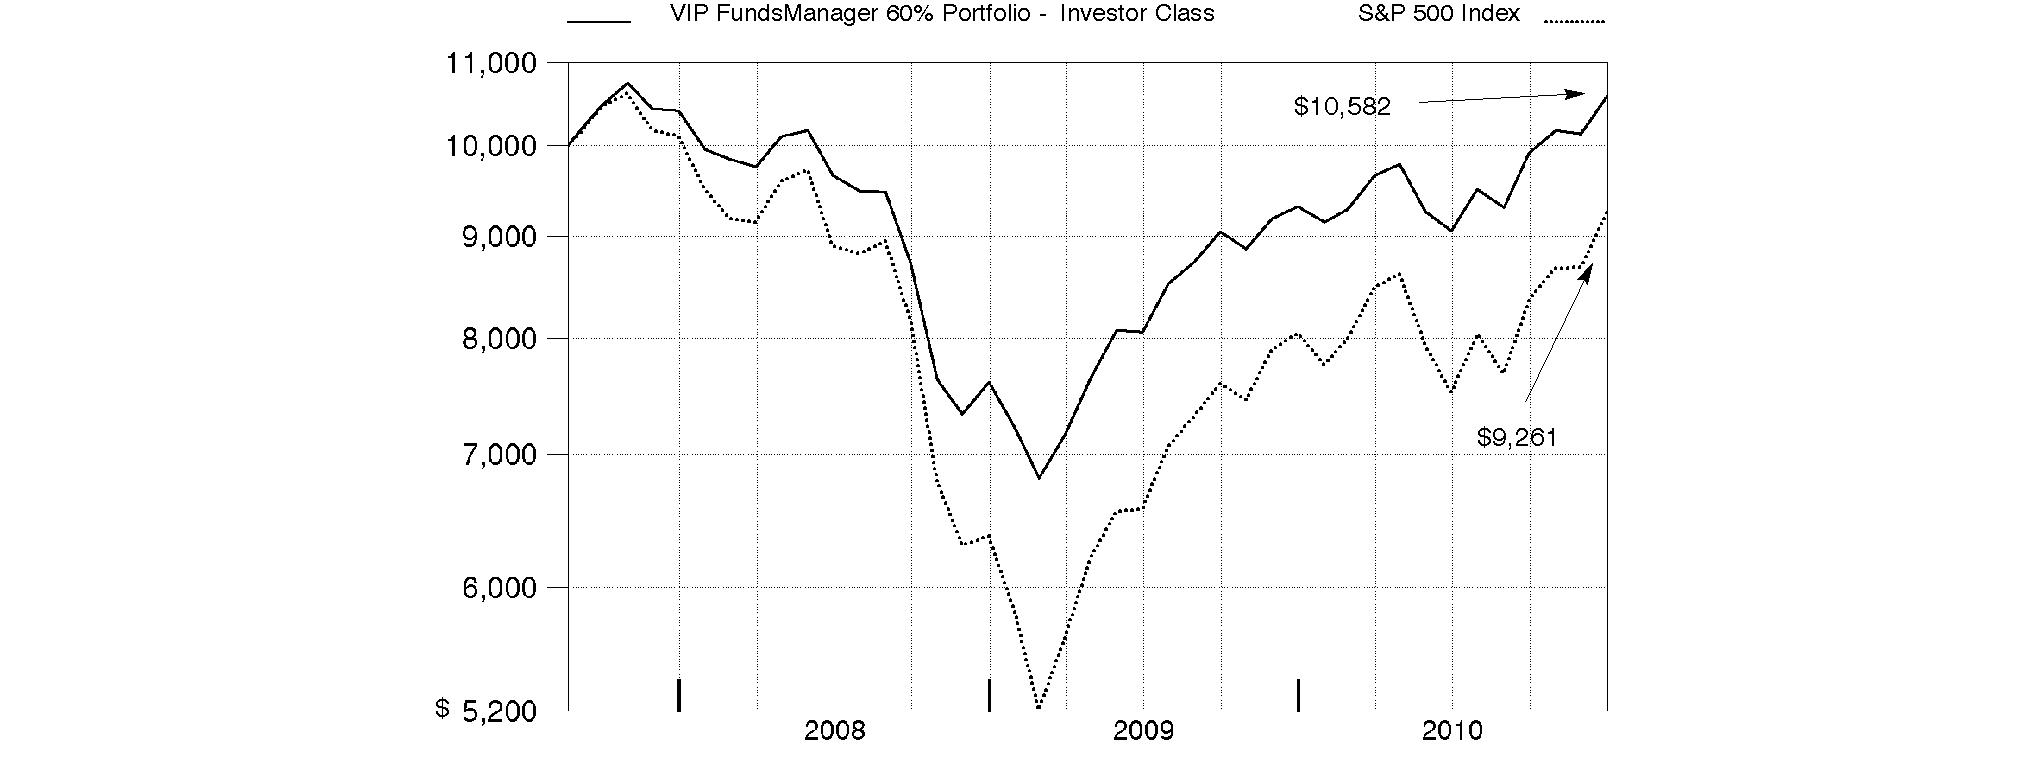
Annual Report
VIP FundsManager 70% Portfolio
Performance: The Bottom Line
Average annual total return reflects the change in the value of an investment, assuming reinvestment of the class' distributions from dividend income and capital gains (the profits earned upon the sale of securities that have grown in value, if any) and assuming a constant rate of performance each year. During periods of reimbursement by Fidelity, a fund's total return will be greater than it would be had the reimbursement not occurred. Performance numbers are net of all underlying fund operating expenses, but do not include any insurance charges imposed by your insurance company's separate account. If performance information included the effect of these additional charges, the total returns would have been lower. How a fund did yesterday is no guarantee of how it will do tomorrow.
Average Annual Total Returns
Periods ended December 31, 2010 | | Past 1
year | Life of fund A |
VIP FundsManager 70% Portfolio - Investor Class | | 14.32% | 2.65% |
VIP FundsManager 70% Portfolio - Service Class | | 14.32% | 2.65% |
VIP FundsManager 70% Portfolio - Service Class 2 | | 14.09% | 2.49% |
A From April 13, 2006.
$10,000 Over Life of Fund
Let's say hypothetically that $10,000 was invested in VIP FundsManager 70% Portfolio - Investor Class on April 13, 2006, when the fund started. The chart shows how the value of your investment would have changed, and also shows how the S&P 500 Index performed over the same period.
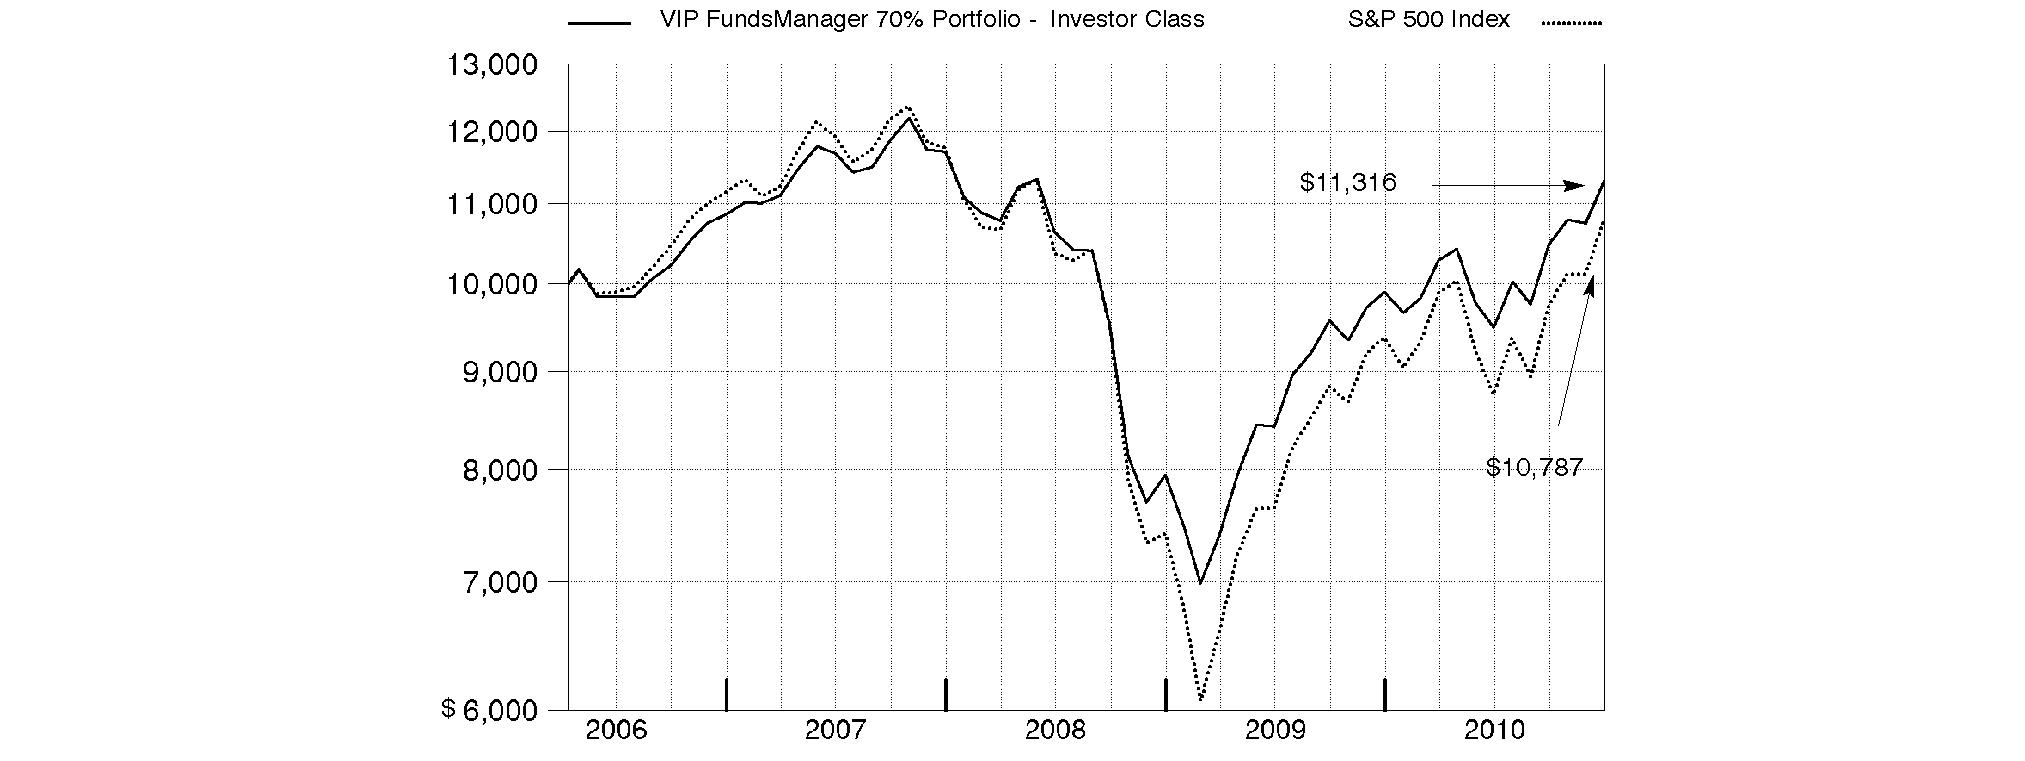
Annual Report
VIP FundsManager 85% Portfolio
Performance: The Bottom Line
Average annual total return reflects the change in the value of an investment, assuming reinvestment of the class' distributions from dividend income and capital gains (the profits earned upon the sale of securities that have grown in value, if any) and assuming a constant rate of performance each year. During periods of reimbursement by Fidelity, a fund's total return will be greater than it would be had the reimbursement not occurred. Performance numbers are net of all underlying fund operating expenses, but do not include any insurance charges imposed by your insurance company's separate account. If performance information included the effect of these additional charges, the total returns would have been lower. How a fund did yesterday is no guarantee of how it will do tomorrow.
Average Annual Total Returns
Periods ended December 31, 2010 | | Past 1
year | Life of fund A |
VIP FundsManager 85% Portfolio - Investor Class | | 16.20% | 1.92% |
VIP FundsManager 85% Portfolio - Service Class | | 16.07% | 1.90% |
VIP FundsManager 85% Portfolio - Service Class 2 | | 16.00% | 1.75% |
A From April 13, 2006.
$10,000 Over Life of Fund
Let's say hypothetically that $10,000 was invested in VIP FundsManager 85% Portfolio - Investor Class on April 13, 2006, when the fund started. The chart shows how the value of your investment would have changed, and also shows how the S&P 500 Index performed over the same period.
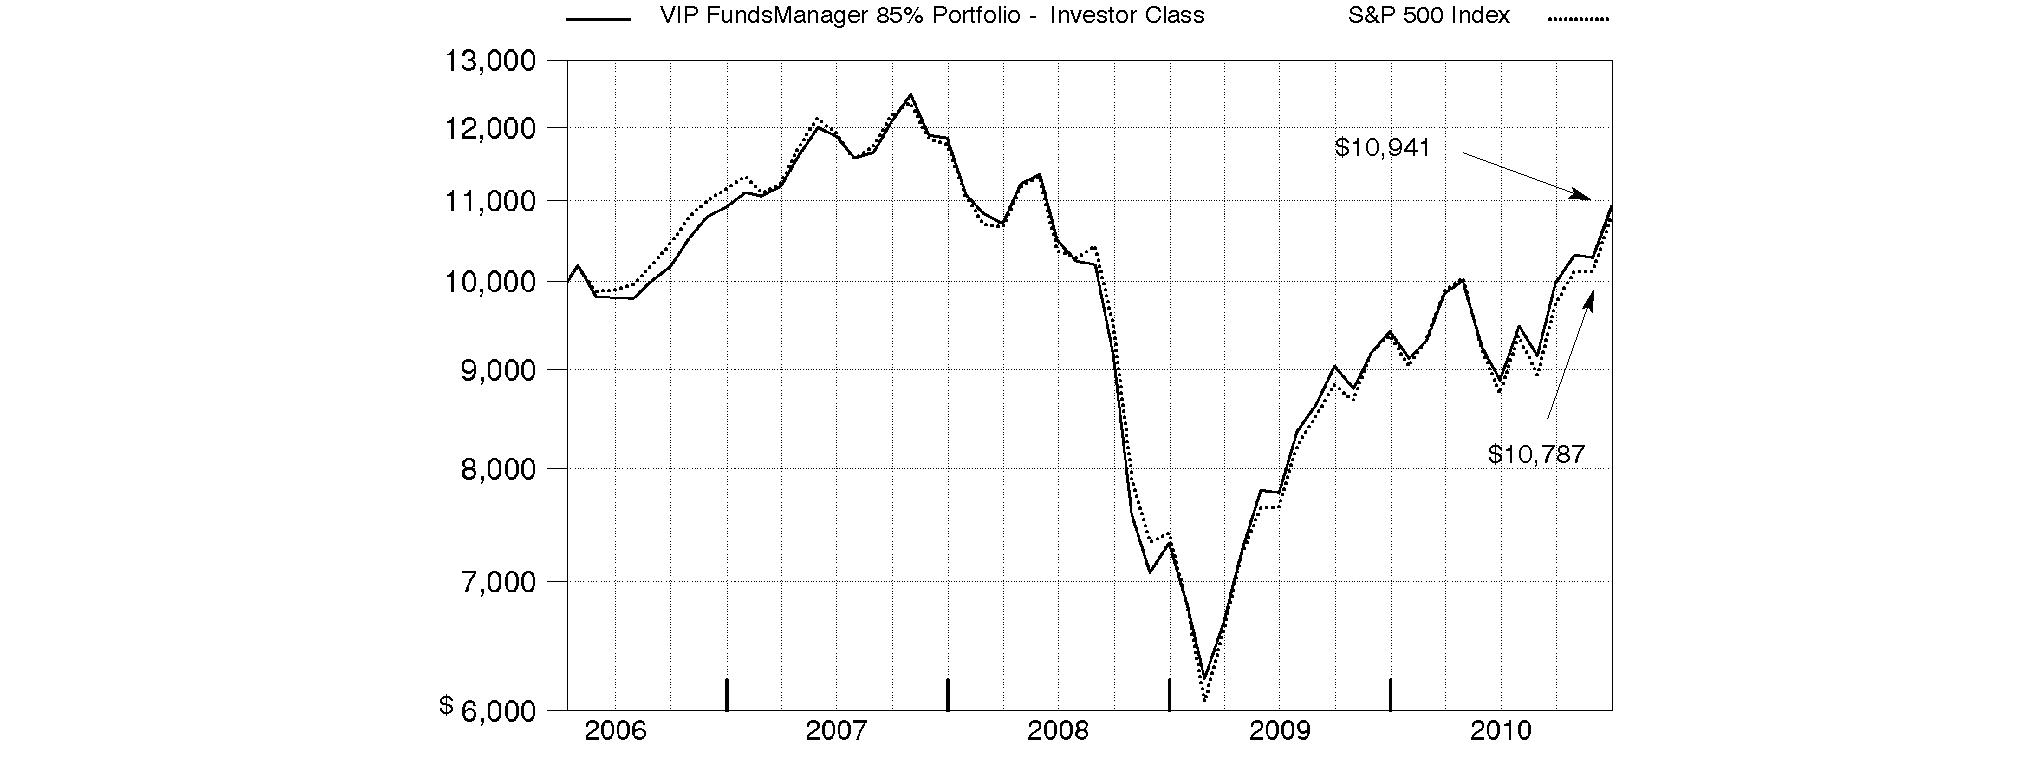
Annual Report
Market Recap: While market improvements around the world hit a speed bump in the first half of the 12-month period ending December 31, 2010, world economies re-accelerated in August, supported by a broadening recovery and low inflation in the U.S. Domestic stock markets recorded solid gains for the year, lifted by a strong second-half rally fueled by economic optimism, encouraging earnings reports and a wave of corporate mergers. The large-cap S&P 500® Index rose 15.06%, the blue-chip-laden Dow Jones Industrial AverageSM added 14.06% and the technology-heavy Nasdaq Composite® Index climbed 18.02%. Meanwhile, international stocks, as represented by the MSCI® ACWI® (All Country World Index) ex USA Index, gained 11.29%, boosted in part by a depreciating U.S. dollar. In the fixed-income arena, U.S. taxable investment-grade bonds generated positive results during 2010, as the Barclays Capital® U.S. Aggregate Bond Index gained 6.54%. With ultra-low interest rates bolstering nearly all fixed-income securities for most of the year, sectors in the index with higher yields and more credit risk generally fared best, while most high-quality bonds generated more-moderate returns. Meanwhile, high-yield bonds, as represented by The BofA Merrill LynchSM US High Yield Constrained Index, returned 15.07%, a result of improved economic data and strengthening investor demand. Overseas, foreign bond markets showed mixed results, with a sizable disparity between the 3.97% return of the Citigroup® Non-U.S. Group of 7 Index-which measures the performance of sovereign debt of the major global economies outside the U.S.-and the 12.04% advance of the JPMorgan Emerging Markets Bond Index Global (EMBI Global), which benefited from the rising overall credit quality of emerging-markets debt issuers.
Comments from Xuehai En, Portfolio Manager of VIP FundsManager® Portfolios: For the year ending December 31, 2010, all of the VIP FundsManager® Portfolios beat their Composite benchmarks. (For specific portfolio results, please see the performance section of this report.) Favorable asset allocation boosted the performance of all of the Portfolios, as did strong domestic equity stock selection. Regarding asset allocation, shifting to a somewhat riskier-than-benchmark positioning during the second half of the year in a market environment that rewarded risk proved advantageous. Specifically, modestly overweighting domestic equities, holding out-of-benchmark stakes in gold, real estate and emerging-markets equities, and underweighting the more-defensive cash and investment-grade bond categories contributed significantly to most of the Portfolios. Exposure to high-yield bonds - also not in the index - helped performance in the 20% Portfolio but moderately detracted from results elsewhere. As for security selection, in addition to domestic equities, stock picks in foreign developed markets aided results in the 85% and 60% Portfolios. Many of the top-contributing underlying funds were sector/industry funds focused on economically sensitive or commodities-oriented groups, including several Fidelity® Select Portfolios®: Industrials Portfolio, Technology Portfolio, Consumer Discretionary Portfolio, Transportation Portfolio, Energy Service Portfolio and Gold Portfolio. Fidelity® Real Estate Investment Portfolio added value as well. Among international holdings, Fidelity Emerging Markets Fund was a leading contributor across all of the Portfolios. Two small-cap funds - Fidelity International Small Cap Opportunities Fund and Fidelity International Small Cap Fund - together provided a meaningful boost to results. On the downside, our position in high-yield bonds dampened results in all except the 20% Portfolio, primarily due to the underperformance of Fidelity Floating Rate High Income Fund and Fidelity Focused High Income Fund. Fidelity Floating Rate High Income Fund invests in floating-rate bank loans - an asset class that typically underperforms traditional high-yield bonds during strong periods for the latter. Fidelity Focused High Income Fund underperformed because of its higher-quality bias during a period when lower-quality high-yield bonds generated the biggest gains. Sector/industry funds that were among the biggest detractors included three Select Portfolios: Financial Services Portfolio, Energy Portfolio and Consumer Staples Portfolio. In the case of Energy Portfolio, although the energy sector was one of the best-performing groups during the year, this fund underperformed primarily because of poor stock picking in the oil/gas exploration and production group. Financial Services Portfolio trailed its index mainly as a result of adverse positioning in regional banks and investment banking/brokerage. Exposure to emerging-markets bonds via Fidelity New Markets Income Fund notably detracted from performance in the 60% Portfolio. Lastly, Fidelity International Discovery Fund was a noticeable detractor in the 85% Portfolio, and Fidelity U.S. Bond Index Fund modestly hampered the relative return of the 20% Portfolio.
The views expressed above reflect those of the portfolio manager(s) only through the end of the period as stated on the cover of this report and do not necessarily represent the views of Fidelity or any other person in the Fidelity organization. Any such views are subject to change at any time based upon market or other conditions and Fidelity disclaims any responsibility to update such views. These views may not be relied on as investment advice and, because investment decisions for a Fidelity fund are based on numerous factors, may not be relied on as an indication of trading intent on behalf of any Fidelity fund.
Annual Report
As a shareholder of a Fund, you incur two types of costs: (1) transaction costs, and (2) ongoing costs, including distribution and/or service (12b-1) fees and other Fund expenses. This Example is intended to help you understand your ongoing costs (in dollars) of investing in the Funds and to compare these costs with the ongoing costs of investing in other mutual funds.
The Example is based on an investment of $1,000 invested at the beginning of the period and held for the entire period (July 1, 2010 to December 31, 2010).
Actual Expenses
The first line of the accompanying table for each class of each fund provides information about actual account values and actual expenses. You may use the information in this line, together with the amount you invested, to estimate the expenses that you paid over the period. Simply divide your account value by $1,000.00 (for example, an $8,600 account value divided by $1,000.00 = 8.6), then multiply the result by the number in the first line for a class of the fund under the heading entitled "Expenses Paid During Period" to estimate the expenses you paid on your account during this period. The estimate of expenses does not include any fees or other expenses of any variable annuity or variable life insurance product. If they were, the estimate of expenses you paid during the period would be higher, and your ending account value would be lower. In addition, each Fund, as a shareholder in underlying Fidelity Funds, will indirectly bear its pro-rata share of the fees and expenses incurred by the underlying Fidelity Funds. These fees and expenses are not included in each Fund's annualized expense ratio used to calculate the expense estimates in the table below.
Hypothetical Example for Comparison Purposes
The second line of the accompanying table for each class of each fund provides information about hypothetical account values and hypothetical expenses based on a Class' actual expense ratio and an assumed rate of return of 5% per year before expenses, which is not the Class' actual return. The hypothetical account values and expenses may not be used to estimate the actual ending account balance or expenses you paid for the period. You may use this information to compare the ongoing costs of investing in the Fund and other funds. To do so, compare this 5% hypothetical example with the 5% hypothetical examples that appear in the shareholder reports of the other funds. The estimate of expenses does not include any fees or other expenses of any variable annuity or variable life insurance product. If they were, the estimate of expenses you paid during the period would be higher, and your ending account value would be lower. In addition, each Fund, as a shareholder in underlying Fidelity Funds, will indirectly bear its pro-rata share of the fees and expenses incurred by the underlying Fidelity Funds. These fees and expenses are not included in each Fund's annualized expense ratio used to calculate the expense estimates in the table below.
Please note that the expenses shown in the table are meant to highlight your ongoing costs only and do not reflect any transaction costs. Therefore, the second line of the table is useful in comparing ongoing costs only, and will not help you determine the relative total costs of owning different funds.
| Annualized
Expense Ratio | Beginning
Account Value
July 1, 2010 | Ending
Account Value
December 31, 2010 | Expenses Paid
During Period*
July 1, 2010
to December 31, 2010 |
VIP FundsManager 20% Portfolio | | | | |
Service Class | .20% | | | |
Actual | | $ 1,000.00 | $ 1,064.10 | $ 1.04 |
HypotheticalA | | $ 1,000.00 | $ 1,024.20 | $ 1.02 |
Service Class 2 | .35% | | | |
Actual | | $ 1,000.00 | $ 1,063.90 | $ 1.82 |
HypotheticalA | | $ 1,000.00 | $ 1,023.44 | $ 1.79 |
Investor Class | .20% | | | |
Actual | | $ 1,000.00 | $ 1,065.20 | $ 1.04 |
HypotheticalA | | $ 1,000.00 | $ 1,024.20 | $ 1.02 |
VIP FundsManager 50% Portfolio | | | | |
Service Class | .20% | | | |
Actual | | $ 1,000.00 | $ 1,140.20 | $ 1.08 |
HypotheticalA | | $ 1,000.00 | $ 1,024.20 | $ 1.02 |
Service Class 2 | .35% | | | |
Actual | | $ 1,000.00 | $ 1,140.10 | $ 1.89 |
HypotheticalA | | $ 1,000.00 | $ 1,023.44 | $ 1.79 |
Investor Class | .20% | | | |
Actual | | $ 1,000.00 | $ 1,140.20 | $ 1.08 |
HypotheticalA | | $ 1,000.00 | $ 1,024.20 | $ 1.02 |
| Annualized
Expense Ratio | Beginning
Account Value
July 1, 2010 | Ending
Account Value
December 31, 2010 | Expenses Paid
During Period*
July 1, 2010
to December 31, 2010 |
VIP FundsManager 60% Portfolio | | | | |
Service Class | .20% | | | |
Actual | | $ 1,000.00 | $ 1,168.00 | $ 1.09 |
HypotheticalA | | $ 1,000.00 | $ 1,024.20 | $ 1.02 |
Service Class 2 | .35% | | | |
Actual | | $ 1,000.00 | $ 1,166.60 | $ 1.91 |
HypotheticalA | | $ 1,000.00 | $ 1,023.44 | $ 1.79 |
Investor Class | .20% | | | |
Actual | | $ 1,000.00 | $ 1,168.00 | $ 1.09 |
HypotheticalA | | $ 1,000.00 | $ 1,024.20 | $ 1.02 |
VIP FundsManager 70% Portfolio | | | | |
Service Class | .20% | | | |
Actual | | $ 1,000.00 | $ 1,191.40 | $ 1.10 |
HypotheticalA | | $ 1,000.00 | $ 1,024.20 | $ 1.02 |
Service Class 2 | .35% | | | |
Actual | | $ 1,000.00 | $ 1,190.40 | $ 1.93 |
HypotheticalA | | $ 1,000.00 | $ 1,023.44 | $ 1.79 |
Investor Class | .20% | | | |
Actual | | $ 1,000.00 | $ 1,192.80 | $ 1.11 |
HypotheticalA | | $ 1,000.00 | $ 1,024.20 | $ 1.02 |
VIP FundsManager 85% Portfolio | | | | |
Service Class | .20% | | | |
Actual | | $ 1,000.00 | $ 1,230.60 | $ 1.12 |
HypotheticalA | | $ 1,000.00 | $ 1,024.20 | $ 1.02 |
Service Class 2 | .35% | | | |
Actual | | $ 1,000.00 | $ 1,230.00 | $ 1.97 |
HypotheticalA | | $ 1,000.00 | $ 1,023.44 | $ 1.79 |
Investor Class | .20% | | | |
Actual | | $ 1,000.00 | $ 1,230.30 | $ 1.12 |
HypotheticalA | | $ 1,000.00 | $ 1,024.20 | $ 1.02 |
A 5% return per year before expenses
* Expenses are equal to each Class' annualized expense ratio, multiplied by the average account value over the period, multiplied by 184/ 365 (to reflect the one-half year period). The fees and expenses of the underlying Fidelity Funds in which the Fund invests are not included in each class' annualized expense ratio.
Annual Report
VIP FundsManager 20% Portfolio
Investment Changes (Unaudited)
Fund Holdings as of December 31, 2010 |
| % of fund's
net assets | % of fund's net assets
6 months ago |
Domestic Equity Funds | | |
Fidelity 130/30 Large Cap Fund | 0.0 * | 0.0 * |
Fidelity Air Transportation Portfolio | 0.1 | 0.1 |
Fidelity Automotive Portfolio | 0.1 | 0.0 * |
Fidelity Banking Portfolio | 0.6 | 0.4 |
Fidelity Biotechnology Portfolio | 0.0 * | 0.0 * |
Fidelity Blue Chip Growth Fund | 0.1 | 0.1 |
Fidelity Brokerage & Investment Management Portfolio | 0.2 | 0.2 |
Fidelity Chemicals Portfolio | 0.2 | 0.1 |
Fidelity Commodity Strategy Fund | 0.0 * | 0.0 |
Fidelity Communications Equipment Portfolio | 0.2 | 0.1 |
Fidelity Computers Portfolio | 0.5 | 0.5 |
Fidelity Construction & Housing Portfolio | 0.2 | 0.2 |
Fidelity Consumer Discretionary Portfolio | 1.1 | 0.8 |
Fidelity Consumer Staples Portfolio | 1.2 | 1.5 |
Fidelity Contrafund | 0.1 | 0.0 * |
Fidelity Defense & Aerospace Portfolio | 0.0 * | 0.0* |
Fidelity Disciplined Equity Fund | 0.0 * | 0.0* |
Fidelity Dividend Growth Fund | 0.6 | 0.7 |
Fidelity Electronics Portfolio | 0.1 | 0.1 |
Fidelity Energy Portfolio | 0.9 | 1.1 |
Fidelity Energy Service Portfolio | 1.1 | 0.1 |
Fidelity Environmental & Alternative Energy Portfolio | 0.0 * | 0.1 |
Fidelity Equity-Income Fund | 0.0 * | 0.0 * |
Fidelity Equity-Income II Fund | 0.0 * | 0.0 * |
Fidelity Financial Services Portfolio | 0.2 | 0.8 |
Fidelity Fund | 0.0 * | 0.0 * |
Fidelity Global Commodity Stock Fund | 0.0 * | 0.0 |
Fidelity Gold Portfolio | 1.0 | 0.7 |
Fidelity Growth Company Fund | 0.0 * | 0.0 * |
Fidelity Health Care Portfolio | 0.3 | 0.3 |
Fidelity Independence Fund | 0.0 * | 0.0 * |
Fidelity Industrial Equipment Portfolio | 0.2 | 0.1 |
Fidelity Industrials Portfolio | 1.2 | 1.1 |
Fidelity Insurance Portfolio | 0.8 | 0.6 |
Fidelity IT Services Portfolio | 0.1 | 0.1 |
|
| % of fund's
net assets | % of fund's net assets
6 months ago |
Fidelity Large Cap Stock Fund | 0.4 | 0.4 |
Fidelity Large Cap Value Fund | 0.0 * | 0.0 * |
Fidelity Leisure Portfolio | 0.1 | 0.0 * |
Fidelity Leveraged Company Stock Fund | 0.0 * | 0.0 * |
Fidelity Magellan Fund | 0.0 * | 0.0 * |
Fidelity Materials Portfolio | 0.2 | 0.2 |
Fidelity Medical Delivery Portfolio | 0.4 | 0.4 |
Fidelity Medical Equipment & Systems Portfolio | 0.1 | 0.1 |
Fidelity Mega Cap Stock Fund | 0.3 | 0.3 |
Fidelity Mid-Cap Stock Fund | 0.0 * | 0.0 * |
Fidelity Multimedia Portfolio | 0.2 | 0.1 |
Fidelity Natural Resources Portfolio | 0.0 * | 0.0 * |
Fidelity Pharmaceuticals Portfolio | 1.0 | 0.8 |
Fidelity Real Estate Investment Portfolio | 0.3 | 0.3 |
Fidelity Retailing Portfolio | 0.2 | 0.2 |
Fidelity Series Commodity Strategy Fund | 0.0 | 0.0 * |
Fidelity Small Cap Growth Fund | 0.0 * | 0.0 * |
Fidelity Small Cap Stock Fund | 0.0 * | 0.0 * |
Fidelity Small Cap Value Fund | 0.4 | 0.4 |
Fidelity Software & Computer Services Portfolio | 0.4 | 0.4 |
Fidelity Technology Portfolio | 1.8 | 1.2 |
Fidelity Telecom and Utilities Fund | 0.2 | 0.2 |
Fidelity Telecommunications Portfolio | 0.4 | 0.3 |
Fidelity Transportation Portfolio | 0.2 | 0.1 |
Fidelity Utilities Portfolio | 0.2 | 0.4 |
Spartan Extended Market Index Fund Investor Class | 0.1 | 0.1 |
Spartan Total Market Index Fund Investor Class | 0.0 * | 0.0 * |
VIP Mid Cap Portfolio Investor Class | 0.0 * | 0.0 * |
| 18.0 | 15.7 |
International Equity Funds | | |
Fidelity Canada Fund | 0.1 | 0.1 |
Fidelity Diversified International Fund | 0.2 | 0.2 |
Fidelity Emerging Asia Fund | 0.0 * | 0.0 |
Fidelity Emerging Markets Fund | 1.2 | 0.5 |
Fidelity International Capital Appreciation Fund | 0.3 | 0.3 |
Fidelity International Discovery Fund | 1.1 | 0.3 |
Fund Holdings as of December 31, 2010 - continued |
| % of fund's
net assets | % of fund's net assets
6 months ago |
Fidelity International Real Estate Fund | 0.5 | 0.0 |
Fidelity International Small Cap Fund | 0.2 | 0.2 |
Fidelity International Small Cap Opportunities Fund | 0.7 | 0.6 |
Fidelity International Value Fund | 0.4 | 0.0 * |
Fidelity Japan Fund | 0.1 | 0.4 |
Fidelity Japan Smaller Companies Fund | 0.0 * | 0.0 |
Fidelity Nordic Fund | 0.7 | 0.1 |
Fidelity Overseas Fund | 0.0 * | 0.0 * |
Fidelity Pacific Basin Fund | 0.2 | 0.1 |
Spartan International Index Fund Investor Class | 1.8 | 1.7 |
| 7.5 | 4.5 |
Fixed-Income Funds | | |
Fidelity Floating Rate High Income Fund | 3.2 | 1.5 |
Fidelity Focused High Income Fund | 0.3 | 0.0 |
Fidelity High Income Fund | 2.9 | 3.0 |
Fidelity New Markets Income Fund | 1.1 | 0.4 |
Fidelity Real Estate Income Fund | 0.6 | 0.6 |
Fidelity U.S. Bond Index Fund | 45.0 | 47.8 |
| 53.1 | 53.3 |
Money Market Funds | | |
Fidelity Institutional Money Market Portfolio Class I | 3.4 | 4.1 |
Fidelity Institutional Prime Money Market Portfolio Class I | 16.2 | 20.2 |
Fidelity Select Money Market Portfolio | 1.8 | 2.2 |
| 21.4 | 26.5 |
Net Other Assets (Liabilities)* | 0.0 | 0.0 |
| 100.0 | 100.0 |
* Amount represents less than 0.1%
Asset Allocation (% of fund's net assets) |
As of December 31, 2010 |
| Domestic Equity Funds | 18.0% | |
 | International Equity Funds | 7.5% | |
| Fixed Income Funds | 53.1% | |
| Money Market Funds | 21.4% | |

As of June 30, 2010 |
| Domestic Equity Funds | 15.7% | |
| International Equity Funds | 4.5% | |
| Fixed Income Funds | 53.3% | |
| Money Market Funds | 26.5% | |

Annual Report
VIP FundsManager 20% Portfolio
Investments December 31, 2010
Showing Percentage of Net Assets
Equity Funds - 25.5% |
| Shares | | Value |
Domestic Equity Funds - 18.0% |
Fidelity 130/30 Large Cap Fund | 2,952 | | $ 21,370 |
Fidelity Air Transportation Portfolio | 6,468 | | 273,905 |
Fidelity Automotive Portfolio | 6,494 | | 293,473 |
Fidelity Banking Portfolio | 134,924 | | 2,497,436 |
Fidelity Biotechnology Portfolio (a) | 1,153 | | 84,152 |
Fidelity Blue Chip Growth Fund | 8,970 | | 406,812 |
Fidelity Brokerage & Investment Management Portfolio | 13,913 | | 729,741 |
Fidelity Chemicals Portfolio | 6,374 | | 608,671 |
Fidelity Commodity Strategy Fund (a) | 958 | | 11,352 |
Fidelity Communications Equipment Portfolio | 27,799 | | 736,953 |
Fidelity Computers Portfolio (a) | 37,237 | | 2,100,884 |
Fidelity Construction & Housing Portfolio | 17,837 | | 625,381 |
Fidelity Consumer Discretionary Portfolio | 168,173 | | 4,121,912 |
Fidelity Consumer Staples Portfolio | 69,576 | | 4,755,553 |
Fidelity Contrafund | 3,257 | | 220,573 |
Fidelity Defense & Aerospace Portfolio | 1,190 | | 87,126 |
Fidelity Disciplined Equity Fund | 2,042 | | 46,006 |
Fidelity Dividend Growth Fund | 76,576 | | 2,177,042 |
Fidelity Electronics Portfolio | 6,804 | | 329,101 |
Fidelity Energy Portfolio | 69,361 | | 3,626,168 |
Fidelity Energy Service Portfolio | 57,979 | | 4,311,935 |
Fidelity Environmental & Alternative Energy Portfolio | 10,768 | | 191,662 |
Fidelity Equity-Income Fund | 665 | | 29,420 |
Fidelity Equity-Income II Fund | 680 | | 12,402 |
Fidelity Financial Services Portfolio | 13,181 | | 811,807 |
Fidelity Fund | 640 | | 20,592 |
Fidelity Global Commodity Stock Fund | 3,323 | | 56,953 |
Fidelity Gold Portfolio | 71,114 | | 3,776,880 |
Fidelity Growth Company Fund | 1,100 | | 91,482 |
Fidelity Health Care Portfolio | 9,385 | | 1,169,466 |
Fidelity Independence Fund | 309 | | 7,533 |
Fidelity Industrial Equipment Portfolio | 24,293 | | 824,014 |
Fidelity Industrials Portfolio | 194,839 | | 4,609,900 |
Fidelity Insurance Portfolio | 66,058 | | 3,116,614 |
Fidelity IT Services Portfolio (a) | 27,264 | | 575,811 |
Fidelity Large Cap Stock Fund | 79,734 | | 1,404,124 |
Fidelity Large Cap Value Fund | 9,788 | | 102,966 |
Fidelity Leisure Portfolio | 2,789 | | 254,239 |
Fidelity Leveraged Company Stock Fund | 193 | | 5,477 |
Fidelity Magellan Fund | 375 | | 26,856 |
Fidelity Materials Portfolio | 14,393 | | 977,256 |
Fidelity Medical Delivery Portfolio (a) | 31,868 | | 1,583,214 |
Fidelity Medical Equipment & Systems Portfolio (a) | 13,553 | | 373,780 |
Fidelity Mega Cap Stock Fund | 105,585 | | 1,054,790 |
Fidelity Mid-Cap Stock Fund | 1,938 | | 55,922 |
Fidelity Multimedia Portfolio | 18,211 | | 779,792 |
Fidelity Natural Resources Portfolio | 3,129 | | 108,924 |
|
| Shares | | Value |
Fidelity Pharmaceuticals Portfolio | 316,487 | | $ 3,902,281 |
Fidelity Real Estate Investment Portfolio | 46,807 | | 1,202,461 |
Fidelity Retailing Portfolio | 12,864 | | 688,088 |
Fidelity Small Cap Growth Fund | 7,959 | | 124,875 |
Fidelity Small Cap Stock Fund (a) | 3,102 | | 60,799 |
Fidelity Small Cap Value Fund | 95,507 | | 1,490,867 |
Fidelity Software & Computer Services Portfolio | 18,957 | | 1,657,936 |
Fidelity Technology Portfolio (a) | 75,486 | | 7,217,242 |
Fidelity Telecom and Utilities Fund | 38,558 | | 615,005 |
Fidelity Telecommunications Portfolio | 35,653 | | 1,655,711 |
Fidelity Transportation Portfolio | 12,776 | | 708,063 |
Fidelity Utilities Portfolio | 12,652 | | 612,095 |
Spartan Extended Market Index Fund Investor Class | 6,033 | | 230,274 |
Spartan Total Market Index Fund Investor Class | 3,323 | | 121,074 |
VIP Mid Cap Portfolio Investor Class | 79 | | 2,578 |
TOTAL DOMESTIC EQUITY FUNDS | | 70,376,771 |
International Equity Funds - 7.5% |
Fidelity Canada Fund | 9,919 | | 576,771 |
Fidelity Diversified International Fund | 30,158 | | 909,265 |
Fidelity Emerging Asia Fund | 1,244 | | 38,078 |
Fidelity Emerging Markets Fund | 176,937 | | 4,662,302 |
Fidelity International Capital Appreciation Fund | 90,173 | | 1,162,333 |
Fidelity International Discovery Fund | 126,642 | | 4,184,262 |
Fidelity International Real Estate Fund | 195,822 | | 1,836,810 |
Fidelity International Small Cap Fund | 40,542 | | 861,929 |
Fidelity International Small Cap Opportunities Fund | 262,716 | | 2,729,618 |
Fidelity International Value Fund | 189,412 | | 1,541,817 |
Fidelity Japan Fund | 46,169 | | 516,166 |
Fidelity Japan Smaller Companies Fund | 8,244 | | 75,764 |
Fidelity Nordic Fund | 73,905 | | 2,537,900 |
Fidelity Overseas Fund | 423 | | 13,750 |
Fidelity Pacific Basin Fund | 34,529 | | 900,176 |
Spartan International Index Fund Investor Class | 200,396 | | 7,047,932 |
TOTAL INTERNATIONAL EQUITY FUNDS | | 29,594,873 |
TOTAL EQUITY FUNDS (Cost $81,343,197) | 99,971,644 |
Fixed-Income Funds - 53.1% |
| | | |
Fidelity Floating Rate High Income Fund | 1,275,000 | | 12,482,249 |
Fidelity Focused High Income Fund | 131,571 | | 1,211,771 |
Fidelity High Income Fund | 1,269,966 | | 11,353,492 |
Fidelity New Markets Income Fund | 270,865 | | 4,239,035 |
Fixed-Income Funds - continued |
| Shares | | Value |
Fidelity Real Estate Income Fund | 210,313 | | $ 2,187,256 |
Fidelity U.S. Bond Index Fund | 15,583,622 | | 176,562,442 |
TOTAL FIXED-INCOME FUNDS (Cost $200,843,821) | 208,036,245 |
Money Market Funds - 21.4% |
| | | |
Fidelity Institutional Money Market Portfolio Class I | 13,147,294 | | 13,147,294 |
Fidelity Institutional Prime Money Market Portfolio Class I | 63,529,449 | | 63,529,449 |
Fidelity Select Money Market Portfolio | 7,242,291 | | 7,242,291 |
TOTAL MONEY MARKET FUNDS (Cost $83,919,034) | 83,919,034 |
TOTAL INVESTMENT PORTFOLIO - 100.0% (Cost $366,106,052) | | 391,926,923 |
NET OTHER ASSETS (LIABILITIES) - 0.0% | | (64,067) |
NET ASSETS - 100% | $ 391,862,856 |
Legend |
(a) Non-income producing |
Other Information |
All investments are categorized as Level 1 under the Fair Value Hierarchy. The inputs or methodology used for valuing securities may not be an indication of the risk associated with investing in those securities. For more information on valuation inputs, please refer to the Security Valuation section in the accompanying Notes to Financial Statements. |
Income Tax Information |
At December 31, 2010, the Fund had a capital loss carryforward of approximately $11,488,547 of which $6,448,435 and $5,040,112 will expire in fiscal 2016 and 2017, respectively. Capital loss carryforwards are only available to offset future capital gains of the Fund to the extent provided by regulations and may be limited. |
See accompanying notes which are an integral part of the financial statements.
Annual Report
VIP FundsManager 20% Portfolio
Statement of Assets and Liabilities
| December 31, 2010 |
| | |
Assets | | |
Investment in securities, at value (cost $366,106,052) - See accompanying schedule | | $ 391,926,923 |
Receivable for fund shares sold | | 279,167 |
Total assets | | 392,206,090 |
| | |
Liabilities | | |
Payable for investments purchased | $ 278,757 | |
Payable for fund shares redeemed | 409 | |
Accrued management fee | 63,999 | |
Distribution and service plan fees payable | 69 | |
Total liabilities | | 343,234 |
| | |
Net Assets | | $ 391,862,856 |
Net Assets consist of: | | |
Paid in capital | | $ 377,810,809 |
Accumulated undistributed net realized gain (loss) on investments | | (11,768,824) |
Net unrealized appreciation (depreciation) on investments | | 25,820,871 |
Net Assets | | $ 391,862,856 |
Statement of Assets and Liabilities - continued
| December 31, 2010 |
| | |
| | |
Service Class:
Net Asset Value, offering price and redemption price per share ($67,476 ÷ 6,345 shares) | | $ 10.63 |
| | |
Service Class 2:
Net Asset Value, offering price and redemption price per share ($569,086 ÷ 53,583 shares) | | $ 10.62 |
| | |
Investor Class:
Net Asset Value, offering price and redemption price per share ($391,226,294 ÷ 36,814,893 shares) | | $ 10.63 |
See accompanying notes which are an integral part of the financial statements.
Annual Report
Statement of Operations
| Year ended December 31, 2010 |
| | |
Investment Income | | |
Income distributions from underlying funds | | $ 6,725,616 |
| | |
Expenses | | |
Management fee | $ 823,151 | |
Distribution and service plan fees | 1,189 | |
Independent trustees' compensation | 1,140 | |
Total expenses before reductions | 825,480 | |
Expense reductions | (165,684) | 659,796 |
Net investment income (loss) | | 6,065,820 |
Realized and Unrealized Gain (Loss) Realized gain (loss) on sale of underlying fund shares | 1,054,843 | |
Capital gain distributions from underlying funds | 1,812,776 | |
Total net realized gain (loss) | | 2,867,619 |
Change in net unrealized appreciation (depreciation) on underlying funds | | 15,177,948 |
Net gain (loss) | | 18,045,567 |
Net increase (decrease) in net assets resulting from operations | | $ 24,111,387 |
Statement of Changes in Net Assets
| Year ended December 31, 2010 | Year ended December 31, 2009 |
Increase (Decrease) in Net Assets | | |
Operations | | |
Net investment income (loss) | $ 6,065,820 | $ 4,232,847 |
Net realized gain (loss) | 2,867,619 | (3,236,878) |
Change in net unrealized appreciation (depreciation) | 15,177,948 | 18,437,148 |
Net increase (decrease) in net assets resulting from operations | 24,111,387 | 19,433,117 |
Distributions to shareholders from net investment income | (6,084,767) | (4,256,815) |
Distributions to shareholders from net realized gain | (470,898) | (158,646) |
Total distributions | (6,555,665) | (4,415,461) |
Share transactions - net increase (decrease) | 102,969,202 | 103,034,500 |
Total increase (decrease) in net assets | 120,524,924 | 118,052,156 |
| | |
Net Assets | | |
Beginning of period | 271,337,932 | 153,285,776 |
End of period | $ 391,862,856 | $ 271,337,932 |
See accompanying notes which are an integral part of the financial statements.
Annual Report
Financial Highlights - Service Class
Years ended December 31, | 2010 | 2009 | 2008 | 2007 | 2006 G |
Selected Per-Share Data | | | | | |
Net asset value, beginning of period | $ 10.07 | $ 9.27 | $ 10.48 | $ 10.34 | $ 10.00 |
Income from Investment Operations | | | | | |
Net investment income (loss) E | .19 | .21 | .34 | .45 | .33 |
Net realized and unrealized gain (loss) | .55 | .76 | (1.21) | .18 | .20 |
Total from investment operations | .74 | .97 | (.87) | .63 | .53 |
Distributions from net investment income | (.17) | (.16) | (.30) | (.29) | (.14) |
Distributions from net realized gain | (.01) | (.01) | (.04) | (.20) | (.05) |
Total distributions | (.18) | (.17) J | (.34) I | (.49) | (.19) |
Net asset value, end of period | $ 10.63 | $ 10.07 | $ 9.27 | $ 10.48 | $ 10.34 |
Total Return B, C, D | 7.36% | 10.43% | (8.33)% | 6.12% | 5.34% |
Ratios to Average Net Assets F, H | | | | | |
Expenses before reductions | .35% | .35% | .35% | .35% | .35% A |
Expenses net of fee waivers, if any | .20% | .20% | .20% | .20% | .20% A |
Expenses net of all reductions | .20% | .20% | .20% | .20% | .20% A |
Net investment income (loss) | 1.84% | 2.19% | 3.33% | 4.20% | 4.52% A |
Supplemental Data | | | | | |
Net assets, end of period (000 omitted) | $ 67 | $ 61 | $ 88 | $ 112 | $ 105 |
Portfolio turnover rate | 14% | 31% | 64% | 76% | 92% A |
A Annualized
B Total returns for periods of less than one year are not annualized.
C Total returns do not reflect charges attributable to your insurance company's separate account. Inclusion of these charges would reduce the total returns shown.
D Total returns would have been lower had certain expenses not been reduced during the periods shown.
E Calculated based on average shares outstanding during the period.
F Amounts do not include the activity of the underlying funds.
G For the period April 13, 2006 (commencement of operations) to December 31, 2006.
H Expense ratios reflect operating expenses of the class. Expenses before reductions do not reflect amounts reimbursed by the investment adviser or reductions from expense offset arrangements and do not represent the amount paid by the class during periods when reimbursements or reductions occur. Expenses net of fee waivers reflect expenses after reimbursement by the investment adviser but prior to reductions from expense offset arrangements. Expenses net of all reductions represent the net expenses paid by the class but do not include expenses of the investment companies in which the Fund invests.
I Total distributions of $.34 per share is comprised of distributions from net investment income of $.302 and distributions from net realized gain of $.035 per share.
J Total distributions of $.17 per share is comprised of distributions from net investment income of $.161 and distributions from net realized gain of $.006 per share.
Financial Highlights - Service Class 2
Years ended December 31, | 2010 | 2009 | 2008 | 2007 | 2006 G |
Selected Per-Share Data | | | | | |
Net asset value, beginning of period | $ 10.06 | $ 9.28 | $ 10.48 | $ 10.34 | $ 10.00 |
Income from Investment Operations | | | | | |
Net investment income (loss) E | .18 | .20 | .32 | .43 | .32 |
Net realized and unrealized gain (loss) | .55 | .74 | (1.20) | .18 | .20 |
Total from investment operations | .73 | .94 | (.88) | .61 | .52 |
Distributions from net investment income | (.16) | (.16) | (.29) | (.27) | (.13) |
Distributions from net realized gain | (.01) | (.01) | (.04) | (.20) | (.05) |
Total distributions | (.17) | (.16) J | (.32) I | (.47) | (.18) |
Net asset value, end of period | $ 10.62 | $ 10.06 | $ 9.28 | $ 10.48 | $ 10.34 |
Total Return B, C, D | 7.24% | 10.14% | (8.40)% | 5.96% | 5.23% |
Ratios to Average Net Assets F, H | | | | | |
Expenses before reductions | .50% | .50% | .50% | .50% | .50% A |
Expenses net of fee waivers, if any | .35% | .35% | .35% | .35% | .35% A |
Expenses net of all reductions | .35% | .35% | .35% | .35% | .35% A |
Net investment income (loss) | 1.69% | 2.04% | 3.18% | 4.05% | 4.38% A |
Supplemental Data | | | | | |
Net assets, end of period (000 omitted) | $ 569 | $ 425 | $ 88 | $ 112 | $ 105 |
Portfolio turnover rate | 14% | 31% | 64% | 76% | 92% A |
A Annualized
B Total returns for periods of less than one year are not annualized.
C Total returns do not reflect charges attributable to your insurance company's separate account. Inclusion of these charges would reduce the total returns shown.
D Total returns would have been lower had certain expenses not been reduced during the periods shown.
E Calculated based on average shares outstanding during the period.
F Amounts do not include the activity of the underlying funds.
G For the period April 13, 2006 (commencement of operations) to December 31, 2006.
H Expense ratios reflect operating expenses of the class. Expenses before reductions do not reflect amounts reimbursed by the investment adviser or reductions from expense offset arrangements and do not represent the amount paid by the class during periods when reimbursements or reductions occur. Expenses net of fee waivers reflect expenses after reimbursement by the investment adviser but prior to reductions from expense offset arrangements. Expenses net of all reductions represent the net expenses paid by the class but do not include expenses of the investment companies in which the Fund invests.
I Total distributions of $.32 per share is comprised of distributions from net investment income of $.285 and distributions from net realized gain of $.035 per share.
J Total distributions of $.16 per share is comprised of distributions from net investment income of $.155 and distributions from net realized gain of $.006 per share.
See accompanying notes which are an integral part of the financial statements.
Annual Report
Financial Highlights - Investor Class
Years ended December 31, | 2010 | 2009 | 2008 | 2007 | 2006 G |
Selected Per-Share Data | | | | | |
Net asset value, beginning of period | $ 10.06 | $ 9.27 | $ 10.48 | $ 10.34 | $ 10.00 |
Income from Investment Operations | | | | | |
Net investment income (loss) E | .19 | .21 | .33 | .45 | .33 |
Net realized and unrealized gain (loss) | .56 | .75 | (1.20) | .18 | .20 |
Total from investment operations | .75 | .96 | (.87) | .63 | .53 |
Distributions from net investment income | (.17) | (.16) | (.30) | (.29) | (.14) |
Distributions from net realized gain | (.01) | (.01) | (.04) | (.20) | (.05) |
Total distributions | (.18) | (.17) J | (.34) I | (.49) | (.19) |
Net asset value, end of period | $ 10.63 | $ 10.06 | $ 9.27 | $ 10.48 | $ 10.34 |
Total Return B, C, D | 7.47% | 10.32% | (8.33)% | 6.12% | 5.34% |
Ratios to Average Net Assets F, H | | | | | |
Expenses before reductions | .25% | .25% | .25% | .25% | .25% A |
Expenses net of fee waivers, if any | .20% | .20% | .20% | .20% | .20% A |
Expenses net of all reductions | .20% | .20% | .20% | .20% | .20% A |
Net investment income (loss) | 1.84% | 2.19% | 3.33% | 4.20% | 4.52% A |
Supplemental Data | | | | | |
Net assets, end of period (000 omitted) | $ 391,226 | $ 270,852 | $ 153,110 | $ 115,963 | $ 24,045 |
Portfolio turnover rate | 14% | 31% | 64% | 76% | 92% A |
A Annualized
B Total returns for periods of less than one year are not annualized.
C Total returns do not reflect charges attributable to your insurance company's separate account. Inclusion of these charges would reduce the total returns shown.
D Total returns would have been lower had certain expenses not been reduced during the periods shown.
E Calculated based on average shares outstanding during the period.
F Amounts do not include the activity of the underlying funds.
G For the period April 13, 2006 (commencement of operations) to December 31, 2006.
H Expense ratios reflect operating expenses of the class. Expenses before reductions do not reflect amounts reimbursed by the investment adviser or reductions from expense offset arrangements and do not represent the amount paid by the class during periods when reimbursements or reductions occur. Expenses net of fee waivers reflect expenses after reimbursement by the investment adviser but prior to reductions from expense offset arrangements. Expenses net of all reductions represent the net expenses paid by the class but do not include expenses of the investment companies in which the Fund invests.
I Total distributions of $.34 per share is comprised of distributions from net investment income of $.302 and distributions from net realized gain of $.035 per share.
J Total distributions of $.17 per share is comprised of distributions from net investment income of $.161 and distributions from net realized gain of $.006 per share.
See accompanying notes which are an integral part of the financial statements.
Annual Report
VIP FundsManager 50% Portfolio
Investment Changes (Unaudited)
Fund Holdings as of December 31, 2010 |
| % of fund's
net assets | % of fund's net assets
6 months ago |
Domestic Equity Funds | | |
Fidelity 130/30 Large Cap Fund | 0.0 * | 0.0 * |
Fidelity Air Transportation Portfolio | 0.2 | 0.2 |
Fidelity Automotive Portfolio | 0.1 | 0.0 * |
Fidelity Banking Portfolio | 1.3 | 1.0 |
Fidelity Biotechnology Portfolio | 0.4 | 0.4 |
Fidelity Blue Chip Growth Fund | 0.4 | 0.4 |
Fidelity Brokerage & Investment Management Portfolio | 0.5 | 0.5 |
Fidelity Chemicals Portfolio | 0.4 | 0.2 |
Fidelity Commodity Strategy Fund | 0.0 * | 0.0 |
Fidelity Communications Equipment Portfolio | 0.2 | 0.1 |
Fidelity Computers Portfolio | 0.8 | 0.8 |
Fidelity Construction & Housing Portfolio | 0.4 | 0.4 |
Fidelity Consumer Discretionary Portfolio | 1.1 | 0.5 |
Fidelity Consumer Staples Portfolio | 2.9 | 2.7 |
Fidelity Contrafund | 0.1 | 0.1 |
Fidelity Defense & Aerospace Portfolio | 0.1 | 0.1 |
Fidelity Disciplined Equity Fund | 0.0 * | 0.3 |
Fidelity Dividend Growth Fund | 1.7 | 1.4 |
Fidelity Electronics Portfolio | 0.2 | 0.2 |
Fidelity Energy Portfolio | 2.2 | 2.6 |
Fidelity Energy Service Portfolio | 1.4 | 0.1 |
Fidelity Environmental & Alternative Energy Portfolio | 0.2 | 0.2 |
Fidelity Equity-Income Fund | 0.1 | 0.5 |
Fidelity Equity-Income II Fund | 0.0 * | 0.0 * |
Fidelity Financial Services Portfolio | 1.4 | 1.5 |
Fidelity Fund | 0.1 | 0.1 |
Fidelity Global Commodity Stock Fund | 0.0 * | 0.0 |
Fidelity Gold Portfolio | 1.2 | 1.2 |
Fidelity Growth Company Fund | 0.9 | 0.8 |
Fidelity Health Care Portfolio | 0.6 | 0.4 |
Fidelity Independence Fund | 0.0 * | 0.0 * |
Fidelity Industrial Equipment Portfolio | 0.8 | 0.3 |
Fidelity Industrials Portfolio | 1.7 | 1.6 |
Fidelity Insurance Portfolio | 1.1 | 0.9 |
Fidelity IT Services Portfolio | 0.3 | 0.3 |
Fidelity Large Cap Stock Fund | 0.8 | 1.4 |
Fidelity Large Cap Value Fund | 0.1 | 0.2 |
Fidelity Leisure Portfolio | 0.8 | 0.5 |
|
| % of fund's
net assets | % of fund's net assets
6 months ago |
Fidelity Leveraged Company Stock Fund | 0.0 * | 0.0 * |
Fidelity Magellan Fund | 0.0 * | 0.0 * |
Fidelity Materials Portfolio | 0.3 | 0.2 |
Fidelity Medical Delivery Portfolio | 1.0 | 1.0 |
Fidelity Medical Equipment & Systems Portfolio | 0.1 | 0.6 |
Fidelity Mega Cap Stock Fund | 0.4 | 0.8 |
Fidelity Mid Cap Value Fund | 0.4 | 0.3 |
Fidelity Mid-Cap Stock Fund | 0.0 * | 0.0 * |
Fidelity Multimedia Portfolio | 0.4 | 0.4 |
Fidelity Nasdaq Composite Index Fund | 0.1 | 0.1 |
Fidelity Natural Resources Portfolio | 0.1 | 0.1 |
Fidelity Pharmaceuticals Portfolio | 1.4 | 1.2 |
Fidelity Real Estate Investment Portfolio | 0.6 | 0.6 |
Fidelity Retailing Portfolio | 0.5 | 0.5 |
Fidelity Series Commodity Strategy Fund | 0.0 | 0.0 * |
Fidelity Small Cap Growth Fund | 0.2 | 0.2 |
Fidelity Small Cap Stock Fund | 0.0 * | 0.0 * |
Fidelity Small Cap Value Fund | 0.0 * | 0.0 * |
Fidelity Software & Computer Services Portfolio | 0.5 | 1.1 |
Fidelity Technology Portfolio | 3.3 | 1.9 |
Fidelity Telecom and Utilities Fund | 0.8 | 0.8 |
Fidelity Telecommunications Portfolio | 0.9 | 0.7 |
Fidelity Transportation Portfolio | 0.5 | 0.2 |
Fidelity Utilities Portfolio | 0.6 | 0.5 |
Spartan 500 Index Fund Investor Class | 0.1 | 0.1 |
Spartan Extended Market Index Fund Investor Class | 1.5 | 1.4 |
Spartan Total Market Index Fund Investor Class | 1.5 | 1.6 |
VIP Mid Cap Portfolio Investor Class | 0.3 | 0.3 |
| 40.0 | 36.5 |
International Equity Funds | | |
Fidelity Canada Fund | 0.6 | 0.6 |
Fidelity China Region Fund | 0.1 | 0.1 |
Fidelity Diversified International Fund | 1.0 | 1.0 |
Fidelity Emerging Asia Fund | 0.0 * | 0.0 |
Fidelity Emerging Markets Fund | 1.6 | 0.5 |
Fidelity International Capital Appreciation Fund | 0.5 | 0.5 |
Fidelity International Discovery Fund | 1.3 | 0.9 |
Fund Holdings as of December 31, 2010 - continued |
| % of fund's
net assets | % of fund's net assets
6 months ago |
Fidelity International Real Estate Fund | 0.3 | 0.0 |
Fidelity International Small Cap Fund | 0.3 | 0.3 |
Fidelity International Small Cap Opportunities Fund | 1.0 | 0.9 |
Fidelity International Value Fund | 0.2 | 0.0 * |
Fidelity Japan Fund | 0.3 | 0.5 |
Fidelity Japan Smaller Companies Fund | 0.0 * | 0.0 |
Fidelity Nordic Fund | 1.2 | 0.1 |
Fidelity Overseas Fund | 0.0 * | 0.0 * |
Fidelity Pacific Basin Fund | 0.4 | 0.1 |
Spartan International Index Fund Investor Class | 7.5 | 7.4 |
| 16.3 | 12.9 |
Fixed-Income Funds | | |
Fidelity Floating Rate High Income Fund | 2.0 | 0.9 |
Fidelity Focused High Income Fund | 0.3 | 0.0 |
Fidelity High Income Fund | 2.3 | 1.8 |
Fidelity New Markets Income Fund | 0.7 | 0.4 |
Fidelity Real Estate Income Fund | 0.5 | 0.5 |
Fidelity U.S. Bond Index Fund | 34.7 | 39.4 |
| 40.5 | 43.0 |
Money Market Funds | | |
Fidelity Institutional Prime Money Market Portfolio Class I | 3.2 | 7.6 |
Net Other Assets (Liabilities) * | 0.0 | 0.0 |
| 100.0 | 100.0 |
* Amount represents less than 0.1%
Asset Allocation (% of fund's net assets) |
As of December 31, 2010 |
| Domestic Equity Funds | 40.0% | |
| International Equity Funds | 16.3% | |
| Fixed Income Funds | 40.5% | |
| Money Market Funds | 3.2% | |

As of June 30, 2010 |
| Domestic Equity Funds | 36.5% | |
| International Equity Funds | 12.9% | |
| Fixed Income Funds | 43.0% | |
| Money Market Funds | 7.6% | |

Annual Report
VIP FundsManager 50% Portfolio
Investments December 31, 2010
Showing Percentage of Net Assets
Equity Funds - 56.3% |
| Shares | | Value |
Domestic Equity Funds - 40.0% |
Fidelity 130/30 Large Cap Fund | 11,814 | | $ 85,537 |
Fidelity Air Transportation Portfolio | 24,592 | | 1,041,474 |
Fidelity Automotive Portfolio | 15,016 | | 678,580 |
Fidelity Banking Portfolio | 457,393 | | 8,466,338 |
Fidelity Biotechnology Portfolio (a) | 32,641 | | 2,381,468 |
Fidelity Blue Chip Growth Fund | 56,907 | | 2,580,750 |
Fidelity Brokerage & Investment Management Portfolio | 59,546 | | 3,123,212 |
Fidelity Chemicals Portfolio | 27,219 | | 2,599,455 |
Fidelity Commodity Strategy Fund (a) | 958 | | 11,352 |
Fidelity Communications Equipment Portfolio | 41,161 | | 1,091,173 |
Fidelity Computers Portfolio (a) | 98,541 | | 5,559,659 |
Fidelity Construction & Housing Portfolio | 76,017 | | 2,665,165 |
Fidelity Consumer Discretionary Portfolio | 290,270 | | 7,114,512 |
Fidelity Consumer Staples Portfolio | 288,930 | | 19,748,397 |
Fidelity Contrafund | 12,469 | | 844,556 |
Fidelity Defense & Aerospace Portfolio | 4,702 | | 344,266 |
Fidelity Disciplined Equity Fund | 12,593 | | 283,730 |
Fidelity Dividend Growth Fund | 388,808 | | 11,053,803 |
Fidelity Electronics Portfolio | 22,874 | | 1,106,431 |
Fidelity Energy Portfolio | 285,614 | | 14,931,876 |
Fidelity Energy Service Portfolio | 129,360 | | 9,620,527 |
Fidelity Environmental & Alternative Energy Portfolio | 87,749 | | 1,561,926 |
Fidelity Equity-Income Fund | 18,550 | | 821,009 |
Fidelity Equity-Income II Fund | 511 | | 9,319 |
Fidelity Financial Services Portfolio | 153,938 | | 9,481,072 |
Fidelity Fund | 16,118 | | 518,200 |
Fidelity Global Commodity Stock Fund | 2,557 | | 43,830 |
Fidelity Gold Portfolio | 155,250 | | 8,245,316 |
Fidelity Growth Company Fund | 68,423 | | 5,689,333 |
Fidelity Health Care Portfolio | 30,283 | | 3,773,550 |
Fidelity Independence Fund | 974 | | 23,728 |
Fidelity Industrial Equipment Portfolio | 149,573 | | 5,073,505 |
Fidelity Industrials Portfolio | 493,665 | | 11,680,107 |
Fidelity Insurance Portfolio | 155,046 | | 7,315,054 |
Fidelity IT Services Portfolio (a) | 106,686 | | 2,253,207 |
Fidelity Large Cap Stock Fund | 315,283 | | 5,552,134 |
Fidelity Large Cap Value Fund | 31,300 | | 329,277 |
Fidelity Leisure Portfolio | 61,700 | | 5,623,991 |
Fidelity Leveraged Company Stock Fund | 757 | | 21,526 |
Fidelity Magellan Fund | 2,825 | | 202,435 |
Fidelity Materials Portfolio | 29,490 | | 2,002,358 |
Fidelity Medical Delivery Portfolio (a) | 137,017 | | 6,807,027 |
Fidelity Medical Equipment & Systems Portfolio (a) | 21,084 | | 581,502 |
Fidelity Mega Cap Stock Fund | 288,177 | | 2,878,889 |
Fidelity Mid Cap Value Fund | 148,331 | | 2,365,884 |
Fidelity Mid-Cap Stock Fund | 5,239 | | 151,134 |
Fidelity Multimedia Portfolio | 64,992 | | 2,782,946 |
Fidelity Nasdaq Composite Index Fund | 10,173 | | 358,074 |
Fidelity Natural Resources Portfolio | 13,691 | | 476,594 |
|
| Shares | | Value |
Fidelity Pharmaceuticals Portfolio | 765,281 | | $ 9,435,914 |
Fidelity Real Estate Investment Portfolio | 157,538 | | 4,047,164 |
Fidelity Retailing Portfolio | 66,225 | | 3,542,388 |
Fidelity Small Cap Growth Fund | 92,544 | | 1,452,022 |
Fidelity Small Cap Stock Fund (a) | 7,638 | | 149,697 |
Fidelity Small Cap Value Fund | 7,898 | | 123,293 |
Fidelity Software & Computer Services Portfolio | 39,070 | | 3,417,021 |
Fidelity Technology Portfolio (a) | 234,386 | | 22,409,653 |
Fidelity Telecom and Utilities Fund | 336,922 | | 5,373,902 |
Fidelity Telecommunications Portfolio | 131,240 | | 6,094,791 |
Fidelity Transportation Portfolio | 55,894 | | 3,097,671 |
Fidelity Utilities Portfolio | 88,720 | | 4,292,277 |
Spartan 500 Index Fund Investor Class | 21,633 | | 962,220 |
Spartan Extended Market Index Fund Investor Class | 268,487 | | 10,248,149 |
Spartan Total Market Index Fund Investor Class | 277,196 | | 10,098,257 |
VIP Mid Cap Portfolio Investor Class | 63,337 | | 2,064,778 |
TOTAL DOMESTIC EQUITY FUNDS | | 268,764,385 |
International Equity Funds - 16.3% |
Fidelity Canada Fund | 67,144 | | 3,904,396 |
Fidelity China Region Fund | 28,512 | | 926,914 |
Fidelity Diversified International Fund | 226,597 | | 6,831,905 |
Fidelity Emerging Asia Fund | 1,437 | | 43,992 |
Fidelity Emerging Markets Fund | 407,057 | | 10,725,964 |
Fidelity International Capital Appreciation Fund | 263,723 | | 3,399,385 |
Fidelity International Discovery Fund | 269,882 | | 8,916,899 |
Fidelity International Real Estate Fund | 210,263 | | 1,972,271 |
Fidelity International Small Cap Fund | 89,309 | | 1,898,715 |
Fidelity International Small Cap Opportunities Fund | 642,891 | | 6,679,640 |
Fidelity International Value Fund | 142,660 | | 1,161,250 |
Fidelity Japan Fund | 195,885 | | 2,189,989 |
Fidelity Japan Smaller Companies Fund | 15,890 | | 146,026 |
Fidelity Nordic Fund | 225,378 | | 7,739,484 |
Fidelity Overseas Fund | 279 | | 9,064 |
Fidelity Pacific Basin Fund | 108,033 | | 2,816,419 |
Spartan International Index Fund Investor Class | 1,438,695 | | 50,598,919 |
TOTAL INTERNATIONAL EQUITY FUNDS | | 109,961,232 |
TOTAL EQUITY FUNDS (Cost $299,471,954) | 378,725,617 |
Fixed-Income Funds - 40.5% |
| | | |
Fidelity Floating Rate High Income Fund | 1,402,788 | | 13,733,297 |
Fidelity Focused High Income Fund | 252,177 | | 2,322,547 |
Fidelity High Income Fund | 1,722,074 | | 15,395,344 |
Fidelity New Markets Income Fund | 304,283 | | 4,762,031 |
Fixed-Income Funds - continued |
| Shares | | Value |
Fidelity Real Estate Income Fund | 291,217 | | $ 3,028,654 |
Fidelity U.S. Bond Index Fund | 20,575,548 | | 233,120,966 |
TOTAL FIXED-INCOME FUNDS (Cost $261,348,488) | 272,362,839 |
Money Market Funds - 3.2% |
| | | |
Fidelity Institutional Prime Money Market Portfolio Class I
(Cost $21,746,336) | 21,746,336 | | 21,746,336 |
TOTAL INVESTMENT PORTFOLIO - 100.0% (Cost $582,566,778) | | 672,834,792 |
NET OTHER ASSETS (LIABILITIES) - 0.0% | | (110,146) |
NET ASSETS - 100% | $ 672,724,646 |
Legend |
(a) Non-income producing |
Other Information |
All investments are categorized as Level 1 under the Fair Value Hierarchy. The inputs or methodology used for valuing securities may not be an indication of the risk associated with investing in those securities. For more information on valuation inputs, please refer to the Security Valuation section in the accompanying Notes to Financial Statements. |
Income Tax Information |
At December 31, 2010, the Fund had a capital loss carryforward of approximately $85,066,507 of which $27,271,636 and $57,794,871 will expire in fiscal 2016 and 2017, respectively. Capital loss carryforwards are only available to offset future capital gains of the Fund to the extent provided by regulations and may be limited. |
See accompanying notes which are an integral part of the financial statements.
Annual Report
VIP FundsManager 50% Portfolio
Statement of Assets and Liabilities
| December 31, 2010 |
| | |
Assets | | |
Investment in securities, at value (cost $582,566,778) - See accompanying schedule | | $ 672,834,792 |
Cash | | 3 |
Receivable for investments sold | | 431,200 |
Receivable for fund shares sold | | 51 |
Total assets | | 673,266,046 |
| | |
Liabilities | | |
Payable for fund shares redeemed | $ 431,250 | |
Accrued management fee | 110,023 | |
Distribution and service plan fees payable | 127 | |
Total liabilities | | 541,400 |
| | |
Net Assets | | $ 672,724,646 |
Net Assets consist of: | | |
Paid in capital | | $ 668,289,309 |
Accumulated undistributed net realized gain (loss) on investments | | (85,832,677) |
Net unrealized appreciation (depreciation) on investments | | 90,268,014 |
Net Assets | | $ 672,724,646 |
Statement of Assets and Liabilities - continued
| December 31, 2010 |
| | |
| | |
Service Class:
Net Asset Value, offering price and redemption price per share ($61,789 ÷ 6,164 shares) | | $ 10.02 |
| | |
Service Class 2:
Net Asset Value, offering price and redemption price per share ($1,030,493 ÷ 102,976 shares) | | $ 10.01 |
| | |
Investor Class:
Net Asset Value, offering price and redemption price per share ($671,632,364 ÷ 67,013,883 shares) | | $ 10.02 |
See accompanying notes which are an integral part of the financial statements.
Annual Report
Statement of Operations
| Year ended December 31, 2010 |
| | |
Investment Income | | |
Income distributions from underlying funds | | $ 11,414,422 |
| | |
Expenses | | |
Management fee | $ 1,436,524 | |
Distribution and service plan fees | 2,409 | |
Independent trustees' compensation | 2,005 | |
Total expenses before reductions | 1,440,938 | |
Expense reductions | (289,064) | 1,151,874 |
Net investment income (loss) | | 10,262,548 |
Realized and Unrealized Gain (Loss) Realized gain (loss) on sale of underlying fund shares | 3,277,326 | |
Capital gain distributions from underlying funds | 3,354,663 | |
Total net realized gain (loss) | | 6,631,989 |
Change in net unrealized appreciation (depreciation) on underlying funds | | 50,222,599 |
Net gain (loss) | | 56,854,588 |
Net increase (decrease) in net assets resulting from operations | | $ 67,117,136 |
Statement of Changes in Net Assets
| Year ended December 31, 2010 | Year ended December 31, 2009 |
Increase (Decrease) in Net Assets | | |
Operations | | |
Net investment income (loss) | $ 10,262,548 | $ 8,302,788 |
Net realized gain (loss) | 6,631,989 | (40,440,499) |
Change in net unrealized appreciation (depreciation) | 50,222,599 | 103,521,659 |
Net increase (decrease) in net assets resulting from operations | 67,117,136 | 71,383,948 |
Distributions to shareholders from net investment income | (10,267,333) | (8,316,282) |
Distributions to shareholders from net realized gain | (1,192,500) | (558,167) |
Total distributions | (11,459,833) | (8,874,449) |
Share transactions - net increase (decrease) | 96,216,502 | 123,241,942 |
Total increase (decrease) in net assets | 151,873,805 | 185,751,441 |
| | |
Net Assets | | |
Beginning of period | 520,850,841 | 335,099,400 |
End of period | $ 672,724,646 | $ 520,850,841 |
See accompanying notes which are an integral part of the financial statements.
Annual Report
Financial Highlights - Service Class
Years ended December 31, | 2010 | 2009 | 2008 | 2007 | 2006 G |
Selected Per-Share Data | | | | | |
Net asset value, beginning of period | $ 9.11 | $ 7.80 | $ 10.51 | $ 10.52 | $ 10.00 |
Income from Investment Operations | | | | | |
Net investment income (loss) E | .17 | .17 | .25 | .32 | .26 |
Net realized and unrealized gain (loss) | .91 | 1.30 | (2.59) | .41 | .47 |
Total from investment operations | 1.08 | 1.47 | (2.34) | .73 | .73 |
Distributions from net investment income | (.16) | (.15) | (.24) | (.24) | (.12) |
Distributions from net realized gain | (.02) | (.01) | (.13) | (.50) | (.09) |
Total distributions | (.17) J | (.16) | (.37) I | (.74) | (.21) |
Net asset value, end of period | $ 10.02 | $ 9.11 | $ 7.80 | $ 10.51 | $ 10.52 |
Total Return B, C, D | 11.89% | 18.82% | (22.48)% | 6.99% | 7.31% |
Ratios to Average Net Assets F, H | | | | | |
Expenses before reductions | .35% | .35% | .35% | .35% | .35% A |
Expenses net of fee waivers, if any | .20% | .20% | .20% | .20% | .20% A |
Expenses net of all reductions | .20% | .20% | .20% | .20% | .20% A |
Net investment income (loss) | 1.78% | 2.07% | 2.65% | 2.97% | 3.48% A |
Supplemental Data | | | | | |
Net assets, end of period (000 omitted) | $ 62 | $ 58 | $ 76 | $ 115 | $ 107 |
Portfolio turnover rate | 16% | 44% | 70% | 92% | 103% A |
A Annualized
B Total returns for periods of less than one year are not annualized.
C Total returns do not reflect charges attributable to your insurance company's separate account. Inclusion of these charges would reduce the total returns shown.
D Total returns would have been lower had certain expenses not been reduced during the periods shown.
E Calculated based on average shares outstanding during the period.
F Amounts do not include the activity of the underlying funds.
G For the period April 13, 2006 (commencement of operations) to December 31, 2006.
H Expense ratios reflect operating expenses of the class. Expenses before reductions do not reflect amounts reimbursed by the investment adviser or reductions from expense offset arrangements and do not represent the amount paid by the class during periods when reimbursements or reductions occur. Expenses net of fee waivers reflect expenses after reimbursement by the investment adviser but prior to reductions from expense offset arrangements. Expenses net of all reductions represent the net expenses paid by the class but do not include expenses of the investment companies in which the Fund invests.
I Total distributions of $.37 per share is comprised of distributions from net investment income of $.241 and distributions from net realized gain of $.125 per share.
J Total distributions of $.17 per share is comprised of distributions from net investment income of $.155 and distributions from net realized gain of $.018 per share.
Financial Highlights - Service Class 2
Years ended December 31, | 2010 | 2009 | 2008 | 2007 | 2006 G |
Selected Per-Share Data | | | | | |
Net asset value, beginning of period | $ 9.10 | $ 7.79 | $ 10.51 | $ 10.51 | $ 10.00 |
Income from Investment Operations | | | | | |
Net investment income (loss) E | .15 | .16 | .23 | .31 | .24 |
Net realized and unrealized gain (loss) | .92 | 1.30 | (2.59) | .41 | .47 |
Total from investment operations | 1.07 | 1.46 | (2.36) | .72 | .71 |
Distributions from net investment income | (.14) | (.14) | (.24) | (.22) | (.11) |
Distributions from net realized gain | (.02) | (.01) | (.13) | (.50) | (.09) |
Total distributions | (.16) | (.15) | (.36) I | (.72) | (.20) |
Net asset value, end of period | $ 10.01 | $ 9.10 | $ 7.79 | $ 10.51 | $ 10.51 |
Total Return B, C, D | 11.75% | 18.76% | (22.63)% | 6.93% | 7.09% |
Ratios to Average Net Assets F, H | | | | | |
Expenses before reductions | .50% | .50% | .50% | .50% | .50% A |
Expenses net of fee waivers, if any | .35% | .35% | .35% | .35% | .35% A |
Expenses net of all reductions | .35% | .35% | .35% | .35% | .35% A |
Net investment income (loss) | 1.63% | 1.92% | 2.50% | 2.82% | 3.34% A |
Supplemental Data | | | | | |
Net assets, end of period (000 omitted) | $ 1,030 | $ 550 | $ 236 | $ 115 | $ 107 |
Portfolio turnover rate | 16% | 44% | 70% | 92% | 103% A |
A Annualized
B Total returns for periods of less than one year are not annualized.
C Total returns do not reflect charges attributable to your insurance company's separate account. Inclusion of these charges would reduce the total returns shown.
D Total returns would have been lower had certain expenses not been reduced during the periods shown.
E Calculated based on average shares outstanding during the period.
F Amounts do not include the activity of the underlying funds.
G For the period April 13, 2006 (commencement of operations) to December 31, 2006.
H Expense ratios reflect operating expenses of the class. Expenses before reductions do not reflect amounts reimbursed by the investment adviser or reductions from expense offset arrangements and do not represent the amount paid by the class during periods when reimbursements or reductions occur. Expenses net of fee waivers reflect expenses after reimbursement by the investment adviser but prior to reductions from expense offset arrangements. Expenses net of all reductions represent the net expenses paid by the class but do not include expenses of the investment companies in which the Fund invests.
I Total distributions of $.36 per share is comprised of distributions from net investment income of $.235 and distributions from net realized gain of $.125 per share.
See accompanying notes which are an integral part of the financial statements.
Annual Report
Financial Highlights - Investor Class
Years ended December 31, | 2010 | 2009 | 2008 | 2007 | 2006 G |
Selected Per-Share Data | | | | | |
Net asset value, beginning of period | $ 9.11 | $ 7.79 | $ 10.51 | $ 10.52 | $ 10.00 |
Income from Investment Operations | | | | | |
Net investment income (loss) E | .17 | .17 | .25 | .32 | .26 |
Net realized and unrealized gain (loss) | .91 | 1.31 | (2.60) | .41 | .47 |
Total from investment operations | 1.08 | 1.48 | (2.35) | .73 | .73 |
Distributions from net investment income | (.16) | (.15) | (.24) | (.24) | (.12) |
Distributions from net realized gain | (.02) | (.01) | (.13) | (.50) | (.09) |
Total distributions | (.17) J | (.16) | (.37) I | (.74) | (.21) |
Net asset value, end of period | $ 10.02 | $ 9.11 | $ 7.79 | $ 10.51 | $ 10.52 |
Total Return B, C, D | 11.89% | 18.98% | (22.57)% | 6.99% | 7.31% |
Ratios to Average Net Assets F, H | | | | | |
Expenses before reductions | .25% | .25% | .25% | .25% | .25% A |
Expenses net of fee waivers, if any | .20% | .20% | .20% | .20% | .20% A |
Expenses net of all reductions | .20% | .20% | .20% | .20% | .20% A |
Net investment income (loss) | 1.78% | 2.07% | 2.65% | 2.97% | 3.48% A |
Supplemental Data | | | | | |
Net assets, end of period (000 omitted) | $ 671,632 | $ 520,243 | $ 334,788 | $ 371,298 | $ 143,744 |
Portfolio turnover rate | 16% | 44% | 70% | 92% | 103% A |
A Annualized
B Total returns for periods of less than one year are not annualized.
C Total returns do not reflect charges attributable to your insurance company's separate account. Inclusion of these charges would reduce the total returns shown.
D Total returns would have been lower had certain expenses not been reduced during the periods shown.
E Calculated based on average shares outstanding during the period.
F Amounts do not include the activity of the underlying funds.
G For the period April 13, 2006 (commencement of operations) to December 31, 2006.
H Expense ratios reflect operating expenses of the class. Expenses before reductions do not reflect amounts reimbursed by the investment adviser or reductions from expense offset arrangements and do not represent the amount paid by the class during periods when reimbursements or reductions occur. Expenses net of fee waivers reflect expenses after reimbursement by the investment adviser but prior to reductions from expense offset arrangements. Expenses net of all reductions represent the net expenses paid by the class but do not include expenses of the investment companies in which the Fund invests.
I Total distributions of $.37 per share is comprised of distributions from net investment income of $.241 and distributions from net realized gain of $.125 per share.
J Total distributions of $.17 per share is comprised of distributions from net investment income of $.155 and distributions from net realized gain of $.018 per share.
See accompanying notes which are an integral part of the financial statements.
Annual Report
VIP FundsManager 60% Portfolio
Investment Changes (Unaudited)
Fund Holdings as of December 31, 2010 |
| % of fund's
net assets | % of fund's net assets
6 months ago |
Domestic Equity Funds | | |
Fidelity 130/30 Large Cap Fund | 0.0 * | 0.0 * |
Fidelity Air Transportation Portfolio | 0.2 | 0.2 |
Fidelity Automotive Portfolio | 0.1 | 0.0 * |
Fidelity Banking Portfolio | 1.4 | 1.0 |
Fidelity Biotechnology Portfolio | 0.0 * | 0.1 |
Fidelity Blue Chip Growth Fund | 0.1 | 0.2 |
Fidelity Brokerage & Investment Management Portfolio | 0.2 | 0.3 |
Fidelity Chemicals Portfolio | 0.5 | 0.3 |
Fidelity Commodity Strategy Fund | 0.0 * | 0.0 |
Fidelity Communications Equipment Portfolio | 0.6 | 0.5 |
Fidelity Computers Portfolio | 1.0 | 1.3 |
Fidelity Construction & Housing Portfolio | 0.3 | 0.4 |
Fidelity Consumer Discretionary Portfolio | 2.0 | 1.6 |
Fidelity Consumer Staples Portfolio | 3.7 | 3.7 |
Fidelity Contrafund | 0.4 | 0.1 |
Fidelity Defense & Aerospace Portfolio | 0.1 | 0.1 |
Fidelity Disciplined Equity Fund | 0.0 * | 0.0 * |
Fidelity Dividend Growth Fund | 2.7 | 2.6 |
Fidelity Electronics Portfolio | 0.1 | 0.1 |
Fidelity Energy Portfolio | 2.3 | 2.4 |
Fidelity Energy Service Portfolio | 1.8 | 0.7 |
Fidelity Environmental & Alternative Energy Portfolio | 0.1 | 0.1 |
Fidelity Equity-Income Fund | 0.1 | 0.2 |
Fidelity Equity-Income II Fund | 0.0 * | 0.0 * |
Fidelity Financial Services Portfolio | 1.5 | 2.4 |
Fidelity Fund | 0.0 * | 0.0 * |
Fidelity Global Commodity Stock Fund | 0.2 | 0.0 |
Fidelity Gold Portfolio | 1.1 | 1.1 |
Fidelity Growth Company Fund | 0.8 | 1.0 |
Fidelity Health Care Portfolio | 1.4 | 1.2 |
Fidelity Independence Fund | 0.0 * | 0.0 * |
Fidelity Industrial Equipment Portfolio | 1.3 | 0.5 |
Fidelity Industrials Portfolio | 1.8 | 2.2 |
Fidelity Insurance Portfolio | 1.8 | 1.2 |
Fidelity IT Services Portfolio | 0.3 | 0.4 |
Fidelity Large Cap Stock Fund | 1.8 | 2.2 |
Fidelity Large Cap Value Fund | 0.0 * | 0.1 |
Fidelity Leisure Portfolio | 0.8 | 0.4 |
|
| % of fund's
net assets | % of fund's net assets
6 months ago |
Fidelity Leveraged Company Stock Fund | 0.1 | 0.1 |
Fidelity Magellan Fund | 0.0 * | 0.0 * |
Fidelity Materials Portfolio | 0.4 | 0.2 |
Fidelity Medical Delivery Portfolio | 0.7 | 0.9 |
Fidelity Medical Equipment & Systems Portfolio | 0.4 | 0.5 |
Fidelity Mega Cap Stock Fund | 1.3 | 1.7 |
Fidelity Mid Cap Value Fund | 0.2 | 0.2 |
Fidelity Multimedia Portfolio | 0.6 | 0.4 |
Fidelity Natural Resources Portfolio | 0.0 * | 0.1 |
Fidelity Pharmaceuticals Portfolio | 1.5 | 1.3 |
Fidelity Real Estate Investment Portfolio | 0.4 | 0.7 |
Fidelity Retailing Portfolio | 0.4 | 0.5 |
Fidelity Series Commodity Strategy Fund | 0.0 | 0.0 * |
Fidelity Small Cap Growth Fund | 0.1 | 0.1 |
Fidelity Small Cap Value Fund | 0.3 | 0.4 |
Fidelity Software & Computer Services Portfolio | 0.5 | 0.8 |
Fidelity Stock Selector All Cap Fund | 0.0 * | 0.0 |
Fidelity Technology Portfolio | 4.3 | 2.3 |
Fidelity Telecom and Utilities Fund | 0.8 | 1.1 |
Fidelity Telecommunications Portfolio | 1.0 | 0.8 |
Fidelity Transportation Portfolio | 0.6 | 0.4 |
Fidelity Utilities Portfolio | 1.0 | 0.6 |
Fidelity Value Fund | 0.1 | 0.1 |
Spartan 500 Index Fund Investor Class | 0.0 * | 0.0 * |
Spartan Total Market Index Fund Investor Class | 1.0 | 1.2 |
VIP Mid Cap Portfolio Investor Class | 0.2 | 0.2 |
| 46.4 | 43.2 |
International Equity Funds | | |
Fidelity Canada Fund | 0.6 | 0.7 |
Fidelity China Region Fund | 0.1 | 0.2 |
Fidelity Diversified International Fund | 0.8 | 1.2 |
Fidelity Emerging Asia Fund | 0.0 * | 0.0 |
Fidelity Emerging Markets Fund | 1.7 | 0.8 |
Fidelity International Capital Appreciation Fund | 0.5 | 0.6 |
Fidelity International Discovery Fund | 3.6 | 1.6 |
Fidelity International Real Estate Fund | 0.1 | 0.0 |
Fund Holdings as of December 31, 2010 - continued |
| % of fund's
net assets | % of fund's net assets
6 months ago |
Fidelity International Small Cap Fund | 0.7 | 0.8 |
Fidelity International Small Cap Opportunities Fund | 1.3 | 1.4 |
Fidelity International Value Fund | 0.0 * | 0.1 |
Fidelity Japan Fund | 0.8 | 0.7 |
Fidelity Japan Smaller Companies Fund | 0.3 | 0.0 |
Fidelity Nordic Fund | 2.3 | 0.4 |
Fidelity Overseas Fund | 0.0 * | 0.0 * |
Fidelity Pacific Basin Fund | 1.2 | 0.6 |
Spartan International Index Fund Investor Class | 5.0 | 6.4 |
| 19.0 | 15.5 |
Fixed-Income Funds | | |
Fidelity Floating Rate High Income Fund | 1.6 | 1.2 |
Fidelity Focused High Income Fund | 1.0 | 0.0 |
Fidelity High Income Fund | 1.7 | 1.5 |
Fidelity New Markets Income Fund | 0.9 | 0.1 |
Fidelity Real Estate Income Fund | 0.7 | 1.0 |
Fidelity U.S. Bond Index Fund | 27.5 | 34.3 |
| 33.4 | 38.1 |
Money Market Funds | | |
Fidelity Institutional Prime Money Market Portfolio Class I | 1.2 | 3.2 |
Net Other Assets (Liabilities)* | 0.0 | 0.0 |
| 100.0 | 100.0 |
* Amount represents less than 0.1%
Asset Allocation (% of fund's net assets) |
As of December 31, 2010 |
| Domestic Equity Funds | 46.4% | |
| International Equity Funds | 19.0% | |
| Fixed Income Funds | 33.4% | |
| Money Market Funds | 1.2% | |

As of June 30, 2010 |
| Domestic Equity Funds | 43.2% | |
| International Equity Funds | 15.5% | |
| Fixed Income Funds | 38.1% | |
| Money Market Funds | 3.2% | |

Annual Report
VIP FundsManager 60% Portfolio
Investments December 31, 2010
Showing Percentage of Net Assets
Equity Funds - 65.4% |
| Shares | | Value |
Domestic Equity Funds - 46.4% |
Fidelity 130/30 Large Cap Fund | 7,135 | | $ 51,655 |
Fidelity Air Transportation Portfolio | 114,143 | | 4,833,976 |
Fidelity Automotive Portfolio | 79,019 | | 3,570,854 |
Fidelity Banking Portfolio | 1,936,008 | | 35,835,501 |
Fidelity Biotechnology Portfolio (a) | 12,393 | | 904,207 |
Fidelity Blue Chip Growth Fund | 72,650 | | 3,294,665 |
Fidelity Brokerage & Investment Management Portfolio | 112,577 | | 5,904,652 |
Fidelity Chemicals Portfolio | 141,208 | | 13,485,317 |
Fidelity Commodity Strategy Fund (a) | 1,011 | | 11,977 |
Fidelity Communications Equipment Portfolio | 539,777 | | 14,309,488 |
Fidelity Computers Portfolio (a) | 460,018 | | 25,954,231 |
Fidelity Construction & Housing Portfolio | 251,633 | | 8,822,238 |
Fidelity Consumer Discretionary Portfolio | 2,069,293 | | 50,718,383 |
Fidelity Consumer Staples Portfolio | 1,405,795 | | 96,086,122 |
Fidelity Contrafund | 133,805 | | 9,062,632 |
Fidelity Defense & Aerospace Portfolio | 28,113 | | 2,058,402 |
Fidelity Disciplined Equity Fund | 4,464 | | 100,585 |
Fidelity Dividend Growth Fund | 2,480,676 | | 70,525,609 |
Fidelity Electronics Portfolio | 26,462 | | 1,279,949 |
Fidelity Energy Portfolio | 1,120,111 | | 58,559,381 |
Fidelity Energy Service Portfolio | 625,076 | | 46,486,871 |
Fidelity Environmental & Alternative Energy Portfolio | 88,047 | | 1,567,242 |
Fidelity Equity-Income Fund | 69,580 | | 3,079,604 |
Fidelity Equity-Income II Fund | 4,861 | | 88,717 |
Fidelity Financial Services Portfolio | 636,543 | | 39,204,659 |
Fidelity Fund | 1,831 | | 58,879 |
Fidelity Global Commodity Stock Fund | 372,670 | | 6,387,567 |
Fidelity Gold Portfolio | 546,065 | | 29,001,522 |
Fidelity Growth Company Fund | 240,312 | | 19,981,955 |
Fidelity Health Care Portfolio | 290,737 | | 36,228,687 |
Fidelity Independence Fund | 2,122 | | 51,677 |
Fidelity Industrial Equipment Portfolio | 1,004,524 | | 34,073,447 |
Fidelity Industrials Portfolio | 1,955,314 | | 46,262,720 |
Fidelity Insurance Portfolio | 986,962 | | 46,564,855 |
Fidelity IT Services Portfolio (a) | 425,454 | | 8,985,583 |
Fidelity Large Cap Stock Fund | 2,709,316 | | 47,711,054 |
Fidelity Large Cap Value Fund | 114,963 | | 1,209,415 |
Fidelity Leisure Portfolio | 218,823 | | 19,945,690 |
Fidelity Leveraged Company Stock Fund | 57,376 | | 1,630,621 |
Fidelity Magellan Fund | 2,862 | | 205,125 |
Fidelity Materials Portfolio | 153,456 | | 10,419,631 |
Fidelity Medical Delivery Portfolio (a) | 351,513 | | 17,463,185 |
Fidelity Medical Equipment & Systems Portfolio (a) | 333,901 | | 9,209,002 |
Fidelity Mega Cap Stock Fund | 3,292,146 | | 32,888,536 |
Fidelity Mid Cap Value Fund | 293,296 | | 4,678,070 |
Fidelity Multimedia Portfolio | 332,175 | | 14,223,748 |
Fidelity Natural Resources Portfolio | 32,330 | | 1,125,406 |
Fidelity Pharmaceuticals Portfolio | 3,238,342 | | 39,928,751 |
|
| Shares | | Value |
Fidelity Real Estate Investment Portfolio | 382,852 | | $ 9,835,467 |
Fidelity Retailing Portfolio | 201,235 | | 10,764,085 |
Fidelity Small Cap Growth Fund | 137,422 | | 2,156,156 |
Fidelity Small Cap Value Fund | 507,027 | | 7,914,698 |
Fidelity Software & Computer Services Portfolio | 150,450 | | 13,158,391 |
Fidelity Stock Selector All Cap Fund | 4,389 | | 112,980 |
Fidelity Technology Portfolio (a) | 1,160,802 | | 110,984,244 |
Fidelity Telecom and Utilities Fund | 1,352,766 | | 21,576,621 |
Fidelity Telecommunications Portfolio | 542,917 | | 25,213,055 |
Fidelity Transportation Portfolio | 281,345 | | 15,592,153 |
Fidelity Utilities Portfolio | 532,039 | | 25,740,049 |
Fidelity Value Fund | 25,288 | | 1,737,022 |
Spartan 500 Index Fund Investor Class | 2,199 | | 97,821 |
Spartan Total Market Index Fund Investor Class | 676,152 | | 24,632,225 |
VIP Mid Cap Portfolio Investor Class | 140,092 | | 4,566,989 |
TOTAL DOMESTIC EQUITY FUNDS | | 1,198,113,999 |
International Equity Funds - 19.0% |
Fidelity Canada Fund | 274,712 | | 15,974,481 |
Fidelity China Region Fund | 113,353 | | 3,685,100 |
Fidelity Diversified International Fund | 686,651 | | 20,702,518 |
Fidelity Emerging Asia Fund | 29,129 | | 891,928 |
Fidelity Emerging Markets Fund | 1,619,301 | | 42,668,575 |
Fidelity International Capital Appreciation Fund | 1,012,811 | | 13,055,134 |
Fidelity International Discovery Fund | 2,825,752 | | 93,362,849 |
Fidelity International Real Estate Fund | 379,939 | | 3,563,827 |
Fidelity International Small Cap Fund | 812,189 | | 17,267,139 |
Fidelity International Small Cap Opportunities Fund | 3,342,853 | | 34,732,238 |
Fidelity International Value Fund | 119,910 | | 976,066 |
Fidelity Japan Fund | 1,803,319 | | 20,161,109 |
Fidelity Japan Smaller Companies Fund | 812,733 | | 7,469,017 |
Fidelity Nordic Fund | 1,709,624 | | 58,708,503 |
Fidelity Overseas Fund | 1,143 | | 37,128 |
Fidelity Pacific Basin Fund | 1,171,890 | | 30,551,175 |
Spartan International Index Fund Investor Class | 3,658,396 | | 128,665,780 |
TOTAL INTERNATIONAL EQUITY FUNDS | | 492,472,567 |
TOTAL EQUITY FUNDS (Cost $1,348,904,256) | 1,690,586,566 |
Fixed-Income Funds - 33.4% |
| | | |
Fidelity Floating Rate High Income Fund | 4,172,889 | | 40,852,584 |
Fidelity Focused High Income Fund | 2,858,196 | | 26,323,981 |
Fidelity High Income Fund | 4,920,152 | | 43,986,157 |
Fidelity New Markets Income Fund | 1,437,407 | | 22,495,422 |
Fixed-Income Funds - continued |
| Shares | | Value |
Fidelity Real Estate Income Fund | 1,780,045 | | $ 18,512,471 |
Fidelity U.S. Bond Index Fund | 62,732,304 | | 710,757,002 |
TOTAL FIXED-INCOME FUNDS (Cost $840,822,755) | 862,927,617 |
Money Market Funds - 1.2% |
| | | |
Fidelity Institutional Prime Money Market Portfolio Class I
(Cost $31,106,059) | 31,106,059 | | 31,106,059 |
TOTAL INVESTMENT PORTFOLIO - 100.0% (Cost $2,220,833,070) | | 2,584,620,242 |
NET OTHER ASSETS (LIABILITIES) - 0.0% | | (413,939) |
NET ASSETS - 100% | $ 2,584,206,303 |
Legend |
(a) Non-income producing |
Other Information |
All investments are categorized as Level 1 under the Fair Value Hierarchy. The inputs or methodology used for valuing securities may not be an indication of the risk associated with investing in those securities. For more information on valuation inputs, please refer to the Security Valuation section in the accompanying Notes to Financial Statements. |
Income Tax Information |
At December 31, 2010, the Fund had a capital loss carryforward of approximately $80,163,922 of which $27,333,665 and $52,830,257 will expire in fiscal 2016 and 2017, respectively. Capital loss carryforwards are only available to offset future capital gains of the Fund to the extent provided by regulations and may be limited. |
See accompanying notes which are an integral part of the financial statements.
Annual Report
VIP FundsManager 60% Portfolio
Statement of Assets and Liabilities
| December 31, 2010 |
| | |
Assets | | |
Investment in securities, at value (cost $2,220,833,070) - See accompanying schedule | | $ 2,584,620,242 |
Receivable for fund shares sold | | 4,330,768 |
Total assets | | 2,588,951,010 |
| | |
Liabilities | | |
Payable to custodian bank | $ 4 | |
Payable for investments purchased | 4,330,767 | |
Payable for fund shares redeemed | 1 | |
Accrued management fee | 413,919 | |
Distribution and service plan fees payable | 16 | |
Total liabilities | | 4,744,707 |
| | |
Net Assets | | $ 2,584,206,303 |
Net Assets consist of: | | |
Paid in capital | | $ 2,302,455,960 |
Accumulated undistributed net realized gain (loss) on investments | | (82,036,829) |
Net unrealized appreciation (depreciation) on investments | | 363,787,172 |
Net Assets | | $ 2,584,206,303 |
Statement of Assets and Liabilities - continued
| December 31, 2010 |
| | |
| | |
Service Class:
Net Asset Value, offering price and redemption price per share ($60,258 ÷ 6,096 shares) | | $ 9.88 |
| | |
Service Class 2:
Net Asset Value, offering price and redemption price per share ($125,431 ÷ 12,694 shares) | | $ 9.88 |
| | |
Investor Class:
Net Asset Value, offering price and redemption price per share ($2,584,020,614 ÷ 261,493,334 shares) | | $ 9.88 |
See accompanying notes which are an integral part of the financial statements.
Annual Report
VIP FundsManager 60% Portfolio
Financial Statements - continued
Statement of Operations
| Year ended December 31, 2010 |
| | |
Investment Income | | |
Income distributions from underlying funds | | $ 34,257,876 |
| | |
Expenses | | |
Management fee | $ 4,323,176 | |
Distribution and service plan fees | 318 | |
Independent trustees' compensation | 5,768 | |
Total expenses before reductions | 4,329,262 | |
Expense reductions | (869,670) | 3,459,592 |
Net investment income (loss) | | 30,798,284 |
Realized and Unrealized Gain (Loss) Realized gain (loss) on sale of underlying fund shares | 8,581,025 | |
Capital gain distributions from underlying funds | 12,229,573 | |
Total net realized gain (loss) | | 20,810,598 |
Change in net unrealized appreciation (depreciation) on underlying funds | | 211,909,440 |
Net gain (loss) | | 232,720,038 |
Net increase (decrease) in net assets resulting from operations | | $ 263,518,322 |
Statement of Changes in Net Assets
| Year ended December 31, 2010 | Year ended December 31, 2009 |
Increase (Decrease) in Net Assets | | |
Operations | | |
Net investment income (loss) | $ 30,798,284 | $ 17,230,832 |
Net realized gain (loss) | 20,810,598 | (31,528,105) |
Change in net unrealized appreciation (depreciation) | 211,909,440 | 229,496,553 |
Net increase (decrease) in net assets resulting from operations | 263,518,322 | 215,199,280 |
Distributions to shareholders from net investment income | (30,781,925) | (17,220,749) |
Distributions to shareholders from net realized gain | (5,386,863) | (1,542,165) |
Total distributions | (36,168,788) | (18,762,914) |
Share transactions - net increase (decrease) | 1,196,958,465 | 370,044,169 |
Total increase (decrease) in net assets | 1,424,307,999 | 566,480,535 |
| | |
Net Assets | | |
Beginning of period | 1,159,898,304 | 593,417,769 |
End of period | $ 2,584,206,303 | $ 1,159,898,304 |
See accompanying notes which are an integral part of the financial statements.
Annual Report
Financial Highlights - Service Class
Years ended December 31, | 2010 | 2009 | 2008 | 2007 G |
Selected Per-Share Data | | | | |
Net asset value, beginning of period | $ 8.83 | $ 7.32 | $ 10.29 | $ 10.00 |
Income from Investment Operations | | | | |
Net investment income (loss) E | .16 | .15 | .25 | .18 |
Net realized and unrealized gain (loss) | 1.03 | 1.51 | (3.01) | .23 |
Total from investment operations | 1.19 | 1.66 | (2.76) | .41 |
Distributions from net investment income | (.12) | (.13) | (.13) | (.06) |
Distributions from net realized gain | (.02) | (.01) | (.08) | (.06) |
Total distributions | (.14) | (.15) J | (.21) I | (.12) |
Net asset value, end of period | $ 9.88 | $ 8.83 | $ 7.32 | $ 10.29 |
Total Return B, C, D | 13.49% | 22.61% | (26.93)% | 4.07% |
Ratios to Average Net Assets F, H | | | | |
Expenses before reductions | .35% | .35% | .35% | .35% A |
Expenses net of fee waivers, if any | .20% | .20% | .20% | .20% A |
Expenses net of all reductions | .20% | .20% | .20% | .20% A |
Net investment income (loss) | 1.77% | 1.89% | 2.75% | 4.76% A |
Supplemental Data | | | | |
Net assets, end of period (000 omitted) | $ 60 | $ 52 | $ 65 | $ 104 |
Portfolio turnover rate | 10% | 38% | 74% | 60% A |
A Annualized
B Total returns for periods of less than one year are not annualized.
C Total returns do not reflect charges attributable to your insurance company's separate account. Inclusion of these charges would reduce the total returns shown.
D Total returns would have been lower had certain expenses not been reduced during the periods shown.
E Calculated based on average shares outstanding during the period.
F Amounts do not include the activity of the underlying funds.
G For the period August 22, 2007 (commencement of operations) to December 31, 2007.
H Expense ratios reflect operating expenses of the class. Expenses before reductions do not reflect amounts reimbursed by the investment adviser or reductions from expense offset arrangements and do not represent the amount paid by the class during periods when reimbursements or reductions occur. Expenses net of fee waivers reflect expenses after reimbursement by the investment adviser but prior to reductions from expense offset arrangements. Expenses net of all reductions represent the net expenses paid by the class but do not include expenses of the investment companies in which the Fund invests.
I Total distributions of $.21 per share is comprised of distributions from net investment income of $.133 and distributions from net realized gain of $.080 per share.
J Total distributions of $.15 per share is comprised of distributions from net investment income of $.134 and distributions from net realized gain of $.012 per share.
Financial Highlights - Service Class 2
Years ended December 31, | 2010 | 2009 | 2008 | 2007 G |
Selected Per-Share Data | | | | |
Net asset value, beginning of period | $ 8.83 | $ 7.33 | $ 10.29 | $ 10.00 |
Income from Investment Operations | | | | |
Net investment income (loss) E | .15 | .14 | .23 | .17 |
Net realized and unrealized gain (loss) | 1.03 | 1.50 | (2.99) | .23 |
Total from investment operations | 1.18 | 1.64 | (2.76) | .40 |
Distributions from net investment income | (.11) | (.12) | (.12) | (.05) |
Distributions from net realized gain | (.02) | (.01) | (.08) | (.06) |
Total distributions | (.13) | (.14) J | (.20) I | (.11) |
Net asset value, end of period | $ 9.88 | $ 8.83 | $ 7.33 | $ 10.29 |
Total Return B, C, D | 13.35% | 22.31% | (26.97)% | 4.01% |
Ratios to Average Net Assets F, H | | | | |
Expenses before reductions | .50% | .50% | .50% | .50% A |
Expenses net of fee waivers, if any | .35% | .35% | .35% | .35% A |
Expenses net of all reductions | .35% | .35% | .35% | .35% A |
Net investment income (loss) | 1.62% | 1.74% | 2.59% | 4.61% A |
Supplemental Data | | | | |
Net assets, end of period (000 omitted) | $ 125 | $ 83 | $ 76 | $ 104 |
Portfolio turnover rate | 10% | 38% | 74% | 60% A |
A Annualized
B Total returns for periods of less than one year are not annualized.
C Total returns do not reflect charges attributable to your insurance company's separate account. Inclusion of these charges would reduce the total returns shown.
D Total returns would have been lower had certain expenses not been reduced during the periods shown.
E Calculated based on average shares outstanding during the period.
F Amounts do not include the activity of the underlying funds.
G For the period August 22, 2007 (commencement of operations) to December 31, 2007.
H Expense ratios reflect operating expenses of the class. Expenses before reductions do not reflect amounts reimbursed by the investment adviser or reductions from expense offset arrangements and do not represent the amount paid by the class during periods when reimbursements or reductions occur. Expenses net of fee waivers reflect expenses after reimbursement by the investment adviser but prior to reductions from expense offset arrangements. Expenses net of all reductions represent the net expenses paid by the class but do not include expenses of the investment companies in which the Fund invests.
I Total distributions of $.20 per share is comprised of distributions from net investment income of $.119 and distributions from net realized gain of $.080 per share.
J Total distributions of $.14 per share is comprised of distributions from net investment income of $.124 and distributions from net realized gain of $.012 per share.
See accompanying notes which are an integral part of the financial statements.
Annual Report
Financial Highlights - Investor Class
Years ended December 31, | 2010 | 2009 | 2008 | 2007 G |
Selected Per-Share Data | | | | |
Net asset value, beginning of period | $ 8.82 | $ 7.32 | $ 10.29 | $ 10.00 |
Income from Investment Operations | | | | |
Net investment income (loss) E | .16 | .15 | .23 | .17 |
Net realized and unrealized gain (loss) | 1.04 | 1.50 | (2.99) | .24 |
Total from investment operations | 1.20 | 1.65 | (2.76) | .41 |
Distributions from net investment income | (.12) | (.13) | (.13) | (.06) |
Distributions from net realized gain | (.02) | (.01) | (.08) | (.06) |
Total distributions | (.14) | (.15) J | (.21) I | (.12) |
Net asset value, end of period | $ 9.88 | $ 8.82 | $ 7.32 | $ 10.29 |
Total Return B, C, D | 13.62% | 22.48% | (26.93)% | 4.07% |
Ratios to Average Net Assets F, H | | | | |
Expenses before reductions | .25% | .25% | .25% | .25% A |
Expenses net of fee waivers, if any | .20% | .20% | .20% | .20% A |
Expenses net of all reductions | .20% | .20% | .20% | .20% A |
Net investment income (loss) | 1.77% | 1.89% | 2.75% | 4.76% A |
Supplemental Data | | | | |
Net assets, end of period (000 omitted) | $ 2,584,021 | $ 1,159,764 | $ 593,277 | $ 113,806 |
Portfolio turnover rate | 10% | 38% | 74% | 60% A |
A Annualized
B Total returns for periods of less than one year are not annualized.
C Total returns do not reflect charges attributable to your insurance company's separate account. Inclusion of these charges would reduce the total returns shown.
D Total returns would have been lower had certain expenses not been reduced during the periods shown.
E Calculated based on average shares outstanding during the period.
F Amounts do not include the activity of the underlying funds.
G For the period August 22, 2007 (commencement of operations) to December 31, 2007.
H Expense ratios reflect operating expenses of the class. Expenses before reductions do not reflect amounts reimbursed by the investment adviser or reductions from expense offset arrangements and do not represent the amount paid by the class during periods when reimbursements or reductions occur. Expenses net of fee waivers reflect expenses after reimbursement by the investment adviser but prior to reductions from expense offset arrangements. Expenses net of all reductions represent the net expenses paid by the class but do not include expenses of the investment companies in which the Fund invests.
I Total distributions of $.21 per share is comprised of distributions from net investment income of $.133 and distributions from net realized gain of $.080 per share.
J Total distributions of $.15 per share is comprised of distributions from net investment income of $.134 and distributions from net realized gain of $.012 per share.
See accompanying notes which are an integral part of the financial statements.
Annual Report
VIP FundsManager 70% Portfolio
Investment Changes (Unaudited)
Fund Holdings as of December 31, 2010 |
| % of fund's
net assets | % of fund's net assets
6 months ago |
Domestic Equity Funds | | |
Fidelity 130/30 Large Cap Fund | 0.0* | 0.0* |
Fidelity Air Transportation Portfolio | 0.2 | 0.2 |
Fidelity Automotive Portfolio | 0.1 | 0.1 |
Fidelity Banking Portfolio | 1.2 | 1.1 |
Fidelity Biotechnology Portfolio | 0.5 | 0.5 |
Fidelity Blue Chip Growth Fund | 0.4 | 0.4 |
Fidelity Brokerage & Investment Management Portfolio | 0.5 | 0.5 |
Fidelity Chemicals Portfolio | 0.4 | 0.3 |
Fidelity Commodity Strategy Fund | 0.0* | 0.0 |
Fidelity Communications Equipment Portfolio | 0.2 | 0.2 |
Fidelity Computers Portfolio | 1.4 | 1.3 |
Fidelity Construction & Housing Portfolio | 0.5 | 0.5 |
Fidelity Consumer Discretionary Portfolio | 1.4 | 0.9 |
Fidelity Consumer Staples Portfolio | 4.2 | 4.2 |
Fidelity Contrafund | 0.1 | 0.1 |
Fidelity Defense & Aerospace Portfolio | 0.1 | 0.1 |
Fidelity Disciplined Equity Fund | 0.0 | 0.5 |
Fidelity Dividend Growth Fund | 1.2 | 0.0* |
Fidelity Electronics Portfolio | 0.2 | 0.2 |
Fidelity Energy Portfolio | 3.0 | 3.6 |
Fidelity Energy Service Portfolio | 2.0 | 0.1 |
Fidelity Environmental & Alternative Energy Portfolio | 0.2 | 0.2 |
Fidelity Equity-Income Fund | 0.2 | 1.3 |
Fidelity Equity-Income II Fund | 0.0* | 0.0* |
Fidelity Financial Services Portfolio | 2.0 | 2.2 |
Fidelity Fund | 0.0* | 0.0* |
Fidelity Global Commodity Stock Fund | 0.0* | 0.0 |
Fidelity Gold Portfolio | 1.1 | 0.9 |
Fidelity Growth Company Fund | 0.9 | 0.8 |
Fidelity Health Care Portfolio | 0.8 | 0.6 |
Fidelity Independence Fund | 0.0* | 0.0* |
Fidelity Industrial Equipment Portfolio | 0.9 | 0.7 |
Fidelity Industrials Portfolio | 2.5 | 2.3 |
Fidelity Insurance Portfolio | 1.5 | 1.4 |
Fidelity IT Services Portfolio | 0.4 | 0.3 |
Fidelity Large Cap Stock Fund | 1.3 | 2.4 |
Fidelity Large Cap Value Fund | 0.2 | 0.2 |
Fidelity Leisure Portfolio | 1.0 | 0.6 |
|
| % of fund's
net assets | % of fund's net assets
6 months ago |
Fidelity Leveraged Company Stock Fund | 0.0* | 0.0* |
Fidelity Magellan Fund | 0.0* | 0.0* |
Fidelity Materials Portfolio | 0.3 | 0.2 |
Fidelity Medical Delivery Portfolio | 1.2 | 1.2 |
Fidelity Medical Equipment & Systems Portfolio | 0.2 | 0.8 |
Fidelity Mega Cap Stock Fund | 0.3 | 0.3 |
Fidelity Mid Cap Value Fund | 0.1 | 0.1 |
Fidelity Mid-Cap Stock Fund | 0.0* | 0.0* |
Fidelity Multimedia Portfolio | 0.9 | 0.8 |
Fidelity Nasdaq Composite Index Fund | 0.3 | 0.3 |
Fidelity Natural Resources Portfolio | 0.1 | 0.0* |
Fidelity Pharmaceuticals Portfolio | 1.7 | 1.6 |
Fidelity Real Estate Investment Portfolio | 1.0 | 1.0 |
Fidelity Retailing Portfolio | 0.5 | 0.5 |
Fidelity Series Commodity Strategy Fund | 0.0 | 0.0* |
Fidelity Small Cap Growth Fund | 0.9 | 0.8 |
Fidelity Small Cap Stock Fund | 0.0* | 0.0* |
Fidelity Small Cap Value Fund | 0.2 | 0.2 |
Fidelity Software & Computer Services Portfolio | 0.9 | 1.6 |
Fidelity Technology Portfolio | 4.2 | 2.4 |
Fidelity Telecom and Utilities Fund | 1.2 | 1.2 |
Fidelity Telecommunications Portfolio | 1.0 | 0.8 |
Fidelity Transportation Portfolio | 0.6 | 0.5 |
Fidelity Utilities Portfolio | 0.7 | 0.6 |
Fidelity Value Discovery Fund | 0.0* | 0.0* |
Fidelity Value Fund | 0.3 | 0.3 |
Spartan 500 Index Fund Investor Class | 1.4 | 1.8 |
Spartan Extended Market Index Fund Investor Class | 2.5 | 2.3 |
Spartan Total Market Index Fund Investor Class | 2.1 | 2.1 |
VIP Mid Cap Portfolio Investor Class | 0.7 | 0.7 |
| 53.9 | 50.8 |
International Equity Funds | | |
Fidelity Canada Fund | 0.8 | 0.7 |
Fidelity China Region Fund | 0.2 | 0.2 |
Fidelity Diversified International Fund | 2.2 | 2.2 |
Fund Holdings as of December 31, 2010 - continued |
| % of fund's
net assets | % of fund's net assets
6 months ago |
Fidelity Emerging Asia Fund | 0.0* | 0.0 |
Fidelity Emerging Markets Fund | 1.8 | 1.2 |
Fidelity International Capital Appreciation Fund | 0.9 | 0.9 |
Fidelity International Discovery Fund | 1.6 | 0.9 |
Fidelity International Real Estate Fund | 0.0* | 0.0 |
Fidelity International Small Cap Fund | 0.4 | 0.3 |
Fidelity International Small Cap Opportunities Fund | 0.6 | 0.5 |
Fidelity International Value Fund | 0.3 | 0.1 |
Fidelity Japan Fund | 0.3 | 0.7 |
Fidelity Japan Smaller Companies Fund | 0.0* | 0.0 |
Fidelity Nordic Fund | 1.7 | 0.1 |
Fidelity Overseas Fund | 0.0* | 0.0* |
Fidelity Pacific Basin Fund | 0.3 | 0.1 |
Spartan International Index Fund Investor Class | 10.7 | 10.3 |
| 21.8 | 18.2 |
Fixed-Income Funds | | |
Fidelity Floating Rate High Income Fund | 1.0 | 1.1 |
Fidelity Focused High Income Fund | 0.8 | 0.0 |
Fidelity High Income Fund | 1.5 | 1.2 |
Fidelity New Markets Income Fund | 0.6 | 0.6 |
Fidelity Real Estate Income Fund | 0.4 | 0.4 |
Fidelity U.S. Bond Index Fund | 19.6 | 24.2 |
| 23.9 | 27.5 |
Money Market Funds | | |
Fidelity Institutional Prime Money Market Portfolio Class I | 0.4 | 3.5 |
Net Other Assets (Liabilities)* | 0.0 | 0.0 |
| 100.0 | 100.0 |
* Amount represents less than .01%
Asset Allocation (% of fund's net assets) |
As of December 31, 2010 |
| Domestic Equity Funds | 53.9% | |
| International Equity Funds | 21.8% | |
| Fixed Income Funds | 23.9% | |
| Money Market Funds | 0.4% | |

As of June 30, 2010 |
| Domestic Equity Funds | 50.8% | |
| International Equity Funds | 18.2% | |
| Fixed Income Funds | 27.5% | |
| Money Market Funds | 3.5% | |

Annual Report
VIP FundsManager 70% Portfolio
Investments December 31, 2010
Showing Percentage of Net Assets
Equity Funds - 75.7% |
| Shares | | Value |
Domestic Equity Funds - 53.9% |
Fidelity 130/30 Large Cap Fund | 10,694 | | $ 77,421 |
Fidelity Air Transportation Portfolio | 21,753 | | 921,249 |
Fidelity Automotive Portfolio | 12,440 | | 562,146 |
Fidelity Banking Portfolio | 335,700 | | 6,213,812 |
Fidelity Biotechnology Portfolio (a) | 38,419 | | 2,803,076 |
Fidelity Blue Chip Growth Fund | 47,967 | | 2,175,318 |
Fidelity Brokerage & Investment Management Portfolio | 54,551 | | 2,861,184 |
Fidelity Chemicals Portfolio | 25,104 | | 2,397,455 |
Fidelity Commodity Strategy Fund (a) | 958 | | 11,352 |
Fidelity Communications Equipment Portfolio | 40,872 | | 1,083,519 |
Fidelity Computers Portfolio (a) | 133,377 | | 7,525,117 |
Fidelity Construction & Housing Portfolio | 78,004 | | 2,734,810 |
Fidelity Consumer Discretionary Portfolio | 300,744 | | 7,371,224 |
Fidelity Consumer Staples Portfolio | 334,339 | | 22,852,044 |
Fidelity Contrafund | 9,727 | | 658,809 |
Fidelity Defense & Aerospace Portfolio | 3,920 | | 287,032 |
Fidelity Dividend Growth Fund | 222,059 | | 6,313,124 |
Fidelity Electronics Portfolio | 19,791 | | 957,304 |
Fidelity Energy Portfolio | 309,591 | | 16,185,402 |
Fidelity Energy Service Portfolio | 141,391 | | 10,515,265 |
Fidelity Environmental & Alternative Energy Portfolio | 64,998 | | 1,156,956 |
Fidelity Equity-Income Fund | 22,035 | | 975,257 |
Fidelity Equity-Income II Fund | 504 | | 9,191 |
Fidelity Financial Services Portfolio | 178,951 | | 11,021,597 |
Fidelity Fund | 5,351 | | 172,029 |
Fidelity Global Commodity Stock Fund | 1,568 | | 26,878 |
Fidelity Gold Portfolio | 111,367 | | 5,914,726 |
Fidelity Growth Company Fund | 56,598 | | 4,706,121 |
Fidelity Health Care Portfolio | 32,374 | | 4,034,121 |
Fidelity Independence Fund | 559 | | 13,623 |
Fidelity Industrial Equipment Portfolio | 145,726 | | 4,943,028 |
Fidelity Industrials Portfolio | 558,712 | | 13,219,132 |
Fidelity Insurance Portfolio | 170,568 | | 8,047,386 |
Fidelity IT Services Portfolio (a) | 88,553 | | 1,870,229 |
Fidelity Large Cap Stock Fund | 396,521 | | 6,982,734 |
Fidelity Large Cap Value Fund | 75,219 | | 791,303 |
Fidelity Leisure Portfolio | 61,288 | | 5,586,442 |
Fidelity Leveraged Company Stock Fund | 953 | | 27,083 |
Fidelity Magellan Fund | 894 | | 64,072 |
Fidelity Materials Portfolio | 24,342 | | 1,652,814 |
Fidelity Medical Delivery Portfolio (a) | 131,901 | | 6,552,841 |
Fidelity Medical Equipment & Systems Portfolio (a) | 31,866 | | 878,871 |
Fidelity Mega Cap Stock Fund | 185,294 | | 1,851,082 |
Fidelity Mid Cap Value Fund | 46,778 | | 746,114 |
Fidelity Mid-Cap Stock Fund | 5,983 | | 172,603 |
Fidelity Multimedia Portfolio | 115,954 | | 4,965,167 |
Fidelity Nasdaq Composite Index Fund | 44,023 | | 1,549,616 |
Fidelity Natural Resources Portfolio | 7,763 | | 270,242 |
Fidelity Pharmaceuticals Portfolio | 752,594 | | 9,279,488 |
|
| Shares | | Value |
Fidelity Real Estate Investment Portfolio | 206,543 | | $ 5,306,093 |
Fidelity Retailing Portfolio | 54,367 | | 2,908,106 |
Fidelity Small Cap Growth Fund | 294,313 | | 4,617,778 |
Fidelity Small Cap Stock Fund (a) | 8,025 | | 157,292 |
Fidelity Small Cap Value Fund | 72,649 | | 1,134,048 |
Fidelity Software & Computer Services Portfolio | 58,258 | | 5,095,226 |
Fidelity Technology Portfolio (a) | 235,913 | | 22,555,649 |
Fidelity Telecom and Utilities Fund | 404,855 | | 6,457,435 |
Fidelity Telecommunications Portfolio | 118,899 | | 5,521,671 |
Fidelity Transportation Portfolio | 58,994 | | 3,269,474 |
Fidelity Utilities Portfolio | 79,276 | | 3,835,391 |
Fidelity Value Discovery Fund | 1,606 | | 23,510 |
Fidelity Value Fund | 20,705 | | 1,422,209 |
Spartan 500 Index Fund Investor Class | 168,959 | | 7,515,276 |
Spartan Extended Market Index Fund Investor Class | 354,469 | | 13,530,085 |
Spartan Total Market Index Fund Investor Class | 316,856 | | 11,543,074 |
VIP Mid Cap Portfolio Investor Class | 116,481 | | 3,797,292 |
TOTAL DOMESTIC EQUITY FUNDS | | 290,677,018 |
International Equity Funds - 21.8% |
Fidelity Canada Fund | 72,190 | | 4,197,833 |
Fidelity China Region Fund | 35,909 | | 1,167,417 |
Fidelity Diversified International Fund | 386,298 | | 11,646,880 |
Fidelity Emerging Asia Fund | 1,465 | | 44,870 |
Fidelity Emerging Markets Fund | 370,100 | | 9,752,123 |
Fidelity International Capital Appreciation Fund | 398,253 | | 5,133,487 |
Fidelity International Discovery Fund | 255,342 | | 8,436,497 |
Fidelity International Real Estate Fund | 20,502 | | 192,307 |
Fidelity International Small Cap Fund | 91,422 | | 1,943,627 |
Fidelity International Small Cap Opportunities Fund | 300,042 | | 3,117,433 |
Fidelity International Value Fund | 223,683 | | 1,820,776 |
Fidelity Japan Fund | 129,089 | | 1,443,215 |
Fidelity Japan Smaller Companies Fund | 14,622 | | 134,379 |
Fidelity Nordic Fund | 271,278 | | 9,315,673 |
Fidelity Overseas Fund | 829 | | 26,930 |
Fidelity Pacific Basin Fund | 67,246 | | 1,753,113 |
Spartan International Index Fund Investor Class | 1,643,453 | | 57,800,234 |
TOTAL INTERNATIONAL EQUITY FUNDS | | 117,926,794 |
TOTAL EQUITY FUNDS (Cost $325,589,983) | 408,603,812 |
Fixed-Income Funds - 23.9% |
| | | |
Fidelity Floating Rate High Income Fund | 568,374 | | 5,564,377 |
Fidelity Focused High Income Fund | 483,067 | | 4,449,049 |
Fidelity High Income Fund | 916,313 | | 8,191,838 |
Fidelity New Markets Income Fund | 204,996 | | 3,208,186 |
Fixed-Income Funds - continued |
| Shares | | Value |
Fidelity Real Estate Income Fund | 184,441 | | $ 1,918,184 |
Fidelity U.S. Bond Index Fund | 9,315,960 | | 105,549,822 |
TOTAL FIXED-INCOME FUNDS (Cost $122,599,212) | 128,881,456 |
Money Market Funds - 0.4% |
| | | |
Fidelity Institutional Prime Money Market Portfolio Class I
(Cost $2,173,685) | 2,173,685 | | 2,173,685 |
TOTAL INVESTMENT PORTFOLIO - 100.0% (Cost $450,362,880) | 539,658,953 |
NET OTHER ASSETS (LIABILITIES) - 0.0% | | (88,624) |
NET ASSETS - 100% | $ 539,570,329 |
Legend |
(a) Non-income producing |
Other Information |
All investments are categorized as Level 1 under the Fair Value Hierarchy. The inputs or methodology used for valuing securities may not be an indication of the risk associated with investing in those securities. For more information on valuation inputs, please refer to the Security Valuation section in the accompanying Notes to Financial Statements. |
Income Tax Information |
At December 31, 2010, the Fund had a capital loss carryforward of approximately $134,264,039 of which $51,658,945 and $82,605,094 will expire in fiscal 2016 and 2017, respectively. Capital loss carryforwards are only available to offset future capital gains of the Fund to the extent provided by regulations and may be limited. |
See accompanying notes which are an integral part of the financial statements.
Annual Report
VIP FundsManager 70% Portfolio
Statement of Assets and Liabilities
| December 31, 2010 |
| | |
Assets | | |
Investment in securities, at value (cost $450,362,880) - See accompanying schedule | | $ 539,658,953 |
Receivable for investments sold | | 292 |
Receivable for fund shares sold | | 777,128 |
Total assets | | 540,436,373 |
| | |
Liabilities | | |
Payable to custodian bank | $ 2 | |
Payable for investments purchased | 776,928 | |
Payable for fund shares redeemed | 492 | |
Accrued management fee | 88,305 | |
Distribution and service plan fees payable | 317 | |
Total liabilities | | 866,044 |
| | |
Net Assets | | $ 539,570,329 |
Net Assets consist of: | | |
Paid in capital | | $ 585,050,377 |
Accumulated undistributed net realized gain (loss) on investments | | (134,776,121) |
Net unrealized appreciation (depreciation) on investments | | 89,296,073 |
Net Assets | | $ 539,570,329 |
Statement of Assets and Liabilities - continued
| December 31, 2010 |
| | |
| | |
Service Class:
Net Asset Value, offering price and redemption price per share ($66,610 ÷ 7,025 shares) | | $ 9.48 |
| | |
Service Class 2:
Net Asset Value, offering price and redemption price per share ($2,585,590 ÷ 273,197 shares) | | $ 9.46 |
| | |
Investor Class:
Net Asset Value, offering price and redemption price per share ($536,918,129 ÷ 56,642,527 shares) | | $ 9.48 |
See accompanying notes which are an integral part of the financial statements.
Annual Report
Statement of Operations
| Year ended December 31, 2010 |
| | |
Investment Income | | |
Income distributions from underlying funds | | $ 8,079,611 |
| | |
Expenses | | |
Management fee | $ 1,194,828 | |
Distribution and service plan fees | 5,262 | |
Independent trustees' compensation | 1,679 | |
Total expenses before reductions | 1,201,769 | |
Expense reductions | (241,667) | 960,102 |
Net investment income (loss) | | 7,119,509 |
Realized and Unrealized Gain (Loss) Realized gain (loss) on sale of underlying fund shares | 1,487,679 | |
Capital gain distributions from underlying funds | 2,485,342 | |
Total net realized gain (loss) | | 3,973,021 |
Change in net unrealized appreciation (depreciation) on underlying funds | | 54,824,547 |
Net gain (loss) | | 58,797,568 |
Net increase (decrease) in net assets resulting from operations | | $ 65,917,077 |
Statement of Changes in Net Assets
| Year ended December 31, 2010 | Year ended December 31, 2009 |
Increase (Decrease) in Net Assets | | |
Operations | | |
Net investment income (loss) | $ 7,119,509 | $ 6,234,826 |
Net realized gain (loss) | 3,973,021 | (55,187,420) |
Change in net unrealized appreciation (depreciation) | 54,824,547 | 129,340,992 |
Net increase (decrease) in net assets resulting from operations | 65,917,077 | 80,388,398 |
Distributions to shareholders from net investment income | (7,108,246) | (6,266,412) |
Distributions to shareholders from net realized gain | (1,063,881) | (522,299) |
Total distributions | (8,172,127) | (6,788,711) |
Share transactions - net increase (decrease) | 34,612,388 | 51,384,490 |
Total increase (decrease) in net assets | 92,357,338 | 124,984,177 |
| | |
Net Assets | | |
Beginning of period | 447,212,991 | 322,228,814 |
End of period | $ 539,570,329 | $ 447,212,991 |
See accompanying notes which are an integral part of the financial statements.
Annual Report
Financial Highlights - Service Class
Years ended December 31, | 2010 | 2009 | 2008 | 2007 | 2006 G |
Selected Per-Share Data | | | | | |
Net asset value, beginning of period | $ 8.42 | $ 6.87 | $ 10.65 | $ 10.64 | $ 10.00 |
Income from Investment Operations | | | | | |
Net investment income (loss) E | .13 | .13 | .18 | .24 | .21 |
Net realized and unrealized gain (loss) | 1.08 | 1.55 | (3.53) | .58 | .65 |
Total from investment operations | 1.21 | 1.68 | (3.35) | .82 | .86 |
Distributions from net investment income | (.13) | (.12) | (.18) | (.18) | (.11) |
Distributions from net realized gain | (.02) | (.01) | (.25) | (.63) | (.11) |
Total distributions | (.15) | (.13) | (.43) I | (.81) | (.22) |
Net asset value, end of period | $ 9.48 | $ 8.42 | $ 6.87 | $ 10.65 | $ 10.64 |
Total Return B, C, D | 14.32% | 24.44% | (32.03)% | 7.80% | 8.56% |
Ratios to Average Net Assets F, H | | | | | |
Expenses before reductions | .35% | .35% | .35% | .35% | .35% A |
Expenses net of fee waivers, if any | .20% | .20% | .20% | .20% | .20% A |
Expenses net of all reductions | .20% | .20% | .20% | .20% | .20% A |
Net investment income (loss) | 1.49% | 1.73% | 2.01% | 2.14% | 2.87% A |
Supplemental Data | | | | | |
Net assets, end of period (000 omitted) | $ 67 | $ 68 | $ 68 | $ 117 | $ 109 |
Portfolio turnover rate | 22% | 55% | 84% | 105% | 106% A |
A Annualized
B Total returns for periods of less than one year are not annualized.
C Total returns do not reflect charges attributable to your insurance company's separate account. Inclusion of these charges would reduce the total returns shown.
D Total returns would have been lower had certain expenses not been reduced during the periods shown.
E Calculated based on average shares outstanding during the period.
F Amounts do not include the activity of the underlying funds.
G For the period April 13, 2006 (commencement of operations) to December 31, 2006.
H Expense ratios reflect operating expenses of the class. Expenses before reductions do not reflect amounts reimbursed by the investment adviser or reductions from expense offset arrangements and do not represent the amount paid by the class during periods when reimbursements or reductions occur. Expenses net of fee waivers reflect expenses after reimbursement by the investment adviser but prior to reductions from expense offset arrangements. Expenses net of all reductions represent the net expenses paid by the class but do not include expenses of the investment companies in which the Fund invests.
I Total distributions of $.43 per share is comprised of distributions from net investment income of $.184 and distributions from net realized gain of $.245 per share.
Financial Highlights - Service Class 2
Years ended December 31, | 2010 | 2009 | 2008 | 2007 | 2006 G |
Selected Per-Share Data | | | | | |
Net asset value, beginning of period | $ 8.41 | $ 6.86 | $ 10.65 | $ 10.64 | $ 10.00 |
Income from Investment Operations | | | | | |
Net investment income (loss) E | .12 | .12 | .16 | .22 | .20 |
Net realized and unrealized gain (loss) | 1.07 | 1.55 | (3.53) | .59 | .65 |
Total from investment operations | 1.19 | 1.67 | (3.37) | .81 | .85 |
Distributions from net investment income | (.12) | (.11) | (.18) | (.17) | (.10) |
Distributions from net realized gain | (.02) | (.01) | (.25) | (.63) | (.11) |
Total distributions | (.14) | (.12) | (.42) I | (.80) | (.21) |
Net asset value, end of period | $ 9.46 | $ 8.41 | $ 6.86 | $ 10.65 | $ 10.64 |
Total Return B, C, D | 14.09% | 24.38% | (32.18)% | 7.63% | 8.45% |
Ratios to Average Net Assets F, H | | | | | |
Expenses before reductions | .50% | .50% | .50% | .50% | .50% A |
Expenses net of fee waivers, if any | .35% | .35% | .35% | .35% | .35% A |
Expenses net of all reductions | .35% | .35% | .35% | .35% | .35% A |
Net investment income (loss) | 1.34% | 1.58% | 1.86% | 1.99% | 2.72% A |
Supplemental Data | | | | | |
Net assets, end of period (000 omitted) | $ 2,586 | $ 1,464 | $ 223 | $ 117 | $ 108 |
Portfolio turnover rate | 22% | 55% | 84% | 105% | 106% A |
A Annualized
B Total returns for periods of less than one year are not annualized.
C Total returns do not reflect charges attributable to your insurance company's separate account. Inclusion of these charges would reduce the total returns shown.
D Total returns would have been lower had certain expenses not been reduced during the periods shown.
E Calculated based on average shares outstanding during the period.
F Amounts do not include the activity of the underlying funds.
G For the period April 13, 2006 (commencement of operations) to December 31, 2006.
H Expense ratios reflect operating expenses of the class. Expenses before reductions do not reflect amounts reimbursed by the investment adviser or reductions from expense offset arrangements and do not represent the amount paid by the class during periods when reimbursements or reductions occur. Expenses net of fee waivers reflect expenses after reimbursement by the investment adviser but prior to reductions from expense offset arrangements. Expenses net of all reductions represent the net expenses paid by the class but do not include expenses of the investment companies in which the Fund invests.
I Total distributions of $.42 per share is comprised of distributions from net investment income of $.178 and distributions from net realized gain of $.245 per share.
See accompanying notes which are an integral part of the financial statements.
Annual Report
Financial Highlights - Investor Class
Years ended December 31, | 2010 | 2009 | 2008 | 2007 | 2006 G |
Selected Per-Share Data | | | | | |
Net asset value, beginning of period | $ 8.42 | $ 6.87 | $ 10.65 | $ 10.64 | $ 10.00 |
Income from Investment Operations | | | | | |
Net investment income (loss) E | .13 | .13 | .18 | .24 | .21 |
Net realized and unrealized gain (loss) | 1.08 | 1.55 | (3.53) | .58 | .65 |
Total from investment operations | 1.21 | 1.68 | (3.35) | .82 | .86 |
Distributions from net investment income | (.13) | (.12) | (.18) | (.18) | (.11) |
Distributions from net realized gain | (.02) | (.01) | (.25) | (.63) | (.11) |
Total distributions | (.15) | (.13) | (.43) I | (.81) | (.22) |
Net asset value, end of period | $ 9.48 | $ 8.42 | $ 6.87 | $ 10.65 | $ 10.64 |
Total Return B, C, D | 14.32% | 24.44% | (32.03)% | 7.80% | 8.56% |
Ratios to Average Net Assets F, H | | | | | |
Expenses before reductions | .25% | .25% | .25% | .25% | .25% A |
Expenses net of fee waivers, if any | .20% | .20% | .20% | .20% | .20% A |
Expenses net of all reductions | .20% | .20% | .20% | .20% | .20% A |
Net investment income (loss) | 1.49% | 1.73% | 2.01% | 2.14% | 2.86% A |
Supplemental Data | | | | | |
Net assets, end of period (000 omitted) | $ 536,918 | $ 445,681 | $ 321,938 | $ 444,467 | $ 177,978 |
Portfolio turnover rate | 22% | 55% | 84% | 105% | 106% A |
A Annualized
B Total returns for periods of less than one year are not annualized.
C Total returns do not reflect charges attributable to your insurance company's separate account. Inclusion of these charges would reduce the total returns shown.
D Total returns would have been lower had certain expenses not been reduced during the periods shown.
E Calculated based on average shares outstanding during the period.
F Amounts do not include the activity of the underlying funds.
G For the period April 13, 2006 (commencement of operations) to December 31, 2006.
H Expense ratios reflect operating expenses of the class. Expenses before reductions do not reflect amounts reimbursed by the investment adviser or reductions from expense offset arrangements and do not represent the amount paid by the class during periods when reimbursements or reductions occur. Expenses net of fee waivers reflect expenses after reimbursement by the investment adviser but prior to reductions from expense offset arrangements. Expenses net of all reductions represent the net expenses paid by the class but do not include expenses of the investment companies in which the Fund invests.
I Total distributions of $.43 per share is comprised of distributions from net investment income of $.184 and distributions from net realized gain of $.245 per share.
See accompanying notes which are an integral part of the financial statements.
Annual Report
VIP FundsManager 85% Portfolio
Investment Changes (Unaudited)
Fund Holdings as of December 31, 2010 |
| % of fund's
net assets | % of fund's net assets
6 months ago |
Domestic Equity Funds | | |
Fidelity 130/30 Large Cap Fund | 0.0* | 0.0* |
Fidelity Air Transportation Portfolio | 0.4 | 0.3 |
Fidelity Automotive Portfolio | 0.3 | 0.2 |
Fidelity Banking Portfolio | 1.8 | 1.9 |
Fidelity Biotechnology Portfolio | 0.1 | 0.3 |
Fidelity Blue Chip Growth Fund | 0.3 | 0.3 |
Fidelity Brokerage & Investment Management Portfolio | 0.5 | 0.5 |
Fidelity Chemicals Portfolio | 0.7 | 0.5 |
Fidelity Commodity Strategy Fund | 0.0* | 0.0 |
Fidelity Communications Equipment Portfolio | 0.3 | 0.3 |
Fidelity Computers Portfolio | 2.1 | 2.0 |
Fidelity Construction & Housing Portfolio | 0.6 | 0.6 |
Fidelity Consumer Discretionary Portfolio | 2.4 | 1.8 |
Fidelity Consumer Staples Portfolio | 5.5 | 5.7 |
Fidelity Contrafund | 0.2 | 0.2 |
Fidelity Defense & Aerospace Portfolio | 0.1 | 0.2 |
Fidelity Dividend Growth Fund | 0.0* | 0.0 |
Fidelity Electronics Portfolio | 0.4 | 0.4 |
Fidelity Energy Portfolio | 3.0 | 5.0 |
Fidelity Energy Service Portfolio | 3.5 | 0.4 |
Fidelity Environmental & Alternative Energy Portfolio | 0.3 | 0.3 |
Fidelity Equity-Income Fund | 0.0* | 0.0* |
Fidelity Equity-Income II Fund | 0.0* | 0.0* |
Fidelity Financial Services Portfolio | 2.1 | 3.7 |
Fidelity Global Commodity Stock Fund | 0.8 | 0.0 |
Fidelity Gold Portfolio | 1.3 | 1.3 |
Fidelity Growth Company Fund | 1.1 | 1.4 |
Fidelity Health Care Portfolio | 1.5 | 1.3 |
Fidelity Independence Fund | 0.0* | 0.0* |
Fidelity Industrial Equipment Portfolio | 0.8 | 0.7 |
Fidelity Industrials Portfolio | 3.6 | 3.5 |
Fidelity Insurance Portfolio | 3.0 | 1.9 |
Fidelity IT Services Portfolio | 0.8 | 0.8 |
Fidelity Large Cap Stock Fund | 0.5 | 2.7 |
Fidelity Large Cap Value Fund | 0.1 | 0.0* |
Fidelity Leisure Portfolio | 1.4 | 0.9 |
Fidelity Leveraged Company Stock Fund | 0.0* | 0.0* |
|
| % of fund's
net assets | % of fund's net assets
6 months ago |
Fidelity Magellan Fund | 0.0* | 0.0* |
Fidelity Materials Portfolio | 0.6 | 0.3 |
Fidelity Medical Delivery Portfolio | 1.5 | 1.6 |
Fidelity Medical Equipment & Systems Portfolio | 0.1 | 1.1 |
Fidelity Mega Cap Stock Fund | 0.0 | 1.1 |
Fidelity Mid Cap Value Fund | 0.3 | 0.3 |
Fidelity Mid-Cap Stock Fund | 0.0* | 0.0* |
Fidelity Multimedia Portfolio | 0.8 | 0.7 |
Fidelity Nasdaq Composite Index Fund | 0.2 | 0.3 |
Fidelity Natural Resources Portfolio | 0.1 | 0.1 |
Fidelity Pharmaceuticals Portfolio | 2.7 | 2.4 |
Fidelity Real Estate Investment Portfolio | 0.3 | 1.3 |
Fidelity Retailing Portfolio | 1.0 | 1.0 |
Fidelity Series Commodity Strategy Fund | 0.0 | 0.0* |
Fidelity Small Cap Growth Fund | 0.5 | 0.5 |
Fidelity Small Cap Stock Fund | 0.0* | 0.0* |
Fidelity Small Cap Value Fund | 0.8 | 0.8 |
Fidelity Software & Computer Services Portfolio | 0.3 | 2.2 |
Fidelity Technology Portfolio | 6.4 | 3.0 |
Fidelity Telecom and Utilities Fund | 1.7 | 1.8 |
Fidelity Telecommunications Portfolio | 1.6 | 1.2 |
Fidelity Transportation Portfolio | 1.2 | 1.0 |
Fidelity Utilities Portfolio | 0.7 | 0.7 |
Fidelity Value Discovery Fund | 0.0* | 0.0* |
Spartan 500 Index Fund Investor Class | 2.1 | 2.2 |
Spartan Extended Market Index Fund Investor Class | 0.0* | 0.0* |
Spartan Total Market Index Fund Investor Class | 1.0 | 1.1 |
VIP Mid Cap Portfolio Investor Class | 0.4 | 0.4 |
| 63.8 | 64.2 |
International Equity Funds | | |
Fidelity Canada Fund | 1.0 | 1.0 |
Fidelity China Region Fund | 0.1 | 0.1 |
Fidelity Diversified International Fund | 2.6 | 2.7 |
Fidelity Emerging Asia Fund | 0.0* | 0.0 |
Fidelity Emerging Markets Fund | 2.5 | 1.5 |
Fidelity International Capital Appreciation Fund | 1.3 | 1.3 |
Fund Holdings as of December 31, 2010 - continued |
| % of fund's
net assets | % of fund's net assets
6 months ago |
Fidelity International Discovery Fund | 1.0 | 0.9 |
Fidelity International Real Estate Fund | 0.4 | 0.0 |
Fidelity International Small Cap Fund | 0.3 | 0.3 |
Fidelity International Small Cap Opportunities Fund | 1.1 | 1.0 |
Fidelity International Value Fund | 0.0* | 0.0* |
Fidelity Japan Fund | 0.4 | 1.3 |
Fidelity Japan Smaller Companies Fund | 0.7 | 0.0 |
Fidelity Nordic Fund | 3.4 | 0.2 |
Fidelity Overseas Fund | 0.0* | 0.0* |
Fidelity Pacific Basin Fund | 0.8 | 0.4 |
Spartan International Index Fund Investor Class | 9.9 | 10.8 |
| 25.5 | 21.5 |
Fixed-Income Funds | | |
Fidelity Floating Rate High Income Fund | 0.6 | 0.7 |
Fidelity Focused High Income Fund | 0.2 | 0.0 |
Fidelity High Income Fund | 1.1 | 1.2 |
Fidelity New Markets Income Fund | 1.0 | 1.1 |
Fidelity Real Estate Income Fund | 0.1 | 0.1 |
Fidelity U.S. Bond Index Fund | 7.5 | 10.9 |
| 10.5 | 14.0 |
Money Market Funds | | |
Fidelity Institutional Prime Money Market Portfolio Class I | 0.2 | 0.3 |
Net Other Assets (Liabilities)* | 0.0 | 0.0 |
| 100.0 | 100.0 |
* Amount represents less than 0.1%
Asset Allocation (% of fund's net assets) |
As of December 31, 2010 |
| Domestic Equity Funds | 63.8% | |
| International Equity Funds | 25.5% | |
| Fixed Income Funds | 10.5% | |
| Money Market Funds | 0.2% | |

As of June 30, 2010 |
| Domestic Equity Funds | 64.2% | |
| International Equity Funds | 21.5% | |
| Fixed Income Funds | 14.0% | |
| Money Market Funds | 0.3% | |

Annual Report
VIP FundsManager 85% Portfolio
Investments December 31, 2010
Showing Percentage of Net Assets
Equity Funds - 89.3% |
| Shares | | Value |
Domestic Equity Funds - 63.8% |
Fidelity 130/30 Large Cap Fund | 6,351 | | $ 45,978 |
Fidelity Air Transportation Portfolio | 18,671 | | 790,706 |
Fidelity Automotive Portfolio | 15,288 | | 690,870 |
Fidelity Banking Portfolio | 221,742 | | 4,104,445 |
Fidelity Biotechnology Portfolio (a) | 1,803 | | 131,565 |
Fidelity Blue Chip Growth Fund | 15,659 | | 710,115 |
Fidelity Brokerage & Investment Management Portfolio | 21,900 | | 1,148,651 |
Fidelity Chemicals Portfolio | 17,545 | | 1,675,553 |
Fidelity Commodity Strategy Fund (a) | 958 | | 11,352 |
Fidelity Communications Equipment Portfolio | 25,742 | | 682,415 |
Fidelity Computers Portfolio (a) | 82,328 | | 4,644,960 |
Fidelity Construction & Housing Portfolio | 39,680 | | 1,391,168 |
Fidelity Consumer Discretionary Portfolio | 220,815 | | 5,412,174 |
Fidelity Consumer Staples Portfolio | 182,562 | | 12,478,088 |
Fidelity Contrafund | 6,735 | | 456,159 |
Fidelity Defense & Aerospace Portfolio | 4,332 | | 317,202 |
Fidelity Dividend Growth Fund | 2,795 | | 79,465 |
Fidelity Electronics Portfolio | 17,632 | | 852,849 |
Fidelity Energy Portfolio | 131,179 | | 6,858,019 |
Fidelity Energy Service Portfolio | 107,881 | | 8,023,109 |
Fidelity Environmental & Alternative Energy Portfolio | 32,765 | | 583,212 |
Fidelity Equity-Income Fund | 977 | | 43,258 |
Fidelity Equity-Income II Fund | 1,202 | | 21,940 |
Fidelity Financial Services Portfolio | 77,321 | | 4,762,226 |
Fidelity Global Commodity Stock Fund | 109,628 | | 1,879,023 |
Fidelity Gold Portfolio | 54,486 | | 2,893,745 |
Fidelity Growth Company Fund | 28,860 | | 2,399,715 |
Fidelity Health Care Portfolio | 27,255 | | 3,396,305 |
Fidelity Independence Fund | 420 | | 10,227 |
Fidelity Industrial Equipment Portfolio | 55,551 | | 1,884,273 |
Fidelity Industrials Portfolio | 344,619 | | 8,153,678 |
Fidelity Insurance Portfolio | 144,853 | | 6,834,175 |
Fidelity IT Services Portfolio (a) | 87,008 | | 1,837,616 |
Fidelity Large Cap Stock Fund | 61,788 | | 1,088,093 |
Fidelity Large Cap Value Fund | 9,081 | | 95,532 |
Fidelity Leisure Portfolio | 34,796 | | 3,171,685 |
Fidelity Leveraged Company Stock Fund | 3,068 | | 87,206 |
Fidelity Magellan Fund | 851 | | 60,995 |
Fidelity Materials Portfolio | 18,545 | | 1,259,234 |
Fidelity Medical Delivery Portfolio (a) | 68,485 | | 3,402,339 |
Fidelity Medical Equipment & Systems Portfolio (a) | 8,091 | | 223,143 |
Fidelity Mid Cap Value Fund | 40,474 | | 645,563 |
Fidelity Mid-Cap Stock Fund | 2,425 | | 69,964 |
Fidelity Multimedia Portfolio | 43,432 | | 1,859,750 |
Fidelity Nasdaq Composite Index Fund | 10,441 | | 367,529 |
Fidelity Natural Resources Portfolio | 8,534 | | 297,078 |
Fidelity Pharmaceuticals Portfolio | 494,284 | | 6,094,520 |
Fidelity Real Estate Investment Portfolio | 28,977 | | 744,409 |
|
| Shares | | Value |
Fidelity Retailing Portfolio | 43,714 | | $ 2,338,245 |
Fidelity Small Cap Growth Fund | 70,400 | | 1,104,579 |
Fidelity Small Cap Stock Fund (a) | 3,372 | | 66,101 |
Fidelity Small Cap Value Fund | 115,793 | | 1,807,522 |
Fidelity Software & Computer Services Portfolio | 7,557 | | 660,930 |
Fidelity Technology Portfolio (a) | 152,918 | | 14,620,531 |
Fidelity Telecom and Utilities Fund | 243,328 | | 3,881,077 |
Fidelity Telecommunications Portfolio | 77,565 | | 3,602,139 |
Fidelity Transportation Portfolio | 50,367 | | 2,791,346 |
Fidelity Utilities Portfolio | 34,362 | | 1,662,411 |
Fidelity Value Discovery Fund | 582 | | 8,524 |
Spartan 500 Index Fund Investor Class | 109,301 | | 4,861,729 |
Spartan Extended Market Index Fund Investor Class | 183 | | 6,996 |
Spartan Total Market Index Fund Investor Class | 63,908 | | 2,328,155 |
VIP Mid Cap Portfolio Investor Class | 26,971 | | 879,258 |
TOTAL DOMESTIC EQUITY FUNDS | | 145,290,819 |
International Equity Funds - 25.5% |
Fidelity Canada Fund | 38,580 | | 2,243,426 |
Fidelity China Region Fund | 4,967 | | 161,475 |
Fidelity Diversified International Fund | 199,519 | | 6,015,496 |
Fidelity Emerging Asia Fund | 2,476 | | 75,817 |
Fidelity Emerging Markets Fund | 214,328 | | 5,647,537 |
Fidelity International Capital Appreciation Fund | 221,152 | | 2,850,654 |
Fidelity International Discovery Fund | 65,854 | | 2,175,826 |
Fidelity International Real Estate Fund | 103,939 | | 974,951 |
Fidelity International Small Cap Fund | 35,211 | | 748,591 |
Fidelity International Small Cap Opportunities Fund | 229,457 | | 2,384,054 |
Fidelity International Value Fund | 6,228 | | 50,695 |
Fidelity Japan Fund | 83,427 | | 932,712 |
Fidelity Japan Smaller Companies Fund | 182,615 | | 1,678,231 |
Fidelity Nordic Fund | 223,015 | | 7,658,327 |
Fidelity Overseas Fund | 326 | | 10,598 |
Fidelity Pacific Basin Fund | 71,328 | | 1,859,509 |
Spartan International Index Fund Investor Class | 639,585 | | 22,494,202 |
TOTAL INTERNATIONAL EQUITY FUNDS | | 57,962,101 |
TOTAL EQUITY FUNDS (Cost $160,834,382) | 203,252,920 |
Fixed-Income Funds - 10.5% |
| | | |
Fidelity Floating Rate High Income Fund | 134,077 | | 1,312,611 |
Fidelity Focused High Income Fund | 65,611 | | 604,280 |
Fidelity High Income Fund | 272,957 | | 2,440,238 |
Fidelity New Markets Income Fund | 143,095 | | 2,239,435 |
Fixed-Income Funds - continued |
| Shares | | Value |
Fidelity Real Estate Income Fund | 21,945 | | $ 228,228 |
Fidelity U.S. Bond Index Fund | 1,514,913 | | 17,163,970 |
TOTAL FIXED-INCOME FUNDS (Cost $22,537,357) | 23,988,762 |
Money Market Funds - 0.2% |
| | | |
Fidelity Institutional Prime Money Market Portfolio Class I
(Cost $512,676) | 512,676 | | 512,676 |
TOTAL INVESTMENT PORTFOLIO - 100.0% (Cost $183,884,415) | 227,754,358 |
NET OTHER ASSETS (LIABILITIES) - 0.0% | | (37,289) |
NET ASSETS - 100% | $ 227,717,069 |
Legend |
(a) Non-income producing |
Other Information |
All investments are categorized as Level 1 under the Fair Value Hierarchy. The inputs or methodology used for valuing securities may not be an indication of the risk associated with investing in those securities. For more information on valuation inputs, please refer to the Security Valuation section in the accompanying Notes to Financial Statements. |
Income Tax Information |
At December 31, 2010, the Fund had a capital loss carryforward of approximately $63,847,958 of which $19,300,049 and $44,547,909 will expire in fiscal 2016 and 2017, respectively. Capital loss carryforwards are only available to offset future capital gains of the Fund to the extent provided by regulations and may be limited. |
See accompanying notes which are an integral part of the financial statements.
Annual Report
VIP FundsManager 85% Portfolio
Statement of Assets and Liabilities
| December 31, 2010 |
| | |
Assets | | |
Investment in securities, at value (cost $183,884,415) - See accompanying schedule | | $ 227,754,358 |
Cash | | 10 |
Receivable for investments sold | | 73,283 |
Receivable for fund shares sold | | 60 |
Total assets | | 227,827,711 |
| | |
Liabilities | | |
Payable for fund shares redeemed | $ 73,342 | |
Accrued management fee | 37,036 | |
Distribution and service plan fees payable | 264 | |
Total liabilities | | 110,642 |
| | |
Net Assets | | $ 227,717,069 |
Net Assets consist of: | | |
Paid in capital | | $ 247,926,023 |
Accumulated undistributed net realized gain (loss) on investments | | (64,078,897) |
Net unrealized appreciation (depreciation) on investments | | 43,869,943 |
Net Assets | | $ 227,717,069 |
Statement of Assets and Liabilities - continued
| December 31, 2010 |
| | |
| | |
Service Class:
Net Asset Value, offering price and redemption price per share ($108,321 ÷ 11,783 shares) | | $ 9.19 |
| | |
Service Class 2:
Net Asset Value, offering price and redemption price per share ($2,384,146 ÷ 259,936 shares) | | $ 9.17 |
| | |
Investor Class:
Net Asset Value, offering price and redemption price per share ($225,224,602 ÷ 24,483,933 shares) | | $ 9.20 |
See accompanying notes which are an integral part of the financial statements.
Annual Report
VIP FundsManager 85% Portfolio
Financial Statements - continued
Statement of Operations
| Year ended December 31, 2010 |
| | |
Investment Income | | |
Income distributions from underlying funds | | $ 2,720,719 |
| | |
Expenses | | |
Management fee | $ 483,619 | |
Distribution and service plan fees | 3,666 | |
Independent trustees' compensation | 676 | |
Total expenses before reductions | 487,961 | |
Expense reductions | (98,480) | 389,481 |
Net investment income (loss) | | 2,331,238 |
Realized and Unrealized Gain (Loss) Realized gain (loss) on sale of underlying fund shares | 4,434,132 | |
Capital gain distributions from underlying funds | 921,942 | |
Total net realized gain (loss) | | 5,356,074 |
Change in net unrealized appreciation (depreciation) on underlying funds | | 21,545,551 |
Net gain (loss) | | 26,901,625 |
Net increase (decrease) in net assets resulting from operations | | $ 29,232,863 |
Statement of Changes in Net Assets
| Year ended December 31, 2010 | Year ended December 31, 2009 |
Increase (Decrease) in Net Assets | | |
Operations | | |
Net investment income (loss) | $ 2,331,238 | $ 2,139,971 |
Net realized gain (loss) | 5,356,074 | (30,922,006) |
Change in net unrealized appreciation (depreciation) | 21,545,551 | 65,058,238 |
Net increase (decrease) in net assets resulting from operations | 29,232,863 | 36,276,203 |
Distributions to shareholders from net investment income | (2,346,549) | (2,120,056) |
Distributions to shareholders from net realized gain | (529,855) | (245,543) |
Total distributions | (2,876,404) | (2,365,599) |
Share transactions - net increase (decrease) | 19,899,359 | 26,583,560 |
Total increase (decrease) in net assets | 46,255,818 | 60,494,164 |
| | |
Net Assets | | |
Beginning of period | 181,461,251 | 120,967,087 |
End of period (including undistributed net investment income of $0 and undistributed net investment income of $19,915, respectively) | $ 227,717,069 | $ 181,461,251 |
See accompanying notes which are an integral part of the financial statements.
Annual Report
Financial Highlights - Service Class
Years ended December 31, | 2010 | 2009 | 2008 | 2007 | 2006 G |
Selected Per-Share Data | | | | | |
Net asset value, beginning of period | $ 8.02 | $ 6.32 | $ 10.76 | $ 10.72 | $ 10.00 |
Income from Investment Operations | | | | | |
Net investment income (loss) E | .10 | .11 | .13 | .17 | .17 |
Net realized and unrealized gain (loss) | 1.19 | 1.70 | (4.14) | .74 | .74 |
Total from investment operations | 1.29 | 1.81 | (4.01) | .91 | .91 |
Distributions from net investment income | (.10) | (.10) | (.13) | (.13) | (.08) |
Distributions from net realized gain | (.02) | (.01) | (.30) | (.74) | (.11) |
Total distributions | (.12) | (.11) | (.43) I | (.87) | (.19) |
Net asset value, end of period | $ 9.19 | $ 8.02 | $ 6.32 | $ 10.76 | $ 10.72 |
Total Return B, C, D | 16.07% | 28.56% | (38.14)% | 8.52% | 9.09% |
Ratios to Average Net Assets F, H | | | | | |
Expenses before reductions | .35% | .35% | .35% | .35% | .35% A |
Expenses net of fee waivers, if any | .20% | .20% | .20% | .20% | .20% A |
Expenses net of all reductions | .20% | .20% | .20% | .20% | .20% A |
Net investment income (loss) | 1.20% | 1.53% | 1.52% | 1.48% | 2.33% A |
Supplemental Data | | | | | |
Net assets, end of period (000 omitted) | $ 108 | $ 112 | $ 62 | $ 118 | $ 109 |
Portfolio turnover rate | 38% | 66% | 92% | 104% | 111% A |
A Annualized
B Total returns for periods of less than one year are not annualized.
C Total returns do not reflect charges attributable to your insurance company's separate account. Inclusion of these charges would reduce the total returns shown.
D Total returns would have been lower had certain expenses not been reduced during the periods shown.
E Calculated based on average shares outstanding during the period.
F Amounts do not include the activity of the underlying funds.
G For the period April 13, 2006 (commencement of operations) to December 31, 2006.
H Expense ratios reflect operating expenses of the class. Expenses before reductions do not reflect amounts reimbursed by the investment adviser or reductions from expense offset arrangements and do not represent the amount paid by the class during periods when reimbursements or reductions occur. Expenses net of fee waivers reflect expenses after reimbursement by the investment adviser but prior to reductions from expense offset arrangements. Expenses net of all reductions represent the net expenses paid by the class but do not include expenses of the investment companies in which the Fund invests.
I Total distributions of $.43 per share is comprised of distributions from net investment income of $.126 and distributions from net realized gain of $.300 per share.
Financial Highlights - Service Class 2
Years ended December 31, | 2010 | 2009 | 2008 | 2007 | 2006 G |
Selected Per-Share Data | | | | | |
Net asset value, beginning of period | $ 8.00 | $ 6.32 | $ 10.76 | $ 10.72 | $ 10.00 |
Income from Investment Operations | | | | | |
Net investment income (loss) E | .09 | .10 | .11 | .15 | .16 |
Net realized and unrealized gain (loss) | 1.19 | 1.68 | (4.13) | .74 | .74 |
Total from investment operations | 1.28 | 1.78 | (4.02) | .89 | .90 |
Distributions from net investment income | (.09) | (.09) | (.12) | (.11) | (.07) |
Distributions from net realized gain | (.02) | (.01) | (.30) | (.74) | (.11) |
Total distributions | (.11) | (.10) | (.42) I | (.85) | (.18) |
Net asset value, end of period | $ 9.17 | $ 8.00 | $ 6.32 | $ 10.76 | $ 10.72 |
Total Return B, C, D | 16.00% | 28.17% | (38.19)% | 8.36% | 8.99% |
Ratios to Average Net Assets F, H | | | | | |
Expenses before reductions | .50% | .50% | .50% | .50% | .50% A |
Expenses net of fee waivers, if any | .35% | .35% | .35% | .35% | .35% A |
Expenses net of all reductions | .35% | .35% | .35% | .35% | .35% A |
Net investment income (loss) | 1.05% | 1.38% | 1.37% | 1.33% | 2.17% A |
Supplemental Data | | | | | |
Net assets, end of period (000 omitted) | $ 2,384 | $ 886 | $ 254 | $ 118 | $ 109 |
Portfolio turnover rate | 38% | 66% | 92% | 104% | 111% A |
A Annualized
B Total returns for periods of less than one year are not annualized.
C Total returns do not reflect charges attributable to your insurance company's separate account. Inclusion of these charges would reduce the total returns shown.
D Total returns would have been lower had certain expenses not been reduced during the periods shown.
E Calculated based on average shares outstanding during the period.
F Amounts do not include the activity of the underlying funds.
G For the period April 13, 2006 (commencement of operations) to December 31, 2006.
H Expense ratios reflect operating expenses of the class. Expenses before reductions do not reflect amounts reimbursed by the investment adviser or reductions from expense offset arrangements and do not represent the amount paid by the class during periods when reimbursements or reductions occur. Expenses net of fee waivers reflect expenses after reimbursement by the investment adviser but prior to reductions from expense offset arrangements. Expenses net of all reductions represent the net expenses paid by the class but do not include expenses of the investment companies in which the Fund invests.
I Total distributions of $.42 per share is comprised of distributions from net investment income of $.121 and distributions from net realized gain of $.300 per share.
See accompanying notes which are an integral part of the financial statements.
Annual Report
Financial Highlights - Investor Class
Years ended December 31, | 2010 | 2009 | 2008 | 2007 | 2006 G |
Selected Per-Share Data | | | | | |
Net asset value, beginning of period | $ 8.02 | $ 6.32 | $ 10.77 | $ 10.72 | $ 10.00 |
Income from Investment Operations | | | | | |
Net investment income (loss) E | .10 | .11 | .13 | .17 | .17 |
Net realized and unrealized gain (loss) | 1.20 | 1.70 | (4.15) | .75 | .74 |
Total from investment operations | 1.30 | 1.81 | (4.02) | .92 | .91 |
Distributions from net investment income | (.10) | (.10) | (.13) | (.13) | (.08) |
Distributions from net realized gain | (.02) | (.01) | (.30) | (.74) | (.11) |
Total distributions | (.12) | (.11) | (.43) I | (.87) | (.19) |
Net asset value, end of period | $ 9.20 | $ 8.02 | $ 6.32 | $ 10.77 | $ 10.72 |
Total Return B, C, D | 16.20% | 28.56% | (38.20)% | 8.63% | 9.09% |
Ratios to Average Net Assets F, H | | | | | |
Expenses before reductions | .25% | .25% | .25% | .25% | .25% A |
Expenses net of fee waivers, if any | .20% | .20% | .20% | .20% | .20% A |
Expenses net of all reductions | .20% | .20% | .20% | .20% | .20% A |
Net investment income (loss) | 1.20% | 1.53% | 1.52% | 1.48% | 2.32% A |
Supplemental Data | | | | | |
Net assets, end of period (000 omitted) | $ 225,225 | $ 180,463 | $ 120,650 | $ 176,456 | $ 72,095 |
Portfolio turnover rate | 38% | 66% | 92% | 104% | 111% A |
A Annualized
B Total returns for periods of less than one year are not annualized.
C Total returns do not reflect charges attributable to your insurance company's separate account. Inclusion of these charges would reduce the total returns shown.
D Total returns would have been lower had certain expenses not been reduced during the periods shown.
E Calculated based on average shares outstanding during the period.
F Amounts do not include the activity of the underlying funds.
G For the period April 13, 2006 (commencement of operations) to December 31, 2006.
H Expense ratios reflect operating expenses of the class. Expenses before reductions do not reflect amounts reimbursed by the investment adviser or reductions from expense offset arrangements and do not represent the amount paid by the class during periods when reimbursements or reductions occur. Expenses net of fee waivers reflect expenses after reimbursement by the investment adviser but prior to reductions from expense offset arrangements. Expenses net of all reductions represent the net expenses paid by the class but do not include expenses of the investment companies in which the Fund invests.
I Total distributions of $.43 per share is comprised of distributions from net investment income of $.126 and distributions from net realized gain of $.300 per share.
See accompanying notes which are an integral part of the financial statements.
Annual Report
Notes to Financial Statements
For the period ended December 31, 2010
1. Organization.
VIP FundsManager 20% Portfolio, VIP FundsManager 50% Portfolio, VIP FundsManager 60% Portfolio, VIP FundsManager 70% Portfolio and VIP FundsManager 85% Portfolio, (the Funds) are funds of Variable Insurance Products Fund V. Variable Insurance Products Fund V (the Trust) (referred to in this report as Fidelity Variable Insurance Products) is registered under the Investment Company Act of 1940, as amended (the 1940 Act), as an open-end management investment company organized as a Massachusetts business trust. Each Fund is authorized to issue an unlimited number of shares. The Funds invest primarily in a combination of other Fidelity equity, fixed income and short-term funds (the Underlying Funds) managed by Fidelity Management & Research Company (FMR). Shares of each Fund may only be purchased by insurance companies for the purpose of funding variable annuity or variable life insurance contracts. Each Fund offers three classes of shares: Investor Class shares, Service Class shares and Service Class 2 shares. All classes have equal rights and voting privileges, except for matters affecting a single class. Investment income, realized and unrealized capital gains and losses, the common expenses of the Fund, and certain fund-level expense reductions, if any, are allocated on a pro-rata basis to each class based on the relative net assets of each class to the total net assets of the Fund. Each class differs with respect to distribution and service plan fees incurred. Certain expense reductions may also differ by class.
2. Significant Accounting Policies.
The financial statements have been prepared in conformity with accounting principles generally accepted in the United States of America (GAAP), which require management to make certain estimates and assumptions at the date of the financial statements. Actual results could differ from those estimates. Subsequent events, if any, through the date that the financial statements were issued have been evaluated in the preparation of the financial statements. The following summarizes the significant accounting policies of the Funds:
Security Valuation. Investments are valued as of 4:00 p.m. Eastern time on the last calendar day of the period. Each Fund categorizes the inputs to valuation techniques used to value their investments into a disclosure hierarchy consisting of three levels as shown below.
Level 1 - quoted prices in active markets for identical investments
Level 2 - other significant observable inputs (including quoted prices for similar investments, interest rates, prepayment speeds, etc.)
Level 3 - unobservable inputs (including the Fund's own assumptions based on the best information available)
Valuation techniques used to value each Fund's investments by major category are as follows. Investments in the Underlying Funds are valued at their closing net asset value (NAV) each business day and are categorized as Level 1 in the hierarchy.
Investment Transactions and Income. For financial reporting purposes, the Funds' investment holdings and NAV include trades executed through the end of the last business day of the period. The NAV per share for processing shareholder transactions is calculated as of the close of business of the New York Stock Exchange (NYSE), normally 4:00 p.m. Eastern time and includes trades executed through the end of the prior business day. Gains and losses on securities sold are determined on the basis of identified cost. Income and capital gain distributions from the Underlying Funds, if any, are recorded on the ex-dividend date.
Expenses. Expenses directly attributable to a fund are charged to that fund. Expenses attributable to more than one fund are allocated among the respective funds on the basis of relative net assets or other appropriate methods. Expenses included in the accompanying financial statements reflect the expenses of the Fund and do not include any expenses associated with the Underlying Funds. Expense estimates are accrued in the period to which they relate and adjustments are made when actual amounts are known.
Income Tax Information and Distributions to Shareholders. Each year each Fund intends to qualify as a regulated investment company, including distributing substantially all of its taxable income and realized gains under Subchapter M of the Internal Revenue Code and filing its U.S. federal tax return. As a result, no provision for income taxes is required. As of December 31, 2010, each Fund did not have any unrecognized tax benefits in the accompanying financial statements. A fund's federal tax return is subject to examination by the Internal Revenue Service (IRS) for a period of three years.
Distributions are declared and recorded on the ex-dividend date. Income dividends and capital gain distributions are declared separately for each class. Income and capital gain distributions are determined in accordance with income tax regulations, which may differ from GAAP.
Capital accounts within the financial statements are adjusted for permanent book-tax differences. These adjustments have no impact on net assets or the results of operations. Temporary book-tax differences will reverse in a subsequent period.
Book-tax differences are primarily due to the short-term gain distributions from the Underlying Funds, capital loss carryforwards and losses deferred due to wash sales and excise tax regulations.
Annual Report
2. Significant Accounting Policies - continued
Income Tax Information and Distributions to Shareholders - continued
The federal tax cost of investment securities and unrealized appreciation (depreciation) as of period end were as follows for each Fund:
| Tax cost | Gross unrealized
appreciation | Gross unrealized
depreciation | Net unrealized appreciation
(depreciation) |
VIP FundsManager 20% Portfolio | $ 366,386,329 | $ 26,334,636 | $ (794,042) | $ 25,540,594 |
VIP FundsManager 50% Portfolio | 583,332,950 | 92,445,820 | (2,943,978) | 89,501,842 |
VIP FundsManager 60% Portfolio | 2,222,705,978 | 370,023,272 | (8,109,008) | 361,914,264 |
VIP FundsManager 70% Portfolio | 450,874,965 | 93,278,731 | (4,494,743) | 88,783,988 |
VIP FundsManager 85% Portfolio | 184,115,353 | 45,633,436 | (1,994,431) | 43,639,005 |
The tax-based components of distributable earnings as of period end were as follows for each Fund:
| Capital loss
carryforward | Net unrealized
appreciation
(depreciation) |
VIP FundsManager 20% Portfolio | $ (11,488,547) | $ 25,540,594 |
VIP FundsManager 50% Portfolio | (85,066,507) | 89,501,842 |
VIP FundsManager 60% Portfolio | (80,163,922) | 361,914,264 |
VIP FundsManager 70% Portfolio | (134,264,039) | 88,783,988 |
VIP FundsManager 85% Portfolio | (63,847,958) | 43,639,005 |
The tax character of distributions paid was as follows:
December 31, 2010 | Ordinary
Income |
VIP FundsManager 20% Portfolio | $ 6,555,665 |
VIP FundsManager 50% Portfolio | 11,459,833 |
VIP FundsManager 60% Portfolio | 36,168,788 |
VIP FundsManager 70% Portfolio | 8,172,127 |
VIP FundsManager 85% Portfolio | 2,876,404 |
December 31, 2009 | Ordinary
Income |
VIP FundsManager 20% Portfolio | $ 4,415,461 |
VIP FundsManager 50% Portfolio | 8,874,449 |
VIP FundsManager 60% Portfolio | 18,762,914 |
VIP FundsManager 70% Portfolio | 6,788,711 |
VIP FundsManager 85% Portfolio | 2,365,599 |
3. Purchases and Sales of Investments.
Purchases and redemptions of the Underlying Fund shares are noted in the table below.
| Purchases ($) | Redemptions ($) |
VIP FundsManager 20% Portfolio | 151,149,729 | 46,837,514 |
VIP FundsManager 50% Portfolio | 191,360,693 | 92,961,621 |
VIP FundsManager 60% Portfolio | 1,372,959,233 | 168,916,244 |
VIP FundsManager 70% Portfolio | 140,459,681 | 104,399,534 |
VIP FundsManager 85% Portfolio | 94,006,472 | 73,722,706 |
Annual Report
Notes to Financial Statements - continued
4. Fees and Other Transactions with Affiliates.
Management Fee. Strategic Advisers, Inc. (Strategic Advisers), an affiliate of FMR, provides the funds with investment management related services. For these services each fund pays a monthly management fee to Strategic Advisers. The management fee is based on an annual rate of ..25% of each fund's average net assets. The management fee is reduced by an amount equal to the fees and expenses paid by the fund to the independent Trustees.
Strategic Advisers has contractually agreed to waive 0.05% of its management fee, thereby limiting each fund's management fee to an annual rate of 0.20% of average net assets, until April 30, 2011.
Other Transactions. Strategic Advisers has entered into an administration agreement with FMR under which FMR provides management and administrative services (other than investment advisory services) necessary for the operation of each Fund. Pursuant to this agreement, FMR pays all expenses of each Fund, excluding the distribution and service fees, the compensation of the independent Trustees and certain other expenses such as interest expense. FMR also contracts with other Fidelity companies to perform the services necessary for the operation of each Fund.
Distribution and Service Plan Fees. In accordance with Rule 12b-1 of the 1940 Act, the Funds have adopted separate 12b-1 Plans for each Service Class of shares. Each Service Class pays Fidelity Distributors Corporation (FDC), an affiliate of FMR, a service fee. For the period, the service fee is based on an annual rate of .10% of Service Class' average net assets and .25% of Service Class 2's average net assets.
For the period, total fees, all of which were reallowed to insurance companies for the distribution of shares and providing shareholder support services were as follows:
| Service
Class | Service
Class 2 | Total |
VIP FundsManager 20% Portfolio | $ 64 | $ 1,125 | $ 1,189 |
VIP FundsManager 50% Portfolio | 78 | 2,331 | 2,409 |
VIP FundsManager 60% Portfolio | 54 | 264 | 318 |
VIP FundsManager 70% Portfolio | 65 | 5,197 | 5,262 |
VIP FundsManager 85% Portfolio | 101 | 3,565 | 3,666 |
5. Expense Reductions.
Strategic Advisers contractually agreed to limit each funds' management fee to an annual rate of 0.20% of each funds' average net assets until April 30, 2011. For the period, each fund's management fees were reduced by the following amounts:
| Management Fee
Waiver |
VIP FundsManager 20% Portfolio | $ 165,168 |
VIP FundsManager 50% Portfolio | 288,049 |
VIP FundsManager 60% Portfolio | 869,511 |
VIP FundsManager 70% Portfolio | 239,512 |
VIP FundsManager 85% Portfolio | 96,939 |
In addition, FMR has contractually agreed to reimburse 0.10% of class-level expenses for each fund's Service class and Service Class 2. During the period, this reimbursement reduced each fund's Service class and Service class 2's expenses by the following amounts:
| Reimbursement |
VIP FundsManager 20% Portfolio | |
Service Class | $ 64 |
Service Class 2 | 452 |
VIP FundsManager 50% Portfolio | |
Service Class | 78 |
Service Class 2 | 937 |
VIP FundsManager 60% Portfolio | |
Service Class | 54 |
Service Class 2 | 105 |
VIP FundsManager 70% Portfolio | |
Service Class | 65 |
Service Class 2 | 2,090 |
VIP FundsManager 85% Portfolio | |
Service Class | 101 |
Service Class 2 | 1,440 |
Annual Report
6. Distributions to Shareholders.
Distributions to shareholders of each class were as follows:
Years ended December 31, | 2010 | 2009 |
VIP FundsManager 20% Portfolio | | |
From net investment income | | |
Service Class | $ 1,048 | $ 965 |
Service Class 2 | 8,152 | 4,885 |
Investor Class | 6,075,567 | 4,250,965 |
Total | $ 6,084,767 | $ 4,256,815 |
From net realized gain | | |
Service Class | $ 81 | $ 36 |
Service Class 2 | 684 | 189 |
Investor Class | 470,133 | 158,421 |
Total | $ 470,898 | $ 158,646 |
VIP FundsManager 50% Portfolio | | |
From net investment income | | |
Service Class | $ 939 | $ 930 |
Service Class 2 | 14,288 | 8,449 |
Investor Class | 10,252,106 | 8,306,903 |
Total | $ 10,267,333 | $ 8,316,282 |
From net realized gain | | |
Service Class | $ 109 | $ 62 |
Service Class 2 | 1,824 | 595 |
Investor Class | 1,190,567 | 557,510 |
Total | $ 1,192,500 | $ 558,167 |
VIP FundsManager 60% Portfolio | | |
From net investment income | | |
Service Class | $ 721 | $ 772 |
Service Class 2 | 1,352 | 1,144 |
Investor Class | 30,779,852 | 17,218,833 |
Total | $ 30,781,925 | $ 17,220,749 |
From net realized gain | | |
Service Class | $ 126 | $ 69 |
Service Class 2 | 263 | 111 |
Investor Class | 5,386,474 | 1,541,985 |
Total | $ 5,386,863 | $ 1,542,165 |
VIP FundsManager 70% Portfolio | | |
From net investment income | | |
Service Class | $ 879 | $ 954 |
Service Class 2 | 31,248 | 19,060 |
Investor Class | 7,076,119 | 6,246,398 |
Total | $ 7,108,246 | $ 6,266,412 |
From net realized gain | | |
Service Class | $ 131 | $ 79 |
Service Class 2 | 5,118 | 1,687 |
Investor Class | 1,058,632 | 520,533 |
Total | $ 1,063,881 | $ 522,299 |
VIP FundsManager 85% Portfolio | | |
From net investment income | | |
Service Class | $ 1,117 | $ 1,310 |
Service Class 2 | 22,357 | 9,829 |
Investor Class | 2,323,075 | 2,108,917 |
Total | $ 2,346,549 | $ 2,120,056 |
From net realized gain | | |
Service Class | $ 265 | $ 152 |
Service Class 2 | 4,938 | 1,201 |
Investor Class | 524,652 | 244,190 |
Total | $ 529,855 | $ 245,543 |
Annual Report
Notes to Financial Statements - continued
7. Share Transactions.
Transactions for each class of shares were as follows:
| Shares | Dollars |
Years ended December 31, | 2010 | 2009 | 2010 | 2009 |
VIP FundsManager 20% Portfolio | | | | |
Service Class | | | | |
Shares sold | 659 | 978 | $ 6,790 | $ 9,382 |
Reinvestment of distributions | 106 | 99 | 1,129 | 1,001 |
Shares redeemed | (511) | (4,477) | (5,283) | (42,902) |
Net increase (decrease) | 254 | (3,400) | $ 2,636 | $ (32,519) |
Service Class 2 | | | | |
Shares sold | 41,662 | 45,211 | $ 429,404 | $ 452,984 |
Reinvestment of distributions | 834 | 503 | 8,836 | 5,074 |
Shares redeemed | (31,113) | (13,023) | (317,711) | (128,156) |
Net increase (decrease) | 11,383 | 32,691 | $ 120,529 | $ 329,902 |
Investor Class | | | | |
Shares sold | 11,323,659 | 11,891,398 | $ 117,452,842 | $ 116,489,148 |
Reinvestment of distributions | 616,937 | 437,439 | 6,545,700 | 4,409,386 |
Shares redeemed | (2,038,861) | (1,934,550) | (21,152,505) | (18,161,417) |
Net increase (decrease) | 9,901,735 | 10,394,287 | $ 102,846,037 | $ 102,737,117 |
VIP FundsManager 50% Portfolio | | | | |
Service Class | | | | |
Shares sold | 5,522 | 454 | $ 51,566 | $ 3,627 |
Reinvestment of distributions | 105 | 108 | 1,048 | 992 |
Shares redeemed | (5,815) | (3,965) | (55,467) | (32,043) |
Net increase (decrease) | (188) | (3,403) | $ (2,853) | $ (27,424) |
Service Class 2 | | | | |
Shares sold | 75,310 | 56,741 | $ 705,935 | $ 491,928 |
Reinvestment of distributions | 1,613 | 989 | 16,112 | 9,044 |
Shares redeemed | (34,407) | (27,505) | (330,903) | (222,177) |
Net increase (decrease) | 42,516 | 30,225 | $ 391,144 | $ 278,795 |
Investor Class | | | | |
Shares sold | 13,058,689 | 16,534,289 | $ 124,486,934 | $ 139,580,121 |
Reinvestment of distributions | 1,143,124 | 968,788 | 11,442,673 | 8,864,413 |
Shares redeemed | (4,274,874) | (3,370,095) | (40,101,396) | (25,453,963) |
Net increase (decrease) | 9,926,939 | 14,132,982 | $ 95,828,211 | $ 122,990,571 |
VIP FundsManager 60% Portfolio | | | | |
Service Class | | | | |
Shares sold | 248 | 478 | $ 2,278 | $ 3,601 |
Reinvestment of distributions | 86 | 95 | 847 | 841 |
Shares redeemed | (90) | (3,590) | (820) | (27,407) |
Net increase (decrease) | 244 | (3,017) | $ 2,305 | $ (22,965) |
Service Class 2 | | | | |
Shares sold | 6,329 | 2,609 | $ 58,369 | $ 23,283 |
Reinvestment of distributions | 164 | 141 | 1,615 | 1,255 |
Shares redeemed | (3,203) | (3,710) | (30,616) | (28,584) |
Net increase (decrease) | 3,290 | (960) | $ 29,368 | $ (4,046) |
Investor Class | | | | |
Shares sold | 132,846,745 | 51,668,258 | $ 1,219,167,948 | $ 378,354,498 |
Reinvestment of distributions | 3,664,268 | 2,115,087 | 36,166,326 | 18,760,818 |
Shares redeemed | (6,444,533) | (3,393,129) | (58,407,482) | (27,044,136) |
Net increase (decrease) | 130,066,480 | 50,390,216 | $ 1,196,926,792 | $ 370,071,180 |
Annual Report
7. Share Transactions - continued
| Shares | Dollars |
Years ended December 31, | 2010 | 2009 | 2010 | 2009 |
VIP FundsManager 70% Portfolio | | | | |
Service Class | | | | |
Shares sold | 105 | 2,046 | $ 916 | $ 16,601 |
Reinvestment of distributions | 107 | 122 | 1,010 | 1,033 |
Shares redeemed | (1,257) | (3,960) | (10,260) | (28,297) |
Net increase (decrease) | (1,045) | (1,792) | $ (8,334) | $ (10,663) |
Service Class 2 | | | | |
Shares sold | 117,792 | 152,449 | $ 1,007,136 | $ 1,136,136 |
Reinvestment of distributions | 3,844 | 2,452 | 36,366 | 20,747 |
Shares redeemed | (22,656) | (13,185) | (200,352) | (90,944) |
Net increase (decrease) | 98,980 | 141,716 | $ 843,150 | $ 1,065,939 |
Investor Class | | | | |
Shares sold | 8,149,816 | 9,719,700 | $ 71,824,236 | $ 74,393,886 |
Reinvestment of distributions | 859,002 | 798,929 | 8,134,751 | 6,766,931 |
Shares redeemed | (5,325,112) | (4,438,759) | (46,181,415) | (30,831,603) |
Net increase (decrease) | 3,683,706 | 6,079,870 | $ 33,777,572 | $ 50,329,214 |
VIP FundsManager 85% Portfolio | | | | |
Service Class | | | | |
Shares sold | 1,159 | 10,810 | $ 9,612 | $ 71,154 |
Reinvestment of distributions | 152 | 181 | 1,382 | 1,462 |
Shares redeemed | (3,505) | (6,861) | (28,420) | (48,740) |
Net increase (decrease) | (2,194) | 4,130 | $ (17,426) | $ 23,876 |
Service Class 2 | | | | |
Shares sold | 201,721 | 85,708 | $ 1,678,857 | $ 619,194 |
Reinvestment of distributions | 2,991 | 1,367 | 27,295 | 11,030 |
Shares redeemed | (55,498) | (16,653) | (443,818) | (102,557) |
Net increase (decrease) | 149,214 | 70,422 | $ 1,262,334 | $ 527,667 |
Investor Class | | | | |
Shares sold | 6,173,674 | 6,302,037 | $ 52,921,384 | $ 43,671,055 |
Reinvestment of distributions | 312,144 | 290,866 | 2,847,727 | 2,353,107 |
Shares redeemed | (4,493,396) | (3,180,587) | (37,114,660) | (19,992,145) |
Net increase (decrease) | 1,992,422 | 3,412,316 | $ 18,654,451 | $ 26,032,017 |
8. Other.
The Funds' organizational documents provide former and current trustees and officers with a limited indemnification against liabilities arising in connection with the performance of their duties to the Funds. In the normal course of business, the Funds may also enter into contracts that provide general indemnifications. The Funds' maximum exposure under these arrangements is unknown as this would be dependent on future claims that may be made against the Funds. The risk of material loss from such claims is considered remote.
The Funds do not invest in the Underlying Funds for the purpose of exercising management or control; however, investments by the Funds within their principal investment strategies may represent a significant portion of the Underlying Fund's net assets. At the end of the period, the following VIP FundsManager Portfolios were the owners of record of 10% or more of the total the outstanding shares of the Funds.
Fund | VIP FundsManager 60% Portfolio |
Fidelity Consumer Discretionary Portfolio | 22% |
Fidelity Insurance Portfolio | 20% |
Fidelity Industrial Equipment Portfolio | 14% |
Fidelity Nordic Fund | 12% |
Fidelity Industrials Portfolio | 11% |
Fidelity Pharmaceuticals Portfolio | 11% |
Annual Report
Notes to Financial Statements - continued
8. Other - continued
The Funds, in aggregate, were the owners of record of more than 20% of the total outstanding shares of the following Underlying Funds.
| % of shares held |
Fidelity Consumer Discretionary Portfolio | 33% |
Fidelity Insurance Portfolio | 30% |
In addition, at the end of the period, FMR or its affiliates were the owners of record of more than 10% of the outstanding shares of the following funds:
| Affiliated % |
VIP FundsManager 20% Portfolio | 99% |
VIP FundsManager 50% Portfolio | 99% |
VIP FundsManager 60% Portfolio | 51% |
VIP FundsManager 70% Portfolio | 99% |
VIP FundsManager 85% Portfolio | 99% |
Annual Report
Report of Independent Registered Public Accounting Firm
To the Trustees of Variable Insurance Products Fund V and the Shareholders of VIP FundsManager 20% Portfolio, VIP FundsManager 50% Portfolio, VIP FundsManager 60% Portfolio, VIP FundsManager 70% Portfolio, and VIP FundsManager 85% Portfolio:
In our opinion, the accompanying statements of assets and liabilities, including the schedules of investments, and the related statements of operations and of changes in net assets and the financial highlights present fairly, in all material respects, the financial positions of VIP FundsManager 20% Portfolio, VIP FundsManager 50% Portfolio, VIP FundsManager 60% Portfolio, VIP FundsManager 70% Portfolio, and VIP FundsManager 85% Portfolio (funds of Variable Insurance Products Fund V) at December 31, 2010, the results of each of their operations for the year then ended, the changes in each of their net assets for each of the two years in the period then ended and the financial highlights for each of the periods indicated, in conformity with accounting principles generally accepted in the United States of America. These financial statements and financial highlights (hereafter referred to as "financial statements") are the responsibility of the Funds' Management. Our responsibility is to express an opinion on these financial statements based on our audits. We conducted our audits of these financial statements in accordance with the standards of the Public Company Accounting Oversight Board (United States). Those standards require that we plan and perform the audit to obtain reasonable assurance about whether the financial statements are free of material misstatement. An audit includes examining, on a test basis, evidence supporting the amounts and disclosures in the financial statements, assessing the accounting principles used and significant estimates made by management, and evaluating the overall financial statement presentation. We believe that our audits, which included confirmation of securities at December 31, 2010 by correspondence with the Transfer Agent, provide a reasonable basis for our opinion.
/s/ PricewaterhouseCoopers LLP
PricewaterhouseCoopers LLP
Boston, Massachusetts
February 22, 2011
Annual Report
The Trustees and executive officers of the trust and funds, as applicable, are listed below. The Board of Trustees governs each fund and is responsible for protecting the interests of shareholders. The Trustees are experienced executives who meet periodically throughout the year to oversee each fund's activities, review contractual arrangements with companies that provide services to each fund, oversee management of the risks associated with such activities and contractual arrangements, and review each fund's performance. Except for James C. Curvey, each of the Trustees oversees 189 funds advised by FMR or an affiliate. Mr. Curvey oversees 408 funds advised by FMR or an affiliate.
The Trustees hold office without limit in time except that (a) any Trustee may resign; (b) any Trustee may be removed by written instrument, signed by at least two-thirds of the number of Trustees prior to such removal; (c) any Trustee who requests to be retired or who has become incapacitated by illness or injury may be retired by written instrument signed by a majority of the other Trustees; and (d) any Trustee may be removed at any special meeting of shareholders by a two-thirds vote of the outstanding voting securities of the trust. Each Trustee who is not an interested person (as defined in the 1940 Act) (Independent Trustee), shall retire not later than the last day of the calendar year in which his or her 75th birthday occurs. The Independent Trustees may waive this mandatory retirement age policy with respect to individual Trustees. The executive officers hold office without limit in time, except that any officer may resign or may be removed by a vote of a majority of the Trustees at any regular meeting or any special meeting of the Trustees. Except as indicated, each individual has held the office shown or other offices in the same company for the past five years.
Experience, Skills, Attributes, and Qualifications of the Funds' Trustees. The Governance and Nominating Committee has adopted a statement of policy that describes the experience, qualifications, attributes, and skills that are necessary and desirable for potential Independent Trustee candidates (Statement of Policy). The Board believes that each Trustee satisfied at the time he or she was initially elected or appointed a Trustee, and continues to satisfy, the standards contemplated by the Statement of Policy. The Governance and Nominating Committee also engages professional search firms to help identify potential Independent Trustee candidates who have the experience, qualifications, attributes, and skills consistent with the Statement of Policy. From time to time, additional criteria based on the composition and skills of the current Independent Trustees, as well as experience or skills that may be appropriate in light of future changes to board composition, business conditions, and regulatory or other developments, have also been considered by the professional search firms and the Governance and Nominating Committee. In addition, the Board takes into account the Trustees' commitment and participation in Board and committee meetings, as well as their leadership of standing and ad hoc committees throughout their tenure.
In determining that a particular Trustee was and continues to be qualified to serve as a Trustee, the Board has considered a variety of criteria, none of which, in isolation, was controlling. The Board believes that, collectively, the Trustees have balanced and diverse experience, qualifications, attributes, and skills, which allow the Board to operate effectively in governing each fund and protecting the interests of shareholders. Information about the specific experience, skills, attributes, and qualifications of each Trustee, which in each case led to the Board's conclusion that the Trustee should serve (or continue to serve) as a trustee of the funds, is provided below.
Board Structure and Oversight Function. Abigail P. Johnson is an interested person (as defined in the 1940 Act) and currently serves as Chairman. The Trustees have determined that an interested Chairman is appropriate and benefits shareholders because an interested Chairman has a personal and professional stake in the quality and continuity of services provided to the funds. Independent Trustees exercise their informed business judgment to appoint an individual of their choosing to serve as Chairman, regardless of whether the Trustee happens to be independent or a member of management. The Independent Trustees have determined that they can act independently and effectively without having an Independent Trustee serve as Chairman and that a key structural component for assuring that they are in a position to do so is for the Independent Trustees to constitute a substantial majority for the Board. The Independent Trustees also regularly meet in executive session. Kenneth L. Wolfe serves as Chairman of the Independent Trustees and as such (i) acts as a liaison between the Independent Trustees and management with respect to matters important to the Independent Trustees and (ii) with management prepares agendas for Board meetings.
Fidelity funds are overseen by different Boards of Trustees. The funds' Board oversees Fidelity's investment-grade bond, money market, and asset allocation funds and another Board oversees Fidelity's equity and high income funds. The asset allocation funds may invest in Fidelity funds that are overseen by such other Board. The use of separate Boards, each with its own committee structure, allows the Trustees of each group of Fidelity funds to focus on the unique issues of the funds they oversee, including common research, investment, and operational issues. On occasion, the separate Boards establish joint committees to address issues of overlapping consequences for the Fidelity funds overseen by each Board.
The Trustees operate using a system of committees to facilitate the timely and efficient consideration of all matters of importance to the Trustees, each fund, and fund shareholders and to facilitate compliance with legal and regulatory requirements and oversight of the funds' activities and associated risks. The Board, acting through its committees, has charged FMR and its affiliates with (i) identifying events or circumstances the occurrence of which could have demonstrably adverse effects on the funds' business and/or reputation; (ii) implementing processes and controls to lessen the possibility that such events or circumstances occur or to mitigate the effects of such events or circumstances if they do occur; and (iii) creating and maintaining a system designed to evaluate continuously business and market conditions in order to facilitate the identification and implementation processes described in (i) and (ii) above. Because the day-to-day operations and activities of the funds are carried out by or through FMR, its affiliates and other service providers, the funds' exposure to risks is mitigated but not eliminated by the processes overseen by the Trustees. While each of the Board's committees has responsibility for overseeing different aspects of the funds' activities, oversight is exercised primarily through the Operations and Audit Committees. Appropriate personnel, including but not limited to the funds' Chief Compliance Officer (CCO), FMR's internal auditor, the independent accountants, the funds' Treasurer and portfolio management personnel, make periodic reports to the Board's committees, as appropriate. The responsibilities of each committee, including their oversight responsibilities, are described further under "Standing Committees of the Funds' Trustees."
Annual Report
Trustees and Officers - continued
The fund's Statement of Additional Information (SAI) includes more information about the Trustees. To request a free copy, call Fidelity at 1-877-208-0098.
Interested Trustees*:
Correspondence intended for each Trustee who is an interested person may be sent to Fidelity Investments, 82 Devonshire Street, Boston, Massachusetts 02109.
Name, Age; Principal Occupations and Other Relevant Experience+ |
Abigail P. Johnson (49) |
| Year of Election or Appointment: 2009 Ms. Johnson is Trustee and Chairman of the Board of Trustees of certain Trusts. Ms. Johnson serves as President of Personal, Workplace and Institutional Services (2005-present). Ms. Johnson is the Vice Chairman and Director (2007-present) of FMR LLC. Previously, Ms. Johnson served as President and a Director of FMR (2001-2005), a Trustee of other investment companies advised by FMR, Fidelity Investments Money Management, Inc., and FMR Co., Inc. (2001-2005), Senior Vice President of the Fidelity funds (2001-2005), and managed a number of Fidelity funds. Ms. Abigail P. Johnson and Mr. Arthur E. Johnson are not related. |
James C. Curvey (75) |
| Year of Election or Appointment: 2007 Mr. Curvey also serves as Trustee (2007-present) of other investment companies advised by FMR. Mr. Curvey is a Director of Fidelity Investments Money Management, Inc. (2009-present), Director of Fidelity Research & Analysis Co. (2009-present) and Director of FMR and FMR Co., Inc. (2007-present). Mr. Curvey is also Vice Chairman (2007-present) and Director of FMR LLC. In addition, Mr. Curvey serves as an Overseer for the Boston Symphony Orchestra and a member of the Trustees of Villanova University. Previously, Mr. Curvey was the Vice Chairman (2006-2007) and Director (2000-2007) of FMR Corp. |
* Trustees have been determined to be "Interested Trustees" by virtue of, among other things, their affiliation with the trust or various entities under common control with Strategic Advisers.
+ The information above includes each Trustee's principal occupation during the last five years and other information relating to the experience, attributes, and skills relevant to each Trustee's qualifications to serve as a Trustee, which led to the conclusion that each Trustee should serve as a Trustee for each fund.
Independent Trustees:
Correspondence intended for each Independent Trustee (that is, the Trustees other than the Interested Trustees) may be sent to Fidelity Investments, P.O. Box 55235, Boston, Massachusetts 02205-5235.
Name, Age; Principal Occupations and Other Relevant Experience+ |
Albert R. Gamper, Jr. (68) |
| Year of Election or Appointment: 2007 Prior to his retirement in December 2004, Mr. Gamper served as Chairman of the Board of CIT Group Inc. (commercial finance). During his tenure with CIT Group Inc. Mr. Gamper served in numerous senior management positions, including Chairman (1987-1989; 1999-2001; 2002-2004), Chief Executive Officer (1987-2004), and President (2002-2003). He also served as President and Chief Executive Officer of Tyco Capital Corporation (2001-2002). Mr. Gamper currently serves as a member of the Board of Directors of Public Service Enterprise Group (utilities, 2000-present), a member of the Board of Trustees, Rutgers University (2004-present), and Chairman of the Board of Saint Barnabas Health Care System. Previously, Mr. Gamper served as Chairman of the Board of Governors, Rutgers University (2004-2007). |
Robert F. Gartland (59) |
| Year of Election or Appointment: 2010 Mr. Gartland is a partner and investor of Vietnam Partners LLC (investments and consulting, 2008-present) and is Chairman and an investor in Gartland and Mellina Group Corp. (consulting, 2009-present). Prior to his retirement, Mr. Gartland held a variety of positions at Morgan Stanley (financial services, 1979-2007) including Managing Director (1987-2007). |
Arthur E. Johnson (63) |
| Year of Election or Appointment: 2008 Mr. Johnson serves as a member of the Board of Directors of Eaton Corporation (diversified power management, 2009-present) and AGL Resources, Inc. (holding company). Prior to his retirement, Mr. Johnson served as Senior Vice President of Corporate Strategic Development of Lockheed Martin Corporation (defense contractor, 1999-2009). He previously served on the Board of Directors of IKON Office Solutions, Inc. (1999-2008) and Delta Airlines (2005-2007). Mr. Arthur E. Johnson and Ms. Abigail P. Johnson are not related. |
Michael E. Kenneally (56) |
| Year of Election or Appointment: 2009 Previously, Mr. Kenneally served as a Member of the Advisory Board for certain Fidelity Fixed Income and Asset Allocation Funds (2008-2009). Prior to his retirement, Mr. Kenneally served as Chairman and Global Chief Executive Officer of Credit Suisse Asset Management (2003-2005). Mr. Kenneally was a Director of the Credit Suisse Funds (U.S. mutual funds, 2004-2008) and certain other closed-end funds (2004-2005) and was awarded the Chartered Financial Analyst (CFA) designation in 1991. |
James H. Keyes (70) |
| Year of Election or Appointment: 2007 Mr. Keyes serves as a member of the Boards of Navistar International Corporation (manufacture and sale of trucks, buses, and diesel engines, since 2002) and Pitney Bowes, Inc. (integrated mail, messaging, and document management solutions, since 1998). Prior to his retirement, Mr. Keyes served as Chairman and Chief Executive Officer of Johnson Controls (automotive, building, and energy, 1998-2002) and as a member of the Board of LSI Logic Corporation (semiconductor technologies, 1984-2008). |
Marie L. Knowles (64) |
| Year of Election or Appointment: 2001 Prior to Ms. Knowles' retirement in June 2000, she served as Executive Vice President and Chief Financial Officer of Atlantic Richfield Company (ARCO) (diversified energy, 1996-2000). From 1993 to 1996, she was a Senior Vice President of ARCO and President of ARCO Transportation Company. She served as a Director of ARCO from 1996 to 1998. Ms. Knowles currently serves as a Director and Chairman of the Audit Committee of McKesson Corporation (healthcare service, since 2002). Ms. Knowles is an Honorary Trustee of the Brookings Institution and a member of the Board of the Catalina Island Conservancy and of the Santa Catalina Island Company (2009-present). She also serves as a member of the Advisory Board for the School of Engineering of the University of Southern California and the Foundation Board of the School of Architecture at the University of Virginia (2007-present). Previously, Ms. Knowles served as a Director of Phelps Dodge Corporation (copper mining and manufacturing, 1994-2007). |
Kenneth L. Wolfe (71) |
| Year of Election or Appointment: 2007 Mr. Wolfe is Chairman of the Independent Trustees of the Fixed Income and Asset Allocation Funds (2008-present). Prior to his retirement, Mr. Wolfe served as Chairman and a Director (2007-2009) and Chairman and Chief Executive Officer (1994-2001) of Hershey Foods Corporation. He also served as a member of the Boards of Adelphia Communications Corporation (telecommunications, 2003-2006), Bausch & Lomb, Inc. (medical/pharmaceutical, 1993-2007), and Revlon, Inc. (personal care products, 2004-2009). |
+ The information above includes each Trustee's principal occupation during the last five years and other information relating to the experience, attributes, and skills relevant to each Trustee's qualifications to serve as a Trustee, which led to the conclusion that each Trustee should serve as a Trustee for each fund.
Executive Officers:
Correspondence intended for each executive officer may be sent to Fidelity Investments, 82 Devonshire Street, Boston, Massachusetts 02109.
Name, Age; Principal Occupation |
John R. Hebble (52) |
| Year of Election or Appointment: 2008 President and Treasurer of Fidelity's Fixed Income and Asset Allocation Funds. Mr. Hebble also serves as Treasurer and Chief Financial Officer of The North Carolina Capital Management Trust: Cash and Term Portfolio (2008-present), Assistant Treasurer of other Fidelity funds (2009-present) and is an employee of Fidelity Investments. |
Boyce I. Greer (54) |
| Year of Election or Appointment: 2005 Vice President of Fidelity's Fixed Income Funds and Asset Allocation Funds (2005). Mr. Greer is also a Trustee of other investment companies advised by FMR. Mr. Greer is President of The North Carolina Capital Management Trust: Cash and Term Portfolio (2003-present), the Asset Allocation Division (2008-present), President and a Director of Strategic Advisers, Inc. (2008-present), President of FIMM 130/30 LLC (2008-present), Director of Ballyrock Investment Advisors LLC (2006-present), and an Executive Vice President of FMR (2005-present). Previously, Mr. Greer served as Executive Vice President of FMR Co., Inc. (2005-2009), President and Director of Fidelity Investments Money Management, Inc. (2007-2009) and as a Director and Managing Director of Strategic Advisers, Inc. (2002-2005). |
Derek L. Young (46) |
| Year of Election or Appointment: 2009 Vice President of Fidelity's Asset Allocation Funds. Mr. Young also serves as Chief Investment Officer of the Global Asset Allocation Group (2009-present). Previously, Mr. Young served as a portfolio manager. |
Scott C. Goebel (42) |
| Year of Election or Appointment: 2008 Secretary and Chief Legal Officer (CLO) of the Fidelity funds. Mr. Goebel also serves as Secretary and CLO of The North Carolina Capital Management Trust: Cash and Term Portfolio (2008-present); General Counsel, Secretary, and Senior Vice President of FMR (2008-present) and FMR Co., Inc. (2008-present); Deputy General Counsel of FMR LLC; Chief Legal Officer of Fidelity Management & Research (Hong Kong) Limited (2008-present) and Assistant Secretary of Fidelity Management & Research (Japan) Inc. (2008-present), Fidelity Investments Money Management, Inc. (2008-present), Fidelity Management & Research (U.K.) Inc. (2008-present), and Fidelity Research and Analysis Company (2008-present). Previously, Mr. Goebel served as Assistant Secretary of the Funds (2007-2008) and as Vice President and Secretary of Fidelity Distributors Corporation (FDC) (2005-2007). |
David J. Carter (37) |
| Year of Election or Appointment: 2010 Assistant Secretary of Fidelity's Fixed Income and Asset Allocation Funds. Mr. Carter also serves as Vice President, Associate General Counsel (2010-present) and is an employee of Fidelity Investments (2005-present). |
Holly C. Laurent (56) |
| Year of Election or Appointment: 2008 Anti-Money Laundering (AML) Officer of the Fidelity funds. Ms. Laurent also serves as AML Officer of The North Carolina Capital Management Trust: Cash and Term Portfolio (2008-present) and is an employee of Fidelity Investments. Previously, Ms. Laurent was Senior Vice President and Head of Legal for Fidelity Business Services India Pvt. Ltd. (2006-2008), and Senior Vice President, Deputy General Counsel and Group Head for FMR LLC (2005-2006). |
Christine Reynolds (52) |
| Year of Election or Appointment: 2008 Chief Financial Officer of the Fidelity funds. Ms. Reynolds became President of Fidelity Pricing and Cash Management Services (FPCMS) in August 2008. Ms. Reynolds served as Chief Operating Officer of FPCMS (2007-2008). Previously, Ms. Reynolds served as President, Treasurer, and Anti-Money Laundering officer of the Fidelity funds (2004-2007). |
Michael H. Whitaker (43) |
| Year of Election or Appointment: 2008 Chief Compliance Officer of Fidelity's Fixed Income and Asset Allocation Funds. Mr. Whitaker also serves as Chief Compliance Officer of The North Carolina Capital Management Trust: Cash and Term Portfolio (2008-present). Mr. Whitaker is an employee of Fidelity Investments (2007-present). Prior to joining Fidelity Investments, Mr. Whitaker worked at MFS Investment Management where he served as Senior Vice President and Chief Compliance Officer (2004-2006), and Assistant General Counsel. |
Jeffrey S. Christian (49) |
| Year of Election or Appointment: 2009 Deputy Treasurer of the Fidelity funds. Mr. Christian is an employee of Fidelity Investments. Previously, Mr. Christian served as Chief Financial Officer (2008-2009) of certain Fidelity funds and Senior Vice President of Fidelity Pricing and Cash Management Services (FPCMS) (2004-2009). |
Bryan A. Mehrmann (49) |
| Year of Election or Appointment: 2005 Deputy Treasurer of the Fidelity funds. Mr. Mehrmann is an employee of Fidelity Investments. |
Stephanie J. Dorsey (41) |
| Year of Election or Appointment: 2008 Deputy Treasurer of Fidelity's Fixed Income and Asset Allocation Funds. Ms. Dorsey also serves as Assistant Treasurer of other Fidelity funds (2010-present) and is an employee of Fidelity Investments (2008-present). Previously, Ms. Dorsey served as Treasurer (2004-2008) of the JPMorgan Mutual Funds and Vice President (2004-2008) of JPMorgan Chase Bank. |
Adrien E. Deberghes (43) |
| Year of Election or Appointment: 2010 Assistant Treasurer of Fidelity's Fixed Income and Asset Allocation Funds. Mr. Deberghes also serves as Deputy Treasurer of other Fidelity funds (2008-present) and is an employee of Fidelity Investments (2008-present). Previously, Mr. Deberghes served as Senior Vice President of Mutual Fund Administration at State Street Corporation (2007-2008), Senior Director of Mutual Fund Administration at Investors Bank & Trust (2005-2007), and Director of Finance for Dunkin' Brands (2000-2005). |
Kenneth B. Robins (41) |
| Year of Election or Appointment: 2009 Assistant Treasurer of the Fidelity Fixed Income and Asset Allocation Funds. Mr. Robins also serves as President and Treasurer of other Fidelity funds (2008-present; 2010-present) and is an employee of Fidelity Investments (2004-present). Previously, Mr. Robins served as Deputy Treasurer of the Fidelity funds (2005-2008) and Treasurer and Chief Financial Officer of The North Carolina Capital Management Trust: Cash and Term Portfolios (2006-2008). |
Gary W. Ryan (52) |
| Year of Election or Appointment: 2005 Assistant Treasurer of the Fidelity funds. Mr. Ryan is an employee of Fidelity Investments. Previously, Mr. Ryan served as Vice President of Fund Reporting in Fidelity Pricing and Cash Management Services (FPCMS) (1999-2005). |
Jonathan Davis (42) |
| Year of Election or Appointment: 2010 Assistant Treasurer of the Fidelity funds. Mr. Davis is an employee of Fidelity Investments. Previously, Mr. Davis served as Vice President and Associate General Counsel of FMR LLC (2003-2010). |
Annual Report
A percentage of the dividends distributed during the fiscal year for the following funds qualifies for the dividends-received deduction for corporate shareholders:
Fund | February,
2010 | December,
2010 |
VIP FundsManager 20% | | |
Service Class | - | 5% |
Service Class 2 | - | 6% |
Investor Class | - | 5% |
VIP FundsManager 50% | | |
Service Class | - | 14% |
Service Class 2 | - | 16% |
Investor Class | - | 14% |
VIP FundsManager 60% | | |
Service Class | - | 19% |
Service Class 2 | - | 21% |
Investor Class | - | 19% |
VIP FundsManager 70% | | |
Service Class | - | 23% |
Service Class 2 | - | 25% |
Investor Class | - | 23% |
VIP FundsManager 85% | | |
Service Class | 23% | 31% |
Service Class 2 | 23% | 34% |
Investor Class | 23% | 31% |
A percentage of the dividends distributed during the fiscal year for the following funds was derived from interest on U.S. Government securities which is generally exempt from state income tax:
VIP FundsManager 20% | |
Service Class | 14.41% |
Service Class 2 | 14.41% |
Investor Class | 14.41% |
VIP FundsManager 50% | |
Service Class | 11.18% |
Service Class 2 | 11.18% |
Investor Class | 11.18% |
VIP FundsManager 60% | |
Service Class | 8.81% |
Service Class 2 | 8.81% |
Investor Class | 8.81% |
VIP FundsManager 70% | |
Service Class | 7.46% |
Service Class 2 | 7.46% |
Investor Class | 7.46% |
VIP FundsManager 85% | |
Service Class | 3.77% |
Service Class 2 | 3.77% |
Investor Class | 3.77% |
Annual Report
Board Approval of Investment Advisory Contracts and Management Fees
VIP FundsManager Portfolios
Each year, the Board of Trustees, including the Independent Trustees (together, the Board), votes on the renewal of the management contract and administration agreement (together, the Advisory Contracts) for each fund. The Board, assisted by the advice of fund counsel and Independent Trustees' counsel, requests and considers a broad range of information relevant to the renewal of the Advisory Contracts throughout the year.
The Board meets regularly and considers at each of its meetings factors that are relevant to its annual consideration of the renewal of each fund's Advisory Contracts, including the services and support provided to each fund and its shareholders. The Board has established three standing committees, each composed of Independent Trustees with varying backgrounds, to which the Board has assigned specific subject matter responsibilities in order to enhance effective decision-making by the Board. The Operations Committee, of which all of the Independent Trustees are members, meets regularly throughout the year and, among other matters, considers matters specifically related to the annual consideration of the renewal of each fund's Advisory Contracts. The Board, acting directly and through its Committees, requests and receives information concerning the annual consideration of the renewal of each fund's Advisory Contracts. The Board also meets as needed to consider matters specifically related to the Board's annual consideration of the renewal of Advisory Contracts. Members of the Board may also meet with trustees of other Fidelity funds through ad hoc joint committees to discuss certain matters relevant to the Fidelity funds.
At its September 2010 meeting, the Board of Trustees, including the Independent Trustees, unanimously determined to renew each fund's Advisory Contracts. In reaching its determination, the Board considered all factors it believed relevant, including (i) the nature, extent, and quality of the services to be provided to each fund and its shareholders (including the investment performance of each fund); (ii) the competitiveness of each fund's management fee and total expenses; (iii) the total costs of the services to be provided by and the profits to be realized by Fidelity from its relationship with each fund; (iv) the extent to which economies of scale would be realized as each fund grows; and (v) whether fee levels reflect these economies of scale, if any, for the benefit of fund shareholders.
In considering whether to renew the Advisory Contracts for each fund, the Board reached a determination, with the assistance of fund counsel and Independent Trustees' counsel and through the exercise of its business judgment, that the renewal of the Advisory Contracts is in the best interests of each fund and its shareholders and that the compensation to be received by Fidelity under the management contracts is fair and reasonable. The Board's decision to renew the Advisory Contracts was not based on any single factor, but rather was based on a comprehensive consideration of all the information provided to the Board at its meetings throughout the year. The Board, in reaching its determination to renew the Advisory Contracts, is aware that shareholders in each fund have a broad range of investment choices available to them, including a wide choice among mutual funds offered by Fidelity's competitors, and that each fund's shareholders, with the opportunity to review and weigh the disclosure provided by the fund in its prospectus and other public disclosures, have chosen to invest in that fund, managed by Fidelity.
Nature, Extent, and Quality of Services Provided. The Board considered the staffing within the investment adviser, Strategic Advisers, Inc. (Strategic Advisers), and the administrator, FMR, including the backgrounds of the funds' investment personnel and the funds' investment objectives and disciplines. The Independent Trustees also had discussions with senior management of Fidelity's investment operations and investment groups. The Board considered the structure of the portfolio manager compensation program and whether this structure provides appropriate incentives to act in the best interest of each fund.
Resources Dedicated to Investment Management and Support Services. The Board reviewed the size, education, and experience of Strategic Advisers' investment staff, their use of technology, and Strategic Advisers' and FMR's approach to recruiting, training, and retaining portfolio managers and other research, advisory, and management personnel. The Board noted that Fidelity's analysts have access to a variety of technological tools and market and securities data that enable them to perform both fundamental and quantitative analysis and to specialize in various disciplines. The Board noted FMR's continued focus on strengthening the organization and discipline of equity portfolio management and research.
Shareholder and Administrative Services. The Board considered (i) the nature, extent, quality, and cost of advisory, administrative, and shareholder services performed by FMR and its affiliates under the Advisory Contracts and under separate agreements covering transfer agency, pricing and bookkeeping, and securities lending services for each fund; (ii) the nature and extent of FMR's supervision of third party service providers, principally custodians and subcustodians; and (iii) the resources devoted to, and the record of compliance with, each fund's compliance policies and procedures.
The Board noted that the growth of fund assets over time across the complex allows Fidelity to reinvest in the development of services designed to enhance the value or convenience of the Fidelity funds as investment vehicles. These services include 24-hour access to account information and market information through telephone representatives and over the Internet, and investor education materials and asset allocation tools.
Investment in a Large Fund Family. The Board considered the benefits to shareholders of investing in a Fidelity fund, including the benefits of investing in a fund that is part of a large family of funds offering a variety of investment disciplines and providing a large variety of mutual fund investor services. The Board noted that Fidelity had taken, or had made recommendations that resulted in the Fidelity funds taking, a number of actions over the previous year that benefited particular funds, including (i) dedicating additional resources to investment research and restructuring and broadening the focus of the investment research teams; (ii) bolstering the senior management team that oversees asset management; (iii) launching Class F of certain funds as a lower-fee class available to Freedom K and Freedom Index Funds; (iv) lowering the initial investment minimums and ongoing balance requirements for Real Estate High Income Fund; (v) eliminating subsequent purchase minimums for all funds and adding a waiver of the investment minimum requirement for new accounts opened with the proceeds of a systematic withdrawal plan; (vi) eliminating the withdrawal minimum and maximum limits for systematic withdrawals from Advisor funds; (vii) expanding sales load waivers on Class A shares for Destiny Planholders and expanding Institutional Class eligibility for Class O Destiny Planholders; and (viii) changing certain Class A and Class T sales charge structures to further align them with industry practices.
Annual Report
Board Approval of Investment Advisory Contracts and Management Fees - continued
Investment Performance. The Board considered whether each fund has operated in accordance with its investment objective, as well as its record of compliance with its investment restrictions. It also reviewed each fund's absolute investment performance for each class, as well as each fund's relative investment performance for each class measured over multiple periods, as available, against a proprietary custom index. The Board noted that FMR does not believe that a meaningful peer group exists against which to compare any of the funds' performance.
Because each of VIP FundsManager 20% and VIP FundsManager 85% had been in existence less than five calendar years, for each fund the following charts considered by the Board show, over the one- and three-year periods ended December 31, 2009, the cumulative total returns of Service Class and Service Class 2 of the fund and the cumulative total returns of a proprietary custom index ("benchmark"). The returns of Service Class and Service Class 2 show the performance of the highest and lowest performing classes, respectively (based on three-year performance).
Because each of VIP FundsManager 50% and VIP FundsManager 70% had been in existence less than five calendar years, for each fund the following charts considered by the Board show, over the one- and three-year periods ended December 31, 2009, the cumulative total returns of Investor Class and Service Class 2 of the fund and the cumulative total returns of a proprietary custom index ("benchmark"). The returns of Investor Class and Service Class 2 show the performance of the highest and lowest performing classes, respectively (based on three-year performance).
Because VIP FundsManager 60% had been in existence less than three calendar years, the following chart considered by the Board shows, for the one-year period ended December 31, 2009, the total returns of Service Class and Service Class 2 of the fund and the total return of a proprietary custom index ("benchmark"). The returns of Service Class and Service Class 2 show the performance of the highest and lowest performing classes, respectively.
For each fund, the proprietary custom index is an index developed by FMR that represents the performance of the fund's asset classes according to their respective weightings.
VIP FundsManager 20%
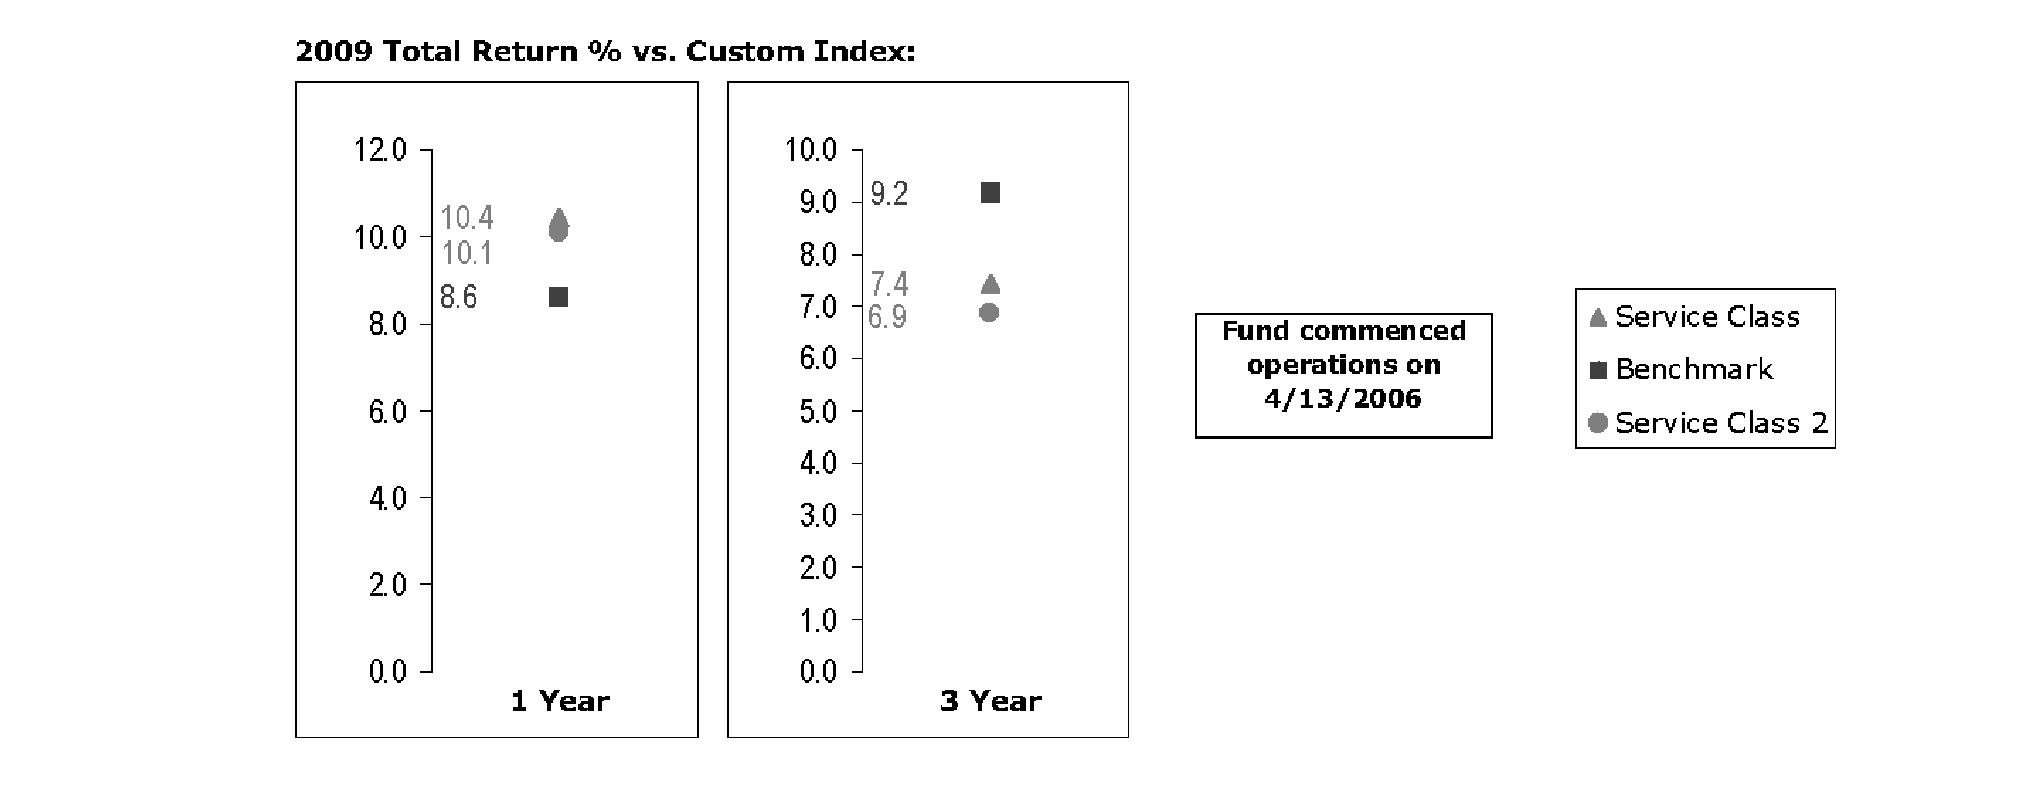
The Board noted that the investment performance of Service Class of the fund compared favorably to its benchmark for the one-year period, although the fund's three-year cumulative total return was lower than its benchmark. The Board considered that the variations in performance among the fund's classes reflect the variations in class expenses, which result in lower performance for higher expense classes. The Board also reviewed the fund's performance since inception as well as performance in the current year.
Annual Report
VIP FundsManager 50%
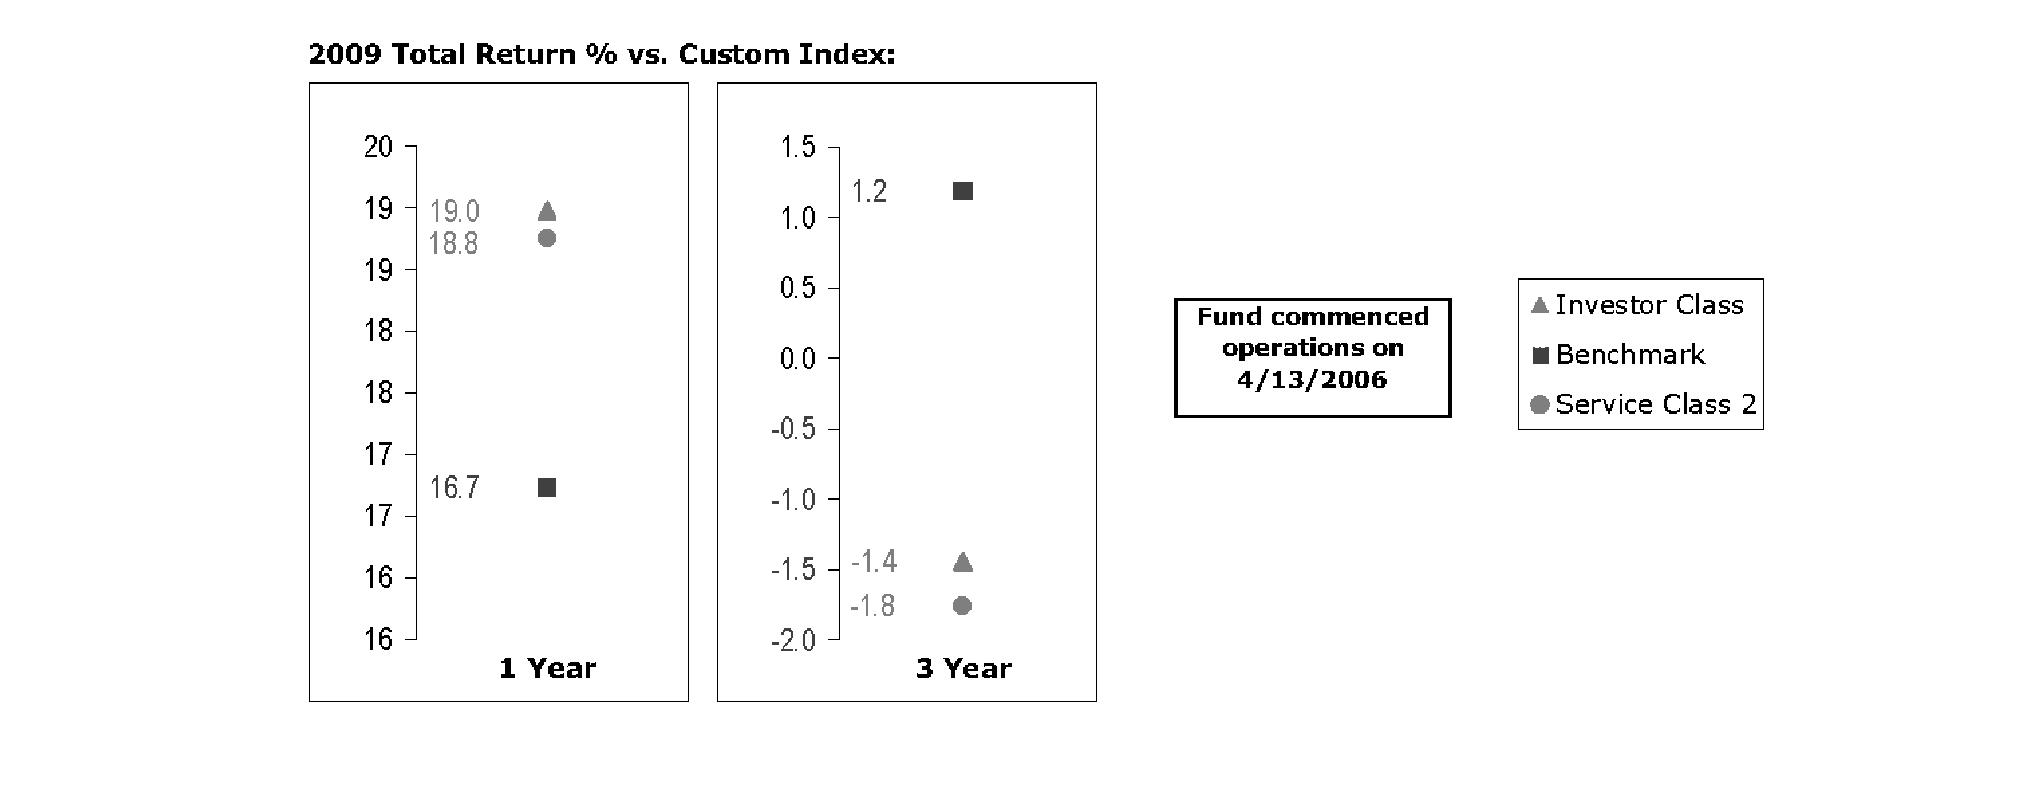
The Board noted that the investment performance of Investor Class of the fund compared favorably to its benchmark for the one-year period, although the fund's three-year cumulative total return was lower than its benchmark. The Board considered that the variations in performance among the fund's classes reflect the variations in class expenses, which result in lower performance for higher expense classes. The Board also reviewed the fund's performance since inception as well as performance in the current year.
VIP FundsManager 60%
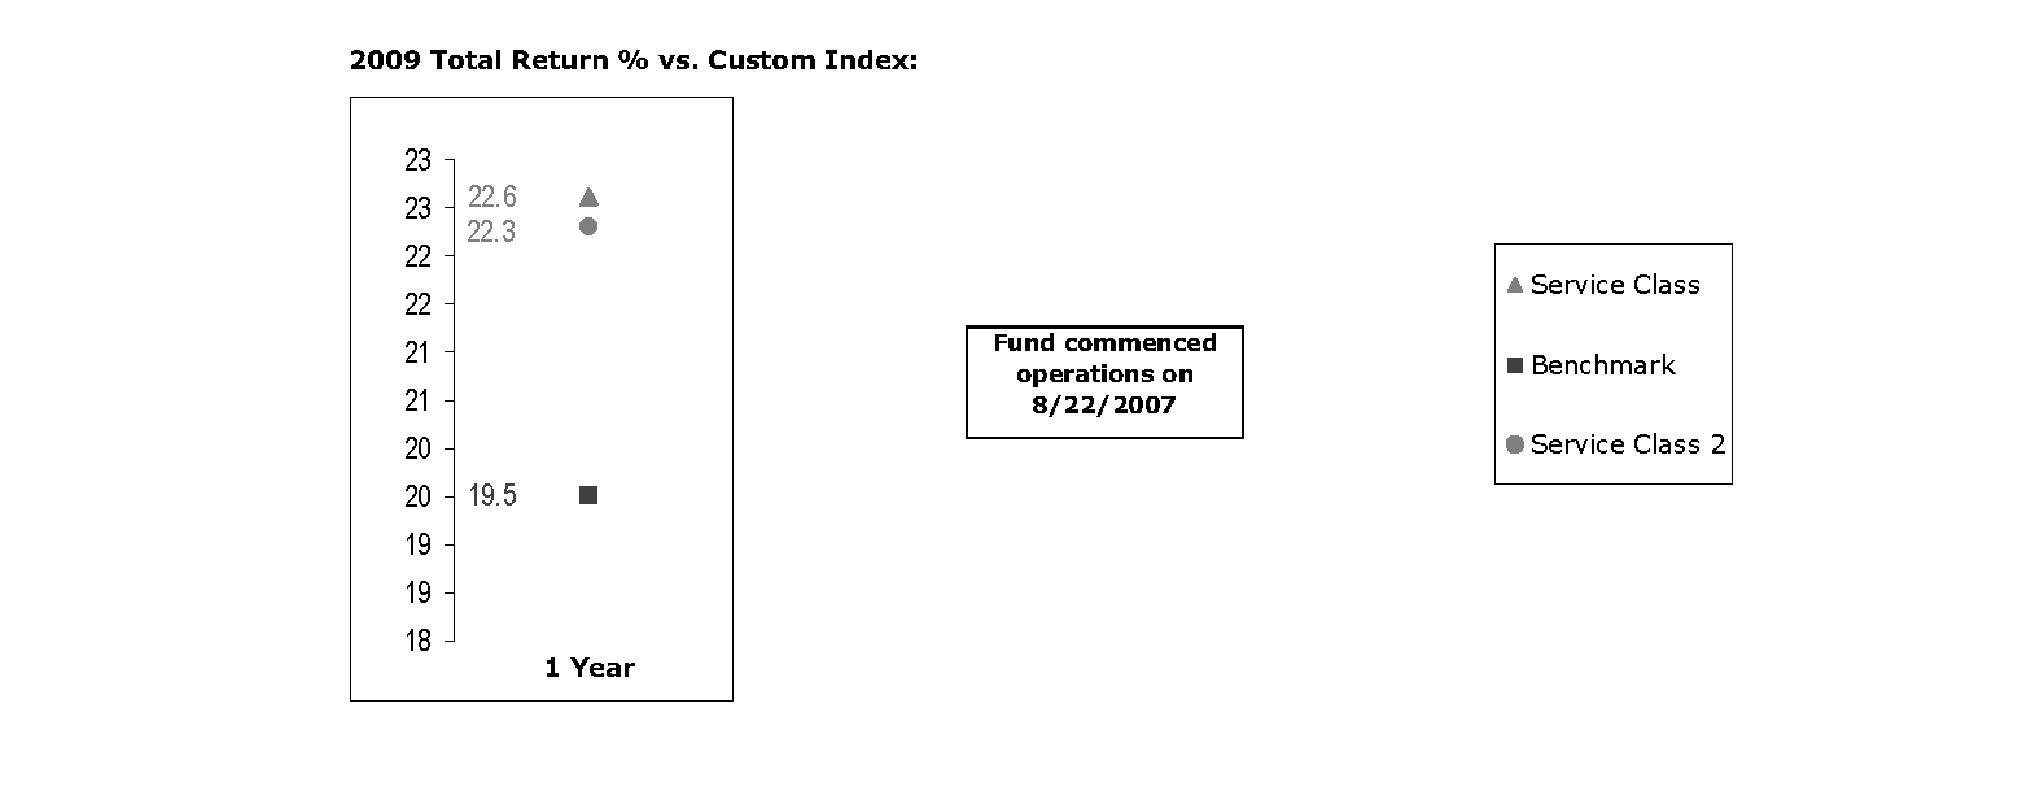
The Board noted that the investment performance of Service Class of the fund compared favorably to its benchmark for the period shown. The Board considered that the variations in performance among the fund's classes reflect the variations in class expenses, which result in lower performance for higher expense classes. The Board also reviewed the fund's performance since inception as well as performance in the current year. The Board noted that it is difficult to evaluate in any comprehensive fashion the performance of the fund, in light of its relatively recent commencement of operations.
Annual Report
Board Approval of Investment Advisory Contracts and Management Fees - continued
VIP FundsManager 70%
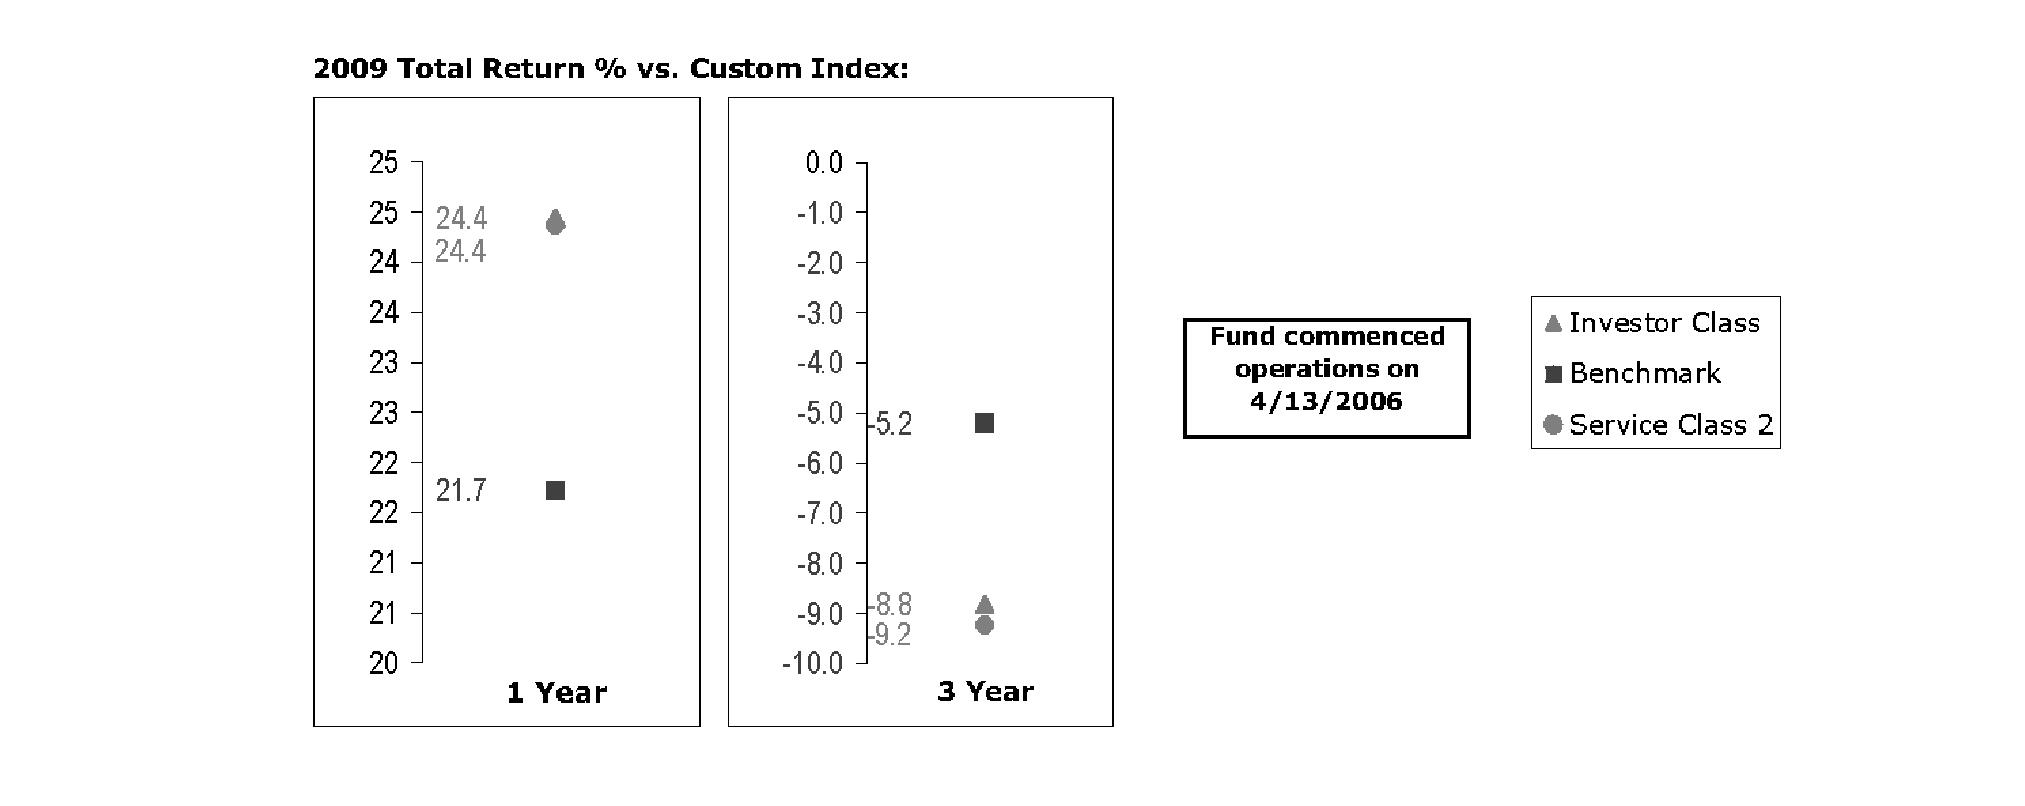
The Board noted that the investment performance of Investor Class of the fund compared favorably to its benchmark for the one-year period, although the fund's three-year cumulative total return was lower than its benchmark. The Board considered that the variations in performance among the fund's classes reflect the variations in class expenses, which result in lower performance for higher expense classes. The Board also reviewed the fund's performance since inception as well as performance in the current year.
VIP FundsManager 85%
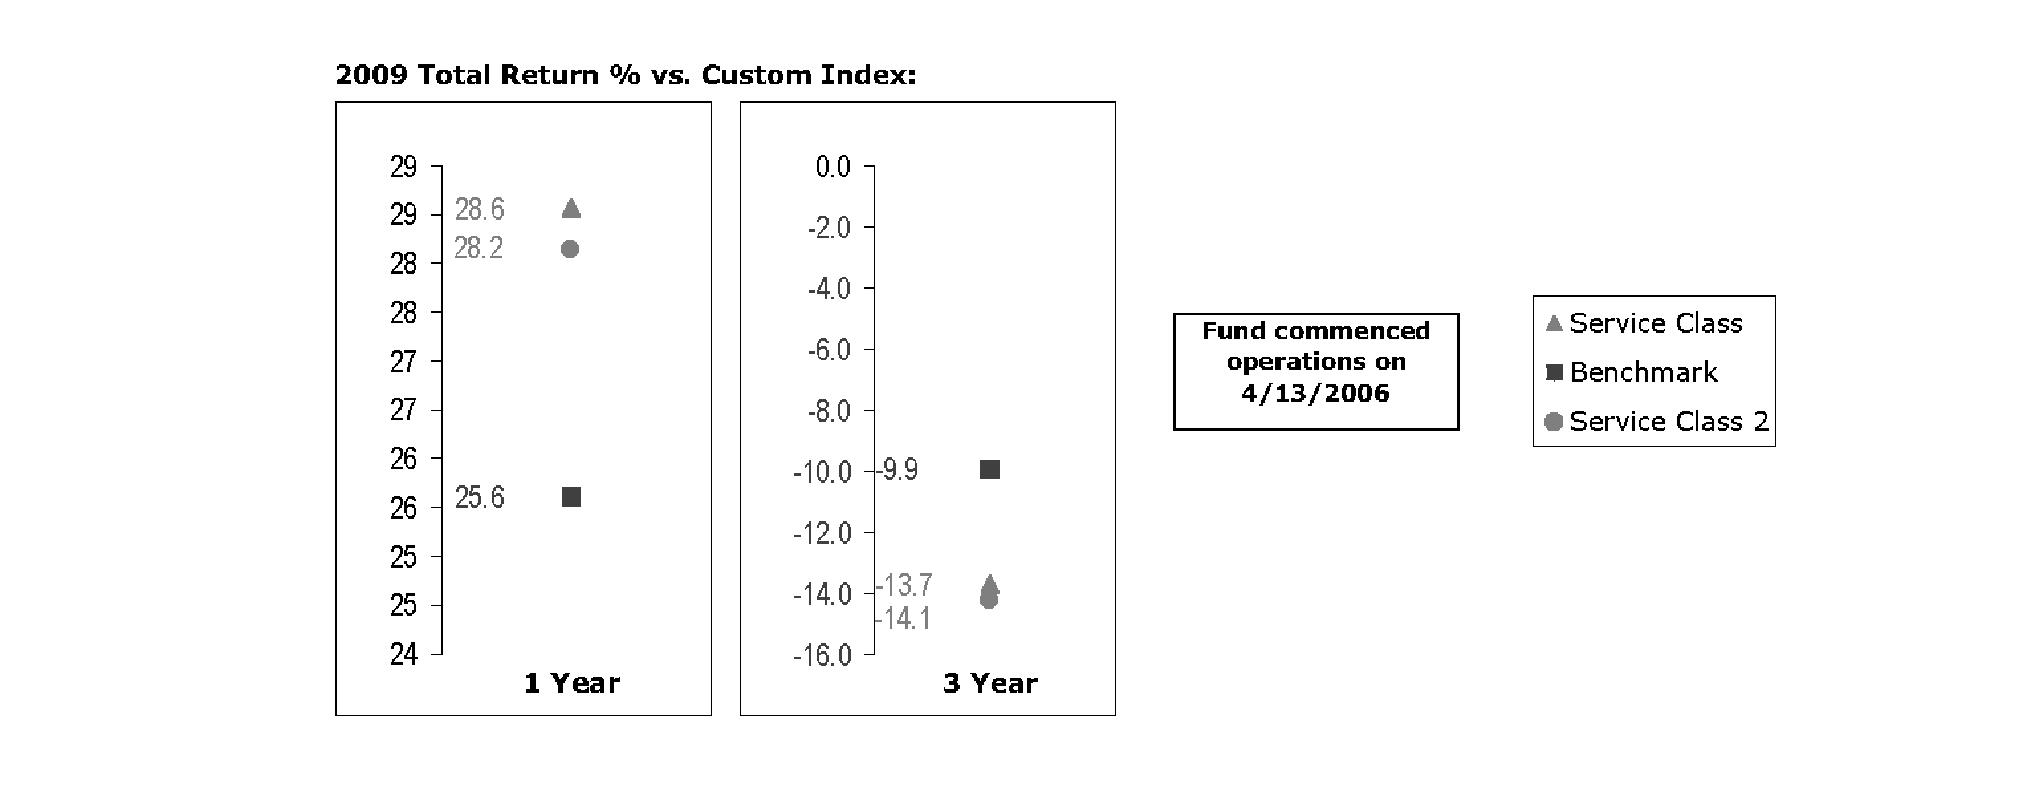
The Board noted that the investment performance of Service Class of the fund compared favorably to its benchmark for the one-year period, although the fund's three-year cumulative total return was lower than its benchmark. The Board considered that the variations in performance among the fund's classes reflect the variations in class expenses, which result in lower performance for higher expense classes. The Board also reviewed the fund's performance since inception as well as performance in the current year.
Based on its review, and giving particular weight to the nature and quality of the resources dedicated by Strategic Advisers and FMR to maintain and improve relative performance and factoring in the unprecedented market events in recent years, the Board concluded that the nature, extent, and quality of investment management and support services and of shareholder and administrative services provided to each fund will benefit each fund's shareholders, particularly in light of the Board's view that each fund's shareholders benefit from investing in a fund that is part of a large family of funds offering a variety of investment disciplines and services.
Annual Report
Competitiveness of Management Fee and Total Fund Expenses. The Board considered each fund's management fee and total expenses compared to "mapped groups" of competitive funds and classes. Fidelity creates "mapped groups" by combining similar Lipper investment objective categories that have comparable management fee characteristics. Combining Lipper investment objective categories aids the Board's management fee and total expense comparisons by broadening the competitive group used for comparison and by reducing the number of universes to which various Fidelity funds are compared.
Management Fee. The Board considered two proprietary management fee comparisons for the 12-month (or shorter) periods shown in the charts below. The group of Lipper funds used by the Board for management fee comparisons is referred to below as the "Total Mapped Group." The Total Mapped Group comparison focuses on a fund's standing relative to the total universe of comparable funds available to investors, in terms of gross management fees before expense reimbursements or caps. "TMG %" represents the percentage of funds in the Total Mapped Group that had management fees that were lower than a fund's. For example, a TMG % of 76% would mean that 24% of the funds in the Total Mapped Group had higher management fees than a fund. The "Asset-Size Peer Group" (ASPG) comparison focuses on a fund's standing relative to non-Fidelity funds similar in size to the fund within the Total Mapped Group. The ASPG represents at least 15% of the funds in the Total Mapped Group with comparable asset size and management fee characteristics, subject to a minimum of 50 funds (or all funds in the Total Mapped Group if fewer than 50). Additional information, such as the ASPG quartile in which a fund's management fee ranked, is also included in the charts and considered by the Board. For a more meaningful comparison of management fees, each fund is compared on the basis of a hypothetical "net management fee," which is derived by subtracting payments made by FMR (under the administration agreement) for non-management expenses (including pricing and bookkeeping fees and fees paid to non-affiliated custodians) from the fund's all-inclusive fee. In this regard, the Board realizes that net management fees can vary from year to year because of differences in non-management expenses, and that non-management expenses may exceed the fund's all-inclusive fee and result in a negative net management fee.
VIP FundsManager 20%
Annual Report
Board Approval of Investment Advisory Contracts and Management Fees - continued
VIP FundsManager 50%
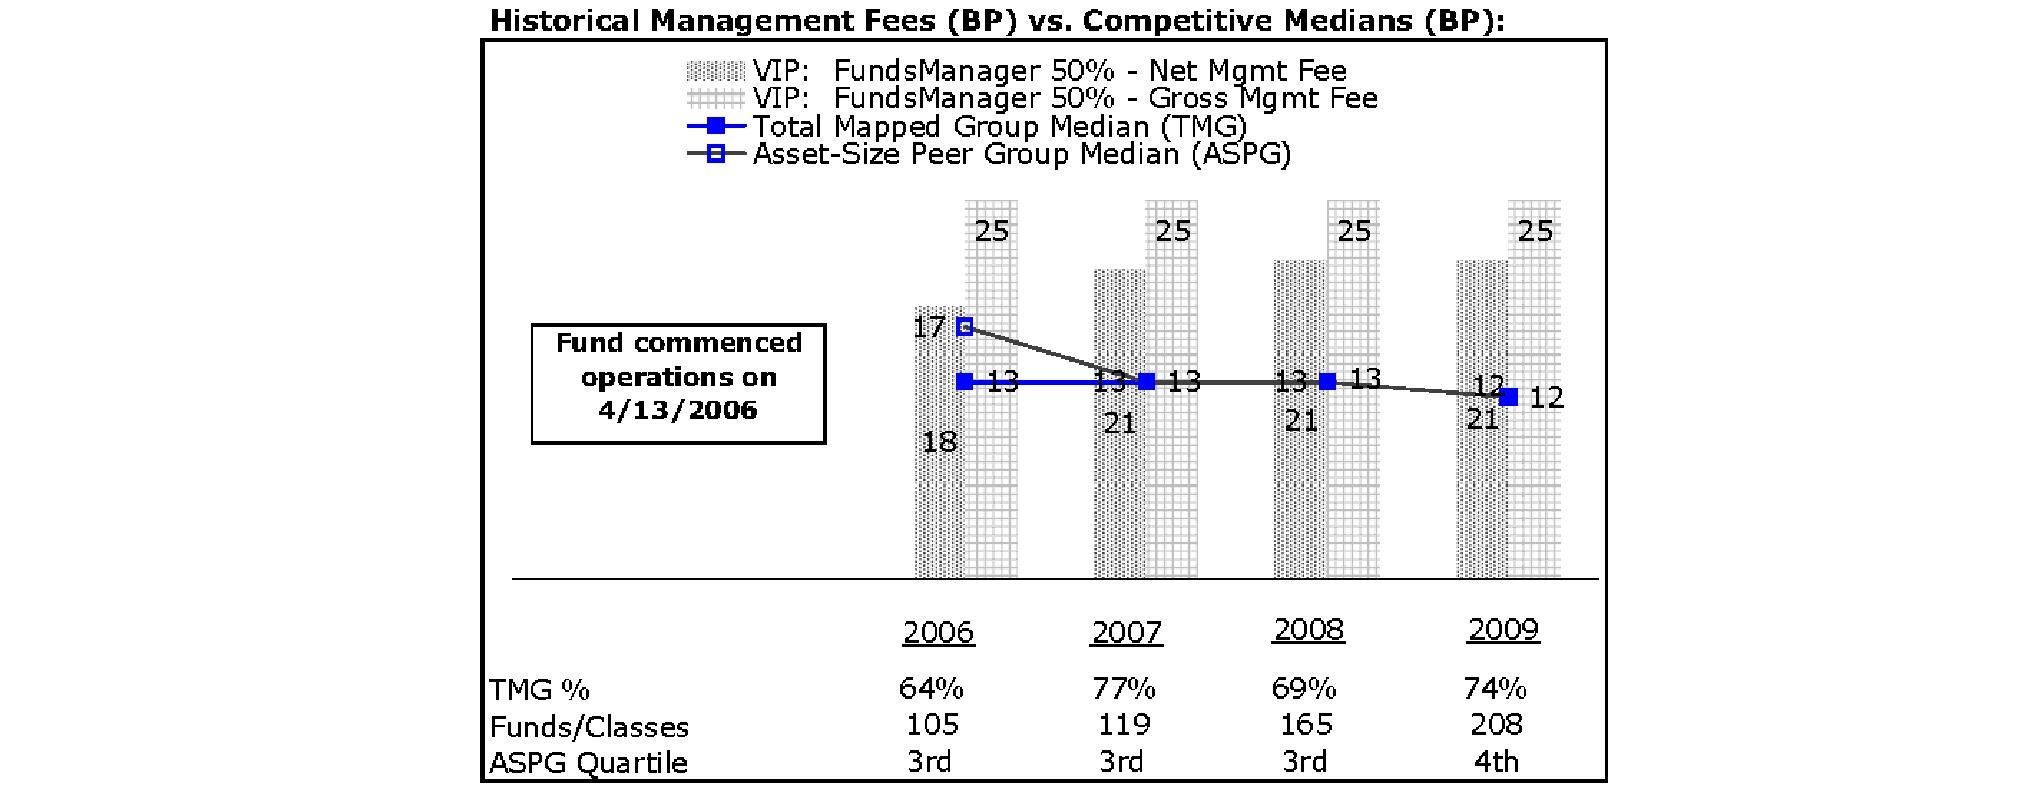
VIP FundsManager 60%
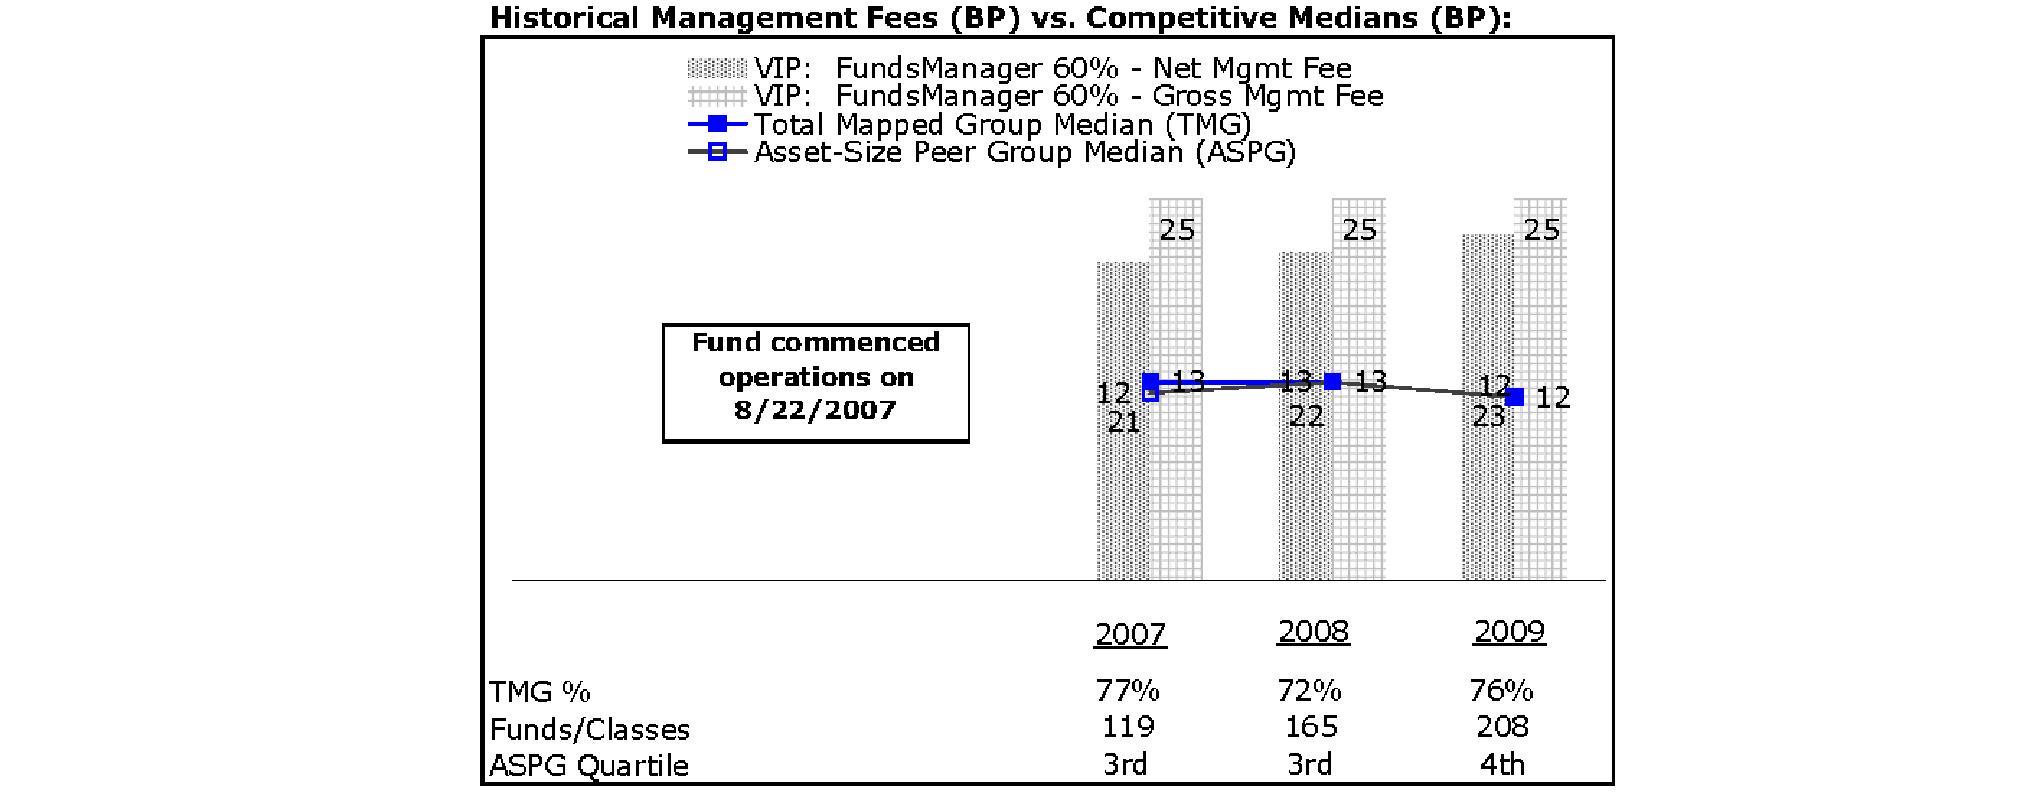
Annual Report
VIP FundsManager 70%
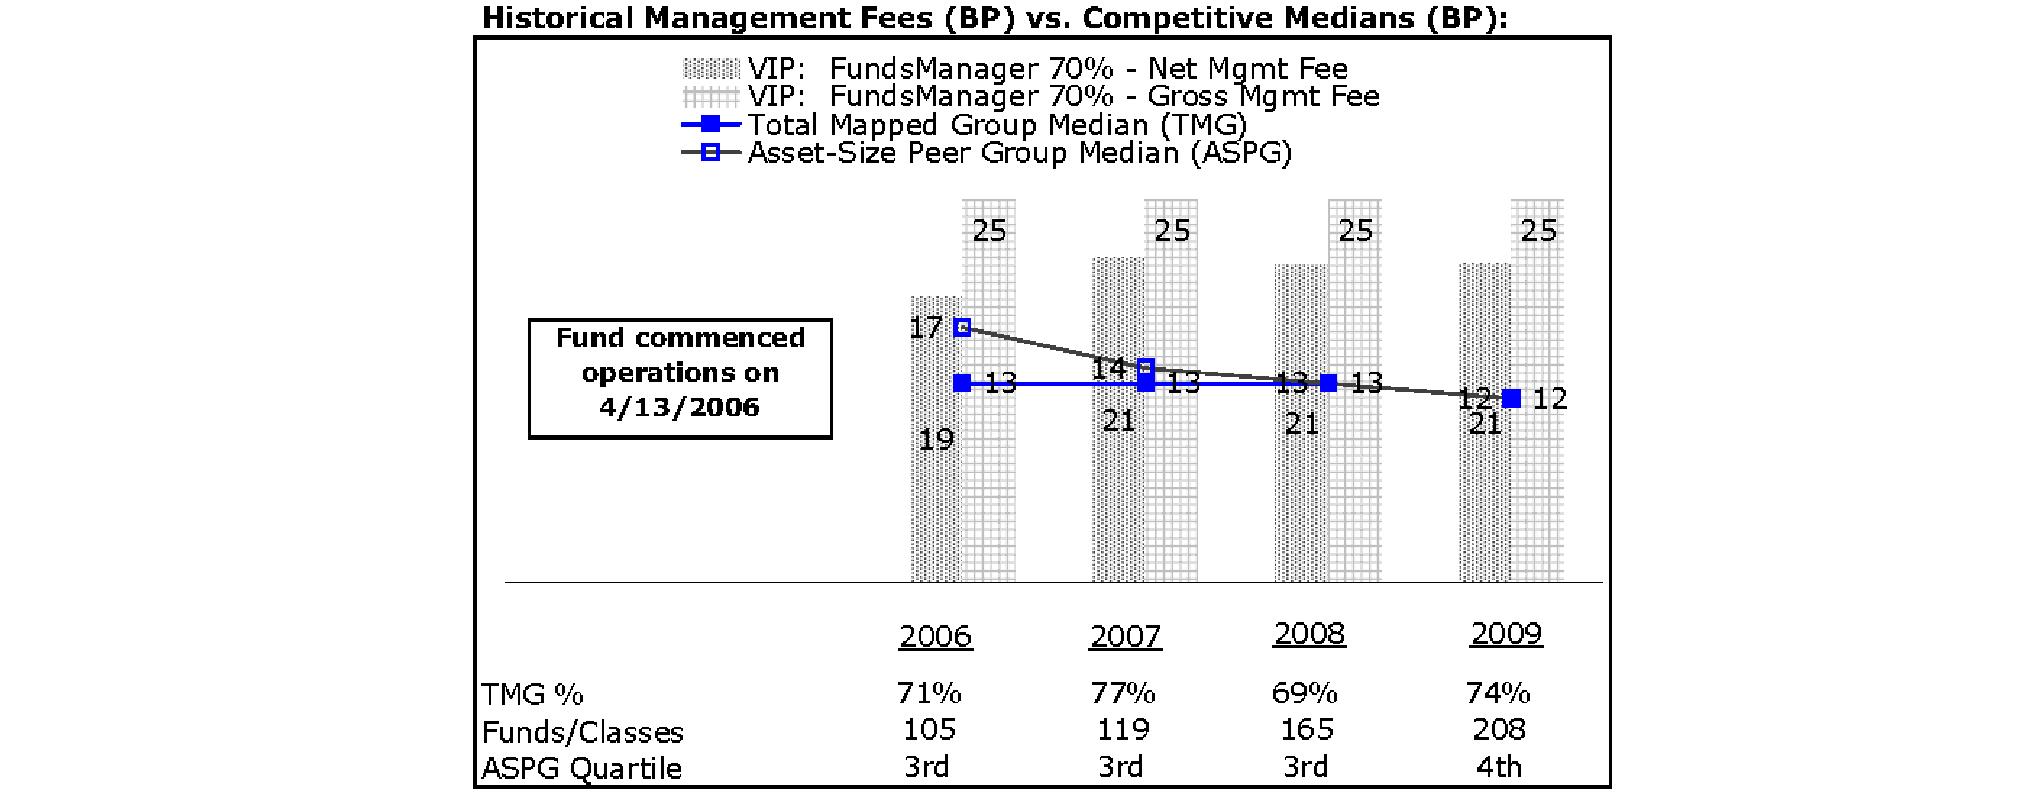
VIP FundsManager 85%
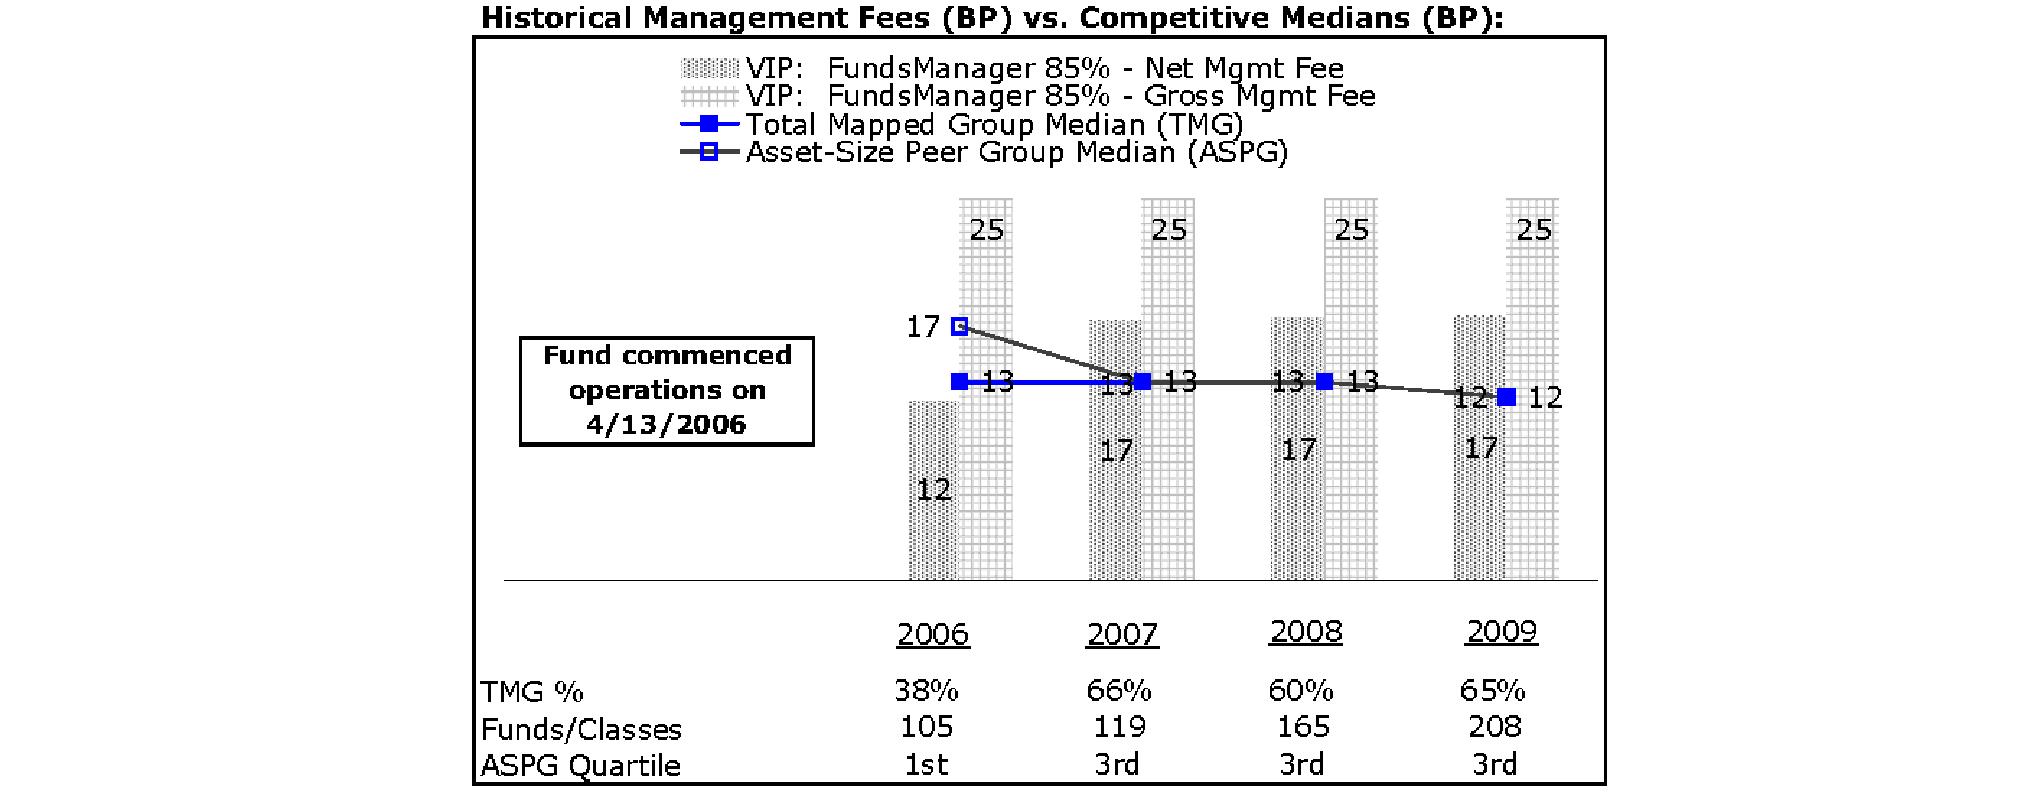
The Board noted that each fund's hypothetical net management fee ranked above the median of its Total Mapped Group and above the median of its ASPG for 2009.
Based on its review, the Board concluded that each fund's management fee is fair and reasonable in light of the services that the fund receives and the other factors considered.
Total Expenses. In its review of the total expenses of each class of each fund, the Board considered the fund's hypothetical net management fee as well as the fund's all-inclusive fee. The Board also considered other expenses, such as pricing and bookkeeping fees and custodial, legal, and audit fees, paid by FMR under the administration agreement. The Board also noted the effects of any waivers and reimbursements on fees and expenses. As part of its review, the Board also considered current and historical total expenses of each fund compared to competitive fund median expenses. Each fund is compared to those funds and classes in the Total Mapped Group (used by the Board for management fee comparisons) that have a similar sales load structure.
Annual Report
Board Approval of Investment Advisory Contracts and Management Fees - continued
The Board noted that the total expenses of each of Investor Class and Service Class of each fund ranked below its competitive median for 2009 and the total expenses of Service Class 2 ranked above its competitive median for 2009. The Board noted that the total expenses of Service Class 2 of each fund were above the median due to 12b-1 fees and that the funds and classes in the Total Mapped Group that have a similar sales load structure included classes with no 12b-1 fees. Excluding the 12b-1 fees, the total expenses of Service Class 2 of each fund ranked below its competitive median for 2009. The Board noted that each fund offers multiple classes, each of which has a different 12b-1 fee structure, and that the multiple structures are intended to offer a range of pricing options for the intermediary market. The Board also noted that the total expenses of the classes of each fund vary primarily by the level of their 12b-1 fees.
Fees Charged to Other Fidelity Clients. The Board also considered Fidelity fee structures and other information with respect to clients of FMR and its affiliates, such as other mutual funds advised or subadvised by FMR or its affiliates, pension plan clients, and other institutional clients. In March 2010, the Board created an ad hoc joint committee with the board of other Fidelity funds (the Committee) to review and compare Fidelity's institutional investment advisory business with its business of providing services to the Fidelity funds, including the differences in services provided, fees charged, and costs incurred, as well as competition in their respective marketplaces.
Based on its review of total expenses and fees charged to other Fidelity clients, the Board concluded that the total expenses of each class of each fund were reasonable, although in some cases above the median of the universe presented for comparison, in light of the services that the fund and its shareholders receive and the other factors considered, including the findings of the Committee.
Costs of the Services and Profitability. The Board considered the revenues earned and the expenses incurred by Fidelity in conducting the business of developing, marketing, distributing, managing, administering and servicing each fund and its shareholders. The Board also considered the level of Fidelity's profits in respect of all the Fidelity funds.
On an annual basis, FMR presents to the Board Fidelity's profitability for each fund. Fidelity calculates the profitability for each fund, as well as aggregate profitability for groups of Fidelity funds and all Fidelity funds, using a series of detailed revenue and cost allocation methodologies which originate with the audited books and records of Fidelity. The Audit Committee of the Board reviews any significant changes from the prior year's methodologies.
PricewaterhouseCoopers LLP (PwC), independent registered public accounting firm and auditor to Fidelity and certain Fidelity funds, has been engaged annually by the Board as part of the Board's assessment of Fidelity's profitability analysis. PwC's engagement includes the review and assessment of Fidelity's methodologies used in determining the revenues and expenses attributable to Fidelity's mutual fund business, and completion of agreed-upon procedures surrounding the mathematical accuracy of fund profitability and its conformity to allocation methodologies. After considering PwC's reports issued under the engagement and information provided by Fidelity, the Board believes that while other allocation methods may also be reasonable, Fidelity's profitability methodologies are reasonable in all material respects.
The Board has also reviewed Fidelity's non-fund businesses and fall-out benefits related to the mutual fund business as well as cases where Fidelity's affiliates may benefit from or be related to the funds' business.
The Board considered the costs of the services provided by and the profits realized by Fidelity in connection with the operation of each fund and were satisfied that the profitability was not excessive in the circumstances.
Economies of Scale. The Board considered whether there have been economies of scale in respect of the management of the Fidelity funds, whether the Fidelity funds (including each fund) have appropriately benefited from any such economies of scale, and whether there is potential for realization of any further economies of scale. The Board considered the extent to which each fund will benefit from economies of scale through increased services to the fund, through waivers or reimbursements, or through fee or expense reductions.
In February 2009, the Board and the board of other Fidelity funds created an ad hoc committee (the Economies of Scale Committee) to analyze whether FMR attains economies of scale in respect of the management and servicing of the Fidelity funds, whether the Fidelity funds have appropriately benefited from such economies of scale, and whether there is potential for realization of any further economies of scale.
The Board concluded, considering the findings of the Economies of Scale Committee, that any potential economies of scale are being appropriately shared between fund shareholders and Fidelity.
Additional Information Requested by the Board. In order to develop fully the factual basis for consideration of the Fidelity funds' Advisory Contracts, the Board requested and received additional information on certain topics, including (i) fund performance trends, actions to be taken by FMR to improve certain funds' overall performance, and Fidelity's long-term strategies for certain funds; (ii) Fidelity's fund profitability methodology methodology and profitability trends for certain funds; (iii) portfolio manager changes that have occurred during the past year and the amount of the investment that each portfolio manager has made in the Fidelity fund(s) that he or she manages; (iv) Fidelity's compensation structure for portfolio managers, research analysts, and other key personnel, including its effects on fund profitability, the rationale for the compensation structure, and the extent to which current market conditions have affected retention and recruitment; (v) the compensation paid by FMR to fund sub-advisers on behalf of the Fidelity funds; (vi) Fidelity's fee structures and rationale for recommending different fees among different categories of funds and classes, as well as Fidelity's voluntary waiver of fees to maintain minimum yields for certain funds and classes; (vii) the rationale for any differences between fund fee structures and fee structures in place for other Fidelity clients; and (viii) explanations regarding the relative total expenses borne by certain funds and classes, total expense competitive trends, and actions that might be taken by FMR to reduce total expenses for certain funds and classes or to achieve further economies of scale.
Annual Report
Based on its evaluation of all of the conclusions noted above, and after considering all factors it believed relevant, the Board ultimately concluded that the advisory fee structures are fair and reasonable, and that each fund's Advisory Contracts should be renewed.
Annual Report
Investment Adviser
Strategic Advisers, Inc.
Boston, MA
General Distributor
Fidelity Distributors Corporation
Boston, MA
Transfer and Service Agents
Fidelity Investments Institutional Operations Company, Inc.
Boston, MA
Fidelity Service Company, Inc.
Boston, MA
Custodian
The Bank of New York Mellon
New York, NY
VIPFM-ANN-0211
1.843208.104
Fidelity® Variable Insurance Products:
Investor Freedom® Funds -
Income, 2005, 2010, 2015, 2020, 2025, 2030
Annual Report
December 31, 2010
(2_fidelity_logos) (Registered_Trademark)
Contents
To view a fund's proxy voting guidelines and proxy voting record for the 12-month period ended June 30, visit http://www.fidelity.com/proxyvotingresults or visit the Securities and Exchange Commission's (SEC) web site at http://www.sec.gov. You may also call 1-877-208-0098 to request a free copy of the proxy voting guidelines.
Fidelity Variable Insurance Products are separate account options which are purchased through a variable insurance contract.
Standard & Poor's, S&P and S&P 500 are registered service marks of The McGraw-Hill Companies, Inc. and have been licensed for use by Fidelity Distributors Corporation.
Other third party marks appearing herein are the property of their respective owners.
All other marks appearing herein are registered or unregistered trademarks or service marks of FMR LLC or an affiliated company.
Annual Report
This report and the financial statements contained herein are submitted for the general information of the shareholders of the funds. This report is not authorized for distribution to prospective investors in the funds unless preceded or accompanied by an effective prospectus.
A fund files its complete schedule of portfolio holdings with the SEC for the first and third quarters of each fiscal year on Form N-Q. Forms N-Q are available on the SEC's web site at http://www.sec.gov. A fund's Forms N-Q may be reviewed and copied at the SEC's Public Reference Room in Washington, DC. Information regarding the operation of the SEC's Public Reference Room may be obtained by calling 1-800-SEC-0330. For a complete list of a fund's portfolio holdings, view the most recent holdings listing, semiannual report, or annual report on Fidelity's web site at http://www.fidelity.com, http://www.advisor.fidelity.com, or http://401k.com, as applicable.
NOT FDIC INSURED • MAY LOSE VALUE • NO BANK GUARANTEE
Neither the funds nor Fidelity Distributors Corporation is a bank.
Annual Report
VIP Investor Freedom Income PortfolioSM
Average annual total return reflects the change in the value of an investment, assuming reinvestment of the fund's distributions from dividend income and capital gains (the profits earned upon the sale of securities that have grown in value, if any) and assuming a constant rate of performance each year. During periods of reimbursement by Fidelity, a fund's total return will be greater than it would be had the reimbursement not occurred. Performance numbers are net of all underlying fund operating expenses, but do not include any insurance charges imposed by your insurance company's separate account. If performance information included the effect of these additional charges, the total returns would have been lower. How a fund did yesterday is no guarantee of how it will do tomorrow.
Average Annual Total Returns
Periods ended December 31, 2010 | Past 1
year | Past 5
years | Life of fund A |
VIP Investor Freedom Income Portfolio | 7.50% | 4.59% | 4.50% |
A From August 3, 2005.
$10,000 Over Life of Fund
Let's say hypothetically that $10,000 was invested in VIP Investor Freedom Income Portfolio on August 3, 2005, when the fund started. The chart shows how the value of your investment would have changed, and also shows how the Barclays Capital® U.S. Aggregate Bond Index performed over the same period.
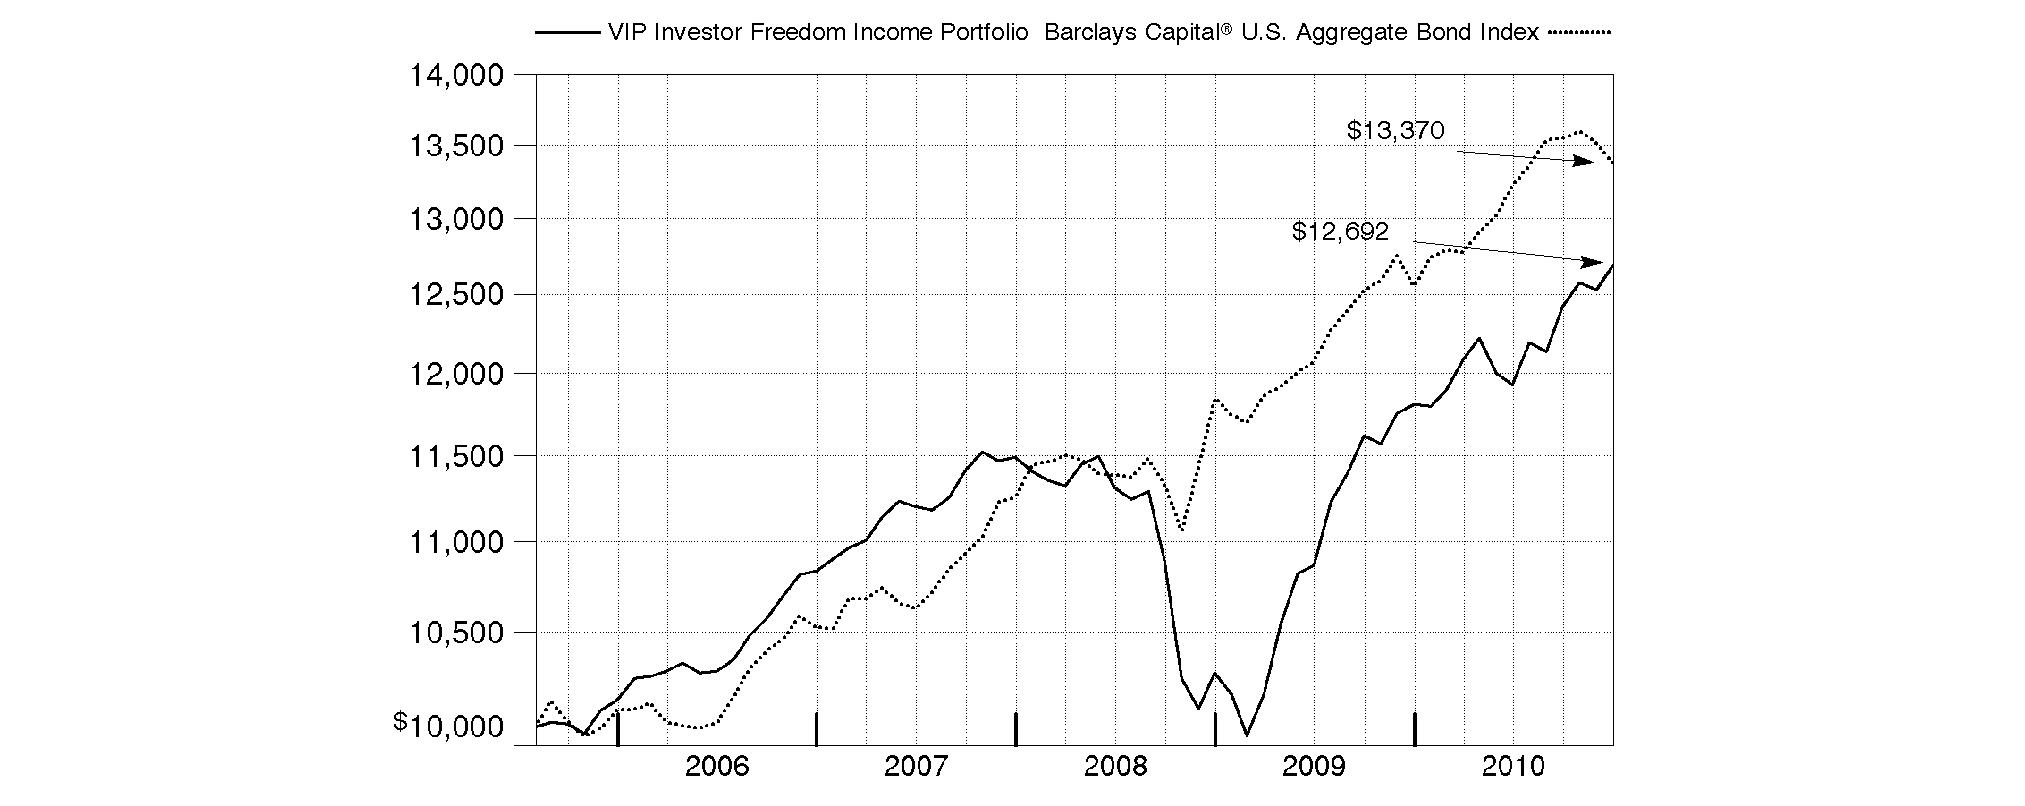
Annual Report
VIP Investor Freedom 2005 PortfolioSM
Performance: The Bottom Line
Average annual total return reflects the change in the value of an investment, assuming reinvestment of the fund's distributions from dividend income and capital gains (the profits earned upon the sale of securities that have grown in value, if any) and assuming a constant rate of performance each year. During periods of reimbursement by Fidelity, a fund's total return will be greater than it would be had the reimbursement not occurred. Performance numbers are net of all underlying fund operating expenses, but do not include any insurance charges imposed by your insurance company's separate account. If performance information included the effect of these additional charges, the total returns would have been lower. How a fund did yesterday is no guarantee of how it will do tomorrow.
Average Annual Total Returns
Periods ended December 31, 2010 | Past 1
year | Past 5
years | Life of fund A |
VIP Investor Freedom 2005 Portfolio | 11.41% | 4.38% | 4.49% |
A From August 3, 2005.
$10,000 Over Life of Fund
Let's say hypothetically that $10,000 was invested in VIP Investor Freedom 2005 Portfolio on August 3, 2005, when the fund started. The chart shows how the value of your investment would have changed, and also shows how the Barclays Capital U.S. Aggregate Bond Index performed over the same period.
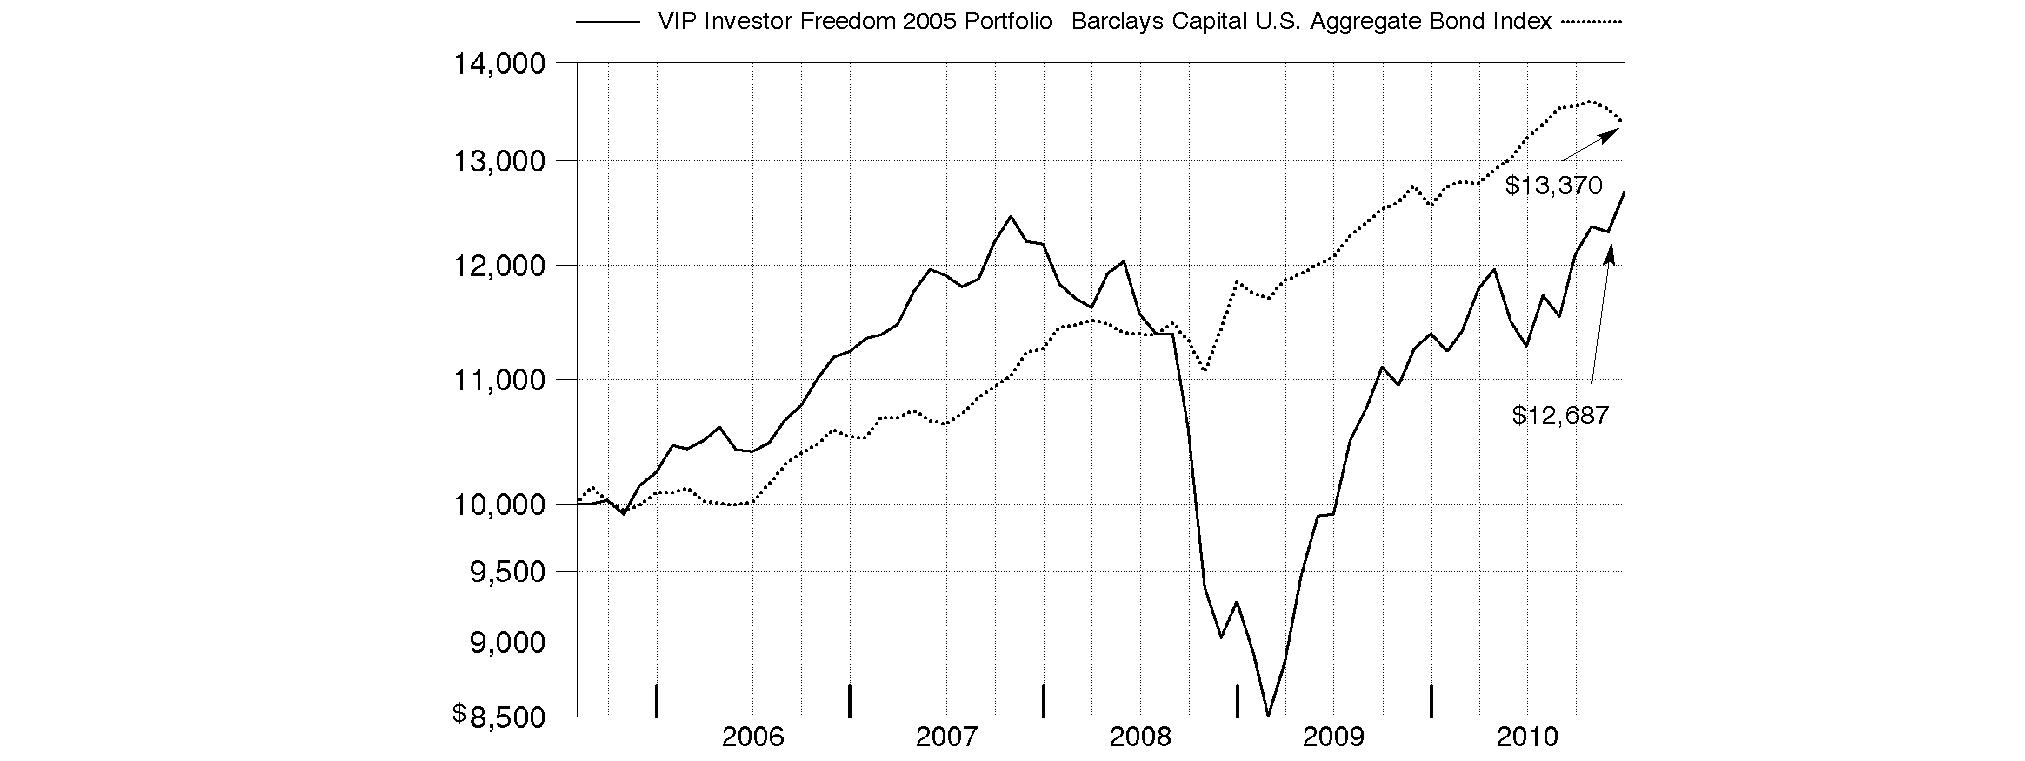
Annual Report
VIP Investor Freedom 2010 PortfolioSM
Performance: The Bottom Line
Average annual total return reflects the change in the value of an investment, assuming reinvestment of the fund's distributions from dividend income and capital gains (the profits earned upon the sale of securities that have grown in value, if any) and assuming a constant rate of performance each year. During periods of reimbursement by Fidelity, a fund's total return will be greater than it would be had the reimbursement not occurred. Performance numbers are net of all underlying fund operating expenses, but do not include any insurance charges imposed by your insurance company's separate account. If performance information included the effect of these additional charges, the total returns would have been lower. How a fund did yesterday is no guarantee of how it will do tomorrow.
Average Annual Total Returns
Periods ended December 31, 2010 | Past 1
year | Past 5
years | Life of fund A |
VIP Investor Freedom 2010 Portfolio | 12.88% | 4.56% | 4.70% |
A From August 3, 2005.
$10,000 Over Life of Fund
Let's say hypothetically that $10,000 was invested in VIP Investor Freedom 2010 Portfolio on August 3, 2005, when the fund started. The chart shows how the value of your investment would have changed, and also shows how the Barclays Capital U.S. Aggregate Bond Index performed over the same period.
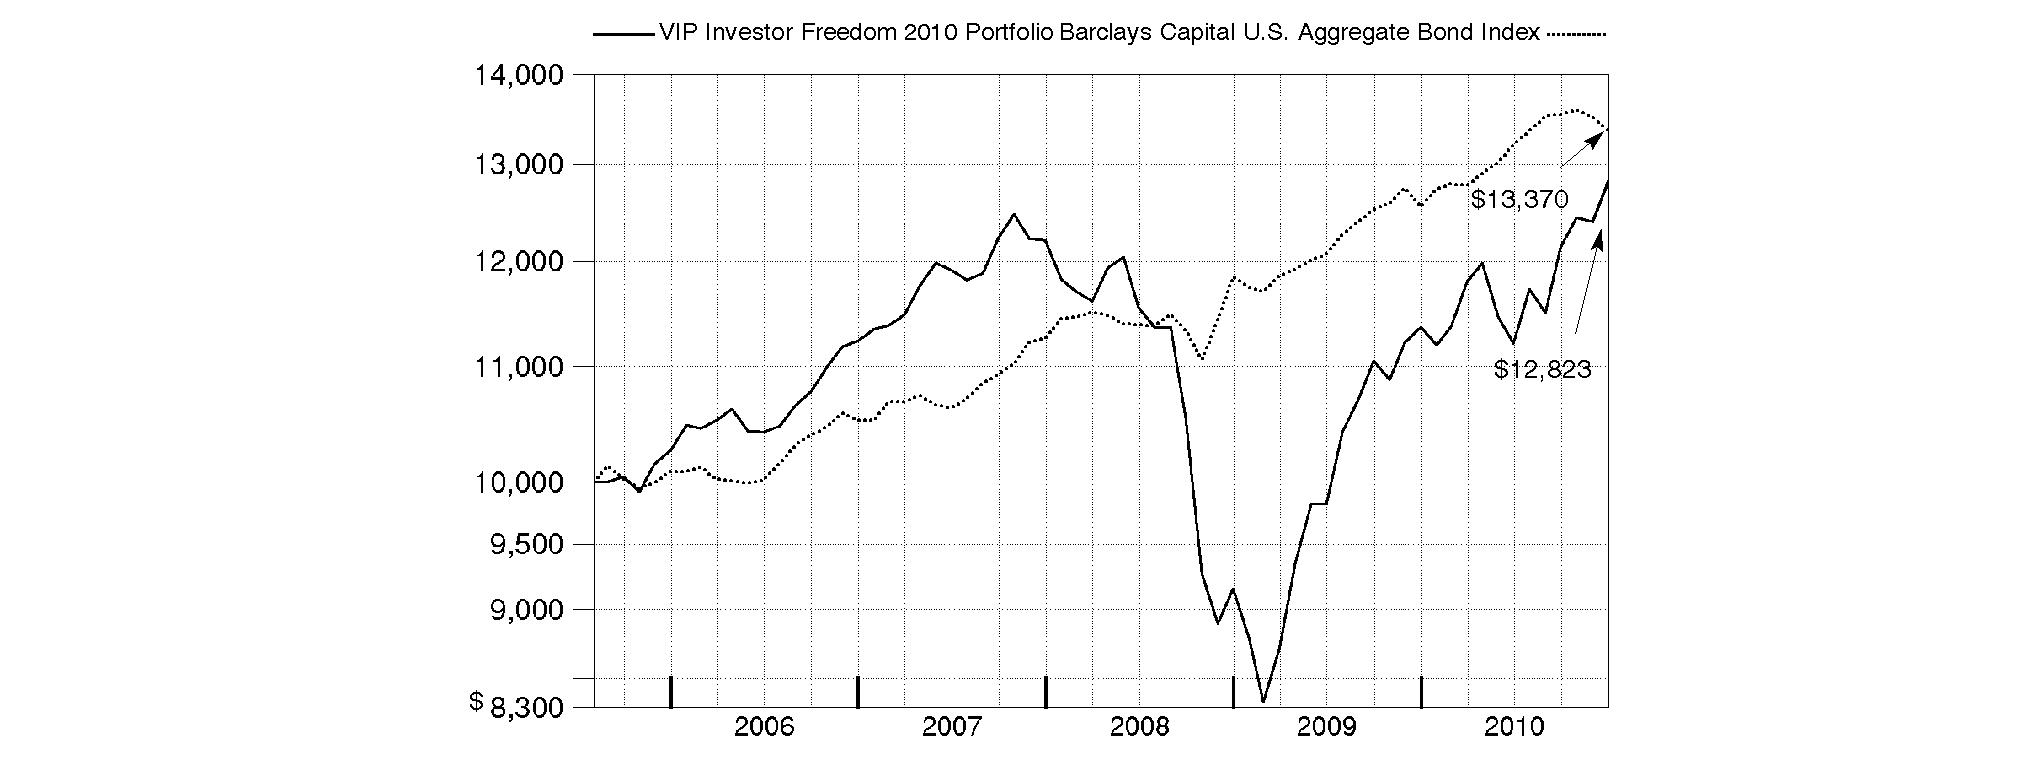
Annual Report
VIP Investor Freedom 2015 PortfolioSM
Performance: The Bottom Line
Average annual total return reflects the change in the value of an investment, assuming reinvestment of the fund's distributions from dividend income and capital gains (the profits earned upon the sale of securities that have grown in value, if any) and assuming a constant rate of performance each year. During periods of reimbursement by Fidelity, a fund's total return will be greater than it would be had the reimbursement not occurred. Performance numbers are net of all underlying fund operating expenses, but do not include any insurance charges imposed by your insurance company's separate account. If performance information included the effect of these additional charges, the total returns would have been lower. How a fund did yesterday is no guarantee of how it will do tomorrow.
Average Annual Total Returns
Periods ended December 31, 2010 | Past 1
year | Past 5
years | Life of fund A |
VIP Investor Freedom 2015 Portfolio | 13.06% | 4.57% | 4.82% |
A From August 3, 2005.
$10,000 Over Life of Fund
Let's say hypothetically that $10,000 was invested in VIP Investor Freedom 2015 Portfolio on August 3, 2005, when the fund started. The chart shows how the value of your investment would have changed, and also shows how the S&P 500® Index performed over the same period.
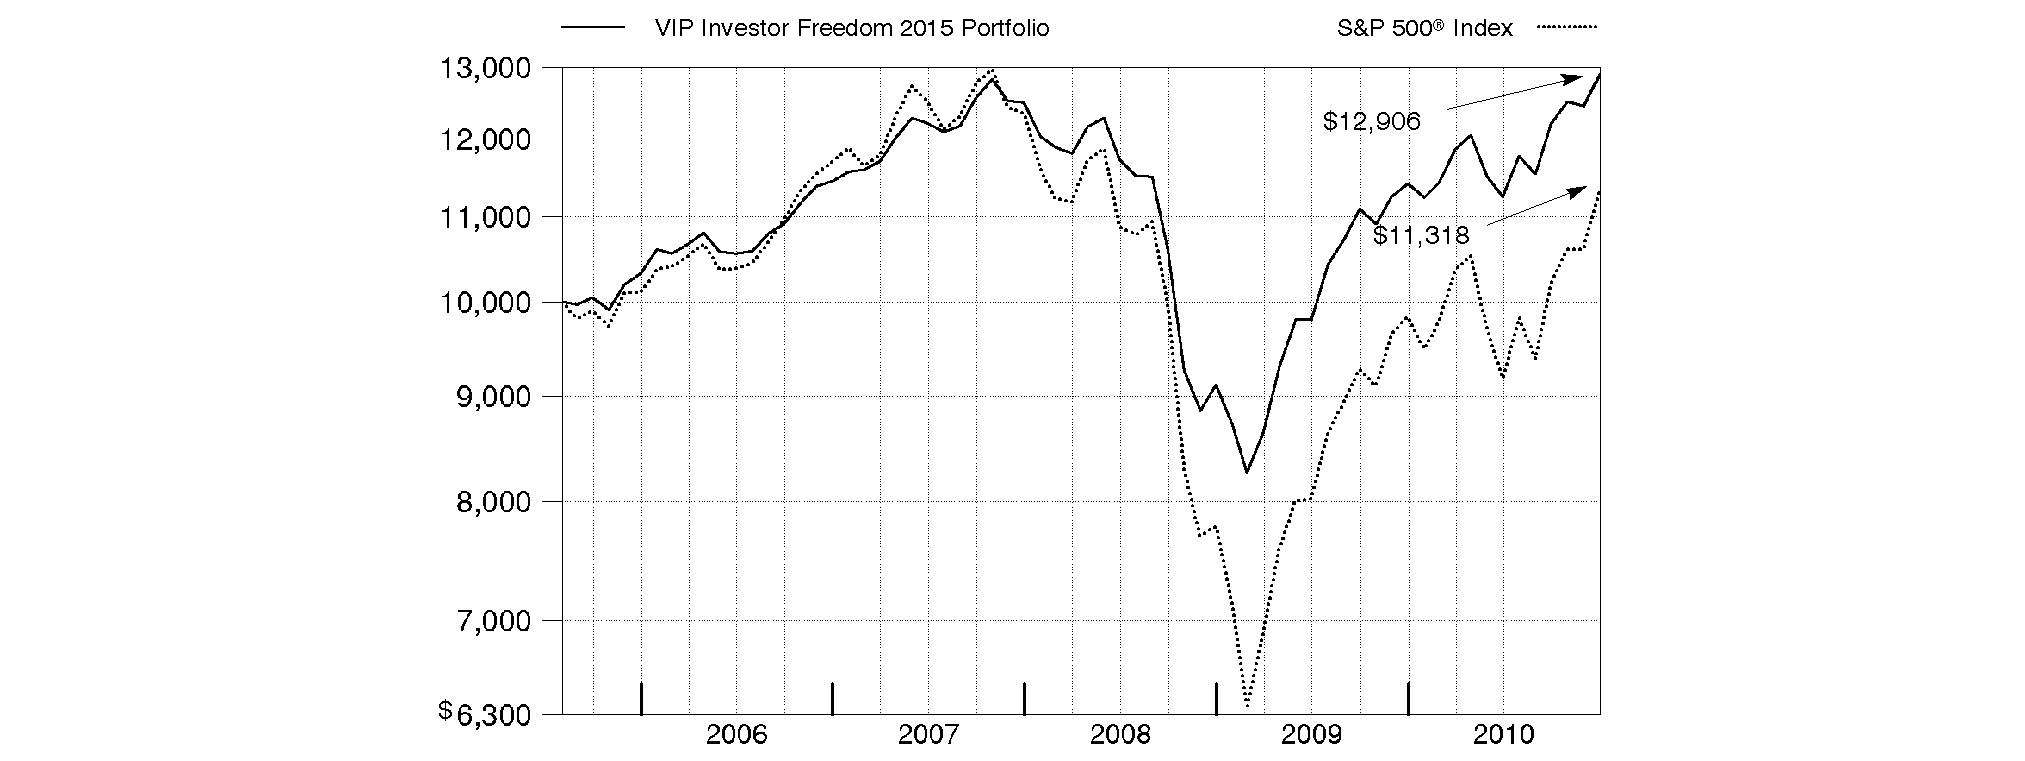
Annual Report
VIP Investor Freedom 2020 PortfolioSM
Performance: The Bottom Line
Average annual total return reflects the change in the value of an investment, assuming reinvestment of the fund's distributions from dividend income and capital gains (the profits earned upon the sale of securities that have grown in value, if any) and assuming a constant rate of performance each year. During periods of reimbursement by Fidelity, a fund's total return will be greater than it would be had the reimbursement not occurred. Performance numbers are net of all underlying fund operating expenses, but do not include any insurance charges imposed by your insurance company's separate account. If performance information included the effect of these additional charges, the total returns would have been lower. How a fund did yesterday is no guarantee of how it will do tomorrow.
Average Annual Total Returns
Periods ended December 31, 2010 | Past 1
year | Past 5
years | Life of fund A |
VIP Investor Freedom 2020 Portfolio | 14.46% | 4.12% | 4.48% |
A From August 3, 2005.
$10,000 Over Life of Fund
Let's say hypothetically that $10,000 was invested in VIP Investor Freedom 2020 Portfolio on August 3, 2005, when the fund started. The chart shows how the value of your investment would have changed, and also shows how the S&P 500 Index performed over the same period.
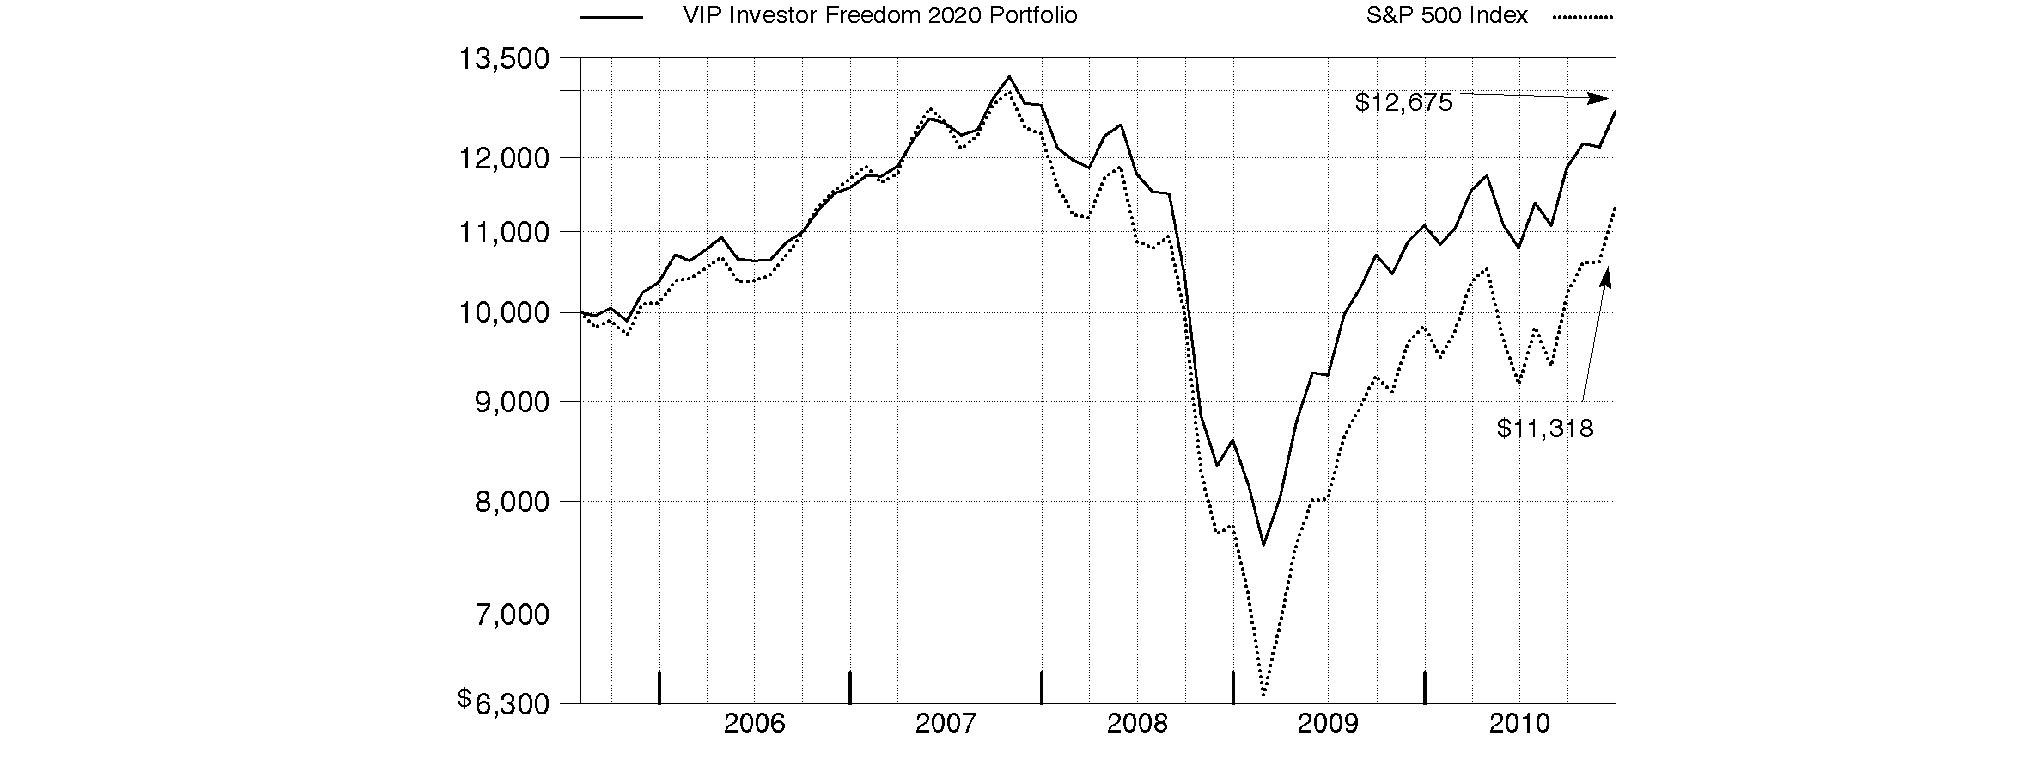
Annual Report
VIP Investor Freedom 2025 PortfolioSM
Performance: The Bottom Line
Average annual total return reflects the change in the value of an investment, assuming reinvestment of the fund's distributions from dividend income and capital gains (the profits earned upon the sale of securities that have grown in value, if any) and assuming a constant rate of performance each year. During periods of reimbursement by Fidelity, a fund's total return will be greater than it would be had the reimbursement not occurred. Performance numbers are net of all underlying fund operating expenses, but do not include any insurance charges imposed by your insurance company's separate account. If performance information included the effect of these additional charges, the total returns would have been lower. How a fund did yesterday is no guarantee of how it will do tomorrow.
Average Annual Total Returns
Periods ended December 31, 2010 | Past 1
year | Past 5
years | Life of fund A |
VIP Investor Freedom 2025 Portfolio | 15.80% | 4.17% | 4.58% |
A From August 3, 2005.
$10,000 Over Life of Fund
Let's say hypothetically that $10,000 was invested in VIP Investor Freedom 2025 Portfolio on August 3, 2005, when the fund started. The chart shows how the value of your investment would have changed, and also shows how the S&P 500 Index performed over the same period.
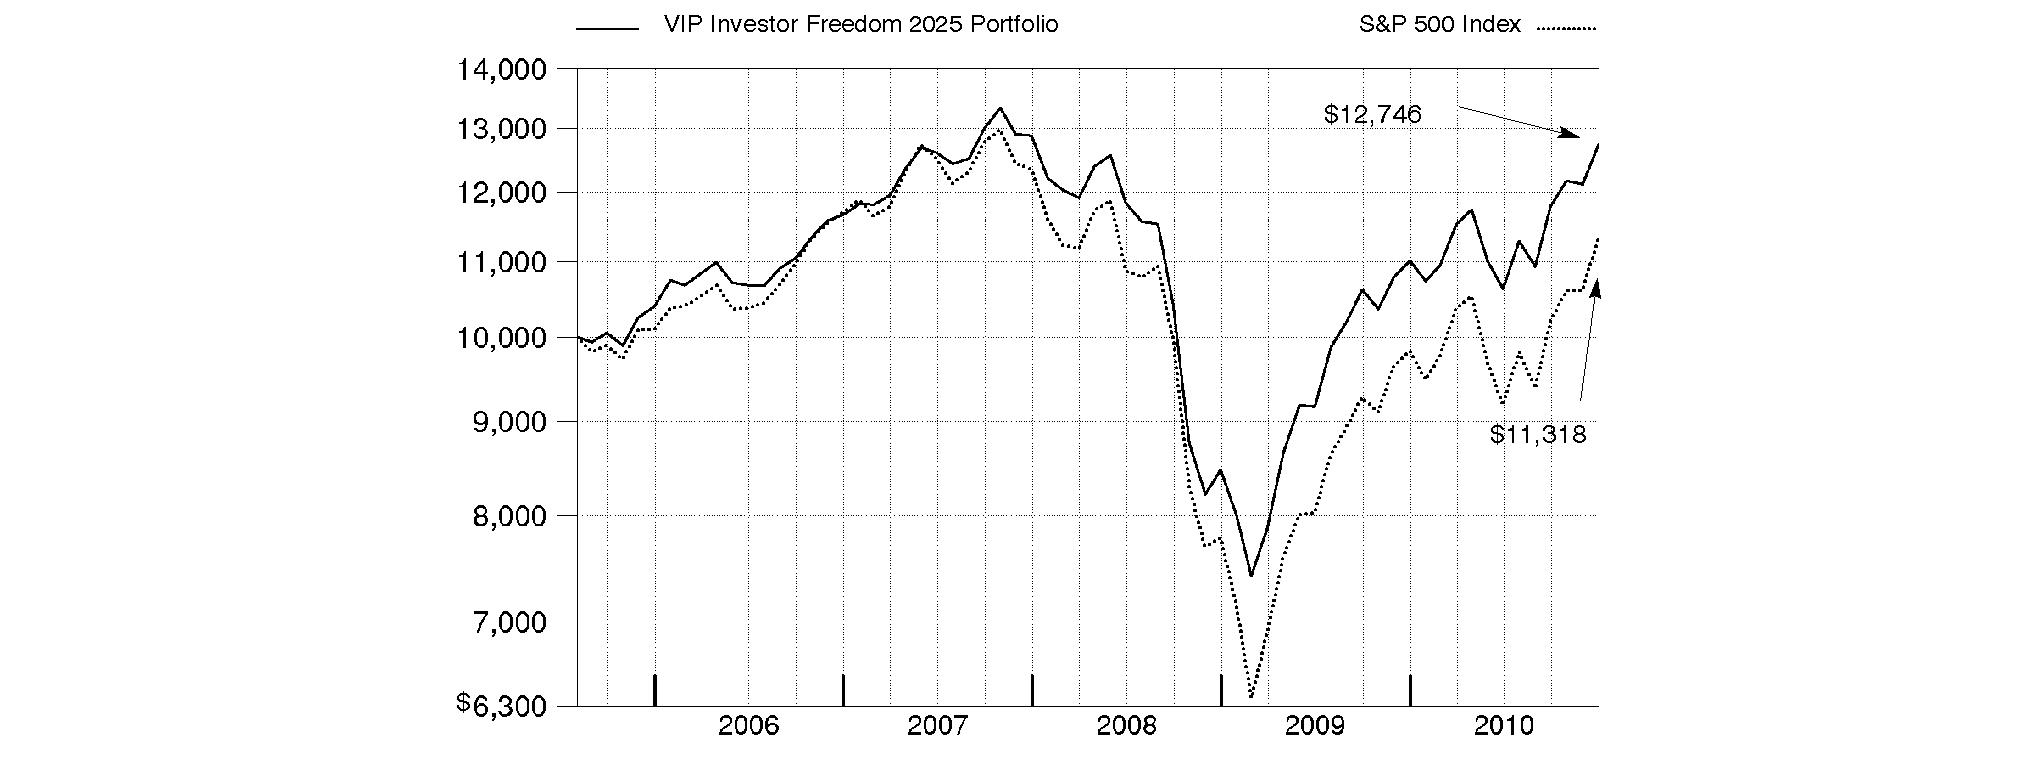
Annual Report
VIP Investor Freedom 2030 PortfolioSM
Performance: The Bottom Line
Average annual total return reflects the change in the value of an investment, assuming reinvestment of the fund's distributions from dividend income and capital gains (the profits earned upon the sale of securities that have grown in value, if any) and assuming a constant rate of performance each year. During periods of reimbursement by Fidelity, a fund's total return will be greater than it would be had the reimbursement not occurred. Performance numbers are net of all underlying fund operating expenses, but do not include any insurance charges imposed by your insurance company's separate account. If performance information included the effect of these additional charges, the total returns would have been lower. How a fund did yesterday is no guarantee of how it will do tomorrow.
Average Annual Total Returns
Periods ended December 31, 2010 | Past 1
year | Past 5
years | Life of fund A |
VIP Investor Freedom 2030 Portfolio | 16.12% | 3.54% | 4.05% |
A From August 3, 2005.
$10,000 Over Life of Fund
Let's say hypothetically that $10,000 was invested in VIP Investor Freedom 2030 Portfolio on August 3, 2005, when the fund started. The chart shows how the value of your investment would have changed, and also shows how the S&P 500 Index performed over the same period.
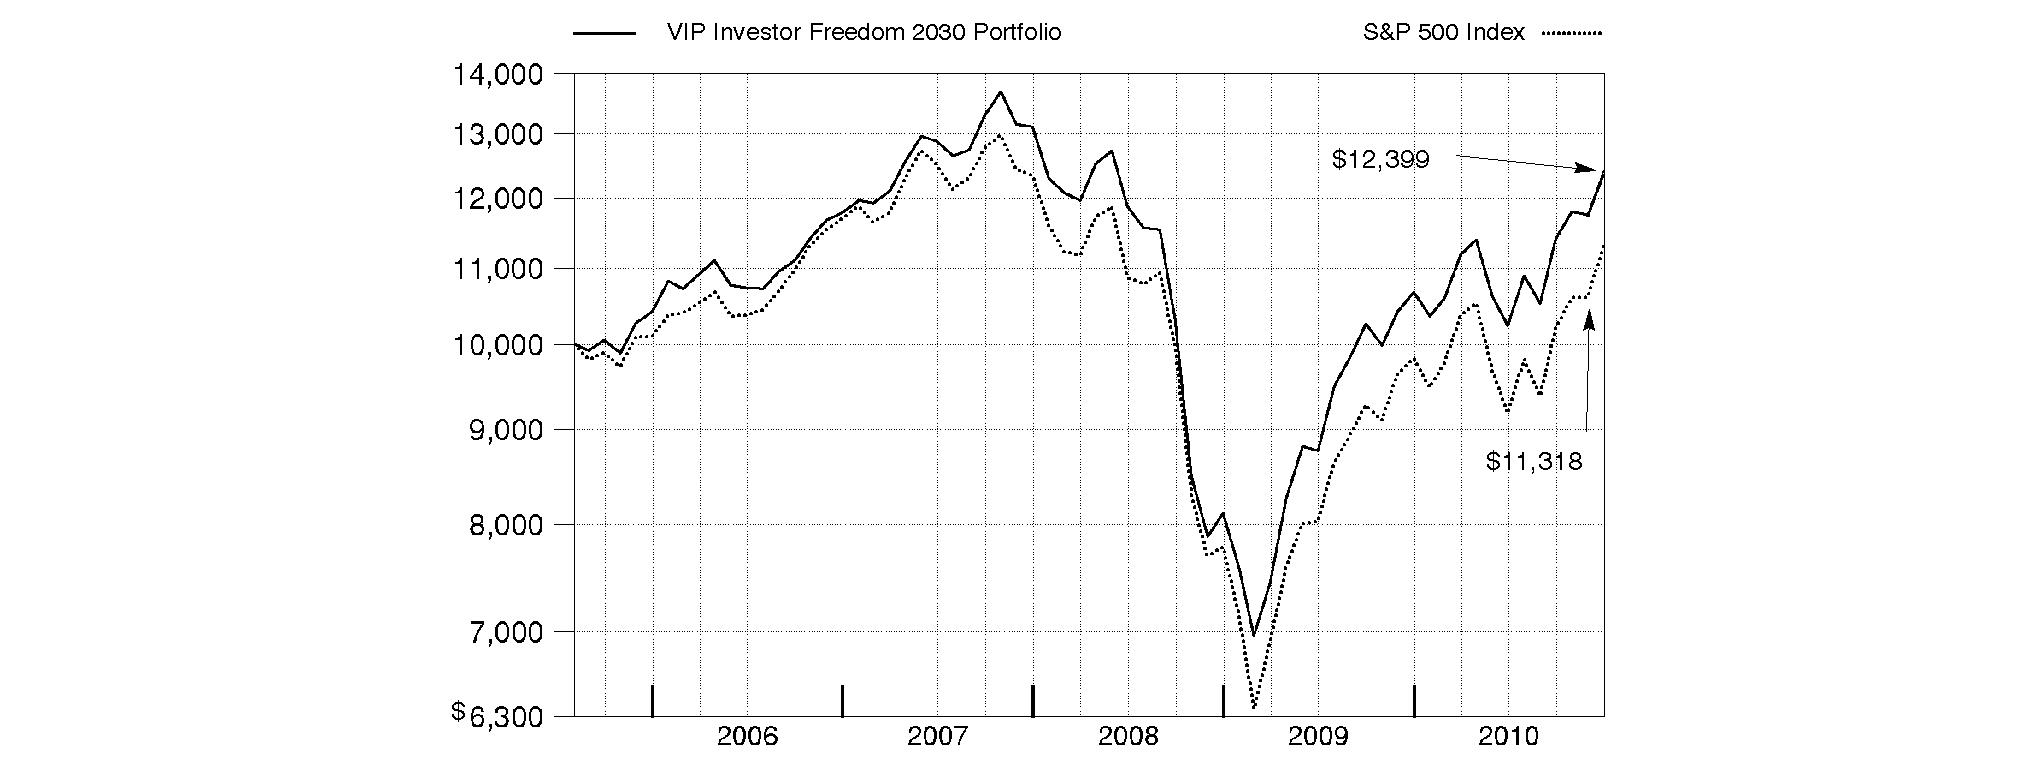
Annual Report
Market Recap: While market improvements around the world hit a speed bump in the first half of the 12-month period ending December 31, 2010, world economies re-accelerated in August, supported by a broadening recovery and low inflation in the U.S. Domestic stock markets recorded solid gains for the year, lifted by a strong second-half rally fueled by economic optimism, encouraging earnings reports and a wave of corporate mergers. The large-cap S&P 500® Index rose 15.06%, the blue-chip-laden Dow Jones Industrial AverageSM added 14.06% and the technology-heavy Nasdaq Composite® Index climbed 18.02%. Meanwhile, international stocks, as represented by the MSCI® ACWI® (All Country World Index) ex USA Index, gained 11.29%, boosted in part by a depreciating U.S. dollar. In the fixed-income arena, U.S. taxable investment-grade bonds generated positive results during 2010, as the Barclays Capital® U.S. Aggregate Bond Index gained 6.54%. With ultra-low interest rates bolstering nearly all fixed-income securities for most of the year, sectors in the index with higher yields and more credit risk generally fared best, while most high-quality bonds generated more-moderate returns. Meanwhile, high-yield bonds, as represented by The BofA Merrill LynchSM US High Yield Constrained Index, returned 15.07%, a result of improved economic data and strengthening investor demand. Overseas, foreign bond markets showed mixed results, with a sizable disparity between the 3.97% return of the Citigroup® Non-U.S. Group of 7 Index - which measures the performance of sovereign debt of the major global economies outside the U.S. - and the 12.04% advance of the JPMorgan Emerging Markets Bond Index Global (EMBI Global), which benefited from the rising overall credit quality of emerging-markets debt issuers.
Comments from Jonathan Shelon and Christopher Sharpe, Co-Portfolio Managers of VIP Investor Freedom® Funds: For the year ending December 31, 2010, each of the four asset classes represented in the VIP Investor Freedom Funds' portfolios - U.S. equity, non-U.S. equity, fixed income and short-term debt investments - posted positive absolute results. However, it was the allocation to equities and investment-grade debt that provided the biggest boost to their year-end results. Consequently, each of the VIP Investor Freedom Funds delivered exceptional returns for investors, with VIP Investor Freedom Income - the most-conservative, shortest-dated Fund - gaining a solid single digit increase, while the longer-dated, more-equity-focused Funds rose into the low- to mid-teens. The Funds' U.S. equity class solidly outpaced the broad-based Dow Jones U.S. Total Stock Market IndexSM, which rose 17.49% for the one-year period ending December 31, 2010. Four of the seven underlying domestic equity funds beat the Dow Jones index, with underlying funds focusing on smaller-capitalization stocks - such as VIP Mid Cap Portfolio and VIP Value Strategies Portfolio - delivering the highest absolute results. VIP Growth Portfolio and VIP Value Portfolio, which invest more heavily in larger-capitalization stocks, also significantly contributed to the Funds' performance. The Funds' non-U.S. equity asset class, which handily outperformed the 7.88% gain of the MSCI ® EAFE® (Europe, Australasia, Far East) Index, also bolstered absolute results. VIP Overseas Portfolio anchored the Funds' performance in the non-U.S. equity class, while VIP Emerging Markets Portfolio - benefiting from an increase in consumer spending in emerging markets - posted a near 18% return for the year. U.S. investors also gained from a generally weaker dollar, which lifted foreign stock returns. Turning to bonds, the Funds' fixed-income asset class handily beat the Barclays Capital® U.S. Aggregate Bond Index. Buoyed by its allocation to credit-related securities, which performed well for most of the year, VIP Investment Grade Bond Portfolio solidly contributed to the Funds' performance, while VIP High Income Portfolio roared past the broader bond market. Lastly, the Funds' short-term debt holding, VIP Money Market Portfolio, performed roughly in line with the Barclays Capital U.S. 3 Month Treasury Bellwether Index, which increased 0.15%.
The views expressed above reflect those of the portfolio manager(s) only through the end of the period as stated on the cover of this report and do not necessarily represent the views of Fidelity or any other person in the Fidelity organization. Any such views are subject to change at any time based upon market or other conditions and Fidelity disclaims any responsibility to update such views. These views may not be relied on as investment advice and, because investment decisions for a Fidelity fund are based on numerous factors, may not be relied on as an indication of trading intent on behalf of any Fidelity fund.
Annual Report
As a shareholder of a Fund, you incur two types of costs: (1) transaction costs, and (2) ongoing costs, including other Fund expenses. This Example is intended to help you understand your ongoing costs (in dollars) of investing in the Funds and to compare these costs with the ongoing costs of investing in other mutual funds.
The Example is based on an investment of $1,000 invested at the beginning of the period and held for the entire period (July 1, 2010 to December 31, 2010).
Actual Expenses
The first line of the accompanying table for each fund provides information about actual account values and actual expenses. You may use the information in this line, together with the amount you invested, to estimate the expenses that you paid over the period. Simply divide your account value by $1,000.00 (for example, an $8,600 account value divided by $1,000.00 = 8.6), then multiply the result by the number in the first line for a fund under the heading entitled "Expenses Paid During Period" to estimate the expenses you paid on your account during this period. The estimate of expenses does not include any fees or other expenses of any variable annuity or variable life insurance product. If they were, the estimate of expenses you paid during the period would be higher, and your ending account value would be lower. In addition, each Fund, as a shareholder in underlying Fidelity Funds, will indirectly bear its pro-rata share of the fees and expenses incurred by the underlying Fidelity Funds. These fees and expenses are not included in each Fund's annualized expense ratio used to calculate the expense estimates in the table below.
Hypothetical Example for Comparison Purposes
The second line of the accompanying table for each fund provides information about hypothetical account values and hypothetical expenses based on a fund's actual expense ratio and an assumed rate of return of 5% per year before expenses, which is not the Fund's actual return. The hypothetical account values and expenses may not be used to estimate the actual ending account balance or expenses you paid for the period. You may use this information to compare the ongoing costs of investing in the Fund and other funds. To do so, compare this 5% hypothetical example with the 5% hypothetical examples that appear in the shareholder reports of the other funds. The estimate of expenses does not include any fees or other expenses of any variable annuity or variable life insurance product. If they were, the estimate of expenses you paid during the period would be higher, and your ending account value would be lower. In addition, each Fund, as a shareholder in underlying Fidelity Funds, will indirectly bear its pro-rata share of the fees and expenses incurred by the underlying Fidelity Funds. These fees and expenses are not included in each Fund's annualized expense ratio used to calculate the expense estimates in the table below.
Please note that the expenses shown in the table are meant to highlight your ongoing costs only and do not reflect any transaction costs. Therefore, the second line of the table is useful in comparing ongoing costs only, and will not help you determine the relative total costs of owning different funds.
| Annualized Expense Ratio | Beginning
Account Value
July 1, 2010 | Ending
Account Value
December 31, 2010 | Expenses Paid
During Period*
July 1, 2010 to December 31, 2010 |
VIP Investor Freedom Income | .00% | | | |
Actual | | $ 1,000.00 | $ 1,063.80 | $ .00 |
HypotheticalA | | $ 1,000.00 | $ 1,025.21 | $ .00 |
VIP Investor Freedom 2005 | .00% | | | |
Actual | | $ 1,000.00 | $ 1,124.50 | $ .00 |
HypotheticalA | | $ 1,000.00 | $ 1,025.21 | $ .00 |
VIP Investor Freedom 2010 | .00% | | | |
Actual | | $ 1,000.00 | $ 1,143.80 | $ .00 |
HypotheticalA | | $ 1,000.00 | $ 1,025.21 | $ .00 |
VIP Investor Freedom 2015 | .00% | | | |
Actual | | $ 1,000.00 | $ 1,147.60 | $ .00 |
HypotheticalA | | $ 1,000.00 | $ 1,025.21 | $ .00 |
VIP Investor Freedom 2020 | .00% | | | |
Actual | | $ 1,000.00 | $ 1,174.80 | $ .00 |
HypotheticalA | | $ 1,000.00 | $ 1,025.21 | $ .00 |
VIP Investor Freedom 2025 | .00% | | | |
Actual | | $ 1,000.00 | $ 1,199.20 | $ .00 |
HypotheticalA | | $ 1,000.00 | $ 1,025.21 | $ .00 |
VIP Investor Freedom 2030 | .00% | | | |
Actual | | $ 1,000.00 | $ 1,211.20 | $ .00 |
HypotheticalA | | $ 1,000.00 | $ 1,025.21 | $ .00 |
A 5% return per year before expenses
* Expenses are equal to each Fund's annualized expense ratio, multiplied by the average account value over the period, multiplied by 184/365 (to reflect the one-half year period). The fees and expenses of the underlying Fidelity Funds in which the Fund invests are not
included in the Fund's annualized expense ratio.
Annual Report
VIP Investor Freedom Income Portfolio
Investment Changes (Unaudited)
Fund Holdings as of December 31, 2010 |
| % of fund's
net assets | % of fund's net assets
6 months ago |
Domestic Equity Funds | | |
VIP Contrafund Portfolio Investor Class | 2.5 | 2.6 |
VIP Equity-Income Portfolio Investor Class | 2.9 | 3.0 |
VIP Growth & Income Portfolio Investor Class | 2.9 | 3.0 |
VIP Growth Portfolio Investor Class | 2.9 | 3.0 |
VIP Mid Cap Portfolio Investor Class | 1.0 | 1.1 |
VIP Value Portfolio Investor Class | 2.5 | 2.6 |
VIP Value Strategies Portfolio Investor Class | 1.1 | 1.1 |
| 15.8 | 16.4 |
Developed International Equity Funds | | |
VIP Overseas Portfolio Investor Class R | 4.6 | 3.1 |
Emerging Markets Equity Funds | | |
VIP Emerging Markets Portfolio Investor Class R | 0.8 | 0.3 |
High Yield Bond Funds | | |
VIP High Income Portfolio Investor Class | 5.0 | 5.0 |
Investment Grade Bond Funds | | |
VIP Investment Grade Bond Portfolio Investor Class | 34.2 | 35.1 |
Short-Term Funds | | |
VIP Money Market Portfolio Investor Class | 39.6 | 40.1 |
Net Other Assets (Liabilities)* | 0.0 | 0.0 |
| 100.0 | 100.0 |
* Amount represents less than 0.1%
Asset Allocation (% of fund's net assets) |
Current |
| Domestic Equity Funds | 15.8% | |
| Developed International Equity Funds | 4.6% | |
 | Emerging Markets Equity Funds | 0.8% | |
 | High Yield Bond Funds | 5.0% | |
| Investment Grade Bond Funds | 34.2% | |
| Short-Term Funds | 39.6% | |

Six months ago |
| Domestic Equity Funds | 16.4% | |
| Developed International Equity Funds | 3.1% | |
| Emerging Markets Equity Funds | 0.3% | |
| High Yield Bond Funds | 5.0% | |
| Investment Grade Bond Funds | 35.1% | |
| Short-Term Funds | 40.1% | |

Expected |
| Domestic Equity Funds | 14.6% | |
| Developed International Equity Funds | 4.6% | |
| Emerging Markets Equity Funds | 0.8% | |
| High Yield Bond Funds | 5.0% | |
| Investment Grade Bond Funds | 35.0% | |
| Short-Term Funds | 40.0% | |

The six months ago allocation is based on the fund's holdings as of June 30, 2010. The current allocation is based on the fund's holdings as of December 31, 2010. The expected allocation represents the fund's anticipated allocation at June 30, 2011. |
Annual Report
VIP Investor Freedom Income Portfolio
Investments December 31, 2010
Showing Percentage of Net Assets
Domestic Equity Funds - 15.8% |
| Shares | | Value |
Domestic Equity Funds - 15.8% |
VIP Contrafund Portfolio Investor Class | 34,068 | | $ 810,810 |
VIP Equity-Income Portfolio Investor Class | 50,074 | | 949,896 |
VIP Growth & Income Portfolio Investor Class | 74,827 | | 942,825 |
VIP Growth Portfolio Investor Class | 25,626 | | 948,173 |
VIP Mid Cap Portfolio Investor Class | 10,079 | | 328,565 |
VIP Value Portfolio Investor Class | 74,125 | | 814,637 |
VIP Value Strategies Portfolio Investor Class | 35,534 | | 344,681 |
TOTAL DOMESTIC EQUITY FUNDS (Cost $5,359,044) | 5,139,587 |
International Equity Funds - 5.4% |
| | | |
Developed International Equity Funds - 4.6% |
VIP Overseas Portfolio Investor Class R | 88,911 | | 1,487,480 |
Emerging Markets Equity Funds - 0.8% |
VIP Emerging Markets Portfolio Investor Class R | 25,076 | | 248,002 |
TOTAL INTERNATIONAL EQUITY FUNDS (Cost $1,449,701) | 1,735,482 |
Bond Funds - 39.2% |
| | | |
High Yield Bond Funds - 5.0% |
VIP High Income Portfolio Investor Class | 290,975 | | 1,617,823 |
Investment Grade Bond Funds - 34.2% |
VIP Investment Grade Bond Portfolio Investor Class | 868,917 | | 11,122,133 |
TOTAL BOND FUNDS (Cost $12,599,638) | 12,739,956 |
Short-Term Funds - 39.6% |
| | | |
VIP Money Market Portfolio Investor Class
(Cost $12,851,555) | 12,851,555 | | 12,851,555 |
TOTAL INVESTMENT PORTFOLIO - 100.0% (Cost $32,259,938) | | 32,466,580 |
NET OTHER ASSETS (LIABILITIES) - 0.0% | | 43 |
NET ASSETS - 100% | $ 32,466,623 |
Other Information |
All investments are categorized as Level 1 under the Fair Value Hierarchy. The inputs or methodology used for valuing securities may not be an indication of the risk associated with investing in those securities. For more information on valuation inputs, please refer to the Security Valuation section in the accompanying Notes to Financial Statements. |
See accompanying notes which are an integral part of the financial statements.
Annual Report
VIP Investor Freedom Income Portfolio
Statement of Assets and Liabilities
| December 31, 2010 |
| | |
Assets | | |
Investment in securities, at value (cost $32,259,938) - See accompanying schedule | | $ 32,466,580 |
Cash | | 42 |
Receivable for investments sold | | 204 |
Total assets | | 32,466,826 |
| | |
Liabilities | | |
Payable for investments purchased | $ 2 | |
Payable for fund shares redeemed | 201 | |
Total liabilities | | 203 |
| | |
Net Assets | | $ 32,466,623 |
Net Assets consist of: | | |
Paid in capital | | $ 32,360,703 |
Undistributed net investment income | | 1,670 |
Accumulated undistributed net realized gain (loss) on investments | | (102,392) |
Net unrealized appreciation (depreciation) on investments | | 206,642 |
Net Assets, for 3,120,638 shares outstanding | | $ 32,466,623 |
Net Asset Value, offering price and redemption price per share ($32,466,623 ÷ 3,120,638 shares) | | $ 10.40 |
Statement of Operations
| Year ended December 31, 2010 |
| | |
Investment Income | | |
Income distributions from underlying funds | | $ 593,418 |
| | |
Expenses | | |
Independent trustees' compensation | $ 104 | |
Total expenses before reductions | 104 | |
Expense reductions | (104) | 0 |
Net investment income (loss) | | 593,418 |
Realized and Unrealized Gain (Loss) Realized gain (loss) on sale of underlying fund shares | 181,513 | |
Capital gain distributions from underlying funds | 136,613 | |
Total net realized gain (loss) | | 318,126 |
Change in net unrealized appreciation (depreciation) on underlying funds | | 1,270,766 |
Net gain (loss) | | 1,588,892 |
Net increase (decrease) in net assets resulting from operations | | $ 2,182,310 |
See accompanying notes which are an integral part of the financial statements.
Annual Report
Statement of Changes in Net Assets
| Year ended
December 31, 2010 | Year ended
December 31, 2009 |
Increase (Decrease) in Net Assets | | |
Operations | | |
Net investment income (loss) | $ 593,418 | $ 821,415 |
Net realized gain (loss) | 318,126 | 259,629 |
Change in net unrealized appreciation (depreciation) | 1,270,766 | 1,652,529 |
Net increase (decrease) in net assets resulting from operations | 2,182,310 | 2,733,573 |
Distributions to shareholders from net investment income | (592,180) | (825,260) |
Distributions to shareholders from net realized gain | (299,615) | (324,704) |
Total distributions | (891,795) | (1,149,964) |
Share transactions
Proceeds from sales of shares | 8,914,880 | 10,383,033 |
Reinvestment of distributions | 891,795 | 1,149,964 |
Cost of shares redeemed | (4,004,799) | (5,013,877) |
Net increase (decrease) in net assets resulting from share transactions | 5,801,876 | 6,519,120 |
Total increase (decrease) in net assets | 7,092,391 | 8,102,729 |
| | |
Net Assets | | |
Beginning of period | 25,374,232 | 17,271,503 |
End of period (including undistributed net investment income of $1,670 and $0, respectively) | $ 32,466,623 | $ 25,374,232 |
Other Information Shares | | |
Sold | 872,042 | 1,063,280 |
Issued in reinvestment of distributions | 86,021 | 117,862 |
Redeemed | (387,078) | (529,653) |
Net increase (decrease) | 570,985 | 651,489 |
Financial Highlights
Years ended December 31, | 2010 | 2009 | 2008 | 2007 | 2006 |
Selected Per-Share Data | | | | | |
Net asset value, beginning of period | $ 9.95 | $ 9.10 | $ 10.79 | $ 10.78 | $ 10.14 |
Income from Investment Operations | | | | | |
Net investment income (loss) C | .21 | .40 | .34 | .42 | .35 |
Net realized and unrealized gain (loss) | .54 | .94 | (1.47) | .22 | .34 |
Total from investment operations | .75 | 1.34 | (1.13) | .64 | .69 |
Distributions from net investment income | (.20) | (.33) | (.37) | (.58) | (.05) |
Distributions from net realized gain | (.10) | (.16) | (.19) | (.06) | - |
Total distributions | (.30) | (.49) | (.56) | (.63) G | (.05) |
Net asset value, end of period | $ 10.40 | $ 9.95 | $ 9.10 | $ 10.79 | $ 10.78 |
Total Return A, B | 7.50% | 14.85% | (10.55)% | 6.08% | 6.83% |
Ratios to Average Net Assets D, F | | | | | |
Expenses before reductions E | .00% | .00% | .00% | .00% | .00% |
Expenses net of fee waivers, if any | .00% | .00% | .00% | .00% | .00% |
Expenses net of all reductions | .00% | .00% | .00% | .00% | .00% |
Net investment income (loss) | 2.00% | 4.12% | 3.33% | 3.90% | 3.39% |
Supplemental Data | | | | | |
Net assets, end of period (000 omitted) | $ 32,467 | $ 25,374 | $ 17,272 | $ 20,090 | $ 11,177 |
Portfolio turnover rate | 24% | 30% | 53% | 38% | 40% |
A Total returns do not reflect charges attributable to your insurance company's separate account. Inclusion of these charges would reduce the total returns shown.
B Total returns would have been lower had certain expenses not been reduced during the periods shown.
C Calculated based on average shares outstanding during the period.
D Amounts do not include the activity of the underlying funds.
E Amount represents less than .01%.
F Expense ratios reflect operating expenses of the Fund. Expenses before reductions do not reflect amounts reimbursed by the investment adviser or reductions from expense offset arrangements and do not represent the amount paid by the Fund during periods when reimbursements or reductions occur. Expenses net of fee waivers reflect expenses after reimbursement by the investment adviser but prior to reductions from expense offset arrangements. Expenses net of all reductions represent the net expenses paid by the Fund but do not include expenses of the investment companies in which the Fund invests.
G Total distributions of $.63 per share is comprised of distributions from net investment income of $.575 and distributions from net realized gain of $.055 per share.
See accompanying notes which are an integral part of the financial statements.
Annual Report
VIP Investor Freedom 2005 Portfolio
Investment Changes (Unaudited)
Fund Holdings as of December 31, 2010 |
| % of fund's
net assets | % of fund's net assets
6 months ago |
Domestic Equity Funds | | |
VIP Contrafund Portfolio Investor Class | 5.2 | 5.3 |
VIP Equity-Income Portfolio Investor Class | 6.1 | 6.1 |
VIP Growth & Income Portfolio Investor Class | 6.0 | 6.2 |
VIP Growth Portfolio Investor Class | 6.0 | 6.2 |
VIP Mid Cap Portfolio Investor Class | 2.1 | 2.2 |
VIP Value Portfolio Investor Class | 5.2 | 5.3 |
VIP Value Strategies Portfolio Investor Class | 2.2 | 2.2 |
| 32.8 | 33.5 |
Developed International Equity Funds | | |
VIP Overseas Portfolio Investor Class R | 9.7 | 9.0 |
Emerging Markets Equity Funds | | |
VIP Emerging Markets Portfolio Investor Class R | 1.6 | 0.8 |
High Yield Bond Funds | | |
VIP High Income Portfolio Investor Class | 4.9 | 5.0 |
Investment Grade Bond Funds | | |
VIP Investment Grade Bond Portfolio Investor Class | 30.2 | 31.9 |
Short-Term Funds | | |
VIP Money Market Portfolio Investor Class | 20.8 | 19.8 |
Net Other Assets (Liabilities)* | 0.0 | 0.0 |
| 100.0 | 100.0 |
* Amount represents less than 0.1%
Asset Allocation (% of fund's net assets) |
Current |
| Domestic Equity Funds | 32.8% | |
| Developed International Equity Funds | 9.7% | |
| Emerging Markets Equity Funds | 1.6% | |
| High Yield Bond Funds | 4.9% | |
| Investment Grade Bond Funds | 30.2% | |
| Short-Term Funds | 20.8% | |

Six months ago |
| Domestic Equity Funds | 33.5% | |
| Developed International Equity Funds | 9.0% | |
| Emerging Markets Equity Funds | 0.8% | |
| High Yield Bond Funds | 5.0% | |
| Investment Grade Bond Funds | 31.9% | |
| Short-Term Funds | 19.8% | |

Expected |
| Domestic Equity Funds | 29.7% | |
| Developed International Equity Funds | 9.2% | |
| Emerging Markets Equity Funds | 1.6% | |
| High Yield Bond Funds | 5.0% | |
| Investment Grade Bond Funds | 30.6% | |
| Short-Term Funds | 23.9% | |

The fund invests according to an asset allocation strategy that becomes increasingly conservative over time. The six months ago allocation is based on the fund's holdings as of June 30, 2010. The current allocation is based on the fund's holdings as of December 31, 2010. The expected allocation represents the fund's anticipated allocation at June 30, 2011. |
Annual Report
VIP Investor Freedom 2005 Portfolio
Investments December 31, 2010
Showing Percentage of Net Assets
Domestic Equity Funds - 32.8% |
| Shares | | Value |
Domestic Equity Funds - 32.8% |
VIP Contrafund Portfolio Investor Class | 22,706 | | $ 540,406 |
VIP Equity-Income Portfolio Investor Class | 33,342 | | 632,503 |
VIP Growth & Income Portfolio Investor Class | 49,926 | | 629,068 |
VIP Growth Portfolio Investor Class | 17,064 | | 631,365 |
VIP Mid Cap Portfolio Investor Class | 6,697 | | 218,337 |
VIP Value Portfolio Investor Class | 49,287 | | 541,661 |
VIP Value Strategies Portfolio Investor Class | 23,681 | | 229,703 |
TOTAL DOMESTIC EQUITY FUNDS (Cost $3,901,169) | 3,423,043 |
International Equity Funds - 11.3% |
| | | |
Developed International Equity Funds - 9.7% |
VIP Overseas Portfolio Investor Class R | 60,271 | | 1,008,327 |
Emerging Markets Equity Funds - 1.6% |
VIP Emerging Markets Portfolio Investor Class R | 17,110 | | 169,217 |
TOTAL INTERNATIONAL EQUITY FUNDS (Cost $1,277,914) | 1,177,544 |
Bond Funds - 35.1% |
| | | |
High Yield Bond Funds - 4.9% |
VIP High Income Portfolio Investor Class | 92,156 | | 512,389 |
Investment Grade Bond Funds - 30.2% |
VIP Investment Grade Bond Portfolio Investor Class | 246,514 | | 3,155,375 |
TOTAL BOND FUNDS (Cost $3,611,763) | 3,667,764 |
Short-Term Funds - 20.8% |
| | | |
VIP Money Market Portfolio Investor Class
(Cost $2,169,406) | 2,169,406 | | 2,169,406 |
TOTAL INVESTMENT PORTFOLIO - 100.0% (Cost $10,960,252) | | 10,437,757 |
NET OTHER ASSETS (LIABILITIES) - 0.0% | | 2 |
NET ASSETS - 100% | $ 10,437,759 |
Other Information |
All investments are categorized as Level 1 under the Fair Value Hierarchy. The inputs or methodology used for valuing securities may not be an indication of the risk associated with investing in those securities. For more information on valuation inputs, please refer to the Security Valuation section in the accompanying Notes to Financial Statements. |
See accompanying notes which are an integral part of the financial statements.
Annual Report
VIP Investor Freedom 2005 Portfolio
Statement of Assets and Liabilities
| December 31, 2010 |
| | |
Assets | | |
Investment in securities, at value (cost $10,960,252) - See accompanying schedule | | $ 10,437,757 |
Receivable for fund shares sold | | 19,939 |
Total assets | | 10,457,696 |
| | |
Liabilities | | |
Payable to custodian bank | $ 2 | |
Payable for investments purchased | 19,929 | |
Payable for fund shares redeemed | 6 | |
Total liabilities | | 19,937 |
| | |
Net Assets | | $ 10,437,759 |
Net Assets consist of: | | |
Paid in capital | | $ 11,032,677 |
Undistributed Net Investment Income | | 241 |
Accumulated undistributed net realized gain (loss) on investments | | (72,664) |
Net unrealized appreciation (depreciation) on investments | | (522,495) |
Net Assets, for 1,060,117 shares outstanding | | $ 10,437,759 |
Net Asset Value, offering price and redemption price per share
($10,437,759 ÷ 1,060,117 shares) | | $ 9.85 |
Statement of Operations
| Year ended December 31, 2010 |
| | |
Investment Income | | |
Income distributions from underlying funds | | $ 188,164 |
| | |
Expenses | | |
Independent trustees' compensation | $ 35 | |
Total expenses before reductions | 35 | |
Expense reductions | (35) | 0 |
Net investment income (loss) | | 188,164 |
Realized and Unrealized Gain (Loss) Realized gain (loss) on sale of underlying fund shares | 198,870 | |
Capital gain distributions from underlying funds | 39,591 | |
Total net realized gain (loss) | | 238,461 |
Change in net unrealized appreciation (depreciation) on underlying funds | | 601,701 |
Net gain (loss) | | 840,162 |
Net increase (decrease) in net assets resulting from operations | | $ 1,028,326 |
See accompanying notes which are an integral part of the financial statements.
Annual Report
Statement of Changes in Net Assets
| Year ended
December 31, 2010 | Year ended
December 31, 2009 |
Increase (Decrease) in Net Assets | | |
Operations | | |
Net investment income (loss) | $ 188,164 | $ 319,887 |
Net realized gain (loss) | 238,461 | 48,273 |
Change in net unrealized appreciation (depreciation) | 601,701 | 1,146,173 |
Net increase (decrease) in net assets resulting from operations | 1,028,326 | 1,514,333 |
Distributions to shareholders from net investment income | (188,220) | (320,414) |
Distributions to shareholders from net realized gain | (227,534) | (123,688) |
Total distributions | (415,754) | (444,102) |
Share transactions
Proceeds from sales of shares | 4,550,953 | 3,903,178 |
Reinvestment of distributions | 415,754 | 444,101 |
Cost of shares redeemed | (4,539,322) | (3,057,467) |
Net increase (decrease) in net assets resulting from share transactions | 427,385 | 1,289,812 |
Total increase (decrease) in net assets | 1,039,957 | 2,360,043 |
| | |
Net Assets | | |
Beginning of period | 9,397,802 | 7,037,759 |
End of period (including undistributed net investment income of $241 and $0, respectively) | $ 10,437,759 | $ 9,397,802 |
Other Information Shares | | |
Sold | 476,271 | 451,085 |
Issued in reinvestment of distributions | 42,428 | 51,238 |
Redeemed | (478,599) | (372,396) |
Net increase (decrease) | 40,100 | 129,927 |
Financial Highlights
Years ended December 31, | 2010 | 2009 | 2008 | 2007 | 2006 |
Selected Per-Share Data | | | | | |
Net asset value, beginning of period | $ 9.21 | $ 7.91 | $ 11.53 | $ 11.17 | $ 10.24 |
Income from Investment Operations | | | | | |
Net investment income (loss) C | .18 | .35 | .32 | .35 | .26 |
Net realized and unrealized gain (loss) | .87 | 1.41 | (3.00) | .59 | .73 |
Total from investment operations | 1.05 | 1.76 | (2.68) | .94 | .99 |
Distributions from net investment income | (.19) | (.33) | (.30) | (.46) | (.06) |
Distributions from net realized gain | (.22) | (.14) | (.64) | (.12) | - |
Total distributions | (.41) | (.46) G | (.94) | (.58) | (.06) |
Net asset value, end of period | $ 9.85 | $ 9.21 | $ 7.91 | $ 11.53 | $ 11.17 |
Total Return A, B | 11.41% | 22.71% | (23.91)% | 8.55% | 9.72% |
Ratios to Average Net Assets D, E | | | | | |
Expenses before reductions F | .00% | .00% | .00% | .00% | .00% |
Expenses net of fee waivers, if any | .00% | .00% | .00% | .00% | .00% |
Expenses net of all reductions | .00% | .00% | .00% | .00% | .00% |
Net investment income (loss) | 1.90% | 4.12% | 3.19% | 3.02% | 2.47% |
Supplemental Data | | | | | |
Net assets, end of period (000 omitted) | $ 10,438 | $ 9,398 | $ 7,038 | $ 8,568 | $ 4,851 |
Portfolio turnover rate | 63% | 47% | 40% | 53% | 55% |
A Total returns do not reflect charges attributable to your insurance company's separate account. Inclusion of these charges would reduce the total returns shown.
B Total returns would have been lower had certain expenses not been reduced during the periods shown.
C Calculated based on average shares outstanding during the period.
D Amounts do not include the activity of the underlying funds.
E Expense ratios reflect operating expenses of the Fund. Expenses before reductions do not reflect amounts reimbursed by the investment adviser or reductions from expense offset arrangements and do not represent the amount paid by the Fund during periods when reimbursements or reductions occur. Expenses net of fee waivers reflect expenses after reimbursement by the investment adviser but prior to reductions from expense offset arrangements. Expenses net of all reductions represent the net expenses paid by the Fund but do not include expenses of the investment companies in which the Fund invests.
F Amount represents less than .01%.
G Total distributions of $.46 per share is comprised of distributions from net investment income of $.325 and distributions from net realized gain of $.135 per share.
See accompanying notes which are an integral part of the financial statements.
Annual Report
VIP Investor Freedom 2010 Portfolio
Investment Changes (Unaudited)
Fund Holdings as of December 31, 2010 |
| % of fund's
net assets | % of fund's net assets
6 months ago |
Domestic Equity Funds | | |
VIP Contrafund Portfolio Investor Class | 6.0 | 5.9 |
VIP Equity-Income Portfolio Investor Class | 7.1 | 6.9 |
VIP Growth & Income Portfolio Investor Class | 7.0 | 6.9 |
VIP Growth Portfolio Investor Class | 7.0 | 6.9 |
VIP Mid Cap Portfolio Investor Class | 2.4 | 2.5 |
VIP Value Portfolio Investor Class | 6.1 | 5.9 |
VIP Value Strategies Portfolio Investor Class | 2.6 | 2.5 |
| 38.2 | 37.5 |
Developed International Equity Funds | | |
VIP Overseas Portfolio Investor Class R | 11.3 | 11.0 |
Emerging Markets Equity Funds | | |
VIP Emerging Markets Portfolio Investor Class R | 1.9 | 1.0 |
High Yield Bond Funds | | |
VIP High Income Portfolio Investor Class | 4.9 | 5.0 |
Investment Grade Bond Funds | | |
VIP Investment Grade Bond Portfolio Investor Class | 33.5 | 35.1 |
Short-Term Funds | | |
VIP Money Market Portfolio Investor Class | 10.2 | 10.4 |
Net Other Assets (Liabilities)* | 0.0 | 0.0 |
| 100.0 | 100.0 |
* Amount represents less than 0.1%
Asset Allocation (% of fund's net assets) |
Current |
| Domestic Equity Funds | 38.2% | |
| Developed International Equity Funds | 11.3% | |
| Emerging Markets Equity Funds | 1.9% | |
| High Yield Bond Funds | 4.9% | |
| Investment Grade Bond Funds | 33.5% | |
| Short-Term Funds | 10.2% | |

Six months ago |
| Domestic Equity Funds | 37.5% | |
| Developed International Equity Funds | 11.0% | |
| Emerging Markets Equity Funds | 1.0% | |
| High Yield Bond Funds | 5.0% | |
| Investment Grade Bond Funds | 35.1% | |
| Short-Term Funds | 10.4% | |

Expected |
| Domestic Equity Funds | 36.2% | |
| Developed International Equity Funds | 11.2% | |
| Emerging Markets Equity Funds | 2.0% | |
| High Yield Bond Funds | 5.0% | |
| Investment Grade Bond Funds | 34.8% | |
| Short-Term Funds | 10.8% | |

The fund invests according to an asset allocation strategy that becomes increasingly conservative over time. The six months ago allocation is based on the fund's holdings as of June 30, 2010. The current allocation is based on the fund's holdings as of December 31, 2010. The expected allocation represents the fund's anticipated allocation at June 30, 2011. |
Annual Report
VIP Investor Freedom 2010 Portfolio
Investments December 31, 2010
Showing Percentage of Net Assets
Domestic Equity Funds - 38.2% |
| Shares | | Value |
Domestic Equity Funds - 38.2% |
VIP Contrafund Portfolio Investor Class | 138,333 | | $ 3,292,324 |
VIP Equity-Income Portfolio Investor Class | 203,137 | | 3,853,500 |
VIP Growth & Income Portfolio Investor Class | 303,767 | | 3,827,467 |
VIP Growth Portfolio Investor Class | 103,871 | | 3,843,218 |
VIP Mid Cap Portfolio Investor Class | 40,826 | | 1,330,943 |
VIP Value Portfolio Investor Class | 300,739 | | 3,305,126 |
VIP Value Strategies Portfolio Investor Class | 143,885 | | 1,395,689 |
TOTAL DOMESTIC EQUITY FUNDS (Cost $24,758,284) | 20,848,267 |
International Equity Funds - 13.2% |
| | | |
Developed International Equity Funds - 11.3% |
VIP Overseas Portfolio Investor Class R | 369,923 | | 6,188,819 |
Emerging Markets Equity Funds - 1.9% |
VIP Emerging Markets Portfolio Investor Class R | 104,404 | | 1,032,554 |
TOTAL INTERNATIONAL EQUITY FUNDS (Cost $8,446,946) | 7,221,373 |
Bond Funds - 38.4% |
| | | |
High Yield Bond Funds - 4.9% |
VIP High Income Portfolio Investor Class | 479,459 | | 2,665,790 |
Investment Grade Bond Funds - 33.5% |
VIP Investment Grade Bond Portfolio Investor Class | 1,427,844 | | 18,276,399 |
TOTAL BOND FUNDS (Cost $20,974,039) | 20,942,189 |
Short-Term Funds - 10.2% |
| | | |
VIP Money Market Portfolio Investor Class
(Cost $5,579,579) | 5,579,579 | | 5,579,579 |
TOTAL INVESTMENT PORTFOLIO - 100.0% (Cost $59,758,848) | | 54,591,408 |
NET OTHER ASSETS (LIABILITIES) - 0.0% | | 6 |
NET ASSETS - 100% | $ 54,591,414 |
Other Information |
All investments are categorized as Level 1 under the Fair Value Hierarchy. The inputs or methodology used for valuing securities may not be an indication of the risk associated with investing in those securities. For more information on valuation inputs, please refer to the Security Valuation section in the accompanying Notes to Financial Statements. |
Income Tax Information |
At December 31, 2010, the Fund had a capital loss carryforward of approximately $148,328 all of which will expire in fiscal 2017. Capital loss carryforwards are only available to offset future capital gains of the Fund to the extent provided by regulations and may be limited. |
See accompanying notes which are an integral part of the financial statements.
Annual Report
VIP Investor Freedom 2010 Portfolio
Statement of Assets and Liabilities
| December 31, 2010 |
| | |
Assets | | |
Investment in securities, at value (cost $59,758,848) - See accompanying schedule | | $ 54,591,408 |
Cash | | 6 |
Receivable for fund shares sold | | 276,146 |
Total assets | | 54,867,560 |
| | |
Liabilities | | |
Payable for investments purchased | $ 276,110 | |
Payable for fund shares redeemed | 36 | |
Total liabilities | | 276,146 |
| | |
Net Assets | | $ 54,591,414 |
Net Assets consist of: | | |
Paid in capital | | $ 60,260,931 |
Accumulated undistributed net realized gain (loss) on investments | | (502,077) |
Net unrealized appreciation (depreciation) on investments | | (5,167,440) |
Net Assets, for 5,426,690 shares outstanding | | $ 54,591,414 |
Net Asset Value, offering price and redemption price per share ($54,591,414 ÷ 5,426,690 shares) | | $ 10.06 |
Statement of Operations
| Year ended December 31, 2010 |
| | |
Investment Income | | |
Income distributions from underlying funds | | $ 1,107,059 |
| | |
Expenses | | |
Independent trustees' compensation | $ 177 | |
Total expenses before reductions | 177 | |
Expense reductions | (177) | 0 |
Net investment income (loss) | | 1,107,059 |
Realized and Unrealized Gain (Loss) Realized gain (loss) on sale of underlying fund shares | 119,540 | |
Capital gain distributions from underlying funds | 233,887 | |
Total net realized gain (loss) | | 353,427 |
Change in net unrealized appreciation (depreciation) on underlying funds | | 4,638,516 |
Net gain (loss) | | 4,991,943 |
Net increase (decrease) in net assets resulting from operations | | $ 6,099,002 |
See accompanying notes which are an integral part of the financial statements.
Annual Report
Statement of Changes in Net Assets
| Year ended
December 31, 2010 | Year ended
December 31, 2009 |
Increase (Decrease) in Net Assets | | |
Operations | | |
Net investment income (loss) | $ 1,107,059 | $ 1,770,049 |
Net realized gain (loss) | 353,427 | 367,370 |
Change in net unrealized appreciation (depreciation) | 4,638,516 | 6,909,808 |
Net increase (decrease) in net assets resulting from operations | 6,099,002 | 9,047,227 |
Distributions to shareholders from net investment income | (1,116,128) | (1,753,497) |
Distributions to shareholders from net realized gain | (236,914) | (622,106) |
Total distributions | (1,353,042) | (2,375,603) |
Share transactions
Proceeds from sales of shares | 8,523,280 | 7,875,090 |
Reinvestment of distributions | 1,353,042 | 2,375,602 |
Cost of shares redeemed | (7,702,235) | (10,455,534) |
Net increase (decrease) in net assets resulting from share transactions | 2,174,087 | (204,842) |
Total increase (decrease) in net assets | 6,920,047 | 6,466,782 |
| | |
Net Assets | | |
Beginning of period | 47,671,367 | 41,204,585 |
End of period | $ 54,591,414 | $ 47,671,367 |
Other Information Shares | | |
Sold | 893,058 | 908,844 |
Issued in reinvestment of distributions | 134,631 | 275,332 |
Redeemed | (814,379) | (1,275,197) |
Net increase (decrease) | 213,310 | (91,021) |
Financial Highlights
Years ended December 31, | 2010 | 2009 | 2008 | 2007 | 2006 |
Selected Per-Share Data | | | | | |
Net asset value, beginning of period | $ 9.14 | $ 7.77 | $ 11.56 | $ 11.19 | $ 10.26 |
Income from Investment Operations | | | | | |
Net investment income (loss) C | .21 | .35 | .30 | .33 | .24 |
Net realized and unrealized gain (loss) | .97 | 1.49 | (3.12) | .62 | .73 |
Total from investment operations | 1.18 | 1.84 | (2.82) | .95 | .97 |
Distributions from net investment income | (.21) | (.35) | (.33) | (.44) | (.04) |
Distributions from net realized gain | (.05) | (.12) | (.64) | (.14) | - |
Total distributions | (.26) | (.47) | (.97) | (.58) | (.04) |
Net asset value, end of period | $ 10.06 | $ 9.14 | $ 7.77 | $ 11.56 | $ 11.19 |
Total Return A, B | 12.88% | 24.09% | (24.99)% | 8.63% | 9.49% |
Ratios to Average Net Assets D, E | | | | | |
Expenses before reductions F | .00% | .00% | .00% | .00% | .00% |
Expenses net of fee waivers, if any | .00% | .00% | .00% | .00% | .00% |
Expenses net of all reductions | .00% | .00% | .00% | .00% | .00% |
Net investment income (loss) | 2.20% | 4.18% | 3.01% | 2.90% | 2.29% |
Supplemental Data | | | | | |
Net assets, end of period (000 omitted) | $ 54,591 | $ 47,671 | $ 41,205 | $ 57,197 | $ 31,460 |
Portfolio turnover rate | 31% | 28% | 40% | 14% | 29% |
A Total returns do not reflect charges attributable to your insurance company's separate account. Inclusion of these charges would reduce the total returns shown.
B Total returns would have been lower had certain expenses not been reduced during the periods shown.
C Calculated based on average shares outstanding during the period.
D Amounts do not include the activity of the underlying funds.
E Expense ratios reflect operating expenses of the Fund. Expenses before reductions do not reflect amounts reimbursed by the investment adviser or reductions from expense offset arrangements and do not represent the amount paid by the Fund during periods when reimbursements or reductions occur. Expenses net of fee waivers reflect expenses after reimbursement by the investment adviser but prior to reductions from expense offset arrangements. Expenses net of all reductions represent the net expenses paid by the Fund but do not include expenses of the investment companies in which the Fund invests.
F Amount represents less than .01%.
See accompanying notes which are an integral part of the financial statements.
Annual Report
VIP Investor Freedom 2015 Portfolio
Investment Changes (Unaudited)
Fund Holdings as of December 31, 2010 |
| % of fund's
net assets | % of fund's net assets
6 months ago |
Domestic Equity Funds | | |
VIP Contrafund Portfolio Investor Class | 6.2 | 6.1 |
VIP Equity-Income Portfolio Investor Class | 7.3 | 7.1 |
VIP Growth & Income Portfolio Investor Class | 7.2 | 7.1 |
VIP Growth Portfolio Investor Class | 7.2 | 7.1 |
VIP Mid Cap Portfolio Investor Class | 2.5 | 2.6 |
VIP Value Portfolio Investor Class | 6.2 | 6.1 |
VIP Value Strategies Portfolio Investor Class | 2.6 | 2.5 |
| 39.2 | 38.6 |
Developed International Equity Funds | | |
VIP Overseas Portfolio Investor Class R | 11.7 | 11.3 |
Emerging Markets Equity Funds | | |
VIP Emerging Markets Portfolio Investor Class R | 1.9 | 1.1 |
High Yield Bond Funds | | |
VIP High Income Portfolio Investor Class | 5.0 | 5.1 |
Investment Grade Bond Funds | | |
VIP Investment Grade Bond Portfolio Investor Class | 33.1 | 34.6 |
Short-Term Funds | | |
VIP Money Market Portfolio Investor Class | 9.1 | 9.3 |
Net Other Assets (Liabilities)* | 0.0 | 0.0 |
| 100.0 | 100.0 |
* Amount represents less than 0.1%
Asset Allocation (% of fund's net assets) |
Current |
| Domestic Equity Funds | 39.2% | |
| Developed International Equity Funds | 11.7% | |
| Emerging Markets Equity Funds | 1.9% | |
| High Yield Bond Funds | 5.0% | |
| Investment Grade Bond Funds | 33.1% | |
| Short-Term Funds | 9.1% | |

Six months ago |
| Domestic Equity Funds | 38.6% | |
| Developed International Equity Funds | 11.3% | |
| Emerging Markets Equity Funds | 1.1% | |
| High Yield Bond Funds | 5.1% | |
| Investment Grade Bond Funds | 34.6% | |
| Short-Term Funds | 9.3% | |

Expected |
| Domestic Equity Funds | 37.0% | |
| Developed International Equity Funds | 11.5% | |
| Emerging Markets Equity Funds | 2.0% | |
| High Yield Bond Funds | 5.1% | |
| Investment Grade Bond Funds | 34.7% | |
| Short-Term Funds | 9.7% | |

The fund invests according to an asset allocation strategy that becomes increasingly conservative over time. The six months ago allocation is based on the fund's holdings as of June 30, 2010. The current allocation is based on the fund's holdings as of December 31, 2010. The expected allocation represents the fund's anticipated allocation at June 30, 2011. |
Annual Report
VIP Investor Freedom 2015 Portfolio
Investments December 31, 2010
Showing Percentage of Net Assets
Domestic Equity Funds - 39.2% |
| Shares | | Value |
Domestic Equity Funds - 39.2% |
VIP Contrafund Portfolio Investor Class | 180,230 | | $ 4,289,484 |
VIP Equity-Income Portfolio Investor Class | 264,771 | | 5,022,699 |
VIP Growth & Income Portfolio Investor Class | 395,958 | | 4,989,066 |
VIP Growth Portfolio Investor Class | 135,396 | | 5,009,649 |
VIP Mid Cap Portfolio Investor Class | 53,036 | | 1,728,977 |
VIP Value Portfolio Investor Class | 391,792 | | 4,305,799 |
VIP Value Strategies Portfolio Investor Class | 187,706 | | 1,820,747 |
TOTAL DOMESTIC EQUITY FUNDS (Cost $31,118,339) | 27,166,421 |
International Equity Funds - 13.6% |
| | | |
Developed International Equity Funds - 11.7% |
VIP Overseas Portfolio Investor Class R | 482,370 | | 8,070,046 |
Emerging Markets Equity Funds - 1.9% |
VIP Emerging Markets Portfolio Investor Class R | 135,912 | | 1,344,165 |
TOTAL INTERNATIONAL EQUITY FUNDS (Cost $10,484,204) | 9,414,211 |
Bond Funds - 38.1% |
| | | |
High Yield Bond Funds - 5.0% |
VIP High Income Portfolio Investor Class | 618,501 | | 3,438,868 |
Investment Grade Bond Funds - 33.1% |
VIP Investment Grade Bond Portfolio Investor Class | 1,792,149 | | 22,939,505 |
TOTAL BOND FUNDS (Cost $26,327,385) | 26,378,373 |
Short-Term Funds - 9.1% |
| | | |
VIP Money Market Portfolio Investor Class
(Cost $6,300,416) | 6,300,416 | | 6,300,416 |
TOTAL INVESTMENT PORTFOLIO - 100.0% (Cost $74,230,344) | | 69,259,421 |
NET OTHER ASSETS (LIABILITIES) - 0.0% | | (1) |
NET ASSETS - 100% | $ 69,259,420 |
Other Information |
All investments are categorized as Level 1 under the Fair Value Hierarchy. The inputs or methodology used for valuing securities may not be an indication of the risk associated with investing in those securities. For more information on valuation inputs, please refer to the Security Valuation section in the accompanying Notes to Financial Statements. |
See accompanying notes which are an integral part of the financial statements.
Annual Report
VIP Investor Freedom 2015 Portfolio
Statement of Assets and Liabilities
| December 31, 2010 |
| | |
Assets | | |
Investment in securities, at value (cost $74,230,344) - See accompanying schedule | | $ 69,259,421 |
Receivable for fund shares sold | | 594 |
Total assets | | 69,260,015 |
| | |
Liabilities | | |
Payable to custodian bank | $ 1 | |
Payable for investments purchased | 550 | |
Payable for fund shares redeemed | 44 | |
Total liabilities | | 595 |
| | |
Net Assets | | $ 69,259,420 |
Net Assets consist of: | | |
Paid in capital | | $ 74,618,458 |
Accumulated undistributed net realized gain (loss) on investments | | (388,115) |
Net unrealized appreciation (depreciation) on investments | | (4,970,923) |
Net Assets, for 7,016,313 shares outstanding | | $ 69,259,420 |
Net Asset Value, offering price and redemption price per share ($69,259,420 ÷ 7,016,313 shares) | | $ 9.87 |
Statement of Operations
| Year ended December 31, 2010 |
| | |
Investment Income | | |
Income distributions from underlying funds | | $ 1,402,241 |
| | |
Expenses | | |
Independent trustees' compensation | $ 220 | |
Total expenses before reductions | 220 | |
Expense reductions | (220) | 0 |
Net investment income (loss) | | 1,402,241 |
Realized and Unrealized Gain (Loss) Realized gain (loss) on sale of underlying fund shares | 772,477 | |
Capital gain distributions from underlying funds | 293,655 | |
Total net realized gain (loss) | | 1,066,132 |
Change in net unrealized appreciation (depreciation) on underlying funds | | 5,241,793 |
Net gain (loss) | | 6,307,925 |
Net increase (decrease) in net assets resulting from operations | | $ 7,710,166 |
See accompanying notes which are an integral part of the financial statements.
Annual Report
Statement of Changes in Net Assets
| Year ended
December 31, 2010 | Year ended
December 31, 2009 |
Increase (Decrease) in Net Assets | | |
Operations | | |
Net investment income (loss) | $ 1,402,241 | $ 2,120,406 |
Net realized gain (loss) | 1,066,132 | 1,123,545 |
Change in net unrealized appreciation (depreciation) | 5,241,793 | 8,638,802 |
Net increase (decrease) in net assets resulting from operations | 7,710,166 | 11,882,753 |
Distributions to shareholders from net investment income | (1,456,211) | (2,103,913) |
Distributions to shareholders from net realized gain | (1,381,049) | (992,936) |
Total distributions | (2,837,260) | (3,096,849) |
Share transactions
Proceeds from sales of shares | 11,454,850 | 8,251,446 |
Reinvestment of distributions | 2,837,260 | 3,096,849 |
Cost of shares redeemed | (9,938,186) | (8,188,140) |
Net increase (decrease) in net assets resulting from share transactions | 4,353,924 | 3,160,155 |
Total increase (decrease) in net assets | 9,226,830 | 11,946,059 |
| | |
Net Assets | | |
Beginning of period | 60,032,590 | 48,086,531 |
End of period (including undistributed net investment income of $0 and $28,396, respectively) | $ 69,259,420 | $ 60,032,590 |
Other Information Shares | | |
Sold | 1,201,923 | 982,434 |
Issued in reinvestment of distributions | 292,477 | 354,719 |
Redeemed | (1,065,623) | (1,000,041) |
Net increase (decrease) | 428,777 | 337,112 |
Financial Highlights
Years ended December 31, | 2010 | 2009 | 2008 | 2007 | 2006 |
Selected Per-Share Data | | | | | |
Net asset value, beginning of period | $ 9.11 | $ 7.69 | $ 11.86 | $ 11.40 | $ 10.32 |
Income from Investment Operations | | | | | |
Net investment income (loss) C | .21 | .34 | .30 | .33 | .20 |
Net realized and unrealized gain (loss) | .97 | 1.58 | (3.41) | .71 | .92 |
Total from investment operations | 1.18 | 1.92 | (3.11) | 1.04 | 1.12 |
Distributions from net investment income | (.22) | (.34) | (.30) | (.42) | (.04) |
Distributions from net realized gain | (.20) | (.16) | (.76) | (.16) | - |
Total distributions | (.42) | (.50) | (1.06) | (.58) | (.04) |
Net asset value, end of period | $ 9.87 | $ 9.11 | $ 7.69 | $ 11.86 | $ 11.40 |
Total Return A, B | 13.06% | 25.25% | (27.11)% | 9.26% | 10.89% |
Ratios to Average Net Assets D, E | | | | | |
Expenses before reductions F | .00% | .00% | .00% | .00% | .00% |
Expenses net of fee waivers, if any | .00% | .00% | .00% | .00% | .00% |
Expenses net of all reductions | .00% | .00% | .00% | .00% | .00% |
Net investment income (loss) | 2.24% | 4.08% | 2.98% | 2.83% | 1.83% |
Supplemental Data | | | | | |
Net assets, end of period (000 omitted) | $ 69,259 | $ 60,033 | $ 48,087 | $ 61,370 | $ 39,838 |
Portfolio turnover rate | 31% | 22% | 29% | 14% | 15% |
A Total returns do not reflect charges attributable to your insurance company's separate account. Inclusion of these charges would reduce the total returns shown.
B Total returns would have been lower had certain expenses not been reduced during the periods shown.
C Calculated based on average shares outstanding during the period.
D Amounts do not include the activity of the underlying funds.
E Expense ratios reflect operating expenses of the Fund. Expenses before reductions do not reflect amounts reimbursed by the investment adviser or reductions from expense offset arrangements and do not represent the amount paid by the Fund during periods when reimbursements or reductions occur. Expenses net of fee waivers reflect expenses after reimbursement by the investment adviser but prior to reductions from expense offset arrangements. Expenses net of all reductions represent the net expenses paid by the Fund but do not include expenses of the investment companies in which the Fund invests.
F Amount represents less than .01%.
See accompanying notes which are an integral part of the financial statements.
Annual Report
VIP Investor Freedom 2020 Portfolio
Investment Changes (Unaudited)
Fund Holdings as of December 31, 2010 |
| % of fund's
net assets | % of fund's net assets
6 months ago |
Domestic Equity Funds | | |
VIP Contrafund Portfolio Investor Class | 7.3 | 7.4 |
VIP Equity-Income Portfolio Investor Class | 8.6 | 8.6 |
VIP Growth & Income Portfolio Investor Class | 8.5 | 8.6 |
VIP Growth Portfolio Investor Class | 8.6 | 8.6 |
VIP Mid Cap Portfolio Investor Class | 3.0 | 3.1 |
VIP Value Portfolio Investor Class | 7.3 | 7.3 |
VIP Value Strategies Portfolio Investor Class | 3.1 | 3.0 |
| 46.4 | 46.6 |
Developed International Equity Funds | | |
VIP Overseas Portfolio Investor Class R | 13.8 | 13.7 |
Emerging Markets Equity Funds | | |
VIP Emerging Markets Portfolio Investor Class R | 2.3 | 1.3 |
High Yield Bond Funds | | |
VIP High Income Portfolio Investor Class | 6.5 | 6.9 |
Investment Grade Bond Funds | | |
VIP Investment Grade Bond Portfolio Investor Class | 27.6 | 28.5 |
Short-Term Funds | | |
VIP Money Market Portfolio Investor Class | 3.4 | 3.0 |
Net Other Assets (Liabilities)* | 0.0 | 0.0 |
| 100.0 | 100.0 |
* Amount represents less than 0.1% |
Asset Allocation (% of fund's net assets) |
Current |
| Domestic Equity Funds | 46.4% | |
| Developed International Equity Funds | 13.8% | |
| Emerging Markets Equity Funds | 2.3% | |
| High Yield Bond Funds | 6.5% | |
| Investment Grade Bond Funds | 27.6% | |
| Short-Term Funds | 3.4% | |

Six months ago |
| Domestic Equity Funds | 46.6% | |
| Developed International Equity Funds | 13.7% | |
| Emerging Markets Equity Funds | 1.3% | |
| High Yield Bond Funds | 6.9% | |
 | Investment Grade Bond Funds | 28.5% | |
| Short-Term Funds | 3.0% | |

Expected |
| Domestic Equity Funds | 43.3% | |
| Developed International Equity Funds | 13.4% | |
| Emerging Markets Equity Funds | 2.4% | |
| High Yield Bond Funds | 6.4% | |
| Investment Grade Bond Funds | 30.1% | |
| Short-Term Funds | 4.4% | |

The fund invests according to an asset allocation strategy that becomes increasingly conservative over time. The six months ago allocation is based on the fund's holdings as of June 30, 2010. The current allocation is based on the fund's holdings as of December 31, 2010. The expected allocation represents the fund's anticipated allocation at June 30, 2011. |
Annual Report
VIP Investor Freedom 2020 Portfolio
Investments December 31, 2010
Showing Percentage of Net Assets
Domestic Equity Funds - 46.4% |
| Shares | | Value |
Domestic Equity Funds - 46.4% |
VIP Contrafund Portfolio Investor Class | 297,314 | | $ 7,076,063 |
VIP Equity-Income Portfolio Investor Class | 436,581 | | 8,281,947 |
VIP Growth & Income Portfolio Investor Class | 653,141 | | 8,229,579 |
VIP Growth Portfolio Investor Class | 223,378 | | 8,264,973 |
VIP Mid Cap Portfolio Investor Class | 87,654 | | 2,857,507 |
VIP Value Portfolio Investor Class | 645,982 | | 7,099,342 |
VIP Value Strategies Portfolio Investor Class | 309,949 | | 3,006,507 |
TOTAL DOMESTIC EQUITY FUNDS (Cost $51,129,838) | 44,815,918 |
International Equity Funds - 16.1% |
| | | |
Developed International Equity Funds - 13.8% |
VIP Overseas Portfolio Investor Class R | 795,681 | | 13,311,747 |
Emerging Markets Equity Funds - 2.3% |
VIP Emerging Markets Portfolio Investor Class R | 224,332 | | 2,218,647 |
TOTAL INTERNATIONAL EQUITY FUNDS (Cost $17,267,672) | 15,530,394 |
Bond Funds - 34.1% |
| | | |
High Yield Bond Funds - 6.5% |
VIP High Income Portfolio Investor Class | 1,127,139 | | 6,266,893 |
Investment Grade Bond Funds - 27.6% |
VIP Investment Grade Bond Portfolio Investor Class | 2,084,024 | | 26,675,509 |
TOTAL BOND FUNDS (Cost $33,128,303) | 32,942,402 |
Short-Term Funds - 3.4% |
| | | |
VIP Money Market Portfolio
Investor Class
(Cost $3,254,052) | 3,254,052 | | 3,254,052 |
TOTAL INVESTMENT PORTFOLIO - 100.0% (Cost $104,779,865) | | 96,542,766 |
NET OTHER ASSETS (LIABILITIES) - 0.0% | | 29 |
NET ASSETS - 100% | $ 96,542,795 |
Other Information |
All investments are categorized as Level 1 under the Fair Value Hierarchy. The inputs or methodology used for valuing securities may not be an indication of the risk associated with investing in those securities. For more information on valuation inputs, please refer to the Security Valuation section in the accompanying Notes to Financial Statements. |
See accompanying notes which are an integral part of the financial statements.
Annual Report
VIP Investor Freedom 2020 Portfolio
Statement of Assets and Liabilities
| December 31, 2010 |
| | |
Assets | | |
Investment in securities, at value (cost $104,779,865) - See accompanying schedule | | $ 96,542,766 |
Cash | | 31 |
Receivable for investments sold | | 99,950 |
Total assets | | 96,642,747 |
| | |
Liabilities | | |
Payable for fund shares redeemed | | 99,952 |
| | |
Net Assets | | $ 96,542,795 |
Net Assets consist of: | | |
Paid in capital | | $ 105,382,552 |
Accumulated undistributed net realized gain (loss) on investments | | (602,658) |
Net unrealized appreciation (depreciation) on investments | | (8,237,099) |
Net Assets, for 9,970,298 shares outstanding | | $ 96,542,795 |
Net Asset Value, offering price and redemption price per share ($96,542,795 ÷ 9,970,298 shares) | | $ 9.68 |
Statement of Operations
| Year ended December 31, 2010 |
| | |
Investment Income | | |
Income distributions from underlying funds | | $ 1,960,564 |
| | |
Expenses | | |
Independent trustees' compensation | $ 302 | |
Total expenses before reductions | 302 | |
Expense reductions | (302) | 0 |
Net investment income (loss) | | 1,960,564 |
Realized and Unrealized Gain (Loss) Realized gain (loss) on sale of underlying fund shares | 845,003 | |
Capital gain distributions from underlying funds | 361,202 | |
Total net realized gain (loss) | | 1,206,205 |
Change in net unrealized appreciation (depreciation) on underlying funds | | 8,652,787 |
Net gain (loss) | | 9,858,992 |
Net increase (decrease) in net assets resulting from operations | | $ 11,819,556 |
See accompanying notes which are an integral part of the financial statements.
Annual Report
VIP Investor Freedom 2020 Portfolio
Financial Statements - continued
Statement of Changes in Net Assets
| Year ended
December 31, 2010 | Year ended
December 31, 2009 |
Increase (Decrease) in Net Assets | | |
Operations | | |
Net investment income (loss) | $ 1,960,564 | $ 2,475,413 |
Net realized gain (loss) | 1,206,205 | 541,874 |
Change in net unrealized appreciation (depreciation) | 8,652,787 | 13,314,509 |
Net increase (decrease) in net assets resulting from operations | 11,819,556 | 16,331,796 |
Distributions to shareholders from net investment income | (1,970,982) | (2,473,776) |
Distributions to shareholders from net realized gain | (1,414,267) | (694,013) |
Total distributions | (3,385,249) | (3,167,789) |
Share transactions
Proceeds from sales of shares | 17,485,465 | 14,627,983 |
Reinvestment of distributions | 3,385,249 | 3,167,789 |
Cost of shares redeemed | (13,240,020) | (9,604,524) |
Net increase (decrease) in net assets resulting from share transactions | 7,630,694 | 8,191,248 |
Total increase (decrease) in net assets | 16,065,001 | 21,355,255 |
| | |
Net Assets | | |
Beginning of period | 80,477,794 | 59,122,539 |
End of period | $ 96,542,795 | $ 80,477,794 |
Other Information Shares | | |
Sold | 1,894,263 | 1,781,445 |
Issued in reinvestment of distributions | 354,490 | 387,658 |
Redeemed | (1,457,338) | (1,296,073) |
Net increase (decrease) | 791,415 | 873,030 |
Financial Highlights
Years ended December 31, | 2010 | 2009 | 2008 | 2007 | 2006 |
Selected Per-Share Data | | | | | |
Net asset value, beginning of period | $ 8.77 | $ 7.12 | $ 12.09 | $ 11.53 | $ 10.36 |
Income from Investment Operations | | | | | |
Net investment income (loss) C | .21 | .30 | .27 | .31 | .22 |
Net realized and unrealized gain (loss) | 1.05 | 1.72 | (4.06) | .84 | 1.00 |
Total from investment operations | 1.26 | 2.02 | (3.79) | 1.15 | 1.22 |
Distributions from net investment income | (.20) | (.28) | (.27) | (.40) | (.05) |
Distributions from net realized gain | (.15) | (.09) | (.91) | (.19) | - |
Total distributions | (.35) | (.37) | (1.18) | (.59) | (.05) |
Net asset value, end of period | $ 9.68 | $ 8.77 | $ 7.12 | $ 12.09 | $ 11.53 |
Total Return A, B | 14.46% | 28.75% | (32.63)% | 10.20% | 11.82% |
Ratios to Average Net Assets D, F | | | | | |
Expenses before reductions E | .00% | .00% | .00% | .00% | .00% |
Expenses net of fee waivers, if any | .00% | .00% | .00% | .00% | .00% |
Expenses net of all reductions | .00% | .00% | .00% | .00% | .00% |
Net investment income (loss) | 2.28% | 3.82% | 2.77% | 2.59% | 2.04% |
Supplemental Data | | | | | |
Net assets, end of period (000 omitted) | $ 96,543 | $ 80,478 | $ 59,123 | $ 76,369 | $ 47,329 |
Portfolio turnover rate | 31% | 20% | 26% | 12% | 15% |
A Total returns do not reflect charges attributable to your insurance company's separate account. Inclusion of these charges would reduce the total returns shown.
B Total returns would have been lower had certain expenses not been reduced during the periods shown.
C Calculated based on average shares outstanding during the period.
D Amounts do not include the activity of the underlying funds.
E Amount represents less than .01%.
F Expense ratios reflect operating expenses of the Fund. Expenses before reductions do not reflect amounts reimbursed by the investment adviser or reductions from expense offset arrangements and do not represent the amount paid by the Fund during periods when reimbursements or reductions occur. Expenses net of fee waivers reflect expenses after reimbursement by the investment adviser but prior to reductions from expense offset arrangements. Expenses net of all reductions represent the net expenses paid by the Fund but do not include expenses of the investment companies in which the Fund invests.
See accompanying notes which are an integral part of the financial statements.
Annual Report
VIP Investor Freedom 2025 Portfolio
Investment Changes (Unaudited)
Fund Holdings as of December 31, 2010 |
| % of fund's
net assets | % of fund's net assets
6 months ago |
Domestic Equity Funds | | |
VIP Contrafund Portfolio Investor Class | 8.3 | 8.4 |
VIP Equity-Income Portfolio Investor Class | 9.8 | 9.7 |
VIP Growth & Income Portfolio Investor Class | 9.7 | 9.7 |
VIP Growth Portfolio Investor Class | 9.7 | 9.7 |
VIP Mid Cap Portfolio Investor Class | 3.4 | 3.5 |
VIP Value Portfolio Investor Class | 8.4 | 8.3 |
VIP Value Strategies Portfolio Investor Class | 3.5 | 3.5 |
| 52.8 | 52.8 |
Developed International Equity Funds | | |
VIP Overseas Portfolio Investor Class R | 15.7 | 15.5 |
Emerging Markets Equity Funds | | |
VIP Emerging Markets Portfolio Investor Class R | 2.6 | 1.5 |
High Yield Bond Funds | | |
VIP High Income Portfolio Investor Class | 7.2 | 7.5 |
Investment Grade Bond Funds | | |
VIP Investment Grade Bond Portfolio Investor Class | 21.6 | 22.7 |
Short-Term Funds | | |
VIP Money Market Portfolio Investor Class | 0.1 | 0.0 |
Net Other Assets (Liabilities)* | 0.0 | 0.0 |
| 100.0 | 100.0 |
* Amount represents less than 0.1% |
Asset Allocation (% of fund's net assets) |
Current |
| Domestic Equity Funds | 52.8% | |
| Developed International Equity Funds | 15.7% | |
| Emerging Markets Equity Funds | 2.6% | |
| High Yield Bond Funds | 7.2% | |
| Investment Grade Bond Funds | 21.6% | |
| Short-Term Funds | 0.1% | |

Six months ago |
| Domestic Equity Funds | 52.8% | |
| Developed International Equity Funds | 15.5% | |
| Emerging Markets Equity Funds | 1.5% | |
| High Yield Bond Funds | 7.5% | |
| Investment Grade Bond Funds | 22.7% | |

Expected |
| Domestic Equity Funds | 50.6% | |
| Developed International Equity Funds | 15.6% | |
| Emerging Markets Equity Funds | 2.8% | |
| High Yield Bond Funds | 7.5% | |
| Investment Grade Bond Funds | 23.3% | |
| Short-Term Funds | 0.2% | |

The fund invests according to an asset allocation strategy that becomes increasingly conservative over time. The six months ago allocation is based on the fund's holdings as of June 30, 2010. The current allocation is based on the fund's holdings as of December 31, 2010. The expected allocation represents the fund's anticipated allocation at June 30, 2011. |
Annual Report
VIP Investor Freedom 2025 Portfolio
Investments December 31, 2010
Showing Percentage of Net Assets
Domestic Equity Funds - 52.8% |
| Shares | | Value |
Domestic Equity Funds - 52.8% |
VIP Contrafund Portfolio Investor Class | 156,015 | | $ 3,713,160 |
VIP Equity-Income Portfolio Investor Class | 228,989 | | 4,343,914 |
VIP Growth & Income Portfolio Investor Class | 342,663 | | 4,317,555 |
VIP Growth Portfolio Investor Class | 117,069 | | 4,331,534 |
VIP Mid Cap Portfolio Investor Class | 45,890 | | 1,495,998 |
VIP Value Portfolio Investor Class | 338,851 | | 3,723,973 |
VIP Value Strategies Portfolio Investor Class | 162,533 | | 1,576,570 |
TOTAL DOMESTIC EQUITY FUNDS (Cost $24,412,336) | 23,502,704 |
International Equity Funds - 18.3% |
| | | |
Developed International Equity Funds - 15.7% |
VIP Overseas Portfolio Investor Class R | 417,619 | | 6,986,762 |
Emerging Markets Equity Funds - 2.6% |
VIP Emerging Markets Portfolio Investor Class R | 117,771 | | 1,164,756 |
TOTAL INTERNATIONAL EQUITY FUNDS (Cost $8,455,497) | 8,151,518 |
Bond Funds - 28.8% |
| | | |
High Yield Bond Funds - 7.2% |
VIP High Income Portfolio Investor Class | 578,775 | | 3,217,989 |
Investment Grade Bond Funds - 21.6% |
VIP Investment Grade Bond Portfolio Investor Class | 752,156 | | 9,627,594 |
TOTAL BOND FUNDS (Cost $12,885,293) | 12,845,583 |
Short-Term Funds - 0.1% |
| | | |
VIP Money Market Portfolio Investor Class
(Cost $29,718) | 29,718 | | 29,718 |
TOTAL INVESTMENT PORTFOLIO - 100.0% (Cost $45,782,844) | | 44,529,523 |
NET OTHER ASSETS (LIABILITIES) - 0.0% | | 3 |
NET ASSETS - 100% | $ 44,529,526 |
Other Information |
All investments are categorized as Level 1 under the Fair Value Hierarchy. The inputs or methodology used for valuing securities may not be an indication of the risk associated with investing in those securities. For more information on valuation inputs, please refer to the Security Valuation section in the accompanying Notes to Financial Statements. |
See accompanying notes which are an integral part of the financial statements.
Annual Report
VIP Investor Freedom 2025 Portfolio
Statement of Assets and Liabilities
| December 31, 2010 |
| | |
Assets | | |
Investment in securities, at value (cost $45,782,844) - See accompanying schedule | | $ 44,529,523 |
Cash | | 1 |
Receivable for fund shares sold | | 156,941 |
Total assets | | 44,686,465 |
| | |
Liabilities | | |
Payable for investments purchased | $ 156,921 | |
Payable for fund shares redeemed | 18 | |
Total liabilities | | 156,939 |
| | |
Net Assets | | $ 44,529,526 |
Net Assets consist of: | | |
Paid in capital | | $ 46,130,042 |
Accumulated undistributed net realized gain (loss) on investments | | (347,195) |
Net unrealized appreciation (depreciation) on investments | | (1,253,321) |
Net Assets, for 4,530,055 shares outstanding | | $ 44,529,526 |
Net Asset Value, offering price and redemption price per share ($44,529,526 ÷ 4,530,055 shares) | | $ 9.83 |
Statement of Operations
| Year ended December 31, 2010 |
| | |
Investment Income | | |
Income distributions from underlying funds | | $ 857,991 |
| | |
Expenses | | |
Independent trustees' compensation | $ 131 | |
Total expenses before reductions | 131 | |
Expense reductions | (131) | 0 |
Net investment income (loss) | | 857,991 |
Realized and Unrealized Gain (Loss) Realized gain (loss) on sale of underlying fund shares | 106,508 | |
Capital gain distributions from underlying funds | 139,074 | |
Total net realized gain (loss) | | 245,582 |
Change in net unrealized appreciation (depreciation) on underlying funds | | 4,556,758 |
Net gain (loss) | | 4,802,340 |
Net increase (decrease) in net assets resulting from operations | | $ 5,660,331 |
See accompanying notes which are an integral part of the financial statements.
Annual Report
Statement of Changes in Net Assets
| Year ended
December 31, 2010 | Year ended
December 31, 2009 |
Increase (Decrease) in Net Assets | | |
Operations | | |
Net investment income (loss) | $ 857,991 | $ 934,238 |
Net realized gain (loss) | 245,582 | 222,959 |
Change in net unrealized appreciation (depreciation) | 4,556,758 | 5,705,982 |
Net increase (decrease) in net assets resulting from operations | 5,660,331 | 6,863,179 |
Distributions to shareholders from net investment income | (856,138) | (913,842) |
Distributions to shareholders from net realized gain | (339,965) | (426,022) |
Total distributions | (1,196,103) | (1,339,864) |
Share transactions
Proceeds from sales of shares | 11,403,282 | 8,304,117 |
Reinvestment of distributions | 1,196,103 | 1,339,864 |
Cost of shares redeemed | (5,515,442) | (3,639,786) |
Net increase (decrease) in net assets resulting from share transactions | 7,083,943 | 6,004,195 |
Total increase (decrease) in net assets | 11,548,171 | 11,527,510 |
| | |
Net Assets | | |
Beginning of period | 32,981,355 | 21,453,845 |
End of period | $ 44,529,526 | $ 32,981,355 |
Other Information Shares | | |
Sold | 1,241,922 | 1,055,869 |
Issued in reinvestment of distributions | 123,024 | 165,648 |
Redeemed | (613,270) | (489,469) |
Net increase (decrease) | 751,676 | 732,048 |
Financial Highlights
Years ended December 31, | 2010 | 2009 | 2008 | 2007 | 2006 |
Selected Per-Share Data | | | | | |
Net asset value, beginning of period | $ 8.73 | $ 7.04 | $ 12.21 | $ 11.62 | $ 10.39 |
Income from Investment Operations | | | | | |
Net investment income (loss) C | .21 | .28 | .27 | .32 | .21 |
Net realized and unrealized gain (loss) | 1.17 | 1.79 | (4.29) | .86 | 1.06 |
Total from investment operations | 1.38 | 2.07 | (4.02) | 1.18 | 1.27 |
Distributions from net investment income | (.20) | (.25) | (.26) | (.38) | (.04) |
Distributions from net realized gain | (.08) | (.13) | (.89) | (.21) | - |
Total distributions | (.28) | (.38) | (1.15) | (.59) | (.04) |
Net asset value, end of period | $ 9.83 | $ 8.73 | $ 7.04 | $ 12.21 | $ 11.62 |
Total Return A, B | 15.80% | 29.95% | (34.22)% | 10.39% | 12.26% |
Ratios to Average Net Assets D, F | | | | | |
Expenses before reductions E | .00% | .00% | .00% | .00% | .00% |
Expenses net of fee waivers, if any | .00% | .00% | .00% | .00% | .00% |
Expenses net of all reductions | .00% | .00% | .00% | .00% | .00% |
Net investment income (loss) | 2.28% | 3.65% | 2.77% | 2.62% | 1.95% |
Supplemental Data | | | | | |
Net assets, end of period (000 omitted) | $ 44,530 | $ 32,981 | $ 21,454 | $ 28,587 | $ 14,630 |
Portfolio turnover rate | 29% | 18% | 30% | 10% | 18% |
A Total returns do not reflect charges attributable to your insurance company's separate account. Inclusion of these charges would reduce the total returns shown.
B Total returns would have been lower had certain expenses not been reduced during the periods shown.
C Calculated based on average shares outstanding during the period.
D Amounts do not include the activity of the underlying funds.
E Amount represents less than .01%.
F Expense ratios reflect operating expenses of the Fund. Expenses before reductions do not reflect amounts reimbursed by the investment adviser or reductions from expense offset arrangements and do not represent the amount paid by the Fund during periods when reimbursements or reductions occur. Expenses net of fee waivers reflect expenses after reimbursement by the investment adviser but prior to reductions from expense offset arrangements. Expenses net of all reductions represent the net expenses paid by the Fund but do not include expenses of the investment companies in which the Fund invests.
See accompanying notes which are an integral part of the financial statements.
Annual Report
VIP Investor Freedom 2030 Portfolio
Investment Changes (Unaudited)
Fund Holdings as of December 31, 2010 |
| % of fund's
net assets | % of fund's net assets
6 months ago |
Domestic Equity Funds | | |
VIP Contrafund Portfolio Investor Class | 8.9 | 9.0 |
VIP Equity-Income Portfolio Investor Class | 10.4 | 10.5 |
VIP Growth & Income Portfolio Investor Class | 10.3 | 9.7 |
VIP Growth Portfolio Investor Class | 10.3 | 10.5 |
VIP Mid Cap Portfolio Investor Class | 3.6 | 3.8 |
VIP Value Portfolio Investor Class | 8.9 | 9.0 |
VIP Value Strategies Portfolio Investor Class | 3.8 | 3.7 |
| 56.2 | 56.2 |
Developed International Equity Funds | | |
VIP Overseas Portfolio Investor Class R | 16.7 | 16.7 |
Emerging Markets Equity Funds | | |
VIP Emerging Markets Portfolio Investor Class R | 2.8 | 1.6 |
High Yield Bond Funds | | |
VIP High Income Portfolio Investor Class | 7.2 | 7.6 |
Investment Grade Bond Funds | | |
VIP Investment Grade Bond Portfolio Investor Class | 17.1 | 17.9 |
Net Other Assets (Liabilities)* | 0.0 | 0.0 |
| 100.0 | 100.0 |
* Amount represents less than 0.1% |
Asset Allocation (% of fund's net assets) |
Current |
| Domestic Equity Funds | 56.2% | |
| Developed International Equity Funds | 16.7% | |
| Emerging Markets Equity Funds | 2.8% | |
 | High Yield Bond Funds | 7.2% | |
| Investment Grade Bond Funds | 17.1% | |

Six months ago |
| Domestic Equity Funds | 56.2% | |
| Developed International Equity Funds | 16.7% | |
| Emerging Markets Equity Funds | 1.6% | |
| High Yield Bond Funds | 7.6% | |
| Investment Grade Bond Funds | 17.9% | |

Expected |
| Domestic Equity Funds | 53.3% | |
| Developed International Equity Funds | 16.5% | |
| Emerging Markets Equity Funds | 2.9% | |
| High Yield Bond Funds | 7.5% | |
| Investment Grade Bond Funds | 19.8% | |

The fund invests according to an asset allocation strategy that becomes increasingly conservative over time. The six months ago allocation is based on the fund's holdings as of June 30, 2010. The current allocation is based on the fund's holdings as of December 31, 2010. The expected allocation represents the fund's anticipated allocation at June 30, 2011. |
Annual Report
VIP Investor Freedom 2030 Portfolio
Investments December 31, 2010
Showing Percentage of Net Assets
Domestic Equity Funds - 56.2% |
| Shares | | Value |
Domestic Equity Funds - 56.2% |
VIP Contrafund Portfolio Investor Class | 172,087 | | $ 4,095,682 |
VIP Equity-Income Portfolio Investor Class | 252,460 | | 4,789,163 |
VIP Growth & Income Portfolio Investor Class | 377,839 | | 4,760,768 |
VIP Growth Portfolio Investor Class | 129,120 | | 4,777,448 |
VIP Mid Cap Portfolio Investor Class | 50,688 | | 1,652,442 |
VIP Value Portfolio Investor Class | 373,304 | | 4,102,607 |
VIP Value Strategies Portfolio Investor Class | 179,116 | | 1,737,424 |
TOTAL DOMESTIC EQUITY FUNDS (Cost $28,943,250) | 25,915,534 |
International Equity Funds - 19.5% |
| | | |
Developed International Equity Funds - 16.7% |
VIP Overseas Portfolio Investor Class R | 460,179 | | 7,698,794 |
Emerging Markets Equity Funds - 2.8% |
VIP Emerging Markets Portfolio Investor Class R | 129,490 | | 1,280,653 |
TOTAL INTERNATIONAL EQUITY FUNDS (Cost $9,834,491) | 8,979,447 |
Bond Funds - 24.3% |
| | | |
High Yield Bond Funds - 7.2% |
VIP High Income Portfolio Investor Class | 597,069 | | 3,319,704 |
Investment Grade Bond Funds - 17.1% |
VIP Investment Grade Bond Portfolio Investor Class | 613,688 | | 7,855,205 |
TOTAL BOND FUNDS (Cost $11,364,072) | 11,174,909 |
TOTAL INVESTMENT PORTFOLIO - 100.0% (Cost $50,141,813) | | 46,069,890 |
NET OTHER ASSETS (LIABILITIES) - 0.0% | | (1) |
NET ASSETS - 100% | $ 46,069,889 |
Other Information |
All investments are categorized as Level 1 under the Fair Value Hierarchy. The inputs or methodology used for valuing securities may not be an indication of the risk associated with investing in those securities. For more information on valuation inputs, please refer to the Security Valuation section in the accompanying Notes to Financial Statements. |
See accompanying notes which are an integral part of the financial statements.
Annual Report
VIP Investor Freedom 2030 Portfolio
Statement of Assets and Liabilities
| December 31, 2010 |
| | |
Assets | | |
Investment in securities, at value (cost $50,141,813) - See accompanying schedule | | $ 46,069,890 |
Receivable for fund shares sold | | 190,628 |
Total assets | | 46,260,518 |
| | |
Liabilities | | |
Payable to custodian bank | $ 2 | |
Payable for investments purchased | 185,444 | |
Payable for fund shares redeemed | 5,183 | |
Total liabilities | | 190,629 |
| | |
Net Assets | | $ 46,069,889 |
Net Assets consist of: | | |
Paid in capital | | $ 50,480,779 |
Accumulated undistributed net realized gain (loss) on investments | | (338,967) |
Net unrealized appreciation (depreciation) on investments | | (4,071,923) |
Net Assets, for 4,896,339 shares outstanding | | $ 46,069,889 |
Net Asset Value, offering price and redemption price per share ($46,069,889 ÷ 4,896,339 shares) | | $ 9.41 |
Statement of Operations
| Year ended December 31, 2010 |
| | |
Investment Income | | |
Income distributions from underlying funds | | $ 843,098 |
| | |
Expenses | | |
Independent trustees' compensation | $ 133 | |
Total expenses before reductions | 133 | |
Expense reductions | (133) | 0 |
Net investment income (loss) | | 843,098 |
Realized and Unrealized Gain (Loss) Realized gain (loss) on sale of underlying fund shares | 238,687 | |
Capital gain distributions from underlying funds | 125,619 | |
Total net realized gain (loss) | | 364,306 |
Change in net unrealized appreciation (depreciation) on underlying funds | | 4,779,150 |
Net gain (loss) | | 5,143,456 |
Net increase (decrease) in net assets resulting from operations | | $ 5,986,554 |
See accompanying notes which are an integral part of the financial statements.
Annual Report
VIP Investor Freedom 2030 Portfolio
Financial Statements - continued
Statement of Changes in Net Assets
| Year ended
December 31, 2010 | Year ended
December 31, 2009 |
Increase (Decrease) in Net Assets | | |
Operations | | |
Net investment income (loss) | $ 843,098 | $ 815,117 |
Net realized gain (loss) | 364,306 | 524,444 |
Change in net unrealized appreciation (depreciation) | 4,779,150 | 6,784,077 |
Net increase (decrease) in net assets resulting from operations | 5,986,554 | 8,123,638 |
Distributions to shareholders from net investment income | (850,947) | (799,682) |
Distributions to shareholders from net realized gain | (588,834) | (516,972) |
Total distributions | (1,439,781) | (1,316,654) |
Share transactions
Proceeds from sales of shares | 9,717,483 | 6,116,678 |
Reinvestment of distributions | 1,439,781 | 1,316,654 |
Cost of shares redeemed | (4,193,863) | (4,466,810) |
Net increase (decrease) in net assets resulting from share transactions | 6,963,401 | 2,966,522 |
Total increase (decrease) in net assets | 11,510,174 | 9,773,506 |
| | |
Net Assets | | |
Beginning of period | 34,559,715 | 24,786,209 |
End of period (including undistributed net investment income of $0 and $19,651, respectively) | $ 46,069,889 | $ 34,559,715 |
Other Information Shares | | |
Sold | 1,100,150 | 850,175 |
Issued in reinvestment of distributions | 157,171 | 176,673 |
Redeemed | (485,488) | (623,714) |
Net increase (decrease) | 771,833 | 403,134 |
Financial Highlights
Years ended December 31, | 2010 | 2009 | 2008 | 2007 | 2006 |
Selected Per-Share Data | | | | | |
Net asset value, beginning of period | $ 8.38 | $ 6.66 | $ 12.48 | $ 11.72 | $ 10.42 |
Income from Investment Operations | | | | | |
Net investment income (loss)C | .19 | .21 | .23 | .30 | .20 |
Net realized and unrealized gain (loss) | 1.15 | 1.85 | (4.78) | .99 | 1.16 |
Total from investment operations | 1.34 | 2.06 | (4.55) | 1.29 | 1.36 |
Distributions from net investment income | (.18) | (.20) | (.29) | (.29) | (.06) |
Distributions from net realized gain | (.13) | (.14) | (.98) | (.24) | - |
Total distributions | (.31) | (.34) | (1.27) | (.53) | (.06) |
Net asset value, end of period | $ 9.41 | $ 8.38 | $ 6.66 | $ 12.48 | $ 11.72 |
Total Return A, B | 16.12% | 31.57% | (38.13)% | 11.28% | 13.12% |
Ratios to Average Net Assets D, F | | | | | |
Expenses before reductions E | .00% | .00% | .00% | .00% | .00% |
Expenses net of fee waivers, if any | .00% | .00% | .00% | .00% | .00% |
Expenses net of all reductions | .00% | .00% | .00% | .00% | .00% |
Net investment income (loss) | 2.20% | 2.86% | 2.38% | 2.41% | 1.84% |
Supplemental Data | | | | | |
Net assets, end of period (000 omitted) | $ 46,070 | $ 34,560 | $ 24,786 | $ 31,355 | $ 14,728 |
Portfolio turnover rate | 26% | 21% | 19% | 12% | 36% |
A Total returns do not reflect charges attributable to your insurance company's separate account. Inclusion of these charges would reduce the total returns shown.
B Total returns would have been lower had certain expenses not been reduced during the periods shown.
C Calculated based on average shares outstanding during the period.
D Amounts do not include the activity of the underlying funds.
E Amount represents less than .01%.
F Expense ratios reflect operating expenses of the Fund. Expenses before reductions do not reflect amounts reimbursed by the investment adviser or reductions from expense offset arrangements and do not represent the amount paid by the Fund during periods when reimbursements or reductions occur. Expenses net of fee waivers reflect expenses after reimbursement by the investment adviser but prior to reductions from expense offset arrangements. Expenses net of all reductions represent the net expenses paid by the Fund but do not include expenses of the investment companies in which the Fund invests.
See accompanying notes which are an integral part of the financial statements.
Annual Report
Notes to Financial Statements
For the period ended December 31, 2010
1. Organization.
VIP Investor Freedom Income Portfolio, VIP Investor Freedom 2005 Portfolio, VIP Investor Freedom 2010 Portfolio, VIP Investor Freedom 2015 Portfolio, VIP Investor Freedom 2020 Portfolio, VIP Investor Freedom 2025 Portfolio and VIP Investor Freedom 2030 Portfolio (the Funds) are funds of Variable Insurance Products Fund V. The Variable Insurance Products Fund V (the Trust) (referred to in this report as Fidelity Variable Insurance Products) is registered under the Investment Company Act of 1940, as amended (the 1940 Act), as an open-end management investment company organized as a Massachusetts business trust. Each Fund is authorized to issue an unlimited number of shares. The Funds invest primarily in a combination of other VIP equity, bond, and short-term funds (the Underlying Funds) managed by Fidelity Management & Research Company (FMR). Shares of each Fund may only be purchased by insurance companies for the purpose of funding variable annuity or variable life insurance contracts.
2. Significant Accounting Policies.
The financial statements have been prepared in conformity with accounting principles generally accepted in the United States of America (GAAP), which require management to make certain estimates and assumptions at the date of the financial statements. Actual results could differ from those estimates. Subsequent events, if any, through the date that the financial statements were issued have been evaluated in the preparation of the financial statements. The following summarizes the significant accounting policies of the Funds:
Security Valuation. Investments are valued as of 4:00 p.m. Eastern time on the last calendar day of the period. Each Fund categorizes the inputs to valuation techniques used to value their investments into a disclosure hierarchy consisting of three levels as shown below.
Level 1 - quoted prices in active markets for identical investments
Level 2 - other significant observable inputs (including quoted prices for similar investments, interest rates, prepayment speeds, etc.)
Level 3 - unobservable inputs (including the Fund's own assumptions based on the best information available)
Valuation techniques used to value each Fund's investments by major category are as follows. Investments in the Underlying Funds are valued at their closing net asset value (NAV) each business day and are categorized as Level 1 in the hierarchy.
Investment Transactions and Income. For financial reporting purposes, the Funds' investment holdings and NAV include trades executed through the end of the last business day of the period. The NAV per share for processing shareholder transactions is calculated as of the close of business of the New York Stock Exchange (NYSE), normally 4:00 p.m. Eastern time and includes trades executed through the end of the prior business day. Gains and losses on securities sold are determined on the basis of identified cost. Income and capital gain distributions from the Underlying Funds, if any, are recorded on the ex-dividend date.
Expenses. Expenses directly attributable to a fund are charged to that fund. Expenses attributable to more than one fund are allocated among the respective funds on the basis of relative net assets or other appropriate methods. Expenses included in the accompanying financial statements reflect the expenses of the Fund and do not include any expenses associated with the Underlying Funds. Expense estimates are accrued in the period to which they relate and adjustments are made when actual amounts are known.
Income Tax Information and Distributions to Shareholders. Each year each Fund intends to qualify as a regulated investment company, including distributing substantially all of its taxable income and realized gains under Subchapter M of the Internal Revenue Code and filing its U.S. federal tax return. As a result, no provision for income taxes is required. As of December 31, 2010, each Fund did not have any unrecognized tax benefits in the accompanying financial statements. A fund's federal tax return is subject to examination by the Internal Revenue Service (IRS) for a period of three years.
Distributions are declared and recorded on the ex-dividend date. Income and capital gain distributions are determined in accordance with income tax regulations, which may differ from GAAP.
Capital accounts within the financial statements are adjusted for permanent book-tax differences. These adjustments have no impact on net assets or the results of operations. Temporary book-tax differences will reverse in a subsequent period.
Book-tax differences are primarily due to the short-term gain distributions from the Underlying Funds, capital loss carryforwards and losses deferred due to wash sales and excise tax regulations.
Annual Report
Notes to Financial Statements - continued
2. Significant Accounting Policies - continued
Income Tax Information and Distributions to Shareholders - continued
The federal tax cost of investment securities and unrealized appreciation (depreciation) as of period end were as follows for each Fund:
| Tax
cost | Gross unrealized
appreciation | Gross unrealized
depreciation | Net unrealized
appreciation
(depreciation) |
VIP Investor Freedom Income | $ 32,394,020 | $ 1,022,388 | $ (949,828) | $ 72,560 |
VIP Investor Freedom 2005 | 11,053,223 | 274,769 | (890,235) | (615,466) |
VIP Investor Freedom 2010 | 60,103,512 | 907,420 | (6,419,524) | (5,512,104) |
VIP Investor Freedom 2015 | 74,618,460 | 1,723,371 | (7,082,410) | (5,359,039) |
VIP Investor Freedom 2020 | 105,423,068 | 2,615,630 | (11,495,932) | (8,880,302) |
VIP Investor Freedom 2025 | 46,130,040 | 3,005,138 | (4,605,655) | (1,600,517) |
VIP Investor Freedom 2030 | 50,480,780 | 1,819,128 | (6,230,018) | (4,410,890) |
The tax-based components of distributable earnings as of period end were as follows for each Fund:
| Undistributed
ordinary
income | Undistributed
long-term
capital gain | Capital loss
carryforward | Net unrealized
appreciation
(depreciation) |
VIP Investor Freedom Income | $ 14,604 | $ 18,755 | $ - | $ 72,560 |
VIP Investor Freedom 2005 | 15,362 | 5,187 | - | (615,466) |
VIP Investor Freedom 2010 | - | - | (148,328) | (5,512,104) |
VIP Investor Freedom 2015 | - | - | - | (5,359,039) |
VIP Investor Freedom 2020 | 27,090 | 13,456 | - | (8,880,302) |
VIP Investor Freedom 2025 | - | - | - | (1,600,517) |
VIP Investor Freedom 2030 | - | - | - | (4,410,890) |
The tax character of distributions paid was as follows:
December 31, 2010 | | | |
| Ordinary
Income | Long-term
Capital Gains | Total |
VIP Investor Freedom Income | $ 821,948 | $ 69,847 | $ 891,795 |
VIP Investor Freedom 2005 | 287,925 | 127,829 | 415,754 |
VIP Investor Freedom 2010 | 1,353,042 | - | 1,353,042 |
VIP Investor Freedom 2015 | 2,362,926 | 474,334 | 2,837,260 |
VIP Investor Freedom 2020 | 2,873,180 | 512,069 | 3,385,249 |
VIP Investor Freedom 2025 | 1,152,198 | 43,905 | 1,196,103 |
VIP Investor Freedom 2030 | 1,250,065 | 189,716 | 1,439,781 |
December 31, 2009 | | | |
| Ordinary
Income | Long-term
Capital Gains | Total |
VIP Investor Freedom Income | $ 1,043,955 | $ 106,009 | $ 1,149,964 |
VIP Investor Freedom 2005 | 407,802 | 36,300 | 444,102 |
VIP Investor Freedom 2010 | 2,033,635 | 341,968 | 2,375,603 |
VIP Investor Freedom 2015 | 2,762,640 | 334,209 | 3,096,849 |
VIP Investor Freedom 2020 | 2,844,226 | 323,563 | 3,167,789 |
VIP Investor Freedom 2025 | 1,156,952 | 182,912 | 1,339,864 |
VIP Investor Freedom 2030 | 1,068,467 | 248,187 | 1,316,654 |
Annual Report
3. Purchases and Sales of Investments.
Purchases and redemptions of the Underlying Fund shares are noted in the table below.
| Purchases ($) | Redemptions ($) |
VIP Investor Freedom Income | 12,645,489 | 7,005,448 |
VIP Investor Freedom 2005 | 6,415,417 | 6,176,042 |
VIP Investor Freedom 2010 | 17,526,493 | 15,364,541 |
VIP Investor Freedom 2015 | 22,619,137 | 19,406,610 |
VIP Investor Freedom 2020 | 32,889,062 | 26,321,858 |
VIP Investor Freedom 2025 | 17,872,588 | 10,987,684 |
VIP Investor Freedom 2030 | 16,549,634 | 10,057,297 |
4. Fees and Other Transactions with Affiliates.
Management Fee. Strategic Advisers, Inc., (Strategic Advisers) an affiliate of FMR, provides the Funds with investment management related services. The Funds do not pay any fees for these services.
Other Transactions. Strategic Advisers has entered into an administration agreement with FMR under which FMR provides management and administrative services (other than investment advisory services) necessary for the operation of each Fund. Pursuant to this agreement, FMR pays all expenses of each Fund, excluding the compensation of the independent Trustees and certain other expenses such as interest expense. FMR also contracts with other Fidelity companies to perform the services necessary for the operation of each Fund. The Funds do not pay any fees for these services.
5. Expense Reductions.
FMR voluntarily agreed to reimburse the Funds to the extent annual operating expenses exceeded certain levels of average net assets as noted in the table below. Some expenses, for example interest expense, are excluded from this reimbursement.
The following Funds were in reimbursement during the period:
| Expense
Limitations | Reimbursement
from adviser |
VIP Investor Freedom Income | 0% | $ 104 |
VIP Investor Freedom 2005 | 0% | 35 |
VIP Investor Freedom 2010 | 0% | 177 |
VIP Investor Freedom 2015 | 0% | 220 |
VIP Investor Freedom 2020 | 0% | 302 |
VIP Investor Freedom 2025 | 0% | 131 |
VIP Investor Freedom 2030 | 0% | 133 |
6. Other.
The Funds' organizational documents provide former and current trustees and officers with a limited indemnification against liabilities arising in connection with the performance of their duties to the Funds. In the normal course of business, the Funds may also enter into contracts that provide general indemnifications. The Funds' maximum exposure under these arrangements is unknown as this would be dependent on future claims that may be made against the Funds. The risk of material loss from such claims is considered remote.
The Funds do not invest in the Underlying Funds for the purpose of exercising management or control; however, investments by the Funds within their principal investment strategies may represent a significant portion of the Underlying Fund's net assets. At the end of the period, FMR or its affiliates were owners of record of all of the outstanding shares of the Funds.
Annual Report
Report of Independent Registered Public Accounting Firm
To the Trustees of Variable Insurance Products V and the Shareholders of VIP Investor Freedom Income Portfolio, VIP Investor Freedom 2005 Portfolio, VIP Investor Freedom 2010 Portfolio, VIP Investor Freedom 2015 Portfolio, VIP Investor Freedom 2020 Portfolio, VIP Investor Freedom 2025 Portfolio, VIP Investor Freedom 2030 Portfolio:
In our opinion, the accompanying statements of assets and liabilities, including the schedules of investments, and the related statements of operations and of changes in net assets and the financial highlights present fairly, in all material respects, the financial positions of VIP Investor Freedom Income Portfolio, VIP Investor Freedom 2005 Portfolio, VIP Investor Freedom 2010 Portfolio, VIP Investor Freedom 2015 Portfolio, VIP Investor Freedom 2020 Portfolio, VIP Investor Freedom 2025 Portfolio and VIP Investor Freedom 2030 Portfolio (the Funds), each a fund of Variable Insurance Products V Trust at December 31, 2010, the results of each of their operations for the year then ended, the changes in each of their net assets for each of the two years in the period then ended and the financial highlights for each of the periods indicated, in conformity with accounting principles generally accepted in the United States of America. These financial statements and financial highlights (hereafter referred to as "financial statements") are the responsibility of the Funds' management. Our responsibility is to express an opinion on these financial statements based on our audits. We conducted our audits of these financial statements in accordance with the standards of the Public Company Accounting Oversight Board (United States). Those standards require that we plan and perform the audit to obtain reasonable assurance about whether the financial statements are free of material misstatement. An audit includes examining, on a test basis, evidence supporting the amounts and disclosures in the financial statements, assessing the accounting principles used and significant estimates made by management, and evaluating the overall financial statement presentation. We believe that our audits, which included confirmation of securities at December 31, 2010 by correspondence with the transfer agent of the underlying funds, provide a reasonable basis for our opinion.
/s/ PricewaterhouseCoopers LLP
PricewaterhouseCoopers LLP
Boston, Massachusetts
February 22, 2011
Annual Report
The Trustees and executive officers of the trust and funds, as applicable, are listed below. The Board of Trustees governs each fund and is responsible for protecting the interests of shareholders. The Trustees are experienced executives who meet periodically throughout the year to oversee each fund's activities, review contractual arrangements with companies that provide services to each fund, oversee management of the risks associated with such activities and contractual arrangements, and review each fund's performance. Except for James C. Curvey, each of the Trustees oversees 189 funds advised by FMR or an affiliate. Mr. Curvey oversees 408 funds advised by FMR or an affiliate.
The Trustees hold office without limit in time except that (a) any Trustee may resign; (b) any Trustee may be removed by written instrument, signed by at least two-thirds of the number of Trustees prior to such removal; (c) any Trustee who requests to be retired or who has become incapacitated by illness or injury may be retired by written instrument signed by a majority of the other Trustees; and (d) any Trustee may be removed at any special meeting of shareholders by a two-thirds vote of the outstanding voting securities of the trust. Each Trustee who is not an interested person (as defined in the 1940 Act) (Independent Trustee), shall retire not later than the last day of the calendar year in which his or her 75th birthday occurs. The Independent Trustees may waive this mandatory retirement age policy with respect to individual Trustees. The executive officers hold office without limit in time, except that any officer may resign or may be removed by a vote of a majority of the Trustees at any regular meeting or any special meeting of the Trustees. Except as indicated, each individual has held the office shown or other offices in the same company for the past five years.
Experience, Skills, Attributes, and Qualifications of the Funds' Trustees. The Governance and Nominating Committee has adopted a statement of policy that describes the experience, qualifications, attributes, and skills that are necessary and desirable for potential Independent Trustee candidates (Statement of Policy). The Board believes that each Trustee satisfied at the time he or she was initially elected or appointed a Trustee, and continues to satisfy, the standards contemplated by the Statement of Policy. The Governance and Nominating Committee also engages professional search firms to help identify potential Independent Trustee candidates who have the experience, qualifications, attributes, and skills consistent with the Statement of Policy. From time to time, additional criteria based on the composition and skills of the current Independent Trustees, as well as experience or skills that may be appropriate in light of future changes to board composition, business conditions, and regulatory or other developments, have also been considered by the professional search firms and the Governance and Nominating Committee. In addition, the Board takes into account the Trustees' commitment and participation in Board and committee meetings, as well as their leadership of standing and ad hoc committees throughout their tenure.
In determining that a particular Trustee was and continues to be qualified to serve as a Trustee, the Board has considered a variety of criteria, none of which, in isolation, was controlling. The Board believes that, collectively, the Trustees have balanced and diverse experience, qualifications, attributes, and skills, which allow the Board to operate effectively in governing each fund and protecting the interests of shareholders. Information about the specific experience, skills, attributes, and qualifications of each Trustee, which in each case led to the Board's conclusion that the Trustee should serve (or continue to serve) as a trustee of the funds, is provided below.
Board Structure and Oversight Function. Abigail P. Johnson is an interested person (as defined in the 1940 Act) and currently serves as Chairman. The Trustees have determined that an interested Chairman is appropriate and benefits shareholders because an interested Chairman has a personal and professional stake in the quality and continuity of services provided to the funds. Independent Trustees exercise their informed business judgment to appoint an individual of their choosing to serve as Chairman, regardless of whether the Trustee happens to be independent or a member of management. The Independent Trustees have determined that they can act independently and effectively without having an Independent Trustee serve as Chairman and that a key structural component for assuring that they are in a position to do so is for the Independent Trustees to constitute a substantial majority for the Board. The Independent Trustees also regularly meet in executive session. Kenneth L. Wolfe serves as Chairman of the Independent Trustees and as such (i) acts as a liaison between the Independent Trustees and management with respect to matters important to the Independent Trustees and (ii) with management prepares agendas for Board meetings.
Fidelity funds are overseen by different Boards of Trustees. The funds' Board oversees Fidelity's investment-grade bond, money market, and asset allocation funds and another Board oversees Fidelity's equity and high income funds. The asset allocation funds may invest in Fidelity funds that are overseen by such other Board. The use of separate Boards, each with its own committee structure, allows the Trustees of each group of Fidelity funds to focus on the unique issues of the funds they oversee, including common research, investment, and operational issues. On occasion, the separate Boards establish joint committees to address issues of overlapping consequences for the Fidelity funds overseen by each Board.
The Trustees operate using a system of committees to facilitate the timely and efficient consideration of all matters of importance to the Trustees, each fund, and fund shareholders and to facilitate compliance with legal and regulatory requirements and oversight of the funds' activities and associated risks. The Board, acting through its committees, has charged FMR and its affiliates with (i) identifying events or circumstances the occurrence of which could have demonstrably adverse effects on the funds' business and/or reputation; (ii) implementing processes and controls to lessen the possibility that such events or circumstances occur or to mitigate the effects of such events or circumstances if they do occur; and (iii) creating and maintaining a system designed to evaluate continuously business and market conditions in order to facilitate the identification and implementation processes described in (i) and (ii) above. Because the day-to-day operations and activities of the funds are carried out by or through FMR, its affiliates and other service providers, the funds' exposure to risks is mitigated but not eliminated by the processes overseen by the Trustees. While each of the Board's committees has responsibility for overseeing different aspects of the funds' activities, oversight is exercised primarily through the Operations and Audit Committees. Appropriate personnel, including but not limited to the funds' Chief Compliance Officer (CCO), FMR's internal auditor, the independent accountants, the funds' Treasurer and portfolio management personnel, make periodic reports to the Board's committees, as appropriate. The responsibilities of each committee, including their oversight responsibilities, are described further under "Standing Committees of the Funds' Trustees."
Annual Report
Trustees and Officers - continued
The funds' Statement of Additional Information (SAI) includes more information about the Trustees. To request a free copy, call Fidelity at 1-877-208-0098.
Interested Trustees*:
Correspondence intended for each Trustee who is an interested person may be sent to Fidelity Investments, 82 Devonshire Street, Boston, Massachusetts 02109.
Name, Age; Principal Occupations and Other Relevant Experience+ |
Abigail P. Johnson (49) |
| Year of Election or Appointment: 2009 Ms. Johnson is Trustee and Chairman of the Board of Trustees of certain Trusts. Ms. Johnson serves as President of Personal, Workplace and Institutional Services (2005-present). Ms. Johnson is the Vice Chairman and Director (2007-present) of FMR LLC. Previously, Ms. Johnson served as President and a Director of FMR (2001-2005), a Trustee of other investment companies advised by FMR, Fidelity Investments Money Management, Inc., and FMR Co., Inc. (2001-2005), Senior Vice President of the Fidelity funds (2001-2005), and managed a number of Fidelity funds. Ms. Abigail P. Johnson and Mr. Arthur E. Johnson are not related. |
James C. Curvey (75) |
| Year of Election or Appointment: 2007 Mr. Curvey also serves as Trustee (2007-present) of other investment companies advised by FMR. Mr. Curvey is a Director of Fidelity Investments Money Management, Inc. (2009-present), Director of Fidelity Research & Analysis Co. (2009-present) and Director of FMR and FMR Co., Inc. (2007-present). Mr. Curvey is also Vice Chairman (2007-present) and Director of FMR LLC. In addition, Mr. Curvey serves as an Overseer for the Boston Symphony Orchestra and a member of the Trustees of Villanova University. Previously, Mr. Curvey was the Vice Chairman (2006-2007) and Director (2000-2007) of FMR Corp. |
* Trustees have been determined to be "Interested Trustees" by virtue of, among other things, their affiliation with the trust or various entities under common control with FMR.
+ The information above includes each Trustee's principal occupation during the last five years and other information relating to the experience, attributes, and skills relevant to each Trustee's qualifications to serve as a Trustee, which led to the conclusion that each Trustee should serve as a Trustee for each fund.
Independent Trustees:
Correspondence intended for each Independent Trustee (that is, the Trustees other than the Interested Trustees) may be sent to Fidelity Investments, P.O. Box 55235, Boston, Massachusetts 02205-5235.
Name, Age; Principal Occupations and Other Relevant Experience+ |
Albert R. Gamper, Jr. (68) |
| Year of Election or Appointment: 2006 Prior to his retirement in December 2004, Mr. Gamper served as Chairman of the Board of CIT Group Inc. (commercial finance). During his tenure with CIT Group Inc. Mr. Gamper served in numerous senior management positions, including Chairman (1987-1989; 1999-2001; 2002-2004), Chief Executive Officer (1987-2004), and President (2002-2003). He also served as President and Chief Executive Officer of Tyco Capital Corporation (2001-2002). Mr. Gamper currently serves as a member of the Board of Directors of Public Service Enterprise Group (utilities, 2000-present), a member of the Board of Trustees, Rutgers University (2004-present), and Chairman of the Board of Saint Barnabas Health Care System. Previously, Mr. Gamper served as Chairman of the Board of Governors, Rutgers University (2004-2007). |
Robert F. Gartland (59) |
| Year of Election or Appointment: 2010 Mr. Gartland is a partner and investor of Vietnam Partners LLC (investments and consulting, 2008-present) and is Chairman and an investor in Gartland and Mellina Group Corp. (consulting, 2009-present). Prior to his retirement, Mr. Gartland held a variety of positions at Morgan Stanley (financial services, 1979-2007) including Managing Director (1987-2007). |
Arthur E. Johnson (63) |
| Year of Election or Appointment: 2008 Mr. Johnson serves as a member of the Board of Directors of Eaton Corporation (diversified power management, 2009-present) and AGL Resources, Inc. (holding company). Prior to his retirement, Mr. Johnson served as Senior Vice President of Corporate Strategic Development of Lockheed Martin Corporation (defense contractor, 1999-2009). He previously served on the Board of Directors of IKON Office Solutions, Inc. (1999-2008) and Delta Airlines (2005-2007). Mr. Arthur E. Johnson and Ms. Abigail P. Johnson are not related. |
Michael E. Kenneally (56) |
| Year of Election or Appointment: 2009 Previously, Mr. Kenneally served as a Member of the Advisory Board for certain Fidelity Fixed Income and Asset Allocation Funds (2008-2009). Prior to his retirement, Mr. Kenneally served as Chairman and Global Chief Executive Officer of Credit Suisse Asset Management (2003-2005). Mr. Kenneally was a Director of the Credit Suisse Funds (U.S. mutual funds, 2004-2008) and certain other closed-end funds (2004-2005) and was awarded the Chartered Financial Analyst (CFA) designation in 1991. |
James H. Keyes (70) |
| Year of Election or Appointment: 2007 Mr. Keyes serves as a member of the Boards of Navistar International Corporation (manufacture and sale of trucks, buses, and diesel engines, since 2002) and Pitney Bowes, Inc. (integrated mail, messaging, and document management solutions, since 1998). Prior to his retirement, Mr. Keyes served as Chairman and Chief Executive Officer of Johnson Controls (automotive, building, and energy, 1998-2002) and as a member of the Board of LSI Logic Corporation (semiconductor technologies, 1984-2008). |
Marie L. Knowles (64) |
| Year of Election or Appointment: 2001 Prior to Ms. Knowles' retirement in June 2000, she served as Executive Vice President and Chief Financial Officer of Atlantic Richfield Company (ARCO) (diversified energy, 1996-2000). From 1993 to 1996, she was a Senior Vice President of ARCO and President of ARCO Transportation Company. She served as a Director of ARCO from 1996 to 1998. Ms. Knowles currently serves as a Director and Chairman of the Audit Committee of McKesson Corporation (healthcare service, since 2002). Ms. Knowles is an Honorary Trustee of the Brookings Institution and a member of the Board of the Catalina Island Conservancy and of the Santa Catalina Island Company (2009-present). She also serves as a member of the Advisory Board for the School of Engineering of the University of Southern California and the Foundation Board of the School of Architecture at the University of Virginia (2007-
present). Previously, Ms. Knowles served as a Director of Phelps Dodge Corporation (copper mining and manufacturing, 1994-2007). |
Kenneth L. Wolfe (71) |
| Year of Election or Appointment: 2007 Mr. Wolfe is Chairman of the Independent Trustees of the Fixed Income and Asset Allocation Funds (2008-present). Prior to his retirement, Mr. Wolfe served as Chairman and a Director (2007-2009) and Chairman and Chief Executive Officer (1994-2001) of Hershey Foods Corporation. He also served as a member of the Boards of Adelphia Communications Corporation (telecommunications, 2003-2006), Bausch & Lomb, Inc. (medical/pharmaceutical, 1993-2007), and Revlon, Inc. (personal care products, 2004-2009). |
+ The information above includes each Trustee's principal occupation during the last five years and other information relating to the experience, attributes, and skills relevant to each Trustee's qualifications to serve as a Trustee, which led to the conclusion that each Trustee should serve as a Trustee for each fund.
Executive Officers:
Correspondence intended for each executive officer may be sent to Fidelity Investments, 82 Devonshire Street, Boston, Massachusetts 02109.
Name, Age; Principal Occupation |
John R. Hebble (52) |
| Year of Election or Appointment: 2008 President and Treasurer of Fidelity's Fixed Income and Asset Allocation Funds. Mr. Hebble also serves as Treasurer and Chief Financial Officer of The North Carolina Capital Management Trust: Cash and Term Portfolio (2008-present), Assistant Treasurer of other Fidelity funds (2009-present) and is an employee of Fidelity Investments. |
Boyce I. Greer (54) |
| Year of Election or Appointment: 2005 Vice President of Fidelity's Fixed Income Funds and Asset Allocation Funds (2005). Mr. Greer is also a Trustee of other investment companies advised by FMR. Mr. Greer is President of The North Carolina Capital Management Trust: Cash and Term Portfolio (2003-present), the Asset Allocation Division (2008-present), President and a Director of Strategic Advisers, Inc. (2008-present), President of FIMM 130/30 LLC (2008-present), Director of Ballyrock Investment Advisors LLC (2006-present), and an Executive Vice President of FMR (2005-present). Previously, Mr. Greer served as Executive Vice President of FMR Co., Inc. (2005-2009), President and Director of Fidelity Investments Money Management, Inc. (2007-2009) and as a Director and Managing Director of Strategic Advisers, Inc. (2002-2005). |
Derek L. Young (46) |
| Year of Election or Appointment: 2009 Vice President of Fidelity's Asset Allocation Funds. Mr. Young also serves as Chief Investment Officer of the Global Asset Allocation Group (2009-present). Previously, Mr. Young served as a portfolio manager. |
Scott C. Goebel (42) |
| Year of Election or Appointment: 2008 Secretary and Chief Legal Officer (CLO) of the Fidelity funds. Mr. Goebel also serves as Secretary and CLO of The North Carolina Capital Management Trust: Cash and Term Portfolio (2008-present); General Counsel, Secretary, and Senior Vice President of FMR (2008-present) and FMR Co., Inc. (2008-present); Deputy General Counsel of FMR LLC; Chief Legal Officer of Fidelity Management & Research (Hong Kong) Limited (2008-present) and Assistant Secretary of Fidelity Management & Research (Japan) Inc. (2008-present), Fidelity Investments Money Management, Inc. (2008-present), Fidelity Management & Research (U.K.) Inc. (2008-present), and Fidelity Research and Analysis Company (2008-present). Previously, Mr. Goebel served as Assistant Secretary of the Funds (2007-2008) and as Vice President and Secretary of Fidelity Distributors Corporation (FDC) (2005-2007). |
David J. Carter (37) |
| Year of Election or Appointment: 2010 Assistant Secretary of Fidelity's Fixed Income and Asset Allocation Funds. Mr. Carter also serves as Vice President, Associate General Counsel (2010-present) and is an employee of Fidelity Investments (2005-present). |
Holly C. Laurent (56) |
| Year of Election or Appointment: 2008 Anti-Money Laundering (AML) Officer of the Fidelity funds. Ms. Laurent also serves as AML Officer of The North Carolina Capital Management Trust: Cash and Term Portfolio (2008-present) and is an employee of Fidelity Investments. Previously, Ms. Laurent was Senior Vice President and Head of Legal for Fidelity Business Services India Pvt. Ltd. (2006-2008), and Senior Vice President, Deputy General Counsel and Group Head for FMR LLC (2005-2006). |
Christine Reynolds (52) |
| Year of Election or Appointment: 2008 Chief Financial Officer of the Fidelity funds. Ms. Reynolds became President of Fidelity Pricing and Cash Management Services (FPCMS) in August 2008. Ms. Reynolds served as Chief Operating Officer of FPCMS (2007-2008). Previously, Ms. Reynolds served as President, Treasurer, and Anti-Money Laundering officer of the Fidelity funds (2004-2007). |
Michael H. Whitaker (43) |
| Year of Election or Appointment: 2008 Chief Compliance Officer of Fidelity's Fixed Income and Asset Allocation Funds. Mr. Whitaker also serves as Chief Compliance Officer of The North Carolina Capital Management Trust: Cash and Term Portfolio (2008-present). Mr. Whitaker is an employee of Fidelity Investments (2007-present). Prior to joining Fidelity Investments, Mr. Whitaker worked at MFS Investment Management where he served as Senior Vice President and Chief Compliance Officer (2004-2006), and Assistant General Counsel. |
Jeffrey S. Christian (49) |
| Year of Election or Appointment: 2009 Deputy Treasurer of the Fidelity funds. Mr. Christian is an employee of Fidelity Investments. Previously, Mr. Christian served as Chief Financial Officer (2008-2009) of certain Fidelity funds and Senior Vice President of Fidelity Pricing and Cash Management Services (FPCMS) (2004-2009). |
Bryan A. Mehrmann (49) |
| Year of Election or Appointment: 2005 Deputy Treasurer of the Fidelity funds. Mr. Mehrmann is an employee of Fidelity Investments. |
Stephanie J. Dorsey (41) |
| Year of Election or Appointment: 2008 Deputy Treasurer of Fidelity's Fixed Income and Asset Allocation Funds. Ms. Dorsey also serves as Assistant Treasurer of other Fidelity funds (2010-present) and is an employee of Fidelity Investments (2008-present). Previously, Ms. Dorsey served as Treasurer (2004-2008) of the JPMorgan Mutual Funds and Vice President (2004-2008) of JPMorgan Chase Bank. |
Adrien E. Deberghes (43) |
| Year of Election or Appointment: 2010 Assistant Treasurer of Fidelity's Fixed Income and Asset Allocation Funds. Mr. Deberghes also serves as Deputy Treasurer of other Fidelity funds (2008-present) and is an employee of Fidelity Investments (2008-present). Previously, Mr. Deberghes served as Senior Vice President of Mutual Fund Administration at State Street Corporation (2007-2008), Senior Director of Mutual Fund Administration at Investors Bank & Trust (2005-2007), and Director of Finance for Dunkin' Brands (2000-2005). |
Kenneth B. Robins (41) |
| Year of Election or Appointment: 2009 Assistant Treasurer of the Fidelity Fixed Income and Asset Allocation Funds. Mr. Robins also serves as President and Treasurer of other Fidelity funds (2008-present; 2010-present) and is an employee of Fidelity Investments (2004-present). Previously, Mr. Robins served as Deputy Treasurer of the Fidelity funds (2005-2008) and Treasurer and Chief Financial Officer of The North Carolina Capital Management Trust: Cash and Term Portfolios (2006-2008). |
Gary W. Ryan (52) |
| Year of Election or Appointment: 2005 Assistant Treasurer of the Fidelity funds. Mr. Ryan is an employee of Fidelity Investments. Previously, Mr. Ryan served as Vice President of Fund Reporting in Fidelity Pricing and Cash Management Services (FPCMS) (1999-2005). |
Jonathan Davis (42) |
| Year of Election or Appointment: 2010 Assistant Treasurer of the Fidelity funds. Mr. Davis is an employee of Fidelity Investments. Previously, Mr. Davis served as Vice President and Associate General Counsel of FMR LLC (2003-2010). |
Annual Report
The Board of Trustees of each fund voted to pay to shareholders of record at the opening of business on record date, the following distributions per share derived from capital gains realized from sales of portfolio securities:
Fund | Pay Date | Record Date | Dividends | Capital Gains |
VIP Investor Freedom Income Portfolio | 02/11/2011 | 02/11/2011 | $0.000 | $0.012 |
VIP Investor Freedom 2005 Portfolio | 02/11/2011 | 02/11/2011 | $0.000 | $0.020 |
VIP Investor Freedom 2010 Portfolio | 02/11/2011 | 02/11/2011 | $0.000 | $0.000 |
VIP Investor Freedom 2015 Portfolio | 02/11/2011 | 02/11/2011 | $0.000 | $0.000 |
VIP Investor Freedom 2020 Portfolio | 02/11/2011 | 02/11/2011 | $0.000 | $0.005 |
VIP Investor Freedom 2025 Portfolio | 02/11/2011 | 02/11/2011 | $0.000 | $0.000 |
VIP Investor Freedom 2030 Portfolio | 02/11/2011 | 02/11/2011 | $0.000 | $0.000 |
The funds hereby designate as capital gain dividend the amounts noted below for the taxable year ended December 31, 2010, or, if subsequently determined to be different, the net capital gain of such year.
Fund | |
VIP Investor Freedom Income Portfolio | $88,602 |
VIP Investor Freedom 2005 Portfolio | $119,245 |
VIP Investor Freedom 2015 Portfolio | $463,593 |
VIP Investor Freedom 2020 Portfolio | $525,524 |
VIP Investor Freedom 2025 Portfolio | $39,296 |
VIP Investor Freedom 2030 Portfolio | $176,113 |
A percentage of the dividends distributed during the fiscal year for the following funds was derived from interest on U.S. Government securities which is generally exempt from state income tax:
VIP Investor Freedom Income Portfolio | 5.07% |
VIP Investor Freedom 2005 Portfolio | 4.03% |
VIP Investor Freedom 2010 Portfolio | 4.98% |
VIP Investor Freedom 2015 Portfolio | 3.77% |
VIP Investor Freedom 2020 Portfolio | 3.53% |
VIP Investor Freedom 2025 Portfolio | 3.14% |
VIP Investor Freedom 2030 Portfolio | 2.45% |
A percentage of the dividends distributed during the fiscal year for the following funds qualifies for the dividends-received deduction for corporate shareholders:
| February, 2010 | December, 2010 |
VIP Investor Freedom Income Portfolio | 1% | 6% |
VIP Investor Freedom 2005 Portfolio | 0% | 11% |
VIP Investor Freedom 2010 Portfolio | 0% | 14% |
VIP Investor Freedom 2015 Portfolio | 1% | 13% |
VIP Investor Freedom 2020 Portfolio | 2% | 16% |
VIP Investor Freedom 2025 Portfolio | 5% | 20% |
VIP Investor Freedom 2030 Portfolio | 0% | 24% |
Annual Report
Board Approval of Investment Advisory Contracts and Management Fees
VIP Investor Freedom Funds
Each year, the Board of Trustees, including the Independent Trustees (together, the Board), votes on the renewal of the management contract and administration agreement (together, the Advisory Contracts) for each fund. The Board, assisted by the advice of fund counsel and Independent Trustees' counsel, requests and considers a broad range of information relevant to the renewal of the Advisory Contracts throughout the year.
The Board meets regularly and considers at each of its meetings factors that are relevant to its annual consideration of the renewal of each fund's Advisory Contracts, including the services and support provided to each fund and its shareholders. The Board has established three standing committees, each composed of Independent Trustees with varying backgrounds, to which the Board has assigned specific subject matter responsibilities in order to enhance effective decision-making by the Board. The Operations Committee, of which all of the Independent Trustees are members, meets regularly throughout the year and, among other matters, considers matters specifically related to the annual consideration of the renewal of each fund's Advisory Contracts. The Board, acting directly and through its Committees, requests and receives information concerning the annual consideration of the renewal of each fund's Advisory Contracts. The Board also meets as needed to consider matters specifically related to the Board's annual consideration of the renewal of Advisory Contracts. Members of the Board may also meet with trustees of other Fidelity funds through ad hoc joint committees to discuss certain matters relevant to the Fidelity funds.
At its September 2010 meeting, the Board of Trustees, including the Independent Trustees, unanimously determined to renew each fund's Advisory Contracts. In reaching its determination, the Board considered all factors it believed relevant and reached a determination, with the assistance of fund counsel and Independent Trustees' counsel and through the exercise of its business judgment, that the renewal of the Advisory Contracts is in the best interests of each fund and its shareholders and that the lack of compensation to be received by Fidelity under the management contracts is fair and reasonable. The Board's decision to renew the Advisory Contracts was not based on any single factor, but rather was based on a comprehensive consideration of all the information provided to the Board at its meetings throughout the year. In reaching its determination, the Board is aware that shareholders in each fund have a broad range of investment choices available to them, including a wide choice among mutual funds offered by Fidelity's competitors, and that each fund's shareholders, with the opportunity to review and weigh the disclosure provided by the fund in its prospectus and other public disclosures, have chosen to invest in that fund, managed by Fidelity.
Nature, Extent, and Quality of Services Provided. The Board considered the staffing within the investment adviser, Strategic Advisers, Inc. (Strategic Advisers), and the administrator, FMR, including the backgrounds of the funds' investment personnel and the funds' investment objectives and disciplines. The Independent Trustees also had discussions with senior management of Fidelity's investment operations and investment groups. The Board considered the structure of the portfolio manager compensation program and whether this structure provides appropriate incentives to act in the best interest of each fund.
Resources Dedicated to Investment Management and Support Services. The Board reviewed the size, education, and experience of Strategic Advisers' investment staff, their use of technology, and Strategic Advisers' and FMR's approach to recruiting, training, and retaining portfolio managers and other research, advisory, and management personnel. The Board noted that Fidelity's analysts have access to a variety of technological tools and market and securities data that enable them to perform both fundamental and quantitative analysis and to specialize in various disciplines. The Board noted FMR's continued focus on strengthening the organization and discipline of equity portfolio management and research.
Shareholder and Administrative Services. The Board considered (i) the nature, extent, quality, and cost of advisory, administrative, and shareholder services performed by FMR and its affiliates under the Advisory Contracts and under separate agreements covering transfer agency, pricing and bookkeeping, and securities lending services for each fund; (ii) the nature and extent of the investment adviser's supervision of third party service providers, principally custodians and subcustodians; and (iii) the resources devoted to, and the record of compliance with, each fund's compliance policies and procedures.
The Board noted that the growth of fund assets over time across the complex allows Fidelity to reinvest in the development of services designed to enhance the value or convenience of the Fidelity funds as investment vehicles. These services include 24-hour access to account information and market information through telephone representatives and over the Internet, and investor education materials and asset allocation tools.
Investment in a Large Fund Family. The Board considered the benefits to shareholders of investing in a Fidelity fund, including the benefits of investing in a fund that is part of a large family of funds offering a variety of investment disciplines and providing a large variety of mutual fund investor services. The Board noted that Fidelity had taken, or had made recommendations that resulted in the Fidelity funds taking, a number of actions over the previous year that benefited particular funds, including (i) dedicating additional resources to investment research and restructuring and broadening the focus of the investment research teams; (ii) bolstering the senior management team that oversees asset management; (iii) launching Class F of certain funds as a lower-fee class available to Freedom K and Freedom Index Funds; (iv) lowering the initial investment minimums and ongoing balance requirements for Real Estate High Income Fund; (v) eliminating subsequent purchase minimums for all funds and adding a waiver of the investment minimum requirement for new accounts opened with the proceeds of a systematic withdrawal plan; (vi) eliminating the withdrawal minimum and maximum limits for systematic withdrawals from Advisor funds; (vii) expanding sales load waivers on Class A shares for Destiny Planholders and expanding Institutional Class eligibility for Class O Destiny Planholders; and (viii) changing certain Class A and Class T sales charge structures to further align them with industry practices.
Annual Report
Board Approval of Investment Advisory Contracts and Management Fees - continued
Investment Performance. The Board considered whether each fund has operated in accordance with its investment objective, as well as its record of compliance with its investment restrictions. It also reviewed each fund's absolute investment performance, as well as each fund's relative investment performance measured over multiple periods against a proprietary custom index. The Board noted that FMR does not believe that a meaningful peer group exists against which to compare any of the funds' performance. Because each fund had been in existence less than five calendar years, for each fund the following charts considered by the Board show, over the one- and three-year periods ended December 31, 2009, the fund's cumulative total returns and the cumulative total returns of a proprietary custom index ("benchmark"). For each fund, the proprietary custom index is an index developed by FMR that represents the performance of the fund's asset classes according to their respective weightings adjusted on June 30 and December 31 of each calendar year to reflect the fund's increasingly conservative asset allocations (for each fund other than VIP Investor Freedom Income Portfolio).
VIP Investor Freedom 2005 Portfolio
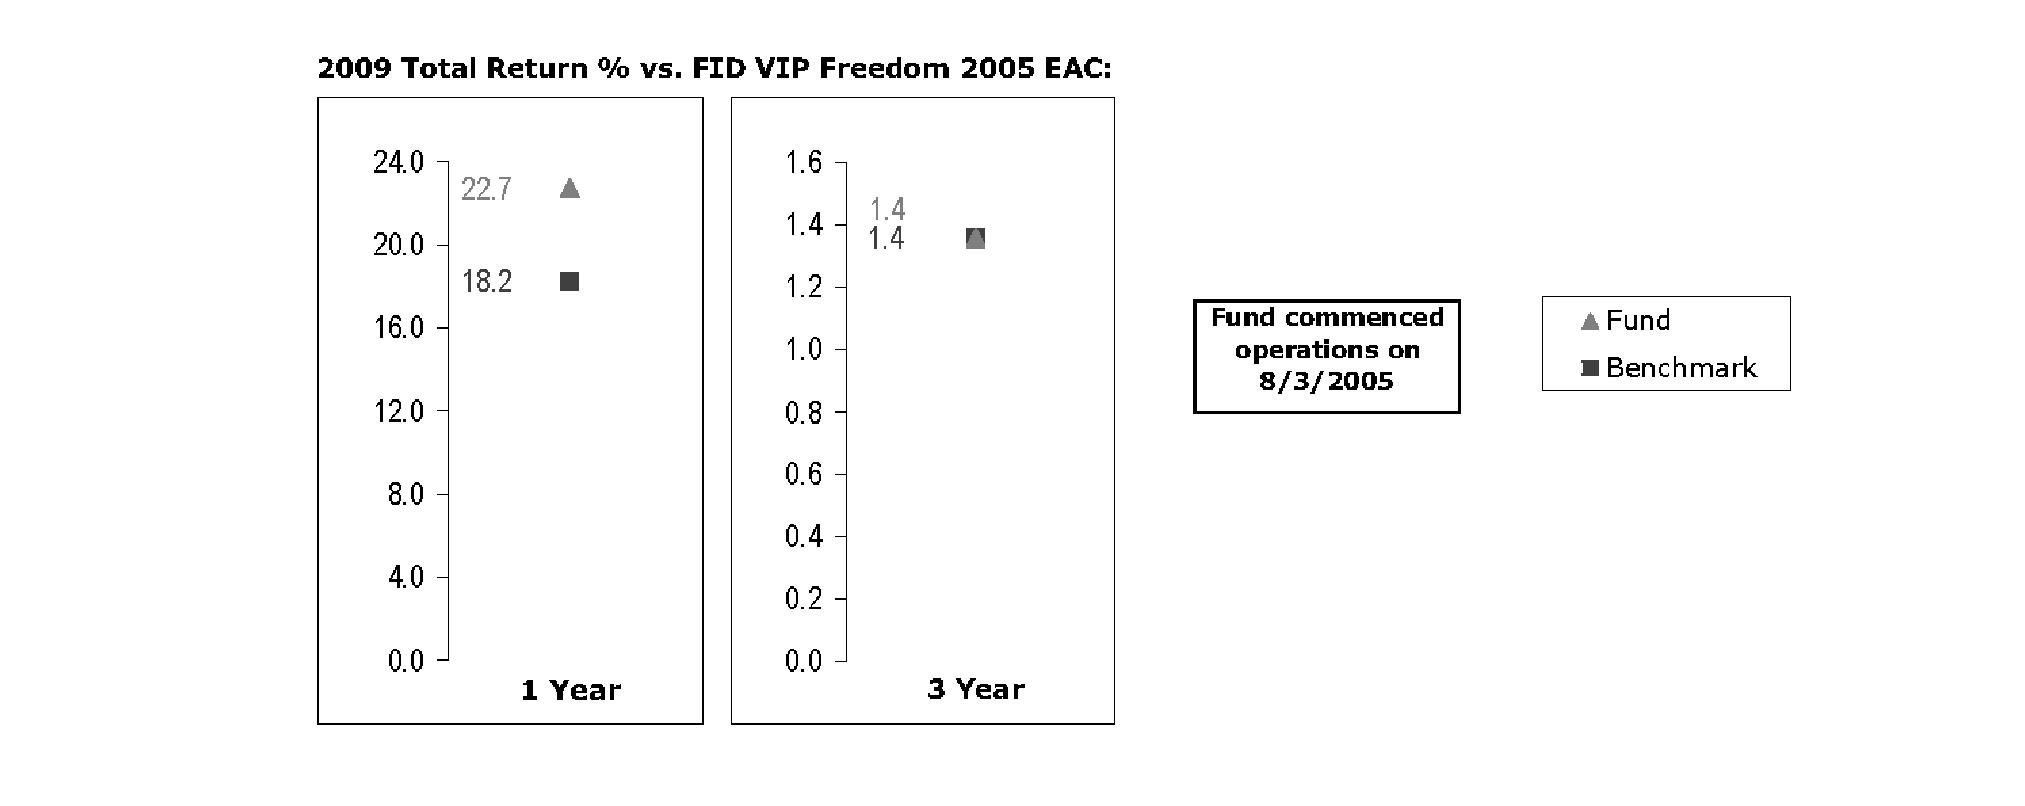
The Board noted that the investment performance of the fund compared favorably to its benchmark for all the periods shown. The Board also reviewed the fund's performance since inception as well as performance in the current year.
VIP Investor Freedom 2010 Portfolio
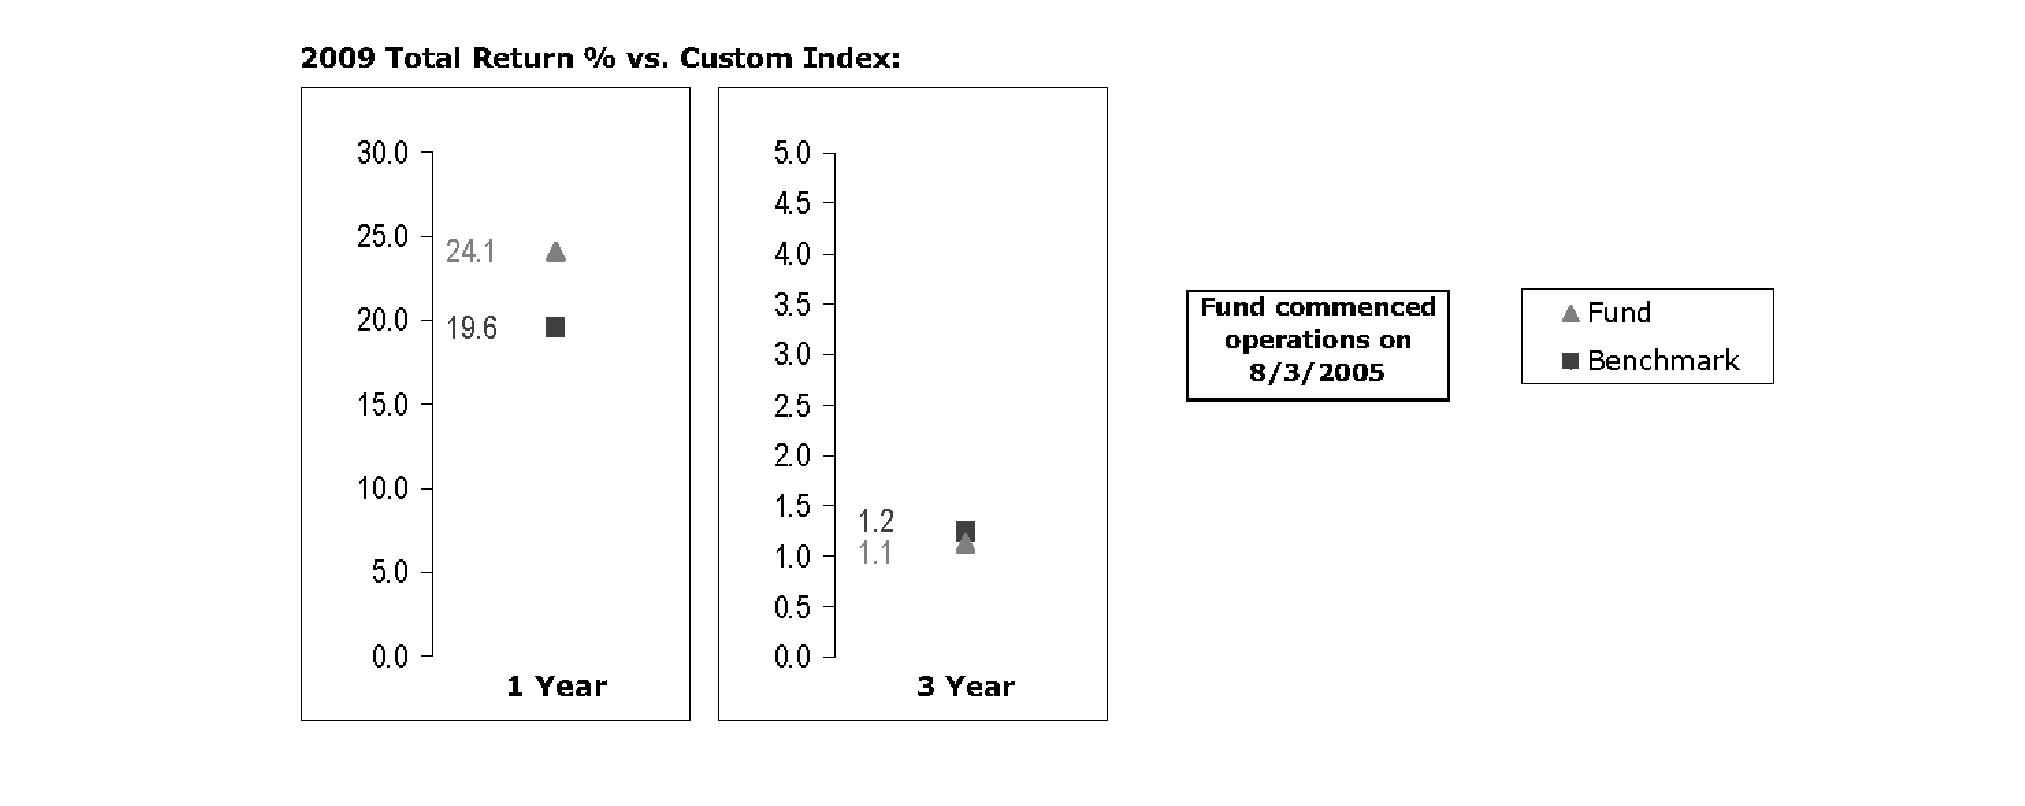
Annual Report
The Board noted that the investment performance of the fund compared favorably to its benchmark for the one-year period, although the fund's three-year cumulative total return was lower than its benchmark. The Board also reviewed the fund's performance since inception as well as performance in the current year.
VIP Investor Freedom 2015 Portfolio
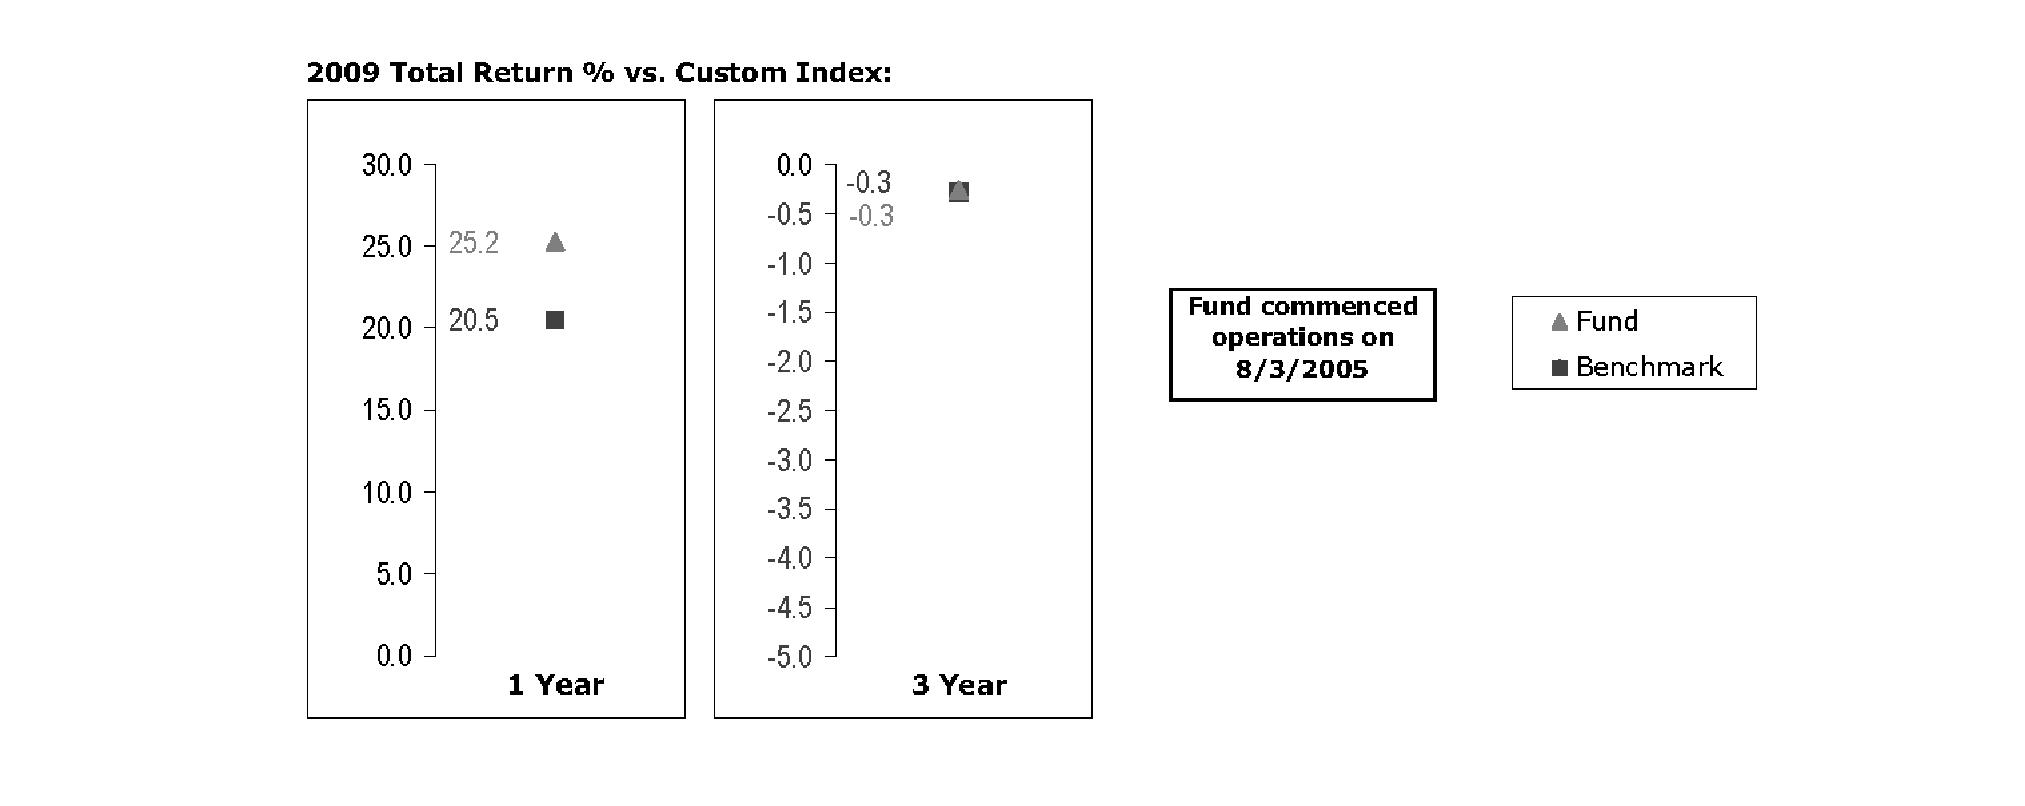
The Board noted that the investment performance of the fund compared favorably to its benchmark for all the periods shown. The Board also reviewed the fund's performance since inception as well as performance in the current year.
VIP Investor Freedom 2020 Portfolio
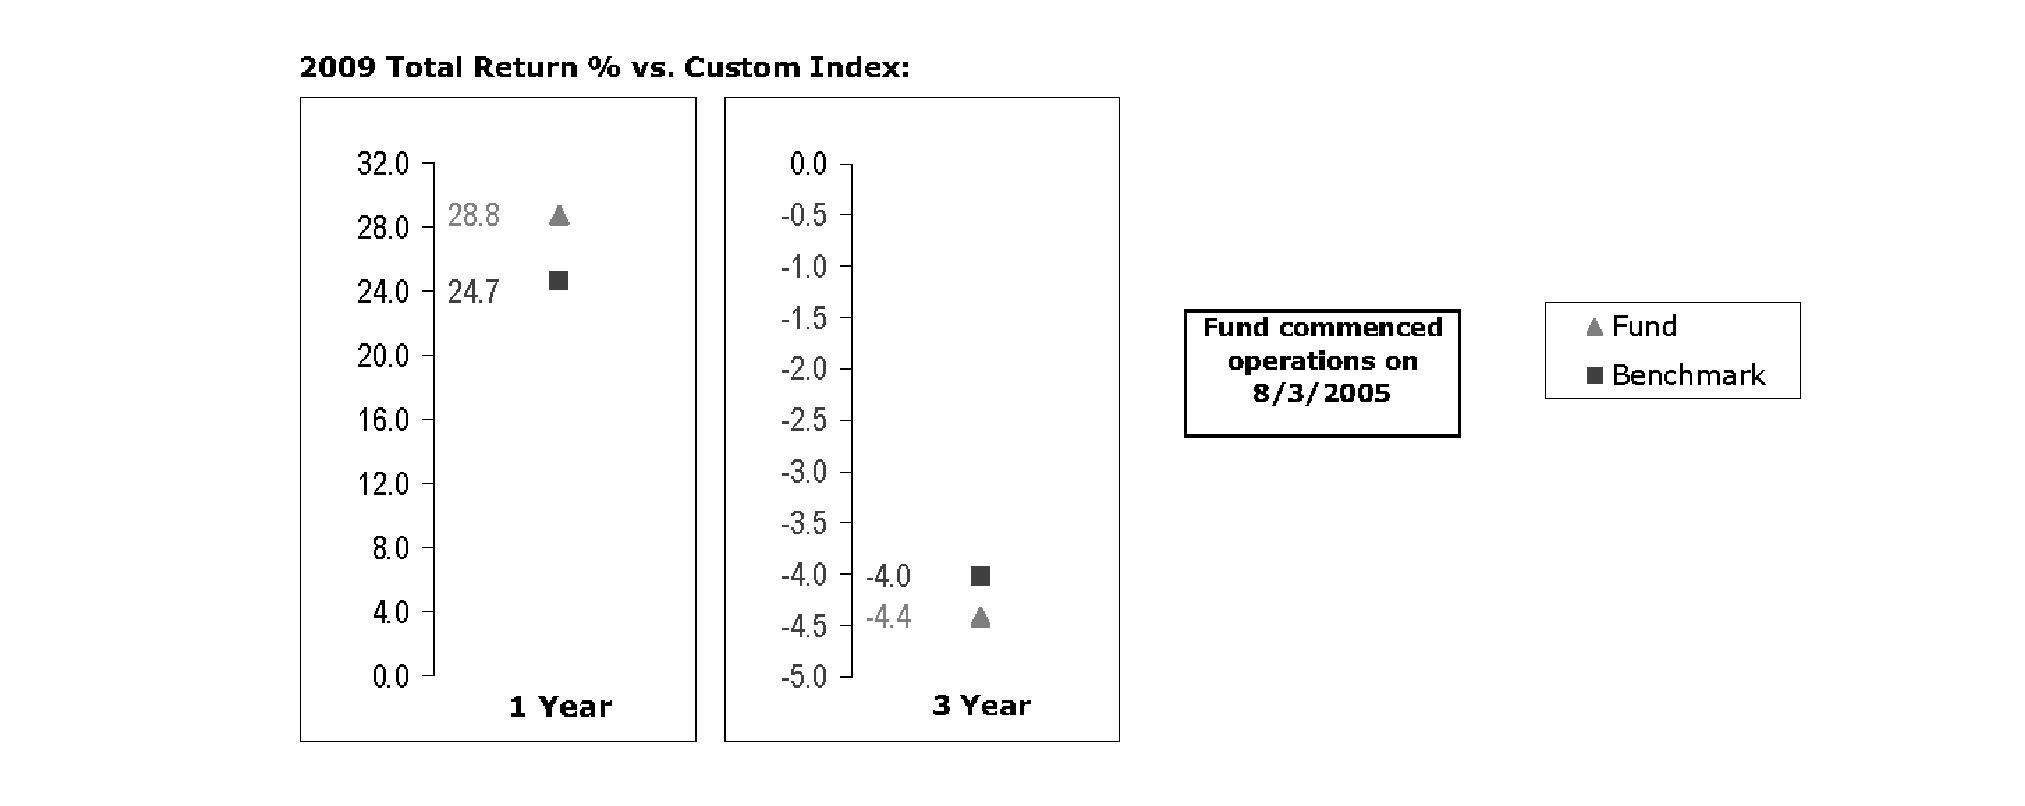
The Board noted that the investment performance of the fund compared favorably to its benchmark for the one-year period, although the fund's three-year cumulative total return was lower than its benchmark. The Board also reviewed the fund's performance since inception as well as performance in the current year.
Annual Report
Board Approval of Investment Advisory Contracts and Management Fees - continued
VIP Investor Freedom 2025 Portfolio
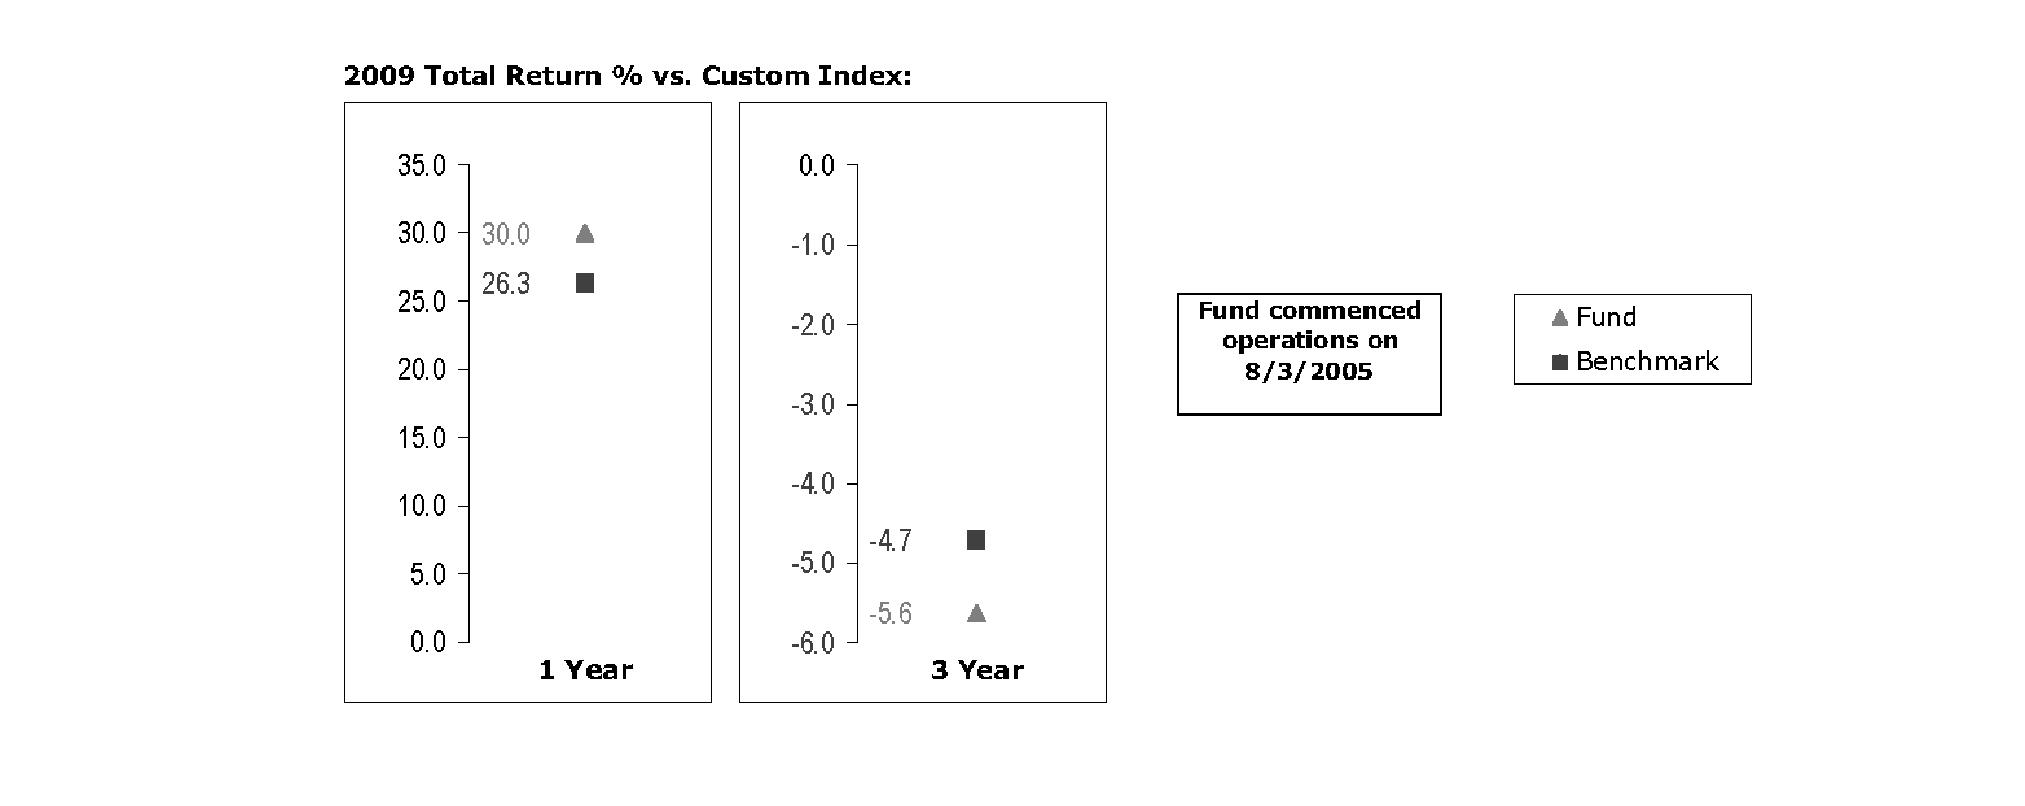
The Board noted that the investment performance of the fund compared favorably to its benchmark for the one-year period, although the fund's three-year cumulative total return was lower than its benchmark. The Board also reviewed the fund's performance since inception as well as performance in the current year.
VIP Investor Freedom 2030 Portfolio
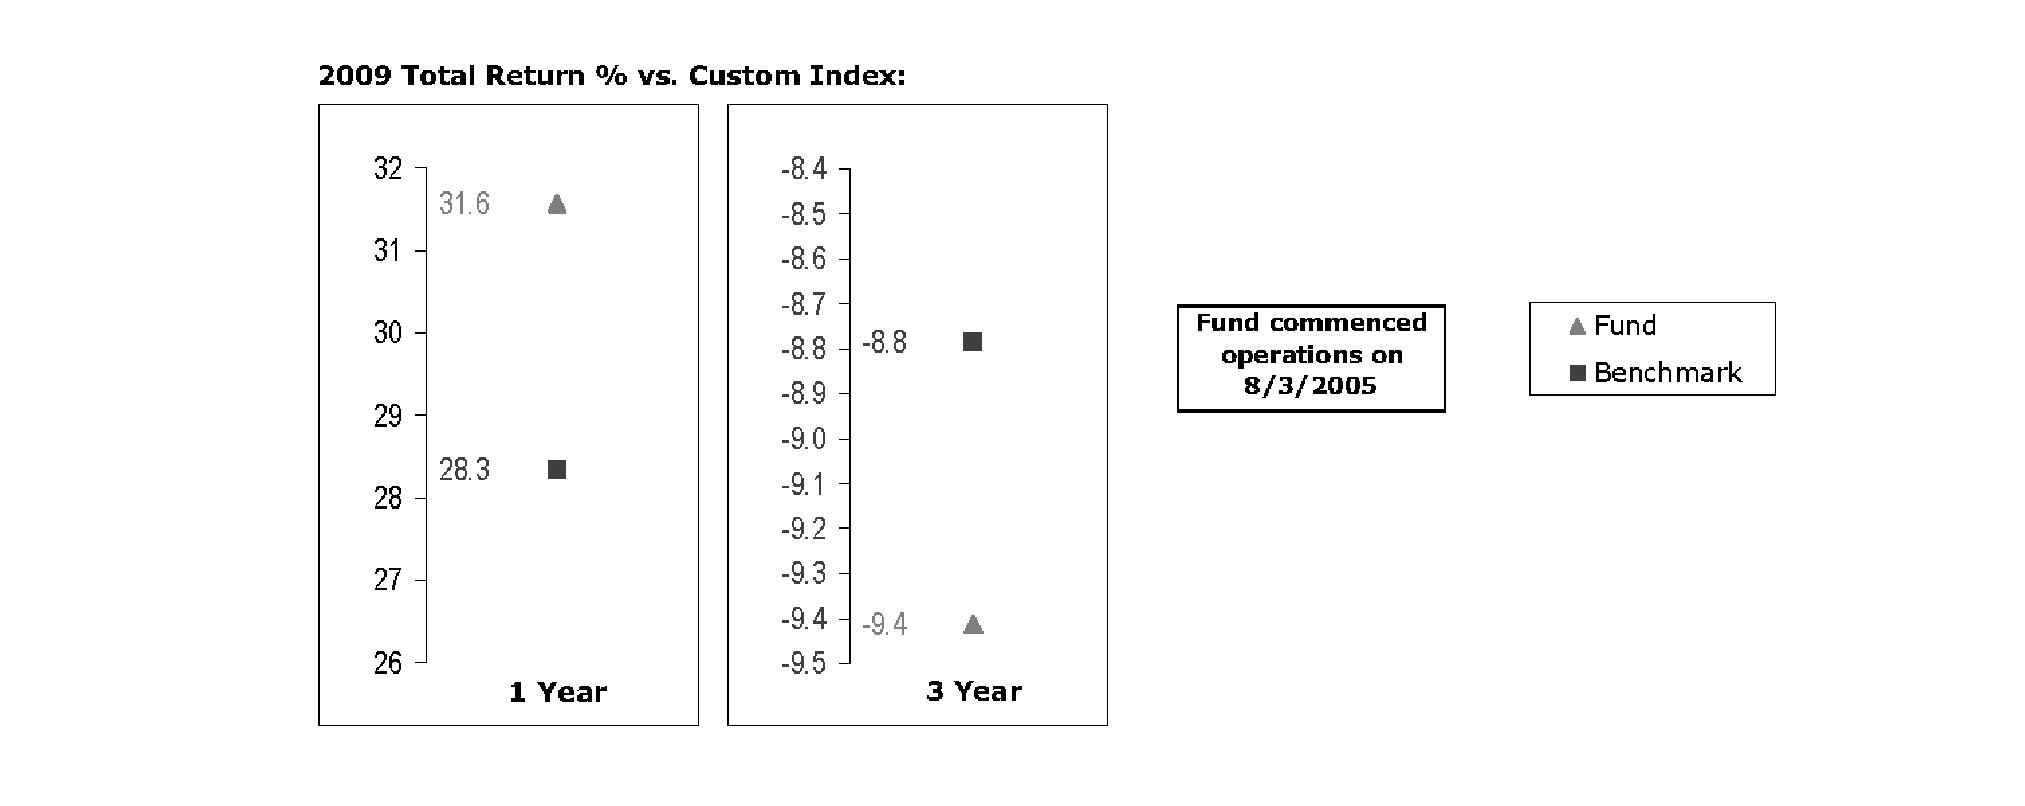
The Board noted that the investment performance of the fund compared favorably to its benchmark for the one-year period, although the fund's three-year cumulative total return was lower than its benchmark. The Board also reviewed the fund's performance since inception as well as performance in the current year.
Annual Report
VIP Investor Freedom Income Portfolio
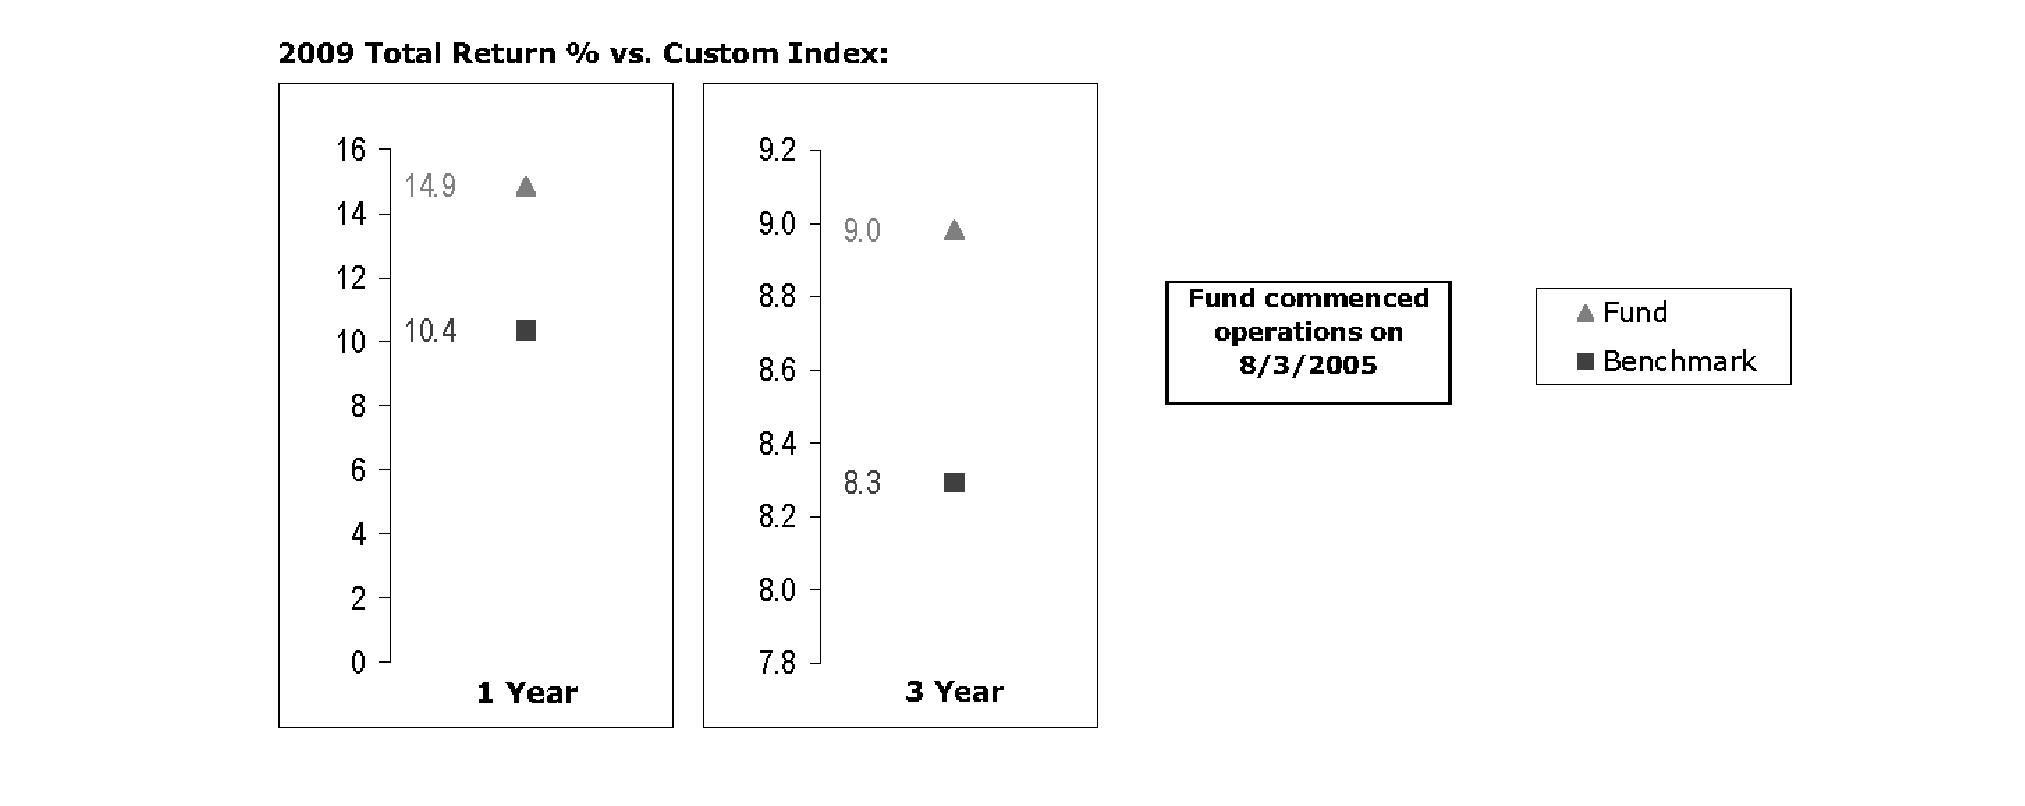
The Board noted that the investment performance of the fund compared favorably to its benchmark for all the periods shown. The Board also reviewed the fund's performance since inception as well as performance in the current year.
Based on its review, and giving particular weight to the nature and quality of the resources dedicated by Strategic Advisers and FMR to maintain and improve relative performance and factoring in the unprecedented market events in recent years, the Board concluded that the nature, extent, and quality of investment management and support services and of shareholder and administrative services provided to each fund will benefit each fund's shareholders, particularly in light of the Board's view that each fund's shareholders benefit from investing in a fund that is part of a large family of funds offering a variety of investment disciplines and services.
Competitiveness of Management Fee and Total Fund Expenses. The Board noted that the funds do not pay Strategic Advisers a management fee for investment advisory services. The Board considered each fund's management fee and total expenses (which include the fees and expenses of underlying funds) compared to "mapped groups" of competitive funds and classes. Fidelity creates "mapped groups" by combining similar Lipper investment objective categories that have comparable management fee characteristics. Combining Lipper investment objective categories aids the Board's management fee and total expense comparisons by broadening the competitive group used for comparison and by reducing the number of universes to which various Fidelity funds are compared.
Management Fee. The Board considered two proprietary management fee comparisons for the 12-month (or shorter) periods shown in the charts below. The group of Lipper funds used by the Board for management fee comparisons is referred to below as the "Total Mapped Group." The Total Mapped Group comparison focuses on a fund's standing relative to the total universe of comparable funds available to investors, in terms of gross management fees before expense reimbursements or caps. "TMG %" represents the percentage of funds in the Total Mapped Group that had management fees that were lower than a fund's. For example, a TMG % of 0% means that 100% of the funds in the Total Mapped Group had higher management fees than a fund. The "Asset-Size Peer Group" (ASPG) comparison focuses on a fund's standing relative to non-Fidelity funds similar in size to the fund within the Total Mapped Group. The ASPG represents at least 15% of the funds in the Total Mapped Group with comparable asset size and management fee characteristics, subject to a minimum of 50 funds (or all funds in the Total Mapped Group if fewer than 50). Additional information, such as the ASPG quartile in which a fund's management fee ranked, is also included in the charts and considered by the Board.
Annual Report
Board Approval of Investment Advisory Contracts and Management Fees - continued
VIP Investor Freedom 2005 Portfolio
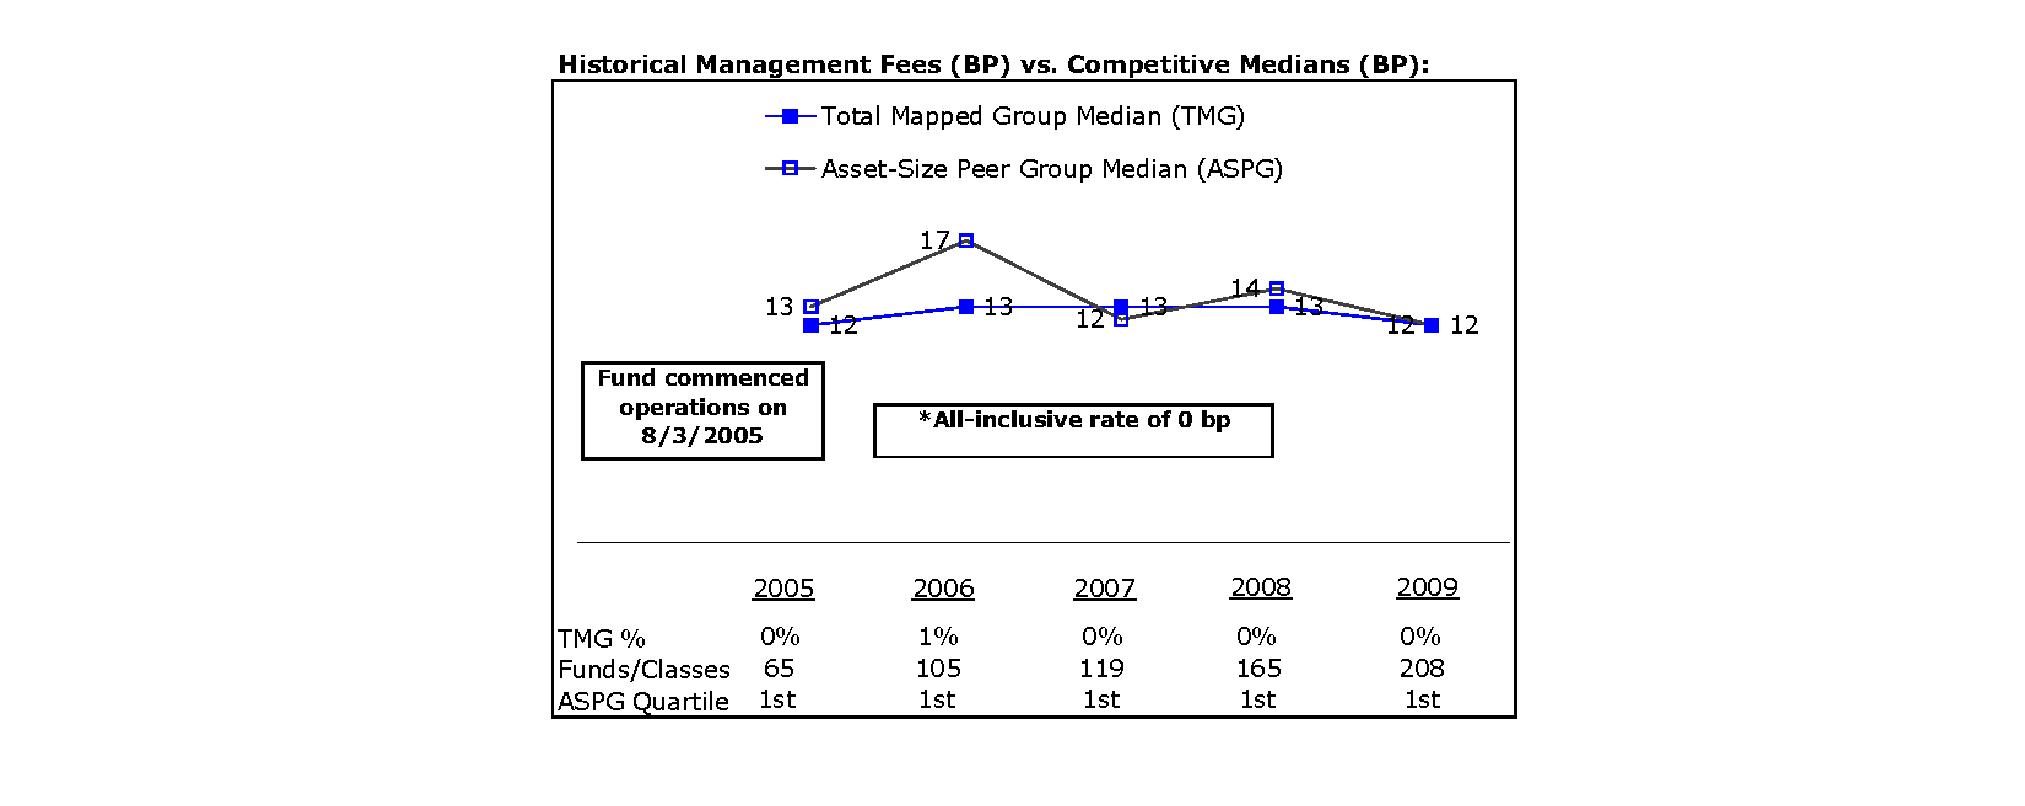
VIP Investor Freedom 2010 Portfolio
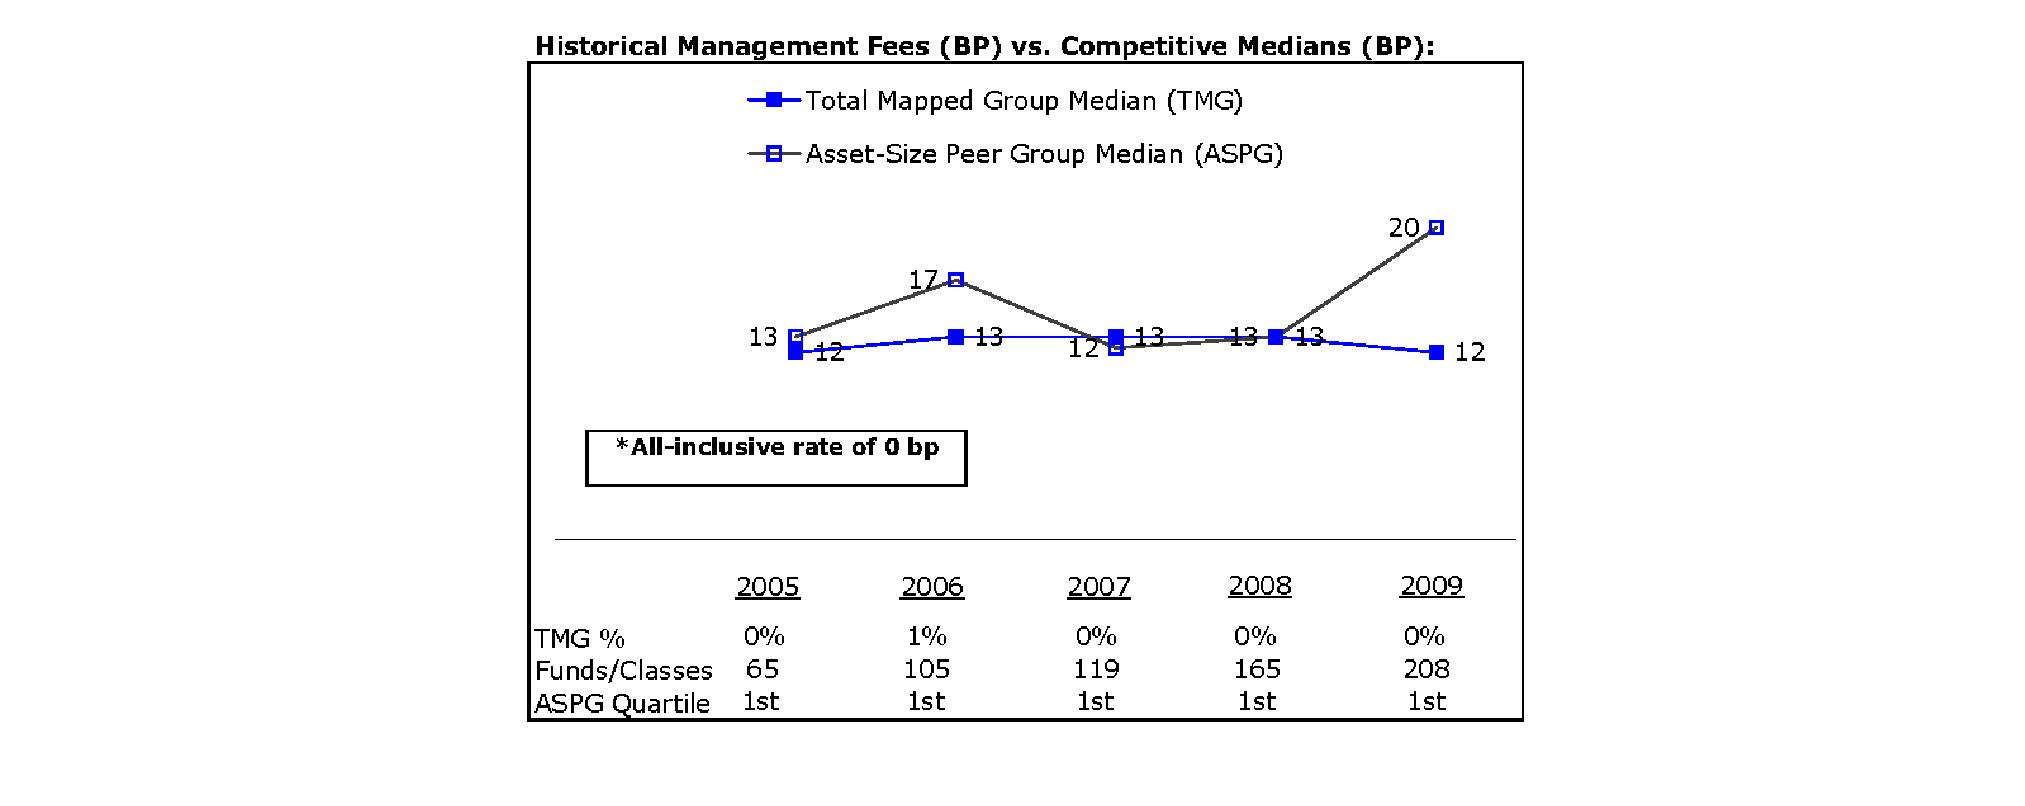
Annual Report
VIP Investor Freedom 2015 Portfolio
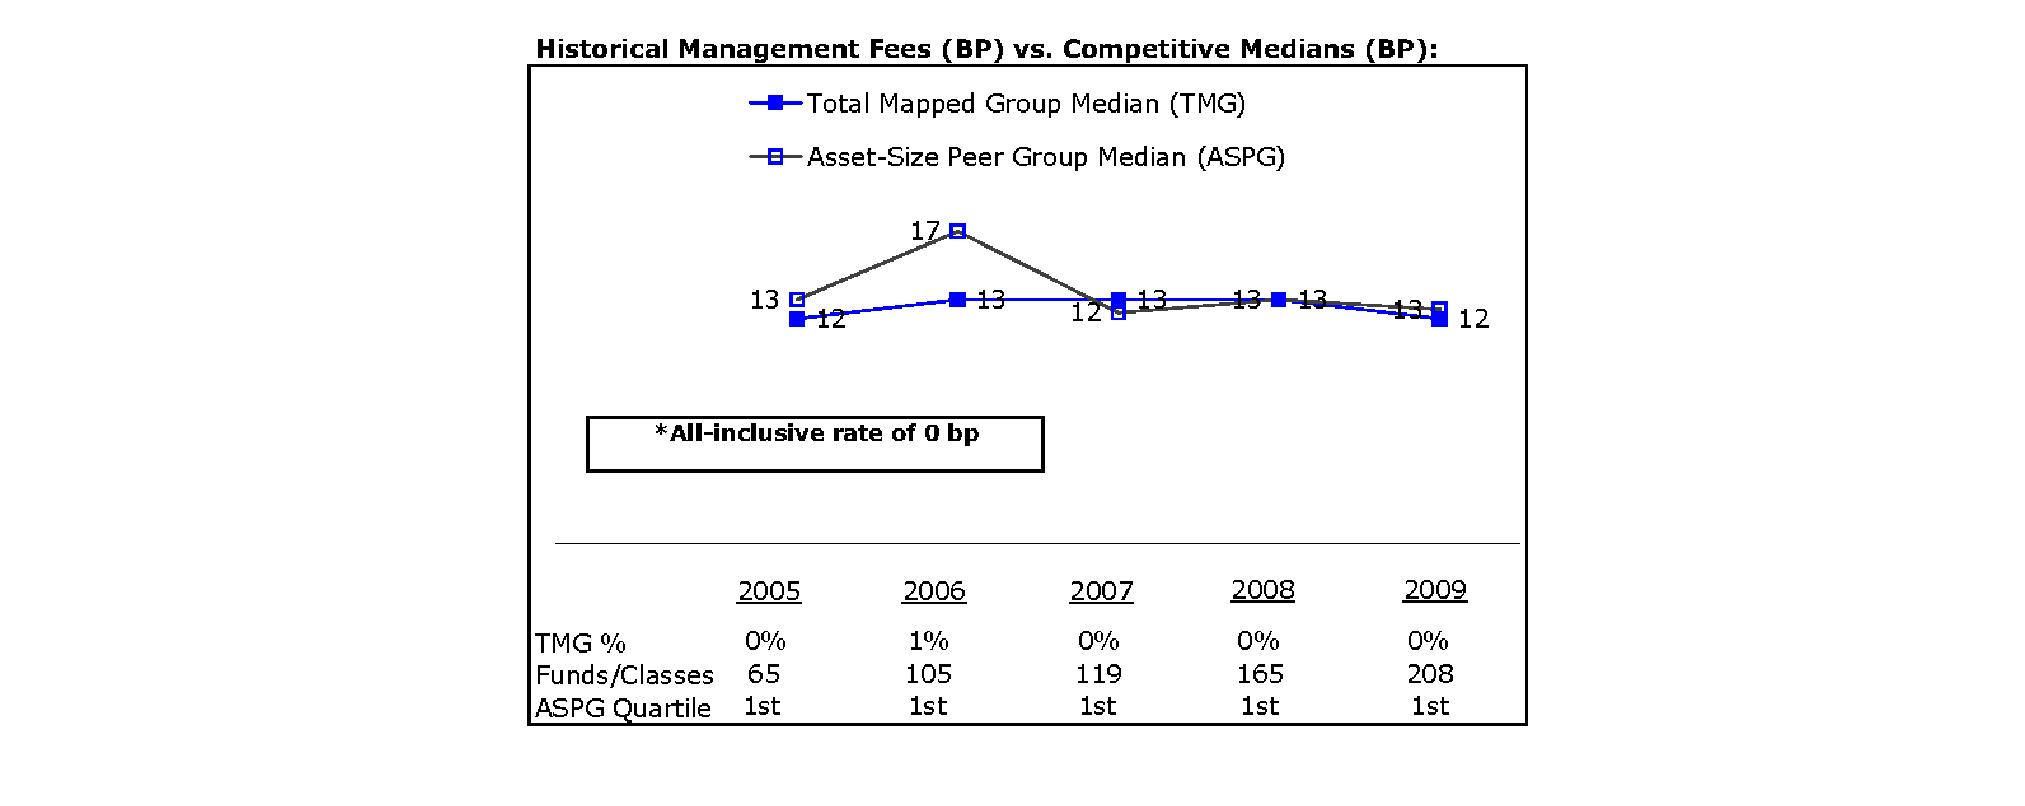
VIP Investor Freedom 2020 Portfolio
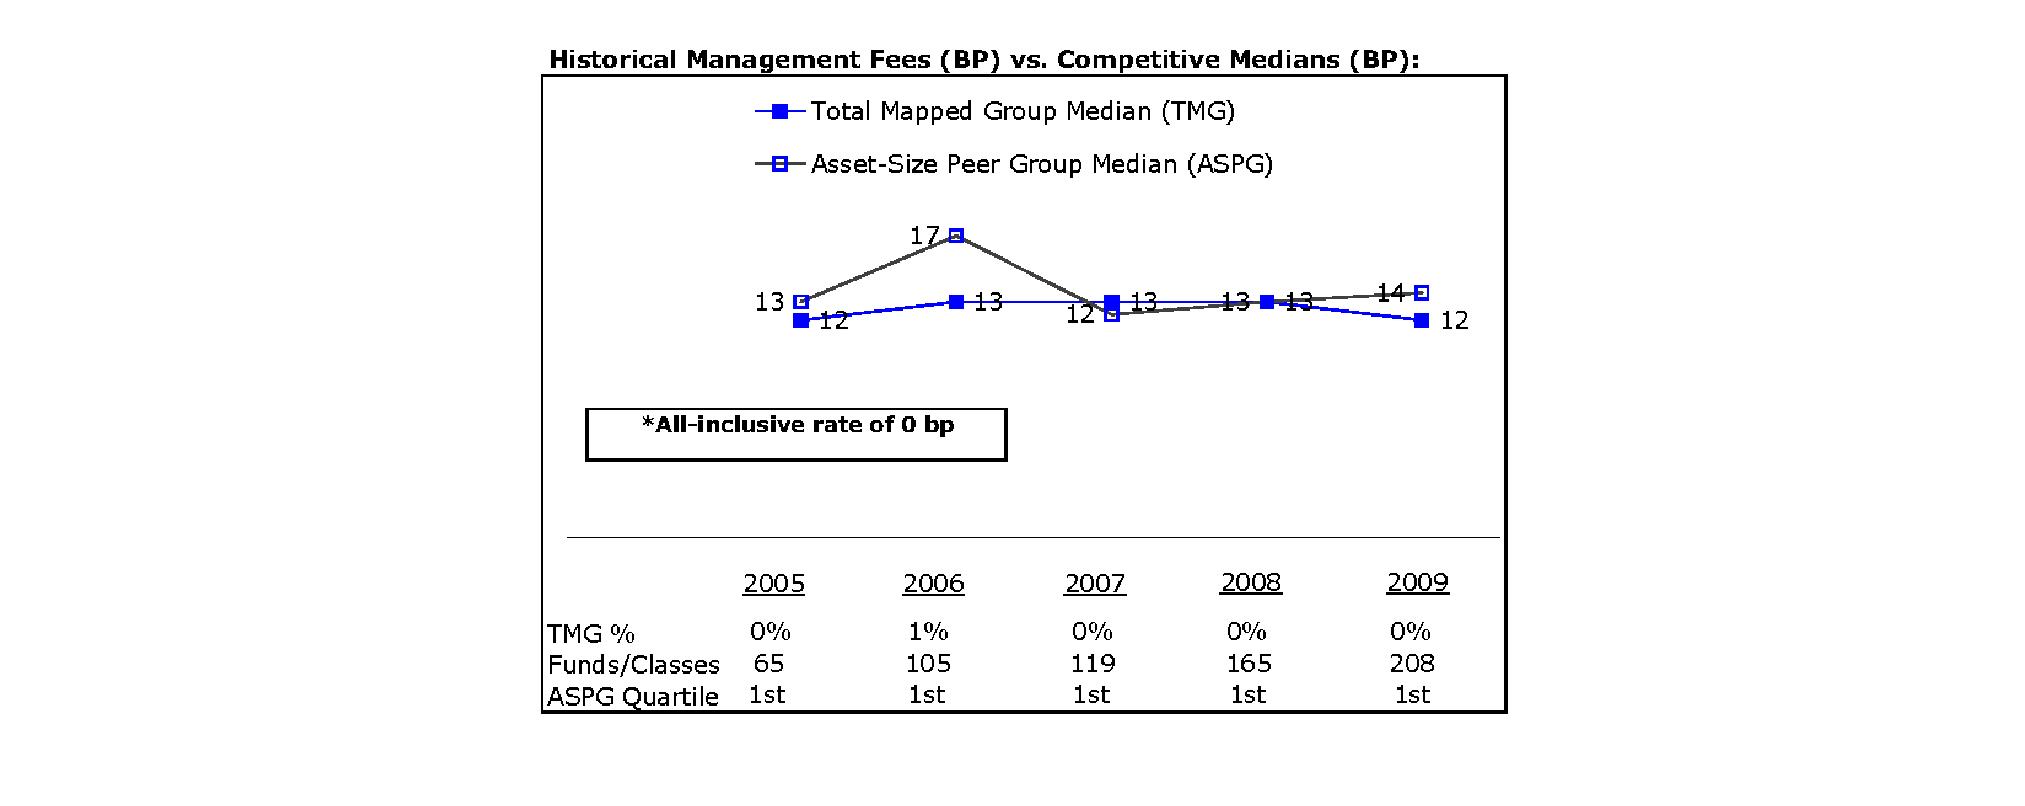
Annual Report
Board Approval of Investment Advisory Contracts and Management Fees - continued
VIP Investor Freedom 2025 Portfolio
VIP Investor Freedom 2030 Portfolio
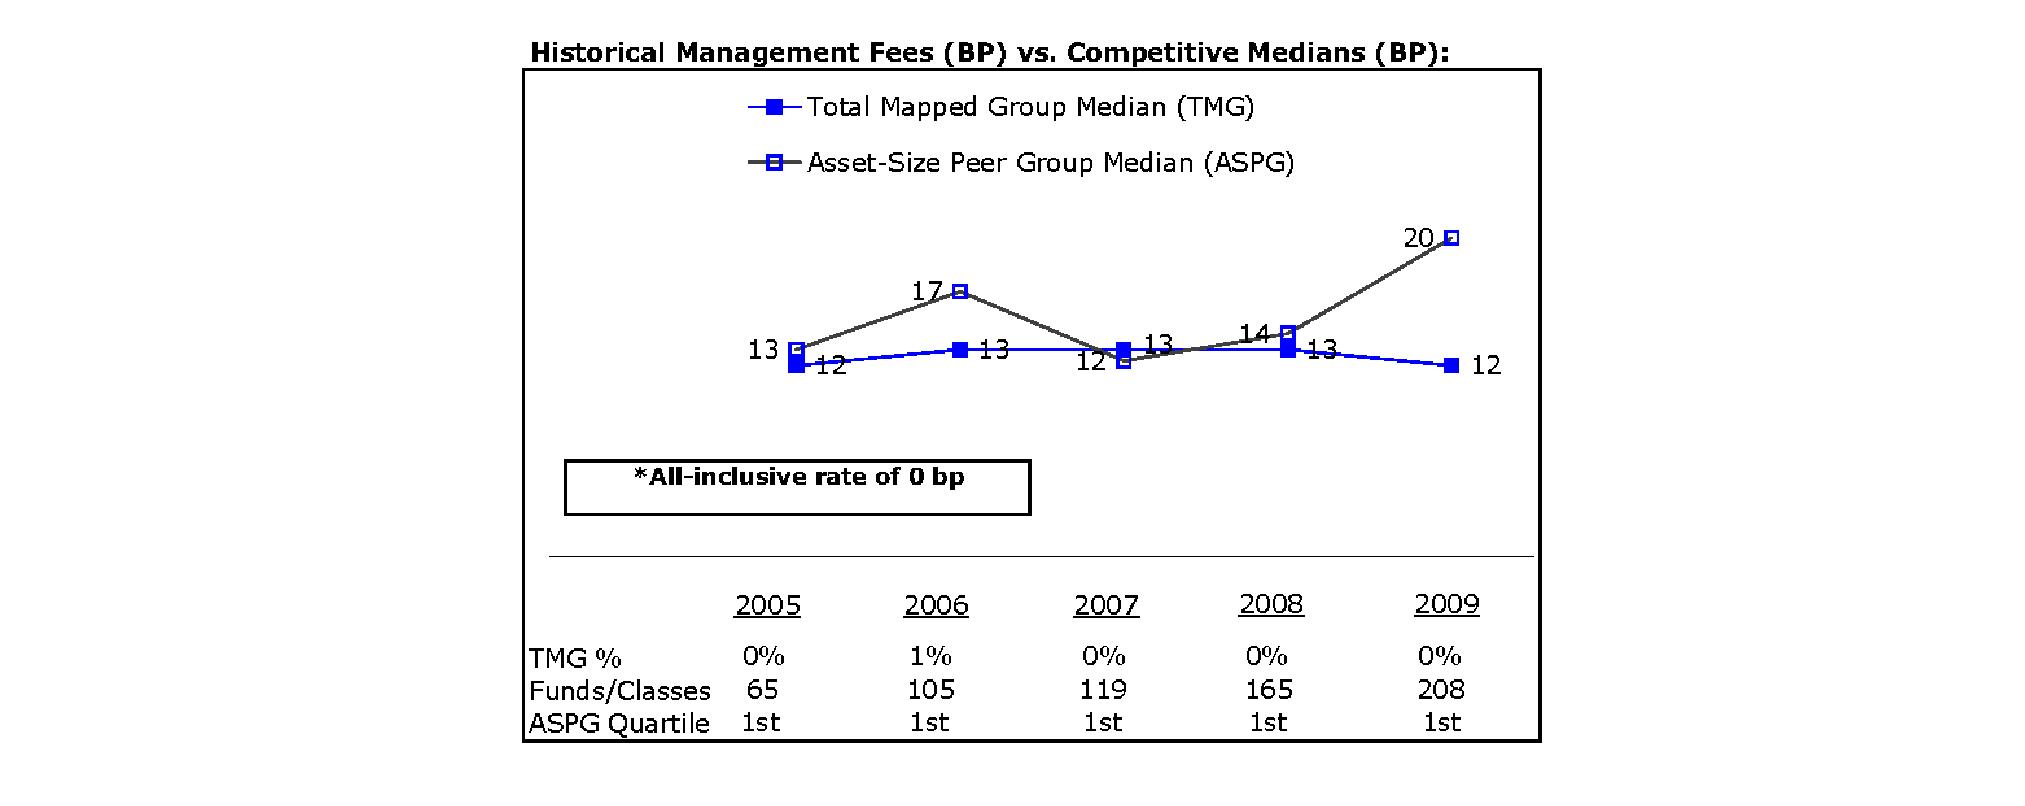
Annual Report
VIP Investor Freedom Income Portfolio
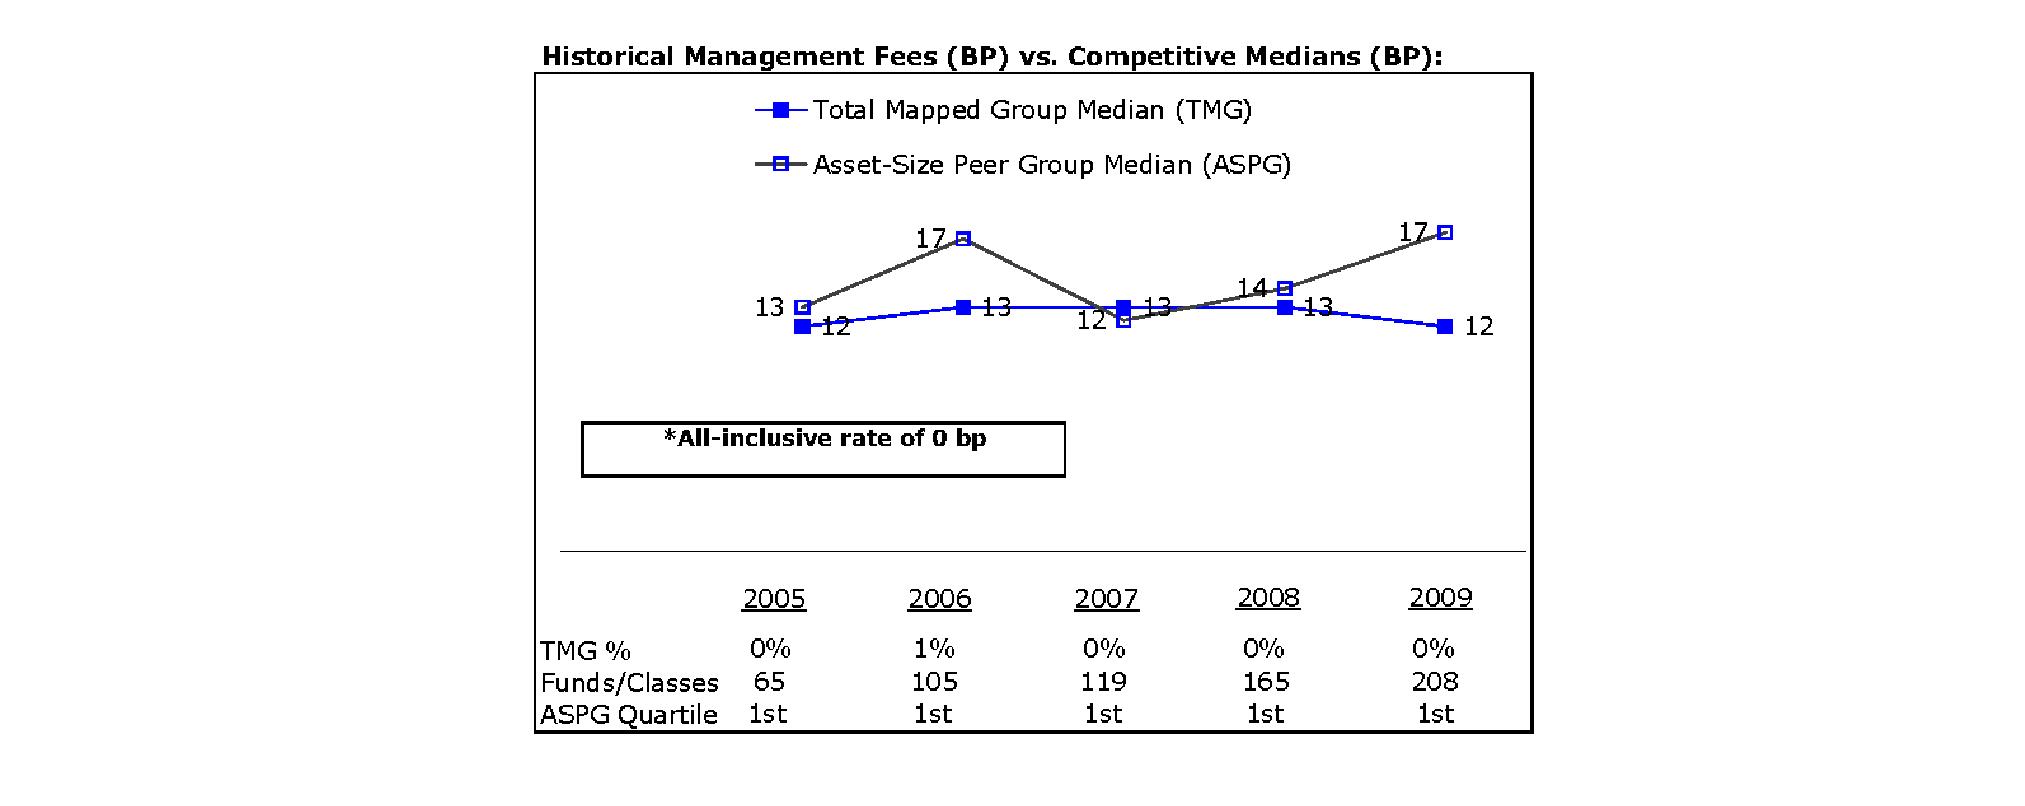
The Board noted that each fund's management fee ranked below the median of its Total Mapped Group and below the median of its ASPG for 2009.
Total Expenses. In its review of each fund's total expenses, the Board noted that each fund invests in Investor Class of the underlying fund to avoid charging fund-paid 12b-1 fees at both fund levels. The Board considered that the funds do not pay transfer agent fees. Instead, Investor Class of each underlying fund bears its pro rata portion of each fund's transfer agent fee according to the percentage of each fund's assets invested in that underlying fund. The Board further noted that FMR pays all other expenses of each fund, with limited exceptions.
The Board noted that each fund's total expenses ranked below its competitive median for 2009.
Fees Charged to Other Fidelity Clients. The Board also considered Fidelity fee structures and other information with respect to clients of FMR and its affiliates, such as other mutual funds advised or subadvised by FMR or its affiliates, pension plan clients, and other institutional clients. In March 2010, the Board created an ad hoc joint committee with the board of other Fidelity funds (the Committee) to review and compare Fidelity's institutional investment advisory business with its business of providing services to the Fidelity funds, including the differences in services provided, fees charged, and costs incurred, as well as competition in their respective marketplaces.
Based on its review of management fees, total expenses, and fees charged to other Fidelity clients, the Board concluded that each fund's management fee and the total expenses of each fund were fair and reasonable in light of the services that the fund and its shareholders receive and the other factors considered, including the findings of the Committee.
Costs of the Services and Profitability. The Board considered the level of Fidelity's profits in respect of all the Fidelity funds.
PricewaterhouseCoopers LLP (PwC), independent registered public accounting firm and auditor to Fidelity and certain Fidelity funds, has been engaged annually by the Board as part of the Board's assessment of Fidelity's profitability analysis. PwC's engagement includes the review and assessment of Fidelity's methodologies used in determining the revenues and expenses attributable to Fidelity's mutual fund business, and completion of agreed-upon procedures surrounding the mathematical accuracy of fund profitability and its conformity to allocation methodologies. After considering PwC's reports issued under the engagement and information provided by Fidelity, the Board believes that while other allocation methods may also be reasonable, Fidelity's profitability methodologies are reasonable in all material respects.
The Board has also reviewed Fidelity's non-fund businesses and fall-out benefits related to the mutual fund business as well as cases where Fidelity's affiliates may benefit from or be related to the funds' business.
The Board concluded that the costs of the services provided by and the profits realized by Fidelity in connection with the operation of each fund were not relevant to the renewal of each fund's Advisory Contracts because the funds do not pay management fees and FMR pays all other expenses of each fund, with limited exceptions.
Economies of Scale. The Board concluded that because the funds do not pay management fees and FMR pays all other expenses of each fund, with limited exceptions, economies of scale cannot be realized by the funds, but may be realized by the other Fidelity funds in which each fund invests.
Additional Information Requested by the Board. In order to develop fully the factual basis for consideration of the Fidelity funds' Advisory Contracts, the Board requested and received additional information on certain topics, including (i) fund performance trends, actions to be taken by FMR to improve certain funds' overall performance, and Fidelity's long-term strategies for certain funds; (ii) Fidelity's fund profitability methodology and profitability trends for certain funds; (iii) portfolio manager changes that have occurred during the past year and the amount of the investment that each portfolio manager has made in the Fidelity fund(s) that he or she manages; (iv) Fidelity's compensation structure for portfolio managers, research analysts, and other key personnel, including its effects on fund profitability, the rationale for the compensation structure, and the extent to which current market conditions have affected retention and recruitment; (v) the compensation paid by FMR to fund sub-advisers on behalf of the Fidelity funds; (vi) Fidelity's fee structures and rationale for recommending different fees among different categories of funds and classes, as well as Fidelity's voluntary waiver of fees to maintain minimum yields for certain funds and classes; (vii) the rationale for any differences between fund fee structures and fee structures in place for other Fidelity clients; and (viii) explanations regarding the relative total expenses borne by certain funds and classes, total expense competitive trends, and actions that might be taken by FMR to reduce total expenses for certain funds and classes or to achieve further economies of scale.
Annual Report
Board Approval of Investment Advisory Contracts and Management Fees - continued
Based on its evaluation of all of the conclusions noted above, and after considering all factors it believed relevant, the Board ultimately concluded that the advisory fee structures are fair and reasonable, and that each fund's Advisory Contracts should be renewed.
Annual Report
Investment Adviser
Strategic Advisers, Inc.
Boston, MA
General Distributor
Fidelity Distributors Corporation
Boston, MA
Transfer and Service Agents
Fidelity Investments Institutional Operations Company, Inc.
Boston, MA
Fidelity Service Company, Inc.
Boston, MA
Custodian
The Bank of New York Mellon
New York, NY
VIPIFF-ANN-0211
1.814507.105
Fidelity® Variable Insurance Products:
Investment Grade Bond Portfolio
Annual Report
December 31, 2010
(2_fidelity_logos) (Registered_Trademark)
Contents
Performance | <Click Here> | How the fund has done over time. |
Management's Discussion of Fund Performance | <Click Here> | The Portfolio Manager's review of fund performance and strategy. |
Shareholder Expense Example | <Click Here> | An example of shareholder expenses. |
Investment Changes | <Click Here> | A summary of major shifts in the fund's investments over the past six months. |
Investments | <Click Here> | A complete list of the fund's investments with their market values. |
Financial Statements | <Click Here> | Statements of assets and liabilities, operations, and changes in net assets, as well as financial highlights. |
Notes | <Click Here> | Notes to the financial statements. |
Report of Independent Registered Public Accounting Firm | <Click Here> | |
Trustees and Officers | <Click Here> | |
Distributions | <Click Here> | |
Board Approval of Investment Advisory Contracts and Management Fees | <Click Here> | |
Fidelity VIP Investment Grade Central Fund Financial Statements | <Click Here> | Complete list of investments and financial statements for
Fidelity VIP Investment Grade Central Fund. |
To view a fund's proxy voting guidelines and proxy voting record for the 12-month period ended June 30, visit http://www.fidelity.com/proxyvotingresults or visit the Securities and Exchange Commission's (SEC) web site at http://www.sec.gov. You may also call 1-877-208-0098 to request a free copy of the proxy voting guidelines.
Fidelity Variable Insurance Products are separate account options which are purchased through a variable insurance contract.
Standard & Poor's, S&P and S&P 500 are registered service marks of The McGraw-Hill Companies, Inc. and have been licensed for use by Fidelity Distributors Corporation.
Other third party marks appearing herein are the property of their respective owners.
All other marks appearing herein are registered or unregistered trademarks or service marks of FMR LLC or an affiliated company.
The general research services agreement with Fidelity Research & Analysis Company has been terminated and is no longer in effect for the fund.
This report and the financial statements contained herein are submitted for the general information of the shareholders of the fund. This report is not authorized for distribution to prospective investors in the fund unless preceded or accompanied by an effective prospectus.
A fund files its complete schedule of portfolio holdings with the SEC for the first and third quarters of each fiscal year on Form N-Q. Forms N-Q are available on the SEC's web site at http://www.sec.gov. A fund's Forms N-Q may be reviewed and copied at the SEC's Public Reference Room in Washington, DC. Information regarding the operation of the SEC's Public Reference Room may be obtained by calling 1-800-SEC-0330. For a complete list of a fund's portfolio holdings, view the most recent holdings listing, semiannual report, or annual report on Fidelity's web site at http://www.fidelity.com, http://www.advisor.fidelity.com, or http://www.401k.com, as applicable.
NOT FDIC INSURED • MAY LOSE VALUE • NO BANK GUARANTEE
Neither the fund nor Fidelity Distributors Corporation is a bank.
Annual Report
Average annual total return reflects the change in the value of an investment, assuming reinvestment of the class' distributions from dividend income and capital gains (the profits earned upon the sale of securities that have grown in value, if any) and assuming a constant rate of performance each year. During periods of reimbursement by Fidelity, a fund's total return will be greater than it would be had the reimbursement not occurred. Performance numbers are net of all underlying fund operating expenses, but do not include any insurance charges imposed by your insurance company's separate account. If performance information included the effect of these additional charges, the total returns would have been lower. How a fund did yesterday is no guarantee of how it will do tomorrow.
Average Annual Total Returns
Periods ended December 31, 2010 | Past 1
year | Past 5
years | Past 10
years |
VIP Investment Grade Bond Portfolio - Initial Class | 7.80% | 5.62% | 5.85% |
VIP Investment Grade Bond Portfolio - Service Class | 7.68% | 5.53% | 5.74% |
VIP Investment Grade Bond Portfolio - Service Class 2 | 7.55% | 5.38% | 5.59% |
VIP Investment Grade Bond Portfolio - Investor Class A | 7.79% | 5.60% | 5.84% |
A The initial offering of Investor Class shares took place on July 21, 2005. Returns prior to July 21, 2005 are those of Initial Class. Had Investor Class's transfer agent fee been reflected, returns prior to July 21, 2005 would have been lower.
$10,000 Over 10 Years
Let's say hypothetically that $10,000 was invested in VIP Investment Grade Bond Portfolio - Initial Class on December 31, 2000. The chart shows how the value of your investment would have changed, and also shows how the Barclays Capital® U.S. Aggregate Bond Index performed over the same period.
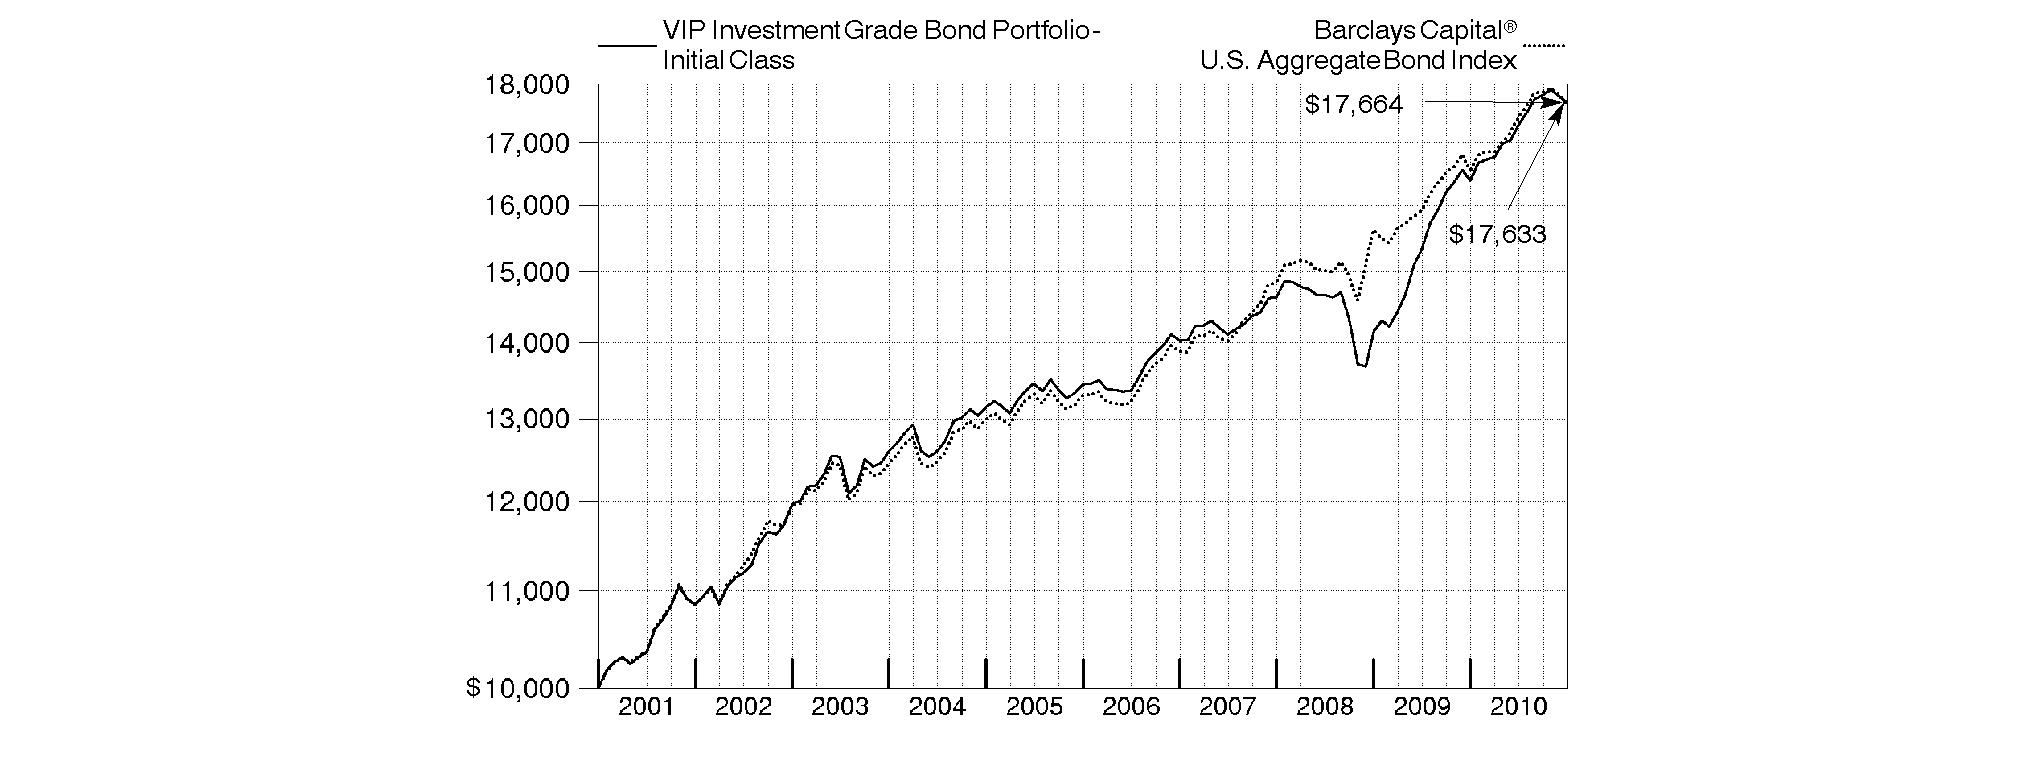
Annual Report
Market Recap: While market improvements around the world hit a speed bump in the first half of the 12-month period ending December 31, 2010, world economies re-accelerated in August, supported by a broadening recovery and low inflation in the U.S. Domestic stock markets recorded solid gains for the year, lifted by a strong second-half rally fueled by economic optimism, encouraging earnings reports and a wave of corporate mergers. The large-cap S&P 500® Index rose 15.06%, the blue-chip-laden Dow Jones Industrial AverageSM added 14.06% and the technology-heavy Nasdaq Composite® Index climbed 18.02%. Meanwhile, international stocks, as represented by the MSCI® ACWI® (All Country World Index) ex USA Index, gained 11.29%, boosted in part by a depreciating U.S. dollar. In the fixed-income arena, U.S. taxable investment-grade bonds generated positive results during 2010, as the Barclays Capital® U.S. Aggregate Bond Index gained 6.54%. With ultra-low interest rates bolstering nearly all fixed-income securities for most of the year, sectors in the index with higher yields and more credit risk generally fared best, while most high-quality bonds generated more-moderate returns. Meanwhile, high-yield bonds, as represented by The BofA Merrill LynchSM US High Yield Constrained Index, returned 15.07%, a result of improved economic data and strengthening investor demand. Overseas, foreign bond markets showed mixed results, with a sizable disparity between the 3.97% return of the Citigroup® Non-U.S. Group of 7 Index - which measures the performance of sovereign debt of the major global economies outside the U.S. - and the 12.04% advance of the JPMorgan Emerging Markets Bond Index Global (EMBI Global), which benefited from the rising overall credit quality of emerging-markets debt issuers.
Comments from Ford O'Neil, Portfolio Manager of VIP Investment Grade Bond Portfolio: For the year, the fund's share classes outperformed the Barclays Capital® U.S. Aggregate Bond Index. By way of review, virtually all of the fund's assets were invested in VIP Investment Grade Central Fund, which I also manage, with the remainder invested in individual securities, short-term repurchase agreements and Fidelity® Specialized High Income Central Fund. This discussion of the fund's performance reflects its holdings in aggregate, including the underlying central funds and other investments I just mentioned. Sector selection was a key factor behind the fund's outperformance. Significant overweightings in higher-yielding, riskier segments of the investment-grade bond market, including commercial mortgage-backed securities and investment-grade corporate bonds, proved beneficial because they substantially outpaced both the index and most high-quality federal-government-backed categories - including Treasuries, mortgage-backed securities and government agency debentures - in which the fund was underweighted. Elsewhere, the fund's out-of-index stake in collateralized mortgage obligations and high-yield corporates also proved advantageous. Security selection overall was a plus. Among corporates, a large overweighting in financials was particularly helpful. In the mortgage segment, the fund's focus on securities with some measure of protection against prepayment proved beneficial. Additionally, investments in TIPS bolstered relative performance. Detracting from performance was the fund's small exposure to European corporate bonds. These securities faltered amid growing concerns about the debt woes of many countries on the continent. During the period, I sold some corporate bonds based on valuation concerns.
The views expressed above reflect those of the portfolio manager(s) only through the end of the period as stated on the cover of this report and do not necessarily represent the views of Fidelity or any other person in the Fidelity organization. Any such views are subject to change at any time based upon market or other conditions and Fidelity disclaims any responsibility to update such views. These views may not be relied on as investment advice and, because investment decisions for a Fidelity fund are based on numerous factors, may not be relied on as an indication of trading intent on behalf of any Fidelity fund.
Annual Report
As a shareholder of the Fund, you incur two types of costs: (1) transaction costs, and (2) ongoing costs, including management fees, distribution and/or service (12b-1) fees and other Fund expenses. This Example is intended to help you understand your ongoing costs (in dollars) of investing in the Fund and to compare these costs with the ongoing costs of investing in other mutual funds.
The Example is based on an investment of $1,000 invested at the beginning of the period and held for the entire period (July 1, 2010 to December 31, 2010).
Actual Expenses
The first line of the accompanying table for each class of the Fund provides information about actual account values and actual expenses. You may use the information in this line, together with the amount you invested, to estimate the expenses that you paid over the period. Simply divide your account value by $1,000.00 (for example, an $8,600 account value divided by $1,000.00 = 8.6), then multiply the result by the number in the first line for a class of the Fund under the heading entitled "Expenses Paid During Period" to estimate the expenses you paid on your account during this period. The estimate of expenses does not include any fees or other expenses of any variable annuity or variable life insurance product. If they were, the estimate of expenses you paid during the period would be higher, and your ending account value would be lower. In addition, the Fund, as a shareholder in the underlying Fidelity Central Funds, will indirectly bear its pro-rata share of the fees and expenses incurred by the underlying Fidelity Central Funds. These fees and expenses are not included in the Fund's annualized expense ratio used to calculate the expense estimate in the table below.
Hypothetical Example for Comparison Purposes
The second line of the accompanying table for each class of the Fund provides information about hypothetical account values and hypothetical expenses based on a Class' actual expense ratio and an assumed rate of return of 5% per year before expenses, which is not the Class' actual return. The hypothetical account values and expenses may not be used to estimate the actual ending account balance or expenses you paid for the period. You may use this information to compare the ongoing costs of investing in the Fund and other funds. To do so, compare this 5% hypothetical example with the 5% hypothetical examples that appear in the shareholder reports of the other funds. The estimate of expenses does not include any fees or other expenses of any variable annuity or variable life insurance product. If they were, the estimate of expenses you paid during the period would be higher, and your ending account value would be lower. In addition, the Fund, as a shareholder in the underlying Fidelity Central Funds, will indirectly bear its pro-rata share of the fees and expenses incurred by the underlying Fidelity Central Funds. These fees and expenses are not included in the Fund's annualized expense ratio used to calculate the expense estimate in the table below.
Please note that the expenses shown in the table are meant to highlight your ongoing costs only and do not reflect any transaction costs. Therefore, the second line of the table is useful in comparing ongoing costs only, and will not help you determine the relative total costs of owning different funds.
| Annualized Expense Ratio | Beginning
Account Value
July 1, 2010 | Ending
Account Value
December 31, 2010 | Expenses Paid
During Period*
July 1, 2010 to
December 31, 2010 |
Initial Class | .41% | | | |
Actual | | $ 1,000.00 | $ 1,020.80 | $ 2.09 |
Hypothetical A | | $ 1,000.00 | $ 1,023.14 | $ 2.09 |
Service Class | .51% | | | |
Actual | | $ 1,000.00 | $ 1,020.70 | $ 2.60 |
Hypothetical A | | $ 1,000.00 | $ 1,022.63 | $ 2.60 |
Service Class 2 | .65% | | | |
Actual | | $ 1,000.00 | $ 1,020.50 | $ 3.31 |
Hypothetical A | | $ 1,000.00 | $ 1,021.93 | $ 3.31 |
Investor Class | .45% | | | |
Actual | | $ 1,000.00 | $ 1,021.30 | $ 2.29 |
Hypothetical A | | $ 1,000.00 | $ 1,022.94 | $ 2.29 |
A 5% return per year before expenses
* Expenses are equal to each Class' annualized expense ratio, multiplied by the average account value over the period, multiplied by 184/365 (to reflect the one-half year period). The fees and expenses of the underlying Fidelity Central Funds in which the Fund invests are not included in the Fund's annualized expense ratio.
Annual Report
Investment Changes (Unaudited)
Quality Diversification (% of fund's net assets) |
As of December 31, 2010 | As of June 30, 2010 |
| U.S. Government and U.S. Government Agency
Obligations† 69.8% | | | U.S. Government and U.S. Government Agency
Obligations† 56.3% | |
 | AAA 7.8% | |  | AAA 7.5% | |
 | AA 2.2% | | | AA 3.0% | |
 | A 7.6% | | | A 7.9% | |
 | BBB 13.2% | | | BBB 12.7% | |
 | BB and Below 5.8% | | | BB and Below 4.7% | |
| Not Rated 0.1% | |  | Not Rated 0.2% | |
 | Short-Term Investments and
Net Other Assets*** (6.5)% | | | Short-Term Investments and
Net Other Assets 7.7% | |

We have used ratings from Moody's Investors Service, Inc. Where Moody's® ratings are not available, we have used S&P® ratings. All ratings are as of the report date and do not reflect subsequent changes. Securities rated BB or below were rated investment grade at the time of acquisition. The information in the above table is based on the combined investments of the fund and its pro-rata share of the investments of Fidelity's fixed-income central fund. |
Weighted Average Maturity as of December 31, 2010 |
| | 6 months ago |
Years | 6.1 | 6.1 |
This is a weighted average of all the maturities of the securities held in a fund. WAM can be used as a measure of sensitivity to interest rate changes and markets changes. Generally, the longer the maturity, the greater the sensitivity to such changes. WAM is based on the dollar-weighted average length of time until principal payments must be paid. Depending on the types of securities held in a fund, certain maturity shortening devices (e.g., demand features, interest rate resets, and call options) may be taken into account when calculating the WAM. |
Duration as of December 31, 2010 |
| | 6 months ago |
Years | 4.5 | 3.8 |
Duration shows how much a bond fund's price fluctuates with changes in comparable interest rates. If rates rise 1%, for example, a fund with a five-year duration is likely to lose about 5% of its value. Other factors also can influence a bond fund's performance and share price. Accordingly, a bond fund's actual performance may differ from this example. |
Asset Allocation (% of fund's net assets) |
As of December 31, 2010* | As of June 30, 2010** |
| Corporate Bonds 24.7% | | | Corporate Bonds 24.2% | |
| U.S. Government and
U.S. Government Agency
Obligations† 69.8% | | | U.S. Government and
U.S. Government Agency
Obligations† 56.3% | |
| Asset-Backed Securities 2.6% | | | Asset-Backed Securities 2.3% | |
| CMOs and Other
Mortgage Related Securities 8.9% | | | CMOs and Other
Mortgage Related Securities 8.9% | |
| Municipal Bonds 0.3% | | | Municipal Bonds 0.3% | |
| Other Investments 0.2% | | | Other Investments 0.3% | |
| Short-Term Investments
and Net Other Assets*** (6.5)% | | | Short-Term Investments
and Net Other Assets 7.7% | |
* Foreign investments | 3.3% | | ** Foreign investments | 4.7% | |
* Futures and Swaps | 2.4% | | ** Futures and Swaps | 2.2% | |

*** Short-Term Investments and Net Other Assets are not included in the pie chart.
† Includes FDIC Guaranteed Corporate Securities.
A holdings listing for the Fund, which presents direct holdings as well as the pro-rata share of any securities and other investments held indirectly through its investment in underlying non-money market Fidelity Central Funds is available at advisor.fidelity.com. Fidelity VIP Investment Grade Central Fund's holdings and financial statements are included at the end of this report.
Annual Report
Investments December 31, 2010
Showing Percentage of Net Assets
Fixed-Income Central Funds - 97.7% |
| Shares | | Value |
INVESTMENT GRADE FIXED-INCOME FUNDS - 95.8% |
Fidelity VIP Investment Grade Central Fund (d) | 26,810,456 | | $ 2,820,191,876 |
HIGH YIELD FIXED-INCOME FUNDS - 1.9% |
Fidelity Specialized High Income Central Fund (c) | 554,410 | | 55,590,665 |
TOTAL FIXED-INCOME CENTRAL FUNDS (Cost $2,810,844,569) | 2,875,782,541 |
Nonconvertible Bonds - 0.1% |
| Principal Amount | | |
CONSUMER STAPLES - 0.1% |
Beverages - 0.1% |
FBG Finance Ltd. 5.125% 6/15/15 (a) (Cost $1,447,860) | | $ 1,750,000 | | 1,857,118 |
Asset-Backed Securities - 0.2% |
|
Advanta Business Card Master Trust Series 2007-D1 Class D, 1.6606% 1/22/13 (a)(b) | | 1,800,000 | | 18,000 |
AmeriCredit Prime Automobile Receivables Trust Series 2007-1 Class E, 6.96% 3/8/16 (a) | | 968,234 | | 940,041 |
Ford Credit Auto Owner Trust: | | | | |
Series 2006-C Class D, 6.89% 5/15/13 (a) | | 725,000 | | 744,747 |
Series 2007-A Class D, 7.05% 12/15/13 (a) | | 425,000 | | 446,838 |
National Collegiate Student Loan Trust: | | | | |
Series 2004-2 Class AIO, 9.75% 10/25/14 (e) | | 1,830,000 | | 269,925 |
Series 2006-1 Class AIO, 5.5% 4/25/11 (e) | | 4,087,648 | | 51,987 |
Series 2006-2 Class AIO, 6% 8/25/11 (e) | | 2,030,000 | | 60,009 |
Series 2006-3 Class AIO, 7.1% 1/25/12 (e) | | 10,830,000 | | 595,650 |
Series 2006-4 Class AIO, 6.35% 2/27/12 (e) | | 7,800,000 | | 489,609 |
Series 2007-1 Class AIO, 7.27% 4/25/12 (e) | | 9,280,000 | | 788,800 |
Series 2007-2 Class AIO, 6.7% 7/25/12 (e) | | 6,820,000 | | 635,870 |
|
| Principal Amount | | Value |
Specialty Underwriting & Residential Finance Trust Series 2006-AB2 Class N1, 5.75% 6/25/37 (a) | | $ 180,261 | | $ 0 |
Wachovia Auto Loan Owner Trust Series 2006-2A Class E, 7.05% 5/20/14 (a) | | 1,175,000 | | 1,193,044 |
TOTAL ASSET-BACKED SECURITIES (Cost $8,033,409) | 6,234,520 |
Collateralized Mortgage Obligations - 0.9% |
|
Private Sponsor - 0.9% |
CWALT, Inc.: | | | | |
floater Series 2005-56: | | | | |
Class 1A1, 0.9906% 11/25/35 (b) | | 10,369,858 | | 6,156,800 |
Class 2A3, 1.8417% 11/25/35 (b) | | 2,461,865 | | 1,405,542 |
Series 2005-56: | | | | |
Class 4A1, 0.5706% 11/25/35 (b) | | 1,933,961 | | 1,178,798 |
Class 5A1, 0.5806% 11/25/35 (b) | | 3,109,556 | | 1,692,867 |
Luminent Mortgage Trust: | | | | |
floater Series 2006-1 Class A1, 0.5006% 4/25/36 (b) | | 5,180,099 | | 3,013,882 |
Series 2006-5 Class A1A, 0.4506% 7/25/36 (b) | | 4,043,397 | | 2,299,906 |
MASTR Adjustable Rate Mortgages Trust Series 2007-3 Class 22A2, 0.4706% 5/25/47 (b) | | 691,115 | | 437,230 |
Merrill Lynch Alternative Note Asset Trust floater Series 2007-OAR1 Class A1, 0.4306% 2/25/37 (b) | | 1,874,794 | | 1,313,887 |
Residential Accredit Loans, Inc. floater Series 2005-QO5 Class A1, 1.3417% 1/25/46 (b) | | 4,307,830 | | 2,416,861 |
Structured Asset Mortgage Investments, Inc. floater Series 2006-AR6 Class 2A1, 0.4506% 7/25/46 (b) | | 8,305,839 | | 5,070,958 |
Wells Fargo Mortgage Backed Securities Trust Series 2005-AR2 Class 1A2, 2.8551% 3/25/35 (b) | | 1,068,768 | | 632,248 |
TOTAL COLLATERALIZED MORTGAGE OBLIGATIONS (Cost $25,542,492) | 25,618,979 |
Cash Equivalents - 1.3% |
| Maturity Amount | | Value |
Investments in repurchase agreements in a joint trading account at 0.26%, dated 12/31/10 due 1/3/11 (Collateralized by U.S. Government Obligations) #
(Cost $39,778,000) | $ 39,778,868 | | $ 39,778,000 |
TOTAL INVESTMENT PORTFOLIO - 100.2% (Cost $2,885,646,330) | | 2,949,271,158 |
NET OTHER ASSETS (LIABILITIES) - (0.2)% | | (5,348,183) |
NET ASSETS - 100% | $ 2,943,922,975 |
Legend |
(a) Security exempt from registration under Rule 144A of the Securities Act of 1933. These securities may be resold in transactions exempt from registration, normally to qualified institutional buyers. At the end of the period, the value of these securities amounted to $5,199,788 or 0.2% of net assets. |
(b) The coupon rate shown on floating or adjustable rate securities represents the rate at period end. |
(c) Affiliated fund that is available only to investment companies and other accounts managed by Fidelity Investments. A complete unaudited schedule of portfolio holdings for each Fidelity Central Fund is filed with the SEC for the first and third quarters of each fiscal year on Form N-Q and is available upon request or at the SEC's web site at www.sec.gov. An unaudited holdings listing for the Fund, which presents direct holdings as well as the pro rata share of securities and other investments held indirectly through its investment in underlying non-money market Fidelity Central Funds, is available at advisor.fidelity.com. In addition, each Fidelity Central Fund's financial statements, which are not covered by the Fund's Report of Independent Registered Public Accounting Firm, are available on the SEC's web site or upon request. |
(d) Affiliated central fund that is available only to investment companies and other accounts managed by Fidelity Investments. Fidelity VIP Investment Grade Central Fund's investments and financial statements are included at the end of this report as an attachment. |
(e) Security represents right to receive monthly interest payments on an underlying pool of mortgages or assets. Principal shown is the outstanding par amount of the pool held as of the end of the period. |
# Additional information on each counterparty to the repurchase agreement is as follows: |
Repurchase Agreement / Counterparty | Value |
$39,778,000 due 1/03/11 at 0.26% |
BNP Paribas Securities Corp. | $ 4,563,110 |
Bank of America NA | 4,881,637 |
Barclays Capital, Inc. | 1,525,512 |
Credit Agricole Securities (USA), Inc. | 373,238 |
HSBC Securities (USA), Inc. | 1,220,409 |
ING Financial Markets LLC | 1,464,491 |
J.P. Morgan Securities, Inc. | 1,220,409 |
Merrill Lynch Government Securities, Inc. | 2,196,737 |
Merrill Lynch, Pierce, Fenner & Smith, Inc. | 2,439,786 |
Mizuho Securities USA, Inc. | 9,763,274 |
Societe Generale, New York Branch | 2,440,819 |
Wells Fargo Securities LLC | 7,688,578 |
| $ 39,778,000 |
Affiliated Central Funds |
Information regarding fiscal year to date income earned by the Fund from investments in Fidelity Central Funds is as follows: |
Fund | Income earned |
Fidelity Specialized High Income Central Fund | $ 3,738,327 |
Fidelity VIP Investment Grade Central Fund | 110,038,491 |
Total | $ 113,776,818 |
Additional information regarding the Fund's fiscal year to date purchases and sales, including the ownership percentage, of the non Money Market Central Funds is as follows: |
Fund | Value,
beginning of period | Purchases | Sales
Proceeds | Value,
end of
period | % ownership,
end of
period |
Fidelity Specialized High Income Central Fund | $ 49,151,300 | $ 3,738,327 | $ - | $ 55,590,665 | 12.1% |
Fidelity VIP Investment Grade Central Fund | 3,022,577,174 | 229,720,199 | 459,929,585 | 2,820,191,876 | 75.0% |
Total | $ 3,071,728,474 | $ 233,458,526 | $ 459,929,585 | $ 2,875,782,541 | |
Other Information |
The following is a summary of the inputs used, as of December 31, 2010, involving the Fund's assets and liabilities carried at fair value. The inputs or methodology used for valuing securities may not be an indication of the risk associated with investing in those securities. For more information on valuation inputs, and their aggregation into the levels used in the tables below, please refer to the Security Valuation section in the accompanying Notes to Financial Statements. |
Valuation Inputs at Reporting Date: |
Description | Total | Level 1 | Level 2 | Level 3 |
Investments in Securities: | | | | |
Corporate Bonds | $ 1,857,118 | $ - | $ 1,857,118 | $ - |
Asset-Backed Securities | 6,234,520 | - | 5,726,911 | 507,609 |
Collateralized Mortgage Obligations | 25,618,979 | - | 25,618,979 | - |
Fixed-Income Funds | 2,875,782,541 | 2,875,782,541 | - | - |
Cash Equivalents | 39,778,000 | - | 39,778,000 | - |
Total Investments in Securities: | $ 2,949,271,158 | $ 2,875,782,541 | $ 72,981,008 | $ 507,609 |
The following is a reconciliation of Investments in Securities for which Level 3 inputs were used in determining value: |
Investments in Securities: | |
Beginning Balance | $ - |
Total Realized Gain (Loss) | - |
Total Unrealized Gain (Loss) | 40,846 |
Cost of Purchases | 586,583 |
Proceeds of Sales | - |
Amortization/Accretion | (119,820) |
Transfers in to Level 3 | - |
Transfers out of Level 3 | - |
Ending Balance | $ 507,609 |
The change in unrealized gain (loss) for the period attributable to Level 3 securities held at December 31, 2010 | $ 40,846 |
The information used in the above reconciliation represents fiscal year to date activity for any Investments in Securities identified as using Level 3 inputs at either the beginning or the end of the current fiscal period. Transfers in or out of Level 3 represent the beginning value of any Security or Instrument where a change in the pricing level occurred from the beginning to the end of the period. The cost of purchases and the proceeds of sales may include securities received or delivered through corporate actions or exchanges. Realized and unrealized gains (losses) disclosed in the reconciliation are included in Net Gain (Loss) on the Fund's Statement of Operations. |
See accompanying notes which are an integral part of the financial statements.
Annual Report
Statement of Assets and Liabilities
| December 31, 2010 |
| | |
Assets | | |
Investment in securities, at value (including repurchase agreements of $39,778,000) - See accompanying schedule: Unaffiliated issuers (cost $74,801,761) | $ 73,488,617 | |
Fidelity Central Funds (cost $2,810,844,569) | 2,875,782,541 | |
Total Investments (cost $2,885,646,330) | | $ 2,949,271,158 |
Cash | | 706 |
Receivable for fund shares sold | | 2,659,740 |
Interest receivable | | 64,946 |
Prepaid expenses | | 7,888 |
Total assets | | 2,952,004,438 |
| | |
Liabilities | | |
Payable for investments purchased | $ 17,682 | |
Payable for fund shares redeemed | 6,721,825 | |
Accrued management fee | 819,276 | |
Distribution and service plan fees payable | 235,099 | |
Other affiliated payables | 258,346 | |
Other payables and accrued expenses | 29,235 | |
Total liabilities | | 8,081,463 |
| | |
Net Assets | | $ 2,943,922,975 |
Net Assets consist of: | | |
Paid in capital | | $ 2,829,297,740 |
Undistributed net investment income | | 555,736 |
Accumulated undistributed net realized gain (loss) on investments | | 50,444,671 |
Net unrealized appreciation (depreciation) on investments | | 63,624,828 |
Net Assets | | $ 2,943,922,975 |
Statement of Assets and Liabilities - continued
| December 31, 2010 |
| | |
Initial Class:
Net Asset Value, offering price and redemption price per share ($1,110,373,224 ÷ 86,517,004 shares) | | $ 12.83 |
| | |
Service Class:
Net Asset Value, offering price and redemption price per share ($283,962,448 ÷ 22,303,048 shares) | | $ 12.73 |
| | |
Service Class 2:
Net Asset Value, offering price and redemption price per share ($1,011,651,803 ÷ 80,309,603 shares) | | $ 12.60 |
| | |
Investor Class:
Net Asset Value, offering price and redemption price per share ($537,935,500 ÷ 42,029,059 shares) | | $ 12.80 |
See accompanying notes which are an integral part of the financial statements.
Annual Report
Statement of Operations
| Year ended December 31, 2010 |
| | |
Investment Income | | |
Interest | | $ 4,823,326 |
Income from Fidelity Central Funds | | 113,776,818 |
Total income | | 118,600,144 |
| | |
Expenses | | |
Management fee | $ 9,867,462 | |
Transfer agent fees | 2,536,566 | |
Distribution and service plan fees | 3,191,817 | |
Accounting fees and expenses | 996,045 | |
Custodian fees and expenses | 4,686 | |
Independent trustees' compensation | 11,459 | |
Registration fees | 2,572 | |
Audit | 50,887 | |
Legal | 14,416 | |
Miscellaneous | 39,616 | |
Total expenses before reductions | 16,715,526 | |
Expense reductions | (241,448) | 16,474,078 |
Net investment income | | 102,126,066 |
Realized and Unrealized Gain (Loss) Net realized gain (loss) on: | | |
Investment securities: | | |
Unaffiliated issuers | 968,072 | |
Fidelity Central Funds | 9,758,488 | |
Capital gain distributions from Fidelity Central Funds | 99,735,555 | |
Total net realized gain (loss) | | 110,462,115 |
Change in net unrealized appreciation (depreciation) on investment securities | | 20,788,788 |
Net gain (loss) | | 131,250,903 |
Net increase (decrease) in net assets resulting from operations | | $ 233,376,969 |
Statement of Changes in Net Assets
| Year ended
December 31, 2010 | Year ended
December 31, 2009 |
Increase (Decrease) in Net Assets | | |
Operations | | |
Net investment income | $ 102,126,066 | $ 109,761,887 |
Net realized gain (loss) | 110,462,115 | 2,163,300 |
Change in net unrealized appreciation (depreciation) | 20,788,788 | 270,387,352 |
Net increase (decrease) in net assets resulting from operations | 233,376,969 | 382,312,539 |
Distributions to shareholders from net investment income | (102,934,619) | (231,145,149) |
Distributions to shareholders from net realized gain | (32,318,250) | (11,161,010) |
Total distributions | (135,252,869) | (242,306,159) |
Share transactions - net increase (decrease) | (261,188,374) | 591,004,922 |
Total increase (decrease) in net assets | (163,064,274) | 731,011,302 |
| | |
Net Assets | | |
Beginning of period | 3,106,987,249 | 2,375,975,947 |
End of period (including undistributed net investment income of $555,736 and undistributed net investment income of $1,802,543, respectively) | $ 2,943,922,975 | $ 3,106,987,249 |
See accompanying notes which are an integral part of the financial statements.
Annual Report
Financial Highlights - Initial Class
Years ended December 31, | 2010 | 2009 | 2008 | 2007 | 2006 |
Selected Per-Share Data | | | | | |
Net asset value, beginning of period | $ 12.48 | $ 11.84 | $ 12.76 | $ 12.76 | $ 12.76 |
Income from Investment Operations | | | | | |
Net investment income C | .443 | .510 | .592 | .610 | .591 |
Net realized and unrealized gain (loss) | .528 | 1.266 | (.987) | (.076) | (.060) |
Total from investment operations | .971 | 1.776 | (.395) | .534 | .531 |
Distributions from net investment income | (.476) | (1.087) | (.515) | (.534) | (.501) |
Distributions from net realized gain | (.145) | (.049) | (.010) | - | (.030) |
Total distributions | (.621) | (1.136) | (.525) | (.534) | (.531) |
Net asset value, end of period | $ 12.83 | $ 12.48 | $ 11.84 | $ 12.76 | $ 12.76 |
Total Return A, B | 7.80% | 15.72% | (3.25)% | 4.35% | 4.35% |
Ratios to Average Net Assets D, F | | | | | |
Expenses before reductions | .43% | .45% | .43% | .43% | .44% |
Expenses net of fee waivers, if any | .42% | .45% | .43% | .43% | .44% |
Expenses net of all reductions | .42% | .45% | .43% | .43% | .44% |
Net investment income | 3.38% | 4.19% | 4.84% | 4.88% | 4.75% |
Supplemental Data | | | | | |
Net assets, end of period (000 omitted) | $ 1,110,373 | $ 1,083,773 | $ 936,912 | $ 1,134,915 | $ 1,184,942 |
Portfolio turnover rate E | 8% | 3% | 14% | 2% | 34% |
A Total returns do not reflect charges attributable to your insurance company's separate account. Inclusion of these charges would reduce the total returns shown.
B Total returns would have been lower had certain expenses not been reduced during the periods shown.
C Calculated based on average shares outstanding during the period.
D Fees and expenses of the underlying Fidelity Central Funds are not included in the Fund's expense ratio. The Fund indirectly bears its proportionate share of the expenses of any underlying Fidelity Central Funds.
E Amount does not include the portfolio activity of any underlying Fidelity Central Funds.
F Expense ratios reflect operating expenses of the class. Expenses before reductions do not reflect amounts reimbursed by the investment adviser or reductions from expense offset arrangements and do not represent the amount paid by the class during periods when reimbursements or reductions occur. Expenses net of fee waivers reflect expenses after reimbursement by the investment adviser but prior to reductions from expense offset arrangements. Expenses net of all reductions represent the net expenses paid by the class. Fees and expenses of the underlying Fidelity Central Funds are not included in the Fund's expense ratio. The Fund indirectly bears its proportionate share of the expenses of any Fidelity Central Funds. Based on their most recent shareholder report date, the annualized expenses for the Fidelity VIP Investment Grade Central Fund and Fidelity Specialized High Income Central Fund were less than .01%.
Financial Highlights - Service Class
Years ended December 31, | 2010 | 2009 | 2008 | 2007 | 2006 |
Selected Per-Share Data | | | | | |
Net asset value, beginning of period | $ 12.39 | $ 11.75 | $ 12.68 | $ 12.68 | $ 12.68 |
Income from Investment Operations | | | | | |
Net investment income C | .427 | .495 | .572 | .593 | .575 |
Net realized and unrealized gain (loss) | .521 | 1.262 | (.986) | (.069) | (.053) |
Total from investment operations | .948 | 1.757 | (.414) | .524 | .522 |
Distributions from net investment income | (.463) | (1.068) | (.506) | (.524) | (.492) |
Distributions from net realized gain | (.145) | (.049) | (.010) | - | (.030) |
Total distributions | (.608) | (1.117) | (.516) | (.524) | (.522) |
Net asset value, end of period | $ 12.73 | $ 12.39 | $ 11.75 | $ 12.68 | $ 12.68 |
Total Return A, B | 7.68% | 15.67% | (3.42)% | 4.29% | 4.30% |
Ratios to Average Net Assets D, F | | | | | |
Expenses before reductions | .53% | .54% | .53% | .53% | .54% |
Expenses net of fee waivers, if any | .52% | .54% | .53% | .53% | .54% |
Expenses net of all reductions | .52% | .54% | .53% | .53% | .54% |
Net investment income | 3.28% | 4.09% | 4.75% | 4.78% | 4.65% |
Supplemental Data | | | | | |
Net assets, end of period (000 omitted) | $ 283,962 | $ 259,246 | $ 202,501 | $ 147,990 | $ 99,633 |
Portfolio turnover rate E | 8% | 3% | 14% | 2% | 34% |
A Total returns do not reflect charges attributable to your insurance company's separate account. Inclusion of these charges would reduce the total returns shown.
B Total returns would have been lower had certain expenses not been reduced during the periods shown.
C Calculated based on average shares outstanding during the period.
D Fees and expenses of the underlying Fidelity Central Funds are not included in the Fund's expense ratio. The Fund indirectly bears its proportionate share of the expenses of any underlying Fidelity Central Funds.
E Amount does not include the portfolio activity of any underlying Fidelity Central Funds.
F Expense ratios reflect operating expenses of the class. Expenses before reductions do not reflect amounts reimbursed by the investment adviser or reductions from expense offset arrangements and do not represent the amount paid by the class during periods when reimbursements or reductions occur. Expenses net of fee waivers reflect expenses after reimbursement by the investment adviser but prior to reductions from expense offset arrangements. Expenses net of all reductions represent the net expenses paid by the class. Fees and expenses of the underlying Fidelity Central Funds are not included in the Fund's expense ratio. The Fund indirectly bears its proportionate share of the expenses of any Fidelity Central Funds. Based on their most recent shareholder report date, the annualized expenses for the Fidelity VIP Investment Grade Central Fund and Fidelity Specialized High Income Central Fund were less than .01%.
See accompanying notes which are an integral part of the financial statements.
Annual Report
Financial Highlights - Service Class 2
Years ended December 31, | 2010 | 2009 | 2008 | 2007 | 2006 |
Selected Per-Share Data | | | | | |
Net asset value, beginning of period | $ 12.26 | $ 11.62 | $ 12.55 | $ 12.56 | $ 12.57 |
Income from Investment Operations | | | | | |
Net investment income C | .402 | .473 | .551 | .568 | .551 |
Net realized and unrealized gain (loss) | .520 | 1.244 | (.975) | (.064) | (.053) |
Total from investment operations | .922 | 1.717 | (.424) | .504 | .498 |
Distributions from net investment income | (.437) | (1.028) | (.496) | (.514) | (.478) |
Distributions from net realized gain | (.145) | (.049) | (.010) | - | (.030) |
Total distributions | (.582) | (1.077) | (.506) | (.514) | (.508) |
Net asset value, end of period | $ 12.60 | $ 12.26 | $ 11.62 | $ 12.55 | $ 12.56 |
Total Return A, B | 7.55% | 15.47% | (3.54)% | 4.17% | 4.14% |
Ratios to Average Net Assets D, F | | | | | |
Expenses before reductions | .68% | .69% | .67% | .68% | .69% |
Expenses net of fee waivers, if any | .67% | .69% | .67% | .68% | .69% |
Expenses net of all reductions | .67% | .69% | .67% | .68% | .69% |
Net investment income | 3.13% | 3.94% | 4.60% | 4.63% | 4.50% |
Supplemental Data | | | | | |
Net assets, end of period (000 omitted) | $ 1,011,652 | $ 1,240,935 | $ 930,150 | $ 1,018,017 | $ 497,504 |
Portfolio turnover rate E | 8% | 3% | 14% | 2% | 34% |
A Total returns do not reflect charges attributable to your insurance company's separate account. Inclusion of these charges would reduce the total returns shown.
B Total returns would have been lower had certain expenses not been reduced during the periods shown.
C Calculated based on average shares outstanding during the period.
D Fees and expenses of the underlying Fidelity Central Funds are not included in the Fund's expense ratio. The Fund indirectly bears its proportionate share of the expenses of any underlying Fidelity Central Funds.
E Amount does not include the portfolio activity of any underlying Fidelity Central Funds.
F Expense ratios reflect operating expenses of the class. Expenses before reductions do not reflect amounts reimbursed by the investment adviser or reductions from expense offset arrangements and do not represent the amount paid by the class during periods when reimbursements or reductions occur. Expenses net of fee waivers reflect expenses after reimbursement by the investment adviser but prior to reductions from expense offset arrangements. Expenses net of all reductions represent the net expenses paid by the class. Fees and expenses of the underlying Fidelity Central Funds are not included in the Fund's expense ratio. The Fund indirectly bears its proportionate share of the expenses of any Fidelity Central Funds. Based on their most recent shareholder report date, the annualized expenses for the Fidelity VIP Investment Grade Central Fund and Fidelity Specialized High Income Central Fund were less than .01%.
Financial Highlights - Investor Class
Years ended December 31, | 2010 | 2009 | 2008 | 2007 | 2006 |
Selected Per-Share Data | | | | | |
Net asset value, beginning of period | $ 12.45 | $ 11.81 | $ 12.73 | $ 12.74 | $ 12.75 |
Income from Investment Operations | | | | | |
Net investment income C | .438 | .511 | .586 | .603 | .583 |
Net realized and unrealized gain (loss) | .529 | 1.263 | (.983) | (.079) | (.055) |
Total from investment operations | .967 | 1.774 | (.397) | .524 | .528 |
Distributions from net investment income | (.472) | (1.085) | (.513) | (.534) | (.508) |
Distributions from net realized gain | (.145) | (.049) | (.010) | - | (.030) |
Total distributions | (.617) | (1.134) | (.523) | (.534) | (.538) |
Net asset value, end of period | $ 12.80 | $ 12.45 | $ 11.81 | $ 12.73 | $ 12.74 |
Total Return A, B | 7.79% | 15.75% | (3.28)% | 4.28% | 4.33% |
Ratios to Average Net Assets D, F | | | | | |
Expenses before reductions | .46% | .48% | .46% | .46% | .48% |
Expenses net of fee waivers, if any | .45% | .45% | .45% | .46% | .48% |
Expenses net of all reductions | .45% | .45% | .45% | .46% | .48% |
Net investment income | 3.35% | 4.18% | 4.82% | 4.84% | 4.72% |
Supplemental Data | | | | | |
Net assets, end of period (000 omitted) | $ 537,936 | $ 523,032 | $ 306,413 | $ 284,223 | $ 168,456 |
Portfolio turnover rate E | 8% | 3% | 14% | 2% | 34% |
A Total returns do not reflect charges attributable to your insurance company's separate account. Inclusion of these charges would reduce the total returns shown.
B Total returns would have been lower had certain expenses not been reduced during the periods shown.
C Calculated based on average shares outstanding during the period.
D Fees and expenses of the underlying Fidelity Central Funds are not included in the Fund's expense ratio. The Fund indirectly bears its proportionate share of the expenses of any underlying Fidelity Central Funds.
E Amount does not include the portfolio activity of any underlying Fidelity Central Funds.
F Expense ratios reflect operating expenses of the class. Expenses before reductions do not reflect amounts reimbursed by the investment adviser or reductions from expense offset arrangements and do not represent the amount paid by the class during periods when reimbursements or reductions occur. Expenses net of fee waivers reflect expenses after reimbursement by the investment adviser but prior to reductions from expense offset arrangements. Expenses net of all reductions represent the net expenses paid by the class. Fees and expenses of the underlying Fidelity Central Funds are not included in the Fund's expense ratio. The Fund indirectly bears its proportionate share of the expenses of any Fidelity Central Funds. Based on their most recent shareholder report date, the annualized expenses for the Fidelity VIP Investment Grade Central Fund and Fidelity Specialized High Income Central Fund were less than .01%.
See accompanying notes which are an integral part of the financial statements.
Annual Report
Notes to Financial Statements
For the period ended December 31, 2010
1. Organization.
VIP Investment Grade Bond Portfolio (the Fund) is a fund of Variable Insurance Products Fund V (the Trust) and is authorized to issue an unlimited number of shares. The Trust is registered under the Investment Company Act of 1940, as amended (the 1940 Act), as an open-end management investment company organized as a Massachusetts business trust. Shares of the Fund may only be purchased by insurance companies for the purpose of funding variable annuity or variable life insurance contracts. The Fund offers the following classes of shares: Initial Class shares, Service Class shares, Service Class 2 shares, and Investor Class shares. All classes have equal rights and voting privileges, except for matters affecting a single class. Investment income, realized and unrealized capital gains and losses, the common expenses of the Fund, and certain fund-level expense reductions, if any, are allocated on a pro-rata basis to each class based on the relative net assets of each class to the total net assets of the Fund. Each class differs with respect to transfer agent and distribution and service plan fees incurred. Certain expense reductions may also differ by class.
2. Investments in Fidelity Central Funds.
The Fund may invest in Fidelity Central Funds, which are open-end investment companies available only to other investment companies and accounts managed by Fidelity Management & Research Company (FMR) and its affiliates. The Fund's Schedule of Investments lists each of the Fidelity Central Funds held as of period end, if any, as an investment of the Fund, but does not include the underlying holdings of each Fidelity Central Fund. As an Investing Fund, the Fund indirectly bears its proportionate share of the expenses of the underlying Fidelity Central Funds.
Based on their investment objective, each Fidelity Central Fund may invest or participate in various investment vehicles or strategies that are similar to those of the Fund. These strategies are consistent with the investment objectives of the Fund and may involve certain economic risks which may cause a decline in value of each of the Fidelity Central Funds and thus a decline in the value of the Fund. The following summarizes the Fund's investment in each Fidelity Central Fund.
Fidelity Central Fund | Investment Manager | Investment Objective | Investment Practices |
Fidelity Specialized High Income Central Fund | FMR Co., Inc. (FMRC) | Seeks a high level of current income by normally investing in income-producing debt securities, with an emphasis on lower-quality debt securities. | Delayed Delivery & When Issued Securities Loans & Direct Debt Instruments Repurchase Agreements Restricted Securities |
VIP Investment Grade Central Fund | Fidelity Investments Money Management, Inc. (FIMM) | Seeks a high level of current income by normally investing in investment-grade debt securities and repurchase agreements. | Delayed Delivery & When Issued Securities Repurchase Agreements Restricted Securities Swap Agreements |
An unaudited holdings listing for the Fund, which presents direct holdings as well as the pro-rata share of any securities and other investments held indirectly through its investment in underlying non-money market Fidelity Central Funds, is available at advisor.fidelity.com. A complete unaudited list of holdings for each Fidelity Central Fund is available upon request or at the Securities and Exchange Commission (the SEC) web site at www.sec.gov. In addition, the financial statements of the Fidelity Central Funds which contain the significant accounting policies (including security valuation policies) of those funds, which are not covered by the Fund's Report of Independent Registered Public Accounting Firm, are available on the SEC web site or upon request.
3. Significant Accounting Policies.
The financial statements have been prepared in conformity with accounting principles generally accepted in the United States of America (GAAP), which require management to make certain estimates and assumptions at the date of the financial statements. Actual results could differ from those estimates. Subsequent events, if any, through the date that the financial statements were issued have been evaluated in the preparation of the financial statements. The following summarizes the significant accounting policies of the Fund:
Security Valuation. Investments are valued as of 4:00 p.m. Eastern time on the last calendar day of the period. The Fund uses independent pricing services approved by the Board of Trustees to value its investments. When current market prices or quotations are not readily available or reliable, valuations may be determined in good faith in accordance with procedures adopted by the Board of Trustees. Factors used in determining value may include market or security specific events, changes in interest rates and credit quality. The frequency with which these procedures are used cannot be predicted and they may be utilized to a significant extent. The value used for net asset value (NAV) calculation under these procedures may differ from published prices for the same securities.
Annual Report
3. Significant Accounting Policies - continued
Security Valuation - continued
The Fund categorizes the inputs to valuation techniques used to value its investments into a disclosure hierarchy consisting of three levels as shown below.
Level 1 - quoted prices in active markets for identical investments
Level 2 - other significant observable inputs (including quoted prices for similar investments, interest rates, prepayment speeds, etc.)
Level 3 - unobservable inputs (including the Fund's own assumptions based on the best information available)
Changes in valuation techniques may result in transfers in or out of an assigned level within the disclosure hierarchy. The aggregate value of investments by input level, as of December 31, 2010 for the Fund's investments, as well as a roll forward of Level 3 securities, is included at the end of the Fund's Schedule of Investments. Valuation techniques used to value the Fund's investments by major category are as follows.
Debt securities, including restricted securities, are valued based on evaluated prices received from independent pricing services or from dealers who make markets in such securities. For corporate bonds, pricing services utilize matrix pricing which considers yield or price of bonds of comparable quality, coupon, maturity and type as well as dealer supplied prices and are generally categorized as Level 2 in the hierarchy. For asset backed securities and collateralized mortgage obligations, pricing services utilize matrix pricing which considers prepayment speed assumptions, attributes of the collateral, yield or price of bonds of comparable quality, coupon, maturity and type as well as dealer supplied prices and, accordingly, such securities are generally categorized as Level 2 in the hierarchy. Short-term securities with remaining maturities of sixty days or less for which quotations are not readily available are valued at amortized cost, which approximates fair value and are categorized as Level 2 in the hierarchy.
When independent prices are unavailable or unreliable, debt securities may be valued utilizing pricing matrices which consider similar factors that would be used by independent pricing services. These are generally categorized as Level 2 in the hierarchy but may be Level 3 depending on the circumstances.
Investments in open-end mutual funds, including the Fidelity Central Funds, are valued at their closing net asset value each business day and are categorized as Level 1 in the hierarchy.
Investment Transactions and Income. For financial reporting purposes, the Fund's investment holdings and NAV include trades executed through the end of the last business day of the period. The NAV per share for processing shareholder transactions is calculated as of the close of business of the New York Stock Exchange (NYSE), normally 4:00 p.m. Eastern time and includes trades executed through the end of the prior business day. Gains and losses on securities sold are determined on the basis of identified cost and may include proceeds received from litigation. Interest income and distributions from the Fidelity Central Funds are accrued as earned. Interest income includes coupon interest and amortization of premium and accretion of discount on debt securities.
Expenses. Expenses directly attributable to a fund are charged to that fund. Expenses attributable to more than one fund are allocated among the respective funds on the basis of relative net assets or other appropriate methods. Expense estimates are accrued in the period to which they relate and adjustments are made when actual amounts are known.
Income Tax Information and Distributions to Shareholders. Each year the Fund intends to qualify as a regulated investment company, including distributing substantially all of its taxable income and realized gains under Subchapter M of the Internal Revenue Code and filing its U.S. federal tax return. As a result, no provision for income taxes is required. As of December 31, 2010, the Fund did not have any unrecognized tax benefits in the accompanying financial statements. A fund's federal tax return is subject to examination by the Internal Revenue Service (IRS) for a period of three years.
Distributions are declared and recorded on the ex-dividend date. Income dividends and capital gain distributions are declared separately for each class. Income and capital gain distributions are determined in accordance with income tax regulations, which may differ from GAAP.
Capital accounts within the financial statements are adjusted for permanent book-tax differences. These adjustments have no impact on net assets or the results of operations. Temporary book-tax differences will reverse in a subsequent period.
Book-tax differences are primarily due to the short-term gain distributions from the Fidelity Central Funds, in-kind transactions, market discount, partnerships (including allocations from Fidelity Central Funds), deferred trustees compensation, capital loss carryforwards and losses deferred due to wash sales.
Annual Report
Notes to Financial Statements - continued
3. Significant Accounting Policies - continued
Income Tax Information and Distributions to Shareholders - continued
The federal tax cost of investment securities and unrealized appreciation (depreciation) as of period end were as follows:
Gross unrealized appreciation | $ 125,081,176 |
Gross unrealized depreciation | (3,720,942) |
Net unrealized appreciation (depreciation) | $ 121,360,234 |
Tax Cost | $ 2,827,910,924 |
The tax-based components of distributable earnings as of period end were as follows:
Undistributed ordinary income | $ 452,233 |
Undistributed long-term capital gain | $ 47,565,134 |
Net unrealized appreciation (depreciation) | $ 121,360,234 |
The tax character of distributions paid was as follows:
| December 31, 2010 | December 31, 2009 |
Ordinary Income | $ 135,252,869 | $ 242,306,159 |
4. Operating Policies.
Repurchase Agreements. FMR has received an Exemptive Order from the SEC which permits the Fund and other affiliated entities of FMR to transfer uninvested cash balances into joint trading accounts which are then invested in repurchase agreements. The Fund may also invest directly with institutions in repurchase agreements. Repurchase agreements are collateralized by government or non-government securities. Upon settlement date, collateral is held in segregated accounts with custodian banks and may be obtained in the event of a default of the counterparty. The Fund monitors, on a daily basis, the value of the collateral to ensure it is at least equal to the principal amount of the repurchase agreement (including accrued interest). In the event of a default by the counterparty, realization of the collateral proceeds could be delayed, during which time the value of the collateral may decline.
Restricted Securities. The Fund may invest in securities that are subject to legal or contractual restrictions on resale. These securities generally may be resold in transactions exempt from registration or to the public if the securities are registered. Disposal of these securities may involve time-consuming negotiations and expense, and prompt sale at an acceptable price may be difficult. Information regarding restricted securities is included at the end of the Fund's Schedule of Investments.
5. Purchases and Sales of Investments.
Purchases and sales of securities (including the Fixed-Income Central Funds), other than short-term securities, aggregated $241,769,499 and $468,637,845, respectively.
6. Fees and Other Transactions with Affiliates.
Management Fee. FMR and its affiliates provide the Fund with investment management related services for which the Fund pays a monthly management fee. The management fee is the sum of an individual fund fee rate that is based on an annual rate of .20% of the Fund's average net assets and a group fee rate that averaged .12% during the period. The group fee rate is based upon the average net assets of all the mutual funds advised by FMR. The group fee rate decreases as assets under management increase and increases as assets under management decrease. For the period, the total annual management fee rate was .32% of the Fund's average net assets.
Distribution and Service Plan Fees. In accordance with Rule 12b-1 of the 1940 Act, the Fund has adopted separate 12b-1 Plans for each Service Class of shares. Each Service Class pays Fidelity Distributors Corporation (FDC), an affiliate of FMR, a service fee. For the period, the service fee is based on an annual rate of .10% of Service Class' average net assets and .25% of Service Class 2's average net assets.
Annual Report
6. Fees and Other Transactions with Affiliates - continued
Distribution and Service Plan Fees - continued
For the period, total fees, all of which were re-allowed to insurance companies for the distribution of shares and providing shareholder support services were as follows:
Service Class | $ 282,189 |
Service Class 2 | 2,909,628 |
| $ 3,191,817 |
Transfer Agent Fees. Fidelity Investments Institutional Operations Company, Inc. (FIIOC), an affiliate of FMR, is the Fund's transfer, dividend disbursing, and shareholder servicing agent. FIIOC receives an asset-based fee with respect to each class. Each class (with the exception of Investor Class) pays a transfer agent fee, excluding out of pocket expenses, equal to an annual rate of .07% of average net assets. Investor Class pays a monthly asset-based transfer agent fee of .10% of average net assets. In addition, FIIOC receives an asset-based fee of .01% of average net assets for typesetting, printing and mailing of shareholder reports, except proxy statements. FIIOC has agreed to voluntarily waive this fee until December 31, 2010. (See Note 8: Expense Reductions.) For the period, transfer agent fees for each class, including printing and out of pocket expenses, were as follows:
Initial Class | $ 861,479 |
Service Class | 209,893 |
Service Class 2 | 857,799 |
Investor Class | 607,395 |
| $ 2,536,566 |
Accounting Fees. Fidelity Service Company, Inc. (FSC), an affiliate of FMR, maintains the Fund's accounting records. The fee is based on the level of average net assets for the month.
7. Committed Line of Credit.
The Fund participates with other funds managed by FMR or an affiliate in a $3.75 billion credit facility (the "line of credit") to be utilized for temporary or emergency purposes to fund shareholder redemptions or for other short-term liquidity purposes. The Fund has agreed to pay commitment fees on its pro-rata portion of the line of credit, which amounted to $12,364 and is reflected in Miscellaneous expenses on the Statement of Operations. During the period, there were no borrowings on this line of credit.
8. Expense Reductions.
In addition to FIIOC waiving a portion of its transfer agent fees, FMR voluntarily agreed to reimburse each class to the extent annual operating expenses exceeded certain levels of average net assets as noted in the table below. Some expenses, for example interest expense, including commitment fees, are excluded from this reimbursement.
Fees were waived and/or expenses were reimbursed for the following classes during the period:
| Expense
Limitations | Reimbursement/Waiver |
Initial Class | 0.45% | $ 80,979 |
Service Class | 0.55% | 20,476 |
Service Class 2 | 0.70% | 84,299 |
Investor Class | 0.45% | 55,694 |
| | $ 241,448 |
Effective May 1, 2011, the expense limitations will be eliminated.
9. Distributions to Shareholders.
Distributions to shareholders of each class were as follows:
Years ended December 31, | 2010 | 2009 |
From net investment income | | |
Initial Class | $ 39,652,079 | $ 87,610,201 |
Service Class | 9,934,693 | 19,954,637 |
Service Class 2 | 33,971,385 | 88,033,795 |
Investor Class | 19,376,462 | 35,546,516 |
Total | $ 102,934,619 | $ 231,145,149 |
Annual Report
Notes to Financial Statements - continued
9. Distributions to Shareholders - continued
Years ended December 31, | 2010 | 2009 |
From net realized gain | | |
Initial Class | $ 12,070,578 | $ 4,011,757 |
Service Class | 3,112,885 | 945,912 |
Service Class 2 | 11,186,239 | 4,432,173 |
Investor Class | 5,948,548 | 1,771,168 |
Total | $ 32,318,250 | $ 11,161,010 |
10. Share Transactions.
Transactions for each class of shares were as follows:
| Shares | Dollars |
Years ended December 31, | 2010 | 2009 | 2010 | 2009 |
Initial Class | | | | |
Shares sold | 14,591,614 | 15,591,090 | $ 191,644,371 | $ 191,599,400 |
Reinvestment of distributions | 4,047,794 | 7,704,191 | 51,722,657 | 91,621,958 |
Shares redeemed | (18,940,310) | (15,602,320) | (248,258,905) | (188,710,961) |
Net increase (decrease) | (300,902) | 7,692,961 | $ (4,891,877) | $ 94,510,397 |
Service Class | | | | |
Shares sold | 4,596,946 | 5,896,195 | $ 59,682,718 | $ 71,123,720 |
Reinvestment of distributions | 1,029,933 | 1,768,247 | 13,047,578 | 20,900,549 |
Shares redeemed | (4,250,312) | (3,968,274) | (55,672,659) | (47,914,261) |
Net increase (decrease) | 1,376,567 | 3,696,168 | $ 17,057,637 | $ 44,110,008 |
Service Class 2 | | | | |
Shares sold | 15,013,576 | 30,001,161 | $ 192,078,938 | $ 360,275,824 |
Reinvestment of distributions | 3,601,813 | 7,883,820 | 45,157,624 | 92,465,968 |
Shares redeemed | (39,548,465) | (16,703,361) | (509,866,109) | (196,872,876) |
Net increase (decrease) | (20,933,076) | 21,181,620 | $ (272,629,547) | $ 255,868,916 |
Investor Class | | | | |
Shares sold | 8,642,451 | 16,665,565 | $ 113,090,085 | $ 204,785,485 |
Reinvestment of distributions | 1,988,124 | 3,117,232 | 25,325,010 | 37,317,684 |
Shares redeemed | (10,609,871) | (3,716,578) | (139,139,682) | (45,587,568) |
Net increase (decrease) | 20,704 | 16,066,219 | $ (724,587) | $ 196,515,601 |
11. Other.
The Fund's organizational documents provide former and current trustees and officers with a limited indemnification against liabilities arising in connection with the performance of their duties to the Fund. In the normal course of business, the Fund may also enter into contracts that provide general indemnifications. The Fund's maximum exposure under these arrangements is unknown as this would be dependent on future claims that may be made against the Fund. The risk of material loss from such claims is considered remote.
At the end of the period, FMR or its affiliates were the owners of record of 40% of the total outstanding shares of the Fund and one otherwise unaffiliated shareholder was the owner of record of 22% of the total outstanding shares of the Fund.
Annual Report
Report of Independent Registered Public Accounting Firm
To the Trustees of Variable Insurance Products Fund V and Shareholders of VIP Investment Grade Bond Portfolio:
We have audited the accompanying statement of assets and liabilities of VIP Investment Grade Bond Portfolio (the Fund), a fund of Variable Insurance Products Fund V, including the schedule of investments, as of December 31, 2010, and the related statement of operations for the year then ended, the statement of changes in net assets for each of the two years in the period then ended, and the financial highlights for each of the five years in the period then ended. These financial statements and financial highlights are the responsibility of the Fund's management. Our responsibility is to express an opinion on these financial statements and financial highlights based on our audits.
We conducted our audits in accordance with the standards of the Public Company Accounting Oversight Board (United States). Those standards require that we plan and perform the audit to obtain reasonable assurance about whether the financial statements and financial highlights are free of material misstatement. The Fund is not required to have, nor were we engaged to perform, an audit of its internal control over financial reporting. Our audits included consideration of internal control over financial reporting as a basis for designing audit procedures that are appropriate in the circumstances, but not for the purpose of expressing an opinion on the effectiveness of the Fund's internal control over financial reporting. Accordingly, we express no such opinion. An audit also includes examining, on a test basis, evidence supporting the amounts and disclosures in the financial statements, assessing the accounting principles used and significant estimates made by management, as well as evaluating the overall financial statement presentation. Our procedures included confirmation of securities owned as of December 31, 2010, by correspondence with the custodians and brokers. We believe that our audits provide a reasonable basis for our opinion.
In our opinion, the financial statements and financial highlights referred to above present fairly, in all material respects, the financial position of VIP Investment Grade Bond Portfolio as of December 31, 2010, the results of its operations for the year then ended, the changes in its net assets for each of the two years in the period then ended, and the financial highlights for each of the five years in the period then ended, in conformity with accounting principles generally accepted in the United States of America.
/s/ Deloitte & Touche LLP
DELOITTE & TOUCHE LLP
Boston, Massachusetts
February 23, 2011
Annual Report
The Trustees and executive officers of the trust and fund, as applicable, are listed below. The Board of Trustees governs the fund and is responsible for protecting the interests of shareholders. The Trustees are experienced executives who meet periodically throughout the year to oversee the fund's activities, review contractual arrangements with companies that provide services to the fund, oversee management of the risks associated with such activities and contractual arrangements, and review the fund's performance. Except for James C. Curvey, each of the Trustees oversees 189 funds advised by FMR or an affiliate. Mr. Curvey oversees 408 funds advised by FMR or an affiliate.
The Trustees hold office without limit in time except that (a) any Trustee may resign; (b) any Trustee may be removed by written instrument, signed by at least two-thirds of the number of Trustees prior to such removal; (c) any Trustee who requests to be retired or who has become incapacitated by illness or injury may be retired by written instrument signed by a majority of the other Trustees; and (d) any Trustee may be removed at any special meeting of shareholders by a two-thirds vote of the outstanding voting securities of the trust. Each Trustee who is not an interested person (as defined in the 1940 Act) (Independent Trustee), shall retire not later than the last day of the calendar year in which his or her 75th birthday occurs. The Independent Trustees may waive this mandatory retirement age policy with respect to individual Trustees. The executive officers hold office without limit in time, except that any officer may resign or may be removed by a vote of a majority of the Trustees at any regular meeting or any special meeting of the Trustees. Except as indicated, each individual has held the office shown or other offices in the same company for the past five years.
Experience, Skills, Attributes, and Qualifications of the Fund's Trustees. The Governance and Nominating Committee has adopted a statement of policy that describes the experience, qualifications, attributes, and skills that are necessary and desirable for potential Independent Trustee candidates (Statement of Policy). The Board believes that each Trustee satisfied at the time he or she was initially elected or appointed a Trustee, and continues to satisfy, the standards contemplated by the Statement of Policy. The Governance and Nominating Committee also engages professional search firms to help identify potential Independent Trustee candidates who have the experience, qualifications, attributes, and skills consistent with the Statement of Policy. From time to time, additional criteria based on the composition and skills of the current Independent Trustees, as well as experience or skills that may be appropriate in light of future changes to board composition, business conditions, and regulatory or other developments, have also been considered by the professional search firms and the Governance and Nominating Committee. In addition, the Board takes into account the Trustees' commitment and participation in Board and committee meetings, as well as their leadership of standing and ad hoc committees throughout their tenure.
In determining that a particular Trustee was and continues to be qualified to serve as a Trustee, the Board has considered a variety of criteria, none of which, in isolation, was controlling. The Board believes that, collectively, the Trustees have balanced and diverse experience, qualifications, attributes, and skills, which allow the Board to operate effectively in governing the fund and protecting the interests of shareholders. Information about the specific experience, skills, attributes, and qualifications of each Trustee, which in each case led to the Board's conclusion that the Trustee should serve (or continue to serve) as a trustee of the fund, is provided below.
Board Structure and Oversight Function. Abigail P. Johnson is an interested person (as defined in the 1940 Act) and currently serves as Chairman. The Trustees have determined that an interested Chairman is appropriate and benefits shareholders because an interested Chairman has a personal and professional stake in the quality and continuity of services provided to the fund. Independent Trustees exercise their informed business judgment to appoint an individual of their choosing to serve as Chairman, regardless of whether the Trustee happens to be independent or a member of management. The Independent Trustees have determined that they can act independently and effectively without having an Independent Trustee serve as Chairman and that a key structural component for assuring that they are in a position to do so is for the Independent Trustees to constitute a substantial majority for the Board. The Independent Trustees also regularly meet in executive session. Kenneth L. Wolfe serves as Chairman of the Independent Trustees and as such (i) acts as a liaison between the Independent Trustees and management with respect to matters important to the Independent Trustees and (ii) with management prepares agendas for Board meetings.
Fidelity funds are overseen by different Boards of Trustees. The fund's Board oversees Fidelity's investment-grade bond, money market, and asset allocation funds and another Board oversees Fidelity's equity and high income funds. The asset allocation funds may invest in Fidelity funds that are overseen by such other Board. The use of separate Boards, each with its own committee structure, allows the Trustees of each group of Fidelity funds to focus on the unique issues of the funds they oversee, including common research, investment, and operational issues. On occasion, the separate Boards establish joint committees to address issues of overlapping consequences for the Fidelity funds overseen by each Board.
The Trustees operate using a system of committees to facilitate the timely and efficient consideration of all matters of importance to the Trustees, the fund, and fund shareholders and to facilitate compliance with legal and regulatory requirements and oversight of the fund's activities and associated risks. The Board, acting through its committees, has charged FMR and its affiliates with (i) identifying events or circumstances the occurrence of which could have demonstrably adverse effects on the fund's business and/or reputation; (ii) implementing processes and controls to lessen the possibility that such events or circumstances occur or to mitigate the effects of such events or circumstances if they do occur; and (iii) creating and maintaining a system designed to evaluate continuously business and market conditions in order to facilitate the identification and implementation processes described in (i) and (ii) above. Because the day-to-day operations and activities of the fund are carried out by or through FMR, its affiliates and other service providers, the fund's exposure to risks is mitigated but not eliminated by the processes overseen by the Trustees. While each of the Board's committees has responsibility for overseeing different aspects of the fund's activities, oversight is exercised primarily through the Operations and Audit Committees. Appropriate personnel, including but not limited to the fund's Chief Compliance Officer (CCO), FMR's internal auditor, the independent accountants, the fund's Treasurer and portfolio management personnel, make periodic reports to the Board's committees, as appropriate. The responsibilities of each committee, including their oversight responsibilities, are described further under "Standing Committees of the Fund's Trustees."
Annual Report
Trustees and Officers - continued
The fund's Statement of Additional Information (SAI) includes more information about the Trustees. To request a free copy, call Fidelity at 1-877-208-0098.
Interested Trustees*:
Correspondence intended for each Trustee who is an interested person may be sent to Fidelity Investments, 82 Devonshire Street, Boston, Massachusetts 02109.
Name, Age; Principal Occupations and Other Relevant Experience+ |
Abigail P. Johnson (49) |
| Year of Election or Appointment: 2009 Ms. Johnson is Trustee and Chairman of the Board of Trustees of certain Trusts. Ms. Johnson serves as President of Personal, Workplace and Institutional Services (2005-present). Ms. Johnson is the Vice Chairman and Director (2007-present) of FMR LLC. Previously, Ms. Johnson served as President and a Director of FMR (2001-2005), a Trustee of other investment companies advised by FMR, Fidelity Investments Money Management, Inc., and FMR Co., Inc. (2001-2005), Senior Vice President of the Fidelity funds (2001-2005), and managed a number of Fidelity funds. Ms. Abigail P. Johnson and Mr. Arthur E. Johnson are not related. |
James C. Curvey (75) |
| Year of Election or Appointment: 2007 Mr. Curvey also serves as Trustee (2007-present) of other investment companies advised by FMR. Mr. Curvey is a Director of Fidelity Investments Money Management, Inc. (2009-present), Director of Fidelity Research & Analysis Co. (2009-present) and Director of FMR and FMR Co., Inc. (2007-present). Mr. Curvey is also Vice Chairman (2007-present) and Director of FMR LLC. In addition, Mr. Curvey serves as an Overseer for the Boston Symphony Orchestra and a member of the Trustees of Villanova University. Previously, Mr. Curvey was the Vice Chairman (2006-2007) and Director (2000-2007) of FMR Corp. |
* Trustees have been determined to be "Interested Trustees" by virtue of, among other things, their affiliation with the trust or various entities under common control with FMR.
+ The information above includes each Trustee's principal occupation during the last five years and other information relating to the experience, attributes, and skills relevant to each Trustee's qualifications to serve as a Trustee, which led to the conclusion that each Trustee should serve as a Trustee for the fund.
Independent Trustees:
Correspondence intended for each Independent Trustee (that is, the Trustees other than the Interested Trustees) may be sent to Fidelity Investments, P.O. Box 55235, Boston, Massachusetts 02205-5235.
Name, Age; Principal Occupations and Other Relevant Experience+ |
Albert R. Gamper, Jr. (68) |
| Year of Election or Appointment: 2006 Prior to his retirement in December 2004, Mr. Gamper served as Chairman of the Board of CIT Group Inc. (commercial finance). During his tenure with CIT Group Inc. Mr. Gamper served in numerous senior management positions, including Chairman (1987-1989; 1999-2001; 2002-2004), Chief Executive Officer (1987-2004), and President (2002-2003). He also served as President and Chief Executive Officer of Tyco Capital Corporation (2001-2002). Mr. Gamper currently serves as a member of the Board of Directors of Public Service Enterprise Group (utilities, 2000-present), a member of the Board of Trustees, Rutgers University (2004-present), and Chairman of the Board of Saint Barnabas Health Care System. Previously, Mr. Gamper served as Chairman of the Board of Governors, Rutgers University (2004-2007). |
Robert F. Gartland (59) |
| Year of Election or Appointment: 2010 Mr. Gartland is a partner and investor of Vietnam Partners LLC (investments and consulting, 2008-present) and is Chairman and an investor in Gartland and Mellina Group Corp. (consulting, 2009-present). Prior to his retirement, Mr. Gartland held a variety of positions at Morgan Stanley (financial services, 1979-2007) including Managing Director (1987-2007). |
Arthur E. Johnson (63) |
| Year of Election or Appointment: 2008 Mr. Johnson serves as a member of the Board of Directors of Eaton Corporation (diversified power management, 2009-present) and AGL Resources, Inc. (holding company). Prior to his retirement, Mr. Johnson served as Senior Vice President of Corporate Strategic Development of Lockheed Martin Corporation (defense contractor, 1999-2009). He previously served on the Board of Directors of IKON Office Solutions, Inc. (1999-2008) and Delta Airlines (2005-2007). Mr. Arthur E. Johnson and Ms. Abigail P. Johnson are not related. |
Michael E. Kenneally (56) |
| Year of Election or Appointment: 2009 Previously, Mr. Kenneally served as a Member of the Advisory Board for certain Fidelity Fixed Income and Asset Allocation Funds (2008-2009). Prior to his retirement, Mr. Kenneally served as Chairman and Global Chief Executive Officer of Credit Suisse Asset Management (2003-2005). Mr. Kenneally was a Director of the Credit Suisse Funds (U.S. mutual funds, 2004-2008) and certain other closed-end funds (2004-2005) and was awarded the Chartered Financial Analyst (CFA) designation in 1991. |
James H. Keyes (70) |
| Year of Election or Appointment: 2007 Mr. Keyes serves as a member of the Boards of Navistar International Corporation (manufacture and sale of trucks, buses, and diesel engines, since 2002) and Pitney Bowes, Inc. (integrated mail, messaging, and document management solutions, since 1998). Prior to his retirement, Mr. Keyes served as Chairman and Chief Executive Officer of Johnson Controls (automotive, building, and energy, 1998-2002) and as a member of the Board of LSI Logic Corporation (semiconductor technologies, 1984-2008). |
Marie L. Knowles (64) |
| Year of Election or Appointment: 2001 Prior to Ms. Knowles' retirement in June 2000, she served as Executive Vice President and Chief Financial Officer of Atlantic Richfield Company (ARCO) (diversified energy, 1996-2000). From 1993 to 1996, she was a Senior Vice President of ARCO and President of ARCO Transportation Company. She served as a Director of ARCO from 1996 to 1998. Ms. Knowles currently serves as a Director and Chairman of the Audit Committee of McKesson Corporation (healthcare service, since 2002). Ms. Knowles is an Honorary Trustee of the Brookings Institution and a member of the Board of the Catalina Island Conservancy and of the Santa Catalina Island Company (2009-present). She also serves as a member of the Advisory Board for the School of Engineering of the University of Southern California and the Foundation Board of the School of Architecture at the University of Virginia (2007-present). Previously, Ms. Knowles served as a Director of Phelps Dodge Corporation (copper mining and manufacturing, 1994-2007). |
Kenneth L. Wolfe (71) |
| Year of Election or Appointment: 2005 Mr. Wolfe is Chairman of the Independent Trustees of the Fixed Income and Asset Allocation Funds (2008-present). Prior to his retirement, Mr. Wolfe served as Chairman and a Director (2007-2009) and Chairman and Chief Executive Officer (1994-2001) of Hershey Foods Corporation. He also served as a member of the Boards of Adelphia Communications Corporation (telecommunications, 2003-2006), Bausch & Lomb, Inc. (medical/pharmaceutical, 1993-2007), and Revlon, Inc. (personal care products, 2004-2009). |
+ The information above includes each Trustee's principal occupation during the last five years and other information relating to the experience, attributes, and skills relevant to each Trustee's qualifications to serve as a Trustee, which led to the conclusion that each Trustee should serve as a Trustee for the fund.
Executive Officers:
Correspondence intended for each executive officer may be sent to Fidelity Investments, 82 Devonshire Street, Boston, Massachusetts 02109.
Name, Age; Principal Occupation |
John R. Hebble (52) |
| Year of Election or Appointment: 2008 President and Treasurer of Fidelity's Fixed Income and Asset Allocation Funds. Mr. Hebble also serves as Treasurer and Chief Financial Officer of The North Carolina Capital Management Trust: Cash and Term Portfolio (2008-present), Assistant Treasurer of other Fidelity funds (2009-present) and is an employee of Fidelity Investments. |
Boyce I. Greer (54) |
| Year of Election or Appointment: 2005 Vice President of Fidelity's Fixed Income Funds and Asset Allocation Funds (2005). Mr. Greer is also a Trustee of other investment companies advised by FMR. Mr. Greer is President of The North Carolina Capital Management Trust: Cash and Term Portfolio (2003-present), the Asset Allocation Division (2008-present), President and a Director of Strategic Advisers, Inc. (2008-present), President of FIMM 130/30 LLC (2008-present), Director of Ballyrock Investment Advisors LLC (2006-present), and an Executive Vice President of FMR (2005-present). Previously, Mr. Greer served as Executive Vice President of FMR Co., Inc. (2005-2009), President and Director of Fidelity Investments Money Management, Inc. (2007-2009) and as a Director and Managing Director of Strategic Advisers, Inc. (2002-2005). |
Christopher P. Sullivan (56) |
| Year of Election or Appointment: 2009 Vice President of Fidelity's Bond Funds. Mr. Sullivan also serves as President of Fidelity's Bond Division (2009-present). Mr. Sullivan is Executive Vice President of Fidelity Investments Money Management, Inc. (2009-present), and a Director of Fidelity Management & Research (U.K.) Inc. (2010-present). Previously, Mr. Sullivan served as Managing Director, Co-Head of U.S. Fixed Income at Goldman Sachs Asset Management (2001-2009). |
Christine J. Thompson (52) |
| Year of Election or Appointment: 2010 Vice President of Fidelity's Bond Funds. Ms. Thompson also serves as Chief Investment Officer of FMR's Bond Group (2010-present) and is an employee of Fidelity Investments. Previously, Ms. Thompson served as Director of Municipal Bond Portfolio Managers (2002-2010). |
Scott C. Goebel (42) |
| Year of Election or Appointment: 2008 Secretary and Chief Legal Officer (CLO) of the Fidelity funds. Mr. Goebel also serves as Secretary and CLO of The North Carolina Capital Management Trust: Cash and Term Portfolio (2008-present); General Counsel, Secretary, and Senior Vice President of FMR (2008-present) and FMR Co., Inc. (2008-present); Deputy General Counsel of FMR LLC; Chief Legal Officer of Fidelity Management & Research (Hong Kong) Limited (2008-present) and Assistant Secretary of Fidelity Management & Research (Japan) Inc. (2008-present), Fidelity Investments Money Management, Inc. (2008-present), Fidelity Management & Research (U.K.) Inc. (2008-present), and Fidelity Research and Analysis Company (2008-present). Previously, Mr. Goebel served as Assistant Secretary of the Funds (2007-2008) and as Vice President and Secretary of Fidelity Distributors Corporation (FDC) (2005-2007). |
David J. Carter (37) |
| Year of Election or Appointment: 2010 Assistant Secretary of Fidelity's Fixed Income and Asset Allocation Funds. Mr. Carter also serves as Vice President, Associate General Counsel (2010-present) and is an employee of Fidelity Investments (2005-present). |
Holly C. Laurent (56) |
| Year of Election or Appointment: 2008 Anti-Money Laundering (AML) Officer of the Fidelity funds. Ms. Laurent also serves as AML Officer of The North Carolina Capital Management Trust: Cash and Term Portfolio (2008-present) and is an employee of Fidelity Investments. Previously, Ms. Laurent was Senior Vice President and Head of Legal for Fidelity Business Services India Pvt. Ltd. (2006-2008), and Senior Vice President, Deputy General Counsel and Group Head for FMR LLC (2005-2006). |
Christine Reynolds (52) |
| Year of Election or Appointment: 2008 Chief Financial Officer of the Fidelity funds. Ms. Reynolds became President of Fidelity Pricing and Cash Management Services (FPCMS) in August 2008. Ms. Reynolds served as Chief Operating Officer of FPCMS (2007-2008). Previously, Ms. Reynolds served as President, Treasurer, and Anti-Money Laundering officer of the Fidelity funds (2004-2007). |
Michael H. Whitaker (43) |
| Year of Election or Appointment: 2008 Chief Compliance Officer of Fidelity's Fixed Income and Asset Allocation Funds. Mr. Whitaker also serves as Chief Compliance Officer of The North Carolina Capital Management Trust: Cash and Term Portfolio (2008-present). Mr. Whitaker is an employee of Fidelity Investments (2007-present). Prior to joining Fidelity Investments, Mr. Whitaker worked at MFS Investment Management where he served as Senior Vice President and Chief Compliance Officer (2004-2006), and Assistant General Counsel. |
Jeffrey S. Christian (49) |
| Year of Election or Appointment: 2009 Deputy Treasurer of the Fidelity funds. Mr. Christian is an employee of Fidelity Investments. Previously, Mr. Christian served as Chief Financial Officer (2008-2009) of certain Fidelity funds and Senior Vice President of Fidelity Pricing and Cash Management Services (FPCMS) (2004-2009). |
Bryan A. Mehrmann (49) |
| Year of Election or Appointment: 2005 Deputy Treasurer of the Fidelity funds. Mr. Mehrmann is an employee of Fidelity Investments. |
Stephanie J. Dorsey (41) |
| Year of Election or Appointment: 2008 Deputy Treasurer of Fidelity's Fixed Income and Asset Allocation Funds. Ms. Dorsey also serves as Assistant Treasurer of other Fidelity funds (2010-present) and is an employee of Fidelity Investments (2008-present). Previously, Ms. Dorsey served as Treasurer (2004-2008) of the JPMorgan Mutual Funds and Vice President (2004-2008) of JPMorgan Chase Bank. |
Adrien E. Deberghes (43) |
| Year of Election or Appointment: 2010 Assistant Treasurer of Fidelity's Fixed Income and Asset Allocation Funds. Mr. Deberghes also serves as Deputy Treasurer of other Fidelity funds (2008-present) and is an employee of Fidelity Investments (2008-present). Previously, Mr. Deberghes served as Senior Vice President of Mutual Fund Administration at State Street Corporation (2007-2008), Senior Director of Mutual Fund Administration at Investors Bank & Trust (2005-2007), and Director of Finance for Dunkin' Brands (2000-2005). |
Kenneth B. Robins (41) |
| Year of Election or Appointment: 2009 Assistant Treasurer of the Fidelity Fixed Income and Asset Allocation Funds. Mr. Robins also serves as President and Treasurer of other Fidelity funds (2008-present; 2010-present) and is an employee of Fidelity Investments (2004-present). Previously, Mr. Robins served as Deputy Treasurer of the Fidelity funds (2005-2008) and Treasurer and Chief Financial Officer of The North Carolina Capital Management Trust: Cash and Term Portfolios (2006-2008). |
Gary W. Ryan (52) |
| Year of Election or Appointment: 2005 Assistant Treasurer of the Fidelity funds. Mr. Ryan is an employee of Fidelity Investments. Previously, Mr. Ryan served as Vice President of Fund Reporting in Fidelity Pricing and Cash Management Services (FPCMS) (1999-2005). |
Jonathan Davis (42) |
| Year of Election or Appointment: 2010 Assistant Treasurer of the Fidelity funds. Mr. Davis is an employee of Fidelity Investments. Previously, Mr. Davis served as Vice President and Associate General Counsel of FMR LLC (2003-2010). |
Annual Report
The Board of Trustees of VIP Investment Grade Bond Portfolio voted to pay to shareholders of record at the opening of business on record date, the following distributions per share derived from capital gains realized from sales of portfolio securities, and dividends derived from net investment income:
| Pay Date | Record Date | Dividends | Capital Gains |
Initial Class | 02/11/11 | 02/11/11 | $0.005 | $0.214 |
| | | | |
Service Class | 02/11/11 | 02/11/11 | $0.005 | $0.214 |
| | | | |
Service Class 2 | 02/11/11 | 02/11/11 | $0.005 | $0.214 |
| | | | |
Investor Class | 02/11/11 | 02/11/11 | $0.005 | $0.214 |
The fund hereby designates as a capital gain dividend with respect to the taxable year ended December 31, 2010, $47,565,134, or, if subsequently determined to be different, the net capital gain of such year.
A total of 9.32% of the dividends distributed during the fiscal year was derived from interest on U.S. Government securities which is generally exempt from state income tax.
Annual Report
Board Approval of Investment Advisory Contracts and Management Fees
VIP Investment Grade Bond Portfolio
Each year, the Board of Trustees, including the Independent Trustees (together, the Board), votes on the renewal of the management contract and sub-advisory agreements (together, the Advisory Contracts) for the fund. The Board, assisted by the advice of fund counsel and Independent Trustees' counsel, requests and considers a broad range of information relevant to the renewal of the Advisory Contracts throughout the year.
The Board meets regularly and considers at each of its meetings factors that are relevant to its annual consideration of the renewal of the fund's Advisory Contracts, including the services and support provided to the fund and its shareholders. The Board has established three standing committees, each composed of Independent Trustees with varying backgrounds, to which the Board has assigned specific subject matter responsibilities in order to enhance effective decision-making by the Board. The Operations Committee, of which all of the Independent Trustees are members, meets regularly throughout the year and, among other matters, considers matters specifically related to the annual consideration of the renewal of the fund's Advisory Contracts. The Board, acting directly and through its Committees, requests and receives information concerning the annual consideration of the renewal of the fund's Advisory Contracts. The Board also meets as needed to consider matters specifically related to the Board's annual consideration of the renewal of Advisory Contracts. Members of the Board may also meet with trustees of other Fidelity funds through ad hoc joint committees to discuss certain matters relevant to the Fidelity funds.
At its September 2010 meeting, the Board of Trustees, including the Independent Trustees, unanimously determined to renew the fund's Advisory Contracts. In reaching its determination, the Board considered all factors it believed relevant, including (i) the nature, extent, and quality of the services to be provided to the fund and its shareholders (including the investment performance of the fund); (ii) the competitiveness of the fund's management fee and total expenses; (iii) the total costs of the services to be provided by and the profits to be realized by Fidelity from its relationship with the fund; (iv) the extent to which economies of scale would be realized as the fund grows; and (v) whether fee levels reflect these economies of scale, if any, for the benefit of fund shareholders.
In considering whether to renew the Advisory Contracts for the fund, the Board reached a determination, with the assistance of fund counsel and Independent Trustees' counsel and through the exercise of its business judgment, that the renewal of the Advisory Contracts is in the best interests of the fund and its shareholders and that the compensation to be received by Fidelity under the management contract is fair and reasonable. The Board's decision to renew the Advisory Contracts was not based on any single factor, but rather was based on a comprehensive consideration of all the information provided to the Board at its meetings throughout the year. The Board, in reaching its determination to renew the Advisory Contracts, is aware that shareholders in the fund have a broad range of investment choices available to them, including a wide choice among mutual funds offered by Fidelity's competitors, and that the fund's shareholders, with the opportunity to review and weigh the disclosure provided by the fund in its prospectus and other public disclosures, have chosen to invest in this fund, managed by Fidelity.
Nature, Extent, and Quality of Services Provided. The Board considered the staffing within the investment adviser, FMR, and the sub-advisers (together, the Investment Advisers), including the backgrounds of the fund's investment personnel and the fund's investment objective and discipline. The Independent Trustees also had discussions with senior management of Fidelity's investment operations and investment groups. The Board considered the structure of the portfolio manager compensation program and whether this structure provides appropriate incentives to act in the best interest of the fund.
Resources Dedicated to Investment Management and Support Services. The Board reviewed the size, education, and experience of the Investment Advisers' investment staff, their use of technology, and the Investment Advisers' approach to recruiting, training, and retaining portfolio managers and other research, advisory, and management personnel. The Board noted that Fidelity's analysts have access to a variety of technological tools and market and securities data that enable them to perform both fundamental and quantitative analysis and to specialize in various disciplines. The Board considered Fidelity's extensive global research capabilities that enable the Investment Advisers to aggregate data from various sources in an effort to produce positive investment results. The Board also considered that Fidelity's portfolio managers and analysts have access to daily portfolio attribution that allows for monitoring of a fund's portfolio, as well as an electronic communication system that provides immediate real-time access to research concerning issuers and credit enhancers. In addition, the Board considered the trading resources that are an integral part of the fixed-income portfolio management investment process.
Shareholder and Administrative Services. The Board considered (i) the nature, extent, quality, and cost of advisory, administrative, and shareholder services performed by the Investment Advisers and their affiliates under the Advisory Contracts and under separate agreements covering transfer agency, pricing and bookkeeping, and securities lending services for the fund; (ii) the nature and extent of the investment adviser's supervision of third party service providers, principally custodians and subcustodians; and (iii) the resources devoted to, and the record of compliance with, the fund's compliance policies and procedures.
The Board noted that the growth of fund assets over time across the complex allows Fidelity to reinvest in the development of services designed to enhance the value or convenience of the Fidelity funds as investment vehicles. These services include 24-hour access to account information and market information through telephone representatives and over the Internet, and investor education materials and asset allocation tools.
Annual Report
Board Approval of Investment Advisory Contracts and Management Fees - continued
Investment in a Large Fund Family. The Board considered the benefits to shareholders of investing in a Fidelity fund, including the benefits of investing in a fund that is part of a large family of funds offering a variety of investment disciplines and providing a large variety of mutual fund investor services. The Board noted that Fidelity had taken, or had made recommendations that resulted in the Fidelity funds taking, a number of actions over the previous year that benefited particular funds, including (i) dedicating additional resources to investment research and restructuring and broadening the focus of the investment research teams; (ii) bolstering the senior management team that oversees asset management; (iii) launching Class F of certain funds as a lower-fee class available to Freedom K and Freedom Index Funds; (iv) lowering the initial investment minimums and ongoing balance requirements for Real Estate High Income Fund; (v) eliminating subsequent purchase minimums for all funds and adding a waiver of the investment minimum requirement for new accounts opened with the proceeds of a systematic withdrawal plan; (vi) eliminating the withdrawal minimum and maximum limits for systematic withdrawals from Advisor funds; (vii) expanding sales load waivers on Class A shares for Destiny Planholders and expanding Institutional Class eligibility for Class O Destiny Planholders; and (viii) changing certain Class A and Class T sales charge structures to further align them with industry practices.
Investment Performance. The Board considered whether the fund has operated in accordance with its investment objective, as well as its record of compliance with its investment restrictions. It also reviewed the fund's absolute investment performance for each class, as well as the fund's relative investment performance for each class measured over multiple periods against (i) a broad-based securities market index, and (ii) a peer group of mutual funds deemed appropriate by Fidelity and reviewed by the Board. The following charts considered by the Board show, over the one-, three-, and five-year periods ended December 31, 2009, the cumulative total returns of Initial Class and Service Class 2 of the fund, the cumulative total returns of a broad-based securities market index ("benchmark"), and a range of cumulative total returns of a peer group of mutual funds identified by Lipper Inc. as having an investment objective similar to that of the fund. The returns of Initial Class and Service Class 2 show the performance of the highest and lowest performing classes, respectively (based on five-year performance). The box within each chart shows the 25th percentile return (bottom of box) and the 75th percentile return (top of box) of the peer group. Returns shown above the box are in the first quartile and returns shown below the box are in the fourth quartile. The percentage beaten numbers noted below each chart correspond to the percentile box and represent the percentage of funds in the peer group whose performance was equal to or lower than that of the class indicated.
VIP Investment Grade Bond Portfolio
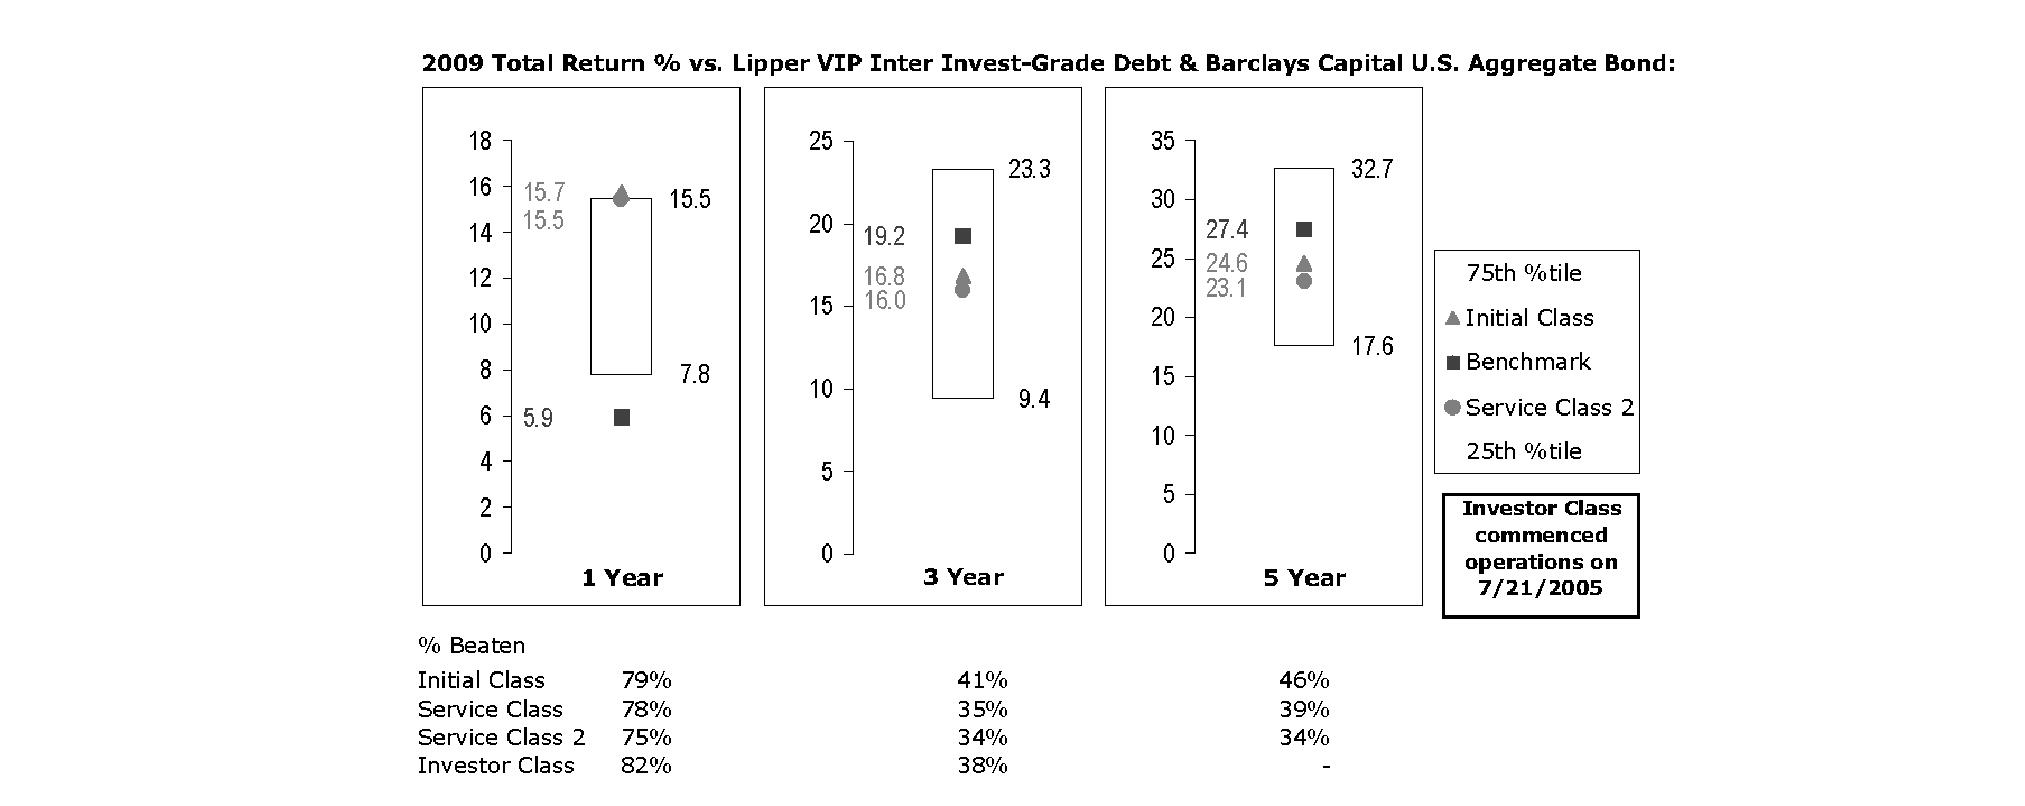
The Board reviewed the fund's relative investment performance against its peer group and noted that the performance of Initial Class of the fund was in the first quartile for the one-year period and the third quartile for the three- and five-year periods. The Board also noted that the investment performance of the fund was lower than its benchmark for the three- and five-year periods, although the one-year cumulative total return of Initial Class compared favorably to its benchmark. The Board considered that the variations in performance among the fund's classes reflect the variations in class expenses, which result in lower performance for higher expense classes. The Board also reviewed the fund's performance since inception as well as performance in the current year.
Based on its review, and giving particular weight to the nature and quality of the resources dedicated by the Investment Advisers to maintain and improve relative performance and factoring in the unprecedented market events in recent years, the Board concluded that the nature, extent, and quality of investment management and support services and of shareholder and administrative services provided to the fund will benefit the fund's shareholders, particularly in light of the Board's view that the fund's shareholders benefit from investing in a fund that is part of a large family of funds offering a variety of investment disciplines and services.
Annual Report
Competitiveness of Management Fee and Total Fund Expenses. The Board considered the fund's management fee and total expenses compared to "mapped groups" of competitive funds and classes. Fidelity creates "mapped groups" by combining similar Lipper investment objective categories that have comparable management fee characteristics. Combining Lipper investment objective categories aids the Board's management fee and total expense comparisons by broadening the competitive group used for comparison and by reducing the number of universes to which various Fidelity funds are compared.
Management Fee. The Board considered two proprietary management fee comparisons for the 12-month periods shown in the chart below. The group of Lipper funds used by the Board for management fee comparisons is referred to below as the "Total Mapped Group" and, for the reasons explained above, is broader than the Lipper peer group used by the Board for performance comparisons. The Total Mapped Group comparison focuses on a fund's standing relative to the total universe of comparable funds available to investors, in terms of gross management fees before expense reimbursements or caps. "TMG %" represents the percentage of funds in the Total Mapped Group that had management fees that were lower than the fund's. For example, a TMG % of 3% means that 97% of the funds in the Total Mapped Group had higher management fees than the fund. The "Asset-Size Peer Group" (ASPG) comparison focuses on a fund's standing relative to non-Fidelity funds similar in size to the fund within the Total Mapped Group. The ASPG represents at least 15% of the funds in the Total Mapped Group with comparable asset size and management fee characteristics, subject to a minimum of 50 funds (or all funds in the Total Mapped Group if fewer than 50). Additional information, such as the ASPG quartile in which the fund's management fee ranked, is also included in the chart and considered by the Board.
VIP Investment Grade Bond Portfolio
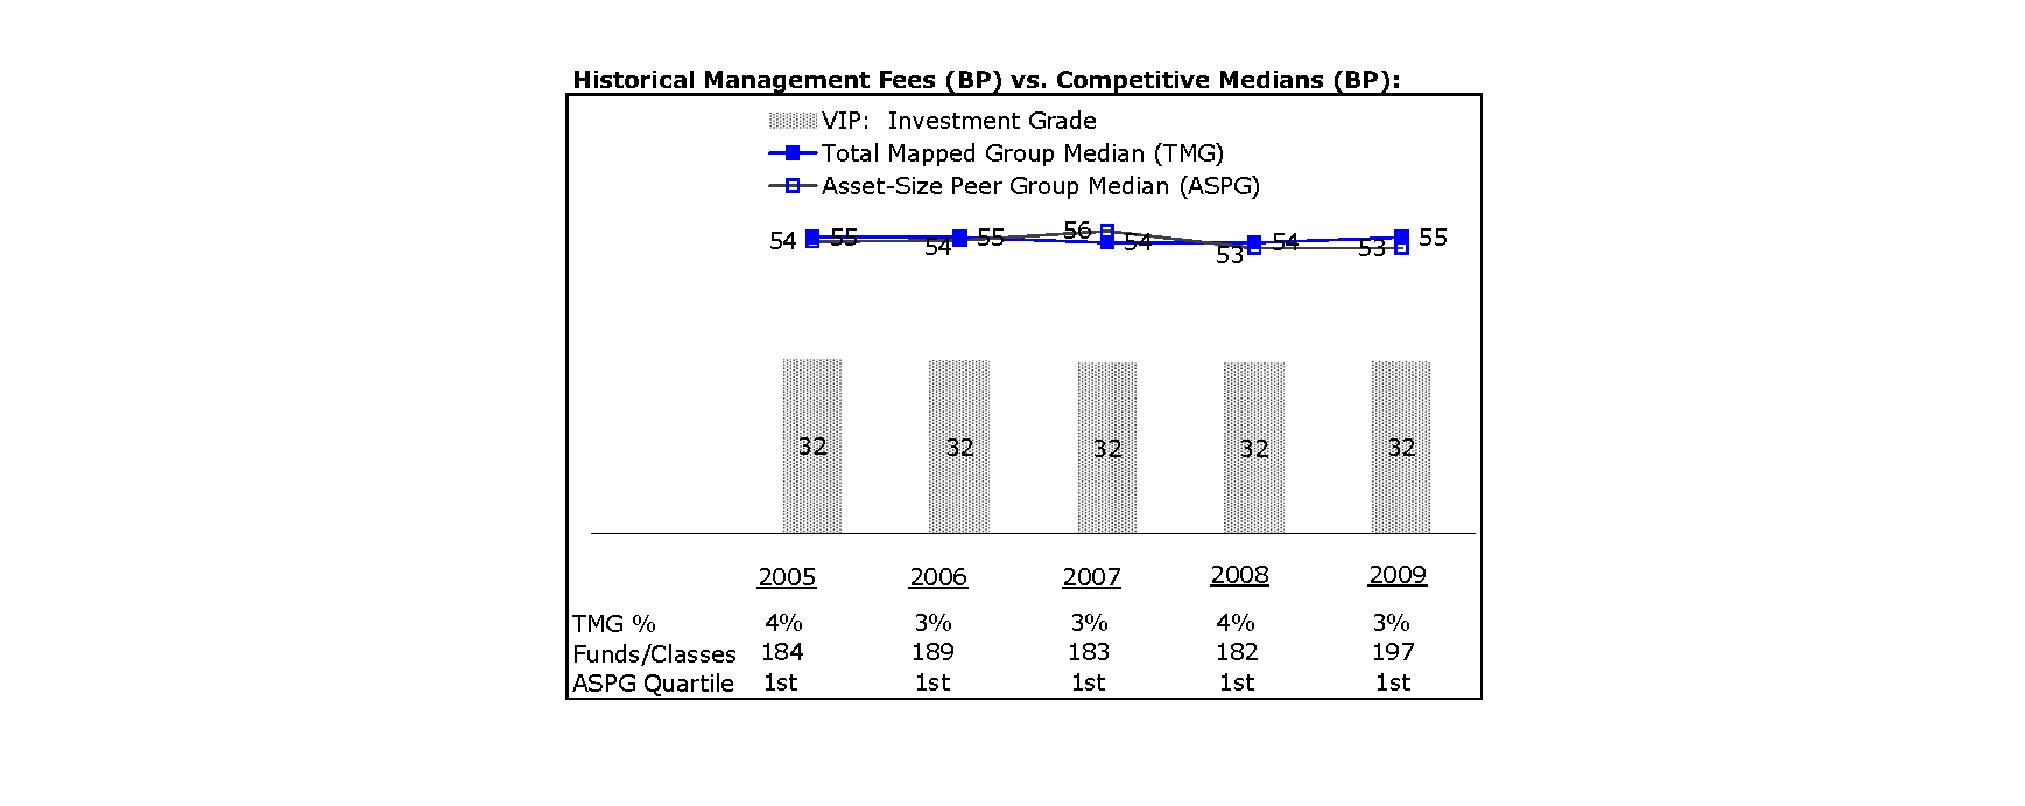
The Board noted that the fund's management fee ranked below the median of its Total Mapped Group and below the median of its ASPG for 2009.
Furthermore, the Board considered that it had approved an amendment (effective June 1, 2005) to the fund's management contract that lowered the fund's individual fund fee rate from 30 basis points to 20 basis points. The Board considered that the chart reflects the fund's lower management fee for 2005, as if the lower rate were in effect for the entire year.
Based on its review, the Board concluded that the fund's management fee is fair and reasonable in light of the services that the fund receives and the other factors considered.
Total Expenses. In its review of each class's total expenses, the Board considered the fund's management fee as well as other fund or class expenses, as applicable, such as transfer agent fees, pricing and bookkeeping fees, fund-paid 12b-1 fees, and custodial, legal, and audit fees. The Board also noted the effects of any waivers and reimbursements on fees and expenses. As part of its review, the Board also considered current and historical total expenses of each class of the fund compared to competitive fund median expenses. Each class of the fund is compared to those funds and classes in the Total Mapped Group (used by the Board for management fee comparisons) that have a similar sales load structure.
The Board noted that the total expenses of each class ranked below its competitive median for 2009.
Fees Charged to Other Fidelity Clients. The Board also considered Fidelity fee structures and other information with respect to clients of FMR and its affiliates, such as other mutual funds advised or subadvised by FMR or its affiliates, pension plan clients, and other institutional clients. In March 2010, the Board created an ad hoc joint committee with the board of other Fidelity funds (the Committee) to review and compare Fidelity's institutional investment advisory business with its business of providing services to the Fidelity funds, including the differences in services provided, fees charged, and costs incurred, as well as competition in their respective marketplaces.
Annual Report
Board Approval of Investment Advisory Contracts and Management Fees - continued
Based on its review of total expenses and fees charged to other Fidelity clients, the Board concluded that the total expenses of each class of the fund were reasonable in light of the services that the fund and its shareholders receive and the other factors considered, including the findings of the Committee.
Costs of the Services and Profitability. The Board considered the revenues earned and the expenses incurred by Fidelity in conducting the business of developing, marketing, distributing, managing, administering and servicing the fund and its shareholders. The Board also considered the level of Fidelity's profits in respect of all the Fidelity funds.
On an annual basis, FMR presents to the Board Fidelity's profitability for the fund. Fidelity calculates the profitability for each fund, as well as aggregate profitability for groups of Fidelity funds and all Fidelity funds, using a series of detailed revenue and cost allocation methodologies which originate with the audited books and records of Fidelity. The Audit Committee of the Board reviews any significant changes from the prior year's methodologies.
PricewaterhouseCoopers LLP (PwC), independent registered public accounting firm and auditor to Fidelity and certain Fidelity funds, has been engaged annually by the Board as part of the Board's assessment of Fidelity's profitability analysis. PwC's engagement includes the review and assessment of Fidelity's methodologies used in determining the revenues and expenses attributable to Fidelity's mutual fund business, and completion of agreed-upon procedures surrounding the mathematical accuracy of fund profitability and its conformity to allocation methodologies. After considering PwC's reports issued under the engagement and information provided by Fidelity, the Board believes that while other allocation methods may also be reasonable, Fidelity's profitability methodologies are reasonable in all material respects.
The Board has also reviewed Fidelity's non-fund businesses and fall-out benefits related to the mutual fund business as well as cases where Fidelity's affiliates may benefit from or be related to the fund's business.
The Board considered the costs of the services provided by and the profits realized by Fidelity in connection with the operation of the fund and were satisfied that the profitability was not excessive in the circumstances.
Economies of Scale. The Board considered whether there have been economies of scale in respect of the management of the Fidelity funds, whether the Fidelity funds (including the fund) have appropriately benefited from any such economies of scale, and whether there is potential for realization of any further economies of scale. The Board considered the extent to which the fund will benefit from economies of scale through increased services to the fund, through waivers or reimbursements, or through fee or expense reductions.
In February 2009, the Board and the board of other Fidelity funds created an ad hoc committee (the Economies of Scale Committee) to analyze whether FMR attains economies of scale in respect of the management and servicing of the Fidelity funds, whether the Fidelity funds have appropriately benefited from such economies of scale, and whether there is potential for realization of any further economies of scale.
The Board recognized that the fund's management contract incorporates a "group fee" structure, which provides for lower group fee rates as total fund assets under FMR's management increase, and for higher group fee rates as total fund assets under FMR's management decrease. FMR calculates the group fee rates based on a tiered asset "breakpoint" schedule that varies based on asset class. The Board considered that the group fee is designed to deliver the benefits of economies of scale to fund shareholders when total Fidelity fund assets increase, even if assets of any particular fund are unchanged or have declined, because some portion of Fidelity's costs are attributable to services provided to all Fidelity funds, and all funds benefit if those costs can be allocated among more assets. The Board concluded that, given the group fee structure, fund shareholders will benefit from lower management fees as assets under FMR's management increase at the fund complex level, regardless of whether Fidelity achieves any such economies of scale.
The Board concluded, considering the findings of the Economies of Scale Committee, that any potential economies of scale are being appropriately shared between fund shareholders and Fidelity.
Additional Information Requested by the Board. In order to develop fully the factual basis for consideration of the Fidelity funds' Advisory Contracts, the Board requested and received additional information on certain topics, including (i) fund performance trends, actions to be taken by FMR to improve certain funds' overall performance, and Fidelity's long-term strategies for certain funds; (ii) Fidelity's fund profitability methodology and profitability trends for certain funds; (iii) portfolio manager changes that have occurred during the past year and the amount of the investment that each portfolio manager has made in the Fidelity fund(s) that he or she manages; (iv) Fidelity's compensation structure for portfolio managers, research analysts, and other key personnel, including its effects on fund profitability, the rationale for the compensation structure, and the extent to which current market conditions have affected retention and recruitment; (v) the compensation paid by FMR to fund sub-advisers on behalf of the Fidelity funds; (vi) Fidelity's fee structures and rationale for recommending different fees among different categories of funds and classes, as well as Fidelity's voluntary waiver of fees to maintain minimum yields for certain funds and classes; (vii) the rationale for any differences between fund fee structures and fee structures in place for other Fidelity clients; and (viii) explanations regarding the relative total expenses borne by certain funds and classes, total expense competitive trends, and actions that might be taken by FMR to reduce total expenses for certain funds and classes or to achieve further economies of scale.
Annual Report
Based on its evaluation of all of the conclusions noted above, and after considering all factors it believed relevant, the Board ultimately concluded that the advisory fee structures are fair and reasonable, and that the fund's Advisory Contracts should be renewed.
Annual Report
The following are the financial statements for the Fidelity VIP Investment
Grade Central Fund as of December 31, 2010 which is a direct investment of
VIP Investment Grade Bond Portfolio.
Not Part of Financial Report
Performance: The Bottom Line
Average annual total return reflects the change in the value of an investment, assuming reinvestment of the fund's distributions from dividend income and capital gains (the profits earned upon the sale of securities that have grown in value, if any) and assuming a constant rate of performance each year. During periods of reimbursement by Fidelity, a fund's total return will be greater than it would be had the reimbursement not occurred. Performance numbers are net of all underlying fund operating expenses, but do not include any insurance charges imposed by your insurance company's separate account. If performance information included the effect of these additional charges, the total returns would have been lower. How a fund did yesterday is no guarantee of how it will do tomorrow.
Average Annual Total Returns
Periods ended December 31, 2010 | Past 1
year | Life of
fund A |
Fidelity® VIP Investment Grade Central Fund | 8.12% | 7.02% |
A From June 23, 2006
$10,000 Over Life of Fund
Let's say hypothetically that $10,000 was invested in Fidelity® VIP Investment Grade Central Fund on June 23, 2006, when the fund started. The chart shows how the value of your investment would have changed, and also shows how the Barclays Capital® U.S. Aggregate Bond Index performed over the same period.
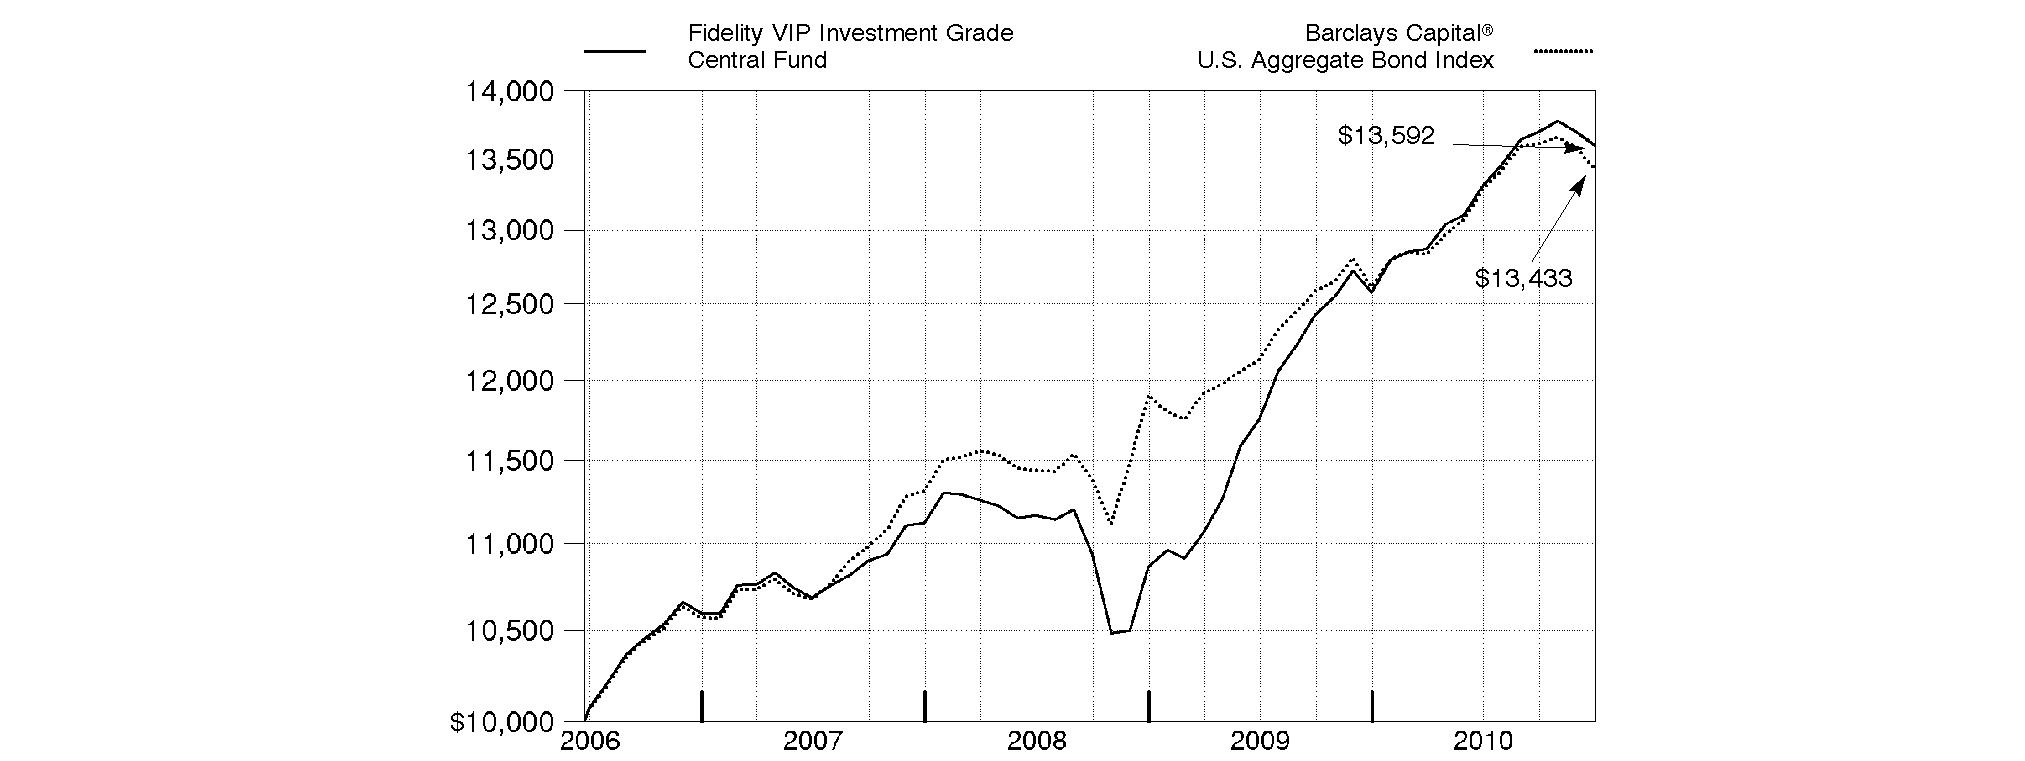
Annual Report
Management's Discussion of Fund Performance
Market Recap: While market improvements around the world hit a speed bump in the first half of the 12-month period ending December 31, 2010, world economies re-accelerated in August, supported by a broadening recovery and low inflation in the U.S. Domestic stock markets recorded solid gains for the year, lifted by a strong second-half rally fueled by economic optimism, encouraging earnings reports and a wave of corporate mergers. The large-cap S&P 500® Index rose 15.06%, the blue-chip-laden Dow Jones Industrial AverageSM added 14.06% and the technology-heavy Nasdaq Composite® Index climbed 18.02%. Meanwhile, international stocks, as represented by the MSCI® ACWI® (All Country World Index) ex USA Index, gained 11.29%, boosted in part by a depreciating U.S. dollar. In the fixed-income arena, U.S. taxable investment-grade bonds generated positive results during 2010, as the Barclays Capital® U.S. Aggregate Bond Index gained 6.54%. With ultra-low interest rates bolstering nearly all fixed-income securities for most of the year, sectors in the index with higher yields and more credit risk generally fared best, while most high-quality bonds generated more-moderate returns. Meanwhile, high-yield bonds, as represented by The BofA Merrill LynchSM US High Yield Constrained Index, returned 15.07%, a result of improved economic data and strengthening investor demand. Overseas, foreign bond markets showed mixed results, with a sizable disparity between the 3.97% return of the Citigroup® Non-U.S. Group of 7 Index - which measures the performance of sovereign debt of the major global economies outside the U.S. - and the 12.04% advance of the JPMorgan Emerging Markets Bond Index Global (EMBI Global), which benefited from the rising overall credit quality of emerging-markets debt issuers.
Comments from Ford O'Neil, Portfolio Manager of Fidelity® VIP Investment Grade Central Fund: For the year, the fund returned 8.12%, outpacing the Barclays Capital® U.S. Aggregate Bond Index. Sector selection was a key factor behind the fund's outperformance. Specifically, significant overweightings in higher-yielding, riskier segments of the investment-grade bond market - most notably corporate bonds and commercial mortgage-backed securities (CMBS) - bolstered relative performance, as these sectors significantly outpaced the index. A corresponding underweighting in lagging U.S. government bonds also helped, as did an out-of-index stake in Treasury Inflation-Protected Securities (TIPS). Advantageous security selection further boosted results, particularly among corporates and government-agency-backed mortgage securities. Within the corporate sector, an overweighting in bonds issued by financial companies - led by real estate investment trusts (REITS) - helped lift the fund's performance, as the area was a standout during the year. Among mortgages, a focus on securities with some measure of protection against prepayment - including those backed by older loans, low-balance loans, 15-year mortgages and hybrid adjustable-rate mortgages - proved beneficial. Detracting from results was exposure to European corporate bonds, which faltered in response to the continent's debt woes.
The views expressed above reflect those of the portfolio manager(s) only through the end of the period as stated on the cover of this report and do not necessarily represent the views of Fidelity or any other person in the Fidelity organization. Any such views are subject to change at any time based upon market or other conditions and Fidelity disclaims any responsibility to update such views. These views may not be relied on as investment advice and, because investment decisions for a Fidelity fund are based on numerous factors, may not be relied on as an indication of trading intent on behalf of any Fidelity fund.
Annual Report
Shareholder Expense Example
As a shareholder of the Fund, you incur two types of costs: (1) transaction costs, and (2) ongoing costs, including other Fund expenses. This Example is intended to help you understand your ongoing costs (in dollars) of investing in the Fund and to compare these costs with the ongoing costs of investing in other mutual funds.
The Example is based on an investment of $1,000 invested at the beginning of the period and held for the entire period (July 1, 2010 to December 31, 2010).
Actual Expenses
The first line of the accompanying table provides information about actual account values and actual expenses. You may use the information in this line, together with the amount you invested, to estimate the expenses that you paid over the period. Simply divide your account value by $1,000.00 (for example, an $8,600 account value divided by $1,000.00 = 8.6), then multiply the result by the number in the first line under the heading entitled "Expenses Paid During Period" to estimate the expenses you paid on your account during this period.
Hypothetical Example for Comparison Purposes
The second line of the accompanying table provides information about hypothetical account values and hypothetical expenses based on the Fund's actual expense ratio and an assumed rate of return of 5% per year before expenses, which is not the Fund's actual return. The hypothetical account values and expenses may not be used to estimate the actual ending account balance or expenses you paid for the period. You may use this information to compare the ongoing costs of investing in the Fund and other funds. To do so, compare this 5% hypothetical example with the 5% hypothetical examples that appear in the shareholder reports of the other funds.
Please note that the expenses shown in the table are meant to highlight your ongoing costs only and do not reflect any transaction costs. Therefore, the second line of the table is useful in comparing ongoing costs only, and will not help you determine the relative total costs of owning different funds.
| Annualized
Expense Ratio | Beginning
Account Value
July 1, 2010 | Ending
Account Value
December 31, 2010 | Expenses Paid
During Period*
July 1, 2010 to
December 31, 2010 |
Actual | .0027% | $ 1,000.00 | $ 1,021.50 | $ .01 |
Hypothetical (5% return per year before expenses) | | $ 1,000.00 | $ 1,025.19 | $ .01 |
* Expenses are equal to the Fund's annualized expense ratio, multiplied by the average account value over the period, multiplied by 184/365 (to reflect the one-half year period).
Annual Report
Investment Changes (Unaudited)
Quality Diversification (% of fund's net assets) |
As of December 31, 2010 | As of June 30, 2010 |
| U.S. Government and
U.S. Government
Agency Obligations† 72.9% | | | U.S. Government and
U.S. Government
Agency Obligations† 58.7% | |
| AAA 8.2% | | | AAA 7.7% | |
| AA 2.3% | | | AA 3.3% | |
| A 7.9% | | | A 8.2% | |
| BBB 13.5% | | | BBB 12.8% | |
| BB and Below 3.2% | | | BB and Below 2.3% | |
| Not Rated 0.1% | | | Not Rated 0.2% | |
 | Short-Term
Investments and
Net Other Assets*** (8.1)% | | | Short-Term
Investments and
Net Other Assets 6.8% | |

We have used ratings from Moody's Investors Service, Inc. Where Moody's® ratings are not available, we have used S&P® ratings. All ratings are as of the report date and do not reflect subsequent changes. Securities rated BB or below were rated investment grade at the time of acquisition. |
Weighted Average Maturity as of December 31, 2010 |
| | 6 months ago |
Years | 6.2 | 6.2 |
This is a weighted average of all the maturities of the securities held in a fund. WAM can be used as a measure of sensitivity to interest rate changes and markets changes. Generally, the longer the maturity, the greater the sensitivity to such changes. WAM is based on the dollar-weighted average length of time until principal payments must be paid. Depending on the types of securities held in a fund, certain maturity shortening devices (e.g., demand features, interest rate resets, and call options) may be taken into account when calculating the WAM. |
Duration as of December 31, 2010 |
| | 6 months ago |
Years | 4.7 | 3.9 |
Duration shows how much a bond fund's price fluctuates with changes in comparable interest rates. If rates rise 1%, for example, a fund with a five-year duration is likely to lose about 5% of its value. Other factors also can influence a bond fund's performance and share price. Accordingly, a bond fund's actual performance may differ from this example. |
Asset Allocation (% of fund's net assets) |
As of December 31, 2010 * | As of June 30, 2010 ** |
| Corporate Bonds 23.9% | | | Corporate Bonds 23.5% | |
| U.S. Government and
U.S. Government
Agency Obligations† 72.9% | | | U.S. Government and
U.S. Government
Agency Obligations† 58.7% | |
| Asset-Backed
Securities 2.6% | | | Asset-Backed
Securities 2.3% | |
| CMOs and
Other Mortgage
Related Securities 8.2% | | | CMOs and
Other Mortgage
Related Securities 8.4% | |
| Municipal Bonds 0.3% | | | Municipal Bonds 0.3% | |
| Other Investments 0.2% | |  | Other Investments 0.0% | |
| Short-Term
Investments and
Net Other Assets*** (8.1)% | | | Short-Term
Investments and
Net Other Assets 6.8% | |
* Foreign investments | 3.2% | | **Foreign investments | 4.3% | |
* Futures and Swaps | 2.4% | | **Futures and Swaps | 2.3% | |
*** Short-Term Investments and Net Other Assets are not included in the pie chart. |
† Includes FDIC Guaranteed Corporate Securities |

Annual Report
Investments December 31, 2010
Showing Percentage of Net Assets
Nonconvertible Bonds - 23.9% |
| Principal Amount | | Value |
CONSUMER DISCRETIONARY - 2.0% |
Household Durables - 0.2% |
Fortune Brands, Inc.: | | | | |
5.375% 1/15/16 | | $ 2,100,000 | | $ 2,171,705 |
5.875% 1/15/36 | | 5,329,000 | | 4,670,789 |
| | 6,842,494 |
Media - 1.8% |
AOL Time Warner, Inc. 7.625% 4/15/31 | | 1,625,000 | | 1,975,485 |
Comcast Corp.: | | | | |
4.95% 6/15/16 | | 2,975,000 | | 3,205,286 |
5.5% 3/15/11 | | 2,675,000 | | 2,701,108 |
5.7% 5/15/18 | | 2,400,000 | | 2,641,262 |
6.4% 3/1/40 | | 2,884,000 | | 3,091,259 |
6.45% 3/15/37 | | 1,410,000 | | 1,506,536 |
COX Communications, Inc. 4.625% 6/1/13 | | 3,475,000 | | 3,718,764 |
Discovery Communications LLC: | | | | |
3.7% 6/1/15 | | 2,648,000 | | 2,741,572 |
6.35% 6/1/40 | | 2,421,000 | | 2,614,876 |
NBC Universal, Inc.: | | | | |
3.65% 4/30/15 (c) | | 1,200,000 | | 1,230,834 |
5.15% 4/30/20 (c) | | 3,234,000 | | 3,352,442 |
6.4% 4/30/40 (c) | | 3,340,000 | | 3,546,960 |
News America Holdings, Inc. 7.75% 12/1/45 | | 1,905,000 | | 2,264,068 |
News America, Inc.: | | | | |
6.15% 3/1/37 | | 1,745,000 | | 1,819,307 |
6.2% 12/15/34 | | 5,840,000 | | 6,131,912 |
Time Warner Cable, Inc.: | | | | |
5.85% 5/1/17 | | 2,467,000 | | 2,752,674 |
6.2% 7/1/13 | | 7,000,000 | | 7,774,424 |
6.75% 7/1/18 | | 4,425,000 | | 5,158,130 |
Time Warner, Inc.: | | | | |
5.875% 11/15/16 | | 5,514,000 | | 6,223,746 |
6.5% 11/15/36 | | 2,337,000 | | 2,554,208 |
Viacom, Inc.: | | | | |
6.125% 10/5/17 | | 1,312,000 | | 1,480,120 |
6.75% 10/5/37 | | 935,000 | | 1,057,487 |
| | 69,542,460 |
TOTAL CONSUMER DISCRETIONARY | | 76,384,954 |
CONSUMER STAPLES - 1.3% |
Beverages - 0.3% |
Anheuser-Busch InBev Worldwide, Inc.: | | | | |
7.2% 1/15/14 (c) | | 3,000,000 | | 3,430,785 |
7.75% 1/15/19 (c) | | 3,200,000 | | 3,981,914 |
Diageo Capital PLC 5.2% 1/30/13 | | 1,705,000 | | 1,838,686 |
|
| Principal Amount | | Value |
FBG Finance Ltd. 5.125% 6/15/15 (c) | | $ 2,185,000 | | $ 2,318,746 |
| | 11,570,131 |
Food & Staples Retailing - 0.1% |
CVS Caremark Corp. 6.302% 6/1/37 (j) | | 3,037,000 | | 2,926,909 |
Food Products - 0.5% |
General Mills, Inc. 5.2% 3/17/15 | | 3,528,000 | | 3,894,810 |
Kraft Foods, Inc.: | | | | |
5.375% 2/10/20 | | 4,086,000 | | 4,397,635 |
6.125% 2/1/18 | | 3,684,000 | | 4,208,215 |
6.5% 8/11/17 | | 3,514,000 | | 4,090,549 |
| | 16,591,209 |
Tobacco - 0.4% |
Altria Group, Inc. 9.7% 11/10/18 | | 4,450,000 | | 5,870,556 |
Philip Morris International, Inc.: | | | | |
4.875% 5/16/13 | | 2,904,000 | | 3,143,731 |
5.65% 5/16/18 | | 2,751,000 | | 3,101,543 |
Reynolds American, Inc. 7.25% 6/15/37 | | 3,085,000 | | 3,207,576 |
| | 15,323,406 |
TOTAL CONSUMER STAPLES | | 46,411,655 |
ENERGY - 2.7% |
Energy Equipment & Services - 0.2% |
DCP Midstream LLC 5.35% 3/15/20 (c) | | 3,724,000 | | 3,859,688 |
El Paso Pipeline Partners Operating Co. LLC 4.1% 11/15/15 | | 3,902,000 | | 3,862,695 |
| | 7,722,383 |
Oil, Gas & Consumable Fuels - 2.5% |
Anadarko Petroleum Corp. 6.375% 9/15/17 | | 3,512,000 | | 3,825,646 |
Apache Corp. 5.1% 9/1/40 | | 3,242,000 | | 3,150,047 |
Canadian Natural Resources Ltd. 5.7% 5/15/17 | | 5,685,000 | | 6,481,810 |
ConocoPhillips 5.75% 2/1/19 | | 3,900,000 | | 4,444,495 |
Devon Financing Corp. U.L.C. 6.875% 9/30/11 | | 3,000,000 | | 3,134,124 |
Duke Capital LLC 6.25% 2/15/13 | | 855,000 | | 927,249 |
Duke Energy Field Services 6.45% 11/3/36 (c) | | 2,477,000 | | 2,571,943 |
El Paso Natural Gas Co. 5.95% 4/15/17 | | 3,330,000 | | 3,571,885 |
EnCana Holdings Finance Corp. 5.8% 5/1/14 | | 320,000 | | 356,364 |
Kaneb Pipe Line Operations Participation LP 7.75% 2/15/12 | | 4,200,000 | | 4,455,263 |
Motiva Enterprises LLC: | | | | |
5.75% 1/15/20 (c) | | 1,496,000 | | 1,678,080 |
6.85% 1/15/40 (c) | | 5,616,000 | | 6,527,213 |
Nakilat, Inc. 6.067% 12/31/33 (c) | | 1,808,000 | | 1,898,400 |
Nonconvertible Bonds - continued |
| Principal Amount | | Value |
ENERGY - continued |
Oil, Gas & Consumable Fuels - continued |
Nexen, Inc.: | | | | |
5.875% 3/10/35 | | $ 5,405,000 | | $ 5,025,764 |
6.4% 5/15/37 | | 2,125,000 | | 2,058,874 |
NGPL PipeCo LLC 6.514% 12/15/12 (c) | | 1,980,000 | | 2,137,034 |
Pemex Project Funding Master Trust 0.9034% 12/3/12 (c)(j) | | 410,000 | | 407,335 |
Petro-Canada: | | | | |
6.05% 5/15/18 | | 1,480,000 | | 1,681,523 |
6.8% 5/15/38 | | 3,485,000 | | 3,969,781 |
Petrobras International Finance
Co. Ltd.: | | | | |
5.75% 1/20/20 | | 2,320,000 | | 2,407,158 |
6.875% 1/20/40 | | 6,213,000 | | 6,461,520 |
7.875% 3/15/19 | | 4,277,000 | | 5,056,141 |
Plains All American Pipeline LP/PAA Finance Corp.: | | | | |
3.95% 9/15/15 | | 2,158,000 | | 2,229,814 |
6.125% 1/15/17 | | 1,250,000 | | 1,372,470 |
Ras Laffan Liquefied Natural Gas Co. Ltd. III: | | | | |
4.5% 9/30/12 (c) | | 2,009,000 | | 2,109,558 |
5.5% 9/30/14 (c) | | 2,808,000 | | 3,024,238 |
5.832% 9/30/16 (c) | | 2,118,975 | | 2,277,898 |
6.332% 9/30/27 (c) | | 2,415,000 | | 2,549,322 |
6.75% 9/30/19 (c) | | 1,838,000 | | 2,131,972 |
Suncor Energy, Inc. 6.1% 6/1/18 | | 4,665,000 | | 5,363,742 |
Transcontinental Gas Pipe Line Corp. 6.4% 4/15/16 | | 615,000 | | 707,226 |
| | 93,993,889 |
TOTAL ENERGY | | 101,716,272 |
FINANCIALS - 12.4% |
Capital Markets - 2.6% |
Bear Stearns Companies, Inc.: | | | | |
5.3% 10/30/15 | | 4,375,000 | | 4,747,654 |
6.95% 8/10/12 | | 2,070,000 | | 2,258,362 |
BlackRock, Inc. 6.25% 9/15/17 | | 1,507,000 | | 1,696,419 |
Goldman Sachs Group, Inc.: | | | | |
3.7% 8/1/15 | | 5,186,000 | | 5,284,078 |
5.625% 1/15/17 | | 3,000,000 | | 3,172,314 |
5.95% 1/18/18 | | 755,000 | | 819,087 |
6.15% 4/1/18 | | 5,954,000 | | 6,556,503 |
6.75% 10/1/37 | | 3,421,000 | | 3,497,617 |
Janus Capital Group, Inc.: | | | | |
6.125% 9/15/11 (b) | | 2,071,000 | | 2,115,342 |
6.5% 6/15/12 | | 6,054,000 | | 6,547,637 |
JPMorgan Chase Capital XX 6.55% 9/29/36 | | 3,090,000 | | 3,108,438 |
|
| Principal Amount | | Value |
JPMorgan Chase Capital XXV 6.8% 10/1/37 | | $ 6,975,000 | | $ 7,191,860 |
Lazard Group LLC: | | | | |
6.85% 6/15/17 | | 3,241,000 | | 3,390,481 |
7.125% 5/15/15 | | 5,585,000 | | 6,013,906 |
Merrill Lynch & Co., Inc.: | | | | |
5.45% 2/5/13 | | 1,820,000 | | 1,919,725 |
6.4% 8/28/17 | | 1,989,000 | | 2,102,912 |
6.875% 4/25/18 | | 1,676,000 | | 1,834,144 |
Morgan Stanley: | | | | |
4% 7/24/15 | | 11,995,000 | | 12,057,194 |
4.75% 4/1/14 | | 1,500,000 | | 1,536,041 |
5.95% 12/28/17 | | 2,100,000 | | 2,221,884 |
6% 5/13/14 | | 3,380,000 | | 3,652,022 |
6.625% 4/1/18 | | 10,165,000 | | 11,026,677 |
7.3% 5/13/19 | | 3,590,000 | | 4,041,040 |
UBS AG Stamford Branch 5.75% 4/25/18 | | 1,220,000 | | 1,325,812 |
| | 98,117,149 |
Commercial Banks - 2.3% |
Bank of America NA 5.3% 3/15/17 | | 6,480,000 | | 6,567,046 |
Credit Suisse (Guernsey) Ltd. 5.86% (j) | | 4,785,000 | | 4,521,825 |
Credit Suisse New York Branch 6% 2/15/18 | | 6,110,000 | | 6,551,716 |
DBS Bank Ltd. (Singapore) 0.5044% 5/16/17 (c)(j) | | 280,110 | | 273,725 |
Discover Bank: | | | | |
7% 4/15/20 | | 1,891,000 | | 2,032,904 |
8.7% 11/18/19 | | 6,339,000 | | 7,461,726 |
Export-Import Bank of Korea 5.5% 10/17/12 | | 6,570,000 | | 6,954,246 |
Fifth Third Bancorp: | | | | |
4.5% 6/1/18 | | 1,179,000 | | 1,136,262 |
8.25% 3/1/38 | | 4,319,000 | | 4,970,517 |
Fifth Third Bank 4.75% 2/1/15 | | 487,000 | | 505,070 |
Fifth Third Capital Trust IV 6.5% 4/15/67 (j) | | 1,585,000 | | 1,505,750 |
HBOS PLC 6.75% 5/21/18 (c) | | 2,600,000 | | 2,434,487 |
Huntington Bancshares, Inc. 7% 12/15/20 | | 1,004,000 | | 1,057,104 |
KeyBank NA: | | | | |
5.8% 7/1/14 | | 2,049,000 | | 2,195,526 |
6.95% 2/1/28 | | 800,000 | | 814,176 |
KeyBank NA, Cleveland 5.45% 3/3/16 | | 1,618,000 | | 1,702,704 |
Korea Development Bank 5.3% 1/17/13 | | 3,805,000 | | 4,028,411 |
Manufacturers & Traders Trust Co. 1.79% 4/1/13 (j) | | 269,000 | | 265,788 |
Marshall & Ilsley Bank: | | | | |
4.85% 6/16/15 | | 1,796,000 | | 1,824,759 |
5% 1/17/17 | | 2,497,000 | | 2,533,761 |
5.25% 9/4/12 | | 1,200,000 | | 1,236,642 |
Nonconvertible Bonds - continued |
| Principal Amount | | Value |
FINANCIALS - continued |
Commercial Banks - continued |
PNC Funding Corp. 3.625% 2/8/15 | | $ 1,165,000 | | $ 1,204,556 |
Regions Bank: | | | | |
6.45% 6/26/37 | | 3,952,000 | | 3,512,340 |
7.5% 5/15/18 | | 2,383,000 | | 2,454,490 |
Regions Financial Corp.: | | | | |
5.75% 6/15/15 | | 814,000 | | 796,703 |
7.75% 11/10/14 | | 2,367,000 | | 2,461,680 |
SouthTrust Corp. 5.8% 6/15/14 | | 1,440,000 | | 1,558,660 |
Wachovia Bank NA 4.875% 2/1/15 | | 4,405,000 | | 4,671,313 |
Wachovia Corp. 4.875% 2/15/14 | | 785,000 | | 826,669 |
Wells Fargo & Co.: | | | | |
3.625% 4/15/15 | | 4,064,000 | | 4,214,136 |
3.75% 10/1/14 | | 3,750,000 | | 3,914,569 |
| | 86,189,261 |
Consumer Finance - 0.7% |
Capital One Financial Corp. 5.7% 9/15/11 | | 1,991,000 | | 2,055,321 |
General Electric Capital Corp.: | | | | |
2.25% 11/9/15 | | 2,597,000 | | 2,496,639 |
3.5% 6/29/15 | | 1,573,000 | | 1,600,559 |
5.625% 9/15/17 | | 2,420,000 | | 2,653,530 |
5.625% 5/1/18 | | 9,700,000 | | 10,577,986 |
5.875% 1/14/38 | | 3,600,000 | | 3,736,976 |
6.375% 11/15/67 (j) | | 4,000,000 | | 3,960,000 |
| | 27,081,011 |
Diversified Financial Services - 1.9% |
Bank of America Corp. 5.75% 12/1/17 | | 12,165,000 | | 12,659,215 |
BP Capital Markets PLC 3.125% 10/1/15 | | 3,694,000 | | 3,691,462 |
Capital One Capital V 10.25% 8/15/39 | | 1,378,000 | | 1,474,460 |
Citigroup, Inc.: | | | | |
4.75% 5/19/15 | | 10,152,000 | | 10,630,129 |
5.375% 8/9/20 | | 3,993,000 | | 4,148,755 |
5.5% 4/11/13 | | 1,390,000 | | 1,480,114 |
6.125% 5/15/18 | | 6,240,000 | | 6,836,088 |
6.5% 8/19/13 | | 8,073,000 | | 8,864,630 |
JPMorgan Chase & Co. 6.3% 4/23/19 | | 3,920,000 | | 4,461,960 |
Prime Property Funding, Inc.: | | | | |
5.125% 6/1/15 (c) | | 3,375,000 | | 3,263,164 |
5.35% 4/15/12 (c) | | 1,700,000 | | 1,733,142 |
5.5% 1/15/14 (c) | | 2,405,000 | | 2,386,424 |
TECO Finance, Inc.: | | | | |
4% 3/15/16 | | 1,075,000 | | 1,096,132 |
5.15% 3/15/20 | | 1,545,000 | | 1,601,803 |
ZFS Finance USA Trust II 6.45% 12/15/65 (c)(j) | | 3,716,000 | | 3,655,615 |
|
| Principal Amount | | Value |
ZFS Finance USA Trust IV 5.875% 5/9/62 (c)(j) | | $ 500,000 | | $ 487,875 |
ZFS Finance USA Trust V 6.5% 5/9/67 (c)(j) | | 1,016,000 | | 990,600 |
| | 69,461,568 |
Insurance - 1.8% |
Allstate Corp. 6.2% 5/16/14 | | 2,709,000 | | 3,063,624 |
American International Group, Inc. 8.175% 5/15/68 (j) | | 3,075,000 | | 3,274,288 |
Aon Corp.: | | | | |
3.5% 9/30/15 | | 1,538,000 | | 1,538,758 |
5% 9/30/20 | | 1,792,000 | | 1,808,667 |
6.25% 9/30/40 | | 1,150,000 | | 1,182,175 |
Axis Capital Holdings Ltd. 5.75% 12/1/14 | | 420,000 | | 446,612 |
Lincoln National Corp. 7% 5/17/66 (j) | | 4,799,000 | | 4,679,025 |
Massachusetts Mutual Life Insurance Co. 8.875% 6/1/39 (c) | | 1,455,000 | | 1,947,411 |
MetLife, Inc.: | | | | |
2.375% 2/6/14 | | 2,161,000 | | 2,171,256 |
4.75% 2/8/21 | | 1,477,000 | | 1,508,051 |
5.875% 2/6/41 | | 1,140,000 | | 1,201,934 |
6.75% 6/1/16 | | 3,234,000 | | 3,736,928 |
Metropolitan Life Global Funding I 5.125% 6/10/14 (c) | | 2,884,000 | | 3,137,059 |
New York Life Global Funding 4.65% 5/9/13 (c) | | 6,045,000 | | 6,500,636 |
New York Life Insurance Co. 6.75% 11/15/39 (c) | | 1,348,000 | | 1,589,424 |
Northwestern Mutual Life Insurance Co. 6.063% 3/30/40 (c) | | 2,060,000 | | 2,275,361 |
Pacific Life Global Funding 5.15% 4/15/13 (c) | | 3,690,000 | | 3,944,924 |
Pacific Life Insurance Co. 9.25% 6/15/39 (c) | | 2,297,000 | | 2,985,030 |
Pacific LifeCorp 6% 2/10/20 (c) | | 2,514,000 | | 2,642,201 |
Prudential Financial, Inc.: | | | | |
7.375% 6/15/19 | | 1,250,000 | | 1,473,799 |
8.875% 6/15/38 (j) | | 4,682,000 | | 5,442,825 |
Symetra Financial Corp. 6.125% 4/1/16 (c) | | 6,355,000 | | 6,409,253 |
The Chubb Corp. 5.75% 5/15/18 | | 1,895,000 | | 2,105,476 |
Unum Group 5.625% 9/15/20 | | 2,099,000 | | 2,106,896 |
| | 67,171,613 |
Real Estate Investment Trusts - 0.8% |
AvalonBay Communities, Inc. 5.5% 1/15/12 | | 508,000 | | 528,709 |
Camden Property Trust 5.375% 12/15/13 | | 2,985,000 | | 3,197,941 |
Developers Diversified Realty Corp.: | | | | |
5.25% 4/15/11 | | 2,713,000 | | 2,737,425 |
5.375% 10/15/12 | | 1,252,000 | | 1,288,114 |
7.5% 4/1/17 | | 1,944,000 | | 2,171,625 |
Duke Realty LP 4.625% 5/15/13 | | 1,047,000 | | 1,089,510 |
Nonconvertible Bonds - continued |
| Principal Amount | | Value |
FINANCIALS - continued |
Real Estate Investment Trusts - continued |
Equity One, Inc. 6% 9/15/17 | | $ 2,405,000 | | $ 2,385,709 |
Federal Realty Investment Trust: | | | | |
5.4% 12/1/13 | | 1,401,000 | | 1,508,532 |
5.9% 4/1/20 | | 1,046,000 | | 1,109,301 |
HRPT Properties Trust: | | | | |
5.75% 11/1/15 | | 670,000 | | 697,630 |
6.25% 6/15/17 | | 4,455,000 | | 4,557,478 |
UDR, Inc. 5.5% 4/1/14 | | 3,685,000 | | 3,917,009 |
United Dominion Realty Trust, Inc. 5.25% 1/15/15 | | 904,000 | | 950,573 |
Washington (REIT) 5.95% 6/15/11 | | 3,042,000 | | 3,096,318 |
| | 29,235,874 |
Real Estate Management & Development - 1.9% |
AMB Property LP 5.9% 8/15/13 | | 2,575,000 | | 2,735,600 |
BioMed Realty LP 6.125% 4/15/20 (c) | | 1,392,000 | | 1,469,770 |
Brandywine Operating Partnership LP: | | | | |
5.7% 5/1/17 | | 5,000,000 | | 4,987,380 |
5.75% 4/1/12 | | 1,376,000 | | 1,424,841 |
Colonial Properties Trust: | | | | |
4.8% 4/1/11 | | 273,000 | | 273,634 |
5.5% 10/1/15 | | 6,290,000 | | 6,277,760 |
Digital Realty Trust LP 4.5% 7/15/15 (c) | | 1,829,000 | | 1,840,265 |
Duke Realty LP: | | | | |
5.4% 8/15/14 | | 2,242,000 | | 2,363,077 |
5.5% 3/1/16 | | 1,270,000 | | 1,321,834 |
5.625% 8/15/11 | | 3,781,000 | | 3,859,252 |
5.95% 2/15/17 | | 928,000 | | 966,491 |
6.25% 5/15/13 | | 2,913,000 | | 3,133,770 |
6.5% 1/15/18 | | 2,445,000 | | 2,608,915 |
ERP Operating LP: | | | | |
4.75% 7/15/20 | | 2,827,000 | | 2,849,203 |
5.375% 8/1/16 | | 1,066,000 | | 1,165,524 |
5.5% 10/1/12 | | 3,560,000 | | 3,801,578 |
5.75% 6/15/17 | | 4,365,000 | | 4,782,665 |
Liberty Property LP: | | | | |
4.75% 10/1/20 | | 4,185,000 | | 4,141,271 |
5.5% 12/15/16 | | 2,290,000 | | 2,479,230 |
6.625% 10/1/17 | | 2,673,000 | | 3,028,156 |
Post Apartment Homes LP 6.3% 6/1/13 | | 2,679,000 | | 2,879,427 |
Reckson Operating Partnership LP: | | | | |
5.15% 1/15/11 | | 810,000 | | 810,394 |
6% 3/31/16 | | 3,099,000 | | 3,192,339 |
Regency Centers LP: | | | | |
5.875% 6/15/17 | | 1,827,000 | | 1,948,139 |
6.75% 1/15/12 | | 2,035,000 | | 2,110,851 |
Simon Property Group LP: | | | | |
4.2% 2/1/15 | | 1,523,000 | | 1,592,494 |
|
| Principal Amount | | Value |
5.1% 6/15/15 | | $ 2,220,000 | | $ 2,409,590 |
Tanger Properties LP: | | | | |
6.125% 6/1/20 | | 1,657,000 | | 1,778,677 |
6.15% 11/15/15 | | 349,000 | | 378,626 |
| | 72,610,753 |
Thrifts & Mortgage Finance - 0.4% |
Bank of America Corp.: | | | | |
3.7% 9/1/15 | | 185,000 | | 183,403 |
5.65% 5/1/18 | | 4,438,000 | | 4,534,624 |
6.5% 8/1/16 | | 3,000,000 | | 3,255,279 |
First Niagara Financial Group, Inc. 6.75% 3/19/20 | | 3,095,000 | | 3,223,015 |
Independence Community Bank Corp. 2.11% 4/1/14 (j) | | 4,690,000 | | 4,689,934 |
| | 15,886,255 |
TOTAL FINANCIALS | | 465,753,484 |
HEALTH CARE - 0.2% |
Health Care Providers & Services - 0.2% |
Express Scripts, Inc.: | | | | |
5.25% 6/15/12 | | 3,016,000 | | 3,183,252 |
6.25% 6/15/14 | | 1,108,000 | | 1,238,702 |
Medco Health Solutions, Inc. 4.125% 9/15/20 | | 2,723,000 | | 2,632,950 |
| | 7,054,904 |
INDUSTRIALS - 0.6% |
Airlines - 0.4% |
American Airlines, Inc. pass-thru trust certificates 6.978% 10/1/12 | | 58,599 | | 58,892 |
Continental Airlines, Inc.: | | | | |
6.648% 3/15/19 | | 1,468,210 | | 1,534,279 |
6.795% 2/2/20 | | 2,733,498 | | 2,760,833 |
Delta Air Lines, Inc. pass-thru trust certificates 6.821% 8/10/22 | | 2,486,428 | | 2,672,911 |
Northwest Airlines, Inc. pass-thru trust certificates 7.027% 11/1/19 | | 2,877,094 | | 3,020,949 |
U.S. Airways pass-thru trust certificates: | | | | |
6.85% 7/30/19 | | 1,290,625 | | 1,290,625 |
8.36% 7/20/20 | | 4,631,669 | | 4,724,303 |
| | 16,062,792 |
Industrial Conglomerates - 0.2% |
General Electric Co. 5.25% 12/6/17 | | 7,130,000 | | 7,701,070 |
TOTAL INDUSTRIALS | | 23,763,862 |
Nonconvertible Bonds - continued |
| Principal Amount | | Value |
MATERIALS - 0.6% |
Chemicals - 0.3% |
Dow Chemical Co.: | | | | |
4.85% 8/15/12 | | $ 3,520,000 | | $ 3,710,710 |
7.6% 5/15/14 | | 7,213,000 | | 8,319,388 |
| | 12,030,098 |
Metals & Mining - 0.3% |
Anglo American Capital PLC: | | | | |
4.45% 9/27/20 (c) | | 935,000 | | 949,495 |
9.375% 4/8/14 (c) | | 2,675,000 | | 3,220,630 |
Corporacion Nacional del Cobre (Codelco) 3.75% 11/4/20 (c) | | 1,206,000 | | 1,148,272 |
United States Steel Corp. 6.65% 6/1/37 | | 1,771,000 | | 1,487,640 |
Vale Overseas Ltd. 6.25% 1/23/17 | | 3,115,000 | | 3,473,552 |
| | 10,279,589 |
TOTAL MATERIALS | | 22,309,687 |
TELECOMMUNICATION SERVICES - 1.5% |
Diversified Telecommunication Services - 1.0% |
AT&T, Inc.: | | | | |
6.3% 1/15/38 | | 364,000 | | 384,001 |
6.8% 5/15/36 | | 10,939,000 | | 12,115,096 |
BellSouth Capital Funding Corp. 7.875% 2/15/30 | | 526,000 | | 633,756 |
CenturyLink, Inc. 7.6% 9/15/39 | | 2,898,000 | | 2,920,886 |
Sprint Capital Corp. 6.875% 11/15/28 | | 5,000,000 | | 4,375,000 |
Telecom Italia Capital SA: | | | | |
4.95% 9/30/14 | | 2,000,000 | | 2,049,086 |
5.25% 10/1/15 | | 192,000 | | 196,581 |
6.999% 6/4/18 | | 3,792,000 | | 4,015,072 |
7.2% 7/18/36 | | 3,523,000 | | 3,308,315 |
Telefonica Emisiones SAU 5.855% 2/4/13 | | 1,438,000 | | 1,535,335 |
Verizon Communications, Inc.: | | | | |
6.1% 4/15/18 | | 2,190,000 | | 2,487,669 |
6.25% 4/1/37 | | 1,380,000 | | 1,472,539 |
6.9% 4/15/38 | | 2,420,000 | | 2,822,574 |
Verizon New York, Inc. 6.875% 4/1/12 | | 1,095,000 | | 1,168,092 |
| | 39,484,002 |
Wireless Telecommunication Services - 0.5% |
AT&T Wireless Services, Inc. 8.125% 5/1/12 | | 1,130,000 | | 1,234,394 |
DIRECTV Holdings LLC/DIRECTV Financing, Inc.: | | | | |
4.75% 10/1/14 | | 3,759,000 | | 4,006,184 |
5.875% 10/1/19 | | 4,711,000 | | 5,120,117 |
6.35% 3/15/40 | | 1,471,000 | | 1,547,448 |
|
| Principal Amount | | Value |
Sprint Nextel Corp. 6% 12/1/16 | | $ 2,260,000 | | $ 2,183,725 |
Vodafone Group PLC 5% 12/16/13 | | 2,775,000 | | 3,020,821 |
| | 17,112,689 |
TOTAL TELECOMMUNICATION SERVICES | | 56,596,691 |
UTILITIES - 2.6% |
Electric Utilities - 1.3% |
Alabama Power Co. 3.375% 10/1/20 | | 2,167,000 | | 2,049,650 |
Ameren Illinois Co. 6.125% 11/15/17 | | 1,465,000 | | 1,631,234 |
AmerenUE 6.4% 6/15/17 | | 3,819,000 | | 4,322,780 |
Commonwealth Edison Co. 5.4% 12/15/11 | | 1,925,000 | | 2,007,804 |
Duquesne Light Holdings, Inc. 6.4% 9/15/20 (c) | | 5,907,000 | | 5,863,028 |
Edison International 3.75% 9/15/17 | | 2,401,000 | | 2,384,049 |
EDP Finance BV: | | | | |
4.9% 10/1/19 (c) | | 1,100,000 | | 937,681 |
6% 2/2/18 (c) | | 1,864,000 | | 1,742,236 |
FirstEnergy Corp. 7.375% 11/15/31 | | 2,361,000 | | 2,488,879 |
FirstEnergy Solutions Corp.: | | | | |
4.8% 2/15/15 | | 990,000 | | 1,039,583 |
6.05% 8/15/21 | | 3,013,000 | | 3,095,158 |
Kentucky Utilities Co.: | | | | |
3.25% 11/1/20 (c) | | 284,000 | | 267,868 |
5.125% 11/1/40 (c) | | 2,032,000 | | 1,993,479 |
LG&E and KU Energy LLC: | | | | |
2.125% 11/15/15 (c) | | 2,670,000 | | 2,561,382 |
3.75% 11/15/20 (c) | | 525,000 | | 499,816 |
Louisville Gas & Electric Co. 5.125% 11/15/40 (c) | | 610,000 | | 599,338 |
Nevada Power Co. 6.5% 5/15/18 | | 3,165,000 | | 3,642,611 |
Pennsylvania Electric Co. 6.05% 9/1/17 | | 2,905,000 | | 3,143,422 |
Pepco Holdings, Inc. 2.7% 10/1/15 | | 2,535,000 | | 2,470,776 |
PPL Capital Funding, Inc. 6.7% 3/30/67 (j) | | 382,000 | | 374,360 |
Progress Energy, Inc.: | | | | |
5.625% 1/15/16 | | 2,000,000 | | 2,240,234 |
7.1% 3/1/11 | | 3,932,000 | | 3,971,996 |
Tampa Electric Co. 5.4% 5/15/21 (c) | | 1,329,000 | | 1,426,764 |
| | 50,754,128 |
Independent Power Producers & Energy Traders - 0.3% |
Exelon Generation Co. LLC 6.2% 10/1/17 | | 6,685,000 | | 7,481,685 |
Nonconvertible Bonds - continued |
| Principal Amount | | Value |
UTILITIES - continued |
Independent Power Producers & Energy Traders - continued |
PPL Energy Supply LLC: | | | | |
6.2% 5/15/16 | | $ 1,229,000 | | $ 1,353,192 |
6.5% 5/1/18 | | 2,640,000 | | 2,939,431 |
| | 11,774,308 |
Multi-Utilities - 1.0% |
Consolidated Edison Co. of New York, Inc. 5.7% 6/15/40 | | 1,395,000 | | 1,483,948 |
Dominion Resources, Inc.: | | | | |
6.25% 6/30/12 | | 1,938,000 | | 2,082,679 |
6.3% 9/30/66 (j) | | 9,626,000 | | 9,385,350 |
DTE Energy Co. 7.05% 6/1/11 | | 3,500,000 | | 3,588,092 |
MidAmerican Energy Holdings, Co.: | | | | |
5.875% 10/1/12 | | 2,880,000 | | 3,107,413 |
6.5% 9/15/37 | | 1,334,000 | | 1,509,041 |
National Grid PLC 6.3% 8/1/16 | | 4,181,000 | | 4,773,188 |
NiSource Finance Corp.: | | | | |
5.4% 7/15/14 | | 3,885,000 | | 4,260,439 |
5.45% 9/15/20 | | 613,000 | | 631,699 |
6.25% 12/15/40 | | 837,000 | | 850,876 |
6.4% 3/15/18 | | 2,760,000 | | 3,059,609 |
Wisconsin Energy Corp. 6.25% 5/15/67 (j) | | 1,738,000 | | 1,711,930 |
| | 36,444,264 |
TOTAL UTILITIES | | 98,972,700 |
TOTAL NONCONVERTIBLE BONDS (Cost $841,335,019) | 898,964,209 |
U.S. Government and Government Agency Obligations - 31.9% |
|
U.S. Government Agency Obligations - 2.1% |
Fannie Mae: | | | | |
0.375% 12/28/12 | | 5,510,000 | | 5,475,028 |
0.5% 10/30/12 | | 5,199,000 | | 5,185,254 |
0.75% 12/18/13 | | 2,443,000 | | 2,415,712 |
1% 4/4/12 | | 10,285,000 | | 10,352,500 |
1% 9/23/13 | | 1,480,000 | | 1,477,761 |
1.25% 8/20/13 | | 2,517,000 | | 2,533,446 |
1.75% 2/22/13 | | 20,000,000 | | 20,422,300 |
2.5% 5/15/14 | | 1,734,000 | | 1,799,051 |
2.75% 3/13/14 | | 1,840,000 | | 1,923,192 |
5% 2/16/12 | | 2,860,000 | | 3,003,918 |
Federal Home Loan Bank: | | | | |
0.875% 12/27/13 | | 250,000 | | 247,808 |
1.625% 11/21/12 | | 5,835,000 | | 5,940,794 |
1.625% 3/20/13 | | 4,450,000 | | 4,530,398 |
Freddie Mac: | | | | |
0.375% 11/30/12 | | 4,019,000 | | 3,995,075 |
|
| Principal
Amount | | Value |
1.125% 7/27/12 | | $ 600,000 | | $ 605,404 |
1.75% 6/15/12 | | 4,185,000 | | 4,258,639 |
2.125% 3/23/12 | | 204,000 | | 208,066 |
Tennessee Valley Authority 5.375% 4/1/56 | | 2,375,000 | | 2,553,220 |
U.S. Department of Housing and Urban Development Government guaranteed participation certificates Series 1996-A, 7.63% 8/1/14 | | 250,000 | | 250,476 |
TOTAL U.S. GOVERNMENT AGENCY OBLIGATIONS | | 77,178,042 |
U.S. Treasury Inflation Protected Obligations - 3.8% |
U.S. Treasury Inflation-Indexed Bonds: | | | | |
2.125% 2/15/40 (g) | | 29,111,212 | | 30,873,361 |
2.5% 1/15/29 | | 8,149,120 | | 9,243,520 |
U.S. Treasury Inflation-Indexed Notes 1.375% 1/15/20 | | 99,841,459 | | 103,857,906 |
TOTAL U.S. TREASURY INFLATION PROTECTED OBLIGATIONS | | 143,974,787 |
U.S. Treasury Obligations - 25.5% |
U.S. Treasury Bonds: | | | | |
3.875% 8/15/40 | | 101,415,000 | | 93,412,748 |
4.375% 11/15/39 | | 26,390,000 | | 26,530,184 |
U.S. Treasury Notes: | | | | |
0.375% 9/30/12 | | 3,346,000 | | 3,338,026 |
1.375% 11/30/15 | | 179,532,000 | | 174,468,659 |
2.25% 1/31/15 | | 42,293,000 | | 43,416,387 |
2.375% 8/31/14 | | 115,000,000 | | 119,132,870 |
2.375% 9/30/14 | | 60,000,000 | | 62,146,860 |
2.375% 2/28/15 | | 39,150,000 | | 40,349,165 |
2.5% 4/30/15 | | 40,000,000 | | 41,353,120 |
2.625% 7/31/14 (g) | | 265,000,000 | | 277,152,625 |
2.625% 11/15/20 | | 81,608,000 | | 76,979,276 |
TOTAL U.S. TREASURY OBLIGATIONS | | 958,279,920 |
Other Government Related - 0.5% |
Citigroup Funding, Inc. 2.125% 7/12/12 (FDIC Guaranteed) (d) | | 18,220,000 | | 18,633,357 |
TOTAL U.S. GOVERNMENT AND GOVERNMENT AGENCY OBLIGATIONS (Cost $1,182,991,224) | 1,198,066,106 |
U.S. Government Agency - Mortgage Securities - 40.7% |
| Principal
Amount | | Value |
Fannie Mae - 34.2% |
1.842% 5/1/34 (j) | | $ 1,452,126 | | $ 1,486,403 |
2.02% 9/1/33 (j) | | 738,816 | | 755,525 |
2.166% 10/1/33 (j) | | 51,859 | | 53,640 |
2.207% 7/1/35 (j) | | 47,282 | | 48,850 |
2.297% 10/1/33 (j) | | 1,242,032 | | 1,285,156 |
2.316% 3/1/35 (j) | | 20,083 | | 20,834 |
2.532% 7/1/34 (j) | | 61,745 | | 64,323 |
2.553% 10/1/33 (j) | | 104,917 | | 109,799 |
2.561% 2/1/35 (j) | | 3,007,537 | | 3,135,849 |
2.582% 3/1/35 (j) | | 65,713 | | 68,573 |
2.589% 6/1/36 (j) | | 115,117 | | 120,630 |
2.62% 8/1/36 (j) | | 2,182,272 | | 2,288,076 |
2.622% 7/1/34 (j) | | 2,306,430 | | 2,409,443 |
2.666% 6/1/34 (j) | | 585,851 | | 611,689 |
2.687% 2/1/35 (j) | | 3,750,869 | | 3,928,062 |
2.744% 9/1/34 (j) | | 869,796 | | 909,066 |
2.749% 5/1/36 (j) | | 485,520 | | 511,839 |
2.771% 5/1/35 (j) | | 267,725 | | 281,475 |
2.773% 11/1/36 (j) | | 1,483,486 | | 1,561,551 |
2.836% 9/1/35 (j) | | 2,314,389 | | 2,429,476 |
2.949% 2/1/34 (j) | | 34,314 | | 36,044 |
2.961% 9/1/36 (j) | | 1,225,737 | | 1,298,132 |
2.981% 7/1/35 (j) | | 137,869 | | 144,851 |
3% 1/1/26 (e) | | 16,000,000 | | 15,667,501 |
3.128% 10/1/37 (j) | | 48,690 | | 51,189 |
3.161% 4/1/36 (j) | | 2,269,027 | | 2,391,610 |
3.5% 1/1/26 (e)(f) | | 9,000,000 | | 9,064,688 |
3.5% 1/1/26 (e)(f) | | 27,000,000 | | 27,194,063 |
3.5% 11/1/40 (f) | | 28,060,018 | | 26,812,664 |
3.5% 1/1/41 (e)(f) | | 8,000,000 | | 7,655,638 |
3.536% 7/1/37 (j) | | 270,895 | | 284,653 |
4% 8/1/18 to 12/1/40 (f) | | 52,582,018 | | 52,613,977 |
4% 1/1/41 (e)(f) | | 4,000,000 | | 3,979,062 |
4% 1/1/41 (e)(f) | | 22,000,000 | | 21,884,843 |
4% 1/1/41 (e)(f) | | 13,500,000 | | 13,429,336 |
4% 1/1/41 (e)(f) | | 14,000,000 | | 13,926,718 |
4% 1/1/41 (e)(f) | | 13,500,000 | | 13,429,336 |
4.5% 6/1/24 to 11/1/40 | | 57,978,491 | | 59,780,947 |
4.5% 1/1/26 (e) | | 8,800,000 | | 9,224,187 |
4.5% 1/1/41 (e)(f) | | 34,000,000 | | 34,905,780 |
4.5% 1/1/41 (e) | | 5,100,000 | | 5,235,867 |
4.5% 1/1/41 (e) | | 22,000,000 | | 22,586,093 |
4.5% 1/1/41 (e) | | 18,000,000 | | 18,479,531 |
5% 2/1/18 to 9/1/40 | | 112,709,592 | | 119,039,853 |
5% 1/1/41 (e) | | 28,000,000 | | 29,437,187 |
5% 1/1/41 (e) | | 15,000,000 | | 15,769,922 |
5% 1/1/41 (e) | | 24,000,000 | | 25,231,874 |
5% 1/1/41 (e) | | 25,000,000 | | 26,283,203 |
5% 1/1/41 (e) | | 19,000,000 | | 19,975,234 |
5% 1/1/41 (e) | | 19,500,000 | | 20,500,898 |
|
| Principal
Amount | | Value |
5% 1/1/41 (e) | | $ 16,000,000 | | $ 16,821,250 |
5% 1/1/41 (e)(f) | | 22,500,000 | | 23,654,882 |
5% 1/1/41 (e)(f) | | 39,000,000 | | 41,001,796 |
5.214% 12/1/35 (j) | | 675,731 | | 710,998 |
5.227% 2/1/36 (j) | | 1,493,233 | | 1,562,380 |
5.5% 4/1/16 to 12/1/39 | | 103,273,226 | | 110,721,617 |
5.5% 1/1/41 (e) | | 15,000,000 | | 16,048,829 |
5.5% 1/1/41 (e) | | 59,000,000 | | 63,125,392 |
5.5% 1/1/41 (e) | | 4,000,000 | | 4,279,688 |
5.5% 1/1/41 (e) | | 5,000,000 | | 5,349,610 |
5.5% 1/1/41 (e) | | 63,500,000 | | 67,940,041 |
5.5% 1/1/41 (e)(f) | | 63,500,000 | | 67,940,041 |
6% 6/1/14 to 4/1/39 | | 51,586,975 | | 56,047,195 |
6% 1/1/41 (e) | | 35,500,000 | | 38,578,517 |
6% 1/1/41 (e) | | 18,000,000 | | 19,560,938 |
6% 1/1/41 | | 1,000,000 | | 1,086,719 |
6% 1/1/41 (e)(f) | | 39,000,000 | | 42,382,033 |
6% 1/1/41 (e)(f) | | 16,000,000 | | 17,387,501 |
6% 1/1/41 (e)(f) | | 13,000,000 | | 14,127,344 |
6.5% 6/1/11 to 9/1/38 (f) | | 24,763,032 | | 27,630,163 |
6.5% 12/1/40 (e)(f) | | 5,000,000 | | 5,564,649 |
6.5% 1/1/41 (e)(f) | | 400,000 | | 444,500 |
7% 3/1/15 to 8/1/32 | | 2,000,155 | | 2,239,657 |
7.5% 7/1/16 to 11/1/31 | | 1,652,421 | | 1,864,735 |
8% 1/1/30 to 5/1/30 | | 56,346 | | 64,021 |
8.5% 3/1/25 to 6/1/25 | | 867 | | 999 |
TOTAL FANNIE MAE | | 1,284,530,635 |
Freddie Mac - 2.9% |
2.194% 4/1/35 (j) | | 929,602 | | 965,923 |
2.624% 1/1/35 (j) | | 274,978 | | 287,108 |
2.664% 6/1/35 (j) | | 202,056 | | 212,268 |
2.664% 3/1/36 (j) | | 252,888 | | 262,289 |
2.961% 1/1/35 (j) | | 916,997 | | 965,486 |
3.352% 10/1/35 (j) | | 160,543 | | 170,075 |
3.513% 3/1/33 (j) | | 18,661 | | 19,658 |
4% 1/1/26 (e) | | 1,750,000 | | 1,797,852 |
4.5% 7/1/25 to 5/1/40 | | 6,789,662 | | 7,018,195 |
4.5% 1/1/41 (e) | | 14,000,000 | | 14,348,907 |
4.5% 1/1/41 (e) | | 34,000,000 | | 34,847,345 |
4.938% 1/1/36 (j) | | 787,870 | | 814,729 |
5% 9/1/39 to 9/1/40 | | 29,243,890 | | 30,761,918 |
5.31% 11/1/35 (j) | | 462,609 | | 489,931 |
6% 4/1/32 to 7/1/37 | | 4,510,167 | | 4,963,215 |
6% 1/1/41 (e) | | 10,500,000 | | 11,369,531 |
7.5% 5/1/17 to 11/1/31 | | 163,696 | | 184,217 |
U.S. Government Agency - Mortgage Securities - continued |
| Principal
Amount | | Value |
Freddie Mac - continued |
8% 7/1/17 to 5/1/27 | | $ 28,060 | | $ 31,560 |
8.5% 3/1/20 to 1/1/28 | | 138,806 | | 158,814 |
TOTAL FREDDIE MAC | | 109,669,021 |
Ginnie Mae - 3.6% |
4% 1/15/25 to 2/15/40 | | 25,023,892 | | 26,123,543 |
4% 1/1/41 (e) | | 8,000,000 | | 8,046,875 |
4% 1/1/41 (e) | | 19,000,000 | | 19,111,329 |
4.5% 3/15/39 to 6/15/40 (e)(f) | | 55,259,446 | | 57,505,206 |
4.5% 1/1/41 (e)(f) | | 4,000,000 | | 4,153,438 |
6% 3/15/29 to 11/15/34 | | 7,252,646 | | 7,985,021 |
6.5% 8/15/27 to 11/15/35 | | 6,906,025 | | 7,787,424 |
7% 1/15/28 to 7/15/32 | | 3,248,105 | | 3,667,381 |
7.5% 4/15/22 to 10/15/28 | | 850,912 | | 962,383 |
8% 2/15/17 to 9/15/30 | | 96,683 | | 109,480 |
8.5% 12/15/16 to 3/15/30 | | 19,233 | | 21,579 |
TOTAL GINNIE MAE | | 135,473,659 |
TOTAL U.S. GOVERNMENT AGENCY - MORTGAGE SECURITIES (Cost $1,520,596,203) | 1,529,673,315 |
Asset-Backed Securities - 2.6% |
|
Accredited Mortgage Loan Trust Series 2005-1 Class M1, 0.7306% 4/25/35 (j) | | 634,109 | | 363,315 |
ACE Securities Corp. Home Equity Loan Trust: | | | | |
Series 2004-HE1 Class M1, 1.0106% 3/25/34 (j) | | 17,845 | | 17,583 |
Series 2005-HE2 Class M2, 0.7106% 4/25/35 (j) | | 61,759 | | 58,085 |
Advanta Business Card Master Trust Series 2006-C1 Class C1, 0.7406% 10/20/14 (j) | | 26,387 | | 4,894 |
Airspeed Ltd. Series 2007-1A Class C1, 2.7603% 6/15/32 (c)(j) | | 2,669,096 | | 1,161,057 |
Ally Auto Receivables Trust Series 2009-A: | | | | |
Class A3, 2.33% 6/17/13 (c) | | 1,620,000 | | 1,643,457 |
Class A4, 3% 10/15/15 (c) | | 1,600,000 | | 1,653,065 |
Ally Master Owner Trust Series 2010-3 Class A, 2.88% 4/15/15 (c) | | 7,850,000 | | 8,039,402 |
AmeriCredit Automobile Receivables Trust: | | | | |
Series 2006-1 Class C1, 5.28% 11/6/11 | | 79,836 | | 79,846 |
|
| Principal Amount | | Value |
Series 2008-AF Class A3, 5.68% 12/12/12 (FSA Insured) | | $ 2,409,159 | | $ 2,432,866 |
Ameriquest Mortgage Securities, Inc. pass-thru certificates: | | | | |
Series 2003-10 Class M1, 0.9606% 12/25/33 (j) | | 35,559 | | 26,470 |
Series 2004-R2 Class M3, 0.8106% 4/25/34 (j) | | 47,022 | | 10,349 |
Series 2004-R8 Class M9, 3.0106% 9/25/34 (j) | | 127,968 | | 355 |
Series 2005-R2 Class M1, 0.7106% 4/25/35 (j) | | 727,000 | | 619,056 |
Argent Securities, Inc. pass-thru certificates: | | | | |
Series 2003-W7 Class A2, 1.0334% 3/25/34 (j) | | 16,878 | | 12,543 |
Series 2004-W11 Class M2, 0.9606% 11/25/34 (j) | | 198,000 | | 144,658 |
Series 2004-W7 Class M1, 0.8106% 5/25/34 (j) | | 209,000 | | 142,109 |
Series 2006-W4 Class A2C, 0.4206% 5/25/36 (j) | | 498,794 | | 175,547 |
Asset Backed Securities Corp. Home Equity Loan Trust Series 2004-HE2 Class M1, 1.0856% 4/25/34 (j) | | 940,000 | | 688,710 |
Bank of America Auto Trust Series 2009-1A Class A4, 3.52% 6/15/16 (c) | | 3,100,000 | | 3,218,910 |
BMW Vehicle Lease Trust Series 2010-1 Class A3, 0.82% 4/15/13 | | 5,050,000 | | 5,050,629 |
Brazos Higher Education Authority, Inc. Series 2006-2 Class A9, 0.3128% 12/26/24 (j) | | 572,436 | | 543,814 |
C-BASS Trust Series 2006-CB7 Class A2, 0.3206% 10/25/36 (j) | | 24,678 | | 24,462 |
CarMax Auto Owner Trust Series 2007-2 Class C, 5.61% 11/15/13 | | 4,260,000 | | 4,348,442 |
Carrington Mortgage Loan Trust: | | | | |
Series 2006-FRE1 Class M1, 0.5606% 7/25/36 (j) | | 402,000 | | 37,404 |
Series 2007-RFC1 Class A3, 0.4006% 12/25/36 (j) | | 635,000 | | 234,678 |
Cendant Timeshare Receivables Funding LLC: | | | | |
Series 2005 1A Class 2A2, 0.4406% 5/20/17 (FGIC Insured) (c)(j) | | 43,706 | | 41,584 |
Series 2005-1A Class A1, 4.67% 5/20/17 (FGIC Insured) (c) | | 186,774 | | 187,931 |
Chase Issuance Trust Series 2008-9 Class A, 4.26% 5/15/13 | | 2,000,000 | | 2,027,524 |
Chrysler Financial Auto Securitization Trust Series 2010-A Class A3, 0.91% 8/8/13 | | 6,300,000 | | 6,288,606 |
Asset-Backed Securities - continued |
| Principal Amount | | Value |
Chrysler Financial Lease Trust Series 2010-A Class A2, 1.78% 6/15/11 (c) | | $ 3,687,947 | | $ 3,691,805 |
Citibank Credit Card Issuance Trust Series 2009-A5 Class A5, 2.25% 12/23/14 | | 12,500,000 | | 12,778,243 |
Citigroup Mortgage Loan Trust Series 2007-AMC4 Class M1, 0.5306% 5/25/37 (j) | | 270,000 | | 8,061 |
Countrywide Home Loans, Inc.: | | | | |
Series 2003-BC1 Class B1, 5.4% 3/25/32 (MGIC Investment Corp. Insured) (j) | | 40,946 | | 15,611 |
Series 2004-3 Class M4, 1.2306% 4/25/34 (j) | | 56,336 | | 22,916 |
Series 2004-4 Class M2, 1.0556% 6/25/34 (j) | | 207,174 | | 116,855 |
Series 2005-3 Class MV1, 0.6806% 8/25/35 (j) | | 332,140 | | 316,265 |
Series 2005-AB1 Class A2, 0.4706% 8/25/35 (j) | | 42,826 | | 42,278 |
Fannie Mae subordinate REMIC pass-thru certificates Series 2004-T5 Class AB3, 0.724% 5/28/35 (j) | | 13,702 | | 9,955 |
Fieldstone Mortgage Investment Corp.: | | | | |
Series 2004-3 Class M5, 2.4356% 8/25/34 (j) | | 102,000 | | 58,021 |
Series 2006-3 Class 2A3, 0.4206% 11/25/36 (j) | | 1,585,000 | | 590,510 |
First Franklin Mortgage Loan Trust Series 2004-FF2 Class M3, 1.0856% 3/25/34 (j) | | 5,800 | | 1,960 |
Ford Credit Auto Lease Trust Series 2010-B Class A3, 0.8% 7/15/13 (c) | | 5,190,000 | | 5,182,149 |
Ford Credit Auto Owner Trust: | | | | |
Series 2006-B Class D, 7.26% 2/15/13 (c) | | 1,025,000 | | 1,036,262 |
Series 2009-D: | | | | |
Class A3, 2.17% 10/15/13 | | 2,000,000 | | 2,022,622 |
Class A4, 2.98% 8/15/14 | | 1,800,000 | | 1,864,918 |
Series 2010-B Class A3, 0.98% 10/15/14 | | 3,550,000 | | 3,559,392 |
Ford Credit Floorplan Master Owner Trust: | | | | |
Series 2006-4 Class B, 0.8103% 6/15/13 (j) | | 272,000 | | 269,138 |
Series 2010-5 Class A1, 1.5% 9/15/15 | | 3,580,000 | | 3,550,822 |
Fremont Home Loan Trust Series 2005-A: | | | | |
Class M3, 0.7506% 1/25/35 (j) | | 334,000 | | 161,990 |
Class M4, 0.9406% 1/25/35 (j) | | 128,000 | | 24,000 |
|
| Principal Amount | | Value |
GCO Education Loan Funding Master Trust II Series 2007-1A Class C1L, 0.6675% 2/25/47 (c)(j) | | $ 829,000 | | $ 489,110 |
GE Business Loan Trust Series 2003-1 Class A, 0.6903% 4/15/31 (c)(j) | | 91,430 | | 80,458 |
GSAMP Trust: | | | | |
Series 2004-AR1: | | | | |
Class B4, 5% 6/25/34 (c)(j) | | 152,632 | | 30,796 |
Class M1, 0.9106% 6/25/34 (j) | | 772,000 | | 535,225 |
Series 2007-HE1 Class M1, 0.5106% 3/25/47 (j) | | 289,000 | | 16,155 |
Guggenheim Structured Real Estate Funding Ltd.: | | | | |
Series 2005-1 Class C, 1.3406% 5/25/30 (c)(j) | | 225,553 | | 115,032 |
Series 2006-3 Class C, 0.8106% 9/25/46 (c)(j) | | 538,000 | | 107,600 |
Home Equity Asset Trust: | | | | |
Series 2003-3 Class M1, 1.5506% 8/25/33 (j) | | 278,551 | | 200,025 |
Series 2003-5 Class A2, 0.9606% 12/25/33 (j) | | 11,595 | | 7,459 |
Series 2005-5 Class 2A2, 0.5106% 11/25/35 (j) | | 36,047 | | 35,735 |
Series 2006-1 Class 2A3, 0.4856% 4/25/36 (j) | | 432,940 | | 420,559 |
HSBC Home Equity Loan Trust Series 2006-2 Class M2, 0.5506% 3/20/36 (j) | | 267,165 | | 221,330 |
HSI Asset Securitization Corp. Trust Series 2007-HE1 Class 2A3, 0.4506% 1/25/37 (j) | | 436,000 | | 183,933 |
Hyundai Auto Receivables Trust Series 2009-A Class A3, 2.03% 8/15/13 | | 2,040,000 | | 2,063,169 |
JPMorgan Mortgage Acquisition Trust Series 2007-CH1: | | | | |
Class AV4, 0.3906% 11/25/36 (j) | | 438,000 | | 372,795 |
Class MV1, 0.4906% 11/25/36 (j) | | 356,000 | | 218,688 |
Keycorp Student Loan Trust Series 1999-A Class A2, 0.6328% 12/27/29 (j) | | 263,786 | | 225,082 |
Long Beach Mortgage Loan Trust Series 2004-2 Class M2, 1.3406% 6/25/34 (j) | | 33,693 | | 21,576 |
MASTR Asset Backed Securities Trust: | | | | |
Series 2006-AM3 Class M1, 0.5206% 10/25/36 (j) | | 158,000 | | 8,828 |
Series 2007-HE1 Class M1, 0.5606% 5/25/37 (j) | | 249,000 | | 12,629 |
Asset-Backed Securities - continued |
| Principal Amount | | Value |
Merrill Lynch Mortgage Investors Trust: | | | | |
Series 2003-OPT1 Class M1, 0.9106% 7/25/34 (j) | | $ 32,638 | | $ 25,423 |
Series 2006-FM1 Class A2B, 0.3706% 4/25/37 (j) | | 587,991 | | 522,861 |
Series 2006-OPT1 Class A1A, 0.5206% 6/25/35 (j) | | 557,894 | | 454,194 |
Morgan Stanley ABS Capital I Trust: | | | | |
Series 2004-HE6 Class A2, 0.6006% 8/25/34 (j) | | 20,187 | | 16,039 |
Series 2004-NC8 Class M6, 1.5106% 9/25/34 (j) | | 109,818 | | 46,659 |
Series 2005-NC1 Class M1, 0.7006% 1/25/35 (j) | | 141,000 | | 76,321 |
National Collegiate Student Loan Trust Series 2006-4 Class A1, 0.2906% 3/25/25 (j) | | 63,366 | | 62,561 |
New Century Home Equity Loan Trust: | | | | |
Series 2005-4 Class M2, 0.7706% 9/25/35 (j) | | 503,000 | | 353,384 |
Series 2005-D Class M2, 0.7306% 2/25/36 (j) | | 105,000 | | 9,116 |
Nissan Auto Receivables Owner Trust Series 2010-A Class A4, 1.31% 9/15/16 | | 2,140,000 | | 2,126,190 |
Ocala Funding LLC Series 2006-1A Class A, 1.6606% 3/20/11 (a)(c)(j) | | 414,000 | | 153,180 |
Park Place Securities, Inc.: | | | | |
Series 2004-WCW1: | | | | |
Class M3, 1.5106% 9/25/34 (j) | | 188,000 | | 106,329 |
Class M4, 1.7106% 9/25/34 (j) | | 241,000 | | 60,235 |
Series 2005-WCH1: | | | | |
Class M2, 0.7806% 1/25/36 (j) | | 1,972,000 | | 1,771,878 |
Class M3, 0.8206% 1/25/36 (j) | | 168,000 | | 115,936 |
Class M4, 1.0906% 1/25/36 (j) | | 520,000 | | 211,753 |
Series 2005-WHQ2 Class M7, 1.5106% 5/25/35 (j) | | 1,251,000 | | 37,720 |
Providian Master Note Trust Series 2006-C1A Class C1, 0.8103% 3/15/15 (c)(j) | | 759,000 | | 758,241 |
Residential Asset Securities Corp. Series 2007-KS2 Class AI1, 0.3306% 2/25/37 (j) | | 158,971 | | 156,905 |
Salomon Brothers Mortgage Securities VII, Inc. Series 2003-HE1 Class A, 1.0606% 4/25/33 (j) | | 1,796 | | 1,576 |
Saxon Asset Securities Trust Series 2004-1 Class M1, 1.0556% 3/25/35 (j) | | 546,481 | | 451,576 |
|
| Principal Amount | | Value |
Sierra Receivables Funding Co. Series 2007-1A Class A2, 0.4034% 3/20/19 (FGIC Insured) (c)(j) | | $ 223,539 | | $ 210,148 |
SLM Private Credit Student Loan Trust Series 2004-A Class C, 1.2516% 6/15/33 (j) | | 448,000 | | 40,310 |
Structured Asset Investment Loan Trust Series 2004-8 Class M5, 1.4106% 9/25/34 (j) | | 25,472 | | 11,238 |
Terwin Mortgage Trust Series 2003-4HE Class A1, 1.1206% 9/25/34 (j) | | 10,148 | | 7,706 |
Volkswagen Auto Lease Trust Series 2010-A Class A3, 0.85% 11/20/13 | | 5,630,000 | | 5,618,154 |
WaMu Master Note Trust Series 2006-C2A Class C2, 0.7603% 8/15/15 (c)(j) | | 2,465,000 | | 2,452,634 |
Whinstone Capital Management Ltd. Series 1A Class B3, 2.0884% 10/25/44 (c)(j) | | 630,180 | | 252,072 |
TOTAL ASSET-BACKED SECURITIES (Cost $98,689,696) | 96,077,647 |
Collateralized Mortgage Obligations - 1.8% |
|
Private Sponsor - 1.5% |
Arran Residential Mortgages Funding No. 1 PLC floater Series 2006-1A Class DB, 0.7191% 4/12/56 (c)(j) | | 503,217 | | 491,386 |
Banc of America Commercial Mortgage Trust Series 2007-2: | | | | |
Class B, 5.8772% 4/10/49 (j) | | 485,000 | | 122,364 |
Class C, 5.8772% 4/10/49 (j) | | 1,290,000 | | 226,621 |
Class D, 5.8772% 4/10/49 (j) | | 650,000 | | 101,577 |
Banc of America Mortgage Securities, Inc.: | | | | |
Series 2004-B Class 1A1, 2.9237% 3/25/34 (j) | | 20,516 | | 17,947 |
Series 2005-E Class 2A7, 2.8659% 6/25/35 (j) | | 2,680,000 | | 2,137,111 |
Bear Stearns ALT-A Trust floater Series 2005-1 Class A1, 0.5406% 1/25/35 (j) | | 762,127 | | 612,735 |
Chase Mortgage Finance Trust: | | | | |
Series 2007-A1 Class 1A5, 3.0795% 2/25/37 (j) | | 423,600 | | 417,819 |
Series 2007-A2 Class 2A1, 3.1213% 7/25/37 (j) | | 225,084 | | 224,085 |
Citigroup Commercial Mortgage Trust Series 2008-C7 Class A2B, 6.2934% 12/10/49 (j) | | 7,310,000 | | 7,768,167 |
Citigroup Mortgage Loan Trust Series 2004-UST1 Class A4, 2.4839% 8/25/34 (j) | | 2,462,748 | | 2,447,072 |
Collateralized Mortgage Obligations - continued |
| Principal Amount | | Value |
Private Sponsor - continued |
Credit Suisse First Boston Mortgage Securities Corp. floater Series 2007-AR7 Class 2A1, 2.9157% 11/25/34 (j) | | $ 755,141 | | $ 699,723 |
Fosse Master Issuer PLC floater Series 2006-1A: | | | | |
Class B2, 0.4491% 10/18/54 (c)(j) | | 1,007,000 | | 993,909 |
Class C2, 0.7591% 10/18/54 (c)(j) | | 337,000 | | 330,833 |
Class M2, 0.5391% 10/18/54 (c)(j) | | 579,000 | | 568,231 |
Gracechurch Mortgage Financing PLC floater Series 2006-1 Class D2, 0.7544% 11/20/56 (c)(j) | | 863,000 | | 831,995 |
Gracechurch Mortgage Funding PLC floater Series 1A Class DB, 0.7591% 10/11/41 (c)(j) | | 1,097,000 | | 1,092,996 |
Granite Master Issuer PLC floater: | | | | |
Series 2006-1A Class C2, 0.8606% 12/20/54 (c)(j) | | 2,117,000 | | 1,159,058 |
Series 2006-2 Class C1, 0.7306% 12/20/54 (j) | | 1,885,000 | | 1,065,025 |
Series 2006-3 Class C2, 0.7606% 12/20/54 (j) | | 396,000 | | 225,461 |
Series 2006-4: | | | | |
Class B1, 0.3506% 12/20/54 (j) | | 1,059,000 | | 840,846 |
Class C1, 0.6406% 12/20/54 (j) | | 647,000 | | 354,233 |
Class M1, 0.4306% 12/20/54 (j) | | 279,000 | | 195,300 |
Series 2007-1: | | | | |
Class 1C1, 0.8606% 12/20/54 (j) | | 654,000 | | 369,510 |
Class 1M1, 0.5606% 12/20/54 (j) | | 425,000 | | 297,500 |
Class 2C1, 1.2206% 12/20/54 (j) | | 298,000 | | 168,370 |
Class 2M1, 0.7606% 12/20/54 (j) | | 546,000 | | 382,200 |
Series 2007-2 Class 2C1, 0.6906% 12/17/54 (j) | | 757,000 | | 412,565 |
Granite Mortgages PLC floater Series 2003-3 Class 1C, 2.7391% 1/20/44 (j) | | 151,584 | | 101,183 |
GSR Mortgage Loan Trust Series 2007-AR2 Class 2A1, 3.1373% 4/25/35 (j) | | 1,096,295 | | 960,360 |
Harborview Mortgage Loan Trust floater Series 2005-2 Class 2A1A, 0.4806% 5/19/35 (j) | | 131,587 | | 86,008 |
|
| Principal Amount | | Value |
JPMorgan Chase Commercial Mortgage Securities Trust Series 2007-CB18 Class A3, 5.447% 6/12/47 (j) | | $ 6,230,000 | | $ 6,455,198 |
JPMorgan Mortgage Trust: | | | | |
Series 2004-A5 Class 2A1, 2.814% 12/25/34 (j) | | 741,646 | | 686,047 |
Series 2006-A2 Class 5A1, 2.9702% 11/25/33 (j) | | 900,756 | | 861,293 |
Series 2007-A1 Class 1A1, 3.0106% 7/25/35 (j) | | 2,239,363 | | 2,174,494 |
MASTR Adjustable Rate Mortgages Trust Series 2007-3 Class 22A2, 0.4706% 5/25/47 (j) | | 361,395 | | 228,635 |
Merrill Lynch Alternative Note Asset Trust floater Series 2007-OAR1 Class A1, 0.4306% 2/25/37 (j) | | 528,474 | | 370,364 |
Merrill Lynch Floating Trust floater Series 2006-1: | | | | |
Class C, 0.45% 6/15/22 (c)(j) | | 449,000 | | 387,263 |
Class D, 0.46% 6/15/22 (c)(j) | | 173,000 | | 144,888 |
Class E, 0.47% 6/15/22 (c)(j) | | 276,000 | | 228,390 |
Class F, 0.5% 6/15/22 (c)(j) | | 498,000 | | 404,625 |
Class G, 0.57% 6/15/22 (c)(j) | | 103,000 | | 81,113 |
Class H, 0.59% 6/15/22 (c)(j) | | 207,000 | | 159,038 |
Class J, 0.63% 6/15/22 (c)(j) | | 242,000 | | 173,635 |
Merrill Lynch-CFC Commercial Mortgage Trust Series 2006-3 Class ASB, 5.382% 7/12/46 (j) | | 4,570,000 | | 4,825,622 |
Opteum Mortgage Acceptance Corp. floater Series 2005-3 Class APT, 0.5506% 7/25/35 (j) | | 823,361 | | 668,261 |
Option One Mortgage Loan Trust floater Series 2007-CP1 Class M1, 0.5606% 3/25/37 (j) | | 861,000 | | 55,212 |
Provident Funding Mortgage Loan Trust Series 2005-2 Class 3A, 2.85% 10/25/35 (j) | | 1,587,388 | | 1,353,750 |
RESI Finance LP/RESI Finance DE Corp. floater Series 2003-B Class B5, 2.6125% 7/10/35 (c)(j) | | 313,293 | | 225,132 |
Residential Asset Mortgage Products, Inc. sequential payer Series 2003-SL1 Class A31, 7.125% 4/25/31 | | 56,310 | | 56,990 |
Residential Funding Securities Corp. floater Series 2003-RP2 Class A1, 0.7106% 6/25/33 (c)(j) | | 90,159 | | 74,843 |
Sequoia Mortgage Trust floater Series 2004-6 Class A3B, 1.1948% 7/20/34 (j) | | 14,112 | | 10,385 |
TBW Mortgage-Backed pass-thru certificates floater Series 2006-4 Class A3, 0.4534% 9/25/36 (j) | | 1,153,000 | | 651,547 |
Wells Fargo Mortgage Backed Securities Trust: | | | | |
Series 2004-H Class A1, 4.5316% 6/25/34 (j) | | 733,531 | | 719,897 |
Collateralized Mortgage Obligations - continued |
| Principal Amount | | Value |
Private Sponsor - continued |
Wells Fargo Mortgage Backed Securities Trust: - continued | | | | |
Series 2005-AR10 Class 2A2, 2.8562% 6/25/35 (j) | | $ 2,802,664 | | $ 2,720,076 |
Series 2005-AR12: | | | | |
Class 2A5, 2.854% 7/25/35 (j) | | 3,710,000 | | 3,527,797 |
Class 2A6, 2.854% 7/25/35 (j) | | 3,569,160 | | 3,351,200 |
Series 2005-AR3 Class 2A1, 2.8794% 3/25/35 (j) | | 732,178 | | 665,887 |
TOTAL PRIVATE SPONSOR | | 56,963,772 |
U.S. Government Agency - 0.3% |
Fannie Mae planned amortization class: | | | | |
Series 1999-54 Class PH, 6.5% 11/18/29 | | 1,803,526 | | 1,973,338 |
Series 1999-57 Class PH, 6.5% 12/25/29 | | 1,305,158 | | 1,473,620 |
Fannie Mae subordinate REMIC pass-thru certificates: | | | | |
planned amortization class: | | | | |
Series 2002-9 Class PC, 6% 3/25/17 | | 197,569 | | 212,344 |
Series 2004-81 Class KD, 4.5% 7/25/18 | | 2,625,000 | | 2,764,342 |
sequential payer Series 2004-86 Class KC, 4.5% 5/25/19 | | 402,180 | | 419,941 |
Freddie Mac Multi-class participation certificates guaranteed planned amortization class Series 2500 Class TE, 5.5% 9/15/17 | | 4,935,527 | | 5,309,423 |
Ginnie Mae guaranteed REMIC pass-thru securities Series 2007-35 Class SC, 38.6362% 6/16/37 (j)(l) | | 150,712 | | 258,348 |
TOTAL U.S. GOVERNMENT AGENCY | | 12,411,356 |
TOTAL COLLATERALIZED MORTGAGE OBLIGATIONS (Cost $69,917,762) | 69,375,128 |
Commercial Mortgage Securities - 6.7% |
|
Asset Securitization Corp. Series 1997-D5: | | | | |
Class A2, 7.0665% 2/14/43 (j) | | 1,435,000 | | 1,537,109 |
Class A3, 7.1165% 2/14/43 (j) | | 1,545,000 | | 1,679,308 |
Banc of America Commercial Mortgage Trust: | | | | |
sequential payer: | | | | |
Series 2006-2 Class AAB, 5.9119% 5/10/45 (j) | | 2,100,000 | | 2,260,657 |
|
| Principal Amount | | Value |
Series 2006-5: | | | | |
Class A2, 5.317% 9/10/47 | | $ 8,745,000 | | $ 8,993,782 |
Class A3, 5.39% 9/10/47 | | 1,985,000 | | 2,047,132 |
Series 2007-2 Class A1, 5.421% 4/10/49 | | 893,874 | | 913,111 |
Series 2007-3 Class A3, 5.6579% 6/10/49 (j) | | 6,100,000 | | 6,393,260 |
Banc of America Commercial Mortgage, Inc.: | | | | |
sequential payer: | | | | |
Series 2005-1 Class A3, 4.877% 11/10/42 | | 1,048,758 | | 1,054,068 |
Series 2007-1 Class A2, 5.381% 1/15/49 | | 1,545,000 | | 1,575,329 |
Series 2001-3 Class H, 6.562% 4/11/37 (c) | | 4,889,139 | | 4,963,829 |
Banc of America Large Loan, Inc. floater: | | | | |
Series 2005-MIB1: | | | | |
Class F, 0.7303% 3/15/22 (c)(j) | | 217,000 | | 190,960 |
Class G, 0.7903% 3/15/22 (c)(j) | | 141,000 | | 121,260 |
Series 2006-BIX1: | | | | |
Class F, 0.5703% 10/15/19 (c)(j) | | 558,000 | | 477,090 |
Class G, 0.5903% 10/15/19 (c)(j) | | 380,000 | | 311,600 |
Bayview Commercial Asset Trust: | | | | |
floater: | | | | |
Series 2004-1: | | | | |
Class A, 0.6206% 4/25/34 (c)(j) | | 507,742 | | 406,194 |
Class B, 2.1606% 4/25/34 (c)(j) | | 39,902 | | 20,749 |
Class M1, 0.8206% 4/25/34 (c)(j) | | 32,512 | | 21,133 |
Class M2, 1.4606% 4/25/34 (c)(j) | | 29,134 | | 17,918 |
Series 2004-2: | | | | |
Class A, 0.6906% 8/25/34 (c)(j) | | 402,808 | | 334,330 |
Class M1, 0.8406% 8/25/34 (c)(j) | | 65,056 | | 44,888 |
Series 2004-3: | | | | |
Class A1, 0.6306% 1/25/35 (c)(j) | | 818,203 | | 670,927 |
Class A2, 0.6806% 1/25/35 (c)(j) | | 106,504 | | 75,618 |
Class M1, 0.7606% 1/25/35 (c)(j) | | 109,010 | | 73,037 |
Class M2, 1.2606% 1/25/35 (c)(j) | | 70,481 | | 44,403 |
Series 2005-2A: | | | | |
Class A1, 0.5706% 8/25/35 (c)(j) | | 446,430 | | 358,572 |
Series 2005-2A: | | | | |
Class M1, 0.6906% 8/25/35 (c)(j) | | 33,101 | | 21,357 |
Class M2, 0.7406% 8/25/35 (c)(j) | | 54,443 | | 34,157 |
Class M3, 0.7606% 8/25/35 (c)(j) | | 30,052 | | 18,001 |
Commercial Mortgage Securities - continued |
| Principal
Amount | | Value |
Bayview Commercial Asset Trust: -
continued | | | | |
floater: | | | | |
Series 2005-2A: | | | | |
Class M4, 0.8706% 8/25/35 (c)(j) | | $ 27,875 | | $ 16,106 |
Series 2005-3A: | | | | |
Class A1, 0.5806% 11/25/35 (c)(j) | | 246,546 | | 200,417 |
Class A2, 0.6606% 11/25/35 (c)(j) | | 159,754 | | 118,218 |
Series 2005-4A: | | | | |
Class A2, 0.6506% 1/25/36 (c)(j) | | 877,038 | | 631,467 |
Class M1, 0.7106% 1/25/36 (c)(j) | | 183,506 | | 100,929 |
Class M2, 0.7306% 1/25/36 (c)(j) | | 55,359 | | 28,787 |
Class M3, 0.7606% 1/25/36 (c)(j) | | 80,476 | | 38,629 |
Series 2006-1 Class A2, 0.6206% 4/25/36 (c)(j) | | 87,381 | | 62,827 |
Series 2006-2A: | | | | |
Class A1, 0.4906% 7/25/36 (c)(j) | | 863,136 | | 679,029 |
Class A2, 0.5406% 7/25/36 (c)(j) | | 77,910 | | 55,683 |
Class M1, 0.5706% 7/25/36 (c)(j) | | 81,806 | | 44,265 |
Class M2, 0.5906% 7/25/36 (c)(j) | | 57,876 | | 28,440 |
Class M6, 0.8006% 7/25/36 (c)(j) | | 58,989 | | 22,233 |
Series 2006-3A: | | | | |
Class M5, 0.7406% 10/25/36 (c)(j) | | 69,848 | | 24,447 |
Class M6, 0.8206% 10/25/36 (c)(j) | | 136,402 | | 38,193 |
Series 2006-4A: | | | | |
Class A1, 0.4906% 12/25/36 (c)(j) | | 500,750 | | 400,750 |
Class A2, 0.5306% 12/25/36 (c)(j) | | 1,116,012 | | 794,935 |
Class M1, 0.5506% 12/25/36 (c)(j) | | 80,870 | | 40,581 |
Series 2007-1: | | | | |
Class A2, 0.5306% 3/25/37 (c)(j) | | 215,369 | | 142,144 |
Class B3, 3.6106% 3/25/37 (c)(j) | | 137,367 | | 17,858 |
Series 2007-2A: | | | | |
Class A1, 0.5306% 7/25/37 (c)(j) | | 196,874 | | 146,671 |
|
| Principal
Amount | | Value |
Class A2, 0.5806% 7/25/37 (c)(j) | | $ 184,274 | | $ 99,508 |
Class B1, 1.8606% 7/25/37 (c)(j) | | 173,249 | | 25,987 |
Class B2, 2.5106% 7/25/37 (c)(j) | | 149,624 | | 19,451 |
Class B3, 3.6106% 7/25/37 (c)(j) | | 169,312 | | 18,624 |
Class M2, 0.6706% 7/25/37 (c)(j) | | 102,375 | | 28,665 |
Class M3, 0.7506% 7/25/37 (c)(j) | | 102,375 | | 24,570 |
Class M4, 0.9106% 7/25/37 (c)(j) | | 216,562 | | 45,478 |
Class M5, 1.0106% 7/25/37 (c)(j) | | 192,937 | | 34,729 |
Class M6, 1.2606% 7/25/37 (c)(j) | | 240,187 | | 38,430 |
Series 2007-3: | | | | |
Class A2, 0.5506% 7/25/37 (c)(j) | | 311,425 | | 204,668 |
Class B1, 1.2106% 7/25/37 (c)(j) | | 143,936 | | 34,214 |
Class B2, 1.8606% 7/25/37 (c)(j) | | 503,121 | | 91,870 |
Class B3, 4.2606% 7/25/37 (c)(j) | | 193,005 | | 29,221 |
Class M1, 0.5706% 7/25/37 (c)(j) | | 127,579 | | 65,104 |
Class M2, 0.6006% 7/25/37 (c)(j) | | 134,122 | | 52,039 |
Class M3, 0.6306% 7/25/37 (c)(j) | | 293,106 | | 99,861 |
Class M4, 0.7606% 7/25/37 (c)(j) | | 463,212 | | 150,683 |
Class M5, 0.8606% 7/25/37 (c)(j) | | 173,377 | | 48,788 |
Class M6, 1.0606% 7/25/37 (c)(j) | | 130,851 | | 32,268 |
Series 2007-4A: | | | | |
Class B1, 2.8106% 9/25/37 (c)(j) | | 243,244 | | 17,027 |
Class B2, 3.7106% 9/25/37 (c)(j) | | 1,188,539 | | 71,312 |
Class M4, 1.8606% 9/25/37 (c)(j) | | 783,413 | | 101,844 |
Class M5, 2.0106% 9/25/37 (c)(j) | | 783,413 | | 82,258 |
Class M6, 2.2106% 9/25/37 (c)(j) | | 783,413 | | 70,507 |
Series 2004-1 Class IO, 1.25% 4/25/34 (c)(k) | | 1,480,477 | | 48,116 |
Commercial Mortgage Securities - continued |
| Principal
Amount | | Value |
Bear Stearns Commercial Mortgage Securities Trust: | | | | |
floater: | | | | |
Series 2006-BBA7: | | | | |
Class G, 0.7003% 3/15/19 (c)(j) | | $ 284,000 | | $ 235,513 |
Class H, 0.9103% 3/15/19 (c)(j) | | 191,000 | | 132,258 |
Class J, 1.1103% 3/15/19 (c)(j) | | 143,000 | | 93,502 |
Series 2007-BBA8: | | | | |
Class D, 0.5103% 3/15/22 (c)(j) | | 147,000 | | 114,660 |
Class E, 0.5603% 3/15/22 (c)(j) | | 763,000 | | 549,360 |
Class F, 0.6103% 3/15/22 (c)(j) | | 468,000 | | 318,240 |
Class G, 0.6603% 3/15/22 (c)(j) | | 120,000 | | 78,000 |
Class H, 0.8103% 3/15/22 (c)(j) | | 147,000 | | 80,850 |
Class J, 0.9603% 3/15/22 (c)(j) | | 147,000 | | 66,150 |
Series 2006-PW13 Class A3, 5.518% 9/11/41 | | 2,010,000 | | 2,108,160 |
Series 2007-PW15 Class A1, 5.016% 2/11/44 | | 890,971 | | 905,795 |
Series 2007-PW16: | | | | |
Class B, 5.9064% 6/11/40 (c)(j) | | 1,405,000 | | 775,013 |
Class C, 5.9064% 6/11/40 (c)(j) | | 1,170,000 | | 528,010 |
Class D, 5.9064% 6/11/40 (c)(j) | | 1,170,000 | | 469,285 |
C-BASS Trust floater Series 2006-SC1 Class A, 0.5306% 5/25/36 (c)(j) | | 314,213 | | 235,550 |
Citigroup Commercial Mortgage Trust: | | | | |
floater Series 2006-FL2: | | | | |
Class G, 0.5922% 8/15/21 (c)(j) | | 156,000 | | 147,420 |
Class H, 0.6322% 8/15/21 (c)(j) | | 125,000 | | 116,250 |
sequential payer Series 2006-C5 Class A4, 5.431% 10/15/49 | | 3,810,000 | | 4,069,304 |
Series 2007-C6 Class A1, 5.622% 12/10/49 (j) | | 4,149,204 | | 4,155,761 |
Series 2007-FL3A Class A2, 0.4003% 4/15/22 (c)(j) | | 2,595,000 | | 2,343,648 |
Citigroup/Deutsche Bank Commercial Mortgage Trust: | | | | |
sequential payer Series 2007-CD4 Class A4, 5.322% 12/11/49 | | 2,960,000 | | 3,068,099 |
Series 2007-CD4 Class A3, 5.293% 12/11/49 | | 6,065,000 | | 6,249,515 |
|
| Principal
Amount | | Value |
COMM pass-thru certificates: | | | | |
floater: | | | | |
Series 2005-F10A: | | | | |
Class D, 0.5703% 4/15/17 (c)(j) | | $ 335,000 | | $ 301,500 |
Class E, 0.6303% 4/15/17 (c)(j) | | 107,000 | | 92,020 |
Class F, 0.6703% 4/15/17 (c)(j) | | 60,000 | | 49,200 |
Class G, 0.8103% 4/15/17 (c)(j) | | 60,000 | | 44,400 |
Class H, 0.8803% 4/15/17 (c)(j) | | 60,000 | | 38,400 |
Class J, 1.1103% 4/15/17 (c)(j) | | 46,000 | | 24,840 |
Series 2005-FL11: | | | | |
Class F, 0.7103% 11/15/17 (c)(j) | | 65,513 | | 56,341 |
Class G, 0.7603% 11/15/17 (c)(j) | | 45,227 | | 36,634 |
sequential payer Series 2006-CN2A: | | | | |
Class A2FX, 5.449% 2/5/19 (c) | | 2,775,000 | | 2,775,483 |
Class AJFX, 5.478% 2/5/19 (c) | | 2,110,000 | | 2,100,587 |
Series 2004-LBN2 Class X2, 1.006% 3/10/39 (c)(j)(k) | | 4,071,270 | | 5,845 |
Credit Suisse Commercial Mortgage Trust: | | | | |
sequential payer Series 2007-C2 Class A2, 5.448% 1/15/49 (j) | | 3,885,000 | | 3,960,951 |
Series 2006-C4 Class AAB, 5.439% 9/15/39 | | 5,350,000 | | 5,633,975 |
Series 2007-C5 Class A4, 5.695% 9/15/40 (j) | | 2,750,000 | | 2,823,457 |
Credit Suisse First Boston Mortgage Securities Corp.: | | | | |
sequential payer Series 2004-C1: | | | | |
Class A3, 4.321% 1/15/37 | | 905,825 | | 916,156 |
Class A4, 4.75% 1/15/37 | | 3,035,000 | | 3,179,434 |
Series 1997-C2 Class D, 7.27% 1/17/35 | | 115,345 | | 116,910 |
Series 2001-CKN5 Class AX, 2.1871% 9/15/34 (c)(j)(k) | | 19,672,515 | | 124,771 |
Series 2002-CP3 Class G, 6.639% 7/15/35 (c) | | 250,000 | | 235,719 |
Series 2004-C1 Class ASP, 1.1338% 1/15/37 (c)(j)(k) | | 19,606,289 | | 31,339 |
Series 2006-C1 Class A3, 5.6903% 2/15/39 (j) | | 3,895,000 | | 4,108,506 |
Credit Suisse Mortgage Capital Certificates: | | | | |
floater Series 2007-TFL1: | | | | |
Class B, 0.4103% 2/15/22 (c)(j) | | 3,470,000 | | 2,845,400 |
Commercial Mortgage Securities - continued |
| Principal
Amount | | Value |
Credit Suisse Mortgage Capital Certificates: - continued | | | | |
Class C: | | | | |
0.4303% 2/15/22 (c)(j) | | $ 657,000 | | $ 512,460 |
0.5303% 2/15/22 (c)(j) | | 234,000 | | 152,100 |
Class F, 0.5803% 2/15/22 (c)(j) | | 469,000 | | 267,330 |
sequential payer Series 2007-C1 Class A1, 5.227% 2/15/40 | | 173,429 | | 174,089 |
GE Capital Commercial Mortgage Corp. sequential payer Series 2007-C1 Class A4, 5.543% 12/10/49 | | 4,470,000 | | 4,602,328 |
Greenwich Capital Commercial Funding Corp.: | | | | |
floater Series 2006-FL4 Class B, 0.4556% 11/5/21 (c)(j) | | 3,490,000 | | 3,193,683 |
sequential payer Series 2007-GG11 Class A2, 5.597% 12/10/49 | | 13,805,000 | | 14,454,023 |
Series 2006-GG7 Class A3, 6.0797% 7/10/38 (j) | | 3,460,000 | | 3,645,520 |
GS Mortgage Securities Corp. II: | | | | |
floater: | | | | |
Series 2006-FL8A: | | | | |
Class C, 0.5056% 6/6/20 (c)(j) | | 405,000 | | 380,083 |
Class D, 0.5456% 6/6/20 (c)(j) | | 1,115,000 | | 1,008,382 |
Class E, 0.6356% 6/6/20 (c)(j) | | 2,220,000 | | 1,954,107 |
Class F, 0.7056% 6/6/20 (c)(j) | | 294,000 | | 251,849 |
Series 2007-EOP: | | | | |
Class C, 0.5856% 3/6/20 (c)(j) | | 1,335,000 | | 1,254,900 |
Class D, 0.6356% 3/6/20 (c)(j) | | 400,000 | | 372,000 |
Class E, 0.7056% 3/6/20 (c)(j) | | 670,000 | | 616,400 |
Class F, 0.7456% 3/6/20 (c)(j) | | 335,000 | | 304,850 |
Class G, 0.7856% 3/6/20 (c)(j) | | 165,000 | | 148,500 |
Class H, 0.9156% 3/6/20 (c)(j) | | 275,000 | | 244,750 |
Class J, 1.1156% 3/6/20 (c)(j) | | 395,000 | | 350,563 |
sequential payer Series 2004-GG2 Class A4, 4.964% 8/10/38 | | 2,725,000 | | 2,825,500 |
Series 2006-GG6 Class A2, 5.506% 4/10/38 | | 2,676,596 | | 2,690,611 |
GS Mortgage Securities Trust sequential payer Series 2007-GG10: | | | | |
Class A1, 5.69% 8/10/45 | | 400,030 | | 407,329 |
Class A2, 5.778% 8/10/45 | | 5,055,000 | | 5,192,885 |
|
| Principal
Amount | | Value |
Class A4, 6.0014% 8/10/45 (j) | | $ 2,280,000 | | $ 2,383,539 |
JPMorgan Chase Commercial Mortgage Securities Trust: | | | | |
floater Series 2006-FLA2: | | | | |
Class E, 0.5403% 11/15/18 (c)(j) | | 101,332 | | 83,092 |
Class F, 0.5903% 11/15/18 (c)(j) | | 151,998 | | 121,598 |
Class G, 0.6203% 11/15/18 (c)(j) | | 132,422 | | 101,965 |
Class H, 0.7603% 11/15/18 (c)(j) | | 101,337 | | 76,003 |
sequential payer: | | | | |
Series 2006-CB14 Class A3B, 5.6678% 12/12/44 (j) | | 4,625,000 | | 4,885,890 |
Series 2006-LDP9 Class A2, 5.134% 5/15/47 (j) | | 5,105,000 | | 5,319,068 |
Series 2007-LDP10 Class A1, 5.122% 1/15/49 | | 182,979 | | 184,279 |
Series 2007-LDPX Class A3, 5.412% 1/15/49 | | 3,796,000 | | 3,948,080 |
Series 2005-LDP3 Class A3, 4.959% 8/15/42 | | 4,006,322 | | 4,139,639 |
Series 2007-CB19: | | | | |
Class B, 5.9323% 2/12/49 (j) | | 755,000 | | 416,469 |
Class C, 5.9323% 2/12/49 (j) | | 1,971,000 | | 842,611 |
Class D, 5.9323% 2/12/49 (j) | | 2,075,000 | | 728,100 |
Series 2007-LDP10: | | | | |
Class BS, 5.437% 1/15/49 (j) | | 1,725,000 | | 761,676 |
Class CS, 5.466% 1/15/49 (j) | | 745,000 | | 261,038 |
Class ES, 5.7307% 1/15/49 (c)(j) | | 4,663,000 | | 537,025 |
LB Commercial Conduit Mortgage Trust sequential payer Series 2007-C3 Class A4, 6.1412% 7/15/44 (j) | | 3,733,000 | | 3,993,078 |
LB-UBS Commercial Mortgage Trust: | | | | |
sequential payer: | | | | |
Series 2005-C3 Class A2, 4.553% 7/15/30 | | 788,882 | | 790,293 |
Series 2006-C1 Class A2, 5.084% 2/15/31 | | 791,278 | | 794,230 |
Series 2006-C6 Class A2, 5.262% 9/15/39 (j) | | 3,340,000 | | 3,385,257 |
Series 2006-C7 Class A1, 5.279% 11/15/38 | | 216,299 | | 218,926 |
Series 2007-C1: | | | | |
Class A1, 5.391% 2/15/40 (j) | | 479,456 | | 487,680 |
Class A3, 5.398% 2/15/40 | | 5,000,000 | | 5,127,684 |
Class A4, 5.424% 2/15/40 | | 8,620,000 | | 9,052,203 |
Series 2007-C2 Class A3, 5.43% 2/15/40 | | 1,165,000 | | 1,201,346 |
Series 2001-C3 Class B, 6.512% 6/15/36 | | 1,810,000 | | 1,849,426 |
Commercial Mortgage Securities - continued |
| Principal
Amount | | Value |
Lehman Brothers Floating Rate Commercial Mortgage Trust floater Series 2006-LLFA: | | | | |
Class F, 0.6003% 9/15/21 (c)(j) | | $ 402,971 | | $ 290,139 |
Class G, 0.6203% 9/15/21 (c)(j) | | 795,609 | | 556,927 |
Class H, 0.6603% 9/15/21 (c)(j) | | 204,773 | | 131,055 |
Merrill Lynch Mortgage Trust: | | | | |
sequential payer: | | | | |
Series 2004-KEY2 Class A2, 4.166% 8/12/39 | | 130,107 | | 133,058 |
Series 2005-MCP1 Class A2, 4.556% 6/12/43 | | 591,965 | | 599,989 |
Series 2007-C1 Class A4, 6.0193% 6/12/50 (j) | | 3,796,000 | | 4,042,651 |
Merrill Lynch-CFC Commercial Mortgage Trust: | | | | |
sequential payer: | | | | |
Series 2007-5: | | | | |
Class A1, 4.275% 8/12/48 | | 103,536 | | 103,725 |
Class A3, 5.364% 8/12/48 | | 4,298,000 | | 4,407,673 |
Series 2007-6 Class A4, 5.485% 3/12/51 (j) | | 3,875,000 | | 3,950,869 |
Series 2007-9 Class A4, 5.7% 9/12/49 | | 5,500,000 | | 5,739,890 |
Series 2007-7 Class B, 5.75% 6/12/50 | | 770,000 | | 142,219 |
Morgan Stanley Capital I Trust: | | | | |
floater: | | | | |
Series 2006-XLF Class C, 1.461% 7/15/19 (c)(j) | | 113,478 | | 15,887 |
Series 2007-XCLA Class A1, 0.461% 7/17/17 (c)(j) | | 844,085 | | 633,064 |
Series 2007-XLFA: | | | | |
Class D, 0.451% 10/15/20 (c)(j) | | 235,000 | | 84,600 |
Class E, 0.511% 10/15/20 (c)(j) | | 294,000 | | 61,740 |
Class F, 0.561% 10/15/20 (c)(j) | | 176,000 | | 24,640 |
Class G, 0.601% 10/15/20 (c)(j) | | 218,000 | | 15,260 |
Class H, 0.691% 10/15/20 (c)(j) | | 137,000 | | 8,220 |
Class J, 0.841% 10/15/20 (c)(j) | | 157,000 | | 6,280 |
Class NHRO, 1.151% 10/15/20 (c)(j) | | 87,956 | | 13,193 |
sequential payer: | | | | |
Series 2006-T23 Class A1, 5.682% 8/12/41 | | 170,591 | | 171,620 |
Series 2007-HQ11 Class A31, 5.439% 2/12/44 (j) | | 4,785,000 | | 4,952,626 |
Series 2007-IQ13 Class A1, 5.05% 3/15/44 | | 876,557 | | 886,529 |
Series 2007-IQ14 Class A1, 5.38% 4/15/49 | | 1,962,899 | | 2,006,532 |
|
| Principal
Amount | | Value |
Series 2005-IQ9 Class X2, 1.2161% 7/15/56 (c)(j)(k) | | $ 18,144,327 | | $ 194,700 |
Series 2007-HQ12 Class A2, 5.7804% 4/12/49 (j) | | 4,801,965 | | 4,983,155 |
Series 2007-IQ14 Class B, 5.9133% 4/15/49 (j) | | 2,175,000 | | 761,250 |
Providence Place Group Ltd. Partnership Series 2000-C1 Class A2, 7.75% 7/20/28 (c) | | 2,999,017 | | 3,088,988 |
Wachovia Bank Commercial Mortgage Trust: | | | | |
floater: | | | | |
Series 2005-WL5A Class K, 1.4603% 1/15/18 (c)(j) | | 449,000 | | 431,314 |
Series 2006-WL7A: | | | | |
Class E, 0.5406% 9/15/21 (c)(j) | | 491,000 | | 369,365 |
Class F, 0.6006% 8/11/18 (c)(j) | | 661,000 | | 420,243 |
Class G, 0.6206% 8/11/18 (c)(j) | | 626,000 | | 360,010 |
Class J, 0.8606% 8/11/18 (c)(j) | | 139,000 | | 58,478 |
Series 2007-WHL8: | | | | |
Class AP2, 1.0603% 6/15/20 (c)(j) | | 53,945 | | 35,064 |
Class F, 0.7403% 6/15/20 (c)(j) | | 1,046,000 | | 575,300 |
Class LXR2, 1.0603% 6/15/20 (c)(j) | | 713,442 | | 527,947 |
sequential payer: | | | | |
Series 2003-C7 Class A1, 4.241% 10/15/35 (c) | | 540,274 | | 544,433 |
Series 2007-C30: | | | | |
Class A3, 5.246% 12/15/43 | | 5,940,000 | | 6,037,814 |
Class A4, 5.305% 12/15/43 | | 3,240,000 | | 3,253,120 |
Class A5, 5.342% 12/15/43 | | 3,796,000 | | 3,835,733 |
Series 2007-C31 Class A1, 5.14% 4/15/47 | | 376,214 | | 378,529 |
Series 2007-C32 Class A2, 5.9276% 6/15/49 (j) | | 1,255,000 | | 1,318,666 |
Series 2006-C23 Class A5, 5.416% 1/15/45 (j) | | 3,010,000 | | 3,209,459 |
Series 2007-C30 Class E, 5.553% 12/15/43 (j) | | 6,257,000 | | 492,687 |
Series 2007-C31 Class C, 5.8835% 4/15/47 (j) | | 2,455,000 | | 638,650 |
TOTAL COMMERCIAL MORTGAGE SECURITIES (Cost $269,059,901) | 253,357,549 |
Municipal Securities - 0.3% |
|
California Gen. Oblig.: | | | | |
6.2% 3/1/19 | | 2,000,000 | | 2,024,600 |
7.5% 4/1/34 | | 2,400,000 | | 2,483,400 |
Municipal Securities - continued |
| Principal
Amount | | Value |
California Gen. Oblig.: - continued | | | | |
7.55% 4/1/39 | | $ 2,560,000 | | $ 2,655,078 |
Illinois Gen. Oblig. Series 2010, 4.421% 1/1/15 | | 2,850,000 | | 2,854,218 |
TOTAL MUNICIPAL SECURITIES (Cost $9,883,129) | 10,017,296 |
Foreign Government and Government Agency Obligations - 0.1% |
|
United Mexican States 5.875% 1/15/14
(Cost $1,643,514) | | 1,665,000 | | 1,843,988 |
Supranational Obligations - 0.0% |
|
Corporacion Andina de Fomento 5.2% 5/21/13
(Cost $348,544) | | 350,000 | | 378,609 |
Preferred Securities - 0.1% |
| | | |
FINANCIALS - 0.1% |
Diversified Financial Services - 0.1% |
MUFG Capital Finance 1 Ltd. 6.346% (j)
(Cost $2,315,312) | 2,283,000 | | 2,363,147 |
Cash Equivalents - 15.8% |
| Maturity Amount | | |
Investments in repurchase agreements in a joint trading account at 0.26%, dated 12/31/10 due 1/3/11 (Collateralized by U.S. Government Obligations) #
(Cost $595,112,000) | $ 595,124,992 | | 595,112,000 |
TOTAL INVESTMENT PORTFOLIO - 123.9% (Cost $4,591,892,304) | | 4,655,228,994 |
NET OTHER ASSETS (LIABILITIES) - (23.9)% | | (897,137,963) |
NET ASSETS - 100% | $ 3,758,091,031 |
Swap Agreements |
| Expiration Date | | Notional Amount | | Value |
Credit Default Swaps |
Receive monthly a fixed rate of .15% multiplied by the notional amount and pay to Credit Suisse First Boston upon each credit event of one of the issues of ABX AA 07-01 Index, par value of the proportional notional amount (Rating-C) (Upfront Payment Made/
(Received) $(360,000)) (i) | Sept. 2037 | | $ 2,127,083 | | $ (1,990,489) |
Receive monthly a fixed rate of .15% multiplied by the notional amount and pay to Credit Suisse First Boston upon each credit event of one of the issues of ABX AA 07-01 Index, par value of the proportional notional amount (Rating-C) (Upfront Payment Made/
(Received) $(598,000)) (i) | Sept. 2037 | | 1,843,472 | | (1,725,090) |
Receive monthly a fixed rate of .15% multiplied by the notional amount and pay to JPMorgan Chase, Inc. upon each credit event of one of the issues of ABX AA 07-01 Index, par value of the proportional notional amount (Rating-C) (Upfront Payment Made/(Received) $(348,750)) (i) | Sept. 2037 | | 1,063,541 | | (995,244) |
Receive monthly a fixed rate of .15% multiplied by the notional amount and pay to JPMorgan Chase, Inc. upon each credit event of one of the issues of ABX AA 07-01 Index, par value of the proportional notional amount (Rating-C) (Upfront Payment Made/(Received) $(701,375)) (i) | Sept. 2037 | | 2,197,985 | | (2,056,838) |
Swap Agreements - continued |
| Expiration Date | | Notional Amount | | Value |
Credit Default Swaps - continued |
Receive monthly a fixed rate of .15% multiplied by the notional amount and pay to UBS upon each credit event of one of the issues of ABX AA 07-1 Index, par value of the proportional notional amount (Rating-C) (Upfront Payment Made/(Received) $(572,000)) (i) | Sept. 2037 | | $ 3,119,721 | | $ (2,919,383) |
Receive monthly a fixed rate of .15% multiplied by the notional amount and pay to UBS upon each credit event of one of the issues of ABX AA 07-1 Index, par value of the proportional notional amount (Rating-C) (Upfront Payment Made/(Received) $(214,000)) (i) | Sept. 2037 | | 1,134,444 | | (1,061,594) |
Receive monthly a fixed rate of .15% multiplied by the notional amount and pay to UBS upon each credit event of one of the issues of ABX AA 07-1 Index, par value of the proportional notional amount (Rating-C) (Upfront Payment Made/(Received) $(1,023,500)) (i) | Sept. 2037 | | 3,261,527 | | (3,052,082) |
Receive monthly notional amount multiplied by .82% and pay UBS upon credit event of Morgan Stanley ABS Capital I, Inc., par value of the notional amount of Morgan Stanley ABS Capital I, Inc. Series 2004-NC6 Class M3, 5.6413% 7/25/34 (h) | August 2034 | | 90,418 | | (50,218) |
Receive monthly notional amount multiplied by 2.4% and pay Deutsche Bank upon credit event of Fremont Home Loan Trust, par value of the notional amount of Fremont Home Loan Trust Series 2004-A Class B3, 7.2288% 1/25/34
(Rating-C) (h) | Feb. 2034 | | 4,841 | | (4,566) |
|
| Expiration Date | | Notional Amount | | Value |
Receive monthly notional amount multiplied by 2.5% and pay Bank of America upon credit event of Ameriquest Mortgage Securities, Inc., par value of the notional amount of Ameriquest Mortgage Securities, Inc. Series 2004-R11 Class M9, 6.102% 11/25/34 (Rating-C) (h) | Dec. 2034 | | $ 245,904 | | $ (239,757) |
Receive monthly notional amount multiplied by 2.5% and pay Bank of America upon credit event of Ameriquest Mortgage Securities, Inc., par value of the notional amount of Ameriquest Mortgage Securities, Inc. Series 2004-R8 Class M9, 8.07% 9/25/34 (Rating-C) (h) | Oct. 2034 | | 127,968 | | (127,145) |
Receive monthly notional amount multiplied by 2.5% and pay Credit Suisse First Boston upon credit event of Ameriquest Mortgage Securities, Inc., par value of the notional amount of Ameriquest Mortgage Securities, Inc. Series 2004-R11 Class M9, 8.03% 11/25/34
(Rating-C) (h) | Dec. 2034 | | 427,179 | | (416,501) |
Receive monthly notional amount multiplied by 3.35% and pay Morgan Stanley, Inc. upon credit event of Morgan Stanley ABS Capital I, Inc., par value of the notional amount of Morgan Stanley ABS Capital I, Inc. Series 2004-HE7, Class B3, 9.01% 8/25/34 (Rating-C) (h) | Sept. 2034 | | 89,622 | | (67,742) |
Receive monthly notional amount multiplied by 3.83% and pay Morgan Stanley, Inc. upon credit event of Park Place Securities, Inc., par value of the notional amount of Park Place Securities, Inc. Series 2005-WHQ2 Class M9, 7.2% 5/25/35 (Rating-C) (h) | June 2035 | | 213,551 | | (196,823) |
Swap Agreements - continued |
| Expiration Date | | Notional Amount | | Value |
Credit Default Swaps - continued |
Receive semi-annually notional amount multiplied by .61% and pay JPMorgan Chase, Inc. upon credit event of United Mexican States, par value of the notional amount of United Mexican States
7.5% 4/8/33
(Rating-Baa1) (h) | May 2011 | | $ 4,290,000 | | $ 5,138 |
Receive semi-annually notional amount multiplied by .625% and pay Deutsche Bank upon credit event of United Mexican States, par value of the notional amount of United Mexican States
7.5% 4/8/33
(Rating-Baa1) (h) | May 2011 | | 2,260,000 | | 2,877 |
TOTAL CREDIT DEFAULT SWAPS | | $ 22,497,256 | | $ (14,895,457) |
Interest Rate Swaps |
Receive semi-annually a fixed rate equal to 1.2857% and pay quarterly a floating rate based on 3-month LIBOR with JPMorgan Chase, Inc. | June 2012 | | 80,966,000 | | 904,147 |
| | $ 103,463,256 | | $ (13,991,310) |
Legend |
(a) Non-income producing - Security is in default. |
(b) Security initially issued at one coupon which converts to a higher coupon at a specified date. The rate shown is the rate at period end. |
(c) Security exempt from registration under Rule 144A of the Securities Act of 1933. These securities may be resold in transactions exempt from registration, normally to qualified institutional buyers. At the end of the period, the value of these securities amounted to $206,861,474 or 5.5% of net assets. |
(d) Under the Temporary Liquidity Guarantee Program, the Federal Deposit Insurance Corporation guarantees principal and interest in the event of payment default or bankruptcy until the earlier of maturity date of the debt or until June 30, 2012. At the end of the period these securities amounted to $18,633,357 or 0.5% of net assets. |
(e) Security or a portion of the security purchased on a delayed delivery or when-issued basis. |
(f) A portion of the security is subject to a forward commitment to sell. |
(g) Security or a portion of the security has been segregated as collateral for open swap agreements. At the period end, the value of securities pledged amounted to $16,789,409. |
(h) Represents a credit default swap contract in which the Fund has sold protection on the underlying reference entity. The value of each credit default swap and the credit rating can be measures of the current payment/performance risk. For the underlying reference entity, ratings disclosed are from Moody's Investors Service, Inc. Where Moody's ratings are not available, S&P ratings are disclosed and are indicated as such. All ratings are as of the report date and do not reflect subsequent changes. Where a credit rating is not disclosed, the value is used as the measure of the payment/performance risk. |
(i) Represents a credit default swap based on a tradable index of home equity asset-backed debt securities. The value of each credit default swap and the credit rating can be measures of the current payment/
performance risk. In addition, the swap represents a contract in which the Fund has sold protection on the index of underlying securities. Ratings represent a weighted average of the ratings of all securities included in the index. Ratings used in the weighted average are from Moody's Investors Service, Inc., or S&P where Moody's ratings are not available. All ratings are as of the report date and do not reflect subsequent changes. |
(j) The coupon rate shown on floating or adjustable rate securities represents the rate at period end. |
(k) Security represents right to receive monthly interest payments on an underlying pool of mortgages or assets. Principal shown is the outstanding par amount of the pool held as of the end of the period. |
(l) Coupon is inversely indexed to a floating interest rate multiplied by a specified factor. The price may be considerably more volatile than the price of a comparable fixed rate security. |
# Additional information on each counterparty to the repurchase agreement is as follows: |
Repurchase Agreement / Counterparty | Value |
$595,112,000 due 1/03/11 at 0.26% |
BNP Paribas Securities Corp. | $ 68,267,928 |
Bank of America NA | 73,033,355 |
Barclays Capital, Inc. | 22,822,923 |
Credit Agricole Securities (USA), Inc. | 5,583,948 |
HSBC Securities (USA), Inc. | 18,258,339 |
ING Financial Markets LLC | 21,910,006 |
J.P. Morgan Securities, Inc. | 18,258,339 |
Merrill Lynch Government Securities, Inc. | 32,865,010 |
Merrill Lynch, Pierce, Fenner & Smith, Inc. | 36,501,231 |
Mizuho Securities USA, Inc. | 146,066,710 |
Societe Generale, New York Branch | 36,516,677 |
Wells Fargo Securities LLC | 115,027,534 |
| $ 595,112,000 |
Other Information |
The following is a summary of the inputs used, as of December 31, 2010, involving the Fund's assets and liabilities carried at fair value. The inputs or methodology used for valuing securities may not be an indication of the risk associated with investing in those securities. For more information on valuation inputs, and their aggregation into the levels used in the tables below, please refer to the Security Valuation section in the accompanying Notes to Financial Statements. |
Valuation Inputs at Reporting Date: |
Description | Total | Level 1 | Level 2 | Level 3 |
Investments in Securities: | | | | |
Corporate Bonds | $ 898,964,209 | $ - | $ 898,964,209 | $ - |
U.S. Government and Government Agency Obligations | 1,198,066,106 | - | 1,198,066,106 | - |
U.S. Government Agency - Mortgage Securities | 1,529,673,315 | - | 1,529,673,315 | - |
Asset-Backed Securities | 96,077,647 | - | 91,992,025 | 4,085,622 |
Collateralized Mortgage Obligations | 69,375,128 | - | 68,869,354 | 505,774 |
Commercial Mortgage Securities | 253,357,549 | - | 243,048,311 | 10,309,238 |
Municipal Securities | 10,017,296 | - | 10,017,296 | - |
Foreign Government and Government Agency Obligations | 1,843,988 | - | 1,843,988 | - |
Supranational Obligations | 378,609 | - | 378,609 | - |
Preferred Securities | 2,363,147 | - | 2,363,147 | - |
Cash Equivalents | 595,112,000 | - | 595,112,000 | - |
Total Investments in Securities: | $ 4,655,228,994 | $ - | $ 4,640,328,360 | $ 14,900,634 |
Derivative Instruments: | | | | |
Assets | | | | |
Swap Agreements | $ 912,162 | $ - | $ 912,162 | $ - |
Liabilities | | | | |
Swap Agreements | $ (14,903,472) | $ - | $ (13,800,719) | $ (1,102,753) |
Total Derivative Instruments: | $ (13,991,310) | $ - | $ (12,888,557) | $ (1,102,753) |
Other Financial Instruments: | | | | |
Forward Commitments | $ (1,935,055) | $ - | $ (1,935,055) | $ - |
The following is a reconciliation of Investments in Securities and Derivative Instruments for which Level 3 inputs were used in determining value: |
Investments in Securities: | |
Beginning Balance | $ 14,822,693 |
Total Realized Gain (Loss) | (1,178,838) |
Total Unrealized Gain (Loss) | 3,830,464 |
Cost of Purchases | 2,149,062 |
Proceeds of Sales | (1,842,836) |
Amortization/Accretion | (590,231) |
Transfers in to Level 3 | 4,258,003 |
Transfers out of Level 3 | (6,547,683) |
Ending Balance | $ 14,900,634 |
The change in unrealized gain (loss) for the period attributable to Level 3 securities held at December 31, 2010 | $ 2,336,040 |
Derivative Instruments: | |
Swap Agreements | |
Beginning Balance | $ (2,151,575) |
Total Unrealized Gain (Loss) | 1,124,186 |
Transfers in to Level 3 | (75,364) |
Transfers out of Level 3 | - |
Ending Balance | $ (1,102,753) |
Realized gain (loss) on Swap Agreements for the period | $ 483,000 |
The change in unrealized gain (loss) for the period attributable to Level 3 Swap Agreements held at December 31, 2010 | $ 576,599 |
The information used in the above reconciliation represents fiscal year to date activity for any Investments in Securities and Derivative Instruments identified as using Level 3 inputs at either the beginning or the end of the current fiscal period. Transfers in or out of Level 3 represent the beginning value of any Security or Instrument where a change in the pricing level occurred from the beginning to the end of the period. The cost of purchases and the proceeds of sales may include securities received or delivered through corporate actions or exchanges. Realized and unrealized gains (losses) disclosed in the reconciliation are included in Net Gain (Loss) on the Fund's Statement of Operations. |
Value of Derivative Instruments |
The following table is a summary of the Fund's value of derivative instruments by risk exposure as of December 31, 2010. For additional information on derivative instruments, please refer to the Derivative Instruments section in the accompanying Notes to Financial Statements. |
Risk Exposure /
Derivative Type | Value |
| Asset | Liability |
Credit Risk | | |
Swap Agreements | $ 8,015 | $ (14,903,472) |
Interest Rate Risk | | |
Swap Agreements | 904,147 | - |
Total Value of Derivatives (a) | $ 912,162 | $ (14,903,472) |
(a) Value is disclosed on the Statement of Assets and Liabilities in the Unrealized Appreciation and Unrealized Depreciation on Swap Agreements line-items. |
See accompanying notes which are an integral part of the financial statements.
Annual Report
Financial Statements
Statement of Assets and Liabilities
| December 31, 2010 |
| | |
Assets | | |
Investment in securities, at value (including repurchase agreements of $595,112,000) - See accompanying schedule: Unaffiliated issuers (cost $4,591,892,304) | | $ 4,655,228,994 |
Commitment to sell securities on a delayed delivery basis | $ (338,697,446) | |
Receivable for securities sold on a delayed delivery basis | 336,762,391 | (1,935,055) |
Receivable for investments sold, regular delivery | | 47,846,855 |
Cash | | 56,371 |
Receivable for swap agreements | | 5,033 |
Interest receivable | | 26,028,023 |
Unrealized appreciation on swap agreements | | 912,162 |
Other receivables | | 127 |
Total assets | | 4,728,142,510 |
| | |
Liabilities | | |
Payable for investments purchased
Regular delivery | $ 63,313,367 | |
Delayed delivery | 891,520,784 | |
Payable for swap agreements | 296,379 | |
Unrealized depreciation on swap agreements | 14,903,472 | |
Other payables and accrued expenses | 17,477 | |
Total liabilities | | 970,051,479 |
| | |
Net Assets | | $ 3,758,091,031 |
Net Assets consist of: | | |
Paid in capital | | $ 3,691,566,497 |
Undistributed net investment income | | 8,506,392 |
Accumulated undistributed net realized gain (loss) on investments | | 9,355,288 |
Net unrealized appreciation (depreciation) on investments | | 48,662,854 |
Net Assets, for 35,729,379 shares outstanding | | $ 3,758,091,031 |
Net Asset Value, offering price and redemption price per share ($3,758,091,031 ÷ 35,729,379 shares) | | $ 105.18 |
Statement of Operations
| Year ended December 31, 2010 |
| | |
Investment Income | | |
Dividends | | $ 161,918 |
Interest | | 145,080,348 |
Total income | | 145,242,266 |
| | |
Expenses | | |
Custodian fees and expenses | $ 102,026 | |
Independent trustees' compensation | 14,263 | |
Total expenses before reductions | 116,289 | |
Expense reductions | (14,694) | 101,595 |
Net investment income | | 145,140,671 |
Realized and Unrealized Gain (Loss) Net realized gain (loss) on: | | |
Investment securities: | | |
Unaffiliated issuers | 126,911,348 | |
Swap agreements | 16,131,406 | |
Total net realized gain (loss) | | 143,042,754 |
Change in net unrealized appreciation (depreciation) on: Investment securities | 40,510,873 | |
Swap agreements | (11,915,110) | |
Delayed delivery commitments | (2,850,134) | |
Total change in net unrealized appreciation (depreciation) | | 25,745,629 |
Net gain (loss) | | 168,788,383 |
Net increase (decrease) in net assets resulting from operations | | $ 313,929,054 |
See accompanying notes which are an integral part of the financial statements.
Annual Report
Statement of Changes in Net Assets
| Year ended
December 31, 2010 | Year ended
December 31, 2009 |
Increase (Decrease) in Net Assets | | |
Operations | | |
Net investment income | $ 145,140,671 | $ 164,800,617 |
Net realized gain (loss) | 143,042,754 | 24,778,123 |
Change in net unrealized appreciation (depreciation) | 25,745,629 | 307,699,497 |
Net increase (decrease) in net assets resulting from operations | 313,929,054 | 497,278,237 |
Distributions to shareholders from net investment income | (145,185,204) | (157,751,977) |
Distributions to shareholders from net realized gain | (132,021,770) | (9,844,730) |
Total distributions | (277,206,974) | (167,596,707) |
Share transactions
Proceeds from sales of shares | 72,938,886 | 459,946,752 |
Reinvestment of distributions | 277,206,974 | 167,596,707 |
Cost of shares redeemed | (586,003,407) | (162,859,288) |
Net increase (decrease) in net assets resulting from share transactions | (235,857,547) | 464,684,171 |
Total increase (decrease) in net assets | (199,135,467) | 794,365,701 |
| | |
Net Assets | | |
Beginning of period | 3,957,226,498 | 3,162,860,797 |
End of period (including undistributed net investment income of $8,506,392 and undistributed net investment income of $9,252,186, respectively) | $ 3,758,091,031 | $ 3,957,226,498 |
Other Information Shares | | |
Sold | 678,877 | 4,495,735 |
Issued in reinvestment of distributions | 2,605,878 | 1,665,760 |
Redeemed | (5,416,725) | (1,669,790) |
Net increase (decrease) | (2,131,970) | 4,491,705 |
See accompanying notes which are an integral part of the financial statements.
Annual Report
Financial Highlights
Years ended December 31, | 2010 | 2009 | 2008 | 2007 | 2006 H |
Selected Per-Share Data | | | | | |
Net asset value, beginning of period | $ 104.52 | $ 94.78 | $ 102.50 | $ 103.02 | $ 100.00 |
Income from Investment Operations | | | | | |
Net investment income D | 3.943 | 4.762 | 5.319 | 5.534 | 2.814 |
Net realized and unrealized gain (loss) | 4.424 | 9.818 | (7.583) | (.594) | 3.132 |
Total from investment operations | 8.367 | 14.580 | (2.264) | 4.940 | 5.946 |
Distributions from net investment income | (3.947) | (4.580) | (5.236) | (5.385) | (2.826) |
Distributions from net realized gain | (3.760) | (.260) | (.220) | (.075) | (.100) |
Total distributions | (7.707) | (4.840) | (5.456) | (5.460) | (2.926) |
Net asset value, end of period | $ 105.18 | $ 104.52 | $ 94.78 | $ 102.50 | $ 103.02 |
Total Return B, C | 8.12% | 15.71% | (2.29) % | 4.94% | 5.95% |
Ratios to Average Net Assets E, I | | | | | |
Expenses before reductions G | -% | -% | -% | -% | -% A |
Expenses net of fee waivers, if any G | -% | -% | -% | -% | -% A |
Expenses net of all reductions G | -% | -% | -% | -% | -% A |
Net investment income | 3.65% | 4.75% | 5.35% | 5.42% | 5.23% A |
Supplemental Data | | | | | |
Net assets, end of period (000 omitted) | $ 3,758,091 | $ 3,957,226 | $ 3,162,861 | $ 3,587,807 | $ 2,794,948 |
Portfolio turnover rate F | 230% | 141% | 140% | 137% | 99% A |
A Annualized
B Total returns for periods of less than one year are not annualized.
C Total returns would have been lower had certain expenses not been reduced during the periods shown.
D Calculated based on average shares outstanding during the period.
E Fees and expenses of the underlying Fidelity Central Funds are not included in the Fund's expense ratio. The Fund indirectly bears its proportionate share of the expenses of any underlying Fidelity Central Funds.
F Amount does not include the portfolio activity of any underlying Fidelity Central Funds.
G Amount represents less than .01%.
H For the period June 23, 2006 (commencement of operations) to December 31, 2006.
I Expense ratios reflect operating expenses of the Fund. Expenses before reductions do not reflect amounts reimbursed by the investment adviser or reductions from expense offset arrangements and do not represent the amount paid by the Fund during periods when reimbursements or reductions occur. Expense ratios before reductions for start-up periods may not be representative of longer term operating periods. Expenses net of fee waivers reflect expenses after reimbursement by the investment adviser but prior to reductions from expense offset arrangements. Expenses net of all reductions represent the net expenses paid by the Fund.
See accompanying notes which are an integral part of the financial statements.
Annual Report
Notes to Financial Statements
For the period ended December 31, 2010
1. Organization.
Fidelity VIP Investment Grade Central Fund (the Fund) is a fund of Fidelity Garrison Street Trust (the Trust) and is authorized to issue an unlimited number of shares. The Trust is registered under the Investment Company Act of 1940, as amended (the 1940 Act), as an open-end management investment company organized as a Massachusetts business trust. Shares of the Fund are only offered to other investment companies and accounts managed by Fidelity Management & Research Company (FMR), or its affiliates (the Investing Funds).
2. Significant Accounting Policies.
The financial statements have been prepared in conformity with accounting principles generally accepted in the United States of America (GAAP), which require management to make certain estimates and assumptions at the date of the financial statements. Actual results could differ from those estimates. Subsequent events, if any, through the date that the financial statements were issued have been evaluated in the preparation of the financial statements. The following summarizes the significant accounting policies of the Fund:
Security Valuation. Investments are valued as of 4:00 p.m. Eastern time on the last calendar day of the period. The Fund uses independent pricing services approved by the Board of Trustees to value its investments. When current market prices or quotations are not readily available or reliable, valuations may be determined in good faith in accordance with procedures adopted by the Board of Trustees. Factors used in determining value may include market or security specific events, changes in interest rates and credit quality. The frequency with which these procedures are used cannot be predicted and they may be utilized to a significant extent. The value used for net asset value (NAV) calculation under these procedures may differ from published prices for the same securities.
The Fund categorizes the inputs to valuation techniques used to value its investments into a disclosure hierarchy consisting of three levels as shown below.
Level 1 - quoted prices in active markets for identical investments
Level 2 - other significant observable inputs (including quoted prices for similar investments, interest rates, prepayment speeds, etc.)
Level 3 - unobservable inputs (including the Fund's own assumptions based on the best information available)
Changes in valuation techniques may result in transfers in or out of an assigned level within the disclosure hierarchy. The aggregate value of investments by input level, as of December 31, 2010 for the Fund's investments, as well as a roll forward of Level 3 securities, is included at the end of the Fund's Schedule of Investments. Valuation techniques used to value the Fund's investments by major category are as follows.
Debt securities, including restricted securities, are valued based on evaluated prices received from independent pricing services or from dealers who make markets in such securities. For corporate bonds, foreign government and government agency obligations, municipal securities, preferred securities, supranational obligations and U.S. government and government agency obligations, pricing services utilize matrix pricing which considers yield or price of bonds of comparable quality, coupon, maturity and type as well as dealer supplied prices and are generally categorized as Level 2 in the hierarchy. For asset backed securities, collateralized mortgage obligations, commercial mortgage securities and U.S. government agency mortgage securities, pricing services utilize matrix pricing which considers prepayment speed assumptions, attributes of the collateral, yield or price of bonds of comparable quality, coupon, maturity and type as well as dealer supplied prices and, accordingly, such securities are generally categorized as Level 2 in the hierarchy. Dealers which make markets in asset backed securities, collateralized mortgage obligations and commercial mortgage securities may also consider such factors as the structure of the issue, cash flow assumptions, the value of underlying assets as well as any guarantees.
Swaps are marked-to-market daily based on valuations from independent pricing services or dealer-supplied valuations and changes in value are recorded as unrealized appreciation (depreciation). Pricing services utilize matrix pricing which considers comparisons to interest rate curves, credit spread curves, default possibilities and recovery rates and, as a result, swaps are generally categorized as Level 2 in the hierarchy.
When independent prices are unavailable or unreliable, debt securities and swaps may be valued utilizing pricing matrices which consider similar factors that would be used by independent pricing services. These are generally categorized as Level 2 in the hierarchy but may be Level 3 depending on the circumstances.
Investment Transactions and Income. For financial reporting purposes, the Fund's investment holdings and NAV include trades executed through the end of the last business day of the period. The NAV per share for processing shareholder transactions is calculated as of the close of business of the New York Stock Exchange (NYSE), normally 4:00 p.m. Eastern time and includes trades executed through the end of the prior business day. Gains and losses on securities sold are determined on the basis of identified cost and may include proceeds received from litigation. Dividend income is recorded on the ex-dividend date. Interest income is accrued as earned. Interest income includes coupon interest and amortization of premium and accretion of discount on debt securities. Inflation-indexed bonds are fixed-income securities whose principal value is periodically adjusted to the rate of inflation.
Annual Report
2. Significant Accounting Policies - continued
Investment Transactions and Income - continued
Interest is accrued based on the principal value, which is adjusted for inflation. The adjustments to principal due to inflation are reflected as increases or decreases to interest income even though principal is not received until maturity. Debt obligations may be placed on non-accrual status and related interest income may be reduced by ceasing current accruals and writing off interest receivables when the collection of all or a portion of interest has become doubtful based on consistently applied procedures. A debt obligation is removed from non-accrual status when the issuer resumes interest payments or when collectability of interest is reasonably assured.
Expenses. Expenses directly attributable to a fund are charged to that fund. Expenses attributable to more than one fund are allocated among the respective funds on the basis of relative net assets or other appropriate methods. Expense estimates are accrued in the period to which they relate and adjustments are made when actual amounts are known.
Income Tax Information and Distributions to Shareholders. Each year the Fund intends to qualify as a regulated investment company, including distributing substantially all of its taxable income and realized gains under Subchapter M of the Internal Revenue Code and filing its U.S. federal tax return. As a result, no provision for income taxes is required. As of December 31, 2010, the Fund did not have any unrecognized tax benefits in the accompanying financial statements. A fund's federal tax return is subject to examination by the Internal Revenue Service (IRS) for a period of three years.
Dividends are declared and recorded daily and paid monthly from net investment income. Distributions from realized gains, if any, are declared and recorded on the ex-dividend date. Income and capital gain distributions are determined in accordance with income tax regulations, which may differ from GAAP.
Capital accounts within the financial statements are adjusted for permanent book-tax differences. These adjustments have no impact on net assets or the results of operations. Temporary book-tax differences will reverse in a subsequent period.
Book-tax differences are primarily due to swap agreements, market discount, financing transactions and losses deferred due to wash sales.
The federal tax cost of investment securities and unrealized appreciation (depreciation) as of period end were as follows:
Gross unrealized appreciation | $ 128,920,135 |
Gross unrealized depreciation | (63,120,034) |
Net unrealized appreciation (depreciation) | $ 65,800,101 |
Tax Cost | $ 4,589,428,893 |
The tax-based components of distributable earnings as of period end were as follows:
Undistributed ordinary income | $ 5,972,092 |
Undistributed long-term capital gain | $ 8,733,328 |
Net unrealized appreciation (depreciation) | $ 51,819,112 |
The tax character of distributions paid was as follows:
| December 31, 2010 | December 31, 2009 |
Ordinary Income | $ 187,103,640 | $ 167,596,707 |
Long-term Capital Gains | 90,103,334 | - |
Total | $ 277,206,974 | $ 167,596,707 |
3. Operating Policies.
Repurchase Agreements. FMR has received an Exemptive Order from the Securities and Exchange Commission (the SEC) which permits the Fund and other affiliated entities of FMR to transfer uninvested cash balances into joint trading accounts which are then invested in repurchase agreements. The Fund may also invest directly with institutions in repurchase agreements. Repurchase agreements are collateralized by government or non-government securities. Upon settlement date, collateral is held in segregated accounts with custodian banks and may be obtained in the event of a default of the counterparty. The Fund monitors, on a daily basis, the value of the collateral to ensure it is at least equal to the principal amount of the repurchase agreement (including accrued interest). In the event of a default by the counterparty, realization of the collateral proceeds could be delayed, during which time the value of the collateral may decline.
Annual Report
Notes to Financial Statements - continued
3. Operating Policies - continued
Delayed Delivery Transactions and When-Issued Securities. The Fund may purchase or sell securities on a delayed delivery or when-issued basis. Payment and delivery may take place after the customary settlement period for that security. The price of the underlying securities and the date when the securities will be delivered and paid for are fixed at the time the transaction is negotiated. During the time a delayed delivery sell is outstanding, the contract is marked-to-market daily and equivalent deliverable securities are held for the transaction. The securities purchased on a delayed delivery or when-issued basis are identified as such in the Fund's Schedule of Investments. The Fund may receive compensation for interest forgone in the purchase of a delayed delivery or when-issued security. With respect to purchase commitments, the Fund identifies securities as segregated in its records with a value at least equal to the amount of the commitment. Losses may arise due to changes in the value of the underlying securities or if the counterparty does not perform under the contract's terms, or if the issuer does not issue the securities due to political, economic, or other factors.
Restricted Securities. The Fund may invest in securities that are subject to legal or contractual restrictions on resale. These securities generally may be resold in transactions exempt from registration or to the public if the securities are registered. Disposal of these securities may involve time-consuming negotiations and expense, and prompt sale at an acceptable price may be difficult. Information regarding restricted securities is included at the end of the Fund's Schedule of Investments.
4. Derivative Instruments.
Risk Exposures and the Use of Derivative Instruments. The Fund uses derivative instruments (derivatives), including swap agreements, in order to meet its investment objectives. The strategy is to use derivatives to increase returns, to gain exposure to certain types of assets and to manage exposure to certain risks as defined below. The success of any strategy involving derivatives depends on analysis of numerous economic factors, and if the strategies for investment do not work as intended, the Fund may not achieve its objectives.
The Fund's use of derivatives may increase or decrease its exposure to the following risk:
Credit Risk | Credit risk relates to the ability of the issuer to a financial instrument to make further principal or interest payments on an obligation or commitment that it has entered into with the Fund. |
Interest Rate Risk | Interest rate risk relates to the fluctuations in the value of interest-bearing securities due to changes in the prevailing levels of market interest rates. |
The Fund is also exposed to additional risks from investing in derivatives, such as liquidity risk and counterparty credit risk. Liquidity risk is the risk that the Fund will be unable to sell the derivative in the open market in a timely manner. Counterparty credit risk is the risk that the counterparty will not be able to fulfill its obligation to the Fund. Derivative counterparty credit risk is managed through formal evaluation of the creditworthiness of all potential counterparties. On certain over-the-counter derivatives, the Fund attempts to reduce its exposure to counterparty credit risk by entering into an International Swaps and Derivatives Association (ISDA) Master Agreement on a bilateral basis with each of its counterparties. The ISDA Master Agreement gives each counterparty the right to terminate all transactions traded under such agreement if there is a certain deterioration in the credit quality of the other party. The ISDA Master Agreement gives the Fund the right, upon an event of default by the applicable counterparty or a termination of the agreement, to close out all transactions traded under such agreement and to net amounts owed under each transaction to one net payable by one party to the other. To mitigate counterparty credit risk, the Fund offsets certain payables and/or receivables with collateral. Collateral, in the form of cash or securities, may be required to be held in segregated accounts with the Fund's custodian bank in accordance with the collateral agreements entered into between the Fund, the swap counterparty and the Fund's custodian bank and, if required, is identified in the Schedule of Investments. The Fund could experience delays and costs in gaining access to the collateral even though it is held by the Fund's custodian bank. The Fund's maximum risk of loss from counterparty credit risk is generally the aggregate unrealized appreciation and unpaid counterparty fees in excess of any collateral pledged by the counterparty to the Fund. Risk of loss may exceed the amounts recognized in the Statement of Assets and Liabilities.
Net Realized Gain (Loss) and Change in Net Unrealized Appreciation (Depreciation) on Derivatives. The table below, which reflects the impacts of derivatives on the financial performance of the Fund, summarizes the net realized gain (loss) and change in net unrealized appreciation (depreciation) for derivatives during the period.
Risk Exposure / Derivative Type | Net Realized
Gain (Loss) | Change in Net
Unrealized Appreciation
(Depreciation) |
Credit Risk | | |
Swap Agreements | $ (3,687,760) | $ 4,152,801 |
Interest Rate Risk | | |
Swap Agreements | 19,819,166 | (16,067,911) |
Totals (a) | $ 16,131,406 | $ (11,915,110) |
(a) A summary of the value of derivatives by risk exposure as of period end, if any, is included at the end of the Schedule of Investments and is representative of activity for the period.
Annual Report
4. Derivative Instruments - continued
Swap Agreements. A swap agreement (swap) is a contract between two parties to exchange future cash flows at periodic intervals based on a notional principal amount.
Details of swaps open at period end are included in the Schedule of Investments under the caption "Swap Agreements." Swaps are marked-to-market daily and changes in value are recorded as unrealized appreciation or (depreciation) and reflected in the Statement of Assets and Liabilities. Any upfront payments made or received upon entering a swap to compensate for differences between stated terms of the agreement and prevailing market conditions (e.g. credit spreads, interest rates or other factors) are recorded as realized gain or (loss) ratably over the term of the swap. Payments are exchanged at specified intervals, accrued daily commencing with the effective date of the contract and recorded as realized gain or (loss). Realized gain or (loss) is also recorded in the event of an early termination of a swap. The net realized gain (loss) and change in net unrealized appreciation (depreciation) on swaps during the period is included in the Statement of Operations.
Risks of loss may include credit risk and interest rate risk. In addition, there is the risk of failure by the counterparty to perform under the terms of the agreement and lack of liquidity in the market.
Interest Rate Swaps. Interest rate swaps are agreements between counterparties to exchange cash flows, one based on a fixed rate, and the other on a floating rate. The Fund entered into interest rate swaps to manage its exposure to interest rate changes. Changes in interest rates can have an effect on both the value of bond holdings as well as the amount of interest income earned. In general, the value of bonds can fall when interest rates rise and can rise when interest rates fall.
Credit Default Swaps. Credit default swaps enable the Fund to buy or sell protection on a debt security or a basket of securities against a defined credit event. Under the terms of a credit default swap the buyer of protection (buyer) receives credit protection in exchange for making periodic payments to the seller of protection (seller) based on a fixed percentage applied to a notional principal amount. In return for these payments, the seller acts as a guarantor of the creditworthiness of a reference obligation. The Fund entered into credit default swaps as a seller to gain credit exposure to an issuer and/or as a buyer to provide a measure of protection against defaults of an issuer. The issuer may be either a single issuer or a "basket" of issuers. Periodic payments are made over the life of the contract provided that no credit event occurs.
For credit default swaps on most corporate and sovereign issuers, credit events include bankruptcy, failure to pay, obligation acceleration or repudiation/moratorium. For credit default swaps on corporate or sovereign issuers, the obligation that may be put to the seller is not limited to the specific reference obligation described in the Schedule of Investments. For credit default swaps on asset-backed securities, a credit event may be triggered by events such as failure to pay principal, maturity extension, rating downgrade or write-down. For credit default swaps on asset-backed securities, the reference obligation described represents the security that may be put to the seller.
As a seller, if an underlying credit event occurs, the Fund will either pay the buyer an amount equal to the notional amount of the swap and take delivery of the reference obligation or underlying securities comprising an index or pay a net settlement amount of cash equal to the notional amount of the swap less the recovery value of the reference obligation or underlying securities comprising an index.
As a buyer, if an underlying credit event occurs, the Fund will either receive from the seller an amount equal to the notional amount of the swap and deliver the reference obligation or underlying securities comprising an index or receive a net settlement amount of cash equal to the notional amount of the swap less the recovery value of the reference obligation or underlying securities comprising an index.
Typically, the value of each credit default swap and credit rating disclosed for each reference obligation in the Schedule of Investments, where the Fund is the seller, can be used as measures of the current payment/performance risk of the swap. As the value of the swap changes as a positive or negative percentage of the total notional amount, the payment/performance risk may decrease or increase, respectively. Any current or future declines in the value of the swap may be partially offset by upfront payments received by the Fund as the seller, if applicable. In addition to these measures, FMR monitors a variety of factors including cash flow assumptions, market activity and market sentiment as part of its ongoing process of assessing payment/performance risk.
The notional amount of credit default swaps is included in the Schedule of Investments and approximates the maximum potential amount of future payments that the Fund could be required to make if the Fund is the seller and a credit event were to occur. The total notional amount of all credit default swaps open at period end where the Fund is the seller amounted to $22,497,256 representing 0.60% of net assets.
5. Purchases and Sales of Investments.
Purchases and sales of securities, other than short-term securities and U.S. government securities, aggregated $394,562,863 and $657,166,167, respectively.
Annual Report
Notes to Financial Statements - continued
6. Fees and Other Transactions with Affiliates.
Management Fee and Expense Contract. Fidelity Investments Money Management, Inc. (FIMM), an affiliate of FMR, provides the Fund with investment management services. The Fund does not pay any fees for these services. Pursuant to the Fund's management contract with FIMM, FMR pays FIMM a portion of the management fees it receives from the Investing Funds. In addition, under an expense contract, FMR also pays all other expenses of the Fund, excluding custody fees, the compensation of the independent Trustees, and certain exceptions such as interest expense.
7. Expense Reductions.
FMR has voluntarily agreed to reimburse a portion of the Fund's operating expenses. For the period, the reimbursement reduced the expenses by $14,263.
In addition, through arrangements with the Fund's custodian, credits realized as a result of uninvested cash balances were used to reduce the Fund's expenses. During the period, these credits reduced the Fund's custody expenses by $431.
8. Other.
The Fund's organizational documents provide former and current trustees and officers with a limited indemnification against liabilities arising in connection with the performance of their duties to the Fund. In the normal course of business, the Fund may also enter into contracts that provide general indemnifications. The Fund's maximum exposure under these arrangements is unknown as this would be dependent on future claims that may be made against the Fund. The risk of material loss from such claims is considered remote.
At the end of the period, mutual funds managed by FMR or an FMR affiliate were the owners of record of all of the outstanding shares of the Fund according to the following schedule.
Fund | Ownership % |
VIP Asset Manager Portfolio | 13.2% |
VIP Asset Manager: Growth Portfolio | 1.0% |
VIP Balanced Portfolio | 10.8% |
VIP Investment Grade Bond Portfolio | 75.0% |
9. Credit Risk.
The Fund invests a portion of its assets in structured securities of issuers that hold mortgage securities, including securities backed by subprime mortgage loans. The value and related income of these securities is sensitive to changes in economic conditions, including delinquencies and/or defaults. Continuing shifts in the market's perception of credit quality on securities backed by subprime mortgage loans have resulted in increased volatility of market price and periods of illiquidity that have adversely impacted the valuation of certain issuers of the Fund.
Annual Report
Report of Independent Registered Public Accounting Firm
To the Trustees of Fidelity Garrison Street Trust and Shareholders of Fidelity VIP Investment Grade Central Fund:
We have audited the accompanying statement of assets and liabilities of Fidelity VIP Investment Grade Central Fund (the Fund), a fund of Fidelity Garrison Street Trust, including the schedule of investments, as of December 31, 2010, and the related statement of operations for the year then ended, the statement of changes in net assets for each of the two years in the period then ended, and the financial highlights for each of the four years in the period then ended and for the period from June 23, 2006, (commencement of operations) to December 31, 2006. These financial statements and financial highlights are the responsibility of the Fund's management. Our responsibility is to express an opinion on these financial statements and financial highlights based on our audits.
We conducted our audits in accordance with the standards of the Public Company Accounting Oversight Board (United States). Those standards require that we plan and perform the audit to obtain reasonable assurance about whether the financial statements and financial highlights are free of material misstatement. The Fund is not required to have, nor were we engaged to perform, an audit of its internal control over financial reporting. Our audits included consideration of internal control over financial reporting as a basis for designing audit procedures that are appropriate in the circumstances, but not for the purpose of expressing an opinion on the effectiveness of the Fund's internal control over financial reporting. Accordingly, we express no such opinion. An audit also includes examining, on a test basis, evidence supporting the amounts and disclosures in the financial statements, assessing the accounting principles used and significant estimates made by management, as well as evaluating the overall financial statement presentation. Our procedures included confirmation of securities owned as of December 31, 2010, by correspondence with the custodians and brokers; where replies were not received from brokers, we performed other auditing procedures. We believe that our audits provide a reasonable basis for our opinion.
In our opinion, the financial statements and financial highlights referred to above present fairly, in all material respects, the financial position of Fidelity VIP Investment Grade Central Fund as of December 31, 2010, the results of its operations for the year then ended, the changes in its net assets for each of the two years in the period then ended, and the financial highlights for each of the four years in the period then ended and for the period from June 23, 2006, (commencement of operations) to December 31, 2006, in conformity with accounting principles generally accepted in the United States of America.
/s/ Deloitte & Touche LLP
DELOITTE & TOUCHE LLP
Boston, Massachusetts
February 22, 2011
Annual Report
Trustees and Officers
The Trustees and executive officers of the trust and fund, as applicable, are listed below. The Board of Trustees governs the fund and is responsible for protecting the interests of shareholders. The Trustees are experienced executives who meet periodically throughout the year to oversee the fund's activities, review contractual arrangements with companies that provide services to the fund, oversee management of the risks associated with such activities and contractual arrangements, and review the fund's performance. Except for James C. Curvey, each of the Trustees oversees 189 funds advised by FMR or an affiliate. Mr. Curvey oversees 408 funds advised by FMR or an affiliate.
The Trustees hold office without limit in time except that (a) any Trustee may resign; (b) any Trustee may be removed by written instrument, signed by at least two-thirds of the number of Trustees prior to such removal; (c) any Trustee who requests to be retired or who has become incapacitated by illness or injury may be retired by written instrument signed by a majority of the other Trustees; and (d) any Trustee may be removed at any special meeting of shareholders by a two-thirds vote of the outstanding voting securities of the trust. Each Trustee who is not an interested person (as defined in the 1940 Act) (Independent Trustee), shall retire not later than the last day of the calendar year in which his or her 75th birthday occurs. The Independent Trustees may waive this mandatory retirement age policy with respect to individual Trustees. The executive officers hold office without limit in time, except that any officer may resign or may be removed by a vote of a majority of the Trustees at any regular meeting or any special meeting of the Trustees. Except as indicated, each individual has held the office shown or other offices in the same company for the past five years.
Experience, Skills, Attributes, and Qualifications of the Fund's Trustees. The Governance and Nominating Committee has adopted a statement of policy that describes the experience, qualifications, attributes, and skills that are necessary and desirable for potential Independent Trustee candidates (Statement of Policy). The Board believes that each Trustee satisfied at the time he or she was initially elected or appointed a Trustee, and continues to satisfy, the standards contemplated by the Statement of Policy. The Governance and Nominating Committee also engages professional search firms to help identify potential Independent Trustee candidates who have the experience, qualifications, attributes, and skills consistent with the Statement of Policy. From time to time, additional criteria based on the composition and skills of the current Independent Trustees, as well as experience or skills that may be appropriate in light of future changes to board composition, business conditions, and regulatory or other developments, have also been considered by the professional search firms and the Governance and Nominating Committee. In addition, the Board takes into account the Trustees' commitment and participation in Board and committee meetings, as well as their leadership of standing and ad hoc committees throughout their tenure.
In determining that a particular Trustee was and continues to be qualified to serve as a Trustee, the Board has considered a variety of criteria, none of which, in isolation, was controlling. The Board believes that, collectively, the Trustees have balanced and diverse experience, qualifications, attributes, and skills, which allow the Board to operate effectively in governing the fund and protecting the interests of shareholders. Information about the specific experience, skills, attributes, and qualifications of each Trustee, which in each case led to the Board's conclusion that the Trustee should serve (or continue to serve) as a trustee of the fund, is provided below.
Board Structure and Oversight Function. Abigail P. Johnson is an interested person (as defined in the 1940 Act) and currently serves as Chairman. The Trustees have determined that an interested Chairman is appropriate and benefits shareholders because an interested Chairman has a personal and professional stake in the quality and continuity of services provided to the fund. Independent Trustees exercise their informed business judgment to appoint an individual of their choosing to serve as Chairman, regardless of whether the Trustee happens to be independent or a member of management. The Independent Trustees have determined that they can act independently and effectively without having an Independent Trustee serve as Chairman and that a key structural component for assuring that they are in a position to do so is for the Independent Trustees to constitute a substantial majority for the Board. The Independent Trustees also regularly meet in executive session. Kenneth L. Wolfe serves as Chairman of the Independent Trustees and as such (i) acts as a liaison between the Independent Trustees and management with respect to matters important to the Independent Trustees and (ii) with management prepares agendas for Board meetings.
Fidelity funds are overseen by different Boards of Trustees. The fund's Board oversees Fidelity's investment-grade bond, money market, and asset allocation funds and another Board oversees Fidelity's equity and high income funds. The asset allocation funds may invest in Fidelity funds that are overseen by such other Board. The use of separate Boards, each with its own committee structure, allows the Trustees of each group of Fidelity funds to focus on the unique issues of the funds they oversee, including common research, investment, and operational issues. On occasion, the separate Boards establish joint committees to address issues of overlapping consequences for the Fidelity funds overseen by each Board.
The Trustees operate using a system of committees to facilitate the timely and efficient consideration of all matters of importance to the Trustees, the fund, and fund shareholders and to facilitate compliance with legal and regulatory requirements and oversight of the fund's activities and associated risks. The Board, acting through its committees, has charged FMR and its affiliates with (i) identifying events or circumstances the occurrence of which could have demonstrably adverse effects on the fund's business and/or reputation; (ii) implementing processes and controls to lessen the possibility that such events or circumstances occur or to mitigate the effects of such events or circumstances if they do occur; and (iii) creating and maintaining a system designed to evaluate continuously business and market conditions in order to facilitate the identification and implementation processes described in (i) and (ii) above. Because the day-to-day operations and activities of the fund are carried out by or through FMR, its affiliates and other service providers, the fund's exposure to risks is mitigated but not eliminated by the processes overseen by the Trustees. While each of the Board's committees has responsibility for overseeing different aspects of the fund's activities, oversight is exercised primarily through the Operations and Audit Committees. Appropriate personnel, including but not limited to the fund's Chief Compliance Officer (CCO), FMR's internal auditor, the independent accountants, the fund's Treasurer and portfolio management personnel, make periodic reports to the Board's committees, as appropriate. The responsibilities of each committee, including their oversight responsibilities, are described further under "Standing Committees of the Fund's Trustees."
Annual Report
The fund's Statement of Additional Information (SAI) includes more information about the Trustees. To request a free copy, call Fidelity at 1-800-544-8544.
Interested Trustees*:
Correspondence intended for each Trustee who is an interested person may be sent to Fidelity Investments, 82 Devonshire Street, Boston, Massachusetts 02109.
Name, Age; Principal Occupations and Other Relevant Experience+ |
Abigail P. Johnson (49) |
| Year of Election or Appointment: 2009 Ms. Johnson is Trustee and Chairman of the Board of Trustees of certain Trusts. Ms. Johnson serves as President of Personal, Workplace and Institutional Services (2005-present). Ms. Johnson is the Vice Chairman and Director (2007-present) of FMR LLC. Previously, Ms. Johnson served as President and a Director of FMR (2001-2005), a Trustee of other investment companies advised by FMR, Fidelity Investments Money Management, Inc., and FMR Co., Inc. (2001-2005), Senior Vice President of the Fidelity funds (2001-2005), and managed a number of Fidelity funds. Ms. Abigail P. Johnson and Mr. Arthur E. Johnson are not related. |
James C. Curvey (75) |
| Year of Election or Appointment: 2007 Mr. Curvey also serves as Trustee (2007-present) of other investment companies advised by FMR. Mr. Curvey is a Director of Fidelity Investments Money Management, Inc. (2009-present), Director of Fidelity Research & Analysis Co. (2009-present) and Director of FMR and FMR Co., Inc. (2007-present). Mr. Curvey is also Vice Chairman (2007-present) and Director of FMR LLC. In addition, Mr. Curvey serves as an Overseer for the Boston Symphony Orchestra and a member of the Trustees of Villanova University. Previously, Mr. Curvey was the Vice Chairman (2006-2007) and Director (2000-2007) of FMR Corp. |
* Trustees have been determined to be "Interested Trustees" by virtue of, among other things, their affiliation with the trust or various entities under common control with FMR.
+ The information above includes each Trustee's principal occupation during the last five years and other information relating to the experience, attributes, and skills relevant to each Trustee's qualifications to serve as a Trustee, which led to the conclusion that each Trustee should serve as a Trustee for the fund.
Independent Trustees:
Correspondence intended for each Independent Trustee (that is, the Trustees other than the Interested Trustees) may be sent to Fidelity Investments, P.O. Box 55235, Boston, Massachusetts 02205-5235.
Name, Age; Principal Occupations and Other Relevant Experience+ |
Albert R. Gamper, Jr. (68) |
| Year of Election or Appointment: 2006 Prior to his retirement in December 2004, Mr. Gamper served as Chairman of the Board of CIT Group Inc. (commercial finance). During his tenure with CIT Group Inc. Mr. Gamper served in numerous senior management positions, including Chairman (1987-1989; 1999-2001; 2002-2004), Chief Executive Officer (1987-2004), and President (2002-2003). He also served as President and Chief Executive Officer of Tyco Capital Corporation (2001-2002). Mr. Gamper currently serves as a member of the Board of Directors of Public Service Enterprise Group (utilities, 2000-present), a member of the Board of Trustees, Rutgers University (2004-present), and Chairman of the Board of Saint Barnabas Health Care System. Previously, Mr. Gamper served as Chairman of the Board of Governors, Rutgers University (2004-2007). |
Robert F. Gartland (59) |
| Year of Election or Appointment: 2010 Mr. Gartland is a partner and investor of Vietnam Partners LLC (investments and consulting, 2008-present) and is Chairman and an investor in Gartland and Mellina Group Corp. (consulting, 2009-present). Prior to his retirement, Mr. Gartland held a variety of positions at Morgan Stanley (financial services, 1979-2007) including Managing Director (1987-2007). |
Arthur E. Johnson (63) |
| Year of Election or Appointment: 2008 Mr. Johnson serves as a member of the Board of Directors of Eaton Corporation (diversified power management, 2009-present) and AGL Resources, Inc. (holding company). Prior to his retirement, Mr. Johnson served as Senior Vice President of Corporate Strategic Development of Lockheed Martin Corporation (defense contractor, 1999-2009). He previously served on the Board of Directors of IKON Office Solutions, Inc. (1999-2008) and Delta Airlines (2005-2007). Mr. Arthur E. Johnson and Ms. Abigail P. Johnson are not related. |
Michael E. Kenneally (56) |
| Year of Election or Appointment: 2009 Previously, Mr. Kenneally served as a Member of the Advisory Board for certain Fidelity Fixed Income and Asset Allocation Funds (2008-2009). Prior to his retirement, Mr. Kenneally served as Chairman and Global Chief Executive Officer of Credit Suisse Asset Management (2003-2005). Mr. Kenneally was a Director of the Credit Suisse Funds (U.S. mutual funds, 2004-2008) and certain other closed-end funds (2004-2005) and was awarded the Chartered Financial Analyst (CFA) designation in 1991. |
James H. Keyes (70) |
| Year of Election or Appointment: 2007 Mr. Keyes serves as a member of the Boards of Navistar International Corporation (manufacture and sale of trucks, buses, and diesel engines, since 2002) and Pitney Bowes, Inc. (integrated mail, messaging, and document management solutions, since 1998). Prior to his retirement, Mr. Keyes served as Chairman and Chief Executive Officer of Johnson Controls (automotive, building, and energy, 1998-2002) and as a member of the Board of LSI Logic Corporation (semiconductor technologies, 1984-2008). |
Marie L. Knowles (64) |
| Year of Election or Appointment: 2001 Prior to Ms. Knowles' retirement in June 2000, she served as Executive Vice President and Chief Financial Officer of Atlantic Richfield Company (ARCO) (diversified energy, 1996-2000). From 1993 to 1996, she was a Senior Vice President of ARCO and President of ARCO Transportation Company. She served as a Director of ARCO from 1996 to 1998. Ms. Knowles currently serves as a Director and Chairman of the Audit Committee of McKesson Corporation (healthcare service, since 2002). Ms. Knowles is an Honorary Trustee of the Brookings Institution and a member of the Board of the Catalina Island Conservancy and of the Santa Catalina Island Company (2009-present). She also serves as a member of the Advisory Board for the School of Engineering of the University of Southern California and the Foundation Board of the School of Architecture at the University of Virginia (2007-
present). Previously, Ms. Knowles served as a Director of Phelps Dodge Corporation (copper mining and manufacturing, 1994-2007). |
Kenneth L. Wolfe (71) |
| Year of Election or Appointment: 2005 Mr. Wolfe is Chairman of the Independent Trustees of the Fixed Income and Asset Allocation Funds (2008-present). Prior to his retirement, Mr. Wolfe served as Chairman and a Director (2007-2009) and Chairman and Chief Executive Officer (1994-2001) of Hershey Foods Corporation. He also served as a member of the Boards of Adelphia Communications Corporation (telecommunications, 2003-2006), Bausch & Lomb, Inc. (medical/pharmaceutical, 1993-2007), and Revlon, Inc. (personal care products, 2004-2009). |
+ The information above includes each Trustee's principal occupation during the last five years and other information relating to the experience, attributes, and skills relevant to each Trustee's qualifications to serve as a Trustee, which led to the conclusion that each Trustee should serve as a Trustee for the fund.
Executive Officers:
Correspondence intended for each executive officer may be sent to Fidelity Investments, 82 Devonshire Street, Boston, Massachusetts 02109.
Name, Age; Principal Occupation |
John R. Hebble (52) |
| Year of Election or Appointment: 2008 President and Treasurer of Fidelity's Fixed Income and Asset Allocation Funds. Mr. Hebble also serves as Treasurer and Chief Financial Officer of The North Carolina Capital Management Trust: Cash and Term Portfolio (2008-present), Assistant Treasurer of other Fidelity funds (2009-present) and is an employee of Fidelity Investments. |
Boyce I. Greer (54) |
| Year of Election or Appointment: 2005 Vice President of Fidelity's Fixed Income Funds and Asset Allocation Funds (2005). Mr. Greer is also a Trustee of other investment companies advised by FMR. Mr. Greer is President of The North Carolina Capital Management Trust: Cash and Term Portfolio (2003-present), the Asset Allocation Division (2008-present), President and a Director of Strategic Advisers, Inc. (2008-present), President of FIMM 130/30 LLC (2008-present), Director of Ballyrock Investment Advisors LLC (2006-present), and an Executive Vice President of FMR (2005-present). Previously, Mr. Greer served as Executive Vice President of FMR Co., Inc. (2005-2009), President and Director of Fidelity Investments Money Management, Inc. (2007-2009) and as a Director and Managing Director of Strategic Advisers, Inc. (2002-2005). |
Christopher P. Sullivan (56) |
| Year of Election or Appointment: 2009 Vice President of Fidelity's Bond Funds. Mr. Sullivan also serves as President of Fidelity's Bond Division (2009-present). Mr. Sullivan is Executive Vice President of Fidelity Investments Money Management, Inc. (2009-present), and a Director of Fidelity Management & Research (U.K.) Inc. (2010-present). Previously, Mr. Sullivan served as Managing Director, Co-Head of U.S. Fixed Income at Goldman Sachs Asset Management (2001-2009). |
Christine J. Thompson (52) |
| Year of Election or Appointment: 2010 Vice President of Fidelity's Bond Funds. Ms. Thompson also serves as Chief Investment Officer of FMR's Bond Group (2010-present) and is an employee of Fidelity Investments. Previously, Ms. Thompson served as Director of Municipal Bond Portfolio Managers (2002-2010). |
Scott C. Goebel (42) |
| Year of Election or Appointment: 2008 Secretary and Chief Legal Officer (CLO) of the Fidelity funds. Mr. Goebel also serves as Secretary and CLO of The North Carolina Capital Management Trust: Cash and Term Portfolio (2008-present); General Counsel, Secretary, and Senior Vice President of FMR (2008-present) and FMR Co., Inc. (2008-present); Deputy General Counsel of FMR LLC; Chief Legal Officer of Fidelity Management & Research (Hong Kong) Limited (2008-present) and Assistant Secretary of Fidelity Management & Research (Japan) Inc. (2008-present), Fidelity Investments Money Management, Inc. (2008-present), Fidelity Management & Research (U.K.) Inc. (2008-present), and Fidelity Research and Analysis Company (2008-present). Previously, Mr. Goebel served as Assistant Secretary of the Funds (2007-2008) and as Vice President and Secretary of Fidelity Distributors Corporation (FDC) (2005-2007). |
David J. Carter (37) |
| Year of Election or Appointment: 2010 Assistant Secretary of Fidelity's Fixed Income and Asset Allocation Funds. Mr. Carter also serves as Vice President, Associate General Counsel (2010-present) and is an employee of Fidelity Investments (2005-present). |
Holly C. Laurent (56) |
| Year of Election or Appointment: 2008 Anti-Money Laundering (AML) Officer of the Fidelity funds. Ms. Laurent also serves as AML Officer of The North Carolina Capital Management Trust: Cash and Term Portfolio (2008-present) and is an employee of Fidelity Investments. Previously, Ms. Laurent was Senior Vice President and Head of Legal for Fidelity Business Services India Pvt. Ltd. (2006-2008), and Senior Vice President, Deputy General Counsel and Group Head for FMR LLC (2005-2006). |
Christine Reynolds (52) |
| Year of Election or Appointment: 2008 Chief Financial Officer of the Fidelity funds. Ms. Reynolds became President of Fidelity Pricing and Cash Management Services (FPCMS) in August 2008. Ms. Reynolds served as Chief Operating Officer of FPCMS (2007-2008). Previously, Ms. Reynolds served as President, Treasurer, and Anti-Money Laundering officer of the Fidelity funds (2004-2007). |
Michael H. Whitaker (43) |
| Year of Election or Appointment: 2008 Chief Compliance Officer of Fidelity's Fixed Income and Asset Allocation Funds. Mr. Whitaker also serves as Chief Compliance Officer of The North Carolina Capital Management Trust: Cash and Term Portfolio (2008-present). Mr. Whitaker is an employee of Fidelity Investments (2007-present). Prior to joining Fidelity Investments, Mr. Whitaker worked at MFS Investment Management where he served as Senior Vice President and Chief Compliance Officer (2004-2006), and Assistant General Counsel. |
Jeffrey S. Christian (49) |
| Year of Election or Appointment: 2009 Deputy Treasurer of the Fidelity funds. Mr. Christian is an employee of Fidelity Investments. Previously, Mr. Christian served as Chief Financial Officer (2008-2009) of certain Fidelity funds and Senior Vice President of Fidelity Pricing and Cash Management Services (FPCMS) (2004-2009). |
Bryan A. Mehrmann (49) |
| Year of Election or Appointment: 2005 Deputy Treasurer of the Fidelity funds. Mr. Mehrmann is an employee of Fidelity Investments. |
Stephanie J. Dorsey (41) |
| Year of Election or Appointment: 2008 Deputy Treasurer of Fidelity's Fixed Income and Asset Allocation Funds. Ms. Dorsey also serves as Assistant Treasurer of other Fidelity funds (2010-present) and is an employee of Fidelity Investments (2008-present). Previously, Ms. Dorsey served as Treasurer (2004-2008) of the JPMorgan Mutual Funds and Vice President (2004-2008) of JPMorgan Chase Bank. |
Adrien E. Deberghes (43) |
| Year of Election or Appointment: 2010 Assistant Treasurer of Fidelity's Fixed Income and Asset Allocation Funds. Mr. Deberghes also serves as Deputy Treasurer of other Fidelity funds (2008-present) and is an employee of Fidelity Investments (2008-present). Previously, Mr. Deberghes served as Senior Vice President of Mutual Fund Administration at State Street Corporation (2007-2008), Senior Director of Mutual Fund Administration at Investors Bank & Trust (2005-2007), and Director of Finance for Dunkin' Brands (2000-2005). |
Kenneth B. Robins (41) |
| Year of Election or Appointment: 2009 Assistant Treasurer of the Fidelity Fixed Income and Asset Allocation Funds. Mr. Robins also serves as President and Treasurer of other Fidelity funds (2008-present; 2010-present) and is an employee of Fidelity Investments (2004-present). Previously, Mr. Robins served as Deputy Treasurer of the Fidelity funds (2005-2008) and Treasurer and Chief Financial Officer of The North Carolina Capital Management Trust: Cash and Term Portfolios (2006-2008). |
Gary W. Ryan (52) |
| Year of Election or Appointment: 2005 Assistant Treasurer of the Fidelity funds. Mr. Ryan is an employee of Fidelity Investments. Previously, Mr. Ryan served as Vice President of Fund Reporting in Fidelity Pricing and Cash Management Services (FPCMS) (1999-2005). |
Jonathan Davis (42) |
| Year of Election or Appointment: 2010 Assistant Treasurer of the Fidelity funds. Mr. Davis is an employee of Fidelity Investments. Previously, Mr. Davis served as Vice President and Associate General Counsel of FMR LLC (2003-2010). |
Annual Report
Distributions (Unaudited)
The Board of Trustees of VIP Investment Grade Central Fund voted to pay on February 11, 2011, to shareholders of record at the opening of business on February 11, 2011, a distribution of $0.31 per share derived from capital gains realized from sales of portfolio securities.
The fund hereby designates as a capital gain dividend with respect to the taxable year ended December 31, 2010, $98,836,662, or, if subsequently determined to be different, the net capital gain of such year.
A total of 15.91% of the dividends distributed during the fiscal year was derived from interest on U.S. Government securities which is generally exempt from state income tax.
Annual Report
Board Approval of Investment Advisory Contracts and Management Fees
Fidelity VIP Investment Grade Central Fund
Each year, the Board of Trustees, including the Independent Trustees (together, the Board), votes on the renewal of the management contract and sub-advisory agreements (together, the Advisory Contracts) for the fund. The Board, assisted by the advice of fund counsel and Independent Trustees' counsel, requests and considers a broad range of information relevant to the renewal of the Advisory Contracts throughout the year.
The Board meets regularly and considers at each of its meetings factors that are relevant to its annual consideration of the renewal of the fund's Advisory Contracts, including the services and support provided to the fund and its shareholders. The Board has established three standing committees, each composed of Independent Trustees with varying backgrounds, to which the Board has assigned specific subject matter responsibilities in order to enhance effective decision-making by the Board. The Operations Committee, of which all of the Independent Trustees are members, meets regularly throughout the year and, among other matters, considers matters specifically related to the annual consideration of the renewal of the fund's Advisory Contracts. The Board, acting directly and through its Committees, requests and receives information concerning the annual consideration of the renewal of the fund's Advisory Contracts. The Board also meets as needed to consider matters specifically related to the Board's annual consideration of the renewal of Advisory Contracts. Members of the Board may also meet with trustees of other Fidelity funds through ad hoc joint committees to discuss certain matters relevant to the Fidelity funds.
At its September 2010 meeting, the Board of Trustees, including the Independent Trustees, unanimously determined to renew the fund's Advisory Contracts. In reaching its determination, the Board considered all factors it believed relevant and reached a determination, with the assistance of fund counsel and Independent Trustees' counsel and through the exercise of its business judgment, that the renewal of the Advisory Contracts is in the best interests of the fund and its shareholders and that the lack of compensation to be received by Fidelity under the management contract is fair and reasonable.
Nature, Extent, and Quality of Services Provided. The Board considered the staffing within the investment adviser, Fidelity Investments Money Management, Inc., and the sub-advisers (together, the Investment Advisers), including the backgrounds of the fund's investment personnel and the fund's investment objective and discipline. The Independent Trustees also had discussions with senior management of Fidelity's investment operations and investment groups. The Board considered the structure of the portfolio manager compensation program and whether this structure provides appropriate incentives to act in the best interest of the fund.
Resources Dedicated to Investment Management and Support Services. The Board reviewed the size, education, and experience of the Investment Advisers' investment staff, their use of technology, and the Investment Advisers' approach to recruiting, training, and retaining portfolio managers and other research, advisory, and management personnel. The Board noted that Fidelity's analysts have access to a variety of technological tools and market and securities data that enable them to perform both fundamental and quantitative analysis and to specialize in various disciplines. The Board considered Fidelity's extensive global research capabilities that enable the Investment Advisers to aggregate data from various sources in an effort to produce positive investment results. The Board also considered that Fidelity's portfolio managers and analysts have access to daily portfolio attribution that allows for monitoring of a fund's portfolio, as well as an electronic communication system that provides immediate real-time access to research concerning issuers and credit enhancers. In addition, the Board considered the trading resources that are an integral part of the fixed-income portfolio management investment process.
Administrative Services. The Board considered (i) the nature, extent, quality, and cost of advisory and administrative services performed by the Investment Advisers and their affiliates under the Advisory Contracts and under separate agreements covering transfer agency and pricing and bookkeeping services for the fund; (ii) the nature and extent of the investment adviser's supervision of third party service providers, principally custodians and subcustodians; and (iii) the resources devoted to, and the record of compliance with, the fund's compliance policies and procedures.
Investment Performance. The Board considered whether the fund has operated in accordance with its investment objective, as well as its record of compliance with its investment restrictions. The Board reviewed the fund's absolute investment performance, as well as the fund's relative investment performance, but did not consider performance to be a material factor in its decision to renew the fund's Advisory Contracts. The Board noted that the fund is designed to offer a liquid investment option for other investment companies and accounts managed by Fidelity Management & Research Company (FMR) or its affiliates and ultimately to enhance the performance of those investment companies and accounts.
Based on its review, the Board concluded that the nature, extent, and quality of investment management and support services and of shareholder and administrative services provided to the fund will benefit the fund's shareholders.
Competitiveness of Management Fee and Total Fund Expenses. The Board considered that FMR pays the fund's management fee on behalf of the fund. The Board also noted that FMR bears all expenses of the fund, except expenses related to the fund's investment activities (primarily custody expenses). Based on its review, the Board concluded that the fund's net management fee and total expenses were reasonable in light of the services that the fund and its shareholders receive and the other factors considered.
Costs of the Services and Profitability. The Board considered the level of Fidelity's profits in respect of all the Fidelity funds, as well as the profitability of each fund that invests in this fund.
Annual Report
Board Approval of Investment Advisory Contracts and Management Fees - continued
PricewaterhouseCoopers LLP (PwC), independent registered public accounting firm and auditor to Fidelity and certain Fidelity funds, has been engaged annually by the Board as part of the Board's assessment of Fidelity's profitability analysis. PwC's engagement includes the review and assessment of Fidelity's methodologies used in determining the revenues and expenses attributable to Fidelity's mutual fund business, and completion of agreed-upon procedures surrounding the mathematical accuracy of fund profitability and its conformity to allocation methodologies. After considering PwC's reports issued under the engagement and information provided by Fidelity, the Board believes that while other allocation methods may also be reasonable, Fidelity's profitability methodologies are reasonable in all material respects.
The Board has also reviewed Fidelity's non-fund businesses and fall-out benefits related to the mutual fund business as well as cases where Fidelity's affiliates may benefit from or be related to the fund's business.
The Board concluded that the costs of the services provided by and the profits realized by Fidelity in connection with the operation of the fund were not relevant to the renewal of the Advisory Contracts because the fund pays no advisory fees and FMR bears all expenses of the fund, except expenses related to the fund's investment activities.
Economies of Scale. The Board concluded that because the fund pays no advisory fees and FMR bears all expenses of the fund, except expenses related to the fund's investment activities, economies of scale cannot be realized by the fund.
Additional Information Requested by the Board. In order to develop fully the factual basis for consideration of the Fidelity funds' Advisory Contracts, the Board requested and received additional information on certain topics, including (i) fund performance trends, actions to be taken by FMR to improve certain funds' overall performance, and Fidelity's long-term strategies for certain funds; (ii) Fidelity's fund profitability methodology and profitability trends for certain funds; (iii) portfolio manager changes that have occurred during the past year and the amount of the investment that each portfolio manager has made in the Fidelity fund(s) that he or she manages; (iv) Fidelity's compensation structure for portfolio managers, research analysts, and other key personnel, including its effects on fund profitability, the rationale for the compensation structure, and the extent to which current market conditions have affected retention and recruitment; (v) the compensation paid by FMR to fund sub-advisers on behalf of the Fidelity funds; (vi) Fidelity's fee structures and rationale for recommending different fees among different categories of funds and classes, as well as Fidelity's voluntary waiver of fees to maintain minimum yields for certain funds and classes; (vii) the rationale for any differences between fund fee structures and fee structures in place for other Fidelity clients; and (viii) explanations regarding the relative total expenses borne by certain funds and classes, total expense competitive trends, and actions that might be taken by FMR to reduce total expenses for certain funds and classes or to achieve further economies of scale.
Based on its evaluation of all of the conclusions noted above, and after considering all factors it believed relevant, the Board ultimately concluded that the advisory fee structures are fair and reasonable, and that the fund's Advisory Contracts should be renewed.
Annual Report
Investment Adviser
Fidelity Management & Research Company
Boston, MA
Investment Sub-Adviser
Fidelity Investments Money Management, Inc.
Fidelity Management & Research (U.K.) Inc.
Fidelity Management & Research (Hong Kong) Limited
Fidelity Management & Research (Japan) Inc.
General Distributor
Fidelity Distributors Corporation
Boston, MA
Transfer and Service Agents
Fidelity Investments Institutional Operations Co., Inc.
Boston, MA
Fidelity Service Company, Inc.
Boston, MA
Custodian
The Bank of New York Mellon
New York, NY
VIPIGB-ANN-0211
1.540025.113
Fidelity® Variable Insurance Products:
Strategic Income Portfolio
Annual Report
December 31, 2010
(2_fidelity_logos) (Registered_Trademark)
Contents
Performance | <Click Here> | How the fund has done over time. |
Management's Discussion of Fund Performance | <Click Here> | The Portfolio Managers' review of fund performance and strategy. |
Shareholder Expense Example | <Click Here> | An example of shareholder expenses. |
Investment Changes | <Click Here> | A summary of major shifts in the fund's investments over the past six months. |
Investments | <Click Here> | A complete list of the fund's investments with their market values. |
Financial Statements | <Click Here> | Statements of assets and liabilities, operations, and changes in net assets, as well as financial highlights. |
Notes | <Click Here> | Notes to the financial statements. |
Report of Independent Registered Public Accounting Firm | <Click Here> | |
Trustees and Officers | <Click Here> | |
Distributions | <Click Here> | |
Board Approval of Investment Advisory Contracts and Management Fees | <Click Here> | |
To view a fund's proxy voting guidelines and proxy voting record for the 12-month period ended June 30, visit http://www.fidelity.com/proxyvotingresults or visit the Securities and Exchange Commission's (SEC) web site at http://www.sec.gov. You may also call 1-877-208-0098 to request a free copy of the proxy voting guidelines.
Fidelity Variable Insurance Products are separate account options which are purchased through a variable insurance contract.
Standard & Poor's, S&P and S&P 500 are registered service marks of The McGraw-Hill Companies, Inc. and have been licensed for use by Fidelity Distributors Corporation.
Other third party marks appearing herein are the property of their respective owners.
All other marks appearing herein are registered or unregistered trademarks or service marks of FMR LLC or an affiliated company.
The general research services agreement with Fidelity Research & Analysis Company has been terminated and is no longer in effect for the fund.
This report and the financial statements contained herein are submitted for the general information of the shareholders of the fund. This report is not authorized for distribution to prospective investors in the fund unless preceded or accompanied by an effective prospectus.
A fund files its complete schedule of portfolio holdings with the SEC for the first and third quarters of each fiscal year on Form N-Q. Forms N-Q are available on the SEC's web site at http://www.sec.gov. A fund's Forms N-Q may be reviewed and copied at the SEC's Public Reference Room in Washington, DC. Information regarding the operation of the SEC's Public Reference Room may be obtained by calling 1-800-SEC-0330. For a complete list of a fund's portfolio holdings, view the most recent holdings listing, semiannual report, or annual report on Fidelity's web site at http://www.fidelity.com, http://www.advisor.fidelity.com, or http://www.401k.com, as applicable.
NOT FDIC INSURED • MAY LOSE VALUE • NO BANK GUARANTEE
Neither the fund nor Fidelity Distributors Corporation is a bank.
Annual Report
Average annual total return reflects the change in the value of an investment, assuming reinvestment of the class' dividend income and capital gains (the profits earned upon the sale of securities that have grown in value, if any) and assuming a constant rate of performance each year. During periods of reimbursement by Fidelity, a fund's total return will be greater than it would be had the reimbursement not occurred. Performance numbers are net of all underlying fund operating expenses, but do not include any insurance charges imposed by your insurance company's separate account. If performance information included the effect of these additional charges, the total returns would have been lower. How a fund did yesterday is no guarantee of how it will do tomorrow.
Average Annual Total Returns
Periods ended December 31, 2010 | Past 1
year | Past 5
years | Life of
fund A |
VIP Strategic Income Portfolio - Initial Class | 9.64% | 7.83% | 7.23% |
VIP Strategic Income Portfolio - Service Class | 9.48% | 7.73% | 7.11% |
VIP Strategic Income Portfolio - Service Class 2 | 9.23% | 7.55% | 6.94% |
VIP Strategic Income Portfolio - Investor Class B | 9.63% | 7.79% | 7.19% |
A From December 23, 2003.
B The initial offering of Investor Class shares took place on July 21, 2005. Returns prior to July 21, 2005 are those of Initial Class. Had Investor Class's transfer agent fee been reflected, returns prior to July 21, 2005 would have been lower.
$10,000 Over Life of Fund
Let's say hypothetically that $10,000 was invested in VIP Strategic Income Portfolio - Initial Class on December 23, 2003, when the fund started. The chart shows how the value of your investment would have changed, and also shows how The BofA ML US High Yield Constrained IndexSM performed over the same period.
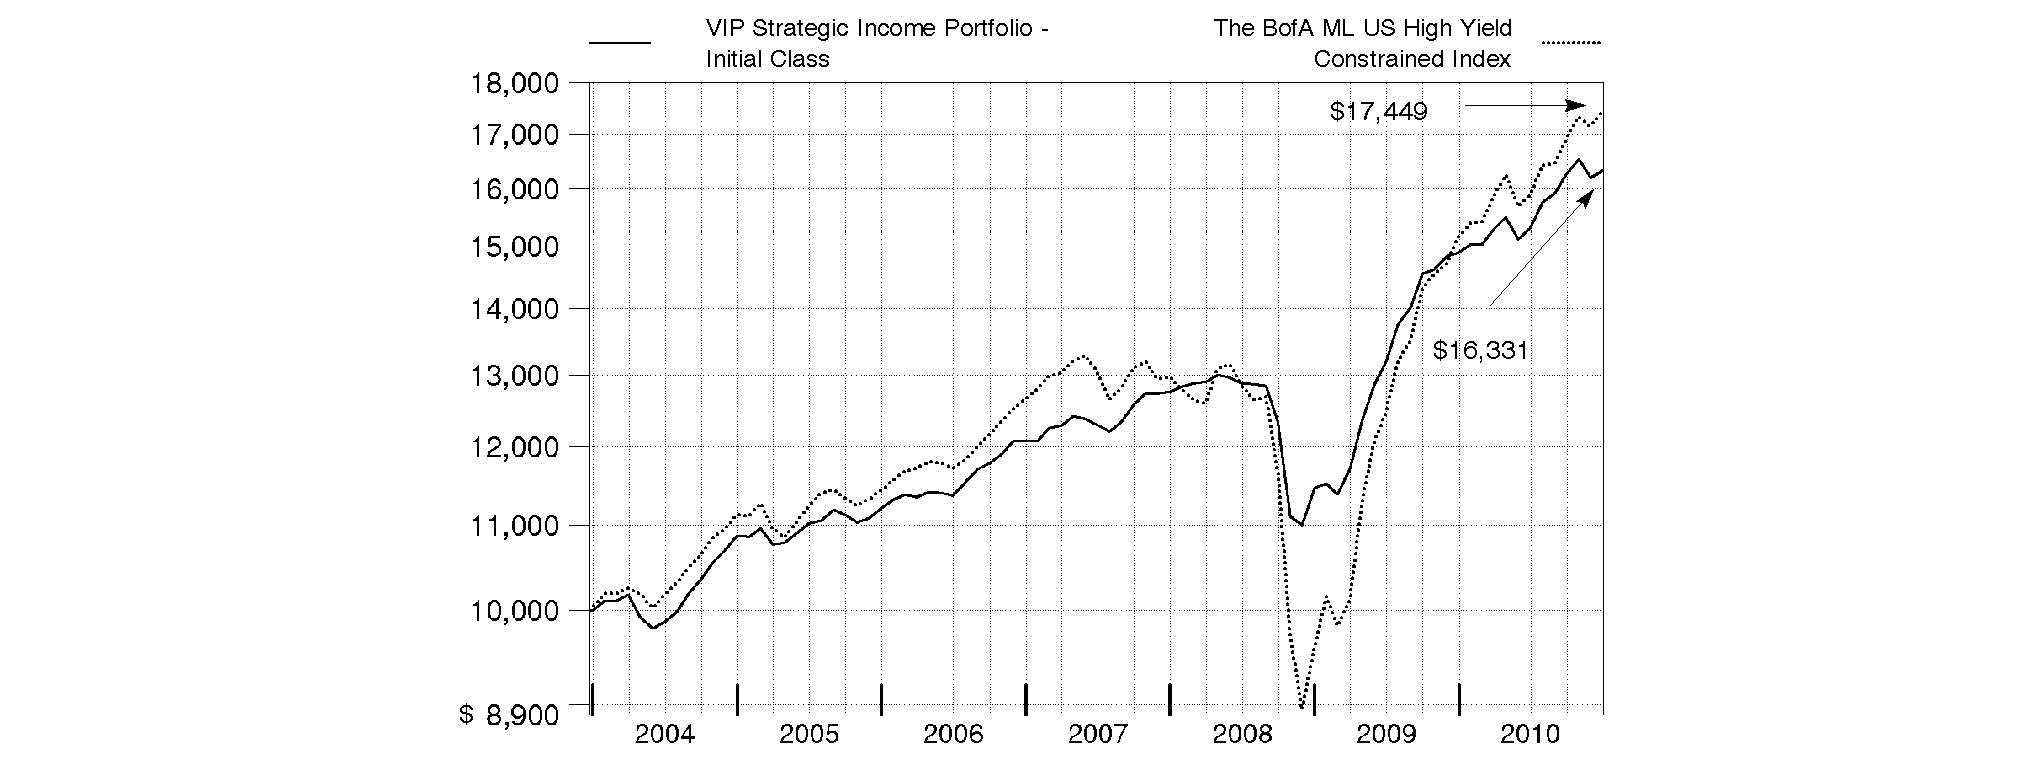
Annual Report
Market Recap: While market improvements around the world hit a speed bump in the first half of the 12-month period ending December 31, 2010, world economies re-accelerated in August, supported by a broadening recovery and low inflation in the U.S. Domestic stock markets recorded solid gains for the year, lifted by a strong second-half rally fueled by economic optimism, encouraging earnings reports and a wave of corporate mergers. The large-cap S&P 500® Index rose 15.06%, the blue-chip-laden Dow Jones Industrial AverageSM added 14.06% and the technology-heavy Nasdaq Composite® Index climbed 18.02%. Meanwhile, international stocks, as represented by the MSCI® ACWI® (All Country World Index) ex USA Index, gained 11.29%, boosted in part by a depreciating U.S. dollar. In the fixed-income arena, U.S. taxable investment-grade bonds generated positive results during 2010, as the Barclays Capital® U.S. Aggregate Bond Index gained 6.54%. With ultra-low interest rates bolstering nearly all fixed-income securities for most of the year, sectors in the index with higher yields and more credit risk generally fared best, while most high-quality bonds generated more-moderate returns. Meanwhile, high-yield bonds, as represented by The BofA Merrill LynchSM US High Yield Constrained Index, returned 15.07%, a result of improved economic data and strengthening investor demand. Overseas, foreign bond markets showed mixed results, with a sizable disparity between the 3.97% return of the Citigroup® Non-U.S. Group of 7 Index - which measures the performance of sovereign debt of the major global economies outside the U.S. - and the 12.04% advance of the JPMorgan Emerging Markets Bond Index Global (EMBI Global), which benefited from the rising overall credit quality of emerging-markets debt issuers.
Comments from Joanna Bewick and Christopher Sharpe, Lead Co-Managers of VIP Strategic Income Portfolio: During the year, the fund's share classes modestly underperformed the 10.10% return of the Fidelity Strategic Income Composite Index. (For specific portfolio results, please refer to the performance section of this report.) Asset allocation and security selection each provided a meaningful contribution to overall results. From a subportfolio standpoint, the high-yield debt sleeve produced the largest absolute return, but fell just short of its index, hampering overall results. Adverse security selection in publishing/printing, along with holding some uninvested cash, played a big role in the sleeve's marginal underperformance. Elsewhere, the U.S. government bond sub posted a mid-single-digit return, benefiting mostly from superior security selection among Treasuries. The fund's emerging-markets debt category produced a double-digit gain and was the biggest contributor to relative performance. A significant overweighting in Argentina proved rewarding here, as did larger-than-benchmark positions in Ukraine and Venezuela. The developed-markets debt sleeve delivered the smallest absolute result and modestly underperformed its benchmark. Unfortunately, currency fluctuations slightly dampened returns in this category. Lastly, excess return from the floating-rate central fund further aided performance.
The views expressed above reflect those of the portfolio manager(s) only through the end of the period as stated on the cover of this report and do not necessarily represent the views of Fidelity or any other person in the Fidelity organization. Any such views are subject to change at any time based upon market or other conditions and Fidelity disclaims any responsibility to update such views. These views may not be relied on as investment advice and, because investment decisions for a Fidelity fund are based on numerous factors, may not be relied on as an indication of trading intent on behalf of any Fidelity fund.
Annual Report
As a shareholder of the Fund, you incur two types of costs: (1) transaction costs, and (2) ongoing costs, including management fees, distribution and/or service (12b-1) fees and other Fund expenses. This Example is intended to help you understand your ongoing costs (in dollars) of investing in the Fund and to compare these costs with the ongoing costs of investing in other mutual funds.
The Example is based on an investment of $1,000 invested at the beginning of the period and held for the entire period (July 1, 2010 to December 31, 2010).
Actual Expenses
The first line of the accompanying table for each class of the Fund provides information about actual account values and actual expenses. You may use the information in this line, together with the amount you invested, to estimate the expenses that you paid over the period. Simply divide your account value by $1,000.00 (for example, an $8,600 account value divided by $1,000.00 = 8.6), then multiply the result by the number in the first line for a class of the Fund under the heading entitled "Expenses Paid During Period" to estimate the expenses you paid on your account during this period. The estimate of expenses does not include any fees or other expenses of any variable annuity or variable life insurance product. If they were, the estimate of expenses you paid during the period would be higher, and your ending account value would be lower. In addition, the Fund, as a shareholder in the underlying Fidelity Central Funds, will indirectly bear its pro-rata share of the fees and expenses incurred by the underlying Fidelity Central Funds. These fees and expenses are not included in the Fund's annualized expense ratio used to calculate the expense estimate in the table below.
Hypothetical Example for Comparison Purposes
The second line of the accompanying table for each class of the Fund provides information about hypothetical account values and hypothetical expenses based on a Class' actual expense ratio and an assumed rate of return of 5% per year before expenses, which is not the Class' actual return. The hypothetical account values and expenses may not be used to estimate the actual ending account balance or expenses you paid for the period. You may use this information to compare the ongoing costs of investing in the Fund and other funds. To do so, compare this 5% hypothetical example with the 5% hypothetical examples that appear in the shareholder reports of the other funds. The estimate of expenses does not include any fees or other expenses of any variable annuity or variable life insurance product. If they were, the estimate of expenses you paid during the period would be higher, and your ending account value would be lower. In addition, the Fund, as a shareholder in the underlying Fidelity Central Funds, will indirectly bear its pro-rata share of the fees and expenses incurred by the underlying Fidelity Central Funds. These fees and expenses are not included in the Fund's annualized expense ratio used to calculate the expense estimate in the table below.
Please note that the expenses shown in the table are meant to highlight your ongoing costs only and do not reflect any transaction costs. Therefore, the second line of the table is useful in comparing ongoing costs only, and will not help you determine the relative total costs of owning different funds.
| Annualized
Expense Ratio | Beginning
Account Value
July 1, 2010 | Ending
Account Value
December 31, 2010 | Expenses Paid
During Period*
July 1, 2010
to December 31, 2010 |
Initial Class | .69% | | | |
Actual | | $ 1,000.00 | $ 1,067.00 | $ 3.59 |
HypotheticalA | | $ 1,000.00 | $ 1,021.73 | $ 3.52 |
Service Class | .79% | | | |
Actual | | $ 1,000.00 | $ 1,066.40 | $ 4.11 |
HypotheticalA | | $ 1,000.00 | $ 1,021.22 | $ 4.02 |
Service Class 2 | .95% | | | |
Actual | | $ 1,000.00 | $ 1,064.90 | $ 4.94 |
HypotheticalA | | $ 1,000.00 | $ 1,020.42 | $ 4.84 |
Investor Class | .73% | | | |
Actual | | $ 1,000.00 | $ 1,066.80 | $ 3.80 |
HypotheticalA | | $ 1,000.00 | $ 1,021.53 | $ 3.72 |
A 5% return per year before expenses
* Expenses are equal to each Class' annualized expense ratio, multiplied by the average account value over the period, multiplied by 184/365 (to reflect the one-half year period). The fees and expenses of the underlying Fidelity Central Funds, in which the Fund invests, are not included in the Fund's annualized expense ratio.
Annual Report
Investment Changes (Unaudited)
The information in the following tables is based on the combined investments of the Fund and its pro-rata share of its investments in each non-money market Fidelity Central Fund.
Top Five Holdings as of December 31, 2010 |
(by issuer, excluding cash equivalents) | % of fund's
net assets | % of fund's net assets
6 months ago |
U.S. Treasury Obligations | 17.3 | 17.7 |
German Federal Republic | 3.7 | 2.2 |
Fannie Mae | 2.7 | 3.4 |
Japan Government | 2.4 | 2.4 |
Canadian Government | 2.2 | 2.2 |
| 28.3 | |
Top Five Market Sectors as of December 31, 2010 |
| % of fund's
net assets | % of fund's net assets
6 months ago |
Consumer Discretionary | 8.6 | 8.0 |
Telecommunication Services | 8.4 | 8.3 |
Financials | 7.3 | 7.0 |
Energy | 5.8 | 5.2 |
Industrials | 4.8 | 4.2 |
Quality Diversification (% of fund's net assets) |
As of December 31, 2010 | As of June 30, 2010 |
 | U.S. Government and
U.S. Government
Agency Obligations† 25.8% | | | U.S. Government and
U.S. Government
Agency Obligations† 27.4% | |
 | AAA,AA,A 14.0% | | | AAA,AA,A 13.1% | |
 | BBB 3.7% | | | BBB 3.8% | |
 | BB 15.4% | | | BB 13.0% | |
 | B 26.2% | | | B 22.8% | |
 | CCC,CC,C 6.7% | | | CCC,CC,C 8.0% | |
 | D 0.0% | | | D 0.0% | |
 | Not Rated 2.5% | | | Not Rated 4.2% | |
 | Equities 1.2% | | | Equities 1.0% | |
 | Short-Term Investments
and Net Other Assets 4.5% | | | Short-Term Investments
and Net Other Assets 6.7% | |

We have used ratings from Moody's Investors Service, Inc. Where Moody's® ratings are not available, we have used S&P® ratings. All ratings are as of the report date and do not reflect subsequent changes. |
Asset Allocation (% of fund's net assets) |
As of December 31, 2010* | As of June 30, 2010** |
| Preferred Securities 0.2% | | | Preferred Securities 0.6% | |
 | Corporate Bonds 38.5% | | | Corporate Bonds 34.1% | |
| U.S. Government and
U.S. Government
Agency Obligations† 25.8% | | | U.S. Government and
U.S. Government
Agency Obligations† 27.4% | |
| Foreign Government &
Government Agency
Obligations 22.5% | | | Foreign Government &
Government Agency
Obligations 22.0% | |
| Floating Rate Loans 7.2% | | | Floating Rate Loans 8.0% | |
| Stocks 1.2% | | | Stocks 1.0% | |
| Other Investments 0.1% | | | Other Investments 0.2% | |
| Short-Term Investments
and Net Other Assets 4.5% | | | Short-Term Investments
and Net Other Assets 6.7% | |
* Foreign investments | 34.3% | | ** Foreign investments | 33.7% | |
* Futures and Swaps | (0.4)% | | ** Futures and Swaps | (0.1)% | |

† Includes FDIC Guaranteed Corporate Securities
An unaudited holdings listing for the Fund, which presents direct holdings as well as the pro-rata share of any securities and other investments held indirectly through its investment in underlying non-money market Fidelity Central Funds, is available at advisor.fidelity.com.
Annual Report
Investments December 31, 2010
Showing Percentage of Net Assets
Corporate Bonds - 38.3% |
| Principal Amount (d) | | Value |
Convertible Bonds - 1.4% |
CONSUMER DISCRETIONARY - 0.3% |
Auto Components - 0.2% |
TRW Automotive, Inc. 3.5% 12/1/15 (f) | | $ 921,000 | | $ 1,774,951 |
Hotels, Restaurants & Leisure - 0.1% |
MGM Mirage, Inc. 4.25% 4/15/15 (f) | | 380,000 | | 413,725 |
TOTAL CONSUMER DISCRETIONARY | | 2,188,676 |
ENERGY - 0.7% |
Energy Equipment & Services - 0.0% |
Cal Dive International, Inc. 3.25% 12/15/25 | | 170,000 | | 163,744 |
Oil, Gas & Consumable Fuels - 0.7% |
Alpha Natural Resources, Inc. 2.375% 4/15/15 | | 1,360,000 | | 1,807,848 |
Chesapeake Energy Corp. 2.5% 5/15/37 | | 1,350,000 | | 1,204,335 |
Massey Energy Co. 3.25% 8/1/15 | | 2,320,000 | | 2,268,960 |
| | 5,281,143 |
TOTAL ENERGY | | 5,444,887 |
HEALTH CARE - 0.1% |
Health Care Equipment & Supplies - 0.1% |
Kinetic Concepts, Inc. 3.25% 4/15/15 (f) | | 1,200,000 | | 1,265,880 |
TELECOMMUNICATION SERVICES - 0.3% |
Wireless Telecommunication Services - 0.3% |
NII Holdings, Inc. 3.125% 6/15/12 | | 2,610,000 | | 2,561,063 |
TOTAL CONVERTIBLE BONDS | | 11,460,506 |
Nonconvertible Bonds - 36.9% |
CONSUMER DISCRETIONARY - 5.6% |
Auto Components - 0.5% |
Affinia Group, Inc.: | | | | |
9% 11/30/14 | | 170,000 | | 172,550 |
9% 11/30/14 (f) | | 190,000 | | 193,800 |
10.75% 8/15/16 (f) | | 149,000 | | 165,390 |
Cooper-Standard Automotive, Inc. 8.5% 5/1/18 (f) | | 145,000 | | 152,794 |
Lear Corp.: | | | | |
7.875% 3/15/18 | | 110,000 | | 117,150 |
8.125% 3/15/20 | | 125,000 | | 135,625 |
RSC Equipment Rental, Inc. 10% 7/15/17 (f) | | 180,000 | | 204,750 |
Stoneridge, Inc. 9.5% 10/15/17 (f) | | 200,000 | | 215,000 |
Tenneco, Inc.: | | | | |
6.875% 12/15/20 (f) | | 545,000 | | 550,450 |
|
| Principal Amount (d) | | Value |
7.75% 8/15/18 (f) | | $ 125,000 | | $ 132,188 |
8.125% 11/15/15 | | 80,000 | | 84,800 |
The Goodyear Tire & Rubber Co. 10.5% 5/15/16 | | 305,000 | | 347,700 |
Tower Automotive Holdings USA LLC / TA Holdings Finance, Inc. 10.625% 9/1/17 (f) | | 432,000 | | 460,598 |
TRW Automotive, Inc.: | | | | |
7% 3/15/14 (f) | | 20,000 | | 21,400 |
7.25% 3/15/17 (f) | | 1,015,000 | | 1,093,663 |
8.875% 12/1/17 (f) | | 120,000 | | 134,100 |
| | 4,181,958 |
Automobiles - 0.1% |
General Motors Corp.: | | | | |
6.75% 5/1/28 (c) | | 692,000 | | 235,280 |
7.125% 7/15/13 (c) | | 140,000 | | 47,250 |
7.2% 1/15/11 (c) | | 350,000 | | 112,000 |
7.4% 9/1/25 (c) | | 45,000 | | 15,075 |
7.7% 4/15/16 (c) | | 531,000 | | 175,230 |
8.25% 7/15/23 (c) | | 415,000 | | 144,213 |
8.375% 7/15/33 (c) | | 605,000 | | 216,288 |
| | 945,336 |
Distributors - 0.1% |
Ferrellgas LP/Ferrellgas Finance Corp. 6.5% 5/1/21 (f) | | 385,000 | | 375,375 |
Diversified Consumer Services - 0.0% |
Mac-Gray Corp. 7.625% 8/15/15 | | 40,000 | | 39,300 |
Hotels, Restaurants & Leisure - 1.6% |
Blue Acquisition Sub, Inc. 9.875% 10/15/18 (f) | | 565,000 | | 596,075 |
DineEquity, Inc. 9.5% 10/30/18 (f) | | 205,000 | | 216,788 |
Dunkin Finance Corp. 9.625% 12/1/18 (f) | | 210,000 | | 212,100 |
GWR Operating Partnership LLP/Great Wolf Finance Corp. 10.875% 4/1/17 | | 355,000 | | 374,525 |
Harrah's Escrow Corp. 12.75% 4/15/18 (f) | | 620,000 | | 635,500 |
Harrah's Operating Co., Inc. 11.25% 6/1/17 | | 675,000 | | 759,375 |
Landry's Restaurants, Inc.: | | | | |
11.625% 12/1/15 | | 110,000 | | 116,050 |
11.625% 12/1/15 (f) | | 85,000 | | 89,675 |
MCE Finance Ltd. 10.25% 5/15/18 | | 620,000 | | 708,350 |
MGM Mirage, Inc.: | | | | |
5.875% 2/27/14 | | 260,000 | | 239,200 |
6.625% 7/15/15 | | 555,000 | | 502,275 |
6.75% 4/1/13 | | 245,000 | | 237,650 |
6.875% 4/1/16 | | 235,000 | | 210,325 |
7.5% 6/1/16 | | 455,000 | | 417,463 |
7.625% 1/15/17 | | 372,000 | | 340,380 |
9% 3/15/20 (f) | | 285,000 | | 313,500 |
Corporate Bonds - continued |
| Principal Amount (d) | | Value |
Nonconvertible Bonds - continued |
CONSUMER DISCRETIONARY - continued |
Hotels, Restaurants & Leisure - continued |
MGM Mirage, Inc.: - continued | | | | |
10.375% 5/15/14 | | $ 100,000 | | $ 112,250 |
11.125% 11/15/17 | | 1,605,000 | | 1,837,725 |
MGM Resorts International 10% 11/1/16 (f) | | 795,000 | | 802,950 |
Mohegan Tribal Gaming Authority 6.875% 2/15/15 | | 125,000 | | 77,188 |
NAI Entertainment Holdings LLC/NAI Entertainment Finance Corp. 8.25% 12/15/17 (f) | | 240,000 | | 252,000 |
NCL Corp. Ltd. 9.5% 11/15/18 (f) | | 125,000 | | 129,688 |
Roadhouse Financing, Inc. 10.75% 10/15/17 (f) | | 450,000 | | 484,875 |
Shingle Springs Tribal Gaming Authority 9.375% 6/15/15 (f) | | 100,000 | | 70,000 |
Speedway Motorsports, Inc. 6.75% 6/1/13 | | 95,000 | | 95,475 |
Station Casinos, Inc.: | | | | |
6% 4/1/12 (c) | | 610,000 | | 61 |
6.5% 2/1/14 (c) | | 811,000 | | 2,028 |
6.625% 3/15/18 (c) | | 830,000 | | 2,075 |
6.875% 3/1/16 (c) | | 865,000 | | 2,163 |
7.75% 8/15/16 (c) | | 920,000 | | 92 |
Town Sports International Holdings, Inc. 11% 2/1/14 | | 23,000 | | 22,770 |
Universal City Development Partners Ltd./UCDP Finance, Inc. 8.875% 11/15/15 | | 1,180,000 | | 1,253,750 |
Virgin River Casino Corp./RBG LLC/B&BB, Inc.: | | | | |
9% 1/15/12 (c) | | 30,000 | | 14,138 |
12.75% 1/15/13 (c) | | 230,000 | | 288 |
Waterford Gaming LLC/Waterford Gaming Finance Corp. 8.625% 9/15/14 (f) | | 62,000 | | 33,790 |
Wynn Las Vegas LLC/Wynn Las Vegas Capital Corp. 7.75% 8/15/20 | | 1,495,000 | | 1,592,175 |
| | 12,754,712 |
Household Durables - 0.3% |
Controladora Mabe SA CV 7.875% 10/28/19 (f) | | 250,000 | | 282,500 |
Jarden Corp. 6.125% 11/15/22 | | 280,000 | | 267,400 |
K. Hovnanian Enterprises, Inc. 10.625% 10/15/16 | | 465,000 | | 478,950 |
Reliance Intermediate Holdings LP 9.5% 12/15/19 (f) | | 485,000 | | 509,250 |
Reynolds Group Issuer, Inc./Reynolds Group Issuer LLC/Reynolds Group Issuer SA: | | | | |
7.125% 4/15/19 (f) | | 245,000 | | 249,900 |
|
| Principal Amount (d) | | Value |
9% 4/15/19 (f) | | $ 280,000 | | $ 287,000 |
Sealy Mattress Co. 10.875% 4/15/16 (f) | | 100,000 | | 113,000 |
| | 2,188,000 |
Leisure Equipment & Products - 0.1% |
Cedar Fair LP/Magnum Management Corp. 9.125% 8/1/18 (f) | | 645,000 | | 690,150 |
Easton-Bell Sports, Inc. 9.75% 12/1/16 | | 120,000 | | 131,100 |
| | 821,250 |
Media - 2.3% |
AMC Entertainment, Inc. 11% 2/1/16 | | 550,000 | | 585,750 |
Bresnan Broadband Holdings LLC 8% 12/15/18 (f) | | 195,000 | | 200,363 |
Cequel Communications Holdings I LLC/Cequel Capital Corp. 8.625% 11/15/17 (f) | | 525,000 | | 553,875 |
Charter Communications Holdings II LLC/Charter Communications Holdings II Capital Corp. 13.5% 11/30/16 | | 400,112 | | 477,134 |
Checkout Holding Corp. 0% 11/15/15 (f) | | 285,000 | | 174,905 |
Clear Channel Communications, Inc.: | | | | |
4.9% 5/15/15 | | 165,000 | | 127,050 |
5.5% 9/15/14 | | 123,000 | | 102,090 |
5.5% 12/15/16 | | 115,000 | | 74,750 |
6.25% 3/15/11 | | 10,000 | | 9,975 |
6.875% 6/15/18 | | 80,000 | | 49,800 |
10.75% 8/1/16 | | 1,510,000 | | 1,343,900 |
11% 8/1/16 pay-in-kind (j) | | 325,075 | | 282,815 |
Clear Channel Worldwide Holdings, Inc.: | | | | |
Series A, 9.25% 12/15/17 | | 120,000 | | 130,500 |
Series B, 9.25% 12/15/17 | | 2,585,000 | | 2,830,575 |
EchoStar Communications Corp. 7.125% 2/1/16 | | 2,725,000 | | 2,806,750 |
Globo Comunicacoes e Participacoes SA 6.25% (e)(f) | | 1,100,000 | | 1,155,000 |
Gray Television, Inc. 10.5% 6/29/15 | | 160,000 | | 161,200 |
Interpublic Group of Companies, Inc. 10% 7/15/17 | | 170,000 | | 197,625 |
Liberty Media Corp.: | | | | |
8.25% 2/1/30 | | 1,295,000 | | 1,256,150 |
8.5% 7/15/29 | | 230,000 | | 224,250 |
MDC Partners, Inc. 11% 11/1/16 | | 65,000 | | 71,663 |
MediMedia USA, Inc. 11.375% 11/15/14 (f) | | 50,000 | | 43,000 |
Net Servicos de Comunicacao SA 7.5% 1/27/20 | | 285,000 | | 324,188 |
Corporate Bonds - continued |
| Principal Amount (d) | | Value |
Nonconvertible Bonds - continued |
CONSUMER DISCRETIONARY - continued |
Media - continued |
Nielsen Finance LLC/Nielsen Finance Co.: | | | | |
7.75% 10/15/18 (f) | | $ 630,000 | | $ 650,475 |
11.5% 5/1/16 | | 315,000 | | 361,463 |
11.625% 2/1/14 | | 160,000 | | 183,600 |
Rainbow National Services LLC: | | | | |
8.75% 9/1/12 (f) | | 110,000 | | 110,000 |
10.375% 9/1/14 (f) | | 365,000 | | 376,863 |
Sinclair Television Group, Inc. 8.375% 10/15/18 (f) | | 300,000 | | 309,000 |
The Reader's Digest Association, Inc. 9.5% 2/15/17 (f)(j) | | 475,000 | | 471,438 |
TL Acquisitions, Inc. 10.5% 1/15/15 (f) | | 885,000 | | 911,550 |
Univision Communications, Inc. 12% 7/1/14 (f) | | 1,295,000 | | 1,418,025 |
Videotron Ltd. 6.875% 1/15/14 | | 125,000 | | 126,563 |
| | 18,102,285 |
Multiline Retail - 0.1% |
Sears Holdings Corp. 6.625% 10/15/18 (f) | | 845,000 | | 792,188 |
Specialty Retail - 0.3% |
Asbury Automotive Group, Inc. 8.375% 11/15/20 (f) | | 125,000 | | 128,750 |
Claire's Stores, Inc.: | | | | |
9.25% 6/1/15 | | 85,000 | | 82,025 |
10.375% 6/1/15 pay-in-kind (j) | | 145,039 | | 141,568 |
Michaels Stores, Inc. 7.75% 11/1/18 (f) | | 1,235,000 | | 1,228,825 |
Sonic Automotive, Inc. 9% 3/15/18 | | 760,000 | | 796,100 |
| | 2,377,268 |
Textiles, Apparel & Luxury Goods - 0.2% |
American Achievement Corp. 10.875% 4/15/16 (f) | | 260,000 | | 267,800 |
Hanesbrands, Inc. 6.375% 12/15/20 (f) | | 640,000 | | 606,400 |
Levi Strauss & Co.: | | | | |
7.625% 5/15/20 | | 775,000 | | 798,250 |
8.875% 4/1/16 | | 170,000 | | 178,296 |
| | 1,850,746 |
TOTAL CONSUMER DISCRETIONARY | | 44,428,418 |
|
| Principal Amount (d) | | Value |
CONSUMER STAPLES - 0.8% |
Beverages - 0.1% |
Anheuser-Busch InBev SA NV 4% 4/26/18 | EUR | 200,000 | | $ 269,739 |
Carlsberg Breweries A/S 3.375% 10/13/17 | EUR | 150,000 | | 193,002 |
Cerveceria Nacional Dominicana C por A: | | | | |
8% 3/27/14 (Reg. S) | | 100,000 | | 103,000 |
16% 3/27/12 (f) | | 500,000 | | 443,750 |
| | 1,009,491 |
Food & Staples Retailing - 0.2% |
Rite Aid Corp.: | | | | |
8% 8/15/20 | | 625,000 | | 650,000 |
9.5% 6/15/17 | | 65,000 | | 54,763 |
9.75% 6/12/16 | | 310,000 | | 341,775 |
10.25% 10/15/19 | | 160,000 | | 166,000 |
Simmons Foods, Inc. 10.5% 11/1/17 (f) | | 245,000 | | 259,088 |
| | 1,471,626 |
Food Products - 0.4% |
Bumble Bee Acquisition Corp. 9% 12/15/17 (f) | | 325,000 | | 337,188 |
Darling International, Inc. 8.5% 12/15/18 (f) | | 100,000 | | 104,120 |
Dean Foods Co. 9.75% 12/15/18 (f) | | 635,000 | | 639,763 |
Harbinger Group, Inc. 10.625% 11/15/15 (f) | | 230,000 | | 229,425 |
Hines Nurseries, Inc. 10.25% 10/1/11 (c) | | 120,000 | | 1,200 |
JBS USA LLC/JBS USA Finance, Inc. 11.625% 5/1/14 | | 330,000 | | 380,721 |
Michael Foods Group, Inc. 9.75% 7/15/18 (f) | | 155,000 | | 168,175 |
Pilgrims Pride Corp. 7.875% 12/15/18 (f) | | 555,000 | | 551,531 |
Smithfield Foods, Inc. 10% 7/15/14 (f) | | 380,000 | | 437,000 |
| | 2,849,123 |
Personal Products - 0.1% |
Elizabeth Arden, Inc. 7.75% 1/15/14 | | 40,000 | | 40,400 |
NBTY, Inc. 9% 10/1/18 (f) | | 425,000 | | 450,500 |
Revlon Consumer Products Corp. 9.75% 11/15/15 | | 300,000 | | 318,750 |
| | 809,650 |
TOTAL CONSUMER STAPLES | | 6,139,890 |
ENERGY - 5.1% |
Energy Equipment & Services - 0.2% |
Complete Production Services, Inc. 8% 12/15/16 | | 130,000 | | 134,550 |
Corporate Bonds - continued |
| Principal Amount (d) | | Value |
Nonconvertible Bonds - continued |
ENERGY - continued |
Energy Equipment & Services - continued |
Frac Tech Services LLLC/Frac Tech Finance, Inc. 7.125% 11/15/18 (f) | | $ 190,000 | | $ 192,850 |
Helix Energy Solutions Group, Inc. 9.5% 1/15/16 (f) | | 240,000 | | 248,400 |
Pioneer Drilling Co. 9.875% 3/15/18 | | 275,000 | | 288,750 |
Pride International, Inc. 6.875% 8/15/20 | | 260,000 | | 267,800 |
Trinidad Drilling Ltd. 7.875% 1/15/19 (f) | | 140,000 | | 141,750 |
| | 1,274,100 |
Oil, Gas & Consumable Fuels - 4.9% |
Adaro Indonesia PT 7.625% 10/22/19 (f) | | 430,000 | | 471,388 |
Arch Coal, Inc. 7.25% 10/1/20 | | 140,000 | | 145,950 |
Atlas Energy Operating Co. LLC/Financing Corp. 10.75% 2/1/18 | | 245,000 | | 299,206 |
Atlas Pipeline Partners LP 8.125% 12/15/15 | | 840,000 | | 865,200 |
ATP Oil & Gas Corp. 11.875% 5/1/15 (f) | | 2,620,000 | | 2,482,450 |
Berry Petroleum Co.: | | | | |
8.25% 11/1/16 | | 150,000 | | 156,000 |
10.25% 6/1/14 | | 145,000 | | 166,388 |
Carrizo Oil & Gas, Inc. 8.625% 10/15/18 (f) | | 200,000 | | 206,000 |
Chaparral Energy, Inc.: | | | | |
8.5% 12/1/15 | | 275,000 | | 279,813 |
9.875% 10/1/20 (f) | | 155,000 | | 163,525 |
Chesapeake Energy Corp.: | | | | |
6.5% 8/15/17 | | 920,000 | | 917,700 |
6.875% 11/15/20 | | 2,335,000 | | 2,364,188 |
7.25% 12/15/18 | | 515,000 | | 529,163 |
9.5% 2/15/15 | | 360,000 | | 405,900 |
Colorado Interstate Gas Co. 6.8% 11/15/15 | | 260,000 | | 299,527 |
Concho Resources, Inc.: | | | | |
7% 1/15/21 | | 250,000 | | 256,250 |
8.625% 10/1/17 | | 155,000 | | 168,950 |
Connacher Oil and Gas Ltd. 10.25% 12/15/15 (f) | | 270,000 | | 271,350 |
CONSOL Energy, Inc.: | | | | |
8% 4/1/17 (f) | | 525,000 | | 556,500 |
8.25% 4/1/20 (f) | | 540,000 | | 577,800 |
Continental Resources, Inc.: | | | | |
7.125% 4/1/21 (f) | | 215,000 | | 223,600 |
8.25% 10/1/19 | | 65,000 | | 72,150 |
Crosstex Energy/Crosstex Energy Finance Corp. 8.875% 2/15/18 | | 390,000 | | 409,500 |
|
| Principal Amount (d) | | Value |
Denbury Resources, Inc.: | | | | |
8.25% 2/15/20 | | $ 308,000 | | $ 335,720 |
9.75% 3/1/16 | | 105,000 | | 116,939 |
Drummond Co., Inc.: | | | | |
7.375% 2/15/16 | | 360,000 | | 370,800 |
9% 10/15/14 (f) | | 710,000 | | 754,375 |
DTEK Finance BV 9.5% 4/28/15 (f) | | 230,000 | | 237,475 |
Energy Transfer Equity LP 7.5% 10/15/20 | | 860,000 | | 890,100 |
Energy XXI Gulf Coast, Inc. 9.25% 12/15/17 (f) | | 1,110,000 | | 1,154,400 |
EXCO Resources, Inc. 7.5% 9/15/18 | | 1,300,000 | | 1,275,560 |
International Coal Group, Inc. 9.125% 4/1/18 | | 300,000 | | 325,500 |
InterNorth, Inc. 9.625% 3/16/06 (c) | | 100,000 | | 0 |
KazMunaiGaz Finance Sub BV: | | | | |
6.375% 4/9/21 (f) | | 320,000 | | 315,200 |
7% 5/5/20 (f) | | 260,000 | | 269,100 |
8.375% 7/2/13 (f) | | 265,000 | | 290,175 |
9.125% 7/2/18 (f) | | 330,000 | | 384,450 |
11.75% 1/23/15 (f) | | 380,000 | | 471,200 |
LINN Energy LLC: | | | | |
7.75% 2/1/21 (f) | | 1,510,000 | | 1,547,750 |
8.625% 4/15/20 (f) | | 1,160,000 | | 1,249,900 |
Markwest Energy Partners LP/Markwest Energy Finance Corp. 6.75% 11/1/20 | | 160,000 | | 160,000 |
Naftogaz of Ukraine NJSC 9.5% 9/30/14 | | 255,000 | | 278,269 |
Nakilat, Inc. 6.267% 12/31/33 (Reg. S) | | 118,845 | | 123,599 |
Newfield Exploration Co. 6.875% 2/1/20 | | 1,025,000 | | 1,071,125 |
Northern Tier Energy LLC/Northern Tier Finance Corp. 10.5% 12/1/17 (f) | | 400,000 | | 413,000 |
Pacific Rubiales Energy Corp. 8.75% 11/10/16 | | 300,000 | | 336,750 |
Pan American Energy LLC 7.875% 5/7/21 (f) | | 170,000 | | 180,200 |
Peabody Energy Corp. 7.875% 11/1/26 | | 300,000 | | 332,250 |
Pemex Project Funding Master Trust 6.625% 6/15/35 | | 315,000 | | 316,575 |
Petrobras International Finance Co. Ltd.: | | | | |
6.875% 1/20/40 | | 270,000 | | 280,800 |
8.375% 12/10/18 | | 140,000 | | 170,277 |
Petrohawk Energy Corp. 7.875% 6/1/15 | | 1,615,000 | | 1,681,619 |
Petroleos de Venezuela SA: | | | | |
4.9% 10/28/14 | | 555,000 | | 344,100 |
5.25% 4/12/17 | | 865,000 | | 488,725 |
5.375% 4/12/27 | | 3,550,000 | | 1,677,375 |
Corporate Bonds - continued |
| Principal Amount (d) | | Value |
Nonconvertible Bonds - continued |
ENERGY - continued |
Oil, Gas & Consumable Fuels - continued |
Petroleos de Venezuela SA: - continued | | | | |
5.5% 4/12/37 | | $ 645,000 | | $ 298,313 |
Petroleos de Venezuela SA 144: | | | | |
8% 11/17/13 (f) | | 210,000 | | 172,463 |
8.5% 11/2/17 (f) | | 820,000 | | 551,450 |
Petroleos Mexicanos: | | | | |
5.5% 1/21/21 | | 265,000 | | 268,975 |
6% 3/5/20 | | 245,000 | | 260,313 |
6.625% (f) | | 745,000 | | 741,275 |
8% 5/3/19 | | 230,000 | | 276,000 |
Petroleum Co. of Trinidad & Tobago Ltd. (Reg. S) 6% 5/8/22 | | 287,500 | | 286,063 |
Petroleum Development Corp. 12% 2/15/18 | | 265,000 | | 296,800 |
Pioneer Natural Resources Co. 7.5% 1/15/20 | | 640,000 | | 702,400 |
Plains Exploration & Production Co. 10% 3/1/16 | | 645,000 | | 715,950 |
Quicksilver Resources, Inc. 11.75% 1/1/16 | | 335,000 | | 388,600 |
Regency Energy Partners LP/Regency Energy Finance Corp. 6.875% 12/1/18 | | 550,000 | | 554,125 |
Rosetta Resources, Inc. 9.5% 4/15/18 | | 290,000 | | 313,200 |
Southern Star Central Corp. 6.75% 3/1/16 | | 90,000 | | 90,900 |
Southwestern Energy Co. 7.5% 2/1/18 | | 150,000 | | 168,555 |
Targa Resources Partners LP/Targa Resources Partners Finance Corp. 11.25% 7/15/17 | | 290,000 | | 332,050 |
Teekay Corp. 8.5% 1/15/20 | | 295,000 | | 321,167 |
Tennessee Gas Pipeline Co.: | | | | |
7% 10/15/28 | | 20,000 | | 21,149 |
7.5% 4/1/17 | | 445,000 | | 511,578 |
7.625% 4/1/37 | | 50,000 | | 55,664 |
8.375% 6/15/32 | | 40,000 | | 47,049 |
TNK-BP Finance SA 7.5% 7/18/16 | | 300,000 | | 331,875 |
Venoco, Inc. 11.5% 10/1/17 | | 410,000 | | 437,675 |
W&T Offshore, Inc. 8.25% 6/15/14 (f) | | 310,000 | | 306,900 |
YPF SA 10% 11/2/28 | | 375,000 | | 431,250 |
| | 39,013,545 |
TOTAL ENERGY | | 40,287,645 |
|
| Principal Amount (d) | | Value |
FINANCIALS - 6.5% |
Capital Markets - 0.2% |
Bank Nederlandse Gemeenten NV 2.5% 11/15/17 | EUR | 500,000 | | $ 641,488 |
Equinox Holdings, Inc. 9.5% 2/1/16 (f) | | 460,000 | | 485,875 |
HSBC Bank PLC 5.75% 6/27/17 (e) | GBP | 100,000 | | 160,480 |
Penson Worldwide, Inc. 12.5% 5/15/17 (f) | | 290,000 | | 265,350 |
| | 1,553,193 |
Commercial Banks - 2.2% |
African Export-Import Bank 8.75% 11/13/14 | | 320,000 | | 358,400 |
Akbank T. A. S. 5.125% 7/22/15 (f) | | 380,000 | | 383,325 |
Ally Financial, Inc.: | | | | |
7.5% 9/15/20 (f) | | 1,605,000 | | 1,685,250 |
8% 3/15/20 | | 3,940,000 | | 4,235,500 |
Banco Bilbao Vizcaya Argentaria SA 3.5% 7/26/13 | EUR | 200,000 | | 263,726 |
Banco Bradesco SA 5.9% 1/16/21 (f) | | 170,000 | | 170,213 |
Banco de Credito del Peru 5.375% 9/16/20 (f) | | 170,000 | | 166,821 |
Banco do Nordeste do Brasil SA 3.625% 11/9/15 (f) | | 170,000 | | 165,750 |
BanColombia SA 6.125% 7/26/20 | | 165,000 | | 168,300 |
BNP Paribas Public Sector SCF 2.25% 10/22/15 | EUR | 400,000 | | 519,061 |
CIT Group, Inc.: | | | | |
7% 5/1/13 | | 123,142 | | 125,451 |
7% 5/1/14 | | 184,712 | | 186,097 |
7% 5/1/15 | | 184,712 | | 185,174 |
7% 5/1/16 | | 307,853 | | 307,853 |
7% 5/1/17 | | 2,465,992 | | 2,462,910 |
Development Bank of Kazakhstan JSC 5.5% 12/20/15 (f) | | 200,000 | | 200,750 |
Development Bank of Philippines 8.375% (j) | | 620,000 | | 685,100 |
EXIM of Ukraine 7.65% 9/7/11 (Issued by Credit Suisse International for EXIM of Ukraine) | | 1,850,000 | | 1,875,438 |
Export-Import Bank of India 0.6825% 6/7/12 (j) | JPY | 10,000,000 | | 120,555 |
HSBK (Europe) BV: | | | | |
7.25% 5/3/17 (f) | | 110,000 | | 111,100 |
9.25% 10/16/13 (f) | | 655,000 | | 712,313 |
Intesa Sanpaolo SpA 3.75% 11/23/16 | EUR | 150,000 | | 194,420 |
Itau Unibanco Holding SA 5.75% 1/22/21 (f) | | 140,000 | | 139,650 |
Kazkommerts International BV 8.5% 4/16/13 (f) | | 285,000 | | 275,738 |
Corporate Bonds - continued |
| Principal Amount (d) | | Value |
Nonconvertible Bonds - continued |
FINANCIALS - continued |
Commercial Banks - continued |
Nordea Bank Finland PLC 2.25% 11/16/15 | EUR | 450,000 | | $ 587,434 |
RSHB Capital SA 9% 6/11/14 (f) | | 115,000 | | 129,571 |
SNS Bank NV 3.5% 9/28/20 | EUR | 100,000 | | 127,179 |
The State Export-Import Bank of Ukraine JSC 8.4% 2/9/16 (Issued by Credit Suisse First Boston International for The State Export-Import Bank of Ukraine JSC) (e) | | 400,000 | | 384,000 |
Trade & Development Bank of Mong LLC 8.5% 10/25/13 | | 200,000 | | 204,000 |
US Bank NA 4.375% 2/28/17 (j) | EUR | 100,000 | | 130,846 |
Vimpel Communications 8.25% 5/23/16 (Reg. S) (Issued by UBS Luxembourg SA for Vimpel Communications) | | 250,000 | | 273,438 |
Wells Fargo & Co. 7.98% (j) | | 135,000 | | 142,763 |
| | 17,678,126 |
Consumer Finance - 1.6% |
ACE Cash Express, Inc. 10.25% 10/1/14 (f) | | 80,000 | | 70,400 |
Ford Motor Credit Co. LLC: | | | | |
6.625% 8/15/17 | | 810,000 | | 848,475 |
7.5% 8/1/12 | | 645,000 | | 685,313 |
12% 5/15/15 | | 1,620,000 | | 2,016,900 |
General Motors Acceptance Corp.: | | | | |
6.75% 12/1/14 | | 915,000 | | 953,888 |
8% 11/1/31 | | 490,000 | | 524,155 |
GMAC LLC: | | | | |
6% 4/1/11 | | 91,000 | | 91,118 |
6.75% 12/1/14 | | 280,000 | | 292,600 |
8% 11/1/31 | | 6,758,000 | | 7,197,270 |
| | 12,680,119 |
Diversified Financial Services - 2.0% |
Azovstal Capital BV 9.125% 2/28/11 | | 100,000 | | 100,250 |
Bank of America Corp.: | | | | |
4% 3/28/18 (j) | EUR | 150,000 | | 179,562 |
8% (j) | | 350,000 | | 350,000 |
8.125% (j) | | 480,000 | | 482,400 |
Bank of Georgia JSC 9% 2/8/12 (Issued by BG Finance BV for Bank of Georgia JSC) | | 220,000 | | 220,000 |
BG Energy Capital PLC 5.125% 12/1/25 | GBP | 250,000 | | 387,943 |
BP Capital Markets PLC 3.83% 10/6/17 | EUR | 500,000 | | 668,590 |
|
| Principal Amount (d) | | Value |
CCO Holdings LLC/CCO Holdings Capital Corp.: | | | | |
7.875% 4/30/18 | | $ 235,000 | | $ 242,638 |
8.125% 4/30/20 | | 565,000 | | 598,900 |
CDW LLC/CDW Finance Corp. 8% 12/15/18 (f) | | 470,000 | | 479,400 |
City of Buenos Aires 12.5% 4/6/15 (f) | | 860,000 | | 954,600 |
Dignity Finance PLC: | | | | |
6.31% 12/31/23 (Reg. S) | GBP | 15,635 | | 27,392 |
8.151% 12/31/30 | GBP | 30,000 | | 56,867 |
FireKeepers Development Authority 13.875% 5/1/15 (f) | | 100,000 | | 118,250 |
Global Cash Access LLC/Global Cash Access Finance Corp. 8.75% 3/15/12 | | 199,000 | | 198,503 |
Hilcorp Energy I LP/Hilcorp Finance Co. 7.625% 4/15/21 (f) | | 360,000 | | 370,800 |
Icahn Enterprises LP/Icahn Enterprises Finance Corp.: | | | | |
7.75% 1/15/16 | | 1,390,000 | | 1,396,950 |
7.75% 1/15/16 (f) | | 395,000 | | 396,975 |
8% 1/15/18 | | 1,958,000 | | 1,967,790 |
8% 1/15/18 (f) | | 395,000 | | 396,975 |
Imperial Tobacco Finance 7.75% 6/24/19 | GBP | 100,000 | | 185,806 |
International Lease Finance Corp. 5.625% 9/20/13 | | 547,000 | | 549,735 |
Landrys Holdings, Inc. 11.5% 6/1/14 (f) | | 270,000 | | 264,600 |
LBI Escrow Corp. 8% 11/1/17 (f) | | 580,000 | | 640,900 |
Myriad International Holding BV 6.375% 7/28/17 (f) | | 275,000 | | 290,125 |
NCO Group, Inc. 11.875% 11/15/14 | | 120,000 | | 93,600 |
Offshore Group Investment Ltd. 11.5% 8/1/15 (f) | | 710,000 | | 759,700 |
Rearden G Holdings Eins GmbH 7.875% 3/30/20 (f) | | 245,000 | | 257,250 |
TMK Capital SA 10% 7/29/11 | | 500,000 | | 516,000 |
Trans Union LLC/Trans Union Financing Corp. 11.375% 6/15/18 (f) | | 350,000 | | 397,250 |
UPC Germany GmbH 8.125% 12/1/17 (f) | | 560,000 | | 590,800 |
Vnesheconombank Via VEB Finance Ltd. 6.8% 11/22/25 (f) | | 200,000 | | 198,500 |
WaMu Covered Bond Program 3.875% 9/27/11 | EUR | 50,000 | | 67,699 |
Wind Acquisition Holdings Finance SA 12.25% 7/15/17
pay-in-kind (f)(j) | | 1,151,458 | | 1,257,568 |
Zhaikmunai Finance BV 10.5% 10/19/15 (f) | | 225,000 | | 225,000 |
| | 15,889,318 |
Corporate Bonds - continued |
| Principal Amount (d) | | Value |
Nonconvertible Bonds - continued |
FINANCIALS - continued |
Insurance - 0.1% |
American International Group, Inc.: | | | | |
5.45% 5/18/17 | | $ 340,000 | | $ 344,297 |
5.85% 1/16/18 | | 120,000 | | 123,737 |
CNO Financial Group, Inc. 9% 1/15/18 (f) | | 255,000 | | 261,375 |
| | 729,409 |
Real Estate Investment Trusts - 0.2% |
Omega Healthcare Investors, Inc.: | | | | |
6.75% 10/15/22 (f) | | 725,000 | | 714,125 |
7.5% 2/15/20 | | 385,000 | | 404,250 |
Senior Housing Properties Trust 8.625% 1/15/12 | | 280,000 | | 292,600 |
| | 1,410,975 |
Real Estate Management & Development - 0.2% |
CB Richard Ellis Services, Inc.: | | | | |
6.625% 10/15/20 (f) | | 480,000 | | 475,200 |
11.625% 6/15/17 | | 425,000 | | 493,000 |
Realogy Corp.: | | | | |
11.5% 4/15/17 (f) | | 145,000 | | 146,450 |
12% 4/15/17 (e)(f) | | 139,213 | | 141,997 |
Toys 'R' Us Property Co. II LLC 8.5% 12/1/17 | | 65,000 | | 69,875 |
Ventas Realty LP 6.5% 6/1/16 | | 65,000 | | 67,600 |
| | 1,394,122 |
TOTAL FINANCIALS | | 51,335,262 |
HEALTH CARE - 2.6% |
Health Care Providers & Services - 2.0% |
Apria Healthcare Group, Inc. 11.25% 11/1/14 | | 505,000 | | 549,188 |
Capella Healthcare, Inc. 9.25% 7/1/17 (f) | | 280,000 | | 297,500 |
CRC Health Group, Inc. 10.75% 2/1/16 | | 90,000 | | 90,225 |
DaVita, Inc.: | | | | |
6.375% 11/1/18 | | 385,000 | | 377,300 |
6.625% 11/1/20 | | 330,000 | | 324,225 |
Gentiva Health Services, Inc. 11.5% 9/1/18 | | 475,000 | | 517,750 |
Hanger Orthopedic Group, Inc. 7.125% 11/15/18 | | 1,230,000 | | 1,217,700 |
HCA Holdings, Inc. 7.75% 5/15/21 (f) | | 5,160,000 | | 5,160,000 |
HCA, Inc.: | | | | |
5.75% 3/15/14 | | 220,000 | | 215,050 |
6.25% 2/15/13 | | 110,000 | | 112,200 |
6.375% 1/15/15 | | 75,000 | | 73,875 |
6.5% 2/15/16 | | 275,000 | | 268,125 |
|
| Principal Amount (d) | | Value |
6.75% 7/15/13 | | $ 110,000 | | $ 113,025 |
7.25% 9/15/20 | | 1,935,000 | | 1,997,888 |
9.125% 11/15/14 | | 580,000 | | 607,550 |
9.25% 11/15/16 | | 1,215,000 | | 1,300,050 |
HealthSouth Corp. 8.125% 2/15/20 | | 575,000 | | 615,250 |
IASIS Healthcare LLC/IASIS Capital Corp. 8.75% 6/15/14 | | 90,000 | | 92,025 |
InVentiv Health, Inc. 10% 8/15/18 (f) | | 75,000 | | 74,250 |
LifePoint Hospitals, Inc. 6.625% 10/1/20 (f) | | 345,000 | | 342,413 |
Quintiles Transnational Holdings, Inc. 9.5% 12/30/14 (f) | | 390,000 | | 399,750 |
ResCare, Inc. 10.75% 1/15/19 (f) | | 240,000 | | 245,688 |
Rhoen-Klinikum AG 3.875% 3/11/16 | EUR | 100,000 | | 133,836 |
Rotech Healthcare, Inc. 10.75% 10/15/15 (f) | | 345,000 | | 357,075 |
Sabra Health Care LP/Sabra Capital Corp. 8.125% 11/1/18 (f) | | 105,000 | | 108,150 |
Skilled Healthcare Group, Inc. 11% 1/15/14 | | 78,000 | | 80,145 |
UHS Escrow Corp. 7% 10/1/18 (f) | | 85,000 | | 87,338 |
United Surgical Partners International, Inc. 8.875% 5/1/17 | | 55,000 | | 56,513 |
| | 15,814,084 |
Health Care Technology - 0.1% |
ConvaTec Healthcare ESA 10.5% 12/15/18 (f) | | 900,000 | | 909,000 |
Life Sciences Tools & Services - 0.0% |
Bio-Rad Laboratories, Inc. 7.5% 8/15/13 | | 70,000 | | 70,963 |
Pharmaceuticals - 0.5% |
Elan Finance PLC/Elan Finance Corp. 8.75% 10/15/16 | | 435,000 | | 439,350 |
Leiner Health Products, Inc. 11% 6/1/12 (c) | | 90,000 | | 4,500 |
Mylan, Inc.: | | | | |
6% 11/15/18 (f) | | 950,000 | | 929,860 |
7.625% 7/15/17 (f) | | 315,000 | | 333,113 |
7.875% 7/15/20 (f) | | 570,000 | | 612,750 |
Valeant Pharmaceuticals International 6.875% 12/1/18 (f) | | 1,365,000 | | 1,351,350 |
| | 3,670,923 |
TOTAL HEALTH CARE | | 20,464,970 |
INDUSTRIALS - 3.6% |
Aerospace & Defense - 0.1% |
Alion Science & Technology Corp.: | | | | |
10.25% 2/1/15 | | 50,000 | | 38,000 |
12% 11/1/14 pay-in-kind | | 116,402 | | 117,172 |
Corporate Bonds - continued |
| Principal Amount (d) | | Value |
Nonconvertible Bonds - continued |
INDUSTRIALS - continued |
Aerospace & Defense - continued |
DigitalGlobe, Inc. 10.5% 5/1/14 | | $ 185,000 | | $ 211,363 |
GeoEye, Inc. 9.625% 10/1/15 | | 75,000 | | 84,750 |
Hexcel Corp. 6.75% 2/1/15 | | 100,000 | | 102,000 |
| | 553,285 |
Air Freight & Logistics - 0.0% |
Air Medical Group Holdings, Inc. 9.25% 11/1/18 (f) | | 285,000 | | 299,250 |
Airlines - 0.8% |
Air Canada 9.25% 8/1/15 (f) | | 595,000 | | 624,750 |
American Airlines, Inc. equipment trust certificate 13% 8/1/16 | | 308,422 | | 360,854 |
American Airlines, Inc. pass-thru trust certificates 10.375% 7/2/19 | | 399,431 | | 471,329 |
Continental Airlines, Inc.: | | | | |
pass-thru trust certificates 6.903% 4/19/22 | | 49,114 | | 49,114 |
3.4253% 6/2/13 (j) | | 2,532,916 | | 2,342,947 |
Continental Airlines, Inc. 7.25% 11/10/19 | | 379,226 | | 421,889 |
Delta Air Lines, Inc. 9.5% 9/15/14 (f) | | 103,000 | | 112,136 |
Delta Air Lines, Inc. pass-thru trust certificates: | | | | |
6.821% 8/10/22 | | 597,230 | | 642,023 |
8.021% 8/10/22 | | 272,762 | | 283,673 |
Northwest Airlines Corp. 10% 2/1/09 (a) | | 105,000 | | 0 |
Northwest Airlines, Inc.: | | | | |
7.875% 3/15/08 (a) | | 90,000 | | 0 |
8.875% 6/1/06 (a) | | 80,000 | | 0 |
Northwest Airlines, Inc. pass-thru trust certificates: | | | | |
7.027% 11/1/19 | | 125,587 | | 131,867 |
8.028% 11/1/17 | | 49,518 | | 49,023 |
United Air Lines, Inc.: | | | | |
9.875% 8/1/13 (f) | | 170,000 | | 183,175 |
12% 11/1/13 (f) | | 270,000 | | 297,675 |
United Air Lines, Inc. pass-thru trust certificates 9.75% 1/15/17 | | 632,897 | | 729,414 |
| | 6,699,869 |
Building Products - 0.1% |
Nortek, Inc. 11% 12/1/13 | | 753,333 | | 794,766 |
Commercial Services & Supplies - 0.9% |
ACCO Brands Corp. 10.625% 3/15/15 | | 45,000 | | 50,625 |
American Reprographics Co. 10.5% 12/15/16 (f) | | 395,000 | | 412,775 |
Browning-Ferris Industries, Inc. 9.25% 5/1/21 | | 100,000 | | 125,760 |
|
| Principal Amount (d) | | Value |
Casella Waste Systems, Inc. 11% 7/15/14 | | $ 105,000 | | $ 115,238 |
Cenveo Corp. 10.5% 8/15/16 (f) | | 175,000 | | 171,938 |
Covanta Holding Corp. 7.25% 12/1/20 | | 430,000 | | 435,925 |
EnergySolutions, Inc. / EnergySolutions LLC 10.75% 8/15/18 (f) | | 290,000 | | 316,448 |
Garda World Security Corp. 9.75% 3/15/17 (f) | | 185,000 | | 198,413 |
International Lease Finance Corp.: | | | | |
6.75% 9/1/16 (f) | | 380,000 | | 398,050 |
7.125% 9/1/18 (f) | | 760,000 | | 798,000 |
8.25% 12/15/20 | | 720,000 | | 734,400 |
8.625% 9/15/15 (f) | | 655,000 | | 694,300 |
8.75% 3/15/17 (f) | | 980,000 | | 1,041,250 |
Iron Mountain, Inc.: | | | | |
6.625% 1/1/16 | | 480,000 | | 481,800 |
7.75% 1/15/15 | | 97,000 | | 97,243 |
The Geo Group, Inc. 7.75% 10/15/17 | | 220,000 | | 231,000 |
United Rentals North America, Inc. 8.375% 9/15/20 | | 605,000 | | 618,613 |
| | 6,921,778 |
Construction & Engineering - 0.0% |
Odebrecht Finance Ltd. 7% 4/21/20 (f) | | 105,000 | | 111,300 |
Electrical Equipment - 0.0% |
General Cable Corp. 7.125% 4/1/17 | | 40,000 | | 41,200 |
Sensus Metering Systems, Inc. 8.625% 12/15/13 | | 60,000 | | 60,900 |
| | 102,100 |
Industrial Conglomerates - 0.1% |
Sequa Corp.: | | | | |
11.75% 12/1/15 (f) | | 705,000 | | 757,875 |
13.5% 12/1/15 pay-in-kind (f) | | 280,685 | | 308,754 |
| | 1,066,629 |
Machinery - 0.2% |
Accuride Corp. 9.5% 8/1/18 (f) | | 55,000 | | 59,675 |
ArvinMeritor, Inc. 10.625% 3/15/18 | | 170,000 | | 190,825 |
Chart Industries, Inc. 9.125% 10/15/15 | | 60,000 | | 61,500 |
Navistar International Corp. 8.25% 11/1/21 | | 710,000 | | 766,800 |
Terex Corp. 10.875% 6/1/16 | | 330,000 | | 382,800 |
| | 1,461,600 |
Marine - 0.3% |
Navios Maritime Acquisition Corp./Navios Acquisition Finance US, Inc. 8.625% 11/1/17 (f) | | 220,000 | | 222,750 |
Corporate Bonds - continued |
| Principal Amount (d) | | Value |
Nonconvertible Bonds - continued |
INDUSTRIALS - continued |
Marine - continued |
Navios Maritime Holdings, Inc.: | | | | |
8.875% 11/1/17 | | $ 875,000 | | $ 934,063 |
9.5% 12/15/14 | | 785,000 | | 816,400 |
SCF Capital Ltd. 5.375% 10/27/17 (f) | | 200,000 | | 195,750 |
Ultrapetrol (Bahamas) Ltd. 9% 11/24/14 | | 95,000 | | 95,475 |
| | 2,264,438 |
Road & Rail - 0.8% |
Avis Budget Car Rental LLC/Avis Budget Finance, Inc.: | | | | |
8.25% 1/15/19 (f) | | 870,000 | | 876,525 |
9.625% 3/15/18 | | 200,000 | | 214,000 |
Georgian Railway Ltd. 9.875% 7/22/15 | | 200,000 | | 215,000 |
Kansas City Southern de Mexico, SA de CV: | | | | |
6.625% 12/15/20 (f) | | 175,000 | | 175,000 |
7.375% 6/1/14 | | 100,000 | | 104,250 |
8% 2/1/18 | | 2,500,000 | | 2,706,250 |
12.5% 4/1/16 | | 855,000 | | 1,047,375 |
Swift Services Holdings, Inc. 10% 11/15/18 (f) | | 690,000 | | 717,600 |
Western Express, Inc. 12.5% 4/15/15 (f) | | 245,000 | | 216,825 |
| | 6,272,825 |
Trading Companies & Distributors - 0.2% |
Aircastle Ltd. 9.75% 8/1/18 | | 755,000 | | 828,613 |
VWR Funding, Inc. 10.25% 7/15/15 pay-in-kind (j) | | 647,482 | | 679,856 |
| | 1,508,469 |
Transportation Infrastructure - 0.1% |
Aeropuertos Argentina 2000 SA 10.75% 12/1/20 (f) | | 180,000 | | 188,100 |
Trico Shipping AS 11.875% 11/1/14 (c)(f) | | 720,000 | | 583,200 |
| | 771,300 |
TOTAL INDUSTRIALS | | 28,827,609 |
INFORMATION TECHNOLOGY - 1.3% |
Communications Equipment - 0.3% |
Brocade Communications Systems, Inc.: | | | | |
6.625% 1/15/18 | | 90,000 | | 93,600 |
6.875% 1/15/20 | | 170,000 | | 181,050 |
Hughes Network System LLC/HNS Finance Corp. 9.5% 4/15/14 | | 320,000 | | 330,000 |
Lucent Technologies, Inc.: | | | | |
6.45% 3/15/29 | | 1,620,000 | | 1,279,800 |
|
| Principal Amount (d) | | Value |
6.5% 1/15/28 | | $ 400,000 | | $ 318,000 |
ViaSat, Inc. 8.875% 9/15/16 | | 105,000 | | 111,825 |
| | 2,314,275 |
Computers & Peripherals - 0.1% |
Seagate HDD Cayman 7.75% 12/15/18 (f) | | 795,000 | | 798,975 |
Electronic Equipment & Components - 0.3% |
Atkore International, Inc. 9.875% 1/1/18 (f) | | 190,000 | | 197,125 |
Reddy Ice Corp.: | | | | |
11.25% 3/15/15 | | 1,875,000 | | 1,921,875 |
13.25% 11/1/15 | | 130,000 | | 111,150 |
| | 2,230,150 |
Internet Software & Services - 0.1% |
Equinix, Inc. 8.125% 3/1/18 | | 665,000 | | 694,925 |
IT Services - 0.2% |
Ceridian Corp. 11.25% 11/15/15 | | 275,000 | | 268,125 |
Fidelity National Information Services, Inc.: | | | | |
7.625% 7/15/17 (f) | | 240,000 | | 252,600 |
7.875% 7/15/20 (f) | | 320,000 | | 339,200 |
SunGard Data Systems, Inc. 7.375% 11/15/18 (f) | | 385,000 | | 381,150 |
Telcordia Technologies, Inc. 11% 5/1/18 (f) | | 580,000 | | 585,800 |
Unisys Corp.: | | | | |
12.5% 1/15/16 | | 210,000 | | 233,100 |
12.75% 10/15/14 (f) | | 32,000 | | 38,080 |
14.25% 9/15/15 (f) | | 26,000 | | 31,460 |
| | 2,129,515 |
Semiconductors & Semiconductor Equipment - 0.3% |
Advanced Micro Devices, Inc.: | | | | |
7.75% 8/1/20 (f) | | 135,000 | | 140,063 |
8.125% 12/15/17 | | 270,000 | | 285,174 |
Amkor Technology, Inc. 7.375% 5/1/18 | | 280,000 | | 287,700 |
Freescale Semiconductor, Inc. 10.75% 8/1/20 (f) | | 295,000 | | 315,650 |
NXP BV/NXP Funding LLC 9.75% 8/1/18 (f) | | 920,000 | | 1,032,700 |
Spansion LLC 11.25% 1/15/16 (c)(f) | | 255,000 | | 69,462 |
Viasystems, Inc. 12% 1/15/15 (f) | | 310,000 | | 346,425 |
| | 2,477,174 |
Software - 0.0% |
Open Solutions, Inc. 9.75% 2/1/15 (f) | | 50,000 | | 34,500 |
TOTAL INFORMATION TECHNOLOGY | | 10,679,514 |
MATERIALS - 2.9% |
Chemicals - 0.6% |
Air Liquide SA 2.908% 10/12/18 | EUR | 50,000 | | 63,856 |
Corporate Bonds - continued |
| Principal Amount (d) | | Value |
Nonconvertible Bonds - continued |
MATERIALS - continued |
Chemicals - continued |
Ashland, Inc. 9.125% 6/1/17 | | $ 160,000 | | $ 183,200 |
Braskem Finance Ltd. 7% 5/7/20 (f) | | 280,000 | | 287,000 |
Ferro Corp. 7.875% 8/15/18 | | 360,000 | | 381,600 |
Georgia Gulf Corp. 9% 1/15/17 (f) | | 860,000 | | 924,500 |
Hexion US Finance Corp./Hexion Nova Scotia Finance ULC 9% 11/15/20 (f) | | 20,000 | | 21,074 |
Ineos Finance PLC 9% 5/15/15 (f) | | 215,000 | | 228,438 |
MacDermid, Inc. 9.5% 4/15/17 (f) | | 40,000 | | 42,600 |
Momentive Performance Materials, Inc. 9% 1/15/21 (f) | | 75,000 | | 77,625 |
Nalco Co. 6.625% 1/15/19 (f) | | 555,000 | | 570,263 |
NOVA Chemicals Corp.: | | | | |
3.5678% 11/15/13 (j) | | 105,000 | | 103,163 |
6.5% 1/15/12 | | 375,000 | | 387,188 |
OMNOVA Solutions, Inc. 7.875% 11/1/18 (f) | | 95,000 | | 95,713 |
OXEA Finance & Cy SCA 9.5% 7/15/17 (f) | | 310,000 | | 334,025 |
PolyOne Corp. 7.375% 9/15/20 | | 155,000 | | 160,038 |
Solutia, Inc.: | | | | |
7.875% 3/15/20 | | 175,000 | | 188,125 |
8.75% 11/1/17 | | 85,000 | | 92,225 |
Sterling Chemicals, Inc. 10.25% 4/1/15 | | 90,000 | | 92,700 |
TPC Group LLC 8.25% 10/1/17 (f) | | 190,000 | | 198,550 |
Tronox Worldwide LLC/Tronox Worldwide Finance Corp. 9.5% 12/1/12 (c) | | 95,000 | | 148,913 |
| | 4,580,796 |
Construction Materials - 0.0% |
Headwaters, Inc. 11.375% 11/1/14 | | 80,000 | | 87,500 |
Roofing Supply Group LLC/Roofing Supply Finance, Inc. 8.625% 12/1/17 (f) | | 105,000 | | 108,938 |
| | 196,438 |
Containers & Packaging - 0.9% |
AEP Industries, Inc. 7.875% 3/15/13 | | 40,000 | | 39,850 |
Ardagh Packaging Finance PLC: | | | | |
7.375% 10/15/17 (f) | | 200,000 | | 205,000 |
9.125% 10/15/20 (f) | | 360,000 | | 377,100 |
Ball Corp. 5.75% 5/15/21 | | 3,000,000 | | 2,910,000 |
Berry Plastics Corp.: | | | | |
8.25% 11/15/15 | | 385,000 | | 401,363 |
9.75% 1/15/21 (f) | | 950,000 | | 940,500 |
|
| Principal Amount (d) | | Value |
Berry Plastics Holding Corp. 4.1766% 9/15/14 (j) | | $ 45,000 | | $ 41,175 |
BWAY Holding Co. 10% 6/15/18 (f) | | 205,000 | | 220,375 |
BWAY Parent Co., Inc. 10.875% 11/1/15 pay-in-kind (f)(j) | | 315,000 | | 315,000 |
Crown Cork & Seal, Inc.: | | | | |
7.375% 12/15/26 | | 1,210,000 | | 1,200,925 |
7.5% 12/15/96 | | 160,000 | | 128,000 |
Jefferson Smurfit Corp. U.S. 8.25% 10/1/12 (c) | | 85,000 | | 0 |
Smurfit-Stone Container Enterprises, Inc. 8% 3/15/17 (c) | | 430,000 | | 0 |
| | 6,779,288 |
Metals & Mining - 1.0% |
Aleris International, Inc.: | | | | |
6% 6/1/20 (f) | | 1,759 | | 8,290 |
9% 12/15/14 pay-in-kind (c)(j) | | 150,000 | | 675 |
Alrosa Finance SA 7.75% 11/3/20 (f) | | 200,000 | | 210,000 |
CSN Islands XI Corp. 6.875% 9/21/19 (f) | | 265,000 | | 286,200 |
Edgen Murray Corp. 12.25% 1/15/15 | | 675,000 | | 590,625 |
Evraz Group SA: | | | | |
8.25% 11/10/15 (f) | | 170,000 | | 181,050 |
8.875% 4/24/13 (f) | | 535,000 | | 576,463 |
FMG Resources (August 2006) Pty Ltd.: | | | | |
6.375% 2/1/16 (f) | | 635,000 | | 639,763 |
6.875% 2/1/18 (f) | | 635,000 | | 633,413 |
7% 11/1/15 (f) | | 790,000 | | 815,675 |
Freeport-McMoRan Copper & Gold, Inc. 8.375% 4/1/17 | | 1,280,000 | | 1,420,800 |
Gerdau Trade, Inc. 5.75% 1/30/21 (f) | | 240,000 | | 240,000 |
McJunkin Red Man Corp. 9.5% 12/15/16 (f) | | 740,000 | | 698,375 |
Metinvest BV 10.25% 5/20/15 (f) | | 260,000 | | 275,600 |
Rain CII Carbon LLC/CII Carbon Corp. 8% 12/1/18 (f) | | 300,000 | | 312,000 |
RathGibson, Inc. 11.25% 2/15/14 (c) | | 301,900 | | 2,128 |
Severstal Columbus LLC 10.25% 2/15/18 (f) | | 555,000 | | 585,525 |
Southern Copper Corp. 6.75% 4/16/40 | | 390,000 | | 407,577 |
Steel Capital SA 6.7% 10/25/17 (f) | | 180,000 | | 177,300 |
Teck Resources Ltd. 10.25% 5/15/16 | | 216,000 | | 267,300 |
| | 8,328,759 |
Paper & Forest Products - 0.4% |
ABI Escrow Corp. 10.25% 10/15/18 (f) | | 1,600,000 | | 1,737,920 |
Corporate Bonds - continued |
| Principal Amount (d) | | Value |
Nonconvertible Bonds - continued |
MATERIALS - continued |
Paper & Forest Products - continued |
Clearwater Paper Corp. 7.125% 11/1/18 (f) | | $ 105,000 | | $ 108,150 |
Georgia-Pacific LLC 5.4% 11/1/20 (f) | | 560,000 | | 549,472 |
Glatfelter 7.125% 5/1/16 | | 40,000 | | 41,200 |
NewPage Corp.: | | | | |
6.5369% 5/1/12 (j) | | 90,000 | | 51,863 |
11.375% 12/31/14 | | 345,000 | | 319,125 |
Solo Cup Co. 8.5% 2/15/14 | | 135,000 | | 119,475 |
Stone Container Corp. 8.375% 7/1/12 (c) | | 220,000 | | 0 |
| | 2,927,205 |
TOTAL MATERIALS | | 22,812,486 |
TELECOMMUNICATION SERVICES - 7.3% |
Diversified Telecommunication Services - 5.0% |
Alestra SA de RL de CV 11.75% 8/11/14 | | 350,000 | | 400,750 |
Citizens Communications Co.: | | | | |
7.125% 3/15/19 | | 225,000 | | 231,188 |
7.875% 1/15/27 | | 280,000 | | 271,600 |
9% 8/15/31 | | 220,000 | | 226,050 |
Clearwire Communications LLC/Clearwire Finance, Inc. 12% 12/1/15 (f) | | 1,225,000 | | 1,323,000 |
Frontier Communications Corp.: | | | | |
8.25% 4/15/17 | | 1,350,000 | | 1,495,125 |
8.5% 4/15/20 | | 1,350,000 | | 1,478,250 |
8.75% 4/15/22 | | 890,000 | | 970,100 |
Global Crossing Ltd. 12% 9/15/15 | | 1,920,000 | | 2,164,800 |
Indosat Palapa Co. BV 7.375% 7/29/20 (f) | | 145,000 | | 159,863 |
Intelsat Bermuda Ltd.: | | | | |
11.25% 2/4/17 | | 2,485,000 | | 2,702,438 |
12% 2/4/17 pay-in-kind (j) | | 2,786,533 | | 2,997,942 |
Intelsat Corp.: | | | | |
9.25% 8/15/14 | | 315,000 | | 324,450 |
9.25% 6/15/16 | | 560,000 | | 604,800 |
Intelsat Ltd. 11.25% 6/15/16 | | 1,680,000 | | 1,806,000 |
Qwest Communications International, Inc.: | | | | |
Series B 7.5% 2/15/14 | | 110,000 | | 111,375 |
7.125% 4/1/18 (f) | | 530,000 | | 547,225 |
7.5% 2/15/14 | | 480,000 | | 486,000 |
Qwest Corp. 8.375% 5/1/16 | | 550,000 | | 655,490 |
Sprint Capital Corp.: | | | | |
6.875% 11/15/28 | | 5,902,000 | | 5,164,250 |
6.9% 5/1/19 | | 1,190,000 | | 1,175,125 |
8.75% 3/15/32 | | 8,490,000 | | 8,574,900 |
|
| Principal Amount (d) | | Value |
Telemar Norte Leste SA 5.5% 10/23/20 (f) | | $ 140,000 | | $ 135,800 |
U.S. West Communications: | | | | |
6.875% 9/15/33 | | 200,000 | | 196,500 |
7.25% 9/15/25 | | 35,000 | | 37,100 |
7.25% 10/15/35 | | 70,000 | | 70,700 |
7.5% 6/15/23 | | 30,000 | | 29,850 |
Wind Acquisition Finance SA: | | | | |
7.25% 2/15/18 (f) | | 415,000 | | 418,113 |
11.75% 7/15/17 (f) | | 4,515,000 | | 5,045,513 |
| | 39,804,297 |
Wireless Telecommunication Services - 2.3% |
Clearwire Escrow Corp. 12% 12/1/15 (f) | | 335,000 | | 361,800 |
Digicel Group Ltd.: | | | | |
8.25% 9/1/17 (f) | | 210,000 | | 216,300 |
8.875% 1/15/15 (f) | | 1,875,000 | | 1,900,875 |
9.125% 1/15/15 pay-in-kind (f)(j) | | 917,000 | | 929,655 |
10.5% 4/15/18 (f) | | 2,495,000 | | 2,744,500 |
12% 4/1/14 (f) | | 1,145,000 | | 1,339,650 |
Intelsat Jackson Holdings Ltd.: | | | | |
8.5% 11/1/19 (f) | | 325,000 | | 349,375 |
9.5% 6/15/16 | | 1,215,000 | | 1,281,825 |
11.5% 6/15/16 | | 560,000 | | 603,400 |
Intelsat Subsidiary Holding Co. Ltd.: | | | | |
8.5% 1/15/13 | | 1,430,000 | | 1,431,859 |
8.875% 1/15/15 | | 760,000 | | 780,900 |
Mobile Telesystems Finance SA 8% 1/28/12 (f) | | 272,000 | | 286,280 |
MTS International Funding Ltd. 8.625% 6/22/20 (f) | | 410,000 | | 463,300 |
NII Capital Corp. 10% 8/15/16 | | 1,190,000 | | 1,317,925 |
Orascom Telecom Finance SCA 7.875% 2/8/14 (f) | | 900,000 | | 846,000 |
Pakistan Mobile Communications Ltd. 8.625% 11/13/13 (f) | | 850,000 | | 850,000 |
Sprint Nextel Corp. 6% 12/1/16 | | 1,515,000 | | 1,463,869 |
Telemovil Finance Co. Ltd. 8% 10/1/17 (f) | | 430,000 | | 440,750 |
Vimpel Communications 8.375% 4/30/13 (Issued by VIP Finance Ireland Ltd. for Vimpel Communications) (f) | | 555,000 | | 599,400 |
| | 18,207,663 |
TOTAL TELECOMMUNICATION SERVICES | | 58,011,960 |
UTILITIES - 1.2% |
Electric Utilities - 0.4% |
Empresa Distribuidora y Comercializadora Norte SA 9.75% 10/25/22 (f) | | 125,000 | | 135,313 |
Intergen NV 9% 6/30/17 (f) | | 1,255,000 | | 1,330,300 |
Corporate Bonds - continued |
| Principal Amount (d) | | Value |
Nonconvertible Bonds - continued |
UTILITIES - continued |
Electric Utilities - continued |
Majapahit Holding BV: | | | | |
7.75% 10/17/16 (Reg. S) | | $ 525,000 | | $ 606,375 |
7.75% 1/20/20 (f) | | 265,000 | | 304,750 |
8% 8/7/19 (f) | | 165,000 | | 191,400 |
National Power Corp. 6.875% 11/2/16 (f) | | 200,000 | | 230,000 |
| | 2,798,138 |
Gas Utilities - 0.2% |
Intergas Finance BV 6.375% 5/14/17 (Reg. S) | | 155,000 | | 161,200 |
Southern Natural Gas Co.: | | | | |
7.35% 2/15/31 | | 175,000 | | 186,424 |
8% 3/1/32 | | 350,000 | | 400,974 |
Star Gas Partners LP/Star Gas Finance Co. 8.875% 12/1/17 (f) | | 210,000 | | 209,475 |
Transportadora de Gas del Sur SA 7.875% 5/14/17 (f) | | 410,000 | | 412,050 |
| | 1,370,123 |
Independent Power Producers & Energy Traders - 0.6% |
Energy Future Holdings Corp.: | | | | |
10% 1/15/20 (f) | | 720,000 | | 738,000 |
10.875% 11/1/17 | | 1,163,000 | | 814,100 |
12% 11/1/17 pay-in-kind (j) | | 446,977 | | 263,567 |
Energy Future Intermediate Holding Co. LLC/Energy Future Intermediate Holding Finance, Inc. 10% 12/1/20 | | 2,042,000 | | 2,093,050 |
Enron Corp. 7.625% 9/10/04 (c) | | 400,000 | | 0 |
Power Sector Assets and Liabilities Management Corp.: | | | | |
7.25% 5/27/19 (f) | | 235,000 | | 276,125 |
7.39% 12/2/24 (f) | | 280,000 | | 329,700 |
Tenaska Alabama Partners LP 7% 6/30/21 (f) | | 79,704 | | 84,885 |
| | 4,599,427 |
Multi-Utilities - 0.0% |
Aquila, Inc. 11.875% 7/1/12 (j) | | 120,000 | | 136,117 |
Utilicorp United, Inc. 7.95% 2/1/11 (e) | | 3,000 | | 3,015 |
| | 139,132 |
|
| Principal Amount (d) | | Value |
Water Utilities - 0.0% |
South East Water Ltd. Class 2A, 5.5834% 3/29/29 | GBP | 165,000 | | $ 249,187 |
TOTAL UTILITIES | | 9,156,007 |
TOTAL NONCONVERTIBLE BONDS | | 292,143,761 |
TOTAL CORPORATE BONDS (Cost $284,821,100) | 303,604,267 |
U.S. Government and Government Agency Obligations - 21.3% |
|
U.S. Government Agency Obligations - 2.0% |
Fannie Mae: | | | | |
0.375% 12/28/12 | | 930,000 | | 924,097 |
0.75% 12/18/13 | | 1,276,000 | | 1,261,747 |
1% 9/23/13 | | 295,000 | | 294,554 |
1.125% 7/30/12 | | 290,000 | | 292,536 |
1.25% 8/20/13 | | 360,000 | | 362,352 |
Federal Home Loan Bank: | | | | |
0.875% 8/22/12 | | 495,000 | | 497,462 |
0.875% 12/27/13 | | 50,000 | | 49,562 |
1.5% 1/16/13 | | 940,000 | | 954,914 |
1.875% 6/21/13 | | 2,240,000 | | 2,292,205 |
Freddie Mac: | | | | |
0.375% 11/30/12 | | 227,000 | | 225,649 |
0.625% 12/28/12 | | 7,250,000 | | 7,236,798 |
4.125% 12/21/12 | | 432,000 | | 460,452 |
4.5% 1/15/14 | | 172,000 | | 189,076 |
Israeli State (guaranteed by U.S. Government through Agency for International Development) 5.5% 9/18/23 | | 530,000 | | 608,369 |
Tennessee Valley Authority 5.25% 9/15/39 | | 400,000 | | 422,886 |
TOTAL U.S. GOVERNMENT AGENCY OBLIGATIONS | | 16,072,659 |
U.S. Treasury Inflation Protected Obligations - 0.8% |
U.S. Treasury Inflation-Indexed Notes 0.5% 4/15/15 | | 5,853,244 | | 5,989,930 |
U.S. Treasury Obligations - 16.5% |
U.S. Treasury Bonds: | | | | |
3.5% 2/15/39 | | 3,430,000 | | 2,955,696 |
3.875% 8/15/40 | | 10,270,000 | | 9,459,635 |
4.25% 11/15/40 | | 300,000 | | 295,125 |
4.375% 2/15/38 | | 675,000 | | 682,172 |
4.75% 2/15/37 | | 250,000 | | 268,672 |
5.25% 2/15/29 | | 2,825,000 | | 3,239,922 |
6.25% 8/15/23 | | 5,561,000 | | 6,989,482 |
7.5% 11/15/16 | | 2,155,000 | | 2,769,679 |
7.5% 11/15/24 | | 780,000 | | 1,092,853 |
U.S. Government and Government Agency Obligations - continued |
| Principal Amount (d) | | Value |
U.S. Treasury Obligations - continued |
U.S. Treasury Bonds: - continued | | | | |
7.875% 2/15/21 | | $ 200,000 | | $ 279,000 |
8% 11/15/21 | | 870,000 | | 1,230,506 |
8.75% 5/15/20 | | 922,000 | | 1,341,871 |
U.S. Treasury Notes: | | | | |
0.375% 9/30/12 | | 4,844,000 | | 4,832,457 |
0.75% 12/15/13 | | 7,264,000 | | 7,212,360 |
1.25% 10/31/15 | | 3,260,000 | | 3,155,067 |
1.375% 2/15/13 | | 297,000 | | 301,478 |
1.375% 11/30/15 | | 2,000,000 | | 1,943,594 |
1.5% 12/31/13 | | 409,000 | | 414,879 |
1.75% 4/15/13 | | 1,779,000 | | 1,819,864 |
1.75% 7/31/15 | | 4,750,000 | | 4,734,800 |
1.875% 4/30/14 | | 2,288,000 | | 2,340,015 |
1.875% 8/31/17 | | 3,300,000 | | 3,150,210 |
1.875% 9/30/17 | | 1,900,000 | | 1,809,305 |
1.875% 10/31/17 | | 3,700,000 | | 3,517,313 |
2.125% 5/31/15 | | 1,958,000 | | 1,989,211 |
2.375% 8/31/14 | | 12,800,000 | | 13,259,943 |
2.375% 9/30/14 | | 942,000 | | 975,706 |
2.375% 10/31/14 | | 4,724,000 | | 4,889,708 |
2.5% 4/30/15 | | 3,089,000 | | 3,193,495 |
2.625% 7/31/14 | | 5,363,000 | | 5,608,942 |
2.625% 4/30/16 | | 1,135,000 | | 1,161,868 |
2.625% 8/15/20 | | 1,000,000 | | 948,047 |
2.625% 11/15/20 | | 3,130,000 | | 2,952,470 |
2.75% 11/30/16 | | 1,500,000 | | 1,531,055 |
2.75% 2/15/19 | | 2,778,000 | | 2,742,189 |
3% 9/30/16 | | 1,969,000 | | 2,042,068 |
3% 2/28/17 | | 1,500,000 | | 1,546,875 |
3.125% 8/31/13 | | 1,375,000 | | 1,458,681 |
3.125% 9/30/13 | | 1,291,000 | | 1,369,569 |
3.125% 10/31/16 | | 3,249,000 | | 3,389,113 |
3.125% 1/31/17 | | 1,636,000 | | 1,699,905 |
3.125% 5/15/19 | | 4,468,000 | | 4,515,124 |
3.375% 6/30/13 | | 734,000 | | 781,538 |
3.5% 5/15/20 | | 1,027,000 | | 1,052,038 |
3.625% 8/15/19 | | 1,109,000 | | 1,158,559 |
3.75% 11/15/18 | | 328,000 | | 348,884 |
3.875% 5/15/18 | | 218,000 | | 234,554 |
4% 8/15/18 | | 721,000 | | 781,328 |
4.25% 11/15/17 | | 1,975,000 | | 2,177,283 |
4.5% 5/15/17 | | 1,172,000 | | 1,311,358 |
5.125% 5/15/16 | | 1,865,000 | | 2,148,683 |
TOTAL U.S. TREASURY OBLIGATIONS | | 131,104,149 |
|
| Principal Amount (d) | | Value |
Other Government Related - 2.0% |
Bank of America Corp.: | | | | |
2.1% 4/30/12 (FDIC Guaranteed) (g) | | $ 200,000 | | $ 204,153 |
3.125% 6/15/12 (FDIC Guaranteed) (g) | | 9,000 | | 9,321 |
Citibank NA 1.875% 5/7/12 (FDIC Guaranteed) (g) | | 1,350,000 | | 1,373,028 |
Citigroup Funding, Inc.: | | | | |
1.875% 10/22/12 (FDIC Guaranteed) (g) | | 4,000,000 | | 4,080,108 |
1.875% 11/15/12 (FDIC Guaranteed) (g) | | 525,000 | | 535,582 |
2% 3/30/12 (FDIC Guaranteed) (g) | | 250,000 | | 254,082 |
2.125% 7/12/12 (FDIC Guaranteed) (g) | | 172,000 | | 175,902 |
General Electric Capital Corp.: | | | | |
2% 9/28/12 (FDIC Guaranteed) (g) | | 1,693,000 | | 1,729,310 |
2.125% 12/21/12 (FDIC Guaranteed) (g) | | 1,000,000 | | 1,027,436 |
2.625% 12/28/12 (FDIC Guaranteed) (g) | | 384,000 | | 398,279 |
3% 12/9/11 (FDIC Guaranteed) (g) | | 310,000 | | 317,453 |
GMAC, Inc. 1.75% 10/30/12 (FDIC Guaranteed) (g) | | 1,360,000 | | 1,384,088 |
Goldman Sachs Group, Inc. 3.25% 6/15/12 (FDIC Guaranteed) (g) | | 9,000 | | 9,343 |
JPMorgan Chase & Co.: | | | | |
2.2% 6/15/12 (FDIC Guaranteed) (g) | | 530,000 | | 542,214 |
3.125% 12/1/11 (FDIC Guaranteed) (g) | | 50,000 | | 51,245 |
Morgan Stanley 3.25% 12/1/11 (FDIC Guaranteed) (g) | | 1,898,000 | | 1,947,384 |
National Credit Union Administration Guaranteed Notes: | | | | |
Series 2010-A1 Class A, 0.6106% 12/7/20 (NCUA Guaranteed) (j) | | 510,000 | | 510,536 |
Series 2010-R3 Class 1A, 0.8253% 12/8/20 (NCUA Guaranteed) (j) | | 1,020,000 | | 1,018,725 |
TOTAL OTHER GOVERNMENT RELATED | | 15,568,189 |
TOTAL U.S. GOVERNMENT AND GOVERNMENT AGENCY OBLIGATIONS (Cost $168,635,070) | 168,734,927 |
U.S. Government Agency - Mortgage Securities - 2.5% |
| Principal Amount (d) | | Value |
Fannie Mae - 1.6% |
2.073% 11/1/35 (j) | | $ 42,667 | | $ 44,097 |
2.233% 9/1/33 (j) | | 46,978 | | 48,483 |
2.474% 10/1/35 (j) | | 5,957 | | 6,182 |
2.48% 11/1/33 (j) | | 10,228 | | 10,663 |
2.589% 6/1/36 (j) | | 3,674 | | 3,850 |
2.642% 7/1/35 (j) | | 26,629 | | 27,907 |
2.652% 3/1/33 (j) | | 14,433 | | 15,123 |
2.68% 1/1/35 (j) | | 25,792 | | 26,961 |
2.731% 5/1/35 (j) | | 71,748 | | 75,612 |
2.744% 9/1/34 (j) | | 35,898 | | 37,519 |
2.773% 11/1/36 (j) | | 6,544 | | 6,889 |
2.805% 7/1/35 (j) | | 66,708 | | 69,985 |
2.829% 9/1/36 (j) | | 13,996 | | 14,723 |
2.857% 9/1/35 (j) | | 75,287 | | 79,177 |
2.884% 11/1/36 (j) | | 17,502 | | 18,443 |
2.981% 7/1/35 (j) | | 47,388 | | 49,788 |
3.128% 10/1/37 (j) | | 24,194 | | 25,436 |
3.137% 8/1/35 (j) | | 69,910 | | 74,039 |
3.161% 4/1/36 (j) | | 29,772 | | 31,380 |
3.359% 1/1/40 (j) | | 1,658,302 | | 1,714,192 |
3.5% 1/1/26 (h)(i) | | 6,000,000 | | 6,043,125 |
3.5% 1/1/26 (h) | | 1,500,000 | | 1,510,781 |
3.5% 11/1/40 | | 1,000,001 | | 955,548 |
3.505% 2/1/37 (j) | | 52,105 | | 54,493 |
3.527% 6/1/47 (j) | | 12,984 | | 13,620 |
4% 9/1/13 to 7/1/40 | | 1,013,428 | | 1,009,854 |
5% 6/1/14 | | 2,848 | | 3,022 |
5.046% 2/1/34 (j) | | 35,819 | | 37,299 |
5.569% 2/1/36 (j) | | 9,835 | | 10,228 |
5.593% 4/1/36 (j) | | 53,048 | | 55,668 |
5.766% 5/1/36 (j) | | 9,907 | | 10,256 |
5.963% 3/1/37 (j) | | 7,961 | | 8,474 |
6% 6/1/16 to 10/1/16 | | 13,730 | | 14,925 |
6.5% 4/1/12 to 9/1/32 | | 152,227 | | 169,634 |
TOTAL FANNIE MAE | | 12,277,376 |
Freddie Mac - 0.2% |
1.975% 3/1/37 (j) | | 55,223 | | 57,312 |
2.041% 3/1/35 (j) | | 17,696 | | 18,193 |
2.094% 5/1/37 (j) | | 11,432 | | 11,817 |
2.409% 6/1/33 (j) | | 29,426 | | 30,518 |
2.54% 6/1/37 (j) | | 27,585 | | 29,062 |
2.551% 5/1/37 (j) | | 98,177 | | 103,328 |
2.579% 5/1/37 (j) | | 61,170 | | 64,104 |
2.586% 12/1/33 (j) | | 63,622 | | 66,397 |
2.621% 10/1/35 (j) | | 36,929 | | 38,616 |
2.631% 7/1/35 (j) | | 32,522 | | 33,993 |
2.865% 9/1/35 (j) | | 6,685 | | 7,015 |
2.958% 1/1/35 (j) | | 75,195 | | 79,198 |
2.985% 4/1/37 (j) | | 11,041 | | 11,601 |
|
| Principal Amount (d) | | Value |
3.022% 7/1/35 (j) | | $ 18,973 | | $ 19,939 |
3.247% 12/1/36 (j) | | 114,344 | | 119,823 |
3.352% 10/1/35 (j) | | 4,587 | | 4,859 |
3.404% 3/1/37 (j) | | 11,004 | | 11,344 |
3.47% 10/1/36 (j) | | 38,551 | | 40,021 |
3.508% 5/1/37 (j) | | 7,341 | | 7,646 |
4.3% 1/1/36 (j) | | 6,834 | | 7,061 |
4.375% 4/1/35 (j) | | 69,237 | | 72,705 |
4.5% 8/1/33 | | 22,266 | | 22,980 |
4.956% 3/1/36 (j) | | 93,111 | | 97,370 |
5.138% 4/1/35 (j) | | 2,595 | | 2,736 |
5.237% 1/1/37 (j) | | 31,299 | | 32,682 |
5.257% 7/1/36 (j) | | 364,812 | | 380,040 |
5.527% 1/1/36 (j) | | 20,286 | | 20,978 |
6.01% 6/1/37 (j) | | 3,363 | | 3,543 |
6.077% 6/1/37 (j) | | 6,513 | | 6,851 |
6.141% 7/1/36 (j) | | 11,922 | | 12,453 |
6.28% 8/1/37 (j) | | 19,005 | | 20,188 |
6.431% 2/1/37 (j) | | 6,263 | | 6,531 |
6.5% 12/1/14 to 3/1/22 | | 197,445 | | 214,430 |
7.22% 4/1/37 (j) | | 481 | | 510 |
TOTAL FREDDIE MAC | | 1,655,844 |
Ginnie Mae - 0.7% |
4% 9/15/25 | | 98,487 | | 103,115 |
5.492% 4/20/60 (l) | | 737,230 | | 802,548 |
5.5% 1/20/60 (l) | | 870,925 | | 949,308 |
5.5% 2/20/60 (l) | | 1,553,831 | | 1,685,440 |
5.5% 3/20/60 (l) | | 1,018,098 | | 1,108,607 |
5.691% 10/20/59 (l) | | 1,102,960 | | 1,208,341 |
TOTAL GINNIE MAE | | 5,857,359 |
TOTAL U.S. GOVERNMENT AGENCY - MORTGAGE SECURITIES (Cost $19,635,803) | 19,790,579 |
Collateralized Mortgage Obligations - 2.0% |
|
Private Sponsor - 0.0% |
Arkle Master Issuer PLC floater Series 2006-1X Class 5M1, 1.318% 2/17/52 (j) | EUR | 50,000 | | 64,512 |
Granite Mortgages PLC 1.0719% 3/20/44 (j) | GBP | 28,507 | | 41,695 |
TOTAL PRIVATE SPONSOR | | 106,207 |
U.S. Government Agency - 2.0% |
Fannie Mae: | | | | |
floater: | | | | |
Series 2006-56 Class PF, 0.6106% 7/25/36 (j) | | 548,384 | | 547,448 |
Collateralized Mortgage Obligations - continued |
| Principal Amount (d) | | Value |
U.S. Government Agency - continued |
Fannie Mae: - continued | | | | |
floater: | | | | |
Series 2010-111 Class AF, 0.6606% 10/25/40 (j) | | $ 919,541 | | $ 922,917 |
sequential payer Series 2007-113 Class DB, 4.5% 12/25/22 | | 440,000 | | 468,633 |
Series 2006-127 Class FD, 0.5406% 7/25/36 (j) | | 475,698 | | 471,509 |
Series 2006-44 Class FK, 0.6906% 6/25/36 (j) | | 174,525 | | 174,342 |
Fannie Mae subordinate REMIC pass-thru certificates: | | | | |
floater: | | | | |
Series 2005-38 Class F, 0.5606% 5/25/35 (j) | | 964,285 | | 958,666 |
Series 2005-56 Class F, 0.5506% 7/25/35 (j) | | 730,276 | | 725,810 |
Series 2006-79 Class PF, 0.6606% 8/25/36 (j) | | 379,775 | | 379,086 |
Series 2010-86 Class FE, 0.7106% 8/25/25 (j) | | 311,972 | | 312,024 |
planned amortization class: | | | | |
Series 2002-9 Class PC, 6% 3/25/17 | | 5,550 | | 5,965 |
Series 2003-113 Class PE, 4% 11/25/18 | | 80,000 | | 84,327 |
Series 2003-70 Class BJ, 5% 7/25/33 | | 45,000 | | 45,854 |
Series 2004-80 Class LD, 4% 1/25/19 | | 100,000 | | 104,473 |
Series 2004-81 Class KD, 4.5% 7/25/18 | | 195,000 | | 205,351 |
Series 2005-52 Class PB, 6.5% 12/25/34 | | 74,640 | | 80,260 |
sequential payer: | | | | |
Series 2002-57 Class BD, 5.5% 9/25/17 | | 21,582 | | 23,459 |
Series 2004-95 Class AN, 5.5% 1/25/25 | | 68,001 | | 72,940 |
Series 2005-117, Class JN, 4.5% 1/25/36 | | 40,000 | | 40,163 |
Series 2006-72 Class CY, 6% 8/25/26 | | 145,000 | | 157,734 |
Series 2003-79 Class FC, 0.7106% 8/25/33 (j) | | 374,658 | | 375,739 |
Series 2008-76 Class EF, 0.7606% 9/25/23 (j) | | 210,961 | | 211,084 |
Freddie Mac planned amortization class: | | | | |
Series 2101 Class PD, 6% 11/15/28 | | 12,462 | | 13,638 |
Series 2115 Class PE, 6% 1/15/14 | | 2,656 | | 2,785 |
|
| Principal Amount (d) | | Value |
Freddie Mac Multi-class participation certificates guaranteed: | | | | |
floater: | | | | |
Series 2630 Class FL, 0.7603% 6/15/18 (j) | | $ 4,142 | | $ 4,187 |
Series 3279 Class FB, 0.5803% 2/15/37 (j) | | 169,496 | | 169,547 |
Series 3325 Class NF, 0.5603% 8/15/35 (j) | | 592,596 | | 589,368 |
Series 3346 Class FA, 0.4903% 2/15/19 (j) | | 1,030,169 | | 1,030,279 |
planned amortization class: | | | | |
Series 2376 Class JE, 5.5% 11/15/16 | | 22,836 | | 24,390 |
Series 2381 Class OG, 5.5% 11/15/16 | | 15,569 | | 16,590 |
Series 2425 Class JH, 6% 3/15/17 | | 28,671 | | 30,781 |
Series 2628 Class OE, 4.5% 6/15/18 | | 95,000 | | 102,509 |
Series 2695 Class DG, 4% 10/15/18 | | 220,000 | | 232,702 |
Series 2831 Class PB, 5% 7/15/19 | | 200,000 | | 217,039 |
Series 2866 Class XE, 4% 12/15/18 | | 250,000 | | 261,437 |
Series 2996 Class MK, 5.5% 6/15/35 | | 25,545 | | 27,761 |
Series 3122 Class FE, 0.5603% 3/15/36 (j) | | 506,184 | | 507,513 |
Series 3147 Class PF, 0.5603% 4/15/36 (j) | | 425,029 | | 425,558 |
sequential payer: | | | | |
Series 2303 Class ZV, 6% 4/15/31 | | 34,753 | | 38,144 |
Series 2570 Class CU, 4.5% 7/15/17 | | 4,853 | | 4,984 |
Series 2572 Class HK, 4% 2/15/17 | | 4,506 | | 4,568 |
Series 2668 Class AZ, 4% 9/15/18 | | 267,157 | | 280,996 |
Series 2860 Class CP, 4% 10/15/17 | | 3,476 | | 3,471 |
Series 2887 Class EB, 4.5% 11/15/19 | | 420,000 | | 442,999 |
Series 2987 Class HE, 4.5% 6/15/20 | | 380,000 | | 403,035 |
Series 3372 Class BD, 4.5% 10/15/22 | | 790,000 | | 832,745 |
Series 2715 Class NG, 4.5% 12/15/18 | | 1,000,000 | | 1,078,359 |
Series 2863 Class DB, 4% 9/15/14 | | 6,607 | | 6,729 |
Collateralized Mortgage Obligations - continued |
| Principal Amount (d) | | Value |
U.S. Government Agency - continued |
Ginnie Mae guaranteed REMIC pass-thru securities: | | | | |
floater: | | | | |
Series 2010-H17 Class FA, 0.5834% 7/20/60 (j)(l) | | $ 469,024 | | $ 465,741 |
Series 2010-H18 Class AF, 0.5578% 9/1/60 (j)(l) | | 487,380 | | 481,287 |
Series 2010-H19 Class FG, 0.5538% 8/20/60 (j)(l) | | 608,999 | | 602,300 |
Series 2004-79 Class FA,
0.5606% 1/20/31 (j) | | 184,111 | | 184,370 |
Series 2003-42 Class FH, 0.7106% 5/20/33 (j) | | 107,084 | | 107,809 |
Series 2004-59 Class FC, 0.5606% 8/16/34 (j) | | 211,794 | | 211,949 |
Government National Mortgage Association pass thru certificates floater Series 2010-85 Class AF, 0.6106% 12/20/39 (j) | | 844,394 | | 847,814 |
TOTAL U.S. GOVERNMENT AGENCY | | 16,021,168 |
TOTAL COLLATERALIZED MORTGAGE OBLIGATIONS (Cost $15,933,532) | 16,127,375 |
Commercial Mortgage Securities - 0.0% |
|
London & Regional Debt Securitisation No. 1 PLC Class A, 0.9498% 10/15/14 (j) | GBP | 50,000 | | 72,547 |
REC Plantation Place Ltd. Series 5 Class A, 0.9673% 7/25/16 (Reg. S) (j) | GBP | 48,473 | | 69,139 |
TOTAL COMMERCIAL MORTGAGE SECURITIES (Cost $158,352) | 141,686 |
Foreign Government and Government Agency Obligations - 22.5% |
|
Arab Republic of Egypt: | | | | |
5.75% 4/29/20 (f) | | 260,000 | | 270,400 |
6.875% 4/30/40 (f) | | 455,000 | | 480,025 |
Argentine Republic: | | | | |
discount (with partial capitalization through 12/31/13) 8.28% 12/31/33 | | 689,504 | | 636,068 |
par 2.5% 12/31/38 (e) | | 680,000 | | 302,600 |
0.6586% 8/3/12 (j) | | 2,437,500 | | 2,323,468 |
7% 3/28/11 | | 3,055,000 | | 3,091,490 |
7% 9/12/13 | | 4,570,000 | | 4,495,991 |
7% 10/3/15 | | 610,000 | | 575,162 |
13.2549% 1/30/14 (j) | ARS | 940,000 | | 230,171 |
Aruba Government 6.4% 9/6/15 (f) | | 100,000 | | 105,000 |
Bahamian Republic 6.95% 11/20/29 (f) | | 240,000 | | 247,200 |
|
| Principal Amount (d) | | Value |
Barbados Government 7.25% 12/15/21 (f) | | $ 215,000 | | $ 223,600 |
Belarus Republic 8.75% 8/3/15 | | 340,000 | | 348,160 |
Bermuda Government 5.603% 7/20/20 (f) | | 185,000 | | 191,475 |
Brazilian Federative Republic: | | | | |
5.625% 1/7/41 | | 675,000 | | 668,250 |
6% 9/15/13 | | 100,005 | | 104,755 |
7.125% 1/20/37 | | 260,000 | | 310,050 |
8.75% 2/4/25 | | 185,000 | | 255,300 |
10.125% 5/15/27 | | 180,000 | | 273,600 |
12.25% 3/6/30 | | 215,000 | | 384,850 |
Buenos Aires Province 11.75% 10/5/15 (f) | | 240,000 | | 248,880 |
Bulgarian Republic 8.25% 1/15/15 (Reg. S) | | 240,000 | | 281,400 |
Canadian Government: | | | | |
1% 9/1/11 | CAD | 1,925,000 | | 1,927,239 |
1.5% 12/1/12 | CAD | 1,700,000 | | 1,699,148 |
2.5% 6/1/15 | CAD | 7,150,000 | | 7,228,720 |
3.5% 6/1/20 | CAD | 3,900,000 | | 4,031,747 |
5% 6/1/37 | CAD | 2,200,000 | | 2,737,062 |
Cayman Island Government 5.95% 11/24/19 (f) | | 120,000 | | 121,800 |
Colombian Republic: | | | | |
6.125% 1/18/41 | | 340,000 | | 346,800 |
7.375% 3/18/19 | | 100,000 | | 120,000 |
7.375% 9/18/37 | | 505,000 | | 598,425 |
10.375% 1/28/33 | | 240,000 | | 360,000 |
11.75% 2/25/20 | | 245,000 | | 367,500 |
Congo Republic 3% 6/30/29 (e) | | 551,000 | | 330,600 |
Croatia Republic: | | | | |
6.625% 7/14/20 (f) | | 275,000 | | 284,625 |
6.75% 11/5/19 (f) | | 230,000 | | 239,232 |
Democratic Socialist Republic of Sri Lanka: | | | | |
7.4% 1/22/15 (f) | | 315,000 | | 345,713 |
8.25% 10/24/12 (f) | | 255,000 | | 272,213 |
Dominican Republic: | | | | |
1.2713% 8/30/24 (j) | | 495,000 | | 440,550 |
7.5% 5/6/21 (f) | | 315,000 | | 334,688 |
9.04% 1/23/18 (f) | | 216,409 | | 245,625 |
Ecuador Republic 5% 2/28/25 | | 76,000 | | 55,480 |
El Salvador Republic: | | | | |
7.375% 12/1/19 (f) | | 180,000 | | 196,200 |
7.65% 6/15/35 (Reg. S) | | 240,000 | | 252,000 |
7.75% 1/24/23 (Reg. S) | | 225,000 | | 247,500 |
8.25% 4/10/32 (Reg. S) | | 90,000 | | 100,800 |
Finnish Government 3.375% 4/15/20 | EUR | 500,000 | | 678,875 |
French Republic: | | | | |
OAT 4.5% 4/25/41 | EUR | 600,000 | | 874,334 |
2.5% 10/25/20 | EUR | 3,500,000 | | 4,349,034 |
4% 4/25/55 | EUR | 500,000 | | 681,536 |
Foreign Government and Government Agency Obligations - continued |
| Principal Amount (d) | | Value |
Gabonese Republic 8.2% 12/12/17 (f) | | $ 230,000 | | $ 268,525 |
Georgia Republic 7.5% 4/15/13 | | 690,000 | | 705,525 |
German Federal Republic: | | | | |
0.75% 9/14/12 | EUR | 9,700,000 | | 12,958,655 |
1.75% 10/9/15 | EUR | 6,545,000 | | 8,709,099 |
3% 7/4/20 | EUR | 4,025,000 | | 5,412,099 |
4.75% 7/4/40 | EUR | 1,630,000 | | 2,703,173 |
Ghana Republic: | | | | |
8.5% 10/4/17 (f) | | 335,000 | | 371,850 |
14.25% 7/29/13 | GHS | 280,000 | | 185,109 |
14.99% 3/11/13 | GHS | 1,070,000 | | 742,808 |
Government of the Democratic Socialist Republic of Sri Lanka 6.25% 10/4/20 (f) | | 280,000 | | 281,400 |
Hungarian Republic: | | | | |
4.75% 2/3/15 | | 135,000 | | 132,638 |
6.25% 1/29/20 | | 320,000 | | 311,200 |
Indonesian Republic: | | | | |
5.875% 3/13/20 (f) | | 530,000 | | 580,350 |
6.625% 2/17/37 (f) | | 325,000 | | 355,063 |
6.875% 1/17/18 (f) | | 300,000 | | 347,250 |
7.5% 1/15/16 (f) | | 175,000 | | 205,625 |
7.75% 1/17/38 (f) | | 510,000 | | 619,650 |
8.5% 10/12/35 (Reg. S) | | 400,000 | | 528,000 |
11.625% 3/4/19 (f) | | 475,000 | | 704,188 |
Islamic Republic of Pakistan 7.125% 3/31/16 (f) | | 1,125,000 | | 1,018,125 |
Italian Republic: | | | | |
2% 12/15/12 | EUR | 850,000 | | 1,126,733 |
3% 6/15/15 | EUR | 4,550,000 | | 5,904,554 |
4% 9/1/20 | EUR | 4,300,000 | | 5,465,612 |
5% 9/1/40 | EUR | 2,050,000 | | 2,574,480 |
Ivory Coast 2.5% 12/31/32 (e) | | 500,000 | | 207,500 |
Japan Government: | | | | |
0.4% 5/15/11 | JPY | 844,300,000 | | 10,405,947 |
1.1% 6/20/20 | JPY | 353,500,000 | | 4,366,834 |
1.9% 9/20/30 | JPY | 260,000,000 | | 3,204,788 |
2% 9/20/40 | JPY | 41,000,000 | | 500,678 |
Lebanese Republic 4% 12/31/17 | | 668,500 | | 643,431 |
Lithuanian Republic: | | | | |
5.125% 9/14/17 (f) | | 140,000 | | 137,900 |
6.75% 1/15/15 (f) | | 330,000 | | 358,050 |
7.375% 2/11/20 (f) | | 225,000 | | 248,625 |
Ontario Province 4.4% 6/2/19 | CAD | 800,000 | | 845,467 |
Perusahaan Penerbit SBSN Indonesia 8.8% 4/23/14 (f) | | 175,000 | | 206,500 |
Peruvian Republic: | | | | |
3% 3/7/27 (e) | | 135,000 | | 116,100 |
5.625% 11/18/50 | | 355,000 | | 328,375 |
|
| Principal Amount (d) | | Value |
7.35% 7/21/25 | | $ 220,000 | | $ 267,300 |
8.75% 11/21/33 | | 305,000 | | 416,325 |
Philippine Republic: | | | | |
6.375% 1/15/32 | | 170,000 | | 181,050 |
6.375% 10/23/34 | | 235,000 | | 250,863 |
6.5% 1/20/20 | | 250,000 | | 289,375 |
9.5% 2/2/30 | | 85,000 | | 123,038 |
9.5% 2/2/30 | | 115,000 | | 166,463 |
10.625% 3/16/25 | | 155,000 | | 239,475 |
Polish Government 3.875% 7/16/15 | | 185,000 | | 187,775 |
Provincia de Cordoba 12.375% 8/17/17 (f) | | 415,000 | | 431,600 |
Republic of Iraq 5.8% 1/15/28 (Reg. S) | | 750,000 | | 688,125 |
Republic of Serbia 6.75% 11/1/24 (f) | | 2,090,667 | | 2,048,854 |
Russian Federation: | | | | |
3.625% 4/29/15 (f) | | 600,000 | | 601,500 |
5% 4/29/20 (f) | | 900,000 | | 901,125 |
7.5% 3/31/30 (Reg. S) | | 5,199,950 | | 6,012,442 |
11% 7/24/18 (Reg. S) | | 110,000 | | 154,000 |
12.75% 6/24/28 (Reg. S) | | 710,000 | | 1,234,513 |
Turkish Republic: | | | | |
5.625% 3/30/21 | | 365,000 | | 381,425 |
6.75% 4/3/18 | | 630,000 | | 717,444 |
6.75% 5/30/40 | | 555,000 | | 609,113 |
6.875% 3/17/36 | | 1,065,000 | | 1,188,860 |
7% 9/26/16 | | 590,000 | | 677,792 |
7.25% 3/15/15 | | 380,000 | | 435,100 |
7.25% 3/5/38 | | 650,000 | | 757,250 |
7.375% 2/5/25 | | 1,150,000 | | 1,362,750 |
7.5% 7/14/17 | | 575,000 | | 679,248 |
7.5% 11/7/19 | | 475,000 | | 566,438 |
11.875% 1/15/30 | | 420,000 | | 721,350 |
UK Treasury GILT: | | | | |
3.25% 12/7/11 | GBP | 2,580,000 | | 4,121,872 |
4.25% 12/7/40 | GBP | 1,625,000 | | 2,546,906 |
4.25% 12/7/55 | GBP | 400,000 | | 643,343 |
4.5% 9/7/34 | GBP | 2,700,000 | | 4,397,835 |
4.75% 9/7/15 | GBP | 1,800,000 | | 3,125,127 |
4.75% 3/7/20 | GBP | 1,450,000 | | 2,500,587 |
Ukraine Cabinet of Ministers 6.875% 3/4/11 (Reg. S) | | 2,710,000 | | 2,722,195 |
Ukraine Financing of Infrastructure Projects State Enterprise 8.375% 11/3/17 (f) | | 280,000 | | 294,350 |
Ukraine Government: | | | | |
6.385% 6/26/12 (f) | | 280,000 | | 284,550 |
6.75% 11/14/17 (f) | | 485,000 | | 484,394 |
6.875% 9/23/15 (f) | | 290,000 | | 294,350 |
7.75% 9/23/20 (f) | | 240,000 | | 243,600 |
United Mexican States: | | | | |
4.25% 7/14/17 | EUR | 50,000 | | 66,683 |
Foreign Government and Government Agency Obligations - continued |
| Principal Amount (d) | | Value |
United Mexican States: - continued | | | | |
5.125% 1/15/20 | | $ 160,000 | | $ 166,800 |
5.625% 1/15/17 | | 250,000 | | 275,000 |
5.75% 10/12/10 | | 446,000 | | 394,710 |
6.05% 1/11/40 | | 1,104,000 | | 1,128,840 |
6.75% 9/27/34 | | 510,000 | | 575,025 |
7.5% 4/8/33 | | 235,000 | | 288,463 |
8.3% 8/15/31 | | 225,000 | | 298,125 |
Uruguay Republic: | | | | |
6.875% 9/28/25 | | 140,000 | | 161,000 |
7.875% 1/15/33 pay-in-kind | | 325,000 | | 393,250 |
8% 11/18/22 | | 553,878 | | 685,424 |
Venezuelan Republic: | | | | |
oil recovery rights 4/15/20 (o) | | 646 | | 16,796 |
1.2884% 4/20/11 (Reg. S) (j) | | 2,715,000 | | 2,674,275 |
6% 12/9/20 | | 395,000 | | 230,088 |
7% 3/31/38 | | 310,000 | | 175,150 |
8.5% 10/8/14 | | 445,000 | | 378,250 |
9% 5/7/23 (Reg. S) | | 1,610,000 | | 1,099,630 |
9.25% 9/15/27 | | 1,150,000 | | 856,750 |
9.25% 5/7/28 (Reg. S) | | 350,000 | | 237,125 |
9.375% 1/13/34 | | 575,000 | | 393,875 |
10.75% 9/19/13 | | 525,000 | | 504,000 |
12.75% 8/23/22 | | 1,685,000 | | 1,482,800 |
13.625% 8/15/18 | | 831,000 | | 806,070 |
Vietnamese Socialist Republic: | | | | |
1.2997% 3/12/16 (j) | | 291,739 | | 271,317 |
4% 3/12/28 (e) | | 1,050,000 | | 861,000 |
6.75% 1/29/20 (f) | | 290,000 | | 295,800 |
6.875% 1/15/16 (f) | | 330,000 | | 346,500 |
TOTAL FOREIGN GOVERNMENT AND GOVERNMENT AGENCY OBLIGATIONS (Cost $174,646,620) | 178,309,695 |
Supranational Obligations - 0.0% |
|
Eurasian Development Bank 7.375% 9/29/14 (f)
(Cost $348,798) | | 345,000 | | 372,169 |
Common Stocks - 0.8% |
| Shares | | |
CONSUMER DISCRETIONARY - 0.1% |
Auto Components - 0.0% |
Intermet Corp. (a)(m) | 6,092 | | 0 |
Remy International, Inc. (a) | 2,065 | | 33,040 |
Remy International, Inc. rights
1/18/11 (a) | 4,130 | | 20,650 |
| | 53,690 |
|
| Shares | | Value |
Media - 0.1% |
Haights Cross Communications, Inc. (a) | 107 | | $ 793 |
Haights Cross Communications, Inc. warrants 3/11/13 (a) | 148 | | 409 |
HMH Holdings, Inc. (a)(m) | 177,689 | | 932,867 |
HMH Holdings, Inc. warrants 3/9/17 (a) | 40,350 | | 20,175 |
RDA Holding Co. (a) | 5,224 | | 122,764 |
RDA Holding Co. warrants 2/19/14 (a)(m) | 510 | | 0 |
SuperMedia, Inc. (a) | 455 | | 3,963 |
| | 1,080,971 |
TOTAL CONSUMER DISCRETIONARY | | 1,134,661 |
FINANCIALS - 0.0% |
Diversified Financial Services - 0.0% |
New Penhall Holding Co.: | | | |
Class A (a) | 321 | | 36,113 |
Class B (a) | 107 | | 12,038 |
| | 48,151 |
INDUSTRIALS - 0.2% |
Aerospace & Defense - 0.0% |
Alion Science & Technology Corp. warrants 3/15/17 (a) | 115 | | 575 |
Airlines - 0.1% |
Delta Air Lines, Inc. (a) | 45,088 | | 568,109 |
Building Products - 0.1% |
Nortek, Inc. (a) | 16,991 | | 611,676 |
Nortek, Inc. warrants 12/7/14 (a) | 524 | | 3,668 |
| | 615,344 |
Marine - 0.0% |
US Shipping Partners Corp. (a) | 644 | | 0 |
US Shipping Partners Corp. warrants 12/31/29 (a) | 6,028 | | 0 |
TOTAL INDUSTRIALS | | 1,184,028 |
INFORMATION TECHNOLOGY - 0.0% |
Semiconductors & Semiconductor Equipment - 0.0% |
ASAT Holdings Ltd. warrants 2/1/11 (a)(m) | 27,300 | | 0 |
MagnaChip Semiconductor LLC (a) | 21,347 | | 2,989 |
Spansion, Inc. Class A (a) | 8,988 | | 186,052 |
| | 189,041 |
MATERIALS - 0.5% |
Chemicals - 0.5% |
Celanese Corp. Class A | 378 | | 15,562 |
Chemtura Corp. (a) | 7,820 | | 124,964 |
Georgia Gulf Corp. (a) | 39,526 | | 950,996 |
Common Stocks - continued |
| Shares | | Value |
MATERIALS - continued |
Chemicals - continued |
LyondellBasell Industries NV Class A (a) | 70,459 | | $ 2,423,790 |
Tronox Worldwide LLC/Tronox Worldwide Finance Corp. rights (a) | 1,653 | | 0 |
| | 3,515,312 |
Containers & Packaging - 0.0% |
Constar International, Inc. (a) | 1,700 | | 3,281 |
Metals & Mining - 0.0% |
Aleris International, Inc. (m) | 2,037 | | 107,961 |
Rathgibson Acquisition Co. LLC Class A (a)(m) | 14,800 | | 105,228 |
| | 213,189 |
TOTAL MATERIALS | | 3,731,782 |
UTILITIES - 0.0% |
Electric Utilities - 0.0% |
Portland General Electric Co. | 140 | | 3,038 |
TOTAL COMMON STOCKS (Cost $6,844,480) | 6,290,701 |
Preferred Stocks - 0.4% |
| | | |
Convertible Preferred Stocks - 0.2% |
CONSUMER DISCRETIONARY - 0.2% |
Automobiles - 0.2% |
General Motors Co. 4.75% | 26,900 | | 1,455,559 |
Nonconvertible Preferred Stocks - 0.2% |
FINANCIALS - 0.2% |
Diversified Financial Services - 0.2% |
GMAC LLC 7.00% (f) | 1,572 | | 1,469,820 |
TOTAL PREFERRED STOCKS (Cost $2,181,140) | 2,925,379 |
Floating Rate Loans - 4.5% |
| Principal Amount (d) | | |
CONSUMER DISCRETIONARY - 1.2% |
Auto Components - 0.0% |
Remy International, Inc. Tranche B, term loan 6.25% 12/12/16 (j) | | $ 25,000 | | 25,063 |
Diversified Consumer Services - 0.2% |
ServiceMaster Co.: | | | | |
term loan 2.7746% 7/24/14 (j) | | 398,311 | | 383,375 |
Tranche DD, term loan 2.77% 7/24/14 (j) | | 41,026 | | 39,488 |
|
| Principal Amount (d) | | Value |
Thomson Learning Tranche B, term loan 2.55% 7/5/14 (j) | | $ 802,601 | | $ 756,451 |
Visant Corp. Tranche B, term loan 7% 12/22/16 (j) | | 394,013 | | 397,953 |
| | 1,577,267 |
Hotels, Restaurants & Leisure - 0.1% |
Burger King Corp. Tranche B, term loan 6.25% 10/19/16 (j) | | 375,000 | | 380,625 |
DineEquity, Inc. term loan 6% 10/19/17 (j) | | 450,133 | | 457,448 |
Green Valley Ranch Gaming LLC Tranche 1LN, term loan 2.26% 2/16/14 (c)(j) | | 18,723 | | 14,697 |
Las Vegas Sands LLC: | | | | |
Tranche B, term loan 3.03% 11/23/16 (j) | | 29,424 | | 28,137 |
Tranche I, term loan 3.03% 11/23/16 (j) | | 5,945 | | 5,700 |
OSI Restaurant Partners, Inc.: | | | | |
Credit-Linked Deposit 2.5601% 6/14/13 (j) | | 3,008 | | 2,865 |
term loan 2.625% 6/14/14 (j) | | 29,227 | | 27,839 |
| | 917,311 |
Media - 0.6% |
Charter Communications Operating LLC Tranche B 1LN, term loan 2.27% 3/6/14 (j) | | 753,257 | | 745,725 |
Getty Images, Inc. Tranche B, term loan 5.25% 11/5/16 (j) | | 413,963 | | 418,102 |
Univision Communications, Inc. term loan 4.5106% 3/31/17 (j) | | 3,351,493 | | 3,150,404 |
| | 4,314,231 |
Specialty Retail - 0.3% |
Burlington Coat Factory Warehouse Corp. term loan 2.5301% 5/28/13 (j) | | 421,709 | | 415,384 |
Michaels Stores, Inc.: | | | | |
Tranche B1, term loan 2.5625% 10/31/13 (j) | | 559,373 | | 545,389 |
Tranche B2, term loan 4.8125% 7/31/16 (j) | | 1,468,670 | | 1,468,670 |
PETCO Animal Supplies, Inc. Tranche B, term loan 6% 11/24/17 (j) | | 120,000 | | 120,450 |
| | 2,549,893 |
Textiles, Apparel & Luxury Goods - 0.0% |
Levi Strauss & Co. term loan 2.5106% 4/4/14 (j) | | 100,000 | | 96,500 |
TOTAL CONSUMER DISCRETIONARY | | 9,480,265 |
CONSUMER STAPLES - 0.1% |
Food & Staples Retailing - 0.0% |
The Great Atlantic & Pacific Tea Co. Tranche 2 LN, term loan 8.75% 6/14/12 (j) | | 210,000 | | 212,100 |
Floating Rate Loans - continued |
| Principal Amount (d) | | Value |
CONSUMER STAPLES - continued |
Food Products - 0.0% |
Green Mountain Coffee Roasters, Inc. Tranche B, term loan 5.5% 12/17/16 (j) | | $ 60,000 | | $ 60,000 |
Personal Products - 0.0% |
NBTY, Inc. Tranche B, term loan 6.25% 10/1/17 (j) | | 130,000 | | 131,788 |
Tobacco - 0.1% |
Reynolds Consumer Products Holdings, Inc. term loan: | | | | |
6.25% 8/6/15 (j) | | 235,000 | | 235,000 |
6.5% 5/5/16 (j) | | 170,000 | | 171,700 |
| | 406,700 |
TOTAL CONSUMER STAPLES | | 810,588 |
ENERGY - 0.0% |
Oil, Gas & Consumable Fuels - 0.0% |
Venoco, Inc. Tranche 2LN, term loan 4.3125% 5/7/14 (j) | | 27,224 | | 25,965 |
FINANCIALS - 0.4% |
Diversified Financial Services - 0.1% |
Fifth Third Processing Solutions: | | | | |
Tranche 1 LN, term loan 5.5% 11/3/16 (j) | | 80,000 | | 80,800 |
Tranche 2 LN, term loan 8.25% 11/3/17 (j) | | 20,000 | | 20,475 |
Goodman Global Group, Inc.: | | | | |
Tranche 1 LN, term loan 5.75% 10/28/16 (j) | | 354,113 | | 355,440 |
Tranche 2 LN, term loan 9% 10/28/17 (j) | | 20,000 | | 20,625 |
| | 477,340 |
Insurance - 0.0% |
CNO Financial Group, Inc. Tranche B, term loan 7.5% 9/30/16 (j) | | 120,000 | | 120,900 |
Real Estate Management & Development - 0.3% |
Realogy Corp.: | | | | |
Credit-Linked Deposit 3.2563% 10/10/13 (j) | | 60,327 | | 56,707 |
Tranche 2LN, term loan 13.5% 10/15/17 | | 950,000 | | 1,042,625 |
Tranche B, term loan 3.2857% 10/10/13 (j) | | 442,868 | | 416,296 |
Tranche DD, term loan 3.2844% 10/10/13 (j) | | 1,204,284 | | 1,129,016 |
| | 2,644,644 |
TOTAL FINANCIALS | | 3,242,884 |
|
| Principal Amount (d) | | Value |
HEALTH CARE - 0.1% |
Health Care Providers & Services - 0.1% |
DaVita, Inc. Tranche A, term loan 3.02% 10/20/15 (j) | | $ 220,000 | | $ 220,550 |
Sunquest Information Systems, Inc. Tranche 1 LN, term loan 6.25% 12/16/16 (j) | | 220,000 | | 220,000 |
| | 440,550 |
Pharmaceuticals - 0.0% |
PTS Acquisition Corp. term loan 2.5106% 4/10/14 (j) | | 129,902 | | 124,381 |
TOTAL HEALTH CARE | | 564,931 |
INDUSTRIALS - 0.7% |
Aerospace & Defense - 0.0% |
DeCrane Aircraft Holdings, Inc. Tranche 2LN, term loan 14.25% 2/21/14 (c)(j) | | 14,470 | | 10,455 |
TransDigm Group, Inc. Tranche B, term loan 5% 12/6/16 (j) | | 115,000 | | 115,863 |
| | 126,318 |
Airlines - 0.4% |
Delta Air Lines, Inc.: | | | | |
Tranche 1LN, term loan 8.75% 9/27/13 (j) | | 34,563 | | 34,908 |
Tranche 2LN, term loan 3.5391% 4/30/14 (j) | | 640,369 | | 622,759 |
Northwest Airlines Corp. Tranche A, term loan 2.06% 12/31/18 (j) | | 785,182 | | 690,960 |
United Air Lines, Inc. Tranche B, term loan 2.3125% 2/1/14 (j) | | 783,167 | | 755,756 |
US Airways Group, Inc. term loan 2.7884% 3/23/14 (j) | | 875,068 | | 785,374 |
| | 2,889,757 |
Commercial Services & Supplies - 0.0% |
Brand Energy & Infrastructure Services, Inc. Tranche 2LN, term loan 6.3125% 2/7/15 (j) | | 40,000 | | 36,000 |
Industrial Conglomerates - 0.2% |
Sequa Corp. term loan 3.5413% 12/3/14 (j) | | 929,534 | | 899,324 |
Tomkins PLC Tranche B, term loan 6.25% 9/21/16 (j) | | 833,695 | | 845,158 |
| | 1,744,482 |
Machinery - 0.0% |
Dresser, Inc. Tranche 2LN, term loan 6.0344% 5/4/15 pay-in-kind (j) | | 230,000 | | 229,425 |
Road & Rail - 0.1% |
Swift Transportation Co., Inc. Tranche B, term loan 6.75% 12/21/16 (j) | | 245,000 | | 246,225 |
Floating Rate Loans - continued |
| Principal Amount (d) | | Value |
INDUSTRIALS - continued |
Transportation Infrastructure - 0.0% |
Trico Shipping AS term loan: | | | | |
13.5% 9/21/11 | | $ 30,683 | | $ 30,683 |
13.5% 9/21/11 | | 14,317 | | 14,317 |
| | 45,000 |
TOTAL INDUSTRIALS | | 5,317,207 |
INFORMATION TECHNOLOGY - 0.4% |
Electronic Equipment & Components - 0.1% |
Flextronics International Ltd.: | | | | |
Tranche B A1, term loan 2.5106% 10/1/14 (j) | | 56,655 | | 56,018 |
Tranche B A2, term loan 2.5106% 10/1/14 (j) | | 135,051 | | 133,532 |
Tranche B A3, term loan 2.5075% 10/1/14 (j) | | 157,560 | | 155,787 |
Tranche B-A, term loan 2.5077% 10/1/14 (j) | | 197,159 | | 194,941 |
Tranche B-B, term loan 2.5075% 10/1/12 (j) | | 191,641 | | 190,204 |
| | 730,482 |
Semiconductors & Semiconductor Equipment - 0.2% |
Freescale Semiconductor, Inc. term loan 4.5075% 12/1/16 (j) | | 1,456,734 | | 1,413,032 |
Spansion, Inc. term loan 6.5% 2/9/15 (j) | | 516,186 | | 521,348 |
| | 1,934,380 |
Software - 0.1% |
Kronos, Inc.: | | | | |
Tranche 1LN, term loan 2.0528% 6/11/14 (j) | | 721,825 | | 704,682 |
Tranche 2LN, term loan 6.0528% 6/11/15 (j) | | 125,000 | | 122,188 |
Open Solutions, Inc. term loan 2.415% 1/23/14 (j) | | 19,254 | | 16,269 |
| | 843,139 |
TOTAL INFORMATION TECHNOLOGY | | 3,508,001 |
MATERIALS - 0.3% |
Chemicals - 0.2% |
Arizona Chemical term loan 6.75% 11/18/16 (j) | | 50,000 | | 50,438 |
Momentive Performance Materials, Inc. Tranche B1, term loan 2.5625% 12/4/13 (j) | | 1,415,412 | | 1,378,257 |
| | 1,428,695 |
|
| Principal Amount (d) | | Value |
Containers & Packaging - 0.1% |
Berry Plastics Holding Corp. Tranche C, term loan 2.2843% 4/3/15 (j) | | $ 598,370 | | $ 564,712 |
Paper & Forest Products - 0.0% |
White Birch Paper Co.: | | | | |
term loan 12% 3/1/11 (j) | | 19,555 | | 19,335 |
Tranche 1LN, term loan 7% 5/8/14 (c)(j) | | 94,500 | | 1,418 |
Tranche DD, term loan 6.7163% 3/1/11 (j)(n) | | 6,780 | | 6,704 |
| | 27,457 |
TOTAL MATERIALS | | 2,020,864 |
TELECOMMUNICATION SERVICES - 0.5% |
Wireless Telecommunication Services - 0.5% |
Digicel International Finance Ltd. term loan 2.8125% 3/30/12 (j) | | 1,200,096 | | 1,189,595 |
Intelsat Jackson Holdings Ltd. term loan 3.29% 2/1/14 (j) | | 1,400,000 | | 1,330,000 |
Intelsat Jackson Holdings SA Tranche B, term loan 5.25% 4/2/18 (j) | | 1,535,000 | | 1,531,163 |
| | 4,050,758 |
UTILITIES - 0.8% |
Electric Utilities - 0.8% |
Texas Competitive Electric Holdings Co. LLC/Texas Competitive Electric Holdings Finance, Inc.: | | | | |
Tranche B1, term loan 3.7638% 10/10/14 (j) | | 2,623,882 | | 2,030,229 |
Tranche B2, term loan 3.7638% 10/10/14 (j) | | 2,083,534 | | 1,612,134 |
Tranche B3, term loan 3.7638% 10/10/14 (j) | | 3,327,038 | | 2,565,978 |
| | 6,208,341 |
Independent Power Producers & Energy Traders - 0.0% |
GenOn Energy, Inc. Tranche B, term loan 6% 9/20/17 (j) | | 169,575 | | 170,635 |
TOTAL UTILITIES | | 6,378,976 |
TOTAL FLOATING RATE LOANS (Cost $32,975,081) | 35,400,439 |
Sovereign Loan Participations - 0.1% |
|
Indonesian Republic: | | | | |
loan participation - Citibank 1.25% 12/14/19 (j) | | 441,564 | | 404,031 |
1.25% 12/14/19 (j) | | 175,404 | | 160,495 |
TOTAL SOVEREIGN LOAN PARTICIPATIONS (Cost $496,401) | 564,526 |
Fixed-Income Funds - 2.9% |
| Shares | | Value |
Fidelity Floating Rate Central Fund (k)
(Cost $20,067,436) | 235,391 | | $ 23,496,730 |
Preferred Securities - 0.2% |
| Principal Amount (d) | | |
CONSUMER DISCRETIONARY - 0.2% |
Media - 0.2% |
Net Servicos de Comunicacao SA 9.25% (f) (Cost $1,268,784) | $ 1,300,000 | | 1,321,187 |
Other - 0.0% |
| Shares | | |
Other - 0.0% |
Idearc, Inc. Claim (a) (Cost $1) | 108,228 | | 1 |
Money Market Funds - 4.4% |
| | | |
Fidelity Cash Central Fund, 0.19% (b)
(Cost $34,754,215) | 34,754,215 | | 34,754,215 |
Cash Equivalents - 0.0% |
| Maturity Amount | | |
Investments in repurchase agreements in a joint trading account at 0.2%, dated 12/31/10 due 1/3/11 (Collateralized by U.S. Treasury Obligations) #
(Cost $45,000) | $ 45,001 | | 45,000 |
TOTAL INVESTMENT PORTFOLIO - 99.9% (Cost $762,811,813) | | 791,878,876 |
NET OTHER ASSETS (LIABILITIES) - 0.1% | | 485,808 |
NET ASSETS - 100% | $ 792,364,684 |
Swap Agreements |
| Expiration Date | | Notional Amount | | Value |
Interest Rate Swaps |
Receive quarterly a floating rate based on 3-month LIBOR and pay semi-annually a fixed rate equal to 0.682% with JPMorgan Chase, Inc. | August 2012 | | $ 2,800,000 | | $ (8,272) |
Currency Abbreviations |
ARS | - | Argentine peso |
CAD | - | Canadian dollar |
EUR | - | European Monetary Unit |
GBP | - | British pound |
GHS | - | Ghana Cedi |
JPY | - | Japanese yen |
Legend |
(a) Non-income producing |
(b) Affiliated fund that is available only to investment companies and other accounts managed by Fidelity Investments. The rate quoted is the annualized seven-day yield of the fund at period end. A complete unaudited listing of the fund's holdings as of its most recent quarter end is available upon request. In addition, each Fidelity Central Fund's financial statements, which are not covered by the Fund's Report of Independent Registered Public Accounting Firm, are available on the SEC's website or upon request. |
(c) Non-income producing - Security is in default. |
(d) Principal amount is stated in United States dollars unless otherwise noted. |
(e) Security initially issued at one coupon which converts to a higher coupon at a specified date. The rate shown is the rate at period end. |
(f) Security exempt from registration under Rule 144A of the Securities Act of 1933. These securities may be resold in transactions exempt from registration, normally to qualified institutional buyers. At the end of the period, the value of these securities amounted to $135,830,485 or 17.1% of net assets. |
(g) Under the Temporary Liquidity Guarantee Program, the Federal Deposit Insurance Corporation guarantees principal and interest in the event of payment default or bankruptcy until the earlier of maturity date of the debt or until June 30, 2012. At the end of the period these securities amounted to $14,038,928 or 1.8% of net assets. |
(h) Security or a portion of the security purchased on a delayed delivery or when-issued basis. |
(i) A portion of the security is subject to a forward commitment to sell. |
(j) The coupon rate shown on floating or adjustable rate securities represents the rate at period end. |
(k) Affiliated fund that is available only to investment companies and other accounts managed by Fidelity Investments. A complete unaudited schedule of portfolio holdings for each Fidelity Central Fund is filed with the SEC for the first and third quarters of each fiscal year on Form N-Q and is available upon request or at the SEC's web site at www.sec.gov. An unaudited holdings listing for the Fund, which presents direct holdings as well as the pro rata share of securities and other investments held indirectly through its investment in underlying non-money market Fidelity Central Funds, is available at advisor.fidelity.com. In addition, each Fidelity Central Fund's financial statements, which are not covered by the Fund's Report of Independent Registered Public Accounting Firm, are available on the SEC's web site or upon request. |
(l) Represents an investment in an underlying pool of reverse mortgages which typically do not require regular principal and interest payments as repayment is deferred until a maturity event. |
(m) Restricted securities - Investment in securities not registered under the Securities Act of 1933 (excluding 144A issues). At the end of the period, the value of restricted securities (excluding 144A issues) amounted to $1,146,056 or 0.1% of net assets. |
Additional information on each holding is as follows: |
Security | Acquisition Date | Acquisition Cost |
Aleris International, Inc. | 6/1/10 | $ 71,295 |
ASAT Holdings Ltd. warrants 2/1/11 | 11/15/07 | 0 |
HMH Holdings, Inc. | 5/2/08 - 3/9/10 | 2,728,497 |
Intermet Corp. | 1/7/05 - 1/13/05 | 115,372 |
Rathgibson Acquisition Co. LLC Class A | 6/9/10 | 78,544 |
RDA Holding Co. warrants 2/19/14 | 2/27/07 | 160,000 |
(n) Position or a portion of the position represents an unfunded loan commitment. At period end, the total principal amount and market value of unfunded commitments totaled $3,583 and $3,542, respectively. |
(o) Quantity represents share amount. |
# Additional information on each counterparty to the repurchase agreement is as follows: |
Repurchase Agreement / Counterparty | Value |
$45,000 due 1/3/11 at 0.2% |
BNP Paribas Securities Corp. | $ 5,321 |
Barclays Capital, Inc. | 10,615 |
Citigroup Global Markets, Inc. | 3,425 |
Credit Agricole Securities (USA), Inc. | 6,849 |
Deutsche Bank Securities, Inc. | 1,370 |
HSBC Securities (USA), Inc. | 4,037 |
J.P. Morgan Securities, Inc. | 3,425 |
Merrill Lynch, Pierce, Fenner & Smith, Inc. | 1,027 |
Mizuho Securities USA, Inc. | 5,822 |
RBS Securities, Inc. | 1,911 |
Societe Generale, New York Branch | 856 |
Wells Fargo Securities LLC | 342 |
| $ 45,000 |
Affiliated Central Funds |
Information regarding fiscal year to date income earned by the Fund from investments in Fidelity Central Funds is as follows: |
Fund | Income earned |
Fidelity Cash Central Fund | $ 80,923 |
Fidelity Floating Rate Central Fund | 969,379 |
Total | $ 1,050,302 |
Additional information regarding the Fund's fiscal year to date purchases and sales, including the ownership percentage, of the non Money Market Central Funds is as follows: |
Fund | Value, beginning of period | Purchases | Sales Proceeds | Value,
end of
period | % ownership, end of
period |
Fidelity Floating Rate Central Fund | $ 29,240,589 | $ 4,046,918 | $ 11,501,861 | $ 23,496,730 | 0.8% |
Other Information |
The following is a summary of the inputs used, as of December 31, 2010, involving the Fund's assets and liabilities carried at fair value. The inputs or methodology used for valuing securities may not be an indication of the risk associated with investing in those securities. For more information on valuation inputs, and their aggregation into the levels used in the tables below, please refer to the Security Valuation section in the accompanying Notes to Financial Statements. |
Valuation Inputs at Reporting Date: |
Description | Total | Level 1 | Level 2 | Level 3 |
Investments in Securities: | | | | |
Equities: | | | | |
Consumer Discretionary | $ 2,590,220 | $ 1,492,562 | $ 1,076,281 | $ 21,377 |
Financials | 1,517,971 | - | 1,469,820 | 48,151 |
Industrials | 1,184,028 | 1,183,453 | - | 575 |
Information Technology | 189,041 | 186,052 | - | 2,989 |
Materials | 3,731,782 | 3,518,593 | 107,961 | 105,228 |
Utilities | 3,038 | 3,038 | - | - |
Corporate Bonds | 303,604,267 | - | 303,337,824 | 266,443 |
U.S. Government and Government Agency Obligations | 168,734,927 | - | 168,734,927 | - |
U.S. Government Agency - Mortgage Securities | 19,790,579 | - | 19,790,579 | - |
Collateralized Mortgage Obligations | 16,127,375 | - | 16,127,375 | - |
Commercial Mortgage Securities | 141,686 | - | 141,686 | - |
Foreign Government and Government Agency Obligations | 178,309,695 | - | 178,088,840 | 220,855 |
Supranational Obligations | 372,169 | - | 372,169 | - |
Floating Rate Loans | 35,400,439 | - | 35,400,439 | - |
Sovereign Loan Participations | 564,526 | - | 564,526 | - |
Fixed-Income Funds | 23,496,730 | 23,496,730 | - | - |
Preferred Securities | 1,321,187 | - | 1,321,187 | - |
Other | 1 | - | - | 1 |
Money Market Funds | 34,754,215 | 34,754,215 | - | - |
Cash Equivalents | 45,000 | - | 45,000 | - |
Total Investments in Securities: | $ 791,878,876 | $ 64,634,643 | $ 726,578,614 | $ 665,619 |
Derivative Instruments: | | | | |
Liabilities | | | | |
Swap Agreements | $ (8,272) | $ - | $ (8,272) | $ - |
Other Financial Instruments: | | | | |
Forward Commitments | $ 6,952 | $ - | $ 6,952 | $ - |
The following is a reconciliation of Investments in Securities for which Level 3 inputs were used in determining value: |
Investments in Securities: | |
Beginning Balance | $ 618,112 |
Total Realized Gain (Loss) | (76,292) |
Total Unrealized Gain (Loss) | (26,148) |
Cost of Purchases | 276,168 |
Proceeds of Sales | (706,670) |
Amortization/Accretion | (1,787) |
Transfers in to Level 3 | 1,183,562 |
Transfers out of Level 3 | (601,326) |
Ending Balance | $ 665,619 |
The change in unrealized gain (loss) for the period attributable to Level 3 securities held at December 31, 2010 | $ (124,524) |
The information used in the above reconciliation represents fiscal year to date activity for any Investments in Securities identified as using Level 3 inputs at either the beginning or the end of the current fiscal period. Transfers in or out of Level 3 represent the beginning value of any Security or Instrument where a change in the pricing level occurred from the beginning to the end of the period. The cost of purchases and the proceeds of sales may include securities received or delivered through corporate actions or exchanges. Realized and unrealized gains (losses) disclosed in the reconciliation are included in Net Gain (Loss) on the Fund's Statement of Operations. |
Value of Derivative Instruments |
The following table is a summary of the Fund's value of derivative instruments by risk exposure as of December 31, 2010. For additional information on derivative instruments, please refer to the Derivative Instruments section in the accompanying Notes to Financial Statements. |
Risk Exposure /
Derivative Type | Value |
| Asset | Liability |
Interest Rate Risk | | |
Swap Agreements (a) | $ - | $ (8,272) |
Total Value of Derivatives | $ - | $ (8,272) |
(a) Value is disclosed on the Statement of Assets and Liabilities in the Unrealized Appreciation and Unrealized Depreciation on Swap Agreements line-items. |
Distribution of investments by country of issue, as a percentage of total net assets, is as follows: (Unaudited) |
United States of America | 65.7% |
Germany | 3.8% |
Bermuda | 3.0% |
United Kingdom | 2.9% |
Canada | 2.7% |
Japan | 2.4% |
Italy | 1.9% |
Argentina | 1.9% |
Venezuela | 1.6% |
Luxembourg | 1.5% |
Turkey | 1.4% |
Netherlands | 1.3% |
Russia | 1.3% |
Mexico | 1.1% |
Others (Individually Less Than 1%) | 7.5% |
| 100.0% |
The information in the above table is based on the combined investments of the Fund and its pro-rata share of its investments in each non-money market Fidelity Central Fund. |
See accompanying notes which are an integral part of the financial statements.
Annual Report
Statement of Assets and Liabilities
| December 31, 2010 |
| | |
Assets | | |
Investment in securities, at value (including repurchase agreements of $45,000) - See accompanying schedule: Unaffiliated issuers (cost $707,990,162) | $ 733,627,931 | |
Fidelity Central Funds (cost $54,821,651) | 58,250,945 | |
Total Investments (cost $762,811,813) | | $ 791,878,876 |
Commitment to sell securities on a delayed delivery basis | (1,951,720) | |
Receivable for securities sold on a delayed delivery basis | 1,958,672 | 6,952 |
Cash | | 235,856 |
Foreign currency held at value (cost $4,155) | | 4,191 |
Receivable for investments sold
Regular delivery | | 2,393,727 |
Delayed delivery | | 1,353,091 |
Receivable for fund shares sold | | 754,454 |
Dividends receivable | | 36 |
Interest receivable | | 9,465,228 |
Distributions receivable from Fidelity Central Funds | | 97,480 |
Prepaid expenses | | 1,841 |
Other receivables | | 2,968 |
Total assets | | 806,194,700 |
| | |
Liabilities | | |
Payable for investments purchased
Regular delivery | $ 4,843,526 | |
Delayed delivery | 7,827,373 | |
Payable for fund shares redeemed | 606,216 | |
Unrealized depreciation on swap agreements | 8,272 | |
Accrued management fee | 373,772 | |
Distribution and service plan fees payable | 1,606 | |
Other affiliated payables | 85,976 | |
Other payables and accrued
expenses | 83,275 | |
Total liabilities | | 13,830,016 |
| | |
Net Assets | | $ 792,364,684 |
Net Assets consist of: | | |
Paid in capital | | $ 753,701,831 |
Undistributed net investment income | | 6,863,011 |
Accumulated undistributed net realized gain (loss) on investments and foreign currency transactions | | 2,703,950 |
Net unrealized appreciation (depreciation) on investments and assets and liabilities in foreign
currencies | | 29,095,892 |
Net Assets | | $ 792,364,684 |
Statement of Assets and Liabilities - continued
| December 31, 2010 |
| | |
Initial Class:
Net Asset Value, offering price and redemption price per share ($154,860,681 ÷ 13,632,434 shares) | | $ 11.36 |
| | |
Service Class:
Net Asset Value, offering price and redemption price per share ($1,199,117 ÷ 105,670 shares) | | $ 11.35 |
| | |
Service Class 2:
Net Asset Value, offering price and redemption price per share ($7,599,309 ÷ 670,534 shares) | | $ 11.33 |
| | |
Investor Class:
Net Asset Value, offering price and redemption price per share ($628,705,577 ÷ 55,459,416 shares) | | $ 11.34 |
See accompanying notes which are an integral part of the financial statements.
Annual Report
Statement of Operations
| Year ended December 31, 2010 |
| | |
Investment Income | | |
Dividends | | $ 389,920 |
Interest | | 40,257,982 |
Income from Fidelity Central Funds | | 1,050,302 |
Total income | | 41,698,204 |
| | |
Expenses | | |
Management fee | $ 4,091,291 | |
Transfer agent fees | 722,994 | |
Distribution and service plan fees | 11,985 | |
Accounting fees and expenses | 274,466 | |
Custodian fees and expenses | 88,812 | |
Independent trustees' compensation | 2,530 | |
Audit | 69,937 | |
Legal | 57,936 | |
Miscellaneous | 7,199 | |
Total expenses before reductions | 5,327,150 | |
Expense reductions | (53,198) | 5,273,952 |
Net investment income | | 36,424,252 |
Realized and Unrealized Gain (Loss) Net realized gain (loss) on: | | |
Investment securities: | | |
Unaffiliated issuers | 20,992,543 | |
Fidelity Central Funds | 1,036,185 | |
Foreign currency transactions | (141,787) | |
Swap agreements | (121,285) | |
Total net realized gain (loss) | | 21,765,656 |
Change in net unrealized appreciation (depreciation) on: Investment securities | 6,822,252 | |
Assets and liabilities in foreign currencies | 52,783 | |
Swap agreements | (9,418) | |
Delayed delivery commitments | 6,952 | |
Total change in net unrealized appreciation (depreciation) | | 6,872,569 |
Net gain (loss) | | 28,638,225 |
Net increase (decrease) in net assets resulting from operations | | $ 65,062,477 |
Statement of Changes in Net Assets
| Year ended
December 31, 2010 | Year ended
December 31, 2009 |
Increase (Decrease) in Net Assets | | |
Operations | | |
Net investment income | $ 36,424,252 | $ 27,721,680 |
Net realized gain (loss) | 21,765,656 | 9,689,230 |
Change in net unrealized appreciation (depreciation) | 6,872,569 | 79,239,248 |
Net increase (decrease) in net assets resulting
from operations | 65,062,477 | 116,650,158 |
Distributions to shareholders from net investment income | (33,691,781) | (24,242,970) |
Distributions to shareholders from net realized gain | (19,090,920) | (4,157,194) |
Total distributions | (52,782,701) | (28,400,164) |
Share transactions - net increase (decrease) | 133,480,969 | 219,226,774 |
Total increase (decrease) in net assets | 145,760,745 | 307,476,768 |
| | |
Net Assets | | |
Beginning of period | 646,603,939 | 339,127,171 |
End of period (including undistributed net investment income of $6,863,011 and undistributed net investment income of $4,458,011, respectively) | $ 792,364,684 | $ 646,603,939 |
See accompanying notes which are an integral part of the financial statements.
Annual Report
Financial Highlights - Initial Class
Years ended December 31, | 2010 | 2009 | 2008 | 2007 | 2006 |
Selected Per-Share Data | | | | | |
Net asset value, beginning of period | $ 11.11 | $ 8.94 | $ 10.63 | $ 10.70 | $ 10.40 |
Income from Investment Operations | | | | | |
Net investment incomeC | .588 | .619 | .583 | .600 | .579 |
Net realized and unrealized gain (loss) | .473 | 2.065 | (1.670) | (.007) | .239 |
Total from investment operations | 1.061 | 2.684 | (1.087) | .593 | .818 |
Distributions from net investment income | (.517) | (.439) | (.548) | (.523) | (.493) |
Distributions from net realized gain | (.294) | (.075) | (.055) | (.140) | (.025) |
Total distributions | (.811) | (.514) | (.603) | (.663) | (.518) |
Net asset value, end of period | $ 11.36 | $ 11.11 | $ 8.94 | $ 10.63 | $ 10.70 |
Total ReturnA,B | 9.64% | 30.02% | (10.20)% | 5.59% | 7.87% |
Ratios to Average Net AssetsD,F | | | | | |
Expenses before reductions | .71% | .74% | .73% | .73% | .74% |
Expenses net of fee waivers, if any | .70% | .74% | .73% | .73% | .74% |
Expenses net of all reductions | .70% | .74% | .72% | .73% | .74% |
Net investment income | 5.07% | 5.98% | 5.65% | 5.49% | 5.40% |
Supplemental Data | | | | | |
Net assets, end of period (000 omitted) | $ 154,861 | $ 166,898 | $ 99,114 | $ 119,524 | $ 123,870 |
Portfolio turnover rateE | 208% | 199% | 256% | 152% | 83% |
A Total returns do not reflect charges attributable to your insurance company's separate account. Inclusion of these charges would reduce the total returns shown.
B Total returns would have been lower had certain expenses not been reduced during the periods shown.
C Calculated based on average shares outstanding during the period.
D Fees and expenses of the underlying Fidelity Central Funds are not included in the Fund's expense ratio. The Fund indirectly bears its proportionate share of the expenses of any underlying Fidelity Central Funds.
E Amount does not include the portfolio activity of any underlying Fidelity Central Funds.
F Expense ratios reflect operating expenses of the class. Expenses before reductions do not reflect amounts reimbursed by the investment adviser or reductions from brokerage service arrangements or reductions from other expense offset arrangements and do not represent the amount paid by the class during periods when reimbursements or reductions occur. Expenses net of fee waivers reflect expenses after reimbursement by the investment adviser but prior to reductions from brokerage service arrangements or other expense offset arrangements. Expenses net of all reductions represent the net expenses paid by the class.
Financial Highlights - Service Class
Years ended December 31, | 2010 | 2009 | 2008 | 2007 | 2006 |
Selected Per-Share Data | | | | | |
Net asset value, beginning of period | $ 11.10 | $ 8.92 | $ 10.61 | $ 10.68 | $ 10.38 |
Income from Investment Operations | | | | | |
Net investment incomeC | .574 | .594 | .574 | .588 | .567 |
Net realized and unrealized gain (loss) | .469 | 2.083 | (1.676) | (.005) | .241 |
Total from investment operations | 1.043 | 2.677 | (1.102) | .583 | .808 |
Distributions from net investment income | (.499) | (.422) | (.533) | (.513) | (.483) |
Distributions from net realized gain | (.294) | (.075) | (.055) | (.140) | (.025) |
Total distributions | (.793) | (.497) | (.588) | (.653) | (.508) |
Net asset value, end of period | $ 11.35 | $ 11.10 | $ 8.92 | $ 10.61 | $ 10.68 |
Total ReturnA,B | 9.48% | 30.01% | (10.37)% | 5.51% | 7.78% |
Ratios to Average Net AssetsD,F | | | | | |
Expenses before reductions | .81% | .84% | .82% | .83% | .84% |
Expenses net of fee waivers, if any | .81% | .84% | .82% | .83% | .84% |
Expenses net of all reductions | .81% | .84% | .82% | .82% | .84% |
Net investment income | 4.96% | 5.88% | 5.55% | 5.39% | 5.30% |
Supplemental Data | | | | | |
Net assets, end of period (000 omitted) | $ 1,199 | $ 1,898 | $ 2,644 | $ 4,445 | $ 4,211 |
Portfolio turnover rateE | 208% | 199% | 256% | 152% | 83% |
A Total returns do not reflect charges attributable to your insurance company's separate account. Inclusion of these charges would reduce the total returns shown.
B Total returns would have been lower had certain expenses not been reduced during the periods shown.
C Calculated based on average shares outstanding during the period.
D Fees and expenses of the underlying Fidelity Central Funds are not included in the Fund's expense ratio. The Fund indirectly bears its proportionate share of the expenses of any underlying Fidelity Central Funds.
E Amount does not include the portfolio activity of any underlying Fidelity Central Funds.
F Expense ratios reflect operating expenses of the class. Expenses before reductions do not reflect amounts reimbursed by the investment adviser or reductions from brokerage service arrangements or reductions from other expense offset arrangements and do not represent the amount paid by the class during periods when reimbursements or reductions occur. Expenses net of fee waivers reflect expenses after reimbursement by the investment adviser but prior to reductions from brokerage service arrangements or other expense offset arrangements. Expenses net of all reductions represent the net expenses paid by the class.
See accompanying notes which are an integral part of the financial statements.
Annual Report
Financial Highlights - Service Class 2
Years ended December 31, | 2010 | 2009 | 2008 | 2007 | 2006 |
Selected Per-Share Data | | | | | |
Net asset value, beginning of period | $ 11.11 | $ 8.92 | $ 10.61 | $ 10.67 | $ 10.38 |
Income from Investment Operations | | | | | |
Net investment incomeC | .560 | .578 | .558 | .571 | .551 |
Net realized and unrealized gain (loss) | .457 | 2.087 | (1.680) | .005 | .232 |
Total from investment operations | 1.017 | 2.665 | (1.122) | .576 | .783 |
Distributions from net investment income | (.503) | (.400) | (.513) | (.496) | (.468) |
Distributions from net realized gain | (.294) | (.075) | (.055) | (.140) | (.025) |
Total distributions | (.797) | (.475) | (.568) | (.636) | (.493) |
Net asset value, end of period | $ 11.33 | $ 11.11 | $ 8.92 | $ 10.61 | $ 10.67 |
Total ReturnA,B | 9.23% | 29.88% | (10.56)% | 5.45% | 7.54% |
Ratios to Average Net AssetsD,F | | | | | |
Expenses before reductions | .97% | .99% | .98% | .98% | .99% |
Expenses net of fee waivers, if any | .96% | .99% | .98% | .98% | .99% |
Expenses net of all reductions | .96% | .99% | .97% | .97% | .99% |
Net investment income | 4.81% | 5.72% | 5.40% | 5.24% | 5.15% |
Supplemental Data | | | | | |
Net assets, end of period (000 omitted) | $ 7,599 | $ 1,918 | $ 2,625 | $ 4,418 | $ 4,192 |
Portfolio turnover rateE | 208% | 199% | 256% | 152% | 83% |
A Total returns do not reflect charges attributable to your insurance company's separate account. Inclusion of these charges would reduce the total returns shown.
B Total returns would have been lower had certain expenses not been reduced during the periods shown.
C Calculated based on average shares outstanding during the period.
D Fees and expenses of the underlying Fidelity Central Funds are not included in the Fund's expense ratio. The Fund indirectly bears its proportionate share of the expenses of any underlying Fidelity Central Funds.
E Amount does not include the portfolio activity of any underlying Fidelity Central Funds.
F Expense ratios reflect operating expenses of the class. Expenses before reductions do not reflect amounts reimbursed by the investment adviser or reductions from brokerage service arrangements or reductions from other expense offset arrangements and do not represent the amount paid by the class during periods when reimbursements or reductions occur. Expenses net of fee waivers reflect expenses after reimbursement by the investment adviser but prior to reductions from brokerage service arrangements or other expense offset arrangements. Expenses net of all reductions represent the net expenses paid by the class.
Financial Highlights - Investor Class
Years ended December 31, | 2010 | 2009 | 2008 | 2007 | 2006 |
Selected Per-Share Data | | | | | |
Net asset value, beginning of period | $ 11.09 | $ 8.92 | $ 10.62 | $ 10.69 | $ 10.39 |
Income from Investment Operations | | | | | |
Net investment incomeC | .584 | .617 | .577 | .591 | .570 |
Net realized and unrealized gain (loss) | .474 | 2.065 | (1.677) | (.003) | .246 |
Total from investment operations | 1.058 | 2.682 | (1.100) | .588 | .816 |
Distributions from net investment income | (.514) | (.437) | (.545) | (.518) | (.491) |
Distributions from net realized gain | (.294) | (.075) | (.055) | (.140) | (.025) |
Total distributions | (.808) | (.512) | (.600) | (.658) | (.516) |
Net asset value, end of period | $ 11.34 | $ 11.09 | $ 8.92 | $ 10.62 | $ 10.69 |
Total ReturnA,B | 9.63% | 30.06% | (10.34)% | 5.55% | 7.85% |
Ratios to Average Net AssetsD,F | | | | | |
Expenses before reductions | .74% | .77% | .76% | .80% | .82% |
Expenses net of fee waivers, if any | .74% | .77% | .76% | .80% | .82% |
Expenses net of all reductions | .74% | .77% | .76% | .80% | .82% |
Net investment income | 5.03% | 5.95% | 5.61% | 5.41% | 5.32% |
Supplemental Data | | | | | |
Net assets, end of period (000 omitted) | $ 628,706 | $ 475,890 | $ 234,744 | $ 228,628 | $ 104,283 |
Portfolio turnover rateE | 208% | 199% | 256% | 152% | 83% |
A Total returns do not reflect charges attributable to your insurance company's separate account. Inclusion of these charges would reduce the total returns shown.
B Total returns would have been lower had certain expenses not been reduced during the periods shown.
C Calculated based on average shares outstanding during the period.
D Fees and expenses of the underlying Fidelity Central Funds are not included in the Fund's expense ratio. The Fund indirectly bears its proportionate share of the expenses of any underlying Fidelity Central Funds.
E Amount does not include the portfolio activity of any underlying Fidelity Central Funds.
F Expense ratios reflect operating expenses of the class. Expenses before reductions do not reflect amounts reimbursed by the investment adviser or reductions from brokerage service arrangements or reductions from other expense offset arrangements and do not represent the amount paid by the class during periods when reimbursements or reductions occur. Expenses net of fee waivers reflect expenses after reimbursement by the investment adviser but prior to reductions from brokerage service arrangements or other expense offset arrangements. Expenses net of all reductions represent the net expenses paid by the class.
See accompanying notes which are an integral part of the financial statements.
Annual Report
Notes to Financial Statements
For the period ended December 31, 2010
1. Organization.
VIP Strategic Income Portfolio (the Fund) is a fund of Variable Insurance Products Fund V (the Trust) and is authorized to issue an unlimited number of shares. The Trust is registered under the Investment Company Act of 1940, as amended (the 1940 Act), as an open-end management investment company organized as a Massachusetts business trust. Shares of the Fund may only be purchased by insurance companies for the purpose of funding variable annuity or variable life insurance contracts. The Fund offers the following classes of shares: Initial Class shares, Service Class shares, Service Class 2 shares, and Investor Class shares. All classes have equal rights and voting privileges, except for matters affecting a single class. Investment income, realized and unrealized capital gains and losses, the common expenses of the Fund, and certain fund-level expense reductions, if any, are allocated on a pro-rata basis to each class based on the relative net assets of each class to the total net assets of the Fund. Each class differs with respect to transfer agent and distribution and service plan fees incurred. Certain expense reductions may also differ by class.
2. Investments in Fidelity Central Funds.
The Fund may invest in Fidelity Central Funds, which are open-end investment companies available only to other investment companies and accounts managed by Fidelity Management & Research Company (FMR) and its affiliates. The Fund's Schedule of Investments lists each of the Fidelity Central Funds held as of period end, if any, as an investment of the Fund, but does not include the underlying holdings of each Fidelity Central Fund. As an Investing Fund, the Fund indirectly bears its proportionate share of the expenses of the underlying Fidelity Central Funds.
Based on their investment objective, each Fidelity Central Fund may invest or participate in various investment vehicles or strategies that are similar to those of the Fund. These strategies are consistent with the investment objectives of the Fund and may involve certain economic risks which may cause a decline in value of each of the Fidelity Central Funds and thus a decline in the value of the Fund. The Money Market Central Funds seek preservation of capital and current income and are managed by Fidelity Investments Money Management, Inc. (FIMM), an affiliate of FMR. The following summarizes the Fund's investment in each Fidelity Central Fund.
Fidelity Central Fund | Investment Manager | Investment Objective | Investment Practices |
Fidelity Floating Rate Central Fund | FMR Co., Inc. (FMRC) | Seeks a high level of income by normally investing in floating rate loans and other floating rate securities. | Loans & Direct Debt Instruments Repurchase Agreements Restricted Securities |
An unaudited holdings listing for the Fund, which presents direct holdings as well as the pro-rata share of any securities and other investments held indirectly through its investment in underlying non-money market Fidelity Central Funds, is available at advisor.fidelity.com. A complete unaudited list of holdings for each Fidelity Central Fund is available upon request or at the Securities and Exchange Commission (the SEC) web site at www.sec.gov. In addition, the financial statements of the Fidelity Central Funds which contain the significant accounting policies (including security valuation policies) of those funds, which are not covered by the Fund's Report of Independent Registered Public Accounting Firm, are available on the SEC web site or upon request.
3. Significant Accounting Policies.
The financial statements have been prepared in conformity with accounting principles generally accepted in the United States of America (GAAP), which require management to make certain estimates and assumptions at the date of the financial statements. Actual results could differ from those estimates. Subsequent events, if any, through the date that the financial statements were issued have been evaluated in the preparation of the financial statements. The following summarizes the significant accounting policies of the Fund:
Security Valuation. Investments are valued as of 4:00 p.m. Eastern time on the last calendar day of the period. The Fund uses independent pricing services approved by the Board of Trustees to value its investments. When current market prices or quotations are not readily available or reliable, valuations may be determined in good faith in accordance with procedures adopted by the Board of Trustees. Factors used in determining value may include market or security specific events, changes in interest rates and credit quality. The frequency with which these procedures are used cannot be predicted and they may be utilized to a significant extent. The value used for net asset value (NAV) calculation under these procedures may differ from published prices for the same securities.
The Fund categorizes the inputs to valuation techniques used to value its investments into a disclosure hierarchy consisting of three levels as shown below.
Level 1 - quoted prices in active markets for identical investments
Level 2 - other significant observable inputs (including quoted prices for similar investments, interest rates, prepayment speeds, etc.)
Level 3 - unobservable inputs (including the Fund's own assumptions based on the best information available)
Annual Report
Notes to Financial Statements - continued
3. Significant Accounting Policies - continued
Security Valuation - continued
Changes in valuation techniques may result in transfers in or out of an assigned level within the disclosure hierarchy. The aggregate value of investments by input level, as of December 31, 2010 for the Fund's investments, as well as a roll forward of Level 3 securities, is included at the end of the Fund's Schedule of Investments. Valuation techniques used to value the Fund's investments by major category are as follows.
Debt securities, including restricted securities, are valued based on evaluated prices received from independent pricing services or from dealers who make markets in such securities. For corporate bonds, floating rate loans, foreign government and government agency obligations, preferred securities, supranational obligations and U.S. government and government agency obligations, pricing services utilize matrix pricing which considers yield or price of bonds of comparable quality, coupon, maturity and type as well as dealer supplied prices and are generally categorized as Level 2 in the hierarchy. For collateralized mortgage obligations, commercial mortgage securities and U.S. government agency mortgage securities, pricing services utilize matrix pricing which considers prepayment speed assumptions, attributes of the collateral, yield or price of bonds of comparable quality, coupon, maturity and type as well as dealer supplied prices and, accordingly, such securities are generally categorized as Level 2 in the hierarchy. Short-term securities with remaining maturities of sixty days or less for which quotations are not readily available are valued at amortized cost, which approximates fair value and are categorized as Level 2 in the hierarchy. The Fund invests a significant portion of its assets in below investment grade securities. The value of these securities can be more volatile due to changes in the credit quality of the issuer and is sensitive to changes in economic, market and regulatory conditions.
Swaps are marked-to-market daily based on valuations from independent pricing services or dealer-supplied valuations and changes in value are recorded as unrealized appreciation (depreciation). Pricing services utilize matrix pricing which considers comparisons to interest rate curves, credit spread curves, default possibilities and recovery rates and, as a result, swaps are generally categorized as Level 2 in the hierarchy.
When independent prices are unavailable or unreliable, debt securities and swaps may be valued utilizing pricing matrices which consider similar factors that would be used by independent pricing services. These are generally categorized as Level 2 in the hierarchy but may be Level 3 depending on the circumstances.
Equity securities, including restricted securities, for which market quotations are readily available, are valued at the last reported sale price or official closing price as reported by an independent pricing service on the primary market or exchange on which they are traded and are categorized as Level 1 in the hierarchy. In the event there were no sales during the day or closing prices are not available, securities are valued at the last quoted bid price or may be valued using the last available price and are generally categorized as Level 2 in the hierarchy. Utilizing these techniques may result in transfers between Level 1 and Level 2. For restricted securities and private placements where observable inputs are limited, assumptions about market activity and risk are used and are categorized as Level 3 in the hierarchy.
Investments in open-end mutual funds, including the Fidelity Central Funds, are valued at their closing net asset value each business day and are categorized as Level 1 in the hierarchy.
Foreign Currency. The Fund uses foreign currency contracts to facilitate transactions in foreign-denominated securities. Gains and losses from these transactions may arise from changes in the value of the foreign currency or if the counterparties do not perform under the contracts' terms.
Foreign-denominated assets, including investment securities, and liabilities are translated into U.S. dollars at the exchange rate at period end. Purchases and sales of investment securities, income and dividends received and expenses denominated in foreign currencies are translated into U.S. dollars at the exchange rate in effect on the transaction date.
The effects of exchange rate fluctuations on investments are included with the net realized and unrealized gain (loss) on investment securities. Other foreign currency transactions resulting in realized and unrealized gain (loss) are disclosed separately.
Investment Transactions and Income. For financial reporting purposes, the Fund's investment holdings and NAV include trades executed through the end of the last business day of the period. The NAV per share for processing shareholder transactions is calculated as of the close of business of the New York Stock Exchange (NYSE), normally 4:00 p.m. Eastern time and includes trades executed through the end of the prior business day. Gains and losses on securities sold are determined on the basis of identified cost. Dividend income is recorded on the ex-dividend date, except for certain dividends from foreign securities where the ex-dividend date may have passed, which are recorded as soon as the Fund is informed of the ex-dividend date. Non-cash dividends included in dividend income, if any, are recorded at the fair market value of the securities received. Distributions received on securities that represent a return of capital or capital gain are recorded as a reduction of cost of investments and/or as a realized gain. The Fund estimates the components of distributions received that may be considered return of capital distributions or capital gain distributions. Interest income and distributions from the Fidelity Central Funds are accrued as earned. Interest income includes coupon interest and amortization of premium and accretion of discount on debt securities. Inflation-indexed bonds are fixed-income securities whose principal value is periodically adjusted to the rate of inflation. Interest is accrued based on the principal value, which is adjusted for inflation. The adjustments to principal due to inflation are reflected as increases or decreases to interest income even though principal is not received until maturity. Investment income is recorded net of foreign taxes
Annual Report
3. Significant Accounting Policies - continued
Investment Transactions and Income - continued
withheld where recovery of such taxes is uncertain. Debt obligations may be placed on non-accrual status and related interest income may be reduced by ceasing current accruals and writing off interest receivables when the collection of all or a portion of interest has become doubtful based on consistently applied procedures. A debt obligation is removed from non-accrual status when the issuer resumes interest payments or when collectability of interest is reasonably assured.
Expenses. Expenses directly attributable to a fund are charged to that fund. Expenses attributable to more than one fund are allocated among the respective funds on the basis of relative net assets or other appropriate methods. Expense estimates are accrued in the period to which they relate and adjustments are made when actual amounts are known.
Income Tax Information and Distributions to Shareholders. Each year the Fund intends to qualify as a regulated investment company, including distributing substantially all of its taxable income and realized gains under Subchapter M of the Internal Revenue Code and filing its U.S. federal tax return. As a result, no provision for income taxes is required. As of December 31, 2010, the Fund did not have any unrecognized tax benefits in the accompanying financial statements. A fund's federal tax return is subject to examination by the Internal Revenue Service (IRS) for a period of three years. Foreign taxes are provided for based on the Fund's understanding of the tax rules and rates that exist in the foreign markets in which it invests.
Distributions are declared and recorded on the ex-dividend date. Income dividends and capital gain distributions are declared separately for each class. Income and capital gain distributions are determined in accordance with income tax regulations, which may differ from GAAP.
Capital accounts within the financial statements are adjusted for permanent book-tax differences. These adjustments have no impact on net assets or the results of operations. Temporary book-tax differences will reverse in a subsequent period.
Book-tax differences are primarily due to swap agreements, foreign currency transactions, market discount, defaulted bonds, partnerships (including allocations from Fidelity Central Funds), and losses deferred due to wash sales and excise tax regulations.
The federal tax cost of investment securities and unrealized appreciation (depreciation) as of period end were as follows:
Gross unrealized appreciation | $ 49,837,307 |
Gross unrealized depreciation | (15,461,644) |
Net unrealized appreciation (depreciation) | $ 34,375,663 |
| |
Tax Cost | $ 757,503,213 |
The tax-based components of distributable earnings as of period end were as follows:
Undistributed ordinary income | $ 326,650 |
Undistributed long-term capital gain | $ 3,936,876 |
Net unrealized appreciation (depreciation) | $ 34,401,250 |
The tax character of distributions paid was as follows:
| December 31, 2010 | December 31, 2009 |
Ordinary Income | $ 44,269,286 | $ 28,400,164 |
Long-term Capital Gains | 8,513,415 | - |
Total | $ 52,782,701 | $ 28,400,164 |
4. Operating Policies.
Repurchase Agreements. FMR has received an Exemptive Order from the SEC which permits the Fund and other affiliated entities of FMR to transfer uninvested cash balances into joint trading accounts which are then invested in repurchase agreements. The Fund may also invest directly with institutions in repurchase agreements. Repurchase agreements are collateralized by government or non-government securities. Upon settlement date, collateral is held in segregated accounts with custodian banks and may be obtained in the event of a default of the counterparty. The Fund monitors, on a daily basis, the value of the collateral to ensure it is at least equal to the principal amount of the repurchase agreement (including accrued interest). In the event of a default by the counterparty, realization of the collateral proceeds could be delayed, during which time the value of the collateral may decline.
Annual Report
Notes to Financial Statements - continued
4. Operating Policies - contined
Delayed Delivery Transactions and When-Issued Securities. The Fund may purchase or sell securities on a delayed delivery or when-issued basis. Payment and delivery may take place after the customary settlement period for that security. The price of the underlying securities and the date when the securities will be delivered and paid for are fixed at the time the transaction is negotiated. During the time a delayed delivery sell is outstanding, the contract is marked-to-market daily and equivalent deliverable securities are held for the transaction. The securities purchased on a delayed delivery or when-issued basis are identified as such in the Fund's Schedule of Investments. The Fund may receive compensation for interest forgone in the purchase of a delayed delivery or when-issued security. With respect to purchase commitments, the Fund identifies securities as segregated in its records with a value at least equal to the amount of the commitment. Losses may arise due to changes in the value of the underlying securities or if the counterparty does not perform under the contract's terms, or if the issuer does not issue the securities due to political, economic, or other factors.
Restricted Securities. The Fund may invest in securities that are subject to legal or contractual restrictions on resale. These securities generally may be resold in transactions exempt from registration or to the public if the securities are registered. Disposal of these securities may involve time-consuming negotiations and expense, and prompt sale at an acceptable price may be difficult. Information regarding restricted securities is included at the end of the Fund's Schedule of Investments.
Loans and Other Direct Debt Instruments. The Fund may invest in loans and loan participations, trade claims or other receivables. These investments may include standby financing commitments, including revolving credit facilities, that obligate the Fund to supply additional cash to the borrower on demand. Loan participations involve a risk of insolvency of the lending bank or other financial intermediary. The Fund may be contractually obligated to receive approval from the agent bank and/or borrower prior to the sale of these investments.
5. Derivative Instruments.
Risk Exposures and the Use of Derivative Instruments. The Fund uses derivative instruments (derivatives), including swap agreements, in order to meet its investment objectives. The strategy is to use derivatives to increase returns, to gain exposure to certain types of assets and to manage exposure to certain risks as defined below. The success of any strategy involving derivatives depends on analysis of numerous economic factors, and if the strategies for investment do not work as intended, the Fund may not achieve its objectives.
The Fund's use of derivatives may increase or decrease its exposure to the following risk:
Interest Rate Risk | Interest rate risk relates to the fluctuations in the value of interest-bearing securities due to changes in the prevailing levels of market interest rates. |
The Fund is also exposed to additional risks from investing in derivatives, such as liquidity risk and counterparty credit risk. Liquidity risk is the risk that the Fund will be unable to sell the derivative in the open market in a timely manner. Counterparty credit risk is the risk that the counterparty will not be able to fulfill its obligation to the Fund. Derivative counterparty credit risk is managed through formal evaluation of the creditworthiness of all potential counterparties. On certain over-the-counter derivatives, the Fund attempts to reduce its exposure to counterparty credit risk by entering into an International Swaps and Derivatives Association (ISDA) Master Agreement on a bilateral basis with each of its counterparties. The ISDA Master Agreement gives each counterparty the right to terminate all transactions traded under such agreement if there is a certain deterioration in the credit quality of the other party. The ISDA Master Agreement gives the Fund the right, upon an event of default by the applicable counterparty or a termination of the agreement, to close out all transactions traded under such agreement and to net amounts owed under each transaction to one net payable by one party to the other. To mitigate counterparty credit risk, the Fund offsets certain payables and/or receivables with collateral. Collateral, in the form of cash or securities, may be required to be held in segregated accounts with the Fund's custodian bank in accordance with the collateral agreements entered into between the Fund, the swap counterparty and the Fund's custodian bank and, if required, is identified in the Schedule of Investments. The Fund could experience delays and costs in gaining access to the collateral even though it is held by the Fund's custodian bank. The Fund's maximum risk of loss from counterparty credit risk is generally the aggregate unrealized appreciation and unpaid counterparty fees in excess of any collateral pledged by the counterparty to the Fund. Risk of loss may exceed the amounts recognized in the Statement of Assets and Liabilities.
Net Realized Gain (Loss) and Change in Net Unrealized Appreciation (Depreciation) on Derivatives. The table below, which reflects the impacts of derivatives on the financial performance of the Fund, summarizes the net realized gain (loss) and change in net unrealized appreciation (depreciation) for derivatives during the period.
Risk Exposure / Derivative Type | Net Realized Gain (Loss) | Change in Net Unrealized Appreciation (Depreciation) |
Interest Rate Risk | | |
Swap Agreements | $ (121,285) | $ (9,418) |
Totals (a) | $ (121,285) | $ (9,418) |
(a) A summary of the value of derivatives by risk exposure as of period end, if any, is included at the end of the Schedule of Investments and is representative of activity for the period.
Annual Report
5. Derivative Instruments - continued
Swap Agreements. A swap agreement (swap) is a contract between two parties to exchange future cash flows at periodic intervals based on a notional principal amount.
Details of swaps open at period end are included in the Schedule of Investments under the caption "Swap Agreements." Swaps are marked-to-market daily and changes in value are recorded as unrealized appreciation or (depreciation) and reflected in the Statement of Assets and Liabilities. Any upfront payments made or received upon entering a swap to compensate for differences between stated terms of the agreement and prevailing market conditions (e.g. credit spreads, interest rates or other factors) are recorded as realized gain or (loss) ratably over the term of the swap. Payments are exchanged at specified intervals, accrued daily commencing with the effective date of the contract and recorded as realized gain or (loss). Realized gain or (loss) is also recorded in the event of an early termination of a swap. The net realized gain (loss) and change in net unrealized appreciation (depreciation) on swaps during the period is included in the Statement of Operations.
Risks of loss may include interest rate risk. In addition, there is the risk of failure by the counterparty to perform under the terms of the agreement and lack of liquidity in the market.
Interest Rate Swaps. Interest rate swaps are agreements between counterparties to exchange cash flows, one based on a fixed rate, and the other on a floating rate. The Fund entered into interest rate swaps to manage its exposure to interest rate changes. Changes in interest rates can have an effect on both the value of bond holdings as well as the amount of interest income earned. In general, the value of bonds can fall when interest rates rise and can rise when interest rates fall.
6. Purchases and Sales of Investments.
Purchases and sales of securities (including the Fixed-Income Central Funds), other than short-term securities and U.S. government securities, aggregated $975,830,049 and $877,691,197, respectively.
7. Fees and Other Transactions with Affiliates.
Management Fee. FMR and its affiliates provide the Fund with investment management related services for which the Fund pays a monthly management fee. The management fee is the sum of an individual fund fee rate that is based on an annual rate of .45% of the Fund's average net assets and a group fee rate that averaged .12% during the period. The group fee rate is based upon the average net assets of all the mutual funds advised by FMR. The group fee rate decreases as assets under management increase and increases as assets under management decrease. For the period, the total annual management fee rate was .57% of the Fund's average net assets.
Distribution and Service Plan Fees. In accordance with Rule 12b-1 of the 1940 Act, the Fund has adopted separate 12b-1 Plans for each Service Class of shares. Each Service Class pays Fidelity Distributors Corporation (FDC), an affiliate of FMR, a service fee. For the period, the service fee is based on an annual rate of .10% of Service Class' average net assets and .25% of Service Class 2's average net assets.
For the period, total fees, all of which were re-allowed to insurance companies for the distribution of shares and providing shareholder support services were as follows:
Service Class | $ 1,576 |
Service Class 2 | 10,409 |
| $ 11,985 |
Transfer Agent Fees. Fidelity Investments Institutional Operations Company, Inc. (FIIOC), an affiliate of FMR, is the Fund's transfer, dividend disbursing, and shareholder servicing agent. FIIOC receives an asset-based fee with respect to each class. Each class (with the exception of Investor Class) pays a transfer agent fee, excluding out of pocket expenses, equal to an annual rate of .07% of average net assets. Investor Class pays a monthly asset-based transfer agent fee of .10% of average net assets. In addition, FIIOC receives an asset-based fee of .01% of average net assets for typesetting, printing and mailing of shareholder reports, except proxy statements. FIIOC has agreed to voluntarily waive this fee until December 31, 2010. (See Note 9: Expense Reductions.) For the period, transfer agent fees for each class, including printing and out of pocket expenses, were as follows:
Initial Class | $ 123,286 |
Service Class | 1,213 |
Service Class 2 | 3,566 |
Investor Class | 594,929 |
| $ 722,994 |
Accounting Fees. Fidelity Service Company, Inc. (FSC), an affiliate of FMR, maintains the Fund's accounting records. The fee is based on the level of average net assets for the month.
Annual Report
Notes to Financial Statements - continued
8. Committed Line of Credit.
The Fund participates with other funds managed by FMR or an affiliate in a $3.75 billion credit facility (the "line of credit") to be utilized for temporary or emergency purposes to fund shareholder redemptions or for other short-term liquidity purposes. The Fund has agreed to pay commitment fees on its pro-rata portion of the line of credit, which amounted to $2,664 and is reflected in Miscellaneous expenses on the Statement of Operations. During the period, there were no borrowings on this line of credit.
9. Expense Reductions.
FMR or its affiliates agreed to waive certain fees during the period as noted in the table below.
Initial Class | $ 11,906 |
Service Class | 114 |
Service Class 2 | 303 |
Investor Class | 40,053 |
Total | $ 52,376 |
Many of the brokers with whom FMR places trades on behalf of the Fund provided services to the Fund in addition to trade execution. These services included payments of certain expenses on behalf of the Fund totaling $241 for the period. In addition, through arrangements with the Fund's custodian, credits realized as a result of uninvested cash balances were used to reduce the Fund's expenses. During the period, these credits reduced the Fund's custody expenses by $581.
10. Distributions to Shareholders.
Distributions to shareholders of each class were as follows:
Years ended December 31, | 2010 | 2009 |
From net investment income | | |
Initial Class | $ 6,766,582 | $ 6,342,757 |
Service Class | 51,899 | 69,077 |
Service Class 2 | 304,388 | 65,395 |
Investor Class | 26,568,912 | 17,765,741 |
Total | $ 33,691,781 | $ 24,242,970 |
From net realized gain | | |
Initial Class | $ 3,891,605 | $ 1,083,615 |
Service Class | 32,045 | 12,277 |
Service Class 2 | 167,108 | 12,262 |
Investor Class | 15,000,162 | 3,049,040 |
Total | $ 19,090,920 | $ 4,157,194 |
11. Share Transactions.
Transactions for each class of shares were as follows:
| Shares | Dollars |
Years ended December 31, | 2010 | 2009 | 2010 | 2009 |
Initial Class | | | | |
Shares sold | 1,592,340 | 5,096,428 | $ 18,469,325 | $ 53,470,698 |
Reinvestment of distributions | 947,149 | 667,839 | 10,658,187 | 7,426,372 |
Shares redeemed | (3,923,967) | (1,836,732) | (45,593,051) | (18,480,857) |
Net increase (decrease) | (1,384,478) | 3,927,535 | $ (16,465,539) | $ 42,416,213 |
Service Class | | | | |
Shares sold | - | - | $ - | $ - |
Reinvestment of distributions | 7,469 | 7,329 | 83,944 | 81,354 |
Shares redeemed | (72,817) | (132,635) | (841,352) | (1,343,103) |
Net increase (decrease) | (65,348) | (125,306) | $ (757,408) | $ (1,261,749) |
Annual Report
11. Share Transactions - continued
| Shares | Dollars |
Years ended December 31, | 2010 | 2009 | 2010 | 2009 |
Service Class 2 | | | | |
Shares sold | 652,109 | 3,999 | $ 7,619,023 | $ 41,527 |
Reinvestment of distributions | 41,955 | 6,990 | 471,497 | 77,657 |
Shares redeemed | (196,258) | (132,446) | (2,309,986) | (1,340,594) |
Net increase (decrease) | 497,806 | (121,457) | $ 5,780,534 | $ (1,221,410) |
Investor Class | | | | |
Shares sold | 12,462,396 | 15,870,689 | $ 145,050,130 | $ 169,218,058 |
Reinvestment of distributions | 3,700,172 | 1,875,205 | 41,569,073 | 20,814,781 |
Shares redeemed | (3,601,394) | (1,154,414) | (41,695,821) | (10,739,119) |
Net increase (decrease) | 12,561,174 | 16,591,480 | $ 144,923,382 | $ 179,293,720 |
12. Other.
The Fund's organizational documents provide former and current trustees and officers with a limited indemnification against liabilities arising in connection with the performance of their duties to the Fund. In the normal course of business, the Fund may also enter into contracts that provide general indemnifications. The Fund's maximum exposure under these arrangements is unknown as this would be dependent on future claims that may be made against the Fund. The risk of material loss from such claims is considered remote.
At the end of the period, FMR or its affiliates were the owners of record of 99% of the total outstanding shares of the Fund.
13. Credit Risk.
The Fund's relatively large investment in countries with limited or developing capital markets may involve greater risks than investments in more developed markets and the prices of such investments may be volatile. The yields of emerging market debt obligations reflect, among other things, perceived credit risk. The consequences of political, social or economic changes in these markets may have disruptive effects on the market prices of the Fund's investments and the income they generate, as well as the Fund's ability to repatriate such amounts.
Annual Report
Report of Independent Registered Public Accounting Firm
To the Trustees of Variable Insurance Products Fund V and the Shareholders of VIP Strategic Income Portfolio:
In our opinion, the accompanying statement of assets and liabilities, including the schedule of investments, and the related statements of operations and of changes in net assets and the financial highlights present fairly, in all material respects, the financial position of VIP Strategic Income Portfolio (a fund of Variable Insurance Products Fund V) at December 31, 2010, the results of its operations for the year then ended, the changes in its net assets for each of the two years in the period then ended and the financial highlights for each of the five years in the period then ended, in conformity with accounting principles generally accepted in the United States of America. These financial statements and financial highlights (hereafter referred to as "financial statements") are the responsibility of the VIP Strategic Income Portfolio's management. Our responsibility is to express an opinion on these financial statements based on our audits. We conducted our audits of these financial statements in accordance with the standards of the Public Company Accounting Oversight Board (United States). Those standards require that we plan and perform the audit to obtain reasonable assurance about whether the financial statements are free of material misstatement. An audit includes examining, on a test basis, evidence supporting the amounts and disclosures in the financial statements, assessing the accounting principles used and significant estimates made by management, and evaluating the overall financial statement presentation. We believe that our audits, which included confirmation of securities at December 31, 2010 by correspondence with the custodian, agent banks and brokers, provide a reasonable basis for our opinion.
/s/ PricewaterhouseCoopers LLP
PricewaterhouseCoopers LLP
Boston, Massachusetts
February 24, 2011
Annual Report
The Trustees and executive officers of the trust and fund, as applicable, are listed below. The Board of Trustees governs the fund and is responsible for protecting the interests of shareholders. The Trustees are experienced executives who meet periodically throughout the year to oversee the fund's activities, review contractual arrangements with companies that provide services to the fund, oversee management of the risks associated with such activities and contractual arrangements, and review the fund's performance. Except for James C. Curvey, each of the Trustees oversees 189 funds advised by FMR or an affiliate. Mr. Curvey oversees 408 funds advised by FMR or an affiliate.
The Trustees hold office without limit in time except that (a) any Trustee may resign; (b) any Trustee may be removed by written instrument, signed by at least two-thirds of the number of Trustees prior to such removal; (c) any Trustee who requests to be retired or who has become incapacitated by illness or injury may be retired by written instrument signed by a majority of the other Trustees; and (d) any Trustee may be removed at any special meeting of shareholders by a two-thirds vote of the outstanding voting securities of the trust. Each Trustee who is not an interested person (as defined in the 1940 Act) (Independent Trustee), shall retire not later than the last day of the calendar year in which his or her 75th birthday occurs. The Independent Trustees may waive this mandatory retirement age policy with respect to individual Trustees. The executive officers hold office without limit in time, except that any officer may resign or may be removed by a vote of a majority of the Trustees at any regular meeting or any special meeting of the Trustees. Except as indicated, each individual has held the office shown or other offices in the same company for the past five years.
Experience, Skills, Attributes, and Qualifications of the Fund's Trustees. The Governance and Nominating Committee has adopted a statement of policy that describes the experience, qualifications, attributes, and skills that are necessary and desirable for potential Independent Trustee candidates (Statement of Policy). The Board believes that each Trustee satisfied at the time he or she was initially elected or appointed a Trustee, and continues to satisfy, the standards contemplated by the Statement of Policy. The Governance and Nominating Committee also engages professional search firms to help identify potential Independent Trustee candidates who have the experience, qualifications, attributes, and skills consistent with the Statement of Policy. From time to time, additional criteria based on the composition and skills of the current Independent Trustees, as well as experience or skills that may be appropriate in light of future changes to board composition, business conditions, and regulatory or other developments, have also been considered by the professional search firms and the Governance and Nominating Committee. In addition, the Board takes into account the Trustees' commitment and participation in Board and committee meetings, as well as their leadership of standing and ad hoc committees throughout their tenure.
In determining that a particular Trustee was and continues to be qualified to serve as a Trustee, the Board has considered a variety of criteria, none of which, in isolation, was controlling. The Board believes that, collectively, the Trustees have balanced and diverse experience, qualifications, attributes, and skills, which allow the Board to operate effectively in governing the fund and protecting the interests of shareholders. Information about the specific experience, skills, attributes, and qualifications of each Trustee, which in each case led to the Board's conclusion that the Trustee should serve (or continue to serve) as a trustee of the fund, is provided below.
Board Structure and Oversight Function. Abigail P. Johnson is an interested person (as defined in the 1940 Act) and currently serves as Chairman. The Trustees have determined that an interested Chairman is appropriate and benefits shareholders because an interested Chairman has a personal and professional stake in the quality and continuity of services provided to the fund. Independent Trustees exercise their informed business judgment to appoint an individual of their choosing to serve as Chairman, regardless of whether the Trustee happens to be independent or a member of management. The Independent Trustees have determined that they can act independently and effectively without having an Independent Trustee serve as Chairman and that a key structural component for assuring that they are in a position to do so is for the Independent Trustees to constitute a substantial majority for the Board. The Independent Trustees also regularly meet in executive session. Kenneth L. Wolfe serves as Chairman of the Independent Trustees and as such (i) acts as a liaison between the Independent Trustees and management with respect to matters important to the Independent Trustees and (ii) with management prepares agendas for Board meetings.
Fidelity funds are overseen by different Boards of Trustees. The fund's Board oversees Fidelity's investment-grade bond, money market, and asset allocation funds and another Board oversees Fidelity's equity and high income funds. The asset allocation funds may invest in Fidelity funds that are overseen by such other Board. The use of separate Boards, each with its own committee structure, allows the Trustees of each group of Fidelity funds to focus on the unique issues of the funds they oversee, including common research, investment, and operational issues. On occasion, the separate Boards establish joint committees to address issues of overlapping consequences for the Fidelity funds overseen by each Board.
The Trustees operate using a system of committees to facilitate the timely and efficient consideration of all matters of importance to the Trustees, the fund, and fund shareholders and to facilitate compliance with legal and regulatory requirements and oversight of the fund's activities and associated risks. The Board, acting through its committees, has charged FMR and its affiliates with (i) identifying events or circumstances the occurrence of which could have demonstrably adverse effects on the fund's business and/or reputation; (ii) implementing processes and controls to lessen the possibility that such events or circumstances occur or to mitigate the effects of such events or circumstances if they do occur; and (iii) creating and maintaining a system designed to evaluate continuously business and market conditions in order to facilitate the identification and implementation processes described in (i) and (ii) above. Because the day-to-day operations and activities of the fund are carried out by or through FMR, its affiliates and other service providers, the fund's exposure to risks is mitigated but not eliminated by the processes overseen by the Trustees. While each of the Board's committees has responsibility for overseeing different aspects of the fund's activities, oversight is exercised primarily through the Operations and Audit Committees. Appropriate personnel, including but not limited to the fund's Chief Compliance Officer (CCO), FMR's internal auditor, the independent accountants, the fund's Treasurer and portfolio management personnel, make periodic reports to the Board's committees, as appropriate. The responsibilities of each committee, including their oversight responsibilities, are described further under "Standing Committees of the Fund's Trustees."
Annual Report
Trustees and Officers - continued
The fund's Statement of Additional Information (SAI) includes more information about the Trustees. To request a free copy, call Fidelity at 1-877-208-0098.
Interested Trustees*:
Correspondence intended for each Trustee who is an interested person may be sent to Fidelity Investments, 82 Devonshire Street, Boston, Massachusetts 02109.
Name, Age; Principal Occupations and Other Relevant Experience+
Abigail P. Johnson (49) |
| Year of Election or Appointment: 2009 Ms. Johnson is Trustee and Chairman of the Board of Trustees of certain Trusts. Ms. Johnson serves as President of Personal, Workplace and Institutional Services (2005-present). Ms. Johnson is the Vice Chairman and Director (2007-present) of FMR LLC. Previously, Ms. Johnson served as President and a Director of FMR (2001-2005), a Trustee of other investment companies advised by FMR, Fidelity Investments Money Management, Inc., and FMR Co., Inc. (2001-2005), Senior Vice President of the Fidelity funds (2001-2005), and managed a number of Fidelity funds. Ms. Abigail P. Johnson and Mr. Arthur E. Johnson are not related. |
James C. Curvey (75) |
| Year of Election or Appointment: 2007 Mr. Curvey also serves as Trustee (2007-present) of other investment companies advised by FMR. Mr. Curvey is a Director of Fidelity Investments Money Management, Inc. (2009-present), Director of Fidelity Research & Analysis Co. (2009-present) and Director of FMR and FMR Co., Inc. (2007-present). Mr. Curvey is also Vice Chairman (2007-present) and Director of FMR LLC. In addition, Mr. Curvey serves as an Overseer for the Boston Symphony Orchestra and a member of the Trustees of Villanova University. Previously, Mr. Curvey was the Vice Chairman (2006-2007) and Director (2000-2007) of FMR Corp. |
* Trustees have been determined to be "Interested Trustees" by virtue of, among other things, their affiliation with the trust or various entities under common control with FMR.
+ The information above includes each Trustee's principal occupation during the last five years and other information relating to the experience, attributes, and skills relevant to each Trustee's qualifications to serve as a Trustee, which led to the conclusion that each Trustee should serve as a Trustee for the fund.
Independent Trustees:
Correspondence intended for each Independent Trustee (that is, the Trustees other than the Interested Trustees) may be sent to Fidelity Investments, P.O. Box 55235, Boston, Massachusetts 02205-5235.
Name, Age; Principal Occupations and Other Relevant Experience+ |
Albert R. Gamper, Jr. (68) |
| Year of Election or Appointment: 2006 Prior to his retirement in December 2004, Mr. Gamper served as Chairman of the Board of CIT Group Inc. (commercial finance). During his tenure with CIT Group Inc. Mr. Gamper served in numerous senior management positions, including Chairman (1987-1989; 1999-2001; 2002-2004), Chief Executive Officer (1987-2004), and President (2002-2003). He also served as President and Chief Executive Officer of Tyco Capital Corporation (2001-2002). Mr. Gamper currently serves as a member of the Board of Directors of Public Service Enterprise Group (utilities, 2000-present), a member of the Board of Trustees, Rutgers University (2004-present), and Chairman of the Board of Saint Barnabas Health Care System. Previously, Mr. Gamper served as Chairman of the Board of Governors, Rutgers University (2004-2007). |
Robert F. Gartland (58) |
| Year of Election or Appointment: 2010 Mr. Gartland is a partner and investor of Vietnam Partners LLC (investments and consulting, 2008-present) and is Chairman and an investor in Gartland and Mellina Group Corp. (consulting, 2009-present). Prior to his retirement, Mr. Gartland held a variety of positions at Morgan Stanley (financial services, 1979-2007) including Managing Director (1987-2007). |
Arthur E. Johnson (63) |
| Year of Election or Appointment: 2008 Mr. Johnson serves as a member of the Board of Directors of Eaton Corporation (diversified power management, 2009-present) and AGL Resources, Inc. (holding company). Prior to his retirement, Mr. Johnson served as Senior Vice President of Corporate Strategic Development of Lockheed Martin Corporation (defense contractor, 1999-2009). He previously served on the Board of Directors of IKON Office Solutions, Inc. (1999-2008) and Delta Airlines (2005-2007). Mr. Arthur E. Johnson and Ms. Abigail P. Johnson are not related. |
Michael E. Kenneally (56) |
| Year of Election or Appointment: 2009 Previously, Mr. Kenneally served as a Member of the Advisory Board for certain Fidelity Fixed Income and Asset Allocation Funds (2008-2009). Prior to his retirement, Mr. Kenneally served as Chairman and Global Chief Executive Officer of Credit Suisse Asset Management (2003-2005). Mr. Kenneally was a Director of the Credit Suisse Funds (U.S. mutual funds, 2004-2008) and certain other closed-end funds (2004-2005) and was awarded the Chartered Financial Analyst (CFA) designation in 1991. |
James H. Keyes (70) |
| Year of Election or Appointment: 2007 Mr. Keyes serves as a member of the Boards of Navistar International Corporation (manufacture and sale of trucks, buses, and diesel engines, since 2002) and Pitney Bowes, Inc. (integrated mail, messaging, and document management solutions, since 1998). Prior to his retirement, Mr. Keyes served as Chairman and Chief Executive Officer of Johnson Controls (automotive, building, and energy, 1998-2002) and as a member of the Board of LSI Logic Corporation (semiconductor technologies, 1984-2008). |
Marie L. Knowles (64) |
| Year of Election or Appointment: 2001 Prior to Ms. Knowles' retirement in June 2000, she served as Executive Vice President and Chief Financial Officer of Atlantic Richfield Company (ARCO) (diversified energy, 1996-2000). From 1993 to 1996, she was a Senior Vice President of ARCO and President of ARCO Transportation Company. She served as a Director of ARCO from 1996 to 1998. Ms. Knowles currently serves as a Director and Chairman of the Audit Committee of McKesson Corporation (healthcare service, since 2002). Ms. Knowles is an Honorary Trustee of the Brookings Institution and a member of the Board of the Catalina Island Conservancy and of the Santa Catalina Island Company (2009-present). She also serves as a member of the Advisory Board for the School of Engineering of the University of Southern California and the Foundation Board of the School of Architecture at the University of Virginia (2007-present). Previously, Ms. Knowles served as a Director of Phelps Dodge Corporation (copper mining and manufacturing, 1994-2007). |
Kenneth L. Wolfe (71) |
| Year of Election or Appointment: 2005 Mr. Wolfe is Chairman of the Independent Trustees of the Fixed Income and Asset Allocation Funds (2008-present). Prior to his retirement, Mr. Wolfe served as Chairman and a Director (2007-2009) and Chairman and Chief Executive Officer (1994-2001) of Hershey Foods Corporation. He also served as a member of the Boards of Adelphia Communications Corporation (telecommunications, 2003-2006), Bausch & Lomb, Inc. (medical/pharmaceutical, 1993-2007), and Revlon, Inc. (personal care products, 2004-2009). |
+ The information above includes each Trustee's principal occupation during the last five years and other information relating to the experience, attributes, and skills relevant to each Trustee's qualifications to serve as a Trustee, which led to the conclusion that each Trustee should serve as a Trustee for the fund.
Executive Officers:
Correspondence intended for each executive officer may be sent to Fidelity Investments, 82 Devonshire Street, Boston, Massachusetts 02109.
Name, Age; Principal Occupation |
John R. Hebble (52) |
| Year of Election or Appointment: 2008 President and Treasurer of Fidelity's Fixed Income and Asset Allocation Funds. Mr. Hebble also serves as Treasurer and Chief Financial Officer of The North Carolina Capital Management Trust: Cash and Term Portfolio (2008-present), Assistant Treasurer of other Fidelity funds (2009-present) and is an employee of Fidelity Investments. |
Boyce I. Greer (54) |
| Year of Election or Appointment: 2005 Vice President of Fidelity's Fixed Income Funds and Asset Allocation Funds (2005). Mr. Greer is also a Trustee of other investment companies advised by FMR. Mr. Greer is President of The North Carolina Capital Management Trust: Cash and Term Portfolio (2003-present), the Asset Allocation Division (2008-present), President and a Director of Strategic Advisers, Inc. (2008-present), President of FIMM 130/30 LLC (2008-present), Director of Ballyrock Investment Advisors LLC (2006-present), and an Executive Vice President of FMR (2005-present). Previously, Mr. Greer served as Executive Vice President of FMR Co., Inc. (2005-2009), President and Director of Fidelity Investments Money Management, Inc. (2007-2009) and as a Director and Managing Director of Strategic Advisers, Inc. (2002-2005). |
Christopher P. Sullivan (56) |
| Year of Election or Appointment: 2009 Vice President of Fidelity's Bond Funds. Mr. Sullivan also serves as President of Fidelity's Bond Division (2009-present). Mr. Sullivan is Executive Vice President of Fidelity Investments Money Management, Inc. (2009-present), and a Director of Fidelity Management & Research (U.K.) Inc. (2010-present). Previously, Mr. Sullivan served as Managing Director, Co-Head of U.S. Fixed Income at Goldman Sachs Asset Management (2001-2009). |
Christine J. Thompson (52) |
| Year of Election or Appointment: 2010 Vice President of Fidelity's Bond Funds. Ms. Thompson also serves as Chief Investment Officer of FMR's Bond Group (2010-present) and is an employee of Fidelity Investments. Previously, Ms. Thompson served as Director of Municipal Bond Portfolio Managers (2002-2010). |
Scott C. Goebel (42) |
| Year of Election or Appointment: 2008 Secretary and Chief Legal Officer (CLO) of the Fidelity funds. Mr. Goebel also serves as Secretary and CLO of The North Carolina Capital Management Trust: Cash and Term Portfolio (2008-present); General Counsel, Secretary, and Senior Vice President of FMR (2008-present) and FMR Co., Inc. (2008-present); Deputy General Counsel of FMR LLC; Chief Legal Officer of Fidelity Management & Research (Hong Kong) Limited (2008-present) and Assistant Secretary of Fidelity Management & Research (Japan) Inc. (2008-present), Fidelity Investments Money Management, Inc. (2008-present), Fidelity Management & Research (U.K.) Inc. (2008-present), and Fidelity Research and Analysis Company (2008-present). Previously, Mr. Goebel served as Assistant Secretary of the Funds (2007-2008) and as Vice President and Secretary of Fidelity Distributors Corporation (FDC) (2005-2007). |
David J. Carter (37) |
| Year of Election or Appointment: 2010 Assistant Secretary of Fidelity's Fixed Income and Asset Allocation Funds. Mr. Carter also serves as Vice President, Associate General Counsel (2010-present) and is an employee of Fidelity Investments (2005-present). |
Holly C. Laurent (56) |
| Year of Election or Appointment: 2008 Anti-Money Laundering (AML) Officer of the Fidelity funds. Ms. Laurent also serves as AML Officer of The North Carolina Capital Management Trust: Cash and Term Portfolio (2008-present) and is an employee of Fidelity Investments. Previously, Ms. Laurent was Senior Vice President and Head of Legal for Fidelity Business Services India Pvt. Ltd. (2006-2008), and Senior Vice President, Deputy General Counsel and Group Head for FMR LLC (2005-2006). |
Christine Reynolds (52) |
| Year of Election or Appointment: 2008 Chief Financial Officer of the Fidelity funds. Ms. Reynolds became President of Fidelity Pricing and Cash Management Services (FPCMS) in August 2008. Ms. Reynolds served as Chief Operating Officer of FPCMS (2007-2008). Previously, Ms. Reynolds served as President, Treasurer, and Anti-Money Laundering officer of the Fidelity funds (2004-2007). |
Michael H. Whitaker (43) |
| Year of Election or Appointment: 2008 Chief Compliance Officer of Fidelity's Fixed Income and Asset Allocation Funds. Mr. Whitaker also serves as Chief Compliance Officer of The North Carolina Capital Management Trust: Cash and Term Portfolio (2008-present). Mr. Whitaker is an employee of Fidelity Investments (2007-present). Prior to joining Fidelity Investments, Mr. Whitaker worked at MFS Investment Management where he served as Senior Vice President and Chief Compliance Officer (2004-2006), and Assistant General Counsel. |
Jeffrey S. Christian (49) |
| Year of Election or Appointment: 2009 Deputy Treasurer of the Fidelity funds. Mr. Christian is an employee of Fidelity Investments. Previously, Mr. Christian served as Chief Financial Officer (2008-2009) of certain Fidelity funds and Senior Vice President of Fidelity Pricing and Cash Management Services (FPCMS) (2004-2009). |
Bryan A. Mehrmann (49) |
| Year of Election or Appointment: 2005 Deputy Treasurer of the Fidelity funds. Mr. Mehrmann is an employee of Fidelity Investments. |
Stephanie J. Dorsey (41) |
| Year of Election or Appointment: 2008 Deputy Treasurer of Fidelity's Fixed Income and Asset Allocation Funds. Ms. Dorsey also serves as Assistant Treasurer of other Fidelity funds (2010-present) and is an employee of Fidelity Investments (2008-present). Previously, Ms. Dorsey served as Treasurer (2004-2008) of the JPMorgan Mutual Funds and Vice President (2004-2008) of JPMorgan Chase Bank. |
Adrien E. Deberghes (43) |
| Year of Election or Appointment: 2010 Assistant Treasurer of Fidelity's Fixed Income and Asset Allocation Funds. Mr. Deberghes also serves as Deputy Treasurer of other Fidelity funds (2008-present) and is an employee of Fidelity Investments (2008-present). Previously, Mr. Deberghes served as Senior Vice President of Mutual Fund Administration at State Street Corporation (2007-2008), Senior Director of Mutual Fund Administration at Investors Bank & Trust (2005-2007), and Director of Finance for Dunkin' Brands (2000-2005). |
Kenneth B. Robins (41) |
| Year of Election or Appointment: 2009 Assistant Treasurer of the Fidelity Fixed Income and Asset Allocation Funds. Mr. Robins also serves as President and Treasurer of other Fidelity funds (2008-present; 2010-present) and is an employee of Fidelity Investments (2004-present). Previously, Mr. Robins served as Deputy Treasurer of the Fidelity funds (2005-2008) and Treasurer and Chief Financial Officer of The North Carolina Capital Management Trust: Cash and Term Portfolios (2006-2008). |
Gary W. Ryan (52) |
| Year of Election or Appointment: 2005 Assistant Treasurer of the Fidelity funds. Mr. Ryan is an employee of Fidelity Investments. Previously, Mr. Ryan served as Vice President of Fund Reporting in Fidelity Pricing and Cash Management Services (FPCMS) (1999-2005). |
Jonathan Davis (42) |
| Year of Election or Appointment: 2010 Assistant Treasurer of the Fidelity funds. Mr. Davis is an employee of Fidelity Investments. Previously, Mr. Davis served as Vice President and Associate General Counsel of FMR LLC (2003-2010). |
Annual Report
The Board of Trustees of VIP Strategic Income Portfolio voted to pay to shareholders of record at the opening of business on record date, the following distributions per share derived from capital gains realized from sales of portfolio securities, and dividends derived from net investment income:
| Pay Date | Record Date | Dividends | Capital Gains |
Initial Class | 02/11/2011 | 02/11/2011 | $0.005 | $0.055 |
Service Class | 02/11/2011 | 02/11/2011 | $0.005 | $0.055 |
Service Class 2 | 02/11/2011 | 02/11/2011 | $0.005 | $0.055 |
Investor Class | 02/11/2011 | 02/11/2011 | $0.005 | $0.055 |
The fund hereby designates as a capital gain dividend with respect to the taxable year ended December 31, 2010, $12,450,291 or, if subsequently determined to be different, the net capital gain of such year.
A total of 7.02% of the dividends distributed during the fiscal year was derived from interest on U.S. Government securities which is generally exempt from state income tax.
Annual Report
Board Approval of Investment Advisory Contracts and Management Fees
VIP Strategic Income Portfolio
Each year, the Board of Trustees, including the Independent Trustees (together, the Board), votes on the renewal of the management contract and sub-advisory agreements (together, the Advisory Contracts) for the fund. The Board, assisted by the advice of fund counsel and Independent Trustees' counsel, requests and considers a broad range of information relevant to the renewal of the Advisory Contracts throughout the year.
The Board meets regularly and considers at each of its meetings factors that are relevant to its annual consideration of the renewal of the fund's Advisory Contracts, including the services and support provided to the fund and its shareholders. The Board has established three standing committees, each composed of Independent Trustees with varying backgrounds, to which the Board has assigned specific subject matter responsibilities in order to enhance effective decision-making by the Board. The Operations Committee, of which all of the Independent Trustees are members, meets regularly throughout the year and, among other matters, considers matters specifically related to the annual consideration of the renewal of the fund's Advisory Contracts. The Board, acting directly and through its Committees, requests and receives information concerning the annual consideration of the renewal of the fund's Advisory Contracts. The Board also meets as needed to consider matters specifically related to the Board's annual consideration of the renewal of Advisory Contracts. Members of the Board may also meet with trustees of other Fidelity funds through ad hoc joint committees to discuss certain matters relevant to the Fidelity funds.
At its September 2010 meeting, the Board of Trustees, including the Independent Trustees, unanimously determined to renew the fund's Advisory Contracts. In reaching its determination, the Board considered all factors it believed relevant, including (i) the nature, extent, and quality of the services to be provided to the fund and its shareholders (including the investment performance of the fund); (ii) the competitiveness of the fund's management fee and total expenses; (iii) the total costs of the services to be provided by and the profits to be realized by Fidelity from its relationship with the fund; (iv) the extent to which economies of scale would be realized as the fund grows; and (v) whether fee levels reflect these economies of scale, if any, for the benefit of fund shareholders.
In considering whether to renew the Advisory Contracts for the fund, the Board reached a determination, with the assistance of fund counsel and Independent Trustees' counsel and through the exercise of its business judgment, that the renewal of the Advisory Contracts is in the best interests of the fund and its shareholders and that the compensation to be received by Fidelity under the management contract is fair and reasonable. The Board's decision to renew the Advisory Contracts was not based on any single factor, but rather was based on a comprehensive consideration of all the information provided to the Board at its meetings throughout the year. The Board, in reaching its determination to renew the Advisory Contracts, is aware that shareholders in the fund have a broad range of investment choices available to them, including a wide choice among mutual funds offered by Fidelity's competitors, and that the fund's shareholders, with the opportunity to review and weigh the disclosure provided by the fund in its prospectus and other public disclosures, have chosen to invest in this fund, managed by Fidelity.
Nature, Extent, and Quality of Services Provided. The Board considered the staffing within the investment adviser, FMR, and the sub-advisers (together, the Investment Advisers), including the backgrounds of the fund's investment personnel and the fund's investment objective and discipline. The Independent Trustees also had discussions with senior management of Fidelity's investment operations and investment groups. The Board considered the structure of the portfolio manager compensation program and whether this structure provides appropriate incentives to act in the best interest of the fund.
Resources Dedicated to Investment Management and Support Services. The Board reviewed the size, education, and experience of the Investment Advisers' investment staff, their use of technology, and the Investment Advisers' approach to recruiting, training, and retaining portfolio managers and other research, advisory, and management personnel. The Board noted that Fidelity's analysts have access to a variety of technological tools and market and securities data that enable them to perform both fundamental and quantitative analysis and to specialize in various disciplines. The Board considered Fidelity's extensive global research capabilities that enable the Investment Advisers to aggregate data from various sources in an effort to produce positive investment results. The Board also considered that Fidelity's portfolio managers and analysts have access to daily portfolio attribution that allows for monitoring of a fund's portfolio, as well as an electronic communication system that provides immediate real-time access to research concerning issuers and credit enhancers. The Board noted FMR's continued focus on strengthening the organization and discipline of equity portfolio management and research.
Shareholder and Administrative Services. The Board considered (i) the nature, extent, quality, and cost of advisory, administrative, and shareholder services performed by the Investment Advisers and their affiliates under the Advisory Contracts and under separate agreements covering transfer agency, pricing and bookkeeping, and securities lending services for the fund; (ii) the nature and extent of the investment adviser's supervision of third party service providers, principally custodians and subcustodians; and (iii) the resources devoted to, and the record of compliance with, the fund's compliance policies and procedures. The Board also reviewed the allocation of fund brokerage, including allocations to brokers affiliated with the Investment Advisers, the use of brokerage commissions to pay fund expenses, and the use of "soft" commission dollars to pay for research services.
The Board noted that the growth of fund assets over time across the complex allows Fidelity to reinvest in the development of services designed to enhance the value or convenience of the Fidelity funds as investment vehicles. These services include 24-hour access to account information and market information through telephone representatives and over the Internet, and investor education materials and asset allocation tools.
Annual Report
Board Approval of Investment Advisory Contracts and Management Fees - continued
Investment in a Large Fund Family. The Board considered the benefits to shareholders of investing in a Fidelity fund, including the benefits of investing in a fund that is part of a large family of funds offering a variety of investment disciplines and providing a large variety of mutual fund investor services. The Board noted that Fidelity had taken, or had made recommendations that resulted in the Fidelity funds taking, a number of actions over the previous year that benefited particular funds, including (i) dedicating additional resources to investment research and restructuring and broadening the focus of the investment research teams; (ii) bolstering the senior management team that oversees asset management; (iii) launching Class F of certain funds as a lower-fee class available to Freedom K and Freedom Index Funds; (iv) lowering the initial investment minimums and ongoing balance requirements for Real Estate High Income Fund; (v) eliminating subsequent purchase minimums for all funds and adding a waiver of the investment minimum requirement for new accounts opened with the proceeds of a systematic withdrawal plan; (vi) eliminating the withdrawal minimum and maximum limits for systematic withdrawals from Advisor funds; (vii) expanding sales load waivers on Class A shares for Destiny Planholders and expanding Institutional Class eligibility for Class O Destiny Planholders; and (viii) changing certain Class A and Class T sales charge structures to further align them with industry practices.
Investment Performance. The Board considered whether the fund has operated in accordance with its investment objective, as well as its record of compliance with its investment restrictions. It also reviewed the fund's absolute investment performance for each class, as well as the fund's relative investment performance for each class measured over multiple periods against (i) a proprietary custom index, and (ii) a peer group of mutual funds deemed appropriate by Fidelity and reviewed by the Board. The following charts considered by the Board show, over the one-, three- and five-year periods ended December 31, 2009, the cumulative total returns of Initial Class and Service Class 2 of the fund, the cumulative total returns of a proprietary custom index ("benchmark"), and a range of cumulative total returns of a peer group of mutual funds identified by Morningstar, Inc. as having an investment style similar to that of the fund based on underlying portfolio holdings. The returns of Initial Class and Service Class 2 show the performance of the highest and lowest performing classes, respectively (based on five-year performance). The box within each chart shows the 25th percentile return (bottom of box) and the 75th percentile return (top of box) of the peer group. Returns shown above the box are in the first quartile and returns shown below the box are in the fourth quartile. The percentage beaten numbers noted below each chart correspond to the percentile box and represent the percentage of funds in the peer group whose performance was equal to or lower than that of the class indicated. The fund's proprietary custom index is an index developed by FMR that represents the performance of the fund's four general investment categories according to their respective weightings in the fund's neutral mix.
VIP Strategic Income Portfolio
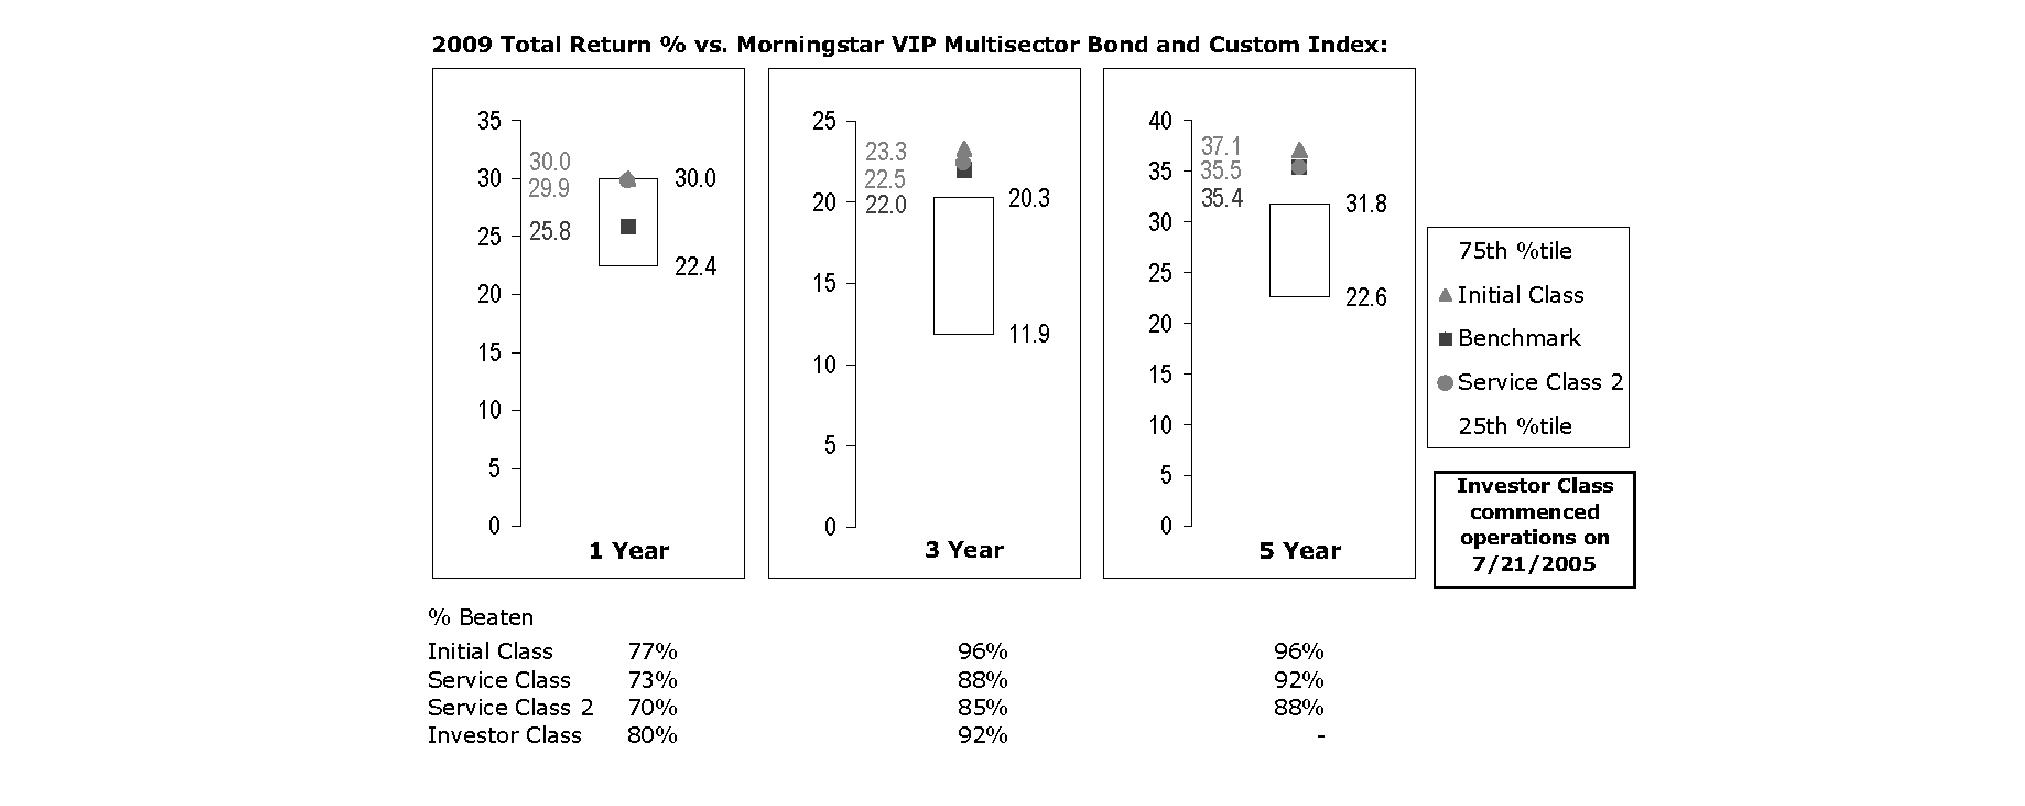
The Board reviewed the fund's relative investment performance against its peer group and noted that the performance of Initial Class of the fund was in the first quartile for all the periods shown. The Board also noted that the investment performance of Initial Class of the fund compared favorably to its benchmark for all the periods shown. The Board considered that the variations in performance among the fund's classes reflect the variations in class expenses, which result in lower performance for higher expense classes. The Board also reviewed the fund's performance since inception as well as performance in the current year.
Based on its review, and giving particular weight to the nature and quality of the resources dedicated by the Investment Advisers to maintain and improve relative performance and factoring in the unprecedented market events in recent years, the Board concluded that the nature, extent, and quality of investment management and support services and of shareholder and administrative services provided to the fund will benefit the fund's shareholders, particularly in light of the Board's view that the fund's shareholders benefit from investing in a fund that is part of a large family of funds offering a variety of investment disciplines and services.
Annual Report
Competitiveness of Management Fee and Total Fund Expenses. The Board considered the fund's management fee and total expenses compared to "mapped groups" of competitive funds and classes. Fidelity creates "mapped groups" by combining similar Lipper investment objective categories that have comparable management fee characteristics. Combining Lipper investment objective categories aids the Board's management fee and total expense comparisons by broadening the competitive group used for comparison and by reducing the number of universes to which various Fidelity funds are compared.
Management Fee. The Board considered two proprietary management fee comparisons for the 12-month periods shown in the chart below. The group of Lipper funds used by the Board for management fee comparisons is referred to below as the "Total Mapped Group." The Total Mapped Group comparison focuses on a fund's standing relative to the total universe of comparable funds available to investors, in terms of gross management fees before expense reimbursements or caps. "TMG %" represents the percentage of funds in the Total Mapped Group that had management fees that were lower than the fund's. For example, a TMG % of 24% means that 76% of the funds in the Total Mapped Group had higher management fees than the fund. The "Asset-Size Peer Group" (ASPG) comparison focuses on a fund's standing relative to non-Fidelity funds similar in size to the fund within the Total Mapped Group. The ASPG represents at least 15% of the funds in the Total Mapped Group with comparable asset size and management fee characteristics, subject to a minimum of 50 funds (or all funds in the Total Mapped Group if fewer than 50). Additional information, such as the ASPG quartile in which the fund's management fee ranked, is also included in the chart and considered by the Board.
VIP Strategic Income Portfolio
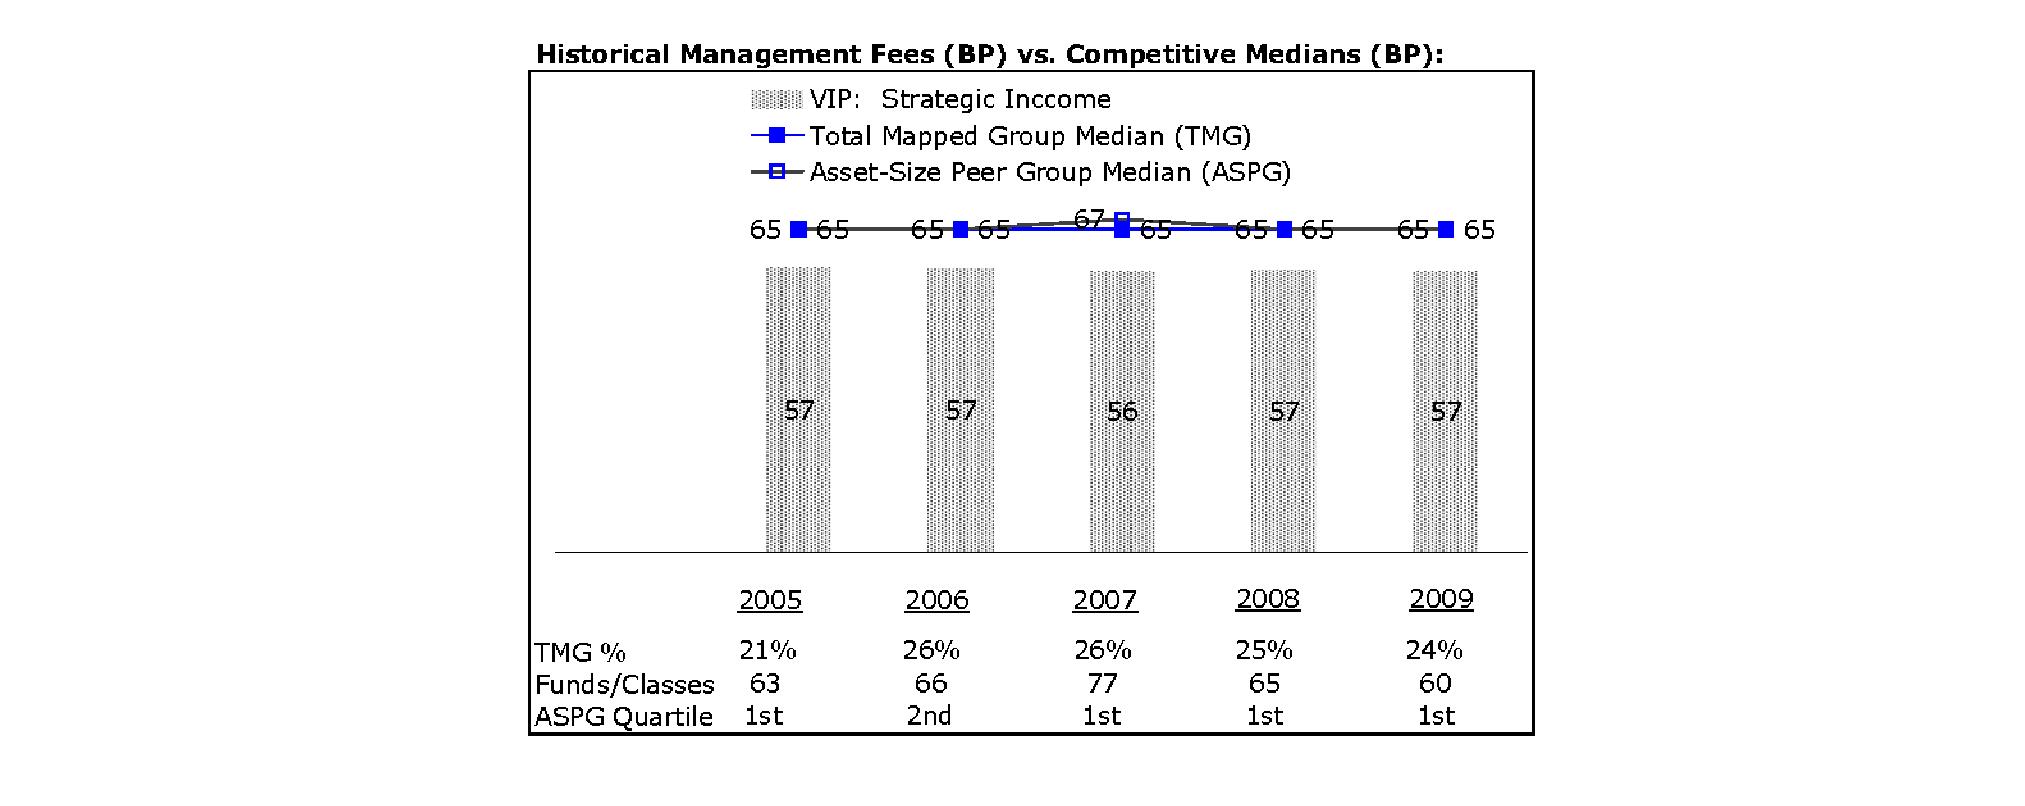
The Board noted that the fund's management fee ranked below the median of its Total Mapped Group and below the median of its ASPG for 2009.
Based on its review, the Board concluded that the fund's management fee is fair and reasonable in light of the services that the fund receives and the other factors considered.
Total Expenses. In its review of each class's total expenses, the Board considered the fund's management fee as well as other fund or class expenses, as applicable, such as transfer agent fees, pricing and bookkeeping fees, fund-paid 12b-1 fees, and custodial, legal, and audit fees. The Board also noted the effects of any waivers and reimbursements on fees and expenses. As part of its review, the Board also considered current and historical total expenses of each class of the fund compared to competitive fund median expenses. Each class of the fund is compared to those funds and classes in the Total Mapped Group (used by the Board for management fee comparisons) that have a similar sales load structure.
The Board noted that the total expenses of each of Initial Class and Investor Class ranked below its competitive median for 2009, the total expenses of Service Class ranked equal to its competitive median for 2009, and the total expenses of Service Class 2 ranked above its competitive median for 2009. The Board noted that the total expenses of Service Class 2 were above the median due to 12b-1 fees and that the funds and classes in the Total Mapped Group that have a similar sales load structure included classes with no 12b-1 fees. Excluding the 12b-1 fees, the total expenses of Service Class 2 ranked equal to its competitive median for 2009. The Board noted that the fund offers multiple classes, each of which has a different 12b-1 fee structure, and that the multiple structures are intended to offer a range of pricing options for the intermediary market. The Board also noted that the total expenses of the classes vary primarily by the level of their 12b-1 fees, although differences in transfer agent fees may also cause expenses to vary from class to class.
Annual Report
Board Approval of Investment Advisory Contracts and Management Fees - continued
Fees Charged to Other Fidelity Clients. The Board also considered Fidelity fee structures and other information with respect to clients of FMR and its affiliates, such as other mutual funds advised or subadvised by FMR or its affiliates, pension plan clients, and other institutional clients. In March 2010, the Board created an ad hoc joint committee with the board of other Fidelity funds (the Committee) to review and compare Fidelity's institutional investment advisory business with its business of providing services to the Fidelity funds, including the differences in services provided, fees charged, and costs incurred, as well as competition in their respective marketplaces.
Based on its review of total expenses and fees charged to other Fidelity clients, the Board concluded that the total expenses of each class of the fund were reasonable, although in one case above the median of the universe presented for comparison, in light of the services that the fund and its shareholders receive and the other factors considered, including the findings of the Committee.
Costs of the Services and Profitability. The Board considered the revenues earned and the expenses incurred by Fidelity in conducting the business of developing, marketing, distributing, managing, administering and servicing the fund and its shareholders. The Board also considered the level of Fidelity's profits in respect of all the Fidelity funds.
On an annual basis, FMR presents to the Board Fidelity's profitability for the fund. Fidelity calculates the profitability for each fund, as well as aggregate profitability for groups of Fidelity funds and all Fidelity funds, using a series of detailed revenue and cost allocation methodologies which originate with the audited books and records of Fidelity. The Audit Committee of the Board reviews any significant changes from the prior year's methodologies.
PricewaterhouseCoopers LLP (PwC), independent registered public accounting firm and auditor to Fidelity and certain Fidelity funds, has been engaged annually by the Board as part of the Board's assessment of Fidelity's profitability analysis. PwC's engagement includes the review and assessment of Fidelity's methodologies used in determining the revenues and expenses attributable to Fidelity's mutual fund business, and completion of agreed-upon procedures surrounding the mathematical accuracy of fund profitability and its conformity to allocation methodologies. After considering PwC's reports issued under the engagement and information provided by Fidelity, the Board believes that while other allocation methods may also be reasonable, Fidelity's profitability methodologies are reasonable in all material respects.
The Board has also reviewed Fidelity's non-fund businesses and fall-out benefits related to the mutual fund business as well as cases where Fidelity's affiliates may benefit from or be related to the fund's business.
The Board considered the costs of the services provided by and the profits realized by Fidelity in connection with the operation of the fund and were satisfied that the profitability was not excessive in the circumstances.
Economies of Scale. The Board considered whether there have been economies of scale in respect of the management of the Fidelity funds, whether the Fidelity funds (including the fund) have appropriately benefited from any such economies of scale, and whether there is potential for realization of any further economies of scale. The Board considered the extent to which the fund will benefit from economies of scale through increased services to the fund, through waivers or reimbursements, or through fee or expense reductions.
In February 2009, the Board and the board of other Fidelity funds created an ad hoc committee (the Economies of Scale Committee) to analyze whether FMR attains economies of scale in respect of the management and servicing of the Fidelity funds, whether the Fidelity funds have appropriately benefited from such economies of scale, and whether there is potential for realization of any further economies of scale.
The Board recognized that the fund's management contract incorporates a "group fee" structure, which provides for lower group fee rates as total fund assets under FMR's management increase, and for higher group fee rates as total fund assets under FMR's management decrease. FMR calculates the group fee rates based on a tiered asset "breakpoint" schedule that varies based on asset class. The Board considered that the group fee is designed to deliver the benefits of economies of scale to fund shareholders when total Fidelity fund assets increase, even if assets of any particular fund are unchanged or have declined, because some portion of Fidelity's costs are attributable to services provided to all Fidelity funds, and all funds benefit if those costs can be allocated among more assets. The Board concluded that, given the group fee structure, fund shareholders will benefit from lower management fees as assets under FMR's management increase at the fund complex level, regardless of whether Fidelity achieves any such economies of scale.
The Board concluded, considering the findings of the Economies of Scale Committee, that any potential economies of scale are being appropriately shared between fund shareholders and Fidelity.
Additional Information Requested by the Board. In order to develop fully the factual basis for consideration of the Fidelity funds' Advisory Contracts, the Board requested and received additional information on certain topics, including (i) fund performance trends, actions to be taken by FMR to improve certain funds' overall performance, and Fidelity's long-term strategies for certain funds; (ii) Fidelity's fund profitability methodology and profitability trends for certain funds; (iii) portfolio manager changes that have occurred during the past year and the amount of the investment that each portfolio manager has made in the Fidelity fund(s) that he or she manages; (iv) Fidelity's compensation structure for portfolio managers, research analysts, and other key personnel, including its effects on fund profitability, the rationale for the compensation structure, and the extent to which current market conditions have affected retention and recruitment; (v) the compensation paid by FMR to fund sub-advisers on behalf of the Fidelity funds; (vi) Fidelity's fee structures and rationale for recommending different fees among different categories of funds and classes, as well as Fidelity's voluntary waiver of fees to maintain minimum yields for certain funds and classes; (vii) the rationale for any differences between fund fee structures and fee structures in place for other Fidelity clients; and (viii) explanations regarding the relative total expenses borne by certain funds and classes, total expense competitive trends, and actions that might be taken by FMR to reduce total expenses for certain funds and classes or to achieve further economies of scale.
Annual Report
Based on its evaluation of all of the conclusions noted above, and after considering all factors it believed relevant, the Board ultimately concluded that the advisory fee structures are fair and reasonable, and that the fund's Advisory Contracts should be renewed.
Annual Report
Investment Adviser
Fidelity Management & Research Company
Boston, MA
Investment Sub-Advisers
FMR Co., Inc.
Fidelity Investments Money Management, Inc.
FIL Investments (Japan) Limited
FIL Investment Advisors
FIL Investment Advisors (U.K.) Ltd.
Fidelity Management & Research (U.K.) Inc.
Fidelity Management & Research (Japan) Inc.
Fidelity Management & Research (Hong Kong) Limited
General Distributor
Fidelity Distributors Corporation
Boston, MA
Transfer and Service Agents
Fidelity Investments Institutional Operations Company, Inc.
Boston, MA
Fidelity Service Company, Inc.
Boston, MA
Custodian
The Bank of New York Mellon
New York, NY
VIPSI-ANN-0211
1.796350.108
Item 2. Code of Ethics
As of the end of the period, December 31, 2010, Variable Insurance Products Fund V (the trust) has adopted a code of ethics, as defined in Item 2 of Form N-CSR, that applies to its President and Treasurer and its Chief Financial Officer. A copy of the code of ethics is filed as an exhibit to this Form N-CSR.
Item 3. Audit Committee Financial Expert
The Board of Trustees of the trust has determined that Marie L. Knowles is an audit committee financial expert, as defined in Item 3 of Form N-CSR. Ms. Knowles is independent for purposes of Item 3 of Form N-CSR.
Item 4. Principal Accountant Fees and Services
Fees and Services
The following table presents fees billed by Deloitte & Touche LLP, the member firms of Deloitte Touche Tohmatsu, and their respective affiliates (collectively, "Deloitte Entities") in each of the last two fiscal years for services rendered to Asset Manager Portfolio, Asset Manager: Growth Portfolio, Freedom 2005 Portfolio, Freedom 2010 Portfolio, Freedom 2015 Portfolio, Freedom 2020 Portfolio, Freedom 2025 Portfolio, Freedom 2030 Portfolio, Freedom 2035 Portfolio, Freedom 2040 Portfolio, Freedom 2045 Portfolio, Freedom 2050 Portfolio, Freedom Income Portfolio, Freedom Lifetime Income I Portfolio, Freedom Lifetime Income II Portfolio, Freedom Lifetime Income III Portfolio and Investment Grade Bond Portfolio (the "Funds"):
Services Billed by Deloitte Entities
December 31, 2010 FeesA
| Audit Fees | Audit-Related Fees | Tax Fees | All Other Fees |
Asset Manager Portfolio | $32,000 | $- | $7,000 | $- |
Asset Manager: Growth Portfolio | $32,000 | $- | $4,800 | $- |
Freedom 2005 Portfolio | $23,000 | $- | $4,500 | $- |
Freedom 2010 Portfolio | $23,000 | $- | $4,500 | $- |
Freedom 2015 Portfolio | $23,000 | $- | $4,500 | $- |
Freedom 2020 Portfolio | $23,000 | $- | $4,500 | $- |
Freedom 2025 Portfolio | $23,000 | $- | $4,500 | $- |
Freedom 2030 Portfolio | $23,000 | $- | $4,500 | $- |
Freedom 2035 Portfolio | $17,000 | $- | $4,500 | $- |
Freedom 2040 Portfolio | $17,000 | $- | $4,500 | $- |
Freedom 2045 Portfolio | $17,000 | $- | $4,500 | $- |
Freedom 2050 Portfolio | $17,000 | $- | $4,500 | $- |
Freedom Income Portfolio | $23,000 | $- | $4,500 | $- |
Freedom Lifetime Income I Portfolio | $23,000 | $- | $4,500 | $- |
Freedom Lifetime Income II Portfolio | $23,000 | $- | $4,500 | $- |
Freedom Lifetime Income III Portfolio | $23,000 | $- | $4,500 | $- |
Investment Grade Bond Portfolio | $34,000 | $- | $5,600 | $- |
December 31, 2009 FeesA,B
| Audit Fees | Audit-Related Fees | Tax Fees | All Other Fees |
Asset Manager Portfolio | $35,000 | $- | $7,000 | $- |
Asset Manager: Growth Portfolio | $35,000 | $- | $4,700 | $- |
Freedom 2005 Portfolio | $25,000 | $- | $4,500 | $- |
Freedom 2010 Portfolio | $25,000 | $- | $4,500 | $- |
Freedom 2015 Portfolio | $25,000 | $- | $4,500 | $- |
Freedom 2020 Portfolio | $25,000 | $- | $4,500 | $- |
Freedom 2025 Portfolio | $25,000 | $- | $4,500 | $- |
Freedom 2030 Portfolio | $25,000 | $- | $4,500 | $- |
Freedom 2035 Portfolio | $17,000 | $- | $4,500 | $- |
Freedom 2040 Portfolio | $17,000 | $- | $4,500 | $- |
Freedom 2045 Portfolio | $17,000 | $- | $4,500 | $- |
Freedom 2050 Portfolio | $17,000 | $- | $4,500 | $- |
Freedom Income Portfolio | $25,000 | $- | $4,500 | $- |
Freedom Lifetime Income I Portfolio | $25,000 | $- | $4,500 | $- |
Freedom Lifetime Income II Portfolio | $25,000 | $- | $4,500 | $- |
Freedom Lifetime Income III Portfolio | $25,000 | $- | $4,500 | $- |
Investment Grade Bond Portfolio | $34,000 | $- | $5,600 | $- |
A Amounts may reflect rounding.
B Freedom 2035 Portfolio, Freedom 2040 Portfolio, Freedom 2045 Portfolio, and Freedom 2050 Portfolio commenced operations on April 8, 2009.
The following table presents fees billed by PricewaterhouseCoopers LLP ("PwC") in each of the last two fiscal years for services rendered to FundsManager 20% Portfolio, FundsManager 50% Portfolio, FundsManager 60%, FundsManager 70% Portfolio, FundsManager 85% Portfolio, Investor Freedom 2005 Portfolio, Investor Freedom 2010 Portfolio, Investor Freedom 2015 Portfolio, Investor Freedom 2020 Portfolio, Investor Freedom 2025 Portfolio, Investor Freedom 2030 Portfolio, Investor Freedom Income Portfolio, and Strategic Income Portfolio (the "Funds"):
Services Billed by PwC
December 31, 2010 FeesA
| Audit Fees | Audit-Related Fees | Tax Fees | All Other Fees |
FundsManager 20% Portfolio | $29,000 | $- | $2,600 | $100 |
FundsManager 50% Portfolio | $29,000 | $- | $2,600 | $100 |
FundsManager 60% Portfolio | $29,000 | $- | $2,600 | $100 |
FundsManager 70% Portfolio | $29,000 | $- | $2,600 | $100 |
FundsManager 85% Portfolio | $29,000 | $- | $2,600 | $100 |
Investor Freedom 2005 Portfolio | $29,000 | $- | $2,600 | $100 |
Investor Freedom 2010 Portfolio | $29,000 | $- | $2,600 | $100 |
Investor Freedom 2015 Portfolio | $29,000 | $- | $2,600 | $100 |
Investor Freedom 2020 Portfolio | $29,000 | $- | $2,600 | $100 |
Investor Freedom 2025 Portfolio | $29,000 | $- | $2,600 | $100 |
Investor Freedom 2030 Portfolio | $29,000 | $- | $2,600 | $100 |
Investor Freedom Income Portfolio | $29,000 | $- | $2,600 | $100 |
Strategic Income Portfolio | $70,000 | $- | $3,400 | $2,100 |
December 31, 2009 FeesA
| Audit Fees | Audit-Related Fees | Tax Fees | All Other Fees |
FundsManager 20% Portfolio | $30,000 | $- | $3,400 | $100 |
FundsManager 50% Portfolio | $30,000 | $- | $3,400 | $100 |
FundsManager 60% Portfolio | $30,000 | $- | $3,400 | $100 |
FundsManager 70% Portfolio | $30,000 | $- | $3,400 | $100 |
FundsManager 85% Portfolio | $30,000 | $- | $3,400 | $100 |
Investor Freedom 2005 Portfolio | $30,000 | $- | $3,400 | $100 |
Investor Freedom 2010 Portfolio | $30,000 | $- | $3,400 | $100 |
Investor Freedom 2015 Portfolio | $30,000 | $- | $3,400 | $100 |
Investor Freedom 2020 Portfolio | $30,000 | $- | $3,400 | $100 |
Investor Freedom 2025 Portfolio | $30,000 | $- | $3,400 | $100 |
Investor Freedom 2030 Portfolio | $30,000 | $- | $3,400 | $100 |
Investor Freedom Income Portfolio | $30,000 | $- | $3,400 | $100 |
Strategic Income Portfolio | $70,000 | $- | $3,400 | $1,600 |
A Amounts may reflect rounding.
The following table presents fees billed by PwC and Deloitte Entities that were required to be approved by the Audit Committee for services that relate directly to the operations and financial reporting of the Funds and that are rendered on behalf of Fidelity Management & Research Company ("FMR") and entities controlling, controlled by, or under common control with FMR (not including any sub-adviser whose role is primarily portfolio management and is subcontracted with or overseen by another investment adviser) that provide ongoing services to the Funds ("Fund Service Providers"):
Services Billed by Deloitte Entities
| December 31, 2010A | December 31, 2009A |
Audit-Related Fees | $645,000 | $725,000 |
Tax Fees | $- | $- |
All Other Fees | $840,000 | $515,000 |
A Amounts may reflect rounding.
Services Billed by PwC
| December 31, 2010A | December 31, 2009A |
Audit-Related Fees | $2,505,000 | $2,655,000 |
Tax Fees | $- | $- |
All Other Fees | $510,000 | $- |
A Amounts may reflect rounding.
"Audit-Related Fees" represent fees billed for assurance and related services that are reasonably related to the performance of the fund audit or the review of the fund's financial statements and that are not reported under Audit Fees.
"Tax Fees" represent fees billed for tax compliance, tax advice or tax planning that relate directly to the operations and financial reporting of the fund.
"All Other Fees" represent fees billed for services provided to the fund or Fund Service Provider, a significant portion of which are assurance related, that relate directly to the operations and financial reporting of the fund, excluding those services that are reported under Audit Fees, Audit-Related Fees or Tax Fees.
Assurance services must be performed by an independent public accountant.
* * *
The aggregate non-audit fees billed by PwC and Deloitte Entities for services rendered to the Funds, FMR (not including any sub-adviser whose role is primarily portfolio management and is subcontracted with or overseen by another investment adviser), and any Fund Service Provider for each of the last two fiscal years of the Funds are as follows:
Billed By | December 31, 2010 A | December 31, 2009 A |
PwC | $5,050,000 | $4,590,000 |
Deloitte Entities | $1,660,000 | $1,320,000 |
A Amounts may reflect rounding.
The trust's Audit Committee has considered non-audit services that were not pre-approved that were provided by PwC and Deloitte Entities to Fund Service Providers to be compatible with maintaining the independence of PwC and Deloitte Entities in their audits of the Funds, taking into account representations from PwC and Deloitte Entities, in accordance with Public Company Accounting Oversight Board rules, regarding their independence from the Funds and their related entities and FMR's review of the appropriateness and permissibility under applicable law of such non-audit services prior to their provision to the Fund Service Providers.
Audit Committee Pre-Approval Policies and Procedures
The trust's Audit Committee must pre-approve all audit and non-audit services provided by a fund's independent registered public accounting firm relating to the operations or financial reporting of the fund. Prior to the commencement of any audit or non-audit services to a fund, the Audit Committee reviews the services to determine whether they are appropriate and permissible under applicable law.
The Audit Committee has adopted policies and procedures to, among other purposes, provide a framework for the Committee's consideration of non-audit services by the audit firms that audit the Fidelity funds. The policies and procedures require that any non-audit service provided by a fund audit firm to a Fidelity fund and any non-audit service provided by a fund auditor to a Fund Service Provider that relates directly to the operations and financial reporting of a Fidelity fund ("Covered Service") are subject to approval by the Audit Committee before such service is provided.
All Covered Services must be approved in advance of provision of the service either: (i) by formal resolution of the Audit Committee, or (ii) by oral or written approval of the service by the Chair of the Audit Committee (or if the Chair is unavailable, such other member of the Audit Committee as may be designated by the Chair to act in the Chair's absence). The approval contemplated by (ii) above is permitted where the Treasurer determines that action on such an engagement is necessary before the next meeting of the Audit Committee.
Non-audit services provided by a fund audit firm to a Fund Service Provider that do not relate directly to the operations and financial reporting of a Fidelity fund are reported to the Audit Committee on a periodic basis.
Non-Audit Services Approved Pursuant to Rule 2-01(c)(7)(i)(C) and (ii) of Regulation S-X ("De Minimis Exception")
There were no non-audit services approved or required to be approved by the Audit Committee pursuant to the De Minimis Exception during the Funds' last two fiscal years relating to services provided to (i) the Funds or (ii) any Fund Service Provider that relate directly to the operations and financial reporting of the Funds.
Item 5. Audit Committee of Listed Registrants
Not applicable.
Item 6. Investments
(a) Not applicable.
(b) Not applicable
Item 7. Disclosure of Proxy Voting Policies and Procedures for Closed-End Management Investment Companies
Not applicable.
Item 8. Portfolio Managers of Closed-End Management Investment Companies
Not applicable.
Item 9. Purchase of Equity Securities by Closed-End Management Investment Company and Affiliated Purchasers
Not applicable.
Item 10. Submission of Matters to a Vote of Security Holders
There were no material changes to the procedures by which shareholders may recommend nominees to the trust's Board of Trustees.
Item 11. Controls and Procedures
(a)(i) The President and Treasurer and the Chief Financial Officer have concluded that the disclosure controls and procedures (as defined in Rule 30a-3(c) under the Investment Company Act) for each Fund provide reasonable assurances that material information relating to such Fund is made known to them by the appropriate persons, based on their evaluation of these controls and procedures as of a date within 90 days of the filing date of this report.
(a)(ii) There was no change in a Fund's internal control over financial reporting (as defined in Rule 30a-3(d) under the Investment Company Act) that occurred during the second fiscal quarter of the period covered by this report that has materially affected, or is reasonably likely to materially affect, a Fund's internal control over financial reporting.
Item 12. Exhibits
(a) | (1) | Code of Ethics pursuant to Item 2 of Form N-CSR is filed and attached hereto as EX-99.CODE ETH. |
(a) | (2) | Certification pursuant to Rule 30a-2(a) under the Investment Company Act of 1940 (17 CFR 270.30a-2(a)) is filed and attached hereto as Exhibit 99.CERT. |
(a) | (3) | Not applicable. |
(b) | | Certification pursuant to Rule 30a-2(b) under the Investment Company Act of 1940 (17 CFR 270.30a-2(b)) is furnished and attached hereto as Exhibit 99.906CERT. |
SIGNATURES
Pursuant to the requirements of the Securities Exchange Act of 1934 and the Investment Company Act of 1940, the registrant has duly caused this report to be signed on its behalf by the undersigned, thereunto duly authorized.
Variable Insurance Products Fund V
By: | /s/John R. Hebble |
| John R. Hebble |
| President and Treasurer |
| |
Date: | March 3, 2011 |
Pursuant to the requirements of the Securities Exchange Act of 1934 and the Investment Company Act of 1940, this report has been signed below by the following persons on behalf of the registrant and in the capacities and on the dates indicated.
By: | /s/John R. Hebble |
| John R. Hebble |
| President and Treasurer |
| |
Date: | March 3, 2011 |
By: | /s/Christine Reynolds |
| Christine Reynolds |
| Chief Financial Officer |
| |
Date: | March 3, 2011 |