UNITED STATES
SECURITIES AND EXCHANGE COMMISSION
Washington, D.C. 20549
FORM N-CSR
CERTIFIED SHAREHOLDER REPORT OF REGISTERED
MANAGEMENT INVESTMENT COMPANIES
Investment Company Act file number 811-5361
Variable Insurance Products Fund V
(Exact name of registrant as specified in charter)
82 Devonshire St., Boston, Massachusetts 02109
(Address of principal executive offices) (Zip code)
Scott C. Goebel, Secretary
82 Devonshire St.
Boston, Massachusetts 02109
(Name and address of agent for service)
Registrant's telephone number, including area code: 617-563-7000
Date of fiscal year end: | December 31 |
| |
Date of reporting period: | December 31, 2011 |
This report on Form N-CSR relates solely to the Registrant's Asset Manager Portfolio, Asset Manager: Growth Portfolio, Freedom 2005 Portfolio, Freedom 2010 Portfolio, Freedom 2015 Portfolio, Freedom 2020 Portfolio, Freedom 2025 Portfolio, Freedom 2030 Portfolio, Freedom 2035 Portfolio, Freedom 2040 Portfolio, Freedom 2045 Portfolio, Freedom 2050 Portfolio, Freedom Income Portfolio, Freedom Lifetime Income I Portfolio, Freedom Lifetime Income II Portfolio, Freedom Lifetime Income III Portfolio, FundsManager 20% Portfolio, FundsManager 50% Portfolio, FundsManager 60%, FundsManager 70% Portfolio, FundsManager 85% Portfolio, Investment Grade Bond Portfolio, Investor Freedom 2005 Portfolio, Investor Freedom 2010 Portfolio, Investor Freedom 2015 Portfolio, Investor Freedom 2020 Portfolio, Investor Freedom 2025 Portfolio, Investor Freedom 2030 Portfolio, Investor Freedom Income Portfolio and Strategic Income Portfolio series (each, a "Fund" and collectively, the "Funds").
Item 1. Reports to Stockholders
Fidelity® Variable Insurance Products:
Asset Manager Portfolio
Annual Report
December 31, 2011

Contents
Performance | (Click Here) | How the fund has done over time. |
Management's Discussion of Fund Performance | (Click Here) | The Portfolio Manager's review of fund performance and strategy. |
Shareholder Expense Example | (Click Here) | An example of shareholder expenses. |
Investment Changes | (Click Here) | A summary of major shifts in the fund's investments over the past six months. |
Investments | (Click Here) | A complete list of the fund's investments with their market values. |
Financial Statements | (Click Here) | Statements of assets and liabilities, operations, and changes in net assets, as well as financial highlights. |
Notes | (Click Here) | Notes to the financial statements. |
Report of Independent Registered Public Accounting Firm | (Click Here) | |
Trustees and Officers | (Click Here) | |
Distributions | (Click Here) | |
Board Approval of Investment Advisory Contracts and Management Fees | (Click Here) | |
To view a fund's proxy voting guidelines and proxy voting record for the 12-month period ended June 30, visit http://www.fidelity.com/proxyvotingresults or visit the Securities and Exchange Commission's (SEC) web site at http://www.sec.gov. You may also call 1-877-208-0098 to request a free copy of the proxy voting guidelines.
Fidelity Variable Insurance Products are separate account options which are purchased through a variable insurance contract.
Standard & Poor's, S&P and S&P 500 are registered service marks of The McGraw-Hill Companies, Inc. and have been licensed for use by Fidelity Distributors Corporation.
Other third party marks appearing herein are the property of their respective owners.
All other marks appearing herein are registered or unregistered trademarks or service marks of FMR LLC or an affiliated company.
This report and the financial statements contained herein are submitted for the general information of the shareholders of the fund. This report is not authorized for distribution to prospective investors in the fund unless preceded or accompanied by an effective prospectus.
A fund files its complete schedule of portfolio holdings with the SEC for the first and third quarters of each fiscal year on Form N-Q. Forms N-Q are available on the SEC's web site at http://www.sec.gov. A fund's Forms N-Q may be reviewed and copied at the SEC's Public Reference Room in Washington, DC. Information regarding the operation of the SEC's Public Reference Room may be obtained by calling 1-800-SEC-0330. For a complete list of a fund's portfolio holdings, view the most recent holdings listing, semiannual report, or annual report on Fidelity's web site at http://www.fidelity.com, http://www.advisor.fidelity.com, or http://www.401k.com, as applicable.
NOT FDIC INSURED • MAY LOSE VALUE • NO BANK GUARANTEE
Neither the fund nor Fidelity Distributors Corporation is a bank.
Annual Report
Average annual total return reflects the change in the value of an investment, assuming reinvestment of the class' distributions from dividend income and capital gains (the profits earned upon the sale of securities that have grown in value, if any) and assuming a constant rate of performance each year. During periods of reimbursement by Fidelity, a fund's total return will be greater than it would be had the reimbursement not occurred. Performance numbers are net of all underlying fund operating expenses, but do not include any insurance charges imposed by your insurance company's separate account. If performance information included the effect of these additional charges, the total returns would have been lower. How a fund did yesterday is no guarantee of how it will do tomorrow.
Average Annual Total Returns
Periods ended December 31, 2011 | Past 1
year | Past 5
years | Past 10
years |
VIP Asset Manager Portfolio - Initial Class | -2.56% | 3.43% | 4.14% |
VIP Asset Manager Portfolio - Service Class | -2.69% | 3.30% | 4.03% |
VIP Asset Manager Portfolio - Service Class 2 | -2.82% | 3.15% | 3.87% |
VIP Asset Manager Portfolio - Investor Class A | -2.72% | 3.32% | 4.06% |
A The initial offering of Investor Class shares took place on July 21, 2005. Returns prior to July 21, 2005 are those of Initial Class. Had Investor Class's transfer agent fee been reflected, returns prior to July 21, 2005 would have been lower.
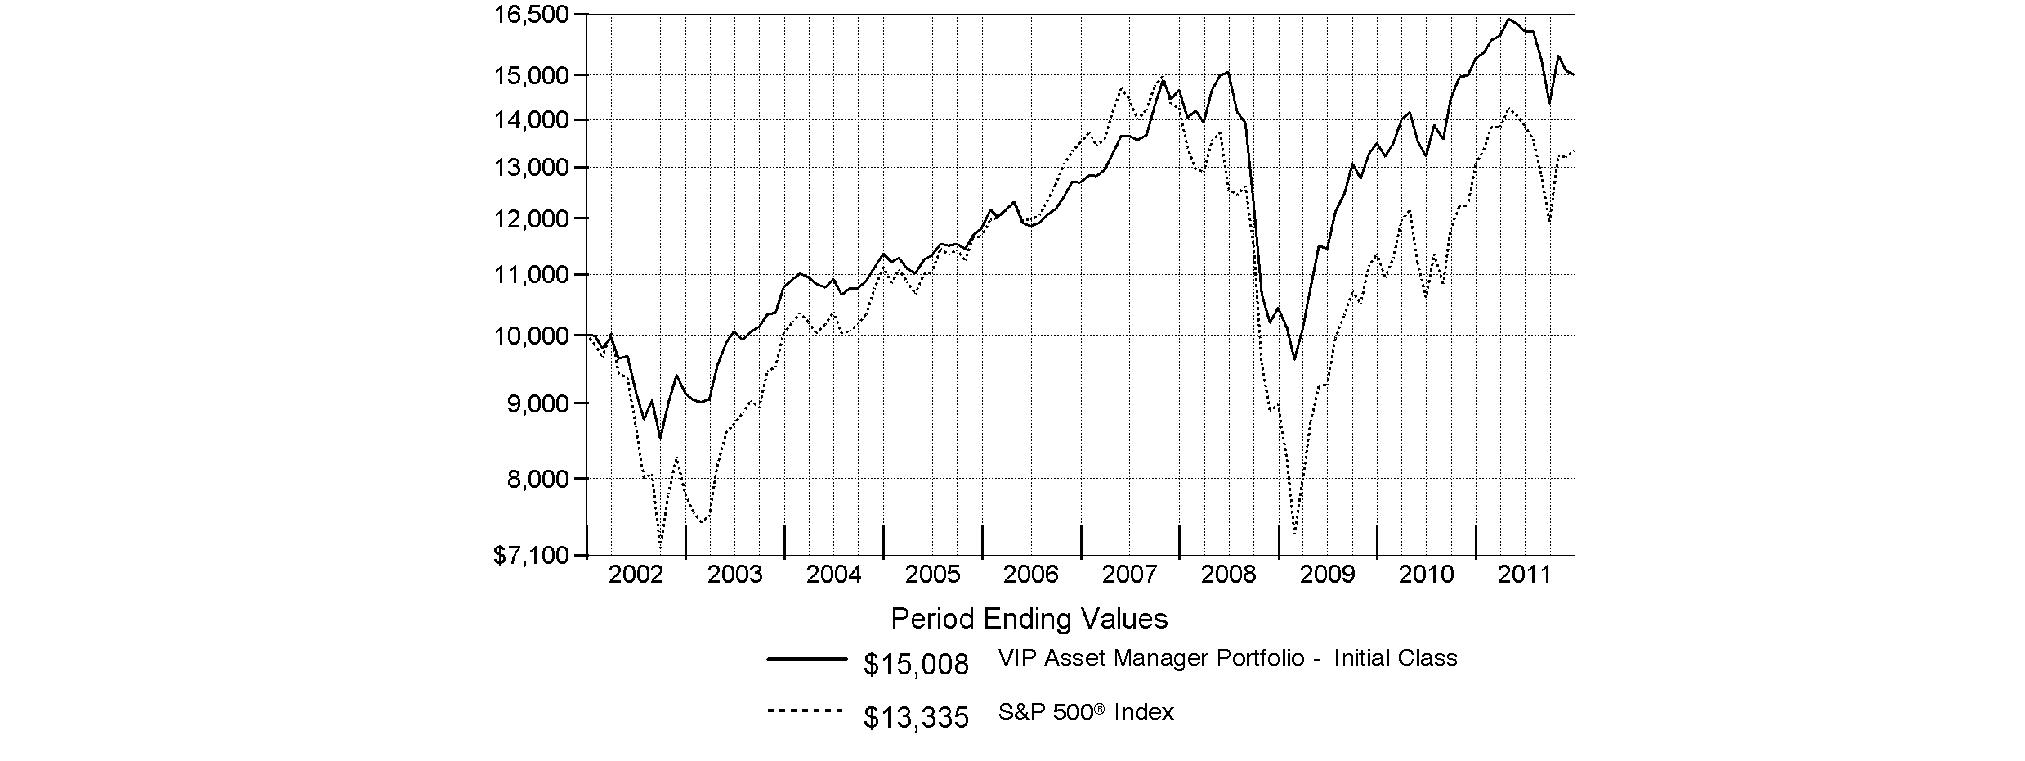
$10,000 Over 10 Years
Let's say hypothetically that $10,000 was invested in VIP Asset Manager Portfolio - Initial Class on December 31, 2001. The chart shows how the value of your investment would have changed, and also shows how the S&P 500® Index performed over the same period.
Annual Report
Market Recap: Extreme market volatility took center stage during the 12 months ending December 31, 2011, stealing the spotlight from signs of progress in the global economy. Early in the year, aggressive monetary stimulus by the U.S. federal government, improving credit-market conditions and solid corporate earnings buoyed most major asset classes. As the period progressed, however, fresh worries about sovereign debt in Europe, inflation in China, gridlock over raising the debt ceiling in the U.S. - along with Standard & Poor's early-August downgrade of the nation's long-term sovereign credit rating - and a dimmed outlook for global growth punctured investor confidence and ignited market instability. Domestic equities, as measured by the broad-based S&P 500® Index, gained 2.11%, easily outpacing the 13.61% decline of MSCI® ACWI® (All Country World Index) ex USA Index, a proxy for foreign stocks. Within the MSCI index, emerging markets declined the most (-18%), with investments here generally held back by a stronger U.S. dollar. The U.K. (-3%) fared better than the rest of Europe (-15%), which was the second-worst-performing index component. Bolstered by periodic flights to quality, U.S. investment-grade bonds posted a 7.84% advance, as reflected by the Barclays Capital® U.S. Aggregate Bond Index, outperforming the 4.37% gain of high-yield securities, as represented by The BofA Merrill LynchSM US High Yield Constrained Index. Hampered by financial woes in Europe, the sovereign debt of major developed markets outside the U.S. rose 4.86%, according to the Citigroup® Non-USD Group-of-Seven (G7) Equal Weighted Index, while the JPMorgan Emerging Markets Bond Index Global (EMBI Global) advanced 8.46%, despite the currency head wind.
Comments from Geoff Stein, Portfolio Manager of VIP Asset Manager Portfolio: For the year ending December 31, 2011, the fund's share classes underperformed the 1.92% return of the Fidelity Asset Manager 50% Composite Index. (For specific portfolio results, please see the performance section of this report.) Poor domestic equity security selection overwhelmed the modest benefit of favorable weighting decisions here, and was, by far, the biggest reason for the fund's underperformance. The U.S. equity subportfolio suffered the most during the third quarter when investors moved out of growth and cyclical stocks, which represented the bulk of its holdings, in favor of defensive sectors, such as utilities, consumer staples and health care. Various factors drove this shift, but the overriding one was a growing fear that the sovereign debt crisis in Europe might spin out of control. On a sector basis, energy, information technology, consumer discretionary and industrials all had a significant negative impact on the subportfolio's results during the year, mainly because of stock selection. Adverse positioning in materials and health care, along with underexposure to utilities, also hurt. Modest out-of-benchmark exposure to emerging-markets (EM) equities also hampered performance. EM stocks responded to the global flight from risk with greater volatility than either U.S. or foreign developed-markets equities, and performed considerably worse in U.S. dollar terms. A small allocation to commodities was another detractor, as this economically sensitive asset class struggled amid heightened concern about a global economic slowdown. On the plus side, underweighting foreign developed-markets equities outweighed weak security selection in that category. I continued to have a dim view of European markets, given the sharp fiscal and economic contrasts between core and peripheral eurozone countries. Additionally, I thought the euro was relatively unattractive and, since we do not hedge foreign currency exposure, wanted to limit the fund's allocation to it. In the investment-grade bond central fund, out-of-index holdings in Treasury Inflation-Protected Securities (TIPS) provided a nice boost, as did my well-timed tactical allocation to the asset class. I added the TIPS position during the summer, in time to benefit from the bouts of investor risk aversion that ensued during the remainder of the period. Lastly, out-of-benchmark allocations to high-yield bonds and floating-rate bank-loan securities were additional contributors.
The views expressed above reflect those of the portfolio manager(s) only through the end of the period as stated on the cover of this report and do not necessarily represent the views of Fidelity or any other person in the Fidelity organization. Any such views are subject to change at any time based upon market or other conditions and Fidelity disclaims any responsibility to update such views. These views may not be relied on as investment advice and, because investment decisions for a Fidelity fund are based on numerous factors, may not be relied on as an indication of trading intent on behalf of any Fidelity fund.
Annual Report
As a shareholder of the Fund, you incur two types of costs: (1) transaction costs, and (2) ongoing costs, including management fees, distribution and/or service (12b-1) fees and other Fund expenses. This Example is intended to help you understand your ongoing costs (in dollars) of investing in the Fund and to compare these costs with the ongoing costs of investing in other mutual funds.
The Example is based on an investment of $1,000 invested at the beginning of the period and held for the entire period (July 1, 2011 to December 31, 2011).
Actual Expenses
The first line of the accompanying table for each class of the Fund provides information about actual account values and actual expenses. You may use the information in this line, together with the amount you invested, to estimate the expenses that you paid over the period. Simply divide your account value by $1,000.00 (for example, an $8,600 account value divided by $1,000.00 = 8.6), then multiply the result by the number in the first line for a class of the Fund under the heading entitled "Expenses Paid During Period" to estimate the expenses you paid on your account during this period. The estimate of expenses does not include any fees or other expenses of any variable annuity or variable life insurance product. If they were, the estimate of expenses you paid during the period would be higher, and your ending account value would be lower. In addition, the Fund, as a shareholder in the underlying Fidelity Central Funds, will indirectly bear its pro-rata share of the fees and expenses incurred by the underlying Fidelity Central Funds. These fees and expenses are not included in the Fund's annualized expense ratio used to calculate the expense estimate in the table below.
Hypothetical Example for Comparison Purposes
The second line of the accompanying table for each class of the Fund provides information about hypothetical account values and hypothetical expenses based on a Class' actual expense ratio and an assumed rate of return of 5% per year before expenses, which is not the Class' actual return. The hypothetical account values and expenses may not be used to estimate the actual ending account balance or expenses you paid for the period. You may use this information to compare the ongoing costs of investing in the Fund and other funds. To do so, compare this 5% hypothetical example with the 5% hypothetical examples that appear in the shareholder reports of the other funds. The estimate of expenses does not include any fees or other expenses of any variable annuity or variable life insurance product. If they were, the estimate of expenses you paid during the period would be higher, and your ending account value would be lower. In addition, the Fund, as a shareholder in the underlying Fidelity Central Funds, will indirectly bear its pro-rata share of the fees and expenses incurred by the underlying Fidelity Central Funds. These fees and expenses are not included in the Fund's annualized expense ratio used to calculate the expense estimate in the table below.
Please note that the expenses shown in the table are meant to highlight your ongoing costs only and do not reflect any transaction costs. Therefore, the second line of the table is useful in comparing ongoing costs only, and will not help you determine the relative total costs of owning different funds.
| Annualized Expense Ratio | Beginning
Account Value
July 1, 2011 | Ending
Account Value
December 31, 2011 | Expenses Paid
During Period*
July 1, 2011 to
December 31, 2011 |
Initial Class | .63% | | | |
Actual | | $ 1,000.00 | $ 934.80 | $ 3.07 |
HypotheticalA | | $ 1,000.00 | $ 1,022.03 | $ 3.21 |
Service Class | .75% | | | |
Actual | | $ 1,000.00 | $ 934.00 | $ 3.66 |
HypotheticalA | | $ 1,000.00 | $ 1,021.42 | $ 3.82 |
Service Class 2 | .90% | | | |
Actual | | $ 1,000.00 | $ 933.60 | $ 4.39 |
HypotheticalA | | $ 1,000.00 | $ 1,020.67 | $ 4.58 |
Investor Class | .71% | | | |
Actual | | $ 1,000.00 | $ 934.40 | $ 3.46 |
HypotheticalA | | $ 1,000.00 | $ 1,021.63 | $ 3.62 |
A 5% return per year before expenses
* Expenses are equal to each Class' annualized expense ratio, multiplied by the average account value over the period, multiplied by 184/365 (to reflect the one-half year period). The fees and expenses of the underlying Fidelity Central Funds in which the Fund invests are not included in the Fund's annualized expense ratio.
Annual Report
Investment Changes (Unaudited)
The information in the following tables is based on the combined investments of the Fund and its pro-rata share of the investments of Fidelity's Central Funds, other than the Commodity Strategy and Money Market Central Funds. |
Top Five Stocks as of December 31, 2011 |
| % of fund's
net assets | % of fund's net assets
6 months ago |
Apple, Inc. | 2.2 | 1.4 |
Chevron Corp. | 0.9 | 0.9 |
United Continental Holdings, Inc. | 0.8 | 0.8 |
Schlumberger Ltd. | 0.6 | 0.8 |
Pioneer Natural Resources Co. | 0.6 | 0.5 |
| 5.1 | |
Top Five Bond Issuers as of December 31, 2011 |
(with maturities greater than one year) | % of fund's
net assets | % of fund's net assets
6 months ago |
U.S. Treasury Obligations | 9.8 | 9.8 |
Fannie Mae | 8.8 | 8.6 |
Freddie Mac | 2.8 | 1.8 |
Ginnie Mae | 2.5 | 2.7 |
Citigroup, Inc. | 0.2 | 0.3 |
| 24.1 | |
Top Five Market Sectors as of December 31, 2011 |
| % of fund's
net assets | % of fund's net assets
6 months ago |
Consumer Discretionary | 12.5 | 9.9 |
Financials | 11.1 | 10.4 |
Energy | 9.2 | 9.1 |
Information Technology | 8.2 | 8.8 |
Industrials | 5.5 | 7.3 |
Asset Allocation (% of fund's net assets) |
As of December 31, 2011 * | As of June 30, 2011 ** |
 | Stock Class and
Equity Futures*** 46.1% | | | Stock Class and
Equity Futures**** 50.3% | |
 | Bond Class 45.3% | | | Bond Class 42.2% | |
 | Short-Term Class 8.6% | | | Short-Term Class 7.5% | |
* Foreign investments | 18.0% | | ** Foreign investments | 23.0% | |

*** Includes investment in Fidelity Commodity Strategy Central Fund of 1.4%.
**** Includes investment in Fidelity Commodity Strategy Central Fund of 1.0%.
Asset allocations in the pie charts reflect the categorization of assets as defined in the fund's prospectus in effect as of the time periods indicated above. Financial Statement categorizations conform to accounting standards and will differ from the pie chart. Percentages are adjusted for the effect of futures contracts and swap contracts, if applicable.
An unaudited holdings listing for the Fund, which presents direct holdings as well as the pro-rata share of any securities and other investments held indirectly through its investment in underlying Fidelity Central Funds, other than the Commodity Strategy and Money Market Central Funds, is available at advisor.fidelity.com.
Annual Report
Investments December 31, 2011
Showing Percentage of Net Assets
Common Stocks - 33.0% |
| Shares | | Value |
CONSUMER DISCRETIONARY - 9.1% |
Auto Components - 0.7% |
Autoliv, Inc. | 49,400 | | $ 2,642,406 |
BorgWarner, Inc. (a) | 32,400 | | 2,065,176 |
TRW Automotive Holdings Corp. (a) | 131,200 | | 4,277,120 |
| | 8,984,702 |
Automobiles - 0.4% |
Ford Motor Co. | 489,300 | | 5,264,868 |
Diversified Consumer Services - 0.3% |
Anhanguera Educacional Participacoes SA | 55,400 | | 597,649 |
Weight Watchers International, Inc. | 50,000 | | 2,750,500 |
| | 3,348,149 |
Hotels, Restaurants & Leisure - 0.5% |
Arcos Dorados Holdings, Inc. | 61,400 | | 1,260,542 |
Panera Bread Co. Class A (a) | 20,400 | | 2,885,580 |
Yum! Brands, Inc. | 30,200 | | 1,782,102 |
| | 5,928,224 |
Household Durables - 0.7% |
Gafisa SA sponsored ADR | 241,200 | | 1,109,520 |
KB Home | 197,600 | | 1,327,872 |
PulteGroup, Inc. (a) | 707,500 | | 4,464,325 |
Toll Brothers, Inc. (a) | 67,500 | | 1,378,350 |
| | 8,280,067 |
Internet & Catalog Retail - 0.2% |
Amazon.com, Inc. (a) | 6,000 | | 1,038,600 |
Groupon, Inc. Class A (a)(d) | 78,700 | | 1,623,581 |
| | 2,662,181 |
Media - 0.7% |
CBS Corp. Class B | 129,100 | | 3,503,774 |
The Walt Disney Co. | 160,700 | | 6,026,250 |
| | 9,530,024 |
Multiline Retail - 1.1% |
Dollar General Corp. (a) | 16,300 | | 670,582 |
Dollar Tree, Inc. (a) | 33,300 | | 2,767,563 |
Lojas Renner SA | 26,000 | | 675,537 |
Macy's, Inc. | 191,600 | | 6,165,688 |
Target Corp. | 63,100 | | 3,231,982 |
| | 13,511,352 |
Specialty Retail - 2.1% |
Dick's Sporting Goods, Inc. | 34,300 | | 1,264,984 |
Home Depot, Inc. | 122,600 | | 5,154,104 |
Limited Brands, Inc. | 147,000 | | 5,931,450 |
PetSmart, Inc. | 25,600 | | 1,313,024 |
Tiffany & Co., Inc. | 14,300 | | 947,518 |
TJX Companies, Inc. | 85,000 | | 5,486,750 |
Vitamin Shoppe, Inc. (a) | 21,800 | | 869,384 |
Williams-Sonoma, Inc. | 145,000 | | 5,582,500 |
| | 26,549,714 |
|
| Shares | | Value |
Textiles, Apparel & Luxury Goods - 2.4% |
Arezzo Industria e Comercio SA | 91,700 | | $ 1,141,821 |
Burberry Group PLC | 69,200 | | 1,273,614 |
Coach, Inc. | 38,700 | | 2,362,248 |
Deckers Outdoor Corp. (a) | 91,300 | | 6,899,541 |
Fossil, Inc. (a) | 44,000 | | 3,491,840 |
Michael Kors Holdings Ltd. | 7,800 | | 212,550 |
Michael Kors Holdings Ltd. | 103,132 | | 2,529,312 |
Prada SpA | 110,800 | | 501,458 |
PVH Corp. | 29,900 | | 2,107,651 |
Ralph Lauren Corp. | 14,900 | | 2,057,392 |
Under Armour, Inc. Class A (sub. vtg.) (a) | 13,800 | | 990,702 |
Vera Bradley, Inc. (a)(d) | 70,200 | | 2,263,950 |
VF Corp. | 31,400 | | 3,987,486 |
| | 29,819,565 |
TOTAL CONSUMER DISCRETIONARY | | 113,878,846 |
CONSUMER STAPLES - 1.2% |
Beverages - 0.3% |
Hansen Natural Corp. (a) | 43,700 | | 4,026,518 |
Food & Staples Retailing - 0.1% |
Drogasil SA | 98,506 | | 685,714 |
Food Products - 0.4% |
Green Mountain Coffee Roasters, Inc. (a) | 121,100 | | 5,431,335 |
Personal Products - 0.4% |
Hengan International Group Co. Ltd. | 320,000 | | 2,993,330 |
Nu Skin Enterprises, Inc. Class A | 50,200 | | 2,438,214 |
| | 5,431,544 |
TOTAL CONSUMER STAPLES | | 15,575,111 |
ENERGY - 6.1% |
Energy Equipment & Services - 1.6% |
Baker Hughes, Inc. | 95,600 | | 4,649,984 |
Carbo Ceramics, Inc. (d) | 14,800 | | 1,825,284 |
Halliburton Co. | 145,100 | | 5,007,401 |
McDermott International, Inc. (a) | 98,500 | | 1,133,735 |
Schlumberger Ltd. | 119,013 | | 8,129,778 |
| | 20,746,182 |
Oil, Gas & Consumable Fuels - 4.5% |
Anadarko Petroleum Corp. | 51,300 | | 3,915,729 |
Cabot Oil & Gas Corp. | 19,800 | | 1,502,820 |
Chevron Corp. | 104,000 | | 11,065,600 |
Concho Resources, Inc. (a) | 62,300 | | 5,840,625 |
Continental Resources, Inc. (a) | 101,500 | | 6,771,065 |
Hess Corp. | 22,500 | | 1,278,000 |
HollyFrontier Corp. | 63,000 | | 1,474,200 |
Kosmos Energy Ltd. | 62,000 | | 760,120 |
Marathon Oil Corp. | 52,500 | | 1,536,675 |
Oasis Petroleum, Inc. (a) | 81,100 | | 2,359,199 |
Occidental Petroleum Corp. | 73,500 | | 6,886,950 |
Common Stocks - continued |
| Shares | | Value |
ENERGY - continued |
Oil, Gas & Consumable Fuels - continued |
Pioneer Natural Resources Co. | 84,000 | | $ 7,516,320 |
Whiting Petroleum Corp. (a) | 111,800 | | 5,219,942 |
| | 56,127,245 |
TOTAL ENERGY | | 76,873,427 |
FINANCIALS - 1.3% |
Capital Markets - 0.8% |
Apollo Global Management LLC Class A | 347,200 | | 4,308,752 |
Morgan Stanley | 411,100 | | 6,219,943 |
| | 10,528,695 |
Diversified Financial Services - 0.4% |
Citigroup, Inc. | 174,100 | | 4,580,571 |
Real Estate Management & Development - 0.1% |
CBRE Group, Inc. (a) | 78,100 | | 1,188,682 |
TOTAL FINANCIALS | | 16,297,948 |
HEALTH CARE - 3.6% |
Biotechnology - 0.7% |
Alexion Pharmaceuticals, Inc. (a) | 62,300 | | 4,454,450 |
Clovis Oncology, Inc. | 14,000 | | 197,260 |
Inhibitex, Inc. (a) | 60,000 | | 656,400 |
InterMune, Inc. (a) | 23,500 | | 296,100 |
Vertex Pharmaceuticals, Inc. (a) | 105,800 | | 3,513,618 |
| | 9,117,828 |
Health Care Providers & Services - 1.8% |
Accretive Health, Inc. (a) | 91,200 | | 2,095,776 |
HMS Holdings Corp. (a) | 84,900 | | 2,715,102 |
Humana, Inc. | 73,000 | | 6,395,530 |
UnitedHealth Group, Inc. | 121,400 | | 6,152,552 |
WellPoint, Inc. | 75,200 | | 4,982,000 |
| | 22,340,960 |
Health Care Technology - 0.1% |
SXC Health Solutions Corp. (a) | 26,200 | | 1,473,364 |
Pharmaceuticals - 1.0% |
Elan Corp. PLC sponsored ADR (a) | 301,500 | | 4,142,610 |
Shire PLC sponsored ADR | 30,300 | | 3,148,170 |
Valeant Pharmaceuticals International, Inc. (Canada) | 100,450 | | 4,700,950 |
| | 11,991,730 |
TOTAL HEALTH CARE | | 44,923,882 |
INDUSTRIALS - 3.2% |
Airlines - 1.6% |
Copa Holdings SA Class A | 32,900 | | 1,930,243 |
Delta Air Lines, Inc. (a) | 856,125 | | 6,926,051 |
|
| Shares | | Value |
Gol Linhas Aereas Inteligentes SA: | | | |
rights 1/26/12 (a) | 5,205 | | $ 0 |
sponsored ADR (d) | 104,500 | | 692,835 |
United Continental Holdings, Inc. (a) | 559,770 | | 10,562,860 |
| | 20,111,989 |
Building Products - 0.2% |
Owens Corning (a) | 68,500 | | 1,967,320 |
Commercial Services & Supplies - 0.0% |
Swisher Hygiene, Inc. | 135,158 | | 505,491 |
Electrical Equipment - 0.1% |
Roper Industries, Inc. | 18,200 | | 1,581,034 |
Machinery - 0.7% |
Caterpillar, Inc. | 12,800 | | 1,159,680 |
Dover Corp. | 18,500 | | 1,073,925 |
Kennametal, Inc. | 54,400 | | 1,986,688 |
Parker Hannifin Corp. | 32,200 | | 2,455,250 |
Sandvik AB | 33,100 | | 406,240 |
WABCO Holdings, Inc. (a) | 11,300 | | 490,420 |
Weg SA | 81,700 | | 823,490 |
| | 8,395,693 |
Professional Services - 0.3% |
Qualicorp SA | 108,000 | | 970,910 |
Robert Half International, Inc. | 102,600 | | 2,919,996 |
| | 3,890,906 |
Trading Companies & Distributors - 0.3% |
Air Lease Corp.: | | | |
Class A (a)(e) | 59,100 | | 1,401,261 |
Class A | 59,300 | | 1,406,003 |
Mills Estruturas e Servicos de Engenharia SA | 95,400 | | 906,280 |
| | 3,713,544 |
TOTAL INDUSTRIALS | | 40,165,977 |
INFORMATION TECHNOLOGY - 6.8% |
Communications Equipment - 0.7% |
Cisco Systems, Inc. | 339,500 | | 6,138,160 |
HTC Corp. | 32,150 | | 527,606 |
QUALCOMM, Inc. | 14,900 | | 815,030 |
Riverbed Technology, Inc. (a) | 59,200 | | 1,391,200 |
| | 8,871,996 |
Computers & Peripherals - 2.2% |
Apple, Inc. (a) | 68,300 | | 27,661,500 |
Fusion-io, Inc. | 10,100 | | 244,420 |
| | 27,905,920 |
Internet Software & Services - 1.2% |
Active Network, Inc. | 51,500 | | 700,400 |
Bankrate, Inc. (d) | 68,600 | | 1,474,900 |
Cornerstone OnDemand, Inc. (d) | 66,800 | | 1,218,432 |
Facebook, Inc. Class B (h) | 8,621 | | 215,525 |
Google, Inc. Class A (a) | 9,600 | | 6,200,640 |
Rackspace Hosting, Inc. (a) | 54,100 | | 2,326,841 |
Common Stocks - continued |
| Shares | | Value |
INFORMATION TECHNOLOGY - continued |
Internet Software & Services - continued |
Renren, Inc. ADR (d) | 33,100 | | $ 117,505 |
VeriSign, Inc. | 49,400 | | 1,764,568 |
YouKu.com, Inc. ADR (a)(d) | 20,200 | | 316,534 |
| | 14,335,345 |
IT Services - 0.6% |
Cognizant Technology Solutions Corp. Class A (a) | 77,300 | | 4,971,163 |
MasterCard, Inc. Class A | 7,700 | | 2,870,714 |
| | 7,841,877 |
Semiconductors & Semiconductor Equipment - 0.8% |
Altera Corp. | 36,900 | | 1,368,990 |
ASML Holding NV | 84,600 | | 3,535,434 |
Freescale Semiconductor Holdings I Ltd. | 121,800 | | 1,540,770 |
KLA-Tencor Corp. | 24,300 | | 1,172,475 |
NXP Semiconductors NV (a) | 173,300 | | 2,663,621 |
| | 10,281,290 |
Software - 1.3% |
Ariba, Inc. (a) | 21,511 | | 604,029 |
Citrix Systems, Inc. (a) | 55,100 | | 3,345,672 |
CommVault Systems, Inc. (a) | 23,900 | | 1,021,008 |
Informatica Corp. (a) | 110,700 | | 4,088,151 |
Jive Software, Inc. | 3,200 | | 51,200 |
RealPage, Inc. (a) | 54,500 | | 1,377,215 |
salesforce.com, Inc. (a) | 9,100 | | 923,286 |
Taleo Corp. Class A (a) | 40,200 | | 1,555,338 |
VMware, Inc. Class A (a) | 36,700 | | 3,053,073 |
Zynga, Inc. | 22,400 | | 210,784 |
| | 16,229,756 |
TOTAL INFORMATION TECHNOLOGY | | 85,466,184 |
MATERIALS - 1.4% |
Chemicals - 1.1% |
Celanese Corp. Class A | 83,000 | | 3,674,410 |
Dow Chemical Co. | 101,600 | | 2,922,016 |
LyondellBasell Industries NV Class A | 46,600 | | 1,514,034 |
Rockwood Holdings, Inc. (a) | 40,500 | | 1,594,485 |
The Mosaic Co. | 37,400 | | 1,886,082 |
Westlake Chemical Corp. | 51,700 | | 2,080,408 |
| | 13,671,435 |
Metals & Mining - 0.3% |
First Quantum Minerals Ltd. | 115,900 | | 2,281,810 |
Genel Energy PLC | 73,100 | | 879,898 |
| | 3,161,708 |
TOTAL MATERIALS | | 16,833,143 |
|
| Shares | | Value |
TELECOMMUNICATION SERVICES - 0.3% |
Wireless Telecommunication Services - 0.3% |
American Tower Corp. Class A | 51,600 | | $ 3,096,516 |
TOTAL COMMON STOCKS (Cost $381,842,132) |
413,111,034
|
Investment Companies - 2.5% |
| | | |
iShares Barclays TIPS Bond ETF
(Cost $30,964,304) | 273,300 | |
31,891,377
|
Fixed-Income Funds - 43.8% |
| | | |
Fidelity Emerging Markets Debt Central Fund (g) | 737,763 | | 7,362,876 |
Fidelity Floating Rate Central Fund (g) | 510,657 | | 50,197,537 |
Fidelity High Income Central Fund 1 (g) | 421,571 | | 40,230,514 |
Fidelity VIP Investment Grade Central Fund (g) | 4,181,369 | | 450,082,516 |
TOTAL FIXED-INCOME FUNDS (Cost $524,471,789) |
547,873,443
|
Equity Funds - 12.9% |
| | | |
Domestic Equity Funds - 1.4% |
Fidelity Commodity Strategy Central Fund (g) | 1,642,711 | | 17,527,726 |
International Equity Funds - 11.5% |
Fidelity Emerging Markets Equity Central Fund (g) | 131,671 | | 22,958,221 |
Fidelity International Equity Central Fund (g) | 2,021,563 | | 121,293,806 |
TOTAL INTERNATIONAL EQUITY FUNDS | | 144,252,027 |
TOTAL EQUITY FUNDS (Cost $194,472,961) |
161,779,753
|
U.S. Treasury Obligations - 0.2% |
| Principal Amount | | |
U.S. Treasury Bills, yield at date of purchase 0.01% 2/23/12 (f)
(Cost $2,749,938) | | $ 2,750,000 | |
2,749,951
|
Money Market Funds - 8.1% |
| Shares | | Value |
| | | |
Fidelity Cash Central Fund, 0.11% (b) | 85,533,317 | | $ 85,533,317 |
Fidelity Money Market Central Fund, 0.39% (b) | 10,373,893 | | 10,373,893 |
Fidelity Securities Lending Cash Central Fund, 0.13% (b)(c) | 5,907,973 | | 5,907,973 |
TOTAL MONEY MARKET FUNDS (Cost $101,815,183) |
101,815,183
|
TOTAL INVESTMENT PORTFOLIO - 100.5% (Cost $1,236,316,307) | 1,259,220,741 |
NET OTHER ASSETS (LIABILITIES) - (0.5)% | (6,886,306) |
NET ASSETS - 100% | $ 1,252,334,435 |
Futures Contracts |
| Expiration Date | | Underlying Face Amount at Value | | Unrealized Appreciation/(Depreciation) |
Purchased |
Equity Index Contracts |
77 CME E-mini S&P 500 Index Contracts | March 2012 | | $ 4,822,510 | | $ (1,656) |
|
The face value of futures purchased as a percentage of net assets is 0.4% |
Security Type Abbreviations |
ETFs - Exchange-Traded Funds |
Legend |
(a) Non-income producing |
(b) Affiliated fund that is available only to investment companies and other accounts managed by Fidelity Investments. The rate quoted is the annualized seven-day yield of the fund at period end. A complete unaudited listing of the fund's holdings as of its most recent quarter end is available upon request. In addition, each Fidelity Central Fund's financial statements, which are not covered by the Fund's Report of Independent Registered Public Accounting Firm, are available on the SEC's website or upon request. |
(c) Investment made with cash collateral received from securities on loan. |
(d) Security or a portion of the security is on loan at period end. |
(e) Security exempt from registration under Rule 144A of the Securities Act of 1933. These securities may be resold in transactions exempt from registration, normally to qualified institutional buyers. At the end of the period, the value of these securities amounted to $1,401,261 or 0.1% of net assets. |
(f) Security or a portion of the security was pledged to cover margin requirements for futures contracts. At the period end, the value of securities pledged amounted to $499,991. |
(g) Affiliated fund that is available only to investment companies and other accounts managed by Fidelity Investments. A complete unaudited schedule of portfolio holdings for each Fidelity Central Fund is filed with the SEC for the first and third quarters of each fiscal year on Form N-Q and is available upon request or at the SEC's web site at www.sec.gov. An unaudited holdings listing for the Fund, which presents direct holdings as well as the pro rata share of securities and other investments held indirectly through its investment in underlying Fidelity Central Funds, other than the Commodity Strategy and Money Market Central Funds, is available at advisor.fidelity.com. In addition, each Fidelity Central Fund's financial statements, which are not covered by the Fund's Report of Independent Registered Public Accounting Firm, are available on the SEC's web site or upon request. |
(h) Restricted securities - Investment in securities not registered under the Securities Act of 1933 (excluding 144A issues). At the end of the period, the value of restricted securities (excluding 144A issues) amounted to $215,525 or 0.0% of net assets. |
Additional information on each restricted holding is as follows: |
Security | Acquisition Date | Acquisition Cost |
Facebook, Inc. Class B | 5/19/11 | $ 215,930 |
Affiliated Central Funds |
Information regarding fiscal year to date income earned by the Fund from investments in Fidelity Central Funds is as follows: |
| |
Fund | Income earned |
Fidelity Cash Central Fund | $ 75,386 |
Fidelity Commodity Strategy Central Fund | 11,259 |
Fidelity Emerging Markets Debt Central Fund | 349,874 |
Fidelity Emerging Markets Equity Central Fund | 442,984 |
Fidelity Floating Rate Central Fund | 2,149,726 |
Fidelity High Income Central Fund 1 | 3,464,817 |
Fidelity International Equity Central Fund | 4,753,912 |
Fidelity Money Market Central Fund | 77,804 |
Fidelity Securities Lending Cash Central Fund | 107,210 |
Fidelity VIP Investment Grade Central Fund | 17,801,249 |
Total | $ 29,234,221 |
Additional information regarding the Fund's fiscal year to date purchases and sales, including the ownership percentage, of the non Money Market Central Funds is as follows: |
Fund | Value,
beginning of
period | Purchases | Sales
Proceeds | Value,
end of
period | % ownership,
end of
period |
Fidelity Commodity Strategy Central Fund | $ 22,829,987 | $ 26,549,557 | $ 28,964,427 | $ 17,527,726 | 1.6% |
Fidelity Emerging Markets Debt Central Fund | - | 7,379,457 | - | 7,362,876 | 6.6% |
Fidelity Emerging Markets Equity Central Fund | 44,864,395 | 746,664 | 15,499,678 | 22,958,221 | 8.2% |
Fidelity Floating Rate Central Fund | 45,723,024 | 13,697,848 | 8,408,001 | 50,197,537 | 1.8% |
Fidelity High Income Central Fund 1 | 52,973,765 | 3,464,169 | 15,208,618 | 40,230,514 | 8.1% |
Fidelity International Equity Central Fund | 162,878,293 | 15,803,760 | 31,835,959 | 121,293,806 | 8.4% |
Fidelity VIP Investment Grade Central Fund | 494,551,472 | 54,815,665 | 111,415,118 | 450,082,516 | 11.9% |
Total | $ 823,820,936 | $ 122,457,120 | $ 211,331,801 | $ 709,653,196 | |
Other Information |
The following is a summary of the inputs used, as of December 31, 2011, involving the Fund's assets and liabilities carried at fair value. The inputs or methodology used for valuing securities may not be an indication of the risk associated with investing in those securities. For more information on valuation inputs, and their aggregation into the levels used in the tables below, please refer to the Security Valuation section in the accompanying Notes to Financial Statements. |
Valuation Inputs at Reporting Date: |
Description | Total | Level 1 | Level 2 | Level 3 |
Investments in Securities: | | | | |
Equities: | | | | |
Consumer Discretionary | $ 113,878,846 | $ 111,349,534 | $ 2,529,312 | $ - |
Consumer Staples | 15,575,111 | 15,575,111 | - | - |
Energy | 76,873,427 | 76,873,427 | - | - |
Financials | 16,297,948 | 16,297,948 | - | - |
Health Care | 44,923,882 | 44,923,882 | - | - |
Industrials | 40,165,977 | 40,165,977 | - | - |
Information Technology | 85,466,184 | 85,250,659 | - | 215,525 |
Materials | 16,833,143 | 16,833,143 | - | - |
Telecommunication Services | 3,096,516 | 3,096,516 | - | - |
Investment Companies | 31,891,377 | 31,891,377 | - | - |
U.S. Government and Government Agency Obligations | 2,749,951 | - | 2,749,951 | - |
Fixed-Income Funds | 547,873,443 | 547,873,443 | - | - |
Money Market Funds | 101,815,183 | 101,815,183 | - | - |
Equity Funds | 161,779,753 | 161,779,753 | - | - |
Total Investments in Securities: | $ 1,259,220,741 | $ 1,253,725,953 | $ 5,279,263 | $ 215,525 |
Derivative Instruments: | | | | |
Liabilities | | | | |
Futures Contracts | $ (1,656) | $ (1,656) | $ - | $ - |
The following is a reconciliation of Investments in Securities for which Level 3 inputs were used in determining value: |
Investments in Securities: | |
Beginning Balance | $ 1,211,550 |
Total Realized Gain (Loss) | - |
Total Unrealized Gain (Loss) | (405) |
Cost of Purchases | 215,930 |
Proceeds of Sales | - |
Amortization/Accretion | - |
Transfers in to Level 3 | - |
Transfers out of Level 3 | (1,211,550) |
Ending Balance | $ 215,525 |
The change in unrealized gain (loss) for the period attributable to Level 3 securities held at December 31, 2011 | $ (405) |
The information used in the above reconciliation represents fiscal year to date activity for any Investments in Securities identified as using Level 3 inputs at either the beginning or the end of the current fiscal period. Transfers in or out of Level 3 represent the beginning value of any Security or Instrument where a change in the pricing level occurred from the beginning to the end of the period. The cost of purchases and the proceeds of sales may include securities received or delivered through corporate actions or exchanges. Realized and unrealized gains (losses) disclosed in the reconciliation are included in Net Gain (Loss) on the Fund's Statement of Operations. |
Value of Derivative Instruments |
The following table is a summary of the Fund's value of derivative instruments by risk exposure as of December 31, 2011. For additional information on derivative instruments, please refer to the Derivative Instruments section in the accompanying Notes to Financial Statements. |
Risk Exposure /
Derivative Type | Value |
| Asset | Liability |
Equity Risk | | |
Futures Contracts (a) | $ - | $ (1,656) |
Total Value of Derivatives | $ - | $ (1,656) |
(a) Reflects cumulative appreciation/(depreciation) on futures contracts as disclosed on the Schedule of Investments. Only the period end variation margin is separately disclosed on the Statement of Assets and Liabilities. |
The information in the following tables is based on the combined investments of the Fund and its pro-rata share of the investments of Fidelity's Central Funds, other than the Commodity Strategy and Money Market Central Funds. |
The composition of credit quality ratings as a percentage of net assets is as follows (Unaudited): |
U.S. Government and U.S. Government Agency Obligations | 24.1% |
AAA,AA,A | 6.4% |
BBB | 5.3% |
BB | 2.8% |
B | 4.3% |
CCC,CC,C | 0.5% |
D | 0.0%** |
Not Rated | 0.8% |
Equities * | 48.5% |
Short-Term Investments and Net Other Assets | 7.3% |
| 100.0% |
* Includes investment in Fidelity Commodity Strategy Central Fund of 1.4%. |
** Amount represents less than 0.1% |
We have used ratings from Moody's Investors Service, Inc. Where Moody's® ratings are not available, we have used S&P® ratings. All ratings are as of the date indicated and do not reflect subsequent changes. Percentages are adjusted for the effect of futures contracts, if applicable. |
Distribution of investments by country of issue, as a percentage of total net assets, is as follows: (Unaudited) |
United States of America | 82.0% |
United Kingdom | 2.9% |
Japan | 1.6% |
Brazil | 1.4% |
Canada | 1.2% |
Others (Individually Less Than 1%) | 10.9% |
| 100.0% |
See accompanying notes which are an integral part of the financial statements.
Annual Report
Statement of Assets and Liabilities
| December 31, 2011 |
| | |
Assets | | |
Investment in securities, at value (including securities loaned of $5,723,701) - See accompanying schedule: Unaffiliated issuers (cost $415,556,374) | $ 447,752,362 | |
Fidelity Central Funds (cost $820,759,933) | 811,468,379 | |
Total Investments (cost $1,236,316,307) | | $ 1,259,220,741 |
Cash | | 23,405 |
Foreign currency held at value (cost $20) | | 20 |
Receivable for investments sold | | 117,471 |
Receivable for fund shares sold | | 133,998 |
Dividends receivable | | 401,987 |
Distributions receivable from Fidelity Central Funds | | 59,045 |
Prepaid expenses | | 3,529 |
Other receivables | | 74,982 |
Total assets | | 1,260,035,178 |
| | |
Liabilities | | |
Payable for fund shares redeemed | 1,028,197 | |
Accrued management fee | 533,011 | |
Distribution and service plan fees payable | 7,455 | |
Payable for daily variation margin on futures contracts | 18,482 | |
Other affiliated payables | 120,786 | |
Other payables and accrued expenses | 84,839 | |
Collateral on securities loaned, at value | 5,907,973 | |
Total liabilities | | 7,700,743 |
| | |
Net Assets | | $ 1,252,334,435 |
Net Assets consist of: | | |
Paid in capital | | $ 1,267,463,219 |
Distributions in excess of net investment income | | (52,107) |
Accumulated undistributed net realized gain (loss) on investments and foreign currency transactions | | (37,978,169) |
Net unrealized appreciation (depreciation) on investments and assets and liabilities in foreign currencies | | 22,901,492 |
Net Assets | | $ 1,252,334,435 |
Statement of Assets and Liabilities - continued
| December 31, 2011 |
| | |
Initial Class:
Net Asset Value, offering price and redemption price per share ($1,108,494,466 ÷ 80,333,985 shares) | | $ 13.80 |
| | |
Service Class:
Net Asset Value, offering price and redemption price per share ($8,042,439 ÷ 586,579 shares) | | $ 13.71 |
| | |
Service Class 2:
Net Asset Value, offering price and redemption price per share ($32,507,838 ÷ 2,396,028 shares) | | $ 13.57 |
| | |
Investor Class:
Net Asset Value, offering price and redemption price per share ($103,289,692 ÷ 7,514,889 shares) | | $ 13.74 |
See accompanying notes which are an integral part of the financial statements.
Annual Report
Statement of Operations
| Year ended December 31, 2011 |
| | |
Investment Income | | |
Dividends | | $ 5,330,125 |
Interest | | 655 |
Income from Fidelity Central Funds | | 29,234,221 |
Total income | | 34,565,001 |
| | |
Expenses | | |
Management fee | $ 6,942,504 | |
Transfer agent fees | 1,092,364 | |
Distribution and service plan fees | 97,657 | |
Accounting and security lending fees | 553,775 | |
Custodian fees and expenses | 30,187 | |
Independent trustees' compensation | 5,263 | |
Appreciation in deferred trustee compensation account | 13 | |
Audit | 50,425 | |
Legal | 10,678 | |
Miscellaneous | 13,596 | |
Total expenses before reductions | 8,796,462 | |
Expense reductions | (142,804) | 8,653,658 |
Net investment income (loss) | | 25,911,343 |
Realized and Unrealized Gain (Loss) Net realized gain (loss) on: | | |
Investment securities: | | |
Unaffiliated issuers | 68,606,154 | |
Fidelity Central Funds | 6,508,074 | |
Foreign currency transactions | (130,537) | |
Futures contracts | (789,641) | |
Capital gain distributions from Fidelity Central Funds | 8,341,557 | |
Total net realized gain (loss) | | 82,535,607 |
Change in net unrealized appreciation (depreciation) on: Investment securities | (140,550,894) | |
Assets and liabilities in foreign currencies | (2,290) | |
Futures contracts | (154,488) | |
Total change in net unrealized appreciation (depreciation) | | (140,707,672) |
Net gain (loss) | | (58,172,065) |
Net increase (decrease) in net assets resulting from operations | | $ (32,260,722) |
Statement of Changes in Net Assets
| Year ended
December 31, 2011 | Year ended
December 31, 2010 |
Increase (Decrease) in Net Assets | | |
Operations | | |
Net investment income (loss) | $ 25,911,343 | $ 23,180,903 |
Net realized gain (loss) | 82,535,607 | 111,599,649 |
Change in net unrealized appreciation (depreciation) | (140,707,672) | 46,878,640 |
Net increase (decrease) in net assets resulting from operations | (32,260,722) | 181,659,192 |
Distributions to shareholders from net investment income | (25,842,847) | (22,808,550) |
Distributions to shareholders from net realized gain | (6,349,020) | (6,928,726) |
Total distributions | (32,191,867) | (29,737,276) |
Share transactions - net increase (decrease) | (108,450,453) | (91,985,209) |
Total increase (decrease) in net assets | (172,903,042) | 59,936,707 |
| | |
Net Assets | | |
Beginning of period | 1,425,237,477 | 1,365,300,770 |
End of period (including Distributions in excess of net investment income of $52,107 and undistributed net investment income of $13,054, respectively) | $ 1,252,334,435 | $ 1,425,237,477 |
See accompanying notes which are an integral part of the financial statements.
Annual Report
Financial Highlights - Initial Class
Years ended December 31, | 2011 | 2010 | 2009 | 2008 | 2007 |
Selected Per-Share Data | | | | | |
Net asset value, beginning of period | $ 14.54 | $ 13.00 | $ 10.31 | $ 16.58 | $ 15.71 |
Income from Investment Operations | | | | | |
Net investment income (loss) C | .28 | .23 | .26 | .36 | .44 |
Net realized and unrealized gain (loss) | (.66) | 1.62 | 2.73 | (4.75) | 1.88 |
Total from investment operations | (.38) | 1.85 | 2.99 | (4.39) | 2.32 |
Distributions from net investment income | (.29) | (.24) | (.28) | (.37) | (1.00) |
Distributions from net realized gain | (.07) | (.07) | (.02) | (1.51) | (.45) |
Total distributions | (.36) | (.31) | (.30) | (1.88) | (1.45) |
Net asset value, end of period | $ 13.80 | $ 14.54 | $ 13.00 | $ 10.31 | $ 16.58 |
Total ReturnA,B | (2.56)% | 14.26% | 29.11% | (28.76)% | 15.57% |
Ratios to Average Net AssetsD,F | | | | | |
Expenses before reductions | .63% | .63% | .67% | .63% | .63% |
Expenses net of fee waivers, if any | .63% | .63% | .67% | .63% | .63% |
Expenses net of all reductions | .62% | .62% | .66% | .63% | .62% |
Net investment income (loss) | 1.91% | 1.72% | 2.31% | 2.62% | 2.75% |
Supplemental Data | | | | | |
Net assets, end of period (000 omitted) | $ 1,108,494 | $ 1,279,306 | $ 1,249,955 | $ 1,093,133 | $ 1,791,647 |
Portfolio turnover rateE | 56% | 54% | 95% | 90% | 99% |
A Total returns do not reflect charges attributable to your insurance company's separate account. Inclusion of these charges would reduce the total returns shown.
B Total returns would have been lower if certain expenses had not been reduced during the applicable periods shown.
C Calculated based on average shares outstanding during the period.
D Fees and expenses of any underlying Fidelity Central Funds are not included in the Fund's expense ratio. The Fund indirectly bears its proportionate share of the expenses of any underlying Fidelity Central Funds.
E Amount does not include the portfolio activity of any underlying Fidelity Central Funds.
F Expense ratios reflect operating expenses of the class. Expenses before reductions do not reflect amounts reimbursed by the investment adviser or reductions from brokerage service arrangements or reductions from other expense offset arrangements and do not represent the amount paid by the class during periods when reimbursements or reductions occur. Expenses net of fee waivers reflect expenses after reimbursement by the investment adviser but prior to reductions from brokerage service arrangements or other expense offset arrangements. Expenses net of all reductions represent the net expenses paid by the class.
Financial Highlights - Service Class
Years ended December 31, | 2011 | 2010 | 2009 | 2008 | 2007 |
Selected Per-Share Data | | | | | |
Net asset value, beginning of period | $ 14.45 | $ 12.92 | $ 10.25 | $ 16.48 | $ 15.61 |
Income from Investment Operations | | | | | |
Net investment income (loss)C | .26 | .22 | .25 | .34 | .42 |
Net realized and unrealized gain (loss) | (.65) | 1.60 | 2.71 | (4.71) | 1.86 |
Total from investment operations | (.39) | 1.82 | 2.96 | (4.37) | 2.28 |
Distributions from net investment income | (.28) | (.22) | (.27) | (.35) | (.96) |
Distributions from net realized gain | (.07) | (.07) | (.02) | (1.51) | (.45) |
Total distributions | (.35) | (.29) | (.29) | (1.86) | (1.41) |
Net asset value, end of period | $ 13.71 | $ 14.45 | $ 12.92 | $ 10.25 | $ 16.48 |
Total ReturnA,B | (2.69)% | 14.14% | 28.94% | (28.82)% | 15.36% |
Ratios to Average Net AssetsD,F | | | | | |
Expenses before reductions | .75% | .75% | .79% | .75% | .74% |
Expenses net of fee waivers, if any | .74% | .74% | .79% | .75% | .74% |
Expenses net of all reductions | .74% | .73% | .78% | .75% | .74% |
Net investment income (loss) | 1.79% | 1.60% | 2.18% | 2.50% | 2.63% |
Supplemental Data | | | | | |
Net assets, end of period (000 omitted) | $ 8,042 | $ 8,613 | $ 8,230 | $ 7,413 | $ 13,530 |
Portfolio turnover rateE | 56% | 54% | 95% | 90% | 99% |
A Total returns do not reflect charges attributable to your insurance company's separate account. Inclusion of these charges would reduce the total returns shown.
B Total returns would have been lower if certain expenses had not been reduced during the applicable periods shown.
C Calculated based on average shares outstanding during the period.
D Fees and expenses of any underlying Fidelity Central Funds are not included in the Fund's expense ratio. The Fund indirectly bears its proportionate share of the expenses of any underlying Fidelity Central Funds.
E Amount does not include the portfolio activity of any underlying Fidelity Central Funds.
F Expense ratios reflect operating expenses of the class. Expenses before reductions do not reflect amounts reimbursed by the investment adviser or reductions from brokerage service arrangements or reductions from other expense offset arrangements and do not represent the amount paid by the class during periods when reimbursements or reductions occur. Expenses net of fee waivers reflect expenses after reimbursement by the investment adviser but prior to reductions from brokerage service arrangements or other expense offset arrangements. Expenses net of all reductions represent the net expenses paid by the class.
See accompanying notes which are an integral part of the financial statements.
Annual Report
Financial Highlights - Service Class 2
Years ended December 31, | 2011 | 2010 | 2009 | 2008 | 2007 |
Selected Per-Share Data | | | | | |
Net asset value, beginning of period | $ 14.30 | $ 12.79 | $ 10.15 | $ 16.34 | $ 15.47 |
Income from Investment Operations | | | | | |
Net investment income (loss)C | .24 | .19 | .23 | .32 | .39 |
Net realized and unrealized gain (loss) | (.65) | 1.59 | 2.68 | (4.67) | 1.85 |
Total from investment operations | (.41) | 1.78 | 2.91 | (4.35) | 2.24 |
Distributions from net investment income | (.25) | (.20) | (.25) | (.33) | (.92) |
Distributions from net realized gain | (.07) | (.07) | (.02) | (1.51) | (.45) |
Total distributions | (.32) | (.27) | (.27) | (1.84) | (1.37) |
Net asset value, end of period | $ 13.57 | $ 14.30 | $ 12.79 | $ 10.15 | $ 16.34 |
Total ReturnA,B | (2.82)% | 13.96% | 28.76% | (28.95)% | 15.24% |
Ratios to Average Net AssetsD,F | | | | | |
Expenses before reductions | .90% | .90% | .93% | .90% | .89% |
Expenses net of fee waivers, if any | .89% | .89% | .93% | .90% | .89% |
Expenses net of all reductions | .89% | .88% | .92% | .89% | .89% |
Net investment income (loss) | 1.64% | 1.46% | 2.04% | 2.36% | 2.48% |
Supplemental Data | | | | | |
Net assets, end of period (000 omitted) | $ 32,508 | $ 39,148 | $ 39,475 | $ 37,360 | $ 59,670 |
Portfolio turnover rateE | 56% | 54% | 95% | 90% | 99% |
A Total returns do not reflect charges attributable to your insurance company's separate account. Inclusion of these charges would reduce the total returns shown.
B Total returns would have been lower if certain expenses had not been reduced during the applicable periods shown.
C Calculated based on average shares outstanding during the period.
D Fees and expenses of any underlying Fidelity Central Funds are not included in the Fund's expense ratio. The Fund indirectly bears its proportionate share of the expenses of any underlying Fidelity Central Funds.
E Amount does not include the portfolio activity of any underlying Fidelity Central Funds.
F Expense ratios reflect operating expenses of the class. Expenses before reductions do not reflect amounts reimbursed by the investment adviser or reductions from brokerage service arrangements or reductions from other expense offset arrangements and do not represent the amount paid by the class during periods when reimbursements or reductions occur. Expenses net of fee waivers reflect expenses after reimbursement by the investment adviser but prior to reductions from brokerage service arrangements or other expense offset arrangements. Expenses net of all reductions represent the net expenses paid by the class.
Financial Highlights - Investor Class
Years ended December 31, | 2011 | 2010 | 2009 | 2008 | 2007 |
Selected Per-Share Data | | | | | |
Net asset value, beginning of period | $ 14.49 | $ 12.96 | $ 10.28 | $ 16.53 | $ 15.67 |
Income from Investment Operations | | | | | |
Net investment income (loss)C | .27 | .22 | .25 | .34 | .42 |
Net realized and unrealized gain (loss) | (.67) | 1.61 | 2.73 | (4.72) | 1.87 |
Total from investment operations | (.40) | 1.83 | 2.98 | (4.38) | 2.29 |
Distributions from net investment income | (.28) | (.23) | (.28) | (.36) | (.98) |
Distributions from net realized gain | (.07) | (.07) | (.02) | (1.51) | (.45) |
Total distributions | (.35) | (.30) | (.30) | (1.87) | (1.43) |
Net asset value, end of period | $ 13.74 | $ 14.49 | $ 12.96 | $ 10.28 | $ 16.53 |
Total ReturnA,B | (2.72)% | 14.16% | 29.01% | (28.79)% | 15.38% |
Ratios to Average Net AssetsD,F | | | | | |
Expenses before reductions | .71% | .72% | .77% | .73% | .75% |
Expenses net of fee waivers, if any | .71% | .71% | .77% | .73% | .75% |
Expenses net of all reductions | .70% | .70% | .76% | .72% | .74% |
Net investment income (loss) | 1.82% | 1.63% | 2.21% | 2.53% | 2.63% |
Supplemental Data | | | | | |
Net assets, end of period (000 omitted) | $ 103,290 | $ 98,171 | $ 67,641 | $ 51,264 | $ 46,555 |
Portfolio turnover rateE | 56% | 54% | 95% | 90% | 99% |
A Total returns do not reflect charges attributable to your insurance company's separate account. Inclusion of these charges would reduce the total returns shown.
B Total returns would have been lower if certain expenses had not been reduced during the applicable periods shown.
C Calculated based on average shares outstanding during the period.
D Fees and expenses of any underlying Fidelity Central Funds are not included in the Fund's expense ratio. The Fund indirectly bears its proportionate share of the expenses of any underlying Fidelity Central Funds.
E Amount does not include the portfolio activity of any underlying Fidelity Central Funds.
F Expense ratios reflect operating expenses of the class. Expenses before reductions do not reflect amounts reimbursed by the investment adviser or reductions from brokerage service arrangements or reductions from other expense offset arrangements and do not represent the amount paid by the class during periods when reimbursements or reductions occur. Expenses net of fee waivers reflect expenses after reimbursement by the investment adviser but prior to reductions from brokerage service arrangements or other expense offset arrangements. Expenses net of all reductions represent the net expenses paid by the class.
See accompanying notes which are an integral part of the financial statements.
Annual Report
Notes to Financial Statements
For the period ended December 31, 2011
1. Organization.
VIP Asset Manager Portfolio (the Fund) is a fund of Variable Insurance Products Fund V (the Trust) and is authorized to issue an unlimited number of shares. The Trust is registered under the Investment Company Act of 1940, as amended (the 1940 Act), as an open-end management investment company organized as a Massachusetts business trust. Shares of the Fund may only be purchased by insurance companies for the purpose of funding variable annuity or variable life insurance contracts. The Fund offers the following classes of shares: Initial Class shares, Service Class shares, Service Class 2 shares and Investor Class shares. All classes have equal rights and voting privileges, except for matters affecting a single class. Investment income, realized and unrealized capital gains and losses, the common expenses of the Fund, and certain fund-level expense reductions, if any, are allocated on a pro-rata basis to each class based on the relative net assets of each class to the total net assets of the Fund. Each class differs with respect to transfer agent and distribution and service plan fees incurred. Certain expense reductions may also differ by class.
2. Investments in Fidelity Central Funds.
The Fund invests in Fidelity Central Funds, which are open-end investment companies available only to other investment companies and accounts managed by Fidelity Management & Research Company (FMR) and its affiliates. The Fund's Schedule of Investments lists each of the Fidelity Central Funds held as of period end, if any, as an investment of the Fund, but do not include the underlying holdings of each Fidelity Central Fund. As an Investing Fund, the Fund indirectly bears its proportionate share of the expenses of the underlying Fidelity Central Funds.
Based on their investment objective, each Fidelity Central Fund may invest or participate in various investment vehicles or strategies that are similar to those of the Fund. These strategies are consistent with the investment objectives of the Fund and may involve certain economic risks which may cause a decline in value of each of the Fidelity Central Funds and thus a decline in the value of the Fund. The following summarizes the Fund's investment in each Fidelity Central Fund.
Fidelity Central Fund | Investment Manager | Investment Objective | Investment Practices | Expense Ratio* |
Fidelity Commodity Strategy Central Fund | FMR Co., Inc. (FMRC) | Seeks to provide investment returns that correspond to the performance of the commodities market. | Investment in wholly-owned subsidiary organized under the laws of the Cayman Islands Repurchase Agreements Restricted Securities | .05% |
Fidelity Emerging Markets Debt Central Fund | FMRC | Seeks high total return by normally investing in debt securities of issuers in emerging markets and other debt investments that are tied economically to emerging markets. | Foreign Securities Repurchase Agreements Restricted Securities | .02% |
Fidelity Emerging Markets Equity Central Fund | FMRC | Seeks capital appreciation by investing primarily in equity securities of issuers in emerging markets. | Foreign Securities Repurchase Agreements Restricted Securities | .12% |
Fidelity International Equity Central Fund | FMRC | Seeks capital appreciation by investing primarily in non-U.S. based common stocks, including securities of issuers located in emerging markets. | Foreign Securities Repurchase Agreements Restricted Securities | .02% |
Fidelity Floating Rate Central Fund | FMRC | Seeks a high level of income by normally investing in floating rate loans and other floating rate securities. | Loans & Direct Debt Instruments Repurchase Agreements Restricted Securities | .00%** |
Fidelity High Income Central Fund 1 | FMRC | Seeks a high level of income and may also seek capital appreciation by investing primarily in debt securities, preferred stocks, and convertible securities, with an emphasis on lower-quality debt securities. | Loans & Direct Debt Instruments Repurchase Agreements Restricted Securities | .00%** |
VIP Investment Grade Central Fund | Fidelity Investments Money Management, Inc. (FIMM) | Seeks a high level of current income by normally investing in investment-grade debt securities and repurchase agreements. | Delayed Delivery & When Issued Securities Repurchase Agreements Restricted Securities Swap Agreements | .00%** |
Fidelity Money Market Central Funds | FIMM | Seeks to obtain a high level of current income consistent with the preservation of capital and liquidity. | Short-term Investments | .00%** |
* Expenses expressed as a percentage of average net assets and are as of each underlying Central Fund's most recent annual or semi-annual shareholder report.
** Amount represents less than 0.01%.
An unaudited holdings listing for the Fund, which presents direct holdings as well as the pro-rata share of any securities and other investments held indirectly through its investment in underlying non-money market Fidelity Central Funds, is available at advisor.fidelity.com. A complete unaudited list of holdings for each Fidelity Central Fund is available upon request or at the Securities and Exchange Commission (the SEC) web site at www.sec.gov. In addition, the financial statements of the Fidelity Central Funds which contain the significant accounting policies (including security valuation policies) of those funds, which are not covered by the Fund's Report of Independent Registered Public Accounting Firm, are available on the SEC web site or upon request.
Annual Report
3. Significant Accounting Policies.
The financial statements have been prepared in conformity with accounting principles generally accepted in the United States of America (GAAP), which require management to make certain estimates and assumptions at the date of the financial statements. Actual results could differ from those estimates. Subsequent events, if any, through the date that the financial statements were issued have been evaluated in the preparation of the financial statements. The following summarizes the significant accounting policies of the Fund:
Security Valuation. Investments are valued as of 4:00 p.m. Eastern time on the last calendar day of the period. The Fund uses independent pricing services approved by the Board of Trustees to value its investments. When current market prices or quotations are not readily available or reliable, valuations may be determined in good faith in accordance with procedures adopted by the Board of Trustees. Factors used in determining value may include market or security specific events. The frequency with which these procedures are used cannot be predicted and they may be utilized to a significant extent. The value used for net asset value (NAV) calculation under these procedures may differ from published prices for the same securities.
The Fund categorizes the inputs to valuation techniques used to value its investments into a disclosure hierarchy consisting of three levels as shown below:
Level 1 - quoted prices in active markets for identical investments
Level 2 - other significant observable inputs (including quoted prices for similar investments, interest rates, prepayment speeds, etc.)
Level 3 - unobservable inputs (including the Fund's own assumptions based on the best information available)
Changes in valuation techniques may result in transfers in or out of an assigned level within the disclosure hierarchy. The aggregate value of investments by input level, as of December 31, 2011, as well as a roll forward of Level 3 securities, is included at the end of the Fund's Schedule of Investments. Valuation techniques used to value the Fund's investments by major category are as follows:
Equity securities, including restricted securities, for which market quotations are readily available, are valued at the last reported sale price or official closing price as reported by an independent pricing service on the primary market or exchange on which they are traded and are categorized as Level 1 in the hierarchy. In the event there were no sales during the day or closing prices are not available, securities are valued at the last quoted bid price or may be valued using the last available price and are generally categorized as Level 2 in the hierarchy. For foreign equity securities, when significant market or security specific events arise, comparisons to the valuation of American Depositary Receipts (ADRs), futures contracts, Exchange-traded funds (ETFs) and certain indexes as well as quoted prices for similar securities are used and are categorized as Level 2 in the hierarchy in these circumstances. Utilizing these techniques may result in transfers between Level 1 and Level 2. For restricted equity securities and private placements where observable inputs are limited, assumptions about market activity and risk are used and are categorized as Level 3 in the hierarchy.
Debt securities, including restricted securities, are valued based on evaluated prices received from independent pricing services or from dealers who make markets in such securities. For U.S. government and government agency obligations, pricing services utilize matrix pricing which considers yield or price of bonds of comparable quality, coupon, maturity and type as well as dealer supplied prices and are generally categorized as Level 2 in the hierarchy. When independent prices are unavailable or unreliable, debt securities may be valued utilizing pricing matrices which consider similar factors that would be used by independent pricing services. These are generally categorized as Level 2 in the hierarchy but may be Level 3 depending on the circumstances. ETFs are valued at their last sale price or official closing price as reported by an independent pricing service on the primary market or exchange on which they are traded and are categorized as Level 1 in the hierarchy. In the event there were no sales during the day but the exchange reports a closing bid level, ETFs are valued at the closing bid and would be categorized as Level 1 in the hierarchy. In the event there was no closing bid, ETFs may be valued by another method that the Board of Trustees believes reflects fair value in accordance with the Board's fair value pricing policies and may be categorized as Level 2 in the hierarchy.
Futures contracts are valued at the settlement price established each day by the board of trade or exchange on which they are traded and are categorized as Level 1 in the hierarchy. Investments in open-end mutual funds, including the Fidelity Central Funds, are valued at their closing net asset value each business day and are categorized as Level 1 in the hierarchy.
New Accounting Pronouncements. In May 2011, the Financial Accounting Standards Board issued Accounting Standard Update No. 2011-04, Fair Value Measurement (Topic 820) - Amendments to Achieve Common Fair Value Measurement and Disclosure Requirements in U.S. GAAP and IFRSs. The update is effective during interim and annual periods beginning after December 15, 2011 and will result in additional disclosure for transfers between levels as well as expanded disclosure for securities categorized as Level 3 under the fair value hierarchy.
In December 2011, the Financial Accounting Standards Board issued Accounting Standard Update No. 2011-11, Disclosures about Offsetting Assets and Liabilities. The update creates new disclosure requirements requiring entities to disclose both gross and net information for derivatives and other financial instruments that are either offset in the Statement of Assets and Liabilities or subject to an enforceable master netting arrangement or similar agreement. The disclosure requirements are effective for annual reporting periods beginning on or after January 1, 2013. Management is currently evaluating the impact of the update's adoption on the Fund's financial statement disclosures.
Annual Report
Notes to Financial Statements - continued
3. Significant Accounting Policies - continued
Foreign Currency. The Fund may use foreign currency contracts to facilitate transactions in foreign-denominated securities. Gains and losses from these transactions may arise from changes in the value of the foreign currency or if the counterparties do not perform under the contracts' terms.
Foreign-denominated assets, including investment securities, and liabilities are translated into U.S. dollars at the exchange rate at period end. Purchases and sales of investment securities, income and dividends received and expenses denominated in foreign currencies are translated into U.S. dollars at the exchange rate in effect on the transaction date.
The effects of exchange rate fluctuations on investments are included with the net realized and unrealized gain (loss) on investment securities. Other foreign currency transactions resulting in realized and unrealized gain (loss) are disclosed separately.
Investment Transactions and Income. For financial reporting purposes, the Fund's investment holdings and NAV include trades executed through the end of the last business day of the period. The NAV per share for processing shareholder transactions is calculated as of the close of business of the New York Stock Exchange (NYSE), normally 4:00 p.m. Eastern time and includes trades executed through the end of the prior business day. Gains and losses on securities sold are determined on the basis of identified cost and may include proceeds received from litigation. Dividend income is recorded on the ex-dividend date, except for certain dividends from foreign securities where the ex-dividend date may have passed, which are recorded as soon as the Fund is informed of the ex-dividend date. Non-cash dividends included in dividend income, if any, are recorded at the fair market value of the securities received. Distributions received on securities that represent a return of capital or capital gain are recorded as a reduction of cost of investments and/or as a realized gain. The Fund estimates the components of distributions received that may be considered return of capital distributions or capital gain distributions. Interest income and distributions from the Fidelity Central Funds are accrued as earned. Interest income includes coupon interest and amortization of premium and accretion of discount on debt securities. Investment income is recorded net of foreign taxes withheld where recovery of such taxes is uncertain.
Expenses. Expenses directly attributable to a fund are charged to that fund. Expenses attributable to more than one fund are allocated among the respective funds on the basis of relative net assets or other appropriate methods. Expense estimates are accrued in the period to which they relate and adjustments are made when actual amounts are known. Expenses included in the accompanying financial statements reflect the expenses of the Fund and do not include any expenses of the Fidelity Central Funds. Although not included in the Fund's expenses, the Fund indirectly bears its proportionate share of the Fidelity Central Funds' expenses through the impact of these expenses on each Fidelity Central Fund's NAV. Based on their most recent shareholder report date, expenses of the Fidelity Central Funds ranged from 0.00% to 0.12%.
Deferred Trustee Compensation. Under a Deferred Compensation Plan (the Plan), independent Trustees may elect to defer receipt of a portion of their annual compensation. Deferred amounts are invested in a cross-section of Fidelity funds, are marked-to-market and remain in the Fund until distributed in accordance with the Plan. The investment of deferred amounts and the offsetting payable to the Trustees are included in the accompanying Statement of Assets and Liabilities.
Income Tax Information and Distributions to Shareholders. Each year, the Fund intends to qualify as a regulated investment company, including distributing substantially all of its taxable income and realized gains under Subchapter M of the Internal Revenue Code. As a result, no provision for income taxes is required. As of December 31, 2011, the Fund did not have any unrecognized tax benefits in the financial statements; nor is the Fund aware of any tax positions for which it is reasonably possible that the total amounts of unrecognized tax benefits will significantly change in the next twelve months. The Fund files a U.S. federal tax return, in addition to state and local tax returns as required. A fund's tax returns are subject to examination by the Internal Revenue Service (IRS) for a period of three fiscal years. State and local tax returns may be subject to examination for an additional fiscal year depending on the jurisdiction. Foreign taxes are provided for based on the Fund's understanding of the tax rules and rates that exist in the foreign markets in which it invests.
Distributions are declared and recorded on the ex-dividend date. Income dividends and capital gain distributions are declared separately for each class. Income and capital gain distributions are determined in accordance with income tax regulations, which may differ from GAAP.
Capital accounts within the financial statements are adjusted for permanent book-tax differences. These adjustments have no impact on net assets or the results of operations. Temporary book-tax differences will reverse in a subsequent period.
Book-tax differences are primarily due to short-term gain distributions from the Fidelity Central Funds, in-kind transactions, futures transactions, foreign currency transactions, market discount, partnerships, partnerships (including allocations from Fidelity Central Funds), deferred trustees compensation, capital loss carryforwards, and losses deferred due to wash sales.
The federal tax cost of investment securities and unrealized appreciation (depreciation) as of period end were as follows:
Gross unrealized appreciation | $ 116,128,920 |
Gross unrealized depreciation | (72,615,754) |
Net unrealized appreciation (depreciation) on securities and other investments | $ 43,513,166 |
| |
Tax Cost | $ 1,215,707,575 |
Annual Report
3. Significant Accounting Policies - continued
Income Tax Information and Distributions to Shareholders - continued
The tax-based components of distributable earnings as of period end were as follows:
Capital loss carryforward | $ (46,050,301) |
Net unrealized appreciation (depreciation) | $ 43,511,880 |
Capital loss carryforwards are only available to offset future capital gains of the Fund to the extent provided by regulations and may be limited. Under the Regulated Investment Company Modernization Act of 2010 (the Act), the Fund is permitted to carry forward capital losses incurred in taxable years beginning after December 22, 2010 for an unlimited period and such capital losses are required to be used prior to any losses that expire. Capital loss carryforwards were as follows:
Fiscal year of expiration | |
2016 | $ (12,728,760) |
2017 | (33,321,541) |
Total with expiration | $ (46,050,301) |
The tax character of distributions paid was as follows:
| December 31, 2011 | December 31, 2010 |
Ordinary Income | $ 32,191,867 | $ 29,737,276 |
4. Operating Policies.
Restricted Securities. The Fund may invest in securities that are subject to legal or contractual restrictions on resale. These securities generally may be resold in transactions exempt from registration or to the public if the securities are registered. Disposal of these securities may involve time-consuming negotiations and expense, and prompt sale at an acceptable price may be difficult. Information regarding restricted securities is included at the end of the Fund's Schedule of Investments.
5. Derivative Instruments.
Risk Exposures and the Use of Derivative Instruments. The Fund used derivative instruments (derivatives), including futures contracts, in order to meet its investment objectives. The strategy is to use derivatives to increase returns and to manage exposure to certain risks as defined below. The success of any strategy involving derivatives depends on analysis of numerous economic factors, and if the strategies for investment do not work as intended, the Fund may not achieve its objectives.
The Fund's use of derivatives increased or decreased its exposure to the following risk:
Equity Risk | Equity risk relates to the fluctuations in the value of financial instruments as a result of changes in market prices (other than those arising from interest rate risk or foreign exchange risk), whether caused by factors specific to an individual investment, its issuer, or all factors affecting all instruments traded in a market or market segment. |
The Fund is also exposed to additional risks from investing in derivatives, such as liquidity risk and counterparty credit risk. Liquidity risk is the risk that the Fund will be unable to sell the derivative in the open market in a timely manner. Counterparty credit risk is the risk that the counterparty will not be able to fulfill its obligation to the Fund. The Fund's maximum risk of loss from counterparty credit risk is generally the aggregate unrealized appreciation and unpaid counterparty payments in excess of any collateral pledged by the counterparty to the Fund. Counterparty risk related to exchange-traded futures contracts is minimal because of the protection provided by the exchange on which they trade. Derivatives involve, to varying degrees, risk of loss in excess of the amounts recognized in the Statement of Assets and Liabilities.
Futures Contracts. A futures contract is an agreement between two parties to buy or sell a specified underlying instrument for a fixed price at a specified future date. The Fund used futures contracts to manage its exposure to the stock market.
Upon entering into a futures contract, a fund is required to deposit either cash or securities (initial margin) with a clearing broker in an amount equal to a certain percentage of the face value of the contract. Futures contracts are marked-to-market daily and subsequent payments (variation margin) are made or received by a fund depending on the daily fluctuations in the value of the futures contracts and are recorded as unrealized appreciation or (depreciation). This receivable and/or payable is included in daily variation margin on futures contracts in the Statement of Assets and Liabilities. Realized gain or (loss) is recorded upon the expiration or closing of a futures contract.
Annual Report
Notes to Financial Statements - continued
5. Derivative Instruments - continued
Futures Contracts - continued
The underlying face amount at value of open futures contracts at period end is shown in the Schedule of Investments under the caption "Futures Contracts." This amount reflects each contract's exposure to the underlying instrument at period end and is representative of activity for the period. Securities deposited to meet initial margin requirements are identified in the Schedule of Investments.
Certain risks arise upon entering into futures contracts, including the risk that an illiquid market limits the ability to close out a futures contract prior to settlement date.
During the period the Fund recognized net realized gain (loss) of ($789,641) and a change in net unrealized appreciation (depreciation) of ($154,488) related to its investment in futures contracts. These amounts are included in the Statement of Operations.
6. Purchases and Sales of Investments.
Purchases and sales of securities (including the Equity and Fixed-Income Central Funds), other than short-term securities, aggregated $724,149,634 and $861,984,720, respectively.
7. Fees and Other Transactions with Affiliates.
Management Fee. FMR and its affiliates provide the Fund with investment management related services for which the Fund pays a monthly management fee. The management fee is the sum of an individual fund fee rate that is based on an annual rate of .25% of the Fund's average net assets and an annualized group fee rate that averaged .26% during the period. The group fee rate is based upon the average net assets of all the mutual funds advised by FMR. The group fee rate decreases as assets under management increase and increases as assets under management decrease. For the period, the total annual management fee rate was .51% of the Fund's average net assets.
FMR pays a portion of the management fees received from the Fund to the Fidelity Central Funds' investment advisers, who are also affiliates, for managing the assets of the Fidelity Central Funds.
During the period, FMR waived a portion of its management fee as described in the Expense Reductions note.
Distribution and Service Plan Fees. In accordance with Rule 12b-1 of the 1940 Act, the Fund has adopted separate 12b-1 Plans for each Service Class of shares. Each Service Class pays Fidelity Distributors Corporation (FDC), an affiliate of FMR, a service fee. For the period, the service fee is based on an annual rate of .10% of Service Class' average net assets and .25% of Service Class 2's average net assets.
For the period, total fees, all of which were re-allowed to insurance companies for the distribution of shares and providing shareholder support services were as follows:
Service Class | $ 8,450 |
Service Class 2 | 89,207 |
| $ 97,657 |
Transfer Agent Fees. Fidelity Investments Institutional Operations Company, Inc. (FIIOC), an affiliate of FMR, is the Fund's transfer, dividend disbursing, and shareholder servicing agent. FIIOC receives an asset-based fee with respect to each class. Each class (with the exception of Investor Class) pays a transfer agent fee, excluding out of pocket expenses, equal to an annual rate of .07% of average net assets. Investor Class pays a monthly asset-based transfer agent fee of .15% of average net assets. In addition, FIIOC receives an asset-based fee of .0045% of average net assets for typesetting, printing and mailing of shareholder reports, except proxy statements. FIIOC voluntarily agreed to waive this fee for the period August 1, 2011 through December 31, 2011 (see Expense Reductions note). For the period, transfer agent fees for each class, including printing and out of pocket expenses, were as follows:
Initial Class | $ 886,498 |
Service Class | 7,624 |
Service Class 2 | 31,800 |
Investor Class | 166,442 |
| $ 1,092,364 |
Accounting and Security Lending Fees. Fidelity Service Company, Inc. (FSC), an affiliate of FMR, maintains the Fund's accounting records. The accounting fee is based on the level of average net assets for the month. Under a separate contract, FSC administers the security lending program. The security lending fee is based on the number and duration of lending transactions.
Annual Report
7. Fees and Other Transactions with Affiliates - continued
Brokerage Commissions. The Fund placed a portion of its portfolio transactions with brokerage firms which are affiliates of the investment adviser. The commissions paid to these affiliated firms were $9,483 for the period.
8. Committed Line of Credit.
The Fund participates with other funds managed by FMR or an affiliate in a $4.0 billion credit facility (the "line of credit") to be utilized for temporary or emergency purposes to fund shareholder redemptions or for other short-term liquidity purposes. The Fund has agreed to pay commitment fees on its pro-rata portion of the line of credit, which amounted to $4,281 and is reflected in Miscellaneous expenses on the Statement of Operations. During the period, there were no borrowings on this line of credit.
9. Security Lending.
The Fund lends portfolio securities through a lending agent from time to time in order to earn additional income. For equity securities, a lending agent is used and may loan securities to certain qualified borrowers, including Fidelity Capital Markets (FCM), a broker-dealer affiliated with the Fund. On the settlement date of the loan, the Fund receives collateral (in the form of U.S. Treasury obligations, letters of credit and/or cash) against the loaned securities and maintains collateral in an amount not less than 100% of the market value of the loaned securities during the period of the loan. The market value of the loaned securities is determined at the close of business of the Fund and any additional required collateral is delivered to the Fund on the next business day. If the borrower defaults on its obligation to return the securities loaned because of insolvency or other reasons, a fund could experience delays and costs in recovering the securities loaned or in gaining access to the collateral. Any cash collateral received is invested in the Fidelity Securities Lending Cash Central Fund. The value of loaned securities and cash collateral at period end are disclosed on the Fund's Statement of Assets and Liabilities. At period end, there were no security loans outstanding with FCM. Security lending income represents the income earned on investing cash collateral, less rebates paid to borrowers and any lending agent fees associated with the loan, plus any premium payments received for lending certain types of securities. Security lending income is presented in the Statement of Operations as a component of income from Fidelity Central Funds. Total security lending income during the period amounted to $107,210, including $351 from securities loaned to FCM.
10. Expense Reductions.
FMR has contractually agreed to waive the Fund's management fee in an amount equal to its proportionate share of the management fee paid to FMR by the subsidiary of Fidelity Commodity Strategy Central Fund based on the Fund's proportionate ownership of the Central Fund. During the period, this waiver reduced the Fund's management fee by $8,333.
FMR or its affiliates agreed to waive certain fees during the period as noted in the table below.
Initial Class | $ 21,424 |
Service Class | 149 |
Service Class 2 | 627 |
Investor Class | 1,849 |
| $ 24,049 |
In addition, many of the brokers with whom FMR places trades on behalf of the Fund provided services to the Fund in addition to trade execution. These services included payments of certain expenses on behalf of the Fund totaling $110,422 for the period.
11. Distributions to Shareholders.
Distributions to shareholders of each class were as follows:
Years ended December 31, | 2011 | 2010 |
From net investment income | | |
Initial Class | $ 23,022,892 | $ 20,670,020 |
Service Class | 160,851 | 130,466 |
Service Class 2 | 593,309 | 539,940 |
Investor Class | 2,065,795 | 1,468,124 |
Total | $ 25,842,847 | $ 22,808,550 |
From net realized gain | | |
Initial Class | $ 5,619,969 | $ 6,228,074 |
Service Class | 41,281 | 42,354 |
Service Class 2 | 168,200 | 193,184 |
Investor Class | 519,570 | 465,114 |
Total | $ 6,349,020 | $ 6,928,726 |
Annual Report
Notes to Financial Statements - continued
12. Share Transactions.
Transactions for each class of shares were as follows:
| Shares | Dollars |
Years ended December 31, | 2011 | 2010 | 2011 | 2010 |
Initial Class | | | | |
Shares sold | 2,032,042 | 2,953,816 | $ 29,814,044 | $ 40,305,021 |
Reinvestment of distributions | 2,095,692 | 1,875,132 | 28,642,861 | 26,898,094 |
Shares redeemed | (11,767,286) | (12,990,962) | (172,535,615) | (175,862,426) |
Net increase (decrease) | (7,639,552) | (8,162,014) | $ (114,078,710) | $ (108,659,311) |
Service Class | | | | |
Shares sold | 66,601 | 217,938 | $ 965,850 | $ 2,870,314 |
Reinvestment of distributions | 14,888 | 12,117 | 202,132 | 172,820 |
Shares redeemed | (90,853) | (270,940) | (1,318,556) | (3,659,374) |
Net increase (decrease) | (9,364) | (40,885) | $ (150,574) | $ (616,240) |
Service Class 2 | | | | |
Shares sold | 285,148 | 317,970 | $ 4,083,615 | $ 4,248,620 |
Reinvestment of distributions | 56,660 | 51,977 | 761,509 | 733,124 |
Shares redeemed | (683,186) | (718,587) | (9,913,610) | (9,598,684) |
Net increase (decrease) | (341,378) | (348,640) | $ (5,068,486) | $ (4,616,940) |
Investor Class | | | | |
Shares sold | 1,843,689 | 2,175,761 | $ 27,115,486 | $ 30,128,589 |
Reinvestment of distributions | 189,888 | 135,106 | 2,585,365 | 1,933,238 |
Shares redeemed | (1,295,411) | (754,597) | (18,853,534) | (10,154,545) |
Net increase (decrease) | 738,166 | 1,556,270 | $ 10,847,317 | $ 21,907,282 |
13. Other.
The Fund's organizational documents provide former and current trustees and officers with a limited indemnification against liabilities arising in connection with the performance of their duties to the Fund. In the normal course of business, the Fund may also enter into contracts that provide general indemnifications. The Fund's maximum exposure under these arrangements is unknown as this would be dependent on future claims that may be made against the Fund. The risk of material loss from such claims is considered remote.
At the end of the period, FMR or its affiliates were the owners of record of 32% of the total outstanding shares of the Fund and two otherwise unaffiliated shareholders were the owners of record of 28% of the total outstanding shares of the Fund.
Annual Report
Report of Independent Registered Public Accounting Firm
To the Trustees of Variable Insurance Products Fund V and Shareholders of VIP Asset Manager Portfolio:
We have audited the accompanying statement of assets and liabilities of VIP Asset Manager Portfolio (the Fund), a fund of Variable Insurance Products Fund V, including the schedule of investments, as of December 31, 2011, and the related statement of operations for the year then ended, the statement of changes in net assets for each of the two years in the period then ended, and the financial highlights for each of the five years in the period then ended. These financial statements and financial highlights are the responsibility of the Fund's management. Our responsibility is to express an opinion on these financial statements and financial highlights based on our audits.
We conducted our audits in accordance with the standards of the Public Company Accounting Oversight Board (United States). Those standards require that we plan and perform the audit to obtain reasonable assurance about whether the financial statements and financial highlights are free of material misstatement. The Fund is not required to have, nor were we engaged to perform, an audit of its internal control over financial reporting. Our audits included consideration of internal control over financial reporting as a basis for designing audit procedures that are appropriate in the circumstances, but not for the purpose of expressing an opinion on the effectiveness of the Fund's internal control over financial reporting. Accordingly, we express no such opinion. An audit also includes examining, on a test basis, evidence supporting the amounts and disclosures in the financial statements, assessing the accounting principles used and significant estimates made by management, as well as evaluating the overall financial statement presentation. Our procedures included confirmation of securities owned as of December 31, 2011, by correspondence with the custodians and brokers. We believe that our audits provide a reasonable basis for our opinion.
In our opinion, the financial statements and financial highlights referred to above present fairly, in all material respects, the financial position of VIP Asset Manager Portfolio as of December 31, 2011, the results of its operations for the year then ended, the changes in its net assets for each of the two years in the period then ended, and the financial highlights for each of the five years in the period then ended, in conformity with accounting principles generally accepted in the United States of America.
/s/ Deloitte & Touche LLP
DELOITTE & TOUCHE LLP
Boston, Massachusetts
February 17, 2012
Annual Report
The Trustees and executive officers of the trust and fund, as applicable, are listed below. The Board of Trustees governs the fund and is responsible for protecting the interests of shareholders. The Trustees are experienced executives who meet periodically throughout the year to oversee the fund's activities, review contractual arrangements with companies that provide services to the fund, oversee management of the risks associated with such activities and contractual arrangements, and review the fund's performance. Except for James C. Curvey, each of the Trustees oversees 203 funds advised by FMR or an affiliate. Mr. Curvey oversees 429 funds advised by FMR or an affiliate.
The Trustees hold office without limit in time except that (a) any Trustee may resign; (b) any Trustee may be removed by written instrument, signed by at least two-thirds of the number of Trustees prior to such removal; (c) any Trustee who requests to be retired or who has become incapacitated by illness or injury may be retired by written instrument signed by a majority of the other Trustees; and (d) any Trustee may be removed at any special meeting of shareholders by a two-thirds vote of the outstanding voting securities of the trust. Each Trustee who is not an interested person (as defined in the 1940 Act) (Independent Trustee), shall retire not later than the last day of the calendar year in which his or her 75th birthday occurs. The Independent Trustees may waive this mandatory retirement age policy with respect to individual Trustees. The executive officers hold office without limit in time, except that any officer may resign or may be removed by a vote of a majority of the Trustees at any regular meeting or any special meeting of the Trustees. Except as indicated, each individual has held the office shown or other offices in the same company for the past five years.
Experience, Skills, Attributes, and Qualifications of the Fund's Trustees. The Governance and Nominating Committee has adopted a statement of policy that describes the experience, qualifications, attributes, and skills that are necessary and desirable for potential Independent Trustee candidates (Statement of Policy). The Board believes that each Trustee satisfied at the time he or she was initially elected or appointed a Trustee, and continues to satisfy, the standards contemplated by the Statement of Policy. The Governance and Nominating Committee also engages professional search firms to help identify potential Independent Trustee candidates who have the experience, qualifications, attributes, and skills consistent with the Statement of Policy. From time to time, additional criteria based on the composition and skills of the current Independent Trustees, as well as experience or skills that may be appropriate in light of future changes to board composition, business conditions, and regulatory or other developments, have also been considered by the professional search firms and the Governance and Nominating Committee. In addition, the Board takes into account the Trustees' commitment and participation in Board and committee meetings, as well as their leadership of standing and ad hoc committees throughout their tenure.
In determining that a particular Trustee was and continues to be qualified to serve as a Trustee, the Board has considered a variety of criteria, none of which, in isolation, was controlling. The Board believes that, collectively, the Trustees have balanced and diverse experience, qualifications, attributes, and skills, which allow the Board to operate effectively in governing the fund and protecting the interests of shareholders. Information about the specific experience, skills, attributes, and qualifications of each Trustee, which in each case led to the Board's conclusion that the Trustee should serve (or continue to serve) as a trustee of the fund, is provided below.
Board Structure and Oversight Function. Abigail P. Johnson is an interested person (as defined in the 1940 Act) and currently serves as Chairman. The Trustees have determined that an interested Chairman is appropriate and benefits shareholders because an interested Chairman has a personal and professional stake in the quality and continuity of services provided to the fund. Independent Trustees exercise their informed business judgment to appoint an individual of their choosing to serve as Chairman, regardless of whether the Trustee happens to be independent or a member of management. The Independent Trustees have determined that they can act independently and effectively without having an Independent Trustee serve as Chairman and that a key structural component for assuring that they are in a position to do so is for the Independent Trustees to constitute a substantial majority for the Board. The Independent Trustees also regularly meet in executive session. Kenneth L. Wolfe serves as Chairman of the Independent Trustees and as such (i) acts as a liaison between the Independent Trustees and management with respect to matters important to the Independent Trustees and (ii) with management prepares agendas for Board meetings.
Fidelity funds are overseen by different Boards of Trustees. The fund's Board oversees Fidelity's investment-grade bond, money market, and asset allocation funds and another Board oversees Fidelity's equity and high income funds. The asset allocation funds may invest in Fidelity funds that are overseen by such other Board. The use of separate Boards, each with its own committee structure, allows the Trustees of each group of Fidelity funds to focus on the unique issues of the funds they oversee, including common research, investment, and operational issues. On occasion, the separate Boards establish joint committees to address issues of overlapping consequences for the Fidelity funds overseen by each Board.
The Trustees operate using a system of committees to facilitate the timely and efficient consideration of all matters of importance to the Trustees, the fund, and fund shareholders and to facilitate compliance with legal and regulatory requirements and oversight of the fund's activities and associated risks. The Board, acting through its committees, has charged FMR and its affiliates with (i) identifying events or circumstances the occurrence of which could have demonstrably adverse effects on the fund's business and/or reputation; (ii) implementing processes and controls to lessen the possibility that such events or circumstances occur or to mitigate the effects of such events or circumstances if they do occur; and (iii) creating and maintaining a system designed to evaluate continuously business and market conditions in order to facilitate the identification and implementation processes described in (i) and (ii) above. Because the day-to-day operations and activities of the fund are carried out by or through FMR, its affiliates and other service providers, the fund's exposure to risks is mitigated but not eliminated by the processes overseen by the Trustees. While each of the Board's committees has responsibility for overseeing different aspects of the fund's activities, oversight is exercised primarily through the Operations and Audit Committees. In addition, an ad hoc Board committee of Independent Trustees has worked with FMR to enhance the Board's oversight of investment and financial risks, legal and regulatory risks, technology risks, and operational risks, including the development of additional risk reporting to the Board. Appropriate personnel, including but not limited to the fund's Chief Compliance Officer (CCO), FMR's internal auditor, the independent accountants, the fund's Treasurer and portfolio management personnel, make periodic reports to the Board's committees, as appropriate, including an annual review of FMR's risk management program for the Fidelity funds. The responsibilities of each standing committee, including their oversight responsibilities, are described further under "Standing Committees of the Fund's Trustees."
Annual Report
Trustees and Officers - continued
The fund's Statement of Additional Information (SAI) includes more information about the Trustees. To request a free copy, call Fidelity at 1-877-208-0098.
Interested Trustees*:
Correspondence intended for each Trustee who is an interested person may be sent to Fidelity Investments, 82 Devonshire Street, Boston, Massachusetts 02109.
Name, Age; Principal Occupations and Other Relevant Experience+ |
Abigail P. Johnson (50) |
| Year of Election or Appointment: 2009 Ms. Johnson is Trustee and Chairman of the Board of Trustees of certain Trusts. Ms. Johnson serves as President of Personal, Workplace and Institutional Services (2005-present). Ms. Johnson is Chairman and Director of FMR Co., Inc. (2011-present), Chairman and Director of FMR (2011-present), and the Vice Chairman and Director (2007-present) of FMR LLC. Previously, Ms. Johnson served as President and a Director of FMR (2001-2005), a Trustee of other investment companies advised by FMR, Fidelity Investments Money Management, Inc., and FMR Co., Inc. (2001-2005), Senior Vice President of the Fidelity funds (2001-2005), and managed a number of Fidelity funds. Ms. Abigail P. Johnson and Mr. Arthur E. Johnson are not related. |
James C. Curvey (76) |
| Year of Election or Appointment: 2007 Mr. Curvey also serves as Trustee (2007-present) of other investment companies advised by FMR. Mr. Curvey is a Director of Fidelity Investments Money Management, Inc. (2009-present), Director of Fidelity Research & Analysis Co. (2009-present) and Director of FMR and FMR Co., Inc. (2007-present). Mr. Curvey is also Vice Chairman (2007-present) and Director of FMR LLC. In addition, Mr. Curvey serves as an Overseer for the Boston Symphony Orchestra and a member of the Trustees of Villanova University. Previously, Mr. Curvey was the Vice Chairman (2006-2007) and Director (2000-2007) of FMR Corp. |
* Trustees have been determined to be "Interested Trustees" by virtue of, among other things, their affiliation with the trust or various entities under common control with FMR.
+ The information above includes each Trustee's principal occupation during the last five years and other information relating to the experience, attributes, and skills relevant to each Trustee's qualifications to serve as a Trustee, which led to the conclusion that each Trustee should serve as a Trustee for the fund.
Independent Trustees:
Correspondence intended for each Independent Trustee (that is, the Trustees other than the Interested Trustees) may be sent to Fidelity Investments, P.O. Box 55235, Boston, Massachusetts 02205-5235.
Name, Age; Principal Occupations and Other Relevant Experience+ |
Albert R. Gamper, Jr. (69) |
| Year of Election or Appointment: 2007 Mr. Gamper is Vice Chairman of the Independent Trustees of the Fixed Income and Asset Allocation Funds (2011-present). Prior to his retirement in December 2004, Mr. Gamper served as Chairman of the Board of CIT Group Inc. (commercial finance). During his tenure with CIT Group Inc. Mr. Gamper served in numerous senior management positions, including Chairman (1987-1989; 1999-2001; 2002-2004), Chief Executive Officer (1987-2004), and President (2002-2003). Mr. Gamper currently serves as a member of the Board of Directors of Public Service Enterprise Group (utilities, 2000-present), a member of the Board of Trustees, Rutgers University (2004-present), and Chairman of the Board of Saint Barnabas Health Care System. Previously, Mr. Gamper served as Chairman of the Board of Governors, Rutgers University (2004-2007). |
Robert F. Gartland (60) |
| Year of Election or Appointment: 2010 Mr. Gartland is a partner and investor of Vietnam Partners LLC (investments and consulting, 2008-present) and is Chairman and an investor in Gartland and Mellina Group Corp. (consulting, 2009-present). Prior to his retirement, Mr. Gartland held a variety of positions at Morgan Stanley (financial services, 1979-2007) including Managing Director (1987-2007). |
Arthur E. Johnson (64) |
| Year of Election or Appointment: 2008 Mr. Johnson serves as a member of the Board of Directors of Eaton Corporation (diversified power management, 2009-present), AGL Resources, Inc. (holding company, 2002-present) and Booz Allen Hamilton (management consulting, 2011-present). Prior to his retirement, Mr. Johnson served as Senior Vice President of Corporate Strategic Development of Lockheed Martin Corporation (defense contractor, 1999-2009). He previously served on the Board of Directors of IKON Office Solutions, Inc. (1999-2008) and Delta Airlines (2005-2007). Mr. Arthur E. Johnson is not related to Mr. Edward C. Johnson 3d or Ms. Abigail P. Johnson. |
Michael E. Kenneally (57) |
| Year of Election or Appointment: 2009 Previously, Mr. Kenneally served as a Member of the Advisory Board for certain Fidelity Fixed Income and Asset Allocation Funds (2008-2009). Prior to his retirement, Mr. Kenneally served as Chairman and Global Chief Executive Officer of Credit Suisse Asset Management (2003-2005). Mr. Kenneally was a Director of the Credit Suisse Funds (U.S. mutual funds, 2004-2008) and certain other closed-end funds (2004-2005) and was awarded the Chartered Financial Analyst (CFA) designation in 1991. |
James H. Keyes (71) |
| Year of Election or Appointment: 2007 Mr. Keyes serves as a member of the Boards of Navistar International Corporation (manufacture and sale of trucks, buses, and diesel engines, since 2002) and Pitney Bowes, Inc. (integrated mail, messaging, and document management solutions, since 1998). Prior to his retirement, Mr. Keyes served as Chairman and Chief Executive Officer of Johnson Controls (automotive, building, and energy, 1998-2002) and as a member of the Board of LSI Logic Corporation (semiconductor technologies, 1984-2008). |
Marie L. Knowles (65) |
| Year of Election or Appointment: 2001 Prior to Ms. Knowles' retirement in June 2000, she served as Executive Vice President and Chief Financial Officer of Atlantic Richfield Company (ARCO) (diversified energy, 1996-2000). From 1993 to 1996, she was a Senior Vice President of ARCO and President of ARCO Transportation Company. She served as a Director of ARCO from 1996 to 1998. Ms. Knowles currently serves as a Director and Chairman of the Audit Committee of McKesson Corporation (healthcare service, since 2002). Ms. Knowles is an Honorary Trustee of the Brookings Institution and a member of the Board of the Catalina Island Conservancy and of the Santa Catalina Island Company (2009-present). She also serves as a member of the Advisory Board for the School of Engineering of the University of Southern California and the Foundation Board of the School of Architecture at the University of Virginia (2007-present). Previously, Ms. Knowles served as a Director of Phelps Dodge Corporation (copper mining and manufacturing, 1994-2007). |
Kenneth L. Wolfe (72) |
| Year of Election or Appointment: 2007 Mr. Wolfe is Chairman of the Independent Trustees of the Fixed Income and Asset Allocation Funds (2008-present). Prior to his retirement, Mr. Wolfe served as Chairman and a Director (2007-2009) and Chairman and Chief Executive Officer (1994-2001) of Hershey Foods Corporation. He also served as a member of the Boards of Adelphia Communications Corporation (telecommunications, 2003-2006), Bausch & Lomb, Inc. (medical/pharmaceutical, 1993-2007), and Revlon, Inc. (personal care products, 2004-2009). |
+ The information above includes each Trustee's principal occupation during the last five years and other information relating to the experience, attributes, and skills relevant to each Trustee's qualifications to serve as a Trustee, which led to the conclusion that each Trustee should serve as a Trustee for the fund.
Executive Officers:
Correspondence intended for each executive officer may be sent to Fidelity Investments, 82 Devonshire Street, Boston, Massachusetts 02109.
Name, Age; Principal Occupation |
John R. Hebble (53) |
| Year of Election or Appointment: 2008 President and Treasurer of Fidelity's Fixed Income and Asset Allocation Funds. Mr. Hebble also serves as President (2011-present), Treasurer, and Chief Financial Officer of The North Carolina Capital Management Trust: Cash and Term Portfolios (2008-present), Assistant Treasurer of other Fidelity funds (2009-present) and is an employee of Fidelity Investments. |
Derek L. Young (47) |
| Year of Election or Appointment: 2009 Vice President of Fidelity's Asset Allocation Funds. Mr. Young also serves as President and a Director of Strategic Advisers, Inc. (2011-present), President of the Global Asset Allocation Group (2011-present), and as Vice Chairman of Pyramis Global Advisers, LLC (2011-present). Previously, Mr. Young served as Chief Investment Officer of the Global Asset Allocation Group (2009-2011) and as a portfolio manager. |
Scott C. Goebel (43) |
| Year of Election or Appointment: 2008 Secretary and Chief Legal Officer (CLO) of the Fidelity funds. Mr. Goebel also serves as Secretary of Fidelity Investments Money Management, Inc. (FIMM) (2010-present) and Fidelity Research and Analysis Company (FRAC) (2010-present); Secretary and CLO of The North Carolina Capital Management Trust: Cash and Term Portfolios (2008-present); General Counsel, Secretary, and Senior Vice President of FMR (2008-present) and FMR Co., Inc. (2008-present); employed by FMR LLC or an affiliate (2001-present); Chief Legal Officer of Fidelity Management & Research (Hong Kong) Limited (2008-present) and Assistant Secretary of Fidelity Management & Research (Japan) Inc. (2008-present), and Fidelity Management & Research (U.K.) Inc. (2008-present). Previously, Mr. Goebel served as Assistant Secretary of FIMM (2008-2010), FRAC (2008-2010), and the Funds (2007-2008) and as Vice President and Secretary of Fidelity Distributors Corporation (FDC) (2005-2007). |
David J. Carter (38) |
| Year of Election or Appointment: 2010 Assistant Secretary of Fidelity's Fixed Income and Asset Allocation Funds. Mr. Carter also serves as Vice President, Associate General Counsel (2010-present) and is an employee of Fidelity Investments (2005-present). |
Holly C. Laurent (57) |
| Year of Election or Appointment: 2008 Anti-Money Laundering (AML) Officer of the Fidelity funds. Ms. Laurent also serves as AML Officer of The North Carolina Capital Management Trust: Cash and Term Portfolios (2008-present) and is an employee of Fidelity Investments. Previously, Ms. Laurent was Senior Vice President and Head of Legal for Fidelity Business Services India Pvt. Ltd. (2006-2008), and Senior Vice President, Deputy General Counsel and Group Head for FMR LLC (2005-2006). |
Christine Reynolds (53) |
| Year of Election or Appointment: 2008 Chief Financial Officer of the Fidelity funds. Ms. Reynolds became President of Fidelity Pricing and Cash Management Services (FPCMS) in August 2008. Ms. Reynolds served as Chief Operating Officer of FPCMS (2007-2008). Previously, Ms. Reynolds served as President, Treasurer, and Anti-Money Laundering officer of the Fidelity funds (2004-2007). |
Michael H. Whitaker (44) |
| Year of Election or Appointment: 2008 Chief Compliance Officer of Fidelity's Fixed Income and Asset Allocation Funds. Mr. Whitaker also serves as Chief Compliance Officer of The North Carolina Capital Management Trust: Cash and Term Portfolios (2008-present). Mr. Whitaker is an employee of Fidelity Investments (2007-present). Prior to joining Fidelity Investments, Mr. Whitaker worked at MFS Investment Management where he served as Senior Vice President and Chief Compliance Officer (2004-2006), and Assistant General Counsel. |
Jeffrey S. Christian (50) |
| Year of Election or Appointment: 2009 Deputy Treasurer of the Fidelity funds. Mr. Christian is an employee of Fidelity Investments. Previously, Mr. Christian served as Chief Financial Officer (2008-2009) of certain Fidelity funds and Senior Vice President of Fidelity Pricing and Cash Management Services (FPCMS) (2004-2009). |
Joseph F. Zambello (54) |
| Year of Election or Appointment: 2011 Deputy Treasurer of the Fidelity funds. Mr. Zambello is an employee of Fidelity Investments. Previously, Mr. Zambello served as Vice President of FMR's Program Management Group (2009-2011) and Vice President of the Transfer Agent Oversight Group (2005-2009). |
Stephanie J. Dorsey (42) |
| Year of Election or Appointment: 2008 Deputy Treasurer of Fidelity's Fixed Income and Asset Allocation Funds. Ms. Dorsey also serves as Assistant Treasurer of other Fidelity funds (2010-present) and is an employee of Fidelity Investments (2008-present). Previously, Ms. Dorsey served as Treasurer (2004-2008) of the JPMorgan Mutual Funds and Vice President (2004-2008) of JPMorgan Chase Bank. |
Adrien E. Deberghes (44) |
| Year of Election or Appointment: 2010 Assistant Treasurer of Fidelity's Fixed Income and Asset Allocation Funds. Mr. Deberghes also serves as Vice President and Assistant Treasurer of Fidelity Rutland Square Trust II and Fidelity Commonwealth Trust II (2011-present), Deputy Treasurer of other Fidelity funds (2008-present), and is an employee of Fidelity Investments (2008-present). Previously, Mr. Deberghes served as Senior Vice President of Mutual Fund Administration at State Street Corporation (2007-2008), Senior Director of Mutual Fund Administration at Investors Bank & Trust (2005-2007), and Director of Finance for Dunkin' Brands (2000-2005). |
Kenneth B. Robins (42) |
| Year of Election or Appointment: 2009 Assistant Treasurer of the Fidelity Fixed Income and Asset Allocation Funds. Mr. Robins also serves as President and Treasurer of other Fidelity funds (2008-present; 2010-present) and is an employee of Fidelity Investments (2004-present). Previously, Mr. Robins served as Deputy Treasurer of the Fidelity funds (2005-2008) and Treasurer and Chief Financial Officer of The North Carolina Capital Management Trust: Cash and Term Portfolios (2006-2008). |
Gary W. Ryan (53) |
| Year of Election or Appointment: 2005 Assistant Treasurer of the Fidelity funds. Mr. Ryan is an employee of Fidelity Investments. Previously, Mr. Ryan served as Vice President of Fund Reporting in Fidelity Pricing and Cash Management Services (FPCMS) (1999-2005). |
Jonathan Davis (43) |
| Year of Election or Appointment: 2010 Assistant Treasurer of the Fidelity funds. Mr. Davis is also Assistant Treasurer of Fidelity Rutland Square Trust II and Fidelity Commonwealth Trust II. Mr. Davis is an employee of Fidelity Investments. Previously, Mr. Davis served as Vice President and Associate General Counsel of FMR LLC (2003-2010). |
Annual Report
A total of 6.52% of the dividends distributed during the fiscal year was derived from interest on U.S. Government securities which is generally exempt from state income tax.
Initial Class designates 4% and 10%; Service Class designates 4% and 11%; Service Class 2 designates 4% and 12%; and Investor Class designates 4% and 11%; of the dividends distributed in February and December, respectively, during the fiscal year as qualifying for the dividends-received deduction for corporate shareholders.
Annual Report
Board Approval of Investment Advisory Contracts and Management Fees
VIP Asset Manager Portfolio
Each year, the Board of Trustees, including the Independent Trustees (together, the Board), votes on the renewal of the management contract and sub-advisory agreements (together, the Advisory Contracts) for the fund. The Board, assisted by the advice of fund counsel and Independent Trustees' counsel, requests and considers a broad range of information relevant to the renewal of the Advisory Contracts throughout the year.
The Board meets regularly and considers at each of its meetings factors that are relevant to its annual consideration of the renewal of the fund's Advisory Contracts, including the services and support provided to the fund and its shareholders. The Board has established three standing committees, Operations, Audit, and Nominating and Governance, each composed of Independent Trustees with varying backgrounds, to which the Board has assigned specific subject matter responsibilities in order to enhance effective decision-making by the Board. The Operations Committee, of which all of the Independent Trustees are members, meets regularly throughout the year and, among other matters, considers matters specifically related to the annual consideration of the renewal of the fund's Advisory Contracts. The Board, acting directly and through its Committees, requests and receives information concerning the annual consideration of the renewal of the fund's Advisory Contracts. The Board also meets as needed to consider matters specifically related to the Board's annual consideration of the renewal of Advisory Contracts. Members of the Board may also meet with trustees of other Fidelity funds through ad hoc joint committees to discuss certain matters relevant to the Fidelity funds.
At its September 2011 meeting, the Board of Trustees, including the Independent Trustees, unanimously determined to renew the fund's Advisory Contracts. In reaching its determination, the Board considered all factors it believed relevant, including (i) the nature, extent, and quality of the services to be provided to the fund and its shareholders (including the investment performance of the fund); (ii) the competitiveness of the fund's management fee and total expense ratio; (iii) the total costs of the services to be provided by and the profits to be realized by Fidelity from its relationship with the fund; (iv) the extent to which economies of scale would be realized as the fund grows; and (v) whether fee levels reflect these economies of scale, if any, for the benefit of fund shareholders.
In considering whether to renew the Advisory Contracts for the fund, the Board reached a determination, with the assistance of fund counsel and Independent Trustees' counsel and through the exercise of its business judgment, that the renewal of the Advisory Contracts is in the best interests of the fund and its shareholders and that the compensation payable under the Advisory Contracts is fair and reasonable. The Board's decision to renew the Advisory Contracts was not based on any single factor, but rather was based on a comprehensive consideration of all the information provided to the Board at its meetings throughout the year. The Board, in reaching its determination to renew the Advisory Contracts, is aware that shareholders in the fund have a broad range of investment choices available to them, including a wide choice among mutual funds offered by Fidelity's competitors, and that the fund's shareholders, who have the opportunity to review and weigh the disclosure provided by the fund in its prospectus and other public disclosures, have chosen to invest in this fund, managed by Fidelity.
Nature, Extent, and Quality of Services Provided. The Board considered the staffing within the investment adviser, FMR, and the sub-advisers (together, the Investment Advisers), including the backgrounds of the fund's investment personnel and the fund's investment objective and discipline. The Independent Trustees also had discussions with senior management of Fidelity's investment operations and investment groups. The Board considered the structure of the portfolio manager compensation program and whether this structure provides appropriate incentives to act in the best interests of the fund.
Resources Dedicated to Investment Management and Support Services. The Board reviewed the general qualifications and capabilities of the Investment Advisers' investment staff, including its size, education, experience, and resources, as well as the Investment Advisers' approach to recruiting, managing, and compensating investment personnel. The Board also noted that FMR has devoted increased resources to non-U.S. offices. The Board noted that Fidelity's analysts have extensive resources, tools and capabilities which allow them to conduct sophisticated quantitative and fundamental analysis, as well as credit analysis of issuers, counterparties and enhancers. The Board also believes that Fidelity's investment professionals have sufficient access to global information and data so as to provide competitive investment results over time, and that those professionals also have access to sophisticated tools which permit them to assess portfolio construction and risk and performance attribution characteristics continuously, as well as to transmit new information and research conclusions rapidly around the world. Additionally, in its deliberations, the Board considered the Investment Advisers' trading capabilities and resources which are an integral part of the investment management process.
Shareholder and Administrative Services. The Board considered (i) the nature, extent, quality, and cost of advisory, administrative, and shareholder services performed by the Investment Advisers and their affiliates under the Advisory Contracts and under separate agreements covering transfer agency, pricing and bookkeeping, and securities lending services for the fund; (ii) the nature and extent of the investment adviser's supervision of third party service providers, principally custodians and subcustodians; and (iii) the resources devoted to, and the record of compliance with, the fund's compliance policies and procedures. The Board also reviewed the allocation of fund brokerage, including allocations to brokers affiliated with the Investment Advisers, the use of brokerage commissions to pay fund expenses, and the use of "soft" commission dollars to pay for research services.
The Board noted that the growth of fund assets over time across the complex allows Fidelity to reinvest in the development of services designed to enhance the value or convenience of the Fidelity funds as investment vehicles. These services include 24-hour access to account information and market information through telephone representatives and over the Internet, investor education materials and asset allocation tools, and the expanded availability of Fidelity Investor Centers, with 35 new branches opening since 2010.
Annual Report
Board Approval of Investment Advisory Contracts and Management Fees - continued
Investment in a Large Fund Family. The Board considered the benefits to shareholders of investing in a Fidelity fund, including the benefits of investing in a fund that is part of a large family of funds offering a variety of investment disciplines and providing a large variety of mutual fund investor services. The Board noted that Fidelity had taken, or had made recommendations that resulted in the Fidelity funds taking, a number of actions over the previous year that benefited particular funds, including (i) continuing to dedicate additional resources to investment research and support of the senior management team that oversees asset management; (ii) rationalizing product lines through the mergers of six funds into other funds; (iii) continuing to migrate the Freedom Funds to dedicated lower cost underlying funds; (iv) obtaining shareholder approval to broaden the investment strategies for Fidelity Consumer Finance Portfolio, Fidelity Emerging Asia Fund, and Fidelity Environment and Alternative Energy Portfolio; (v) contractually agreeing to reduce the management fees and impose other expense limitations on Spartan 500 Index Fund and U.S. Bond Index Fund in connection with launching new institutional classes of these funds; (vi) changing the name, primary and supplemental benchmarks, and investment policies of Fidelity Global Strategies Fund to support the fund's flexible investment mandate and global orientation; and (vii) reducing the transfer agency account fee rates on certain accounts.
Investment Performance. The Board considered whether the fund has operated in accordance with its investment objective, as well as its record of compliance with its investment restrictions. It also reviewed the fund's absolute investment performance for each class, as well as the fund's relative investment performance for each class measured over multiple periods against (i) a proprietary custom index, and (ii) a peer group of mutual funds deemed appropriate by Fidelity and reviewed by the Board. The following charts considered by the Board show, over the one-, three-, and five-year periods ended December 31, 2010, the cumulative total returns of Initial Class and Service Class 2 of the fund, the cumulative total returns of a proprietary custom index ("benchmark"), and a range of cumulative total returns of a peer group of mutual funds identified by Morningstar, Inc. as having an investment style similar to that of the fund based on underlying portfolio holdings. The returns of Initial Class and Service Class 2 show the performance of the highest and lowest performing classes, respectively (based on five-year performance). The box within each chart shows the 25th percentile return (bottom of box) and the 75th percentile return (top of box) of the peer group. Returns shown above the box are in the first quartile and returns shown below the box are in the fourth quartile. The percentage beaten numbers noted below each chart correspond to the percentile box and represent the percentage of funds in the peer group whose performance was equal to or lower than that of the class indicated. The fund's proprietary custom index is an index developed by FMR that represents the performance of the fund's three asset classes according to their respective weightings in the fund's neutral mix.
VIP Asset Manager Portfolio
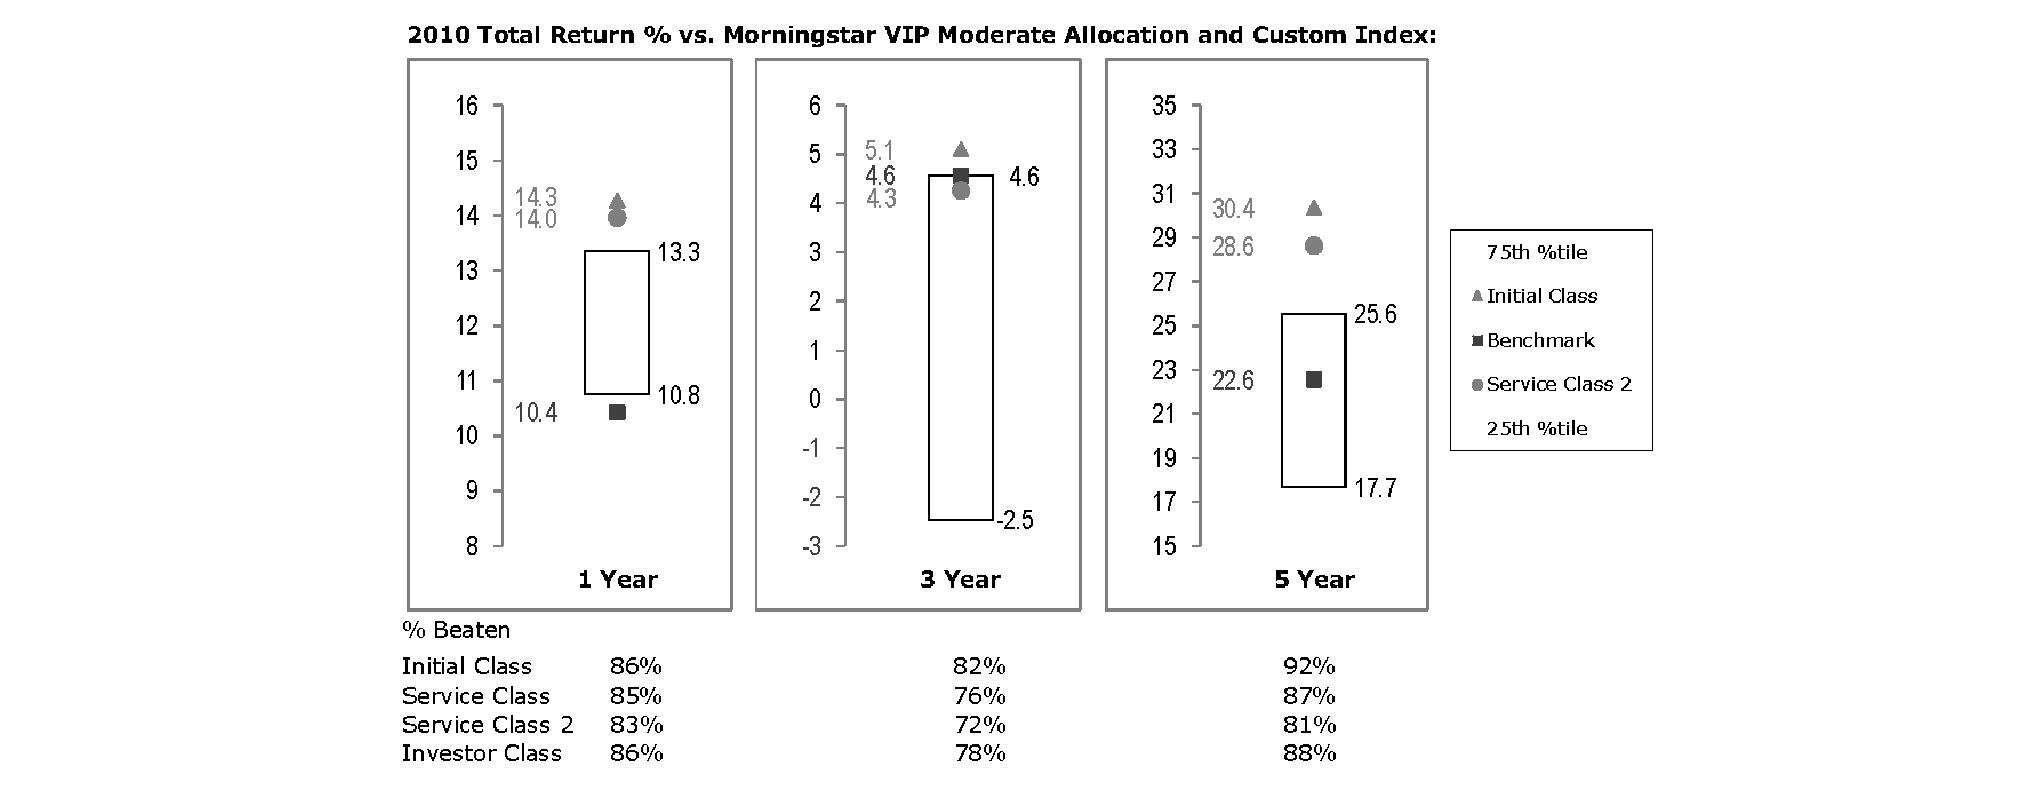
The Board reviewed the fund's relative investment performance against its peer group and noted that the performance of Initial Class of the fund was in the first quartile for all the periods shown. The Board also noted that the investment performance of Initial Class of the fund compared favorably to its benchmark for all the periods shown. The Board considered that the variations in performance among the fund's classes reflect the variations in class expenses, which result in lower performance for higher expense classes. The Board also reviewed the fund's performance since inception as well as performance in the current year.
Based on its review, the Board concluded that the nature, extent, and quality of services provided to the fund under the Advisory Contracts should benefit the fund's shareholders.
Annual Report
Competitiveness of Management Fee and Total Expense Ratio. The Board considered the fund's management fee and total expense ratio compared to "mapped groups" of competitive funds and classes. Fidelity creates "mapped groups" by combining similar Lipper investment objective categories that have comparable management fee characteristics. Combining Lipper investment objective categories aids the Board's management fee and total expense ratio comparisons by broadening the competitive group used for comparison and by reducing the number of universes to which various Fidelity funds are compared.
Management Fee. The Board considered two proprietary management fee comparisons for the 12-month periods shown in the chart below. The group of Lipper funds used by the Board for management fee comparisons is referred to below as the "Total Mapped Group." The Total Mapped Group comparison focuses on a fund's standing relative to the total universe of comparable funds available to investors in terms of gross management fees before expense reimbursements or caps. "TMG %" represents the percentage of funds in the Total Mapped Group that had management fees that were lower than the fund's. For example, a TMG % of 23% means that 77% of the funds in the Total Mapped Group had higher management fees than the fund. The "Asset-Size Peer Group" (ASPG) comparison focuses on a fund's standing relative to non-Fidelity funds similar in size to the fund within the Total Mapped Group. The ASPG represents at least 15% of the funds in the Total Mapped Group with comparable asset size and management fee characteristics, subject to a minimum of 50 funds (or all funds in the Total Mapped Group if fewer than 50). Additional information, such as the ASPG quartile in which the fund's management fee ranked, is also included in the chart and considered by the Board.
VIP Asset Manager Portfolio
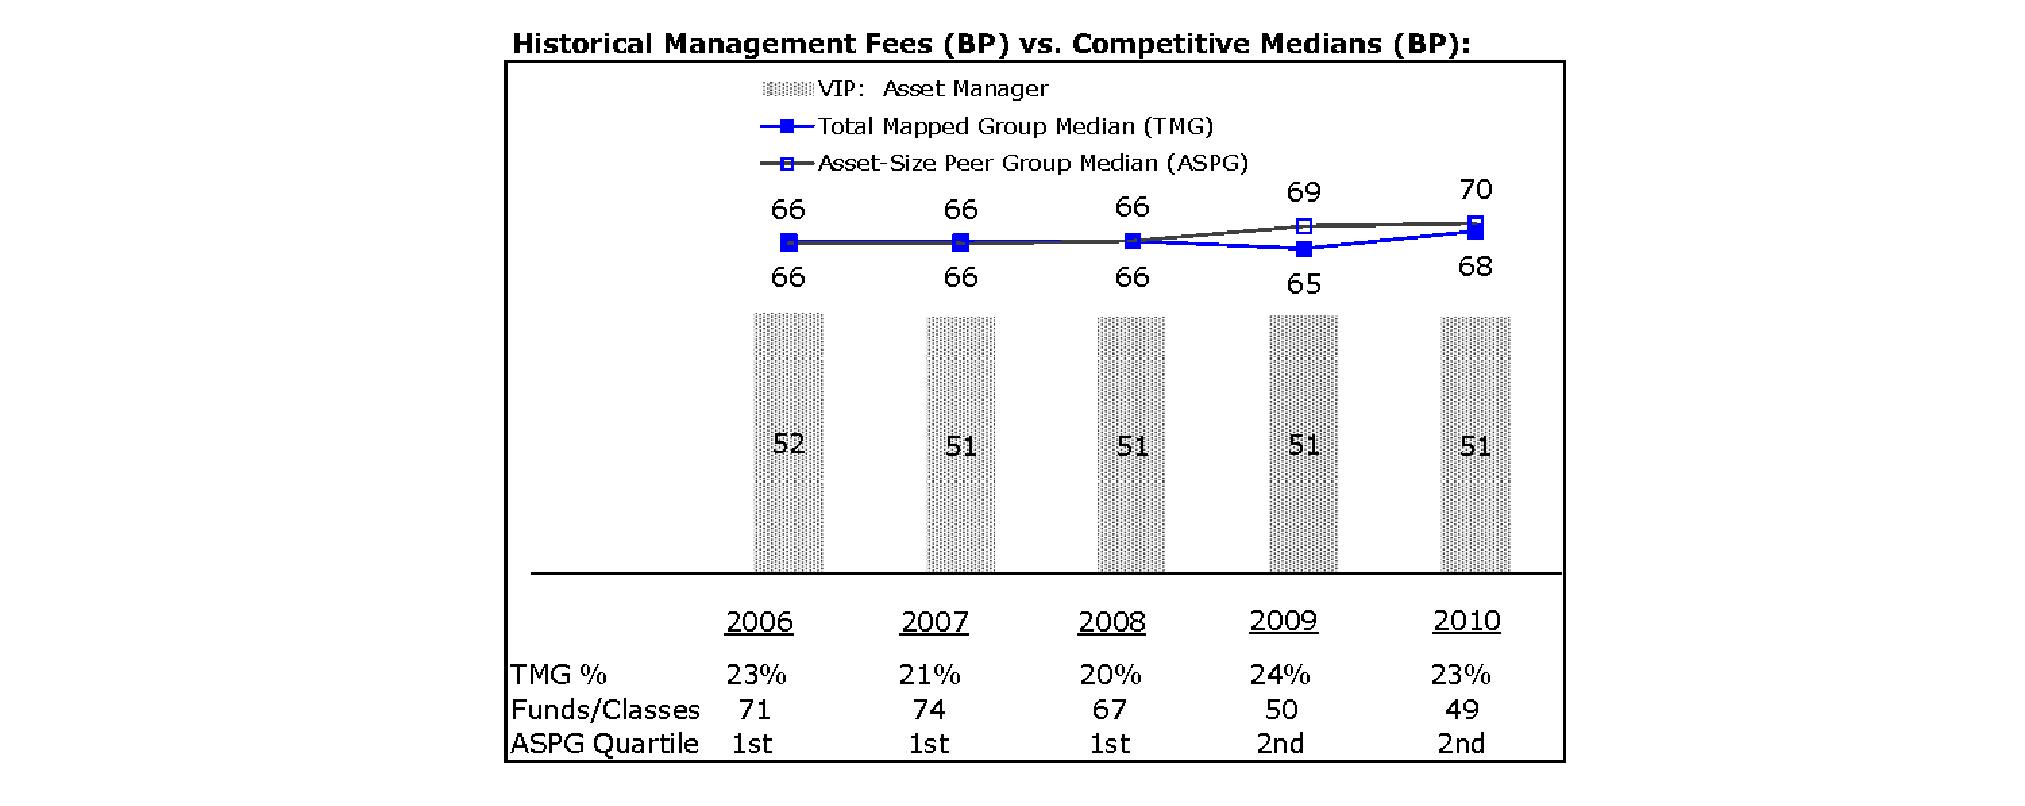
The Board noted that the fund's management fee ranked below the median of its Total Mapped Group and below the median of its ASPG for 2010.
Based on its review, the Board concluded that the fund's management fee is fair and reasonable in light of the services that the fund receives and the other factors considered.
Total Expense Ratio. In its review of each class's total expense ratio, the Board considered the fund's management fee as well as other fund or class expenses, as applicable, such as transfer agent fees, pricing and bookkeeping fees, fund-paid 12b-1 fees, and custodial, legal, and audit fees. The Board also noted the effects of any waivers and reimbursements on fees and expenses. As part of its review, the Board also considered the current and historical total expense ratios of each class of the fund compared to competitive fund median expenses. Each class of the fund is compared to those funds and classes in the Total Mapped Group (used by the Board for management fee comparisons) that have a similar sales load structure.
The Board noted that the total expense ratio of each of Initial Class, Investor Class, and Service Class ranked below its competitive median for 2010 and the total expense ratio of Service Class 2 ranked above its competitive median for 2010. The Board considered that various factors, including 12b-1 fees and relatively higher other expenses in the case of small fund size, can affect total expense ratios. The Board noted that the total expense ratio of Service Class 2 was above the median due to 12b-1 fees and that the funds and classes in the Total Mapped Group that have a similar sales load structure included classes with no 12b-1 fees. Excluding the 12b-1 fees, the total expense ratio of Service Class 2 ranked below its competitive median for 2010. The Board also noted that Investor Class has higher transfer agent fees than traditional variable annuity classes because it is designed for lower cost annuity products, where the majority of servicing costs are incorporated into the funds' total expense ratios rather than being paid at the annuity level. The Board noted that the fund offers multiple classes, each of which has a different 12b-1 fee structure, and that the multiple structures are intended to offer a range of pricing options for the intermediary market. The Board also noted that the total expense ratios of the classes vary primarily by the level of their 12b-1 fees, although differences in transfer agent fees may also cause expenses to vary from class to class.
Annual Report
Board Approval of Investment Advisory Contracts and Management Fees - continued
Fees Charged to Other Fidelity Clients. The Board also considered Fidelity fee structures and other information with respect to clients of FMR and its affiliates, such as other mutual funds advised or subadvised by FMR or its affiliates, pension plan clients, and other institutional clients. In March 2010, the Board created an ad hoc joint committee with the board of other Fidelity funds (the Committee) to review and compare Fidelity's institutional investment advisory business with its business of providing services to the Fidelity funds, including the differences in services provided, fees charged, and costs incurred, as well as competition in their respective marketplaces.
Based on its review of total expense ratios and fees charged to other Fidelity clients, the Board concluded that the total expense ratio of each class of the fund was reasonable, although Service Class 2 was above the median of the universe presented for comparison, in light of the services that the fund and its shareholders receive and the other factors considered, including the findings of the Committee.
Costs of the Services and Profitability. The Board considered the revenues earned and the expenses incurred by Fidelity in conducting the business of developing, marketing, distributing, managing, administering and servicing the fund and its shareholders. The Board also considered the level of Fidelity's profits in respect of all the Fidelity funds.
On an annual basis, FMR presents to the Board Fidelity's profitability for the fund. Fidelity calculates the profitability for each fund, as well as aggregate profitability for groups of Fidelity funds and all Fidelity funds, using a series of detailed revenue and cost allocation methodologies which originate with the books and records of Fidelity on which Fidelity's audited financial statements are based. The Audit Committee of the Board reviews any significant changes from the prior year's methodologies.
PricewaterhouseCoopers LLP (PwC), independent registered public accounting firm and auditor to Fidelity and certain Fidelity funds, has been engaged annually by the Board as part of the Board's assessment of Fidelity's profitability analysis. PwC's engagement includes the review and assessment of Fidelity's methodologies used in determining the revenues and expenses attributable to Fidelity's mutual fund business, and completion of agreed-upon procedures surrounding the mathematical accuracy of fund profitability and its conformity to allocation methodologies. After considering PwC's reports issued under the engagement and information provided by Fidelity, the Board concluded that while other allocation methods may also be reasonable, Fidelity's profitability methodologies are reasonable in all material respects.
The Board also reviewed Fidelity's non-fund businesses and fall-out benefits related to the mutual fund business as well as cases where Fidelity's affiliates may benefit from or be related to the fund's business.
The Board considered the costs of the services provided by and the profits realized by Fidelity in connection with the operation of the fund and was satisfied that the profitability was not excessive in the circumstances.
Economies of Scale. The Board considered whether there have been economies of scale in respect of the management of the Fidelity funds, whether the Fidelity funds (including the fund) have appropriately benefited from any such economies of scale, and whether there is potential for realization of any further economies of scale. The Board considered the extent to which the fund will benefit from economies of scale through increased services to the fund, through waivers or reimbursements, or through fee or expense reductions. The Board also noted that in 2009, it and the board of other Fidelity funds created an ad hoc committee (the Economies of Scale Committee) to analyze whether FMR attains economies of scale in respect of the management and servicing of the Fidelity funds, whether the Fidelity funds have appropriately benefited from such economies of scale, and whether there is potential for realization of any further economies of scale.
The Board recognized that the fund's management contract incorporates a "group fee" structure, which provides for lower group fee rates as total fund assets under FMR's management increase, and for higher group fee rates as total fund assets under FMR's management decrease. FMR calculates the group fee rates based on a tiered asset "breakpoint" schedule that varies based on asset class. The Board considered that the group fee is designed to deliver the benefits of economies of scale to fund shareholders when total Fidelity fund assets increase, even if assets of any particular fund are unchanged or have declined, because some portion of Fidelity's costs are attributable to services provided to all Fidelity funds, and all funds benefit if those costs can be allocated among more assets. The Board concluded that, given the group fee structure, fund shareholders will benefit from lower management fees as assets under FMR's management increase at the fund complex level, regardless of whether Fidelity achieves any such economies of scale.
The Board concluded, taking into account the analysis of the Economies of Scale Committee, that any potential economies of scale are being appropriately shared between fund shareholders and Fidelity.
Additional Information Requested by the Board. In order to develop fully the factual basis for consideration of the Fidelity funds' Advisory Contracts, the Board requested and received additional information on certain topics, including: (i) Fidelity's fund profitability methodology, profitability trends for certain funds, and the impact of certain factors on fund profitability results; (ii) portfolio manager changes that have occurred during the past year and the amount of the investment that each portfolio manager has made in the Fidelity fund(s) that he or she manages; (iii) Fidelity's compensation structure for portfolio managers, research analysts, and other key personnel, including its effects on fund profitability, the rationale for the compensation structure, and the extent to which current market conditions have affected retention and recruitment; (iv) the compensation paid to fund sub-advisers on behalf of the Fidelity funds; (v) Fidelity's fee structures and rationale for recommending different fees among different categories of funds and classes, as well as Fidelity's voluntary waiver of its fees to maintain minimum yields for certain money market funds and classes; (vi) the reasons why certain expenses affect various funds and classes differently; (vii) Fidelity's transfer agent fees, expenses, and services and how the benefits of decreased costs and new efficiencies can be shared across all of the Fidelity funds; (viii) the reasons for and consequences of changes to certain product lines compared to competitors; (ix) the allocation of and historical trends in Fidelity's realization of fall-out benefits; and (x) explanations regarding the relative total expense ratios of certain funds and classes, total expense competitive trends, and actions that might be taken by FMR to reduce total expense ratios for certain funds and classes or to achieve further economies of scale.
Annual Report
Based on its evaluation of all of the conclusions noted above, and after considering all factors it believed relevant, the Board ultimately concluded that the advisory fee structures are fair and reasonable, and that the fund's Advisory Contracts should be renewed.
Annual Report
Investment Adviser
Fidelity Management & Research Company
Boston, MA
Investment Sub-Advisers
FMR Co., Inc.
Fidelity Management & Research (U.K.) Inc.
Fidelity Investments Money Management, Inc.
Fidelity Management & Research
(Hong Kong) Limited
Fidelity Management & Research
(Japan) Inc.
General Distributor
Fidelity Distributors Corporation
Boston, MA
Transfer and Service Agents
Fidelity Investments Institutional Operations Company, Inc.
Boston, MA
Fidelity Service Company, Inc.
Boston, MA
Custodian
JPMorgan Chase Bank
New York, NY
VIPAM-ANN-0212
1.540206.114
Fidelity® Variable Insurance Products:
Asset Manager: Growth Portfolio
Annual Report
December 31, 2011
Contents
Performance | (Click Here) | How the fund has done over time. |
Management's Discussion of Fund Performance | (Click Here) | The Portfolio Manager's review of fund performance and strategy. |
Shareholder Expense Example | (Click Here) | An example of shareholder expenses. |
Investment Changes | (Click Here) | A summary of major shifts in the fund's investments over the past six months. |
Investments | (Click Here) | A complete list of the fund's investments with their market values. |
Financial Statements | (Click Here) | Statements of assets and liabilities, operations, and changes in net assets, as well as financial highlights. |
Notes | (Click Here) | Notes to the financial statements. |
Report of Independent Registered Public Accounting Firm | (Click Here) | |
Trustees and Officers | (Click Here) | |
Distributions | (Click Here) | |
Board Approval of Investment Advisory Contracts and Management Fees | (Click Here) | |
To view a fund's proxy voting guidelines and proxy voting record for the 12-month period ended June 30, visit http://www.fidelity.com/proxyvotingresults or visit the Securities and Exchange Commission's (SEC) web site at http://www.sec.gov. You may also call 1-877-208-0098 to request a free copy of the proxy voting guidelines.
Fidelity Variable Insurance Products are separate account options which are purchased through a variable insurance contract.
Standard & Poor's, S&P and S&P 500 are registered service marks of The McGraw-Hill Companies, Inc. and have been licensed for use by Fidelity Distributors Corporation.
Other third party marks appearing herein are the property of their respective owners.
All other marks appearing herein are registered or unregistered trademarks or service marks of FMR LLC or an affiliated company.
This report and the financial statements contained herein are submitted for the general information of the shareholders of the fund. This report is not authorized for distribution to prospective investors in the fund unless preceded or accompanied by an effective prospectus.
A fund files its complete schedule of portfolio holdings with the SEC for the first and third quarters of each fiscal year on Form N-Q. Forms N-Q are available on the SEC's web site at http://www.sec.gov. A fund's Forms N-Q may be reviewed and copied at the SEC's Public Reference Room in Washington, DC. Information regarding the operation of the SEC's Public Reference Room may be obtained by calling 1-800-SEC-0330. For a complete list of a fund's portfolio holdings, view the most recent holdings listings, semiannual report, or annual report on Fidelity's web site at http://www.fidelity.com, http://www.advisor.fidelity.com, or http://www.401k.com, as applicable.
NOT FDIC INSURED • MAY LOSE VALUE • NO BANK GUARANTEE
Neither the fund nor Fidelity Distributors Corporation is a bank.
Annual Report
Average annual total return reflects the change in the value of an investment, assuming reinvestment of the class' distributions from dividend income and capital gains (the profits earned upon the sale of securities that have grown in value, if any) and assuming a constant rate of performance each year. During periods of reimbursement by Fidelity, a fund's total return will be greater than it would be had the reimbursement not occurred. Performance numbers are net of all underlying fund operating expenses, but do not include any insurance charges imposed by your insurance company's separate account. If performance information included the effect of these additional charges, the total returns would have been lower. How a fund did yesterday is no guarantee of how it will do tomorrow.
Average Annual Total Returns
Periods ended December 31, 2011 | Past 1
year | Past 5
years | Past 10
years |
VIP Asset Manager: Growth Portfolio - Initial Class | -6.17% | 2.07% | 3.12% |
VIP Asset Manager: Growth Portfolio - Service Class | -6.26% | 1.95% | 3.01% |
VIP Asset Manager: Growth Portfolio - Service Class 2 | -6.39% | 1.79% | 2.82% |
VIP Asset Manager: Growth Portfolio - Investor Class A | -6.20% | 1.97% | 3.04% |
A The initial offering of Investor Class shares took place on July 21, 2005. Returns prior to July 21, 2005 are those of Initial Class. Had Investor Class's transfer agent fee been reflected, returns prior to July 21, 2005 would have been lower.
$10,000 Over 10 Years
Let's say hypothetically that $10,000 was invested in VIP Asset Manager: Growth Portfolio - Initial Class on December 31, 2001. The chart shows how the value of your investment would have changed, and also shows how the S&P 500® Index performed over the same period.
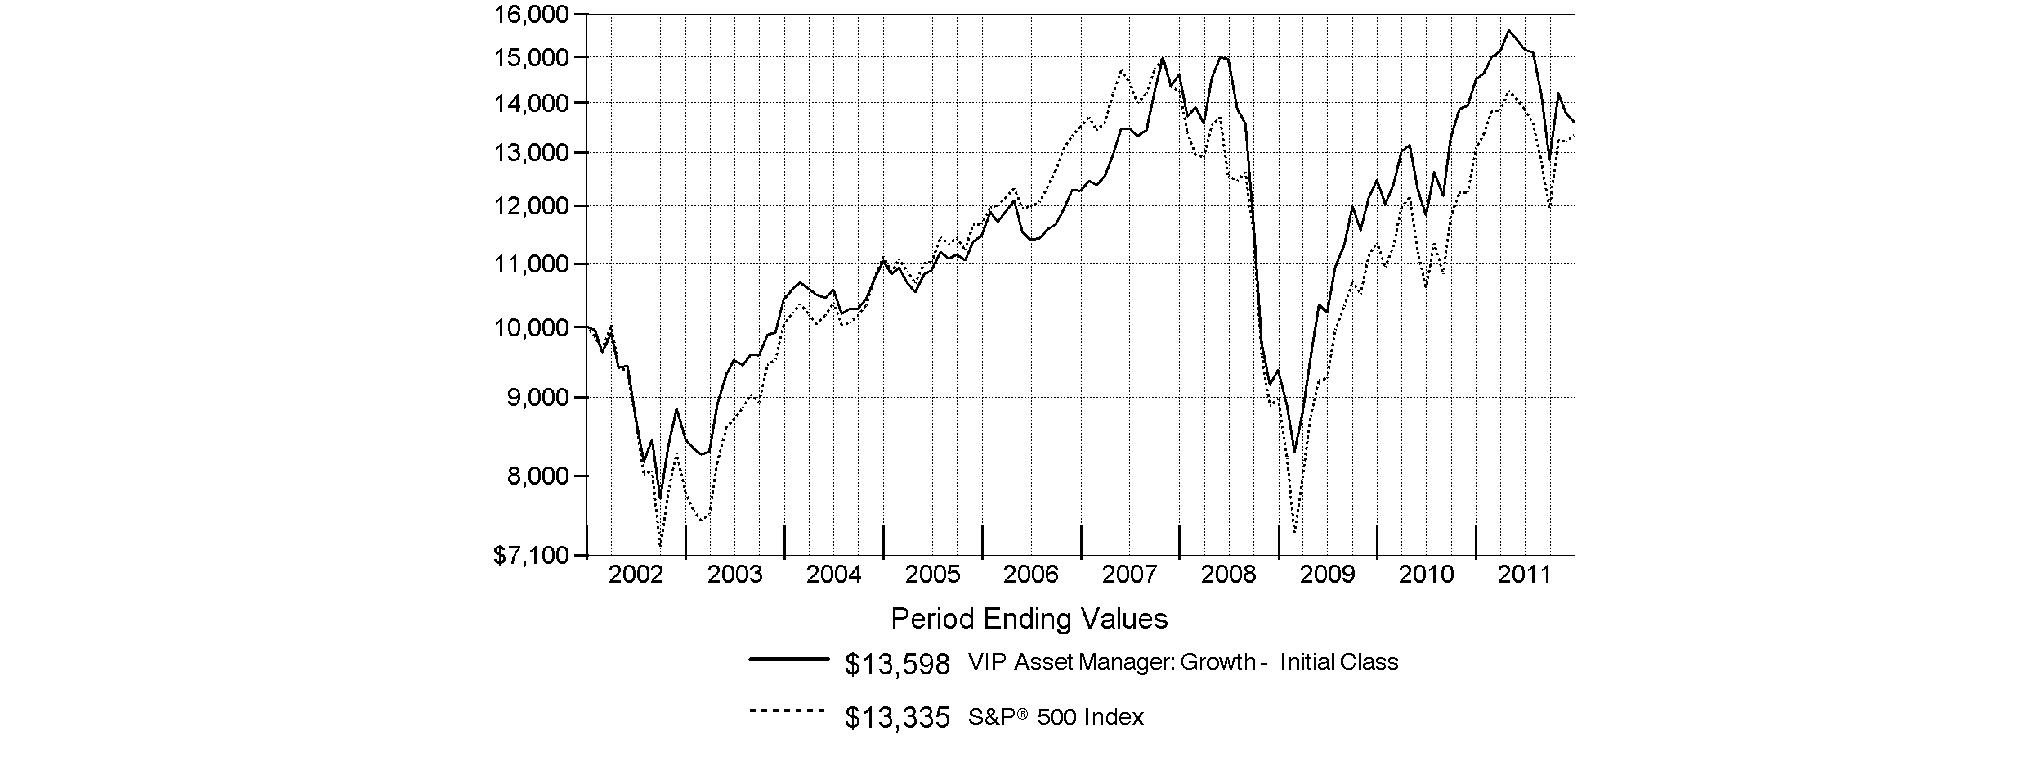
Annual Report
Market Recap: Extreme market volatility took center stage during the 12 months ending December 31, 2011, stealing the spotlight from signs of progress in the global economy. Early in the year, aggressive monetary stimulus by the U.S. federal government, improving credit-market conditions and solid corporate earnings buoyed most major asset classes. As the period progressed, however, fresh worries about sovereign debt in Europe, inflation in China, gridlock over raising the debt ceiling in the U.S. - along with Standard & Poor's early-August downgrade of the nation's long-term sovereign credit rating - and a dimmed outlook for global growth punctured investor confidence and ignited market instability. Domestic equities, as measured by the broad-based S&P 500® Index, gained 2.11%, easily outpacing the 13.61% decline of MSCI® ACWI® (All Country World Index) ex USA Index, a proxy for foreign stocks. Within the MSCI index, emerging markets declined the most (-18%), with investments here generally held back by a stronger U.S. dollar. The U.K. (-3%) fared better than the rest of Europe (-15%), which was the second-worst-performing index component. Bolstered by periodic flights to quality, U.S. investment-grade bonds posted a 7.84% advance, as reflected by the Barclays Capital® U.S. Aggregate Bond Index, outperforming the 4.37% gain of high-yield securities, as represented by The BofA Merrill LynchSM US High Yield Constrained Index. Hampered by financial woes in Europe, the sovereign debt of major developed markets outside the U.S. rose 4.86%, according to the Citigroup® Non-USD Group-of-Seven (G7) Equal Weighted Index, while the JPMorgan Emerging Markets Bond Index Global (EMBI Global) advanced 8.46%, despite the currency head wind.
Comments from Geoff Stein, Portfolio Manager of VIP Asset Manager: Growth Portfolio: For the year ending December 31, 2011, the fund's share classes sharply underperformed the 0.10% return of the Fidelity Asset Manager 70% Composite Index. (For specific portfolio results, please see the performance section of this report.) Poor domestic equity security selection overwhelmed the modest benefit of favorable weighting decisions here, and was, by far, the biggest reason for the fund's underperformance. The U.S. equity subportfolio suffered the most during the third quarter when investors moved out of growth and cyclical stocks, which represented the bulk of its holdings, in favor of defensive sectors, such as utilities, consumer staples and health care. Various factors drove this shift, but the overriding one was a growing fear that the sovereign debt crisis in Europe might spin out of control. On a sector basis, energy, information technology, consumer discretionary and industrials all had a significant negative impact on the subportfolio's results during the year, mainly because of stock selection. Adverse positioning in materials and health care, along with underexposure to utilities, also hurt. Modest out-of-benchmark exposure to emerging-markets (EM) equities also hampered performance. EM stocks responded to the global flight from risk with greater volatility than either U.S. or foreign developed-markets equities, and performed considerably worse in U.S. dollar terms. A small allocation to commodities was another detractor, as this economically sensitive asset class struggled amid heightened concern about a global economic slowdown. On the plus side, underweighting foreign developed-markets equities outweighed weak security selection in that category. I continued to have a dim view of European markets, given the sharp fiscal and economic contrasts between core and peripheral eurozone countries. Additionally, I thought the euro was relatively unattractive and, since we do not hedge foreign currency exposure, wanted to limit the fund's allocation to it. In the investment-grade bond central fund, out-of-index holdings in Treasury Inflation-Protected Securities (TIPS) provided a nice boost, as did my well-timed tactical allocation to the asset class. I added the TIPS position during the summer, in time to benefit from the bouts of investor risk aversion that ensued during the remainder of the period. Lastly, out-of-benchmark allocations to high-yield bonds and floating-rate bank-loan securities were additional contributors.
The views expressed above reflect those of the portfolio manager(s) only through the end of the period as stated on the cover of this report and do not necessarily represent the views of Fidelity or any other person in the Fidelity organization. Any such views are subject to change at any time based upon market or other conditions and Fidelity disclaims any responsibility to update such views. These views may not be relied on as investment advice and, because investment decisions for a Fidelity fund are based on numerous factors, may not be relied on as an indication of trading intent on behalf of any Fidelity fund.
Annual Report
As a shareholder of the Fund, you incur two types of costs: (1) transaction costs, and (2) ongoing costs, including management fees, distribution and/or service (12b-1) fees and other Fund expenses. This Example is intended to help you understand your ongoing costs (in dollars) of investing in the Fund and to compare these costs with the ongoing costs of investing in other mutual funds.
The Example is based on an investment of $1,000 invested at the beginning of the period and held for the entire period (July 1, 2011 to December 31, 2011).
Actual Expenses
The first line of the accompanying table for each class of the Fund provides information about actual account values and actual expenses. You may use the information in this line, together with the amount you invested, to estimate the expenses that you paid over the period. Simply divide your account value by $1,000.00 (for example, an $8,600 account value divided by $1,000.00 = 8.6), then multiply the result by the number in the first line for a class of the Fund under the heading entitled "Expenses Paid During Period" to estimate the expenses you paid on your account during this period. The estimate of expenses does not include any fees or other expenses of any variable annuity or variable life insurance product. If they were, the estimate of expenses you paid during the period would be higher, and your ending account value would be lower. In addition, the Fund, as a shareholder in the underlying Fidelity Central Funds, will indirectly bear its pro-rata share of the fees and expenses incurred by the underlying Fidelity Central Funds. These fees and expenses are not included in the Fund's annualized expense ratio used to calculate the expense estimate in the table below.
Hypothetical Example for Comparison Purposes
The second line of the accompanying table for each class of the Fund provides information about hypothetical account values and hypothetical expenses based on a Class' actual expense ratio and an assumed rate of return of 5% per year before expenses, which is not the Class' actual return. The hypothetical account values and expenses may not be used to estimate the actual ending account balance or expenses you paid for the period. You may use this information to compare the ongoing costs of investing in the Fund and other funds. To do so, compare this 5% hypothetical example with the 5% hypothetical examples that appear in the shareholder reports of the other funds. The estimate of expenses does not include any fees or other expenses of any variable annuity or variable life insurance product. If they were, the estimate of expenses you paid during the period would be higher, and your ending account value would be lower. In addition, the Fund, as a shareholder in the underlying Fidelity Central Funds, will indirectly bear its pro-rata share of the fees and expenses incurred by the underlying Fidelity Central Funds. These fees and expenses are not included in the Fund's annualized expense ratio used to calculate the expense estimate in the table below.
Please note that the expenses shown in the table are meant to highlight your ongoing costs only and do not reflect any transaction costs. Therefore, the second line of the table is useful in comparing ongoing costs only, and will not help you determine the relative total costs of owning different funds.
| Annualized
Expense Ratio | Beginning
Account Value
July 1, 2011 | Ending
Account Value
December 31, 2011 | Expenses Paid
During Period*
July 1, 2011 to December 31, 2011 |
Initial Class | .72% | | | |
Actual | | $ 1,000.00 | $ 896.90 | $ 3.44 |
HypotheticalA | | $ 1,000.00 | $ 1,021.58 | $ 3.67 |
Service Class | .82% | | | |
Actual | | $ 1,000.00 | $ 896.30 | $ 3.92 |
HypotheticalA | | $ 1,000.00 | $ 1,021.07 | $ 4.18 |
Service Class 2 | 1.01% | | | |
Actual | | $ 1,000.00 | $ 895.60 | $ 4.83 |
HypotheticalA | | $ 1,000.00 | $ 1,020.11 | $ 5.14 |
Investor Class | .80% | | | |
Actual | | $ 1,000.00 | $ 896.40 | $ 3.82 |
HypotheticalA | | $ 1,000.00 | $ 1,021.17 | $ 4.08 |
A 5% return per year before expenses
* Expenses are equal to each Class' annualized expense ratio, multiplied by the average account value over the period, multiplied by 184/365 (to reflect the one-half year period). The fees and expenses of the underlying Fidelity Central Funds in which the Fund invests are not included in the Fund's annualized expense ratio.
Annual Report
Investment Changes (Unaudited)
The information in the following tables is based on the combined investments of the Fund and its pro-rata share of the investments of Fidelity's Central Funds, other than the Commodity Strategy and Money Market Central Funds.
Top Ten Stocks as of December 31, 2011 |
| % of fund's
net assets | % of fund's net assets
6 months ago |
Apple, Inc. | 3.1 | 2.0 |
Chevron Corp. | 1.2 | 1.3 |
United Continental Holdings, Inc. | 1.2 | 1.2 |
Schlumberger Ltd. | 0.9 | 1.2 |
Pioneer Natural Resources Co. | 0.8 | 0.7 |
Delta Air Lines, Inc. | 0.8 | 0.7 |
Deckers Outdoor Corp. | 0.8 | 0.8 |
Occidental Petroleum Corp. | 0.8 | 0.4 |
Continental Resources, Inc. | 0.7 | 0.6 |
Humana, Inc. | 0.7 | 0.5 |
| 11.0 | |
Market Sectors as of December 31, 2011 |
(stocks only) | % of fund's
net assets | % of fund's net assets
6 months ago |
Consumer Discretionary | 14.5 | 10.8 |
Information Technology | 10.6 | 11.4 |
Energy | 10.4 | 10.6 |
Industrials | 6.5 | 8.8 |
Health Care | 6.4 | 7.2 |
Financials | 5.9 | 5.7 |
Materials | 3.7 | 7.6 |
Consumer Staples | 3.7 | 4.2 |
Telecommunication Services | 1.4 | 1.1 |
Utilities | 0.8 | 1.0 |
Asset Allocation (% of fund's net assets) |
As of December 31, 2011* | As of June 30, 2011** |
 | Stock Class*** 65.2% | | | Stock Class and
Equity Futures**** 69.7% | |
 | Bond Class 28.3% | | | Bond Class 26.5% | |
| Short-Term Class 6.5% | | | Short-Term Class 3.8% | |
* Foreign investments | 24.1% | | ** Foreign investments | 30.4% | |

*** Includes investment in Fidelity Commodity Strategy Central Fund of 1.7%
**** Includes investment in Fidelity Commodity Strategy Central Fund of 1.1%
Asset allocations in the pie charts reflect the categorization of assets as defined in the Fund's prospectus in effect as of the time periods indicated above. Financial Statement categorizations conform to accounting standards and will differ from the pie chart. Percentages are adjusted for the effect of futures contracts and swap contracts, if applicable.
An unaudited holdings listing for the Fund, which presents direct holdings as well as the pro-rata share of any securities and other investments held indirectly through its investment in underlying Fidelity Central Funds, other than the Commodity Strategy and Money Market Central Funds, is available at advisor.fidelity.com.
Annual Report
Investments December 31, 2011
Showing Percentage of Net Assets
Common Stocks - 46.6% |
| Shares | | Value |
CONSUMER DISCRETIONARY - 12.9% |
Auto Components - 1.0% |
Autoliv, Inc. | 9,000 | | $ 481,410 |
BorgWarner, Inc. (a) | 5,900 | | 376,066 |
TRW Automotive Holdings Corp. (a) | 23,300 | | 759,580 |
| | 1,617,056 |
Automobiles - 0.6% |
Ford Motor Co. | 88,100 | | 947,956 |
Diversified Consumer Services - 0.4% |
Anhanguera Educacional Participacoes SA | 9,900 | | 106,800 |
Weight Watchers International, Inc. | 8,900 | | 489,589 |
| | 596,389 |
Hotels, Restaurants & Leisure - 0.7% |
Arcos Dorados Holdings, Inc. | 11,300 | | 231,989 |
Panera Bread Co. Class A (a) | 3,800 | | 537,510 |
Yum! Brands, Inc. | 5,400 | | 318,654 |
| | 1,088,153 |
Household Durables - 0.9% |
Gafisa SA sponsored ADR | 43,600 | | 200,560 |
KB Home | 35,500 | | 238,560 |
PulteGroup, Inc. (a) | 126,900 | | 800,739 |
Toll Brothers, Inc. (a) | 12,100 | | 247,082 |
| | 1,486,941 |
Internet & Catalog Retail - 0.3% |
Amazon.com, Inc. (a) | 1,000 | | 173,100 |
Groupon, Inc. Class A (a)(d) | 14,100 | | 290,883 |
| | 463,983 |
Media - 1.1% |
CBS Corp. Class B | 23,200 | | 629,648 |
The Walt Disney Co. | 29,100 | | 1,091,250 |
| | 1,720,898 |
Multiline Retail - 1.5% |
Dollar General Corp. (a) | 2,900 | | 119,306 |
Dollar Tree, Inc. (a) | 6,000 | | 498,660 |
Lojas Renner SA | 4,800 | | 124,714 |
Macy's, Inc. | 34,900 | | 1,123,082 |
Target Corp. | 11,300 | | 578,786 |
| | 2,444,548 |
Specialty Retail - 3.0% |
Dick's Sporting Goods, Inc. | 6,100 | | 224,968 |
Home Depot, Inc. | 21,900 | | 920,676 |
Limited Brands, Inc. | 26,300 | | 1,061,205 |
PetSmart, Inc. | 4,600 | | 235,934 |
Tiffany & Co., Inc. | 2,500 | | 165,650 |
TJX Companies, Inc. | 15,300 | | 987,615 |
Vitamin Shoppe, Inc. (a) | 3,800 | | 151,544 |
Williams-Sonoma, Inc. | 25,900 | | 997,150 |
| | 4,744,742 |
|
| Shares | | Value |
Textiles, Apparel & Luxury Goods - 3.4% |
Arezzo Industria e Comercio SA | 16,400 | | $ 204,208 |
Burberry Group PLC | 12,300 | | 226,379 |
Coach, Inc. | 6,800 | | 415,072 |
Deckers Outdoor Corp. (a) | 16,200 | | 1,224,234 |
Fossil, Inc. (a) | 8,500 | | 674,560 |
Michael Kors Holdings Ltd. | 1,000 | | 27,250 |
Michael Kors Holdings Ltd. | 20,634 | | 506,049 |
Prada SpA | 20,600 | | 93,231 |
PVH Corp. | 5,700 | | 401,793 |
Ralph Lauren Corp. | 2,700 | | 372,816 |
Under Armour, Inc. Class A (sub. vtg.) (a) | 2,500 | | 179,475 |
Vera Bradley, Inc. (a)(d) | 12,500 | | 403,125 |
VF Corp. | 5,700 | | 723,843 |
| | 5,452,035 |
TOTAL CONSUMER DISCRETIONARY | | 20,562,701 |
CONSUMER STAPLES - 1.7% |
Beverages - 0.4% |
Hansen Natural Corp. (a) | 7,800 | | 718,692 |
Food & Staples Retailing - 0.1% |
Drogasil SA | 16,035 | | 111,622 |
Food Products - 0.6% |
Green Mountain Coffee Roasters, Inc. (a) | 20,900 | | 937,365 |
Personal Products - 0.6% |
Hengan International Group Co. Ltd. | 57,000 | | 533,187 |
Nu Skin Enterprises, Inc. Class A | 9,100 | | 441,987 |
| | 975,174 |
TOTAL CONSUMER STAPLES | | 2,742,853 |
ENERGY - 8.6% |
Energy Equipment & Services - 2.3% |
Baker Hughes, Inc. | 17,100 | | 831,744 |
Carbo Ceramics, Inc. | 2,500 | | 308,325 |
Halliburton Co. | 25,900 | | 893,809 |
McDermott International, Inc. (a) | 17,700 | | 203,727 |
Schlumberger Ltd. | 21,314 | | 1,455,959 |
| | 3,693,564 |
Oil, Gas & Consumable Fuels - 6.3% |
Anadarko Petroleum Corp. | 9,300 | | 709,869 |
Cabot Oil & Gas Corp. | 3,600 | | 273,240 |
Chevron Corp. | 18,600 | | 1,979,040 |
Concho Resources, Inc. (a) | 11,200 | | 1,050,000 |
Continental Resources, Inc. (a)(d) | 18,100 | | 1,207,451 |
Hess Corp. | 4,000 | | 227,200 |
HollyFrontier Corp. | 11,300 | | 264,420 |
Kosmos Energy Ltd. | 11,100 | | 136,086 |
Marathon Oil Corp. | 9,400 | | 275,138 |
Oasis Petroleum, Inc. (a)(d) | 14,400 | | 418,896 |
Occidental Petroleum Corp. | 13,000 | | 1,218,100 |
Common Stocks - continued |
| Shares | | Value |
ENERGY - continued |
Oil, Gas & Consumable Fuels - continued |
Pioneer Natural Resources Co. | 15,100 | | $ 1,351,148 |
Whiting Petroleum Corp. (a) | 20,200 | | 943,138 |
| | 10,053,726 |
TOTAL ENERGY | | 13,747,290 |
FINANCIALS - 1.9% |
Capital Markets - 1.2% |
Apollo Global Management LLC Class A | 62,000 | | 769,420 |
Morgan Stanley | 73,900 | | 1,118,107 |
| | 1,887,527 |
Diversified Financial Services - 0.5% |
Citigroup, Inc. | 31,600 | | 831,396 |
Real Estate Management & Development - 0.2% |
CBRE Group, Inc. (a) | 14,300 | | 217,646 |
TOTAL FINANCIALS | | 2,936,569 |
HEALTH CARE - 5.1% |
Biotechnology - 1.0% |
Alexion Pharmaceuticals, Inc. (a) | 11,200 | | 800,800 |
Clovis Oncology, Inc. | 1,800 | | 25,362 |
Inhibitex, Inc. (a) | 10,800 | | 118,152 |
InterMune, Inc. (a) | 4,300 | | 54,180 |
Vertex Pharmaceuticals, Inc. (a) | 18,900 | | 627,669 |
| | 1,626,163 |
Health Care Providers & Services - 2.5% |
Accretive Health, Inc. (a) | 16,300 | | 374,574 |
HMS Holdings Corp. (a) | 15,400 | | 492,492 |
Humana, Inc. | 13,000 | | 1,138,930 |
UnitedHealth Group, Inc. | 21,700 | | 1,099,756 |
WellPoint, Inc. | 13,400 | | 887,750 |
| | 3,993,502 |
Health Care Technology - 0.2% |
SXC Health Solutions Corp. (a) | 4,700 | | 264,306 |
Pharmaceuticals - 1.4% |
Elan Corp. PLC sponsored ADR (a) | 53,900 | | 740,586 |
Shire PLC sponsored ADR | 5,400 | | 561,060 |
Valeant Pharmaceuticals International, Inc. (Canada) | 18,006 | | 842,661 |
| | 2,144,307 |
TOTAL HEALTH CARE | | 8,028,278 |
INDUSTRIALS - 4.5% |
Airlines - 2.3% |
Copa Holdings SA Class A | 5,800 | | 340,286 |
Delta Air Lines, Inc. (a) | 152,800 | | 1,236,152 |
|
| Shares | | Value |
Gol Linhas Aereas Inteligentes SA: | | | |
rights 1/26/12 (a) | 941 | | $ 0 |
sponsored ADR | 18,900 | | 125,307 |
United Continental Holdings, Inc. (a) | 100,085 | | 1,888,604 |
| | 3,590,349 |
Building Products - 0.2% |
Owens Corning (a) | 12,200 | | 350,384 |
Commercial Services & Supplies - 0.1% |
Swisher Hygiene, Inc. | 24,821 | | 92,831 |
Electrical Equipment - 0.2% |
Roper Industries, Inc. | 3,400 | | 295,358 |
Machinery - 0.9% |
Caterpillar, Inc. | 2,300 | | 208,380 |
Dover Corp. | 3,400 | | 197,370 |
Kennametal, Inc. | 9,700 | | 354,244 |
Parker Hannifin Corp. | 5,700 | | 434,625 |
Sandvik AB | 5,700 | | 69,957 |
WABCO Holdings, Inc. (a) | 1,800 | | 78,120 |
Weg SA | 14,700 | | 148,168 |
| | 1,490,864 |
Professional Services - 0.4% |
Qualicorp SA | 19,000 | | 170,808 |
Robert Half International, Inc. | 18,400 | | 523,664 |
| | 694,472 |
Trading Companies & Distributors - 0.4% |
Air Lease Corp.: | | | |
Class A (a)(e) | 10,900 | | 258,439 |
Class A | 10,600 | | 251,326 |
Mills Estruturas e Servicos de Engenharia SA | 17,000 | | 161,496 |
| | 671,261 |
TOTAL INDUSTRIALS | | 7,185,519 |
INFORMATION TECHNOLOGY - 9.6% |
Communications Equipment - 1.0% |
Cisco Systems, Inc. | 60,900 | | 1,101,072 |
HTC Corp. | 5,950 | | 97,644 |
QUALCOMM, Inc. | 2,800 | | 153,160 |
Riverbed Technology, Inc. (a) | 10,800 | | 253,800 |
| | 1,605,676 |
Computers & Peripherals - 3.1% |
Apple, Inc. (a) | 12,200 | | 4,941,002 |
Fusion-io, Inc. | 1,300 | | 31,460 |
| | 4,972,462 |
Internet Software & Services - 1.6% |
Active Network, Inc. | 9,100 | | 123,760 |
Bankrate, Inc. | 11,300 | | 242,950 |
Cornerstone OnDemand, Inc. | 12,100 | | 220,704 |
Facebook, Inc. Class B (g) | 1,580 | | 39,500 |
Google, Inc. Class A (a) | 1,700 | | 1,098,030 |
Rackspace Hosting, Inc. (a) | 9,700 | | 417,197 |
Common Stocks - continued |
| Shares | | Value |
INFORMATION TECHNOLOGY - continued |
Internet Software & Services - continued |
Renren, Inc. ADR (d) | 5,600 | | $ 19,880 |
VeriSign, Inc. | 8,900 | | 317,908 |
YouKu.com, Inc. ADR (a)(d) | 3,700 | | 57,979 |
| | 2,537,908 |
IT Services - 0.8% |
Cognizant Technology Solutions Corp. Class A (a) | 13,700 | | 881,047 |
MasterCard, Inc. Class A | 1,300 | | 484,666 |
| | 1,365,713 |
Semiconductors & Semiconductor Equipment - 1.2% |
Altera Corp. | 6,600 | | 244,860 |
ASML Holding NV | 15,200 | | 635,208 |
Freescale Semiconductor Holdings I Ltd. | 21,700 | | 274,505 |
KLA-Tencor Corp. | 4,400 | | 212,300 |
NXP Semiconductors NV (a) | 31,000 | | 476,470 |
| | 1,843,343 |
Software - 1.9% |
Ariba, Inc. (a) | 3,800 | | 106,704 |
Citrix Systems, Inc. (a) | 9,900 | | 601,128 |
CommVault Systems, Inc. (a) | 4,300 | | 183,696 |
Informatica Corp. (a) | 21,400 | | 790,302 |
Jive Software, Inc. | 400 | | 6,400 |
RealPage, Inc. (a) | 9,700 | | 245,119 |
salesforce.com, Inc. (a) | 1,700 | | 172,482 |
Taleo Corp. Class A (a) | 7,400 | | 286,306 |
VMware, Inc. Class A (a) | 6,600 | | 549,054 |
Zynga, Inc. | 4,000 | | 37,640 |
| | 2,978,831 |
TOTAL INFORMATION TECHNOLOGY | | 15,303,933 |
MATERIALS - 1.9% |
Chemicals - 1.5% |
Celanese Corp. Class A | 14,900 | | 659,623 |
Dow Chemical Co. | 18,000 | | 517,680 |
LyondellBasell Industries NV Class A | 8,200 | | 266,418 |
Rockwood Holdings, Inc. (a) | 7,200 | | 283,464 |
The Mosaic Co. | 6,800 | | 342,924 |
Westlake Chemical Corp. | 9,200 | | 370,208 |
| | 2,440,317 |
Metals & Mining - 0.4% |
First Quantum Minerals Ltd. | 21,100 | | 415,411 |
Genel Energy PLC | 13,400 | | 161,295 |
| | 576,706 |
TOTAL MATERIALS | | 3,017,023 |
|
| Shares | | Value |
TELECOMMUNICATION SERVICES - 0.4% |
Wireless Telecommunication Services - 0.4% |
American Tower Corp. Class A | 9,300 | | $ 558,093 |
TOTAL COMMON STOCKS (Cost $68,504,012) |
74,082,259
|
Investment Companies - 2.0% |
| | | |
iShares Barclays TIPS Bond ETF
(Cost $3,060,057) | 26,900 | |
3,138,961
|
Fixed-Income Funds - 27.0% |
| | | |
Fidelity Emerging Markets Debt Central Fund (f) | 94,855 | | 946,655 |
Fidelity Floating Rate Central Fund (f) | 41,654 | | 4,094,560 |
Fidelity High Income Central Fund 1 (f) | 48,490 | | 4,627,374 |
Fidelity VIP Investment Grade Central Fund (f) | 308,149 | | 33,169,163 |
TOTAL FIXED-INCOME FUNDS (Cost $40,888,776) |
42,837,752
|
Equity Funds - 19.0% |
| | | |
Domestic Equity Funds - 1.7% |
Fidelity Commodity Strategy Central Fund (f) | 257,884 | | 2,751,623 |
International Equity Funds - 17.3% |
Fidelity Emerging Markets Equity Central Fund (f) | 23,627 | | 4,119,625 |
Fidelity International Equity Central Fund (f) | 389,839 | | 23,390,361 |
TOTAL INTERNATIONAL EQUITY FUNDS | | 27,509,986 |
TOTAL EQUITY FUNDS (Cost $39,198,133) |
30,261,609
|
U.S. Treasury Obligations - 0.3% |
| Principal Amount | | |
U.S. Treasury Bills, yield at date of purchase 0.02% 2/23/12
(Cost $499,989) | | $ 500,000 | |
499,991
|
Money Market Funds - 6.6% |
| Shares | | Value |
Fidelity Cash Central Fund, 0.11% (b) | 8,312,809 | | $ 8,312,809 |
Fidelity Securities Lending Cash Central Fund, 0.13% (b)(c) | 2,227,650 | | 2,227,650 |
TOTAL MONEY MARKET FUNDS (Cost $10,540,459) |
10,540,459
|
TOTAL INVESTMENT PORTFOLIO - 101.5% (Cost $162,691,426) | | 161,361,031 |
NET OTHER ASSETS (LIABILITIES) - (1.5)% | | (2,313,010) |
NET ASSETS - 100% | $ 159,048,021 |
Security Type Abbreviations |
ETFs - Exchange-Trade Funds |
Legend |
(a) Non-income producing |
(b) Affiliated fund that is available only to investment companies and other accounts managed by Fidelity Investments. The rate quoted is the annualized seven-day yield of the fund at period end. A complete unaudited listing of the fund's holdings as of its most recent quarter end is available upon request. In addition, each Fidelity Central Fund's financial statements, which are not covered by the Fund's Report of Independent Registered Public Accounting Firm, are available on the SEC's website or upon request. |
(c) Investment made with cash collateral received from securities on loan. |
(d) Security or a portion of the security is on loan at period end. |
(e) Security exempt from registration under Rule 144A of the Securities Act of 1933. These securities may be resold in transactions exempt from registration, normally to qualified institutional buyers. At the end of the period, the value of these securities amounted to $258,439 or 0.2% of net assets. |
(f) Affiliated fund that is available only to investment companies and other accounts managed by Fidelity Investments. A complete unaudited schedule of portfolio holdings for each Fidelity Central Fund is filed with the SEC for the first and third quarters of each fiscal year on Form N-Q and is available upon request or at the SEC's web site at www.sec.gov. An unaudited holdings listing for the Fund, which presents direct holdings as well as the pro rata share of securities and other investments held indirectly through its investment in underlying non-money market Fidelity Central Funds, other than the Commodity Strategy and Money Market Central Funds, is available at advisor.fidelity.com. In addition, each Fidelity Central Fund's financial statements, which are not covered by the Fund's Report of Independent Registered Public Accounting Firm, are available on the SEC's web site or upon request. |
(g) Restricted securities - Investment in securities not registered under the Securities Act of 1933 (excluding 144A issues). At the end of the period, the value of restricted securities (excluding 144A issues) amounted to $39,500 or 0.0% of net assets. |
Additional information on each restricted holding is as follows: |
Security | Acquisition Date | Acquisition Cost |
Facebook, Inc. Class B | 5/19/11 | $ 39,574 |
Affiliated Central Funds |
Information regarding fiscal year to date income earned by the Fund from investments in Fidelity Central Funds is as follows: |
Fund | Income earned |
Fidelity Cash Central Fund | $ 6,438 |
Fidelity Commodity Strategy Central Fund | 1,705 |
Fidelity Emerging Markets Debt Central Fund | 44,984 |
Fidelity Emerging Markets Equity Central Fund | 79,802 |
Fidelity Floating Rate Central Fund | 245,195 |
Fidelity High Income Central Fund 1 | 423,916 |
Fidelity International Equity Central Fund | 855,733 |
Fidelity Securities Lending Cash Central Fund | 33,763 |
Fidelity VIP Investment Grade Central Fund | 1,319,175 |
Total | $ 3,010,711 |
Additional information regarding the Fund's fiscal year to date purchases and sales, including the ownership percentage, of the non Money Market Central Funds is as follows: |
Fund | Value,
beginning of period | Purchases | Sales
Proceeds | Value,
end of
period | % ownership,
end of
period |
Fidelity Commodity Strategy Central Fund | $ 2,907,291 | $ 4,175,565 | $ 3,911,444 | $ 2,751,623 | 0.3% |
Fidelity Emerging Markets Debt Central Fund | - | 948,787 | - | 946,655 | 0.8% |
Fidelity Emerging Markets Equity Central Fund | 7,858,662 | 115,212 | 2,572,091 | 4,119,625 | 1.5% |
Fidelity Floating Rate Central Fund | 5,416,203 | 695,271 | 1,904,618 | 4,094,560 | 0.1% |
Fidelity High Income Central Fund 1 | 6,768,440 | 423,916 | 2,461,454 | 4,627,374 | 0.9% |
Fidelity International Equity Central Fund | 26,462,332 | 5,199,347 | 3,209,818 | 23,390,361 | 1.6% |
Fidelity VIP Investment Grade Central Fund | 36,250,066 | 7,920,346 | 11,892,651 | 33,169,163 | 0.9% |
Total | $ 85,662,994 | $ 19,478,444 | $ 25,952,076 | $ 73,099,361 | |
Other Information |
The following is a summary of the inputs used, as of December 31, 2011, involving the Fund's assets and liabilities carried at fair value. The inputs or methodology used for valuing securities may not be an indication of the risk associated with investing in those securities. For more information on valuation inputs, and their aggregation into the levels used in the tables below, please refer to the Security Valuation section in the accompanying Notes to Financial Statements. |
Valuation Inputs at Reporting Date: |
Description | Total | Level 1 | Level 2 | Level 3 |
Investments in Securities: | | | | |
Equities: | | | | |
Consumer Discretionary | $ 20,562,701 | $ 20,056,652 | $ 506,049 | $ - |
Consumer Staples | 2,742,853 | 2,742,853 | - | - |
Energy | 13,747,290 | 13,747,290 | - | - |
Financials | 2,936,569 | 2,936,569 | - | - |
Health Care | 8,028,278 | 8,028,278 | - | - |
Industrials | 7,185,519 | 7,185,519 | - | - |
Information Technology | 15,303,933 | 15,264,433 | - | 39,500 |
Materials | 3,017,023 | 3,017,023 | - | - |
Telecommunication Services | 558,093 | 558,093 | - | - |
Investment Companies | 3,138,961 | 3,138,961 | - | - |
U.S. Government and Government Agency Obligations | 499,991 | - | 499,991 | - |
Fixed-Income Funds | 42,837,752 | 42,837,752 | - | - |
Money Market Funds | 10,540,459 | 10,540,459 | - | - |
Equity Funds | 30,261,609 | 30,261,609 | - | - |
Total Investments in Securities: | $ 161,361,031 | $ 160,315,491 | $ 1,006,040 | $ 39,500 |
The following is a reconciliation of Investments in Securities for which Level 3 inputs were used in determining value: |
Investments in Securities: | |
Beginning Balance | $ 223,450 |
Total Realized Gain (Loss) | - |
Total Unrealized Gain (Loss) | (74) |
Cost of Purchases | 39,574 |
Proceeds of Sales | - |
Amortization/Accretion | - |
Transfers in to Level 3 | - |
Transfers out of Level 3 | (223,450) |
Ending Balance | $ 39,500 |
The change in unrealized gain (loss) for the period attributable to Level 3 securities held at December 31, 2011 | $ (74) |
The information used in the above reconciliation represents fiscal year to date activity for any Investments in Securities identified as using Level 3 inputs at either the beginning or the end of the current fiscal period. Transfers in or out of Level 3 represent the beginning value of any Security or Instrument where a change in the pricing level occurred from the beginning to the end of the period. The cost of purchases and the proceeds of sales may include securities received or delivered through corporate actions or exchanges. Realized and unrealized gains (losses) disclosed in the reconciliation are included in Net Gain (Loss) on the Fund's Statement of Operations. |
The information in the following tables is based on the combined investments of the Fund and its pro-rata share of the investments of Fidelity's Central Funds, other than the Commodity Strategy and Money Market Central Funds. |
The composition of credit quality ratings as a percentage of net assets is as follows (Unaudited): |
U.S. Government and U.S. Government Agency Obligations | 13.9% |
AAA,AA,A | 3.8% |
BBB | 2.8% |
BB | 2.1% |
B | 3.3% |
CCC,CC,C | 0.3% |
D | 0.0% |
Not Rated | 0.4% |
Equities* | 67.8% |
Short-Term Investments and Net Other Assets | 5.6% |
| 100.0% |
* Includes investment in Fidelity Commodity Strategy Central Fund of 1.7%
We have used ratings from Moody's Investors Service, Inc. Where Moody's® ratings are not available, we have used S&P® ratings. All ratings are as of the date indicated and do not reflect subsequent changes. Percentages are adjusted for the effect of futures contracts, if applicable. |
Distribution of investments by country of issue, as a percentage of total net assets, is as follows: (Unaudited) |
United States of America | 75.9% |
United Kingdom | 3.9% |
Japan | 2.1% |
Brazil | 1.7% |
Canada | 1.5% |
Netherlands | 1.3% |
Germany | 1.2% |
France | 1.1% |
Switzerland | 1.1% |
Others (Individually Less Than 1%) | 10.2% |
| 100.0% |
See accompanying notes which are an integral part of the financial statements.
Annual Report
Statement of Assets and Liabilities
| December 31, 2011 |
| | |
Assets | | |
Investment in securities, at value (including securities loaned of $2,154,489) - See accompanying schedule: Unaffiliated issuers (cost $72,064,058) | $ 77,721,211 | |
Fidelity Central Funds (cost $90,627,368) | 83,639,820 | |
Total Investments (cost $162,691,426) | | $ 161,361,031 |
Cash | | 54,037 |
Receivable for investments sold | | 6,134 |
Receivable for fund shares sold | | 9,959 |
Dividends receivable | | 72,338 |
Distributions receivable from Fidelity Central Funds | | 12,650 |
Prepaid expenses | | 479 |
Other receivables | | 4,357 |
Total assets | | 161,520,985 |
| | |
Liabilities | | |
Payable for fund shares redeemed | $ 120,868 | |
Accrued management fee | 74,174 | |
Distribution and service plan fees payable | 1,337 | |
Other affiliated payables | 17,858 | |
Other payables and accrued expenses | 31,077 | |
Collateral on securities loaned, at value | 2,227,650 | |
Total liabilities | | 2,472,964 |
| | |
Net Assets | | $ 159,048,021 |
Net Assets consist of: | | |
Paid in capital | | $ 189,660,881 |
Distributions in excess of net investment income | | (3,888) |
Accumulated undistributed net realized gain (loss) on investments and foreign currency transactions | | (29,278,333) |
Net unrealized appreciation (depreciation) on investments and assets and liabilities in foreign currencies | | (1,330,639) |
Net Assets | | $ 159,048,021 |
Statement of Assets and Liabilities - continued
| December 31, 2011 |
| | |
Initial Class:
Net Asset Value, offering price and redemption price per share ($113,899,003 ÷ 8,533,806 shares) | | $ 13.35 |
| | |
Service Class:
Net Asset Value, offering price and redemption price per share ($5,653,848 ÷ 426,325 shares) | | $ 13.26 |
| | |
Service Class 2:
Net Asset Value, offering price and redemption price per share ($3,260,403 ÷ 246,897 shares) | | $ 13.21 |
| | |
Investor Class:
Net Asset Value, offering price and redemption price per share ($36,234,767 ÷ 2,725,325 shares) | | $ 13.30 |
See accompanying notes which are an integral part of the financial statements.
Annual Report
Statement of Operations
| Year ended December 31, 2011 |
| | |
Investment Income | | |
Dividends | | $ 888,275 |
Interest | | 184 |
Income from Fidelity Central Funds | | 3,010,711 |
Total income | | 3,899,170 |
| | |
Expenses | | |
Management fee | $ 987,256 | |
Transfer agent fees | 170,974 | |
Distribution and service plan fees | 19,412 | |
Accounting and security lending fees | 87,480 | |
Custodian fees and expenses | 18,741 | |
Independent trustees' compensation | 676 | |
Audit | 48,993 | |
Legal | 1,696 | |
Miscellaneous | 1,516 | |
Total expenses before reductions | 1,336,744 | |
Expense reductions | (23,750) | 1,312,994 |
Net investment income (loss) | | 2,586,176 |
Realized and Unrealized Gain (Loss) Net realized gain (loss) on: | | |
Investment securities: | | |
Unaffiliated issuers | 10,669,157 | |
Fidelity Central Funds | 888,255 | |
Foreign currency transactions | (23,886) | |
Futures contracts | (186,402) | |
Capital gain distributions from Fidelity Central Funds | 641,197 | |
Total net realized gain (loss) | | 11,988,321 |
Change in net unrealized appreciation (depreciation) on: Investment securities | (25,444,375) | |
Assets and liabilities in foreign currencies | (665) | |
Futures contracts | (51,463) | |
Total change in net unrealized appreciation (depreciation) | | (25,496,503) |
Net gain (loss) | | (13,508,182) |
Net increase (decrease) in net assets resulting from operations | | $ (10,922,006) |
Statement of Changes in Net Assets
| Year ended
December 31, 2011 | Year ended
December 31, 2010 |
Increase (Decrease) in Net Assets | | |
Operations | | |
Net investment income (loss) | $ 2,586,176 | $ 2,006,745 |
Net realized gain (loss) | 11,988,321 | 15,906,125 |
Change in net unrealized appreciation (depreciation) | (25,496,503) | 8,032,692 |
Net increase (decrease) in net assets resulting from operations | (10,922,006) | 25,945,562 |
Distributions to shareholders from net investment income | (2,772,096) | (1,957,332) |
Distributions to shareholders from net realized gain | (339,717) | (557,354) |
Total distributions | (3,111,813) | (2,514,686) |
Share transactions - net increase (decrease) | (8,641,746) | (16,470,726) |
Total increase (decrease) in net assets | (22,675,565) | 6,960,150 |
| | |
Net Assets | | |
Beginning of period | 181,723,586 | 174,763,436 |
End of period (including distributions in excess of net investment income of $3,888 and distributions in excess of net investment income of $7,498, respectively) | $ 159,048,021 | $ 181,723,586 |
See accompanying notes which are an integral part of the financial statements.
Annual Report
Financial Highlights - Initial Class
Years ended December 31, | 2011 | 2010 | 2009 | 2008 | 2007 |
Selected Per-Share Data | | | | | |
Net asset value, beginning of period | $ 14.52 | $ 12.66 | $ 9.68 | $ 15.51 | $ 13.60 |
Income from Investment Operations | | | | | |
Net investment income (loss) C | .22 | .16 | .17 | .26 | .29 |
Net realized and unrealized gain (loss) | (1.12) | 1.91 | 3.01 | (5.82) | 2.24 |
Total from investment operations | (.90) | 2.07 | 3.18 | (5.56) | 2.53 |
Distributions from net investment income | (.24) | (.16) | (.18) | (.26) | (.62) |
Distributions from net realized gain | (.03) | (.05) | (.02) | (.01) | - |
Total distributions | (.27) | (.21) | (.20) | (.27) | (.62) |
Net asset value, end of period | $ 13.35 | $ 14.52 | $ 12.66 | $ 9.68 | $ 15.51 |
Total Return A, B | (6.17)% | 16.34% | 32.91% | (35.81)% | 18.97% |
Ratios to Average Net Assets D, F | | | | | |
Expenses before reductions | .73% | .74% | .78% | .74% | .74% |
Expenses net of fee waivers, if any | .72% | .73% | .78% | .74% | .74% |
Expenses net of all reductions | .71% | .72% | .77% | .73% | .73% |
Net investment income (loss) | 1.49% | 1.20% | 1.57% | 1.90% | 1.98% |
Supplemental Data | | | | | |
Net assets, end of period (000 omitted) | $ 113,899 | $ 138,051 | $ 136,479 | $ 118,672 | $ 211,867 |
Portfolio turnover rate E | 71% | 68% | 126% | 110% | 132% |
A Total returns do not reflect charges attributable to your insurance company's separate account. Inclusion of these charges would reduce the total returns shown.
B Total returns would have been lower if certain expenses had not been reduced during the applicable periods shown.
C Calculated based on average shares outstanding during the period.
D Fees and expenses of any underlying Fidelity Central Funds are not included in the Fund's expense ratio. The Fund indirectly bears its proportionate share of the expenses of any underlying Fidelity Central Funds.
E Amount does not include the portfolio activity of any underlying Fidelity Central Funds.
F Expense ratios reflect operating expenses of the class. Expenses before reductions do not reflect amounts reimbursed by the investment adviser or reductions from brokerage service arrangements or reductions from other expense offset arrangements and do not represent the amount paid by the class during periods when reimbursements or reductions occur. Expenses net of fee waivers reflect expenses after reimbursement by the investment adviser but prior to reductions from brokerage service arrangements or other expense offset arrangements. Expenses net of all reductions represent the net expenses paid by the class.
Financial Highlights - Service Class
Years ended December 31, | 2011 | 2010 | 2009 | 2008 | 2007 |
Selected Per-Share Data | | | | | |
Net asset value, beginning of period | $ 14.42 | $ 12.58 | $ 9.62 | $ 15.41 | $ 13.51 |
Income from Investment Operations | | | | | |
Net investment income (loss) C | .20 | .14 | .16 | .24 | .27 |
Net realized and unrealized gain (loss) | (1.11) | 1.89 | 2.99 | (5.77) | 2.22 |
Total from investment operations | (.91) | 2.03 | 3.15 | (5.53) | 2.49 |
Distributions from net investment income | (.22) | (.15) | (.17) | (.25) | (.59) |
Distributions from net realized gain | (.03) | (.05) | (.02) | (.01) | - |
Total distributions | (.25) | (.19) G | (.19) | (.26) | (.59) |
Net asset value, end of period | $ 13.26 | $ 14.42 | $ 12.58 | $ 9.62 | $ 15.41 |
Total Return A, B | (6.26)% | 16.18% | 32.79% | (35.88)% | 18.79% |
Ratios to Average Net Assets D, F | | | | | |
Expenses before reductions | .83% | .84% | .88% | .84% | .84% |
Expenses net of fee waivers, if any | .82% | .84% | .88% | .84% | .84% |
Expenses net of all reductions | .81% | .82% | .87% | .83% | .83% |
Net investment income (loss) | 1.39% | 1.09% | 1.47% | 1.80% | 1.88% |
Supplemental Data | | | | | |
Net assets, end of period (000 omitted) | $ 5,654 | $ 3,999 | $ 3,838 | $ 2,911 | $ 5,113 |
Portfolio turnover rate E | 71% | 68% | 126% | 110% | 132% |
A Total returns do not reflect charges attributable to your insurance company's separate account. Inclusion of these charges would reduce the total returns shown.
B Total returns would have been lower if certain expenses had not been reduced during the applicable periods shown.
C Calculated based on average shares outstanding during the period.
D Fees and expenses of any underlying Fidelity Central Funds are not included in the Fund's expense ratio. The Fund indirectly bears its proportionate share of the expenses of any underlying Fidelity Central Funds.
E Amount does not include the portfolio activity of any underlying Fidelity Central Funds.
F Expense ratios reflect operating expenses of the class. Expenses before reductions do not reflect amounts reimbursed by the investment adviser or reductions from brokerage service arrangements or reductions from other expense offset arrangements and do not represent the amount paid by the class during periods when reimbursements or reductions occur. Expenses net of fee waivers reflect expenses after reimbursement by the investment adviser but prior to reductions from brokerage service arrangements or other expense offset arrangements. Expenses net of all reductions represent the net expenses paid by the class.
G Total distributions of $.19 per share is comprised of distributions from net investment income of $.148 and distributions from net realized gain of $.045 per share.
See accompanying notes which are an integral part of the financial statements.
Annual Report
Financial Highlights - Service Class 2
Years ended December 31, | 2011 | 2010 | 2009 | 2008 | 2007 |
Selected Per-Share Data | | | | | |
Net asset value, beginning of period | $ 14.36 | $ 12.51 | $ 9.57 | $ 15.34 | $ 13.42 |
Income from Investment Operations | | | | | |
Net investment income (loss) C | .17 | .12 | .14 | .22 | .25 |
Net realized and unrealized gain (loss) | (1.09) | 1.88 | 2.97 | (5.75) | 2.21 |
Total from investment operations | (.92) | 2.00 | 3.11 | (5.53) | 2.46 |
Distributions from net investment income | (.20) | (.11) | (.15) | (.23) | (.54) |
Distributions from net realized gain | (.03) | (.05) | (.02) | (.01) | - |
Total distributions | (.23) | (.15) G | (.17) | (.24) | (.54) |
Net asset value, end of period | $ 13.21 | $ 14.36 | $ 12.51 | $ 9.57 | $ 15.34 |
Total Return A, B | (6.39)% | 16.02% | 32.55% | (36.05)% | 18.68% |
Ratios to Average Net Assets D, F | | | | | |
Expenses before reductions | 1.01% | 1.02% | 1.06% | 1.01% | 1.02% |
Expenses net of fee waivers, if any | 1.01% | 1.02% | 1.06% | 1.01% | 1.02% |
Expenses net of all reductions | 1.00% | 1.00% | 1.05% | 1.01% | 1.01% |
Net investment income (loss) | 1.20% | .91% | 1.29% | 1.62% | 1.70% |
Supplemental Data | | | | | |
Net assets, end of period (000 omitted) | $ 3,260 | $ 6,046 | $ 8,139 | $ 6,545 | $ 8,622 |
Portfolio turnover rate E | 71% | 68% | 126% | 110% | 132% |
A Total returns do not reflect charges attributable to your insurance company's separate account. Inclusion of these charges would reduce the total returns shown.
B Total returns would have been lower if certain expenses had not been reduced during the applicable periods shown.
C Calculated based on average shares outstanding during the period.
D Fees and expenses of any underlying Fidelity Central Funds are not included in the Fund's expense ratio. The Fund indirectly bears its proportionate share of the expenses of any underlying Fidelity Central Funds.
E Amount does not include the portfolio activity of any underlying Fidelity Central Funds.
F Expense ratios reflect operating expenses of the class. Expenses before reductions do not reflect amounts reimbursed by the investment adviser or reductions from brokerage service arrangements or reductions from other expense offset arrangements and do not represent the amount paid by the class during periods when reimbursements or reductions occur. Expenses net of fee waivers reflect expenses after reimbursement by the investment adviser but prior to reductions from brokerage service arrangements or other expense offset arrangements. Expenses net of all reductions represent the net expenses paid by the class.
G Total distributions of $.15 per share is comprised of distributions from net investment income of $.108 and distributions from net realized gain of $.045 per share.
Financial Highlights - Investor Class
Years ended December 31, | 2011 | 2010 | 2009 | 2008 | 2007 |
Selected Per-Share Data | | | | | |
Net asset value, beginning of period | $ 14.46 | $ 12.61 | $ 9.65 | $ 15.46 | $ 13.56 |
Income from Investment Operations | | | | | |
Net investment income (loss) C | .20 | .15 | .16 | .24 | .27 |
Net realized and unrealized gain (loss) | (1.10) | 1.90 | 2.99 | (5.78) | 2.23 |
Total from investment operations | (.90) | 2.05 | 3.15 | (5.54) | 2.50 |
Distributions from net investment income | (.23) | (.15) | (.17) | (.26) | (.60) |
Distributions from net realized gain | (.03) | (.05) | (.02) | (.01) | - |
Total distributions | (.26) | (.20) | (.19) | (.27) | (.60) |
Net asset value, end of period | $ 13.30 | $ 14.46 | $ 12.61 | $ 9.65 | $ 15.46 |
Total Return A, B | (6.20)% | 16.25% | 32.68% | (35.85)% | 18.78% |
Ratios to Average Net Assets D, F | | | | | |
Expenses before reductions | .81% | .83% | .89% | .83% | .86% |
Expenses net of fee waivers, if any | .81% | .82% | .89% | .83% | .86% |
Expenses net of all reductions | .80% | .81% | .87% | .83% | .86% |
Net investment income (loss) | 1.41% | 1.11% | 1.47% | 1.81% | 1.86% |
Supplemental Data | | | | | |
Net assets, end of period (000 omitted) | $ 36,235 | $ 33,627 | $ 26,307 | $ 20,137 | $ 16,370 |
Portfolio turnover rate E | 71% | 68% | 126% | 110% | 132% |
A Total returns do not reflect charges attributable to your insurance company's separate account. Inclusion of these charges would reduce the total returns shown.
B Total returns would have been lower if certain expenses had not been reduced during the applicable periods shown.
C Calculated based on average shares outstanding during the period.
D Fees and expenses of any underlying Fidelity Central Funds are not included in the Fund's expense ratio. The Fund indirectly bears its proportionate share of the expenses of any underlying Fidelity Central Funds.
E Amount does not include the portfolio activity of any underlying Fidelity Central Funds.
F Expense ratios reflect operating expenses of the class. Expenses before reductions do not reflect amounts reimbursed by the investment adviser or reductions from brokerage service arrangements or reductions from other expense offset arrangements and do not represent the amount paid by the class during periods when reimbursements or reductions occur. Expenses net of fee waivers reflect expenses after reimbursement by the investment adviser but prior to reductions from brokerage service arrangements or other expense offset arrangements. Expenses net of all reductions represent the net expenses paid by the class.
See accompanying notes which are an integral part of the financial statements.
Annual Report
Notes to Financial Statements
For the period ended December 31, 2011
1. Organization.
VIP Asset Manager: Growth Portfolio (the Fund) is a fund of Variable Insurance Products Fund V (the Trust) and is authorized to issue an unlimited number of shares. The Trust is registered under the Investment Company Act of 1940, as amended (the 1940 Act), as an open-end management investment company organized as a Massachusetts business trust. Shares of the Fund may only be purchased by insurance companies for the purpose of funding variable annuity or variable life insurance contracts. The Fund offers the following classes of shares: Initial Class shares, Service Class shares, Service Class 2 shares and Investor Class shares. All classes have equal rights and voting privileges, except for matters affecting a single class. Investment income, realized and unrealized capital gains and losses, the common expenses of the Fund, and certain fund-level expense reductions, if any, are allocated on a pro-rata basis to each class based on the relative net assets of each class to the total net assets of the Fund. Each class differs with respect to transfer agent and distribution and service plan fees incurred. Certain expense reductions may also differ by class. The Fund's investments in emerging markets can be subject to social, economic, regulatory, and political uncertainties and can be extremely volatile.
2. Investments in Fidelity Central Funds.
The Fund invests in Fidelity Central Funds, which are open-end investment companies available only to other investment companies and accounts managed by Fidelity Management & Research Company (FMR) and its affiliates. The Fund's Schedule of Investments lists each of the Fidelity Central Funds held as of period end, if any, as an investment of the Fund, but do not include the underlying holdings of each Fidelity Central Fund. As an Investing Fund, the Fund indirectly bears its proportionate share of the expenses of the underlying Fidelity Central Funds.
Based on their investment objective, each Fidelity Central Fund may invest or participate in various investment vehicles or strategies that are similar to those of the Fund. These strategies are consistent with the investment objectives of the Fund and may involve certain economic risks which may cause a decline in value of each of the Fidelity Central Funds and thus a decline in the value of the Fund. The following summarizes the Fund's investment in each Fidelity Central Fund.
Fidelity Central Fund | Investment Manager | Investment Objective | Investment Practices | Expense Ratio* |
Fidelity Commodity Strategy Central Fund | FMR Co., Inc. (FMRC) | Seeks to provide investment returns that correspond to the performance of the commodities market. | Investment in wholly-owned subsidiary organized under the laws of the Cayman Islands Repurchase Agreements Restricted Securities | .05% |
Fidelity Emerging Markets Debt Central Fund | FMRC | Seeks high total return by normally investing in debt securities of issuers in emerging markets and other debt investments that are tied economically to emerging markets. | Foreign Securities Repurchase Agreements Restricted Securities | .02% |
Fidelity Emerging Markets Equity Central Fund | FMRC | Seeks capital appreciation by investing primarily in equity securities of issuers in emerging markets. | Foreign Securities Repurchase Agreements Restricted Securities | .12% |
Fidelity International Equity Central Fund | FMRC | Seeks capital appreciation by investing primarily in non-U.S. based common stocks, including securities of issuers located in emerging markets. | Foreign Securities Repurchase Agreements Restricted Securities | .02% |
Fidelity Floating Rate Central Fund | FMRC | Seeks a high level of income by normally investing in floating rate loans and other floating rate securities. | Loans & Direct Debt Instruments Repurchase Agreements Restricted Securities | .00%** |
Fidelity High Income Central Fund 1 | FMRC | Seeks a high level of income and may also seek capital appreciation by investing primarily in debt securities, preferred stocks, and convertible securities, with an emphasis on lower-quality debt securities. | Loans & Direct Debt Instruments Repurchase Agreements Restricted Securities | .00%** |
VIP Investment Grade Central Fund | Fidelity Investments Money Management, Inc. (FIMM) | Seeks a high level of current income by normally investing in investment-grade debt securities and repurchase agreements. | Delayed Delivery & When Issued Securities Repurchase Agreements Restricted Securities Swap Agreements | .00%** |
Fidelity Money Market Central Funds | FIMM | Seeks to obtain a high level of current income consistent with the preservation of capital and liquidity. | Short-term Investments | .00%** |
* Expenses expressed as a percentage of average net assets and are as of each underlying Central Fund's most recent annual or semi-annual shareholder report.
** Amount represents less than .01%.
An unaudited holdings listing for the Fund, which presents direct holdings as well as the pro-rata share of any securities and other investments held indirectly through its investment in underlying non-money market Fidelity Central Funds, is available at advisor.fidelity.com. A complete unaudited list of holdings for each Fidelity Central Fund is available upon request or at the Securities and Exchange Commission (the SEC) web site at www.sec.gov.
Annual Report
2. Investments in Fidelity Central Funds - continued
In addition, the financial statements of the Fidelity Central Funds which contain the significant accounting policies (including security valuation policies) of those funds, which are not covered by the Fund's Report of Independent Registered Public Accounting Firm, are available on the SEC web site or upon request.
3. Significant Accounting Policies.
The financial statements have been prepared in conformity with accounting principles generally accepted in the United States of America (GAAP), which require management to make certain estimates and assumptions at the date of the financial statements. Actual results could differ from those estimates. Subsequent events, if any, through the date that the financial statements were issued have been evaluated in the preparation of the financial statements. The following summarizes the significant accounting policies of the Fund:
Security Valuation. Investments are valued as of 4:00 p.m. Eastern time on the last calendar day of the period. The Fund uses independent pricing services approved by the Board of Trustees to value its investments. When current market prices or quotations are not readily available or reliable, valuations may be determined in good faith in accordance with procedures adopted by the Board of Trustees. Factors used in determining value may include market or security specific events, changes in interest rates and credit quality. The frequency with which these procedures are used cannot be predicted and they may be utilized to a significant extent. The value used for net asset value (NAV) calculation under these procedures may differ from published prices for the same securities.
The Fund categorizes the inputs to valuation techniques used to value its investments into a disclosure hierarchy consisting of three levels as shown below:
Level 1 - quoted prices in active markets for identical investments
Level 2 - other significant observable inputs (including quoted prices for similar investments, interest rates, prepayment speeds, etc.)
Level 3 - unobservable inputs (including the Fund's own assumptions based on the best information available)
Changes in valuation techniques may result in transfers in or out of an assigned level within the disclosure hierarchy. The aggregate value of investments by input level, as of December 31, 2011, as well as a roll forward of Level 3 securities, is included at the end of the Fund's Schedule of Investments. Valuation techniques used to value the Fund's investments by major category are as follows:
Equity securities, including restricted securities, for which market quotations are readily available, are valued at the last reported sale price or official closing price as reported by an independent pricing service on the primary market or exchange on which they are traded and are categorized as Level 1 in the hierarchy. In the event there were no sales during the day or closing prices are not available, securities are valued at the last quoted bid price or may be valued using the last available price and are generally categorized as Level 2 in the hierarchy. For foreign equity securities, when significant market or security specific events arise, comparisons to the valuation of American Depositary Receipts (ADRs), futures contracts, Exchange-traded funds (ETFs) and certain indexes as well as quoted prices for similar securities are used and are categorized as Level 2 in the hierarchy in these circumstances. Utilizing these techniques may result in transfers between Level 1 and Level 2. For restricted equity securities and private placements where observable inputs are limited, assumptions about market activity and risk are used and are categorized as Level 3 in the hierarchy.
Debt securities, including restricted securities, are valued based on evaluated prices received from independent pricing services or from dealers who make markets in such securities. For U.S. government and government agency obligations, pricing services utilize matrix pricing which considers yield or price of bonds of comparable quality, coupon, maturity and type as well as dealer supplied prices and are generally categorized as Level 2 in the hierarchy. When independent prices are unavailable or unreliable, debt securities may be valued utilizing pricing matrices which consider similar factors that would be used by independent pricing services. These are generally categorized as Level 2 in the hierarchy but may be Level 3 depending on the circumstances. ETFs are valued at their last sale price or official closing price as reported by an independent pricing service on the primary market or exchange on which they are traded and are categorized as Level 1 in the hierarchy. In the event there were no sales during the day but the exchange reports a closing bid level, ETFs are valued at the closing bid and would be categorized as Level 1 in the hierarchy. In the event there was no closing bid, ETFs may be valued by another method that the Board of Trustees believes reflects fair value in accordance with the Board's fair value pricing policies and may be categorized as Level 2 in the hierarchy.
Investments in open-end mutual funds, including other Fidelity Central Funds, are valued at their closing net asset value each business day and are categorized as Level 1 in the hierarchy.
New Accounting Pronouncements. In May 2011, the Financial Accounting Standards Board issued Accounting Standard Update No. 2011-04, Fair Value Measurement (Topic 820) - Amendments to Achieve Common Fair Value Measurement and Disclosure Requirements in U.S. GAAP and IFRSs. The update is effective during interim and annual periods beginning after December 15, 2011 and will result in additional disclosure for transfers between levels as well as expanded disclosure for securities categorized as Level 3 under the fair value hierarchy.
Annual Report
Notes to Financial Statements - continued
3. Significant Accounting Policies - continued
New Accounting Pronouncements - continued
In December 2011, the Financial Accounting Standards Board issued Accounting Standard Update No. 2011-11, Disclosures about Offsetting Assets and Liabilities. The update creates new disclosure requirements requiring entities to disclose both gross and net information for derivatives and other financial instruments that are either offset in the Statement of Assets and Liabilities or subject to an enforceable master netting arrangement or similar agreement. The disclosure requirements are effective for annual reporting periods beginning on or after January 1, 2013. Management is currently evaluating the impact of the update's adoption on the Fund's financial statement disclosures.
Foreign Currency. The Fund may use foreign currency contracts to facilitate transactions in foreign-denominated securities. Gains and losses from these transactions may arise from changes in the value of the foreign currency or if the counterparties do not perform under the contracts' terms.
Foreign-denominated assets, including investment securities, and liabilities are translated into U.S. dollars at the exchange rate at period end. Purchases and sales of investment securities, income and dividends received and expenses denominated in foreign currencies are translated into U.S. dollars at the exchange rate in effect on the transaction date.
The effects of exchange rate fluctuations on investments are included with the net realized and unrealized gain (loss) on investment securities. Other foreign currency transactions resulting in realized and unrealized gain (loss) are disclosed separately.
Investment Transactions and Income. For financial reporting purposes, the Fund's investment holdings and NAV include trades executed through the end of the last business day of the period. The NAV per share for processing shareholder transactions is calculated as of the close of business of the New York Stock Exchange (NYSE), normally 4:00 p.m. Eastern time and includes trades executed through the end of the prior business day. Gains and losses on securities sold are determined on the basis of identified cost and may include proceeds received from litigation. Dividend income is recorded on the ex-dividend date, except for certain dividends from foreign securities where the ex-dividend date may have passed, which are recorded as soon as the Fund is informed of the ex-dividend date. Non-cash dividends included in dividend income, if any, are recorded at the fair market value of the securities received. Distributions received on securities that represent a return of capital or capital gain are recorded as a reduction of cost of investments and/or as a realized gain. The Fund estimates the components of distributions received that may be considered return of capital distributions or capital gain distributions. Interest income and distributions from the Fidelity Central Funds are accrued as earned. Interest income includes coupon interest and amortization of premium and accretion of discount on debt securities. Investment income is recorded net of foreign taxes withheld where recovery of such taxes is uncertain.
Expenses. Expenses directly attributable to a fund are charged to that fund. Expenses attributable to more than one fund are allocated among the respective funds on the basis of relative net assets or other appropriate methods. Expense estimates are accrued in the period to which they relate and adjustments are made when actual amounts are known. Expenses included in the accompanying financial statements reflect the expenses of the Fund and do not include any expenses of the Fidelity Central Funds. Although not included in the Fund's expenses, the Fund indirectly bears its proportionate share of the Fidelity Central Funds' expenses through the impact of these expenses on each Fidelity Central Fund's NAV. Based on their most recent shareholder report date, expenses of the Fidelity Central Funds ranged from .00% to .12%.
Income Tax Information and Distributions to Shareholders. Each year, the Fund intends to qualify as a regulated investment company, including distributing substantially all of its taxable income and realized gains under Subchapter M of the Internal Revenue Code. As a result, no provision for income taxes is required. As of December 31, 2011, the Fund did not have any unrecognized tax benefits in the financial statements; nor is the Fund aware of any tax positions for which it is reasonably possible that the total amounts of unrecognized tax benefits will significantly change in the next twelve months. The Fund files a U.S. federal tax return, in addition to state and local tax returns as required. A fund's tax returns are subject to examination by the Internal Revenue Service (IRS) for a period of three fiscal years. State and local tax returns may be subject to examination for an additional fiscal year depending on the jurisdiction. Foreign taxes are provided for based on the Fund's understanding of the tax rules and rates that exist in the foreign markets in which it invests.
Distributions are declared and recorded on the ex-dividend date. Income dividends and capital gain distributions are declared separately for each class. Income and capital gain distributions are determined in accordance with income tax regulations, which may differ from GAAP.
Capital accounts within the financial statements are adjusted for permanent book-tax differences. These adjustments have no impact on net assets or the results of operations. Temporary book-tax differences will reverse in a subsequent period.
Book-tax differences are primarily due to short-term gain distributions from the Fidelity Central Funds, in-kind transactions, futures transactions, foreign currency transactions, market discount, partnerships (including allocations from Fidelity Central Funds), deferred trustees compensation, capital loss carryforwards and losses deferred due to wash sales and excise tax regulations.
Annual Report
3. Significant Accounting Policies - continued
Income Tax Information and Distributions to Shareholders - continued
The federal tax cost of investment securities and unrealized appreciation (depreciation) as of period end were as follows:
Gross unrealized appreciation | $ 17,899,762 |
Gross unrealized depreciation | (13,851,139) |
Net unrealized appreciation (depreciation) on securities and other investments | $ 4,048,623 |
| |
Tax Cost | $ 157,312,408 |
The tax-based components of distributable earnings as of period end were as follows:
Capital loss carryforward | $ (34,237,954) |
Net unrealized appreciation (depreciation) | $ 4,048,379 |
Capital loss carryforwards are only available to offset future capital gains of the Fund to the extent provided by regulations and may be limited. Under the Regulated Investment Company Modernization Act of 2010 (the Act), the Fund is permitted to carry forward capital losses incurred in taxable years beginning after December 22, 2010 for an unlimited period and such capital losses are required to be used prior to any losses that expire. Capital loss carryforwards were as follows:
Fiscal year of expiration | |
2016 | $ (12,878,795) |
2017 | (21,359,159) |
Total with expiration | $ (34,237,954) |
The tax character of distributions paid was as follows:
| December 31, 2011 | December 31, 2010 |
Ordinary Income | $ 3,111,813 | $ 2,514,686 |
4. Operating Policies.
Restricted Securities. The Fund may invest in securities that are subject to legal or contractual restrictions on resale. These securities generally may be resold in transactions exempt from registration or to the public if the securities are registered. Disposal of these securities may involve time-consuming negotiations and expense, and prompt sale at an acceptable price may be difficult. Information regarding restricted securities is included at the end of the Fund's Schedule of Investments.
5. Derivative Instruments.
Risk Exposures and the Use of Derivative Instruments. The Fund used derivative instruments (derivatives), including futures contracts, in order to meet its investment objectives. The strategy is to use derivatives to increase returns and to manage exposure to certain risks as defined below. The success of any strategy involving derivatives depends on analysis of numerous economic factors, and if the strategies for investment do not work as intended, the Fund may not achieve its objectives.
The Fund's use of derivatives increased or decreased its exposure to the following risk:
Equity Risk | Equity risk relates to the fluctuations in the value of financial instruments as a result of changes in market prices (other than those arising from interest rate risk or foreign exchange risk), whether caused by factors specific to an individual investment, its issuer, or all factors affecting all instruments traded in a market or market segment. |
The Fund is also exposed to additional risks from investing in derivatives, such as liquidity risk and counterparty credit risk. Liquidity risk is the risk that the Fund will be unable to sell the derivative in the open market in a timely manner. Counterparty credit risk is the risk that the counterparty will not be able to fulfill its obligation to the Fund. The Fund's maximum risk of loss from counterparty credit risk is generally the aggregate unrealized appreciation and unpaid counterparty payments in excess of any collateral pledged by the counterparty to the Fund. Counterparty risk related to exchange-traded futures contracts is minimal because of the protection provided by the exchange on which they trade. Derivatives involve, to varying degrees, risk of loss in excess of the amounts recognized in the Statement of Assets and Liabilities.
Annual Report
Notes to Financial Statements - continued
5. Derivative Instruments - continued
Futures Contracts. A futures contract is an agreement between two parties to buy or sell a specified underlying instrument for a fixed price at a specified future date. The Fund used futures contracts to manage its exposure to the stock market.
Upon entering into a futures contract, a fund is required to deposit either cash or securities (initial margin) with a clearing broker in an amount equal to a certain percentage of the face value of the contract. Futures contracts are marked-to-market daily and subsequent payments (variation margin) are made or received by a fund depending on the daily fluctuations in the value of the futures contracts and are recorded as unrealized appreciation or (depreciation). This receivable and/or payable is included in daily variation margin on futures contracts in the Statement of Assets and Liabilities. Realized gain or (loss) is recorded upon the expiration or closing of a futures contract.
The underlying face amount at value of open futures contracts at period end, if any, is shown in the Schedule of Investments under the caption "Futures Contracts." This amount reflects each contract's exposure to the underlying instrument at period end. Securities deposited to meet initial margin requirements are identified in the Schedule of Investments. Certain risks arise upon entering into futures contracts, including the risk that an illiquid market limits the ability to close out a futures contract prior to settlement date.
During the period the Fund recognized net realized gain (loss) of ($186,402) and a change in net unrealized appreciation (depreciation) of ($51,463) related to its investment in futures contracts. These amounts are included in the Statement of Operations.
6. Purchases and Sales of Investments.
Purchases and sales of securities (including the Equity and Fixed-Income Central Funds), other than short-term securities, aggregated $122,595,207 and $135,964,170, respectively.
7. Fees and Other Transactions with Affiliates.
Management Fee. FMR and its affiliates provide the Fund with investment management related services for which the Fund pays a monthly management fee. The management fee is the sum of an individual fund fee rate that is based on an annual rate of .30% of the Fund's average net assets and an annualized group fee rate that averaged .26% during the period. The group fee rate is based upon the average net assets of all the mutual funds advised by FMR. The group fee rate decreases as assets under management increase and increases as assets under management decrease. For the period, the total annual management fee rate was .56% of the Fund's average net assets.
FMR pays a portion of the management fees received from the Fund to the Fidelity Central Funds' investment advisers, who are also affiliates, for managing the assets of the Fidelity Central Funds.
During the period, FMR waived a portion of its management fee as described in the Expense Reductions note.
Distribution and Service Plan Fees. In accordance with Rule 12b-1 of the 1940 Act, the Fund has adopted separate 12b-1 Plans for each Service Class of shares. Each Service Class pays Fidelity Distributors Corporation (FDC), an affiliate of FMR, a service fee. For the period, the service fee is based on an annual rate of .10% of Service Class' average net assets and .25% of Service Class 2's average net assets.
For the period, total fees, all of which were re-allowed to insurance companies for the distribution of shares and providing shareholder support services were as follows:
Service Class | $ 3,629 |
Service Class 2 | 15,783 |
| $ 19,412 |
Transfer Agent Fees. Fidelity Investments Institutional Operations Company, Inc. (FIIOC), an affiliate of FMR, is the Fund's transfer, dividend disbursing, and shareholder servicing agent. FIIOC receives an asset-based fee with respect to each class. Each class (with the exception of Investor Class) pays a transfer agent fee, excluding out of pocket expenses, equal to an annual rate of .07% of average net assets. Investor Class pays a monthly asset-based transfer agent fee of .15% of average net assets. In addition, FIIOC receives an asset-based fee of .0045% of average net assets for typesetting, printing and mailing of shareholder reports, except proxy statements. FIIOC voluntarily agreed to waive this fee for the period August 1, 2011 through December 31, 2011 (see Expense Reductions note). For the period, transfer agent fees for each class, including printing and out of pocket expenses, were as follows:
Initial Class | $ 100,021 |
Service Class | 2,867 |
Service Class 2 | 7,279 |
Investor Class | 60,807 |
| $ 170,974 |
Annual Report
7. Fees and Other Transactions with Affiliates - continued
Accounting and Security Lending Fees. Fidelity Service Company, Inc. (FSC), an affiliate of FMR, maintains the Fund's accounting records. The accounting fee is based on the level of average net assets for the month. Under a separate contract, FSC administers the security lending program. The security lending fee is based on the number and duration of lending transactions.
Brokerage Commissions. The Fund placed a portion of its portfolio transactions with brokerage firms which are affiliates of the investment adviser. The commissions paid to these affiliated firms were $1,823 for the period.
8. Committed Line of Credit.
The Fund participates with other funds managed by FMR or an affiliate in a $4.0 billion credit facility (the "line of credit") to be utilized for temporary or emergency purposes to fund shareholder redemptions or for other short-term liquidity purposes. The Fund has agreed to pay commitment fees on its pro-rata portion of the line of credit, which amounted to $552 and is reflected in Miscellaneous expenses on the Statement of Operations. During the period, there were no borrowings on this line of credit.
9. Security Lending.
The Fund lends portfolio securities through a lending agent from time to time in order to earn additional income. For equity securities, a lending agent is used and may loan securities to certain qualified borrowers, including Fidelity Capital Markets (FCM), a broker-dealer affiliated with the Fund. On the settlement date of the loan, the Fund receives collateral (in the form of U.S. Treasury obligations, letters of credit and/or cash) against the loaned securities and maintains collateral in an amount not less than 100% of the market value of the loaned securities during the period of the loan. The market value of the loaned securities is determined at the close of business of the Fund and any additional required collateral is delivered to the Fund on the next business day. If the borrower defaults on its obligation to return the securities loaned because of insolvency or other reasons, a fund could experience delays and costs in recovering the securities loaned or in gaining access to the collateral. Any cash collateral received is invested in the Fidelity Securities Lending Cash Central Fund. The value of loaned securities and cash collateral at period end are disclosed on the Fund's Statement of Assets and Liabilities. At period end, there were no security loans outstanding with FCM. Security lending income represents the income earned on investing cash collateral, less rebates paid to borrowers and any lending agent fees associated with the loan, plus any premium payments received for lending certain types of securities. Security lending income is presented in the Statement of Operations as a component of income from Fidelity Central Funds. Total security lending income during the period amounted to $33,763, including $305 from securities loaned to FCM.
10. Expense Reductions.
FMR has contractually agreed to waive the Fund's management fee in an amount equal to its proportionate share of the management fee paid to FMR by the subsidiary of Fidelity Commodity Strategy Central Fund based on the Fund's proportionate ownership of the Central Fund. During the period, this waiver reduced the Fund's management fee by $1,168.
FMR or its affiliates agreed to waive certain fees during the period as noted in the table below.
Initial Class | $ 2,253 |
Service Class | 63 |
Service Class 2 | 110 |
Investor Class | 651 |
| $ 3,077 |
In addition, many of the brokers with whom FMR places trades on behalf of the Fund provided services to the Fund in addition to trade execution. These services included payments of certain expenses on behalf of the Fund totaling $19,505 for the period.
11. Distributions to Shareholders.
Distributions to shareholders of each class were as follows:
Years ended December 31, | 2011 | 2010 |
From net investment income | | |
Initial Class | $ 2,018,353 | $ 1,524,495 |
Service Class | 50,378 | 40,585 |
Service Class 2 | 86,587 | 44,899 |
Investor Class | 616,778 | 347,353 |
Total | $ 2,772,096 | $ 1,957,332 |
Annual Report
Notes to Financial Statements - continued
11. Distributions to Shareholders - continued
Years ended December 31, | 2011 | 2010 |
From net realized gain | | |
Initial Class | $ 242,872 | $ 423,471 |
Service Class | 6,522 | 12,340 |
Service Class 2 | 12,555 | 18,708 |
Investor Class | 77,768 | 102,835 |
Total | $ 339,717 | $ 557,354 |
12. Share Transactions.
Transactions for each class of shares were as follows:
| Shares | Dollars |
Years ended December 31, | 2011 | 2010 | 2011 | 2010 |
Initial Class | | | | |
Shares sold | 324,970 | 314,056 | $ 4,775,569 | $ 4,175,708 |
Reinvestment of distributions | 171,956 | 135,558 | 2,261,225 | 1,947,966 |
Shares redeemed | (1,472,410) | (1,723,443) | (21,398,844) | (22,677,836) |
Net increase (decrease) | (975,484) | (1,273,829) | $ (14,362,050) | $ (16,554,162) |
Service Class | | | | |
Shares sold | 209,255 | 27,481 | $ 2,776,259 | $ 366,364 |
Reinvestment of distributions | 4,353 | 3,706 | 56,900 | 52,925 |
Shares redeemed | (64,541) | (59,096) | (925,999) | (772,171) |
Net increase (decrease) | 149,067 | (27,909) | $ 1,907,160 | $ (352,882) |
Service Class 2 | | | | |
Shares sold | 149,932 | 229,882 | $ 2,168,633 | $ 3,022,061 |
Reinvestment of distributions | 7,620 | 4,473 | 99,142 | 63,607 |
Shares redeemed | (331,565) | (463,914) | (4,516,196) | (6,116,111) |
Net increase (decrease) | (174,013) | (229,559) | $ (2,248,421) | $ (3,030,443) |
Investor Class | | | | |
Shares sold | 881,525 | 645,314 | $ 12,860,103 | $ 8,630,814 |
Reinvestment of distributions | 53,019 | 31,438 | 694,546 | 450,188 |
Shares redeemed | (534,217) | (437,500) | (7,493,084) | (5,614,241) |
Net increase (decrease) | 400,327 | 239,252 | $ 6,061,565 | $ 3,466,761 |
13. Other.
The Fund's organizational documents provide former and current trustees and officers with a limited indemnification against liabilities arising in connection with the performance of their duties to the Fund. In the normal course of business, the Fund may also enter into contracts that provide general indemnifications. The Fund's maximum exposure under these arrangements is unknown as this would be dependent on future claims that may be made against the Fund. The risk of material loss from such claims is considered remote.
At the end of the period, FMR or its affiliates were the owners of record of 77% of the total outstanding shares of the Fund.
Annual Report
Report of Independent Registered Public Accounting Firm
To the Trustees of Variable Insurance Products Fund V and Shareholders of VIP Asset Manager: Growth Portfolio:
We have audited the accompanying statement of assets and liabilities of VIP Asset Manager: Growth Portfolio (the Fund), a fund of Variable Insurance Products Fund V, including the schedule of investments, as of December 31, 2011, and the related statement of operations for the year then ended, the statement of changes in net assets for each of the two years in the period then ended, and the financial highlights for each of the five years in the period then ended. These financial statements and financial highlights are the responsibility of the Fund's management. Our responsibility is to express an opinion on these financial statements and financial highlights based on our audits.
We conducted our audits in accordance with the standards of the Public Company Accounting Oversight Board (United States). Those standards require that we plan and perform the audit to obtain reasonable assurance about whether the financial statements and financial highlights are free of material misstatement. The Fund is not required to have, nor were we engaged to perform, an audit of its internal control over financial reporting. Our audits included consideration of internal control over financial reporting as a basis for designing audit procedures that are appropriate in the circumstances, but not for the purpose of expressing an opinion on the effectiveness of the Fund's internal control over financial reporting. Accordingly, we express no such opinion. An audit also includes examining, on a test basis, evidence supporting the amounts and disclosures in the financial statements, assessing the accounting principles used and significant estimates made by management, as well as evaluating the overall financial statement presentation. Our procedures included confirmation of securities owned as of December 31, 2011, by correspondence with the custodians. We believe that our audits provide a reasonable basis for our opinion.
In our opinion, the financial statements and financial highlights referred to above present fairly, in all material respects, the financial position of VIP Asset Manager: Growth Portfolio as of December 31, 2011, the results of its operations for the year then ended, the changes in its net assets for each of the two years in the period then ended, and the financial highlights for each of the five years in the period then ended, in conformity with accounting principles generally accepted in the United States of America.
/s/ Deloitte & Touche LLP
DELOITTE & TOUCHE LLP
Boston, Massachusetts
February 16, 2012
Annual Report
The Trustees and executive officers of the trust and fund, as applicable, are listed below. The Board of Trustees governs the fund and is responsible for protecting the interests of shareholders. The Trustees are experienced executives who meet periodically throughout the year to oversee the fund's activities, review contractual arrangements with companies that provide services to the fund, oversee management of the risks associated with such activities and contractual arrangements, and review the fund's performance. Except for James C. Curvey, each of the Trustees oversees 203 funds advised by FMR or an affiliate. Mr. Curvey oversees 429 funds advised by FMR or an affiliate.
The Trustees hold office without limit in time except that (a) any Trustee may resign; (b) any Trustee may be removed by written instrument, signed by at least two-thirds of the number of Trustees prior to such removal; (c) any Trustee who requests to be retired or who has become incapacitated by illness or injury may be retired by written instrument signed by a majority of the other Trustees; and (d) any Trustee may be removed at any special meeting of shareholders by a two-thirds vote of the outstanding voting securities of the trust. Each Trustee who is not an interested person (as defined in the 1940 Act) (Independent Trustee), shall retire not later than the last day of the calendar year in which his or her 75th birthday occurs. The Independent Trustees may waive this mandatory retirement age policy with respect to individual Trustees. The executive officers hold office without limit in time, except that any officer may resign or may be removed by a vote of a majority of the Trustees at any regular meeting or any special meeting of the Trustees. Except as indicated, each individual has held the office shown or other offices in the same company for the past five years.
Experience, Skills, Attributes, and Qualifications of the Fund's Trustees. The Governance and Nominating Committee has adopted a statement of policy that describes the experience, qualifications, attributes, and skills that are necessary and desirable for potential Independent Trustee candidates (Statement of Policy). The Board believes that each Trustee satisfied at the time he or she was initially elected or appointed a Trustee, and continues to satisfy, the standards contemplated by the Statement of Policy. The Governance and Nominating Committee also engages professional search firms to help identify potential Independent Trustee candidates who have the experience, qualifications, attributes, and skills consistent with the Statement of Policy. From time to time, additional criteria based on the composition and skills of the current Independent Trustees, as well as experience or skills that may be appropriate in light of future changes to board composition, business conditions, and regulatory or other developments, have also been considered by the professional search firms and the Governance and Nominating Committee. In addition, the Board takes into account the Trustees' commitment and participation in Board and committee meetings, as well as their leadership of standing and ad hoc committees throughout their tenure.
In determining that a particular Trustee was and continues to be qualified to serve as a Trustee, the Board has considered a variety of criteria, none of which, in isolation, was controlling. The Board believes that, collectively, the Trustees have balanced and diverse experience, qualifications, attributes, and skills, which allow the Board to operate effectively in governing the fund and protecting the interests of shareholders. Information about the specific experience, skills, attributes, and qualifications of each Trustee, which in each case led to the Board's conclusion that the Trustee should serve (or continue to serve) as a trustee of the fund, is provided below.
Board Structure and Oversight Function. Abigail P. Johnson is an interested person (as defined in the 1940 Act) and currently serves as Chairman. The Trustees have determined that an interested Chairman is appropriate and benefits shareholders because an interested Chairman has a personal and professional stake in the quality and continuity of services provided to the fund. Independent Trustees exercise their informed business judgment to appoint an individual of their choosing to serve as Chairman, regardless of whether the Trustee happens to be independent or a member of management. The Independent Trustees have determined that they can act independently and effectively without having an Independent Trustee serve as Chairman and that a key structural component for assuring that they are in a position to do so is for the Independent Trustees to constitute a substantial majority for the Board. The Independent Trustees also regularly meet in executive session. Kenneth L. Wolfe serves as Chairman of the Independent Trustees and as such (i) acts as a liaison between the Independent Trustees and management with respect to matters important to the Independent Trustees and (ii) with management prepares agendas for Board meetings.
Fidelity funds are overseen by different Boards of Trustees. The fund's Board oversees Fidelity's investment-grade bond, money market, and asset allocation funds and another Board oversees Fidelity's equity and high income funds. The asset allocation funds may invest in Fidelity funds that are overseen by such other Board. The use of separate Boards, each with its own committee structure, allows the Trustees of each group of Fidelity funds to focus on the unique issues of the funds they oversee, including common research, investment, and operational issues. On occasion, the separate Boards establish joint committees to address issues of overlapping consequences for the Fidelity funds overseen by each Board.
The Trustees operate using a system of committees to facilitate the timely and efficient consideration of all matters of importance to the Trustees, the fund, and fund shareholders and to facilitate compliance with legal and regulatory requirements and oversight of the fund's activities and associated risks. The Board, acting through its committees, has charged FMR and its affiliates with (i) identifying events or circumstances the occurrence of which could have demonstrably adverse effects on the fund's business and/or reputation; (ii) implementing processes and controls to lessen the possibility that such events or circumstances occur or to mitigate the effects of such events or circumstances if they do occur; and (iii) creating and maintaining a system designed to evaluate continuously business and market conditions in order to facilitate the identification and implementation processes described in (i) and (ii) above. Because the day-to-day operations and activities of the fund are carried out by or through FMR, its affiliates and other service providers, the fund's exposure to risks is mitigated but not eliminated by the processes overseen by the Trustees. While each of the Board's committees has responsibility for overseeing different aspects of the fund's activities, oversight is exercised primarily through the Operations and Audit Committees. In addition, an ad hoc Board committee of Independent Trustees has worked with FMR to enhance the Board's oversight of investment and financial risks, legal and regulatory risks, technology risks, and operational risks, including the development of additional risk reporting to the Board. Appropriate personnel, including but not limited to the fund's Chief Compliance Officer (CCO), FMR's internal auditor, the independent accountants, the fund's Treasurer and portfolio management personnel, make periodic reports to the Board's committees, as appropriate, including an annual review of FMR's risk management program for the Fidelity funds. The responsibilities of each standing committee, including their oversight responsibilities, are described further under "Standing Committees of the Fund's Trustees."
Annual Report
The fund's Statement of Additional Information (SAI) includes more information about the Trustees. To request a free copy, call Fidelity at 1-877-208-0098.
Interested Trustees*:
Correspondence intended for each Trustee who is an interested person may be sent to Fidelity Investments, 82 Devonshire Street, Boston, Massachusetts 02109.
Name, Age; Principal Occupations and Other Relevant Experience+ |
Abigail P. Johnson (50) |
| Year of Election or Appointment: 2009 Ms. Johnson is Trustee and Chairman of the Board of Trustees of certain Trusts. Ms. Johnson serves as President of Personal, Workplace and Institutional Services (2005-present). Ms. Johnson is Chairman and Director of FMR Co., Inc. (2011-present), Chairman and Director of FMR (2011-present), and the Vice Chairman and Director (2007-present) of FMR LLC. Previously, Ms. Johnson served as President and a Director of FMR (2001-2005), a Trustee of other investment companies advised by FMR, Fidelity Investments Money Management, Inc., and FMR Co., Inc. (2001-2005), Senior Vice President of the Fidelity funds (2001-2005), and managed a number of Fidelity funds. Ms. Abigail P. Johnson and Mr. Arthur E. Johnson are not related. |
James C. Curvey (76) |
| Year of Election or Appointment: 2007 Mr. Curvey also serves as Trustee (2007-present) of other investment companies advised by FMR. Mr. Curvey is a Director of Fidelity Investments Money Management, Inc. (2009-present), Director of Fidelity Research & Analysis Co. (2009-present) and Director of FMR and FMR Co., Inc. (2007-present). Mr. Curvey is also Vice Chairman (2007-present) and Director of FMR LLC. In addition, Mr. Curvey serves as an Overseer for the Boston Symphony Orchestra and a member of the Trustees of Villanova University. Previously, Mr. Curvey was the Vice Chairman (2006-2007) and Director (2000-2007) of FMR Corp. |
* Trustees have been determined to be "Interested Trustees" by virtue of, among other things, their affiliation with the trust or various entities under common control with FMR.
+ The information above includes each Trustee's principal occupation during the last five years and other information relating to the experience, attributes, and skills relevant to each Trustee's qualifications to serve as a Trustee, which led to the conclusion that each Trustee should serve as a Trustee for the fund.
Independent Trustees:
Correspondence intended for each Independent Trustee (that is, the Trustees other than the Interested Trustees) may be sent to Fidelity Investments, P.O. Box 55235, Boston, Massachusetts 02205-5235.
Name, Age; Principal Occupations and Other Relevant Experience+ |
Albert R. Gamper, Jr. (69) |
| Year of Election or Appointment: 2007 Mr. Gamper is Vice Chairman of the Independent Trustees of the Fixed Income and Asset Allocation Funds (2011-present). Prior to his retirement in December 2004, Mr. Gamper served as Chairman of the Board of CIT Group Inc. (commercial finance). During his tenure with CIT Group Inc. Mr. Gamper served in numerous senior management positions, including Chairman (1987-1989; 1999-2001; 2002-2004), Chief Executive Officer (1987-2004), and President (2002-2003). Mr. Gamper currently serves as a member of the Board of Directors of Public Service Enterprise Group (utilities, 2000-present), a member of the Board of Trustees, Rutgers University (2004-present), and Chairman of the Board of Saint Barnabas Health Care System. Previously, Mr. Gamper served as Chairman of the Board of Governors, Rutgers University (2004-2007). |
Robert F. Gartland (60) |
| Year of Election or Appointment: 2010 Mr. Gartland is a partner and investor of Vietnam Partners LLC (investments and consulting, 2008-present) and is Chairman and an investor in Gartland and Mellina Group Corp. (consulting, 2009-present). Prior to his retirement, Mr. Gartland held a variety of positions at Morgan Stanley (financial services, 1979-2007) including Managing Director (1987-2007). |
Arthur E. Johnson (64) |
| Year of Election or Appointment: 2008 Mr. Johnson serves as a member of the Board of Directors of Eaton Corporation (diversified power management, 2009-present), AGL Resources, Inc. (holding company, 2002-present) and Booz Allen Hamilton (management consulting, 2011-present). Prior to his retirement, Mr. Johnson served as Senior Vice President of Corporate Strategic Development of Lockheed Martin Corporation (defense contractor, 1999-2009). He previously served on the Board of Directors of IKON Office Solutions, Inc. (1999-2008) and Delta Airlines (2005-2007). Mr. Arthur E. Johnson is not related to Mr. Edward C. Johnson 3d or Ms. Abigail P. Johnson. |
Michael E. Kenneally (57) |
| Year of Election or Appointment: 2009 Previously, Mr. Kenneally served as a Member of the Advisory Board for certain Fidelity Fixed Income and Asset Allocation Funds (2008-2009). Prior to his retirement, Mr. Kenneally served as Chairman and Global Chief Executive Officer of Credit Suisse Asset Management (2003-2005). Mr. Kenneally was a Director of the Credit Suisse Funds (U.S. mutual funds, 2004-2008) and certain other closed-end funds (2004-2005) and was awarded the Chartered Financial Analyst (CFA) designation in 1991. |
James H. Keyes (71) |
| Year of Election or Appointment: 2007 Mr. Keyes serves as a member of the Boards of Navistar International Corporation (manufacture and sale of trucks, buses, and diesel engines, since 2002) and Pitney Bowes, Inc. (integrated mail, messaging, and document management solutions, since 1998). Prior to his retirement, Mr. Keyes served as Chairman and Chief Executive Officer of Johnson Controls (automotive, building, and energy, 1998-2002) and as a member of the Board of LSI Logic Corporation (semiconductor technologies, 1984-2008). |
Marie L. Knowles (65) |
| Year of Election or Appointment: 2001 Prior to Ms. Knowles' retirement in June 2000, she served as Executive Vice President and Chief Financial Officer of Atlantic Richfield Company (ARCO) (diversified energy, 1996-2000). From 1993 to 1996, she was a Senior Vice President of ARCO and President of ARCO Transportation Company. She served as a Director of ARCO from 1996 to 1998. Ms. Knowles currently serves as a Director and Chairman of the Audit Committee of McKesson Corporation (healthcare service, since 2002). Ms. Knowles is an Honorary Trustee of the Brookings Institution and a member of the Board of the Catalina Island Conservancy and of the Santa Catalina Island Company (2009-present). She also serves as a member of the Advisory Board for the School of Engineering of the University of Southern California and the Foundation Board of the School of Architecture at the University of Virginia (2007-present). Previously, Ms. Knowles served as a Director of Phelps Dodge Corporation (copper mining and manufacturing, 1994-2007). |
Kenneth L. Wolfe (72) |
| Year of Election or Appointment: 2007 Mr. Wolfe is Chairman of the Independent Trustees of the Fixed Income and Asset Allocation Funds (2008-present). Prior to his retirement, Mr. Wolfe served as Chairman and a Director (2007-2009) and Chairman and Chief Executive Officer (1994-2001) of Hershey Foods Corporation. He also served as a member of the Boards of Adelphia Communications Corporation (telecommunications, 2003-2006), Bausch & Lomb, Inc. (medical/pharmaceutical, 1993-2007), and Revlon, Inc. (personal care products, 2004-2009). |
+ The information above includes each Trustee's principal occupation during the last five years and other information relating to the experience, attributes, and skills relevant to each Trustee's qualifications to serve as a Trustee, which led to the conclusion that each Trustee should serve as a Trustee for the fund.
Executive Officers:
Correspondence intended for each executive officer may be sent to Fidelity Investments, 82 Devonshire Street, Boston, Massachusetts 02109.
Name, Age; Principal Occupation |
John R. Hebble (53) |
| Year of Election or Appointment: 2008 President and Treasurer of Fidelity's Fixed Income and Asset Allocation Funds. Mr. Hebble also serves as President (2011-present), Treasurer, and Chief Financial Officer of The North Carolina Capital Management Trust: Cash and Term Portfolios (2008-present), Assistant Treasurer of other Fidelity funds (2009-present) and is an employee of Fidelity Investments. |
Derek L. Young (47) |
| Year of Election or Appointment: 2009 Vice President of Fidelity's Asset Allocation Funds. Mr. Young also serves as President and a Director of Strategic Advisers, Inc. (2011-present), President of the Global Asset Allocation Group (2011-present), and as Vice Chairman of Pyramis Global Advisers, LLC (2011-present). Previously, Mr. Young served as Chief Investment Officer of the Global Asset Allocation Group (2009-2011) and as a portfolio manager. |
Scott C. Goebel (43) |
| Year of Election or Appointment: 2008 Secretary and Chief Legal Officer (CLO) of the Fidelity funds. Mr. Goebel also serves as Secretary of Fidelity Investments Money Management, Inc. (FIMM) (2010-present) and Fidelity Research and Analysis Company (FRAC) (2010-present); Secretary and CLO of The North Carolina Capital Management Trust: Cash and Term Portfolios (2008-present); General Counsel, Secretary, and Senior Vice President of FMR (2008-present) and FMR Co., Inc. (2008-present); employed by FMR LLC or an affiliate (2001-present); Chief Legal Officer of Fidelity Management & Research (Hong Kong) Limited (2008-present) and Assistant Secretary of Fidelity Management & Research (Japan) Inc. (2008-present), and Fidelity Management & Research (U.K.) Inc. (2008-present). Previously, Mr. Goebel served as Assistant Secretary of FIMM (2008-2010), FRAC (2008-2010), and the Funds (2007-2008) and as Vice President and Secretary of Fidelity Distributors Corporation (FDC) (2005-2007). |
David J. Carter (38) |
| Year of Election or Appointment: 2010 Assistant Secretary of Fidelity's Fixed Income and Asset Allocation Funds. Mr. Carter also serves as Vice President, Associate General Counsel (2010-present) and is an employee of Fidelity Investments (2005-present). |
Holly C. Laurent (57) |
| Year of Election or Appointment: 2008 Anti-Money Laundering (AML) Officer of the Fidelity funds. Ms. Laurent also serves as AML Officer of The North Carolina Capital Management Trust: Cash and Term Portfolios (2008-present) and is an employee of Fidelity Investments. Previously, Ms. Laurent was Senior Vice President and Head of Legal for Fidelity Business Services India Pvt. Ltd. (2006-2008), and Senior Vice President, Deputy General Counsel and Group Head for FMR LLC (2005-2006). |
Christine Reynolds (53) |
| Year of Election or Appointment: 2008 Chief Financial Officer of the Fidelity funds. Ms. Reynolds became President of Fidelity Pricing and Cash Management Services (FPCMS) in August 2008. Ms. Reynolds served as Chief Operating Officer of FPCMS (2007-2008). Previously, Ms. Reynolds served as President, Treasurer, and Anti-Money Laundering officer of the Fidelity funds (2004-2007). |
Michael H. Whitaker (44) |
| Year of Election or Appointment: 2008 Chief Compliance Officer of Fidelity's Fixed Income and Asset Allocation Funds. Mr. Whitaker also serves as Chief Compliance Officer of The North Carolina Capital Management Trust: Cash and Term Portfolios (2008-present). Mr. Whitaker is an employee of Fidelity Investments (2007-present). Prior to joining Fidelity Investments, Mr. Whitaker worked at MFS Investment Management where he served as Senior Vice President and Chief Compliance Officer (2004-2006), and Assistant General Counsel. |
Jeffrey S. Christian (50) |
| Year of Election or Appointment: 2009 Deputy Treasurer of the Fidelity funds. Mr. Christian is an employee of Fidelity Investments. Previously, Mr. Christian served as Chief Financial Officer (2008-2009) of certain Fidelity funds and Senior Vice President of Fidelity Pricing and Cash Management Services (FPCMS) (2004-2009). |
Joseph F. Zambello (54) |
| Year of Election or Appointment: 2011 Deputy Treasurer of the Fidelity funds. Mr. Zambello is an employee of Fidelity Investments. Previously, Mr. Zambello served as Vice President of FMR's Program Management Group (2009-2011) and Vice President of the Transfer Agent Oversight Group (2005-2009). |
Stephanie J. Dorsey (42) |
| Year of Election or Appointment: 2008 Deputy Treasurer of Fidelity's Fixed Income and Asset Allocation Funds. Ms. Dorsey also serves as Assistant Treasurer of other Fidelity funds (2010-present) and is an employee of Fidelity Investments (2008-present). Previously, Ms. Dorsey served as Treasurer (2004-2008) of the JPMorgan Mutual Funds and Vice President (2004-2008) of JPMorgan Chase Bank. |
Adrien E. Deberghes (44) |
| Year of Election or Appointment: 2010 Assistant Treasurer of Fidelity's Fixed Income and Asset Allocation Funds. Mr. Deberghes also serves as Vice President and Assistant Treasurer of Fidelity Rutland Square Trust II and Fidelity Commonwealth Trust II (2011-present), Deputy Treasurer of other Fidelity funds (2008-present), and is an employee of Fidelity Investments (2008-present). Previously, Mr. Deberghes served as Senior Vice President of Mutual Fund Administration at State Street Corporation (2007-2008), Senior Director of Mutual Fund Administration at Investors Bank & Trust (2005-2007), and Director of Finance for Dunkin' Brands (2000-2005). |
Kenneth B. Robins (42) |
| Year of Election or Appointment: 2009 Assistant Treasurer of the Fidelity Fixed Income and Asset Allocation Funds. Mr. Robins also serves as President and Treasurer of other Fidelity funds (2008-present; 2010-present) and is an employee of Fidelity Investments (2004-present). Previously, Mr. Robins served as Deputy Treasurer of the Fidelity funds (2005-2008) and Treasurer and Chief Financial Officer of The North Carolina Capital Management Trust: Cash and Term Portfolios (2006-2008). |
Gary W. Ryan (53) |
| Year of Election or Appointment: 2005 Assistant Treasurer of the Fidelity funds. Mr. Ryan is an employee of Fidelity Investments. Previously, Mr. Ryan served as Vice President of Fund Reporting in Fidelity Pricing and Cash Management Services (FPCMS) (1999-2005). |
Jonathan Davis (43) |
| Year of Election or Appointment: 2010 Assistant Treasurer of the Fidelity funds. Mr. Davis is also Assistant Treasurer of Fidelity Rutland Square Trust II and Fidelity Commonwealth Trust II. Mr. Davis is an employee of Fidelity Investments. Previously, Mr. Davis served as Vice President and Associate General Counsel of FMR LLC (2003-2010). |
Annual Report
A total of 4.89% of the dividends distributed during the fiscal year was derived from interest on U.S. Government securities which is generally exempt from state income tax.
Initial Class designates 17%, Service Class designates 18%, Service Class 2 designates 20%, and Investor Class designates 18%, of the dividends distributed in December 2011, during the fiscal year as qualifying for the dividends-received deduction for corporate shareholders.
Annual Report
Board Approval of Investment Advisory Contracts and Management Fees
VIP Asset Manager: Growth Portfolio
Each year, the Board of Trustees, including the Independent Trustees (together, the Board), votes on the renewal of the management contract and sub-advisory agreements (together, the Advisory Contracts) for the fund. The Board, assisted by the advice of fund counsel and Independent Trustees' counsel, requests and considers a broad range of information relevant to the renewal of the Advisory Contracts throughout the year.
The Board meets regularly and considers at each of its meetings factors that are relevant to its annual consideration of the renewal of the fund's Advisory Contracts, including the services and support provided to the fund and its shareholders. The Board has established three standing committees, Operations, Audit, and Nominating and Governance, each composed of Independent Trustees with varying backgrounds, to which the Board has assigned specific subject matter responsibilities in order to enhance effective decision-making by the Board. The Operations Committee, of which all of the Independent Trustees are members, meets regularly throughout the year and, among other matters, considers matters specifically related to the annual consideration of the renewal of the fund's Advisory Contracts. The Board, acting directly and through its Committees, requests and receives information concerning the annual consideration of the renewal of the fund's Advisory Contracts. The Board also meets as needed to consider matters specifically related to the Board's annual consideration of the renewal of Advisory Contracts. Members of the Board may also meet with trustees of other Fidelity funds through ad hoc joint committees to discuss certain matters relevant to the Fidelity funds.
At its September 2011 meeting, the Board of Trustees, including the Independent Trustees, unanimously determined to renew the fund's Advisory Contracts. In reaching its determination, the Board considered all factors it believed relevant, including (i) the nature, extent, and quality of the services to be provided to the fund and its shareholders (including the investment performance of the fund); (ii) the competitiveness of the fund's management fee and total expense ratio; (iii) the total costs of the services to be provided by and the profits to be realized by Fidelity from its relationship with the fund; (iv) the extent to which economies of scale would be realized as the fund grows; and (v) whether fee levels reflect these economies of scale, if any, for the benefit of fund shareholders.
In considering whether to renew the Advisory Contracts for the fund, the Board reached a determination, with the assistance of fund counsel and Independent Trustees' counsel and through the exercise of its business judgment, that the renewal of the Advisory Contracts is in the best interests of the fund and its shareholders and that the compensation payable under the Advisory Contracts is fair and reasonable. The Board's decision to renew the Advisory Contracts was not based on any single factor, but rather was based on a comprehensive consideration of all the information provided to the Board at its meetings throughout the year. The Board, in reaching its determination to renew the Advisory Contracts, is aware that shareholders in the fund have a broad range of investment choices available to them, including a wide choice among mutual funds offered by Fidelity's competitors, and that the fund's shareholders, who have the opportunity to review and weigh the disclosure provided by the fund in its prospectus and other public disclosures, have chosen to invest in this fund, managed by Fidelity.
Nature, Extent, and Quality of Services Provided. The Board considered the staffing within the investment adviser, FMR, and the sub-advisers (together, the Investment Advisers), including the backgrounds of the fund's investment personnel and the fund's investment objective and discipline. The Independent Trustees also had discussions with senior management of Fidelity's investment operations and investment groups. The Board considered the structure of the portfolio manager compensation program and whether this structure provides appropriate incentives to act in the best interests of the fund.
Resources Dedicated to Investment Management and Support Services. The Board reviewed the general qualifications and capabilities of the Investment Advisers' investment staff, including its size, education, experience, and resources, as well as the Investment Advisers' approach to recruiting, managing, and compensating investment personnel. The Board also noted that FMR has devoted increased resources to non-U.S. offices. The Board noted that Fidelity's analysts have extensive resources, tools and capabilities which allow them to conduct sophisticated quantitative and fundamental analysis, as well as credit analysis of issuers, counterparties and enhancers. The Board also believes that Fidelity's investment professionals have sufficient access to global information and data so as to provide competitive investment results over time, and that those professionals also have access to sophisticated tools which permit them to assess portfolio construction and risk and performance attribution characteristics continuously, as well as to transmit new information and research conclusions rapidly around the world. Additionally, in its deliberations, the Board considered the Investment Advisers' trading capabilities and resources which are an integral part of the investment management process.
Shareholder and Administrative Services. The Board considered (i) the nature, extent, quality, and cost of advisory, administrative, and shareholder services performed by the Investment Advisers and their affiliates under the Advisory Contracts and under separate agreements covering transfer agency, pricing and bookkeeping, and securities lending services for the fund; (ii) the nature and extent of the investment adviser's supervision of third party service providers, principally custodians and subcustodians; and (iii) the resources devoted to, and the record of compliance with, the fund's compliance policies and procedures. The Board also reviewed the allocation of fund brokerage, including allocations to brokers affiliated with the Investment Advisers, the use of brokerage commissions to pay fund expenses, and the use of "soft" commission dollars to pay for research services.
The Board noted that the growth of fund assets over time across the complex allows Fidelity to reinvest in the development of services designed to enhance the value or convenience of the Fidelity funds as investment vehicles. These services include 24-hour access to account information and market information through telephone representatives and over the Internet, investor education materials and asset allocation tools, and the expanded availability of Fidelity Investor Centers, with 35 new branches opening since 2010.
Annual Report
Investment in a Large Fund Family. The Board considered the benefits to shareholders of investing in a Fidelity fund, including the benefits of investing in a fund that is part of a large family of funds offering a variety of investment disciplines and providing a large variety of mutual fund investor services. The Board noted that Fidelity had taken, or had made recommendations that resulted in the Fidelity funds taking, a number of actions over the previous year that benefited particular funds, including (i) continuing to dedicate additional resources to investment research and support of the senior management team that oversees asset management; (ii) rationalizing product lines through the mergers of six funds into other funds; (iii) continuing to migrate the Freedom Funds to dedicated lower cost underlying funds; (iv) obtaining shareholder approval to broaden the investment strategies for Fidelity Consumer Finance Portfolio, Fidelity Emerging Asia Fund, and Fidelity Environment and Alternative Energy Portfolio; (v) contractually agreeing to reduce the management fees and impose other expense limitations on Spartan 500 Index Fund and U.S. Bond Index Fund in connection with launching new institutional classes of these funds; (vi) changing the name, primary and supplemental benchmarks, and investment policies of Fidelity Global Strategies Fund to support the fund's flexible investment mandate and global orientation; and (vii) reducing the transfer agency account fee rates on certain accounts.
Investment Performance. The Board considered whether the fund has operated in accordance with its investment objective, as well as its record of compliance with its investment restrictions. It also reviewed the fund's absolute investment performance for each class, as well as the fund's relative investment performance for each class measured over multiple periods against (i) a proprietary custom index, and (ii) a peer group of mutual funds deemed appropriate by Fidelity and reviewed by the Board. The following charts considered by the Board show, over the one-, three-, and five-year periods ended December 31, 2010, the cumulative total returns of Initial Class and Service Class 2 of the fund, the cumulative total returns of a proprietary custom index ("benchmark"), and a range of cumulative total returns of a peer group of mutual funds identified by Morningstar, Inc. as having an investment style similar to that of the fund based on underlying portfolio holdings. The returns of Initial Class and Service Class 2 show the performance of the highest and lowest performing classes, respectively (based on five-year performance). The box within each chart shows the 25th percentile return (bottom of box) and the 75th percentile return (top of box) of the peer group. Returns shown above the box are in the first quartile and returns shown below the box are in the fourth quartile. The percentage beaten numbers noted below each chart correspond to the percentile box and represent the percentage of funds in the peer group whose performance was equal to or lower than that of the class indicated. The fund's proprietary custom index is an index developed by FMR that represents the performance of the fund's three asset classes according to their respective weightings in the fund's neutral mix.
VIP Asset Manager: Growth Portfolio
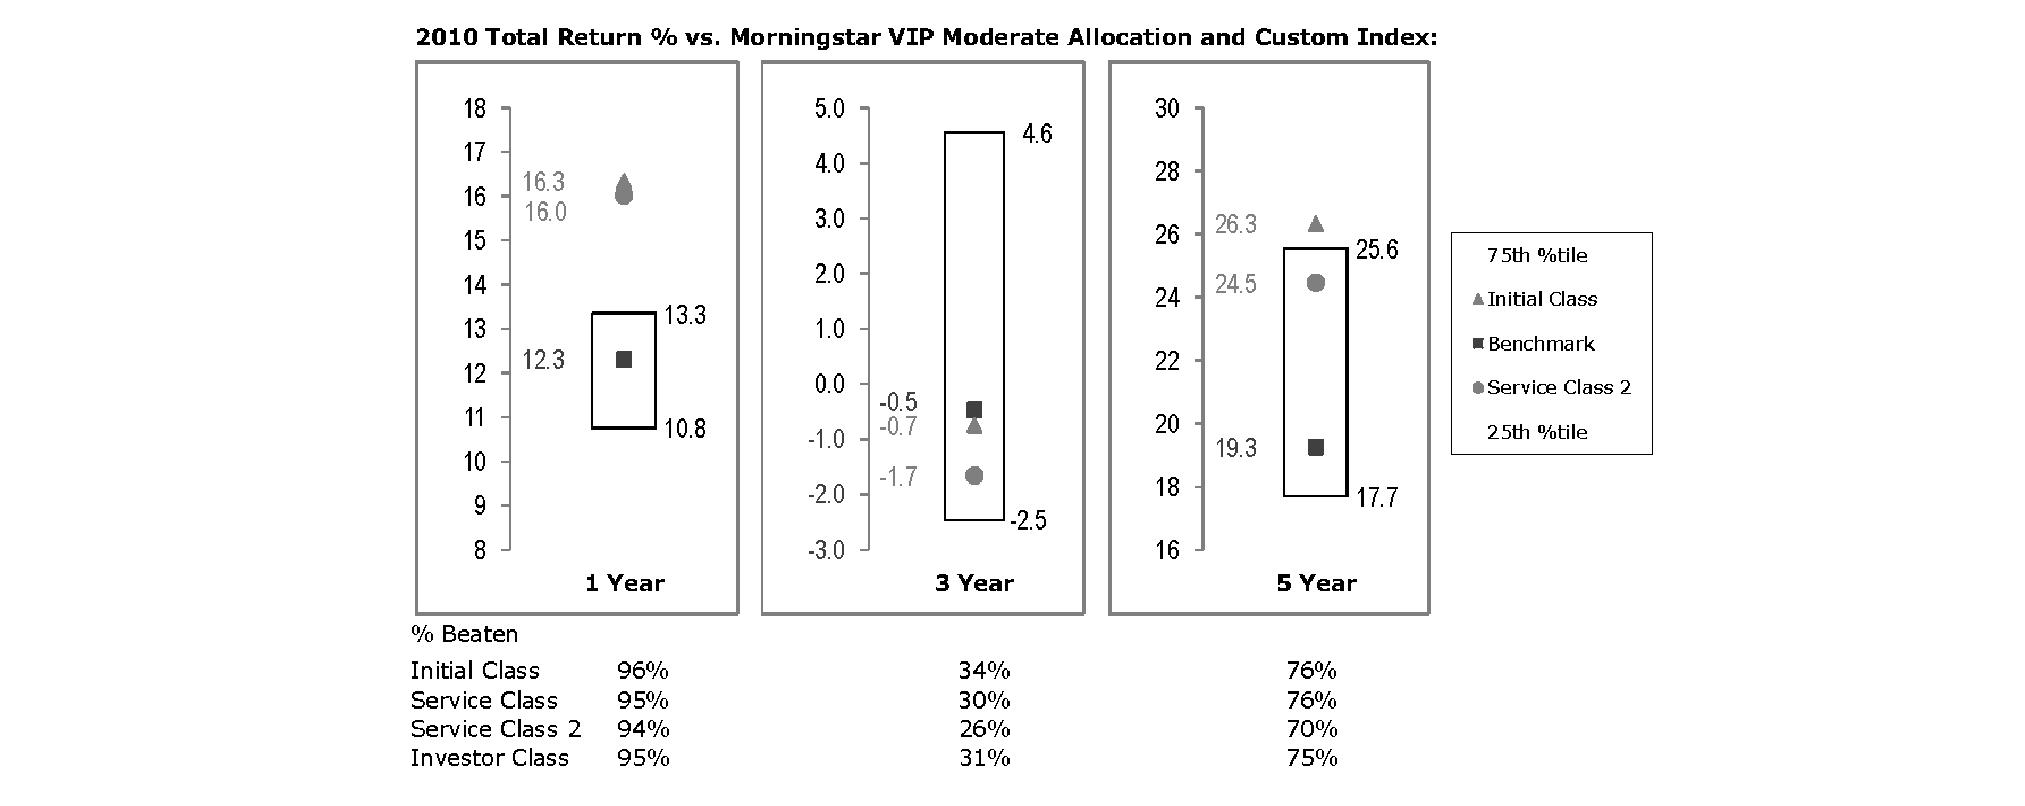
The Board reviewed the fund's relative investment performance against its peer group and noted that the performance of Initial Class of the fund was in the first quartile for the one- and five-year periods and the third quartile for the three-year period. The Board also noted that the investment performance of Initial Class of the fund compared favorably to its benchmark for the one- and five-year periods, although the fund's three-year cumulative total return was lower than its benchmark. The Board considered that the variations in performance among the fund's classes reflect the variations in class expenses, which result in lower performance for higher expense classes. The Board also reviewed the fund's performance since inception as well as performance in the current year.
Annual Report
Board Approval of Investment Advisory Contracts and Management Fees - continued
Based on its review, the Board concluded that the nature, extent, and quality of services provided to the fund under the Advisory Contracts should benefit the fund's shareholders.
Competitiveness of Management Fee and Total Expense Ratio. The Board considered the fund's management fee and total expense ratio compared to "mapped groups" of competitive funds and classes. Fidelity creates "mapped groups" by combining similar Lipper investment objective categories that have comparable management fee characteristics. Combining Lipper investment objective categories aids the Board's management fee and total expense ratio comparisons by broadening the competitive group used for comparison and by reducing the number of universes to which various Fidelity funds are compared.
Management Fee. The Board considered two proprietary management fee comparisons for the 12-month periods shown in the chart below. The group of Lipper funds used by the Board for management fee comparisons is referred to below as the "Total Mapped Group." The Total Mapped Group comparison focuses on a fund's standing relative to the total universe of comparable funds available to investors in terms of gross management fees before expense reimbursements or caps. "TMG %" represents the percentage of funds in the Total Mapped Group that had management fees that were lower than the fund's. For example, a TMG % of 31% means that 69% of the funds in the Total Mapped Group had higher management fees than the fund. The "Asset-Size Peer Group" (ASPG) comparison focuses on a fund's standing relative to non-Fidelity funds similar in size to the fund within the Total Mapped Group. The ASPG represents at least 15% of the funds in the Total Mapped Group with comparable asset size and management fee characteristics, subject to a minimum of 50 funds (or all funds in the Total Mapped Group if fewer than 50). Additional information, such as the ASPG quartile in which the fund's management fee ranked, is also included in the chart and considered by the Board.
VIP Asset Manager: Growth Portfolio
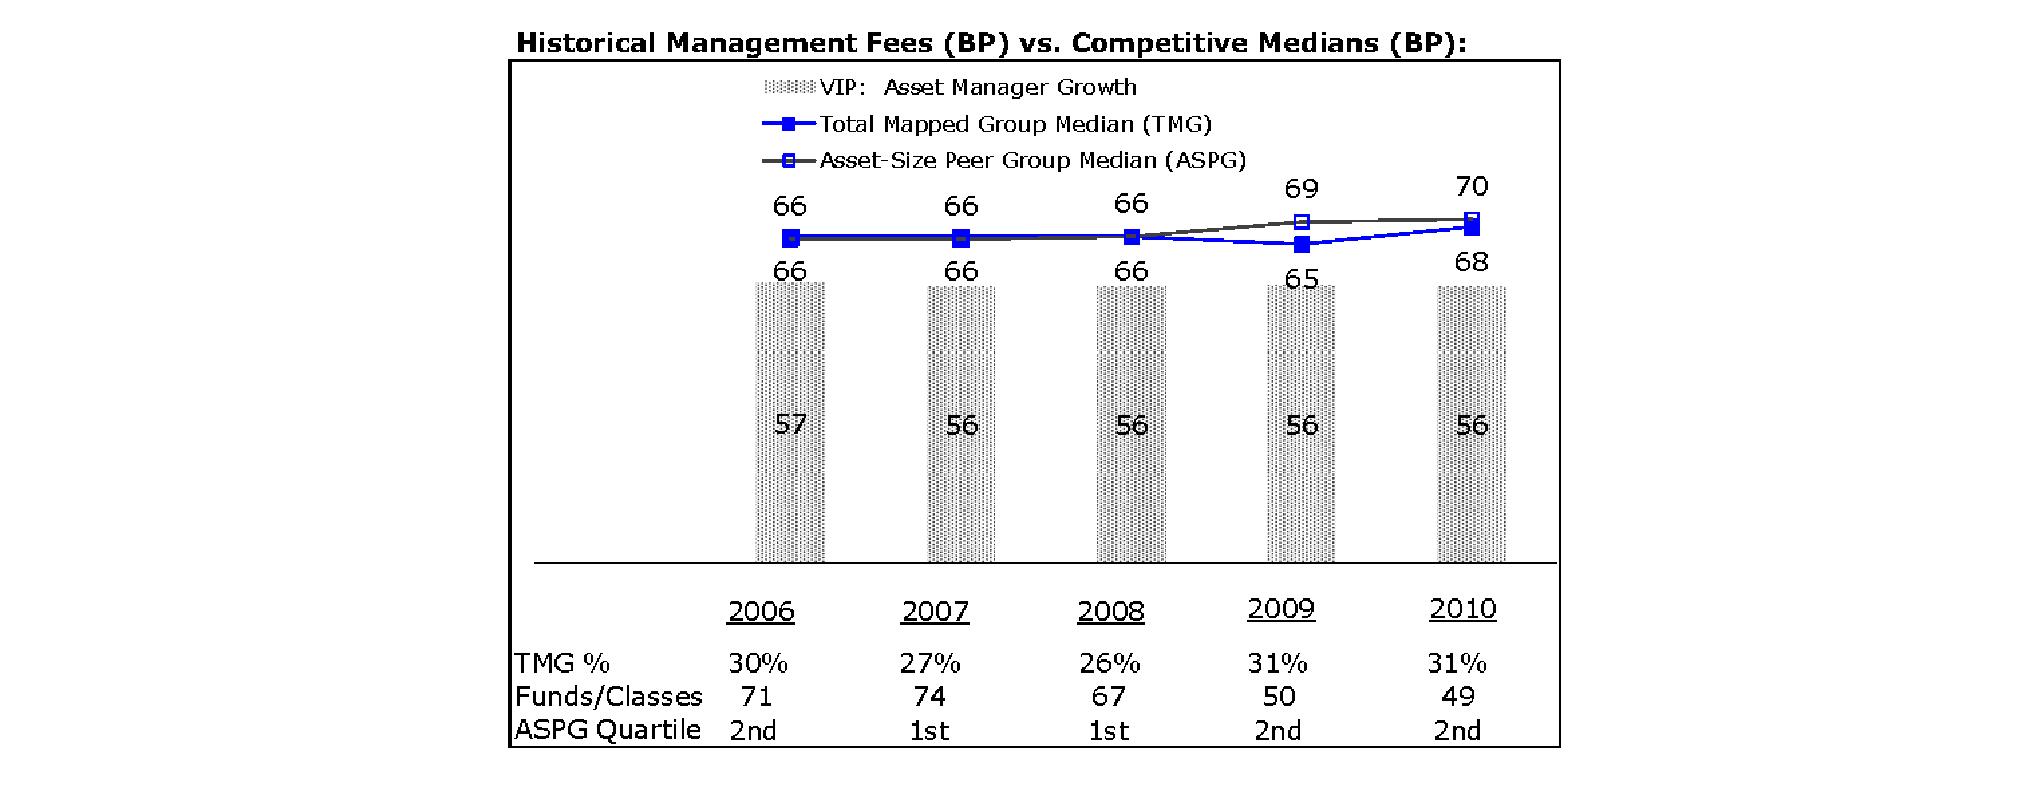
The Board noted that the fund's management fee ranked below the median of its Total Mapped Group and below the median of its ASPG for 2010.
Based on its review, the Board concluded that the fund's management fee is fair and reasonable in light of the services that the fund receives and the other factors considered.
Total Expense Ratio. In its review of each class's total expense ratio, the Board considered the fund's management fee as well as other fund or class expenses, as applicable, such as transfer agent fees, pricing and bookkeeping fees, fund-paid 12b-1 fees, and custodial, legal, and audit fees. The Board also noted the effects of any waivers and reimbursements on fees and expenses. As part of its review, the Board also considered the current and historical total expense ratios of each class of the fund compared to competitive fund median expenses. Each class of the fund is compared to those funds and classes in the Total Mapped Group (used by the Board for management fee comparisons) that have a similar sales load structure.
The Board noted that the total expense ratio of each of Initial Class, Investor Class, and Service Class ranked below its competitive median for 2010 and the total expense ratio of Service Class 2 ranked above its competitive median for 2010. The Board considered that various factors, including 12b-1 fees and relatively higher other expenses in the case of small fund size, can affect total expense ratios. The Board noted that the total expense ratio of Service Class 2 was above the median due to 12b-1 fees and that the funds and classes in the Total Mapped Group that have a similar sales load structure included classes with no 12b-1 fees. Excluding the 12b-1 fees, the total expense ratio of Service Class 2 ranked below its competitive median for 2010. The Board also noted that Investor Class has higher transfer agent fees than traditional variable annuity classes because it is designed for lower cost annuity products, where the majority of servicing costs are incorporated into the funds' total expense ratios rather than being paid at the annuity level. The Board noted that the fund offers multiple classes, each of which has a different 12b-1 fee structure, and that the multiple structures are intended to offer a range of pricing options for the intermediary market. The Board also noted that the total expense ratios of the classes vary primarily by the level of their 12b-1 fees, although differences in transfer agent fees may also cause expenses to vary from class to class.
Annual Report
Fees Charged to Other Fidelity Clients. The Board also considered Fidelity fee structures and other information with respect to clients of FMR and its affiliates, such as other mutual funds advised or subadvised by FMR or its affiliates, pension plan clients, and other institutional clients. In March 2010, the Board created an ad hoc joint committee with the board of other Fidelity funds (the Committee) to review and compare Fidelity's institutional investment advisory business with its business of providing services to the Fidelity funds, including the differences in services provided, fees charged, and costs incurred, as well as competition in their respective marketplaces.
Based on its review of total expense ratios and fees charged to other Fidelity clients, the Board concluded that the total expense ratio of each class of the fund was reasonable, although Service Class 2 was above the median of the universe presented for comparison, in light of the services that the fund and its shareholders receive and the other factors considered, including the findings of the Committee.
Costs of the Services and Profitability. The Board considered the revenues earned and the expenses incurred by Fidelity in conducting the business of developing, marketing, distributing, managing, administering and servicing the fund and its shareholders. The Board also considered the level of Fidelity's profits in respect of all the Fidelity funds.
On an annual basis, FMR presents to the Board Fidelity's profitability for the fund. Fidelity calculates the profitability for each fund, as well as aggregate profitability for groups of Fidelity funds and all Fidelity funds, using a series of detailed revenue and cost allocation methodologies which originate with the books and records of Fidelity on which Fidelity's audited financial statements are based. The Audit Committee of the Board reviews any significant changes from the prior year's methodologies.
PricewaterhouseCoopers LLP (PwC), independent registered public accounting firm and auditor to Fidelity and certain Fidelity funds, has been engaged annually by the Board as part of the Board's assessment of Fidelity's profitability analysis. PwC's engagement includes the review and assessment of Fidelity's methodologies used in determining the revenues and expenses attributable to Fidelity's mutual fund business, and completion of agreed-upon procedures surrounding the mathematical accuracy of fund profitability and its conformity to allocation methodologies. After considering PwC's reports issued under the engagement and information provided by Fidelity, the Board concluded that while other allocation methods may also be reasonable, Fidelity's profitability methodologies are reasonable in all material respects.
The Board also reviewed Fidelity's non-fund businesses and fall-out benefits related to the mutual fund business as well as cases where Fidelity's affiliates may benefit from or be related to the fund's business.
The Board considered the costs of the services provided by and the profits realized by Fidelity in connection with the operation of the fund and was satisfied that the profitability was not excessive in the circumstances.
Economies of Scale. The Board considered whether there have been economies of scale in respect of the management of the Fidelity funds, whether the Fidelity funds (including the fund) have appropriately benefited from any such economies of scale, and whether there is potential for realization of any further economies of scale. The Board considered the extent to which the fund will benefit from economies of scale through increased services to the fund, through waivers or reimbursements, or through fee or expense reductions. The Board also noted that in 2009, it and the board of other Fidelity funds created an ad hoc committee (the Economies of Scale Committee) to analyze whether FMR attains economies of scale in respect of the management and servicing of the Fidelity funds, whether the Fidelity funds have appropriately benefited from such economies of scale, and whether there is potential for realization of any further economies of scale.
The Board recognized that the fund's management contract incorporates a "group fee" structure, which provides for lower group fee rates as total fund assets under FMR's management increase, and for higher group fee rates as total fund assets under FMR's management decrease. FMR calculates the group fee rates based on a tiered asset "breakpoint" schedule that varies based on asset class. The Board considered that the group fee is designed to deliver the benefits of economies of scale to fund shareholders when total Fidelity fund assets increase, even if assets of any particular fund are unchanged or have declined, because some portion of Fidelity's costs are attributable to services provided to all Fidelity funds, and all funds benefit if those costs can be allocated among more assets. The Board concluded that, given the group fee structure, fund shareholders will benefit from lower management fees as assets under FMR's management increase at the fund complex level, regardless of whether Fidelity achieves any such economies of scale.
The Board concluded, taking into account the analysis of the Economies of Scale Committee, that any potential economies of scale are being appropriately shared between fund shareholders and Fidelity.
Additional Information Requested by the Board. In order to develop fully the factual basis for consideration of the Fidelity funds' Advisory Contracts, the Board requested and received additional information on certain topics, including: (i) Fidelity's fund profitability methodology, profitability trends for certain funds, and the impact of certain factors on fund profitability results; (ii) portfolio manager changes that have occurred during the past year and the amount of the investment that each portfolio manager has made in the Fidelity fund(s) that he or she manages; (iii) Fidelity's compensation structure for portfolio managers, research analysts, and other key personnel, including its effects on fund profitability, the rationale for the compensation structure, and the extent to which current market conditions have affected retention and recruitment; (iv) the compensation paid to fund sub-advisers on behalf of the Fidelity funds; (v) Fidelity's fee structures and rationale for recommending different fees among different categories of funds and classes, as well as Fidelity's voluntary waiver of its fees to maintain minimum yields for certain money market funds and classes; (vi) the reasons why certain expenses affect various funds and classes differently; (vii) Fidelity's transfer agent fees, expenses, and services and how the benefits of decreased costs and new efficiencies can be shared across all of the Fidelity funds; (viii) the reasons for and consequences of changes to certain product lines compared to competitors; (ix) the allocation of and historical trends in Fidelity's realization of fall-out benefits; and (x) explanations regarding the relative total expense ratios of certain funds and classes, total expense competitive trends, and actions that might be taken by FMR to reduce total expense ratios for certain funds and classes or to achieve further economies of scale.
Annual Report
Board Approval of Investment Advisory Contracts and Management Fees - continued
Based on its evaluation of all of the conclusions noted above, and after considering all factors it believed relevant, the Board ultimately concluded that the advisory fee structures are fair and reasonable, and that the fund's Advisory Contracts should be renewed.
Annual Report
Investment Adviser
Fidelity Management & Research Company
Boston, MA
Investment Sub-Advisers
FMR Co., Inc.
Fidelity Management & Research (U.K.) Inc.
Fidelity Management & Research (Hong Kong) Limited
Fidelity Management & Research (Japan) Inc.
Fidelity Investments Money Management, Inc.
General Distributor
Fidelity Distributors Corporation
Boston, MA
Transfer and Service Agents
Fidelity Investments Institutional Operations Company, Inc.
Boston, MA
Fidelity Service Company, Inc.
Boston, MA
Custodian
JPMorgan Chase Bank
New York, NY
VIPAMG-ANN-0212
1.540207.114
Fidelity® Variable Insurance Products:
Freedom Funds -
Income, 2005, 2010, 2015, 2020, 2025, 2030, 2035, 2040, 2045, 2050
Annual Report
December 31, 2011
Contents
Annual Report
To view a fund's proxy voting guidelines and proxy voting record for the 12-month period ended June 30, visit http://www.fidelity.com/proxyvotingresults or visit the Securities and Exchange Commission's (SEC) web site at http://www.sec.gov. You may also call 1-877-208-0098 to request a free copy of the proxy voting guidelines.
Fidelity Variable Insurance Products are separate account options which are purchased through a variable insurance contract.
Standard & Poor's, S&P and S&P 500 are registered service marks of The McGraw-Hill Companies, Inc. and have been licensed for use by Fidelity Distributors Corporation.
Other third party marks appearing herein are the property of their respective owners.
All other marks appearing herein are registered or unregistered trademarks or service marks of FMR LLC or an affiliated company.
This report and the financial statements contained herein are submitted for the general information of the shareholders of the funds. This report is not authorized for distribution to prospective investors in the funds unless preceded or accompanied by an effective prospectus.
A fund files its complete schedule of portfolio holdings with the SEC for the first and third quarters of each fiscal year on Form N-Q. Forms N-Q are available on the SEC's web site at http://www.sec.gov. A fund's Forms N-Q may be reviewed and copied at the SEC's Public Reference Room in Washington, DC. Information regarding the operation of the SEC's Public Reference Room may be obtained by calling 1-800-SEC-0330. For a complete list of a fund's portfolio holdings, view the most recent holdings listing, semiannual report, or annual report on Fidelity's web site at http://www.fidelity.com, http://www.advisor.fidelity.com, or http://www.401k.com, as applicable.
NOT FDIC INSURED • MAY LOSE VALUE • NO BANK GUARANTEE
Neither the funds nor Fidelity Distributors Corporation is a bank.
Annual Report
VIP Freedom Income Portfolio
Average annual total return reflects the change in the value of an investment, assuming reinvestment of the class' distributions from dividend income and capital gains (the profits earned upon the sale of securities that have grown in value, if any) and assuming a constant rate of performance each year. During periods of reimbursement by Fidelity, a fund's total return will be greater than it would be had the reimbursement not occurred. Performance numbers are net of all underlying fund operating expenses, but do not include any insurance charges imposed by your insurance company's separate account. If performance information included the effect of these additional charges, the total returns would have been lower. How a fund did yesterday is no guarantee of how it will do tomorrow.
Average Annual Total Returns
Periods ended December 31, 2011 | Past 1
year | Past 5
years | Life of
FundA |
VIP Freedom Income PortfolioSM - Initial Class | 1.63% | 3.60% | 4.41% |
VIP Freedom Income Portfolio - Service Class | 1.56% | 3.50% | 4.31% |
VIP Freedom Income Portfolio - Service Class 2 | 1.39% | 3.35% | 4.15% |
A From April 26, 2005.
$10,000 Over Life of Fund
Let's say hypothetically that $10,000 was invested in VIP Freedom Income Portfolio - Initial Class on April 26, 2005, when the fund started. The chart shows how the value of your investment would have changed, and also shows how the Barclays Capital® U.S. Aggregate Bond Index performed over the same period.
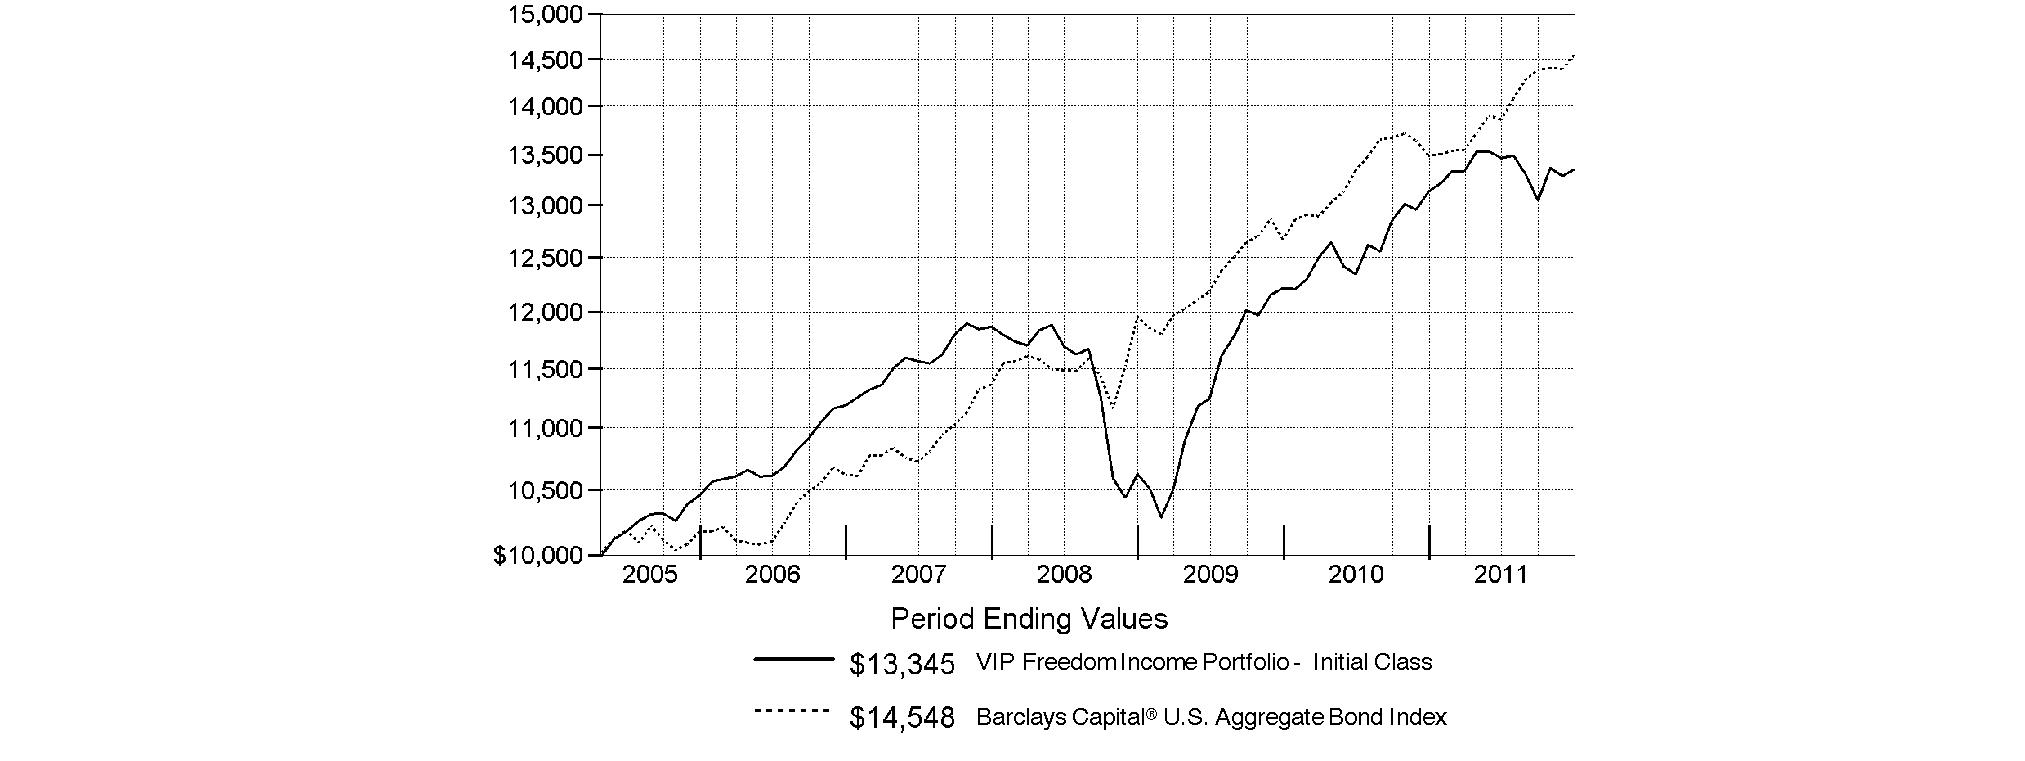
Annual Report
VIP Freedom 2005 Portfolio
Performance: The Bottom Line
Average annual total return reflects the change in the value of an investment, assuming reinvestment of the class' distributions from dividend income and capital gains (the profits earned upon the sale of securities that have grown in value, if any) and assuming a constant rate of performance each year. During periods of reimbursement by Fidelity, a fund's total return will be greater than it would be had the reimbursement not occurred. Performance numbers are net of all underlying fund operating expenses, but do not include any insurance charges imposed by your insurance company's separate account. If performance information included the effect of these additional charges, the total returns would have been lower. How a fund did yesterday is no guarantee of how it will do tomorrow.
Average Annual Total Returns
Periods ended December 31, 2011 | Past 1
year | Past 5
years | Life of
FundA |
VIP Freedom 2005 PortfolioSM - Initial Class | 0.18% | 2.58% | 4.52% |
VIP Freedom 2005 Portfolio - Service Class | -0.04% | 2.46% | 4.40% |
VIP Freedom 2005 Portfolio - Service Class 2 | -0.09% | 2.30% | 4.25% |
A From April 26, 2005.
$10,000 Over Life of Fund
Let's say hypothetically that $10,000 was invested in VIP Freedom 2005 Portfolio - Initial Class on April 26, 2005, when the fund started. The chart shows how the value of your investment would have changed, and also shows how the Barclays Capital U.S. Aggregate Bond Index performed over the same period.
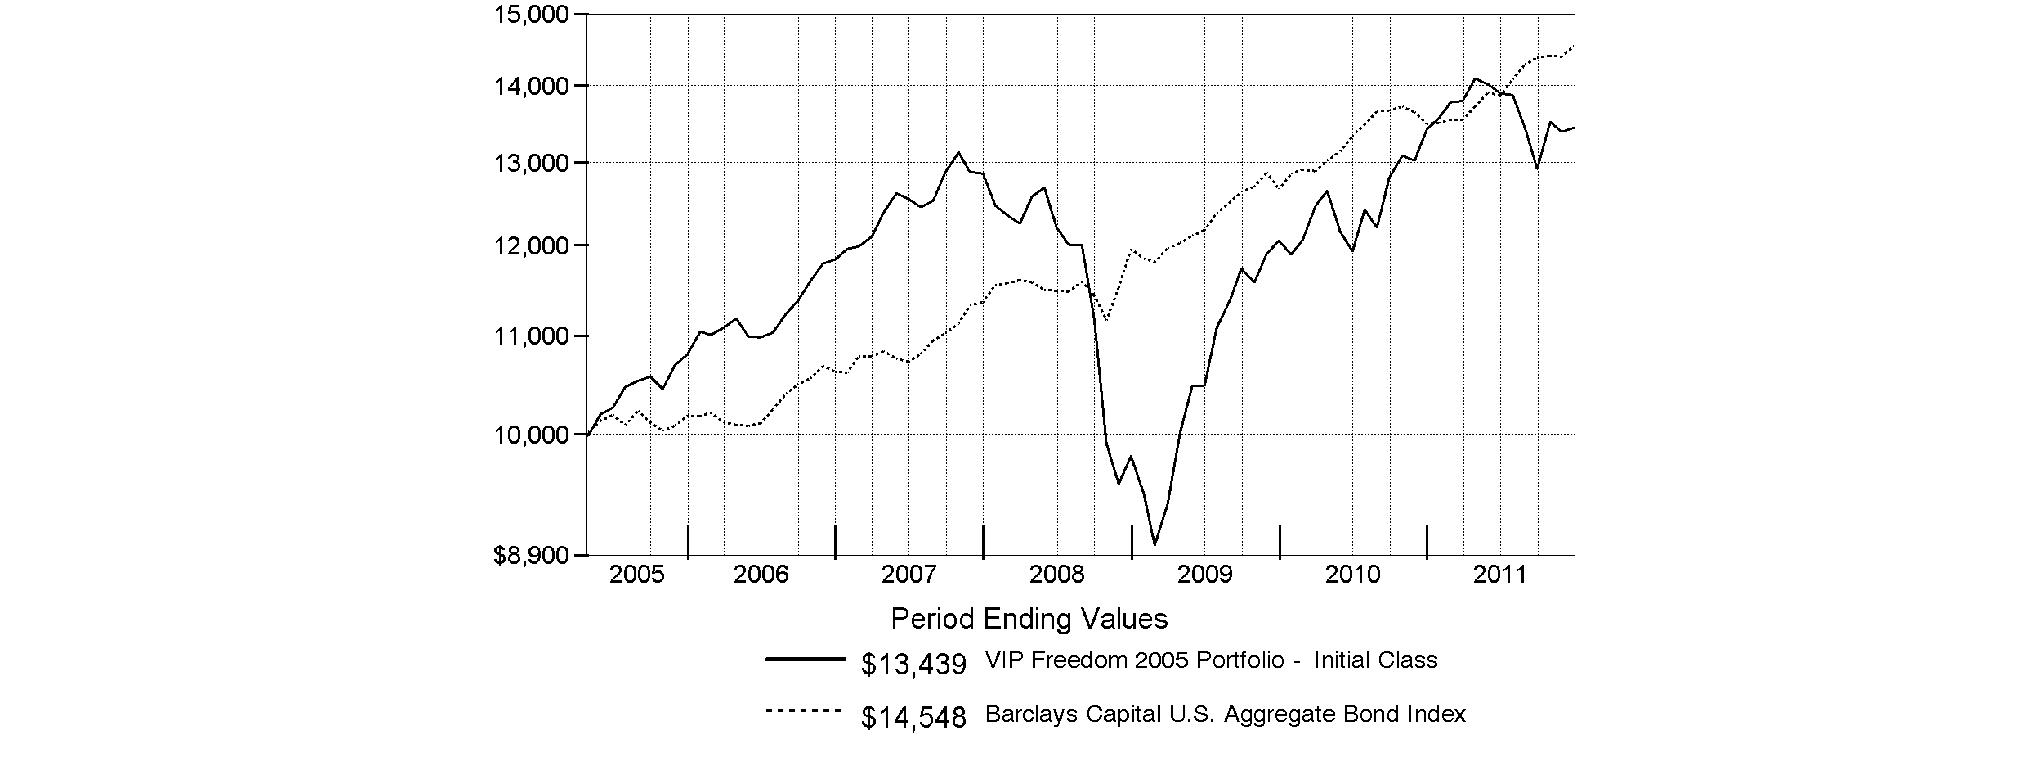
Annual Report
VIP Freedom 2010 Portfolio
Performance: The Bottom Line
Average annual total return reflects the change in the value of an investment, assuming reinvestment of the class' distributions from dividend income and capital gains (the profits earned upon the sale of securities that have grown in value, if any) and assuming a constant rate of performance each year. During periods of reimbursement by Fidelity, a fund's total return will be greater than it would be had the reimbursement not occurred. Performance numbers are net of all underlying fund operating expenses, but do not include any insurance charges imposed by your insurance company's separate account. If performance information included the effect of these additional charges, the total returns would have been lower. How a fund did yesterday is no guarantee of how it will do tomorrow.
Average Annual Total Returns
Periods ended December 31, 2011 | Past 1
year | Past 5
years | Life of
FundA |
VIP Freedom 2010 PortfolioSM - Initial Class | -0.19% | 2.68% | 4.69% |
VIP Freedom 2010 Portfolio - Service Class | -0.28% | 2.58% | 4.58% |
VIP Freedom 2010 Portfolio - Service Class 2 | -0.43% | 2.42% | 4.41% |
A From April 26, 2005.
$10,000 Over Life of Fund
Let's say hypothetically that $10,000 was invested in VIP Freedom 2010 Portfolio - Initial Class on April 26, 2005, when the fund started. The chart shows how the value of your investment would have changed, and also shows how the Barclays Capital U.S. Aggregate Bond Index performed over the same period.
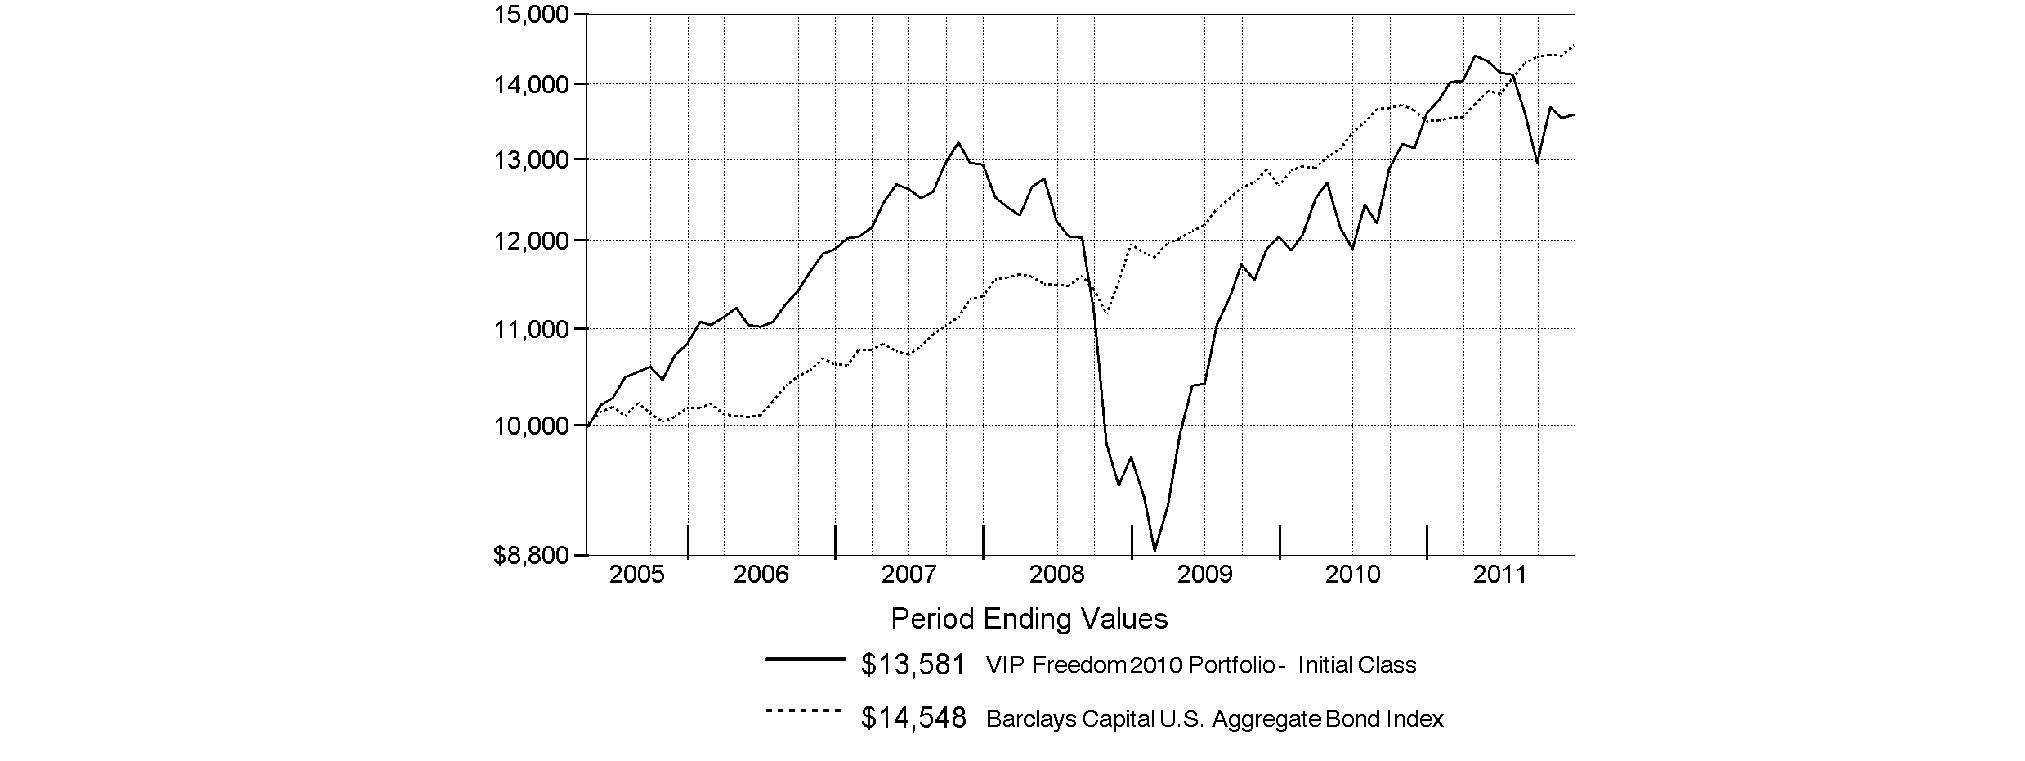
Annual Report
VIP Freedom 2015 Portfolio
Performance: The Bottom Line
Average annual total return reflects the change in the value of an investment, assuming reinvestment of the class' distributions from dividend income and capital gains (the profits earned upon the sale of securities that have grown in value, if any) and assuming a constant rate of performance each year. During periods of reimbursement by Fidelity, a fund's total return will be greater than it would be had the reimbursement not occurred. Performance numbers are net of all underlying fund operating expenses, but do not include any insurance charges imposed by your insurance company's separate account. If performance information included the effect of these additional charges, the total returns would have been lower. How a fund did yesterday is no guarantee of how it will do tomorrow.
Average Annual Total Returns
Periods ended December 31, 2011 | Past 1
year | Past 5
years | Life of
FundA |
VIP Freedom 2015 PortfolioSM - Initial Class | -0.36% | 2.41% | 4.90% |
VIP Freedom 2015 Portfolio - Service Class | -0.41% | 2.31% | 4.80% |
VIP Freedom 2015 Portfolio - Service Class 2 | -0.52% | 2.15% | 4.65% |
A From April 26, 2005.
$10,000 Over Life of Fund
Let's say hypothetically that $10,000 was invested in VIP Freedom 2015 Portfolio - Initial Class on April 26, 2005, when the fund started. The chart shows how the value of your investment would have changed, and also shows how the S&P 500® Index performed over the same period.
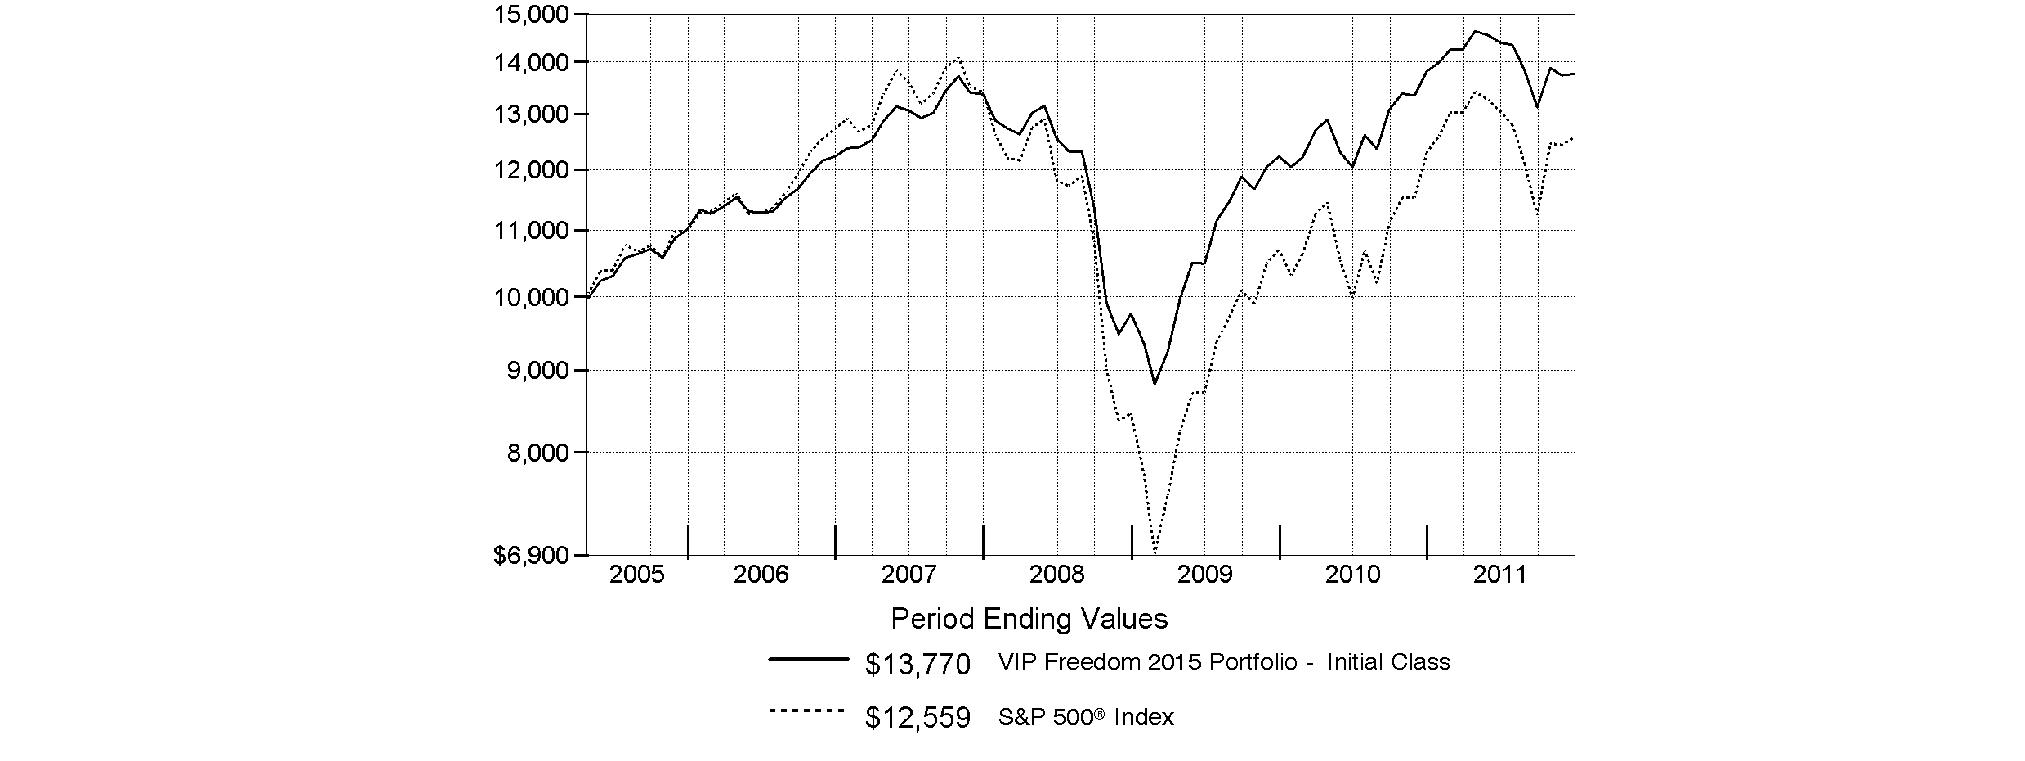
Annual Report
VIP Freedom 2020 Portfolio
Performance: The Bottom Line
Average annual total return reflects the change in the value of an investment, assuming reinvestment of the class' distributions from dividend income and capital gains (the profits earned upon the sale of securities that have grown in value, if any) and assuming a constant rate of performance each year. During periods of reimbursement by Fidelity, a fund's total return will be greater than it would be had the reimbursement not occurred. Performance numbers are net of all underlying fund operating expenses, but do not include any insurance charges imposed by your insurance company's separate account. If performance information included the effect of these additional charges, the total returns would have been lower. How a fund did yesterday is no guarantee of how it will do tomorrow.
Average Annual Total Returns
Periods ended December 31, 2011 | Past 1
year | Past 5
years | Life of
FundA |
VIP Freedom 2020 PortfolioSM - Initial Class | -1.03% | 1.66% | 4.63% |
VIP Freedom 2020 Portfolio - Service Class | -1.12% | 1.57% | 4.53% |
VIP Freedom 2020 Portfolio - Service Class 2 | -1.24% | 1.41% | 4.38% |
A From April 26, 2005.
$10,000 Over Life of Fund
Let's say hypothetically that $10,000 was invested in VIP Freedom 2020 Portfolio - Initial Class on April 26, 2005, when the fund started. The chart shows how the value of your investment would have changed, and also shows how the S&P 500 Index performed over the same period.
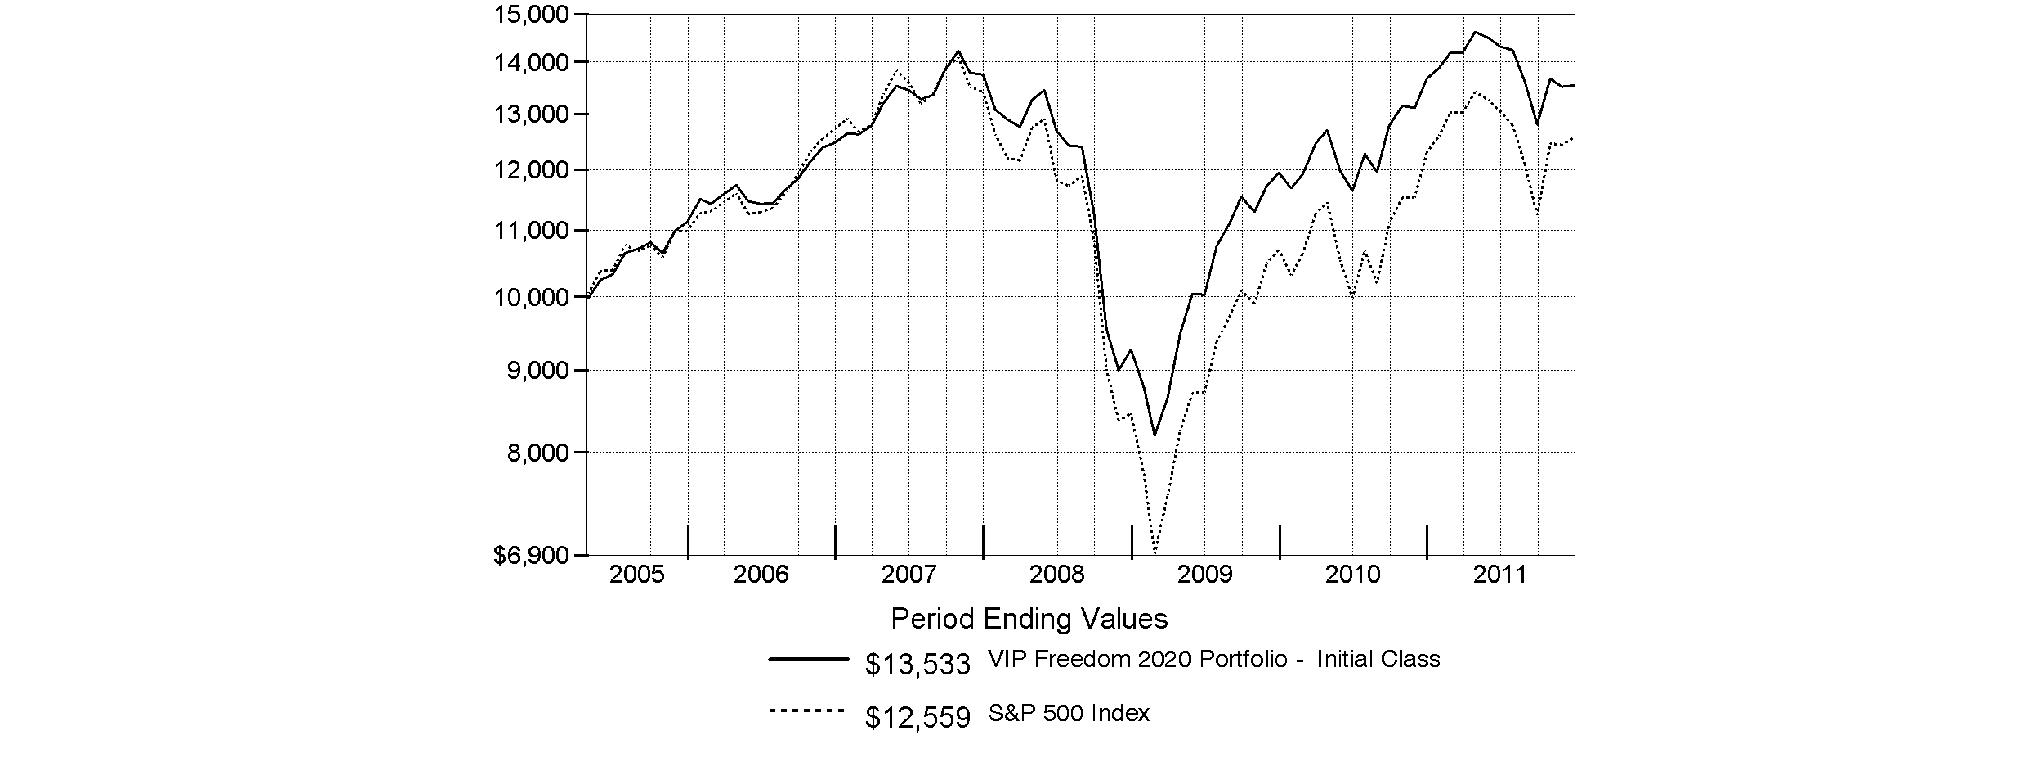
Annual Report
VIP Freedom 2025 Portfolio
Performance: The Bottom Line
Average annual total return reflects the change in the value of an investment, assuming reinvestment of the class' distributions from dividend income and capital gains (the profits earned upon the sale of securities that have grown in value, if any) and assuming a constant rate of performance each year. During periods of reimbursement by Fidelity, a fund's total return will be greater than it would be had the reimbursement not occurred. Performance numbers are net of all underlying fund operating expenses, but do not include any insurance charges imposed by your insurance company's separate account. If performance information included the effect of these additional charges, the total returns would have been lower. How a fund did yesterday is no guarantee of how it will do tomorrow.
Average Annual Total Returns
Periods ended December 31, 2011 | Past 1
year | Past 5
years | Life of
FundA |
VIP Freedom 2025 PortfolioSM - Initial Class | -2.11% | 1.41% | 4.64% |
VIP Freedom 2025 Portfolio - Service Class | -2.26% | 1.30% | 4.53% |
VIP Freedom 2025 Portfolio - Service Class 2 | -2.35% | 1.16% | 4.38% |
A From April 26, 2005.
$10,000 Over Life of Fund
Let's say hypothetically that $10,000 was invested in VIP Freedom 2025 Portfolio - Initial Class on April 26, 2005, when the fund started. The chart shows how the value of your investment would have changed, and also shows how the S&P 500 Index performed over the same period.
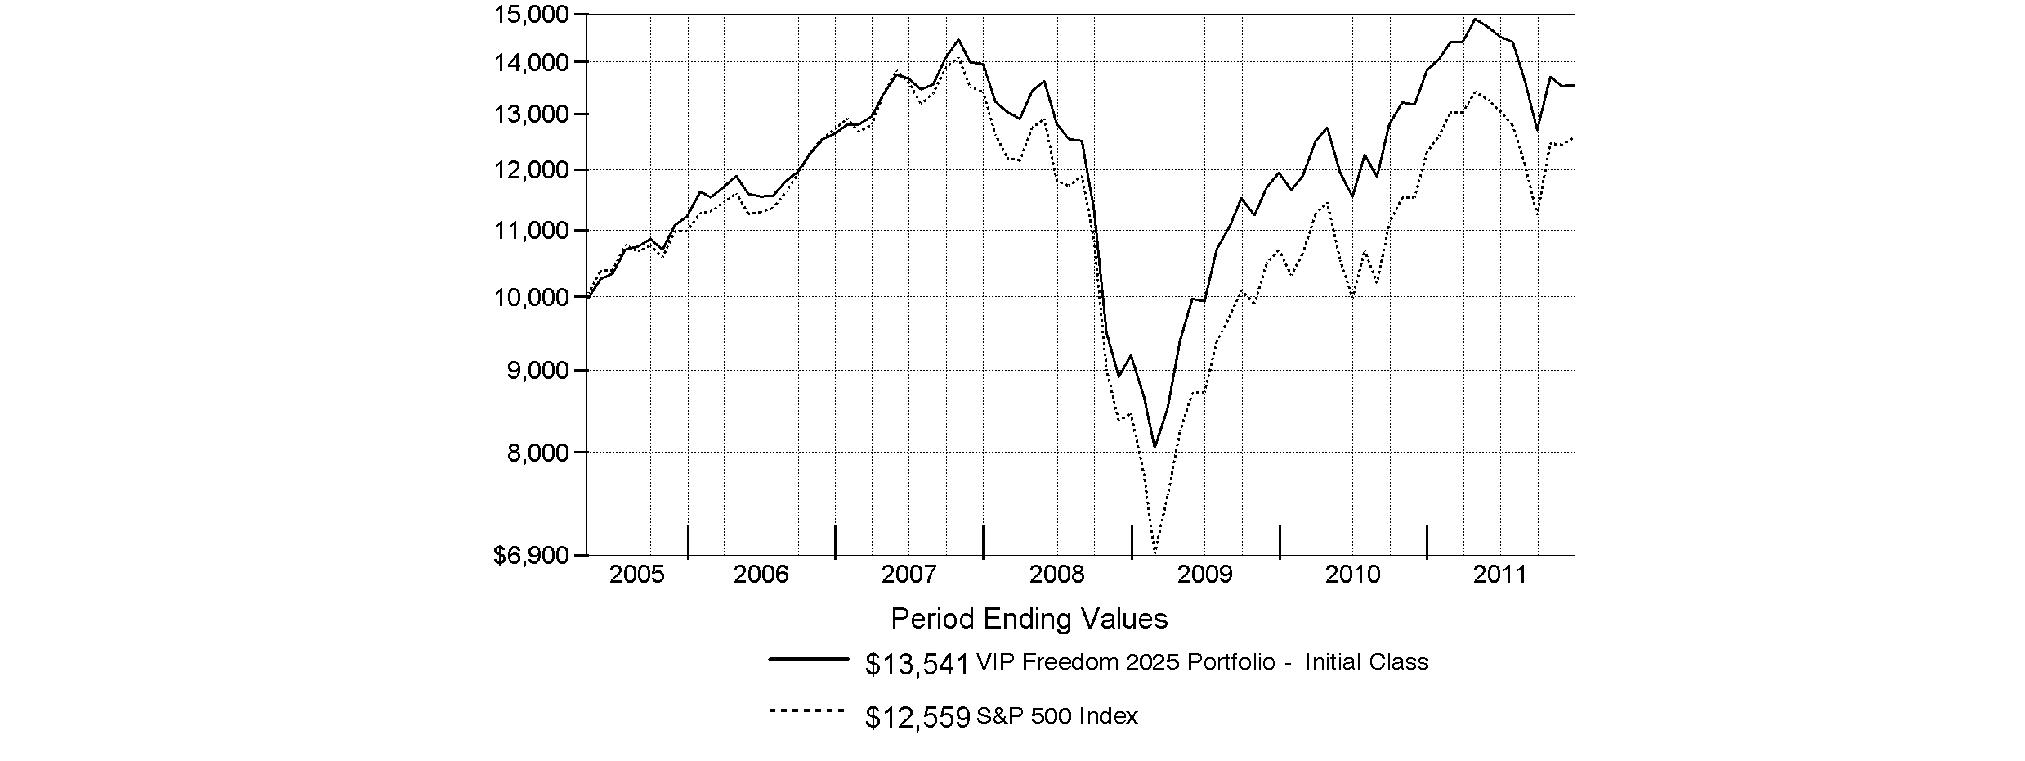
Annual Report
VIP Freedom 2030 Portfolio
Performance: The Bottom Line
Average annual total return reflects the change in the value of an investment, assuming reinvestment of the class' distributions from dividend income and capital gains (the profits earned upon the sale of securities that have grown in value, if any) and assuming a constant rate of performance each year. During periods of reimbursement by Fidelity, a fund's total return will be greater than it would be had the reimbursement not occurred. Performance numbers are net of all underlying fund operating expenses, but do not include any insurance charges imposed by your insurance company's separate account. If performance information included the effect of these additional charges, the total returns would have been lower. How a fund did yesterday is no guarantee of how it will do tomorrow.
Average Annual Total Returns
Periods ended December 31, 2011 | Past 1
year | Past 5
years | Life of
FundA |
VIP Freedom 2030 PortfolioSM - Initial Class | -2.60% | 0.54% | 4.22% |
VIP Freedom 2030 Portfolio - Service Class | -2.70% | 0.42% | 4.12% |
VIP Freedom 2030 Portfolio - Service Class 2 | -2.83% | 0.29% | 3.96% |
A From April 26, 2005.
$10,000 Over Life of Fund
Let's say hypothetically that $10,000 was invested in VIP Freedom 2030 Portfolio - Initial Class on April 26, 2005, when the fund started. The chart shows how the value of your investment would have changed, and also shows how the S&P 500 Index performed over the same period.
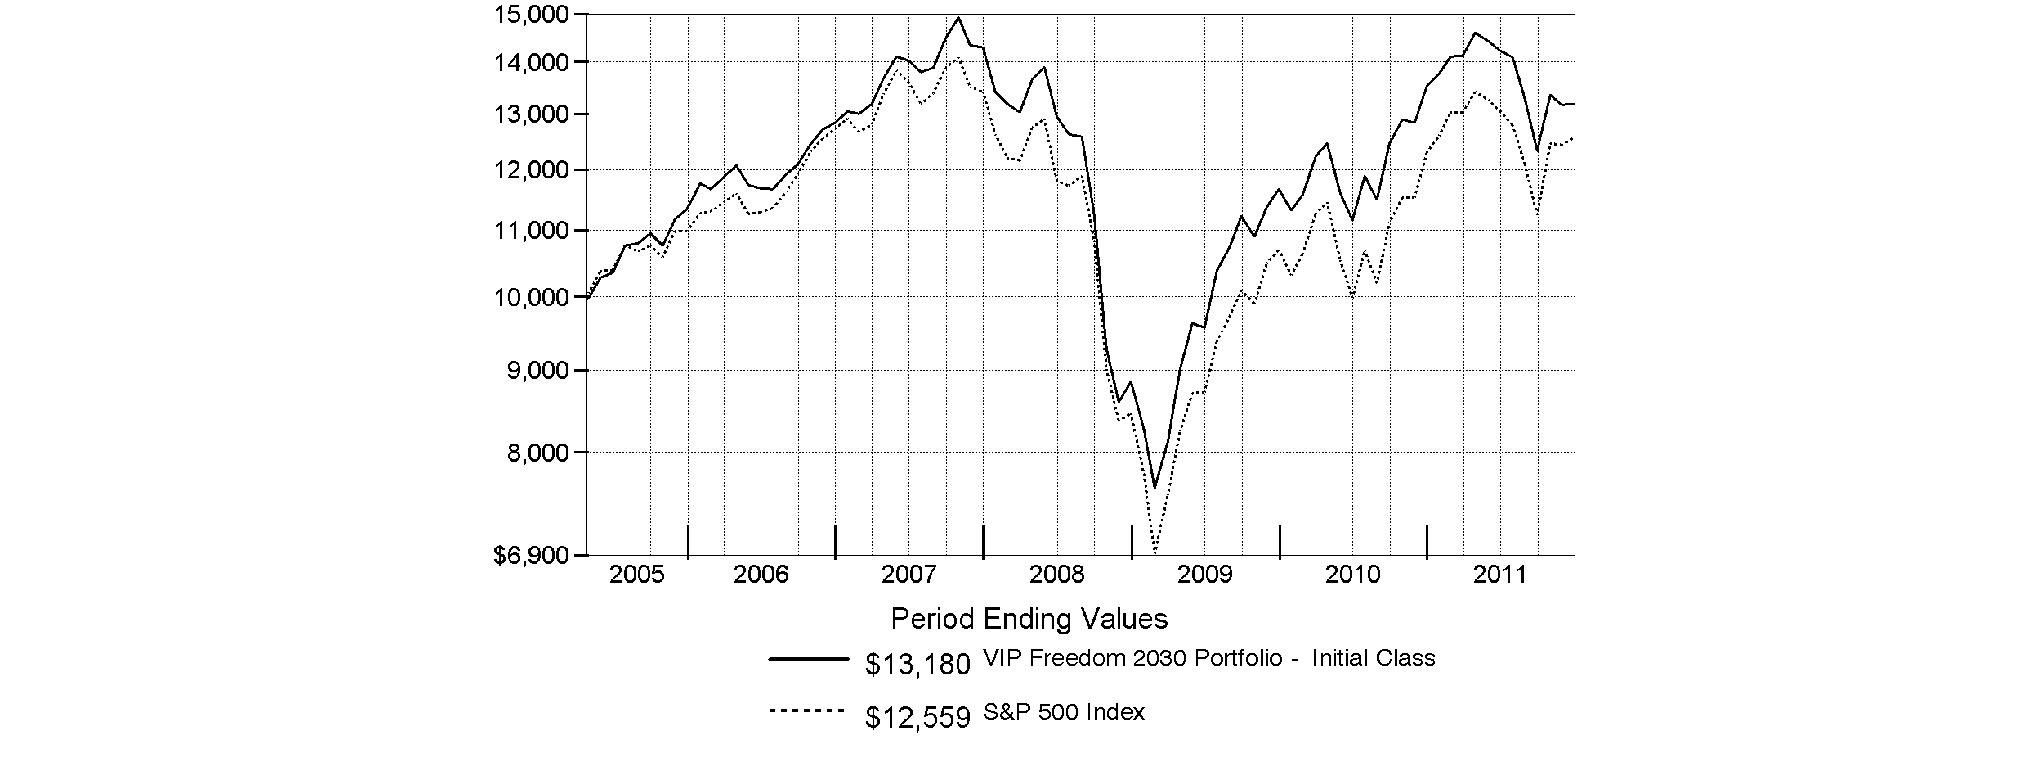
Annual Report
VIP Freedom 2035 Portfolio
Performance: The Bottom Line
Average annual total return reflects the change in the value of an investment, assuming reinvestment of the class' distributions from dividend income and capital gains (the profits earned upon the sale of securities that have grown in value, if any) and assuming a constant rate of performance each year. During periods of reimbursement by Fidelity, a fund's total return will be greater than it would be had the reimbursement not occurred. Performance numbers are net of all underlying fund operating expenses, but do not include any insurance charges imposed by your insurance company's separate account. If performance information included the effect of these additional charges, the total returns would have been lower. How a fund did yesterday is no guarantee of how it will do tomorrow.
Average Annual Total Returns
Periods ended December 31, 2011 | Past 1
year | Life of
FundA |
VIP Freedom 2035 PortfolioSM - Initial Class | -3.99% | 18.04% |
VIP Freedom 2035 Portfolio - Service Class | -4.10% | 17.92% |
VIP Freedom 2035 Portfolio - Service Class 2 | -4.25% | 17.73% |
A From April 8, 2009.
$10,000 Over Life of Fund
Let's say hypothetically that $10,000 was invested in VIP Freedom 2035 Portfolio - Initial Class on April 8, 2009, when the fund started. The chart shows how the value of your investment would have changed, and also shows how the S&P 500 Index performed over the same period.
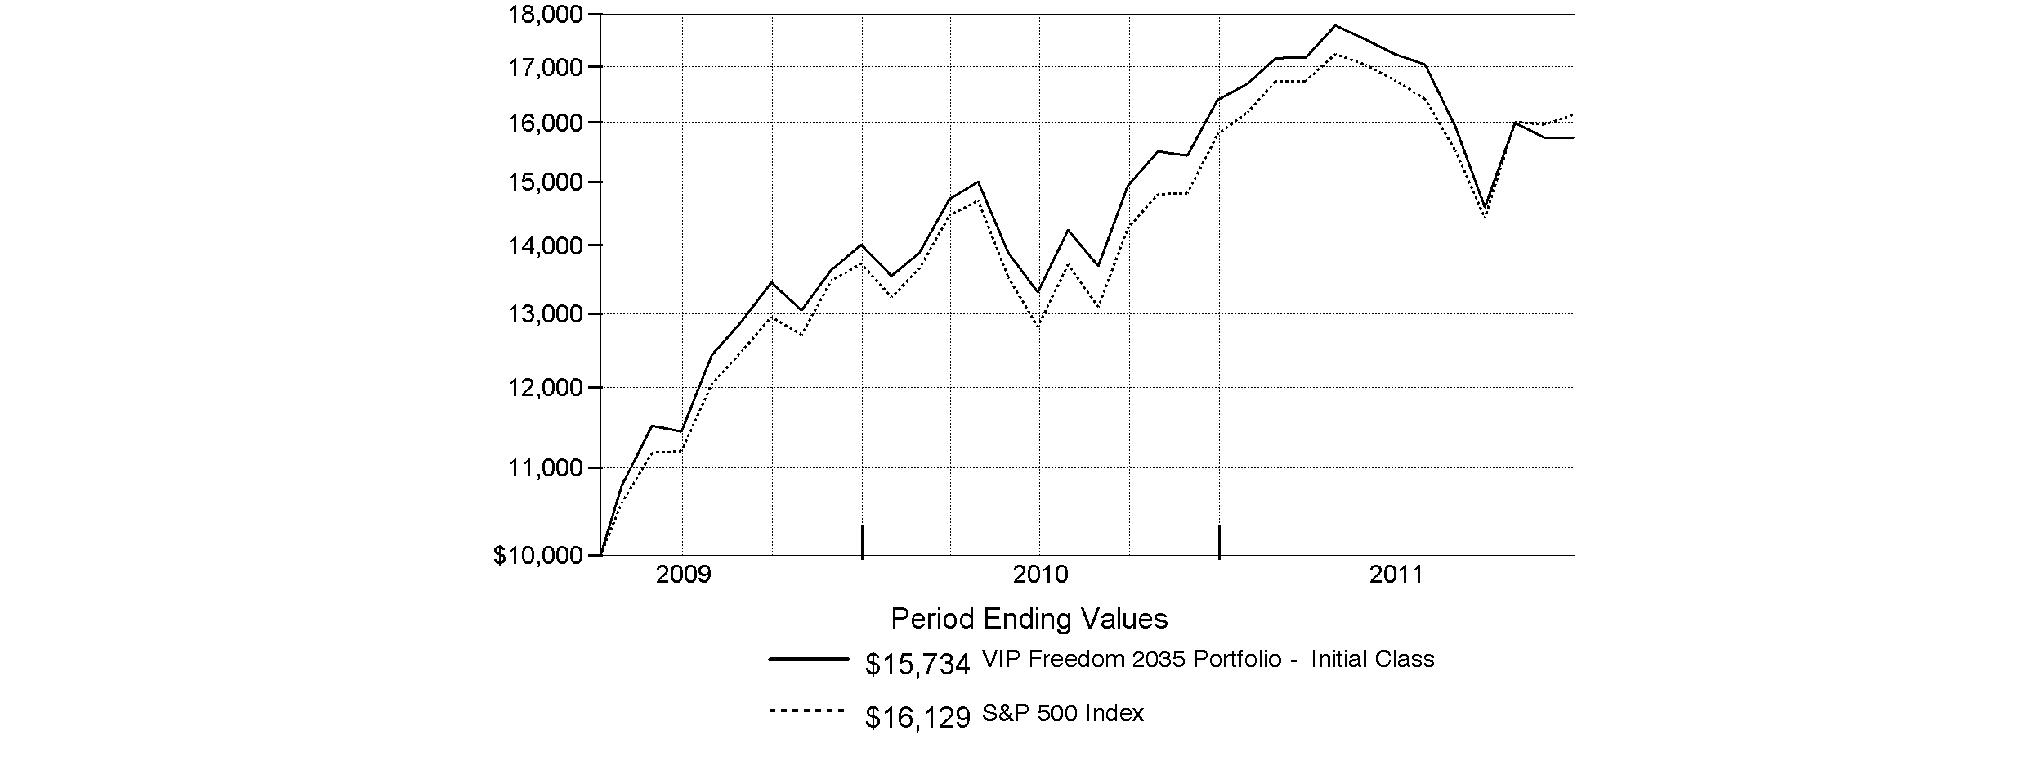
Annual Report
VIP Freedom 2040 Portfolio
Performance: The Bottom Line
Average annual total return reflects the change in the value of an investment, assuming reinvestment of the class' distributions from dividend income and capital gains (the profits earned upon the sale of securities that have grown in value, if any) and assuming a constant rate of performance each year. During periods of reimbursement by Fidelity, a fund's total return will be greater than it would be had the reimbursement not occurred. Performance numbers are net of all underlying fund operating expenses, but do not include any insurance charges imposed by your insurance company's separate account. If performance information included the effect of these additional charges, the total returns would have been lower. How a fund did yesterday is no guarantee of how it will do tomorrow.
Average Annual Total Returns
Periods ended December 31, 2011 | Past 1
year | Life of
FundA |
VIP Freedom 2040 PortfolioSM - Initial Class | -4.02% | 18.35% |
VIP Freedom 2040 Portfolio - Service Class | -4.17% | 18.21% |
VIP Freedom 2040 Portfolio - Service Class 2 | -4.32% | 18.05% |
A From April 8, 2009.
$10,000 Over Life of Fund
Let's say hypothetically that $10,000 was invested in VIP Freedom 2040 Portfolio - Initial Class on April 8, 2009, when the fund started. The chart shows how the value of your investment would have changed, and also shows how the S&P 500 Index performed over the same period.

Annual Report
VIP Freedom 2045 Portfolio
Performance: The Bottom Line
Average annual total return reflects the change in the value of an investment, assuming reinvestment of the class' distributions from dividend income and capital gains (the profits earned upon the sale of securities that have grown in value, if any) and assuming a constant rate of performance each year. During periods of reimbursement by Fidelity, a fund's total return will be greater than it would be had the reimbursement not occurred. Performance numbers are net of all underlying fund operating expenses, but do not include any insurance charges imposed by your insurance company's separate account. If performance information included the effect of these additional charges, the total returns would have been lower. How a fund did yesterday is no guarantee of how it will do tomorrow.
Average Annual Total Returns
Periods ended December 31, 2011 | Past 1
year | Life of
FundA |
VIP Freedom 2045 PortfolioSM - Initial Class | -4.41% | 18.37% |
VIP Freedom 2045 Portfolio - Service Class | -4.52% | 18.24% |
VIP Freedom 2045 Portfolio - Service Class 2 | -4.64% | 18.08% |
A From April 8, 2009.
$10,000 Over Life of Fund
Let's say hypothetically that $10,000 was invested in VIP Freedom 2045 Portfolio - Initial Class on April 8, 2009, when the fund started. The chart shows how the value of your investment would have changed, and also shows how the S&P 500 Index performed over the same period.

Annual Report
VIP Freedom 2050 Portfolio
Performance: The Bottom Line
Average annual total return reflects the change in the value of an investment, assuming reinvestment of the class' distributions from dividend income and capital gains (the profits earned upon the sale of securities that have grown in value, if any) and assuming a constant rate of performance each year. During periods of reimbursement by Fidelity, a fund's total return will be greater than it would be had the reimbursement not occurred. Performance numbers are net of all underlying fund operating expenses, but do not include any insurance charges imposed by your insurance company's separate account. If performance information included the effect of these additional charges, the total returns would have been lower. How a fund did yesterday is no guarantee of how it will do tomorrow.
Average Annual Total Returns
Periods ended December 31, 2011 | Past 1
year | Life of
FundA |
VIP Freedom 2050 PortfolioSM - Initial Class | -4.93% | 18.64% |
VIP Freedom 2050 Portfolio - Service Class | -5.06% | 18.51% |
VIP Freedom 2050 Portfolio - Service Class 2 | -5.16% | 18.33% |
A From April 8, 2009.
$10,000 Over Life of Fund
Let's say hypothetically that $10,000 was invested in VIP Freedom 2050 Portfolio - Initial Class on April 8, 2009, when the fund started. The chart shows how the value of your investment would have changed, and also shows how the S&P 500 Index performed over the same period.
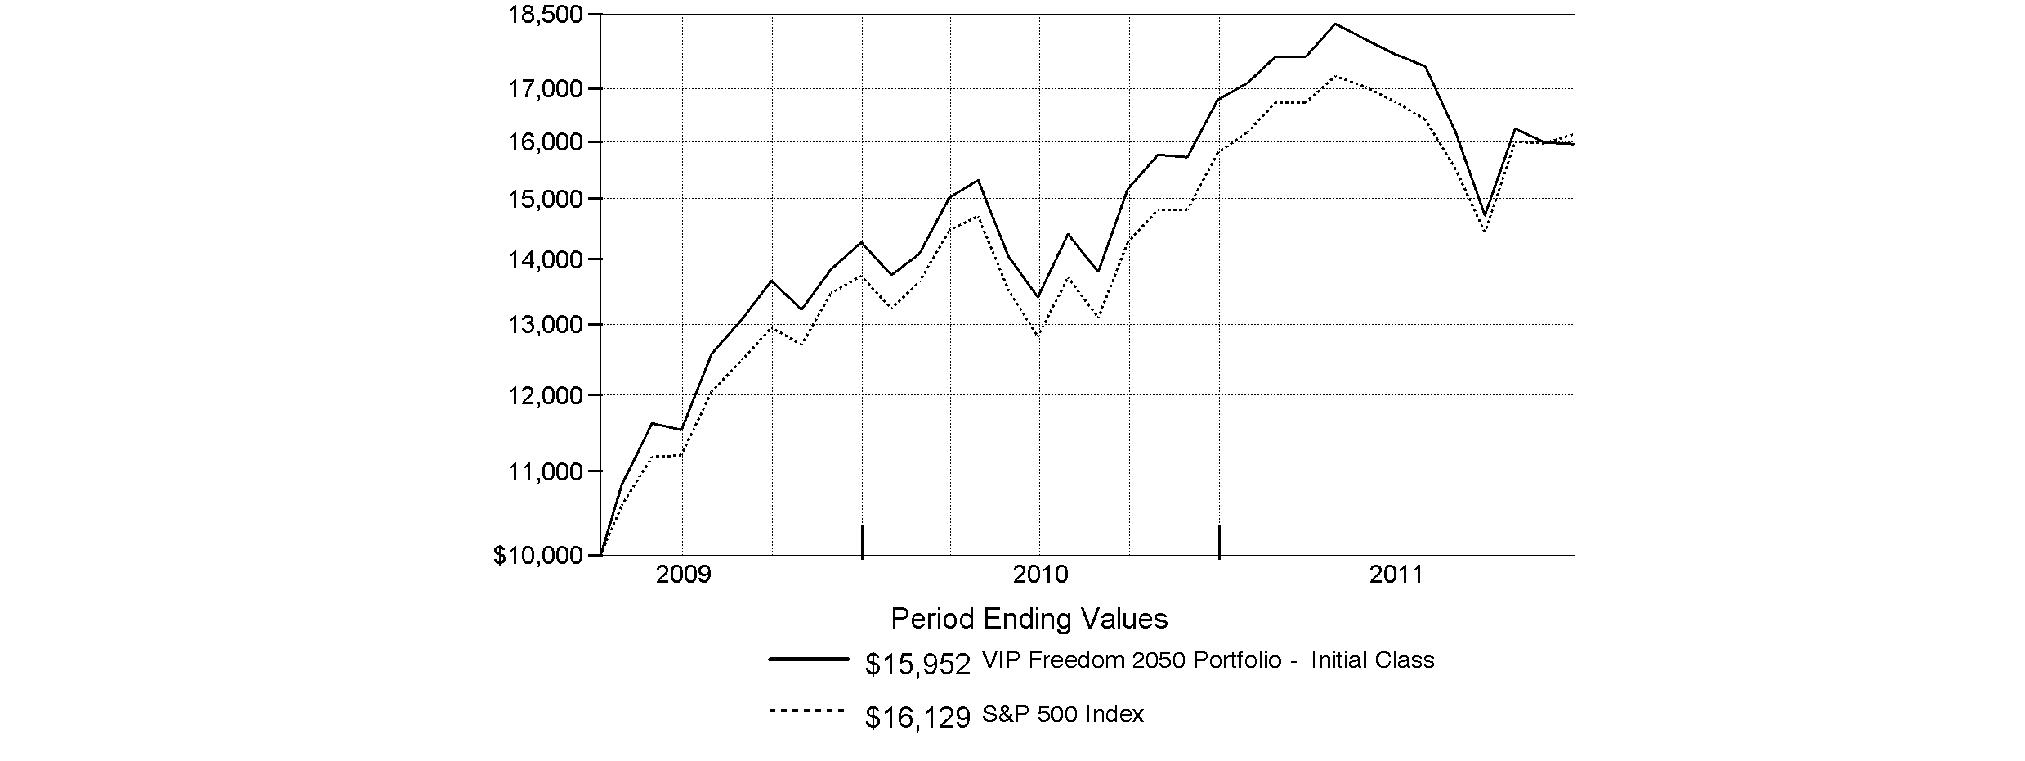
Annual Report
Market Recap: Extreme market volatility took center stage during the 12 months ending December 31, 2011, stealing the spotlight from signs of progress in the global economy. Early in the year, aggressive monetary stimulus by the U.S. federal government, improving credit-market conditions and solid corporate earnings buoyed most major asset classes. As the period progressed, however, fresh worries about sovereign debt in Europe, inflation in China, gridlock over raising the debt ceiling in the U.S. - along with Standard & Poor's early-August downgrade of the nation's long-term sovereign credit rating - and a dimmed outlook for global growth punctured investor confidence and ignited market instability. Domestic equities, as measured by the broad-based S&P 500® Index, gained 2.11%, easily outpaced the 13.61% decline of MSCI® ACWI® (All Country World Index) ex USA Index, a proxy for foreign stocks. Within the MSCI index, emerging markets declined the most (-18%), with investments here generally held back by a stronger U.S. dollar. The U.K. (-3%) fared better than the rest of Europe (-15%), which was the second-worst-performing index component. Bolstered by periodic flights to quality, U.S. investment-grade bonds posted a 7.84% advance, as reflected by the Barclays Capital® U.S. Aggregate Bond Index, outperforming the 4.37% gain of high-yield securities, as represented by The BofA Merrill LynchSM US High Yield Constrained Index. Hampered by financial woes in Europe, the sovereign debt of major developed markets outside the U.S. rose 4.86%, according to the Citigroup® Non-USD Group-of-Seven (G7) Equal Weighted Index, while the JPMorgan Emerging Markets Bond Index Global (EMBI Global) advanced 8.46%, despite the currency head wind.
Comments from Christopher Sharpe, Co-Portfolio Manager of VIP Freedom Funds, and Andrew Dierdorf, who became Co-Portfolio Manager on June 21, 2011: For the year ending December 31, 2011, only the two shortest-dated, most-conservative Funds - VIP Freedom Income Fund and VIP Freedom 2005 Fund - delivered a positive absolute return. VIP Freedom Income Fund performed best, buoyed by its higher allocation to investment-grade bonds, which did very well during the year. In contrast, the more-equity-focused Funds declined. VIP Freedom 2030 Fund, which has the highest allocation to U.S. and non-U.S. equities, saw the biggest decline. (For specific Fund results, please refer to the performance section of this report.) As volatility picked up throughout the year, returns for equities seesawed. The Funds' underlying equity funds - both U.S. and non-U.S. - also struggled to deliver positive results and keep pace with their respective benchmark indexes, due to unfavorable security selection overall. In aggregate, the Funds' U.S. equity asset class underperformed the Dow Jones U.S. Total Stock Market IndexSM, which rose 1.08% for the one-year period. Turning to the Funds' non-U.S. holdings, VIP Overseas Portfolio and VIP Emerging Markets Portfolio each experienced a double-digit decline. While financial woes across Europe plagued stocks globally, holding back the performance of VIP Overseas Portfolio, monetary tightening and signs of an economic slowdown in China, India and other developing countries presented head winds for emerging-markets stocks. In aggregate, the non-U.S. equity asset class lagged the MSCI® EAFE® (Europe, Australasia, Far East) Index, which fell 12.04%. With headline events and disappointing U.S. economic data - such as continued high levels of unemployment and a stagnant housing market - taking their toll on the equity markets, investors shifted their focus to higher-quality bonds, especially U.S. Treasuries. The performance of VIP Investment Grade Bond Portfolio fell just short of the Barclays Capital® U.S. Aggregate Bond Index, and the Funds' high-yield debt allocation to VIP High Income Portfolio underperformed by an even greater degree. As a result, the Funds' bond asset class, in aggregate, detracted from overall results. Lastly, representing the Funds' short-term debt asset class, VIP Money Market Portfolio performed on par with the Barclays Capital U.S. 3 Month Treasury Bellwether Index, which increased 0.11%.
The views expressed above reflect those of the portfolio manager(s) only through the end of the period as stated on the cover of this report and do not necessarily represent the views of Fidelity or any other person in the Fidelity organization. Any such views are subject to change at any time based upon market or other conditions and Fidelity disclaims any responsibility to update such views. These views may not be relied on as investment advice and, because investment decisions for a Fidelity fund are based on numerous factors, may not be relied on as an indication of trading intent on behalf of any Fidelity fund.
Annual Report
As a shareholder of a Fund, you incur two types of costs: (1) transaction costs, and (2) ongoing costs, including distribution and/or service (12b-1) fees and other Fund expenses. This Example is intended to help you understand your ongoing costs (in dollars) of investing in the Funds and to compare these costs with the ongoing costs of investing in other mutual funds.
The Example is based on an investment of $1,000 invested at the beginning of the period and held for the entire period (July 1, 2011 to December 31, 2011).
Actual Expenses
The first line of the accompanying table for each class of each fund provides information about actual account values and actual expenses. You may use the information in this line, together with the amount you invested, to estimate the expenses that you paid over the period. Simply divide your account value by $1,000.00 (for example, an $8,600 account value divided by $1,000.00 = 8.6), then multiply the result by the number in the first line for a class of the fund under the heading entitled "Expenses Paid During Period" to estimate the expenses you paid on your account during this period. The estimate of expenses does not include any fees or other expenses of any variable annuity or variable life insurance product. If they were, the estimate of expenses you paid during the period would be higher, and your ending account value would be lower. In addition, each Fund, as a shareholder in underlying Fidelity Funds, will indirectly bear its pro-rata share of the fees and expenses incurred by the underlying Fidelity Funds. These fees and expenses are not included in each Fund's annualized expense ratio used to calculate the expense estimates in the table below.
Hypothetical Example for Comparison Purposes
The second line of the accompanying table for each class of each fund provides information about hypothetical account values and hypothetical expenses based on a Class' actual expense ratio and an assumed rate of return of 5% per year before expenses, which is not the Class' actual return. The hypothetical account values and expenses may not be used to estimate the actual ending account balance or expenses you paid for the period. You may use this information to compare the ongoing costs of investing in the Fund and other funds. To do so, compare this 5% hypothetical example with the 5% hypothetical examples that appear in the shareholder reports of the other funds. The estimate of expenses does not include any fees or other expenses of any variable annuity or variable life insurance product. If they were, the estimate of expenses you paid during the period would be higher, and your ending account value would be lower. In addition, each Fund, as a shareholder in underlying Fidelity Funds, will indirectly bear its pro-rata share of the fees and expenses incurred by the underlying Fidelity Funds. These fees and expenses are not included in each Fund's annualized expense ratio used to calculate the expense estimates in the table below.
Please note that the expenses shown in the table are meant to highlight your ongoing costs only and do not reflect any transaction costs. Therefore, the second line of the table is useful in comparing ongoing costs only, and will not help you determine the relative total costs of owning different funds.
| Annualized
Expense Ratio | Beginning
Account Value
July 1, 2011 | Ending
Account Value
December 31, 2011 | Expenses Paid
During Period*
July 1, 2011 to
December 31, 2011 |
VIP Freedom Income | | | | |
Initial Class | .00% | | | |
Actual | | $ 1,000.00 | $ 991.20 | $ .00 |
HypotheticalA | | $ 1,000.00 | $ 1,025.21 | $ .00 |
Service Class | .10% | | | |
Actual | | $ 1,000.00 | $ 991.50 | $ .50 |
HypotheticalA | | $ 1,000.00 | $ 1,024.70 | $ .51 |
Service Class 2 | .25% | | | |
Actual | | $ 1,000.00 | $ 990.70 | $ 1.25 |
HypotheticalA | | $ 1,000.00 | $ 1,023.95 | $ 1.28 |
VIP Freedom 2005 | | | | |
Initial Class | .00% | | | |
Actual | | $ 1,000.00 | $ 967.20 | $ .00 |
HypotheticalA | | $ 1,000.00 | $ 1,025.21 | $ .00 |
Service Class | .10% | | | |
Actual | | $ 1,000.00 | $ 966.10 | $ .50 |
HypotheticalA | | $ 1,000.00 | $ 1,024.70 | $ .51 |
Service Class 2 | .25% | | | |
Actual | | $ 1,000.00 | $ 965.60 | $ 1.24 |
HypotheticalA | | $ 1,000.00 | $ 1,023.95 | $ 1.28 |
| Annualized
Expense Ratio | Beginning
Account Value
July 1, 2011 | Ending
Account Value
December 31, 2011 | Expenses Paid
During Period*
July 1, 2011 to
December 31, 2011 |
VIP Freedom 2010 | | | | |
Initial Class | .00% | | | |
Actual | | $ 1,000.00 | $ 959.70 | $ .00 |
HypotheticalA | | $ 1,000.00 | $ 1,025.21 | $ .00 |
Service Class | .10% | | | |
Actual | | $ 1,000.00 | $ 958.70 | $ .49 |
HypotheticalA | | $ 1,000.00 | $ 1,024.70 | $ .51 |
Service Class 2 | .25% | | | |
Actual | | $ 1,000.00 | $ 958.10 | $ 1.23 |
HypotheticalA | | $ 1,000.00 | $ 1,023.95 | $ 1.28 |
VIP Freedom 2015 | | | | |
Initial Class | .00% | | | |
Actual | | $ 1,000.00 | $ 957.10 | $ .00 |
HypotheticalA | | $ 1,000.00 | $ 1,025.21 | $ .00 |
Service Class | .10% | | | |
Actual | | $ 1,000.00 | $ 956.50 | $ .49 |
HypotheticalA | | $ 1,000.00 | $ 1,024.70 | $ .51 |
Service Class 2 | .25% | | | |
Actual | | $ 1,000.00 | $ 956.20 | $ 1.23 |
HypotheticalA | | $ 1,000.00 | $ 1,023.95 | $ 1.28 |
VIP Freedom 2020 | | | | |
Initial Class | .00% | | | |
Actual | | $ 1,000.00 | $ 945.90 | $ .00 |
HypotheticalA | | $ 1,000.00 | $ 1,025.21 | $ .00 |
Service Class | .10% | | | |
Actual | | $ 1,000.00 | $ 945.80 | $ .49 |
HypotheticalA | | $ 1,000.00 | $ 1,024.70 | $ .51 |
Service Class 2 | .25% | | | |
Actual | | $ 1,000.00 | $ 945.50 | $ 1.23 |
HypotheticalA | | $ 1,000.00 | $ 1,023.95 | $ 1.28 |
VIP Freedom 2025 | | | | |
Initial Class | .00% | | | |
Actual | | $ 1,000.00 | $ 932.70 | $ .00 |
HypotheticalA | | $ 1,000.00 | $ 1,025.21 | $ .00 |
Service Class | .10% | | | |
Actual | | $ 1,000.00 | $ 932.10 | $ .49 |
HypotheticalA | | $ 1,000.00 | $ 1,024.70 | $ .51 |
Service Class 2 | .25% | | | |
Actual | | $ 1,000.00 | $ 931.90 | $ 1.22 |
HypotheticalA | | $ 1,000.00 | $ 1,023.95 | $ 1.28 |
VIP Freedom 2030 | | | | |
Initial Class | .00% | | | |
Actual | | $ 1,000.00 | $ 926.80 | $ .00 |
HypotheticalA | | $ 1,000.00 | $ 1,025.21 | $ .00 |
Service Class | .10% | | | |
Actual | | $ 1,000.00 | $ 926.70 | $ .49 |
HypotheticalA | | $ 1,000.00 | $ 1,024.70 | $ .51 |
Service Class 2 | .25% | | | |
Actual | | $ 1,000.00 | $ 926.20 | $ 1.21 |
HypotheticalA | | $ 1,000.00 | $ 1,023.95 | $ 1.28 |
| Annualized
Expense Ratio | Beginning
Account Value
July 1, 2011 | Ending
Account Value
December 31, 2011 | Expenses Paid
During Period*
July 1, 2011 to
December 31, 2011 |
VIP Freedom 2035 | | | | |
Initial Class | .00% | | | |
Actual | | $ 1,000.00 | $ 913.00 | $ .00 |
HypotheticalA | | $ 1,000.00 | $ 1,025.21 | $ .00 |
Service Class | .10% | | | |
Actual | | $ 1,000.00 | $ 912.00 | $ .48 |
HypotheticalA | | $ 1,000.00 | $ 1,024.70 | $ .51 |
Service Class 2 | .25% | | | |
Actual | | $ 1,000.00 | $ 911.10 | $ 1.20 |
HypotheticalA | | $ 1,000.00 | $ 1,023.95 | $ 1.28 |
VIP Freedom 2040 | | | | |
Initial Class | .00% | | | |
Actual | | $ 1,000.00 | $ 911.60 | $ .00 |
HypotheticalA | | $ 1,000.00 | $ 1,025.21 | $ .00 |
Service Class | .10% | | | |
Actual | | $ 1,000.00 | $ 910.90 | $ .48 |
HypotheticalA | | $ 1,000.00 | $ 1,024.70 | $ .51 |
Service Class 2 | .25% | | | |
Actual | | $ 1,000.00 | $ 910.70 | $ 1.20 |
HypotheticalA | | $ 1,000.00 | $ 1,023.95 | $ 1.28 |
VIP Freedom 2045 | | | | |
Initial Class | .00% | | | |
Actual | | $ 1,000.00 | $ 907.70 | $ .00 |
HypotheticalA | | $ 1,000.00 | $ 1,025.21 | $ .00 |
Service Class | .10% | | | |
Actual | | $ 1,000.00 | $ 907.20 | $ .48 |
HypotheticalA | | $ 1,000.00 | $ 1,024.70 | $ .51 |
Service Class 2 | .25% | | | |
Actual | | $ 1,000.00 | $ 906.60 | $ 1.20 |
HypotheticalA | | $ 1,000.00 | $ 1,023.95 | $ 1.28 |
VIP Freedom 2050 | | | | |
Initial Class | .00% | | | |
Actual | | $ 1,000.00 | $ 902.70 | $ .00 |
HypotheticalA | | $ 1,000.00 | $ 1,025.21 | $ .00 |
Service Class | .10% | | | |
Actual | | $ 1,000.00 | $ 901.50 | $ .48 |
HypotheticalA | | $ 1,000.00 | $ 1,024.70 | $ .51 |
Service Class 2 | .25% | | | |
Actual | | $ 1,000.00 | $ 901.10 | $ 1.20 |
HypotheticalA | | $ 1,000.00 | $ 1,023.95 | $ 1.28 |
A 5% return per year before expenses
* Expenses are equal to each Class' annualized expense ratio, multiplied by the average account value over the period, multiplied by 184/ 365 (to reflect the one-half year period). The fees and expenses of the underlying Fidelity Funds in which the Fund invests are not included in each class' annualized expense ratio.
Annual Report
VIP Freedom Income Portfolio
Investment Changes (Unaudited)
Fund Holdings as of December 31, 2011 |
| % of fund's
net assets | % of fund's net assets
6 months ago |
Domestic Equity Funds | | |
VIP Contrafund Portfolio Initial Class | 2.3 | 2.4 |
VIP Equity-Income Portfolio Initial Class | 2.8 | 2.8 |
VIP Growth & Income Portfolio Initial Class | 2.8 | 2.8 |
VIP Growth Portfolio Initial Class | 2.7 | 2.9 |
VIP Mid Cap Portfolio Initial Class | 1.0 | 1.0 |
VIP Value Portfolio Initial Class | 2.4 | 2.4 |
VIP Value Strategies Portfolio Initial Class | 1.0 | 1.0 |
| 15.0 | 15.3 |
Developed International Equity Funds | | |
VIP Overseas Portfolio Initial Class | 4.1 | 4.5 |
Emerging Markets Equity Funds | | |
VIP Emerging Markets Portfolio Initial Class | 1.0 | 0.8 |
High Yield Bond Funds | | |
VIP High Income Portfolio Initial Class | 5.1 | 5.0 |
Investment Grade Bond Funds | | |
VIP Investment Grade Bond Portfolio Initial Class | 35.3 | 34.7 |
Short-Term Funds | | |
VIP Money Market Portfolio Initial Class | 39.5 | 39.8 |
Net Other Assets (Liabilities) | 0.0* | (0.1) |
| 100.0 | 100.0 |
* Amount represents less than 0.1% |
Asset Allocation (% of fund's net assets) |
Current |
 | Domestic Equity Funds | 15.0% | |
 | Developed International Equity Funds | 4.1% | |
 | Emerging Markets Equity Funds | 1.0% | |
 | High Yield Bond Funds | 5.1% | |
 | Investment Grade Bond Funds | 35.3% | |
 | Short-Term Funds | 39.5% | |

Six months ago |
| Domestic Equity Funds | 15.3% | |
| Developed International Equity Funds | 4.5% | |
| Emerging Markets Equity Funds | 0.8% | |
 | High Yield Bond Funds | 5.0% | |
| Investment Grade Bond Funds | 34.7% | |
| Short-Term Funds | 39.8% | |
 | Net Other Assets † | (0.1)% | |

Expected |
| Domestic Equity Funds | 14.6% | |
| Developed International Equity Funds | 4.6% | |
| Emerging Markets Equity Funds | 0.8% | |
| High Yield Bond Funds | 5.0% | |
| Investment Grade Bond Funds | 35.0% | |
| Short-Term Funds | 40.0% | |

The six months ago allocation is based on the fund's holdings as of June 30, 2011. The current allocation is based on the fund's holdings as of December 31, 2011. The expected allocation represents the fund's anticipated allocation at June 30, 2012. |
† Net Other Assets are not included in the pie chart. |
Annual Report
VIP Freedom Income Portfolio
Investments December 31, 2011
Showing Percentage of Net Assets
Domestic Equity Funds - 15.0% |
| Shares | | Value |
Domestic Equity Funds - 15.0% |
VIP Contrafund Portfolio Initial Class | 21,477 | | $ 494,405 |
VIP Equity-Income Portfolio Initial Class | 31,611 | | 590,805 |
VIP Growth & Income Portfolio Initial Class | 47,244 | | 594,797 |
VIP Growth Portfolio Initial Class | 15,562 | | 574,097 |
VIP Mid Cap Portfolio Initial Class | 6,818 | | 198,253 |
VIP Value Portfolio Initial Class | 48,006 | | 508,862 |
VIP Value Strategies Portfolio Initial Class | 23,658 | | 207,714 |
TOTAL DOMESTIC EQUITY FUNDS (Cost $3,572,399) |
3,168,933
|
International Equity Funds - 5.1% |
| | | |
Developed International Equity Funds - 4.1% |
VIP Overseas Portfolio Initial Class | 62,995 | | 858,617 |
Emerging Markets Equity Funds - 1.0% |
VIP Emerging Markets Portfolio Initial Class | 28,552 | | 220,990 |
TOTAL INTERNATIONAL EQUITY FUNDS (Cost $1,144,076) |
1,079,607
|
Bond Funds - 40.4% |
| Shares | | Value |
High Yield Bond Funds - 5.1% |
VIP High Income Portfolio Initial Class | 202,737 | | $ 1,092,753 |
Investment Grade Bond Funds - 35.3% |
VIP Investment Grade Bond Portfolio Initial Class | 576,162 | | 7,472,820 |
TOTAL BOND FUNDS (Cost $8,403,359) |
8,565,573
|
Short-Term Funds - 39.5% |
| | | |
VIP Money Market Portfolio Initial Class
(Cost $8,361,572) | 8,361,572 | |
8,361,572
|
TOTAL INVESTMENT PORTFOLIO - 100.0% (Cost $21,481,406) | | 21,175,685 |
NET OTHER ASSETS (LIABILITIES) - 0.0% | | (2,079) |
NET ASSETS - 100% | $ 21,173,606 |
Other Information |
All investments are categorized as Level 1 under the Fair Value Hierarchy. The inputs or methodology used for valuing securities may not be an indication of the risk associated with investing in those securities. For more information on valuation inputs, please refer to the Security Valuation section in the accompanying Notes to Financial Statements. |
See accompanying notes which are an integral part of the financial statements.
Annual Report
VIP Freedom Income Portfolio
Statement of Assets and Liabilities
| December 31, 2011 |
| | |
Assets | | |
Investment in securities, at value (cost $21,481,406) - See accompanying schedule | | $ 21,175,685 |
Cash | | 3,775 |
Receivable for investments sold | | 99,929 |
Receivable for fund shares sold | | 364,829 |
Total assets | | 21,644,218 |
| | |
Liabilities | | |
Payable for investments purchased | $ 367,256 | |
Payable for fund shares redeemed | 101,541 | |
Distribution and service plan fees payable | 1,815 | |
Total liabilities | | 470,612 |
| | |
Net Assets | | $ 21,173,606 |
Net Assets consist of: | | |
Paid in capital | | $ 21,474,267 |
Undistributed net investment income | | 537 |
Accumulated undistributed net realized gain (loss) on investments | | 4,523 |
Net unrealized appreciation (depreciation) on investments | | (305,721) |
Net Assets | | $ 21,173,606 |
Statement of Assets and Liabilities - continued
| December 31, 2011 |
| | |
Initial Class:
Net Asset Value, offering price and redemption price per share ($10,937,521 ÷ 1,071,396 shares) | | $ 10.21 |
| | |
Service Class:
Net Asset Value, offering price and redemption price per share ($2,505,447 ÷ 245,242 shares) | | $ 10.22 |
| | |
Service Class 2:
Net Asset Value, offering price and redemption price per share ($7,730,638 ÷ 759,720 shares) | | $ 10.18 |
See accompanying notes which are an integral part of the financial statements.
Annual Report
VIP Freedom Income Portfolio
Financial Statements - continued
Statement of Operations
| Year ended December 31, 2011 |
| | |
Investment Income | | |
Income distributions from underlying funds | | $ 378,641 |
| | |
Expenses | | |
Distribution and service plan fees | $ 20,493 | |
Independent trustees' compensation | 73 | |
Total expenses before reductions | 20,566 | |
Expense reductions | (73) | 20,493 |
Net investment income (loss) | | 358,148 |
Realized and Unrealized Gain (Loss) Realized gain (loss) on sale of underlying fund shares | 1,156 | |
Capital gain distributions from underlying funds | 183,072 | |
Total net realized gain (loss) | | 184,228 |
Change in net unrealized appreciation (depreciation) on underlying funds | | (299,503) |
Net gain (loss) | | (115,275) |
Net increase (decrease) in net assets resulting from operations | | $ 242,873 |
Statement of Changes in Net Assets
| Year ended
December 31,
2011 | Year ended
December 31,
2010 |
Increase (Decrease) in Net Assets | | |
Operations | | |
Net investment income (loss) | $ 358,148 | $ 324,248 |
Net realized gain (loss) | 184,228 | 453,688 |
Change in net unrealized appreciation (depreciation) | (299,503) | 547,661 |
Net increase (decrease) in net assets resulting from operations | 242,873 | 1,325,597 |
Distributions to shareholders from net investment income | (357,612) | (329,236) |
Distributions to shareholders from net realized gain | (78,451) | (476,604) |
Total distributions | (436,063) | (805,840) |
Share transactions - net increase (decrease) | 2,716,306 | (1,464,915) |
Total increase (decrease) in net assets | 2,523,116 | (945,158) |
| | |
Net Assets | | |
Beginning of period | 18,650,490 | 19,595,648 |
End of period (including undistributed net investment income of $537 and undistributed net investment income of $0, respectively) | $ 21,173,606 | $ 18,650,490 |
See accompanying notes which are an integral part of the financial statements.
Annual Report
Financial Highlights - Initial Class
Years ended December 31, | 2011 | 2010 | 2009 | 2008 | 2007 |
Selected Per-Share Data | | | | | |
Net asset value, beginning of period | $ 10.27 | $ 10.00 | $ 9.14 | $ 10.80 | $ 10.71 |
Income from Investment Operations | | | | | |
Net investment income (loss) C | .19 | .19 | .39 | .36 | .43 |
Net realized and unrealized gain (loss) | (.02) | .56 | .96 | (1.48) | .22 |
Total from investment operations | .17 | .75 | 1.35 | (1.12) | .65 |
Distributions from net investment income | (.19) | (.20) | (.35) | (.37) | (.44) |
Distributions from net realized gain | (.04) | (.28) | (.15) | (.17) | (.12) |
Total distributions | (.23) | (.48) | (.49) G | (.54) | (.56) |
Net asset value, end of period | $ 10.21 | $ 10.27 | $ 10.00 | $ 9.14 | $ 10.80 |
Total Return A, B | 1.63% | 7.49% | 14.95% | (10.45)% | 6.10% |
Ratios to Average Net Assets D, F | | | | | |
Expenses before reductions E | .00% | .00% | .00% | .00% | .00% |
Expenses net of fee waivers, if any | .00% | .00% | .00% | .00% | .00% |
Expenses net of all reductions | .00% | .00% | .00% | .00% | .00% |
Net investment income (loss) | 1.85% | 1.88% | 4.00% | 3.50% | 3.93% |
Supplemental Data | | | | | |
Net assets, end of period (000 omitted) | $ 10,938 | $ 11,165 | $ 12,679 | $ 8,976 | $ 10,035 |
Portfolio turnover rate | 49% | 41% | 32% | 55% | 56% |
A Total returns do not reflect charges attributable to your insurance company's separate account. Inclusion of these charges would reduce the total returns shown.
B Total returns would have been lower if certain expenses had not been reduced during the applicable periods shown.
C Calculated based on average shares outstanding during the period.
D Amounts do not include the activity of the Underlying Funds.
E Amount represents less than .01%.
F Expense ratios reflect operating expenses of the class. Expenses before reductions do not reflect amounts reimbursed by the investment adviser or reductions from expense offset arrangements and do not represent the amount paid by the class during periods when reimbursements or reductions occur. Expenses net of fee waivers reflect expenses after reimbursement by the investment adviser but prior to reductions from expense offset arrangements. Expenses net of all reductions represent the net expenses paid by the class but do not include expenses of the investment companies in which the Fund invests.
G Total distributions of $.49 per share is comprised of distributions from net investment income of $.347 and distributions from net realized gain of $.146 per share.
Financial Highlights - Service Class
Years ended December 31, | 2011 | 2010 | 2009 | 2008 | 2007 |
Selected Per-Share Data | | | | | |
Net asset value, beginning of period | $ 10.28 | $ 10.00 | $ 9.14 | $ 10.81 | $ 10.71 |
Income from Investment Operations | | | | | |
Net investment income (loss) C | .18 | .18 | .37 | .35 | .42 |
Net realized and unrealized gain (loss) | (.02) | .56 | .97 | (1.50) | .23 |
Total from investment operations | .16 | .74 | 1.34 | (1.15) | .65 |
Distributions from net investment income | (.18) | (.19) | (.33) | (.35) | (.43) |
Distributions from net realized gain | (.04) | (.28) | (.15) | (.17) | (.12) |
Total distributions | (.22) | (.46) G | (.48) F | (.52) | (.55) |
Net asset value, end of period | $ 10.22 | $ 10.28 | $ 10.00 | $ 9.14 | $ 10.81 |
Total Return A, B | 1.56% | 7.46% | 14.81% | (10.65)% | 6.10% |
Ratios to Average Net Assets D, E | | | | | |
Expenses before reductions | .10% | .10% | .10% | .10% | .10% |
Expenses net of fee waivers, if any | .10% | .10% | .10% | .10% | .10% |
Expenses net of all reductions | .10% | .10% | .10% | .10% | .10% |
Net investment income (loss) | 1.75% | 1.78% | 3.90% | 3.40% | 3.83% |
Supplemental Data | | | | | |
Net assets, end of period (000 omitted) | $ 2,505 | $ 172 | $ 163 | $ 258 | $ 414 |
Portfolio turnover rate | 49% | 41% | 32% | 55% | 56% |
A Total returns do not reflect charges attributable to your insurance company's separate account. Inclusion of these charges would reduce the total returns shown.
B Total returns would have been lower if certain expenses had not been reduced during the applicable periods shown.
C Calculated based on average shares outstanding during the period.
D Amounts do not include the activity of the Underlying Funds.
E Expense ratios reflect operating expenses of the class. Expenses before reductions do not reflect amounts reimbursed by the investment adviser or reductions from expense offset arrangements and do not represent the amount paid by the class during periods when reimbursements or reductions occur. Expenses net of fee waivers reflect expenses after reimbursement by the investment adviser but prior to reductions from expense offset arrangements. Expenses net of all reductions represent the net expenses paid by the class but do not include expenses of the investment companies in which the Fund invests.
F Total distributions of $.48 per share is comprised of distributions from net investment income of $.334 and distributions from net realized gain of $.146 per share.
G Total distributions of $.46 per share is comprised of distributions from net investment income of $.189 and distributions from net realized gain of $.275 per share.
See accompanying notes which are an integral part of the financial statements.
Annual Report
Financial Highlights - Service Class 2
Years ended December 31, | 2011 | 2010 | 2009 | 2008 | 2007 |
Selected Per-Share Data | | | | | |
Net asset value, beginning of period | $ 10.24 | $ 9.97 | $ 9.12 | $ 10.78 | $ 10.69 |
Income from Investment Operations | | | | | |
Net investment income (loss) C | .17 | .17 | .36 | .33 | .40 |
Net realized and unrealized gain (loss) | (.03) | .55 | .96 | (1.48) | .23 |
Total from investment operations | .14 | .72 | 1.32 | (1.15) | .63 |
Distributions from net investment income | (.16) | (.18) | (.33) | (.34) | (.42) |
Distributions from net realized gain | (.04) | (.28) | (.15) | (.17) | (.12) |
Total distributions | (.20) | (.45) G | (.47) F | (.51) | (.54) |
Net asset value, end of period | $ 10.18 | $ 10.24 | $ 9.97 | $ 9.12 | $ 10.78 |
Total Return A, B | 1.39% | 7.25% | 14.64% | (10.70)% | 5.92% |
Ratios to Average Net Assets D, E | | | | | |
Expenses before reductions | .25% | .25% | .25% | .25% | .25% |
Expenses net of fee waivers, if any | .25% | .25% | .25% | .25% | .25% |
Expenses net of all reductions | .25% | .25% | .25% | .25% | .25% |
Net investment income (loss) | 1.60% | 1.63% | 3.76% | 3.25% | 3.68% |
Supplemental Data | | | | | |
Net assets, end of period (000 omitted) | $ 7,731 | $ 7,313 | $ 6,753 | $ 4,836 | $ 3,589 |
Portfolio turnover rate | 49% | 41% | 32% | 55% | 56% |
A Total returns do not reflect charges attributable to your insurance company's separate account. Inclusion of these charges would reduce the total returns shown.
B Total returns would have been lower if certain expenses had not been reduced during the applicable periods shown.
C Calculated based on average shares outstanding during the period.
D Amounts do not include the activity of the Underlying Funds.
E Expense ratios reflect operating expenses of the class. Expenses before reductions do not reflect amounts reimbursed by the investment adviser or reductions from expense offset arrangements and do not represent the amount paid by the class during periods when reimbursements or reductions occur. Expenses net of fee waivers reflect expenses after reimbursement by the investment adviser but prior to reductions from expense offset arrangements. Expenses net of all reductions represent the net expenses paid by the class but do not include expenses of the investment companies in which the Fund invests.
F Total distributions of $.47 per share is comprised of distributions from net investment income of $.326 and distributions from net realized gain of $.146 per share.
G Total distributions of $.45 per share is comprised of distributions from net investment income of $.176 and distributions from net realized gain of $.275 per share.
See accompanying notes which are an integral part of the financial statements.
Annual Report
VIP Freedom 2005 Portfolio
Investment Changes (Unaudited)
Fund Holdings as of December 31, 2011 |
| % of fund's
net assets | % of fund's net assets
6 months ago |
Domestic Equity Funds | | |
VIP Contrafund Portfolio Initial Class | 4.6 | 4.8 |
VIP Equity-Income Portfolio Initial Class | 5.6 | 5.6 |
VIP Growth & Income Portfolio Initial Class | 5.6 | 5.6 |
VIP Growth Portfolio Initial Class | 5.4 | 5.8 |
VIP Mid Cap Portfolio Initial Class | 1.8 | 2.0 |
VIP Value Portfolio Initial Class | 4.8 | 4.8 |
VIP Value Strategies Portfolio Initial Class | 2.0 | 2.0 |
| 29.8 | 30.6 |
Developed International Equity Funds | | |
VIP Overseas Portfolio Initial Class | 7.8 | 9.2 |
Emerging Markets Equity Funds | | |
VIP Emerging Markets Portfolio Initial Class | 2.0 | 1.6 |
High Yield Bond Funds | | |
VIP High Income Portfolio Initial Class | 5.2 | 5.0 |
Investment Grade Bond Funds | | |
VIP Investment Grade Bond Portfolio Initial Class | 30.5 | 30.5 |
Short-Term Funds | | |
VIP Money Market Portfolio Initial Class | 24.7 | 23.1 |
Net Other Assets (Liabilities)* | 0.0 | 0.0 |
| 100.0 | 100.0 |
* Amount represents less than 0.1% |
Asset Allocation (% of fund's net assets) |
Current |
| Domestic Equity Funds | 29.8% | |
| Developed International Equity Funds | 7.8% | |
| Emerging Markets Equity Funds | 2.0% | |
| High Yield Bond Funds | 5.2% | |
| Investment Grade Bond Funds | 30.5% | |
| Short-Term Funds | 24.7% | |

Six months ago |
| Domestic Equity Funds | 30.6% | |
| Developed International Equity Funds | 9.2% | |
| Emerging Markets Equity Funds | 1.6% | |
| High Yield Bond Funds | 5.0% | |
| Investment Grade Bond Funds | 30.5% | |
| Short-Term Funds | 23.1% | |

Expected |
| Domestic Equity Funds | 27.2% | |
| Developed International Equity Funds | 8.4% | |
| Emerging Markets Equity Funds | 1.5% | |
| High Yield Bond Funds | 5.0% | |
| Investment Grade Bond Funds | 29.7% | |
| Short-Term Funds | 28.2% | |

The fund invests according to an asset allocation strategy that becomes increasingly conservative over time. The six months ago allocation is based on the fund's holdings as of June 30, 2011. The current allocation is based on the fund's holdings as of December 31, 2011. The expected allocation represents the fund's anticipated allocation at June 30, 2012. |
Annual Report
VIP Freedom 2005 Portfolio
Investments December 31, 2011
Showing Percentage of Net Assets
Domestic Equity Funds - 29.8% |
| Shares | | Value |
Domestic Equity Funds - 29.8% |
VIP Contrafund Portfolio Initial Class | 11,143 | | $ 256,507 |
VIP Equity-Income Portfolio Initial Class | 16,525 | | 308,861 |
VIP Growth & Income Portfolio Initial Class | 24,727 | | 311,308 |
VIP Growth Portfolio Initial Class | 8,065 | | 297,533 |
VIP Mid Cap Portfolio Initial Class | 3,513 | | 102,153 |
VIP Value Portfolio Initial Class | 25,104 | | 266,103 |
VIP Value Strategies Portfolio Initial Class | 12,345 | | 108,385 |
TOTAL DOMESTIC EQUITY FUNDS (Cost $1,878,259) |
1,650,850
|
International Equity Funds - 9.8% |
| | | |
Developed International Equity Funds - 7.8% |
VIP Overseas Portfolio Initial Class | 31,810 | | 433,576 |
Emerging Markets Equity Funds - 2.0% |
VIP Emerging Markets Portfolio Initial Class | 14,064 | | 108,859 |
TOTAL INTERNATIONAL EQUITY FUNDS (Cost $736,651) |
542,435
|
Bond Funds - 35.7% |
| Shares | | Value |
High Yield Bond Funds - 5.2% |
VIP High Income Portfolio Initial Class | 53,302 | | $ 287,296 |
Investment Grade Bond Funds - 30.5% |
VIP Investment Grade Bond Portfolio Initial Class | 130,566 | | 1,693,436 |
TOTAL BOND FUNDS (Cost $1,953,446) |
1,980,732
|
Short-Term Funds - 24.7% |
| | | |
VIP Money Market Portfolio Initial Class
(Cost $1,370,831) | 1,370,831 | |
1,370,831
|
TOTAL INVESTMENT PORTFOLIO - 100.0% (Cost $5,939,187) | | 5,544,848 |
NET OTHER ASSETS (LIABILITIES) - 0.0% | | (311) |
NET ASSETS - 100% | $ 5,544,537 |
Other Information |
All investments are categorized as Level 1 under the Fair Value Hierarchy. The inputs or methodology used for valuing securities may not be an indication of the risk associated with investing in those securities. For more information on valuation inputs, please refer to the Security Valuation section in the accompanying Notes to Financial Statements. |
See accompanying notes which are an integral part of the financial statements.
Annual Report
VIP Freedom 2005 Portfolio
Statement of Assets and Liabilities
| December 31, 2011 |
| | |
Assets | | |
Investment in securities, at value (cost $5,939,187) - See accompanying schedule | | $ 5,544,848 |
Receivable for investments sold | | 29,863 |
Receivable for fund shares sold | | 278 |
Total assets | | 5,574,989 |
| | |
Liabilities | | |
Payable for fund shares redeemed | $ 30,130 | |
Distribution and service plan fees payable | 322 | |
Total liabilities | | 30,452 |
| | |
Net Assets | | $ 5,544,537 |
Net Assets consist of: | | |
Paid in capital | | $ 6,211,008 |
Accumulated undistributed net realized gain (loss) on investments | | (272,132) |
Net unrealized appreciation (depreciation) on investments | | (394,339) |
Net Assets | | $ 5,544,537 |
Statement of Assets and Liabilities - continued
| December 31, 2011 |
| | |
Initial Class:
Net Asset Value, offering price and redemption price per share ($5,223,845 ÷ 530,052 shares) | | $ 9.86 |
| | |
Service Class:
Net Asset Value, offering price and redemption price per share ($94,841 ÷ 9,617 shares) | | $ 9.86 |
| | |
Service Class 2:
Net Asset Value, offering price and redemption price per share ($225,851 ÷ 22,930 shares) | | $ 9.85 |
See accompanying notes which are an integral part of the financial statements.
Annual Report
Statement of Operations
| Year ended December 31, 2011 |
| | |
Investment Income | | |
Income distributions from underlying funds | | $ 130,334 |
| | |
Expenses | | |
Distribution and service plan fees | $ 1,244 | |
Independent trustees' compensation | 21 | |
Total expenses before reductions | 1,265 | |
Expense reductions | (21) | 1,244 |
Net investment income (loss) | | 129,090 |
Realized and Unrealized Gain (Loss) Realized gain (loss) on sale of underlying fund shares | (91,461) | |
Capital gain distributions from underlying funds | 52,736 | |
Total net realized gain (loss) | | (38,725) |
Change in net unrealized appreciation (depreciation) on underlying funds | | (73,018) |
Net gain (loss) | | (111,743) |
Net increase (decrease) in net assets resulting from operations | | $ 17,347 |
Statement of Changes in Net Assets
| Year ended
December 31,
2011 | Year ended
December 31,
2010 |
Increase (Decrease) in Net Assets | | |
Operations | | |
Net investment income (loss) | $ 129,090 | $ 117,868 |
Net realized gain (loss) | (38,725) | (54,409) |
Change in net unrealized appreciation (depreciation) | (73,018) | 602,863 |
Net increase (decrease) in net assets resulting from operations | 17,347 | 666,322 |
Distributions to shareholders from net investment income | (128,904) | (118,355) |
Distributions to shareholders from net realized gain | (25,204) | (79,802) |
Total distributions | (154,108) | (198,157) |
Share transactions - net increase (decrease) | (386,788) | (1,588,370) |
Total increase (decrease) in net assets | (523,549) | (1,120,205) |
| | |
Net Assets | | |
Beginning of period | 6,068,086 | 7,188,291 |
End of period | $ 5,544,537 | $ 6,068,086 |
See accompanying notes which are an integral part of the financial statements.
Annual Report
Financial Highlights - Initial Class
Years ended December 31, | 2011 | 2010 | 2009 | 2008 | 2007 |
Selected Per-Share Data | | | | | |
Net asset value, beginning of period | $ 10.07 | $ 9.34 | $ 8.14 | $ 11.59 | $ 11.41 |
Income from Investment Operations | | | | | |
Net investment income (loss) C | .22 | .18 | .34 | .34 | .38 |
Net realized and unrealized gain (loss) | (.20) | .87 | 1.48 | (3.06) | .60 |
Total from investment operations | .02 | 1.05 | 1.82 | (2.72) | .98 |
Distributions from net investment income | (.19) | (.20) | (.35) | (.34) | (.34) |
Distributions from net realized gain | (.04) | (.12) | (.26) | (.39) | (.47) |
Total distributions | (.23) | (.32) | (.62) H | (.73) | (.80) G |
Net asset value, end of period | $ 9.86 | $ 10.07 | $ 9.34 | $ 8.14 | $ 11.59 |
Total Return A, B | .18% | 11.34% | 23.02% | (23.83)% | 8.65% |
Ratios to Average Net Assets D, F | | | | | |
Expenses before reductions E | .00% | .00% | .00% | .00% | .00% |
Expenses net of fee waivers, if any | .00% | .00% | .00% | .00% | .00% |
Expenses net of all reductions | .00% | .00% | .00% | .00% | .00% |
Net investment income (loss) | 2.17% | 1.90% | 3.95% | 3.29% | 3.20% |
Supplemental Data | | | | | |
Net assets, end of period (000 omitted) | $ 5,224 | $ 5,733 | $ 6,833 | $ 5,993 | $ 9,203 |
Portfolio turnover rate | 54% | 42% | 50% | 51% | 51% |
A Total returns do not reflect charges attributable to your insurance company's separate account. Inclusion of these charges would reduce the total returns shown.
B Total returns would have been lower if certain expenses had not been reduced during the applicable periods shown.
C Calculated based on average shares outstanding during the period.
D Amounts do not include the activity of the Underlying Funds.
E Amount represents less than .01%.
F Expense ratios reflect operating expenses of the class. Expenses before reductions do not reflect amounts reimbursed by the investment adviser or reductions from expense offset arrangements and do not represent the amount paid by the class during periods when reimbursements or reductions occur. Expenses net of fee waivers reflect expenses after reimbursement by the investment adviser but prior to reductions from expense offset arrangements. Expenses net of all reductions represent the net expenses paid by the class but do not include expenses of the investment companies in which the Fund invests.
G Total distributions of $.80 per share is comprised of distributions from net investment income of $.335 and distributions from net realized gain of $.465 per share.
H Total distributions of $.62 per share is comprised of distributions from net investment income of $.353 and distributions from net realized gain of $.262 per share.
Financial Highlights - Service Class
Years ended December 31, | 2011 | 2010 | 2009 | 2008 | 2007 |
Selected Per-Share Data | | | | | |
Net asset value, beginning of period | $ 10.08 | $ 9.35 | $ 8.14 | $ 11.59 | $ 11.41 |
Income from Investment Operations | | | | | |
Net investment income (loss) C | .21 | .17 | .33 | .33 | .37 |
Net realized and unrealized gain (loss) | (.21) | .87 | 1.48 | (3.06) | .60 |
Total from investment operations | - F | 1.04 | 1.81 | (2.73) | .97 |
Distributions from net investment income | (.18) | (.19) | (.34) | (.33) | (.32) |
Distributions from net realized gain | (.04) | (.12) | (.26) | (.39) | (.47) |
Total distributions | (.22) | (.31) | (.60) H | (.72) | (.79) G |
Net asset value, end of period | $ 9.86 | $ 10.08 | $ 9.35 | $ 8.14 | $ 11.59 |
Total Return A, B | (.04)% | 11.24% | 23.00% | (23.95)% | 8.55% |
Ratios to Average Net Assets D, E | | | | | |
Expenses before reductions | .10% | .10% | .10% | .10% | .10% |
Expenses net of fee waivers, if any | .10% | .10% | .10% | .10% | .10% |
Expenses net of all reductions | .10% | .10% | .10% | .10% | .10% |
Net investment income (loss) | 2.07% | 1.80% | 3.85% | 3.19% | 3.10% |
Supplemental Data | | | | | |
Net assets, end of period (000 omitted) | $ 95 | $ 179 | $ 172 | $ 250 | $ 449 |
Portfolio turnover rate | 54% | 42% | 50% | 51% | 51% |
A Total returns do not reflect charges attributable to your insurance company's separate account. Inclusion of these charges would reduce the total returns shown.
B Total returns would have been lower if certain expenses had not been reduced during the applicable periods shown.
C Calculated based on average shares outstanding during the period.
D Amounts do not include the activity of the Underlying Funds.
E Expense ratios reflect operating expenses of the class. Expenses before reductions do not reflect amounts reimbursed by the investment adviser or reductions from expense offset arrangements and do not represent the amount paid by the class during periods when reimbursements or reductions occur. Expenses net of fee waivers reflect expenses after reimbursement by the investment adviser but prior to reductions from expense offset arrangements. Expenses net of all reductions represent the net expenses paid by the class but do not include expenses of the investment companies in which the Fund invests.
F Amount represents less than $.01 per share.
G Total distributions of $.79 per share is comprised of distributions from net investment income of $.323 and distributions from net realized gain of $.465 per share.
H Total distributions of $.60 per share is comprised of distributions from net investment income of $.341 and distributions from net realized gain of $.262 per share.
See accompanying notes which are an integral part of the financial statements.
Annual Report
Financial Highlights - Service Class 2
Years ended December 31, | 2011 | 2010 | 2009 | 2008 | 2007 |
Selected Per-Share Data | | | | | |
Net asset value, beginning of period | $ 10.08 | $ 9.35 | $ 8.14 | $ 11.59 | $ 11.41 |
Income from Investment Operations | | | | | |
Net investment income (loss) C | .19 | .16 | .32 | .31 | .35 |
Net realized and unrealized gain (loss) | (.20) | .86 | 1.48 | (3.06) | .60 |
Total from investment operations | (.01) | 1.02 | 1.80 | (2.75) | .95 |
Distributions from net investment income | (.18) | (.18) | (.32) | (.31) | (.31) |
Distributions from net realized gain | (.04) | (.12) | (.26) | (.39) | (.47) |
Total distributions | (.22) | (.29) H | (.59) G | (.70) | (.77) F |
Net asset value, end of period | $ 9.85 | $ 10.08 | $ 9.35 | $ 8.14 | $ 11.59 |
Total Return A, B | (.09)% | 11.06% | 22.78% | (24.12)% | 8.40% |
Ratios to Average Net Assets D, E | | | | | |
Expenses before reductions | .25% | .25% | .25% | .25% | .25% |
Expenses net of fee waivers, if any | .25% | .25% | .25% | .25% | .25% |
Expenses net of all reductions | .25% | .25% | .25% | .25% | .25% |
Net investment income (loss) | 1.92% | 1.65% | 3.70% | 3.04% | 2.95% |
Supplemental Data | | | | | |
Net assets, end of period (000 omitted) | $ 226 | $ 157 | $ 183 | $ 271 | $ 456 |
Portfolio turnover rate | 54% | 42% | 50% | 51% | 51% |
A Total returns do not reflect charges attributable to your insurance company's separate account. Inclusion of these charges would reduce the total returns shown.
B Total returns would have been lower if certain expenses had not been reduced during the applicable periods shown.
C Calculated based on average shares outstanding during the period.
D Amounts do not include the activity of the Underlying Funds.
E Expense ratios reflect operating expenses of the class. Expenses before reductions do not reflect amounts reimbursed by the investment adviser or reductions from expense offset arrangements and do not represent the amount paid by the class during periods when reimbursements or reductions occur. Expenses net of fee waivers reflect expenses after reimbursement by the investment adviser but prior to reductions from expense offset arrangements. Expenses net of all reductions represent the net expenses paid by the class but do not include expenses of the investment companies in which the Fund invests.
F Total distributions of $.77 per share is comprised of distributions from net investment income of $.306 and distributions from net realized gain of $.465 per share.
G Total distributions of $.59 per share is comprised of distributions from net investment income of $.324 and distributions from net realized gain of $.262 per share.
H Total distributions of $.29 per share is comprised of distributions from net investment income of $.177 and distributions from net realized gain of $.117 per share.
See accompanying notes which are an integral part of the financial statements.
Annual Report
VIP Freedom 2010 Portfolio
Investment Changes (Unaudited)
Fund Holdings as of December 31, 2011 |
| % of fund's
net assets | % of fund's net assets
6 months ago |
Domestic Equity Funds | | |
VIP Contrafund Portfolio Initial Class | 5.7 | 5.8 |
VIP Equity-Income Portfolio Initial Class | 6.9 | 6.7 |
VIP Growth & Income Portfolio Initial Class | 6.9 | 6.7 |
VIP Growth Portfolio Initial Class | 6.7 | 6.9 |
VIP Mid Cap Portfolio Initial Class | 2.3 | 2.4 |
VIP Value Portfolio Initial Class | 5.9 | 5.8 |
VIP Value Strategies Portfolio Initial Class | 2.4 | 2.4 |
| 36.8 | 36.7 |
Developed International Equity Funds | | |
VIP Overseas Portfolio Initial Class | 9.8 | 11.2 |
Emerging Markets Equity Funds | | |
VIP Emerging Markets Portfolio Initial Class | 2.5 | 1.9 |
High Yield Bond Funds | | |
VIP High Income Portfolio Initial Class | 5.1 | 5.0 |
Investment Grade Bond Funds | | |
VIP Investment Grade Bond Portfolio Initial Class | 34.8 | 34.6 |
Short-Term Funds | | |
VIP Money Market Portfolio Initial Class | 11.0 | 10.7 |
Net Other Assets (Liabilities) | 0.0* | (0.1) |
| 100.0 | 100.0 |
* Amount represents less than 0.1% |
Asset Allocation (% of fund's net assets) |
Current |
| Domestic Equity Funds | 36.8% | |
| Developed International Equity Funds | 9.8% | |
| Emerging Markets Equity Funds | 2.5% | |
| High Yield Bond Funds | 5.1% | |
| Investment Grade Bond Funds | 34.8% | |
| Short-Term Funds | 11.0% | |

Six months ago |
| Domestic Equity Funds | 36.7% | |
| Developed International Equity Funds | 11.2% | |
| Emerging Markets Equity Funds | 1.9% | |
| High Yield Bond Funds | 5.0% | |
| Investment Grade Bond Funds | 34.6% | |
| Short-Term Funds | 10.7% | |
| Net Other Assets † | (0.1)% | |

Expected |
| Domestic Equity Funds | 35.7% | |
| Developed International Equity Funds | 11.1% | |
| Emerging Markets Equity Funds | 1.9% | |
| High Yield Bond Funds | 5.0% | |
| Investment Grade Bond Funds | 34.5% | |
| Short-Term Funds | 11.8% | |

The fund invests according to an asset allocation strategy that becomes increasingly conservative over time. The six months ago allocation is based on the fund's holdings as of June 30, 2011. The current allocation is based on the fund's holdings as of December 31, 2011. The expected allocation represents the fund's anticipated allocation at June 30, 2012. |
† Net Other Assets are not included in the pie chart. |
Annual Report
VIP Freedom 2010 Portfolio
Investments December 31, 2011
Showing Percentage of Net Assets
Domestic Equity Funds - 36.8% |
| Shares | | Value |
Domestic Equity Funds - 36.8% |
VIP Contrafund Portfolio Initial Class | 447,769 | | $ 10,307,654 |
VIP Equity-Income Portfolio Initial Class | 658,010 | | 12,298,203 |
VIP Growth & Income Portfolio Initial Class | 983,379 | | 12,380,740 |
VIP Growth Portfolio Initial Class | 324,016 | | 11,952,961 |
VIP Mid Cap Portfolio Initial Class | 142,866 | | 4,154,557 |
VIP Value Portfolio Initial Class | 1,000,345 | | 10,603,652 |
VIP Value Strategies Portfolio Initial Class | 495,359 | | 4,349,255 |
TOTAL DOMESTIC EQUITY FUNDS (Cost $72,553,479) |
66,047,022
|
International Equity Funds - 12.3% |
| | | |
Developed International Equity Funds - 9.8% |
VIP Overseas Portfolio Initial Class | 1,295,684 | | 17,660,169 |
Emerging Markets Equity Funds - 2.5% |
VIP Emerging Markets Portfolio Initial Class | 587,849 | | 4,549,949 |
TOTAL INTERNATIONAL EQUITY FUNDS (Cost $28,043,632) |
22,210,118
|
Bond Funds - 39.9% |
| Shares | | Value |
High Yield Bond Funds - 5.1% |
VIP High Income Portfolio Initial Class | 1,711,503 | | $ 9,224,999 |
Investment Grade Bond Funds - 34.8% |
VIP Investment Grade Bond Portfolio Initial Class | 4,817,528 | | 62,483,334 |
TOTAL BOND FUNDS (Cost $71,047,536) |
71,708,333
|
Short-Term Funds - 11.0% |
| | | |
VIP Money Market Portfolio Initial Class
(Cost $19,724,734) | 19,724,734 | |
19,724,734
|
TOTAL INVESTMENT PORTFOLIO - 100.0% (Cost $191,369,381) | | 179,690,207 |
NET OTHER ASSETS (LIABILITIES) - 0.0% | | (73,145) |
NET ASSETS - 100% | $ 179,617,062 |
Other Information |
All investments are categorized as Level 1 under the Fair Value Hierarchy. The inputs or methodology used for valuing securities may not be an indication of the risk associated with investing in those securities. For more information on valuation inputs, please refer to the Security Valuation section in the accompanying Notes to Financial Statements. |
See accompanying notes which are an integral part of the financial statements.
Annual Report
VIP Freedom 2010 Portfolio
Statement of Assets and Liabilities
| December 31, 2011 |
| | |
Assets | | |
Investment in securities, at value (cost $191,369,381) - See accompanying schedule | | $ 179,690,207 |
Cash | | 370 |
Receivable for investments sold | | 434,579 |
Receivable for fund shares sold | | 38,619 |
Total assets | | 180,163,775 |
| | |
Liabilities | | |
Payable for fund shares redeemed | $ 517,263 | |
Distribution and service plan fees payable | 29,450 | |
Total liabilities | | 546,713 |
| | |
Net Assets | | $ 179,617,062 |
Net Assets consist of: | | |
Paid in capital | | $ 191,344,636 |
Undistributed net investment income | | 3,257 |
Accumulated undistributed net realized gain (loss) on investments | | (51,657) |
Net unrealized appreciation (depreciation) on investments | | (11,679,174) |
Net Assets | | $ 179,617,062 |
Statement of Assets and Liabilities - continued
| December 31, 2011 |
| | |
Initial Class:
Net Asset Value, offering price and redemption price per share ($22,337,671 ÷ 2,167,592 shares) | | $ 10.31 |
| | |
Service Class:
Net Asset Value, offering price and redemption price per share ($20,926,880 ÷ 2,032,470 shares) | | $ 10.30 |
| | |
Service Class 2:
Net Asset Value, offering price and redemption price per share ($136,352,511 ÷ 13,291,287 shares) | | $ 10.26 |
See accompanying notes which are an integral part of the financial statements.
Annual Report
Statement of Operations
| Year ended December 31, 2011 |
| | |
Investment Income | | |
Income distributions from underlying funds | | $ 3,841,239 |
| | |
Expenses | | |
Distribution and service plan fees | $ 335,799 | |
Independent trustees' compensation | 602 | |
Total expenses before reductions | 336,401 | |
Expense reductions | (602) | 335,799 |
Net investment income (loss) | | 3,505,440 |
Realized and Unrealized Gain (Loss) Realized gain (loss) on sale of underlying fund shares | 123,432 | |
Capital gain distributions from underlying funds | 1,602,132 | |
Total net realized gain (loss) | | 1,725,564 |
Change in net unrealized appreciation (depreciation) on underlying funds | | (6,181,305) |
Net gain (loss) | | (4,455,741) |
Net increase (decrease) in net assets resulting from operations | | $ (950,301) |
Statement of Changes in Net Assets
| Year ended
December 31,
2011 | Year ended
December 31,
2010 |
Increase (Decrease) in Net Assets | | |
Operations | | |
Net investment income (loss) | $ 3,505,440 | $ 3,027,486 |
Net realized gain (loss) | 1,725,564 | 2,094,428 |
Change in net unrealized appreciation (depreciation) | (6,181,305) | 11,980,452 |
Net increase (decrease) in net assets resulting from operations | (950,301) | 17,102,366 |
Distributions to shareholders from net investment income | (3,501,665) | (3,027,992) |
Distributions to shareholders from net realized gain | (930,001) | (2,711,578) |
Total distributions | (4,431,666) | (5,739,570) |
Share transactions - net increase (decrease) | 25,200,781 | 20,210,504 |
Total increase (decrease) in net assets | 19,818,814 | 31,573,300 |
| | |
Net Assets | | |
Beginning of period | 159,798,248 | 128,224,948 |
End of period (including undistributed net investment income of $3,257 and undistributed net investment income of $7,845, respectively) | $ 179,617,062 | $ 159,798,248 |
See accompanying notes which are an integral part of the financial statements.
Annual Report
Financial Highlights - Initial Class
Years ended December 31, | 2011 | 2010 | 2009 | 2008 | 2007 |
Selected Per-Share Data | | | | | |
Net asset value, beginning of period | $ 10.61 | $ 9.77 | $ 8.23 | $ 11.96 | $ 11.59 |
Income from Investment Operations | | | | | |
Net investment income (loss) C | .24 | .24 | .38 | .35 | .36 |
Net realized and unrealized gain (loss) | (.26) | 1.02 | 1.60 | (3.32) | .64 |
Total from investment operations | (.02) | 1.26 | 1.98 | (2.97) | 1.00 |
Distributions from net investment income | (.23) | (.23) | (.37) | (.31) | (.30) |
Distributions from net realized gain | (.06) | (.19) | (.07) | (.45) | (.33) |
Total distributions | (.28) G | (.42) | (.44) | (.76) | (.63) |
Net asset value, end of period | $ 10.31 | $ 10.61 | $ 9.77 | $ 8.23 | $ 11.96 |
Total Return A, B | (.19)% | 12.95% | 24.27% | (25.05)% | 8.71% |
Ratios to Average Net Assets D, F | | | | | |
Expenses before reductions E | .00% | .00% | .00% | .00% | .00% |
Expenses net of fee waivers, if any | .00% | .00% | .00% | .00% | .00% |
Expenses net of all reductions | .00% | .00% | .00% | .00% | .00% |
Net investment income (loss) | 2.27% | 2.38% | 4.22% | 3.27% | 2.95% |
Supplemental Data | | | | | |
Net assets, end of period (000 omitted) | $ 22,338 | $ 22,573 | $ 21,197 | $ 24,962 | $ 26,629 |
Portfolio turnover rate | 17% | 29% | 28% | 34% | 21% |
A Total returns do not reflect charges attributable to your insurance company's separate account. Inclusion of these charges would reduce the total returns shown.
B Total returns would have been lower if certain expenses had not been reduced during the applicable periods shown.
C Calculated based on average shares outstanding during the period.
D Amounts do not include the activity of the Underlying Funds.
E Amount represents less than .01%.
F Expense ratios reflect operating expenses of the class. Expenses before reductions do not reflect amounts reimbursed by the investment adviser or reductions from expense offset arrangements and do not represent the amount paid by the class during periods when reimbursements or reductions occur. Expenses net of fee waivers reflect expenses after reimbursement by the investment adviser but prior to reductions from expense offset arrangements. Expenses net of all reductions represent the net expenses paid by the class but do not include expenses of the investment companies in which the Fund invests.
G Total distributions of $.28 per share is comprised of distributions from net investment income of $.225 and distributions from net realized gain of $.055 per share.
Financial Highlights - Service Class
Years ended December 31, | 2011 | 2010 | 2009 | 2008 | 2007 |
Selected Per-Share Data | | | | | |
Net asset value, beginning of period | $ 10.60 | $ 9.77 | $ 8.23 | $ 11.95 | $ 11.58 |
Income from Investment Operations | | | | | |
Net investment income (loss) C | .23 | .23 | .37 | .33 | .35 |
Net realized and unrealized gain (loss) | (.26) | 1.01 | 1.60 | (3.30) | .64 |
Total from investment operations | (.03) | 1.24 | 1.97 | (2.97) | .99 |
Distributions from net investment income | (.22) | (.21) | (.36) | (.30) | (.29) |
Distributions from net realized gain | (.06) | (.19) | (.07) | (.45) | (.33) |
Total distributions | (.27) G | (.41) F | (.43) | (.75) | (.62) |
Net asset value, end of period | $ 10.30 | $ 10.60 | $ 9.77 | $ 8.23 | $ 11.95 |
Total Return A, B | (.28)% | 12.74% | 24.15% | (25.08)% | 8.65% |
Ratios to Average Net Assets D, E | | | | | |
Expenses before reductions | .10% | .10% | .10% | .10% | .10% |
Expenses net of fee waivers, if any | .10% | .10% | .10% | .10% | .10% |
Expenses net of all reductions | .10% | .10% | .10% | .10% | .10% |
Net investment income (loss) | 2.17% | 2.28% | 4.12% | 3.17% | 2.85% |
Supplemental Data | | | | | |
Net assets, end of period (000 omitted) | $ 20,927 | $ 19,259 | $ 19,238 | $ 17,137 | $ 19,295 |
Portfolio turnover rate | 17% | 29% | 28% | 34% | 21% |
A Total returns do not reflect charges attributable to your insurance company's separate account. Inclusion of these charges would reduce the total returns shown.
B Total returns would have been lower if certain expenses had not been reduced during the applicable periods shown.
C Calculated based on average shares outstanding during the period.
D Amounts do not include the activity of the Underlying Funds.
E Expense ratios reflect operating expenses of the class. Expenses before reductions do not reflect amounts reimbursed by the investment adviser or reductions from expense offset arrangements and do not represent the amount paid by the class during periods when reimbursements or reductions occur. Expenses net of fee waivers reflect expenses after reimbursement by the investment adviser but prior to reductions from expense offset arrangements. Expenses net of all reductions represent the net expenses paid by the class but do not include expenses of the investment companies in which the Fund invests.
F Total distributions of $.41 per share is comprised of distributions from net investment income of $.214 and distributions from net realized gain of $.191 per share.
G Total distributions of $.27 per share is comprised of distributions from net investment income of $.215 and distributions from net realized gain of $.055 per share.
See accompanying notes which are an integral part of the financial statements.
Annual Report
Financial Highlights - Service Class 2
Years ended December 31, | 2011 | 2010 | 2009 | 2008 | 2007 |
Selected Per-Share Data | | | | | |
Net asset value, beginning of period | $ 10.56 | $ 9.74 | $ 8.21 | $ 11.92 | $ 11.56 |
Income from Investment Operations | | | | | |
Net investment income (loss) C | .22 | .22 | .35 | .32 | .33 |
Net realized and unrealized gain (loss) | (.26) | .99 | 1.60 | (3.29) | .64 |
Total from investment operations | (.04) | 1.21 | 1.95 | (2.97) | .97 |
Distributions from net investment income | (.20) | (.20) | (.35) | (.29) | (.28) |
Distributions from net realized gain | (.06) | (.19) | (.07) | (.45) | (.33) |
Total distributions | (.26) | (.39) | (.42) | (.74) | (.61) |
Net asset value, end of period | $ 10.26 | $ 10.56 | $ 9.74 | $ 8.21 | $ 11.92 |
Total Return A, B | (.43)% | 12.55% | 23.95% | (25.17)% | 8.42% |
Ratios to Average Net Assets D, E | | | | | |
Expenses before reductions | .25% | .25% | .25% | .25% | .25% |
Expenses net of fee waivers, if any | .25% | .25% | .25% | .25% | .25% |
Expenses net of all reductions | .25% | .25% | .25% | .25% | .25% |
Net investment income (loss) | 2.02% | 2.13% | 3.97% | 3.02% | 2.70% |
Supplemental Data | | | | | |
Net assets, end of period (000 omitted) | $ 136,353 | $ 117,966 | $ 87,791 | $ 66,370 | $ 62,510 |
Portfolio turnover rate | 17% | 29% | 28% | 34% | 21% |
A Total returns do not reflect charges attributable to your insurance company's separate account. Inclusion of these charges would reduce the total returns shown.
B Total returns would have been lower if certain expenses had not been reduced during the applicable periods shown.
C Calculated based on average shares outstanding during the period.
D Amounts do not include the activity of the Underlying Funds.
E Expense ratios reflect operating expenses of the class. Expenses before reductions do not reflect amounts reimbursed by the investment adviser or reductions from expense offset arrangements and do not represent the amount paid by the class during periods when reimbursements or reductions occur. Expenses net of fee waivers reflect expenses after reimbursement by the investment adviser but prior to reductions from expense offset arrangements. Expenses net of all reductions represent the net expenses paid by the class but do not include expenses of the investment companies in which the Fund invests.
See accompanying notes which are an integral part of the financial statements.
Annual Report
VIP Freedom 2015 Portfolio
Investment Changes (Unaudited)
Fund Holdings as of December 31, 2011 |
| % of fund's
net assets | % of fund's net assets
6 months ago |
Domestic Equity Funds | | |
VIP Contrafund Portfolio Initial Class | 5.9 | 5.9 |
VIP Equity-Income Portfolio Initial Class | 7.0 | 6.9 |
VIP Growth & Income Portfolio Initial Class | 7.1 | 6.9 |
VIP Growth Portfolio Initial Class | 6.8 | 7.1 |
VIP Mid Cap Portfolio Initial Class | 2.4 | 2.4 |
VIP Value Portfolio Initial Class | 6.1 | 5.9 |
VIP Value Strategies Portfolio Initial Class | 2.5 | 2.5 |
| 37.8 | 37.6 |
Developed International Equity Funds | | |
VIP Overseas Portfolio Initial Class | 10.1 | 11.4 |
Emerging Markets Equity Funds | | |
VIP Emerging Markets Portfolio Initial Class | 2.6 | 2.0 |
High Yield Bond Funds | | |
VIP High Income Portfolio Initial Class | 5.2 | 5.1 |
Investment Grade Bond Funds | | |
VIP Investment Grade Bond Portfolio Initial Class | 34.9 | 34.4 |
Short-Term Funds | | |
VIP Money Market Portfolio Initial Class | 9.5 | 9.5 |
| | |
Net Other Assets (Liabilities) | (0.1) | 0.0* |
| 100.0 | 100.0 |
* Amount represents less than 0.1% |
Asset Allocation (% of fund's net assets) |
Current |
| Domestic Equity Funds | 37.8% | |
| Developed International Equity Funds | 10.1% | |
| Emerging Markets Equity Funds | 2.6% | |
| High Yield Bond Funds | 5.2% | |
| Investment Grade Bond Funds | 34.9% | |
| Short-Term Funds | 9.5% | |
| Net Other Assets † | (0.1)% | |

Six months ago |
| Domestic Equity Funds | 37.6% | |
| Developed International Equity Funds | 11.4% | |
| Emerging Markets Equity Funds | 2.0% | |
| High Yield Bond Funds | 5.1% | |
| Investment Grade Bond Funds | 34.4% | |
| Short-Term Funds | 9.5% | |

Expected |
| Domestic Equity Funds | 36.8% | |
| Developed International Equity Funds | 11.4% | |
| Emerging Markets Equity Funds | 2.0% | |
| High Yield Bond Funds | 5.0% | |
| Investment Grade Bond Funds | 34.9% | |
| Short-Term Funds | 9.9% | |

The fund invests according to an asset allocation strategy that becomes increasingly conservative over time. The six months ago allocation is based on the fund's holdings as of June 30, 2011. The current allocation is based on the fund's holdings as of December 31, 2011. The expected allocation represents the fund's anticipated allocation at June 30, 2012. |
† Net Other Assets are not included in the pie chart. |
Annual Report
VIP Freedom 2015 Portfolio
Investments December 31, 2011
Showing Percentage of Net Assets
Domestic Equity Funds - 37.8% |
| Shares | | Value |
Domestic Equity Funds - 37.8% |
VIP Contrafund Portfolio Initial Class | 260,703 | | $ 6,001,373 |
VIP Equity-Income Portfolio Initial Class | 383,406 | | 7,165,855 |
VIP Growth & Income Portfolio Initial Class | 573,067 | | 7,214,919 |
VIP Growth Portfolio Initial Class | 188,867 | | 6,967,303 |
VIP Mid Cap Portfolio Initial Class | 83,105 | | 2,416,689 |
VIP Value Portfolio Initial Class | 582,566 | | 6,175,203 |
VIP Value Strategies Portfolio Initial Class | 288,222 | | 2,530,592 |
TOTAL DOMESTIC EQUITY FUNDS (Cost $39,870,452) |
38,471,934
|
International Equity Funds - 12.7% |
| | | |
Developed International Equity Funds - 10.1% |
VIP Overseas Portfolio Initial Class | 754,549 | | 10,284,508 |
Emerging Markets Equity Funds - 2.6% |
VIP Emerging Markets Portfolio Initial Class | 342,242 | | 2,648,952 |
TOTAL INTERNATIONAL EQUITY FUNDS (Cost $15,720,908) |
12,933,460
|
Bond Funds - 40.1% |
| Shares | | Value |
High Yield Bond Funds - 5.2% |
VIP High Income Portfolio Initial Class | 976,522 | | $ 5,263,452 |
Investment Grade Bond Funds - 34.9% |
VIP Investment Grade Bond Portfolio Initial Class | 2,739,479 | | 35,531,039 |
TOTAL BOND FUNDS (Cost $40,132,859) |
40,794,491
|
Short-Term Funds - 9.5% |
| | | |
VIP Money Market Portfolio Initial Class
(Cost $9,724,413) | 9,724,413 | |
9,724,413
|
TOTAL INVESTMENT PORTFOLIO - 100.1% (Cost $105,448,632) | | 101,924,298 |
NET OTHER ASSETS (LIABILITIES) - (0.1)% | | (55,936) |
NET ASSETS - 100% | $ 101,868,362 |
Other Information |
All investments are categorized as Level 1 under the Fair Value Hierarchy. The inputs or methodology used for valuing securities may not be an indication of the risk associated with investing in those securities. For more information on valuation inputs, please refer to the Security Valuation section in the accompanying Notes to Financial Statements. |
See accompanying notes which are an integral part of the financial statements.
Annual Report
Fidelity VIP Freedom 2015 Portfolio
Statement of Assets and Liabilities
| December 31, 2011 |
| | |
Assets | | |
Investment in securities, at value (cost $105,448,632) - See accompanying schedule | | $ 101,924,298 |
Receivable for investments sold | | 515,823 |
Receivable for fund shares sold | | 27,886 |
Total assets | | 102,468,007 |
| | |
Liabilities | | |
Payable to custodian bank | $ 79 | |
Payable for fund shares redeemed | 587,600 | |
Distribution and service plan fees payable | 11,966 | |
Total liabilities | | 599,645 |
| | |
Net Assets | | $ 101,868,362 |
Net Assets consist of: | | |
Paid in capital | | $ 105,294,793 |
Accumulated undistributed net realized gain (loss) on investments | | 97,903 |
Net unrealized appreciation (depreciation) on investments | | (3,524,334) |
Net Assets | | $ 101,868,362 |
Statement of Assets and Liabilities - continued
| December 31, 2011 |
| | |
Initial Class:
Net Asset Value, offering price and redemption price per share ($38,879,425 ÷ 3,744,150 shares) | | $ 10.38 |
| | |
Service Class:
Net Asset Value, offering price and redemption price per share ($7,743,053 ÷ 746,396 shares) | | $ 10.37 |
| | |
Service Class 2:
Net Asset Value, offering price and redemption price per share ($55,245,884 ÷ 5,342,327 shares) | | $ 10.34 |
See accompanying notes which are an integral part of the financial statements.
Annual Report
Fidelity VIP Freedom 2015 Portfolio
Financial Statements - continued
Statement of Operations
| Year ended December 31, 2011 |
| | |
Investment Income | | |
Income distributions from underlying funds | | $ 2,189,456 |
| | |
Expenses | | |
Distribution and service plan fees | $ 145,878 | |
Independent trustees' compensation | 363 | |
Total expenses before reductions | 146,241 | |
Expense reductions | (363) | 145,878 |
Net investment income (loss) | | 2,043,578 |
Realized and Unrealized Gain (Loss) Realized gain (loss) on sale of underlying fund shares | 169,820 | |
Capital gain distributions from underlying funds | 964,139 | |
Total net realized gain (loss) | | 1,133,959 |
Change in net unrealized appreciation (depreciation) on underlying funds | | (3,546,950) |
Net gain (loss) | | (2,412,991) |
Net increase (decrease) in net assets resulting from operations | | $ (369,413) |
Statement of Changes in Net Assets
| Year ended
December 31,
2011 | Year ended
December 31,
2010 |
Increase (Decrease) in Net Assets | | |
Operations | | |
Net investment income (loss) | $ 2,043,578 | $ 1,902,444 |
Net realized gain (loss) | 1,133,959 | 866,011 |
Change in net unrealized appreciation (depreciation) | (3,546,950) | 8,117,654 |
Net increase (decrease) in net assets resulting from operations | (369,413) | 10,886,109 |
Distributions to shareholders from net investment income | (2,043,772) | (1,907,875) |
Distributions to shareholders from net realized gain | (530,501) | (1,118,696) |
Total distributions | (2,574,273) | (3,026,571) |
Share transactions - net increase (decrease) | 6,442,512 | 9,160,517 |
Total increase (decrease) in net assets | 3,498,826 | 17,020,055 |
| | |
Net Assets | | |
Beginning of period | 98,369,536 | 81,349,481 |
End of period | $ 101,868,362 | $ 98,369,536 |
See accompanying notes which are an integral part of the financial statements.
Annual Report
Financial Highlights - Initial Class
Years ended December 31, | 2011 | 2010 | 2009 | 2008 | 2007 |
Selected Per-Share Data | | | | | |
Net asset value, beginning of period | $ 10.70 | $ 9.78 | $ 8.19 | $ 12.29 | $ 11.93 |
Income from Investment Operations | | | | | |
Net investment income (loss) C | .23 | .23 | .38 | .33 | .37 |
Net realized and unrealized gain (loss) | (.27) | 1.04 | 1.67 | (3.61) | .73 |
Total from investment operations | (.04) | 1.27 | 2.05 | (3.28) | 1.10 |
Distributions from net investment income | (.23) | (.23) | (.34) | (.30) | (.36) |
Distributions from net realized gain | (.06) | (.13) | (.12) | (.52) | (.38) |
Total distributions | (.28) H | (.35) G | (.46) | (.82) F | (.74) |
Net asset value, end of period | $ 10.38 | $ 10.70 | $ 9.78 | $ 8.19 | $ 12.29 |
Total Return A, B | (.36)% | 13.09% | 25.28% | (27.03)% | 9.33% |
Ratios to Average Net Assets D, E | | | | | |
Expenses before reductions I | .00% | .00% | .00% | .00% | .00% |
Expenses net of fee waivers, if any | .00% | .00% | .00% | .00% | .00% |
Expenses net of all reductions | .00% | .00% | .00% | .00% | .00% |
Net investment income (loss) | 2.16% | 2.30% | 4.21% | 3.11% | 2.93% |
Supplemental Data | | | | | |
Net assets, end of period (000 omitted) | $ 38,879 | $ 39,535 | $ 37,291 | $ 25,977 | $ 33,780 |
Portfolio turnover rate | 26% | 30% | 23% | 27% | 18% |
A Total returns do not reflect charges attributable to your insurance company's separate account. Inclusion of these charges would reduce the total returns shown.
B Total returns would have been lower if certain expenses had not been reduced during the applicable periods shown.
C Calculated based on average shares outstanding during the period.
D Amounts do not include the activity of the Underlying Funds.
E Expense ratios reflect operating expenses of the class. Expenses before reductions do not reflect amounts reimbursed by the investment adviser or reductions from expense offset arrangements and do not represent the amount paid by the class during periods when reimbursements or reductions occur. Expenses net of fee waivers reflect expenses after reimbursement by the investment adviser but prior to reductions from expense offset arrangements. Expenses net of all reductions represent the net expenses paid by the class but do not include expenses of the investment companies in which the Fund invests.
F Total distributions of $.82 per share is comprised of distributions from net investment income of $.302 and distributions from net realized gain of $.515 per share.
G Total distributions of $.35 per share is comprised of distributions from net investment income of $.227 and distributions from net realized gain of $.127 per share.
H Total distributions of $.28 per share is comprised of distributions from net investment income of $.227 and distributions from net realized gain of $.055 per share.
I Amount represents less than .01%.
Financial Highlights - Service Class
Years ended December 31, | 2011 | 2010 | 2009 | 2008 | 2007 |
Selected Per-Share Data | | | | | |
Net asset value, beginning of period | $ 10.69 | $ 9.77 | $ 8.19 | $ 12.29 | $ 11.93 |
Income from Investment Operations | | | | | |
Net investment income (loss) C | .22 | .22 | .37 | .31 | .35 |
Net realized and unrealized gain (loss) | (.26) | 1.05 | 1.66 | (3.60) | .74 |
Total from investment operations | (.04) | 1.27 | 2.03 | (3.29) | 1.09 |
Distributions from net investment income | (.22) | (.22) | (.33) | (.29) | (.35) |
Distributions from net realized gain | (.06) | (.13) | (.12) | (.52) | (.38) |
Total distributions | (.28) | (.35) | (.45) | (.81) F | (.73) |
Net asset value, end of period | $ 10.37 | $ 10.69 | $ 9.77 | $ 8.19 | $ 12.29 |
Total Return A, B | (.41)% | 13.00% | 25.06% | (27.10)% | 9.23% |
Ratios to Average Net Assets D, E | | | | | |
Expenses before reductions | .10% | .10% | .10% | .10% | .10% |
Expenses net of fee waivers, if any | .10% | .10% | .10% | .10% | .10% |
Expenses net of all reductions | .10% | .10% | .10% | .10% | .10% |
Net investment income (loss) | 2.06% | 2.20% | 4.12% | 3.01% | 2.83% |
Supplemental Data | | | | | |
Net assets, end of period (000 omitted) | $ 7,743 | $ 2,723 | $ 1,524 | $ 936 | $ 477 |
Portfolio turnover rate | 26% | 30% | 23% | 27% | 18% |
A Total returns do not reflect charges attributable to your insurance company's separate account. Inclusion of these charges would reduce the total returns shown.
B Total returns would have been lower if certain expenses had not been reduced during the applicable periods shown.
C Calculated based on average shares outstanding during the period.
D Amounts do not include the activity of the Underlying Funds.
E Expense ratios reflect operating expenses of the class. Expenses before reductions do not reflect amounts reimbursed by the investment adviser or reductions from expense offset arrangements and do not represent the amount paid by the class during periods when reimbursements or reductions occur. Expenses net of fee waivers reflect expenses after reimbursement by the investment adviser but prior to reductions from expense offset arrangements. Expenses net of all reductions represent the net expenses paid by the class but do not include expenses of the investment companies in which the Fund invests.
F Total distributions of $.81 per share is comprised of distributions from net investment income of $.294 and distributions from net realized gain of $.515 per share.
See accompanying notes which are an integral part of the financial statements.
Annual Report
Financial Highlights - Service Class 2
Years ended December 31, | 2011 | 2010 | 2009 | 2008 | 2007 |
Selected Per-Share Data | | | | | |
Net asset value, beginning of period | $ 10.65 | $ 9.74 | $ 8.16 | $ 12.26 | $ 11.91 |
Income from Investment Operations | | | | | |
Net investment income (loss) C | .21 | .21 | .35 | .30 | .33 |
Net realized and unrealized gain (loss) | (.26) | 1.03 | 1.67 | (3.61) | .74 |
Total from investment operations | (.05) | 1.24 | 2.02 | (3.31) | 1.07 |
Distributions from net investment income | (.20) | (.20) | (.32) | (.28) | (.34) |
Distributions from net realized gain | (.06) | (.13) | (.12) | (.52) | (.38) |
Total distributions | (.26) | (.33) | (.44) | (.79) F | (.72) |
Net asset value, end of period | $ 10.34 | $ 10.65 | $ 9.74 | $ 8.16 | $ 12.26 |
Total Return A, B | (.52)% | 12.79% | 25.02% | (27.30)% | 9.07% |
Ratios to Average Net Assets D, E | | | | | |
Expenses before reductions | .25% | .25% | .25% | .25% | .25% |
Expenses net of fee waivers, if any | .25% | .25% | .25% | .25% | .25% |
Expenses net of all reductions | .25% | .25% | .25% | .25% | .25% |
Net investment income (loss) | 1.91% | 2.05% | 3.97% | 2.86% | 2.68% |
Supplemental Data | | | | | |
Net assets, end of period (000 omitted) | $ 55,246 | $ 56,112 | $ 42,534 | $ 25,855 | $ 24,497 |
Portfolio turnover rate | 26% | 30% | 23% | 27% | 18% |
A Total returns do not reflect charges attributable to your insurance company's separate account. Inclusion of these charges would reduce the total returns shown.
B Total returns would have been lower if certain expenses had not been reduced during the applicable periods shown.
C Calculated based on average shares outstanding during the period.
D Amounts do not include the activity of the Underlying Funds.
E Expense ratios reflect operating expenses of the class. Expenses before reductions do not reflect amounts reimbursed by the investment adviser or reductions from expense offset arrangements and do not represent the amount paid by the class during periods when reimbursements or reductions occur. Expenses net of fee waivers reflect expenses after reimbursement by the investment adviser but prior to reductions from expense offset arrangements. Expenses net of all reductions represent the net expenses paid by the class but do not include expenses of the investment companies in which the Fund invests.
F Total distributions of $.79 per share is comprised of distributions from net investment income of $.279 and distributions from net realized gain of $.515 per share.
See accompanying notes which are an integral part of the financial statements.
Annual Report
VIP Freedom 2020 Portfolio
Investment Changes (Unaudited)
Fund Holdings as of December 31, 2011 |
| % of fund's
net assets | % of fund's net assets
6 months ago |
Domestic Equity Funds | | |
VIP Contrafund Portfolio Initial Class | 6.8 | 7.0 |
VIP Equity-Income Portfolio Initial Class | 8.1 | 8.1 |
VIP Growth & Income Portfolio Initial Class | 8.1 | 8.1 |
VIP Growth Portfolio Initial Class | 7.9 | 8.3 |
VIP Mid Cap Portfolio Initial Class | 2.7 | 2.8 |
VIP Value Portfolio Initial Class | 7.0 | 6.9 |
VIP Value Strategies Portfolio Initial Class | 2.9 | 2.9 |
| 43.5 | 44.1 |
Developed International Equity Funds | | |
VIP Overseas Portfolio Initial Class | 11.6 | 13.5 |
Emerging Markets Equity Funds | | |
VIP Emerging Markets Portfolio Initial Class | 3.0 | 2.3 |
High Yield Bond Funds | | |
VIP High Income Portfolio Initial Class | 6.4 | 6.5 |
Investment Grade Bond Funds | | |
VIP Investment Grade Bond Portfolio Initial Class | 30.7 | 29.5 |
Short-Term Funds | | |
VIP Money Market Portfolio Initial Class | 4.8 | 4.1 |
Net Other Assets (Liabilities) * | 0.0 | 0.0 |
| 100.0 | 100.0 |
* Amount represents less than 0.1% |
Asset Allocation (% of fund's net assets) |
Current |
| Domestic Equity Funds | 43.5% | |
| Developed International Equity Funds | 11.6% | |
| Emerging Markets Equity Funds | 3.0% | |
| High Yield Bond Funds | 6.4% | |
| Investment Grade Bond Funds | 30.7% | |
| Short-Term Funds | 4.8% | |

Six months ago |
| Domestic Equity Funds | 44.1% | |
| Developed International Equity Funds | 13.5% | |
| Emerging Markets Equity Funds | 2.3% | |
| High Yield Bond Funds | 6.5% | |
| Investment Grade Bond Funds | 29.5% | |
| Short-Term Funds | 4.1% | |

Expected |
| Domestic Equity Funds | 41.2% | |
| Developed International Equity Funds | 12.9% | |
| Emerging Markets Equity Funds | 2.2% | |
| High Yield Bond Funds | 6.0% | |
| Investment Grade Bond Funds | 31.7% | |
| Short-Term Funds | 6.0% | |

The fund invests according to an asset allocation strategy that becomes increasingly conservative over time. The six months ago allocation is based on the fund's holdings as of June 30, 2011. The current allocation is based on the fund's holdings as of December 31, 2011. The expected allocation represents the fund's anticipated allocation at June 30, 2012. |
Annual Report
VIP Freedom 2020 Portfolio
Investments December 31, 2011
Showing Percentage of Net Assets
Domestic Equity Funds - 43.5% |
| Shares | | Value |
Domestic Equity Funds - 43.5% |
VIP Contrafund Portfolio Initial Class | 1,504,474 | | $ 34,632,985 |
VIP Equity-Income Portfolio Initial Class | 2,213,856 | | 41,376,968 |
VIP Growth & Income Portfolio Initial Class | 3,308,668 | | 41,656,135 |
VIP Growth Portfolio Initial Class | 1,090,025 | | 40,211,016 |
VIP Mid Cap Portfolio Initial Class | 479,220 | | 13,935,729 |
VIP Value Portfolio Initial Class | 3,361,392 | | 35,630,759 |
VIP Value Strategies Portfolio Initial Class | 1,661,721 | | 14,589,908 |
TOTAL DOMESTIC EQUITY FUNDS (Cost $226,369,852) |
222,033,500
|
International Equity Funds - 14.6% |
| | | |
Developed International Equity Funds - 11.6% |
VIP Overseas Portfolio Initial Class | 4,355,134 | | 59,360,471 |
Emerging Markets Equity Funds - 3.0% |
VIP Emerging Markets Portfolio Initial Class | 1,973,334 | | 15,273,606 |
TOTAL INTERNATIONAL EQUITY FUNDS (Cost $89,553,127) |
74,634,077
|
Bond Funds - 37.1% |
| Shares | | Value |
High Yield Bond Funds - 6.4% |
VIP High Income Portfolio Initial Class | 6,096,910 | | $ 32,862,346 |
Investment Grade Bond Funds - 30.7% |
VIP Investment Grade Bond Portfolio Initial Class | 12,096,102 | | 156,886,440 |
TOTAL BOND FUNDS (Cost $189,548,943) |
189,748,786
|
Short-Term Funds - 4.8% |
| | | |
VIP Money Market Portfolio Initial Class
(Cost $24,739,026) | 24,739,026 | |
24,739,026
|
TOTAL INVESTMENT PORTFOLIO - 100.0% (Cost $530,210,948) | | 511,155,389 |
NET OTHER ASSETS (LIABILITIES) - 0.0% | | (129,937) |
NET ASSETS - 100% | $ 511,025,452 |
Other Information |
All investments are categorized as Level 1 under the Fair Value Hierarchy. The inputs or methodology used for valuing securities may not be an indication of the risk associated with investing in those securities. For more information on valuation inputs, please refer to the Security Valuation section in the accompanying Notes to Financial Statements. |
See accompanying notes which are an integral part of the financial statements.
Annual Report
Fidelity VIP Freedom 2020 Portfolio
Statement of Assets and Liabilities
| December 31, 2011 |
| | |
Assets | | |
Investment in securities, at value (cost $530,210,948) - See accompanying schedule | | $ 511,155,389 |
Cash | | 160 |
Receivable for fund shares sold | | 1,141,807 |
Total assets | | 512,297,356 |
| | |
Liabilities | | |
Payable for investments purchased | $ 1,001,227 | |
Payable for fund shares redeemed | 180,652 | |
Distribution and service plan fees payable | 90,025 | |
Total liabilities | | 1,271,904 |
| | |
Net Assets | | $ 511,025,452 |
Net Assets consist of: | | |
Paid in capital | | $ 530,320,773 |
Accumulated undistributed net realized gain (loss) on investments | | (239,762) |
Net unrealized appreciation (depreciation) on investments | | (19,055,559) |
Net Assets | | $ 511,025,452 |
Statement of Assets and Liabilities - continued
| December 31, 2011 |
| | |
Initial Class:
Net Asset Value, offering price and redemption price per share ($47,730,562 ÷ 4,673,414 shares) | | $ 10.21 |
| | |
Service Class:
Net Asset Value, offering price and redemption price per share ($36,817,620 ÷ 3,610,661 shares) | | $ 10.20 |
| | |
Service Class 2:
Net Asset Value, offering price and redemption price per share ($426,477,270 ÷ 41,952,268 shares) | | $ 10.17 |
See accompanying notes which are an integral part of the financial statements.
Annual Report
Fidelity VIP Freedom 2020 Portfolio
Financial Statements - continued
Statement of Operations
| Year ended December 31, 2011 |
| | |
Investment Income | | |
Income distributions from underlying funds | | $ 11,339,995 |
Interest | | 3 |
Total income | | 11,339,998 |
| | |
Expenses | | |
Distribution and service plan fees | $ 970,454 | |
Independent trustees' compensation | 1,609 | |
Total expenses before reductions | 972,063 | |
Expense reductions | (1,609) | 970,454 |
Net investment income (loss) | | 10,369,544 |
Realized and Unrealized Gain (Loss) Realized gain (loss) on sale of underlying fund shares | 91,798 | |
Capital gain distributions from underlying funds | 3,729,006 | |
Total net realized gain (loss) | | 3,820,804 |
Change in net unrealized appreciation (depreciation) on underlying funds | | (22,099,443) |
Net gain (loss) | | (18,278,639) |
Net increase (decrease) in net assets resulting from operations | | $ (7,909,095) |
Statement of Changes in Net Assets
| Year ended
December 31,
2011 | Year ended
December 31,
2010 |
Increase (Decrease) in Net Assets | | |
Operations | | |
Net investment income (loss) | $ 10,369,544 | $ 7,410,113 |
Net realized gain (loss) | 3,820,804 | 1,627,031 |
Change in net unrealized appreciation (depreciation) | (22,099,443) | 35,177,912 |
Net increase (decrease) in net assets resulting from operations | (7,909,095) | 44,215,056 |
Distributions to shareholders from net investment income | (10,386,172) | (7,414,198) |
Distributions to shareholders from net realized gain | (1,960,572) | (2,619,651) |
Total distributions | (12,346,744) | (10,033,849) |
Share transactions - net increase (decrease) | 142,556,761 | 100,585,667 |
Total increase (decrease) in net assets | 122,300,922 | 134,766,874 |
| | |
Net Assets | | |
Beginning of period | 388,724,530 | 253,957,656 |
End of period | $ 511,025,452 | $ 388,724,530 |
See accompanying notes which are an integral part of the financial statements.
Annual Report
Financial Highlights - Initial Class
Years ended December 31, | 2011 | 2010 | 2009 | 2008 | 2007 |
Selected Per-Share Data | | | | | |
Net asset value, beginning of period | $ 10.59 | $ 9.52 | $ 7.71 | $ 12.63 | $ 12.10 |
Income from Investment Operations | | | | | |
Net investment income (loss) C | .26 | .26 | .33 | .32 | .35 |
Net realized and unrealized gain (loss) | (.37) | 1.11 | 1.88 | (4.38) | .88 |
Total from investment operations | (.11) | 1.37 | 2.21 | (4.06) | 1.23 |
Distributions from net investment income | (.23) | (.22) | (.29) | (.28) | (.27) |
Distributions from net realized gain | (.04) | (.08) | (.11) | (.59) | (.43) |
Total distributions | (.27) | (.30) | (.40) I | (.86) H | (.70) G |
Net asset value, end of period | $ 10.21 | $ 10.59 | $ 9.52 | $ 7.71 | $ 12.63 |
Total Return A, B | (1.03)% | 14.49% | 28.97% | (32.60)% | 10.23% |
Ratios to Average Net Assets D, F | | | | | |
Expenses before reductions E | .00% | .00% | .00% | .00% | .00% |
Expenses net of fee waivers, if any | .00% | .00% | .00% | .00% | .00% |
Expenses net of all reductions | .00% | .00% | .00% | .00% | .00% |
Net investment income (loss) | 2.47% | 2.61% | 3.93% | 3.07% | 2.76% |
Supplemental Data | | | | | |
Net assets, end of period (000 omitted) | $ 47,731 | $ 45,225 | $ 38,330 | $ 33,089 | $ 31,465 |
Portfolio turnover rate | 10% | 21% | 18% | 24% | 12% |
A Total returns do not reflect charges attributable to your insurance company's separate account. Inclusion of these charges would reduce the total returns shown.
B Total returns would have been lower if certain expenses had not been reduced during the applicable periods shown.
C Calculated based on average shares outstanding during the period.
D Amounts do not include the activity of the Underlying Funds.
E Amount represents less than .01%.
F Expense ratios reflect operating expenses of the class. Expenses before reductions do not reflect amounts reimbursed by the investment adviser or reductions from expense offset arrangements and do not represent the amount paid by the class during periods when reimbursements or reductions occur. Expenses net of fee waivers reflect expenses after reimbursement by the investment adviser but prior to reductions from expense offset arrangements. Expenses net of all reductions represent the net expenses paid by the class but do not include expenses of the investment companies in which the Fund invests.
G Total distributions of $.70 per share is comprised of distributions from net investment income of $.273 and distributions from net realized gain of $.425 per share.
H Total distributions of $.86 per share is comprised of distributions from net investment income of $.279 and distributions from net realized gain of $.585 per share.
I Total distributions of $.40 per share is comprised of distributions from net investment income of $.293 and distributions from net realized gain of $.107 per share.
Financial Highlights - Service Class
Years ended December 31, | 2011 | 2010 | 2009 | 2008 | 2007 |
Selected Per-Share Data | | | | | |
Net asset value, beginning of period | $ 10.58 | $ 9.50 | $ 7.70 | $ 12.62 | $ 12.09 |
Income from Investment Operations | | | | | |
Net investment income (loss) C | .25 | .25 | .32 | .31 | .34 |
Net realized and unrealized gain (loss) | (.37) | 1.12 | 1.87 | (4.38) | .88 |
Total from investment operations | (.12) | 1.37 | 2.19 | (4.07) | 1.22 |
Distributions from net investment income | (.22) | (.21) | (.29) | (.27) | (.26) |
Distributions from net realized gain | (.04) | (.08) | (.11) | (.59) | (.43) |
Total distributions | (.26) | (.29) | (.39) H | (.85) G | (.69) F |
Net asset value, end of period | $ 10.20 | $ 10.58 | $ 9.50 | $ 7.70 | $ 12.62 |
Total Return A, B | (1.12)% | 14.52% | 28.78% | (32.71)% | 10.17% |
Ratios to Average Net Assets D, E | | | | | |
Expenses before reductions | .10% | .10% | .10% | .10% | .10% |
Expenses net of fee waivers, if any | .10% | .10% | .10% | .10% | .10% |
Expenses net of all reductions | .10% | .10% | .10% | .10% | .10% |
Net investment income (loss) | 2.37% | 2.51% | 3.83% | 2.97% | 2.66% |
Supplemental Data | | | | | |
Net assets, end of period (000 omitted) | $ 36,818 | $ 33,244 | $ 25,941 | $ 18,325 | $ 19,881 |
Portfolio turnover rate | 10% | 21% | 18% | 24% | 12% |
A Total returns do not reflect charges attributable to your insurance company's separate account. Inclusion of these charges would reduce the total returns shown.
B Total returns would have been lower if certain expenses had not been reduced during the applicable periods shown.
C Calculated based on average shares outstanding during the period.
D Amounts do not include the activity of the Underlying Funds.
E Expense ratios reflect operating expenses of the class. Expenses before reductions do not reflect amounts reimbursed by the investment adviser or reductions from expense offset arrangements and do not represent the amount paid by the class during periods when reimbursements or reductions occur. Expenses net of fee waivers reflect expenses after reimbursement by the investment adviser but prior to reductions from expense offset arrangements. Expenses net of all reductions represent the net expenses paid by the class but do not include expenses of the investment companies in which the Fund invests.
F Total distributions of $.69 per share is comprised of distributions from net investment income of $.264 and distributions from net realized gain of $.425 per share.
G Total distributions of $.85 per share is comprised of distributions from net investment income of $.269 and distributions from net realized gain of $.585 per share.
H Total distributions of $.39 per share is comprised of distributions from net investment income of $.285 and distributions from net realized gain of $.107 per share.
See accompanying notes which are an integral part of the financial statements.
Annual Report
Financial Highlights - Service Class 2
Years ended December 31, | 2011 | 2010 | 2009 | 2008 | 2007 |
Selected Per-Share Data | | | | | |
Net asset value, beginning of period | $ 10.55 | $ 9.48 | $ 7.69 | $ 12.60 | $ 12.08 |
Income from Investment Operations | | | | | |
Net investment income (loss) C | .24 | .23 | .31 | .30 | .32 |
Net realized and unrealized gain (loss) | (.37) | 1.12 | 1.86 | (4.37) | .87 |
Total from investment operations | (.13) | 1.35 | 2.17 | (4.07) | 1.19 |
Distributions from net investment income | (.21) | (.20) | (.28) | (.26) | (.25) |
Distributions from net realized gain | (.04) | (.08) | (.11) | (.59) | (.43) |
Total distributions | (.25) | (.28) | (.38) H | (.84) G | (.67) F |
Net asset value, end of period | $ 10.17 | $ 10.55 | $ 9.48 | $ 7.69 | $ 12.60 |
Total Return A, B | (1.24)% | 14.33% | 28.55% | (32.80)% | 9.97% |
Ratios to Average Net Assets D, E | | | | | |
Expenses before reductions | .25% | .25% | .25% | .25% | .25% |
Expenses net of fee waivers, if any | .25% | .25% | .25% | .25% | .25% |
Expenses net of all reductions | .25% | .25% | .25% | .25% | .25% |
Net investment income (loss) | 2.22% | 2.36% | 3.68% | 2.82% | 2.51% |
Supplemental Data | | | | | |
Net assets, end of period (000 omitted) | $ 426,477 | $ 310,255 | $ 189,686 | $ 106,530 | $ 119,395 |
Portfolio turnover rate | 10% | 21% | 18% | 24% | 12% |
A Total returns do not reflect charges attributable to your insurance company's separate account. Inclusion of these charges would reduce the total returns shown.
B Total returns would have been lower if certain expenses had not been reduced during the applicable periods shown.
C Calculated based on average shares outstanding during the period.
D Amounts do not include the activity of the Underlying Funds.
E Expense ratios reflect operating expenses of the class. Expenses before reductions do not reflect amounts reimbursed by the investment adviser or reductions from expense offset arrangements and do not represent the amount paid by the class during periods when reimbursements or reductions occur. Expenses net of fee waivers reflect expenses after reimbursement by the investment adviser but prior to reductions from expense offset arrangements. Expenses net of all reductions represent the net expenses paid by the class but do not include expenses of the investment companies in which the Fund invests.
F Total distributions of $.67 per share is comprised of distributions from net investment income of $.249 and distributions from net realized gain of $.425 per share.
G Total distributions of $.84 per share is comprised of distributions from net investment income of $.255 and distributions from net realized gain of $.585 per share.
H Total distributions of $.38 per share is comprised of distributions from net investment income of $.275 and distributions from net realized gain of $.107 per share.
See accompanying notes which are an integral part of the financial statements.
Annual Report
VIP Freedom 2025 Portfolio
Investment Changes (Unaudited)
Fund Holdings as of December 31, 2011 |
| % of fund's
net assets | % of fund's net assets
6 months ago |
Domestic Equity Funds | | |
VIP Contrafund Portfolio Initial Class | 8.0 | 8.1 |
VIP Equity-Income Portfolio Initial Class | 9.5 | 9.4 |
VIP Growth & Income Portfolio Initial Class | 9.6 | 9.4 |
VIP Growth Portfolio Initial Class | 9.3 | 9.6 |
VIP Mid Cap Portfolio Initial Class | 3.2 | 3.3 |
VIP Value Portfolio Initial Class | 8.2 | 8.0 |
VIP Value Strategies Portfolio Initial Class | 3.4 | 3.4 |
| 51.2 | 51.2 |
Developed International Equity Funds | | |
VIP Overseas Portfolio Initial Class | 13.7 | 15.7 |
Emerging Markets Equity Funds | | |
VIP Emerging Markets Portfolio Initial Class | 3.6 | 2.7 |
High Yield Bond Funds | | |
VIP High Income Portfolio Initial Class | 7.7 | 7.5 |
Investment Grade Bond Funds | | |
VIP Investment Grade Bond Portfolio Initial Class | 23.6 | 22.8 |
Short-Term Funds | | |
VIP Money Market Portfolio Initial Class | 0.2 | 0.1 |
Net Other Assets (Liabilities) * | 0.0 | 0.0 |
| 100.0 | 100.0 |
* Amount represents less than 0.1% |
Asset Allocation (% of fund's net assets) |
Current |
| Domestic Equity Funds | 51.2% | |
| Developed International Equity Funds | 13.7% | |
| Emerging Markets Equity Funds | 3.6% | |
| High Yield Bond Funds | 7.7% | |
| Investment Grade Bond Funds | 23.6% | |
| Short-Term Funds | 0.2% | |

Six months ago |
| Domestic Equity Funds | 51.2% | |
| Developed International Equity Funds | 15.7% | |
| Emerging Markets Equity Funds | 2.7% | |
| High Yield Bond Funds | 7.5% | |
| Investment Grade Bond Funds | 22.8% | |
| Short-Term Funds | 0.1% | |

Expected |
| Domestic Equity Funds | 49.9% | |
| Developed International Equity Funds | 15.5% | |
| Emerging Markets Equity Funds | 2.7% | |
| High Yield Bond Funds | 7.4% | |
| Investment Grade Bond Funds | 24.1% | |
| Short-Term Funds | 0.4% | |

The fund invests according to an asset allocation strategy that becomes increasingly conservative over time. The six months ago allocation is based on the fund's holdings as of June 30, 2011. The current allocation is based on the fund's holdings as of December 31, 2011. The expected allocation represents the fund's anticipated allocation at June 30, 2012. |
Annual Report
VIP Freedom 2025 Portfolio
Investments December 31, 2011
Showing Percentage of Net Assets
Domestic Equity Funds - 51.2% |
| Shares | | Value |
Domestic Equity Funds - 51.2% |
VIP Contrafund Portfolio Initial Class | 168,490 | | $ 3,878,644 |
VIP Equity-Income Portfolio Initial Class | 247,735 | | 4,630,169 |
VIP Growth & Income Portfolio Initial Class | 370,266 | | 4,661,653 |
VIP Growth Portfolio Initial Class | 122,153 | | 4,506,214 |
VIP Mid Cap Portfolio Initial Class | 53,826 | | 1,565,248 |
VIP Value Portfolio Initial Class | 376,180 | | 3,987,504 |
VIP Value Strategies Portfolio Initial Class | 186,460 | | 1,637,120 |
TOTAL DOMESTIC EQUITY FUNDS (Cost $25,753,680) |
24,866,552
|
International Equity Funds - 17.3% |
| | | |
Developed International Equity Funds - 13.7% |
VIP Overseas Portfolio Initial Class | 489,210 | | 6,667,936 |
Emerging Markets Equity Funds - 3.6% |
VIP Emerging Markets Portfolio Initial Class | 221,634 | | 1,715,446 |
TOTAL INTERNATIONAL EQUITY FUNDS (Cost $10,107,608) |
8,383,382
|
Bond Funds - 31.3% |
| Shares | | Value |
High Yield Bond Funds - 7.7% |
VIP High Income Portfolio Initial Class | 689,307 | | $ 3,715,367 |
Investment Grade Bond Funds - 23.6% |
VIP Investment Grade Bond Portfolio Initial Class | 885,213 | | 11,481,215 |
TOTAL BOND FUNDS (Cost $15,361,409) |
15,196,582
|
Short-Term Funds - 0.2% |
| | | |
VIP Money Market Portfolio Initial Class
(Cost $124,047) | 124,047 | |
124,047
|
TOTAL INVESTMENT PORTFOLIO - 100.0% (Cost $51,346,744) | | 48,570,563 |
NET OTHER ASSETS (LIABILITIES) - 0.0% | | (16,314) |
NET ASSETS - 100% | $ 48,554,249 |
Other Information |
All investments are categorized as Level 1 under the Fair Value Hierarchy. The inputs or methodology used for valuing securities may not be an indication of the risk associated with investing in those securities. For more information on valuation inputs, please refer to the Security Valuation section in the accompanying Notes to Financial Statements. |
See accompanying notes which are an integral part of the financial statements.
Annual Report
Fidelity VIP Freedom 2025 Portfolio
Statement of Assets and Liabilities
| December 31, 2011 |
| | |
Assets | | |
Investment in securities, at value (cost $51,346,744) - See accompanying schedule | | $ 48,570,563 |
Cash | | 67 |
Receivable for investments sold | | 435,262 |
Receivable for fund shares sold | | 33,858 |
Total assets | | 49,039,750 |
| | |
Liabilities | | |
Payable for fund shares redeemed | $ 479,798 | |
Distribution and service plan fees payable | 5,703 | |
Total liabilities | | 485,501 |
| | |
Net Assets | | $ 48,554,249 |
Net Assets consist of: | | |
Paid in capital | | $ 51,454,726 |
Accumulated undistributed net realized gain (loss) on investments | | (124,296) |
Net unrealized appreciation (depreciation) on investments | | (2,776,181) |
Net Assets | | $ 48,554,249 |
Statement of Assets and Liabilities - continued
| December 31, 2011 |
| | |
Initial Class:
Net Asset Value, offering price and redemption price per share ($15,536,509 ÷ 1,551,124 shares) | | $ 10.02 |
| | |
Service Class:
Net Asset Value, offering price and redemption price per share ($7,149,002 ÷ 714,369 shares) | | $ 10.01 |
| | |
Service Class 2:
Net Asset Value, offering price and redemption price per share ($25,868,738 ÷ 2,595,164 shares) | | $ 9.97 |
See accompanying notes which are an integral part of the financial statements.
Annual Report
Statement of Operations
| Year ended December 31, 2011 |
| | |
Investment Income | | |
Income distributions from underlying funds | | $ 1,037,270 |
| | |
Expenses | | |
Distribution and service plan fees | $ 65,477 | |
Independent trustees' compensation | 162 | |
Total expenses before reductions | 65,639 | |
Expense reductions | (162) | 65,477 |
Net investment income (loss) | | 971,793 |
Realized and Unrealized Gain (Loss) Realized gain (loss) on sale of underlying fund shares | 4,069 | |
Capital gain distributions from underlying funds | 305,332 | |
Total net realized gain (loss) | | 309,401 |
Change in net unrealized appreciation (depreciation) on underlying funds | | (2,312,775) |
Net gain (loss) | | (2,003,374) |
Net increase (decrease) in net assets resulting from operations | | $ (1,031,581) |
Statement of Changes in Net Assets
| Year ended
December 31,
2011 | Year ended
December 31,
2010 |
Increase (Decrease) in Net Assets | | |
Operations | | |
Net investment income (loss) | $ 971,793 | $ 797,639 |
Net realized gain (loss) | 309,401 | 159,679 |
Change in net unrealized appreciation (depreciation) | (2,312,775) | 3,475,839 |
Net increase (decrease) in net assets resulting from operations | (1,031,581) | 4,433,157 |
Distributions to shareholders from net investment income | (970,164) | (799,512) |
Distributions to shareholders from net realized gain | (158,174) | (217,768) |
Total distributions | (1,128,338) | (1,017,280) |
Share transactions - net increase (decrease) | 9,114,938 | 14,354,269 |
Total increase (decrease) in net assets | 6,955,019 | 17,770,146 |
| | |
Net Assets | | |
Beginning of period | 41,599,230 | 23,829,084 |
End of period | $ 48,554,249 | $ 41,599,230 |
See accompanying notes which are an integral part of the financial statements.
Annual Report
Financial Highlights - Initial Class
Years ended December 31, | 2011 | 2010 | 2009 | 2008 | 2007 |
Selected Per-Share Data | | | | | |
Net asset value, beginning of period | $ 10.49 | $ 9.30 | $ 7.49 | $ 12.71 | $ 12.18 |
Income from Investment Operations | | | | | |
Net investment income (loss) C | .24 | .28 | .32 | .31 | .38 |
Net realized and unrealized gain (loss) | (.46) | 1.19 | 1.89 | (4.58) | .89 |
Total from investment operations | (.22) | 1.47 | 2.21 | (4.27) | 1.27 |
Distributions from net investment income | (.22) | (.21) | (.29) | (.28) | (.27) |
Distributions from net realized gain | (.03) | (.06) | (.12) | (.67) | (.47) |
Total distributions | (.25) | (.28) G | (.40) F | (.95) | (.74) |
Net asset value, end of period | $ 10.02 | $ 10.49 | $ 9.30 | $ 7.49 | $ 12.71 |
Total Return A, B | (2.11)% | 15.79% | 30.05% | (34.16)% | 10.50% |
Ratios to Average Net Assets D, E | | | | | |
Expenses before reductions H | .00% | .00% | .00% | .00% | .00% |
Expenses net of fee waivers, if any | .00% | .00% | .00% | .00% | .00% |
Expenses net of all reductions | .00% | .00% | .00% | .00% | .00% |
Net investment income (loss) | 2.25% | 2.91% | 3.84% | 2.90% | 2.95% |
Supplemental Data | | | | | |
Net assets, end of period (000 omitted) | $ 15,537 | $ 17,388 | $ 14,888 | $ 11,015 | $ 15,197 |
Portfolio turnover rate | 21% | 25% | 30% | 36% | 20% |
A Total returns do not reflect charges attributable to your insurance company's separate account. Inclusion of these charges would reduce the total returns shown.
B Total returns would have been lower if certain expenses had not been reduced during the applicable periods shown.
C Calculated based on average shares outstanding during the period.
D Amounts do not include the activity of the Underlying Funds.
E Expense ratios reflect operating expenses of the class. Expenses before reductions do not reflect amounts reimbursed by the investment adviser or reductions from expense offset arrangements and do not represent the amount paid by the class during periods when reimbursements or reductions occur. Expenses net of fee waivers reflect expenses after reimbursement by the investment adviser but prior to reductions from expense offset arrangements. Expenses net of all reductions represent the net expenses paid by the class but do not include expenses of the investment companies in which the Fund invests.
F Total distributions of $.40 per share is comprised of distributions from net investment income of $.285 and distributions from net realized gain of $.117 per share.
G Total distributions of $.28 per share is comprised of distributions from net investment income of $.214 and distributions from net realized gain of $.061 per share.
H Amount represents less than .01%.
Financial Highlights - Service Class
Years ended December 31, | 2011 | 2010 | 2009 | 2008 | 2007 |
Selected Per-Share Data | | | | | |
Net asset value, beginning of period | $ 10.49 | $ 9.30 | $ 7.49 | $ 12.70 | $ 12.18 |
Income from Investment Operations | | | | | |
Net investment income (loss) C | .23 | .27 | .31 | .29 | .37 |
Net realized and unrealized gain (loss) | (.47) | 1.19 | 1.90 | (4.56) | .87 |
Total from investment operations | (.24) | 1.46 | 2.21 | (4.27) | 1.24 |
Distributions from net investment income | (.21) | (.21) | (.28) | (.27) | (.25) |
Distributions from net realized gain | (.03) | (.06) | (.12) | (.67) | (.47) |
Total distributions | (.24) | (.27) | (.40) F | (.94) | (.72) |
Net asset value, end of period | $ 10.01 | $ 10.49 | $ 9.30 | $ 7.49 | $ 12.70 |
Total Return A, B | (2.26)% | 15.70% | 29.96% | (34.20)% | 10.31% |
Ratios to Average Net Assets D, E | | | | | |
Expenses before reductions | .10% | .10% | .10% | .10% | .10% |
Expenses net of fee waivers, if any | .10% | .10% | .10% | .10% | .10% |
Expenses net of all reductions | .10% | .10% | .10% | .10% | .10% |
Net investment income (loss) | 2.16% | 2.81% | 3.74% | 2.80% | 2.85% |
Supplemental Data | | | | | |
Net assets, end of period (000 omitted) | $ 7,149 | $ 1,429 | $ 679 | $ 403 | $ 497 |
Portfolio turnover rate | 21% | 25% | 30% | 36% | 20% |
A Total returns do not reflect charges attributable to your insurance company's separate account. Inclusion of these charges would reduce the total returns shown.
B Total returns would have been lower if certain expenses had not been reduced during the applicable periods shown.
C Calculated based on average shares outstanding during the period.
D Amounts do not include the activity of the Underlying Funds.
E Expense ratios reflect operating expenses of the class. Expenses before reductions do not reflect amounts reimbursed by the investment adviser or reductions from expense offset arrangements and do not represent the amount paid by the class during periods when reimbursements or reductions occur. Expenses net of fee waivers reflect expenses after reimbursement by the investment adviser but prior to reductions from expense offset arrangements. Expenses net of all reductions represent the net expenses paid by the class but do not include expenses of the investment companies in which the Fund invests.
F Total distributions of $.40 per share is comprised of distributions from net investment income of $.278 and distributions from net realized gain of $.117 per share.
See accompanying notes which are an integral part of the financial statements.
Annual Report
Financial Highlights - Service Class 2
Years ended December 31, | 2011 | 2010 | 2009 | 2008 | 2007 |
Selected Per-Share Data | | | | | |
Net asset value, beginning of period | $ 10.44 | $ 9.27 | $ 7.47 | $ 12.68 | $ 12.17 |
Income from Investment Operations | | | | | |
Net investment income (loss) C | .21 | .26 | .30 | .28 | .35 |
Net realized and unrealized gain (loss) | (.45) | 1.17 | 1.89 | (4.57) | .89 |
Total from investment operations | (.24) | 1.43 | 2.19 | (4.29) | 1.24 |
Distributions from net investment income | (.19) | (.20) | (.27) | (.25) | (.26) |
Distributions from net realized gain | (.03) | (.06) | (.12) | (.67) | (.47) |
Total distributions | (.23) G | (.26) | (.39) F | (.92) | (.73) |
Net asset value, end of period | $ 9.97 | $ 10.44 | $ 9.27 | $ 7.47 | $ 12.68 |
Total Return A, B | (2.35)% | 15.47% | 29.79% | (34.36)% | 10.26% |
Ratios to Average Net Assets D, E | | | | | |
Expenses before reductions | .25% | .25% | .25% | .25% | .25% |
Expenses net of fee waivers, if any | .25% | .25% | .25% | .25% | .25% |
Expenses net of all reductions | .25% | .25% | .25% | .25% | .25% |
Net investment income (loss) | 2.00% | 2.67% | 3.59% | 2.65% | 2.70% |
Supplemental Data | | | | | |
Net assets, end of period (000 omitted) | $ 25,869 | $ 22,782 | $ 8,262 | $ 3,676 | $ 3,998 |
Portfolio turnover rate | 21% | 25% | 30% | 36% | 20% |
A Total returns do not reflect charges attributable to your insurance company's separate account. Inclusion of these charges would reduce the total returns shown.
B Total returns would have been lower if certain expenses had not been reduced during the applicable periods shown.
C Calculated based on average shares outstanding during the period.
D Amounts do not include the activity of the Underlying Funds.
E Expense ratios reflect operating expenses of the class. Expenses before reductions do not reflect amounts reimbursed by the investment adviser or reductions from expense offset arrangements and do not represent the amount paid by the class during periods when reimbursements or reductions occur. Expenses net of fee waivers reflect expenses after reimbursement by the investment adviser but prior to reductions from expense offset arrangements. Expenses net of all reductions represent the net expenses paid by the class but do not include expenses of the investment companies in which the Fund invests.
F Total distributions of $.39 per share is comprised of distributions from net investment income of $.270 and distributions from net realized gain of $.117 per share.
G Total distributions of $.23 per share is comprised of distributions from net investment income of $.192 and distributions from net realized gain of $.033 per share.
See accompanying notes which are an integral part of the financial statements.
Annual Report
VIP Freedom 2030 Portfolio
Investment Changes (Unaudited)
Fund Holdings as of December 31, 2011 |
| % of fund's
net assets | % of fund's net assets
6 months ago |
Domestic Equity Funds | | |
VIP Contrafund Portfolio Initial Class | 8.4 | 8.5 |
VIP Equity-Income Portfolio Initial Class | 10.0 | 10.0 |
VIP Growth & Income Portfolio Initial Class | 10.1 | 9.9 |
VIP Growth Portfolio Initial Class | 9.8 | 10.1 |
VIP Mid Cap Portfolio Initial Class | 3.4 | 3.5 |
VIP Value Portfolio Initial Class | 8.6 | 8.5 |
VIP Value Strategies Portfolio Initial Class | 3.5 | 3.6 |
| 53.8 | 54.1 |
Developed International Equity Funds | | |
VIP Overseas Portfolio Initial Class | 14.4 | 16.6 |
Emerging Markets Equity Funds | | |
VIP Emerging Markets Portfolio Initial Class | 3.7 | 2.9 |
High Yield Bond Funds | | |
VIP High Income Portfolio Initial Class | 7.7 | 7.5 |
Investment Grade Bond Funds | | |
VIP Investment Grade Bond Portfolio Initial Class | 20.4 | 18.9 |
Net Other Assets (Liabilities)* | 0.0 | 0.0 |
| 100.0 | 100.0 |
* Amount represents less than 0.1% |
Asset Allocation (% of fund's net assets) |
Current |
| Domestic Equity Funds | 53.8% | |
| Developed International Equity Funds | 14.4% | |
| Emerging Markets Equity Funds | 3.7% | |
 | High Yield Bond Funds | 7.7% | |
| Investment Grade Bond Funds | 20.4% | |

Six months ago |
| Domestic Equity Funds | 54.1% | |
| Developed International Equity Funds | 16.6% | |
| Emerging Markets Equity Funds | 2.9% | |
| High Yield Bond Funds | 7.5% | |
| Investment Grade Bond Funds | 18.9% | |

Expected |
| Domestic Equity Funds | 52.0% | |
| Developed International Equity Funds | 16.1% | |
| Emerging Markets Equity Funds | 2.9% | |
| High Yield Bond Funds | 7.5% | |
| Investment Grade Bond Funds | 21.5% | |

The fund invests according to an asset allocation strategy that becomes increasingly conservative over time. The six months ago allocation is based on the fund's holdings as of June 30, 2011. The current allocation is based on the fund's holdings as of December 31, 2011. The expected allocation represents the fund's anticipated allocation at June 30, 2012. |
Annual Report
VIP Freedom 2030 Portfolio
Investments December 31, 2011
Showing Percentage of Net Assets
Domestic Equity Funds - 53.8% |
| Shares | | Value |
Domestic Equity Funds - 53.8% |
VIP Contrafund Portfolio Initial Class | 433,539 | | $ 9,980,060 |
VIP Equity-Income Portfolio Initial Class | 638,259 | | 11,929,065 |
VIP Growth & Income Portfolio Initial Class | 954,045 | | 12,011,431 |
VIP Growth Portfolio Initial Class | 314,364 | | 11,596,880 |
VIP Mid Cap Portfolio Initial Class | 138,439 | | 4,025,820 |
VIP Value Portfolio Initial Class | 968,786 | | 10,269,128 |
VIP Value Strategies Portfolio Initial Class | 480,214 | | 4,216,277 |
TOTAL DOMESTIC EQUITY FUNDS (Cost $68,168,369) |
64,028,661
|
International Equity Funds - 18.1% |
| | | |
Developed International Equity Funds - 14.4% |
VIP Overseas Portfolio Initial Class | 1,255,186 | | 17,108,183 |
Emerging Markets Equity Funds - 3.7% |
VIP Emerging Markets Portfolio Initial Class | 568,106 | | 4,397,137 |
TOTAL INTERNATIONAL EQUITY FUNDS (Cost $26,675,452) |
21,505,320
|
Bond Funds - 28.1% |
| Shares | | Value |
High Yield Bond Funds - 7.7% |
VIP High Income Portfolio Initial Class | 1,696,666 | | $ 9,145,031 |
Investment Grade Bond Funds - 20.4% |
VIP Investment Grade Bond Portfolio Initial Class | 1,871,976 | | 24,279,525 |
TOTAL BOND FUNDS (Cost $33,755,097) |
33,424,556
|
TOTAL INVESTMENT PORTFOLIO - 100.0% (Cost $128,598,918) | | 118,958,537 |
NET OTHER ASSETS (LIABILITIES) - 0.0% | | (21,252) |
NET ASSETS - 100% | $ 118,937,285 |
Other Information |
All investments are categorized as Level 1 under the Fair Value Hierarchy. The inputs or methodology used for valuing securities may not be an indication of the risk associated with investing in those securities. For more information on valuation inputs, please refer to the Security Valuation section in the accompanying Notes to Financial Statements. |
See accompanying notes which are an integral part of the financial statements.
Annual Report
VIP Freedom 2030 Portfolio
Statement of Assets and Liabilities
| December 31, 2011 |
| | |
Assets | | |
Investment in securities, at value (cost $128,598,918) - See accompanying schedule | | $ 118,958,537 |
Cash | | 40,632 |
Receivable for fund shares sold | | 193,204 |
Total assets | | 119,192,373 |
| | |
Liabilities | | |
Payable for investments purchased | $ 60,222 | |
Payable for fund shares redeemed | 180,268 | |
Distribution and service plan fees payable | 14,598 | |
Total liabilities | | 255,088 |
| | |
Net Assets | | $ 118,937,285 |
Net Assets consist of: | | |
Paid in capital | | $ 129,430,130 |
Accumulated undistributed net realized gain (loss) on investments | | (852,464) |
Net unrealized appreciation (depreciation) on investments | | (9,640,381) |
Net Assets | | $ 118,937,285 |
Statement of Assets and Liabilities - continued
| December 31, 2011 |
| | |
Initial Class:
Net Asset Value, offering price and redemption price per share ($30,601,046 ÷ 3,155,255 shares) | | $ 9.70 |
| | |
Service Class:
Net Asset Value, offering price and redemption price per share ($28,665,627 ÷ 2,958,693 shares) | | $ 9.69 |
| | |
Service Class 2:
Net Asset Value, offering price and redemption price per share ($59,670,612 ÷ 6,173,786 shares) | | $ 9.67 |
See accompanying notes which are an integral part of the financial statements.
Annual Report
VIP Freedom 2030 Portfolio
Financial Statements - continued
Statement of Operations
| Year ended December 31, 2011 |
| | |
Investment Income | | |
Income distributions from underlying funds | | $ 2,578,106 |
Interest | | 1 |
Total income | | 2,578,107 |
| | |
Expenses | | |
Distribution and service plan fees | $ 166,458 | |
Independent trustees' compensation | 402 | |
Total expenses before reductions | 166,860 | |
Expense reductions | (402) | 166,458 |
Net investment income (loss) | | 2,411,649 |
Realized and Unrealized Gain (Loss) Realized gain (loss) on sale of underlying fund shares | (64,882) | |
Capital gain distributions from underlying funds | 636,278 | |
Total net realized gain (loss) | | 571,396 |
Change in net unrealized appreciation (depreciation) on underlying funds | | (6,493,930) |
Net gain (loss) | | (5,922,534) |
Net increase (decrease) in net assets resulting from operations | | $ (3,510,885) |
Statement of Changes in Net Assets
| Year ended
December 31,
2011 | Year ended
December 31,
2010 |
Increase (Decrease) in Net Assets | | |
Operations | | |
Net investment income (loss) | $ 2,411,649 | $ 1,775,471 |
Net realized gain (loss) | 571,396 | 472,595 |
Change in net unrealized appreciation (depreciation) | (6,493,930) | 10,749,816 |
Net increase (decrease) in net assets resulting from operations | (3,510,885) | 12,997,882 |
Distributions to shareholders from net investment income | (2,415,727) | (1,775,488) |
Distributions to shareholders from net realized gain | (360,538) | (668,951) |
Total distributions | (2,776,265) | (2,444,439) |
Share transactions - net increase (decrease) | 23,596,541 | 16,267,172 |
Total increase (decrease) in net assets | 17,309,391 | 26,820,615 |
| | |
Net Assets | | |
Beginning of period | 101,627,894 | 74,807,279 |
End of period | $ 118,937,285 | $ 101,627,894 |
See accompanying notes which are an integral part of the financial statements.
Annual Report
Financial Highlights - Initial Class
Years ended December 31, | 2011 | 2010 | 2009 | 2008 | 2007 |
Selected Per-Share Data | | | | | |
Net asset value, beginning of period | $ 10.21 | $ 9.03 | $ 7.12 | $ 13.02 | $ 12.44 |
Income from Investment Operations | | | | | |
Net investment income (loss) C | .23 | .21 | .24 | .28 | .34 |
Net realized and unrealized gain (loss) | (.49) | 1.24 | 1.96 | (5.14) | 1.06 |
Total from investment operations | (.26) | 1.45 | 2.20 | (4.86) | 1.40 |
Distributions from net investment income | (.22) | (.20) | (.18) | (.25) | (.28) |
Distributions from net realized gain | (.03) | (.07) | (.11) | (.80) | (.54) |
Total distributions | (.25) | (.27) | (.29) | (1.04) F | (.82) |
Net asset value, end of period | $ 9.70 | $ 10.21 | $ 9.03 | $ 7.12 | $ 13.02 |
Total Return A, B | (2.60)% | 16.08% | 31.66% | (38.04)% | 11.37% |
Ratios to Average Net Assets D, E | | | | | |
Expenses before reductions G | .00% | .00% | .00% | .00% | .00% |
Expenses net of fee waivers, if any | .00% | .00% | .00% | .00% | .00% |
Expenses net of all reductions | .00% | .00% | .00% | .00% | .00% |
Net investment income (loss) | 2.27% | 2.25% | 3.13% | 2.69% | 2.56% |
Supplemental Data | | | | | |
Net assets, end of period (000 omitted) | $ 30,601 | $ 28,917 | $ 23,836 | $ 19,592 | $ 23,767 |
Portfolio turnover rate | 16% | 25% | 24% | 23% | 17% |
A Total returns do not reflect charges attributable to your insurance company's separate account. Inclusion of these charges would reduce the total returns shown.
B Total returns would have been lower if certain expenses had not been reduced during the applicable periods shown.
C Calculated based on average shares outstanding during the period.
D Amounts do not include the activity of the Underlying Funds.
E Expense ratios reflect operating expenses of the class. Expenses before reductions do not reflect amounts reimbursed by the investment adviser or reductions from expense offset arrangements and do not represent the amount paid by the class during periods when reimbursements or reductions occur. Expenses net of fee waivers reflect expenses after reimbursement by the investment adviser but prior to reductions from expense offset arrangements. Expenses net of all reductions represent the net expenses paid by the class but do not include expenses of the investment companies in which the Fund invests.
F Total distributions of $1.04 per share is comprised of distributions from net investment income of $.245 and distributions from net realized gain of $.795 per share.
G Amount represents less than .01%.
Financial Highlights - Service Class
Years ended December 31, | 2011 | 2010 | 2009 | 2008 | 2007 |
Selected Per-Share Data | | | | | |
Net asset value, beginning of period | $ 10.20 | $ 9.02 | $ 7.12 | $ 13.01 | $ 12.44 |
Income from Investment Operations | | | | | |
Net investment income (loss) C | .22 | .20 | .24 | .27 | .33 |
Net realized and unrealized gain (loss) | (.49) | 1.24 | 1.94 | (5.13) | 1.05 |
Total from investment operations | (.27) | 1.44 | 2.18 | (4.86) | 1.38 |
Distributions from net investment income | (.21) | (.19) | (.17) | (.24) | (.27) |
Distributions from net realized gain | (.03) | (.07) | (.11) | (.80) | (.54) |
Total distributions | (.24) | (.26) | (.28) | (1.03) F | (.81) |
Net asset value, end of period | $ 9.69 | $ 10.20 | $ 9.02 | $ 7.12 | $ 13.01 |
Total Return A, B | (2.70)% | 16.00% | 31.40% | (38.08)% | 11.21% |
Ratios to Average Net Assets D, E | | | | | |
Expenses before reductions | .10% | .10% | .10% | .10% | .10% |
Expenses net of fee waivers, if any | .10% | .10% | .10% | .10% | .10% |
Expenses net of all reductions | .10% | .10% | .10% | .10% | .10% |
Net investment income (loss) | 2.17% | 2.15% | 3.03% | 2.59% | 2.46% |
Supplemental Data | | | | | |
Net assets, end of period (000 omitted) | $ 28,666 | $ 23,137 | $ 16,162 | $ 10,298 | $ 12,884 |
Portfolio turnover rate | 16% | 25% | 24% | 23% | 17% |
A Total returns do not reflect charges attributable to your insurance company's separate account. Inclusion of these charges would reduce the total returns shown.
B Total returns would have been lower if certain expenses had not been reduced during the applicable periods shown.
C Calculated based on average shares outstanding during the period.
D Amounts do not include the activity of the Underlying Funds.
E Expense ratios reflect operating expenses of the class. Expenses before reductions do not reflect amounts reimbursed by the investment adviser or reductions from expense offset arrangements and do not represent the amount paid by the class during periods when reimbursements or reductions occur. Expenses net of fee waivers reflect expenses after reimbursement by the investment adviser but prior to reductions from expense offset arrangements. Expenses net of all reductions represent the net expenses paid by the class but do not include expenses of the investment companies in which the Fund invests.
F Total distributions of $1.03 per share is comprised of distributions from net investment income of $.235 and distributions from net realized gain of $.795 per share.
See accompanying notes which are an integral part of the financial statements.
Annual Report
Financial Highlights - Service Class 2
Years ended December 31, | 2011 | 2010 | 2009 | 2008 | 2007 |
Selected Per-Share Data | | | | | |
Net asset value, beginning of period | $ 10.18 | $ 9.00 | $ 7.11 | $ 12.99 | $ 12.42 |
Income from Investment Operations | | | | | |
Net investment income (loss) C | .21 | .19 | .23 | .26 | .31 |
Net realized and unrealized gain (loss) | (.50) | 1.24 | 1.93 | (5.12) | 1.05 |
Total from investment operations | (.29) | 1.43 | 2.16 | (4.86) | 1.36 |
Distributions from net investment income | (.19) | (.17) | (.16) | (.22) | (.25) |
Distributions from net realized gain | (.03) | (.07) | (.11) | (.80) | (.54) |
Total distributions | (.22) | (.25) F | (.27) | (1.02) G | (.79) |
Net asset value, end of period | $ 9.67 | $ 10.18 | $ 9.00 | $ 7.11 | $ 12.99 |
Total Return A, B | (2.83)% | 15.89% | 31.18% | (38.17)% | 11.08% |
Ratios to Average Net Assets D, E | | | | | |
Expenses before reductions | .25% | .25% | .25% | .25% | .25% |
Expenses net of fee waivers, if any | .25% | .25% | .25% | .25% | .25% |
Expenses net of all reductions | .25% | .25% | .25% | .25% | .25% |
Net investment income (loss) | 2.02% | 2.01% | 2.88% | 2.44% | 2.31% |
Supplemental Data | | | | | |
Net assets, end of period (000 omitted) | $ 59,671 | $ 49,574 | $ 34,809 | $ 19,273 | $ 24,148 |
Portfolio turnover rate | 16% | 25% | 24% | 23% | 17% |
A Total returns do not reflect charges attributable to your insurance company's separate account. Inclusion of these charges would reduce the total returns shown.
B Total returns would have been lower if certain expenses had not been reduced during the applicable periods shown.
C Calculated based on average shares outstanding during the period.
D Amounts do not include the activity of the Underlying Funds.
E Expense ratios reflect operating expenses of the class. Expenses before reductions do not reflect amounts reimbursed by the investment adviser or reductions from expense offset arrangements and do not represent the amount paid by the class during periods when reimbursements or reductions occur. Expenses net of fee waivers reflect expenses after reimbursement by the investment adviser but prior to reductions from expense offset arrangements. Expenses net of all reductions represent the net expenses paid by the class but do not include expenses of the investment companies in which the Fund invests.
F Total distributions of $.25 per share is comprised of distributions from net investment income of $.173 and distributions from net realized gain of $.072 per share.
G Total distributions of $1.02 per share is comprised of distributions from net investment income of $.221 and distributions from net realized gain of $.795 per share.
See accompanying notes which are an integral part of the financial statements.
Annual Report
Fidelity VIP Freedom 2035 Portfolio
Investment Changes (Unaudited)
Fund Holdings as of December 31, 2011 |
| % of fund's
net assets | % of fund's net assets
6 months ago |
Domestic Equity Funds | | |
VIP Contrafund Portfolio Initial Class | 9.6 | 9.7 |
VIP Equity-Income Portfolio Initial Class | 11.4 | 11.2 |
VIP Growth & Income Portfolio Initial Class | 11.5 | 11.2 |
VIP Growth Portfolio Initial Class | 11.1 | 11.4 |
VIP Mid Cap Portfolio Initial Class | 3.9 | 3.9 |
VIP Value Portfolio Initial Class | 9.9 | 9.6 |
VIP Value Strategies Portfolio Initial Class | 4.0 | 4.1 |
| 61.4 | 61.1 |
Developed International Equity Funds | | |
VIP Overseas Portfolio Initial Class | 16.4 | 18.8 |
Emerging Markets Equity Funds | | |
VIP Emerging Markets Portfolio Initial Class | 4.2 | 3.2 |
High Yield Bond Funds | | |
VIP High Income Portfolio Initial Class | 7.7 | 7.5 |
Investment Grade Bond Funds | | |
VIP Investment Grade Bond Portfolio Initial Class | 10.3 | 9.4 |
Net Other Assets (Liabilities)* | 0.0 | 0.0 |
| 100.0 | 100.0 |
* Amount represents less than 0.1% |
Asset Allocation (% of fund's net assets) |
Current |
| Domestic Equity Funds | 61.4% | |
| Developed International Equity Funds | 16.4% | |
| Emerging Markets Equity Funds | 4.2% | |
| High Yield Bond Funds | 7.7% | |
| Investment Grade Bond Funds | 10.3% | |

Six months ago |
| Domestic Equity Funds | 61.1% | |
| Developed International Equity Funds | 18.8% | |
| Emerging Markets Equity Funds | 3.2% | |
| High Yield Bond Funds | 7.5% | |
| Investment Grade Bond Funds | 9.4% | |

Expected |
| Domestic Equity Funds | 60.1% | |
| Developed International Equity Funds | 18.6% | |
| Emerging Markets Equity Funds | 3.3% | |
| High Yield Bond Funds | 7.5% | |
| Investment Grade Bond Funds | 10.5% | |

The fund invests according to an asset allocation strategy that becomes increasingly conservative over time. The six months ago allocation is based on the fund's holdings as of June 30, 2011. The current allocation is based on the fund's holdings as of December 31, 2011. The expected allocation represents the fund's anticipated allocation at June 30, 2012. |
Annual Report
Fidelity VIP Freedom 2035 Portfolio
Investments December 31, 2011
Showing Percentage of Net Assets
Domestic Equity Funds - 61.4% |
| Shares | | Value |
Domestic Equity Funds - 61.4% |
VIP Contrafund Portfolio Initial Class | 1,927 | | $ 44,363 |
VIP Equity-Income Portfolio Initial Class | 2,833 | | 52,952 |
VIP Growth & Income Portfolio Initial Class | 4,235 | | 53,323 |
VIP Growth Portfolio Initial Class | 1,395 | | 51,479 |
VIP Mid Cap Portfolio Initial Class | 615 | | 17,876 |
VIP Value Portfolio Initial Class | 4,307 | | 45,654 |
VIP Value Strategies Portfolio Initial Class | 2,133 | | 18,725 |
TOTAL DOMESTIC EQUITY FUNDS (Cost $193,362) |
284,372
|
International Equity Funds - 20.6% |
| | | |
Developed International Equity Funds - 16.4% |
VIP Overseas Portfolio Initial Class | 5,572 | | 75,945 |
Emerging Markets Equity Funds - 4.2% |
VIP Emerging Markets Portfolio Initial Class | 2,523 | | 19,530 |
TOTAL INTERNATIONAL EQUITY FUNDS (Cost $87,752) |
95,475
|
Bond Funds - 18.0% |
| Shares | | Value |
High Yield Bond Funds - 7.7% |
VIP High Income Portfolio Initial Class | 6,608 | | $ 35,618 |
Investment Grade Bond Funds - 10.3% |
VIP Investment Grade Bond Portfolio Initial Class | 3,666 | | 47,553 |
TOTAL BOND FUNDS (Cost $74,270) |
83,171
|
TOTAL INVESTMENT PORTFOLIO - 100.0% (Cost $355,384) | | 463,018 |
NET OTHER ASSETS (LIABILITIES) - 0.0% | | (68) |
NET ASSETS - 100% | $ 462,950 |
Other Information |
All investments are categorized as Level 1 under the Fair Value Hierarchy. The inputs or methodology used for valuing securities may not be an indication of the risk associated with investing in those securities. For more information on valuation inputs, please refer to the Security Valuation section in the accompanying Notes to Financial Statements. |
See accompanying notes which are an integral part of the financial statements.
Annual Report
Fidelity VIP Freedom 2035 Portfolio
Statement of Assets and Liabilities
| December 31, 2011 |
| | |
Assets | | |
Investment in securities, at value (cost $355,384) - See accompanying schedule | | $ 463,018 |
Cash | | 1 |
Receivable for investments sold | | 88 |
Total assets | | 463,107 |
| | |
Liabilities | | |
Payable for fund shares redeemed | $ 92 | |
Distribution and service plan fees payable | 65 | |
Total liabilities | | 157 |
| | |
Net Assets | | $ 462,950 |
Net Assets consist of: | | |
Paid in capital | | $ 359,404 |
Accumulated undistributed net realized gain (loss) on investments | | (4,088) |
Net unrealized appreciation (depreciation) on investments | | 107,634 |
Net Assets | | $ 462,950 |
Statement of Assets and Liabilities - continued
| December 31, 2011 |
| | |
Initial Class:
Net Asset Value, offering price and redemption price per share ($97,180 ÷ 7,033 shares) | | $ 13.82 |
| | |
Service Class:
Net Asset Value, offering price and redemption price per share ($89,761 ÷ 6,494 shares) | | $ 13.82 |
| | |
Service Class 2:
Net Asset Value, offering price and redemption price per share ($276,009 ÷ 19,994 shares) | | $ 13.80 |
See accompanying notes which are an integral part of the financial statements.
Annual Report
Statement of Operations
| Year ended December 31, 2011 |
| | |
Investment Income | | |
Income distributions from underlying funds | | $ 9,199 |
| | |
Expenses | | |
Distribution and service plan fees | $ 835 | |
Total expenses | | 835 |
Net investment income (loss) | | 8,364 |
Realized and Unrealized Gain (Loss) Realized gain (loss) on sale of underlying fund shares | (4,398) | |
Capital gain distributions from underlying funds | 1,756 | |
Total net realized gain (loss) | | (2,642) |
Change in net unrealized appreciation (depreciation) on underlying funds | | (29,065) |
Net gain (loss) | | (31,707) |
Net increase (decrease) in net assets resulting from operations | | $ (23,343) |
Statement of Changes in Net Assets
| Year ended
December 31,
2011 | Year ended
December 31,
2010 |
Increase (Decrease) in Net Assets | | |
Operations | | |
Net investment income (loss) | $ 8,364 | $ 7,448 |
Net realized gain (loss) | (2,642) | 25,939 |
Change in net unrealized appreciation (depreciation) | (29,065) | 27,693 |
Net increase (decrease) in net assets resulting from operations | (23,343) | 61,080 |
Distributions to shareholders from net investment income | (8,242) | (7,448) |
Distributions to shareholders from net realized gain | (2,047) | (29,333) |
Total distributions | (10,289) | (36,781) |
Share transactions - net increase (decrease) | 48,994 | (3,350) |
Total increase (decrease) in net assets | 15,362 | 20,949 |
| | |
Net Assets | | |
Beginning of period | 447,588 | 426,639 |
End of period | $ 462,950 | $ 447,588 |
See accompanying notes which are an integral part of the financial statements.
Annual Report
Financial Highlights - Initial Class
Years ended December 31, | 2011 | 2010 | 2009 F |
Selected Per-Share Data | | | |
Net asset value, beginning of period | $ 14.74 | $ 13.74 | $ 10.00 |
Income from Investment Operations | | | |
Net investment income (loss) D | .27 | .27 | .25 |
Net realized and unrealized gain (loss) | (.85) | 2.04 | 3.76 |
Total from investment operations | (.58) | 2.31 | 4.01 |
Distributions from net investment income | (.28) | (.28) | (.25) |
Distributions from net realized gain | (.06) | (1.03) | (.01) |
Total distributions | (.34) | (1.31) | (.27) H |
Net asset value, end of period | $ 13.82 | $ 14.74 | $ 13.74 |
Total Return B, C | (3.99)% | 17.01% | 40.04% |
Ratios to Average Net Assets E, G | | | |
Expenses before reductions | .00% | .00% | .00% A |
Expenses net of fee waivers, if any | .00% | .00% | .00% A |
Expenses net of all reductions | .00% | .00% | .00% A |
Net investment income (loss) | 1.82% | 1.92% | 2.78% A |
Supplemental Data | | | |
Net assets, end of period (000 omitted) | $ 97 | $ 121 | $ 144 |
Portfolio turnover rate | 38% | 38% | 5% A |
A Annualized
B Total returns for periods of less than one year are not annualized.
C Total returns do not reflect charges attributable to your insurance company's separate account. Inclusion of these charges would reduce the total returns shown.
D Calculated based on average shares outstanding during the period.
E Amounts do not include the activity of the Underlying Funds.
F For the period April 8, 2009 (commencement of operations) to December 31, 2009.
G Expense ratios reflect operating expenses of the class. Expenses before reductions do not reflect amounts reimbursed by the investment adviser or reductions from expense offset arrangements and do not represent the amount paid by the class during periods when reimbursements or reductions occur. Expense ratios before reductions for start-up periods may not be representative of longer-term operating periods. Expenses net of fee waivers reflect expenses after reimbursement by the investment adviser but prior to reductions from expense offset arrangements. Expenses net of all reductions represent the net expenses paid by the class but do not include expenses of the investment companies in which the Fund invests.
H Total distributions of $.27 per share is comprised of distributions from net investment income of $.252 and distributions from net realized gain of $.014 per share.
Financial Highlights - Service Class
Years ended December 31, | 2011 | 2010 | 2009 F |
Selected Per-Share Data | | | |
Net asset value, beginning of period | $ 14.74 | $ 13.73 | $ 10.00 |
Income from Investment Operations | | | |
Net investment income (loss) D | .25 | .26 | .24 |
Net realized and unrealized gain (loss) | (.85) | 2.04 | 3.75 |
Total from investment operations | (.60) | 2.30 | 3.99 |
Distributions from net investment income | (.26) | (.26) | (.24) |
Distributions from net realized gain | (.06) | (1.03) | (.01) |
Total distributions | (.32) | (1.29) | (.26) H |
Net asset value, end of period | $ 13.82 | $ 14.74 | $ 13.73 |
Total Return B, C | (4.10)% | 16.97% | 39.85% |
Ratios to Average Net Assets E, G | | | |
Expenses before reductions | .10% | .10% | .10% A |
Expenses net of fee waivers, if any | .10% | .10% | .10% A |
Expenses net of all reductions | .10% | .10% | .10% A |
Net investment income (loss) | 1.72% | 1.82% | 2.68% A |
Supplemental Data | | | |
Net assets, end of period (000 omitted) | $ 90 | $ 116 | $ 140 |
Portfolio turnover rate | 38% | 38% | 5% A |
A Annualized
B Total returns for periods of less than one year are not annualized.
C Total returns do not reflect charges attributable to your insurance company's separate account. Inclusion of these charges would reduce the total returns shown.
D Calculated based on average shares outstanding during the period.
E Amounts do not include the activity of the Underlying Funds.
F For the period April 8, 2009 (commencement of operations) to December 31, 2009.
G Expense ratios reflect operating expenses of the class. Expenses before reductions do not reflect amounts reimbursed by the investment adviser or reductions from expense offset arrangements and do not represent the amount paid by the class during periods when reimbursements or reductions occur. Expense ratios before reductions for start-up periods may not be representative of longer-term operating periods. Expenses net of fee waivers reflect expenses after reimbursement by the investment adviser but prior to reductions from expense offset arrangements. Expenses net of all reductions represent the net expenses paid by the class but do not include expenses of the investment companies in which the Fund invests.
H Total distributions of $.26 per share is comprised of distributions from net investment income of $.243 and distributions from net realized gain of $.014 per share.
See accompanying notes which are an integral part of the financial statements.
Annual Report
Financial Highlights - Service Class 2
Years ended December 31, | 2011 | 2010 | 2009 F |
Selected Per-Share Data | | | |
Net asset value, beginning of period | $ 14.72 | $ 13.73 | $ 10.00 |
Income from Investment Operations | | | |
Net investment income (loss) D | .23 | .24 | .23 |
Net realized and unrealized gain (loss) | (.85) | 2.03 | 3.74 |
Total from investment operations | (.62) | 2.27 | 3.97 |
Distributions from net investment income | (.24) | (.26) | (.23) |
Distributions from net realized gain | (.06) | (1.03) | (.01) |
Total distributions | (.30) | (1.28) I | (.24) H |
Net asset value, end of period | $ 13.80 | $ 14.72 | $ 13.73 |
Total Return B, C | (4.25)% | 16.76% | 39.72% |
Ratios to Average Net Assets E, G | | | |
Expenses before reductions | .25% | .25% | .25% A |
Expenses net of fee waivers, if any | .25% | .25% | .25% A |
Expenses net of all reductions | .25% | .25% | .25% A |
Net investment income (loss) | 1.57% | 1.67% | 2.53% A |
Supplemental Data | | | |
Net assets, end of period (000 omitted) | $ 276 | $ 211 | $ 143 |
Portfolio turnover rate | 38% | 38% | 5% A |
A Annualized
B Total returns for periods of less than one year are not annualized.
C Total returns do not reflect charges attributable to your insurance company's separate account. Inclusion of these charges would reduce the total returns shown.
D Calculated based on average shares outstanding during the period.
E Amounts do not include the activity of the Underlying Funds.
F For the period April 8, 2009 (commencement of operations) to December 31, 2009.
G Expense ratios reflect operating expenses of the class. Expenses before reductions do not reflect amounts reimbursed by the investment adviser or reductions from expense offset arrangements and do not represent the amount paid by the class during periods when reimbursements or reductions occur. Expense ratios before reductions for start-up periods may not be representative of longer-term operating periods. Expenses net of fee waivers reflect expenses after reimbursement by the investment adviser but prior to reductions from expense offset arrangements. Expenses net of all reductions represent the net expenses paid by the class but do not include expenses of the investment companies in which the Fund invests.
H Total distributions of $.24 per share is comprised of distributions from net investment income of $.230 and distributions from net realized gain of $.014 per share.
I Total distributions of $1.28 per share is comprised of distributions from net investment income of $.255 and distributions from net realized gain of $1.029 per share.
See accompanying notes which are an integral part of the financial statements.
Annual Report
Fidelity VIP Freedom 2040 Portfolio
Investment Changes (Unaudited)
Fund Holdings as of December 31, 2011 |
| % of fund's
net assets | % of fund's net assets
6 months ago |
Domestic Equity Funds | | |
VIP Contrafund Portfolio Initial Class | 9.7 | 9.7 |
VIP Equity-Income Portfolio Initial Class | 11.5 | 11.3 |
VIP Growth & Income Portfolio Initial Class | 11.6 | 11.2 |
VIP Growth Portfolio Initial Class | 11.2 | 11.4 |
VIP Mid Cap Portfolio Initial Class | 3.9 | 3.9 |
VIP Value Portfolio Initial Class | 10.0 | 9.7 |
VIP Value Strategies Portfolio Initial Class | 4.1 | 4.1 |
| 62.0 | 61.3 |
Developed International Equity Funds | | |
VIP Overseas Portfolio Initial Class | 16.5 | 18.8 |
Emerging Markets Equity Funds | | |
VIP Emerging Markets Portfolio Initial Class | 4.2 | 3.3 |
High Yield Bond Funds | | |
VIP High Income Portfolio Initial Class | 8.2 | 8.3 |
Investment Grade Bond Funds | | |
VIP Investment Grade Bond Portfolio Initial Class | 9.1 | 8.3 |
Net Other Assets (Liabilities)* | 0.0 | 0.0 |
| 100.0 | 100.0 |
* Amount represents less than 0.1% |
Asset Allocation (% of fund's net assets) |
Current |
| Domestic Equity Funds | 62.0% | |
| Developed International Equity Funds | 16.5% | |
| Emerging Markets Equity Funds | 4.2% | |
| High Yield Bond Funds | 8.2% | |
| Investment Grade Bond Funds | 9.1% | |

Six months ago |
| Domestic Equity Funds | 61.3% | |
| Developed International Equity Funds | 18.8% | |
| Emerging Markets Equity Funds | 3.3% | |
| High Yield Bond Funds | 8.3% | |
| Investment Grade Bond Funds | 8.3% | |

Expected |
| Domestic Equity Funds | 60.6% | |
| Developed International Equity Funds | 18.8% | |
| Emerging Markets Equity Funds | 3.3% | |
| High Yield Bond Funds | 7.8% | |
| Investment Grade Bond Funds | 9.5% | |

The fund invests according to an asset allocation strategy that becomes increasingly conservative over time. The six months ago allocation is based on the fund's holdings as of June 30, 2011. The current allocation is based on the fund's holdings as of December 31, 2011. The expected allocation represents the fund's anticipated allocation at June 30, 2012. |
Annual Report
Fidelity VIP Freedom 2040 Portfolio
Investments December 31, 2011
Showing Percentage of Net Assets
Domestic Equity Funds - 62.0% |
| Shares | | Value |
Domestic Equity Funds - 62.0% |
VIP Contrafund Portfolio Initial Class | 11,558 | | $ 266,072 |
VIP Equity-Income Portfolio Initial Class | 17,023 | | 318,163 |
VIP Growth & Income Portfolio Initial Class | 25,452 | | 320,445 |
VIP Growth Portfolio Initial Class | 8,377 | | 309,026 |
VIP Mid Cap Portfolio Initial Class | 3,679 | | 106,999 |
VIP Value Portfolio Initial Class | 25,858 | | 274,091 |
VIP Value Strategies Portfolio Initial Class | 12,785 | | 112,252 |
TOTAL DOMESTIC EQUITY FUNDS (Cost $1,713,404) |
1,707,048
|
International Equity Funds - 20.7% |
| | | |
Developed International Equity Funds - 16.5% |
VIP Overseas Portfolio Initial Class | 33,383 | | 455,007 |
Emerging Markets Equity Funds - 4.2% |
VIP Emerging Markets Portfolio Initial Class | 15,082 | | 116,731 |
TOTAL INTERNATIONAL EQUITY FUNDS (Cost $680,806) |
571,738
|
Bond Funds - 17.3% |
| Shares | | Value |
High Yield Bond Funds - 8.2% |
VIP High Income Portfolio Initial Class | 41,966 | | $ 226,195 |
Investment Grade Bond Funds - 9.1% |
VIP Investment Grade Bond Portfolio Initial Class | 19,254 | | 249,727 |
TOTAL BOND FUNDS (Cost $477,903) |
475,922
|
TOTAL INVESTMENT PORTFOLIO - 100.0% (Cost $2,872,113) | | 2,754,708 |
NET OTHER ASSETS (LIABILITIES) - 0.0% | | (125) |
NET ASSETS - 100% | $ 2,754,583 |
Other Information |
All investments are categorized as Level 1 under the Fair Value Hierarchy. The inputs or methodology used for valuing securities may not be an indication of the risk associated with investing in those securities. For more information on valuation inputs, please refer to the Security Valuation section in the accompanying Notes to Financial Statements. |
See accompanying notes which are an integral part of the financial statements.
Annual Report
Fidelity VIP Freedom 2040 Portfolio
Statement of Assets and Liabilities
| December 31, 2011 |
| | |
Assets | | |
Investment in securities, at value (cost $2,872,113) - See accompanying schedule | | $ 2,754,708 |
Receivable for investments sold | | 6,593 |
Receivable for fund shares sold | | 1,666 |
Total assets | | 2,762,967 |
| | |
Liabilities | | |
Payable for investments purchased | $ 1,545 | |
Payable for fund shares redeemed | 6,716 | |
Distribution and service plan fees payable | 123 | |
Total liabilities | | 8,384 |
| | |
Net Assets | | $ 2,754,583 |
Net Assets consist of: | | |
Paid in capital | | $ 2,892,853 |
Accumulated undistributed net realized gain (loss) on investments | | (20,865) |
Net unrealized appreciation (depreciation) on investments | | (117,405) |
Net Assets | | $ 2,754,583 |
Statement of Assets and Liabilities - continued
| December 31, 2011 |
| | |
Initial Class:
Net Asset Value, offering price and redemption price per share ($1,559,299 ÷ 118,513.5 shares) | | $ 13.16 |
| | |
Service Class:
Net Asset Value, offering price and redemption price per share ($1,057,887 ÷ 80,417.4 shares) | | $ 13.15 |
| | |
Service Class 2:
Net Asset Value, offering price and redemption price per share ($137,397 ÷ 10,448.2 shares) | | $ 13.15 |
See accompanying notes which are an integral part of the financial statements.
Annual Report
Fidelity VIP Freedom 2040 Portfolio
Financial Statements - continued
Statement of Operations
| Year ended December 31, 2011 |
| | |
Investment Income | | |
Income distributions from underlying funds | | $ 56,782 |
| | |
Expenses | | |
Distribution and service plan fees | $ 1,155 | |
Independent trustees' compensation | 7 | |
Total expenses before reductions | 1,162 | |
Expense reductions | (7) | 1,155 |
Net investment income (loss) | | 55,627 |
Realized and Unrealized Gain (Loss) Realized gain (loss) on sale of underlying fund shares | (21,325) | |
Capital gain distributions from underlying funds | 5,926 | |
Total net realized gain (loss) | | (15,399) |
Change in net unrealized appreciation (depreciation) on underlying funds | | (265,954) |
Net gain (loss) | | (281,353) |
Net increase (decrease) in net assets resulting from operations | | $ (225,726) |
Statement of Changes in Net Assets
| Year ended
December 31,
2011 | Year ended
December 31,
2010 |
Increase (Decrease) in Net Assets | | |
Operations | | |
Net investment income (loss) | $ 55,627 | $ 8,762 |
Net realized gain (loss) | (15,399) | 56,775 |
Change in net unrealized appreciation (depreciation) | (265,954) | 37,318 |
Net increase (decrease) in net assets resulting from operations | (225,726) | 102,855 |
Distributions to shareholders from net investment income | (55,567) | (8,846) |
Distributions to shareholders from net realized gain | (4,556) | (62,347) |
Total distributions | (60,123) | (71,193) |
Share transactions - net increase (decrease) | 2,502,045 | 80,183 |
Total increase (decrease) in net assets | 2,216,196 | 111,845 |
| | |
Net Assets | | |
Beginning of period | 538,387 | 426,542 |
End of period | $ 2,754,583 | $ 538,387 |
See accompanying notes which are an integral part of the financial statements.
Annual Report
Financial Highlights - Initial Class
Years ended December 31, | 2011 | 2010 | 2009 G |
Selected Per-Share Data | | | |
Net asset value, beginning of period | $ 14.02 | $ 13.82 | $ 10.00 |
Income from Investment Operations | | | |
Net investment income (loss) D | .35 | .20 | .26 |
Net realized and unrealized gain (loss) | (.91) | 2.15 | 3.83 |
Total from investment operations | (.56) | 2.35 | 4.09 |
Distributions from net investment income | (.27) | (.28) | (.26) |
Distributions from net realized gain | (.02) | (1.87) | (.01) |
Total distributions | (.30) J | (2.15) | (.27) I |
Net asset value, end of period | $ 13.16 | $ 14.02 | $ 13.82 |
Total Return B, C | (4.02)% | 17.19% | 40.89% |
Ratios to Average Net Assets E, H | | | |
Expenses before reductions | .00% F | .00% | .00% A |
Expenses net of fee waivers, if any | .00% | .00% | .00% A |
Expenses net of all reductions | .00% | .00% | .00% A |
Net investment income (loss) | 2.50% | 1.46% | 2.81% A |
Supplemental Data | | | |
Net assets, end of period (000 omitted) | $ 1,559 | $ 278 | $ 145 |
Portfolio turnover rate | 42% | 194% | 5% A |
A Annualized
B Total returns for periods of less than one year are not annualized.
C Total returns do not reflect charges attributable to your insurance company's separate account. Inclusion of these charges would reduce the total returns shown.
D Calculated based on average shares outstanding during the period.
E Amounts do not include the activity of the Underlying Funds.
F Amount represents less than .01%.
G For the period April 8, 2009 (commencement of operations) to December 31, 2009.
H Expense ratios reflect operating expenses of the class. Expenses before reductions do not reflect amounts reimbursed by the investment adviser or reductions from expense offset arrangements and do not represent the amount paid by the class during periods when reimbursements or reductions occur. Expenses net of fee waivers reflect expenses after reimbursement by the investment adviser but prior to reductions from expense offset arrangements. Expenses net of all reductions represent the net expenses paid by the class but do not include expenses of the investment companies in which the Fund invests.
I Total distributions of $.27 per share is comprised of distributions from net investment income of $.257 and distributions from net realized gain of $.014 per share.
J Total distributions of $.30 per share is comprised of distributions from net investment income of $.274 and distributions from net realized gain of $.022 per share.
Financial Highlights - Service Class
Years ended December 31, | 2011 | 2010 | 2009 F |
Selected Per-Share Data | | | |
Net asset value, beginning of period | $ 14.02 | $ 13.82 | $ 10.00 |
Income from Investment Operations | | | |
Net investment income (loss) D | .33 | .19 | .25 |
Net realized and unrealized gain (loss) | (.91) | 2.14 | 3.83 |
Total from investment operations | (.58) | 2.33 | 4.08 |
Distributions from net investment income | (.26) | (.26) | (.25) |
Distributions from net realized gain | (.02) | (1.87) | (.01) |
Total distributions | (.29) I | (2.13) | (.26) H |
Net asset value, end of period | $ 13.15 | $ 14.02 | $ 13.82 |
Total Return B, C | (4.17)% | 17.05% | 40.80% |
Ratios to Average Net Assets E, G | | | |
Expenses before reductions | .10% | .10% | .10% A |
Expenses net of fee waivers, if any | .10% | .10% | .10% A |
Expenses net of all reductions | .10% | .10% | .10% A |
Net investment income (loss) | 2.41% | 1.36% | 2.71% A |
Supplemental Data | | | |
Net assets, end of period (000 omitted) | $ 1,058 | $ 116 | $ 141 |
Portfolio turnover rate | 42% | 194% | 5% A |
A Annualized
B Total returns for periods of less than one year are not annualized.
C Total returns do not reflect charges attributable to your insurance company's separate account. Inclusion of these charges would reduce the total returns shown.
D Calculated based on average shares outstanding during the period.
E Amounts do not include the activity of the Underlying Funds.
F For the period April 8, 2009 (commencement of operations) to December 31, 2009.
G Expense ratios reflect operating expenses of the class. Expenses before reductions do not reflect amounts reimbursed by the investment adviser or reductions from expense offset arrangements and do not represent the amount paid by the class during periods when reimbursements or reductions occur. Expenses net of fee waivers reflect expenses after reimbursement by the investment adviser but prior to reductions from expense offset arrangements. Expenses net of all reductions represent the net expenses paid by the class but do not include expenses of the investment companies in which the Fund invests.
H Total distributions of $.26 per share is comprised of distributions from net investment income of $.248 and distributions from net realized gain of $.014 per share.
I Total distributions of $.29 per share is comprised of distributions from net investment income of $.264 and distributions from net realized gain of $.022 per share.
See accompanying notes which are an integral part of the financial statements.
Annual Report
Financial Highlights - Service Class 2
Years ended December 31, | 2011 | 2010 | 2009 F |
Selected Per-Share Data | | | |
Net asset value, beginning of period | $ 14.02 | $ 13.82 | $ 10.00 |
Income from Investment Operations | | | |
Net investment income (loss) D | .32 | .17 | .23 |
Net realized and unrealized gain (loss) | (.92) | 2.14 | 3.84 |
Total from investment operations | (.60) | 2.31 | 4.07 |
Distributions from net investment income | (.24) | (.24) | (.23) |
Distributions from net realized gain | (.02) | (1.87) | (.01) |
Total distributions | (.27) I | (2.11) | (.25) H |
Net asset value, end of period | $ 13.15 | $ 14.02 | $ 13.82 |
Total Return B, C | (4.32)% | 16.92% | 40.66% |
Ratios to Average Net Assets E, G | | | |
Expenses before reductions | .25% | .25% | .25% A |
Expenses net of fee waivers, if any | .25% | .25% | .25% A |
Expenses net of all reductions | .25% | .25% | .25% A |
Net investment income (loss) | 2.25% | 1.21% | 2.56% A |
Supplemental Data | | | |
Net assets, end of period (000 omitted) | $ 137 | $ 144 | $ 141 |
Portfolio turnover rate | 42% | 194% | 5% A |
A Annualized
B Total returns for periods of less than one year are not annualized.
C Total returns do not reflect charges attributable to your insurance company's separate account. Inclusion of these charges would reduce the total returns shown.
D Calculated based on average shares outstanding during the period.
E Amounts do not include the activity of the Underlying Funds.
F For the period April 8, 2009 (commencement of operations) to December 31, 2009.
G Expense ratios reflect operating expenses of the class. Expenses before reductions do not reflect amounts reimbursed by the investment adviser or reductions from expense offset arrangements and do not represent the amount paid by the class during periods when reimbursements or reductions occur. Expenses net of fee waivers reflect expenses after reimbursement by the investment adviser but prior to reductions from expense offset arrangements. Expenses net of all reductions represent the net expenses paid by the class but do not include expenses of the investment companies in which the Fund invests.
H Total distributions of $.25 per share is comprised of distributions from net investment income of $.234 and distributions from net realized gain of $.014 per share.
I Total distributions of $.27 per share is comprised of distributions from net investment income of $.243 and distributions from net realized gain of $.022 per share.
See accompanying notes which are an integral part of the financial statements.
Annual Report
Fidelity VIP Freedom 2045 Portfolio
Investment Changes (Unaudited)
Fund Holdings as of December 31, 2011 |
| % of fund's
net assets | % of fund's net assets
6 months ago |
Domestic Equity Funds | | |
VIP Contrafund Portfolio Initial Class | 9.9 | 9.9 |
VIP Equity-Income Portfolio Initial Class | 11.8 | 11.6 |
VIP Growth & Income Portfolio Initial Class | 11.9 | 11.6 |
VIP Growth Portfolio Initial Class | 11.5 | 11.8 |
VIP Mid Cap Portfolio Initial Class | 4.0 | 4.0 |
VIP Value Portfolio Initial Class | 10.2 | 9.9 |
VIP Value Strategies Portfolio Initial Class | 4.1 | 4.2 |
| 63.4 | 63.0 |
Developed International Equity Funds | | |
VIP Overseas Portfolio Initial Class | 16.9 | 19.3 |
Emerging Markets Equity Funds | | |
VIP Emerging Markets Portfolio Initial Class | 4.4 | 3.4 |
High Yield Bond Funds | | |
VIP High Income Portfolio Initial Class | 10.2 | 10.0 |
Investment Grade Bond Funds | | |
VIP Investment Grade Bond Portfolio Initial Class | 5.1 | 4.3 |
Net Other Assets (Liabilities)* | 0.0 | 0.0 |
| 100.0 | 100.0 |
* Amount represents less than 0.1% |
Asset Allocation (% of fund's net assets) |
Current |
| Domestic Equity Funds | 63.4% | |
| Developed International Equity Funds | 16.9% | |
| Emerging Markets Equity Funds | 4.4% | |
| High Yield Bond Funds | 10.2% | |
| Investment Grade Bond Funds | 5.1% | |

Six months ago |
| Domestic Equity Funds | 63.0% | |
| Developed International Equity Funds | 19.3% | |
| Emerging Markets Equity Funds | 3.4% | |
| High Yield Bond Funds | 10.0% | |
| Investment Grade Bond Funds | 4.3% | |

Expected |
| Domestic Equity Funds | 62.2% | |
| Developed International Equity Funds | 19.3% | |
| Emerging Markets Equity Funds | 3.4% | |
| High Yield Bond Funds | 9.9% | |
| Investment Grade Bond Funds | 5.2% | |

The fund invests according to an asset allocation strategy that becomes increasingly conservative over time. The six months ago allocation is based on the fund's holdings as of June 30, 2011. The current allocation is based on the fund's holdings as of December 31, 2011. The expected allocation represents the fund's anticipated allocation at June 30, 2012. |
Annual Report
Fidelity VIP Freedom 2045 Portfolio
Investments December 31, 2011
Showing Percentage of Net Assets
Domestic Equity Funds - 63.4% |
| Shares | | Value |
Domestic Equity Funds - 63.4% |
VIP Contrafund Portfolio Initial Class | 1,409 | | $ 32,432 |
VIP Equity-Income Portfolio Initial Class | 2,073 | | 38,745 |
VIP Growth & Income Portfolio Initial Class | 3,099 | | 39,017 |
VIP Growth Portfolio Initial Class | 1,021 | | 37,664 |
VIP Mid Cap Portfolio Initial Class | 449 | | 13,069 |
VIP Value Portfolio Initial Class | 3,149 | | 33,377 |
VIP Value Strategies Portfolio Initial Class | 1,559 | | 13,690 |
TOTAL DOMESTIC EQUITY FUNDS (Cost $131,574) |
207,994
|
International Equity Funds - 21.3% |
| | | |
Developed International Equity Funds - 16.9% |
VIP Overseas Portfolio Initial Class | 4,076 | | 55,553 |
Emerging Markets Equity Funds - 4.4% |
VIP Emerging Markets Portfolio Initial Class | 1,848 | | 14,301 |
TOTAL INTERNATIONAL EQUITY FUNDS (Cost $59,456) |
69,854
|
Bond Funds - 15.3% |
| Shares | | Value |
High Yield Bond Funds - 10.2% |
VIP High Income Portfolio Initial Class | 6,207 | | $ 33,458 |
Investment Grade Bond Funds - 5.1% |
VIP Investment Grade Bond Portfolio Initial Class | 1,286 | | 16,679 |
TOTAL BOND FUNDS (Cost $42,136) |
50,137
|
TOTAL INVESTMENT PORTFOLIO - 100.0% (Cost $233,166) | | 327,985 |
NET OTHER ASSETS (LIABILITIES) - 0.0% | | (36) |
NET ASSETS - 100% | $ 327,949 |
Other Information |
All investments are categorized as Level 1 under the Fair Value Hierarchy. The inputs or methodology used for valuing securities may not be an indication of the risk associated with investing in those securities. For more information on valuation inputs, please refer to the Security Valuation section in the accompanying Notes to Financial Statements. |
See accompanying notes which are an integral part of the financial statements.
Annual Report
Fidelity VIP Freedom 2045 Portfolio
Statement of Assets and Liabilities
| December 31, 2011 |
| | |
Assets | | |
Investment in securities, at value (cost $233,166) - See accompanying schedule | | $ 327,985 |
Cash | | 1 |
Receivable for investments sold | | 2 |
Receivable for fund shares sold | | 89 |
Total assets | | 328,077 |
| | |
Liabilities | | |
Payable for investments purchased | $ 61 | |
Payable for fund shares redeemed | 29 | |
Distribution and service plan fees payable | 38 | |
Total liabilities | | 128 |
| | |
Net Assets | | $ 327,949 |
Net Assets consist of: | | |
Paid in capital | | $ 223,058 |
Accumulated undistributed net realized gain (loss) on investments | | 10,072 |
Net unrealized appreciation (depreciation) on investments | | 94,819 |
Net Assets | | $ 327,949 |
Statement of Assets and Liabilities - continued
| December 31, 2011 |
| | |
Initial Class:
Net Asset Value, offering price and redemption price per share ($94,727 ÷ 7,079 shares) | | $ 13.38 |
| | |
Service Class:
Net Asset Value, offering price and redemption price per share ($90,399 ÷ 6,755 shares) | | $ 13.38 |
| | |
Service Class 2:
Net Asset Value, offering price and redemption price per share ($142,823 ÷ 10,677 shares) | | $ 13.38 |
See accompanying notes which are an integral part of the financial statements.
Annual Report
Fidelity VIP Freedom 2045 Portfolio
Financial Statements - continued
Statement of Operations
| Year ended December 31, 2011 |
| | |
Investment Income | | |
Income distributions from underlying funds | | $ 6,686 |
| | |
Expenses | | |
Distribution and service plan fees | $ 460 | |
Total expenses | | 460 |
Net investment income (loss) | | 6,226 |
Realized and Unrealized Gain (Loss) Realized gain (loss) on sale of underlying fund shares | 10,053 | |
Capital gain distributions from underlying funds | 753 | |
Total net realized gain (loss) | | 10,806 |
Change in net unrealized appreciation (depreciation) on underlying funds | | (34,585) |
Net gain (loss) | | (23,779) |
Net increase (decrease) in net assets resulting from operations | | $ (17,553) |
Statement of Changes in Net Assets
| Year ended
December 31,
2011 | Year ended
December 31,
2010 |
Increase (Decrease) in Net Assets | | |
Operations | | |
Net investment income (loss) | $ 6,226 | $ 6,151 |
Net realized gain (loss) | 10,806 | 34,905 |
Change in net unrealized appreciation (depreciation) | (34,585) | 16,858 |
Net increase (decrease) in net assets resulting from operations | (17,553) | 57,914 |
Distributions to shareholders from net investment income | (6,231) | (6,187) |
Distributions to shareholders from net realized gain | (8,346) | (31,255) |
Total distributions | (14,577) | (37,442) |
Share transactions - net increase (decrease) | (3,769) | (84,084) |
Total increase (decrease) in net assets | (35,899) | (63,612) |
| | |
Net Assets | | |
Beginning of period | 363,848 | 427,460 |
End of period | $ 327,949 | $ 363,848 |
See accompanying notes which are an integral part of the financial statements.
Annual Report
Financial Highlights - Initial Class
Years ended December 31, | 2011 | 2010 | 2009 F |
Selected Per-Share Data | | | |
Net asset value, beginning of period | $ 14.61 | $ 13.86 | $ 10.00 |
Income from Investment Operations | | | |
Net investment income (loss) D | .27 | .24 | .26 |
Net realized and unrealized gain (loss) | (.89) | 2.14 | 3.87 |
Total from investment operations | (.62) | 2.38 | 4.13 |
Distributions from net investment income | (.28) | (.29) | (.26) |
Distributions from net realized gain | (.34) | (1.34) | (.01) |
Total distributions | (.61) H | (1.63) | (.27) |
Net asset value, end of period | $ 13.38 | $ 14.61 | $ 13.86 |
Total Return B, C | (4.41)% | 17.37% | 41.28% |
Ratios to Average Net Assets E, G | | | |
Expenses before reductions | .00% | .00% | .00% A |
Expenses net of fee waivers, if any | .00% | .00% | .00% A |
Expenses net of all reductions | .00% | .00% | .00% A |
Net investment income (loss) | 1.88% | 1.65% | 2.83% A |
Supplemental Data | | | |
Net assets, end of period (000 omitted) | $ 95 | $ 121 | $ 145 |
Portfolio turnover rate | 29% | 17% | 5% A |
A Annualized
B Total returns for periods of less than one year are not annualized.
C Total returns do not reflect charges attributable to your insurance company's separate account. Inclusion of these charges would reduce the total returns shown.
D Calculated based on average shares outstanding during the period.
E Amounts do not include the activity of the Underlying Funds.
F For the period April 8, 2009 (commencement of operations) to December 31, 2009.
G Expense ratios reflect operating expenses of the class. Expenses before reductions do not reflect amounts reimbursed by the investment adviser or reductions from expense offset arrangements and do not represent the amount paid by the class during periods when reimbursements or reductions occur. Expense ratios before reductions for start-up periods may not be representative of longer-term operating periods. Expenses net of fee waivers reflect expenses after reimbursement by the investment adviser but prior to reductions from expense offset arrangements. Expenses net of all reductions represent the net expenses paid by the class but do not include expenses of the investment companies in which the Fund invests.
H Total distributions of $.61 per share is comprised of distributions from net investment income of $.279 and distributions from net realized gain of $.335 per share.
Financial Highlights - Service Class
Years ended December 31, | 2011 | 2010 | 2009 F |
Selected Per-Share Data | | | |
Net asset value, beginning of period | $ 14.61 | $ 13.86 | $ 10.00 |
Income from Investment Operations | | | |
Net investment income (loss) D | .26 | .22 | .25 |
Net realized and unrealized gain (loss) | (.89) | 2.14 | 3.87 |
Total from investment operations | (.63) | 2.36 | 4.12 |
Distributions from net investment income | (.26) | (.28) | (.25) |
Distributions from net realized gain | (.34) | (1.34) | (.01) |
Total distributions | (.60) | (1.61) H | (.26) |
Net asset value, end of period | $ 13.38 | $ 14.61 | $ 13.86 |
Total Return B, C | (4.52)% | 17.23% | 41.19% |
Ratios to Average Net Assets E, G | | | |
Expenses before reductions | .10% | .10% | .10% A |
Expenses net of fee waivers, if any | .10% | .10% | .10% A |
Expenses net of all reductions | .10% | .10% | .10% A |
Net investment income (loss) | 1.78% | 1.55% | 2.73% A |
Supplemental Data | | | |
Net assets, end of period (000 omitted) | $ 90 | $ 117 | $ 141 |
Portfolio turnover rate | 29% | 17% | 5% A |
A Annualized
B Total returns for periods of less than one year are not annualized.
C Total returns do not reflect charges attributable to your insurance company's separate account. Inclusion of these charges would reduce the total returns shown.
D Calculated based on average shares outstanding during the period.
E Amounts do not include the activity of the Underlying Funds.
F For the period April 8, 2009 (commencement of operations) to December 31, 2009.
G Expense ratios reflect operating expenses of the class. Expenses before reductions do not reflect amounts reimbursed by the investment adviser or reductions from expense offset arrangements and do not represent the amount paid by the class during periods when reimbursements or reductions occur. Expense ratios before reductions for start-up periods may not be representative of longer-term operating periods. Expenses net of fee waivers reflect expenses after reimbursement by the investment adviser but prior to reductions from expense offset arrangements. Expenses net of all reductions represent the net expenses paid by the class but do not include expenses of the investment companies in which the Fund invests.
H Total distributions of $1.61 per share is comprised of distributions from net investment income of $.276 and distributions from net realized gain of $1.335 per share.
See accompanying notes which are an integral part of the financial statements.
Annual Report
Financial Highlights - Service Class 2
Years ended December 31, | 2011 | 2010 | 2009 F |
Selected Per-Share Data | | | |
Net asset value, beginning of period | $ 14.61 | $ 13.85 | $ 10.00 |
Income from Investment Operations | | | |
Net investment income (loss) D | .23 | .20 | .24 |
Net realized and unrealized gain (loss) | (.88) | 2.15 | 3.86 |
Total from investment operations | (.65) | 2.35 | 4.10 |
Distributions from net investment income | (.25) | (.25) | (.24) |
Distributions from net realized gain | (.34) | (1.34) | (.01) |
Total distributions | (.58) H | (1.59) | (.25) |
Net asset value, end of period | $ 13.38 | $ 14.61 | $ 13.85 |
Total Return B, C | (4.64)% | 17.15% | 40.96% |
Ratios to Average Net Assets E, G | | | |
Expenses before reductions | .25% | .25% | .25% A |
Expenses net of fee waivers, if any | .25% | .25% | .25% A |
Expenses net of all reductions | .25% | .25% | .25% A |
Net investment income (loss) | 1.63% | 1.40% | 2.58% A |
Supplemental Data | | | |
Net assets, end of period (000 omitted) | $ 143 | $ 126 | $ 141 |
Portfolio turnover rate | 29% | 17% | 5% A |
A Annualized
B Total returns for periods of less than one year are not annualized.
C Total returns do not reflect charges attributable to your insurance company's separate account. Inclusion of these charges would reduce the total returns shown.
D Calculated based on average shares outstanding during the period.
E Amounts do not include the activity of the Underlying Funds.
F For the period April 8, 2009 (commencement of operations) to December 31, 2009.
G Expense ratios reflect operating expenses of the class. Expenses before reductions do not reflect amounts reimbursed by the investment adviser or reductions from expense offset arrangements and do not represent the amount paid by the class during periods when reimbursements or reductions occur. Expense ratios before reductions for start-up periods may not be representative of longer-term operating periods. Expenses net of fee waivers reflect expenses after reimbursement by the investment adviser but prior to reductions from expense offset arrangements. Expenses net of all reductions represent the net expenses paid by the class but do not include expenses of the investment companies in which the Fund invests.
H Total distributions of $.58 per share is comprised of distributions from net investment income of $.245 and distributions from net realized gain of $.335 per share.
See accompanying notes which are an integral part of the financial statements.
Annual Report
Fidelity VIP Freedom 2050 Portfolio
Investment Changes (Unaudited)
Fund Holdings as of December 31, 2011 |
| % of fund's
net assets | % of fund's net assets
6 months ago |
Domestic Equity Funds | | |
VIP Contrafund Portfolio Initial Class | 10.3 | 10.4 |
VIP Equity-Income Portfolio Initial Class | 12.2 | 12.1 |
VIP Growth & Income Portfolio Initial Class | 12.3 | 12.1 |
VIP Growth Portfolio Initial Class | 11.9 | 12.3 |
VIP Mid Cap Portfolio Initial Class | 4.1 | 4.2 |
VIP Value Portfolio Initial Class | 10.6 | 10.4 |
VIP Value Strategies Portfolio Initial Class | 4.3 | 4.3 |
| 65.7 | 65.8 |
Developed International Equity Funds | | |
VIP Overseas Portfolio Initial Class | 17.6 | 20.2 |
Emerging Markets Equity Funds | | |
VIP Emerging Markets Portfolio Initial Class | 4.5 | 3.5 |
High Yield Bond Funds | | |
VIP High Income Portfolio Initial Class | 10.3 | 10.1 |
Investment Grade Bond Funds | | |
VIP Investment Grade Bond Portfolio Initial Class | 1.9 | 0.4 |
Net Other Assets (Liabilities) * | 0.0 | 0.0 |
| 100.0 | 100.0 |
* Amount represents less than 0.1% |
Asset Allocation (% of fund's net assets) |
Current |
| Domestic Equity Funds | 65.7% | |
| Developed International Equity Funds | 17.6% | |
| Emerging Markets Equity Funds | 4.5% | |
| High Yield Bond Funds | 10.3% | |
| Investment Grade Bond Funds | 1.9% | |

Six months ago |
| Domestic Equity Funds | 65.8% | |
| Developed International Equity Funds | 20.2% | |
| Emerging Markets Equity Funds | 3.5% | |
| High Yield Bond Funds | 10.1% | |
| Investment Grade Bond Funds | 0.4% | |

Expected |
| Domestic Equity Funds | 63.6% | |
| Developed International Equity Funds | 19.7% | |
| Emerging Markets Equity Funds | 3.5% | |
| High Yield Bond Funds | 10.0% | |
| Investment Grade Bond Funds | 3.2% | |

The fund invests according to an asset allocation strategy that becomes increasingly conservative over time. The six months ago allocation is based on the fund's holdings as of June 30, 2011. The current allocation is based on the fund's holdings as of December 31, 2011. The expected allocation represents the fund's anticipated allocation at June 30, 2012. |
Annual Report
Fidelity VIP Freedom 2050 Portfolio
Investments December 31, 2011
Showing Percentage of Net Assets
Domestic Equity Funds - 65.7% |
| Shares | | Value |
Domestic Equity Funds - 65.7% |
VIP Contrafund Portfolio Initial Class | 2,257 | | $ 51,955 |
VIP Equity-Income Portfolio Initial Class | 3,319 | | 62,026 |
VIP Growth & Income Portfolio Initial Class | 4,959 | | 62,432 |
VIP Growth Portfolio Initial Class | 1,636 | | 60,341 |
VIP Mid Cap Portfolio Initial Class | 721 | | 20,969 |
VIP Value Portfolio Initial Class | 5,041 | | 53,430 |
VIP Value Strategies Portfolio Initial Class | 2,500 | | 21,946 |
TOTAL DOMESTIC EQUITY FUNDS (Cost $255,906) |
333,099
|
International Equity Funds - 22.1% |
| | | |
Developed International Equity Funds - 17.6% |
VIP Overseas Portfolio Initial Class | 6,534 | | 89,063 |
Emerging Markets Equity Funds - 4.5% |
VIP Emerging Markets Portfolio Initial Class | 2,964 | | 22,944 |
TOTAL INTERNATIONAL EQUITY FUNDS (Cost $104,536) |
112,007
|
Bond Funds - 12.2% |
| Shares | | Value |
High Yield Bond Funds - 10.3% |
VIP High Income Portfolio Initial Class | 9,638 | | $ 51,948 |
Investment Grade Bond Funds - 1.9% |
VIP Investment Grade Bond Portfolio Initial Class | 756 | | 9,804 |
TOTAL BOND FUNDS (Cost $54,850) |
61,752
|
TOTAL INVESTMENT PORTFOLIO - 100.0% (Cost $415,292) | | 506,858 |
NET OTHER ASSETS (LIABILITIES) - 0.0% | | (37) |
NET ASSETS - 100% | $ 506,821 |
Other Information |
All investments are categorized as Level 1 under the Fair Value Hierarchy. The inputs or methodology used for valuing securities may not be an indication of the risk associated with investing in those securities. For more information on valuation inputs, please refer to the Security Valuation section in the accompanying Notes to Financial Statements. |
See accompanying notes which are an integral part of the financial statements.
Annual Report
Fidelity VIP Freedom 2050 Portfolio
Statement of Assets and Liabilities
| December 31, 2011 |
| | |
Assets | | |
Investment in securities, at value (cost $415,292) - See accompanying schedule | | $ 506,858 |
Receivable for investments sold | | 100 |
Total assets | | 506,958 |
| | |
Liabilities | | |
Payable for fund shares redeemed | $ 99 | |
Distribution and service plan fees payable | 38 | |
Total liabilities | | 137 |
| | |
Net Assets | | $ 506,821 |
Net Assets consist of: | | |
Paid in capital | | $ 352,723 |
Accumulated undistributed net realized gain (loss) on investments | | 62,532 |
Net unrealized appreciation (depreciation) on investments | | 91,566 |
Net Assets | | $ 506,821 |
Statement of Assets and Liabilities - continued
| December 31, 2011 |
| | |
Initial Class:
Net Asset Value, offering price and redemption price per share ($252,675 ÷ 18,940 shares) | | $ 13.34 |
| | |
Service Class:
Net Asset Value, offering price and redemption price per share ($90,931 ÷ 6,814 shares) | | $ 13.34 |
| | |
Service Class 2:
Net Asset Value, offering price and redemption price per share ($163,215 ÷ 12,243 shares) | | $ 13.33 |
See accompanying notes which are an integral part of the financial statements.
Annual Report
Statement of Operations
| Year ended December 31, 2011 |
| | |
Investment Income | | |
Income distributions from underlying funds | | $ 9,576 |
| | |
Expenses | | |
Distribution and service plan fees | $ 479 | |
Total expenses | | 479 |
Net investment income (loss) | | 9,097 |
Realized and Unrealized Gain (Loss) Realized gain (loss) on sale of underlying fund shares | 108,343 | |
Capital gain distributions from underlying funds | 935 | |
Total net realized gain (loss) | | 109,278 |
Change in net unrealized appreciation (depreciation) on underlying funds | | (124,717) |
Net gain (loss) | | (15,439) |
Net increase (decrease) in net assets resulting from operations | | $ (6,342) |
Statement of Changes in Net Assets
| Year ended
December 31,
2011 | Year ended
December 31,
2010 |
Increase (Decrease) in Net Assets | | |
Operations | | |
Net investment income (loss) | $ 9,097 | $ 15,147 |
Net realized gain (loss) | 109,278 | 22,127 |
Change in net unrealized appreciation (depreciation) | (124,717) | 95,990 |
Net increase (decrease) in net assets resulting from operations | (6,342) | 133,264 |
Distributions to shareholders from net investment income | (9,104) | (15,204) |
Distributions to shareholders from net realized gain | (51,618) | (18,973) |
Total distributions | (60,722) | (34,177) |
Share transactions - net increase (decrease) | (352,075) | 378,806 |
Total increase (decrease) in net assets | (419,139) | 477,893 |
| | |
Net Assets | | |
Beginning of period | 925,960 | 448,067 |
End of period | $ 506,821 | $ 925,960 |
See accompanying notes which are an integral part of the financial statements.
Annual Report
Financial Highlights - Initial Class
Years ended December 31, | 2011 | 2010 | 2009 F |
Selected Per-Share Data | | | |
Net asset value, beginning of period | $ 15.82 | $ 14.01 | $ 10.00 |
Income from Investment Operations | | | |
Net investment income (loss) D | .26 | .39 | .26 |
Net realized and unrealized gain (loss) | (1.03) | 2.06 | 4.01 |
Total from investment operations | (.77) | 2.45 | 4.27 |
Distributions from net investment income | (.28) | (.28) | (.25) |
Distributions from net realized gain | (1.43) | (.36) | (.01) |
Total distributions | (1.71) | (.64) | (.26) |
Net asset value, end of period | $ 13.34 | $ 15.82 | $ 14.01 |
Total Return B, C | (4.93)% | 17.58% | 42.70% |
Ratios to Average Net Assets E, G | | | |
Expenses before reductions | .00% | .00% | .00% A |
Expenses net of fee waivers, if any | .00% | .00% | .00% A |
Expenses net of all reductions | .00% | .00% | .00% A |
Net investment income (loss) | 1.67% | 2.64% | 2.76% A |
Supplemental Data | | | |
Net assets, end of period (000 omitted) | $ 253 | $ 666 | $ 159 |
Portfolio turnover rate | 92% | 50% | 4% A |
A Annualized
B Total returns for periods of less than one year are not annualized.
C Total returns do not reflect charges attributable to your insurance company's separate account. Inclusion of these charges would reduce the total returns shown.
D Calculated based on average shares outstanding during the period.
E Amounts do not include the activity of the Underlying Funds.
F For the period April 8, 2009 (commencement of operations) to December 31, 2009.
G Expense ratios reflect operating expenses of the class. Expenses before reductions do not reflect amounts reimbursed by the investment adviser or reductions from expense offset arrangements and do not represent the amount paid by the class during periods when reimbursements or reductions occur. Expense ratios before reductions for start-up periods may not be representative of longer-term operating periods. Expenses net of fee waivers reflect expenses after reimbursement by the investment adviser but prior to reductions from expense offset arrangements. Expenses net of all reductions represent the net expenses paid by the class but do not include expenses of the investment companies in which the Fund invests.
Financial Highlights - Service Class
Years ended December 31, | 2011 | 2010 | 2009 F |
Selected Per-Share Data | | | |
Net asset value, beginning of period | $ 15.82 | $ 14.00 | $ 10.00 |
Income from Investment Operations | | | |
Net investment income (loss) D | .25 | .37 | .25 |
Net realized and unrealized gain (loss) | (1.04) | 2.07 | 4.00 |
Total from investment operations | (.79) | 2.44 | 4.25 |
Distributions from net investment income | (.26) | (.26) | (.24) |
Distributions from net realized gain | (1.43) | (.36) | (.01) |
Total distributions | (1.69) | (.62) | (.25) |
Net asset value, end of period | $ 13.34 | $ 15.82 | $ 14.00 |
Total Return B, C | (5.06)% | 17.53% | 42.51% |
Ratios to Average Net Assets E, G | | | |
Expenses before reductions | .10% | .10% | .10% A |
Expenses net of fee waivers, if any | .10% | .10% | .10% A |
Expenses net of all reductions | .10% | .10% | .10% A |
Net investment income (loss) | 1.57% | 2.54% | 2.66% A |
Supplemental Data | | | |
Net assets, end of period (000 omitted) | $ 91 | $ 118 | $ 143 |
Portfolio turnover rate | 92% | 50% | 4% A |
A Annualized
B Total returns for periods of less than one year are not annualized.
C Total returns do not reflect charges attributable to your insurance company's separate account. Inclusion of these charges would reduce the total returns shown.
D Calculated based on average shares outstanding during the period.
E Amounts do not include the activity of the Underlying Funds.
F For the period April 8, 2009 (commencement of operations) to December 31, 2009.
G Expense ratios reflect operating expenses of the class. Expenses before reductions do not reflect amounts reimbursed by the investment adviser or reductions from expense offset arrangements and do not represent the amount paid by the class during periods when reimbursements or reductions occur. Expense ratios before reductions for start-up periods may not be representative of longer-term operating periods. Expenses net of fee waivers reflect expenses after reimbursement by the investment adviser but prior to reductions from expense offset arrangements. Expenses net of all reductions represent the net expenses paid by the class but do not include expenses of the investment companies in which the Fund invests.
See accompanying notes which are an integral part of the financial statements.
Annual Report
Financial Highlights - Service Class 2
Years ended December 31, | 2011 | 2010 | 2009 F |
Selected Per-Share Data | | | |
Net asset value, beginning of period | $ 15.81 | $ 14.00 | $ 10.00 |
Income from Investment Operations | | | |
Net investment income (loss) D | .22 | .35 | .23 |
Net realized and unrealized gain (loss) | (1.02) | 2.06 | 4.01 |
Total from investment operations | (.80) | 2.41 | 4.24 |
Distributions from net investment income | (.25) | (.24) | (.23) |
Distributions from net realized gain | (1.43) | (.36) | (.01) |
Total distributions | (1.68) | (.60) | (.24) |
Net asset value, end of period | $ 13.33 | $ 15.81 | $ 14.00 |
Total Return B, C | (5.16)% | 17.30% | 42.37% |
Ratios to Average Net Assets E, G | | | |
Expenses before reductions | .25% | .25% | .25% A |
Expenses net of fee waivers, if any | .25% | .25% | .25% A |
Expenses net of all reductions | .25% | .25% | .25% A |
Net investment income (loss) | 1.42% | 2.39% | 2.51% A |
Supplemental Data | | | |
Net assets, end of period (000 omitted) | $ 163 | $ 142 | $ 147 |
Portfolio turnover rate | 92% | 50% | 4% A |
A Annualized
B Total returns for periods of less than one year are not annualized.
C Total returns do not reflect charges attributable to your insurance company's separate account. Inclusion of these charges would reduce the total returns shown.
D Calculated based on average shares outstanding during the period.
E Amounts do not include the activity of the Underlying Funds.
F For the period April 8, 2009 (commencement of operations) to December 31, 2009.
G Expense ratios reflect operating expenses of the class. Expenses before reductions do not reflect amounts reimbursed by the investment adviser or reductions from expense offset arrangements and do not represent the amount paid by the class during periods when reimbursements or reductions occur. Expense ratios before reductions for start-up periods may not be representative of longer-term operating periods. Expenses net of fee waivers reflect expenses after reimbursement by the investment adviser but prior to reductions from expense offset arrangements. Expenses net of all reductions represent the net expenses paid by the class but do not include expenses of the investment companies in which the Fund invests.
See accompanying notes which are an integral part of the financial statements.
Annual Report
Notes to Financial Statements
For the period ended December 31, 2011
1. Organization.
VIP Freedom Income Portfolio, VIP Freedom 2005 Portfolio, VIP Freedom 2010 Portfolio, VIP Freedom 2015 Portfolio, VIP Freedom 2020 Portfolio, VIP Freedom 2025 Portfolio, VIP Freedom 2030 Portfolio, VIP Freedom 2035 Portfolio, VIP Freedom 2040 Portfolio, VIP Freedom 2045 Portfolio and VIP Freedom 2050 Portfolio (the Funds) are funds of Variable Insurance Products Fund V. Variable Insurance Products Fund V (the Trust) (referred to in this report as Fidelity Variable Insurance Products) is registered under the Investment Company Act of 1940, as amended (the 1940 Act), as an open-end management investment company organized as a Massachusetts business trust. Each Fund is authorized to issue an unlimited number of shares. The Funds invest primarily in a combination of other VIP equity, bond, and short-term funds (the Underlying Funds) managed by Fidelity Management & Research Company (FMR). Shares of each Fund may only be purchased by insurance companies for the purpose of funding variable annuity or variable life insurance contracts. Each Fund offers three classes of shares: Initial Class shares, Service Class shares and Service Class 2 shares. All classes have equal rights and voting privileges, except for matters affecting a single class. Investment income, realized and unrealized capital gains and losses, the common expenses of the Fund, and certain fund-level expense reductions, if any, are allocated on a pro-rata basis to each class based on the relative net assets of each class to the total net assets of the Fund. Each class differs with respect to distribution and service plan fees incurred. Certain expense reductions may also differ by class.
2. Significant Accounting Policies.
The financial statements have been prepared in conformity with accounting principles generally accepted in the United States of America (GAAP), which require management to make certain estimates and assumptions at the date of the financial statements. Actual results could differ from those estimates. Subsequent events, if any, through the date that the financial statements were issued have been evaluated in the preparation of the financial statements. The following summarizes the significant accounting policies of the Funds:
Security Valuation. Investments are valued as of 4:00 p.m. Eastern time on the last calendar day of the period. Each Fund categorizes the inputs to valuation techniques used to value their investments into a disclosure hierarchy consisting of three levels as shown below:
Level 1 - quoted prices in active markets for identical investments
Level 2 - other significant observable inputs (including quoted prices for similar investments, interest rates, prepayment speeds, etc.)
Level 3 - unobservable inputs (including the Fund's own assumptions based on the best information available)
Valuation techniques used to value each Fund's investments by major category are as follows. Investments in the Underlying Funds are valued at their closing net asset value (NAV) each business day and are categorized as Level 1 in the hierarchy.
Investment Transactions and Income. For financial reporting purposes, the Funds' investment holdings and NAV include trades executed through the end of the last business day of the period. The NAV per share for processing shareholder transactions is calculated as of the close of business of the New York Stock Exchange (NYSE), normally 4:00 p.m. Eastern time and includes trades executed through the end of the prior business day. Gains and losses on securities sold are determined on the basis of identified cost. Income and capital gain distributions from the Underlying Funds, if any, are recorded on the ex-dividend date. Interest income is accrued as earned. Interest income includes coupon interest and amortization of premium and accretion of discount on debt securities.
Expenses. Expenses directly attributable to a fund are charged to that fund. Expenses attributable to more than one fund are allocated among the respective funds on the basis of relative net assets or other appropriate methods. Expenses included in the accompanying financial statements reflect the expenses of the Fund and do not include any expenses associated with the Underlying Funds. Expense estimates are accrued in the period to which they relate and adjustments are made when actual amounts are known.
Income Tax Information and Distributions to Shareholders. Each year, each Fund intends to qualify as a regulated investment company, including distributing substantially all of its taxable income and realized gains under Subchapter M of the Internal Revenue Code. As a result, no provision for income taxes is required. As of December 31, 2011, each Fund did not have any unrecognized tax benefits in the financial statements; nor is each Fund aware of any tax positions for which it is reasonably possible that the total amounts of unrecognized tax benefits will significantly change in the next twelve months. Each Fund files a U.S. federal tax return, in addition to state and local tax returns as required. A fund's tax returns are subject to examination by the Internal Revenue Service (IRS) for a period of three fiscal years. State and local tax returns may be subject to examination for an additional fiscal year depending on the jurisdiction.
Distributions are declared and recorded on the ex-dividend date. Income dividends and capital gain distributions are declared separately for each class. Income and capital gain distributions are determined in accordance with income tax regulations, which may differ from GAAP.
Capital accounts within the financial statements are adjusted for permanent book-tax differences. These adjustments have no impact on net assets or the results of operations. Temporary book-tax differences will reverse in a subsequent period.
Annual Report
2. Significant Accounting Policies - continued
Income Tax Information and Distributions to Shareholders - continued
Book-tax differences are primarily due to the short-term gain distributions from the Underlying Funds, capital loss carryforwards and losses deferred due to wash sales and excise tax regulations.
The federal tax cost of investment securities and unrealized appreciation (depreciation) as of period end were as follows for each Fund:
| Tax cost | Gross unrealized
appreciation | Gross unrealized
depreciation | Net unrealized
appreciation
(depreciation) on
securities and other
investments |
VIP Freedom Income | $ 21,594,473 | $ 369,269 | $ (788,057) | $ (418,788) |
VIP Freedom 2005 | 6,059,493 | 103,777 | (618,422) | (514,645) |
VIP Freedom 2010 | 192,369,781 | 5,102,465 | (17,782,039) | (12,679,574) |
VIP Freedom 2015 | 105,994,375 | 5,383,063 | (9,453,140) | (4,070,077) |
VIP Freedom 2020 | 532,461,855 | 22,856,647 | (44,163,113) | (21,306,466) |
VIP Freedom 2025 | 51,655,090 | 1,849,222 | (4,933,749) | (3,084,527) |
VIP Freedom 2030 | 129,789,535 | 4,824,747 | (15,655,745) | (10,830,998) |
VIP Freedom 2035 | 357,234 | 113,301 | (7,517) | 105,784 |
VIP Freedom 2040 | 2,894,716 | 126,265 | (266,273) | (140,008) |
VIP Freedom 2045 | 233,844 | 95,942 | (1,801) | 94,141 |
VIP Freedom 2050 | 419,555 | 97,886 | (10,583) | 87,303 |
The tax-based components of distributable earnings as of period end were as follows for each Fund:
| Undistributed
ordinary income | Undistributed
long-term
capital gain | Capital loss
carryforward | Net unrealized
appreciation
(depreciation) |
VIP Freedom Income | $ 3,740 | $ 114,389 | $ - | $ (418,788) |
VIP Freedom 2005 | - | - | (151,827) | (514,645) |
VIP Freedom 2010 | 3,257 | 948,742 | - | (12,679,574) |
VIP Freedom 2015 | 22,222 | 621,424 | - | (4,070,077) |
VIP Freedom 2020 | 59 | 2,011,087 | - | (21,306,466) |
VIP Freedom 2025 | - | 184,049 | - | (3,084,527) |
VIP Freedom 2030 | - | 338,153 | - | (10,830,998) |
VIP Freedom 2035 | - | - | (2,237) | 105,784 |
VIP Freedom 2040 | - | 1,738 | - | (140,008) |
VIP Freedom 2045 | - | 10,750 | - | 94,141 |
VIP Freedom 2050 | - | 69,911 | - | 87,303 |
Capital loss carryforwards are only available to offset future capital gains of the Funds to the extent provided by regulations and may be limited. Under the Regulated Investment Company Modernization Act of 2010 (the Act), the Fund is permitted to carry forward capital losses incurred in taxable years beginning after December 22, 2010 for an unlimited period and such capital losses are required to be used prior to any losses that expire. Capital loss carryforwards were as follows:
| Fiscal year of expiration | |
| 2018 | Total with expiration |
VIP Freedom 2005 | $ (86,373) | $ (86,373) |
| No expiration | | Total capital |
| Short-term | Long-term | Total no expiration | loss carryfoward |
VIP Freedom 2005 | $ (20,603) | $ (44,851) | $ (65,454) | $ (151,827) |
VIP Freedom 2035 | (2,237) | - | (2,237) | (2,237) |
Annual Report
Notes to Financial Statements - continued
2. Significant Accounting Policies - continued
Income Tax Information and Distributions to Shareholders - continued
The tax character of distributions paid was as follows:
December 31, 2011 | | | |
| Ordinary Income | Long-term
Capital Gains | Total |
VIP Freedom Income | $ 436,063 | $ - | $ 436,063 |
VIP Freedom 2005 | 154,108 | - | 154,108 |
VIP Freedom 2010 | 4,416,607 | 15,059 | 4,431,666 |
VIP Freedom 2015 | 2,574,274 | - | 2,574,274 |
VIP Freedom 2020 | 12,346,744 | - | 12,346,744 |
VIP Freedom 2025 | 1,128,338 | - | 1,128,338 |
VIP Freedom 2030 | 2,776,265 | - | 2,776,265 |
VIP Freedom 2035 | 9,742 | 547 | 10,289 |
VIP Freedom 2040 | 60,123 | - | 60,123 |
VIP Freedom 2045 | 6,710 | 7,867 | 14,577 |
VIP Freedom 2050 | 60,722 | - | 60,722 |
December 31, 2010 | | | |
| Ordinary Income | Long-term
Capital Gains | Total |
VIP Freedom Income | $ 513,223 | $ 292,617 | $ 805,840 |
VIP Freedom 2005 | 198,157 | - | 198,157 |
VIP Freedom 2010 | 4,963,086 | 776,484 | 5,739,570 |
VIP Freedom 2015 | 2,892,227 | 134,344 | 3,026,571 |
VIP Freedom 2020 | 9,854,211 | 179,638 | 10,033,849 |
VIP Freedom 2025 | 1,001,759 | 15,521 | 1,017,280 |
VIP Freedom 2030 | 2,346,989 | 97,450 | 2,444,439 |
VIP Freedom 2035 | 15,387 | 21,394 | 36,781 |
VIP Freedom 2040 | 54,058 | 17,135 | 71,193 |
VIP Freedom 2045 | 13,928 | 23,514 | 37,442 |
VIP Freedom 2050 | 23,223 | 10,954 | 34,177 |
3. Purchases and Sales of Investments.
Purchases and redemptions of the Underlying Fund shares are noted in the table below.
| Purchases ($) | Redemptions ($) |
VIP Freedom Income | 12,872,273 | 10,029,121 |
VIP Freedom 2005 | 3,260,114 | 3,618,918 |
VIP Freedom 2010 | 54,341,201 | 28,417,603 |
VIP Freedom 2015 | 33,187,760 | 26,267,547 |
VIP Freedom 2020 | 191,775,242 | 47,403,283 |
VIP Freedom 2025 | 18,826,438 | 9,550,765 |
VIP Freedom 2030 | 41,986,614 | 18,109,188 |
VIP Freedom 2035 | 241,423 | 192,582 |
VIP Freedom 2040 | 3,440,421 | 936,863 |
VIP Freedom 2045 | 102,979 | 114,350 |
VIP Freedom 2050 | 528,640 | 931,426 |
4. Fees and Other Transactions with Affiliates.
Management Fee. Strategic Advisers, Inc. (Strategic Advisers), an affiliate of FMR, provides the Funds with investment management related services. The Funds do not pay any fees for these services.
Other Transactions. Strategic Advisers has entered into an administration agreement with FMR under which FMR provides management and administrative services (other than investment advisory services) necessary for the operation of each Fund. Pursuant to this agreement, FMR pays all expenses of each Fund, excluding the distribution and service fees, the compensation of the independent Trustees and certain other expenses such as
Annual Report
4. Fees and Other Transactions with Affiliates - continued
Other Transactions - continued
interest expense. FMR also contracts with other Fidelity companies to perform the services necessary for the operation of each Fund. The Funds do not pay any fees for these services.
Distribution and Service Plan Fees. In accordance with Rule 12b-1 of the 1940 Act, the Funds have adopted separate 12b-1 Plans for each Service Class of shares. Each Service Class pays Fidelity Distributors Corporation (FDC), an affiliate of FMR, a service fee. For the period, the service fee is based on an annual rate of .10% of Service Class' average net assets and .25% of Service Class 2's average net assets.
For the period, total fees, all of which were reallowed to insurance companies for the distribution of shares and providing shareholder support services were as follows:
| Service
Class | Service
Class 2 | Total |
VIP Freedom Income | $ 1,556 | $ 18,937 | $ 20,493 |
VIP Freedom 2005 | 151 | 1,093 | 1,244 |
VIP Freedom 2010 | 20,030 | 315,769 | 335,799 |
VIP Freedom 2015 | 4,794 | 141,084 | 145,878 |
VIP Freedom 2020 | 36,528 | 933,926 | 970,454 |
VIP Freedom 2025 | 4,718 | 60,759 | 65,477 |
VIP Freedom 2030 | 27,309 | 139,149 | 166,458 |
VIP Freedom 2035 | 104 | 731 | 835 |
VIP Freedom 2040 | 772 | 383 | 1,155 |
VIP Freedom 2045 | 104 | 356 | 460 |
VIP Freedom 2050 | 105 | 374 | 479 |
5. Expense Reductions.
FMR voluntarily agreed to reimburse funds to the extent annual operating expenses exceeded certain levels of average net assets as noted in the table below. Some expenses, for example interest expense, are excluded from this reimbursement.
The following classes of each applicable Fund were in reimbursement during the period:
| Expense
Limitations | Reimbursement
from adviser |
| | |
VIP Freedom Income | | |
Initial Class | -% | $ 40 |
Service Class | .10% | 6 |
Service Class 2 | .25% | 27 |
VIP Freedom 2005 | | |
Initial Class | -% | 18 |
Service Class | .10% | 1 |
Service Class 2 | .25% | 2 |
VIP Freedom 2010 | | |
Initial Class | -% | 81 |
Service Class | .10% | 71 |
Service Class 2 | .25% | 450 |
VIP Freedom 2015 | | |
Initial Class | -% | 144 |
Service Class | .10% | 17 |
Service Class 2 | .25% | 202 |
VIP Freedom 2020 | | |
Initial Class | -% | 172 |
Service Class | .10% | 128 |
Service Class 2 | .25% | 1,309 |
Annual Report
Notes to Financial Statements - continued
5. Expense Reductions - continued
| Expense
Limitations | Reimbursement
from adviser |
| | |
VIP Freedom 2025 | | |
Initial Class | -% | $ 60 |
Service Class | .10% | 16 |
Service Class 2 | .25% | 86 |
VIP Freedom 2030 | | |
Initial Class | -% | 109 |
Service Class | .10% | 96 |
Service Class 2 | .25% | 197 |
VIP Freedom 2040 | | |
Initial Class | -% | 4 |
Service Class | .10% | 2 |
Service Class 2 | .25% | 1 |
6. Distributions to Shareholders.
Distributions to shareholders of each class were as follows:
Years ended December 31, | 2011 | 2010 |
VIP Freedom Income | | |
From net investment income | | |
Initial Class | $ 195,722 | $ 210,386 |
Service Class | 37,230 | 3,035 |
Service Class 2 | 124,660 | 115,815 |
Total | $ 357,612 | $ 329,236 |
From net realized gain | | |
Initial Class | $ 40,602 | $ 290,719 |
Service Class | 8,022 | 4,582 |
Service Class 2 | 29,827 | 181,303 |
Total | $ 78,451 | $ 476,604 |
VIP Freedom 2005 | | |
From net investment income | | |
Initial Class | $ 98,956 | $ 112,320 |
Service Class | 2,218 | 3,344 |
Service Class 2 | 27,730 | 2,691 |
Total | $ 128,904 | $ 118,355 |
From net realized gain | | |
Initial Class | $ 19,170 | $ 76,130 |
Service Class | 458 | 2,040 |
Service Class 2 | 5,576 | 1,632 |
Total | $ 25,204 | $ 79,802 |
VIP Freedom 2010 | | |
From net investment income | | |
Initial Class | $ 476,833 | $ 463,722 |
Service Class | 427,907 | 377,308 |
Service Class 2 | 2,596,925 | 2,186,962 |
Total | $ 3,501,665 | $ 3,027,992 |
From net realized gain | | |
Initial Class | $ 116,725 | $ 398,603 |
Service Class | 108,547 | 350,127 |
Service Class 2 | 704,729 | 1,962,848 |
Total | $ 930,001 | $ 2,711,578 |
Annual Report
6. Distributions to Shareholders - continued
Years ended December 31, | 2011 | 2010 |
VIP Freedom 2015 | | |
From net investment income | | |
Initial Class | $ 826,838 | $ 813,676 |
Service Class | 171,855 | 54,230 |
Service Class 2 | 1,045,079 | 1,039,969 |
Total | $ 2,043,772 | $ 1,907,875 |
From net realized gain | | |
Initial Class | $ 200,335 | $ 461,272 |
Service Class | 42,769 | 28,463 |
Service Class 2 | 287,397 | 628,961 |
Total | $ 530,501 | $ 1,118,696 |
VIP Freedom 2020 | | |
From net investment income | | |
Initial Class | $ 1,049,292 | $ 930,464 |
Service Class | 778,227 | 654,671 |
Service Class 2 | 8,558,653 | 5,829,063 |
Total | $ 10,386,172 | $ 7,414,198 |
From net realized gain | | |
Initial Class | $ 181,696 | $ 331,668 |
Service Class | 140,856 | 235,505 |
Service Class 2 | 1,638,020 | 2,052,478 |
Total | $ 1,960,572 | $ 2,619,651 |
VIP Freedom 2025 | | |
From net investment income | | |
Initial Class | $ 332,511 | $ 346,092 |
Service Class | 150,864 | 27,402 |
Service Class 2 | 486,789 | 426,018 |
Total | $ 970,164 | $ 799,512 |
VIP Freedom 2025 | | |
From net realized gain | | |
Initial Class | $ 50,800 | $ 98,389 |
Service Class | 23,707 | 7,360 |
Service Class 2 | 83,667 | 112,019 |
Total | $ 158,174 | $ 217,768 |
VIP Freedom 2030 | | |
From net investment income | | |
Initial Class | $ 662,495 | $ 539,256 |
Service Class | 589,888 | 411,502 |
Service Class 2 | 1,163,344 | 824,730 |
Total | $ 2,415,727 | $ 1,775,488 |
From net realized gain | | |
Initial Class | $ 92,441 | $ 194,726 |
Service Class | 86,325 | 151,508 |
Service Class 2 | 181,772 | 322,717 |
Total | $ 360,538 | $ 668,951 |
VIP Freedom 2035 | | |
From net investment income | | |
Initial Class | $ 1,899 | $ 2,136 |
Service Class | 1,654 | 1,918 |
Service Class 2 | 4,689 | 3,394 |
Total | $ 8,242 | $ 7,448 |
From net realized gain | | |
Initial Class | $ 445 | $ 8,162 |
Service Class | 420 | 7,842 |
Service Class 2 | 1,182 | 13,329 |
Total | $ 2,047 | $ 29,333 |
Annual Report
Notes to Financial Statements - continued
6. Distributions to Shareholders - continued
VIP Freedom 2040 | | |
Years ended December 31, | 2011 | 2010 |
From net investment income | | |
Initial Class | $ 31,680 | $ 4,811 |
Service Class | 20,912 | 1,884 |
Service Class 2 | 2,975 | 2,151 |
Total | $ 55,567 | $ 8,846 |
From net realized gain | | |
Initial Class | $ 2,544 | $ 31,376 |
Service Class | 1,743 | 13,997 |
Service Class 2 | 269 | 16,974 |
Total | $ 4,556 | $ 62,347 |
VIP Freedom 2045 | | |
From net investment income | | |
Initial Class | $ 1,932 | $ 2,203 |
Service Class | 1,740 | 2,006 |
Service Class 2 | 2,559 | 1,978 |
Total | $ 6,231 | $ 6,187 |
From net realized gain | | |
Initial Class | $ 2,739 | $ 10,391 |
Service Class | 2,654 | 10,084 |
Service Class 2 | 2,953 | 10,780 |
Total | $ 8,346 | $ 31,255 |
VIP Freedom 2050 | | |
From net investment income | | |
Initial Class | $ 4,684 | $ 11,275 |
Service Class | 1,588 | 1,872 |
Service Class 2 | 2,832 | 2,057 |
Total | $ 9,104 | $ 15,204 |
From net realized gain | | |
Initial Class | $ 26,549 | $ 12,930 |
Service Class | 8,828 | 2,793 |
Service Class 2 | 16,241 | 3,250 |
Total | $ 51,618 | $ 18,973 |
7. Share Transactions.
Transactions for each class of shares were as follows:
| Shares | Dollars |
Years ended December 31, | 2011 | 2010 | 2011 | 2010 |
VIP Freedom Income | | | | |
Initial Class | | | | |
Shares sold | 543,622 | 258,557 | $ 5,666,542 | $ 2,671,849 |
Reinvestment of distributions | 23,169 | 48,930 | 236,324 | 501,105 |
Shares redeemed | (582,469) | (488,726) | (6,065,963) | (5,003,766) |
Net increase (decrease) | (15,678) | (181,239) | $ (163,097) | $ (1,830,812) |
Service Class | | | | |
Shares sold | 316,591 | 14,564 | $ 3,328,350 | $ 146,987 |
Reinvestment of distributions | 4,432 | 743 | 45,252 | 7,617 |
Shares redeemed | (92,529) | (14,887) | (964,609) | (152,852) |
Net increase (decrease) | 228,494 | 420 | $ 2,408,993 | $ 1,752 |
Service Class 2 | | | | |
Shares sold | 402,000 | 357,073 | $ 4,158,851 | $ 3,636,152 |
Reinvestment of distributions | 15,190 | 29,093 | 154,487 | 297,118 |
Shares redeemed | (371,665) | (349,472) | (3,842,928) | (3,569,125) |
Net increase (decrease) | 45,525 | 36,694 | $ 470,410 | $ 364,145 |
Annual Report
7. Share Transactions - continued
| Shares | Dollars |
Years ended December 31, | 2011 | 2010 | 2011 | 2010 |
VIP Freedom 2005 | | | | |
Initial Class | | | | |
Shares sold | 127,726 | 134,064 | $ 1,305,070 | $ 1,286,624 |
Reinvestment of distributions | 11,980 | 19,288 | 118,126 | 188,450 |
Shares redeemed | (178,877) | (315,687) | (1,815,207) | (3,018,853) |
Net increase (decrease) | (39,171) | (162,335) | $ (392,011) | $ (1,543,779) |
Service Class | | | | |
Shares sold | 7,624 | 6,760 | $ 77,113 | $ 68,354 |
Reinvestment of distributions | 271 | 549 | 2,676 | 5,384 |
Shares redeemed | (16,002) | (7,984) | (161,474) | (77,087) |
Net increase (decrease) | (8,107) | (675) | $ (81,685) | $ (3,349) |
Service Class 2 | | | | |
Shares sold | 142,912 | 9,995 | $ 1,423,341 | $ 93,487 |
Reinvestment of distributions | 3,381 | 440 | 33,306 | 4,323 |
Shares redeemed | (138,887) | (14,517) | (1,369,739) | (139,052) |
Net increase (decrease) | 7,406 | (4,082) | $ 86,908 | $ (41,242) |
VIP Freedom 2010 | | | | |
Initial Class | | | | |
Shares sold | 464,447 | 436,778 | $ 4,963,243 | $ 4,483,599 |
Reinvestment of distributions | 57,516 | 82,723 | 593,558 | 862,325 |
Shares redeemed | (482,640) | (559,697) | (5,181,548) | (5,705,979) |
Net increase (decrease) | 39,323 | (40,196) | $ 375,253 | $ (360,055) |
Service Class | | | | |
Shares sold | 588,287 | 560,883 | $ 6,354,925 | $ 5,683,418 |
Reinvestment of distributions | 52,037 | 69,957 | 536,454 | 727,435 |
Shares redeemed | (425,148) | (783,131) | (4,547,355) | (8,010,814) |
Net increase (decrease) | 215,176 | (152,291) | $ 2,344,024 | $ (1,599,961) |
Service Class 2 | | | | |
Shares sold | 3,362,539 | 3,191,303 | $ 35,801,452 | $ 32,493,399 |
Reinvestment of distributions | 321,514 | 398,872 | 3,301,654 | 4,149,810 |
Shares redeemed | (1,562,905) | (1,434,821) | (16,621,602) | (14,472,689) |
Net increase (decrease) | 2,121,148 | 2,155,354 | $ 22,481,504 | $ 22,170,520 |
VIP Freedom 2015 | | | | |
Initial Class | | | | |
Shares sold | 850,771 | 670,873 | $ 9,246,584 | $ 6,860,434 |
Reinvestment of distributions | 98,957 | 120,777 | 1,027,173 | 1,274,948 |
Shares redeemed | (901,866) | (909,179) | (9,801,615) | (9,208,564) |
Net increase (decrease) | 47,862 | (117,529) | $ 472,142 | $ (1,073,182) |
Service Class | | | | |
Shares sold | 717,209 | 156,503 | $ 7,691,501 | $ 1,583,510 |
Reinvestment of distributions | 20,697 | 7,803 | 214,624 | 82,693 |
Shares redeemed | (246,215) | (65,542) | (2,641,295) | (664,170) |
Net increase (decrease) | 491,691 | 98,764 | $ 5,264,830 | $ 1,002,033 |
Service Class 2 | | | | |
Shares sold | 1,160,410 | 1,421,812 | $ 12,483,558 | $ 14,400,184 |
Reinvestment of distributions | 128,866 | 158,545 | 1,332,475 | 1,668,930 |
Shares redeemed | (1,214,512) | (678,716) | (13,110,493) | (6,837,448) |
Net increase (decrease) | 74,764 | 901,641 | $ 705,540 | $ 9,231,666 |
VIP Freedom 2020 | | | | |
Initial Class | | | | |
Shares sold | 1,431,567 | 920,774 | $ 15,478,055 | $ 9,150,944 |
Reinvestment of distributions | 120,449 | 120,936 | 1,230,988 | 1,262,132 |
Shares redeemed | (1,147,522) | (799,922) | (12,307,636) | (7,947,958) |
Net increase (decrease) | 404,494 | 241,788 | $ 4,401,407 | $ 2,465,118 |
Annual Report
Notes to Financial Statements - continued
7. Share Transactions - continued
| Shares | Dollars |
Years ended December 31, | 2011 | 2010 | 2011 | 2010 |
VIP Freedom 2020 | | | | |
Service Class | | | | |
Shares sold | 1,052,615 | 1,051,011 | $ 11,359,843 | $ 10,406,571 |
Reinvestment of distributions | 90,106 | 85,322 | 919,083 | 890,176 |
Shares redeemed | (674,788) | (722,926) | (7,210,331) | (7,208,777) |
Net increase (decrease) | 467,933 | 413,407 | $ 5,068,595 | $ 4,087,970 |
Service Class 2 | | | | |
Shares sold | 13,613,924 | 10,438,161 | $ 144,846,404 | $ 103,574,788 |
Reinvestment of distributions | 1,002,623 | 756,007 | 10,196,673 | 7,881,541 |
Shares redeemed | (2,071,647) | (1,785,393) | (21,956,318) | (17,423,750) |
Net increase (decrease) | 12,544,900 | 9,408,775 | $ 133,086,759 | $ 94,032,579 |
VIP Freedom 2025 | | | | |
Initial Class | | | | |
Shares sold | 316,493 | 210,663 | $ 3,360,409 | $ 2,056,243 |
Reinvestment of distributions | 38,255 | 42,774 | 383,311 | 444,481 |
Shares redeemed | (460,823) | (197,611) | (4,896,785) | (1,893,385) |
Net increase (decrease) | (106,075) | 55,826 | $ (1,153,065) | $ 607,339 |
Service Class | | | | |
Shares sold | 664,334 | 96,750 | $ 6,956,093 | $ 938,977 |
Reinvestment of distributions | 17,440 | 3,336 | 174,571 | 34,762 |
Shares redeemed | (103,678) | (36,867) | (1,089,627) | (368,024) |
Net increase (decrease) | 578,096 | 63,219 | $ 6,041,037 | $ 605,715 |
Service Class 2 | | | | |
Shares sold | 722,933 | 1,456,760 | $ 7,498,084 | $ 14,706,194 |
Reinvestment of distributions | 57,217 | 51,796 | 570,455 | 538,037 |
Shares redeemed | (366,230) | (218,947) | (3,841,573) | (2,103,016) |
Net increase (decrease) | 413,920 | 1,289,609 | $ 4,226,966 | $ 13,141,215 |
VIP Freedom 2030 | | | | |
Initial Class | | | | |
Shares sold | 804,180 | 775,263 | $ 8,224,380 | $ 7,430,999 |
Reinvestment of distributions | 77,829 | 73,020 | 754,936 | 733,982 |
Shares redeemed | (558,805) | (656,437) | (5,715,678) | (6,157,596) |
Net increase (decrease) | 323,204 | 191,846 | $ 3,263,638 | $ 2,007,385 |
Service Class | | | | |
Shares sold | 1,124,643 | 826,988 | $ 11,604,879 | $ 7,926,058 |
Reinvestment of distributions | 69,785 | 56,031 | 676,213 | 563,009 |
Shares redeemed | (503,954) | (406,449) | (5,160,071) | (3,785,635) |
Net increase (decrease) | 690,474 | 476,570 | $ 7,121,021 | $ 4,703,432 |
Service Class 2 | | | | |
Shares sold | 2,397,724 | 1,644,957 | $ 24,438,048 | $ 15,476,635 |
Reinvestment of distributions | 139,102 | 114,453 | 1,345,116 | 1,147,447 |
Shares redeemed | (1,233,591) | (754,936) | (12,571,282) | (7,067,727) |
Net increase (decrease) | 1,303,235 | 1,004,474 | $ 13,211,882 | $ 9,556,355 |
VIP Freedom 2035 | | | | |
Initial Class | | | | |
Shares sold | 517 | 169 | $ 7,378 | $ 2,393 |
Reinvestment of distributions | 168 | 710 | 2,344 | 10,298 |
Shares redeemed | (1,837) | (3,191) | (27,110) | (45,336) |
Net increase (decrease) | (1,152) | (2,312) | $ (17,388) | $ (32,645) |
Service Class | | | | |
Shares sold | - | - | $ - | $ - |
Reinvestment of distributions | 148 | 673 | 2,074 | 9,760 |
Shares redeemed | (1,496) | (3,018) | (22,170) | (42,843) |
Net increase (decrease) | (1,348) | (2,345) | $ (20,096) | $ (33,083) |
Annual Report
7. Share Transactions - continued
| Shares | Dollars |
Years ended December 31, | 2011 | 2010 | 2011 | 2010 |
VIP Freedom 2035 | | | | |
Service Class 2 | | | | |
Shares sold | 16,012 | 6,219 | $ 233,514 | $ 94,194 |
Reinvestment of distributions | 420 | 1,147 | 5,871 | 16,723 |
Shares redeemed | (10,794) | (3,391) | (152,907) | (48,539) |
Net increase (decrease) | 5,638 | 3,975 | $ 86,478 | $ 62,378 |
VIP Freedom 2040 | | | | |
Initial Class | | | | |
Shares sold | 114,034 | 70,337 | $ 1,616,680 | $ 989,272 |
Reinvestment of distributions | 2,599 | 2,586 | 34,224 | 36,187 |
Shares redeemed | (17,949) | (63,590) | (248,395) | (920,096) |
Net increase (decrease) | 98,684 | 9,333 | $ 1,402,509 | $ 105,363 |
Service Class | | | | |
Shares sold | 111,915 | - | $ 1,670,332 | $ - |
Reinvestment of distributions | 1,720 | 1,138 | 22,655 | 15,881 |
Shares redeemed | (41,524) | (3,021) | (597,686) | (43,092) |
Net increase (decrease) | 72,111 | (1,883) | $ 1,095,301 | $ (27,211) |
Service Class 2 | | | | |
Shares sold | 5,669 | 1,870 | $ 78,289 | $ 28,133 |
Reinvestment of distributions | 247 | 1,370 | 3,244 | 19,125 |
Shares redeemed | (5,726) | (3,161) | (77,298) | (45,227) |
Net increase (decrease) | 190 | 79 | $ 4,235 | $ 2,031 |
VIP Freedom 2045 | | | | |
Initial Class | | | | |
Shares sold | 215 | 38 | $ 3,017 | $ 576 |
Reinvestment of distributions | 328 | 872 | 4,671 | 12,594 |
Shares redeemed | (1,725) | (3,131) | (24,843) | (44,833) |
Net increase (decrease) | (1,182) | (2,221) | $ (17,155) | $ (31,663) |
Service Class | | | | |
Shares sold | - | - | $ - | $ - |
Reinvestment of distributions | 308 | 837 | 4,394 | 12,090 |
Shares redeemed | (1,560) | (3,018) | (22,468) | (43,180) |
Net increase (decrease) | (1,252) | (2,181) | $ (18,074) | $ (31,090) |
Service Class 2 | | | | |
Shares sold | 5,549 | 617 | $ 79,835 | $ 9,521 |
Reinvestment of distributions | 390 | 883 | 5,512 | 12,757 |
Shares redeemed | (3,892) | (3,049) | (53,887) | (43,609) |
Net increase (decrease) | 2,047 | (1,549) | $ 31,460 | $ (21,331) |
VIP Freedom 2050 | | | | |
Initial Class | | | | |
Shares sold | 25,741 | 38,491 | $ 405,897 | $ 556,062 |
Reinvestment of distributions | 2,281 | 1,539 | 31,233 | 24,205 |
Shares redeemed | (51,164) | (9,291) | (826,168) | (141,310) |
Net increase (decrease) | (23,142) | 30,739 | $ (389,038) | $ 438,957 |
Service Class | | | | |
Shares sold | - | - | $ - | $ - |
Reinvestment of distributions | 770 | 302 | 10,416 | 4,665 |
Shares redeemed | (1,439) | (2,999) | (22,752) | (43,436) |
Net increase (decrease) | (669) | (2,697) | $ (12,336) | $ (38,771) |
Service Class 2 | | | | |
Shares sold | 6,757 | 1,782 | $ 103,745 | $ 26,095 |
Reinvestment of distributions | 1,417 | 343 | 19,073 | 5,307 |
Shares redeemed | (4,906) | (3,620) | (73,519) | (52,782) |
Net increase (decrease) | 3,268 | (1,495) | $ 49,299 | $ (21,380) |
Annual Report
Notes to Financial Statements - continued
8. Other.
The Funds' organizational documents provide former and current trustees and officers with a limited indemnification against liabilities arising in connection with the performance of their duties to the Funds. In the normal course of business, the Funds may also enter into contracts that provide general indemnifications. The Funds' maximum exposure under these arrangements is unknown as this would be dependent on future claims that may be made against the Funds. The risk of material loss from such claims is considered remote.
The Funds do not invest in the Underlying Funds for the purpose of exercising management or control; however, investments by the Funds within their principal investment strategies may represent a significant portion of the Underlying Fund's net assets. At the end of the period, VIP Freedom 2020 was the owner of record of approximately 25% of the total outstanding shares of VIP Value Portfolio, and approximately 17% of the total outstanding shares of VIP Emerging Markets Portfolio.
The Funds, in aggregate, were the owners of record of more than 20% of the total outstanding shares of the following Underlying Funds.
Fund | % of shares held |
VIP Emerging Markets Portfolio | 33% |
VIP Value Portfolio | 47% |
In addition, at the end of the period, FMR or its affiliates and certain otherwise unaffiliated shareholders each were owners of record of more than 10% of the outstanding shares of the following funds:
| Affiliated% | Number of
Unaffiliated
Shareholders | Unaffiliated
Shareholders% |
VIP Freedom Income | 49% | 1 | 18% |
VIP Freedom 2005 | 95% | - | - |
VIP Freedom 2010 | - | 1 | 73% |
VIP Freedom 2015 | 32% | 1 | 35% |
VIP Freedom 2020 | - | 1 | 74% |
VIP Freedom 2025 | 25% | 3 | 57% |
VIP Freedom 2030 | 12% | 2 | 62% |
VIP Freedom 2035 | 42% | 2 | 53% |
VIP Freedom 2040 | - | 3 | 90% |
VIP Freedom 2045 | 75% | 1 | 16% |
VIP Freedom 2050 | 31% | 2 | 61% |
Annual Report
Report of Independent Registered Public Accounting Firm
To the Trustees of Variable Insurance Products Fund V and the Shareholders of VIP Freedom Income Portfolio, VIP Freedom 2005 Portfolio, VIP Freedom 2010 Portfolio, VIP Freedom 2015 Portfolio, VIP Freedom 2020 Portfolio, VIP Freedom 2025 Portfolio, VIP Freedom 2030 Portfolio, VIP Freedom 2035 Portfolio, VIP Freedom 2040 Portfolio, VIP Freedom 2045 Portfolio and VIP Freedom 2050 Portfolio:
We have audited the accompanying statements of assets and liabilities of VIP Freedom Income Portfolio, VIP Freedom 2005 Portfolio, VIP Freedom 2010 Portfolio, VIP Freedom 2015 Portfolio, VIP Freedom 2020 Portfolio, VIP Freedom 2025 Portfolio, VIP Freedom 2030 Portfolio, VIP Freedom 2035 Portfolio, VIP Freedom 2040 Portfolio, VIP Freedom 2045 Portfolio and VIP Freedom 2050 Portfolio (the Funds), each a fund of Variable Insurance Products Fund V, including the schedules of investments, as of December 31, 2011, and the related statements of operations for the year then ended, the statements of changes in net assets for each of the two years in the period then ended, and the financial highlights for each of the periods presented. These financial statements and financial highlights are the responsibility of the Funds' management. Our responsibility is to express an opinion on these financial statements and financial highlights based on our audits.
We conducted our audits in accordance with the standards of the Public Company Accounting Oversight Board (United States). Those standards require that we plan and perform the audit to obtain reasonable assurance about whether the financial statements and financial highlights are free of material misstatement. The Funds are not required to have, nor were we engaged to perform, an audit of their internal control over financial reporting. Our audits included consideration of internal control over financial reporting as a basis for designing audit procedures that are appropriate in the circumstances, but not for the purpose of expressing an opinion on the effectiveness of the Funds' internal control over financial reporting. Accordingly, we express no such opinion. An audit also includes examining, on a test basis, evidence supporting the amounts and disclosures in the financial statements, assessing the accounting principles used and significant estimates made by management, as well as evaluating the overall financial statement presentation. Our procedures included confirmation of securities owned as of December 31, 2011, by correspondence with the custodians. We believe that our audits provide a reasonable basis for our opinion.
In our opinion, the financial statements and financial highlights referred to above present fairly, in all material respects, the financial position of VIP Freedom Income Portfolio, VIP Freedom 2005 Portfolio, VIP Freedom 2010 Portfolio, VIP Freedom 2015 Portfolio, VIP Freedom 2020 Portfolio, VIP Freedom 2025 Portfolio, VIP Freedom 2030 Portfolio, VIP Freedom 2035 Portfolio, VIP Freedom 2040 Portfolio, VIP Freedom 2045 Portfolio and VIP Freedom 2050 Portfolio as of December 31, 2011, the results of their operations for the year then ended, the changes in their net assets for each of the two years in the period then ended, and the financial highlights for each of the periods presented, in conformity with accounting principles generally accepted in the United States of America.
/s/ Deloitte & Touche LLP
DELOITTE & TOUCHE LLP
Boston, Massachusetts
February 16, 2012
Annual Report
The Trustees and executive officers of the trust and funds, as applicable, are listed below. The Board of Trustees governs each VIP Freedom Portfolio and is responsible for protecting the interests of shareholders. The Trustees are experienced executives who meet periodically throughout the year to oversee each VIP Freedom Portfolio's activities, review contractual arrangements with companies that provide services to each VIP Freedom Portfolio, oversee management of the risks associated with such activities and contractual arrangements, and review each VIP Freedom Portfolio's performance. If the interests of a VIP Freedom Portfolio and an underlying Fidelity fund were to diverge, a conflict of interest could arise and affect how the Trustees fulfill their fiduciary duties to the affected funds. Strategic Advisers has structured the VIP Freedom Portfolios to avoid these potential conflicts, although there may be situations where a conflict of interest is unavoidable. In such instances, Strategic Advisers and the Trustees would take reasonable steps to minimize and, if possible, eliminate the conflict. Except for James C. Curvey, each of the Trustees oversees 203 funds advised by FMR or an affiliate. Mr. Curvey oversees 429 funds advised by FMR or an affiliate.
The Trustees hold office without limit in time except that (a) any Trustee may resign; (b) any Trustee may be removed by written instrument, signed by at least two-thirds of the number of Trustees prior to such removal; (c) any Trustee who requests to be retired or who has become incapacitated by illness or injury may be retired by written instrument signed by a majority of the other Trustees; and (d) any Trustee may be removed at any special meeting of shareholders by a two-thirds vote of the outstanding voting securities of the trust. Each Trustee who is not an interested person (as defined in the 1940 Act) (Independent Trustee), shall retire not later than the last day of the calendar year in which his or her 75th birthday occurs. The Independent Trustees may waive this mandatory retirement age policy with respect to individual Trustees. The executive officers hold office without limit in time, except that any officer may resign or may be removed by a vote of a majority of the Trustees at any regular meeting or any special meeting of the Trustees. Except as indicated, each individual has held the office shown or other offices in the same company for the past five years.
Experience, Skills, Attributes, and Qualifications of the Funds' Trustees. The Governance and Nominating Committee has adopted a statement of policy that describes the experience, qualifications, attributes, and skills that are necessary and desirable for potential Independent Trustee candidates (Statement of Policy). The Board believes that each Trustee satisfied at the time he or she was initially elected or appointed a Trustee, and continues to satisfy, the standards contemplated by the Statement of Policy. The Governance and Nominating Committee also engages professional search firms to help identify potential Independent Trustee candidates who have the experience, qualifications, attributes, and skills consistent with the Statement of Policy. From time to time, additional criteria based on the composition and skills of the current Independent Trustees, as well as experience or skills that may be appropriate in light of future changes to board composition, business conditions, and regulatory or other developments, have also been considered by the professional search firms and the Governance and Nominating Committee. In addition, the Board takes into account the Trustees' commitment and participation in Board and committee meetings, as well as their leadership of standing and ad hoc committees throughout their tenure.
In determining that a particular Trustee was and continues to be qualified to serve as a Trustee, the Board has considered a variety of criteria, none of which, in isolation, was controlling. The Board believes that, collectively, the Trustees have balanced and diverse experience, qualifications, attributes, and skills, which allow the Board to operate effectively in governing each fund and protecting the interests of shareholders. Information about the specific experience, skills, attributes, and qualifications of each Trustee, which in each case led to the Board's conclusion that the Trustee should serve (or continue to serve) as a trustee of the funds, is provided below.
Board Structure and Oversight Function. Abigail P. Johnson is an interested person (as defined in the 1940 Act) and currently serves as Chairman. The Trustees have determined that an interested Chairman is appropriate and benefits shareholders because an interested Chairman has a personal and professional stake in the quality and continuity of services provided to the funds. Independent Trustees exercise their informed business judgment to appoint an individual of their choosing to serve as Chairman, regardless of whether the Trustee happens to be independent or a member of management. The Independent Trustees have determined that they can act independently and effectively without having an Independent Trustee serve as Chairman and that a key structural component for assuring that they are in a position to do so is for the Independent Trustees to constitute a substantial majority for the Board. The Independent Trustees also regularly meet in executive session. Kenneth L. Wolfe serves as Chairman of the Independent Trustees and as such (i) acts as a liaison between the Independent Trustees and management with respect to matters important to the Independent Trustees and (ii) with management prepares agendas for Board meetings.
Fidelity funds are overseen by different Boards of Trustees. The funds' Board oversees Fidelity's investment-grade bond, money market, and asset allocation funds and another Board oversees Fidelity's equity and high income funds. The asset allocation funds may invest in Fidelity funds that are overseen by such other Board. The use of separate Boards, each with its own committee structure, allows the Trustees of each group of Fidelity funds to focus on the unique issues of the funds they oversee, including common research, investment, and operational issues. On occasion, the separate Boards establish joint committees to address issues of overlapping consequences for the Fidelity funds overseen by each Board.
The Trustees operate using a system of committees to facilitate the timely and efficient consideration of all matters of importance to the Trustees, each fund, and fund shareholders and to facilitate compliance with legal and regulatory requirements and oversight of the funds' activities and associated risks. The Board, acting through its committees, has charged FMR and its affiliates with (i) identifying events or circumstances the occurrence of which could have demonstrably adverse effects on the funds' business and/or reputation; (ii) implementing processes and controls to lessen the possibility that such events or circumstances occur or to mitigate the effects of such events or circumstances if they do occur; and (iii) creating and maintaining a system designed to evaluate continuously business and market conditions in order to facilitate the identification and implementation processes described in (i) and (ii) above. Because the day-to-day operations and activities of the funds are carried out by or through FMR, its affiliates and other service providers, the funds' exposure to risks is mitigated but not eliminated by the processes overseen by the Trustees. While each of the Board's committees has responsibility for overseeing different aspects of the funds' activities, oversight is exercised primarily through the Operations and Audit Committees. In addition, an ad hoc Board committee of Independent Trustees has worked with FMR to enhance the Board's oversight of investment and financial risks, legal and regulatory risks, technology risks, and operational risks, including the development of additional risk reporting to the Board. Appropriate personnel, including but not limited to the funds' Chief Compliance Officer (CCO), FMR's internal auditor, the independent accountants, the funds' Treasurer and portfolio management personnel, make periodic reports to the Board's committees, as appropriate, including an annual review of FMR's risk management program for the Fidelity funds. The responsibilities of each standing committee, including their oversight responsibilities, are described further under "Standing Committees of the Funds' Trustees."
Annual Report
The funds' Statement of Additional Information (SAI) includes more information about the Trustees. To request a free copy, call Fidelity at 1-877-208-0098.
Interested Trustees*:
Correspondence intended for each Trustee who is an interested person may be sent to Fidelity Investments, 82 Devonshire Street, Boston, Massachusetts 02109.
Name, Age; Principal Occupations and Other Relevant Experience+ |
Abigail P. Johnson (50) |
| Year of Election or Appointment: 2009 Ms. Johnson is Trustee and Chairman of the Board of Trustees of certain Trusts. Ms. Johnson serves as President of Personal, Workplace and Institutional Services (2005-present). Ms. Johnson is Chairman and Director of FMR Co., Inc. (2011-present), Chairman and Director of FMR (2011-present), and the Vice Chairman and Director (2007-present) of FMR LLC. Previously, Ms. Johnson served as President and a Director of FMR (2001-2005), a Trustee of other investment companies advised by FMR, Fidelity Investments Money Management, Inc., and FMR Co., Inc. (2001-2005), Senior Vice President of the Fidelity funds (2001-2005), and managed a number of Fidelity funds. Ms. Abigail P. Johnson and Mr. Arthur E. Johnson are not related. |
James C. Curvey (76) |
| Year of Election or Appointment: 2007 Mr. Curvey also serves as Trustee (2007-present) of other investment companies advised by FMR. Mr. Curvey is a Director of Fidelity Investments Money Management, Inc. (2009-present), Director of Fidelity Research & Analysis Co. (2009-present) and Director of FMR and FMR Co., Inc. (2007-present). Mr. Curvey is also Vice Chairman (2007-present) and Director of FMR LLC. In addition, Mr. Curvey serves as an Overseer for the Boston Symphony Orchestra and a member of the Trustees of Villanova University. Previously, Mr. Curvey was the Vice Chairman (2006-2007) and Director (2000-2007) of FMR Corp. |
* Trustees have been determined to be "Interested Trustees" by virtue of, among other things, their affiliation with the trust or various entities under common control with FMR.
+ The information above includes each Trustee's principal occupation during the last five years and other information relating to the experience, attributes, and skills relevant to each Trustee's qualifications to serve as a Trustee, which led to the conclusion that each Trustee should serve as a Trustee for each fund.
Independent Trustees:
Correspondence intended for each Independent Trustee (that is, the Trustees other than the Interested Trustees) may be sent to Fidelity Investments, P.O. Box 55235, Boston, Massachusetts 02205-5235.
Name, Age; Principal Occupations and Other Relevant Experience+ |
Albert R. Gamper, Jr. (69) |
| Year of Election or Appointment: 2007 Mr. Gamper is Vice Chairman of the Independent Trustees of the Fixed Income and Asset Allocation Funds (2011-present). Prior to his retirement in December 2004, Mr. Gamper served as Chairman of the Board of CIT Group Inc. (commercial finance). During his tenure with CIT Group Inc. Mr. Gamper served in numerous senior management positions, including Chairman (1987-1989; 1999-2001; 2002-2004), Chief Executive Officer (1987-2004), and President (2002-2003). Mr. Gamper currently serves as a member of the Board of Directors of Public Service Enterprise Group (utilities, 2000-present), a member of the Board of Trustees, Rutgers University (2004-present), and Chairman of the Board of Saint Barnabas Health Care System. Previously, Mr. Gamper served as Chairman of the Board of Governors, Rutgers University (2004-2007). |
Robert F. Gartland (60) |
| Year of Election or Appointment: 2010 Mr. Gartland is a partner and investor of Vietnam Partners LLC (investments and consulting, 2008-present) and is Chairman and an investor in Gartland and Mellina Group Corp. (consulting, 2009-present). Prior to his retirement, Mr. Gartland held a variety of positions at Morgan Stanley (financial services, 1979-2007) including Managing Director (1987-2007). |
Arthur E. Johnson (64) |
| Year of Election or Appointment: 2008 Mr. Johnson serves as a member of the Board of Directors of Eaton Corporation (diversified power management, 2009-present), AGL Resources, Inc. (holding company, 2002-present) and Booz Allen Hamilton (management consulting, 2011-present). Prior to his retirement, Mr. Johnson served as Senior Vice President of Corporate Strategic Development of Lockheed Martin Corporation (defense contractor, 1999-2009). He previously served on the Board of Directors of IKON Office Solutions, Inc. (1999-2008) and Delta Airlines (2005-2007). Mr. Arthur E. Johnson is not related to Mr. Edward C. Johnson 3d or Ms. Abigail P. Johnson. |
Michael E. Kenneally (57) |
| Year of Election or Appointment: 2009 Previously, Mr. Kenneally served as a Member of the Advisory Board for certain Fidelity Fixed Income and Asset Allocation Funds (2008-2009). Prior to his retirement, Mr. Kenneally served as Chairman and Global Chief Executive Officer of Credit Suisse Asset Management (2003-2005). Mr. Kenneally was a Director of the Credit Suisse Funds (U.S. mutual funds, 2004-2008) and certain other closed-end funds (2004-2005) and was awarded the Chartered Financial Analyst (CFA) designation in 1991. |
James H. Keyes (71) |
| Year of Election or Appointment: 2007 Mr. Keyes serves as a member of the Boards of Navistar International Corporation (manufacture and sale of trucks, buses, and diesel engines, since 2002) and Pitney Bowes, Inc. (integrated mail, messaging, and document management solutions, since 1998). Prior to his retirement, Mr. Keyes served as Chairman and Chief Executive Officer of Johnson Controls (automotive, building, and energy, 1998-2002) and as a member of the Board of LSI Logic Corporation (semiconductor technologies, 1984-2008). |
Marie L. Knowles (65) |
| Year of Election or Appointment: 2001 Prior to Ms. Knowles' retirement in June 2000, she served as Executive Vice President and Chief Financial Officer of Atlantic Richfield Company (ARCO) (diversified energy, 1996-2000). From 1993 to 1996, she was a Senior Vice President of ARCO and President of ARCO Transportation Company. She served as a Director of ARCO from 1996 to 1998. Ms. Knowles currently serves as a Director and Chairman of the Audit Committee of McKesson Corporation (healthcare service, since 2002). Ms. Knowles is an Honorary Trustee of the Brookings Institution and a member of the Board of the Catalina Island Conservancy and of the Santa Catalina Island Company (2009-present). She also serves as a member of the Advisory Board for the School of Engineering of the University of Southern California and the Foundation Board of the School of Architecture at the University of Virginia (2007-present). Previously, Ms. Knowles served as a Director of Phelps Dodge Corporation (copper mining and manufacturing, 1994-2007). |
Kenneth L. Wolfe (72) |
| Year of Election or Appointment: 2007 Mr. Wolfe is Chairman of the Independent Trustees of the Fixed Income and Asset Allocation Funds (2008-present). Prior to his retirement, Mr. Wolfe served as Chairman and a Director (2007-2009) and Chairman and Chief Executive Officer (1994-2001) of Hershey Foods Corporation. He also served as a member of the Boards of Adelphia Communications Corporation (telecommunications, 2003-2006), Bausch & Lomb, Inc. (medical/pharmaceutical, 1993-2007), and Revlon, Inc. (personal care products, 2004-2009). |
+ The information above includes each Trustee's principal occupation during the last five years and other information relating to the experience, attributes, and skills relevant to each Trustee's qualifications to serve as a Trustee, which led to the conclusion that each Trustee should serve as a Trustee for each fund.
Annual Report
Executive Officers:
Correspondence intended for each executive officer may be sent to Fidelity Investments, 82 Devonshire Street, Boston, Massachusetts 02109.
Name, Age; Principal Occupation |
John R. Hebble (53) |
| Year of Election or Appointment: 2008 President and Treasurer of Fidelity's Fixed Income and Asset Allocation Funds. Mr. Hebble also serves as President (2011-present), Treasurer, and Chief Financial Officer of The North Carolina Capital Management Trust: Cash and Term Portfolios (2008-present), Assistant Treasurer of other Fidelity funds (2009-present) and is an employee of Fidelity Investments. |
Derek L. Young (47) |
| Year of Election or Appointment: 2009 Vice President of Fidelity's Asset Allocation Funds. Mr. Young also serves as President and a Director of Strategic Advisers, Inc. (2011-present), President of the Global Asset Allocation Group (2011-present), and as Vice Chairman of Pyramis Global Advisers, LLC (2011-present). Previously, Mr. Young served as Chief Investment Officer of the Global Asset Allocation Group (2009-2011) and as a portfolio manager. |
Scott C. Goebel (43) |
| Year of Election or Appointment: 2008 Secretary and Chief Legal Officer (CLO) of the Fidelity funds. Mr. Goebel also serves as Secretary of Fidelity Investments Money Management, Inc. (FIMM) (2010-present) and Fidelity Research and Analysis Company (FRAC) (2010-present); Secretary and CLO of The North Carolina Capital Management Trust: Cash and Term Portfolios (2008-present); General Counsel, Secretary, and Senior Vice President of FMR (2008-present) and FMR Co., Inc. (2008-present); employed by FMR LLC or an affiliate (2001-present); Chief Legal Officer of Fidelity Management & Research (Hong Kong) Limited (2008-present) and Assistant Secretary of Fidelity Management & Research (Japan) Inc. (2008-present), and Fidelity Management & Research (U.K.) Inc. (2008-present). Previously, Mr. Goebel served as Assistant Secretary of FIMM (2008-2010), FRAC (2008-2010), and the Funds (2007-2008) and as Vice President and Secretary of Fidelity Distributors Corporation (FDC) (2005-2007). |
David J. Carter (38) |
| Year of Election or Appointment: 2010 Assistant Secretary of Fidelity's Fixed Income and Asset Allocation Funds. Mr. Carter also serves as Vice President, Associate General Counsel (2010-present) and is an employee of Fidelity Investments (2005-present). |
Holly C. Laurent (57) |
| Year of Election or Appointment: 2008 Anti-Money Laundering (AML) Officer of the Fidelity funds. Ms. Laurent also serves as AML Officer of The North Carolina Capital Management Trust: Cash and Term Portfolios (2008-present) and is an employee of Fidelity Investments. Previously, Ms. Laurent was Senior Vice President and Head of Legal for Fidelity Business Services India Pvt. Ltd. (2006-2008), and Senior Vice President, Deputy General Counsel and Group Head for FMR LLC (2005-2006). |
Christine Reynolds (53) |
| Year of Election or Appointment: 2008 Chief Financial Officer of the Fidelity funds. Ms. Reynolds became President of Fidelity Pricing and Cash Management Services (FPCMS) in August 2008. Ms. Reynolds served as Chief Operating Officer of FPCMS (2007-2008). Previously, Ms. Reynolds served as President, Treasurer, and Anti-Money Laundering officer of the Fidelity funds (2004-2007). |
Michael H. Whitaker (44) |
| Year of Election or Appointment: 2008 Chief Compliance Officer of Fidelity's Fixed Income and Asset Allocation Funds. Mr. Whitaker also serves as Chief Compliance Officer of The North Carolina Capital Management Trust: Cash and Term Portfolios (2008-present). Mr. Whitaker is an employee of Fidelity Investments (2007-present). Prior to joining Fidelity Investments, Mr. Whitaker worked at MFS Investment Management where he served as Senior Vice President and Chief Compliance Officer (2004-2006), and Assistant General Counsel. |
Jeffrey S. Christian (50) |
| Year of Election or Appointment: 2009 Deputy Treasurer of the Fidelity funds. Mr. Christian is an employee of Fidelity Investments. Previously, Mr. Christian served as Chief Financial Officer (2008-2009) of certain Fidelity funds and Senior Vice President of Fidelity Pricing and Cash Management Services (FPCMS) (2004-2009). |
Joseph F. Zambello (54) |
| Year of Election or Appointment: 2011 Deputy Treasurer of the Fidelity funds. Mr. Zambello is an employee of Fidelity Investments. Previously, Mr. Zambello served as Vice President of FMR's Program Management Group (2009-2011) and Vice President of the Transfer Agent Oversight Group (2005-2009). |
Stephanie J. Dorsey (42) |
| Year of Election or Appointment: 2008 Deputy Treasurer of Fidelity's Fixed Income and Asset Allocation Funds. Ms. Dorsey also serves as Assistant Treasurer of other Fidelity funds (2010-present) and is an employee of Fidelity Investments (2008-present). Previously, Ms. Dorsey served as Treasurer (2004-2008) of the JPMorgan Mutual Funds and Vice President (2004-2008) of JPMorgan Chase Bank. |
Adrien E. Deberghes (44) |
| Year of Election or Appointment: 2010 Assistant Treasurer of Fidelity's Fixed Income and Asset Allocation Funds. Mr. Deberghes also serves as Vice President and Assistant Treasurer of Fidelity Rutland Square Trust II and Fidelity Commonwealth Trust II (2011-present), Deputy Treasurer of other Fidelity funds (2008-present), and is an employee of Fidelity Investments (2008-present). Previously, Mr. Deberghes served as Senior Vice President of Mutual Fund Administration at State Street Corporation (2007-2008), Senior Director of Mutual Fund Administration at Investors Bank & Trust (2005-2007), and Director of Finance for Dunkin' Brands (2000-2005). |
Kenneth B. Robins (42) |
| Year of Election or Appointment: 2009 Assistant Treasurer of the Fidelity Fixed Income and Asset Allocation Funds. Mr. Robins also serves as President and Treasurer of other Fidelity funds (2008-present; 2010-present) and is an employee of Fidelity Investments (2004-present). Previously, Mr. Robins served as Deputy Treasurer of the Fidelity funds (2005-2008) and Treasurer and Chief Financial Officer of The North Carolina Capital Management Trust: Cash and Term Portfolios (2006-2008). |
Gary W. Ryan (53) |
| Year of Election or Appointment: 2005 Assistant Treasurer of the Fidelity funds. Mr. Ryan is an employee of Fidelity Investments. Previously, Mr. Ryan served as Vice President of Fund Reporting in Fidelity Pricing and Cash Management Services (FPCMS) (1999-2005). |
Jonathan Davis (43) |
| Year of Election or Appointment: 2010 Assistant Treasurer of the Fidelity funds. Mr. Davis is also Assistant Treasurer of Fidelity Rutland Square Trust II and Fidelity Commonwealth Trust II. Mr. Davis is an employee of Fidelity Investments. Previously, Mr. Davis served as Vice President and Associate General Counsel of FMR LLC (2003-2010). |
Annual Report
The Board of Trustees of each portfolio voted to pay to shareholders of record at the opening of business on record date, the following distributions per share derived from capital gains realized from sales of portfolio securities:
| Pay Date | Record Date | Capital Gains |
VIP Freedom Income Portfolio | | | |
Initial Class | 02/10/12 | 02/10/12 | $0.063 |
Service Class | 02/10/12 | 02/10/12 | $0.063 |
Service Class 2 | 02/10/12 | 02/10/12 | $0.063 |
VIP Freedom 2005 Portfolio | | | |
Initial Class | 02/10/12 | 02/10/12 | $0.000 |
Service Class | 02/10/12 | 02/10/12 | $0.000 |
Service Class 2 | 02/10/12 | 02/10/12 | $0.000 |
VIP Freedom 2010 Portfolio | | | |
Initial Class | 02/10/12 | 02/10/12 | $0.056 |
Service Class | 02/10/12 | 02/10/12 | $0.056 |
Service Class 2 | 02/10/12 | 02/10/12 | $0.056 |
VIP Freedom 2015 Portfolio | | | |
Initial Class | 02/10/12 | 02/10/12 | $0.068 |
Service Class | 02/10/12 | 02/10/12 | $0.068 |
Service Class 2 | 02/10/12 | 02/10/12 | $0.068 |
VIP Freedom 2020 Portfolio | | | |
Initial Class | 02/10/12 | 02/10/12 | $0.041 |
Service Class | 02/10/12 | 02/10/12 | $0.041 |
Service Class 2 | 02/10/12 | 02/10/12 | $0.041 |
VIP Freedom 2025 Portfolio | | | |
Initial Class | 02/10/12 | 02/10/12 | $0.037 |
Service Class | 02/10/12 | 02/10/12 | $0.037 |
Service Class 2 | 02/10/12 | 02/10/12 | $0.037 |
VIP Freedom 2030 Portfolio | | | |
Initial Class | 02/10/12 | 02/10/12 | $0.028 |
Service Class | 02/10/12 | 02/10/12 | $0.028 |
Service Class 2 | 02/10/12 | 02/10/12 | $0.028 |
VIP Freedom 2035 Portfolio | | | |
Initial Class | 02/10/12 | 02/10/12 | $0.000 |
Service Class | 02/10/12 | 02/10/12 | $0.000 |
Service Class 2 | 02/10/12 | 02/10/12 | $0.000 |
VIP Freedom 2040 Portfolio | | | |
Initial Class | 02/10/12 | 02/10/12 | $0.010 |
Service Class | 02/10/12 | 02/10/12 | $0.010 |
Service Class 2 | 02/10/12 | 02/10/12 | $0.010 |
VIP Freedom 2045 Portfolio | | | |
Initial Class | 02/10/12 | 02/10/12 | $0.437 |
Service Class | 02/10/12 | 02/10/12 | $0.437 |
Service Class 2 | 02/10/12 | 02/10/12 | $0.437 |
VIP Freedom 2050 Portfolio | | | |
Initial Class | 02/10/12 | 02/10/12 | $1.801 |
Service Class | 02/10/12 | 02/10/12 | $1.801 |
Service Class 2 | 02/10/12 | 02/10/12 | $1.801 |
Annual Report
Distributions - continued
The funds hereby designate as capital gain dividend the amounts noted below for the taxable year ended December 31, 2011, or, if subsequently determined to be different, the net capital gain of such year.
VIP Freedom Income Portfolio | $ 114,389 |
VIP Freedom 2005 Portfolio | 0 |
VIP Freedom 2010 Portfolio | 950,229 |
VIP Freedom 2015 Portfolio | 621,424 |
VIP Freedom 2020 Portfolio | 2,011,087 |
VIP Freedom 2025 Portfolio | 186,584 |
VIP Freedom 2030 Portfolio | 348,173 |
VIP Freedom 2035 Portfolio | 0 |
VIP Freedom 2040 Portfolio | 1,781 |
VIP Freedom 2045 Portfolio | 10,864 |
VIP Freedom 2050 Portfolio | 69,937 |
A percentage of the dividends distributed during the fiscal year for the following funds was derived from interest on U.S. Government securities which is generally exempt from state income tax:
VIP Freedom Income Portfolio | |
Initial Class | 6.34% |
Service Class | 6.34% |
Service Class 2 | 6.34% |
VIP Freedom 2005 Portfolio | |
Initial Class | 5.47% |
Service Class | 5.47% |
Service Class 2 | 5.47% |
VIP Freedom 2010 Portfolio | |
Initial Class | 5.35% |
Service Class | 5.35% |
Service Class 2 | 5.35% |
VIP Freedom 2015 Portfolio | |
Initial Class | 5.36% |
Service Class | 5.36% |
Service Class 2 | 5.36% |
VIP Freedom 2020 Portfolio | |
Initial Class | 4.82% |
Service Class | 4.82% |
Service Class 2 | 4.82% |
VIP Freedom 2025 Portfolio | |
Initial Class | 4.05% |
Service Class | 4.05% |
Service Class 2 | 4.05% |
VIP Freedom 2030 Portfolio | |
Initial Class | 3.61% |
Service Class | 3.61% |
Service Class 2 | 3.61% |
VIP Freedom 2035 Portfolio | |
Initial Class | 2.23% |
Service Class | 2.23% |
Service Class 2 | 2.23% |
Annual Report
A percentage of the dividends distributed during the fiscal year for the following funds qualify for the dividends-received deduction for corporate shareholders:
| February 2011 | December 2011 |
VIP Freedom Income Portfolio | | |
Initial Class | 0% | 9% |
Service Class | 0% | 9% |
Service Class 2 | 0% | 10% |
VIP Freedom 2005 Portfolio | | |
Initial Class | 0% | 17% |
Service Class | 0% | 18% |
Service Class 2 | 0% | 17% |
VIP Freedom 2010 Portfolio | | |
Initial Class | 9% | 18% |
Service Class | 9% | 18% |
Service Class 2 | 9% | 19% |
VIP Freedom 2015 Portfolio | | |
Initial Class | 0% | 18% |
Service Class | 0% | 18% |
Service Class 2 | 0% | 20% |
VIP Freedom 2020 Portfolio | | |
Initial Class | 0% | 21% |
Service Class | 0% | 22% |
Service Class 2 | 0% | 23% |
VIP Freedom 2025 Portfolio | | |
Initial Class | 0% | 26% |
Service Class | 0% | 26% |
Service Class 2 | 0% | 28% |
VIP Freedom 2030 Portfolio | | |
Initial Class | 0% | 28% |
Service Class | 0% | 29% |
Service Class 2 | 0% | 30% |
VIP Freedom 2035 Portfolio | | |
Initial Class | 0% | 36% |
Service Class | 0% | 38% |
Service Class 2 | 0% | 41% |
VIP Freedom 2040 Portfolio | | |
Initial Class | 0% | 36% |
Service Class | 0% | 37% |
Service Class 2 | 0% | 40% |
VIP Freedom 2045 Portfolio | | |
Initial Class | 0% | 37% |
Service Class | 0% | 39% |
Service Class 2 | 0% | 42% |
VIP Freedom 2050 Portfolio | | |
Initial Class | 0% | 7% |
Service Class | 0% | 7% |
Service Class 2 | 0% | 8% |
Annual Report
Distributions - continued
The amounts per share which represent income derived from sources within, and taxes paid to, foreign countries or possessions of the United States are as follows:
| | Pay Date | Income | Taxes |
VIP Freedom Income Portfolio | | | |
Initial Class | 12/29/2011 | $0.010 | $0.001 |
Service Class | 12/29/2011 | $0.010 | $0.001 |
Service Class 2 | 12/29/2011 | $0.009 | $0.001 |
VIP Freedom 2005 Portfolio | | | |
Initial Class | 12/29/2011 | $0.018 | $0.001 |
Service Class | 12/29/2011 | $0.017 | $0.001 |
Service Class 2 | 12/29/2011 | $0.018 | $0.001 |
VIP Freedom 2010 Portfolio | | | |
Initial Class | 12/29/2011 | $0.025 | $0.002 |
Service Class | 12/29/2011 | $0.024 | $0.002 |
Service Class 2 | 12/29/2011 | $0.023 | $0.002 |
VIP Freedom 2015 Portfolio | | | |
Initial Class | 12/29/2011 | $0.026 | $0.002 |
Service Class | 12/29/2011 | $0.025 | $0.002 |
Service Class 2 | 12/29/2011 | $0.023 | $0.002 |
VIP Freedom 2020 Portfolio | | | |
Initial Class | 12/29/2011 | $0.030 | $0.002 |
Service Class | 12/29/2011 | $0.028 | $0.002 |
Service Class 2 | 12/29/2011 | $0.027 | $0.002 |
VIP Freedom 2025 Portfolio | | | |
Initial Class | 12/29/2011 | $0.032 | $0.002 |
Service Class | 12/29/2011 | $0.032 | $0.002 |
Service Class 2 | 12/29/2011 | $0.029 | $0.002 |
VIP Freedom 2030 Portfolio | | | |
Initial Class | 12/29/2011 | $0.035 | $0.003 |
Service Class | 12/29/2011 | $0.033 | $0.003 |
Service Class 2 | 12/29/2011 | $0.031 | $0.003 |
VIP Freedom 2035 Portfolio | | | |
Initial Class | 12/29/2011 | $0.059 | $0.004 |
Service Class | 12/29/2011 | $0.056 | $0.004 |
Service Class 2 | 12/29/2011 | $0.052 | $0.004 |
VIP Freedom 2040 Portfolio | | | |
Initial Class | 12/29/2011 | $0.051 | $0.004 |
Service Class | 12/29/2011 | $0.050 | $0.004 |
Service Class 2 | 12/29/2011 | $0.046 | $0.004 |
VIP Freedom 2045 Portfolio | | | |
Initial Class | 12/29/2011 | $0.058 | $0.004 |
Service Class | 12/29/2011 | $0.055 | $0.004 |
Service Class 2 | 12/29/2011 | $0.051 | $0.004 |
VIP Freedom 2050 Portfolio | | | |
Initial Class | 12/29/2011 | $0.062 | $0.004 |
Service Class | 12/29/2011 | $0.062 | $0.004 |
Service Class 2 | 12/29/2011 | $0.061 | $0.004 |
Annual Report
Board Approval of Investment Advisory Contracts and Management Fees
VIP Freedom Funds
Each year, the Board of Trustees, including the Independent Trustees (together, the Board), votes on the renewal of the management contract and administration agreement (together, the Advisory Contracts) for each fund. The Board, assisted by the advice of fund counsel and Independent Trustees' counsel, requests and considers a broad range of information relevant to the renewal of the Advisory Contracts throughout the year.
The Board meets regularly and considers at each of its meetings factors that are relevant to its annual consideration of the renewal of each fund's Advisory Contracts, including the services and support provided to each fund and its shareholders. The Board has established three standing committees, Operations, Audit, and Nominating and Governance, each composed of Independent Trustees with varying backgrounds, to which the Board has assigned specific subject matter responsibilities in order to enhance effective decision-making by the Board. The Operations Committee, of which all of the Independent Trustees are members, meets regularly throughout the year and, among other matters, considers matters specifically related to the annual consideration of the renewal of each fund's Advisory Contracts. The Board, acting directly and through its Committees, requests and receives information concerning the annual consideration of the renewal of each fund's Advisory Contracts. The Board also meets as needed to consider matters specifically related to the Board's annual consideration of the renewal of Advisory Contracts. Members of the Board may also meet with trustees of other Fidelity funds through ad hoc joint committees to discuss certain matters relevant to the Fidelity funds.
At its September 2011 meeting, the Board of Trustees, including the Independent Trustees, unanimously determined to renew each fund's Advisory Contracts. In reaching its determination, the Board considered all factors it believed relevant and reached a determination, with the assistance of fund counsel and Independent Trustees' counsel and through the exercise of its business judgment, that the renewal of the Advisory Contracts is in the best interests of each fund and its shareholders and that the lack of compensation payable under the Advisory Contracts is fair and reasonable. The Board's decision to renew the Advisory Contracts was not based on any single factor, but rather was based on a comprehensive consideration of all the information provided to the Board at its meetings throughout the year. In reaching its determination, the Board is aware that shareholders in each fund have a broad range of investment choices available to them, including a wide choice among mutual funds offered by Fidelity's competitors, and that each fund's shareholders, who have the opportunity to review and weigh the disclosure provided by the fund in its prospectus and other public disclosures, have chosen to invest in that fund, managed by Fidelity.
Nature, Extent, and Quality of Services Provided. The Board considered the staffing within the investment adviser, Strategic Advisers, Inc. (Strategic Advisers), and the administrator, FMR, including the backgrounds of the funds' investment personnel and the funds' investment objectives and disciplines. The Independent Trustees also had discussions with senior management of Fidelity's investment operations and investment groups. The Board considered the structure of the portfolio manager compensation program and whether this structure provides appropriate incentives to act in the best interests of each fund.
Resources Dedicated to Investment Management and Support Services. The Board reviewed the general qualifications and capabilities of Strategic Advisers' investment staff, including its size, education, experience, and resources, as well as Strategic Advisers' and FMR's approach to recruiting, managing, and compensating investment personnel. The Board also noted that FMR has devoted increased resources to non-U.S. offices. The Board noted that Fidelity's analysts have extensive resources, tools and capabilities which allow them to conduct sophisticated quantitative and fundamental analysis, as well as credit analysis of issuers, counterparties and enhancers. The Board also believes that Fidelity's investment professionals have sufficient access to global information and data so as to provide competitive investment results over time, and that those professionals also have access to sophisticated tools which permit them to assess portfolio construction and risk and performance attribution characteristics continuously, as well as to transmit new information and research conclusions rapidly around the world. Additionally, in its deliberations, the Board considered Strategic Advisers' trading capabilities and resources which are an integral part of the investment management process.
Shareholder and Administrative Services. The Board considered (i) the nature, extent, quality, and cost of advisory, administrative, and shareholder services performed by FMR and its affiliates under the Advisory Contracts and under separate agreements covering transfer agency, pricing and bookkeeping, and securities lending services for each fund; (ii) the nature and extent of FMR's supervision of third party service providers, principally custodians and subcustodians; and (iii) the resources devoted to, and the record of compliance with, each fund's compliance policies and procedures.
The Board noted that the growth of fund assets over time across the complex allows Fidelity to reinvest in the development of services designed to enhance the value or convenience of the Fidelity funds as investment vehicles. These services include 24-hour access to account information and market information through telephone representatives and over the Internet, investor education materials and asset allocation tools, and the expanded availability of Fidelity Investor Centers, with 35 new branches opening since 2010.
Investment in a Large Fund Family. The Board considered the benefits to shareholders of investing in a Fidelity fund, including the benefits of investing in a fund that is part of a large family of funds offering a variety of investment disciplines and providing a large variety of mutual fund investor services. The Board noted that Fidelity had taken, or had made recommendations that resulted in the Fidelity funds taking, a number of actions over the previous year that benefited particular funds, including (i) continuing to dedicate additional resources to investment research and support of the senior management team that oversees asset management; (ii) rationalizing product lines through the mergers of six funds into other funds; (iii) continuing to migrate the Freedom Funds to dedicated lower cost underlying funds; (iv) obtaining shareholder approval to broaden the investment strategies for Fidelity Consumer Finance Portfolio, Fidelity Emerging Asia Fund, and Fidelity Environment and Alternative Energy Portfolio; (v) contractually agreeing to reduce the management fees and impose other expense limitations on Spartan 500 Index Fund and U.S. Bond Index Fund in connection with launching new institutional classes of these funds; (vi) changing the name, primary and supplemental benchmarks, and investment policies of Fidelity Global Strategies Fund to support the fund's flexible investment mandate and global orientation; and (vii) reducing the transfer agency account fee rates on certain accounts.
Annual Report
Board Approval of Investment Advisory Contracts and Management Fees - continued
Investment Performance. The Board considered whether each fund has operated in accordance with its investment objective, as well as its record of compliance with its investment restrictions. It also reviewed each fund's absolute investment performance for each class, as well as each fund's relative investment performance for each class measured over multiple periods, as available, against a proprietary custom index. The Board noted that FMR does not believe that a meaningful peer group exists against which to compare any of the funds' performance, given that even competitor funds with the same target date can differ significantly in their asset allocation strategy, degree of active management, and glide path construction.
For VIP Freedom 2005 Portfolio, VIP Freedom 2010 Portfolio, VIP Freedom 2015 Portfolio, VIP Freedom 2020 Portfolio, VIP Freedom 2025 Portfolio, VIP Freedom 2030 Portfolio, and VIP Freedom Income Portfolio, the following charts considered by the Board show, over the one-, three-, and five-year periods ended December 31, 2010, the cumulative total returns of Initial Class and Service Class 2 of the fund and the cumulative total returns of a proprietary custom index ("benchmark"). The returns of Initial Class and Service Class 2 show the performance of the highest and lowest performing classes, respectively (based on five-year performance).
Because VIP Freedom 2035 Portfolio, VIP Freedom 2040 Portfolio, VIP Freedom 2045 Portfolio, and VIP Freedom 2050 Portfolio had been in existence less than three calendar years, for each such fund the following chart considered by the Board shows, for the one-year period ended December 31, 2010, the total returns of Initial Class and Service Class 2 of the fund and the total return of a proprietary custom index ("benchmark"). The returns of Initial Class and Service Class 2 show the performance of the highest and lowest performing classes, respectively.
For each fund, the proprietary custom index is an index developed by FMR that represents the performance of the fund's asset classes according to their respective weightings, adjusted on the last day of every month to reflect the fund's increasingly conservative asset allocations over time (for each fund other than VIP Freedom Income Portfolio).
VIP Freedom 2005 Portfolio
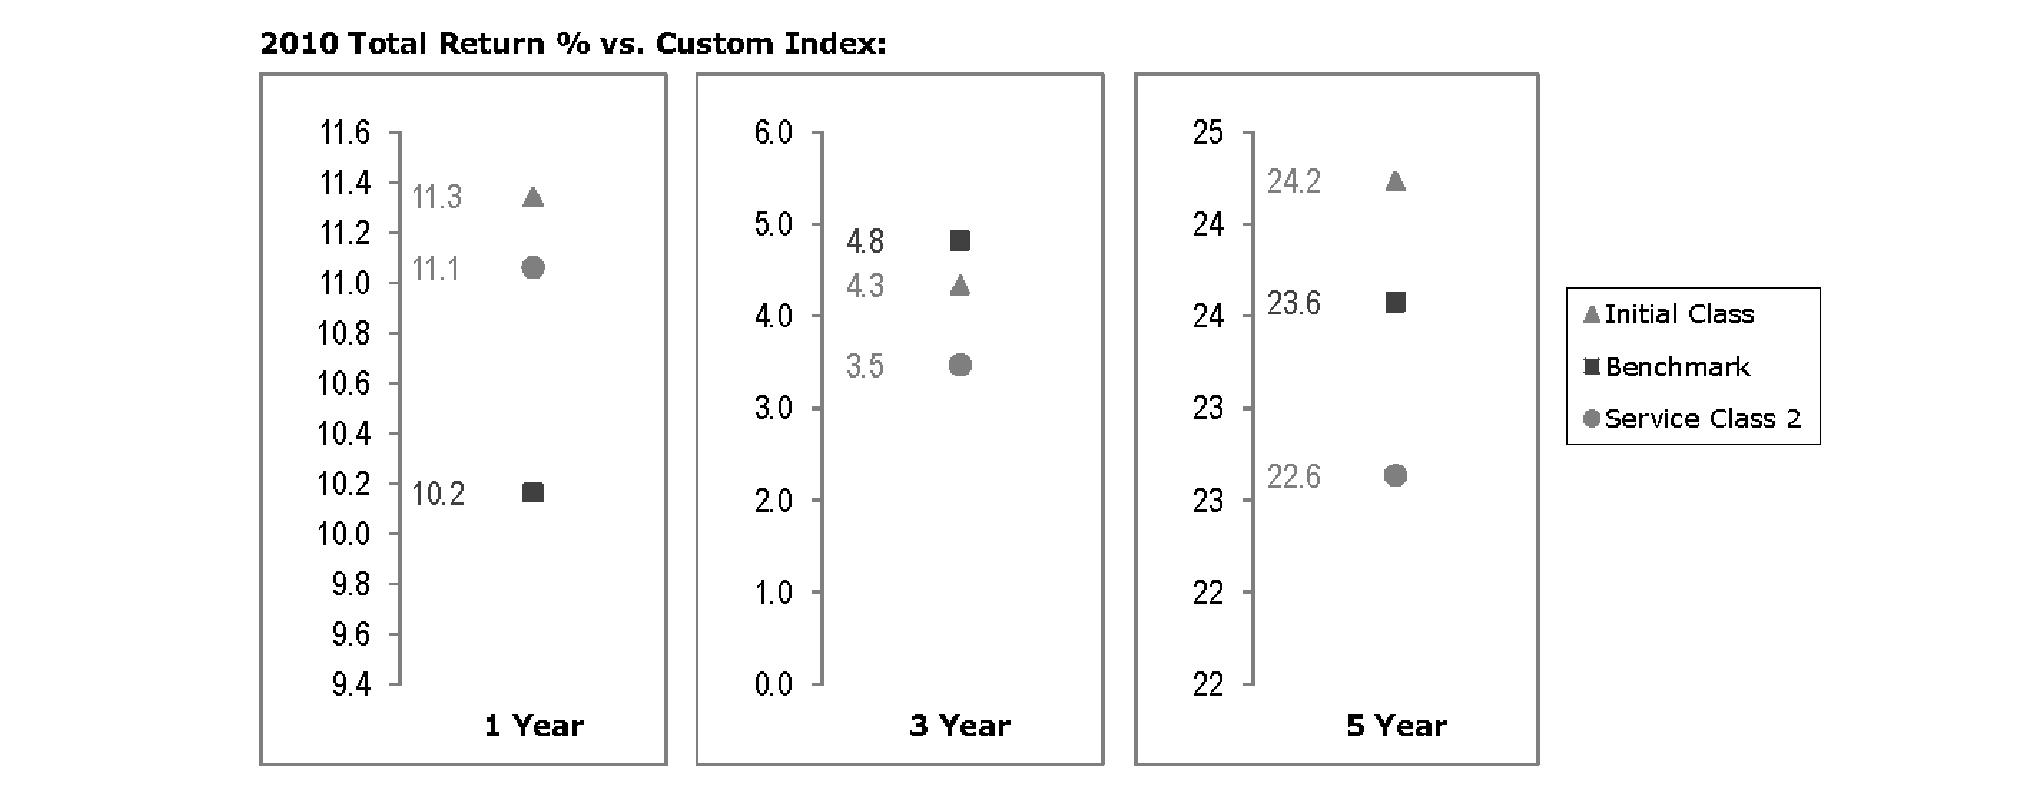
The Board noted that the investment performance of Initial Class of the fund compared favorably to its benchmark for the one- and five-year periods, although the fund's three-year cumulative total return was lower than its benchmark. The Board considered that the variations in performance among the fund's classes reflect the variations in class expenses, which result in lower performance for higher expense classes. The Board also reviewed the fund's performance since inception as well as performance in the current year.
Annual Report
VIP Freedom 2010 Portfolio
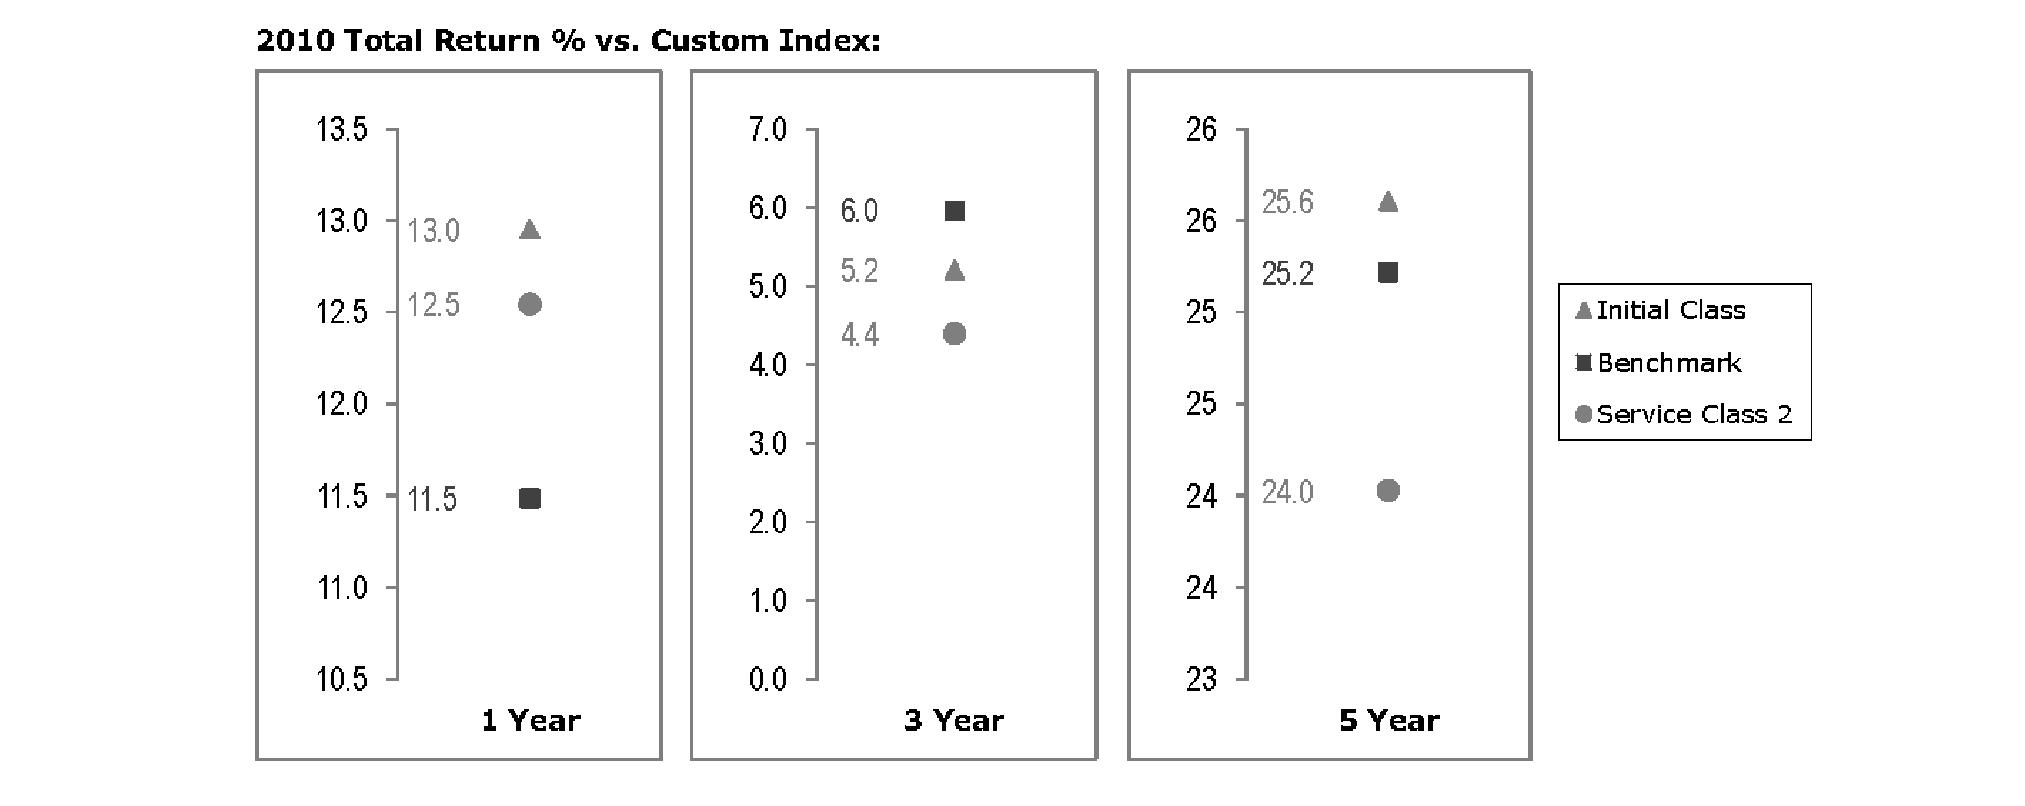
The Board noted that the investment performance of Initial Class of the fund compared favorably to its benchmark for the one- and five-year periods, although the fund's three-year cumulative total return was lower than its benchmark. The Board considered that the variations in performance among the fund's classes reflect the variations in class expenses, which result in lower performance for higher expense classes. The Board also reviewed the fund's performance since inception as well as performance in the current year.
VIP Freedom 2015 Portfolio
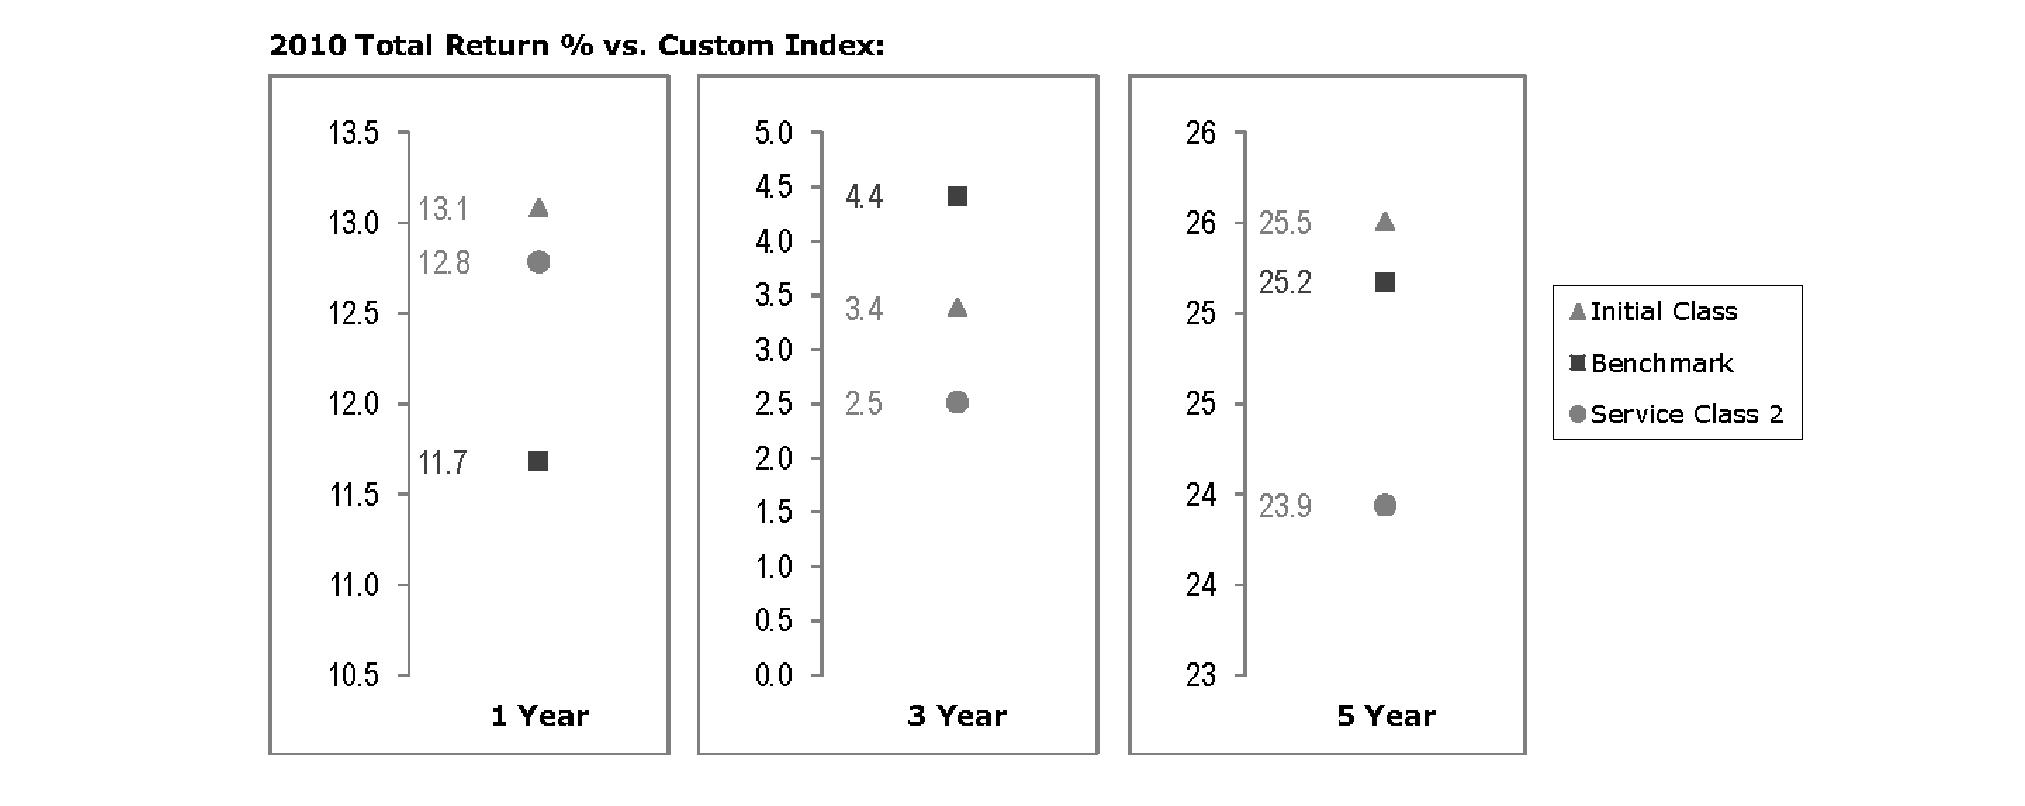
The Board noted that the investment performance of Initial Class of the fund compared favorably to its benchmark for the one- and five-year periods, although the fund's three-year cumulative total return was lower than its benchmark. The Board considered that the variations in performance among the fund's classes reflect the variations in class expenses, which result in lower performance for higher expense classes. The Board also reviewed the fund's performance since inception as well as performance in the current year.
Annual Report
Board Approval of Investment Advisory Contracts and Management Fees - continued
VIP Freedom 2020 Portfolio
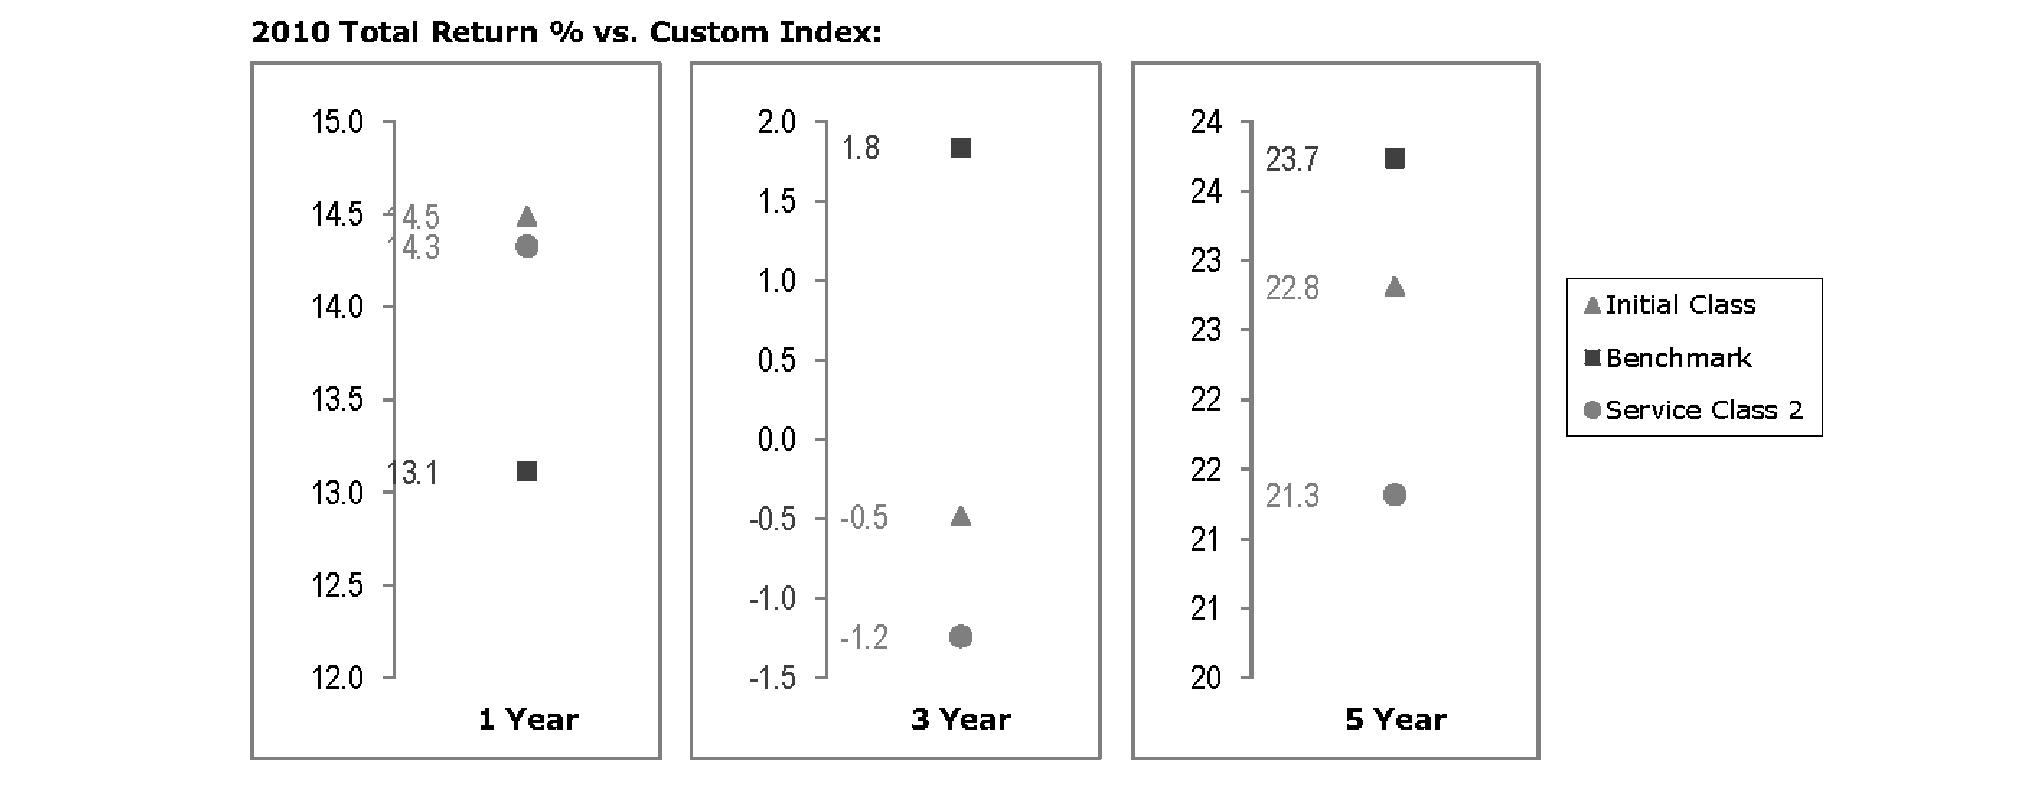
The Board noted that the investment performance of the fund was lower than its benchmark for the three- and five-year periods, although the one-year total return of Initial Class compared favorably to its benchmark. The Board considered that the variations in performance among the fund's classes reflect the variations in class expenses, which result in lower performance for higher expense classes. The Board also reviewed the fund's performance since inception as well as performance in the current year.
VIP Freedom 2025 Portfolio
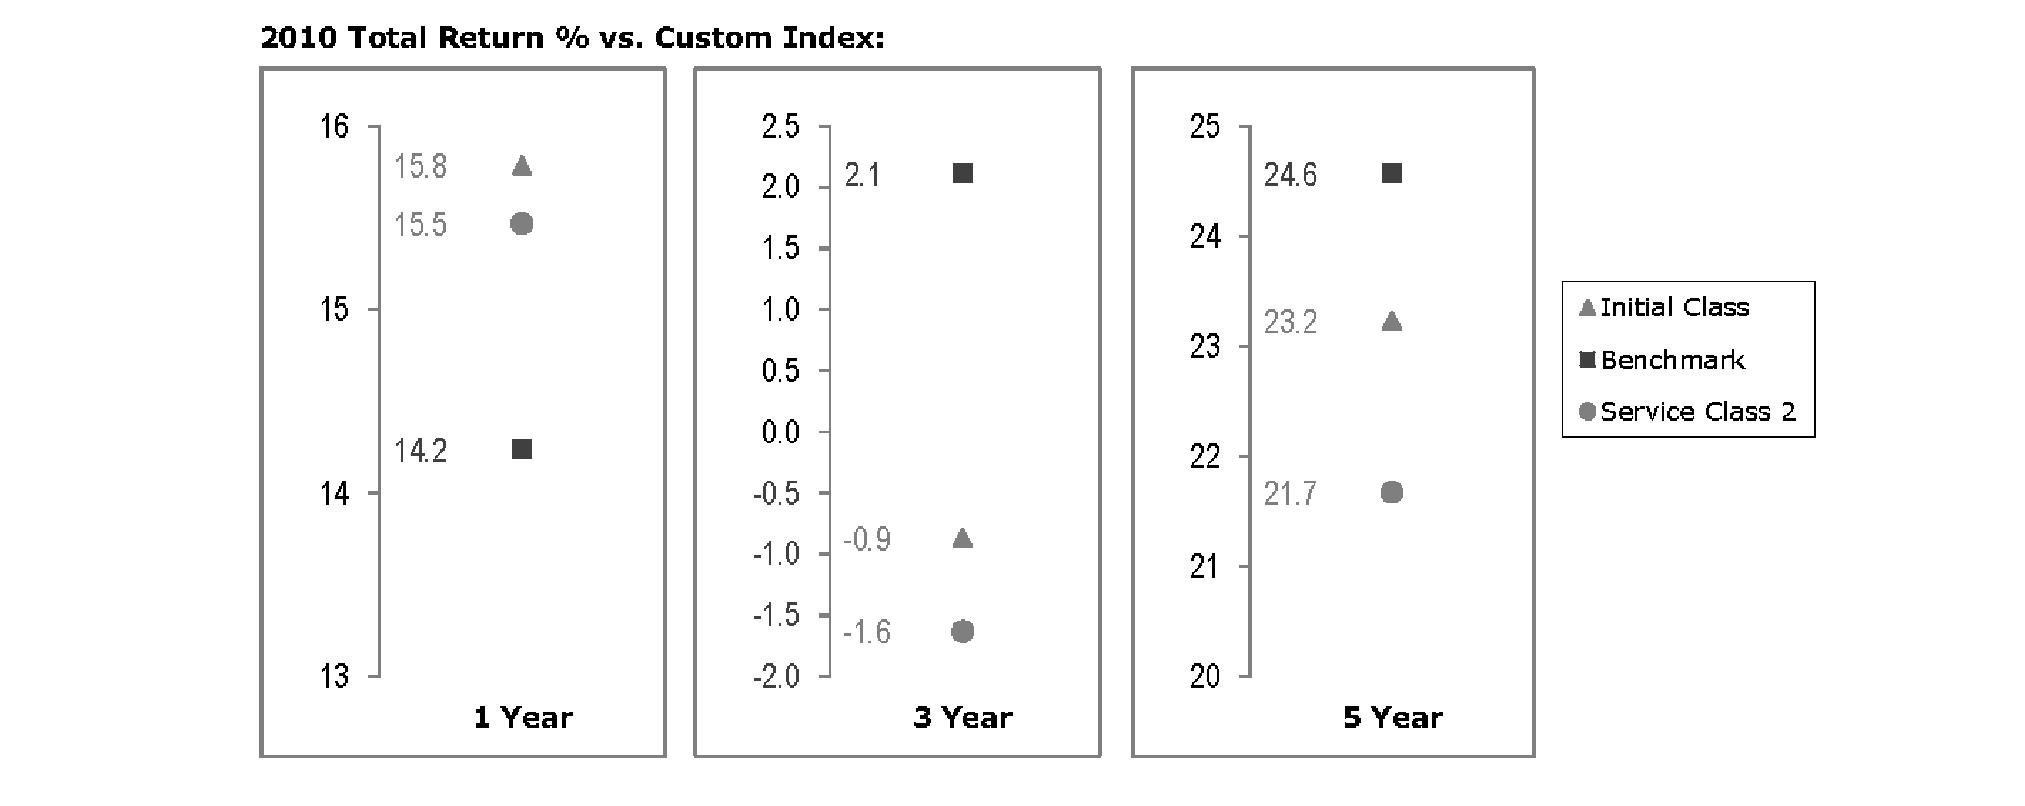
The Board noted that the investment performance of the fund was lower than its benchmark for the three- and five-year periods, although the one-year total return of Initial Class compared favorably to its benchmark. The Board considered that the variations in performance among the fund's classes reflect the variations in class expenses, which result in lower performance for higher expense classes. The Board also reviewed the fund's performance since inception as well as performance in the current year.
Annual Report
VIP Freedom 2030 Portfolio
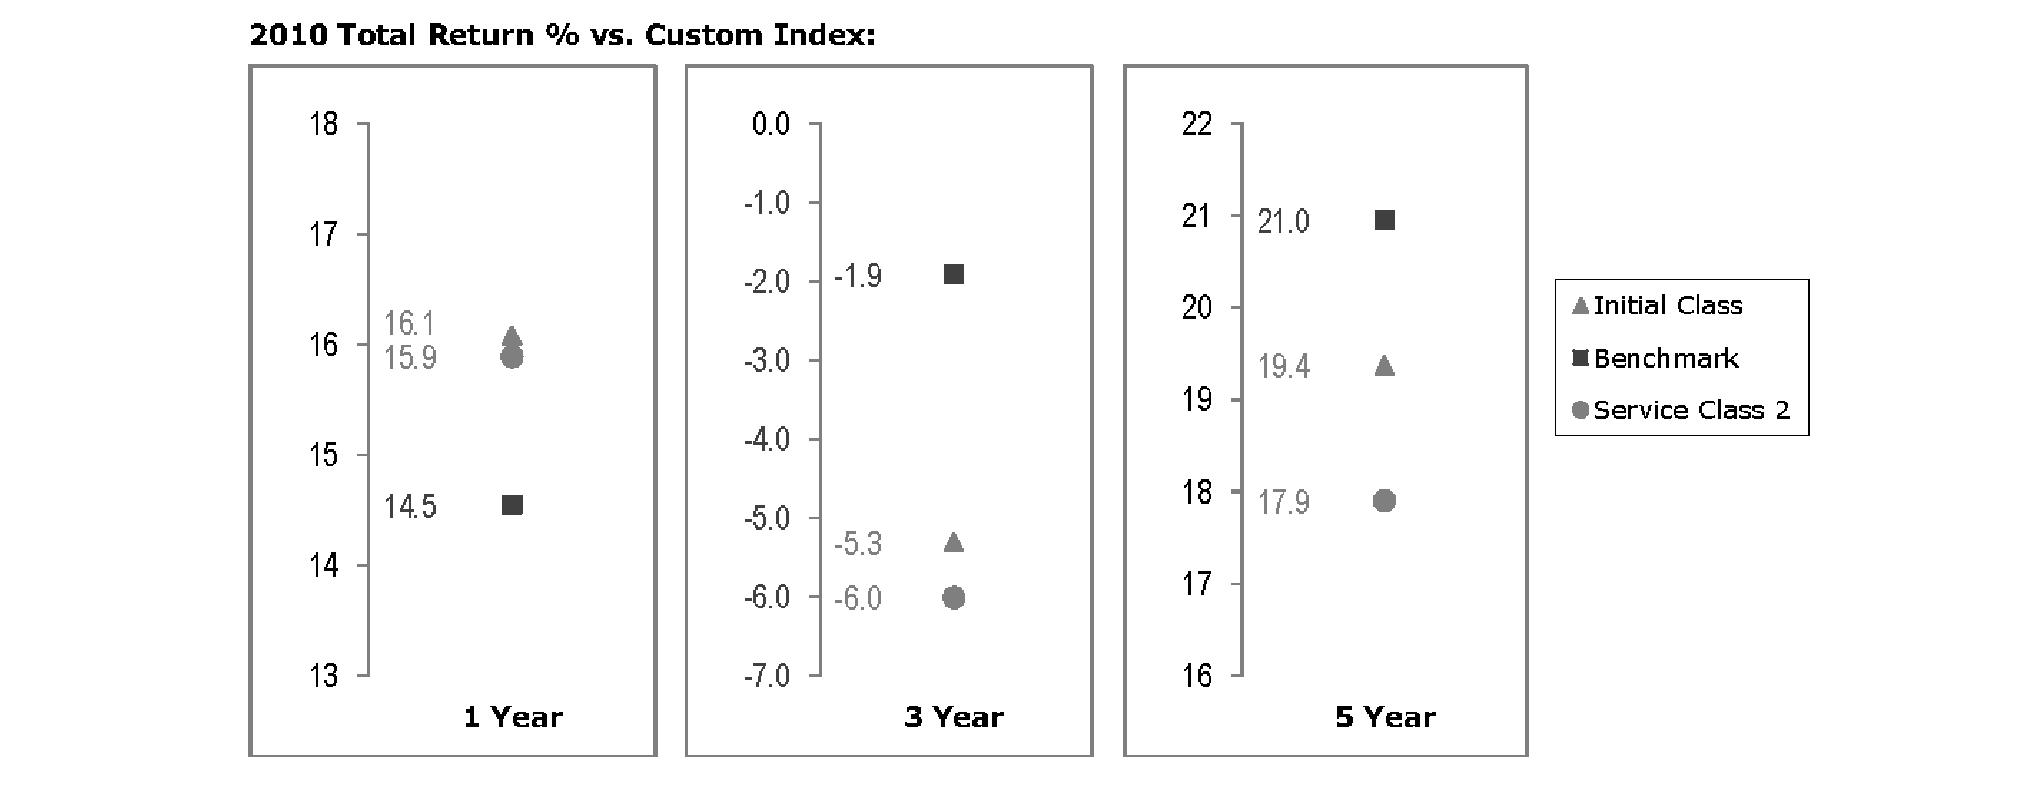
The Board noted that the investment performance of the fund was lower than its benchmark for the three- and five-year periods, although the one-year total return of Initial Class compared favorably to its benchmark. The Board considered that the variations in performance among the fund's classes reflect the variations in class expenses, which result in lower performance for higher expense classes. The Board also reviewed the fund's performance since inception as well as performance in the current year.
VIP Freedom 2035 Portfolio
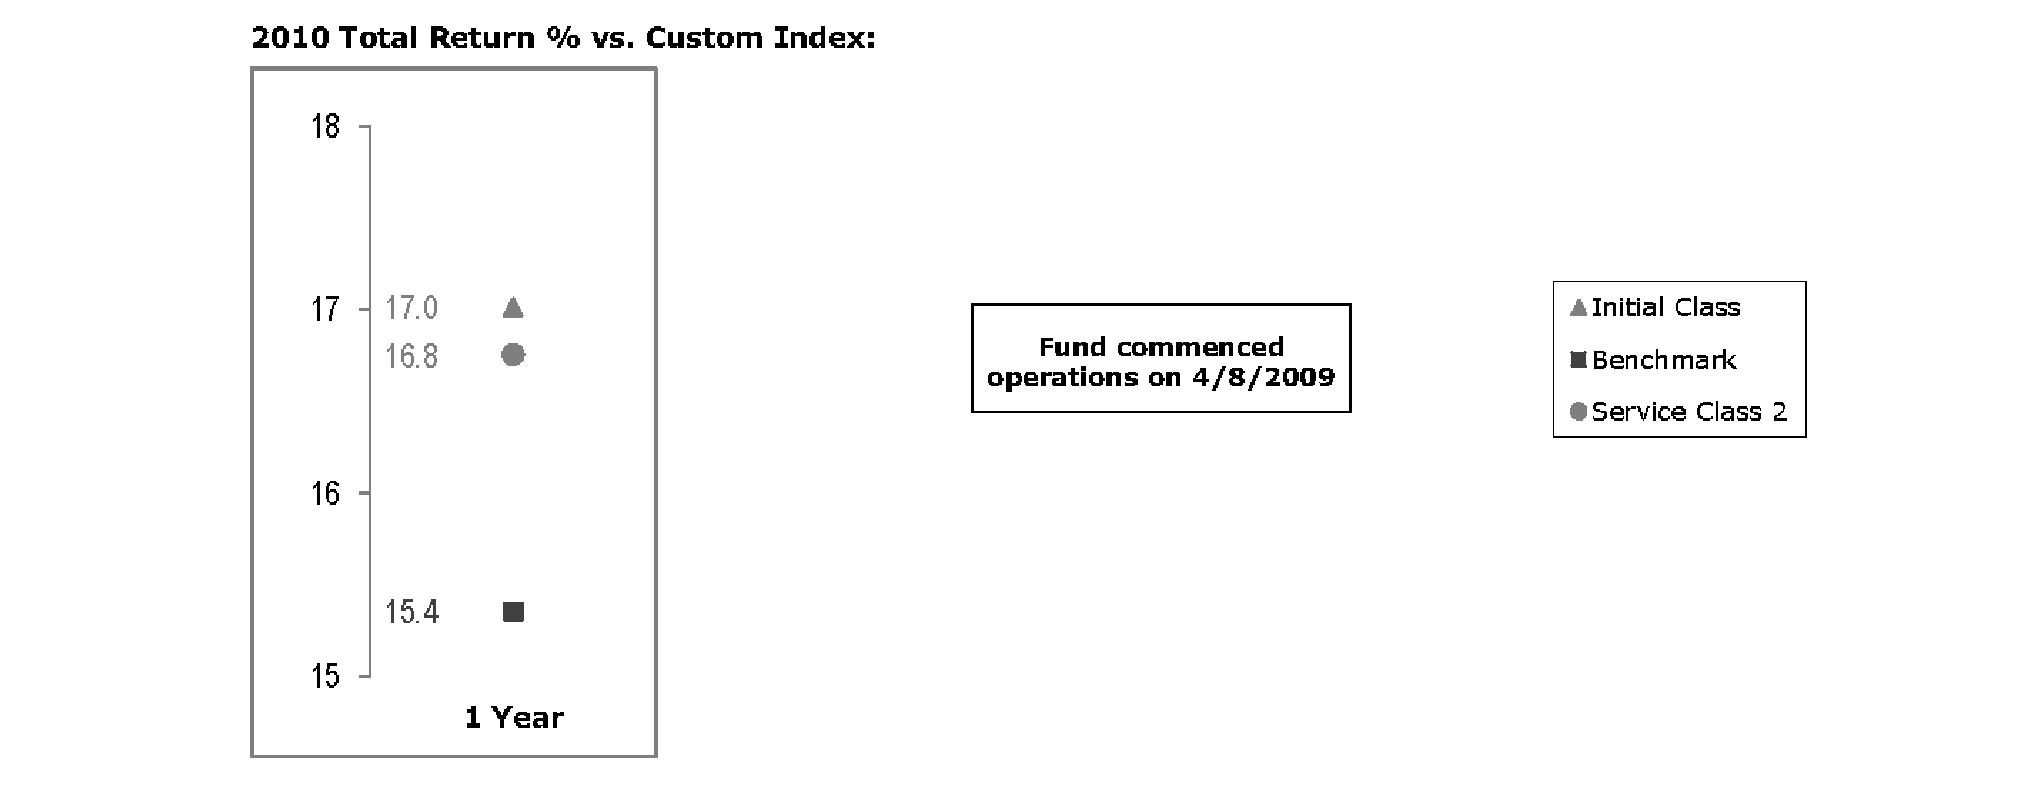
The Board noted that the investment performance of Initial Class of the fund compared favorably to its benchmark for the period shown. The Board considered that the variations in performance among the fund's classes reflect the variations in class expenses, which result in lower performance for higher expense classes. The Board also reviewed the fund's performance since inception as well as performance in the current year. The Board noted that it is difficult to evaluate in any comprehensive fashion the performance of the fund, in light of its relatively recent commencement of operations.
Annual Report
Board Approval of Investment Advisory Contracts and Management Fees - continued
VIP Freedom 2040 Portfolio
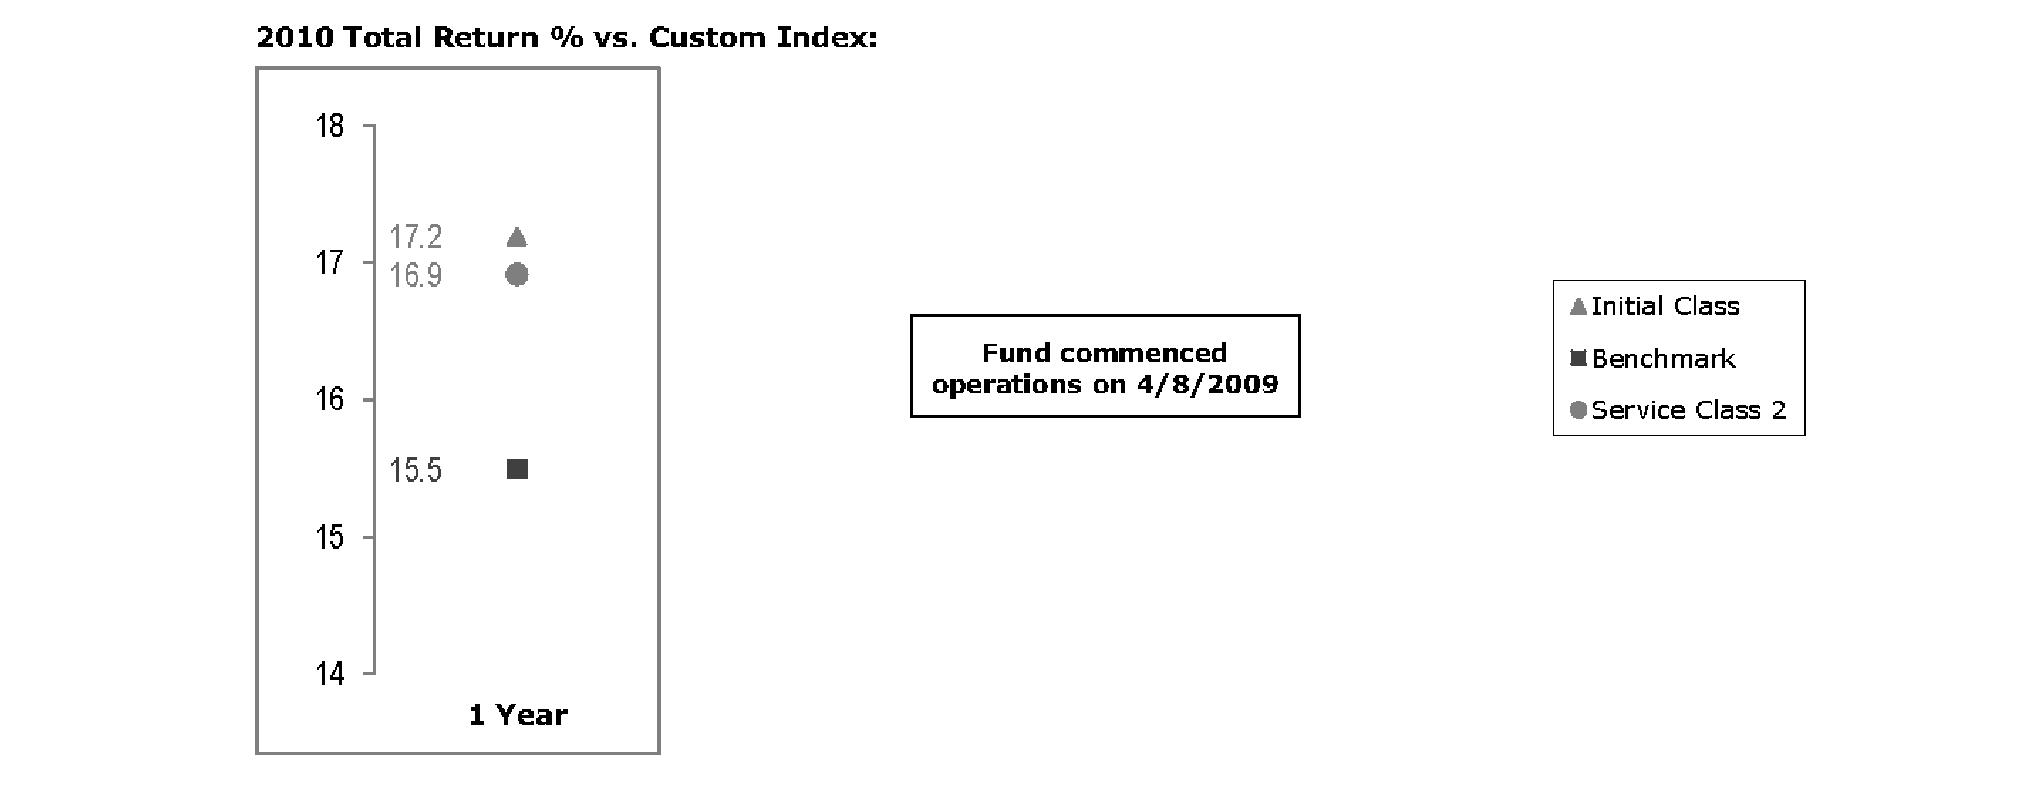
The Board noted that the investment performance of Initial Class of the fund compared favorably to its benchmark for the period shown. The Board considered that the variations in performance among the fund's classes reflect the variations in class expenses, which result in lower performance for higher expense classes. The Board also reviewed the fund's performance since inception as well as performance in the current year. The Board noted that it is difficult to evaluate in any comprehensive fashion the performance of the fund, in light of its relatively recent commencement of operations.
VIP Freedom 2045 Portfolio
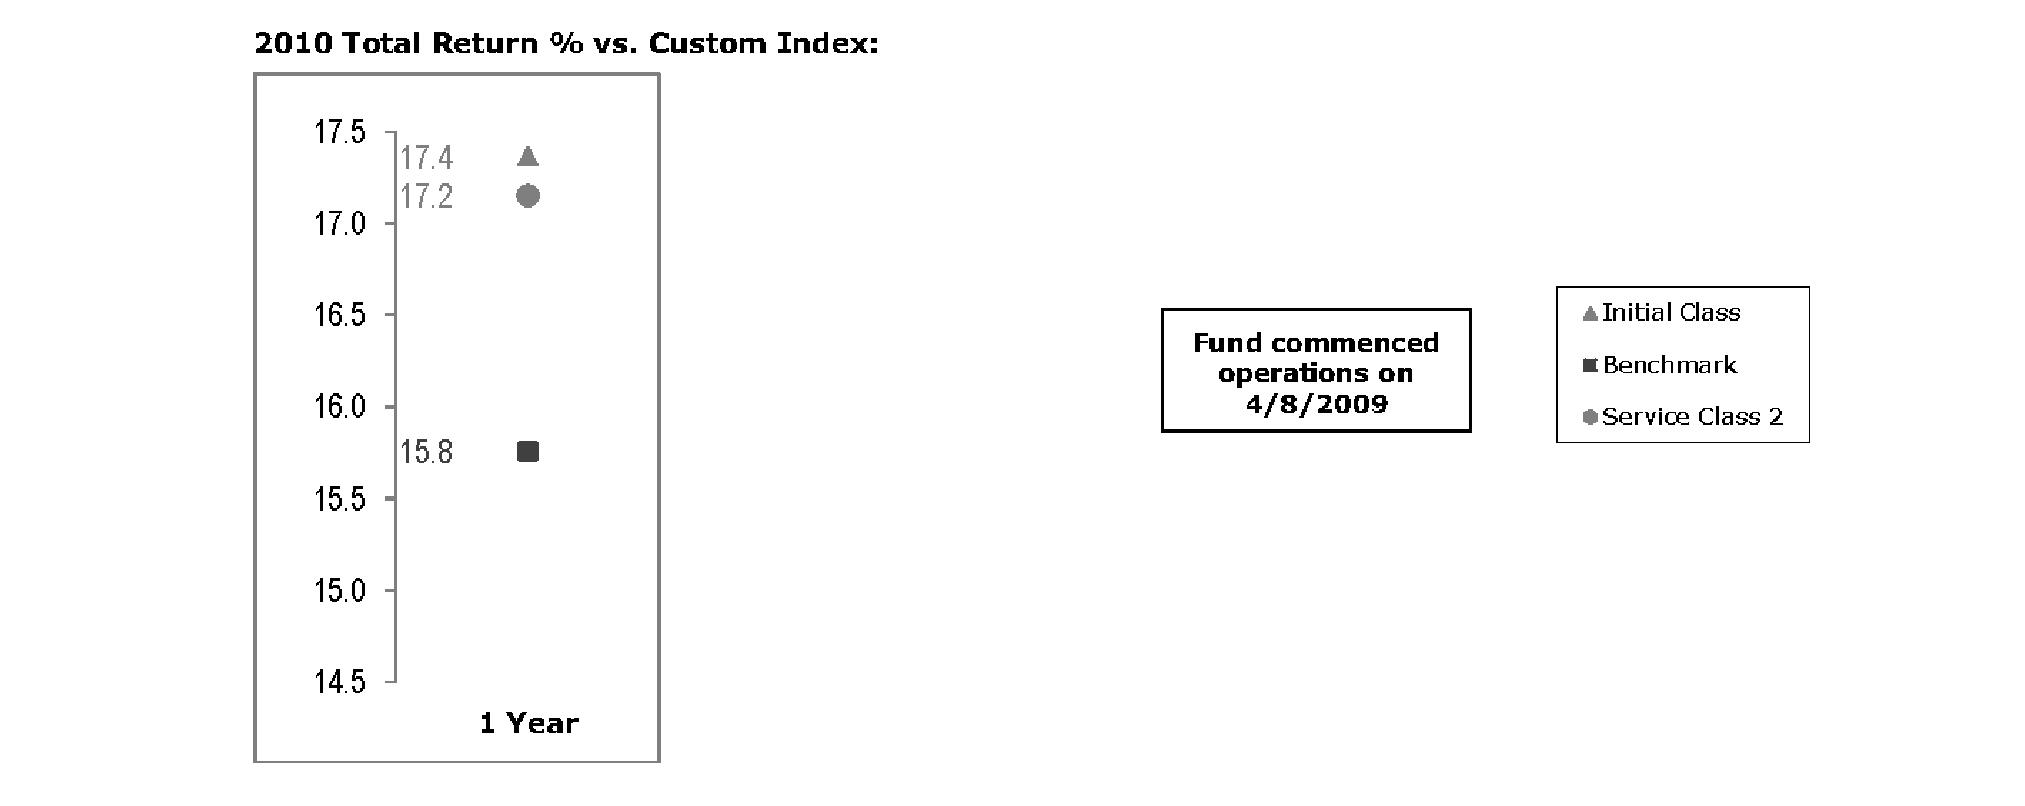
The Board noted that the investment performance of Initial Class of the fund compared favorably to its benchmark for the period shown. The Board considered that the variations in performance among the fund's classes reflect the variations in class expenses, which result in lower performance for higher expense classes. The Board also reviewed the fund's performance since inception as well as performance in the current year. The Board noted that it is difficult to evaluate in any comprehensive fashion the performance of the fund, in light of its relatively recent commencement of operations.
Annual Report
VIP Freedom 2050 Portfolio
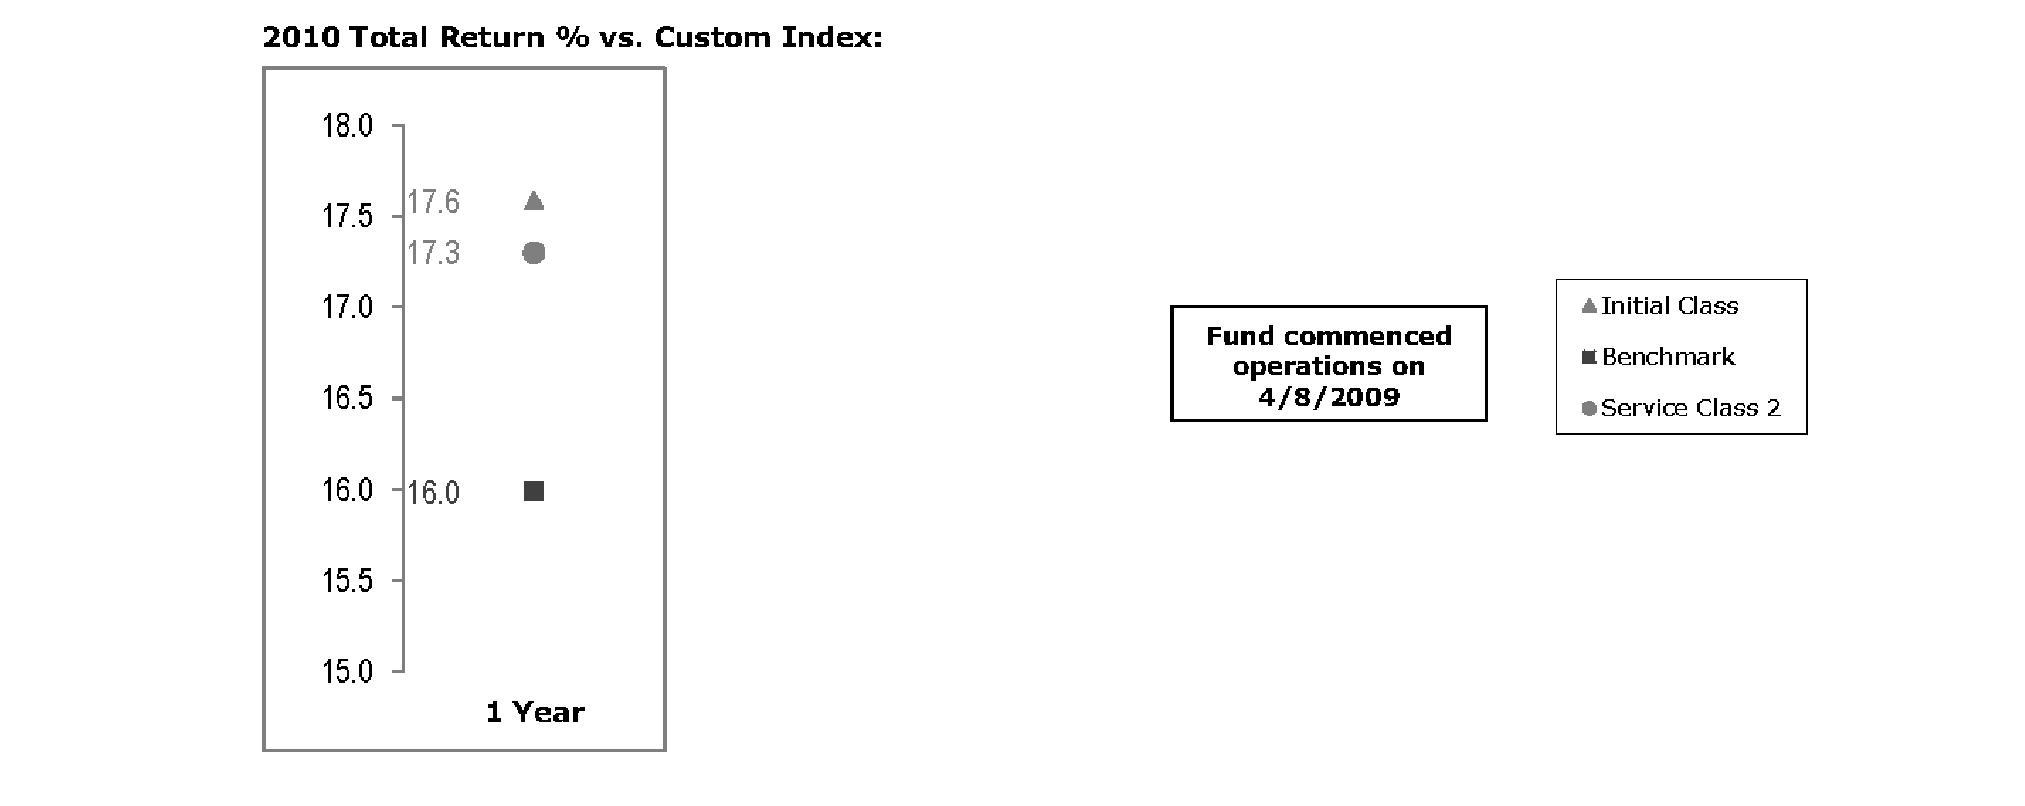
The Board noted that the investment performance of Initial Class of the fund compared favorably to its benchmark for the period shown. The Board considered that the variations in performance among the fund's classes reflect the variations in class expenses, which result in lower performance for higher expense classes. The Board also reviewed the fund's performance since inception as well as performance in the current year. The Board noted that it is difficult to evaluate in any comprehensive fashion the performance of the fund, in light of its relatively recent commencement of operations.
VIP Freedom Income Portfolio
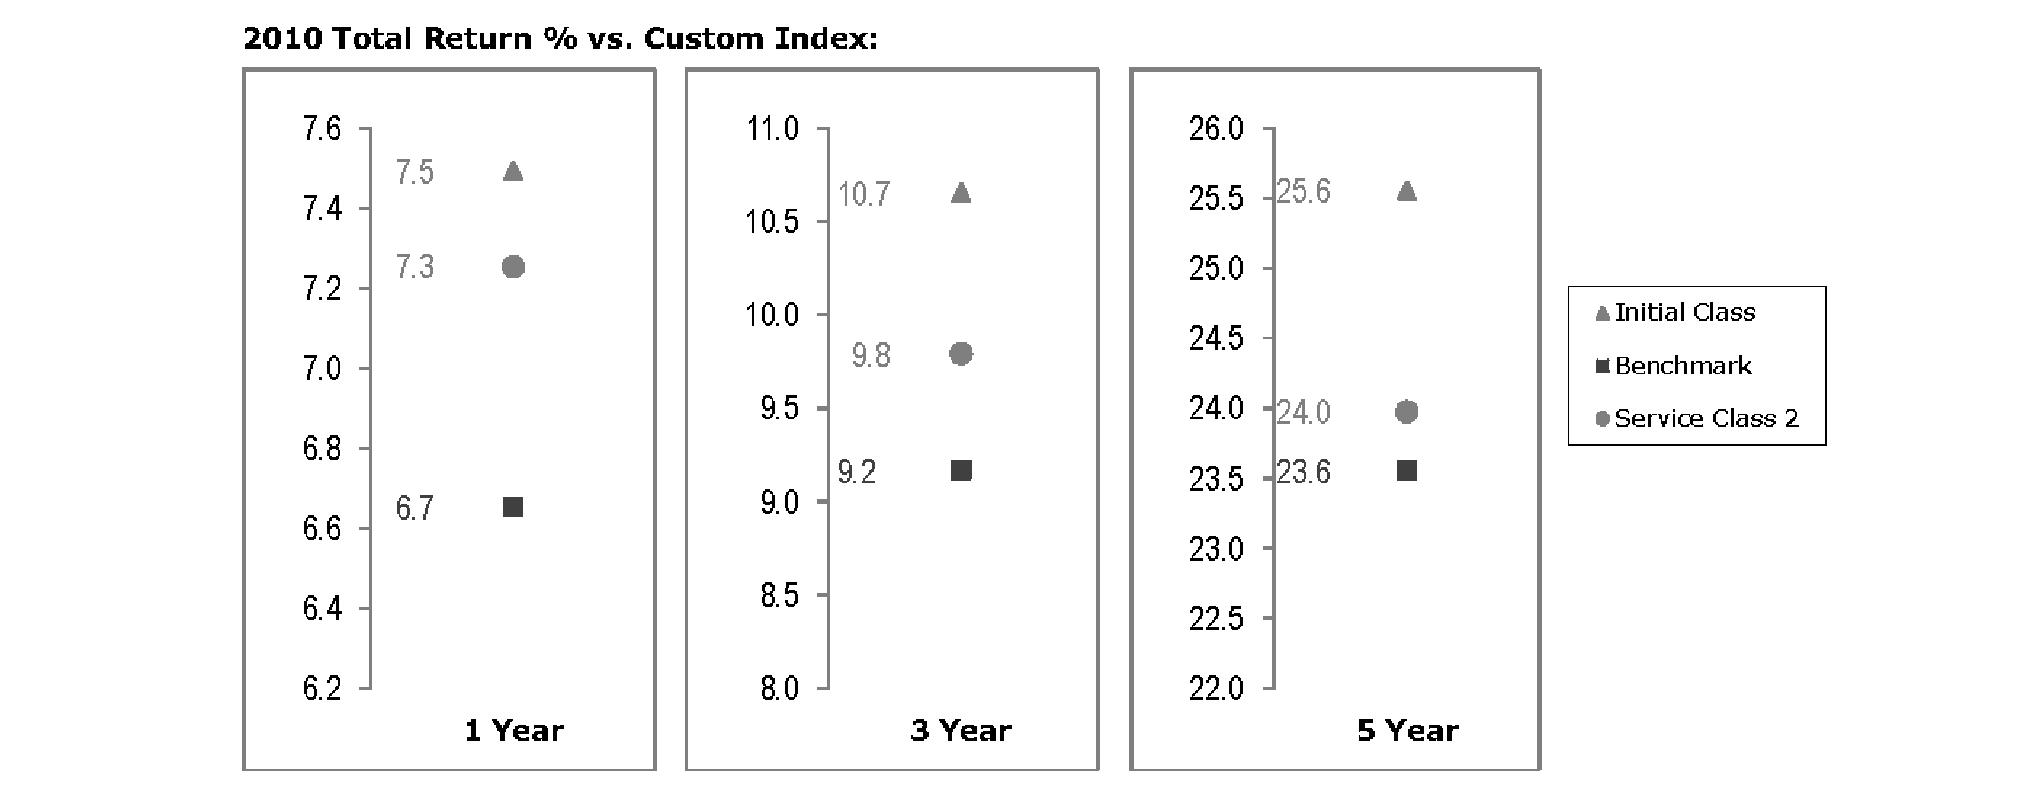
The Board noted that the investment performance of Initial Class of the fund compared favorably to its benchmark for all the periods shown. The Board considered that the variations in performance among the fund's classes reflect the variations in class expenses, which result in lower performance for higher expense classes. The Board also reviewed the fund's performance since inception as well as performance in the current year.
Based on its review, the Board concluded that the nature, extent, and quality of services provided to each fund under the Advisory Contracts should benefit each fund's shareholders.
Competitiveness of Management Fee and Total Expense Ratio. The Board noted that the funds do not pay Strategic Advisers a management fee for investment advisory services. The Board considered each fund's management fee and total expense ratio compared to "mapped groups" of competitive funds and classes, and also considered that each fund bears indirectly the expenses of the underlying funds in which it invests. Fidelity creates "mapped groups" by combining similar Lipper investment objective categories that have comparable management fee characteristics. Combining Lipper investment objective categories aids the Board's management fee and total expense ratio comparisons by broadening the competitive group used for comparison and by reducing the number of universes to which various Fidelity funds are compared.
Annual Report
Board Approval of Investment Advisory Contracts and Management Fees - continued
Management Fee. The Board considered two proprietary management fee comparisons for the 12-month (or shorter) periods shown in the charts below. The group of Lipper funds used by the Board for management fee comparisons is referred to below as the "Total Mapped Group." The Total Mapped Group comparison focuses on a fund's standing relative to the total universe of comparable funds available to investors in terms of gross management fees before expense reimbursements or caps. "TMG %" represents the percentage of funds in the Total Mapped Group that had management fees that were lower than a fund's. For example, a TMG % of 0% means that 100% of the funds in the Total Mapped Group had higher management fees than a fund. The "Asset-Size Peer Group" (ASPG) comparison focuses on a fund's standing relative to non-Fidelity funds similar in size to the fund within the Total Mapped Group. The ASPG represents at least 15% of the funds in the Total Mapped Group with comparable asset size and management fee characteristics, subject to a minimum of 50 funds (or all funds in the Total Mapped Group if fewer than 50). Additional information, such as the ASPG quartile in which a fund's management fee ranked, is also included in the charts and considered by the Board.
VIP Freedom 2005 Portfolio
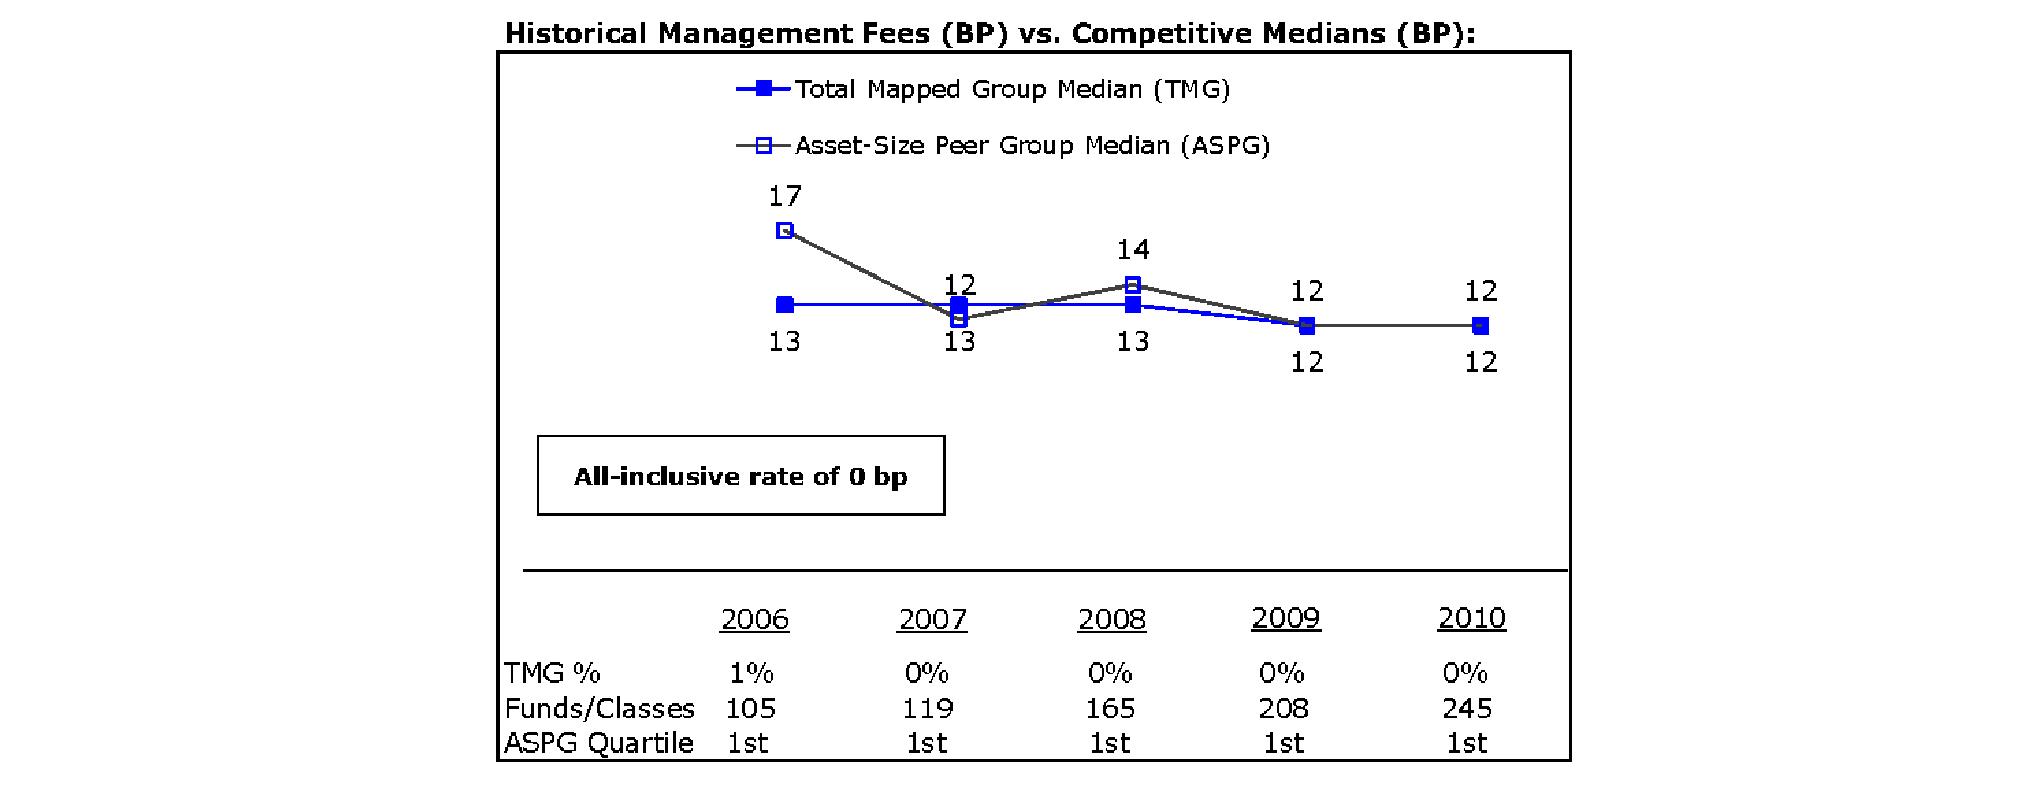
VIP Freedom 2010 Portfolio
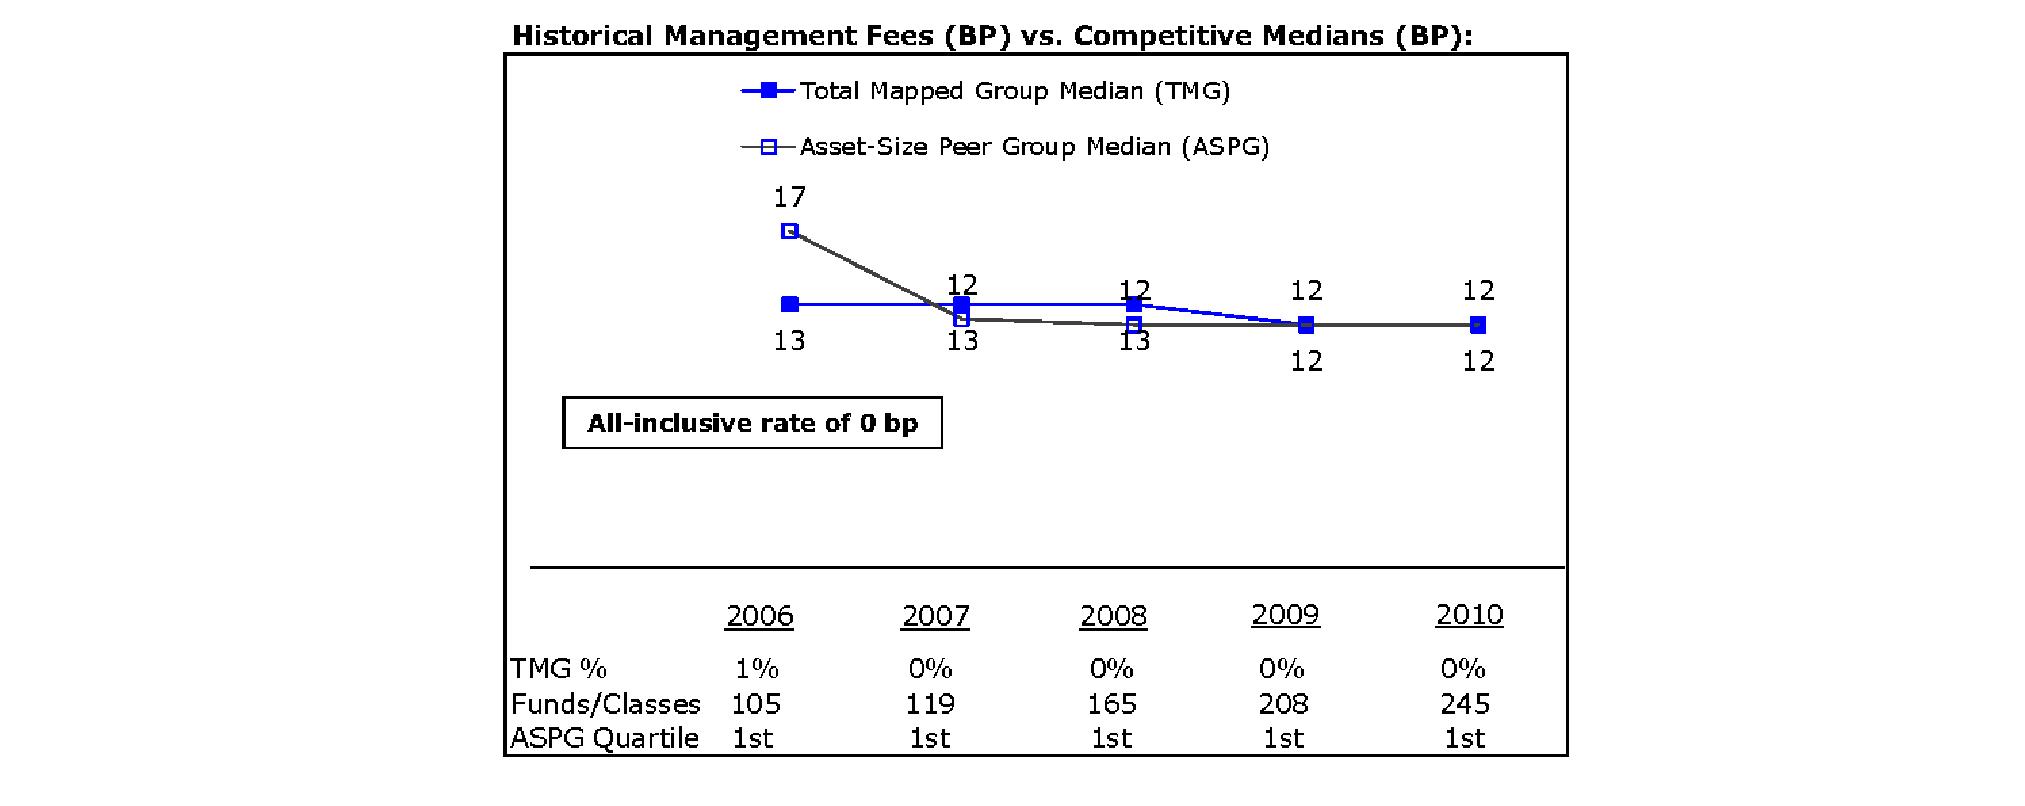
Annual Report
VIP Freedom 2015 Portfolio
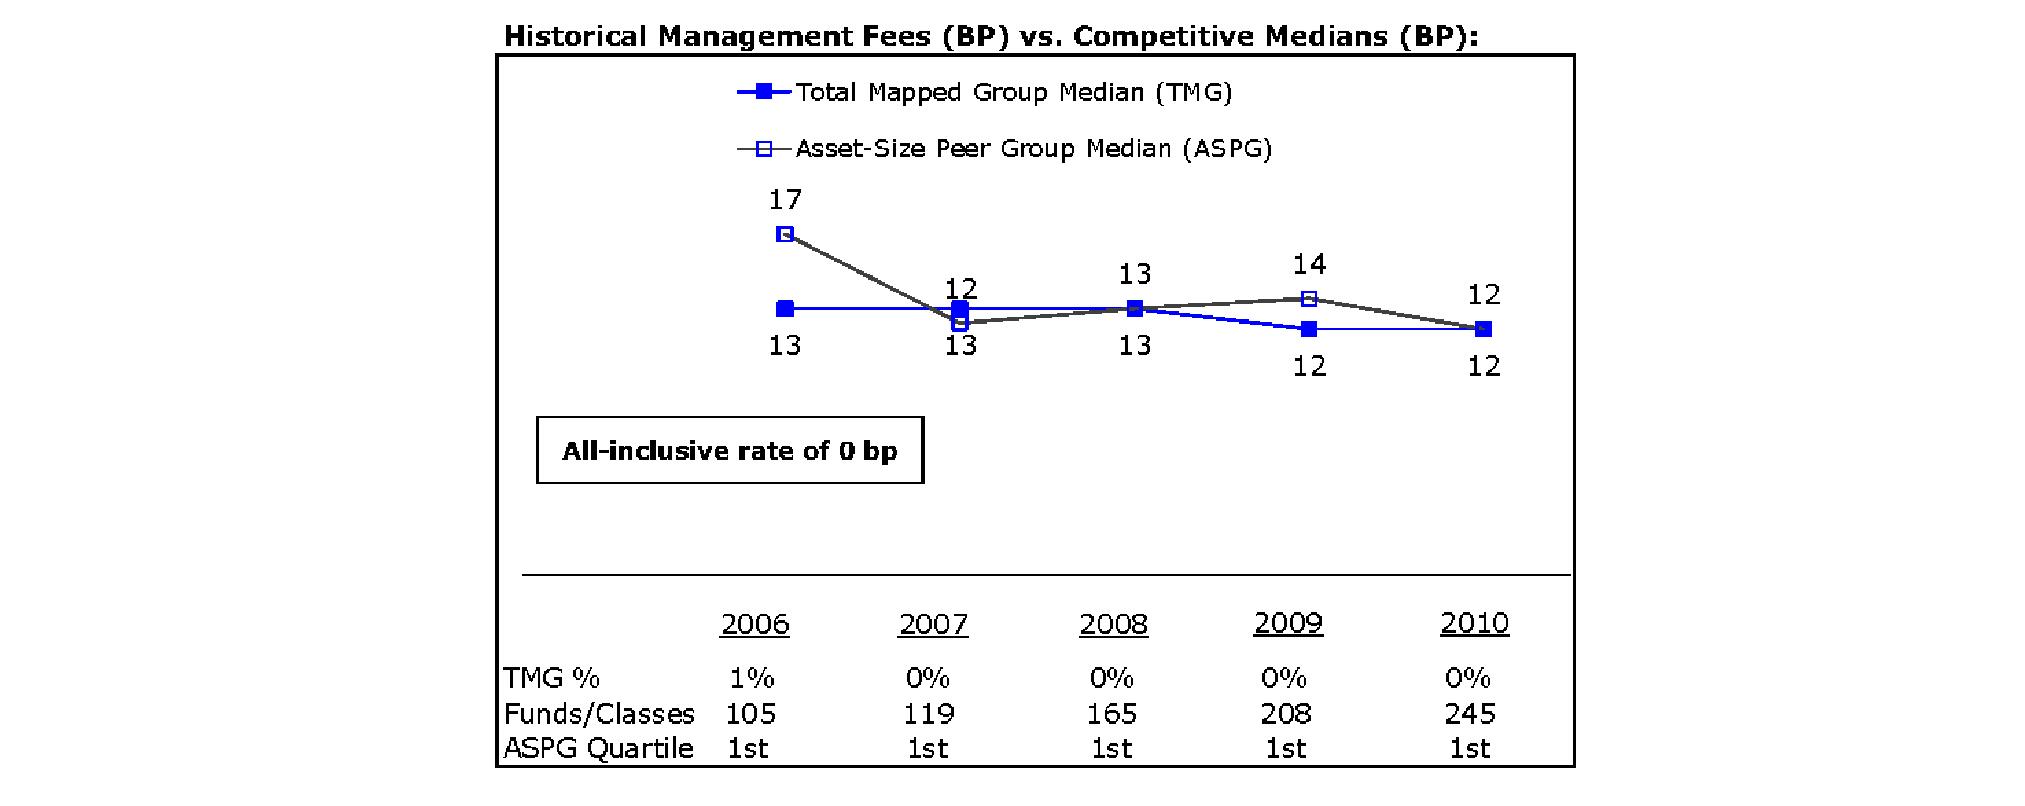
VIP Freedom 2020 Portfolio
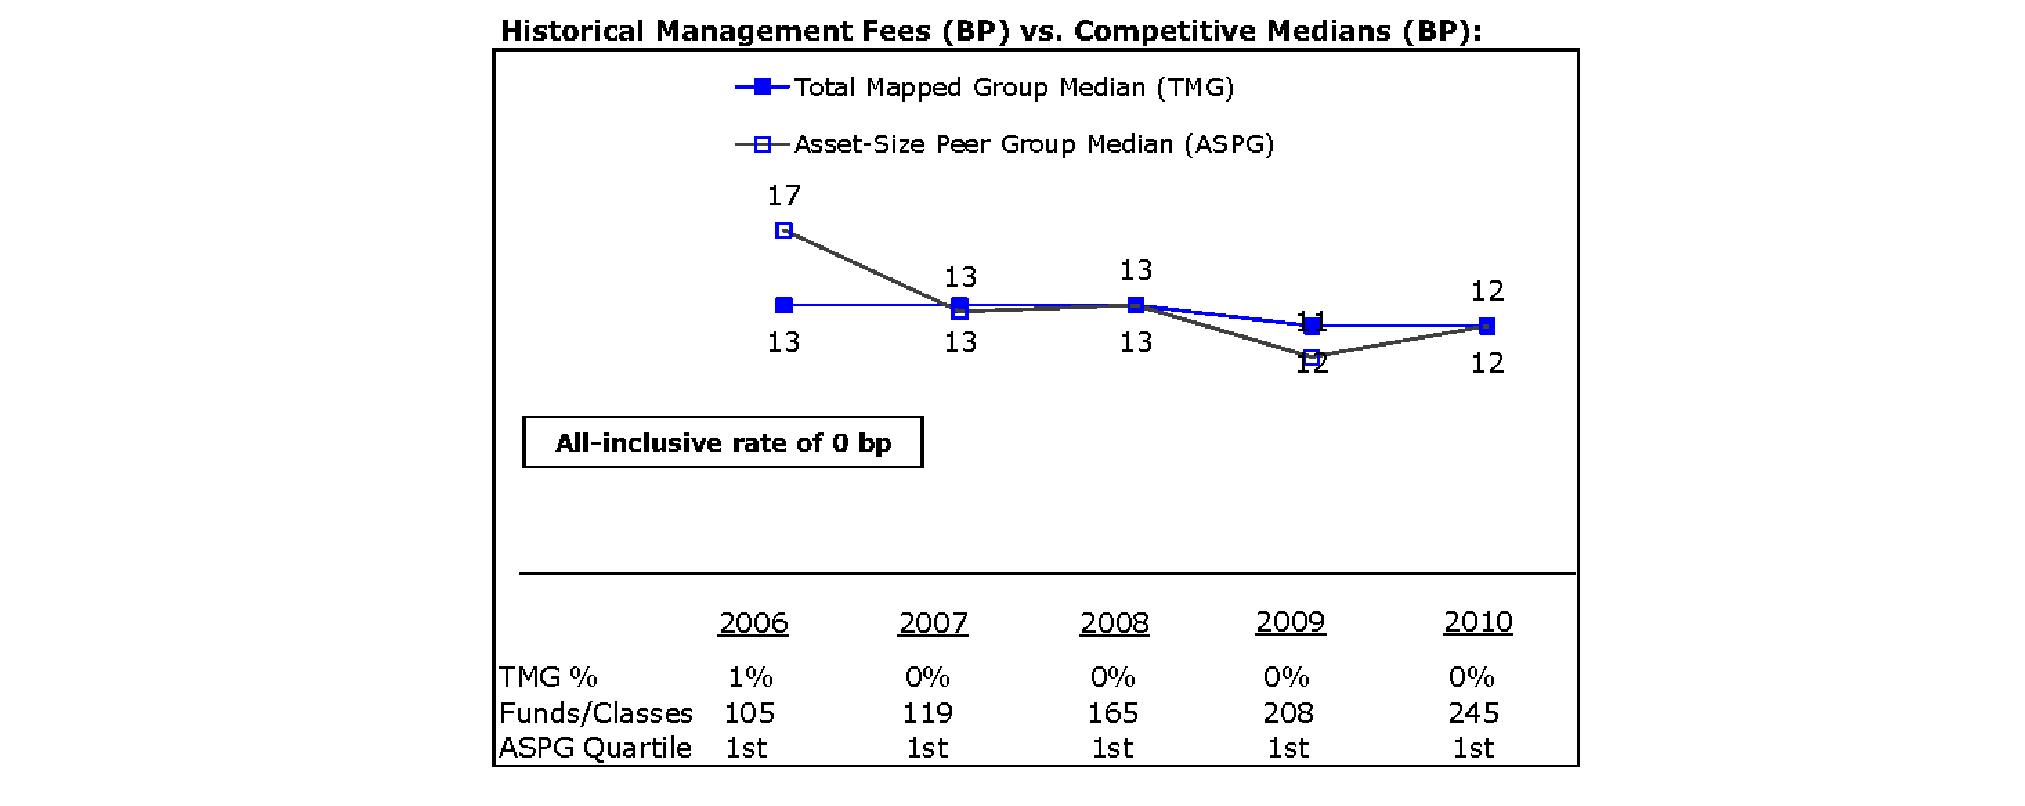
Annual Report
Board Approval of Investment Advisory Contracts and Management Fees - continued
VIP Freedom 2025 Portfolio
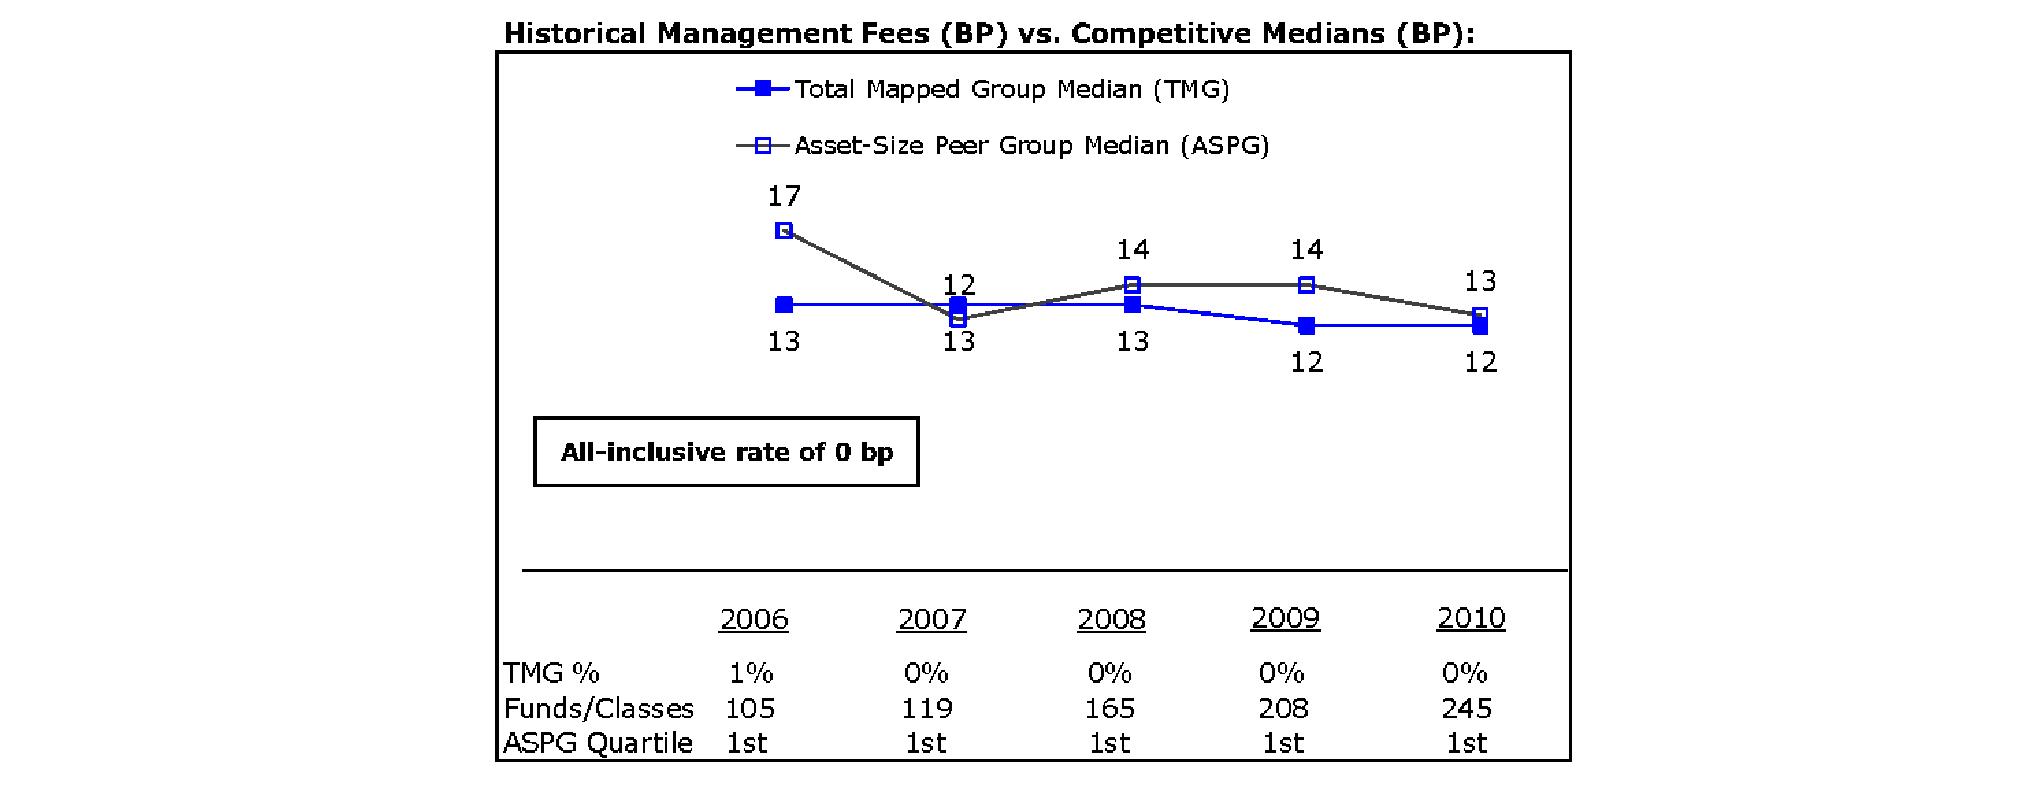
VIP Freedom 2030 Portfolio
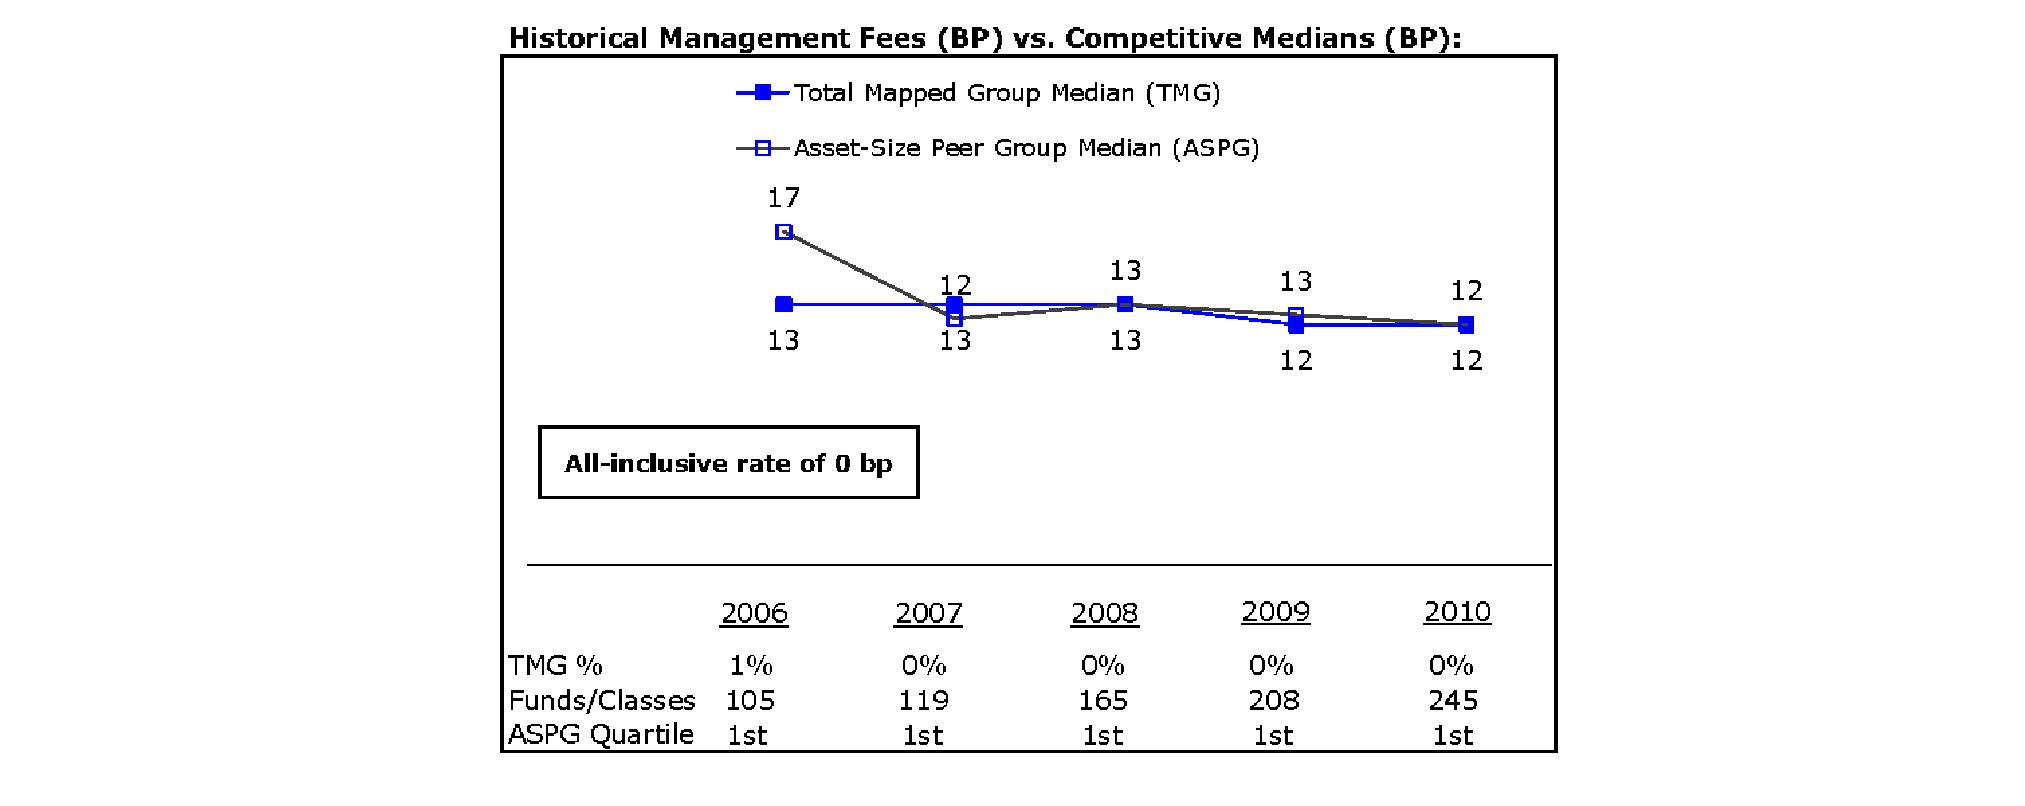
Annual Report
VIP Freedom 2035 Portfolio
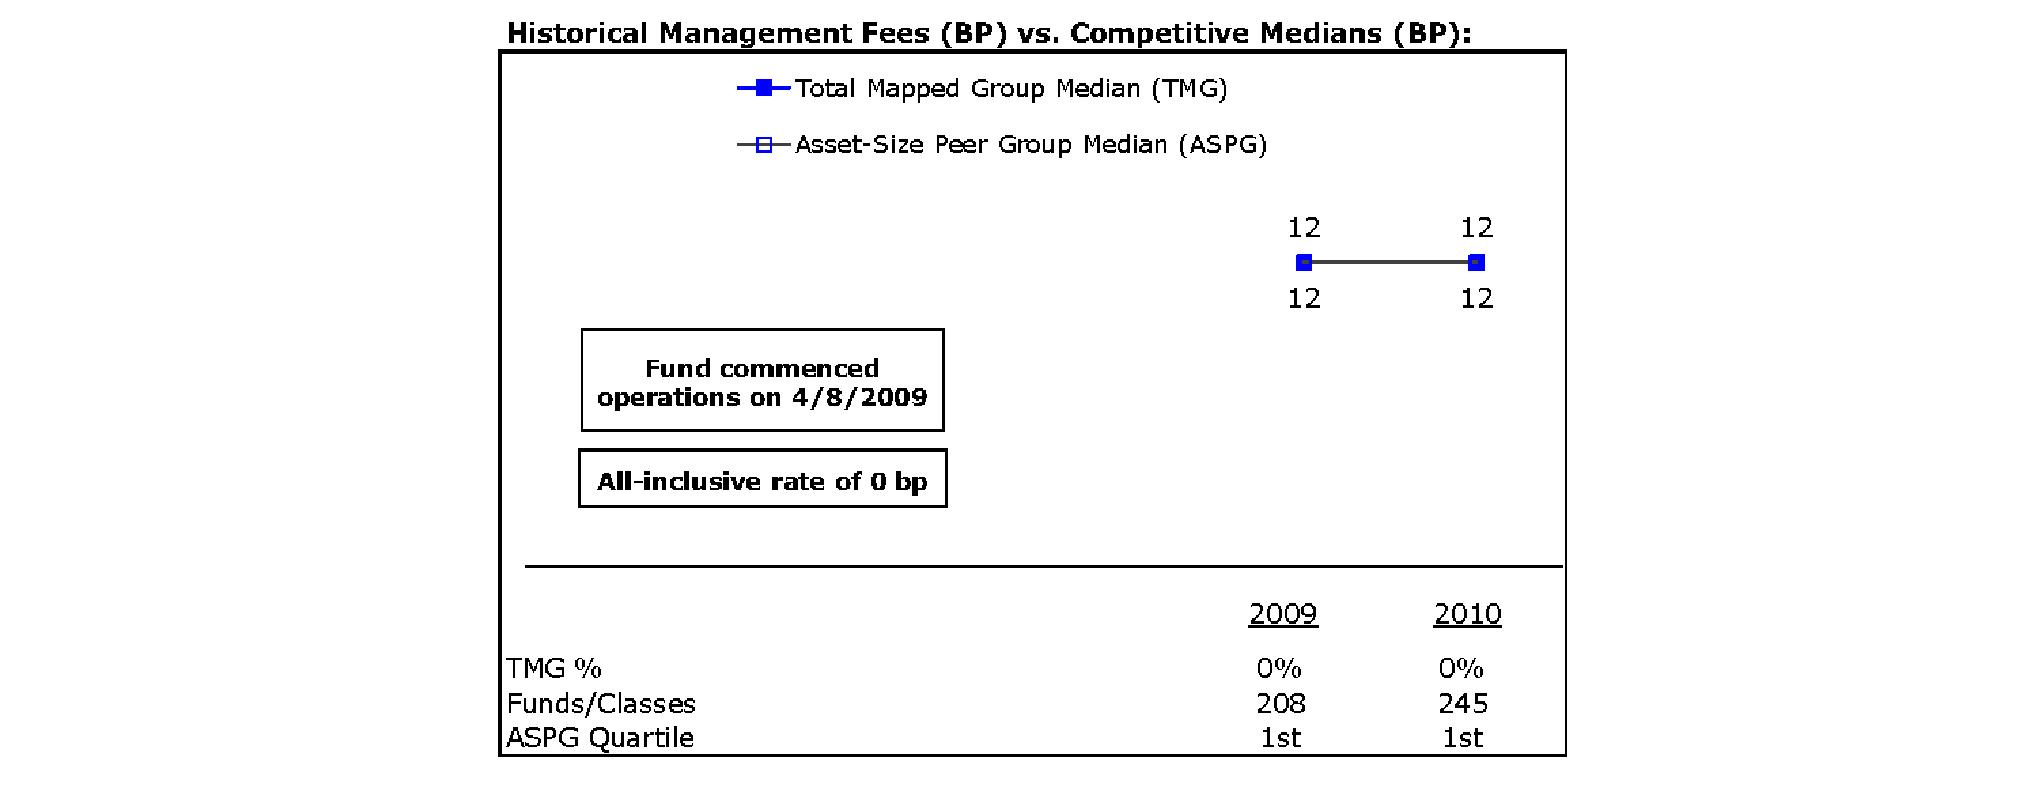
VIP Freedom 2040 Portfolio
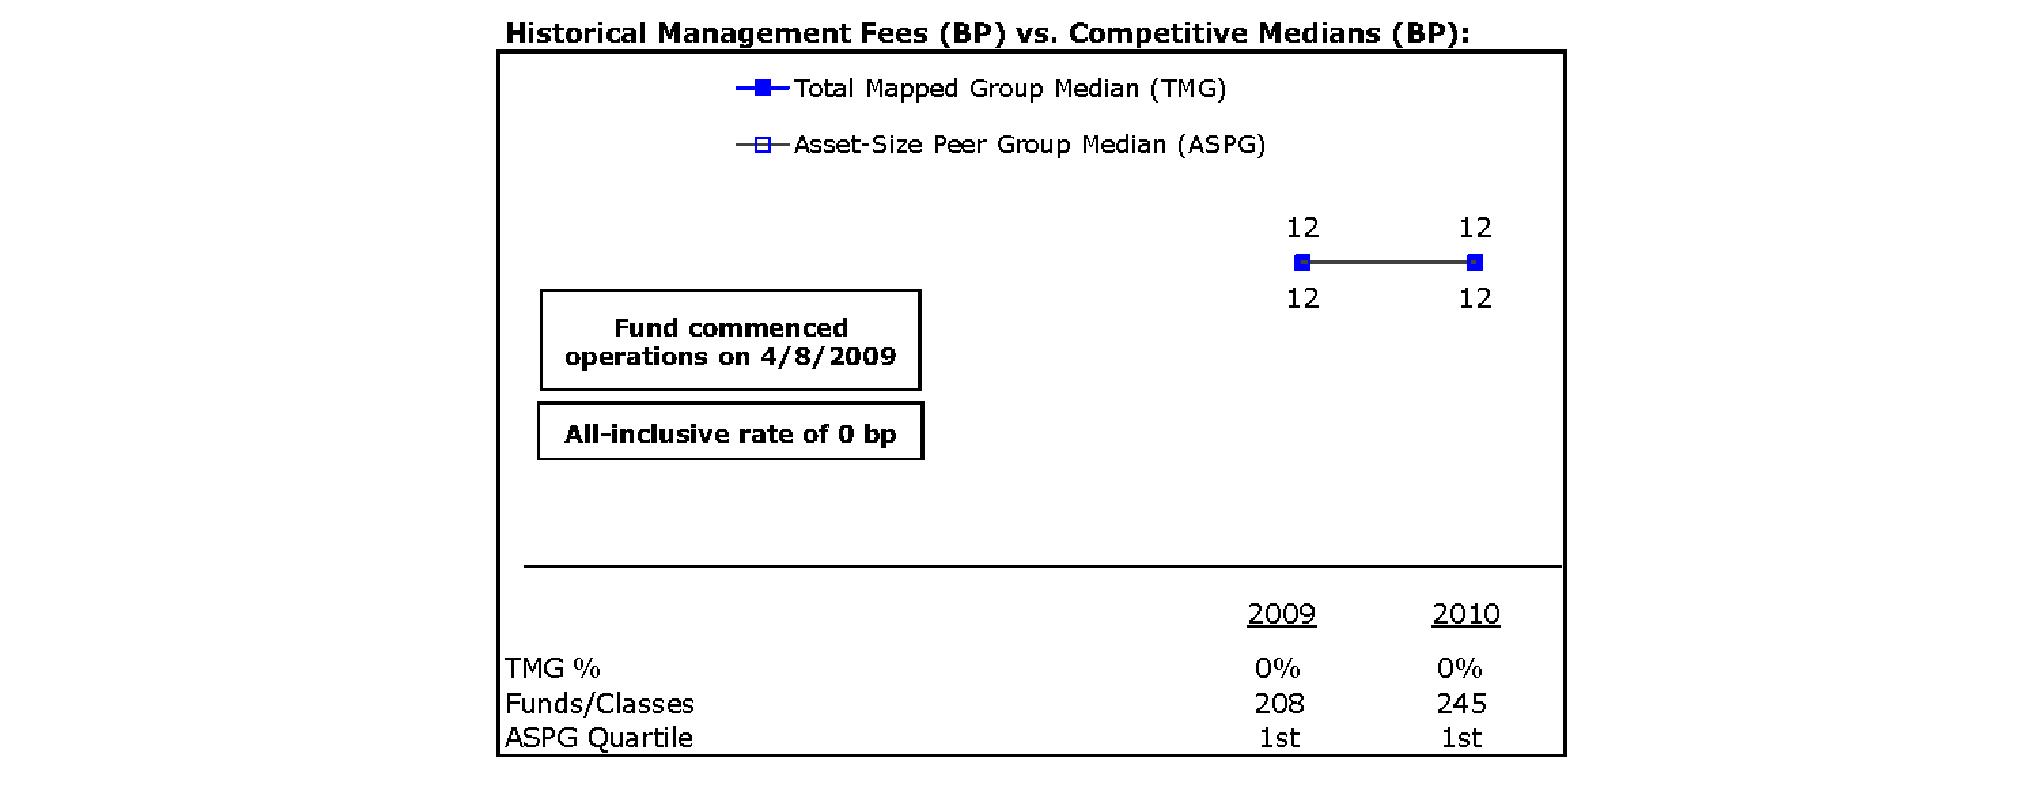
Annual Report
Board Approval of Investment Advisory Contracts and Management Fees - continued
VIP Freedom 2045 Portfolio
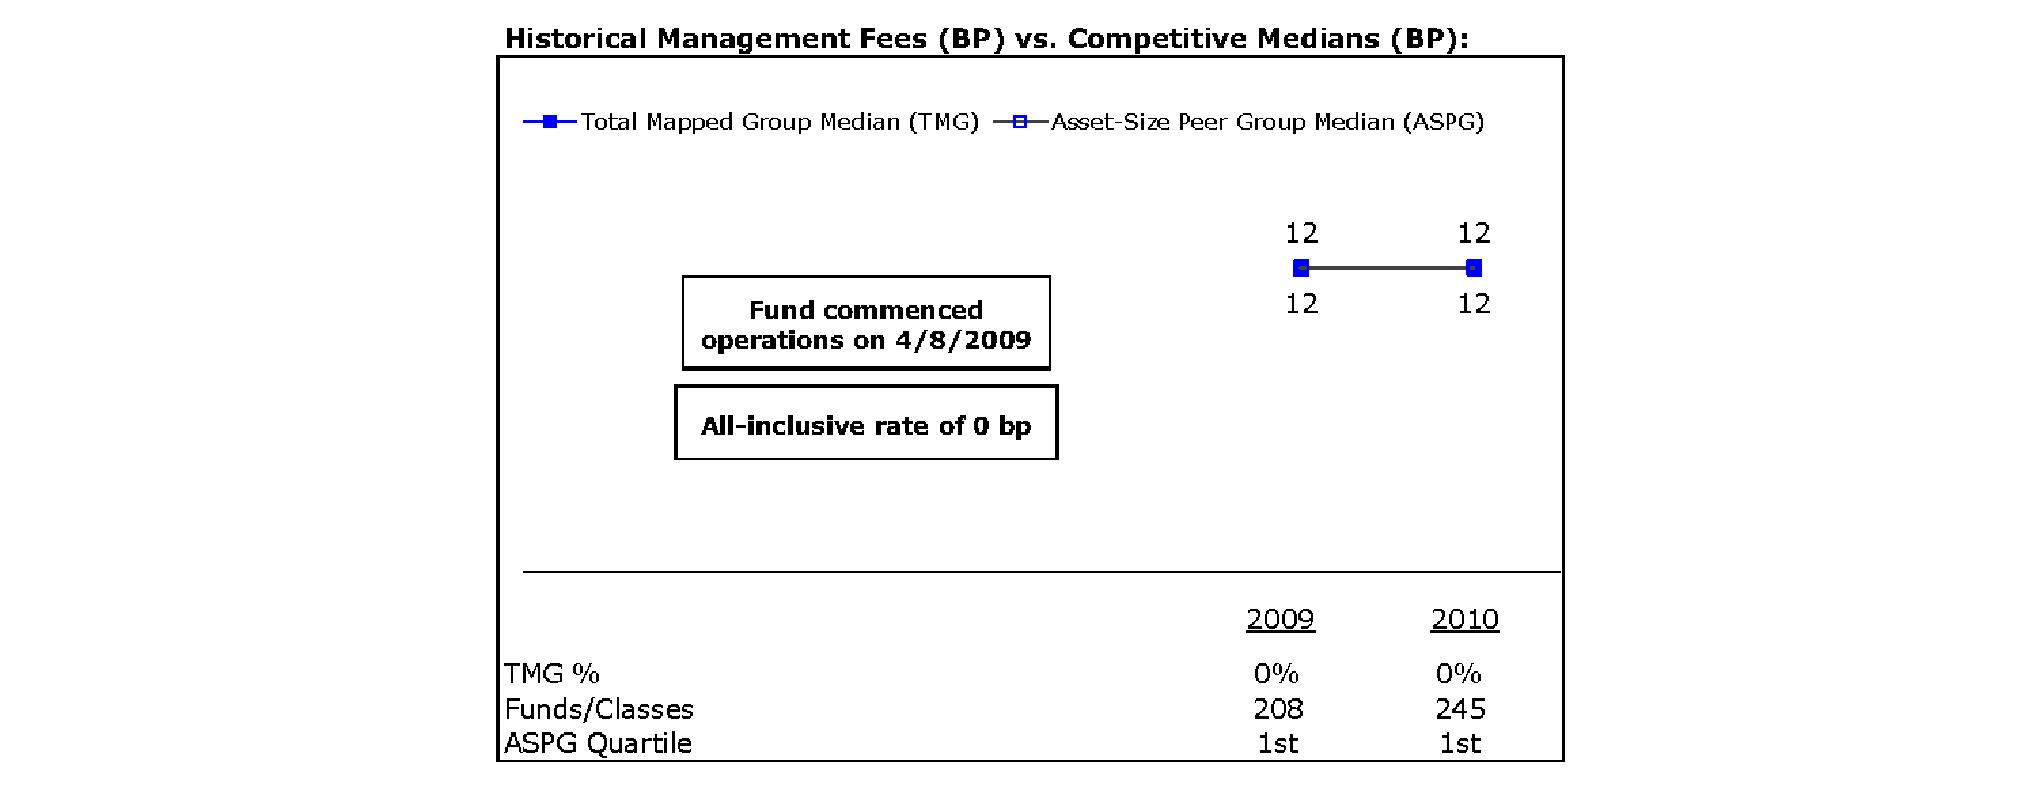
VIP Freedom 2050 Portfolio
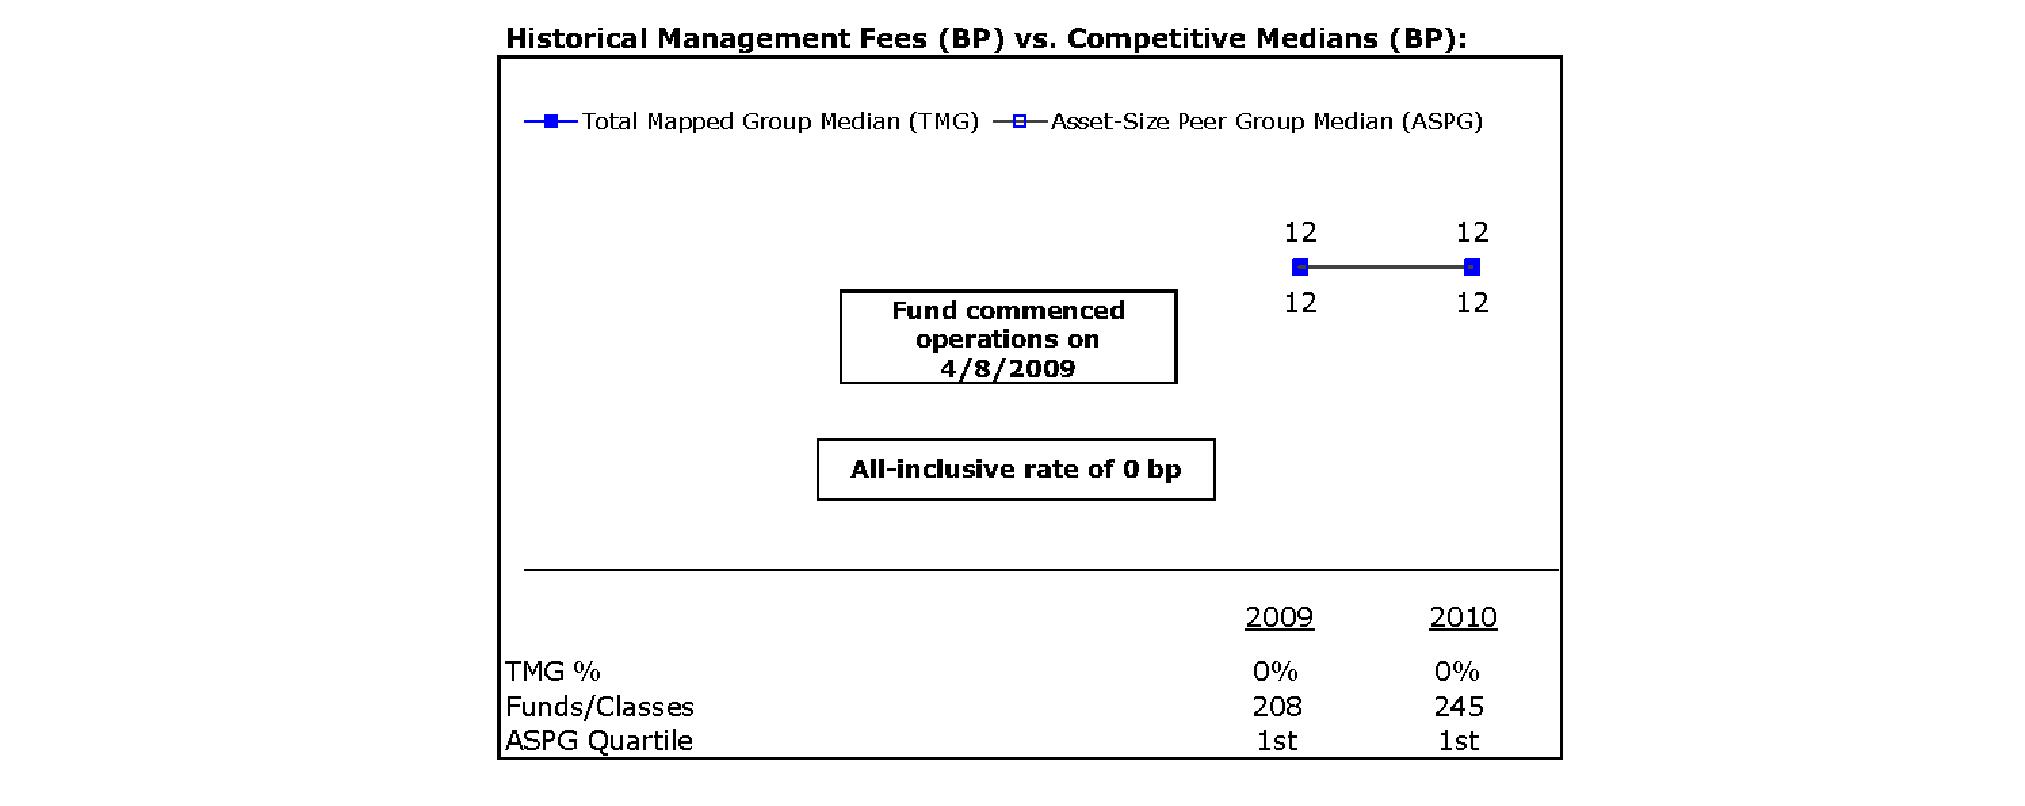
Annual Report
VIP Freedom Income Portfolio
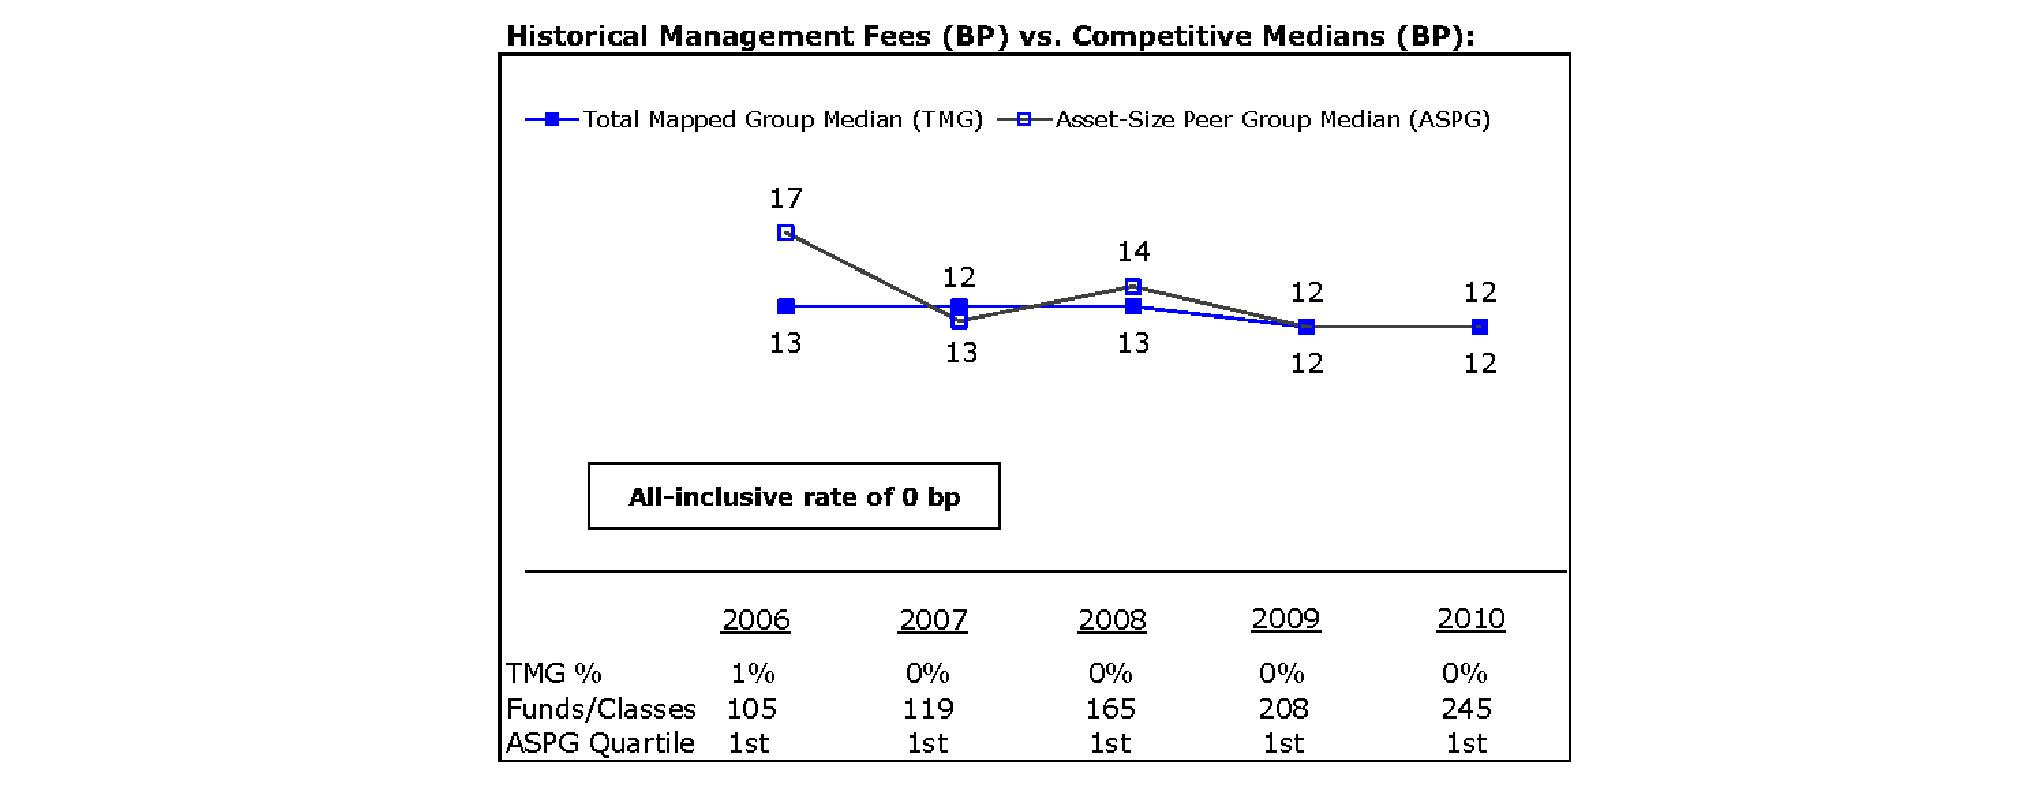
The Board noted that each fund's management fee ranked below the median of its Total Mapped Group and below the median of its ASPG for 2010.
Based on its review, the Board concluded that each fund's management fee is fair and reasonable in light of the services that the fund receives and the other factors considered.
Total Expense Ratio. In its review of the total expense ratio of each class of each fund, the Board noted that each fund invests in Initial Class of the underlying fund to avoid charging fund-paid 12b-1 fees at both fund levels. The Board considered that the funds do not pay transfer agent fees. Instead, Initial Class of each underlying fund bears its pro rata portion of each fund's transfer agent fee according to the percentage of each fund's assets invested in that underlying fund. The Board further noted that FMR pays all other expenses of each fund, with limited exceptions.
The Board noted that the total expense ratio of each of Initial Class and Service Class of each fund ranked below its competitive median for 2010 and the total expense ratio of Service Class 2 of each fund ranked above its competitive median for 2010. The Board considered that various factors, including 12b-1 fees and relatively higher other expenses in the case of small fund size, can affect total expense ratios. The Board noted that the total expense ratio of Service Class 2 of each fund was above the median due to 12b-1 fees and that the funds and classes in the Total Mapped Group that have a similar sales load structure included classes with no 12b-1 fees. Excluding the 12b-1 fees, the total expense ratio of Service Class 2 of each fund ranked below its competitive median for 2010. The Board noted that each fund offers multiple classes, each of which has a different 12b-1 fee structure, and that the multiple structures are intended to offer a range of pricing options for the intermediary market. The Board also noted that the total expense ratios of the classes of each fund vary primarily by the level of their 12b-1 fees.
Fees Charged to Other Fidelity Clients. The Board also considered Fidelity fee structures and other information with respect to clients of FMR and its affiliates, such as other mutual funds advised or subadvised by FMR or its affiliates, pension plan clients, and other institutional clients. In March 2010, the Board created an ad hoc joint committee with the board of other Fidelity funds (the Committee) to review and compare Fidelity's institutional investment advisory business with its business of providing services to the Fidelity funds, including the differences in services provided, fees charged, and costs incurred, as well as competition in their respective marketplaces.
Based on its review of total expense ratios and fees charged to other Fidelity clients, the Board concluded that the total expense ratio of each class of each fund was reasonable, although in some cases above the median of the universe presented for comparison, in light of the services that the fund and its shareholders receive and the other factors considered, including the findings of the Committee.
Costs of the Services and Profitability. The Board considered the level of Fidelity's profits in respect of all the Fidelity funds.
PricewaterhouseCoopers LLP (PwC), independent registered public accounting firm and auditor to Fidelity and certain Fidelity funds, has been engaged annually by the Board as part of the Board's assessment of Fidelity's profitability analysis. PwC's engagement includes the review and assessment of Fidelity's methodologies used in determining the revenues and expenses attributable to Fidelity's mutual fund business, and completion of agreed-upon procedures surrounding the mathematical accuracy of fund profitability and its conformity to allocation methodologies. After considering PwC's reports issued under the engagement and information provided by Fidelity, the Board concluded that while other allocation methods may also be reasonable, Fidelity's profitability methodologies are reasonable in all material respects.
Annual Report
Board Approval of Investment Advisory Contracts and Management Fees - continued
The Board also reviewed Fidelity's non-fund businesses and fall-out benefits related to the mutual fund business as well as cases where Fidelity's affiliates may benefit from or be related to the funds' business.
The Board concluded that the costs of the services provided by and the profits realized by Fidelity in connection with the operation of each fund were not relevant to the renewal of each fund's Advisory Contracts because the funds do not pay management fees and FMR pays all other expenses of each fund, with limited exceptions.
Economies of Scale. The Board concluded that because the funds do not pay management fees and FMR pays all other expenses of each fund, with limited exceptions, economies of scale cannot be realized by the funds, but may be realized by the other Fidelity funds in which each fund invests.
Additional Information Requested by the Board. In order to develop fully the factual basis for consideration of the Fidelity funds' Advisory Contracts, the Board requested and received additional information on certain topics, including: (i) Fidelity's fund profitability methodology, profitability trends for certain funds, and the impact of certain factors on fund profitability results; (ii) portfolio manager changes that have occurred during the past year and the amount of the investment that each portfolio manager has made in the Fidelity fund(s) that he or she manages; (iii) Fidelity's compensation structure for portfolio managers, research analysts, and other key personnel, including its effects on fund profitability, the rationale for the compensation structure, and the extent to which current market conditions have affected retention and recruitment; (iv) the compensation paid to fund sub-advisers on behalf of the Fidelity funds; (v) Fidelity's fee structures and rationale for recommending different fees among different categories of funds and classes, as well as Fidelity's voluntary waiver of its fees to maintain minimum yields for certain money market funds and classes; (vi) the reasons why certain expenses affect various funds and classes differently; (vii) Fidelity's transfer agent fees, expenses, and services and how the benefits of decreased costs and new efficiencies can be shared across all of the Fidelity funds; (viii) the reasons for and consequences of changes to certain product lines compared to competitors; (ix) the allocation of and historical trends in Fidelity's realization of fall-out benefits; and (x) explanations regarding the relative total expense ratios of certain funds and classes, total expense competitive trends, and actions that might be taken by FMR to reduce total expense ratios for certain funds and classes or to achieve further economies of scale.
Based on its evaluation of all of the conclusions noted above, and after considering all factors it believed relevant, the Board ultimately concluded that the advisory fee structures are fair and reasonable, and that each fund's Advisory Contracts should be renewed.
Annual Report
Investment Adviser
Strategic Advisers, Inc.
Boston, MA
General Distributor
Fidelity Distributors Corporation
Boston, MA
Transfer and Service Agents
Fidelity Investments Institutional Operations Company, Inc.
Boston, MA
Fidelity Service Company, Inc.
Boston, MA
Custodian
The Bank of New York Mellon
New York, NY
VIPFF2K-ANN-0212
1.826371.107
Fidelity® Variable Insurance Products:
Freedom Lifetime Income Funds -
Portfolios I, II, & III
Annual Report
December 31, 2011
Contents
To view a fund's proxy voting guidelines and proxy voting record for the 12-month period ended June 30, visit http://www.fidelity.com/proxyvotingresults or visit the Securities and Exchange Commission's (SEC) web site at http://www.sec.gov. You may also call 1-877-208-0098 to request a free copy of the proxy voting guidelines.
Fidelity Variable Insurance Products are separate account options which are purchased through a variable insurance contract.
Standard & Poor's, S&P and S&P 500 are registered service marks of The McGraw-Hill Companies, Inc. and have been licensed for use by Fidelity Distributors Corporation.
Other third party marks appearing herein are the property of their respective owners.
All other marks appearing herein are registered or unregistered trademarks or service marks of FMR LLC or an affiliated company.
This report and the financial statements contained herein are submitted for the general information of the shareholders of the funds. This report is not authorized for distribution to prospective investors in the funds unless preceded or accompanied by an effective prospectus.
A fund files its complete schedule of portfolio holdings with the SEC for the first and third quarters of each fiscal year on Form N-Q. Forms N-Q are available on the SEC's web site at http://www.sec.gov. A fund's Forms N-Q may be reviewed and copied at the SEC's Public Reference Room in Washington, DC. Information regarding the operation of the SEC's Public Reference Room may be obtained by calling 1-800-SEC-0330. For a complete list of a fund's portfolio holdings, view the most recent holdings listing, semiannual report, or annual report on Fidelity's web site at http://www.fidelity.com, http://www.advisor.fidelity.com, or http://www.401k.com, as applicable.
NOT FDIC INSURED • MAY LOSE VALUE • NO BANK GUARANTEE
Neither the funds nor Fidelity Distributors Corporation is a bank.
Annual Report
VIP Freedom Lifetime Income® I Portfolio
Performance: The Bottom Line
Average annual total return reflects the change in the value of an investment, assuming reinvestment of the fund's distributions from dividend income and capital gains (the profits earned upon the sale of securities that have grown in value, if any) and assuming a constant rate of performance each year. During periods of reimbursement by Fidelity, a fund's total return will be greater than it would be had the reimbursement not occurred. Performance numbers are net of all underlying fund operating expenses, but do not include any insurance charges imposed by your insurance company's separate account. If performance information included the effect of these additional charges, the total returns would have been lower. How a fund did yesterday is no guarantee of how it will do tomorrow.
Average Annual Total Returns
Periods ended December 31, 2011 | Past 1
year | Past 5
years | Life of
fund A |
VIP Freedom Lifetime Income® I Portfolio | 0.48% | 2.90% | 4.21% |
A From July 26, 2005.
$10,000 Over Life of Fund
Let's say hypothetically that $10,000 was invested in VIP Freedom Lifetime Income I Portfolio on July 26, 2005, when the fund started. The chart shows how the value of your investment would have changed, and also shows how the S&P 500® Index performed over the same period.
Annual Report
VIP Freedom Lifetime Income II Portfolio
Performance: The Bottom Line
Average annual total return reflects the change in the value of an investment, assuming reinvestment of the fund's distributions from dividend income and capital gains (the profits earned upon the sale of securities that have grown in value, if any) and assuming a constant rate of performance each year. During periods of reimbursement by Fidelity, a fund's total return will be greater than it would be had the reimbursement not occurred. Performance numbers are net of all underlying fund operating expenses, but do not include any insurance charges imposed by your insurance company's separate account. If performance information included the effect of these additional charges, the total returns would have been lower. How a fund did yesterday is no guarantee of how it will do tomorrow.
Average Annual Total Returns
Periods ended December 31, 2011 | Past 1
year | Past 5
years | Life of
fund A |
VIP Freedom Lifetime Income II Portfolio | 0.25% | 2.35% | 4.33% |
A From July 26, 2005.
$10,000 Over Life of Fund
Let's say hypothetically that $10,000 was invested in VIP Freedom Lifetime Income II Portfolio on July 26, 2005, when the fund started. The chart shows how the value of your investment would have changed, and also shows how the S&P 500 Index performed over the same period.
Annual Report
VIP Freedom Lifetime Income III Portfolio
Performance: The Bottom Line
Average annual total return reflects the change in the value of an investment, assuming reinvestment of the fund's distributions from dividend income and capital gains (the profits earned upon the sale of securities that have grown in value, if any) and assuming a constant rate of performance each year. During periods of reimbursement by Fidelity, a fund's total return will be greater than it would be had the reimbursement not occurred. Performance numbers are net of all underlying fund operating expenses, but do not include any insurance charges imposed by your insurance company's separate account. If performance information included the effect of these additional charges, the total returns would have been lower. How a fund did yesterday is no guarantee of how it will do tomorrow.
Average Annual Total Returns
Periods ended December 31, 2011 | Past 1
year | Past 5
years | Life of
fund A |
VIP Freedom Lifetime Income III Portfolio | -2.36% | 1.16% | 3.76% |
A From July 26, 2005.
$10,000 Over Life of Fund
Let's say hypothetically that $10,000 was invested in VIP Freedom Lifetime Income III Portfolio on July 26, 2005, when the fund started. The chart shows how the value of your investment would have changed, and also shows how the S&P 500 Index performed over the same period.
Annual Report
Market Recap: Extreme market volatility took center stage during the 12 months ending December 31, 2011, stealing the spotlight from signs of progress in the global economy. Early in the year, aggressive monetary stimulus by the U.S. federal government, improving credit-market conditions and solid corporate earnings buoyed most major asset classes. As the period progressed, however, fresh worries about sovereign debt in Europe, inflation in China, gridlock over raising the debt ceiling in the U.S. - along with Standard & Poor's early-August downgrade of the nation's long-term sovereign credit rating - and a dimmed outlook for global growth punctured investor confidence and ignited market instability. Domestic equities, as measured by the broad-based S&P 500® Index, gained 2.11%, easily outpaced the 13.61% decline of MSCI® ACWI® (All Country World Index) ex USA Index, a proxy for foreign stocks. Within the MSCI index, emerging markets declined the most (-18%), with investments here generally held back by a stronger U.S. dollar. The U.K. (-3%) fared better than the rest of Europe (-15%), which was the second-worst-performing index component. Bolstered by periodic flights to quality, U.S. investment-grade bonds posted a 7.84% advance, as reflected by the Barclays Capital® U.S. Aggregate Bond Index, outperforming the 4.37% gain of high-yield securities, as represented by The BofA Merrill LynchSM US High Yield Constrained Index. Hampered by financial woes in Europe, the sovereign debt of major developed markets outside the U.S. rose 4.86%, according to the Citigroup® Non-USD Group-of-Seven (G7) Equal Weighted Index, while the JPMorgan Emerging Markets Bond Index Global (EMBI Global) advanced 8.46%, despite the currency head wind.
Comments from Christopher Sharpe, Co-Portfolio Manager of VIP Freedom Lifetime Income Funds, and Andrew Dierdorf, who became Co-Portfolio Manager on June 21, 2011: For the year ending December 31, 2011, VIP Freedom Lifetime Income Fund I and VIP Freedom Lifetime Income Fund II - the two more-conservative Funds with higher allocations to the bond asset class - delivered modest positive absolute returns for the 12-month period. Meanwhile, VIP Freedom Lifetime Income Fund III, the most-equity-focused Fund of the three, delivered a low single-digit loss. (For specific Fund results, please refer to the performance section of this report.) As volatility picked up throughout the year, returns for equities seesawed. The Funds' underlying equity funds - both U.S. and non-U.S. - also struggled to deliver positive results and keep pace with their respective benchmark indexes, due to unfavorable security selection overall. In aggregate, the Funds' U.S. equity asset class underperformed the Dow Jones U.S. Total Stock Market IndexSM, which rose 1.08% for the one-year period. Turning to the Funds' non-U.S. holdings, VIP Overseas Portfolio and VIP Emerging Markets Portfolio each experienced a double-digit decline. While financial woes across Europe plagued stocks globally, holding back the performance of VIP Overseas Portfolio, monetary tightening and signs of an economic slowdown in China, India and other developing countries presented head winds for emerging-markets stocks. In aggregate, the non-U.S. equity asset class lagged the MSCI® EAFE® (Europe, Australasia, Far East) Index, which fell 12.04%. With headline events and disappointing U.S. economic data - such as continued high levels of unemployment and a stagnant housing market - taking their toll on the equity markets, investors shifted their focus to higher-quality bonds, especially U.S. Treasuries. The performance of VIP Investment Grade Bond Portfolio fell just short of the Barclays Capital® U.S. Aggregate Bond Index, and the Funds' high-yield debt allocation to VIP High Income Portfolio underperformed by an even greater degree. As a result, the Funds' bond asset class, in aggregate, detracted from overall results. Lastly, representing the Funds' short-term debt asset class, VIP Money Market Portfolio performed on par with the Barclays Capital U.S. 3 Month Treasury Bellwether Index, which increased 0.11%.
The views expressed above reflect those of the portfolio manager(s) only through the end of the period as stated on the cover of this report and do not necessarily represent the views of Fidelity or any other person in the Fidelity organization. Any such views are subject to change at any time based upon market or other conditions and Fidelity disclaims any responsibility to update such views. These views may not be relied on as investment advice and, because investment decisions for a Fidelity fund are based on numerous factors, may not be relied on as an indication of trading intent on behalf of any Fidelity fund.
Annual Report
As a shareholder of a Fund, you incur two types of costs: (1) transaction costs, and (2) ongoing costs, including other Fund expenses. This Example is intended to help you understand your ongoing costs (in dollars) of investing in the Funds and to compare these costs with the ongoing costs of investing in other mutual funds.
The Example is based on an investment of $1,000 invested at the beginning of the period and held for the entire period (July 1, 2011 to December 31, 2011).
Actual Expenses
The first line of the accompanying table for each fund provides information about actual account values and actual expenses. You may use the information in this line, together with the amount you invested, to estimate the expenses that you paid over the period. Simply divide your account value by $1,000.00 (for example, an $8,600 account value divided by $1,000.00 = 8.6), then multiply the result by the number in the first line for a fund under the heading entitled "Expenses Paid During Period" to estimate the expenses you paid on your account during this period. The estimate of expenses does not include any fees or other expenses of any variable annuity or variable life insurance product. If they were, the estimate of expenses you paid during the period would be higher, and your ending account value would be lower. In addition, each Fund, as a shareholder in underlying Fidelity Funds, will indirectly bear its pro-rata share of the fees and expenses incurred by the underlying Fidelity Funds. These fees and expenses are not included in each Fund's annualized expense ratio used to calculate the expense estimates in the table below.
Hypothetical Example for Comparison Purposes
The second line of the accompanying table for each fund provides information about hypothetical account values and hypothetical expenses based on a fund's actual expense ratio and an assumed rate of return of 5% per year before expenses, which is not the Fund's actual return. The hypothetical account values and expenses may not be used to estimate the actual ending account balance or expenses you paid for the period. You may use this information to compare the ongoing costs of investing in the Fund and other funds. To do so, compare this 5% hypothetical example with the 5% hypothetical examples that appear in the shareholder reports of the other funds. The estimate of expenses does not include any fees or other expenses of any variable annuity or variable life insurance product. If they were, the estimate of expenses you paid during the period would be higher, and your ending account value would be lower. In addition, each Fund, as a shareholder in underlying Fidelity Funds, will indirectly bear its pro-rata share of the fees and expenses incurred by the underlying Fidelity Funds. These fees and expenses are not included in each Fund's annualized expense ratio used to calculate the expense estimates in the table below.
Please note that the expenses shown in the table are meant to highlight your ongoing costs only and do not reflect any transaction costs. Therefore, the second line of the table is useful in comparing ongoing costs only, and will not help you determine the relative total costs of owning different funds.
| Annualized
Expense Ratio | Beginning
Account Value
July 1, 2011 | Ending
Account Value
December 31, 2011 | Expenses Paid
During Period*
July 1, 2011 to
December 31, 2011 |
VIP Freedom Lifetime Income I | .00% | | | |
Actual | | $ 1,000.00 | $ 969.00 | $ .00 |
HypotheticalA | | $ 1,000.00 | $ 1,025.21 | $ .00 |
VIP Freedom Lifetime Income II | .00% | | | |
Actual | | $ 1,000.00 | $ 962.20 | $ .00 |
HypotheticalA | | $ 1,000.00 | $ 1,025.21 | $ .00 |
VIP Freedom Lifetime Income III | .00% | | | |
Actual | | $ 1,000.00 | $ 931.60 | $ .00 |
HypotheticalA | | $ 1,000.00 | $ 1,025.21 | $ .00 |
A 5% return per year before expenses
* Expenses are equal to each Fund's annualized expense ratio, multiplied by the average account value over the period, multiplied by 184/365 (to reflect the one-half year period). The fees and expenses of the underlying Fidelity Funds in which the Fund invests are not included in the Fund's annualized expense ratio.
Annual Report
VIP Freedom Lifetime Income I Portfolio
Investment Changes (Unaudited)
Fund Holdings as of December 31, 2011 |
| % of fund's
net assets | % of fund's net assets
6 months ago |
Domestic Equity Funds | | |
VIP Contrafund Portfolio Investor Class | 4.8 | 5.0 |
VIP Equity-Income Portfolio Investor Class | 5.8 | 5.8 |
VIP Growth & Income Portfolio Investor Class | 5.8 | 5.8 |
VIP Growth Portfolio Investor Class | 5.6 | 5.9 |
VIP Mid Cap Portfolio Investor Class | 1.9 | 2.0 |
VIP Value Portfolio Investor Class | 4.9 | 5.0 |
VIP Value Strategies Portfolio Investor Class | 2.0 | 2.1 |
| 30.8 | 31.6 |
Developed International Equity Funds | | |
VIP Overseas Portfolio Investor Class R | 8.1 | 9.6 |
Emerging Markets Equity Funds | | |
VIP Emerging Markets Portfolio Investor Class R | 1.9 | 1.6 |
High Yield Bond Funds | | |
VIP High Income Portfolio Investor Class | 5.1 | 5.0 |
Investment Grade Bond Funds | | |
VIP Investment Grade Bond Portfolio Investor Class | 39.1 | 37.3 |
Short-Term Funds | | |
VIP Money Market Portfolio Investor Class | 15.0 | 14.9 |
Net Other Assets (Liabilities)* | 0.0 | 0.0 |
| 100.0 | 100.0 |
* Amount represents less than 0.1% |
Asset Allocation (% of fund's net assets) |
Current |
| Domestic Equity Funds | 30.8% | |
| Developed International Equity Funds | 8.1% | |
 | Emerging Markets
Equity Funds | 1.9% | |
 | High Yield Bond Funds | 5.1% | |
| Investment Grade Bond Funds | 39.1% | |
| Short-Term Funds | 15.0% | |

Six months ago |
| Domestic Equity Funds | 31.6% | |
| Developed International Equity Funds | 9.6% | |
| Emerging Markets
Equity Funds | 1.6% | |
| High Yield Bond Funds | 5.0% | |
| Investment Grade Bond Funds | 37.3% | |
| Short-Term Funds | 14.9% | |

Expected |
| Domestic Equity Funds | 29.2% | |
| Developed International Equity Funds | 9.0% | |
| Emerging Markets
Equity Funds | 1.6% | |
| High Yield Bond Funds | 5.0% | |
| Investment Grade Bond Funds | 40.2% | |
| Short-Term Funds | 15.0% | |

The fund invests according to an asset allocation strategy that becomes increasingly conservative over time. The six months ago allocation is based on the fund's holdings as of June 30, 2011. The current allocation is based on the fund's holdings as of December 31, 2011. The expected allocation represents the fund's anticipated allocation at June 30, 2012. |
Annual Report
VIP Freedom Lifetime Income I Portfolio
Investments December 31, 2011
Showing Percentage of Net Assets
Domestic Equity Funds - 30.8% |
| Shares | | Value |
Domestic Equity Funds - 30.8% |
VIP Contrafund Portfolio Investor Class | 22,578 | | $ 517,939 |
VIP Equity-Income Portfolio Investor Class | 33,231 | | 619,417 |
VIP Growth & Income Portfolio Investor Class | 49,888 | | 626,591 |
VIP Growth Portfolio Investor Class | 16,317 | | 600,629 |
VIP Mid Cap Portfolio Investor Class | 7,124 | | 206,606 |
VIP Value Portfolio Investor Class | 49,917 | | 528,625 |
VIP Value Strategies Portfolio Investor Class | 24,388 | | 213,150 |
TOTAL DOMESTIC EQUITY FUNDS (Cost $3,933,492) |
3,312,957
|
International Equity Funds - 10.0% |
| | | |
Developed International Equity Funds - 8.1% |
VIP Overseas Portfolio Investor Class R | 64,175 | | 872,143 |
Emerging Markets Equity Funds - 1.9% |
VIP Emerging Markets Portfolio Investor Class R | 26,331 | | 203,274 |
TOTAL INTERNATIONAL EQUITY FUNDS (Cost $1,447,859) |
1,075,417
|
Bond Funds - 44.2% |
| Shares | | Value |
High Yield Bond Funds - 5.1% |
VIP High Income Portfolio Investor Class | 102,252 | | $ 549,091 |
Investment Grade Bond Funds - 39.1% |
VIP Investment Grade Bond Portfolio Investor Class | 324,944 | | 4,201,523 |
TOTAL BOND FUNDS (Cost $4,746,887) |
4,750,614
|
Short-Term Funds - 15.0% |
| | | |
VIP Money Market Portfolio Investor Class
(Cost $1,607,780) | 1,607,780 | |
1,607,780
|
TOTAL INVESTMENT PORTFOLIO - 100.0% (Cost $11,736,018) | | 10,746,768 |
NET OTHER ASSETS (LIABILITIES) - 0.0% | | 6 |
NET ASSETS - 100% | $ 10,746,774 |
Other Information |
All investments are categorized as Level 1 under the Fair Value Hierarchy. The inputs or methodology used for valuing securities may not be an indication of the risk associated with investing in those securities. For more information on valuation inputs, please refer to the Security Valuation section in the accompanying Notes to Financial Statements. |
See accompanying notes which are an integral part of the financial statements.
Annual Report
VIP Freedom Lifetime Income I Portfolio
Statement of Assets and Liabilities
| December 31, 2011 |
| | |
Assets | | |
Investment in securities, at value (cost $11,736,018) - See accompanying schedule | | $ 10,746,768 |
Receivable for investments sold | | 183 |
Total assets | | 10,746,951 |
| | |
Liabilities | | |
Payable for fund shares redeemed | | 177 |
| | |
Net Assets | | $ 10,746,774 |
Net Assets consist of: | | |
Paid in capital | | $ 11,725,734 |
Accumulated undistributed net realized gain (loss) on investments | | 10,290 |
Net unrealized appreciation (depreciation) on investments | | (989,250) |
Net Assets, for 1,114,159 shares outstanding | | $ 10,746,774 |
Net Asset Value, offering price and redemption price per share ($10,746,774 ÷ 1,114,159 shares) | | $ 9.65 |
Statement of Operations
| Year ended December 31, 2011 |
| | |
Investment Income | | |
Income distributions from underlying funds | | $ 231,643 |
| | |
Expenses | | |
Independent trustees' compensation | $ 37 | |
Total expenses before reductions | 37 | |
Expense reductions | (37) | 0 |
Net investment income (loss) | | 231,643 |
Realized and Unrealized Gain (Loss) Realized gain (loss) on sale of underlying fund shares | 24,219 | |
Capital gain distributions from underlying funds | 106,219 | |
Total net realized gain (loss) | | 130,438 |
Change in net unrealized appreciation (depreciation) on underlying funds | | (302,019) |
Net gain (loss) | | (171,581) |
Net increase (decrease) in net assets resulting from operations | | $ 60,062 |
See accompanying notes which are an integral part of the financial statements.
Annual Report
Statement of Changes in Net Assets
| Year ended
December 31, 2011 | Year ended
December 31, 2010 |
Increase (Decrease) in Net Assets | | |
Operations | | |
Net investment income (loss) | $ 231,643 | $ 212,825 |
Net realized gain (loss) | 130,438 | 110,224 |
Change in net unrealized appreciation (depreciation) | (302,019) | 753,750 |
Net increase (decrease) in net assets resulting from operations | 60,062 | 1,076,799 |
Distributions to shareholders from net investment income | (231,878) | (222,558) |
Distributions to shareholders from net realized gain | (68,922) | (110,575) |
Total distributions | (300,800) | (333,133) |
Share transactions
Proceeds from sales of shares | 1,633,322 | 1,364,399 |
Reinvestment of distributions | 300,800 | 333,133 |
Cost of shares redeemed | (1,291,500) | (869,595) |
Net increase (decrease) in net assets resulting from share transactions | 642,622 | 827,937 |
Total increase (decrease) in net assets | 401,884 | 1,571,603 |
| | |
Net Assets | | |
Beginning of period | 10,344,890 | 8,773,287 |
End of period | $ 10,746,774 | $ 10,344,890 |
Other Information Shares | | |
Sold | 165,152 | 143,545 |
Issued in reinvestment of distributions | 31,148 | 33,844 |
Redeemed | (129,343) | (91,110) |
Net increase (decrease) | 66,957 | 86,279 |
Financial Highlights
Years ended December 31, | 2011 | 2010 | 2009 | 2008 | 2007 |
Selected Per-Share Data | | | | | |
Net asset value, beginning of period | $ 9.88 | $ 9.13 | $ 7.81 | $ 11.21 | $ 10.98 |
Income from Investment Operations | | | | | |
Net investment income (loss)C | .22 | .21 | .36 | .33 | .36 |
Net realized and unrealized gain (loss) | (.17) | .87 | 1.40 | (2.85) | .53 |
Total from investment operations | .05 | 1.08 | 1.76 | (2.52) | .89 |
Distributions from net investment income | (.21) | (.22) | (.36) | (.37) | (.34) |
Distributions from net realized gain | (.06) | (.11) | (.08) | (.51) | (.32) |
Total distributions | (.28)G | (.33) | (.44) | (.88) | (.66) |
Net asset value, end of period | $ 9.65 | $ 9.88 | $ 9.13 | $ 7.81 | $ 11.21 |
Total ReturnA,B | .48% | 11.84% | 22.76% | (22.68)% | 8.16% |
Ratios to Average Net AssetsD,F | | | | | |
Expenses before reductionsE | .00% | .00% | .00% | .00% | .00% |
Expenses net of fee waivers, if any | .00% | .00% | .00% | .00% | .00% |
Expenses net of all reductions | .00% | .00% | .00% | .00% | .00% |
Net investment income (loss) | 2.25% | 2.26% | 4.28% | 3.31% | 3.15% |
Supplemental Data | | | | | |
Net assets, end of period (000 omitted) | $ 10,747 | $ 10,345 | $ 8,773 | $ 7,648 | $ 12,533 |
Portfolio turnover rate | 17% | 26% | 20% | 25% | 16% |
A Total returns do not reflect charges attributable to your insurance company's separate account. Inclusion of these charges would reduce the total returns shown.
B Total returns would have been lower if certain expenses had not been reduced during the applicable periods shown.
C Calculated based on average shares outstanding during the period.
D Amounts do not include the activity of the Underlying Funds.
E Amount represents less than .01%.
F Expense ratios reflect operating expenses of the Fund. Expenses before reductions do not reflect amounts reimbursed by the investment adviser or reductions from expense offset arrangements and do not represent the amount paid by the Fund during periods when reimbursements or reductions occur. Expenses net of fee waivers reflect expenses after reimbursement by the investment adviser but prior to reductions from expense offset arrangements. Expenses net of all reductions represent the net expenses paid by the Fund but do not include expenses of the investment companies in which the Fund invests.
G Total distributions of $.28 per share is comprised of distributions from net investment income of $.214 and distributions from net realized gain of $.064 per share.
See accompanying notes which are an integral part of the financial statements.
Annual Report
VIP Freedom Lifetime Income II Portfolio
Investment Changes (Unaudited)
Fund Holdings as of December 31, 2011 |
| % of fund's
net assets | % of fund's net assets
6 months ago |
Domestic Equity Funds | | |
VIP Contrafund Portfolio Investor Class | 5.5 | 5.6 |
VIP Equity-Income Portfolio Investor Class | 6.6 | 6.6 |
VIP Growth & Income Portfolio Investor Class | 6.7 | 6.6 |
VIP Growth Portfolio Investor Class | 6.4 | 6.7 |
VIP Mid Cap Portfolio Investor Class | 2.2 | 2.3 |
VIP Value Portfolio Investor Class | 5.6 | 5.6 |
VIP Value Strategies Portfolio Investor Class | 2.3 | 2.4 |
| 35.3 | 35.8 |
Developed International Equity Funds | | |
VIP Overseas Portfolio Investor Class R | 9.3 | 10.9 |
Emerging Markets Equity Funds | | |
VIP Emerging Markets Portfolio Investor Class R | 2.1 | 1.9 |
High Yield Bond Funds | | |
VIP High Income Portfolio Investor Class | 5.4 | 5.3 |
Investment Grade Bond Funds | | |
VIP Investment Grade Bond Portfolio Investor Class | 39.3 | 37.8 |
Short-Term Funds | | |
VIP Money Market Portfolio Investor Class | 8.6 | 8.3 |
Net Other Assets (Liabilities)* | 0.0 | 0.0 |
| 100.0 | 100.0 |
* Amount represents less than 0.1% |
Asset Allocation (% of fund's net assets) |
Current |
| Domestic Equity Funds | 35.3% | |
| Developed International Equity Funds | 9.3% | |
| Emerging Markets Equity Funds | 2.1% | |
| High Yield Bond Funds | 5.4% | |
| Investment Grade Bond Funds | 39.3% | |
| Short-Term Funds | 8.6% | |

Six months ago |
| Domestic Equity Funds | 35.8% | |
| Developed International Equity Funds | 10.9% | |
| Emerging Markets Equity Funds | 1.9% | |
| High Yield Bond Funds | 5.3% | |
| Investment Grade Bond Funds | 37.8% | |
| Short-Term Funds | 8.3% | |

Expected |
| Domestic Equity Funds | 34.1% | |
| Developed International Equity Funds | 10.6% | |
| Emerging Markets Equity Funds | 1.8% | |
| High Yield Bond Funds | 5.1% | |
| Investment Grade Bond Funds | 39.2% | |
| Short-Term Funds | 9.2% | |

The fund invests according to an asset allocation strategy that becomes increasingly conservative over time. The six months ago allocation is based on the fund's holdings as of June 30, 2011. The current allocation is based on the fund's holdings as of December 31, 2011. The expected allocation represents the fund's anticipated allocation at June 30, 2012. |
Annual Report
VIP Freedom Lifetime Income II Portfolio
Investments December 31, 2011
Showing Percentage of Net Assets
Domestic Equity Funds - 35.3% |
| Shares | | Value |
Domestic Equity Funds - 35.3% |
VIP Contrafund Portfolio Investor Class | 39,863 | | $ 914,447 |
VIP Equity-Income Portfolio Investor Class | 58,709 | | 1,094,327 |
VIP Growth & Income Portfolio Investor Class | 88,217 | | 1,108,003 |
VIP Growth Portfolio Investor Class | 28,858 | | 1,062,270 |
VIP Mid Cap Portfolio Investor Class | 12,612 | | 365,761 |
VIP Value Portfolio Investor Class | 88,197 | | 934,010 |
VIP Value Strategies Portfolio Investor Class | 43,060 | | 376,341 |
TOTAL DOMESTIC EQUITY FUNDS (Cost $7,147,167) |
5,855,159
|
International Equity Funds - 11.4% |
| | | |
Developed International Equity Funds - 9.3% |
VIP Overseas Portfolio Investor Class R | 113,270 | | 1,539,343 |
Emerging Markets Equity Funds - 2.1% |
VIP Emerging Markets Portfolio Investor Class R | 46,439 | | 358,513 |
TOTAL INTERNATIONAL EQUITY FUNDS (Cost $2,726,669) |
1,897,856
|
Bond Funds - 44.7% |
| Shares | | Value |
High Yield Bond Funds - 5.4% |
VIP High Income Portfolio Investor Class | 165,324 | | $ 887,789 |
Investment Grade Bond Funds - 39.3% |
VIP Investment Grade Bond Portfolio Investor Class | 504,245 | | 6,519,891 |
TOTAL BOND FUNDS (Cost $7,387,689) |
7,407,680
|
Short-Term Funds - 8.6% |
| | | |
VIP Money Market Portfolio Investor Class
(Cost $1,432,847) | 1,432,847 | |
1,432,847
|
TOTAL INVESTMENT PORTFOLIO - 100.0% (Cost $18,694,372) | | 16,593,542 |
NET OTHER ASSETS (LIABILITIES) - 0.0% | | 5 |
NET ASSETS - 100% | $ 16,593,547 |
Other Information |
All investments are categorized as Level 1 under the Fair Value Hierarchy. The inputs or methodology used for valuing securities may not be an indication of the risk associated with investing in those securities. For more information on valuation inputs, please refer to the Security Valuation section in the accompanying Notes to Financial Statements. |
See accompanying notes which are an integral part of the financial statements.
Annual Report
VIP Freedom Lifetime Income II Portfolio
Statement of Assets and Liabilities
| December 31, 2011 |
| | |
Assets | | |
Investment in securities, at value (cost $18,694,372) - See accompanying schedule | | $ 16,593,542 |
Cash | | 1 |
Receivable for investments sold | | 280 |
Total assets | | 16,593,823 |
| | |
Liabilities | | |
Payable for fund shares redeemed | | 276 |
| | |
Net Assets | | $ 16,593,547 |
Net Assets consist of: | | |
Paid in capital | | $ 19,553,327 |
Accumulated undistributed net realized gain (loss) on investments | | (858,950) |
Net unrealized appreciation (depreciation) on investments | | (2,100,830) |
Net Assets, for 1,738,371 shares outstanding | | $ 16,593,547 |
Net Asset Value, offering price and redemption price per share ($16,593,547 ÷ 1,738,371 shares) | | $ 9.55 |
Statement of Operations
| Year ended December 31, 2011 |
| | |
Investment Income | | |
Income distributions from underlying funds | | $ 371,217 |
| | |
Expenses | | |
Independent trustees' compensation | $ 57 | |
Total expenses before reductions | 57 | |
Expense reductions | (57) | 0 |
Net investment income (loss) | | 371,217 |
Realized and Unrealized Gain (Loss) Realized gain (loss) on sale of underlying fund shares | (13,136) | |
Capital gain distributions from underlying funds | 167,048 | |
Total net realized gain (loss) | | 153,912 |
Change in net unrealized appreciation (depreciation) on underlying funds | | (516,144) |
Net gain (loss) | | (362,232) |
Net increase (decrease) in net assets resulting from operations | | $ 8,985 |
See accompanying notes which are an integral part of the financial statements.
Annual Report
Statement of Changes in Net Assets
| Year ended
December 31, 2011 | Year ended
December 31, 2010 |
Increase (Decrease) in Net Assets | | |
Operations | | |
Net investment income (loss) | $ 371,217 | $ 314,795 |
Net realized gain (loss) | 153,912 | (234,213) |
Change in net unrealized appreciation (depreciation) | (516,144) | 1,664,188 |
Net increase (decrease) in net assets resulting from operations | 8,985 | 1,744,770 |
Distributions to shareholders from net investment income | (372,166) | (312,980) |
Distributions to shareholders from net realized gain | (74,433) | (73,409) |
Total distributions | (446,599) | (386,389) |
Share transactions
Proceeds from sales of shares | 3,096,734 | 407,181 |
Reinvestment of distributions | 446,599 | 386,389 |
Cost of shares redeemed | (1,149,414) | (1,687,084) |
Net increase (decrease) in net assets resulting from share transactions | 2,393,919 | (893,514) |
Total increase (decrease) in net assets | 1,956,305 | 464,867 |
| | |
Net Assets | | |
Beginning of period | 14,637,242 | 14,172,375 |
End of period | $ 16,593,547 | $ 14,637,242 |
Other Information Shares | | |
Sold | 312,697 | 44,625 |
Issued in reinvestment of distributions | 46,764 | 39,603 |
Redeemed | (115,460) | (182,338) |
Net increase (decrease) | 244,001 | (98,110) |
Financial Highlights
Years ended December 31, | 2011 | 2010 | 2009 | 2008 | 2007 |
Selected Per-Share Data | | | | | |
Net asset value, beginning of period | $ 9.79 | $ 8.90 | $ 7.42 | $ 11.68 | $ 11.36 |
Income from Investment Operations | | | | | |
Net investment income (loss)C | .23 | .21 | .34 | .29 | .32 |
Net realized and unrealized gain (loss) | (.21) | .95 | 1.59 | (3.57) | .77 |
Total from investment operations | .02 | 1.16 | 1.93 | (3.28) | 1.09 |
Distributions from net investment income | (.22) | (.22) | (.36) | (.34) | (.30) |
Distributions from net realized gain | (.04) | (.05) | (.09) | (.64) | (.48) |
Total distributions | (.26) | (.27) | (.45) | (.98) | (.77) G |
Net asset value, end of period | $ 9.55 | $ 9.79 | $ 8.90 | $ 7.42 | $ 11.68 |
Total ReturnA,B | .25% | 12.99% | 26.44% | (28.49)% | 9.67% |
Ratios to Average Net AssetsD,F | | | | | |
Expenses before reductionsE | .00% | .00% | .00% | .00% | .00% |
Expenses net of fee waivers, if any | .00% | .00% | .00% | .00% | .00% |
Expenses net of all reductions | .00% | .00% | .00% | .00% | .00% |
Net investment income (loss) | 2.33% | 2.22% | 4.25% | 2.91% | 2.67% |
Supplemental Data | | | | | |
Net assets, end of period (000 omitted) | $ 16,594 | $ 14,637 | $ 14,172 | $ 12,892 | $ 22,701 |
Portfolio turnover rate | 12% | 23% | 21% | 25% | 18% |
A Total returns do not reflect charges attributable to your insurance company's separate account. Inclusion of these charges would reduce the total returns shown.
B Total returns would have been lower if certain expenses had not been reduced during the applicable periods shown.
C Calculated based on average shares outstanding during the period.
D Amounts do not include the activity of the Underlying Funds.
E Amount represents less than .01%.
F Expense ratios reflect operating expenses of the Fund. Expenses before reductions do not reflect amounts reimbursed by the investment adviser or reductions from expense offset arrangements and do not represent the amount paid by the Fund during periods when reimbursements or reductions occur. Expenses net of fee waivers reflect expenses after reimbursement by the investment adviser but prior to reductions from expense offset arrangements. Expenses net of all reductions represent the net expenses paid by the Fund but do not include expenses of the investment companies in which the Fund invests.
G Total distributions of $.77 per share is comprised of distributions from net investment income of $.295 and distributions from net realized gain of $.475 per share.
See accompanying notes which are an integral part of the financial statements.
Annual Report
VIP Freedom Lifetime Income III Portfolio
Investment Changes (Unaudited)
Fund Holdings as of December 31, 2011 |
| % of fund's
net assets | % of fund's net assets
6 months ago |
Domestic Equity Funds | | |
VIP Contrafund Portfolio Investor Class | 8.2 | 8.2 |
VIP Equity-Income Portfolio Investor Class | 9.8 | 9.6 |
VIP Growth & Income Portfolio Investor Class | 9.9 | 9.5 |
VIP Growth Portfolio Investor Class | 9.5 | 9.7 |
VIP Mid Cap Portfolio Investor Class | 3.2 | 3.3 |
VIP Value Portfolio Investor Class | 8.3 | 8.2 |
VIP Value Strategies Portfolio Investor Class | 3.3 | 3.4 |
| 52.2 | 51.9 |
Developed International Equity Funds | | |
VIP Overseas Portfolio Investor Class R | 13.7 | 15.9 |
Emerging Markets Equity Funds | | |
VIP Emerging Markets Portfolio Investor Class R | 3.2 | 2.7 |
High Yield Bond Funds | | |
VIP High Income Portfolio Investor Class | 7.8 | 7.5 |
Investment Grade Bond Funds | | |
VIP Investment Grade Bond Portfolio Investor Class | 23.1 | 22.0 |
Net Other Assets (Liabilities)* | 0.0 | 0.0 |
| 100.0 | 100.0 |
* Amount represents less than 0.1% |
Asset Allocation (% of fund's net assets) |
Current |
| Domestic Equity Funds | 52.2% | |
 | Developed International Equity Funds | 13.7% | |
| Emerging Markets Equity Funds | 3.2% | |
 | High Yield Bond Funds | 7.8% | |
| Investment Grade Bond Funds | 23.1% | |

Six months ago |
| Domestic Equity Funds | 51.9% | |
| Developed International Equity Funds | 15.9% | |
| Emerging Markets Equity Funds | 2.7% | |
| High Yield Bond Funds | 7.5% | |
| Investment Grade Bond Funds | 22.0% | |

Expected |
| Domestic Equity Funds | 51.3% | |
| Developed International Equity Funds | 15.9% | |
| Emerging Markets Equity Funds | 2.8% | |
| High Yield Bond Funds | 7.5% | |
| Investment Grade Bond Funds | 22.5% | |

The fund invests according to an asset allocation strategy that becomes increasingly conservative over time. The six months ago allocation is based on the fund's holdings as of June 30, 2011. The current allocation is based on the fund's holdings as of December 31, 2011. The expected allocation represents the fund's anticipated allocation at June 30, 2012. |
Annual Report
VIP Freedom Lifetime Income III Portfolio
Investments December 31, 2011
Showing Percentage of Net Assets
Domestic Equity Funds - 52.2% |
| Shares | | Value |
Domestic Equity Funds - 52.2% |
VIP Contrafund Portfolio Investor Class | 24,294 | | $ 557,294 |
VIP Equity-Income Portfolio Investor Class | 35,744 | | 666,271 |
VIP Growth & Income Portfolio Investor Class | 53,726 | | 674,801 |
VIP Growth Portfolio Investor Class | 17,576 | | 646,966 |
VIP Mid Cap Portfolio Investor Class | 7,663 | | 222,239 |
VIP Value Portfolio Investor Class | 53,675 | | 568,419 |
VIP Value Strategies Portfolio Investor Class | 26,147 | | 228,523 |
TOTAL DOMESTIC EQUITY FUNDS (Cost $4,281,405) |
3,564,513
|
International Equity Funds - 16.9% |
| | | |
Developed International Equity Funds - 13.7% |
VIP Overseas Portfolio Investor Class R | 68,938 | | 936,863 |
Emerging Markets Equity Funds - 3.2% |
VIP Emerging Markets Portfolio Investor Class R | 27,734 | | 214,103 |
TOTAL INTERNATIONAL EQUITY FUNDS (Cost $1,619,452) |
1,150,966
|
Bond Funds - 30.9% |
| Shares | | Value |
High Yield Bond Funds - 7.8% |
VIP High Income Portfolio Investor Class | 98,501 | | $ 528,951 |
Investment Grade Bond Funds - 23.1% |
VIP Investment Grade Bond Portfolio Investor Class | 122,167 | | 1,579,615 |
TOTAL BOND FUNDS (Cost $2,148,091) |
2,108,566
|
TOTAL INVESTMENT PORTFOLIO - 100.0% (Cost $8,048,948) | | 6,824,045 |
NET OTHER ASSETS (LIABILITIES) - 0.0% | | (3) |
NET ASSETS - 100% | $ 6,824,042 |
Other Information |
All investments are categorized as Level 1 under the Fair Value Hierarchy. The inputs or methodology used for valuing securities may not be an indication of the risk associated with investing in those securities. For more information on valuation inputs, please refer to the Security Valuation section in the accompanying Notes to Financial Statements. |
See accompanying notes which are an integral part of the financial statements.
Annual Report
VIP Freedom Lifetime Income III Portfolio
Statement of Assets and Liabilities
| December 31, 2011 |
| | |
Assets | | |
Investment in securities, at value (cost $8,048,948) - See accompanying schedule | | $ 6,824,045 |
Receivable for investments sold | | 113 |
Total assets | | 6,824,158 |
| | |
Liabilities | | |
Payable to custodian bank | $ 1 | |
Payable for fund shares redeemed | 115 | |
Total liabilities | | 116 |
| | |
Net Assets | | $ 6,824,042 |
Net Assets consist of: | | |
Paid in capital | | $ 8,200,308 |
Accumulated undistributed net realized gain (loss) on investments | | (151,363) |
Net unrealized appreciation (depreciation) on investments | | (1,224,903) |
Net Assets, for 764,709 shares outstanding | | $ 6,824,042 |
Net Asset Value, offering price and redemption price per share ($6,824,042 ÷ 764,709 shares) | | $ 8.92 |
Statement of Operations
| Year ended December 31, 2011 |
| | |
Investment Income | | |
Income distributions from underlying funds | | $ 149,218 |
| | |
Expenses | | |
Independent trustees' compensation | $ 25 | |
Total expenses before reductions | 25 | |
Expense reductions | (25) | 0 |
Net investment income (loss) | | 149,218 |
Realized and Unrealized Gain (Loss) Realized gain (loss) on sale of underlying fund shares | (21,794) | |
Capital gain distributions from underlying funds | 45,672 | |
Total net realized gain (loss) | | 23,878 |
Change in net unrealized appreciation (depreciation) on underlying funds | | (324,508) |
Net gain (loss) | | (300,630) |
Net increase (decrease) in net assets resulting from operations | | $ (151,412) |
See accompanying notes which are an integral part of the financial statements.
Annual Report
Statement of Changes in Net Assets
| Year ended
December 31, 2011 | Year ended
December 31, 2010 |
Increase (Decrease) in Net Assets | | |
Operations | | |
Net investment income (loss) | $ 149,218 | $ 131,619 |
Net realized gain (loss) | 23,878 | (82,518) |
Change in net unrealized appreciation (depreciation) | (324,508) | 919,548 |
Net increase (decrease) in net assets resulting from operations | (151,412) | 968,649 |
Distributions to shareholders from net investment income | (149,868) | (133,615) |
Distributions to shareholders from net realized gain | (20,877) | (29,512) |
Total distributions | (170,745) | (163,127) |
Share transactions
Proceeds from sales of shares | 1,044,709 | 87,477 |
Reinvestment of distributions | 170,745 | 163,127 |
Cost of shares redeemed | (809,829) | (945,584) |
Net increase (decrease) in net assets resulting from share transactions | 405,625 | (694,980) |
Total increase (decrease) in net assets | 83,468 | 110,542 |
| | |
Net Assets | | |
Beginning of period | 6,740,574 | 6,630,032 |
End of period | $ 6,824,042 | $ 6,740,574 |
Other Information Shares | | |
Sold | 111,015 | 9,419 |
Issued in reinvestment of distributions | 19,120 | 17,634 |
Redeemed | (84,793) | (108,174) |
Net increase (decrease) | 45,342 | (81,121) |
Financial Highlights
Years ended December 31, | 2011 | 2010 | 2009 | 2008 | 2007 |
Selected Per-Share Data | | | | | |
Net asset value, beginning of period | $ 9.37 | $ 8.28 | $ 6.72 | $ 11.90 | $ 11.56 |
Income from Investment Operations | | | | | |
Net investment income (loss)C | .20 | .18 | .24 | .24 | .29 |
Net realized and unrealized gain (loss) | (.42) | 1.14 | 1.76 | (4.36) | .96 |
Total from investment operations | (.22) | 1.32 | 2.00 | (4.12) | 1.25 |
Distributions from net investment income | (.20) | (.19) | (.26) | (.27) | (.29) |
Distributions from net realized gain | (.03) | (.04) | (.18) | (.79) | (.62) |
Total distributions | (.23) | (.23) | (.44) | (1.06) | (.91) |
Net asset value, end of period | $ 8.92 | $ 9.37 | $ 8.28 | $ 6.72 | $ 11.90 |
Total ReturnA,B | (2.36)% | 15.98% | 30.34% | (35.25)% | 10.88% |
Ratios to Average Net AssetsD,F | | | | | |
Expenses before reductionsE | .00% | .00% | .00% | .00% | .00% |
Expenses net of fee waivers, if any | .00% | .00% | .00% | .00% | .00% |
Expenses net of all reductions | .00% | .00% | .00% | .00% | .00% |
Net investment income (loss) | 2.13% | 2.03% | 3.33% | 2.43% | 2.41% |
Supplemental Data | | | | | |
Net assets, end of period (000 omitted) | $ 6,824 | $ 6,741 | $ 6,630 | $ 5,419 | $ 11,085 |
Portfolio turnover rate | 16% | 20% | 10% | 20% | 11% |
A Total returns do not reflect charges attributable to your insurance company's separate account. Inclusion of these charges would reduce the total returns shown.
B Total returns would have been lower if certain expenses had not been reduced during the applicable periods shown.
C Calculated based on average shares outstanding during the period.
D Amounts do not include the activity of the Underlying Funds.
E Amount represents less than .01%.
F Expense ratios reflect operating expenses of the Fund. Expenses before reductions do not reflect amounts reimbursed by the investment adviser or reductions from expense offset arrangements and do not represent the amount paid by the Fund during periods when reimbursements or reductions occur. Expenses net of fee waivers reflect expenses after reimbursement by the investment adviser but prior to reductions from expense offset arrangements. Expenses net of all reductions represent the net expenses paid by the Fund but do not include expenses of the investment companies in which the Fund invests.
See accompanying notes which are an integral part of the financial statements.
Annual Report
Notes to Financial Statements
For the period ended December 31, 2011
1. Organization.
VIP Freedom Lifetime Income I Portfolio, VIP Freedom Lifetime Income II Portfolio, and VIP Freedom Lifetime Income III Portfolio (the Funds) are funds of Variable Insurance Products Fund V. The Variable Insurance Products Fund V (the Trust) (referred to in this report as Fidelity Variable Insurance Products) is registered under the Investment Company Act of 1940, as amended (the 1940 Act), as an open-end management investment company organized as a Massachusetts business trust. Each Fund is authorized to issue an unlimited number of shares. The Funds invest primarily in a combination of other VIP equity, bond, and short-term funds (the Underlying Funds) managed by Fidelity Management & Research Company (FMR). Shares of each Fund may only be purchased by insurance companies for the purpose of funding variable annuity or variable life insurance contracts.
2. Significant Accounting Policies.
The financial statements have been prepared in conformity with accounting principles generally accepted in the United States of America (GAAP), which require management to make certain estimates and assumptions at the date of the financial statements. Actual results could differ from those estimates. Subsequent events, if any, through the date that the financial statements were issued have been evaluated in the preparation of the financial statements. The following summarizes the significant accounting policies of the Funds:
Security Valuation. Investments are valued as of 4:00 p.m. Eastern time on the last calendar day of the period. Each Fund categorizes the inputs to valuation techniques used to value their investments into a disclosure hierarchy consisting of three levels as shown below:
Level 1 - quoted prices in active markets for identical investments
Level 2 - other significant observable inputs (including quoted prices for similar investments, interest rates, prepayment speeds, etc.)
Level 3 - unobservable inputs (including the Fund's own assumptions based on the best information available)
Valuation techniques used to value each Fund's investments by major category are as follows. Investments in the Underlying Funds are valued at their closing net asset value (NAV) each business day and are categorized as Level 1 in the hierarchy.
Investment Transactions and Income. For financial reporting purposes, the Funds' investment holdings and NAV include trades executed through the end of the last business day of the period. The NAV per share for processing shareholder transactions is calculated as of the close of business of the New York Stock Exchange (NYSE), normally 4:00 p.m. Eastern time and includes trades executed through the end of the prior business day. Gains and losses on securities sold are determined on the basis of identified cost. Income and capital gain distributions from the Underlying Funds, if any, are recorded on the ex-dividend date.
Expenses. Expenses directly attributable to a fund are charged to that fund. Expenses attributable to more than one fund are allocated among the respective funds on the basis of relative net assets or other appropriate methods. Expenses included in the accompanying financial statements reflect the expenses of the Fund and do not include any expenses associated with the Underlying Funds. Expense estimates are accrued in the period to which they relate and adjustments are made when actual amounts are known.
Income Tax Information and Distributions to Shareholders. Each year, each Fund intends to qualify as a regulated investment company, including distributing substantially all of its taxable income and realized gains under Subchapter M of the Internal Revenue Code. As a result, no provision for income taxes is required. As of December 31, 2011, each Fund did not have any unrecognized tax benefits in the financial statements; nor is each Fund aware of any tax positions for which it is reasonably possible that the total amounts of unrecognized tax benefits will significantly change in the next twelve months. Each Fund files a U.S. federal tax return, in addition to state and local tax returns as required. A fund's tax returns are subject to examination by the Internal Revenue Service (IRS) for a period of three fiscal years. State and local tax returns may be subject to examination for an additional fiscal year depending on the jurisdiction.
Distributions are declared and recorded on the ex-dividend date. Income and capital gain distributions are determined in accordance with income tax regulations, which may differ from GAAP.
Capital accounts within the financial statements are adjusted for permanent book-tax differences. These adjustments have no impact on net assets or the results of operations. Temporary book-tax differences will reverse in a subsequent period.
Book-tax differences are primarily due to the short-term gain distributions from the Underlying Funds, capital loss carryforwards and losses deferred due to wash sales and excise tax regulations.
Annual Report
Notes to Financial Statements - continued
2. Significant Accounting Policies - continued
Income Tax Information and Distributions to Shareholders - continued
The federal tax cost of investment securities and unrealized appreciation (depreciation) as of period end were as follows for each Fund:
| Tax cost | Gross unrealized appreciation | Gross unrealized depreciation | Net unrealized
appreciation
(depreciation) on securities and other investments |
VIP Freedom Lifetime Income I | $ 11,788,706 | $ 167,421 | $ (1,209,359) | $ (1,041,938) |
VIP Freedom Lifetime Income II | 18,841,405 | 240,179 | (2,488,042) | (2,247,863) |
VIP Freedom Lifetime Income III | 8,117,231 | 119,483 | (1,412,669) | (1,293,186) |
The tax-based components of distributable earnings as of period end were as follows for each Fund:
| Undistributed
ordinary
income | Undistributed long-term
capital gain | Capital loss
carryforward | Net unrealized
appreciation
(depreciation) |
VIP Freedom Lifetime Income I | $ 1,403 | $ 61,575 | $ - | $ (1,041,938) |
VIP Freedom Lifetime Income II | - | - | (711,917) | (2,247,863) |
VIP Freedom Lifetime Income III | - | - | (83,080) | (1,293,186) |
Capital loss carryforwards are only available to offset future capital gains of the Funds to the extent provided by regulations and may be limited. Under the Regulated Investment Company Modernization Act of 2010 (the Act), the Fund is permitted to carry forward capital losses incurred in taxable years beginning after December 22, 2010 for an unlimited period and such capital losses are required to be used prior to any losses that expire. Capital loss carryforwards were as follows:
| Fiscal year of expiration | |
| 2017 | 2018 | Total with
expiration |
VIP Freedom Lifetime Income II | $ (422,746) | $ (289,171) | $ (711,917) |
VIP Freedom Lifetime Income III | - | (83,080) | (83,080) |
The tax character of distributions paid was as follows:
December 31, 2011 | |
| Ordinary
Income |
VIP Freedom Lifetime Income I | $ 300,800 |
VIP Freedom Lifetime Income II | 446,599 |
VIP Freedom Lifetime Income III | 170,745 |
December 31, 2010 | | | |
| Ordinary
Income | Long-term
Capital Gains | Total |
VIP Freedom Lifetime Income I | $ 330,090 | $ 3,043 | $ 333,133 |
VIP Freedom Lifetime Income II | 386,389 | - | 386,389 |
VIP Freedom Lifetime Income III | 163,127 | - | 163,127 |
3. Purchases and Sales of Investments.
Purchases and redemptions of the Underlying Fund shares are noted in the table below.
| Purchases ($) | Redemptions ($) |
VIP Freedom Lifetime Income I | 2,408,400 | 1,728,727 |
VIP Freedom Lifetime Income II | 4,457,341 | 1,971,766 |
VIP Freedom Lifetime Income III | 1,535,497 | 1,105,729 |
Annual Report
4. Fees and Other Transactions with Affiliates.
Management Fee. Strategic Advisers, Inc. (Strategic Advisers), an affiliate of FMR, provides the Funds with investment management related services. The Funds do not pay any fees for these services.
Other Transactions. Strategic Advisers, Inc. (Strategic Advisers) has entered into an administration agreement with FMR under which FMR provides management and administrative services (other than investment advisory services) necessary for the operation of each Fund. Pursuant to this agreement, FMR pays all expenses of each Fund, excluding the compensation of the independent Trustees and certain other expenses such as interest expense. FMR also contracts with other Fidelity companies to perform the services necessary for the operation of each Fund. The Funds do not pay any fees for these services.
5. Expense Reductions.
FMR voluntarily agreed to reimburse Funds to the extent annual operating expenses exceeded certain levels of average net assets as noted in the table below. Some expenses, for example interest expense, are excluded from this reimbursement.
The following Funds were in reimbursement during the period:
| Expense
Limitations | Reimbursement
from adviser |
VIP Freedom Lifetime Income I | .00% | $ 37 |
VIP Freedom Lifetime Income II | .00% | $ 57 |
VIP Freedom Lifetime Income III | .00% | $ 25 |
6. Other.
The Funds' organizational documents provide former and current trustees and officers with a limited indemnification against liabilities arising in connection with the performance of their duties to the Funds. In the normal course of business, the Funds may also enter into contracts that provide general indemnifications. The Funds' maximum exposure under these arrangements is unknown as this would be dependent on future claims that may be made against the Funds. The risk of material loss from such claims is considered remote.
At the end of the period, FMR or its affiliates were owners of record of all of the outstanding shares of the Funds.
Annual Report
Report of Independent Registered Public Accounting Firm
To the Trustees of Variable Insurance Products Fund V and the Shareholders of VIP Freedom Lifetime Income I Portfolio, VIP Freedom Lifetime Income II Portfolio, VIP Freedom Lifetime Income III Portfolio:
We have audited the accompanying statements of assets and liabilities of VIP Freedom Lifetime Income I Portfolio, VIP Freedom Lifetime Income II Portfolio, VIP Freedom Lifetime Income III Portfolio (the Funds), each a fund of Variable Insurance Products Fund V, including the schedules of investments, as of December 31, 2011, and the related statements of operations for the year then ended, the statements of changes in net assets for each of the two years in the period then ended, and the financial highlights for each of the five years in the period then ended. These financial statements and financial highlights are the responsibility of the Funds' management. Our responsibility is to express an opinion on these financial statements and financial highlights based on our audits.
We conducted our audits in accordance with the standards of the Public Company Accounting Oversight Board (United States). Those standards require that we plan and perform the audit to obtain reasonable assurance about whether the financial statements and financial highlights are free of material misstatement. The Funds are not required to have, nor were we engaged to perform, an audit of their internal control over financial reporting. Our audits included consideration of internal control over financial reporting as a basis for designing audit procedures that are appropriate in the circumstances, but not for the purpose of expressing an opinion on the effectiveness of the Fund's internal control over financial reporting. Accordingly, we express no such opinion. An audit also includes examining, on a test basis, evidence supporting the amounts and disclosures in the financial statements, assessing the accounting principles used and significant estimates made by management, as well as evaluating the overall financial statement presentation. Our procedures included confirmation of securities owned as of December 31, 2011, by correspondence with the custodians. We believe that our audits provide a reasonable basis for our opinion.
In our opinion, the financial statements and financial highlights referred to above present fairly, in all material respects, the financial position of VIP Freedom Lifetime Income I Portfolio, VIP Freedom Lifetime Income II Portfolio, VIP Freedom Lifetime Income III Portfolio as of December 31, 2011, the results of their operations for the year then ended, the changes in their net assets for each of the two years in the period then ended, and their financial highlights for each of the five years in the period then ended, in conformity with accounting principles generally accepted in the United States of America.
/s/ Deloitte & Touche LLP
DELOITTE & TOUCHE LLP
Boston, Massachusetts
February 21, 2012
Annual Report
The Trustees and executive officers of the trust and funds, as applicable, are listed below. The Board of Trustees governs each VIP Freedom Lifetime Income Fund and is responsible for protecting the interests of shareholders. The Trustees are experienced executives who meet periodically throughout the year to oversee each VIP Freedom Lifetime Income Fund's activities, review contractual arrangements with companies that provide services to each VIP Freedom Lifetime Income Fund, oversee management of the risks associated with such activities and contractual arrangements, and review each VIP Freedom Lifetime Income Fund's performance. If the interests of a VIP Freedom Lifetime Income Fund and an underlying Fidelity fund were to diverge, a conflict of interest could arise and affect how the Trustees fulfill their fiduciary duties to the affected funds. Strategic Advisers has structured the VIP Freedom Lifetime Income Funds to avoid these potential conflicts, although there may be situations where a conflict of interest is unavoidable. In such instances, Strategic Advisers and the Trustees would take reasonable steps to minimize and, if possible, eliminate the conflict. Except for James C. Curvey, each of the Trustees oversees 203 funds advised by FMR or an affiliate. Mr. Curvey oversees 429 funds advised by FMR or an affiliate.
The Trustees hold office without limit in time except that (a) any Trustee may resign; (b) any Trustee may be removed by written instrument, signed by at least two-thirds of the number of Trustees prior to such removal; (c) any Trustee who requests to be retired or who has become incapacitated by illness or injury may be retired by written instrument signed by a majority of the other Trustees; and (d) any Trustee may be removed at any special meeting of shareholders by a two-thirds vote of the outstanding voting securities of the trust. Each Trustee who is not an interested person (as defined in the 1940 Act) (Independent Trustee), shall retire not later than the last day of the calendar year in which his or her 75th birthday occurs. The Independent Trustees may waive this mandatory retirement age policy with respect to individual Trustees. The executive officers hold office without limit in time, except that any officer may resign or may be removed by a vote of a majority of the Trustees at any regular meeting or any special meeting of the Trustees. Except as indicated, each individual has held the office shown or other offices in the same company for the past five years.
Experience, Skills, Attributes, and Qualifications of the Funds' Trustees. The Governance and Nominating Committee has adopted a statement of policy that describes the experience, qualifications, attributes, and skills that are necessary and desirable for potential Independent Trustee candidates (Statement of Policy). The Board believes that each Trustee satisfied at the time he or she was initially elected or appointed a Trustee, and continues to satisfy, the standards contemplated by the Statement of Policy. The Governance and Nominating Committee also engages professional search firms to help identify potential Independent Trustee candidates who have the experience, qualifications, attributes, and skills consistent with the Statement of Policy. From time to time, additional criteria based on the composition and skills of the current Independent Trustees, as well as experience or skills that may be appropriate in light of future changes to board composition, business conditions, and regulatory or other developments, have also been considered by the professional search firms and the Governance and Nominating Committee. In addition, the Board takes into account the Trustees' commitment and participation in Board and committee meetings, as well as their leadership of standing and ad hoc committees throughout their tenure.
In determining that a particular Trustee was and continues to be qualified to serve as a Trustee, the Board has considered a variety of criteria, none of which, in isolation, was controlling. The Board believes that, collectively, the Trustees have balanced and diverse experience, qualifications, attributes, and skills, which allow the Board to operate effectively in governing each fund and protecting the interests of shareholders. Information about the specific experience, skills, attributes, and qualifications of each Trustee, which in each case led to the Board's conclusion that the Trustee should serve (or continue to serve) as a trustee of the funds, is provided below.
Board Structure and Oversight Function. Abigail P. Johnson is an interested person (as defined in the 1940 Act) and currently serves as Chairman. The Trustees have determined that an interested Chairman is appropriate and benefits shareholders because an interested Chairman has a personal and professional stake in the quality and continuity of services provided to the funds. Independent Trustees exercise their informed business judgment to appoint an individual of their choosing to serve as Chairman, regardless of whether the Trustee happens to be independent or a member of management. The Independent Trustees have determined that they can act independently and effectively without having an Independent Trustee serve as Chairman and that a key structural component for assuring that they are in a position to do so is for the Independent Trustees to constitute a substantial majority for the Board. The Independent Trustees also regularly meet in executive session. Kenneth L. Wolfe serves as Chairman of the Independent Trustees and as such (i) acts as a liaison between the Independent Trustees and management with respect to matters important to the Independent Trustees and (ii) with management prepares agendas for Board meetings.
Fidelity funds are overseen by different Boards of Trustees. The funds' Board oversees Fidelity's investment-grade bond, money market, and asset allocation funds and another Board oversees Fidelity's equity and high income funds. The asset allocation funds may invest in Fidelity funds that are overseen by such other Board. The use of separate Boards, each with its own committee structure, allows the Trustees of each group of Fidelity funds to focus on the unique issues of the funds they oversee, including common research, investment, and operational issues. On occasion, the separate Boards establish joint committees to address issues of overlapping consequences for the Fidelity funds overseen by each Board.
The Trustees operate using a system of committees to facilitate the timely and efficient consideration of all matters of importance to the Trustees, each fund, and fund shareholders and to facilitate compliance with legal and regulatory requirements and oversight of the funds' activities and associated risks. The Board, acting through its committees, has charged FMR and its affiliates with (i) identifying events or circumstances the occurrence of which could have demonstrably adverse effects on the funds' business and/or reputation; (ii) implementing processes and controls to lessen the possibility that such events or circumstances occur or to mitigate the effects of such events or circumstances if they do occur; and (iii) creating and maintaining a system designed to evaluate continuously business and market conditions in order to facilitate the identification and implementation processes described in (i) and (ii) above. Because the day-to-day operations and activities of the funds are carried out by or through FMR, its affiliates and other service providers, the funds' exposure to risks is mitigated but not eliminated by the processes overseen by the Trustees. While each of the Board's committees has responsibility for overseeing different aspects of the funds' activities, oversight is exercised primarily through the Operations and Audit Committees. In addition, an ad hoc Board committee of Independent Trustees has worked with FMR to enhance the Board's oversight of investment and financial risks, legal and regulatory risks, technology risks, and operational risks, including the development of additional risk reporting to the Board. Appropriate personnel, including but not limited to the funds' Chief Compliance Officer (CCO), FMR's internal auditor, the independent accountants, the funds' Treasurer and portfolio management personnel, make periodic reports to the Board's committees, as appropriate, including an annual review of FMR's risk management program for the Fidelity funds. The responsibilities of each standing committee, including their oversight responsibilities, are described further under "Standing Committees of the Funds' Trustees."
Annual Report
Trustees and Officers - continued
The funds' Statement of Additional Information (SAI) includes more information about the Trustees. To request a free copy, call Fidelity at 1-877-208-0098.
Interested Trustees*:
Correspondence intended for each Trustee who is an interested person may be sent to Fidelity Investments, 82 Devonshire Street, Boston, Massachusetts 02109.
Name, Age; Principal Occupations and Other Relevant Experience+ |
Abigail P. Johnson (50) |
| Year of Election or Appointment: 2009 Ms. Johnson is Trustee and Chairman of the Board of Trustees of certain Trusts. Ms. Johnson serves as President of Personal, Workplace and Institutional Services (2005-present). Ms. Johnson is Chairman and Director of FMR Co., Inc. (2011-present), Chairman and Director of FMR (2011-present), and the Vice Chairman and Director (2007-present) of FMR LLC. Previously, Ms. Johnson served as President and a Director of FMR (2001-2005), a Trustee of other investment companies advised by FMR, Fidelity Investments Money Management, Inc., and FMR Co., Inc. (2001-2005), Senior Vice President of the Fidelity funds (2001-2005), and managed a number of Fidelity funds. Ms. Abigail P. Johnson and Mr. Arthur E. Johnson are not related. |
James C. Curvey (76) |
| Year of Election or Appointment: 2007 Mr. Curvey also serves as Trustee (2007-present) of other investment companies advised by FMR. Mr. Curvey is a Director of Fidelity Investments Money Management, Inc. (2009-present), Director of Fidelity Research & Analysis Co. (2009-present) and Director of FMR and FMR Co., Inc. (2007-present). Mr. Curvey is also Vice Chairman (2007-present) and Director of FMR LLC. In addition, Mr. Curvey serves as an Overseer for the Boston Symphony Orchestra and a member of the Trustees of Villanova University. Previously, Mr. Curvey was the Vice Chairman (2006-2007) and Director (2000-2007) of FMR Corp. |
* Trustees have been determined to be "Interested Trustees" by virtue of, among other things, their affiliation with the trust or various entities under common control with FMR.
+ The information above includes each Trustee's principal occupation during the last five years and other information relating to the experience, attributes, and skills relevant to each Trustee's qualifications to serve as a Trustee, which led to the conclusion that each Trustee should serve as a Trustee for each fund.
Independent Trustees:
Correspondence intended for each Independent Trustee (that is, the Trustees other than the Interested Trustees) may be sent to Fidelity Investments, P.O. Box 55235, Boston, Massachusetts 02205-5235.
Name, Age; Principal Occupations and Other Relevant Experience+ |
Albert R. Gamper, Jr. (69) |
| Year of Election or Appointment: 2007 Mr. Gamper is Vice Chairman of the Independent Trustees of the Fixed Income and Asset Allocation Funds (2011-present). Prior to his retirement in December 2004, Mr. Gamper served as Chairman of the Board of CIT Group Inc. (commercial finance). During his tenure with CIT Group Inc. Mr. Gamper served in numerous senior management positions, including Chairman (1987-1989; 1999-2001; 2002-2004), Chief Executive Officer (1987-2004), and President (2002-2003). Mr. Gamper currently serves as a member of the Board of Directors of Public Service Enterprise Group (utilities, 2000-present), a member of the Board of Trustees, Rutgers University (2004-present), and Chairman of the Board of Saint Barnabas Health Care System. Previously, Mr. Gamper served as Chairman of the Board of Governors, Rutgers University (2004-2007). |
Robert F. Gartland (60) |
| Year of Election or Appointment: 2010 Mr. Gartland is a partner and investor of Vietnam Partners LLC (investments and consulting, 2008-present) and is Chairman and an investor in Gartland and Mellina Group Corp. (consulting, 2009-present). Prior to his retirement, Mr. Gartland held a variety of positions at Morgan Stanley (financial services, 1979-2007) including Managing Director (1987-2007). |
Arthur E. Johnson (64) |
| Year of Election or Appointment: 2008 Mr. Johnson serves as a member of the Board of Directors of Eaton Corporation (diversified power management, 2009-present), AGL Resources, Inc. (holding company, 2002-present) and Booz Allen Hamilton (management consulting, 2011-present). Prior to his retirement, Mr. Johnson served as Senior Vice President of Corporate Strategic Development of Lockheed Martin Corporation (defense contractor, 1999-2009). He previously served on the Board of Directors of IKON Office Solutions, Inc. (1999-2008) and Delta Airlines (2005-2007). Mr. Arthur E. Johnson is not related to Mr. Edward C. Johnson 3d or Ms. Abigail P. Johnson. |
Michael E. Kenneally (57) |
| Year of Election or Appointment: 2009 Previously, Mr. Kenneally served as a Member of the Advisory Board for certain Fidelity Fixed Income and Asset Allocation Funds (2008-2009). Prior to his retirement, Mr. Kenneally served as Chairman and Global Chief Executive Officer of Credit Suisse Asset Management (2003-2005). Mr. Kenneally was a Director of the Credit Suisse Funds (U.S. mutual funds, 2004-2008) and certain other closed-end funds (2004-2005) and was awarded the Chartered Financial Analyst (CFA) designation in 1991. |
James H. Keyes (71) |
| Year of Election or Appointment: 2007 Mr. Keyes serves as a member of the Boards of Navistar International Corporation (manufacture and sale of trucks, buses, and diesel engines, since 2002) and Pitney Bowes, Inc. (integrated mail, messaging, and document management solutions, since 1998). Prior to his retirement, Mr. Keyes served as Chairman and Chief Executive Officer of Johnson Controls (automotive, building, and energy, 1998-2002) and as a member of the Board of LSI Logic Corporation (semiconductor technologies, 1984-2008). |
Marie L. Knowles (65) |
| Year of Election or Appointment: 2001 Prior to Ms. Knowles' retirement in June 2000, she served as Executive Vice President and Chief Financial Officer of Atlantic Richfield Company (ARCO) (diversified energy, 1996-2000). From 1993 to 1996, she was a Senior Vice President of ARCO and President of ARCO Transportation Company. She served as a Director of ARCO from 1996 to 1998. Ms. Knowles currently serves as a Director and Chairman of the Audit Committee of McKesson Corporation (healthcare service, since 2002). Ms. Knowles is an Honorary Trustee of the Brookings Institution and a member of the Board of the Catalina Island Conservancy and of the Santa Catalina Island Company (2009-present). She also serves as a member of the Advisory Board for the School of Engineering of the University of Southern California and the Foundation Board of the School of Architecture at the University of Virginia (2007-present). Previously, Ms. Knowles served as a Director of Phelps Dodge Corporation (copper mining and manufacturing, 1994-2007). |
Kenneth L. Wolfe (72) |
| Year of Election or Appointment: 2007 Mr. Wolfe is Chairman of the Independent Trustees of the Fixed Income and Asset Allocation Funds (2008-present). Prior to his retirement, Mr. Wolfe served as Chairman and a Director (2007-2009) and Chairman and Chief Executive Officer (1994-2001) of Hershey Foods Corporation. He also served as a member of the Boards of Adelphia Communications Corporation (telecommunications, 2003-2006), Bausch & Lomb, Inc. (medical/pharmaceutical, 1993-2007), and Revlon, Inc. (personal care products, 2004-2009). |
+ The information above includes each Trustee's principal occupation during the last five years and other information relating to the experience, attributes, and skills relevant to each Trustee's qualifications to serve as a Trustee, which led to the conclusion that each Trustee should serve as a Trustee for each fund.
Executive Officers:
Correspondence intended for each executive officer may be sent to Fidelity Investments, 82 Devonshire Street, Boston, Massachusetts 02109.
Name, Age; Principal Occupation |
John R. Hebble (53) |
| Year of Election or Appointment: 2008 President and Treasurer of Fidelity's Fixed Income and Asset Allocation Funds. Mr. Hebble also serves as President (2011-present), Treasurer, and Chief Financial Officer of The North Carolina Capital Management Trust: Cash and Term Portfolios (2008-present), Assistant Treasurer of other Fidelity funds (2009-present) and is an employee of Fidelity Investments. |
Derek L. Young (47) |
| Year of Election or Appointment: 2009 Vice President of Fidelity's Asset Allocation Funds. Mr. Young also serves as President and Director of Strategic Advisers, Inc. (2011-present), President of the Global Asset Allocation Group (2011-present), and as Vice Chairman of Pyramis Global Advisers, LLC (2011-present). Previously, Mr. Young served as Chief Investment Officer of the Global Asset Allocation Group (2009-2011) and as a portfolio manager. |
Scott C. Goebel (43) |
| Year of Election or Appointment: 2008 Secretary and Chief Legal Officer (CLO) of the Fidelity funds. Mr. Goebel also serves as Secretary of Fidelity Investments Money Management, Inc. (FIMM) (2010-present) and Fidelity Research and Analysis Company (FRAC) (2010-present); Secretary and CLO of The North Carolina Capital Management Trust: Cash and Term Portfolios (2008-present); General Counsel, Secretary, and Senior Vice President of FMR (2008-present) and FMR Co., Inc. (2008-present); employed by FMR LLC or an affiliate (2001-present); Chief Legal Officer of Fidelity Management & Research (Hong Kong) Limited (2008-present) and Assistant Secretary of Fidelity Management & Research (Japan) Inc. (2008-present), and Fidelity Management & Research (U.K.) Inc. (2008-present). Previously, Mr. Goebel served as Assistant Secretary of FIMM (2008-2010), FRAC (2008-2010), and the Funds (2007-2008) and as Vice President and Secretary of Fidelity Distributors Corporation (FDC) (2005-2007). |
David J. Carter (38) |
| Year of Election or Appointment: 2010 Assistant Secretary of Fidelity's Fixed Income and Asset Allocation Funds. Mr. Carter also serves as Vice President, Associate General Counsel (2010-present) and is an employee of Fidelity Investments (2005-present). |
Holly C. Laurent (57) |
| Year of Election or Appointment: 2008 Anti-Money Laundering (AML) Officer of the Fidelity funds. Ms. Laurent also serves as AML Officer of The North Carolina Capital Management Trust: Cash and Term Portfolios (2008-present) and is an employee of Fidelity Investments. Previously, Ms. Laurent was Senior Vice President and Head of Legal for Fidelity Business Services India Pvt. Ltd. (2006-2008), and Senior Vice President, Deputy General Counsel and Group Head for FMR LLC (2005-2006). |
Christine Reynolds (53) |
| Year of Election or Appointment: 2008 Chief Financial Officer of the Fidelity funds. Ms. Reynolds became President of Fidelity Pricing and Cash Management Services (FPCMS) in August 2008. Ms. Reynolds served as Chief Operating Officer of FPCMS (2007-2008). Previously, Ms. Reynolds served as President, Treasurer, and Anti-Money Laundering officer of the Fidelity funds (2004-2007). |
Michael H. Whitaker (44) |
| Year of Election or Appointment: 2008 Chief Compliance Officer of Fidelity's Fixed Income and Asset Allocation Funds. Mr. Whitaker also serves as Chief Compliance Officer of The North Carolina Capital Management Trust: Cash and Term Portfolios (2008-present). Mr. Whitaker is an employee of Fidelity Investments (2007-present). Prior to joining Fidelity Investments, Mr. Whitaker worked at MFS Investment Management where he served as Senior Vice President and Chief Compliance Officer (2004-2006), and Assistant General Counsel. |
Jeffrey S. Christian (50) |
| Year of Election or Appointment: 2009 Deputy Treasurer of the Fidelity funds. Mr. Christian is an employee of Fidelity Investments. Previously, Mr. Christian served as Chief Financial Officer (2008-2009) of certain Fidelity funds and Senior Vice President of Fidelity Pricing and Cash Management Services (FPCMS) (2004-2009). |
Joseph F. Zambello (54) |
| Year of Election or Appointment: 2011 Deputy Treasurer of the Fidelity funds. Mr. Zambello is an employee of Fidelity Investments. Previously, Mr. Zambello served as Vice President of FMR's Program Management Group (2009-2011) and Vice President of the Transfer Agent Oversight Group (2005-2009). |
Stephanie J. Dorsey (42) |
| Year of Election or Appointment: 2008 Deputy Treasurer of Fidelity's Fixed Income and Asset Allocation Funds. Ms. Dorsey also serves as Assistant Treasurer of other Fidelity funds (2010-present) and is an employee of Fidelity Investments (2008-present). Previously, Ms. Dorsey served as Treasurer (2004-2008) of the JPMorgan Mutual Funds and Vice President (2004-2008) of JPMorgan Chase Bank. |
Adrien E. Deberghes (44) |
| Year of Election or Appointment: 2010 Assistant Treasurer of Fidelity's Fixed Income and Asset Allocation Funds. Mr. Deberghes also serves as Vice President and Assistant Treasurer of Fidelity Rutland Square Trust II and Fidelity Commonwealth Trust II (2011-present), Deputy Treasurer of other Fidelity funds (2008-present), and is an employee of Fidelity Investments (2008-present). Previously, Mr. Deberghes served as Senior Vice President of Mutual Fund Administration at State Street Corporation (2007-2008), Senior Director of Mutual Fund Administration at Investors Bank & Trust (2005-2007), and Director of Finance for Dunkin' Brands (2000-2005). |
Kenneth B. Robins (42) |
| Year of Election or Appointment: 2009 Assistant Treasurer of the Fidelity Fixed Income and Asset Allocation Funds. Mr. Robins also serves as President and Treasurer of other Fidelity funds (2008-present; 2010-present) and is an employee of Fidelity Investments (2004-present). Previously, Mr. Robins served as Deputy Treasurer of the Fidelity funds (2005-2008) and Treasurer and Chief Financial Officer of The North Carolina Capital Management Trust: Cash and Term Portfolios (2006-2008). |
Gary W. Ryan (53) |
| Year of Election or Appointment: 2005 Assistant Treasurer of the Fidelity funds. Mr. Ryan is an employee of Fidelity Investments. Previously, Mr. Ryan served as Vice President of Fund Reporting in Fidelity Pricing and Cash Management Services (FPCMS) (1999-2005). |
Jonathan Davis (43) |
| Year of Election or Appointment: 2010 Assistant Treasurer of the Fidelity funds. Mr. Davis is also Assistant Treasurer of Fidelity Rutland Square Trust II and Fidelity Commonwealth Trust II. Mr. Davis is an employee of Fidelity Investments. Previously, Mr. Davis served as Vice President and Associate General Counsel of FMR LLC (2003-2010). |
Annual Report
The Board of Trustees of each fund voted to pay to shareholders of record at the opening of business on record date, the following distributions per share derived from capital gains realized from sales of portfolio securities:
Fund | Pay Date | Record Date | Capital Gains |
VIP Freedom Lifetime Income I | 02/10/12 | 02/10/12 | $0.057 |
VIP Freedom Lifetime Income II | 02/10/12 | 02/10/12 | $0.000 |
VIP Freedom Lifetime Income III | 02/10/12 | 02/10/12 | $0.000 |
The funds hereby designate as capital gain dividends the amounts noted below for the taxable year ended December 31, 2011, or, if subsequently determined to be different, the net capital gain of such year.
Fund | |
VIP Freedom Lifetime Income I | $61,575 |
A percentage of the dividends distributed during the fiscal year for the following funds qualifies for the dividends-received deduction for corporate shareholders:
Fund | February, 2011 | December, 2011 |
VIP Freedom Lifetime Income I | 6% | 14% |
VIP Freedom Lifetime Income II | 0% | 16% |
VIP Freedom Lifetime Income III | 0% | 26% |
A percentage of the dividends distributed during the fiscal year for the following funds was derived from interest on U.S. Government securities which is generally exempt from state income tax:
| |
VIP Freedom Lifetime Income I | 5.64% |
VIP Freedom Lifetime Income II | 5.81% |
VIP Freedom Lifetime Income III | 4.11% |
The amounts per share which represent income derived from sources within, and taxes paid to, foreign countries or possessions of the United States are as follows:
| Pay Date | Income | Taxes |
VIP Freedom Lifetime Income I | 12/29/2011 | $0.018 | $0.001 |
VIP Freedom Lifetime Income II | 12/29/2011 | $0.020 | $0.002 |
VIP Freedom Lifetime Income III | 12/29/2011 | $0.028 | $0.002 |
Annual Report
Board Approval of Investment Advisory Contracts and Management Fees
VIP Freedom Lifetime Income Funds
Each year, the Board of Trustees, including the Independent Trustees (together, the Board), votes on the renewal of the management contract and administration agreement (together, the Advisory Contracts) for each fund. The Board, assisted by the advice of fund counsel and Independent Trustees' counsel, requests and considers a broad range of information relevant to the renewal of the Advisory Contracts throughout the year.
The Board meets regularly and considers at each of its meetings factors that are relevant to its annual consideration of the renewal of each fund's Advisory Contracts, including the services and support provided to each fund and its shareholders. The Board has established three standing committees, Operations, Audit, and Nominating and Governance, each composed of Independent Trustees with varying backgrounds, to which the Board has assigned specific subject matter responsibilities in order to enhance effective decision-making by the Board. The Operations Committee, of which all of the Independent Trustees are members, meets regularly throughout the year and, among other matters, considers matters specifically related to the annual consideration of the renewal of each fund's Advisory Contracts. The Board, acting directly and through its Committees, requests and receives information concerning the annual consideration of the renewal of each fund's Advisory Contracts. The Board also meets as needed to consider matters specifically related to the Board's annual consideration of the renewal of Advisory Contracts. Members of the Board may also meet with trustees of other Fidelity funds through ad hoc joint committees to discuss certain matters relevant to the Fidelity funds.
At its September 2011 meeting, the Board of Trustees, including the Independent Trustees, unanimously determined to renew each fund's Advisory Contracts. In reaching its determination, the Board considered all factors it believed relevant and reached a determination, with the assistance of fund counsel and Independent Trustees' counsel and through the exercise of its business judgment, that the renewal of the Advisory Contracts is in the best interests of each fund and its shareholders and that the lack of compensation payable under the Advisory Contracts is fair and reasonable. The Board's decision to renew the Advisory Contracts was not based on any single factor, but rather was based on a comprehensive consideration of all the information provided to the Board at its meetings throughout the year. In reaching its determination, the Board is aware that shareholders in each fund have a broad range of investment choices available to them, including a wide choice among mutual funds offered by Fidelity's competitors, and that each fund's shareholders, who have the opportunity to review and weigh the disclosure provided by the fund in its prospectus and other public disclosures, have chosen to invest in that fund, managed by Fidelity.
Nature, Extent, and Quality of Services Provided. The Board considered the staffing within the investment adviser, Strategic Advisers, Inc. (Strategic Advisers), and the administrator, FMR, including the backgrounds of the funds' investment personnel and the funds' investment objectives and disciplines. The Independent Trustees also had discussions with senior management of Fidelity's investment operations and investment groups. The Board considered the structure of the portfolio manager compensation program and whether this structure provides appropriate incentives to act in the best interests of each fund.
Resources Dedicated to Investment Management and Support Services. The Board reviewed the general qualifications and capabilities of Strategic Advisers' investment staff, including its size, education, experience, and resources, as well as Strategic Advisers' and FMR's approach to recruiting, managing, and compensating investment personnel. The Board also noted that FMR has devoted increased resources to non-U.S. offices. The Board noted that Fidelity's analysts have extensive resources, tools and capabilities which allow them to conduct sophisticated quantitative and fundamental analysis, as well as credit analysis of issuers, counterparties and enhancers. The Board also believes that Fidelity's investment professionals have sufficient access to global information and data so as to provide competitive investment results over time, and that those professionals also have access to sophisticated tools which permit them to assess portfolio construction and risk and performance attribution characteristics continuously, as well as to transmit new information and research conclusions rapidly around the world. Additionally, in its deliberations, the Board considered Strategic Advisers' trading capabilities and resources which are an integral part of the investment management process.
Shareholder and Administrative Services. The Board considered (i) the nature, extent, quality, and cost of advisory, administrative, and shareholder services performed by FMR and its affiliates under the Advisory Contracts and under separate agreements covering transfer agency, pricing and bookkeeping, and securities lending services for each fund; (ii) the nature and extent of FMR's supervision of third party service providers, principally custodians and subcustodians; and (iii) the resources devoted to, and the record of compliance with, each fund's compliance policies and procedures.
The Board noted that the growth of fund assets over time across the complex allows Fidelity to reinvest in the development of services designed to enhance the value or convenience of the Fidelity funds as investment vehicles. These services include 24-hour access to account information and market information through telephone representatives and over the Internet, investor education materials and asset allocation tools, and the expanded availability of Fidelity Investor Centers, with 35 new branches opening since 2010.
Investment in a Large Fund Family. The Board considered the benefits to shareholders of investing in a Fidelity fund, including the benefits of investing in a fund that is part of a large family of funds offering a variety of investment disciplines and providing a large variety of mutual fund investor services. The Board noted that Fidelity had taken, or had made recommendations that resulted in the Fidelity funds taking, a number of actions over the previous year that benefited particular funds, including (i) continuing to dedicate additional resources to investment research and support of the senior management team that oversees asset management; (ii) rationalizing product lines through the mergers of six funds into other funds; (iii) continuing to migrate the Freedom Funds to dedicated lower cost underlying funds; (iv) obtaining shareholder approval to broaden the investment strategies for Fidelity Consumer Finance Portfolio, Fidelity Emerging Asia Fund, and Fidelity Environment and Alternative Energy Portfolio; (v) contractually agreeing to reduce the management fees and impose other expense limitations on Spartan 500 Index Fund and U.S. Bond Index Fund in connection with launching new institutional classes of these funds; (vi) changing the name, primary and supplemental benchmarks, and investment policies of Fidelity Global Strategies Fund to support the fund's flexible investment mandate and global orientation; and (vii) reducing the transfer agency account fee rates on certain accounts.
Annual Report
Board Approval of Investment Advisory Contracts and Management Fees - continued
Investment Performance. The Board considered whether each fund has operated in accordance with its investment objective, as well as its record of compliance with its investment restrictions. It also reviewed each fund's absolute investment performance, as well as each fund's relative investment performance measured over multiple periods against a proprietary custom index. The Board noted that FMR does not believe that a meaningful peer group exists against which to compare any of the funds' performance. For each fund, the following charts considered by the Board show, over the one-, three-, and five-year periods ended December 31, 2010, the fund's cumulative total returns and the cumulative total returns of a proprietary custom index ("benchmark"). For each fund, the proprietary custom index is an index developed by FMR that represents the performance of the fund's asset classes according to their respective weightings, adjusted on the last day of every month to reflect the fund's increasingly conservative asset allocations over time.
VIP Freedom Lifetime Income I Portfolio
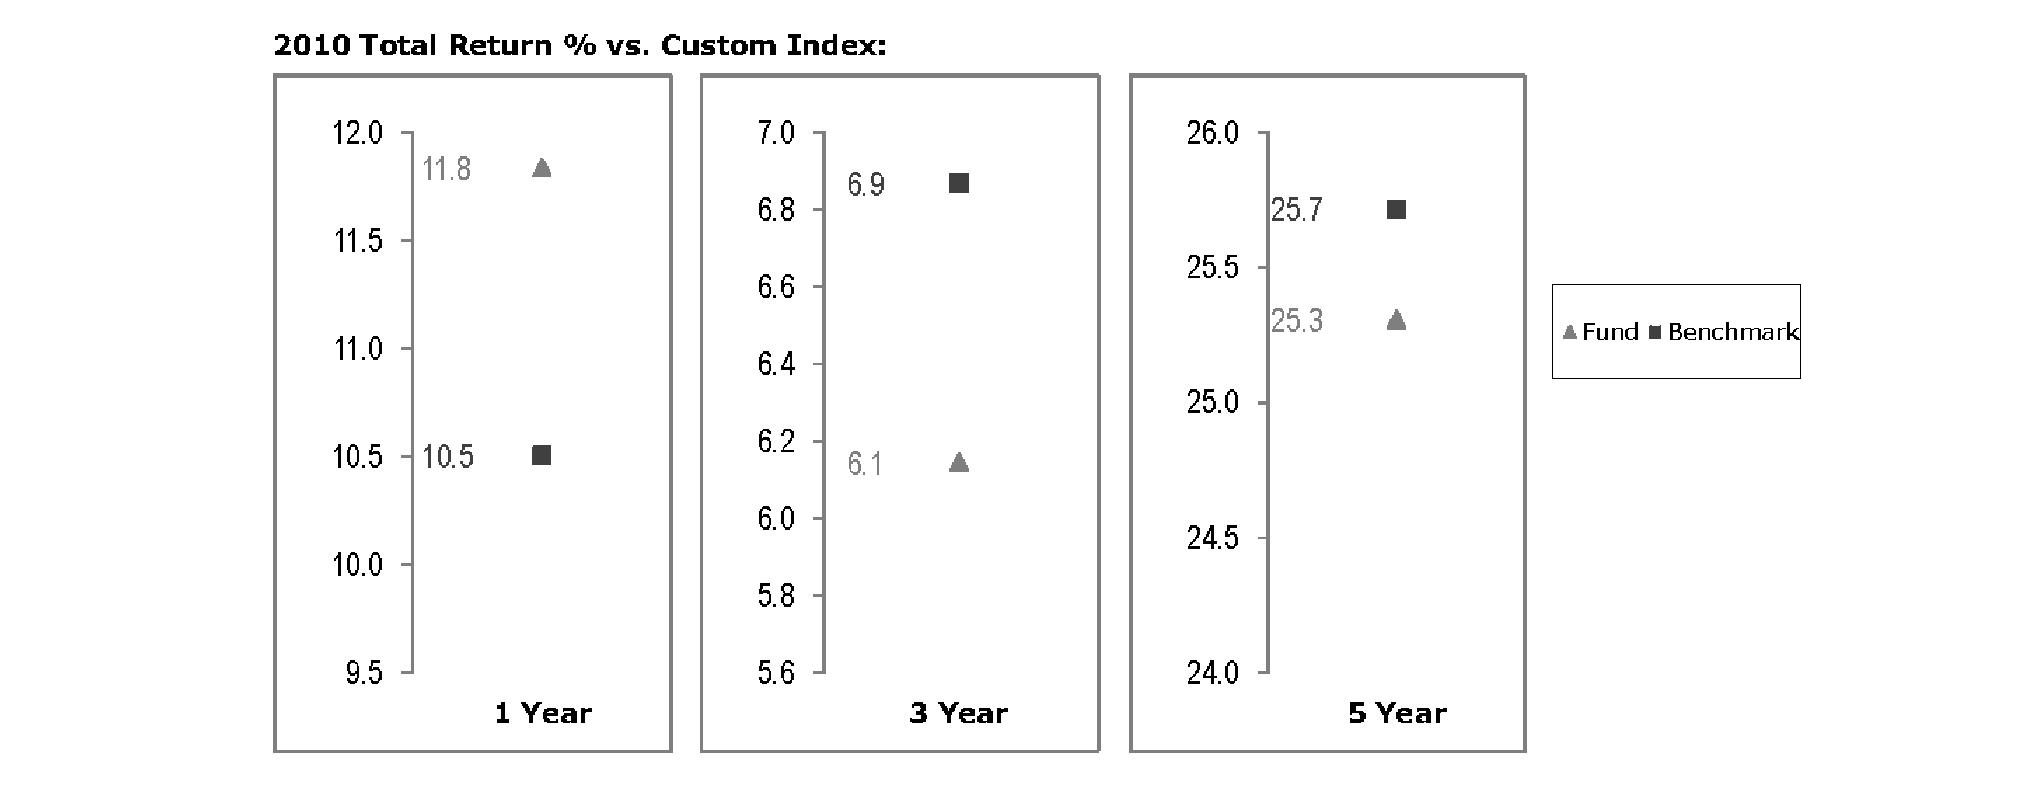
The Board noted that the investment performance of the fund was lower than its benchmark for the three- and five-year periods, although the fund's one-year total return compared favorably to its benchmark. The Board also reviewed the fund's performance since inception as well as performance in the current year.
Annual Report
VIP Freedom Lifetime Income II Portfolio
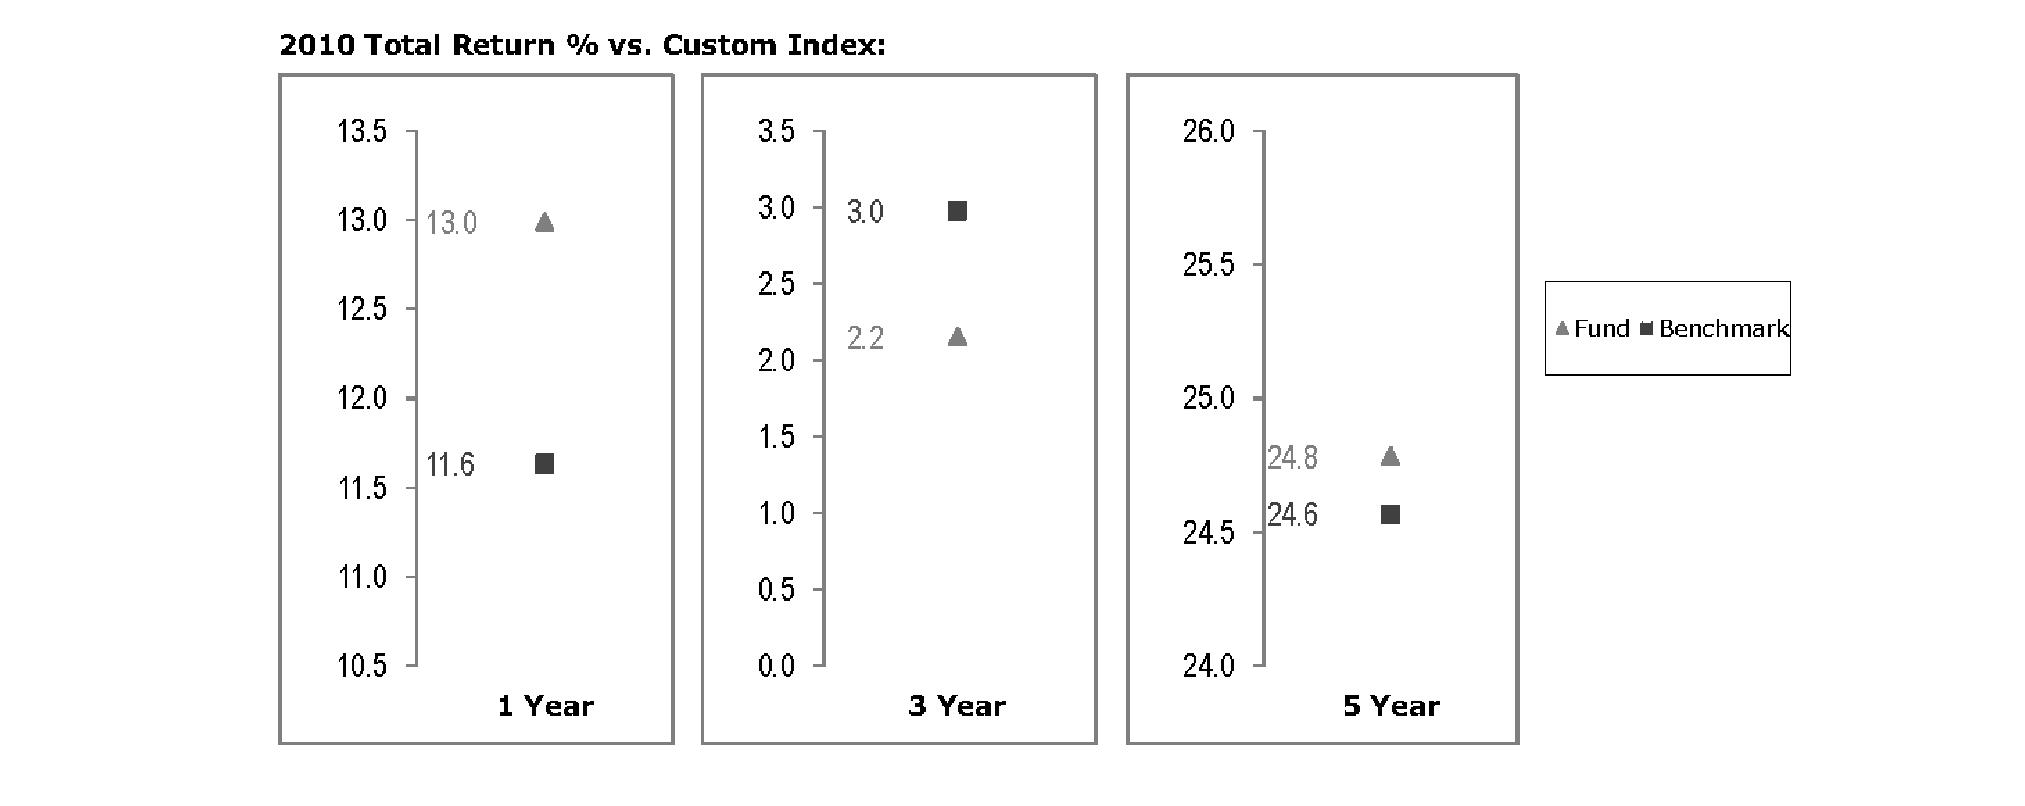
The Board noted that the investment performance of the fund compared favorably to its benchmark for the one- and five-year periods, although the fund's three-year cumulative total return was lower than its benchmark. The Board also reviewed the fund's performance since inception as well as performance in the current year.
VIP Freedom Lifetime Income III Portfolio
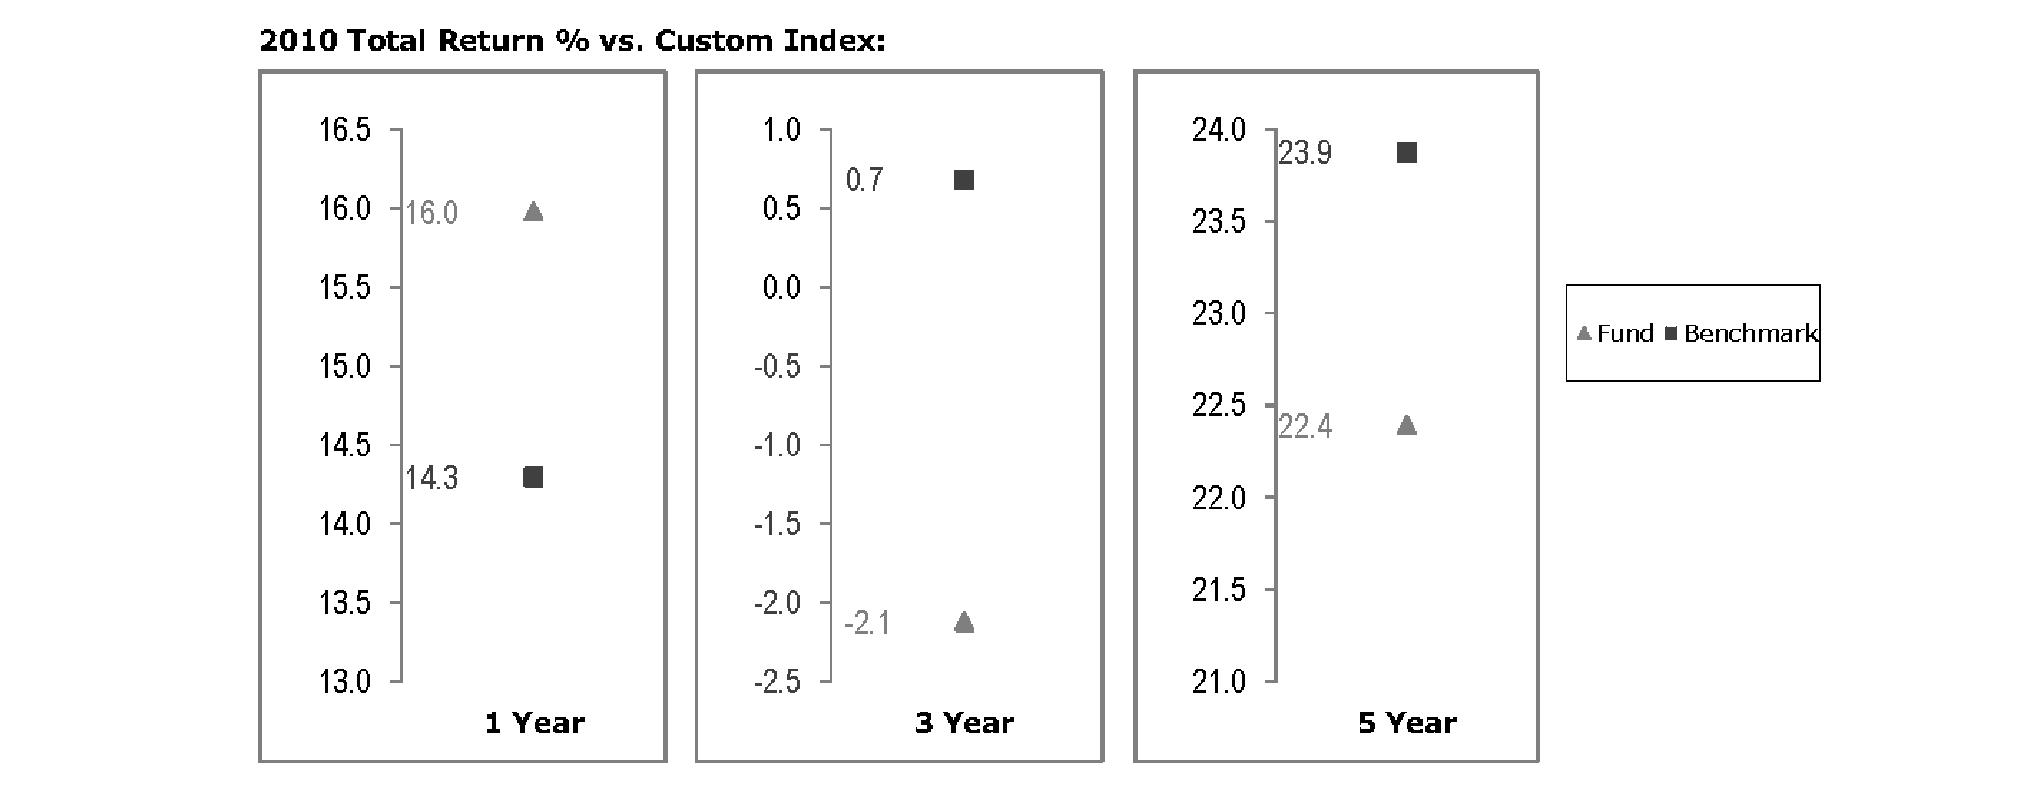
The Board noted that the investment performance of the fund was lower than its benchmark for the three- and five-year periods, although the fund's one-year total return compared favorably to its benchmark. The Board also reviewed the fund's performance since inception as well as performance in the current year.
Based on its review, the Board concluded that the nature, extent, and quality of services provided to each fund under the Advisory Contracts should benefit each fund's shareholders.
Competitiveness of Management Fee and Total Expense Ratio. The Board noted that the funds do not pay Strategic Advisers a management fee for investment advisory services. The Board considered each fund's management fee and total expense ratio compared to "mapped groups" of competitive funds and classes, and also considered that each fund bears indirectly the expenses of the underlying funds in which it invests. Fidelity creates "mapped groups" by combining similar Lipper investment objective categories that have comparable management fee characteristics. Combining Lipper investment objective categories aids the Board's management fee and total expense ratio comparisons by broadening the competitive group used for comparison and by reducing the number of universes to which various Fidelity funds are compared.
Annual Report
Board Approval of Investment Advisory Contracts and Management Fees - continued
Management Fee. The Board considered two proprietary management fee comparisons for the 12-month periods shown in the charts below. The group of Lipper funds used by the Board for management fee comparisons is referred to below as the "Total Mapped Group." The Total Mapped Group comparison focuses on a fund's standing relative to the total universe of comparable funds available to investors in terms of gross management fees before expense reimbursements or caps. "TMG %" represents the percentage of funds in the Total Mapped Group that had management fees that were lower than a fund's. For example, a TMG % of 0% means that 100% of the funds in the Total Mapped Group had higher management fees than a fund. The "Asset-Size Peer Group" (ASPG) comparison focuses on a fund's standing relative to non-Fidelity funds similar in size to the fund within the Total Mapped Group. The ASPG represents at least 15% of the funds in the Total Mapped Group with comparable asset size and management fee characteristics, subject to a minimum of 50 funds (or all funds in the Total Mapped Group if fewer than 50). Additional information, such as the ASPG quartile in which a fund's management fee ranked, is also included in the charts and considered by the Board.
VIP Freedom Lifetime Income I Portfolio
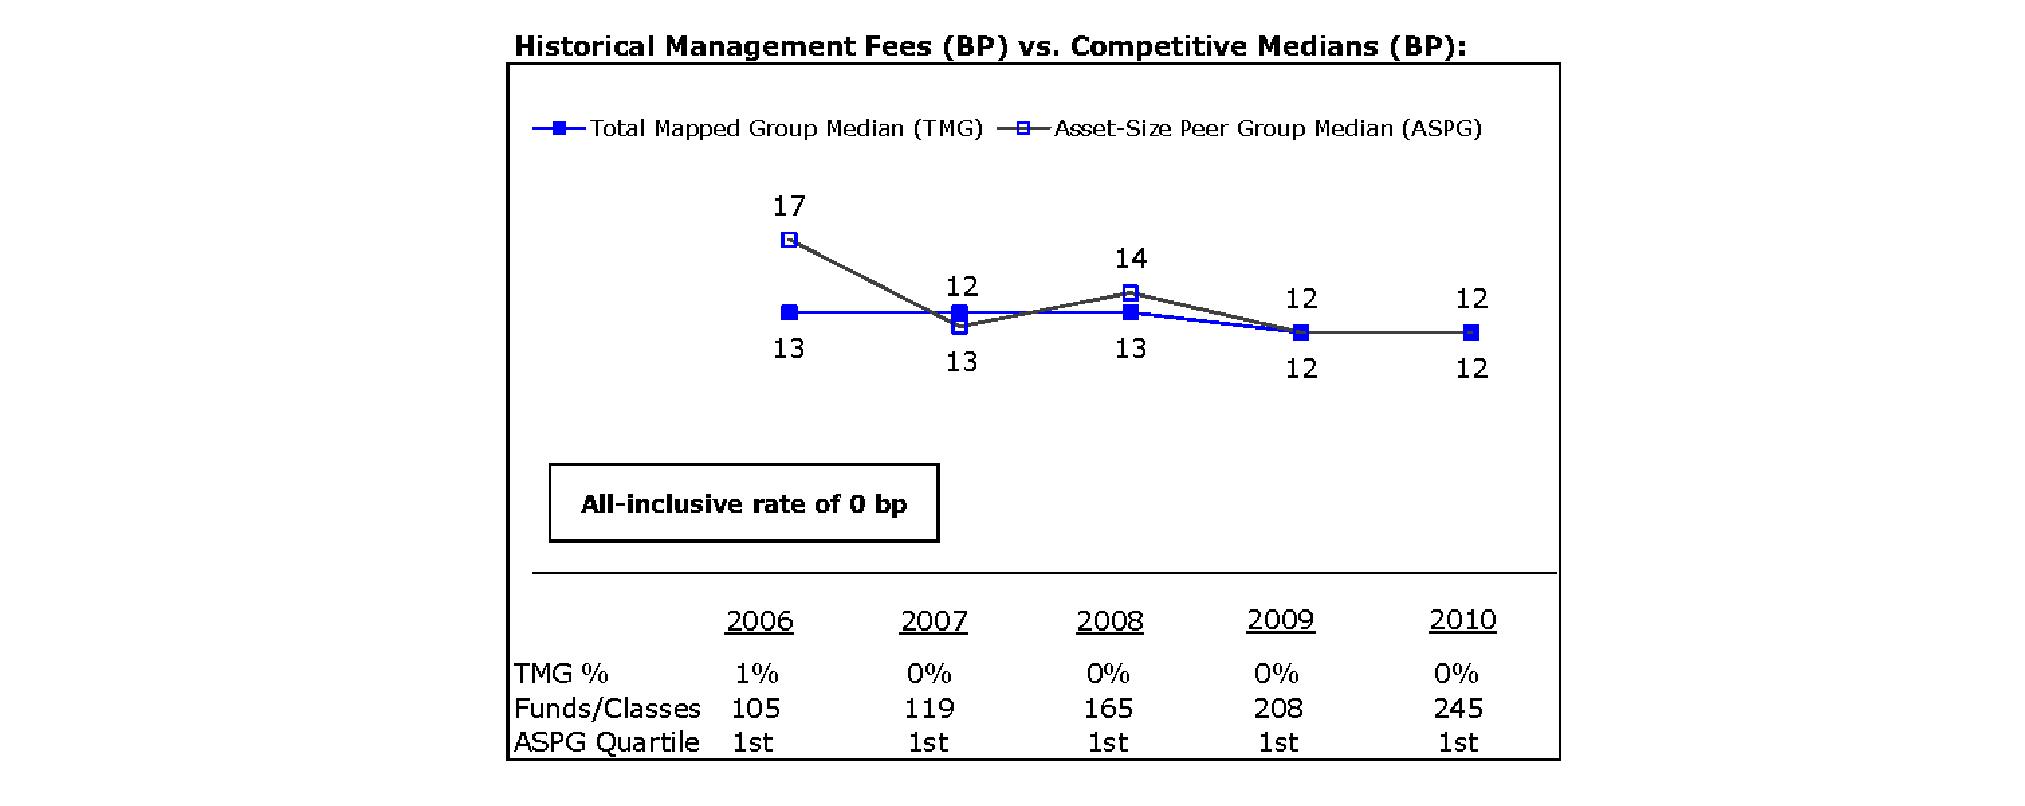
VIP Freedom Lifetime Income II Portfolio
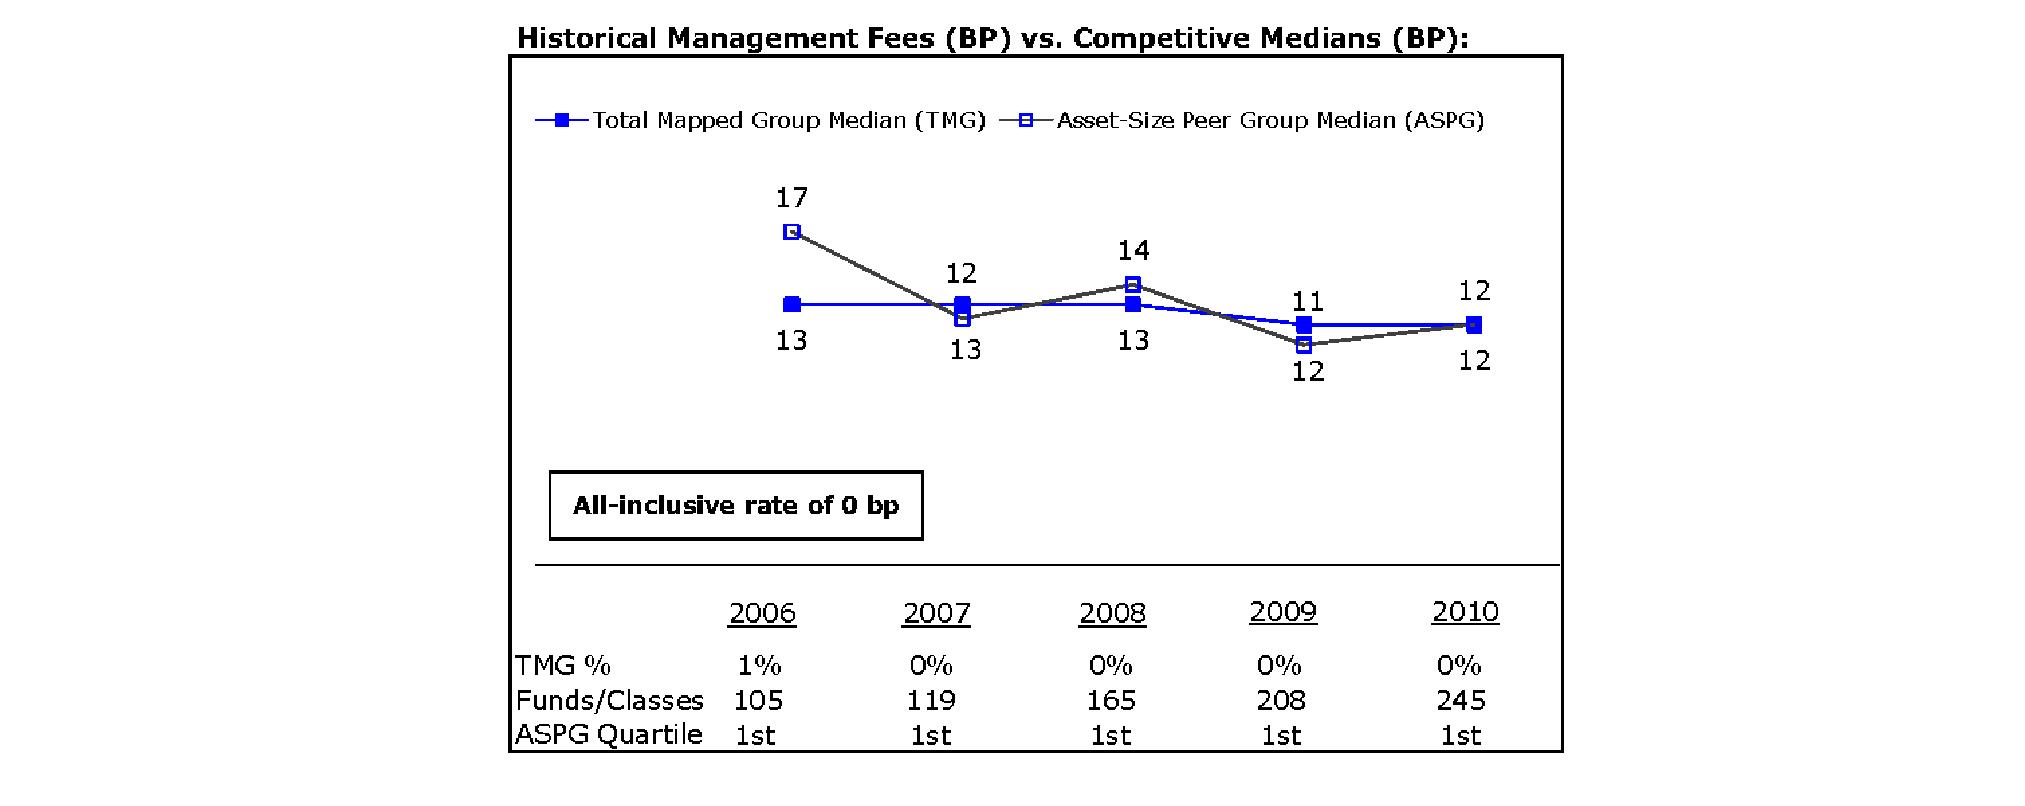
Annual Report
VIP Freedom Lifetime Income III Portfolio
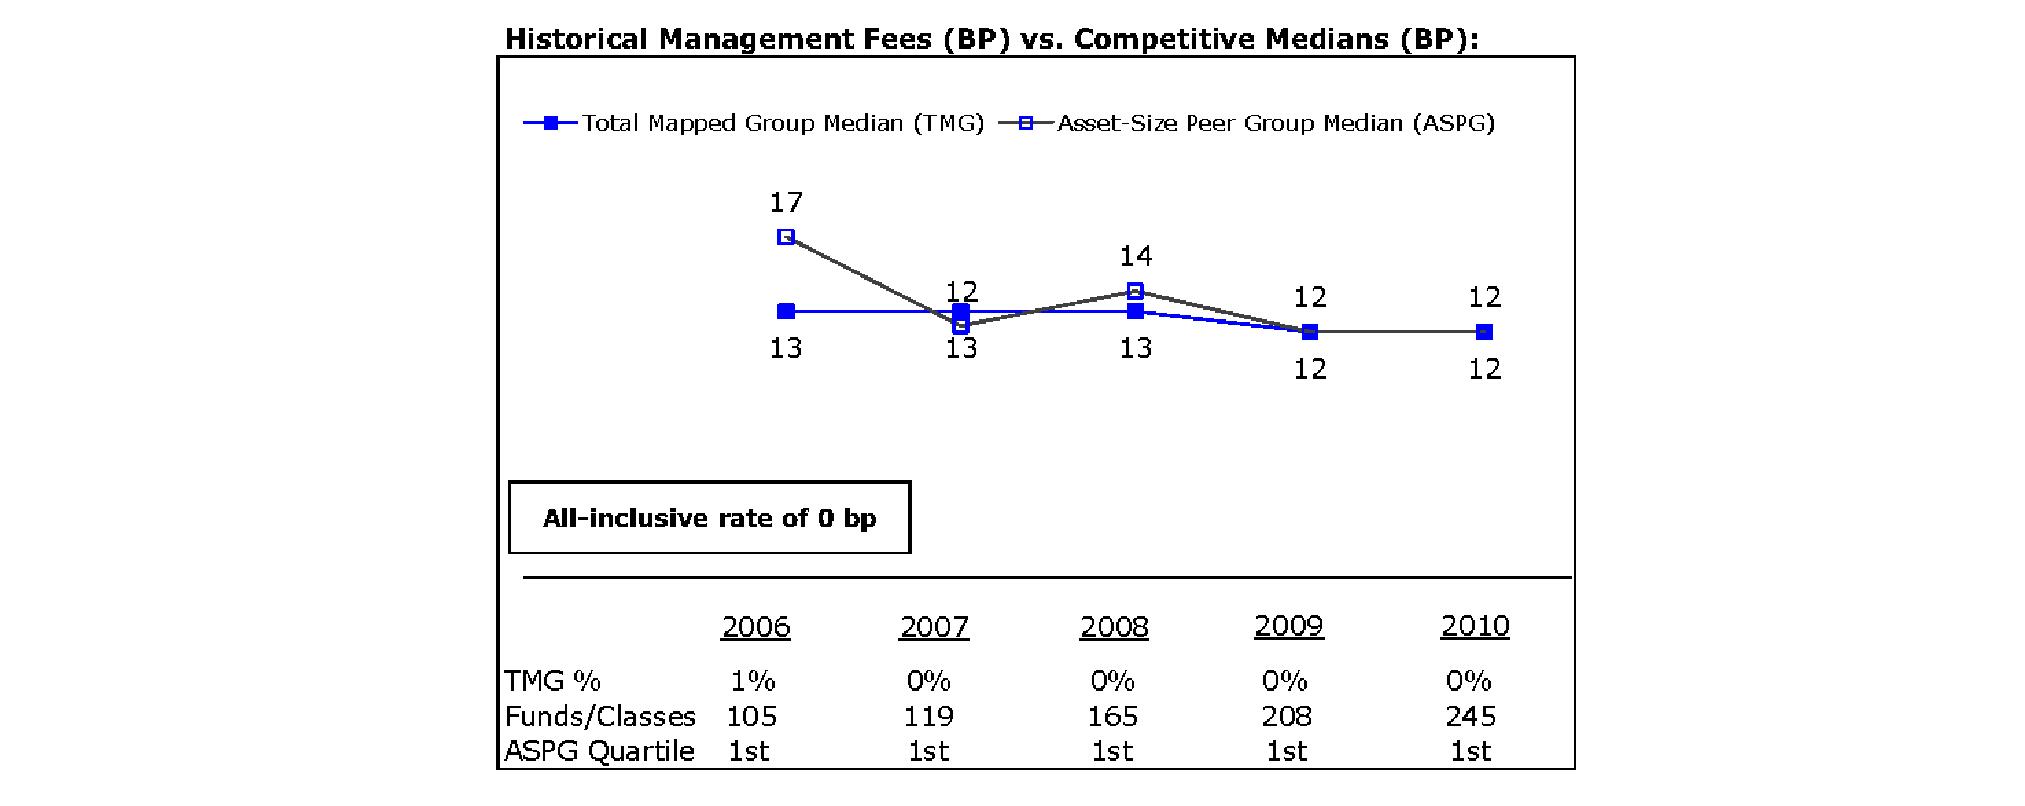
The Board noted that each fund's management fee ranked below the median of its Total Mapped Group and below the median of its ASPG for 2010.
Total Expense Ratio. In its review of each fund's total expense ratio, the Board noted that each fund invests in Investor Class of the underlying fund to avoid charging fund-paid 12b-1 fees at both fund levels. The Board considered that the funds do not pay transfer agent fees. Instead, Investor Class of each underlying fund bears its pro rata portion of each fund's transfer agent fee according to the percentage of each fund's assets invested in that underlying fund. The Board further noted that FMR pays all other expenses of each fund, with limited exceptions.
The Board noted that each fund's total expense ratio ranked below its competitive median for 2010.
Fees Charged to Other Fidelity Clients. The Board also considered Fidelity fee structures and other information with respect to clients of FMR and its affiliates, such as other mutual funds advised or subadvised by FMR or its affiliates, pension plan clients, and other institutional clients. In March 2010, the Board created an ad hoc joint committee with the board of other Fidelity funds (the Committee) to review and compare Fidelity's institutional investment advisory business with its business of providing services to the Fidelity funds, including the differences in services provided, fees charged, and costs incurred, as well as competition in their respective marketplaces.
Based on its review of management fees, total expense ratios, and fees charged to other Fidelity clients, the Board concluded that each fund's management fee and the total expense ratio of each fund were reasonable in light of the services that the fund and its shareholders receive and the other factors considered, including the findings of the Committee.
Costs of the Services and Profitability. The Board considered the level of Fidelity's profits in respect of all the Fidelity funds.
PricewaterhouseCoopers LLP (PwC), independent registered public accounting firm and auditor to Fidelity and certain Fidelity funds, has been engaged annually by the Board as part of the Board's assessment of Fidelity's profitability analysis. PwC's engagement includes the review and assessment of Fidelity's methodologies used in determining the revenues and expenses attributable to Fidelity's mutual fund business, and completion of agreed-upon procedures surrounding the mathematical accuracy of fund profitability and its conformity to allocation methodologies. After considering PwC's reports issued under the engagement and information provided by Fidelity, the Board concluded that while other allocation methods may also be reasonable, Fidelity's profitability methodologies are reasonable in all material respects.
The Board also reviewed Fidelity's non-fund businesses and fall-out benefits related to the mutual fund business as well as cases where Fidelity's affiliates may benefit from or be related to the funds' business.
The Board concluded that the costs of the services provided by and the profits realized by Fidelity in connection with the operation of each fund were not relevant to the renewal of each fund's Advisory Contracts because the funds do not pay management fees and FMR pays all other expenses of each fund, with limited exceptions.
Economies of Scale. The Board concluded that because the funds do not pay management fees and FMR pays all other expenses of each fund, with limited exceptions, economies of scale cannot be realized by the funds, but may be realized by the other Fidelity funds in which each fund invests.
Additional Information Requested by the Board. In order to develop fully the factual basis for consideration of the Fidelity funds' Advisory Contracts, the Board requested and received additional information on certain topics, including: (i) Fidelity's fund profitability methodology, profitability trends for certain funds, and the impact of certain factors on fund profitability results; (ii) portfolio manager changes that have occurred during the past year and the amount of the investment that each portfolio manager has made in the Fidelity fund(s) that he or she manages; (iii) Fidelity's compensation structure for portfolio managers, research analysts, and other key personnel, including its effects on fund profitability, the rationale for the compensation structure, and the extent to which current market conditions have affected retention and recruitment; (iv) the compensation paid to fund sub-advisers on behalf of the Fidelity funds; (v) Fidelity's fee structures and rationale for recommending different fees among different categories of funds and classes, as well as Fidelity's voluntary waiver of its fees to maintain minimum yields for certain money market funds and classes; (vi) the reasons why certain expenses affect various funds and classes differently; (vii) Fidelity's transfer agent fees, expenses, and services and how the benefits of decreased costs and new efficiencies can be shared across all of the Fidelity funds; (viii) the reasons for and consequences of changes to certain product lines compared to competitors; (ix) the allocation of and historical trends in Fidelity's realization of fall-out benefits; and (x) explanations regarding the relative total expense ratios of certain funds and classes, total expense competitive trends, and actions that might be taken by FMR to reduce total expense ratios for certain funds and classes or to achieve further economies of scale.
Annual Report
Board Approval of Investment Advisory Contracts and Management Fees - continued
Based on its evaluation of all of the conclusions noted above, and after considering all factors it believed relevant, the Board ultimately concluded that the advisory fee structures are fair and reasonable, and that each fund's Advisory Contracts should be renewed.
Annual Report
Investment Adviser
Strategic Advisers, Inc.
Boston, MA
General Distributor
Fidelity Distributors Corporation
Boston, MA
Transfer and Service Agents
Fidelity Investments Institutional Operations Company, Inc.
Boston, MA
Fidelity Service Company, Inc.
Boston, MA
Custodian
The Bank of New York Mellon
New York, NY
VIPFLI-ANN-0212
1.816199.106
Fidelity® Variable Insurance Products:
FundsManager - 20%, 50%, 60%, 70%, 85% Portfolio
Annual Report
December 31, 2011
Contents
To view a fund's proxy voting guidelines and proxy voting record for the 12-month period ended June 30, visit http://www.fidelity.com/proxyvotingresults or visit the Securities and Exchange Commission's (SEC) web site at http://www.sec.gov. You may also call 1-877-208-0098 to request a free copy of the proxy voting guidelines.
Fidelity Variable Insurance Products are separate account options which are purchased through a variable insurance contract.
Standard & Poor's, S&P and S&P 500 are registered service marks of The McGraw-Hill Companies, Inc. and have been licensed for use by Fidelity Distributors Corporation.
Other third party marks appearing herein are the property of their respective owners.
All other marks appearing herein are registered or unregistered trademarks or service marks of FMR LLC or an affiliated company.
This report and the financial statements contained herein are submitted for the general information of the shareholders of the funds. This report is not authorized for distribution to prospective investors in the funds unless preceded or accompanied by an effective prospectus.
A fund files its complete schedule of portfolio holdings with the SEC for the first and third quarters of each fiscal year on Form N-Q. Forms N-Q are available on the SEC's web site at http://www.sec.gov. A fund's Forms N-Q may be reviewed and copied at the SEC's Public Reference Room in Washington, DC. Information regarding the operation of the SEC's Public Reference Room may be obtained by calling 1-800-SEC-0330. For a complete list of a fund's portfolio holdings, view the most recent holdings listing, semiannual report, or annual report on Fidelity's web site at http://www.fidelity.com, http://www.advisor.fidelity.com, or http://www.401k.com, as applicable.
NOT FDIC INSURED • MAY LOSE VALUE • NO BANK GUARANTEE
Neither the funds nor Fidelity Distributors Corporation is a bank.
Annual Report
VIP FundsManager 20% Portfolio
Performance: The Bottom Line
Average annual total return reflects the change in the value of an investment, assuming reinvestment of the class' distributions from dividend income and capital gains (the profits earned upon the sale of securities that have grown in value, if any) and assuming a constant rate of performance each year. During periods of reimbursement by Fidelity, a fund's total return will be greater than it would be had the reimbursement not occurred. Performance numbers are net of all underlying fund operating expenses, but do not include any insurance charges imposed by your insurance company's separate account. If performance information included the effect of these additional charges, the total returns would have been lower. How a fund did yesterday is no guarantee of how it will do tomorrow.
Average Annual Total Returns
Periods ended December 31, 2011 | Past 1
year | Past 5
years | Life of fund A |
VIP FundsManager® 20% Portfolio - Investor Class | 2.31% | 3.36% | 3.87% |
VIP FundsManager 20% Portfolio - Service Class | 2.30% | 3.36% | 3.87% |
VIP FundsManager 20% Portfolio - Service Class 2 | 2.20% | 3.22% | 3.73% |
A From April 13, 2006.
$10,000 Over Life of Fund
Let's say hypothetically that $10,000 was invested in VIP FundsManager® 20% Portfolio - Investor Class on April 13, 2006, when the fund started. The chart shows how the value of your investment would have changed, and also shows how the Barclays Capital® U.S. Aggregate Bond Index performed over the same period.

Annual Report
VIP FundsManager 50% Portfolio
Performance: The Bottom Line
Average annual total return reflects the change in the value of an investment, assuming reinvestment of the class' distributions from dividend income and capital gains (the profits earned upon the sale of securities that have grown in value, if any) and assuming a constant rate of performance each year. During periods of reimbursement by Fidelity, a fund's total return will be greater than it would be had the reimbursement not occurred. Performance numbers are net of all underlying fund operating expenses, but do not include any insurance charges imposed by your insurance company's separate account. If performance information included the effect of these additional charges, the total returns would have been lower. How a fund did yesterday is no guarantee of how it will do tomorrow.
Average Annual Total Returns
Periods ended December 31, 2011 | Past 1
year | Past 5
years | Life of fund A |
VIP FundsManager 50% Portfolio - Investor Class | -0.42% | 1.89% | 2.91% |
VIP FundsManager 50% Portfolio - Service Class | -0.42% | 1.89% | 2.91% |
VIP FundsManager 50% Portfolio - Service Class 2 | -0.68% | 1.75% | 2.75% |
A From April 13, 2006.
$10,000 Over Life of Fund
Let's say hypothetically that $10,000 was invested in VIP FundsManager 50% Portfolio - Investor Class on April 13, 2006, when the fund started. The chart shows how the value of your investment would have changed, and also shows how the S&P 500® Index performed over the same period.
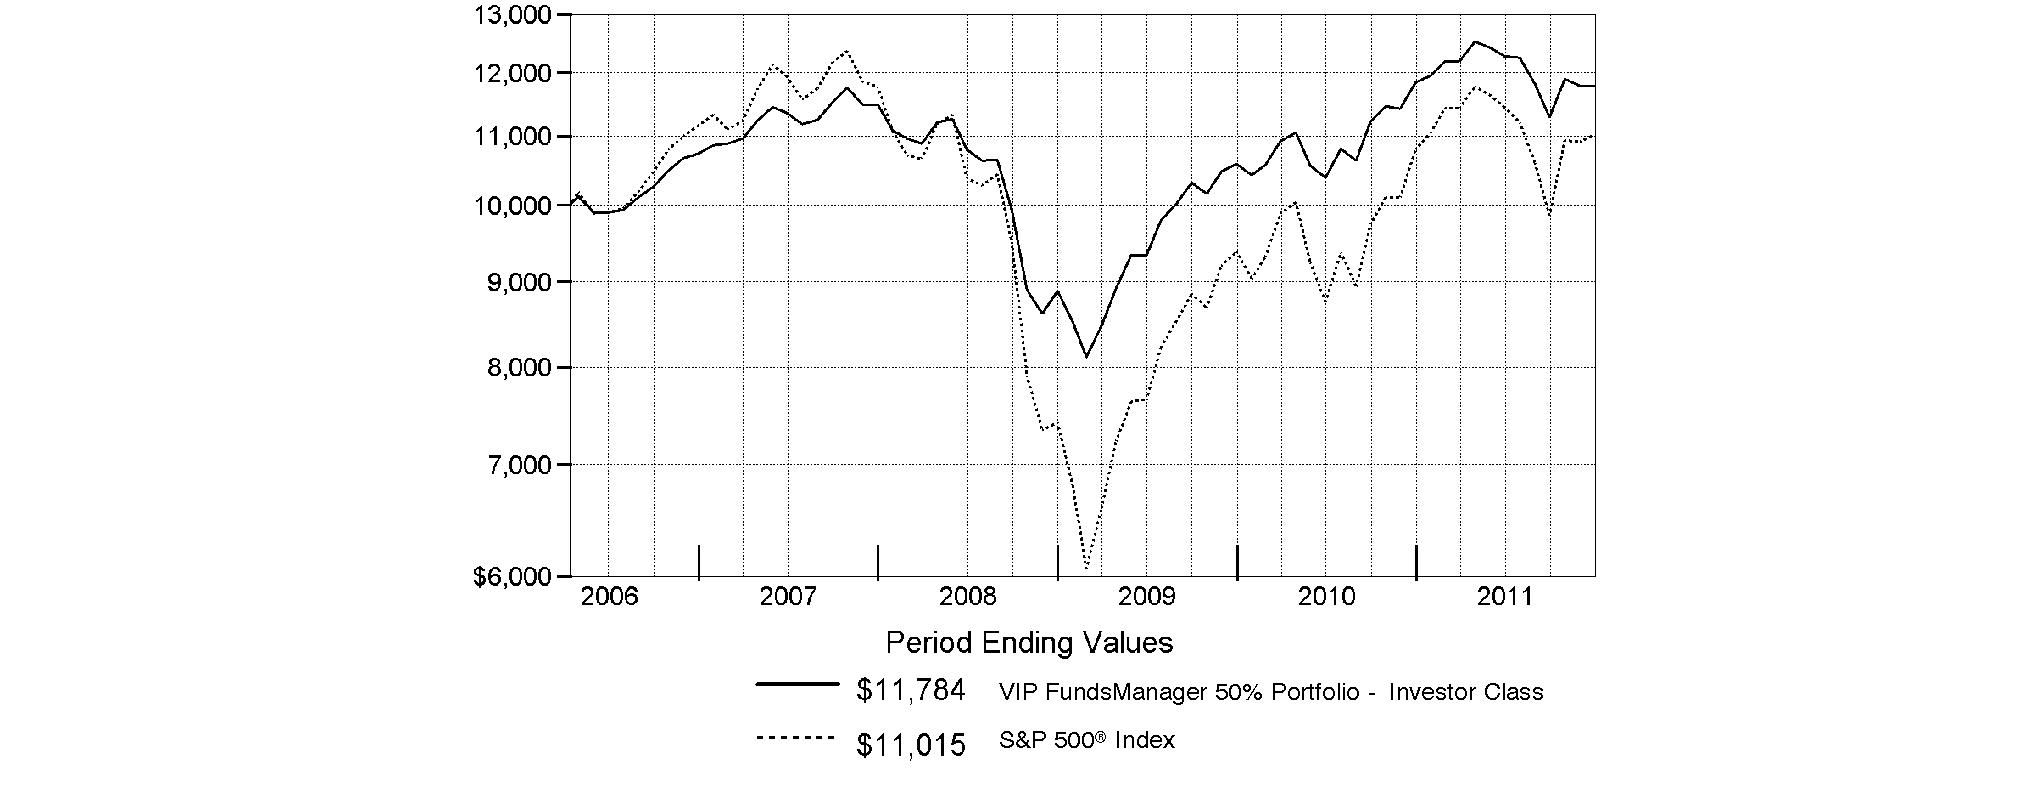
Annual Report
VIP FundsManager 60% Portfolio
Performance: The Bottom Line
Average annual total return reflects the change in the value of an investment, assuming reinvestment of the class' distributions from dividend income and capital gains (the profits earned upon the sale of securities that have grown in value, if any) and assuming a constant rate of performance each year. During periods of reimbursement by Fidelity, a fund's total return will be greater than it would be had the reimbursement not occurred. Performance numbers are net of all underlying fund operating expenses, but do not include any insurance charges imposed by your insurance company's separate account. If performance information included the effect of these additional charges, the total returns would have been lower. How a fund did yesterday is no guarantee of how it will do tomorrow.
Average Annual Total Returns
Periods ended December 31, 2011 | Past 1
year | Life of
fund A |
VIP FundsManager 60% Portfolio - Investor Class | -2.02% | 0.83% |
VIP FundsManager 60% Portfolio - Service Class | -1.92% | 0.85% |
VIP FundsManager 60% Portfolio - Service Class 2 | -2.08% | 0.71% |
A From August 22, 2007.
$10,000 Over Life of Fund
Let's say hypothetically that $10,000 was invested in VIP FundsManager 60% Portfolio - Investor Class on August 22, 2007, when the fund started. The chart shows how the value of your investment would have changed, and also shows how the S&P 500 Index performed over the same period.
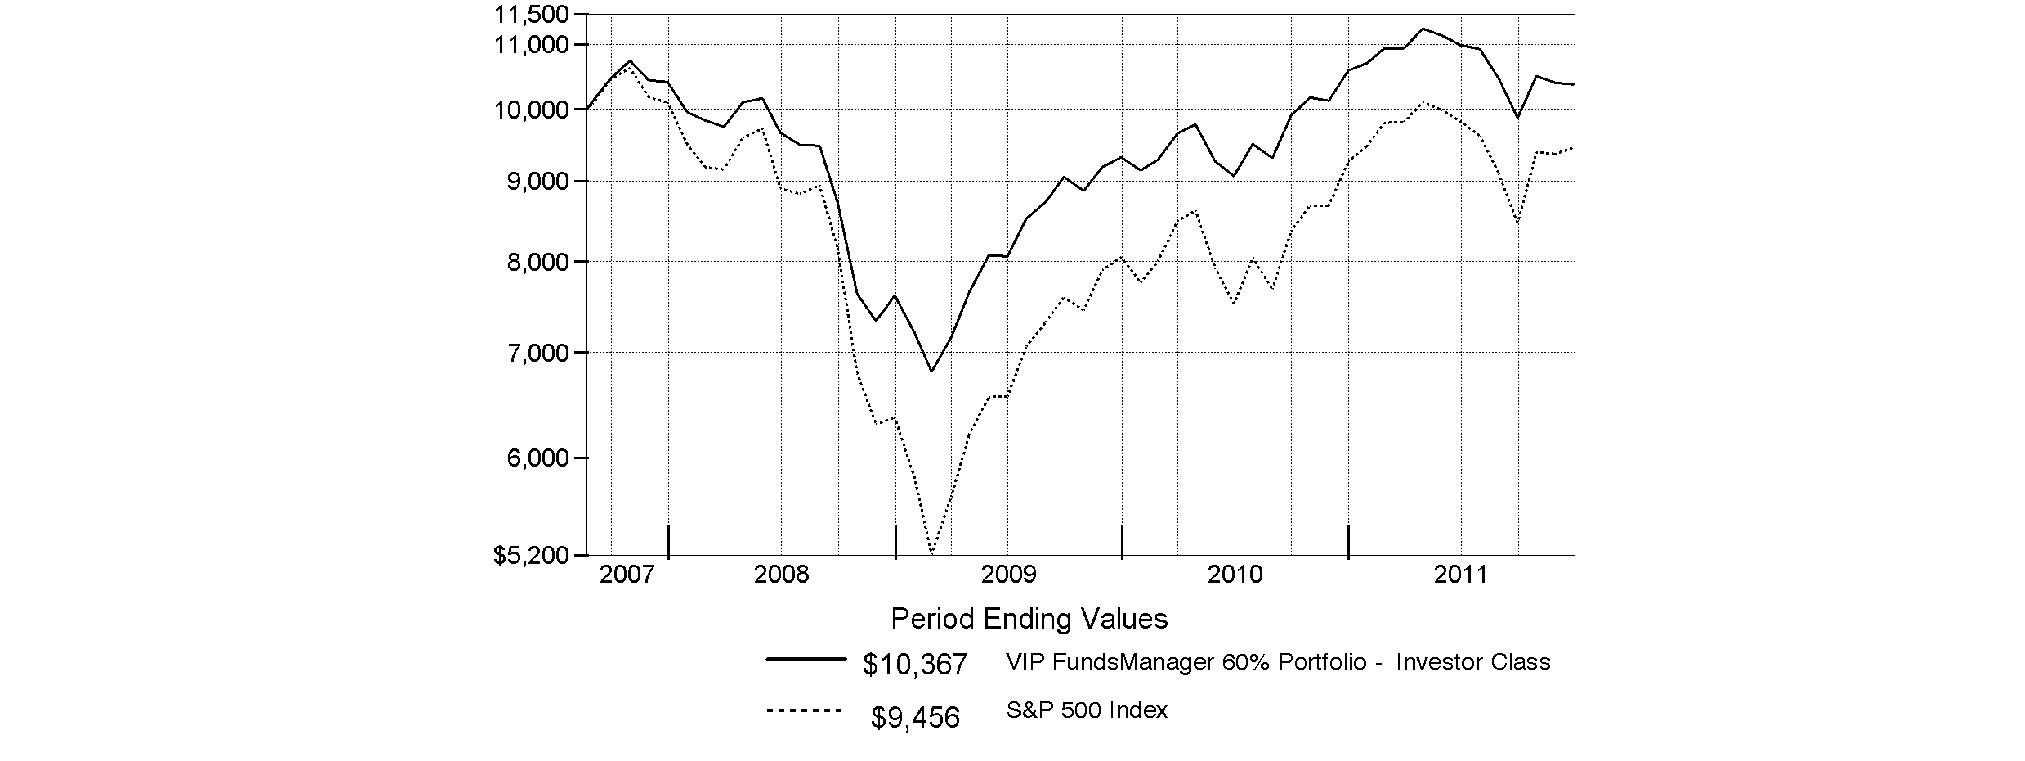
Annual Report
VIP FundsManager 70% Portfolio
Performance: The Bottom Line
Average annual total return reflects the change in the value of an investment, assuming reinvestment of the class' distributions from dividend income and capital gains (the profits earned upon the sale of securities that have grown in value, if any) and assuming a constant rate of performance each year. During periods of reimbursement by Fidelity, a fund's total return will be greater than it would be had the reimbursement not occurred. Performance numbers are net of all underlying fund operating expenses, but do not include any insurance charges imposed by your insurance company's separate account. If performance information included the effect of these additional charges, the total returns would have been lower. How a fund did yesterday is no guarantee of how it will do tomorrow.
Average Annual Total Returns
Periods ended December 31, 2011 | Past 1
year | Past 5
years | Life of fund A |
VIP FundsManager 70% Portfolio - Investor Class | -2.90% | 0.24% | 1.66% |
VIP FundsManager 70% Portfolio - Service Class | -2.79% | 0.26% | 1.68% |
VIP FundsManager 70% Portfolio - Service Class 2 | -2.94% | 0.11% | 1.52% |
A From April 13, 2006.
$10,000 Over Life of Fund
Let's say hypothetically that $10,000 was invested in VIP FundsManager 70% Portfolio - Investor Class on April 13, 2006, when the fund started. The chart shows how the value of your investment would have changed, and also shows how the S&P 500 Index performed over the same period.
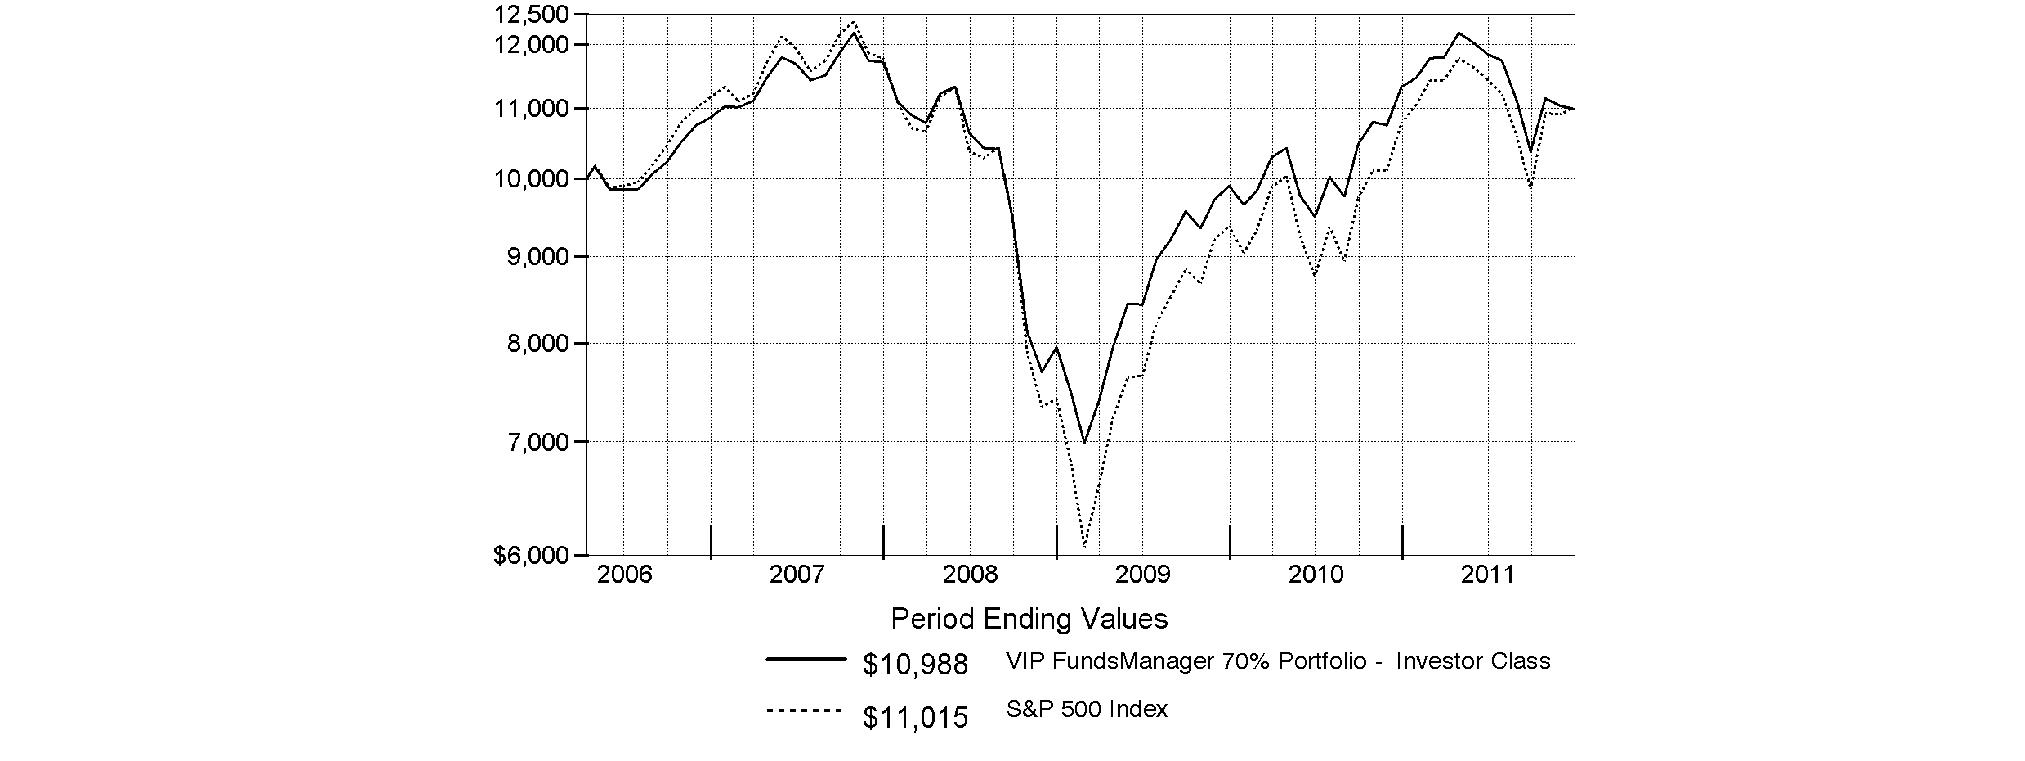
Annual Report
VIP FundsManager 85% Portfolio
Performance: The Bottom Line
Average annual total return reflects the change in the value of an investment, assuming reinvestment of the class' distributions from dividend income and capital gains (the profits earned upon the sale of securities that have grown in value, if any) and assuming a constant rate of performance each year. During periods of reimbursement by Fidelity, a fund's total return will be greater than it would be had the reimbursement not occurred. Performance numbers are net of all underlying fund operating expenses, but do not include any insurance charges imposed by your insurance company's separate account. If performance information included the effect of these additional charges, the total returns would have been lower. How a fund did yesterday is no guarantee of how it will do tomorrow.
Average Annual Total Returns
Periods ended December 31, 2011 | Past 1
year | Past 5
years | Life of fund A |
VIP FundsManager 85% Portfolio - Investor Class | -5.29% | -1.02% | 0.62% |
VIP FundsManager 85% Portfolio - Service Class | -5.30% | -1.05% | 0.60% |
VIP FundsManager 85% Portfolio - Service Class 2 | -5.44% | -1.19% | 0.46% |
A From April 13, 2006.
$10,000 Over Life of Fund
Let's say hypothetically that $10,000 was invested in VIP FundsManager 85% Portfolio - Investor Class on April 13, 2006, when the fund started. The chart shows how the value of your investment would have changed, and also shows how the S&P 500 Index performed over the same period.
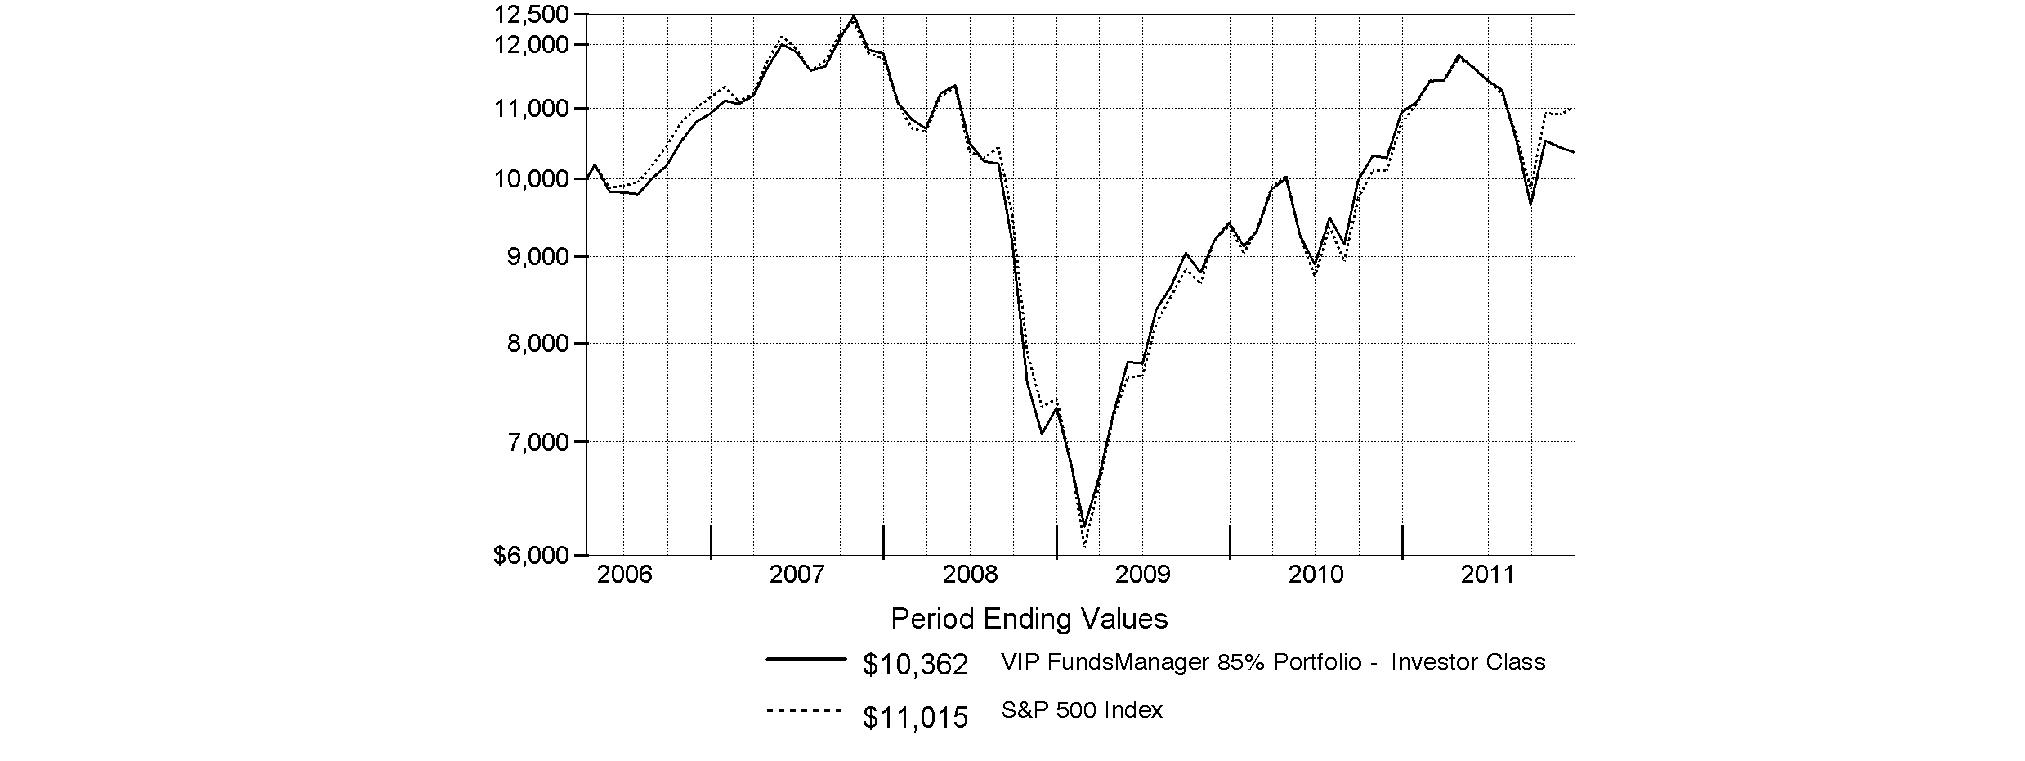
Annual Report
Market Recap: Extreme market volatility took center stage during the 12 months ending December 31, 2011, stealing the spotlight from signs of progress in the global economy. Early in the year, aggressive monetary stimulus by the U.S. federal government, improving credit-market conditions and solid corporate earnings buoyed most major asset classes. As the period progressed, however, fresh worries about sovereign debt in Europe, inflation in China, gridlock over raising the debt ceiling in the U.S. - along with Standard & Poor's early-August downgrade of the nation's long-term sovereign credit rating - and a dimmed outlook for global growth punctured investor confidence and ignited market instability. Domestic equities, as measured by the broad-based S&P 500® Index, gained 2.11%, easily outpacing the 13.61% decline of MSCI® ACWI® (All Country World Index) ex USA Index, a proxy for foreign stocks. Within the MSCI index, emerging markets declined the most (-18%), with investments here generally held back by a stronger U.S. dollar. The U.K. (-3%) fared better than the rest of Europe (-15%), which was the second-worst-performing index component. Bolstered by periodic flights to quality, U.S. investment-grade bonds posted a 7.84% advance, as reflected by the Barclays Capital® U.S. Aggregate Bond Index, outperforming the 4.37% gain of high-yield securities, as represented by The BofA Merrill LynchSM US High Yield Constrained Index. Hampered by financial woes in Europe, the sovereign debt of major developed markets outside the U.S. rose 4.86%, according to the Citigroup® Non-USD Group-of-Seven (G7) Equal Weighted Index, while the JPMorgan Emerging Markets Bond Index Global (EMBI Global) advanced 8.46%, despite the currency head wind.
Comments from Xuehai En, Portfolio Manager of VIP FundsManager® Portfolios: For the year, all classes of the VIP FundsManager Portfolios underperformed their respective Composite benchmarks. (For specific portfolio results, please refer to the performance section of this report.) Across most of the Portfolios, positive asset allocation was overwhelmed by weak security selection, especially in domestic equities. During the period's second half, investors moved out of growth and cyclical stocks, which hurt many underlying Fidelity sector and industry funds, and flocked to defensive sectors, such as utilities, consumer staples and health care. Stock picks in foreign developed markets also dampened performance, but this negative was partially offset by underweighting the asset class, which posted a double-digit decline. Security selection among investment-grade bonds was another detractor, as Spartan® U.S. Bond Index Fund slightly lagged its index. On the plus side, in addition to the favorable underweighting in foreign developed-markets equities, maintaining equal-weighted to modestly overweighted exposure to U.S. equities, on average, also helped, as this category generated a small positive return during the period. Underweighting cash - except in the 85% Portfolio, which does not have a cash target - and holding out-of-benchmark high-yield bonds provided a further boost to returns. On the downside, the Portfolios' allocation to precious metals - also not in the index - detracted because Select Gold Portfolio significantly underperformed. While the price of gold moved higher during the period, the stocks of many gold-mining companies the fund held were volatile amid the retreat from riskier assets. Lastly, a small allocation to non-index emerging-markets equities via Fidelity® Emerging Markets Fund proved unrewarding, as this asset class performed much worse in U.S. dollar terms than either U.S. or foreign developed-markets equities. Underlying U.S. equity funds that detracted included Fidelity sector and industry funds - Fidelity Select Portfolios® - with higher-risk profiles that tended to be more economically sensitive, as well as those with substantial exposure to the poor-performing financials sector, specifically: Technology Portfolio, Financial Services Portfolio, Banking Portfolio, Energy Service Portfolio, Energy Portfolio, Brokerage and Investment Management Portfolio, Automotive Portfolio and Industrials Portfolio. Among diversified funds, Fidelity Dividend Growth Fund, a large blend fund with an aggressive investment strategy that typically helps performance when the market is rising, detracted because its style was out of favor. As a group, international equity funds hampered results. Reflecting the leadership of income-oriented, defensive sectors during the period, the handful of underlying Select Portfolios that notably contributed to relative performance included: Consumer Staples Portfolio, Pharmaceuticals Portfolio, Medical Delivery Portfolio and Utilities Portfolio.
The views expressed above reflect those of the portfolio manager(s) only through the end of the period as stated on the cover of this report and do not necessarily represent the views of Fidelity or any other person in the Fidelity organization. Any such views are subject to change at any time based upon market or other conditions and Fidelity disclaims any responsibility to update such views. These views may not be relied on as investment advice and, because investment decisions for a Fidelity fund are based on numerous factors, may not be relied on as an indication of trading intent on behalf of any Fidelity fund.
Annual Report
As a shareholder of a Fund, you incur two types of costs: (1) transaction costs, and (2) ongoing costs, including distribution and/or service (12b-1) fees and other Fund expenses. This Example is intended to help you understand your ongoing costs (in dollars) of investing in the Funds and to compare these costs with the ongoing costs of investing in other mutual funds.
The Example is based on an investment of $1,000 invested at the beginning of the period and held for the entire period (July 1, 2011 to December 31, 2011).
Actual Expenses
The first line of the accompanying table for each class of each fund provides information about actual account values and actual expenses. You may use the information in this line, together with the amount you invested, to estimate the expenses that you paid over the period. Simply divide your account value by $1,000.00 (for example, an $8,600 account value divided by $1,000.00 = 8.6), then multiply the result by the number in the first line for a class of the fund under the heading entitled "Expenses Paid During Period" to estimate the expenses you paid on your account during this period. The estimate of expenses does not include any fees or other expenses of any variable annuity or variable life insurance product. If they were, the estimate of expenses you paid during the period would be higher, and your ending account value would be lower. In addition, each Fund, as a shareholder in underlying Fidelity Funds, will indirectly bear its pro-rata share of the fees and expenses incurred by the underlying Fidelity Funds. These fees and expenses are not included in each Fund's annualized expense ratio used to calculate the expense estimates in the table below.
Hypothetical Example for Comparison Purposes
The second line of the accompanying table for each class of each fund provides information about hypothetical account values and hypothetical expenses based on a Class' actual expense ratio and an assumed rate of return of 5% per year before expenses, which is not the Class' actual return. The hypothetical account values and expenses may not be used to estimate the actual ending account balance or expenses you paid for the period. You may use this information to compare the ongoing costs of investing in the Fund and other funds. To do so, compare this 5% hypothetical example with the 5% hypothetical examples that appear in the shareholder reports of the other funds. The estimate of expenses does not include any fees or other expenses of any variable annuity or variable life insurance product. If they were, the estimate of expenses you paid during the period would be higher, and your ending account value would be lower. In addition, each Fund, as a shareholder in underlying Fidelity Funds, will indirectly bear its pro-rata share of the fees and expenses incurred by the underlying Fidelity Funds. These fees and expenses are not included in each Fund's annualized expense ratio used to calculate the expense estimates in the table below.
Please note that the expenses shown in the table are meant to highlight your ongoing costs only and do not reflect any transaction costs. Therefore, the second line of the table is useful in comparing ongoing costs only, and will not help you determine the relative total costs of owning different funds.
| Annualized
Expense Ratio | Beginning
Account Value
July 1, 2011 | Ending
Account Value
December 31, 2011 | Expenses Paid
During Period*
July 1, 2011 to
December 31, 2011 |
VIP FundsManager 20% Portfolio | | | | |
Service Class | .20% | | | |
Actual | | $ 1,000.00 | $ 998.60 | $ 1.01 |
Hypothetical A | | $ 1,000.00 | $ 1,024.20 | $ 1.02 |
Service Class 2 | .35% | | | |
Actual | | $ 1,000.00 | $ 998.50 | $ 1.76 |
Hypothetical A | | $ 1,000.00 | $ 1,023.44 | $ 1.79 |
Investor Class | .20% | | | |
Actual | | $ 1,000.00 | $ 999.60 | $ 1.01 |
Hypothetical A | | $ 1,000.00 | $ 1,024.20 | $ 1.02 |
VIP FundsManager 50% Portfolio | | | | |
Service Class | .20% | | | |
Actual | | $ 1,000.00 | $ 959.40 | $ .99 |
Hypothetical A | | $ 1,000.00 | $ 1,024.20 | $ 1.02 |
Service Class 2 | .35% | | | |
Actual | | $ 1,000.00 | $ 958.70 | $ 1.73 |
Hypothetical A | | $ 1,000.00 | $ 1,023.44 | $ 1.79 |
Investor Class | .20% | | | |
Actual | | $ 1,000.00 | $ 960.40 | $ .99 |
Hypothetical A | | $ 1,000.00 | $ 1,024.20 | $ 1.02 |
| Annualized
Expense Ratio | Beginning
Account Value
July 1, 2011 | Ending
Account Value
December 31, 2011 | Expenses Paid
During Period*
July 1, 2011 to
December 31, 2011 |
VIP FundsManager 60% Portfolio | | | | |
Service Class | .20% | | | |
Actual | | $ 1,000.00 | $ 945.40 | $ .98 |
Hypothetical A | | $ 1,000.00 | $ 1,024.20 | $ 1.02 |
Service Class 2 | .35% | | | |
Actual | | $ 1,000.00 | $ 944.70 | $ 1.72 |
Hypothetical A | | $ 1,000.00 | $ 1,023.44 | $ 1.79 |
Investor Class | .20% | | | |
Actual | | $ 1,000.00 | $ 944.40 | $ .98 |
Hypothetical A | | $ 1,000.00 | $ 1,024.20 | $ 1.02 |
VIP FundsManager 70% Portfolio | | | | |
Service Class | .20% | | | |
Actual | | $ 1,000.00 | $ 929.90 | $ .97 |
Hypothetical A | | $ 1,000.00 | $ 1,024.20 | $ 1.02 |
Service Class 2 | .35% | | | |
Actual | | $ 1,000.00 | $ 928.40 | $ 1.70 |
Hypothetical A | | $ 1,000.00 | $ 1,023.44 | $ 1.79 |
Investor Class | .20% | | | |
Actual | | $ 1,000.00 | $ 928.90 | $ .97 |
Hypothetical A | | $ 1,000.00 | $ 1,024.20 | $ 1.02 |
VIP FundsManager 85% Portfolio | | | | |
Service Class | .20% | | | |
Actual | | $ 1,000.00 | $ 907.50 | $ .96 |
Hypothetical A | | $ 1,000.00 | $ 1,024.20 | $ 1.02 |
Service Class 2 | .35% | | | |
Actual | | $ 1,000.00 | $ 907.00 | $ 1.68 |
Hypothetical A | | $ 1,000.00 | $ 1,023.44 | $ 1.79 |
Investor Class | .20% | | | |
Actual | | $ 1,000.00 | $ 907.60 | $ .96 |
Hypothetical A | | $ 1,000.00 | $ 1,024.20 | $ 1.02 |
A 5% return per year before expenses
* Expenses are equal to each Class' annualized expense ratio, multiplied by the average account value over the period, multiplied by 184/ 365 (to reflect the one-half year period). The fees and expenses of the underlying Fidelity Funds in which the Fund invests are not included in each class' annualized expense ratio.
Annual Report
VIP FundsManager 20% Portfolio
Investment Changes (Unaudited)
Fund Holdings as of December 31, 2011 |
| % of fund's
net assets | % of fund's net assets
6 months ago |
Domestic Equity Funds | | |
Fidelity 130/30 Large Cap Fund | 0.0* | 0.0* |
Fidelity Air Transportation Portfolio | 0.1 | 0.1 |
Fidelity Automotive Portfolio | 0.1 | 0.1 |
Fidelity Banking Portfolio | 0.6 | 0.9 |
Fidelity Biotechnology Portfolio | 0.0* | 0.0* |
Fidelity Blue Chip Growth Fund | 0.0* | 0.0* |
Fidelity Brokerage & Investment Management Portfolio | 0.1 | 0.1 |
Fidelity Chemicals Portfolio | 0.3 | 0.3 |
Fidelity Commodity Strategy Fund | 0.0* | 0.0* |
Fidelity Communications Equipment Portfolio | 0.2 | 0.2 |
Fidelity Computers Portfolio | 0.3 | 0.3 |
Fidelity Construction & Housing Portfolio | 0.1 | 0.1 |
Fidelity Consumer Discretionary Portfolio | 0.9 | 0.9 |
Fidelity Consumer Finance Portfolio | 0.2 | 0.0 |
Fidelity Consumer Staples Portfolio | 1.6 | 1.1 |
Fidelity Contrafund | 0.1 | 0.0* |
Fidelity Defense & Aerospace Portfolio | 0.0* | 0.0* |
Fidelity Disciplined Equity Fund | 0.0* | 0.0* |
Fidelity Dividend Growth Fund | 0.1 | 0.5 |
Fidelity Electronics Portfolio | 0.4 | 0.1 |
Fidelity Energy Portfolio | 1.0 | 0.8 |
Fidelity Energy Service Portfolio | 0.1 | 0.9 |
Fidelity Environmental & Alternative Energy Portfolio | 0.0* | 0.0* |
Fidelity Equity-Income Fund | 0.0* | 0.0* |
Fidelity Equity-Income II Fund | 0.0* | 0.0* |
Fidelity Financial Services Portfolio | 0.3 | 0.1 |
Fidelity Fund | 0.0* | 0.0* |
Fidelity Global Commodity Stock Fund | 0.0* | 0.1 |
Fidelity Gold Portfolio | 1.4 | 0.8 |
Fidelity Growth Company Fund | 0.0* | 0.0* |
Fidelity Health Care Portfolio | 1.1 | 1.3 |
Fidelity Independence Fund | 0.0* | 0.0* |
Fidelity Industrial Equipment Portfolio | 0.4 | 0.3 |
Fidelity Industrials Portfolio | 0.9 | 0.6 |
Fidelity Insurance Portfolio | 0.5 | 0.7 |
Fidelity IT Services Portfolio | 0.3 | 0.1 |
Fidelity Large Cap Stock Fund | 0.1 | 0.1 |
|
| % of fund's
net assets | % of fund's net assets
6 months ago |
Fidelity Large Cap Value Fund | 0.0* | 0.0* |
Fidelity Leisure Portfolio | 0.1 | 0.1 |
Fidelity Leveraged Company Stock Fund | 0.0* | 0.0* |
Fidelity Magellan Fund | 0.0* | 0.0* |
Fidelity Materials Portfolio | 0.0* | 0.0* |
Fidelity Medical Delivery Portfolio | 0.3 | 0.4 |
Fidelity Medical Equipment & Systems Portfolio | 0.1 | 0.1 |
Fidelity Mega Cap Stock Fund | 0.2 | 0.2 |
Fidelity Mid-Cap Stock Fund | 0.0* | 0.0* |
Fidelity Multimedia Portfolio | 0.2 | 0.2 |
Fidelity Natural Resources Portfolio | 0.0* | 0.0* |
Fidelity Pharmaceuticals Portfolio | 0.4 | 0.5 |
Fidelity Real Estate Investment Portfolio | 0.3 | 0.3 |
Fidelity Retailing Portfolio | 0.2 | 0.2 |
Fidelity Small Cap Growth Fund | 0.0* | 0.0* |
Fidelity Small Cap Stock Fund | 0.0* | 0.0* |
Fidelity Small Cap Value Fund | 0.0* | 0.0* |
Fidelity Software & Computer Services Portfolio | 1.1 | 0.4 |
Fidelity Technology Portfolio | 0.6 | 0.8 |
Fidelity Telecom and Utilities Fund | 0.5 | 0.6 |
Fidelity Telecommunications Portfolio | 0.5 | 0.4 |
Fidelity Transportation Portfolio | 0.1 | 0.1 |
Fidelity Utilities Portfolio | 0.3 | 0.1 |
Spartan Extended Market Index Fund Investor Class | 0.1 | 0.1 |
Spartan Total Market Index Fund Investor Class | 0.0* | 0.0* |
VIP Energy Portfolio Investor Class | 0.5 | 0.0* |
VIP Mid Cap Portfolio Investor Class | 0.0* | 0.0* |
| 16.7 | 15.0 |
International Equity Funds | | |
Fidelity Canada Fund | 0.1 | 0.1 |
Fidelity Diversified International Fund | 0.5 | 0.2 |
Fidelity Emerging Asia Fund | 0.5 | 0.6 |
Fidelity Emerging Markets Fund | 0.0* | 0.0* |
Fidelity International Capital Appreciation Fund | 0.0* | 0.0* |
Fidelity International Discovery Fund | 0.4 | 0.4 |
Fund Holdings as of December 31, 2011 - continued |
| % of fund's
net assets | % of fund's net assets
6 months ago |
Fidelity International Real Estate Fund | 0.0* | 0.1 |
Fidelity International Small Cap Fund | 0.1 | 0.2 |
Fidelity International Small Cap Opportunities Fund | 0.4 | 0.6 |
Fidelity International Value Fund | 0.4 | 0.5 |
Fidelity Japan Fund | 0.1 | 0.1 |
Fidelity Japan Smaller Companies Fund | 0.2 | 0.1 |
Fidelity Nordic Fund | 0.3 | 0.5 |
Fidelity Overseas Fund | 0.0* | 0.0* |
Fidelity Pacific Basin Fund | 0.2 | 0.2 |
Spartan International Index Fund Investor Class | 1.4 | 1.5 |
| 4.6 | 5.1 |
Fixed-Income Funds | | |
Fidelity Floating Rate High Income Fund | 2.9 | 3.4 |
Fidelity Focused High Income Fund | 0.3 | 0.3 |
Fidelity High Income Fund | 2.1 | 2.6 |
Fidelity New Markets Income Fund | 0.9 | 1.0 |
Fidelity Real Estate Income Fund | 0.4 | 0.5 |
Spartan U.S. Bond Index Fund Investor Class | 50.1 | 47.7 |
| 56.7 | 55.5 |
Money Market Funds | | |
Fidelity Institutional Money Market Portfolio Class I | 2.4 | 2.8 |
Fidelity Institutional Prime Money Market Portfolio Class I | 17.2 | 18.9 |
Fidelity Select Money Market Portfolio | 2.4 | 2.7 |
| 22.0 | 24.4 |
Net Other Assets (Liabilities)* | 0.0 | 0.0 |
| 100.0 | 100.0 |
* Amount represents less than 0.1%
Asset Allocation (% of fund's net assets) |
As of December 31, 2011 |
| Domestic Equity Funds | 16.7% | |
| International Equity Funds | 4.6% | |
| Fixed Income Funds | 56.7% | |
| Money Market Funds | 22.0% | |

As of June 30, 2011 |
| Domestic Equity Funds | 15.0% | |
| International Equity Funds | 5.1% | |
| Fixed Income Funds | 55.5% | |
| Money Market Funds | 24.4% | |

Annual Report
VIP FundsManager 20% Portfolio
Investments December 31, 2011
Showing Percentage of Net Assets
Equity Funds - 21.3% |
| Shares | | Value |
Domestic Equity Funds - 16.7% |
Fidelity 130/30 Large Cap Fund | 2,955 | | $ 20,565 |
Fidelity Air Transportation Portfolio | 7,451 | | 257,283 |
Fidelity Automotive Portfolio | 7,838 | | 244,228 |
Fidelity Banking Portfolio | 196,896 | | 3,144,429 |
Fidelity Biotechnology Portfolio | 1,155 | | 99,451 |
Fidelity Blue Chip Growth Fund | 501 | | 21,244 |
Fidelity Brokerage & Investment Management Portfolio | 14,091 | | 563,068 |
Fidelity Chemicals Portfolio | 18,201 | | 1,731,803 |
Fidelity Commodity Strategy Fund | 1,164 | | 9,769 |
Fidelity Communications Equipment Portfolio | 44,194 | | 974,913 |
Fidelity Computers Portfolio (a) | 31,701 | | 1,708,393 |
Fidelity Construction & Housing Portfolio | 17,963 | | 643,449 |
Fidelity Consumer Discretionary Portfolio | 200,915 | | 4,633,091 |
Fidelity Consumer Finance Portfolio | 106,296 | | 1,173,504 |
Fidelity Consumer Staples Portfolio | 121,200 | | 8,660,932 |
Fidelity Contrafund | 3,266 | | 220,302 |
Fidelity Defense & Aerospace Portfolio | 1,199 | | 93,512 |
Fidelity Disciplined Equity Fund | 2,072 | | 44,568 |
Fidelity Dividend Growth Fund | 17,849 | | 461,765 |
Fidelity Electronics Portfolio | 46,334 | | 2,048,408 |
Fidelity Energy Portfolio | 108,319 | | 5,344,474 |
Fidelity Energy Service Portfolio | 7,082 | | 460,540 |
Fidelity Environmental & Alternative Energy Portfolio | 10,899 | | 164,253 |
Fidelity Equity-Income Fund | 679 | | 28,043 |
Fidelity Equity-Income II Fund | 693 | | 12,061 |
Fidelity Financial Services Portfolio | 36,585 | | 1,789,388 |
Fidelity Fund | 645 | | 20,106 |
Fidelity Global Commodity Stock Fund | 8,615 | | 120,095 |
Fidelity Gold Portfolio | 176,370 | | 7,448,106 |
Fidelity Growth Company Fund | 1,139 | | 92,098 |
Fidelity Health Care Portfolio | 49,818 | | 6,095,676 |
Fidelity Independence Fund | 310 | | 6,716 |
Fidelity Industrial Equipment Portfolio | 65,471 | | 2,028,276 |
Fidelity Industrials Portfolio | 211,445 | | 4,611,612 |
Fidelity Insurance Portfolio | 63,122 | | 2,800,095 |
Fidelity IT Services Portfolio | 83,432 | | 1,774,590 |
Fidelity Large Cap Stock Fund | 13,392 | | 229,677 |
Fidelity Large Cap Value Fund | 9,978 | | 102,678 |
Fidelity Leisure Portfolio | 3,104 | | 299,141 |
Fidelity Leveraged Company Stock Fund | 195 | | 4,895 |
Fidelity Magellan Fund | 377 | | 23,753 |
Fidelity Materials Portfolio | 788 | | 48,407 |
Fidelity Medical Delivery Portfolio (a) | 31,868 | | 1,745,105 |
|
| Shares | | Value |
Fidelity Medical Equipment & Systems Portfolio | 14,326 | | $ 361,008 |
Fidelity Mega Cap Stock Fund | 86,104 | | 869,647 |
Fidelity Mid-Cap Stock Fund | 2,047 | | 54,577 |
Fidelity Multimedia Portfolio | 22,470 | | 967,351 |
Fidelity Natural Resources Portfolio | 3,159 | | 98,850 |
Fidelity Pharmaceuticals Portfolio | 166,993 | | 2,267,763 |
Fidelity Real Estate Investment Portfolio | 57,339 | | 1,583,700 |
Fidelity Retailing Portfolio | 23,875 | | 1,222,895 |
Fidelity Small Cap Growth Fund | 8,138 | | 121,336 |
Fidelity Small Cap Stock Fund | 3,102 | | 51,315 |
Fidelity Small Cap Value Fund | 13,783 | | 192,686 |
Fidelity Software & Computer Services Portfolio | 76,743 | | 5,954,472 |
Fidelity Technology Portfolio (a) | 36,746 | | 3,177,421 |
Fidelity Telecom and Utilities Fund | 160,673 | | 2,786,075 |
Fidelity Telecommunications Portfolio | 56,968 | | 2,495,754 |
Fidelity Transportation Portfolio | 10,703 | | 528,628 |
Fidelity Utilities Portfolio | 33,487 | | 1,792,556 |
Spartan Extended Market Index Fund Investor Class | 6,246 | | 221,477 |
Spartan Total Market Index Fund Investor Class | 3,385 | | 122,254 |
VIP Energy Portfolio Investor Class | 139,023 | | 2,609,463 |
VIP Mid Cap Portfolio Investor Class | 79 | | 2,303 |
TOTAL DOMESTIC EQUITY FUNDS | | 89,485,993 |
International Equity Funds - 4.6% |
Fidelity Canada Fund | 10,072 | | 505,000 |
Fidelity Diversified International Fund | 113,521 | | 2,897,059 |
Fidelity Emerging Asia Fund | 104,609 | | 2,634,056 |
Fidelity Emerging Markets Fund | 8,036 | | 164,889 |
Fidelity International Capital Appreciation Fund | 10,502 | | 116,777 |
Fidelity International Discovery Fund | 75,992 | | 2,098,139 |
Fidelity International Real Estate Fund | 31,129 | | 216,348 |
Fidelity International Small Cap Fund | 32,014 | | 560,891 |
Fidelity International Small Cap Opportunities Fund | 228,196 | | 2,110,815 |
Fidelity International Value Fund | 286,424 | | 1,873,214 |
Fidelity Japan Fund | 44,870 | | 412,805 |
Fidelity Japan Smaller Companies Fund | 89,616 | | 766,220 |
Fidelity Nordic Fund | 62,258 | | 1,666,016 |
Fidelity Overseas Fund | 436 | | 11,555 |
Fidelity Pacific Basin Fund | 40,095 | | 859,626 |
Spartan International Index Fund Investor Class | 254,367 | | 7,567,408 |
TOTAL INTERNATIONAL EQUITY FUNDS | | 24,460,818 |
TOTAL EQUITY FUNDS (Cost $109,121,833) |
113,946,811
|
Fixed-Income Funds - 56.7% |
| Shares | | Value |
Fidelity Floating Rate High Income Fund | 1,595,963 | | $ 15,385,086 |
Fidelity Focused High Income Fund | 160,834 | | 1,439,464 |
Fidelity High Income Fund | 1,321,573 | | 11,418,394 |
Fidelity New Markets Income Fund | 309,490 | | 4,899,231 |
Fidelity Real Estate Income Fund | 221,168 | | 2,266,968 |
Spartan U.S. Bond Index Fund Investor Class | 22,727,352 | | 267,728,208 |
TOTAL FIXED-INCOME FUNDS (Cost $287,978,584) |
303,137,351
|
Money Market Funds - 22.0% |
| | | |
Fidelity Institutional Money Market Portfolio Class I | 13,168,911 | | 13,168,911 |
Fidelity Institutional Prime Money Market Portfolio Class I | 91,889,711 | | 91,889,711 |
Fidelity Select Money Market Portfolio | 12,949,286 | | 12,949,286 |
TOTAL MONEY MARKET FUNDS (Cost $118,007,908) |
118,007,908
|
TOTAL INVESTMENT PORTFOLIO - 100.0% (Cost $515,108,325) | | 535,092,070 |
NET OTHER ASSETS (LIABILITIES) - 0.0% | | (87,607) |
NET ASSETS - 100% | $ 535,004,463 |
Legend |
(a) Non-income producing |
Other Information |
All investments are categorized as Level 1 under the Fair Value Hierarchy. The inputs or methodology used for valuing securities may not be an indication of the risk associated with investing in those securities. For more information on valuation inputs, please refer to the Security Valuation section in the accompanying Notes to Financial Statements. |
See accompanying notes which are an integral part of the financial statements.
Annual Report
VIP FundsManager 20% Portfolio
Statement of Assets and Liabilities
| December 31, 2011 |
| | |
Assets | | |
Investment in securities, at value (cost $515,108,325) - See accompanying schedule | | $ 535,092,070 |
Receivable for fund shares sold | | 743,563 |
Total assets | | 535,835,633 |
| | |
Liabilities | | |
Payable to custodian bank | $ 10 | |
Payable for investments purchased | 743,550 | |
Payable for fund shares redeemed | 13 | |
Accrued management fee | 87,427 | |
Distribution and service plan fees payable | 170 | |
Total liabilities | | 831,170 |
| | |
Net Assets | | $ 535,004,463 |
Net Assets consist of: | | |
Paid in capital | | $ 520,599,703 |
Accumulated undistributed net realized gain (loss) on investments | | (5,578,985) |
Net unrealized appreciation (depreciation) on investments | | 19,983,745 |
Net Assets | | $ 535,004,463 |
Statement of Assets and Liabilities - continued
| December 31, 2011 |
| | |
Service Class:
Net Asset Value, offering price and redemption price per share ($64,250 ÷ 6,014 shares) | | $ 10.68 |
| | |
Service Class 2:
Net Asset Value, offering price and redemption price per share ($1,372,701 ÷ 128,689 shares) | | $ 10.67 |
| | |
Investor Class:
Net Asset Value, offering price and redemption price per share ($533,567,512 ÷ 49,971,539 shares) | | $ 10.68 |
See accompanying notes which are an integral part of the financial statements.
Annual Report
VIP FundsManager 20% Portfolio
Financial Statements - continued
Statement of Operations
| Year ended December 31, 2011 |
| | |
Investment Income | | |
Income distributions from underlying funds | | $ 9,538,314 |
| | |
Expenses | | |
Management fee | $ 1,165,068 | |
Distribution and service plan fees | 2,609 | |
Independent trustees' compensation | 1,633 | |
Total expenses before reductions | 1,169,310 | |
Expense reductions | (234,665) | 934,645 |
Net investment income (loss) | | 8,603,669 |
Realized and Unrealized Gain (Loss) Realized gain (loss) on sale of underlying fund shares | 3,495,385 | |
Capital gain distributions from underlying funds | 3,580,682 | |
Total net realized gain (loss) | | 7,076,067 |
Change in net unrealized appreciation (depreciation) on underlying funds | | (5,837,126) |
Net gain (loss) | | 1,238,941 |
Net increase (decrease) in net assets resulting from operations | | $ 9,842,610 |
Statement of Changes in Net Assets
| Year ended
December 31, 2011 | Year ended
December 31, 2010 |
Increase (Decrease) in Net Assets | | |
Operations | | |
Net investment income (loss) | $ 8,603,669 | $ 6,065,820 |
Net realized gain (loss) | 7,076,067 | 2,867,619 |
Change in net unrealized appreciation (depreciation) | (5,837,126) | 15,177,948 |
Net increase (decrease) in net assets resulting from operations | 9,842,610 | 24,111,387 |
Distributions to shareholders from net investment income | (8,600,023) | (6,084,767) |
Distributions to shareholders from net realized gain | (983,033) | (470,898) |
Total distributions | (9,583,056) | (6,555,665) |
Share transactions - net increase (decrease) | 142,882,053 | 102,969,202 |
Total increase (decrease) in net assets | 143,141,607 | 120,524,924 |
| | |
Net Assets | | |
Beginning of period | 391,862,856 | 271,337,932 |
End of period | $ 535,004,463 | $ 391,862,856 |
See accompanying notes which are an integral part of the financial statements.
Annual Report
Financial Highlights - Service Class
Years ended December 31, | 2011 | 2010 | 2009 | 2008 | 2007 |
Selected Per-Share Data | | | | | |
Net asset value, beginning of period | $ 10.63 | $ 10.07 | $ 9.27 | $ 10.48 | $ 10.34 |
Income from Investment Operations | | | | | |
Net investment income (loss) C | .20 | .19 | .21 | .34 | .45 |
Net realized and unrealized gain (loss) | .05 | .55 | .76 | (1.21) | .18 |
Total from investment operations | .25 | .74 | .97 | (.87) | .63 |
Distributions from net investment income | (.18) | (.17) | (.16) | (.30) | (.29) |
Distributions from net realized gain | (.02) | (.01) | (.01) | (.04) | (.20) |
Total distributions | (.20) | (.18) | (.17) G | (.34) F | (.49) |
Net asset value, end of period | $ 10.68 | $ 10.63 | $ 10.07 | $ 9.27 | $ 10.48 |
Total Return A,B | 2.30% | 7.36% | 10.43% | (8.33)% | 6.12% |
Ratios to Average Net Assets D,E | | | | | |
Expenses before reductions | .35% | .35% | .35% | .35% | .35% |
Expenses net of fee waivers, if any | .20% | .20% | .20% | .20% | .20% |
Expenses net of all reductions | .20% | .20% | .20% | .20% | .20% |
Net investment income (loss) | 1.84% | 1.84% | 2.19% | 3.33% | 4.20% |
Supplemental Data | | | | | |
Net assets, end of period (000 omitted) | $ 64 | $ 67 | $ 61 | $ 88 | $ 112 |
Portfolio turnover rate | 12% | 14% | 31% | 64% | 76% |
A Total returns do not reflect charges attributable to your insurance company's separate account. Inclusion of these charges would reduce the total returns shown.
B Total returns would have been lower if certain expenses had not been reduced during the applicable periods shown.
C Calculated based on average shares outstanding during the period.
D Amounts do not include the activity of the Underlying Funds.
E Expense ratios reflect operating expenses of the class. Expenses before reductions do not reflect amounts reimbursed by the investment adviser or reductions from expense offset arrangements and do not represent the amount paid by the class during periods when reimbursements or reductions occur. Expenses net of fee waivers reflect expenses after reimbursement by the investment adviser but prior to reductions from expense offset arrangements. Expenses net of all reductions represent the net expenses paid by the class but do not include expenses of the investment companies in which the Fund invests.
F Total distributions of $.34 per share is comprised of distributions from net investment income of $.302 and distributions from net realized gain of $.035 per share.
G Total distributions of $.17 per share is comprised of distributions from net investment income of $.161 and distributions from net realized gain of $.006 per share.
Financial Highlights - Service Class 2
Years ended December 31, | 2011 | 2010 | 2009 | 2008 | 2007 |
Selected Per-Share Data | | | | | |
Net asset value, beginning of period | $ 10.62 | $ 10.06 | $ 9.28 | $ 10.48 | $ 10.34 |
Income from Investment Operations | | | | | |
Net investment income (loss) C | .18 | .18 | .20 | .32 | .43 |
Net realized and unrealized gain (loss) | .05 | .55 | .74 | (1.20) | .18 |
Total from investment operations | .23 | .73 | .94 | (.88) | .61 |
Distributions from net investment income | (.16) | (.16) | (.16) | (.29) | (.27) |
Distributions from net realized gain | (.02) | (.01) | (.01) | (.04) | (.20) |
Total distributions | (.18) | (.17) | (.16) G | (.32) F | (.47) |
Net asset value, end of period | $ 10.67 | $ 10.62 | $ 10.06 | $ 9.28 | $ 10.48 |
Total Return A,B | 2.20% | 7.24% | 10.14% | (8.40)% | 5.96% |
Ratios to Average Net Assets D,E | | | | | |
Expenses before reductions | .50% | .50% | .50% | .50% | .50% |
Expenses net of fee waivers, if any | .35% | .35% | .35% | .35% | .35% |
Expenses net of all reductions | .35% | .35% | .35% | .35% | .35% |
Net investment income (loss) | 1.69% | 1.69% | 2.04% | 3.18% | 4.05% |
Supplemental Data | | | | | |
Net assets, end of period (000 omitted) | $ 1,373 | $ 569 | $ 425 | $ 88 | $ 112 |
Portfolio turnover rate | 12% | 14% | 31% | 64% | 76% |
A Total returns do not reflect charges attributable to your insurance company's separate account. Inclusion of these charges would reduce the total returns shown.
B Total returns would have been lower if certain expenses had not been reduced during the applicable periods shown.
C Calculated based on average shares outstanding during the period.
D Amounts do not include the activity of the Underlying Funds.
E Expense ratios reflect operating expenses of the class. Expenses before reductions do not reflect amounts reimbursed by the investment adviser or reductions from expense offset arrangements and do not represent the amount paid by the class during periods when reimbursements or reductions occur. Expenses net of fee waivers reflect expenses after reimbursement by the investment adviser but prior to reductions from expense offset arrangements. Expenses net of all reductions represent the net expenses paid by the class but do not include expenses of the investment companies in which the Fund invests.
F Total distributions of $.32 per share is comprised of distributions from net investment income of $.285 and distributions from net realized gain of $.035 per share.
G Total distributions of $.16 per share is comprised of distributions from net investment income of $.155 and distributions from net realized gain of $.006 per share.
See accompanying notes which are an integral part of the financial statements.
Annual Report
Financial Highlights - Investor Class
Years ended December 31, | 2011 | 2010 | 2009 | 2008 | 2007 |
Selected Per-Share Data | | | | | |
Net asset value, beginning of period | $ 10.63 | $ 10.06 | $ 9.27 | $ 10.48 | $ 10.34 |
Income from Investment Operations | | | | | |
Net investment income (loss) C | .20 | .19 | .21 | .33 | .45 |
Net realized and unrealized gain (loss) | .05 | .56 | .75 | (1.20) | .18 |
Total from investment operations | .25 | .75 | .96 | (.87) | .63 |
Distributions from net investment income | (.18) | (.17) | (.16) | (.30) | (.29) |
Distributions from net realized gain | (.02) | (.01) | (.01) | (.04) | (.20) |
Total distributions | (.20) | (.18) | (.17) G | (.34) F | (.49) |
Net asset value, end of period | $ 10.68 | $ 10.63 | $ 10.06 | $ 9.27 | $ 10.48 |
Total Return A,B | 2.31% | 7.47% | 10.32% | (8.33)% | 6.12% |
Ratios to Average Net Assets D,E | | | | | |
Expenses before reductions | .25% | .25% | .25% | .25% | .25% |
Expenses net of fee waivers, if any | .20% | .20% | .20% | .20% | .20% |
Expenses net of all reductions | .20% | .20% | .20% | .20% | .20% |
Net investment income (loss) | 1.84% | 1.84% | 2.19% | 3.33% | 4.20% |
Supplemental Data | | | | | |
Net assets, end of period (000 omitted) | $ 533,568 | $ 391,226 | $ 270,852 | $ 153,110 | $ 115,963 |
Portfolio turnover rate | 12% | 14% | 31% | 64% | 76% |
A Total returns do not reflect charges attributable to your insurance company's separate account. Inclusion of these charges would reduce the total returns shown.
B Total returns would have been lower if certain expenses had not been reduced during the applicable periods shown.
C Calculated based on average shares outstanding during the period.
D Amounts do not include the activity of the Underlying Funds.
E Expense ratios reflect operating expenses of the class. Expenses before reductions do not reflect amounts reimbursed by the investment adviser or reductions from expense offset arrangements and do not represent the amount paid by the class during periods when reimbursements or reductions occur. Expenses net of fee waivers reflect expenses after reimbursement by the investment adviser but prior to reductions from expense offset arrangements. Expenses net of all reductions represent the net expenses paid by the class but do not include expenses of the investment companies in which the Fund invests.
F Total distributions of $.34 per share is comprised of distributions from net investment income of $.302 and distributions from net realized gain of $.035 per share.
G Total distributions of $.17 per share is comprised of distributions from net investment income of $.161 and distributions from net realized gain of $.006 per share.
See accompanying notes which are an integral part of the financial statements.
Annual Report
VIP FundsManager 50% Portfolio
Investment Changes (Unaudited)
Fund Holdings as of December 31, 2011 |
| % of fund's
net assets | % of fund's net assets
6 months ago |
Domestic Equity Funds | | |
Fidelity 130/30 Large Cap Fund | 0.0* | 0.0* |
Fidelity Air Transportation Portfolio | 0.1 | 0.1 |
Fidelity Automotive Portfolio | 0.2 | 0.4 |
Fidelity Banking Portfolio | 1.0 | 1.2 |
Fidelity Biotechnology Portfolio | 0.4 | 0.4 |
Fidelity Blue Chip Growth Fund | 0.3 | 0.4 |
Fidelity Brokerage & Investment Management Portfolio | 0.3 | 0.4 |
Fidelity Chemicals Portfolio | 0.4 | 0.4 |
Fidelity Commodity Strategy Fund | 0.0* | 0.0* |
Fidelity Communications Equipment Portfolio | 0.2 | 0.2 |
Fidelity Computers Portfolio | 0.9 | 0.7 |
Fidelity Construction & Housing Portfolio | 0.4 | 0.4 |
Fidelity Consumer Discretionary Portfolio | 1.3 | 1.0 |
Fidelity Consumer Finance Portfolio | 0.1 | 0.0* |
Fidelity Consumer Staples Portfolio | 3.4 | 2.9 |
Fidelity Contrafund | 0.1 | 0.1 |
Fidelity Defense & Aerospace Portfolio | 0.1 | 0.1 |
Fidelity Disciplined Equity Fund | 0.0* | 0.0* |
Fidelity Dividend Growth Fund | 0.8 | 1.3 |
Fidelity Electronics Portfolio | 0.5 | 0.1 |
Fidelity Energy Portfolio | 2.3 | 2.2 |
Fidelity Energy Service Portfolio | 0.7 | 1.6 |
Fidelity Environmental & Alternative Energy Portfolio | 0.2 | 0.2 |
Fidelity Equity-Income Fund | 0.0* | 0.0* |
Fidelity Equity-Income II Fund | 0.0* | 0.0* |
Fidelity Financial Services Portfolio | 1.2 | 1.2 |
Fidelity Fund | 0.1 | 0.1 |
Fidelity Global Commodity Stock Fund | 0.1 | 0.1 |
Fidelity Gold Portfolio | 1.2 | 1.0 |
Fidelity Growth Company Fund | 0.8 | 0.8 |
Fidelity Health Care Portfolio | 1.0 | 0.9 |
Fidelity Independence Fund | 0.0* | 0.0* |
Fidelity Industrial Equipment Portfolio | 0.8 | 0.9 |
Fidelity Industrials Portfolio | 1.3 | 1.4 |
Fidelity Insurance Portfolio | 1.4 | 1.1 |
Fidelity IT Services Portfolio | 0.6 | 0.3 |
Fidelity Large Cap Stock Fund | 0.2 | 0.3 |
|
| % of fund's
net assets | % of fund's net assets
6 months ago |
Fidelity Large Cap Value Fund | 0.0* | 0.0* |
Fidelity Leisure Portfolio | 0.4 | 0.5 |
Fidelity Leveraged Company Stock Fund | 0.0* | 0.0* |
Fidelity Magellan Fund | 0.0* | 0.0* |
Fidelity Materials Portfolio | 0.0* | 0.0* |
Fidelity Medical Delivery Portfolio | 1.0 | 1.1 |
Fidelity Medical Equipment & Systems Portfolio | 0.1 | 0.1 |
Fidelity Mega Cap Stock Fund | 0.2 | 0.3 |
Fidelity Mid Cap Value Fund | 0.0* | 0.3 |
Fidelity Mid-Cap Stock Fund | 0.0* | 0.0* |
Fidelity Multimedia Portfolio | 0.4 | 0.4 |
Fidelity Nasdaq Composite Index Fund | 0.0* | 0.0* |
Fidelity Natural Resources Portfolio | 0.1 | 0.1 |
Fidelity Pharmaceuticals Portfolio | 1.4 | 1.4 |
Fidelity Real Estate Investment Portfolio | 0.4 | 0.4 |
Fidelity Retailing Portfolio | 0.9 | 0.3 |
Fidelity Small Cap Growth Fund | 0.0* | 0.0* |
Fidelity Small Cap Stock Fund | 0.0* | 0.0* |
Fidelity Small Cap Value Fund | 0.0* | 0.0* |
Fidelity Software & Computer Services Portfolio | 1.0 | 0.5 |
Fidelity Technology Portfolio | 2.9 | 3.2 |
Fidelity Telecom and Utilities Fund | 0.8 | 0.8 |
Fidelity Telecommunications Portfolio | 1.1 | 0.7 |
Fidelity Transportation Portfolio | 0.3 | 0.4 |
Fidelity Utilities Portfolio | 1.0 | 0.6 |
Spartan 500 Index Fund Investor Class | 0.0* | 0.0* |
Spartan Extended Market Index Fund Investor Class | 1.2 | 1.3 |
Spartan Total Market Index Fund Investor Class | 1.3 | 1.4 |
VIP Mid Cap Portfolio Investor Class | 0.2 | 0.3 |
| 37.1 | 36.3 |
International Equity Funds | | |
Fidelity Canada Fund | 0.5 | 0.5 |
Fidelity China Region Fund | 0.1 | 0.1 |
Fidelity Diversified International Fund | 0.6 | 0.2 |
Fidelity Emerging Asia Fund | 0.7 | 0.7 |
Fidelity Emerging Markets Fund | 0.3 | 0.4 |
Fund Holdings as of December 31, 2011 - continued |
| % of fund's
net assets | % of fund's net assets
6 months ago |
Fidelity International Capital Appreciation Fund | 0.4 | 0.5 |
Fidelity International Discovery Fund | 0.4 | 0.7 |
Fidelity International Real Estate Fund | 0.1 | 0.2 |
Fidelity International Small Cap Fund | 0.2 | 0.3 |
Fidelity International Small Cap Opportunities Fund | 0.8 | 0.9 |
Fidelity International Value Fund | 0.5 | 0.7 |
Fidelity Japan Fund | 0.2 | 0.3 |
Fidelity Japan Smaller Companies Fund | 0.3 | 0.3 |
Fidelity Nordic Fund | 0.8 | 1.0 |
Fidelity Overseas Fund | 0.0* | 0.0* |
Fidelity Pacific Basin Fund | 0.8 | 1.0 |
Spartan International Index Fund Investor Class | 6.2 | 7.0 |
| 12.9 | 14.8 |
Fixed-Income Funds | | |
Fidelity Floating Rate High Income Fund | 2.9 | 2.9 |
Fidelity Focused High Income Fund | 0.4 | 0.4 |
Fidelity High Income Fund | 2.4 | 2.6 |
Fidelity New Markets Income Fund | 0.7 | 0.7 |
Fidelity Real Estate Income Fund | 0.4 | 0.4 |
Spartan U.S. Bond Index Fund Investor Class | 38.3 | 35.6 |
| 45.1 | 42.6 |
Money Market Funds | | |
Fidelity Institutional Prime Money Market Portfolio Class I | 3.6 | 4.9 |
Fidelity Select Money Market Portfolio | 1.3 | 1.4 |
| 4.9 | 6.3 |
Net Other Assets (Liabilities)* | 0.0 | 0.0 |
| 100.0 | 100.0 |
* Amount represents less than 0.1%
Asset Allocation (% of fund's net assets) |
As of December 31, 2011 |
| Domestic Equity Funds | 37.1% | |
| International Equity Funds | 12.9% | |
| Fixed Income Funds | 45.1% | |
| Money Market Funds | 4.9% | |

As of June 30, 2011 |
| Domestic Equity Funds | 36.3% | |
| International Equity Funds | 14.8% | |
| Fixed Income Funds | 42.6% | |
| Money Market Funds | 6.3% | |

Annual Report
VIP FundsManager 50% Portfolio
Investments December 31, 2011
Showing Percentage of Net Assets
Equity Funds - 50.0% |
| Shares | | Value |
Domestic Equity Funds - 37.1% |
Fidelity 130/30 Large Cap Fund | 11,827 | | $ 82,313 |
Fidelity Air Transportation Portfolio | 28,331 | | 978,274 |
Fidelity Automotive Portfolio | 50,331 | | 1,568,300 |
Fidelity Banking Portfolio | 493,795 | | 7,885,908 |
Fidelity Biotechnology Portfolio | 32,688 | | 2,814,448 |
Fidelity Blue Chip Growth Fund | 59,170 | | 2,510,583 |
Fidelity Brokerage & Investment Management Portfolio | 60,307 | | 2,409,870 |
Fidelity Chemicals Portfolio | 28,825 | | 2,742,706 |
Fidelity Commodity Strategy Fund | 1,164 | | 9,769 |
Fidelity Communications Equipment Portfolio | 57,551 | | 1,269,586 |
Fidelity Computers Portfolio (a) | 121,558 | | 6,550,787 |
Fidelity Construction & Housing Portfolio | 76,554 | | 2,742,165 |
Fidelity Consumer Discretionary Portfolio | 433,297 | | 9,991,840 |
Fidelity Consumer Finance Portfolio | 32,948 | | 363,749 |
Fidelity Consumer Staples Portfolio | 367,055 | | 26,229,721 |
Fidelity Contrafund | 12,504 | | 843,517 |
Fidelity Defense & Aerospace Portfolio | 4,740 | | 369,500 |
Fidelity Disciplined Equity Fund | 12,778 | | 274,863 |
Fidelity Dividend Growth Fund | 246,892 | | 6,387,091 |
Fidelity Electronics Portfolio | 84,009 | | 3,714,028 |
Fidelity Energy Portfolio | 351,842 | | 17,359,896 |
Fidelity Energy Service Portfolio | 77,924 | | 5,067,374 |
Fidelity Environmental & Alternative Energy Portfolio | 88,822 | | 1,338,553 |
Fidelity Equity-Income Fund | 1,507 | | 62,238 |
Fidelity Equity-Income II Fund | 521 | | 9,063 |
Fidelity Financial Services Portfolio | 180,493 | | 8,827,925 |
Fidelity Fund | 16,244 | | 505,987 |
Fidelity Global Commodity Stock Fund | 27,618 | | 384,992 |
Fidelity Gold Portfolio | 225,686 | | 9,530,703 |
Fidelity Growth Company Fund | 70,808 | | 5,727,665 |
Fidelity Health Care Portfolio | 64,075 | | 7,840,236 |
Fidelity Independence Fund | 977 | | 21,154 |
Fidelity Industrial Equipment Portfolio | 205,210 | | 6,357,419 |
Fidelity Industrials Portfolio | 450,706 | | 9,829,890 |
Fidelity Insurance Portfolio | 244,744 | | 10,856,859 |
Fidelity IT Services Portfolio | 211,627 | | 4,501,312 |
Fidelity Large Cap Stock Fund | 90,954 | | 1,559,859 |
Fidelity Large Cap Value Fund | 31,910 | | 328,355 |
Fidelity Leisure Portfolio | 30,979 | | 2,985,716 |
Fidelity Leveraged Company Stock Fund | 766 | | 19,239 |
Fidelity Magellan Fund | 2,843 | | 179,048 |
Fidelity Materials Portfolio | 2,713 | | 166,602 |
Fidelity Medical Delivery Portfolio (a) | 137,017 | | 7,503,075 |
Fidelity Medical Equipment & Systems Portfolio | 22,287 | | 561,632 |
Fidelity Mega Cap Stock Fund | 182,786 | | 1,846,135 |
Fidelity Mid Cap Value Fund | 18,884 | | 286,283 |
Fidelity Mid-Cap Stock Fund | 5,533 | | 147,497 |
|
| Shares | | Value |
Fidelity Multimedia Portfolio | 74,085 | | $ 3,189,368 |
Fidelity Nasdaq Composite Index Fund | 10,253 | | 354,649 |
Fidelity Natural Resources Portfolio | 13,823 | | 432,516 |
Fidelity Pharmaceuticals Portfolio | 794,294 | | 10,786,518 |
Fidelity Real Estate Investment Portfolio | 108,908 | | 3,008,034 |
Fidelity Retailing Portfolio | 129,475 | | 6,631,687 |
Fidelity Small Cap Growth Fund | 3,946 | | 58,838 |
Fidelity Small Cap Stock Fund | 7,639 | | 126,345 |
Fidelity Small Cap Value Fund | 8,498 | | 118,806 |
Fidelity Software & Computer Services Portfolio | 95,485 | | 7,408,696 |
Fidelity Technology Portfolio (a) | 258,141 | | 22,321,481 |
Fidelity Telecom and Utilities Fund | 346,714 | | 6,012,022 |
Fidelity Telecommunications Portfolio | 190,138 | | 8,329,940 |
Fidelity Transportation Portfolio | 51,350 | | 2,536,173 |
Fidelity Utilities Portfolio | 145,639 | | 7,796,067 |
Spartan 500 Index Fund Investor Class | 2,842 | | 126,421 |
Spartan Extended Market Index Fund Investor Class | 251,717 | | 8,925,868 |
Spartan Total Market Index Fund Investor Class | 282,301 | | 10,196,719 |
VIP Mid Cap Portfolio Investor Class | 63,584 | | 1,843,940 |
TOTAL DOMESTIC EQUITY FUNDS | | 283,747,813 |
International Equity Funds - 12.9% |
Fidelity Canada Fund | 68,180 | | 3,418,554 |
Fidelity China Region Fund | 29,194 | | 738,328 |
Fidelity Diversified International Fund | 191,084 | | 4,876,476 |
Fidelity Emerging Asia Fund | 201,695 | | 5,078,684 |
Fidelity Emerging Markets Fund | 111,555 | | 2,289,110 |
Fidelity International Capital Appreciation Fund | 266,658 | | 2,965,237 |
Fidelity International Discovery Fund | 121,610 | | 3,357,660 |
Fidelity International Real Estate Fund | 136,575 | | 949,195 |
Fidelity International Small Cap Fund | 91,540 | | 1,603,773 |
Fidelity International Small Cap Opportunities Fund | 653,067 | | 6,040,874 |
Fidelity International Value Fund | 618,056 | | 4,042,088 |
Fidelity Japan Fund | 199,316 | | 1,833,712 |
Fidelity Japan Smaller Companies Fund | 288,983 | | 2,470,807 |
Fidelity Nordic Fund | 214,894 | | 5,750,576 |
Fidelity Overseas Fund | 288 | | 7,617 |
Fidelity Pacific Basin Fund | 291,812 | | 6,256,451 |
Spartan International Index Fund Investor Class | 1,598,716 | | 47,561,814 |
TOTAL INTERNATIONAL EQUITY FUNDS | | 99,240,956 |
TOTAL EQUITY FUNDS (Cost $343,642,077) |
382,988,769
|
Fixed-Income Funds - 45.1% |
| Shares | | Value |
Fidelity Floating Rate High Income Fund | 2,268,953 | | $ 21,872,712 |
Fidelity Focused High Income Fund | 356,772 | | 3,193,114 |
Fidelity High Income Fund | 2,137,064 | | 18,464,229 |
Fidelity New Markets Income Fund | 347,496 | | 5,500,862 |
Fidelity Real Estate Income Fund | 324,536 | | 3,326,489 |
Spartan U.S. Bond Index Fund Investor Class | 24,845,615 | | 292,681,345 |
TOTAL FIXED-INCOME FUNDS (Cost $324,712,624) |
345,038,751
|
Money Market Funds - 4.9% |
| | | |
Fidelity Institutional Prime Money Market Portfolio Class I | 27,332,785 | | 27,332,785 |
Fidelity Select Money Market Portfolio | 10,204,502 | | 10,204,502 |
TOTAL MONEY MARKET FUNDS (Cost $37,537,287) |
37,537,287
|
TOTAL INVESTMENT PORTFOLIO - 100.0% (Cost $705,891,988) | | 765,564,807 |
NET OTHER ASSETS (LIABILITIES) - 0.0% | | (128,131) |
NET ASSETS - 100% | $ 765,436,676 |
Legend |
(a) Non-income producing |
Other Information |
All investments are categorized as Level 1 under the Fair Value Hierarchy. The inputs or methodology used for valuing securities may not be an indication of the risk associated with investing in those securities. For more information on valuation inputs, please refer to the Security Valuation section in the accompanying Notes to Financial Statements. |
See accompanying notes which are an integral part of the financial statements.
Annual Report
VIP FundsManager 50% Portfolio
Statement of Assets and Liabilities
| December 31, 2011 |
| | |
Assets | | |
Investment in securities, at value (cost $705,891,988) - See accompanying schedule | | $ 765,564,807 |
Cash | | 3 |
Receivable for fund shares sold | | 351,864 |
Total assets | | 765,916,674 |
| | |
Liabilities | | |
Payable for investments purchased | $ 348,933 | |
Payable for fund shares redeemed | 2,932 | |
Accrued management fee | 126,021 | |
Distribution and service plan fees payable | 2,112 | |
Total liabilities | | 479,998 |
| | |
Net Assets | | $ 765,436,676 |
Net Assets consist of: | | |
Paid in capital | | $ 780,996,239 |
Accumulated undistributed net realized gain (loss) on investments | | (75,232,382) |
Net unrealized appreciation (depreciation) on investments | | 59,672,819 |
Net Assets | | $ 765,436,676 |
Statement of Assets and Liabilities - continued
| December 31, 2011 |
| | |
Service Class:
Net Asset Value, offering price and redemption price per share ($59,415 ÷ 6,076 shares) | | $ 9.78 |
| | |
Service Class 2:
Net Asset Value, offering price and redemption price per share ($17,799,841 ÷ 1,824,843 shares) | | $ 9.75 |
| | |
Investor Class:
Net Asset Value, offering price and redemption price per share ($747,577,420 ÷ 76,454,369 shares) | | $ 9.78 |
See accompanying notes which are an integral part of the financial statements.
Annual Report
Statement of Operations
| Year ended December 31, 2011 |
| | |
Investment Income | | |
Income distributions from underlying funds | | $ 14,992,755 |
| | |
Expenses | | |
Management fee | $ 1,834,675 | |
Distribution and service plan fees | 19,379 | |
Independent trustees' compensation | 2,609 | |
Total expenses before reductions | 1,856,663 | |
Expense reductions | (375,384) | 1,481,279 |
Net investment income (loss) | | 13,511,476 |
Realized and Unrealized Gain (Loss) Realized gain (loss) on sale of underlying fund shares | 5,726,534 | |
Capital gain distributions from underlying funds | 6,428,707 | |
Total net realized gain (loss) | | 12,155,241 |
Change in net unrealized appreciation (depreciation) on underlying funds | | (30,595,195) |
Net gain (loss) | | (18,439,954) |
Net increase (decrease) in net assets resulting from operations | | $ (4,928,478) |
Statement of Changes in Net Assets
| Year ended
December 31, 2011 | Year ended
December 31, 2010 |
Increase (Decrease) in Net Assets | | |
Operations | | |
Net investment income (loss) | $ 13,511,476 | $ 10,262,548 |
Net realized gain (loss) | 12,155,241 | 6,631,989 |
Change in net unrealized appreciation (depreciation) | (30,595,195) | 50,222,599 |
Net increase (decrease) in net assets resulting from operations | (4,928,478) | 67,117,136 |
Distributions to shareholders from net investment income | (13,480,797) | (10,267,333) |
Distributions to shareholders from net realized gain | (1,686,437) | (1,192,500) |
Total distributions | (15,167,234) | (11,459,833) |
Share transactions - net increase (decrease) | 112,807,742 | 96,216,502 |
Total increase (decrease) in net assets | 92,712,030 | 151,873,805 |
| | |
Net Assets | | |
Beginning of period | 672,724,646 | 520,850,841 |
End of period | $ 765,436,676 | $ 672,724,646 |
See accompanying notes which are an integral part of the financial statements.
Annual Report
Financial Highlights - Service Class
Years ended December 31, | 2011 | 2010 | 2009 | 2008 | 2007 |
Selected Per-Share Data | | | | | |
Net asset value, beginning of period | $ 10.02 | $ 9.11 | $ 7.80 | $ 10.51 | $ 10.52 |
Income from Investment Operations | | | | | |
Net investment income (loss) C | .19 | .17 | .17 | .25 | .32 |
Net realized and unrealized gain (loss) | (.23) | .91 | 1.30 | (2.59) | .41 |
Total from investment operations | (.04) | 1.08 | 1.47 | (2.34) | .73 |
Distributions from net investment income | (.18) | (.16) | (.15) | (.24) | (.24) |
Distributions from net realized gain | (.02) | (.02) | (.01) | (.13) | (.50) |
Total distributions | (.20) | (.17) G | (.16) | (.37) F | (.74) |
Net asset value, end of period | $ 9.78 | $ 10.02 | $ 9.11 | $ 7.80 | $ 10.51 |
Total Return A,B | (.42)% | 11.89% | 18.82% | (22.48)% | 6.99% |
Ratios to Average Net Assets D,E | | | | | |
Expenses before reductions | .35% | .35% | .35% | .35% | .35% |
Expenses net of fee waivers, if any | .20% | .20% | .20% | .20% | .20% |
Expenses net of all reductions | .20% | .20% | .20% | .20% | .20% |
Net investment income (loss) | 1.84% | 1.78% | 2.07% | 2.65% | 2.97% |
Supplemental Data | | | | | |
Net assets, end of period (000 omitted) | $ 59 | $ 62 | $ 58 | $ 76 | $ 115 |
Portfolio turnover rate | 14% | 16% | 44% | 70% | 92% |
A Total returns do not reflect charges attributable to your insurance company's separate account. Inclusion of these charges would reduce the total returns shown.
B Total returns would have been lower if certain expenses had not been reduced during the applicable periods shown.
C Calculated based on average shares outstanding during the period.
D Amounts do not include the activity of the Underlying Funds.
E Expense ratios reflect operating expenses of the class. Expenses before reductions do not reflect amounts reimbursed by the investment adviser or reductions from expense offset arrangements and do not represent the amount paid by the class during periods when reimbursements or reductions occur. Expenses net of fee waivers reflect expenses after reimbursement by the investment adviser but prior to reductions from expense offset arrangements. Expenses net of all reductions represent the net expenses paid by the class but do not include expenses of the investment companies in which the Fund invests.
F Total distributions of $.37 per share is comprised of distributions from net investment income of $.241 and distributions from net realized gain of $.125 per share.
G Total distributions of $.17 per share is comprised of distributions from net investment income of $.155 and distributions from net realized gain of $.018 per share.
Financial Highlights - Service Class 2
Years ended December 31, | 2011 | 2010 | 2009 | 2008 | 2007 |
Selected Per-Share Data | | | | | |
Net asset value, beginning of period | $ 10.01 | $ 9.10 | $ 7.79 | $ 10.51 | $ 10.51 |
Income from Investment Operations | | | | | |
Net investment income (loss) C | .17 | .15 | .16 | .23 | .31 |
Net realized and unrealized gain (loss) | (.24) | .92 | 1.30 | (2.59) | .41 |
Total from investment operations | (.07) | 1.07 | 1.46 | (2.36) | .72 |
Distributions from net investment income | (.17) | (.14) | (.14) | (.24) | (.22) |
Distributions from net realized gain | (.02) | (.02) | (.01) | (.13) | (.50) |
Total distributions | (.19) | (.16) | (.15) | (.36) F | (.72) |
Net asset value, end of period | $ 9.75 | $ 10.01 | $ 9.10 | $ 7.79 | $ 10.51 |
Total Return A,B | (.68)% | 11.75% | 18.76% | (22.63)% | 6.93% |
Ratios to Average Net Assets D,E | | | | | |
Expenses before reductions | .50% | .50% | .50% | .50% | .50% |
Expenses net of fee waivers, if any | .35% | .35% | .35% | .35% | .35% |
Expenses net of all reductions | .35% | .35% | .35% | .35% | .35% |
Net investment income (loss) | 1.69% | 1.63% | 1.92% | 2.50% | 2.82% |
Supplemental Data | | | | | |
Net assets, end of period (000 omitted) | $ 17,800 | $ 1,030 | $ 550 | $ 236 | $ 115 |
Portfolio turnover rate | 14% | 16% | 44% | 70% | 92% |
A Total returns do not reflect charges attributable to your insurance company's separate account. Inclusion of these charges would reduce the total returns shown.
B Total returns would have been lower if certain expenses had not been reduced during the applicable periods shown.
C Calculated based on average shares outstanding during the period.
D Amounts do not include the activity of the Underlying Funds.
E Expense ratios reflect operating expenses of the class. Expenses before reductions do not reflect amounts reimbursed by the investment adviser or reductions from expense offset arrangements and do not represent the amount paid by the class during periods when reimbursements or reductions occur. Expenses net of fee waivers reflect expenses after reimbursement by the investment adviser but prior to reductions from expense offset arrangements. Expenses net of all reductions represent the net expenses paid by the class but do not include expenses of the investment companies in which the Fund invests.
F Total distributions of $.36 per share is comprised of distributions from net investment income of $.235 and distributions from net realized gain of $.125 per share.
See accompanying notes which are an integral part of the financial statements.
Annual Report
Financial Highlights - Investor Class
Years ended December 31, | 2011 | 2010 | 2009 | 2008 | 2007 |
Selected Per-Share Data | | | | | |
Net asset value, beginning of period | $ 10.02 | $ 9.11 | $ 7.79 | $ 10.51 | $ 10.52 |
Income from Investment Operations | | | | | |
Net investment income (loss) C | .19 | .17 | .17 | .25 | .32 |
Net realized and unrealized gain (loss) | (.23) | .91 | 1.31 | (2.60) | .41 |
Total from investment operations | (.04) | 1.08 | 1.48 | (2.35) | .73 |
Distributions from net investment income | (.18) | (.16) | (.15) | (.24) | (.24) |
Distributions from net realized gain | (.02) | (.02) | (.01) | (.13) | (.50) |
Total distributions | (.20) | (.17) G | (.16) | (.37) F | (.74) |
Net asset value, end of period | $ 9.78 | $ 10.02 | $ 9.11 | $ 7.79 | $ 10.51 |
Total Return A,B | (.42)% | 11.89% | 18.98% | (22.57)% | 6.99% |
Ratios to Average Net Assets D,E | | | | | |
Expenses before reductions | .25% | .25% | .25% | .25% | .25% |
Expenses net of fee waivers, if any | .20% | .20% | .20% | .20% | .20% |
Expenses net of all reductions | .20% | .20% | .20% | .20% | .20% |
Net investment income (loss) | 1.84% | 1.78% | 2.07% | 2.65% | 2.97% |
Supplemental Data | | | | | |
Net assets, end of period (000 omitted) | $ 747,577 | $ 671,632 | $ 520,243 | $ 334,788 | $ 371,298 |
Portfolio turnover rate | 14% | 16% | 44% | 70% | 92% |
A Total returns do not reflect charges attributable to your insurance company's separate account. Inclusion of these charges would reduce the total returns shown.
B Total returns would have been lower if certain expenses had not been reduced during the applicable periods shown.
C Calculated based on average shares outstanding during the period.
D Amounts do not include the activity of the Underlying Funds.
E Expense ratios reflect operating expenses of the class. Expenses before reductions do not reflect amounts reimbursed by the investment adviser or reductions from expense offset arrangements and do not represent the amount paid by the class during periods when reimbursements or reductions occur. Expenses net of fee waivers reflect expenses after reimbursement by the investment adviser but prior to reductions from expense offset arrangements. Expenses net of all reductions represent the net expenses paid by the class but do not include expenses of the investment companies in which the Fund invests.
F Total distributions of $.37 per share is comprised of distributions from net investment income of $.241 and distributions from net realized gain of $.125 per share.
G Total distributions of $.17 per share is comprised of distributions from net investment income of $.155 and distributions from net realized gain of $.018 per share.
See accompanying notes which are an integral part of the financial statements.
Annual Report
VIP FundsManager 60% Portfolio
Investment Changes (Unaudited)
Fund Holdings as of December 31, 2011 |
| % of fund's
net assets | % of fund's net assets
6 months ago |
Domestic Equity Funds | | |
Fidelity 130/30 Large Cap Fund | 0.0* | 0.0* |
Fidelity Air Transportation Portfolio | 0.1 | 0.1 |
Fidelity Automotive Portfolio | 0.2 | 0.3 |
Fidelity Banking Portfolio | 1.3 | 1.5 |
Fidelity Biotechnology Portfolio | 0.0* | 0.0* |
Fidelity Blue Chip Growth Fund | 0.1 | 0.1 |
Fidelity Brokerage & Investment Management Portfolio | 0.1 | 0.2 |
Fidelity Chemicals Portfolio | 0.9 | 0.9 |
Fidelity Commodity Strategy Fund | 0.0* | 0.0* |
Fidelity Communications Equipment Portfolio | 0.5 | 0.6 |
Fidelity Computers Portfolio | 1.2 | 0.8 |
Fidelity Construction & Housing Portfolio | 0.2 | 0.3 |
Fidelity Consumer Discretionary Portfolio | 1.9 | 1.7 |
Fidelity Consumer Finance Portfolio | 0.6 | 0.1 |
Fidelity Consumer Staples Portfolio | 4.6 | 3.6 |
Fidelity Contrafund | 0.0* | 0.0* |
Fidelity Defense & Aerospace Portfolio | 0.1 | 0.1 |
Fidelity Disciplined Equity Fund | 0.0* | 0.0* |
Fidelity Dividend Growth Fund | 0.8 | 1.7 |
Fidelity Electronics Portfolio | 0.5 | 0.0* |
Fidelity Energy Portfolio | 2.8 | 2.4 |
Fidelity Energy Service Portfolio | 1.1 | 2.1 |
Fidelity Environmental & Alternative Energy Portfolio | 0.0* | 0.1 |
Fidelity Equity-Income Fund | 0.0* | 0.0* |
Fidelity Equity-Income II Fund | 0.0* | 0.0* |
Fidelity Financial Services Portfolio | 1.5 | 1.3 |
Fidelity Fund | 0.0* | 0.0* |
Fidelity Global Commodity Stock Fund | 0.2 | 0.3 |
Fidelity Gold Portfolio | 1.6 | 0.9 |
Fidelity Growth Company Fund | 0.5 | 0.6 |
Fidelity Health Care Portfolio | 3.0 | 2.3 |
Fidelity Independence Fund | 0.0* | 0.0* |
Fidelity Industrial Equipment Portfolio | 1.6 | 1.5 |
Fidelity Industrials Portfolio | 1.7 | 1.8 |
Fidelity Insurance Portfolio | 1.5 | 1.9 |
Fidelity IT Services Portfolio | 0.7 | 0.4 |
Fidelity Large Cap Stock Fund | 0.7 | 1.4 |
Fidelity Large Cap Value Fund | 0.0* | 0.0* |
|
| % of fund's
net assets | % of fund's net assets
6 months ago |
Fidelity Leisure Portfolio | 0.4 | 0.5 |
Fidelity Leveraged Company Stock Fund | 0.0* | 0.1 |
Fidelity Magellan Fund | 0.0* | 0.0* |
Fidelity Materials Portfolio | 0.2 | 0.2 |
Fidelity Medical Delivery Portfolio | 0.5 | 0.6 |
Fidelity Medical Equipment & Systems Portfolio | 0.2 | 0.3 |
Fidelity Mega Cap Stock Fund | 0.7 | 0.9 |
Fidelity Mid Cap Value Fund | 0.0* | 0.0* |
Fidelity Multimedia Portfolio | 0.6 | 0.7 |
Fidelity Natural Resources Portfolio | 0.0* | 0.0* |
Fidelity Pharmaceuticals Portfolio | 1.1 | 1.3 |
Fidelity Real Estate Investment Portfolio | 0.4 | 0.2 |
Fidelity Retailing Portfolio | 0.5 | 0.2 |
Fidelity Small Cap Growth Fund | 0.1 | 0.1 |
Fidelity Small Cap Value Fund | 0.0* | 0.0* |
Fidelity Software & Computer Services Portfolio | 1.9 | 0.4 |
Fidelity Stock Selector All Cap Fund | 0.0* | 0.0* |
Fidelity Technology Portfolio | 2.9 | 3.8 |
Fidelity Telecom and Utilities Fund | 0.6 | 0.7 |
Fidelity Telecommunications Portfolio | 1.3 | 1.1 |
Fidelity Transportation Portfolio | 0.4 | 0.5 |
Fidelity Utilities Portfolio | 1.7 | 1.1 |
Fidelity Value Fund | 0.0* | 0.0* |
Spartan 500 Index Fund Investor Class | 0.0* | 0.0* |
Spartan Total Market Index Fund Investor Class | 0.6 | 0.8 |
VIP Industrials Portfolio Investor Class | 0.0* | 0.0 |
VIP Mid Cap Portfolio Investor Class | 0.1 | 0.1 |
| 44.2 | 42.6 |
International Equity Funds | | |
Fidelity Canada Fund | 0.3 | 0.5 |
Fidelity China Region Fund | 0.1 | 0.1 |
Fidelity Diversified International Fund | 1.1 | 0.3 |
Fidelity Emerging Asia Fund | 0.8 | 0.8 |
Fidelity Emerging Markets Fund | 0.2 | 0.4 |
Fidelity International Capital Appreciation Fund | 0.3 | 0.4 |
Fidelity International Discovery Fund | 5.2 | 4.4 |
Fund Holdings as of December 31, 2011 - continued |
| % of fund's
net assets | % of fund's net assets
6 months ago |
Fidelity International Real Estate Fund | 0.0* | 0.0* |
Fidelity International Small Cap Fund | 0.3 | 0.5 |
Fidelity International Small Cap Opportunities Fund | 0.8 | 1.1 |
Fidelity International Value Fund | 0.7 | 1.0 |
Fidelity Japan Fund | 0.4 | 0.6 |
Fidelity Japan Smaller Companies Fund | 0.5 | 0.4 |
Fidelity Nordic Fund | 1.0 | 1.5 |
Fidelity Overseas Fund | 0.0* | 0.0* |
Fidelity Pacific Basin Fund | 0.7 | 1.1 |
Spartan International Index Fund Investor Class | 3.2 | 4.0 |
| 15.6 | 17.1 |
Fixed-Income Funds | | |
Fidelity Floating Rate High Income Fund | 2.3 | 2.5 |
Fidelity Focused High Income Fund | 0.8 | 1.0 |
Fidelity High Income Fund | 1.8 | 2.1 |
Fidelity New Markets Income Fund | 0.6 | 0.5 |
Fidelity Real Estate Income Fund | 0.5 | 0.6 |
Spartan U.S. Bond Index Fund Investor Class | 32.4 | 30.3 |
| 38.4 | 37.0 |
Money Market Funds | | |
Fidelity Institutional Prime Money Market Portfolio Class I | 1.8 | 3.3 |
Net Other Assets (Liabilities)* | 0.0 | 0.0 |
| 100.0 | 100.0 |
* Amount represents less than 0.1%
Asset Allocation (% of fund's net assets) |
As of December 31, 2011 |
| Domestic Equity Funds | 44.2% | |
| International Equity Funds | 15.6% | |
| Fixed Income Funds | 38.4% | |
| Money Market Funds | 1.8% | |

As of June 30, 2011 |
| Domestic Equity Funds | 42.6% | |
| International Equity Funds | 17.1% | |
| Fixed Income Funds | 37.0% | |
| Money Market Funds | 3.3% | |

Annual Report
VIP FundsManager 60% Portfolio
Investments December 31, 2011
Showing Percentage of Net Assets
Equity Funds - 59.8% |
| Shares | | Value |
Domestic Equity Funds - 44.2% |
Fidelity 130/30 Large Cap Fund | 7,142 | | $ 49,709 |
Fidelity Air Transportation Portfolio | 131,498 | | 4,540,631 |
Fidelity Automotive Portfolio | 280,024 | | 8,725,558 |
Fidelity Banking Portfolio | 3,257,800 | | 52,027,060 |
Fidelity Biotechnology Portfolio | 12,411 | | 1,068,603 |
Fidelity Blue Chip Growth Fund | 75,538 | | 3,205,087 |
Fidelity Brokerage & Investment Management Portfolio | 114,015 | | 4,556,029 |
Fidelity Chemicals Portfolio | 367,582 | | 34,975,427 |
Fidelity Commodity Strategy Fund | 1,228 | | 10,307 |
Fidelity Communications Equipment Portfolio | 849,846 | | 18,747,601 |
Fidelity Computers Portfolio (a) | 883,347 | | 47,603,587 |
Fidelity Construction & Housing Portfolio | 253,409 | | 9,077,125 |
Fidelity Consumer Discretionary Portfolio | 3,385,638 | | 78,072,820 |
Fidelity Consumer Finance Portfolio | 2,327,070 | | 25,690,848 |
Fidelity Consumer Staples Portfolio | 2,686,295 | | 191,962,658 |
Fidelity Contrafund | 8,989 | | 606,376 |
Fidelity Defense & Aerospace Portfolio | 38,750 | | 3,020,980 |
Fidelity Disciplined Equity Fund | 4,530 | | 97,441 |
Fidelity Dividend Growth Fund | 1,321,934 | | 34,198,427 |
Fidelity Electronics Portfolio | 449,119 | | 19,855,564 |
Fidelity Energy Portfolio | 2,373,458 | | 117,106,442 |
Fidelity Energy Service Portfolio | 706,956 | | 45,973,324 |
Fidelity Environmental & Alternative Energy Portfolio | 89,125 | | 1,343,108 |
Fidelity Equity-Income Fund | 8,706 | | 359,636 |
Fidelity Equity-Income II Fund | 4,958 | | 86,275 |
Fidelity Financial Services Portfolio | 1,284,691 | | 62,834,216 |
Fidelity Fund | 1,846 | | 57,492 |
Fidelity Global Commodity Stock Fund | 655,657 | | 9,139,856 |
Fidelity Gold Portfolio | 1,598,148 | | 67,489,788 |
Fidelity Growth Company Fund | 248,691 | | 20,116,584 |
Fidelity Health Care Portfolio | 1,019,276 | | 124,718,558 |
Fidelity Independence Fund | 2,128 | | 46,072 |
Fidelity Industrial Equipment Portfolio | 2,126,525 | | 65,879,748 |
Fidelity Industrials Portfolio | 3,152,205 | | 68,749,586 |
Fidelity Insurance Portfolio | 1,388,987 | | 61,615,446 |
Fidelity IT Services Portfolio | 1,393,984 | | 29,650,040 |
Fidelity Large Cap Stock Fund | 1,726,719 | | 29,613,233 |
Fidelity Large Cap Value Fund | 28,104 | | 289,192 |
Fidelity Leisure Portfolio | 160,117 | | 15,432,043 |
Fidelity Leveraged Company Stock Fund | 58,041 | | 1,457,404 |
Fidelity Magellan Fund | 2,881 | | 181,427 |
|
| Shares | | Value |
Fidelity Materials Portfolio | 109,973 | | $ 6,753,443 |
Fidelity Medical Delivery Portfolio (a) | 351,513 | | 19,248,873 |
Fidelity Medical Equipment & Systems Portfolio | 352,950 | | 8,894,331 |
Fidelity Mega Cap Stock Fund | 3,039,096 | | 30,694,866 |
Fidelity Mid Cap Value Fund | 5,589 | | 84,728 |
Fidelity Multimedia Portfolio | 565,938 | | 24,363,627 |
Fidelity Natural Resources Portfolio | 32,641 | | 1,021,321 |
Fidelity Pharmaceuticals Portfolio | 3,365,991 | | 45,710,160 |
Fidelity Real Estate Investment Portfolio | 541,069 | | 14,944,327 |
Fidelity Retailing Portfolio | 429,783 | | 22,013,472 |
Fidelity Small Cap Growth Fund | 140,513 | | 2,095,047 |
Fidelity Small Cap Value Fund | 25,096 | | 350,846 |
Fidelity Software & Computer Services Portfolio | 1,031,727 | | 80,051,693 |
Fidelity Stock Selector All Cap Fund | 4,416 | | 107,184 |
Fidelity Technology Portfolio (a) | 1,402,598 | | 121,282,616 |
Fidelity Telecom and Utilities Fund | 1,392,083 | | 24,138,722 |
Fidelity Telecommunications Portfolio | 1,255,946 | | 55,023,014 |
Fidelity Transportation Portfolio | 297,932 | | 14,714,886 |
Fidelity Utilities Portfolio | 1,277,340 | | 68,375,995 |
Fidelity Value Fund | 4,074 | | 258,580 |
Spartan 500 Index Fund Investor Class | 2,243 | | 99,807 |
Spartan Total Market Index Fund Investor Class | 688,605 | | 24,872,398 |
VIP Industrials Portfolio Investor Class | 76,397 | | 1,087,891 |
VIP Mid Cap Portfolio Investor Class | 140,639 | | 4,078,526 |
TOTAL DOMESTIC EQUITY FUNDS | | 1,830,497,661 |
International Equity Funds - 15.6% |
Fidelity Canada Fund | 278,953 | | 13,986,705 |
Fidelity China Region Fund | 116,067 | | 2,935,344 |
Fidelity Diversified International Fund | 1,741,113 | | 44,433,213 |
Fidelity Emerging Asia Fund | 1,327,233 | | 33,419,719 |
Fidelity Emerging Markets Fund | 482,825 | | 9,907,568 |
Fidelity International Capital Appreciation Fund | 1,024,084 | | 11,387,814 |
Fidelity International Discovery Fund | 7,766,197 | | 214,424,692 |
Fidelity International Real Estate Fund | 162,432 | | 1,128,905 |
Fidelity International Small Cap Fund | 830,325 | | 14,547,292 |
Fidelity International Small Cap Opportunities Fund | 3,389,182 | | 31,349,932 |
Fidelity International Value Fund | 4,353,143 | | 28,469,556 |
Fidelity Japan Fund | 1,842,173 | | 16,947,993 |
Fidelity Japan Smaller Companies Fund | 2,274,883 | | 19,450,249 |
Fidelity Nordic Fund | 1,510,299 | | 40,415,604 |
Fidelity Overseas Fund | 1,178 | | 31,202 |
Equity Funds - continued |
| Shares | | Value |
International Equity Funds - continued |
Fidelity Pacific Basin Fund | 1,454,004 | | $ 31,173,849 |
Spartan International Index Fund Investor Class | 4,471,462 | | 133,025,984 |
TOTAL INTERNATIONAL EQUITY FUNDS | | 647,035,621 |
TOTAL EQUITY FUNDS (Cost $2,366,862,421) |
2,477,533,282
|
Fixed-Income Funds - 38.4% |
| | | |
Fidelity Floating Rate High Income Fund | 9,960,388 | | 96,018,143 |
Fidelity Focused High Income Fund | 3,916,525 | | 35,052,903 |
Fidelity High Income Fund | 8,608,539 | | 74,377,779 |
Fidelity New Markets Income Fund | 1,461,049 | | 23,128,407 |
Fidelity Real Estate Income Fund | 2,030,425 | | 20,811,860 |
Spartan U.S. Bond Index Fund Investor Class | 113,872,115 | | 1,341,413,513 |
TOTAL FIXED-INCOME FUNDS (Cost $1,534,943,365) |
1,590,802,605
|
Money Market Funds - 1.8% |
| | | |
Fidelity Institutional Prime Money Market Portfolio Class I
(Cost $72,125,263) | 72,125,263 | |
72,125,263
|
TOTAL INVESTMENT PORTFOLIO - 100.0% (Cost $3,973,931,049) | | 4,140,461,150 |
NET OTHER ASSETS (LIABILITIES) - 0.0% | | (680,956) |
NET ASSETS - 100% | $ 4,139,780,194 |
Legend |
(a) Non-income producing |
Other Information |
All investments are categorized as Level 1 under the Fair Value Hierarchy. The inputs or methodology used for valuing securities may not be an indication of the risk associated with investing in those securities. For more information on valuation inputs, please refer to the Security Valuation section in the accompanying Notes to Financial Statements. |
See accompanying notes which are an integral part of the financial statements.
Annual Report
VIP FundsManager 60% Portfolio
Statement of Assets and Liabilities
| December 31, 2011 |
| | |
Assets | | |
Investment in securities, at value (cost $3,973,931,049) - See accompanying schedule | | $ 4,140,461,150 |
Receivable for fund shares sold | | 3,046,423 |
Total assets | | 4,143,507,573 |
| | |
Liabilities | | |
Payable to custodian bank | $ 3 | |
Payable for investments purchased | 2,114,852 | |
Payable for fund shares redeemed | 931,570 | |
Accrued management fee | 675,829 | |
Distribution and service plan fees payable | 5,125 | |
Total liabilities | | 3,727,379 |
| | |
Net Assets | | $ 4,139,780,194 |
Net Assets consist of: | | |
Paid in capital | | $ 4,012,734,308 |
Accumulated undistributed net realized gain (loss) on investments | | (39,484,215) |
Net unrealized appreciation (depreciation) on investments | | 166,530,101 |
Net Assets | | $ 4,139,780,194 |
Statement of Assets and Liabilities - continued
| December 31, 2011 |
| | |
Service Class:
Net Asset Value, offering price and redemption price per share ($57,631 ÷ 6,049 shares) | | $ 9.53 |
| | |
Service Class 2:
Net Asset Value, offering price and redemption price per share ($45,494,304 ÷ 4,781,163 shares) | | $ 9.52 |
| | |
Investor Class:
Net Asset Value, offering price and redemption price per share ($4,094,228,259 ÷ 429,860,333 shares) | | $ 9.52 |
See accompanying notes which are an integral part of the financial statements.
Annual Report
Statement of Operations
| Year ended December 31, 2011 |
| | |
Investment Income | | |
Income distributions from underlying funds | | $ 66,079,790 |
| | |
Expenses | | |
Management fee | $ 8,385,432 | |
Distribution and service plan fees | 44,852 | |
Independent trustees' compensation | 11,557 | |
Total expenses before reductions | 8,441,841 | |
Expense reductions | (1,699,464) | 6,742,377 |
Net investment income (loss) | | 59,337,413 |
Realized and Unrealized Gain (Loss) Realized gain (loss) on sale of underlying fund shares | 9,108,785 | |
Capital gain distributions from underlying funds | 41,472,043 | |
Total net realized gain (loss) | | 50,580,828 |
Change in net unrealized appreciation (depreciation) on underlying funds | | (197,257,071) |
Net gain (loss) | | (146,676,243) |
Net increase (decrease) in net assets resulting from operations | | $ (87,338,830) |
Statement of Changes in Net Assets
| Year ended
December 31, 2011 | Year ended
December 31, 2010 |
Increase (Decrease) in Net Assets | | |
Operations | | |
Net investment income (loss) | $ 59,337,413 | $ 30,798,284 |
Net realized gain (loss) | 50,580,828 | 20,810,598 |
Change in net unrealized appreciation (depreciation) | (197,257,071) | 211,909,440 |
Net increase (decrease) in net assets resulting from operations | (87,338,830) | 263,518,322 |
Distributions to shareholders from net investment income | (59,310,251) | (30,781,925) |
Distributions to shareholders from net realized gain | (8,964,775) | (5,386,863) |
Total distributions | (68,275,026) | (36,168,788) |
Share transactions - net increase (decrease) | 1,711,187,747 | 1,196,958,465 |
Total increase (decrease) in net assets | 1,555,573,891 | 1,424,307,999 |
| | |
Net Assets | | |
Beginning of period | 2,584,206,303 | 1,159,898,304 |
End of period | $ 4,139,780,194 | $ 2,584,206,303 |
See accompanying notes which are an integral part of the financial statements.
Annual Report
Financial Highlights - Service Class
Years ended December 31, | 2011 | 2010 | 2009 | 2008 | 2007 G |
Selected Per-Share Data | | | | | |
Net asset value, beginning of period | $ 9.88 | $ 8.83 | $ 7.32 | $ 10.29 | $ 10.00 |
Income from Investment Operations | | | | | |
Net investment income (loss) E | .18 | .16 | .15 | .25 | .18 |
Net realized and unrealized gain (loss) | (.37) | 1.03 | 1.51 | (3.01) | .23 |
Total from investment operations | (.19) | 1.19 | 1.66 | (2.76) | .41 |
Distributions from net investment income | (.14) | (.12) | (.13) | (.13) | (.06) |
Distributions from net realized gain | (.02) | (.02) | (.01) | (.08) | (.06) |
Total distributions | (.16) | (.14) | (.15) J | (.21) I | (.12) |
Net asset value, end of period | $ 9.53 | $ 9.88 | $ 8.83 | $ 7.32 | $ 10.29 |
Total Return B,C,D | (1.92)% | 13.49% | 22.61% | (26.93)% | 4.07% |
Ratios to Average Net Assets F,H | | | | | |
Expenses before reductions | .35% | .35% | .35% | .35% | .35% A |
Expenses net of fee waivers, if any | .20% | .20% | .20% | .20% | .20% A |
Expenses net of all reductions | .20% | .20% | .20% | .20% | .20% A |
Net investment income (loss) | 1.77% | 1.77% | 1.89% | 2.75% | 4.76% A |
Supplemental Data | | | | | |
Net assets, end of period (000 omitted) | $ 58 | $ 60 | $ 52 | $ 65 | $ 104 |
Portfolio turnover rate | 9% | 10% | 38% | 74% | 60% A |
A Annualized
B Total returns for periods of less than one year are not annualized.
C Total returns do not reflect charges attributable to your insurance company's separate account. Inclusion of these charges would reduce the total returns shown.
D Total returns would have been lower if certain expenses had not been reduced during the applicable periods shown.
E Calculated based on average shares outstanding during the period.
F Amounts do not include the activity of the Underlying Funds.
G For the period August 22, 2007 (commencement of operations) to December 31, 2007.
H Expense ratios reflect operating expenses of the class. Expenses before reductions do not reflect amounts reimbursed by the investment adviser or reductions from expense offset arrangements and do not represent the amount paid by the class during periods when reimbursements or reductions occur. Expenses net of fee waivers reflect expenses after reimbursement by the investment adviser but prior to reductions from expense offset arrangements. Expenses net of all reductions represent the net expenses paid by the class but do not include expenses of the investment companies in which the Fund invests.
I Total distributions of $.21 per share is comprised of distributions from net investment income of $.133 and distributions from net realized gain of $.080 per share.
J Total distributions of $.15 per share is comprised of distributions from net investment income of $.134 and distributions from net realized gain of $.012 per share.
Financial Highlights - Service Class 2
Years ended December 31, | 2011 | 2010 | 2009 | 2008 | 2007 G |
Selected Per-Share Data | | | | | |
Net asset value, beginning of period | $ 9.88 | $ 8.83 | $ 7.33 | $ 10.29 | $ 10.00 |
Income from Investment Operations | | | | | |
Net investment income (loss) E | .16 | .15 | .14 | .23 | .17 |
Net realized and unrealized gain (loss) | (.37) | 1.03 | 1.50 | (2.99) | .23 |
Total from investment operations | (.21) | 1.18 | 1.64 | (2.76) | .40 |
Distributions from net investment income | (.13) | (.11) | (.12) | (.12) | (.05) |
Distributions from net realized gain | (.02) | (.02) | (.01) | (.08) | (.06) |
Total distributions | (.15) | (.13) | (.14) J | (.20) I | (.11) |
Net asset value, end of period | $ 9.52 | $ 9.88 | $ 8.83 | $ 7.33 | $ 10.29 |
Total Return B,C,D | (2.08)% | 13.35% | 22.31% | (26.97)% | 4.01% |
Ratios to Average Net Assets F,H | | | | | |
Expenses before reductions | .50% | .50% | .50% | .50% | .50% A |
Expenses net of fee waivers, if any | .35% | .35% | .35% | .35% | .35% A |
Expenses net of all reductions | .35% | .35% | .35% | .35% | .35% A |
Net investment income (loss) | 1.62% | 1.62% | 1.74% | 2.59% | 4.61% A |
Supplemental Data | | | | | |
Net assets, end of period (000 omitted) | $ 45,494 | $ 125 | $ 83 | $ 76 | $ 104 |
Portfolio turnover rate | 9% | 10% | 38% | 74% | 60% A |
A Annualized
B Total returns for periods of less than one year are not annualized.
C Total returns do not reflect charges attributable to your insurance company's separate account. Inclusion of these charges would reduce the total returns shown.
D Total returns would have been lower if certain expenses had not been reduced during the applicable periods shown.
E Calculated based on average shares outstanding during the period.
F Amounts do not include the activity of the Underlying Funds.
G For the period August 22, 2007 (commencement of operations) to December 31, 2007.
H Expense ratios reflect operating expenses of the class. Expenses before reductions do not reflect amounts reimbursed by the investment adviser or reductions from expense offset arrangements and do not represent the amount paid by the class during periods when reimbursements or reductions occur. Expenses net of fee waivers reflect expenses after reimbursement by the investment adviser but prior to reductions from expense offset arrangements. Expenses net of all reductions represent the net expenses paid by the class but do not include expenses of the investment companies in which the Fund invests.
I Total distributions of $.20 per share is comprised of distributions from net investment income of $.119 and distributions from net realized gain of $.080 per share.
J Total distributions of $.14 per share is comprised of distributions from net investment income of $.124 and distributions from net realized gain of $.012 per share.
See accompanying notes which are an integral part of the financial statements.
Annual Report
Financial Highlights - Investor Class
Years ended December 31, | 2011 | 2010 | 2009 | 2008 | 2007 G |
Selected Per-Share Data | | | | | |
Net asset value, beginning of period | $ 9.88 | $ 8.82 | $ 7.32 | $ 10.29 | $ 10.00 |
Income from Investment Operations | | | | | |
Net investment income (loss) E | .17 | .16 | .15 | .23 | .17 |
Net realized and unrealized gain (loss) | (.37) | 1.04 | 1.50 | (2.99) | .24 |
Total from investment operations | (.20) | 1.20 | 1.65 | (2.76) | .41 |
Distributions from net investment income | (.14) | (.12) | (.13) | (.13) | (.06) |
Distributions from net realized gain | (.02) | (.02) | (.01) | (.08) | (.06) |
Total distributions | (.16) | (.14) | (.15) J | (.21) I | (.12) |
Net asset value, end of period | $ 9.52 | $ 9.88 | $ 8.82 | $ 7.32 | $ 10.29 |
Total Return B,C,D | (2.02)% | 13.62% | 22.48% | (26.93)% | 4.07% |
Ratios to Average Net Assets F,H | | | | | |
Expenses before reductions | .25% | .25% | .25% | .25% | .25% A |
Expenses net of fee waivers, if any | .20% | .20% | .20% | .20% | .20% A |
Expenses net of all reductions | .20% | .20% | .20% | .20% | .20% A |
Net investment income (loss) | 1.77% | 1.77% | 1.89% | 2.75% | 4.76% A |
Supplemental Data | | | | | |
Net assets, end of period (000 omitted) | $ 4,094,228 | $ 2,584,021 | $ 1,159,764 | $ 593,277 | $ 113,806 |
Portfolio turnover rate | 9% | 10% | 38% | 74% | 60% A |
A Annualized
B Total returns for periods of less than one year are not annualized.
C Total returns do not reflect charges attributable to your insurance company's separate account. Inclusion of these charges would reduce the total returns shown.
D Total returns would have been lower if certain expenses had not been reduced during the applicable periods shown.
E Calculated based on average shares outstanding during the period.
F Amounts do not include the activity of the Underlying Funds.
G For the period August 22, 2007 (commencement of operations) to December 31, 2007.
H Expense ratios reflect operating expenses of the class. Expenses before reductions do not reflect amounts reimbursed by the investment adviser or reductions from expense offset arrangements and do not represent the amount paid by the class during periods when reimbursements or reductions occur. Expenses net of fee waivers reflect expenses after reimbursement by the investment adviser but prior to reductions from expense offset arrangements. Expenses net of all reductions represent the net expenses paid by the class but do not include expenses of the investment companies in which the Fund invests.
I Total distributions of $.21 per share is comprised of distributions from net investment income of $.133 and distributions from net realized gain of $.080 per share.
J Total distributions of $.15 per share is comprised of distributions from net investment income of $.134 and distributions from net realized gain of $.012 per share.
See accompanying notes which are an integral part of the financial statements.
Annual Report
VIP FundsManager 70% Portfolio
Investment Changes (Unaudited)
Fund Holdings as of December 31, 2011 |
| % of fund's
net assets | % of fund's net assets
6 months ago |
Domestic Equity Funds | | |
Fidelity 130/30 Large Cap Fund | 0.0* | 0.0* |
Fidelity Air Transportation Portfolio | 0.2 | 0.2 |
Fidelity Automotive Portfolio | 0.1 | 0.2 |
Fidelity Banking Portfolio | 1.1 | 1.1 |
Fidelity Biotechnology Portfolio | 0.6 | 0.6 |
Fidelity Blue Chip Growth Fund | 0.4 | 0.4 |
Fidelity Brokerage & Investment Management Portfolio | 0.4 | 0.4 |
Fidelity Chemicals Portfolio | 0.7 | 0.7 |
Fidelity Commodity Strategy Fund | 0.0* | 0.0* |
Fidelity Communications Equipment Portfolio | 0.2 | 0.2 |
Fidelity Computers Portfolio | 1.4 | 1.2 |
Fidelity Construction & Housing Portfolio | 0.5 | 0.5 |
Fidelity Consumer Discretionary Portfolio | 1.3 | 1.4 |
Fidelity Consumer Finance Portfolio | 0.2 | 0.0* |
Fidelity Consumer Staples Portfolio | 5.1 | 4.2 |
Fidelity Contrafund | 0.0* | 0.0* |
Fidelity Defense & Aerospace Portfolio | 0.1 | 0.1 |
Fidelity Dividend Growth Fund | 0.5 | 1.1 |
Fidelity Electronics Portfolio | 0.6 | 0.2 |
Fidelity Energy Portfolio | 2.9 | 2.6 |
Fidelity Energy Service Portfolio | 1.2 | 2.6 |
Fidelity Environmental & Alternative Energy Portfolio | 0.2 | 0.2 |
Fidelity Equity-Income Fund | 0.2 | 0.2 |
Fidelity Equity-Income II Fund | 0.0* | 0.0* |
Fidelity Financial Services Portfolio | 1.5 | 1.8 |
Fidelity Fund | 0.0* | 0.0* |
Fidelity Global Commodity Stock Fund | 0.0* | 0.1 |
Fidelity Gold Portfolio | 1.5 | 0.9 |
Fidelity Growth Company Fund | 0.8 | 0.9 |
Fidelity Health Care Portfolio | 1.1 | 1.1 |
Fidelity Independence Fund | 0.0* | 0.0* |
Fidelity Industrial Equipment Portfolio | 0.9 | 1.0 |
Fidelity Industrials Portfolio | 2.2 | 2.4 |
Fidelity Insurance Portfolio | 1.5 | 1.5 |
Fidelity IT Services Portfolio | 0.4 | 0.3 |
Fidelity Large Cap Stock Fund | 0.1 | 0.4 |
Fidelity Large Cap Value Fund | 0.0* | 0.0* |
Fidelity Leisure Portfolio | 0.0* | 0.0* |
|
| % of fund's
net assets | % of fund's net assets
6 months ago |
Fidelity Leveraged Company Stock Fund | 0.0* | 0.0* |
Fidelity Magellan Fund | 0.0* | 0.0* |
Fidelity Materials Portfolio | 0.1 | 0.1 |
Fidelity Medical Delivery Portfolio | 1.3 | 1.3 |
Fidelity Medical Equipment & Systems Portfolio | 0.2 | 0.2 |
Fidelity Mega Cap Stock Fund | 0.3 | 0.3 |
Fidelity Mid Cap Value Fund | 0.0* | 0.0* |
Fidelity Mid-Cap Stock Fund | 0.0* | 0.0* |
Fidelity Multimedia Portfolio | 1.0 | 1.0 |
Fidelity Nasdaq Composite Index Fund | 0.3 | 0.3 |
Fidelity Natural Resources Portfolio | 0.0* | 0.1 |
Fidelity Pharmaceuticals Portfolio | 1.9 | 1.8 |
Fidelity Real Estate Investment Portfolio | 0.9 | 0.9 |
Fidelity Retailing Portfolio | 0.6 | 0.5 |
Fidelity Small Cap Growth Fund | 0.7 | 0.7 |
Fidelity Small Cap Stock Fund | 0.0* | 0.0* |
Fidelity Small Cap Value Fund | 0.0* | 0.0* |
Fidelity Software & Computer Services Portfolio | 1.6 | 0.9 |
Fidelity Technology Portfolio | 3.8 | 4.1 |
Fidelity Telecom and Utilities Fund | 1.3 | 1.2 |
Fidelity Telecommunications Portfolio | 1.0 | 1.1 |
Fidelity Transportation Portfolio | 0.5 | 0.5 |
Fidelity Utilities Portfolio | 0.9 | 0.8 |
Fidelity Value Discovery Fund | 0.0* | 0.0* |
Fidelity Value Fund | 0.1 | 0.1 |
Spartan 500 Index Fund Investor Class | 1.4 | 1.3 |
Spartan Extended Market Index Fund Investor Class | 2.3 | 2.4 |
Spartan Total Market Index Fund Investor Class | 2.1 | 2.0 |
VIP Mid Cap Portfolio Investor Class | 0.6 | 0.6 |
| 50.8 | 50.7 |
International Equity Funds | | |
Fidelity Canada Fund | 0.7 | 0.7 |
Fidelity China Region Fund | 0.2 | 0.2 |
Fidelity Diversified International Fund | 1.0 | 1.1 |
Fidelity Emerging Asia Fund | 0.7 | 0.8 |
Fidelity Emerging Markets Fund | 0.4 | 0.5 |
Fund Holdings as of December 31, 2011 - continued |
| % of fund's
net assets | % of fund's net assets
6 months ago |
Fidelity International Capital Appreciation Fund | 0.8 | 0.9 |
Fidelity International Discovery Fund | 2.2 | 2.0 |
Fidelity International Real Estate Fund | 0.0* | 0.0* |
Fidelity International Small Cap Fund | 0.2 | 0.3 |
Fidelity International Small Cap Opportunities Fund | 0.4 | 0.5 |
Fidelity International Value Fund | 0.7 | 0.8 |
Fidelity Japan Fund | 0.2 | 0.2 |
Fidelity Japan Smaller Companies Fund | 0.5 | 0.4 |
Fidelity Nordic Fund | 1.0 | 1.2 |
Fidelity Overseas Fund | 0.0* | 0.0* |
Fidelity Pacific Basin Fund | 0.9 | 1.1 |
Spartan International Index Fund Investor Class | 9.3 | 10.2 |
| 19.2 | 20.9 |
Fixed-Income Funds | | |
Fidelity Floating Rate High Income Fund | 2.2 | 2.2 |
Fidelity Focused High Income Fund | 0.9 | 0.9 |
Fidelity High Income Fund | 2.0 | 2.1 |
Fidelity New Markets Income Fund | 0.7 | 0.6 |
Fidelity Real Estate Income Fund | 0.4 | 0.3 |
Spartan U.S. Bond Index Fund Investor Class | 23.6 | 20.4 |
| 29.8 | 26.5 |
Money Market Funds | | |
Fidelity Institutional Prime Money Market Portfolio Class I | 0.2 | 1.9 |
Net Other Assets (Liabilities)* | 0.0 | 0.0 |
| 100.0 | 100.0 |
* Amount represents less than 0.1%
Asset Allocation (% of fund's net assets) |
As of December 31, 2011 |
| Domestic Equity Funds | 50.8% | |
| International Equity Funds | 19.2% | |
| Fixed Income Funds | 29.8% | |
| Money Market Funds | 0.2% | |

As of June 30, 2011 |
| Domestic Equity Funds | 50.7% | |
| International Equity Funds | 20.9% | |
| Fixed Income Funds | 26.5% | |
| Money Market Funds | 1.9% | |

Annual Report
VIP FundsManager 70% Portfolio
Investments December 31, 2011
Showing Percentage of Net Assets
Equity Funds - 70.0% |
| Shares | | Value |
Domestic Equity Funds - 50.8% |
Fidelity 130/30 Large Cap Fund | 10,705 | | $ 74,504 |
Fidelity Air Transportation Portfolio | 25,061 | | 865,344 |
Fidelity Automotive Portfolio | 22,086 | | 688,186 |
Fidelity Banking Portfolio | 367,767 | | 5,873,238 |
Fidelity Biotechnology Portfolio | 38,711 | | 3,333,015 |
Fidelity Blue Chip Growth Fund | 49,874 | | 2,116,174 |
Fidelity Brokerage & Investment Management Portfolio | 55,247 | | 2,207,690 |
Fidelity Chemicals Portfolio | 41,537 | | 3,952,282 |
Fidelity Commodity Strategy Fund | 1,164 | | 9,769 |
Fidelity Communications Equipment Portfolio | 52,132 | | 1,150,042 |
Fidelity Computers Portfolio (a) | 145,898 | | 7,862,465 |
Fidelity Construction & Housing Portfolio | 72,380 | | 2,592,656 |
Fidelity Consumer Discretionary Portfolio | 316,741 | | 7,304,051 |
Fidelity Consumer Finance Portfolio | 76,462 | | 844,145 |
Fidelity Consumer Staples Portfolio | 396,818 | | 28,356,626 |
Fidelity Contrafund | 1,026 | | 69,202 |
Fidelity Defense & Aerospace Portfolio | 3,952 | | 308,071 |
Fidelity Dividend Growth Fund | 118,052 | | 3,053,996 |
Fidelity Electronics Portfolio | 78,931 | | 3,489,542 |
Fidelity Energy Portfolio | 324,585 | | 16,015,023 |
Fidelity Energy Service Portfolio | 101,670 | | 6,611,628 |
Fidelity Environmental & Alternative Energy Portfolio | 65,793 | | 991,498 |
Fidelity Equity-Income Fund | 22,503 | | 929,617 |
Fidelity Equity-Income II Fund | 514 | | 8,939 |
Fidelity Financial Services Portfolio | 174,515 | | 8,535,510 |
Fidelity Fund | 5,392 | | 167,974 |
Fidelity Global Commodity Stock Fund | 0 | | 0 |
Fidelity Gold Portfolio | 195,291 | | 8,247,160 |
Fidelity Growth Company Fund | 58,571 | | 4,737,829 |
Fidelity Health Care Portfolio | 50,977 | | 6,237,591 |
Fidelity Independence Fund | 561 | | 12,145 |
Fidelity Industrial Equipment Portfolio | 161,472 | | 5,002,401 |
Fidelity Industrials Portfolio | 560,845 | | 12,232,035 |
Fidelity Insurance Portfolio | 191,747 | | 8,505,892 |
Fidelity IT Services Portfolio | 95,168 | | 2,024,229 |
Fidelity Large Cap Stock Fund | 38,261 | | 656,171 |
Fidelity Large Cap Value Fund | 6,408 | | 65,934 |
Fidelity Leisure Portfolio | 1,421 | | 136,913 |
Fidelity Leveraged Company Stock Fund | 964 | | 24,206 |
Fidelity Magellan Fund | 900 | | 56,670 |
Fidelity Materials Portfolio | 12,473 | | 765,954 |
Fidelity Medical Delivery Portfolio (a) | 131,901 | | 7,222,898 |
Fidelity Medical Equipment & Systems Portfolio | 33,684 | | 848,840 |
Fidelity Mega Cap Stock Fund | 187,568 | | 1,894,439 |
Fidelity Mid Cap Value Fund | 4,413 | | 66,902 |
Fidelity Mid-Cap Stock Fund | 6,318 | | 168,449 |
Fidelity Multimedia Portfolio | 131,177 | | 5,647,161 |
|
| Shares | | Value |
Fidelity Nasdaq Composite Index Fund | 44,371 | | $ 1,534,793 |
Fidelity Natural Resources Portfolio | 7,838 | | 245,249 |
Fidelity Pharmaceuticals Portfolio | 777,512 | | 10,558,607 |
Fidelity Real Estate Investment Portfolio | 181,995 | | 5,026,692 |
Fidelity Retailing Portfolio | 66,421 | | 3,402,102 |
Fidelity Small Cap Growth Fund | 250,220 | | 3,730,781 |
Fidelity Small Cap Stock Fund | 8,026 | | 132,756 |
Fidelity Small Cap Value Fund | 11,337 | | 158,497 |
Fidelity Software & Computer Services Portfolio | 111,438 | | 8,646,478 |
Fidelity Technology Portfolio (a) | 242,657 | | 20,982,536 |
Fidelity Telecom and Utilities Fund | 416,622 | | 7,224,218 |
Fidelity Telecommunications Portfolio | 129,648 | | 5,679,862 |
Fidelity Transportation Portfolio | 54,426 | | 2,688,086 |
Fidelity Utilities Portfolio | 96,811 | | 5,182,306 |
Fidelity Value Discovery Fund | 1,624 | | 22,975 |
Fidelity Value Fund | 8,062 | | 511,712 |
Spartan 500 Index Fund Investor Class | 172,350 | | 7,667,852 |
Spartan Extended Market Index Fund Investor Class | 366,982 | | 13,013,167 |
Spartan Total Market Index Fund Investor Class | 322,692 | | 11,655,623 |
VIP Mid Cap Portfolio Investor Class | 116,936 | | 3,391,152 |
TOTAL DOMESTIC EQUITY FUNDS | | 283,420,450 |
International Equity Funds - 19.2% |
Fidelity Canada Fund | 73,304 | | 3,675,477 |
Fidelity China Region Fund | 36,769 | | 929,899 |
Fidelity Diversified International Fund | 223,170 | | 5,695,298 |
Fidelity Emerging Asia Fund | 146,377 | | 3,685,779 |
Fidelity Emerging Markets Fund | 123,210 | | 2,528,272 |
Fidelity International Capital Appreciation Fund | 402,686 | | 4,477,870 |
Fidelity International Discovery Fund | 442,765 | | 12,224,735 |
Fidelity International Real Estate Fund | 21,516 | | 149,538 |
Fidelity International Small Cap Fund | 62,203 | | 1,089,800 |
Fidelity International Small Cap Opportunities Fund | 240,030 | | 2,220,273 |
Fidelity International Value Fund | 574,569 | | 3,757,682 |
Fidelity Japan Fund | 130,985 | | 1,205,063 |
Fidelity Japan Smaller Companies Fund | 296,666 | | 2,536,494 |
Fidelity Nordic Fund | 204,792 | | 5,480,246 |
Fidelity Overseas Fund | 855 | | 22,632 |
Fidelity Pacific Basin Fund | 241,276 | | 5,172,963 |
Spartan International Index Fund Investor Class | 1,748,353 | | 52,013,507 |
TOTAL INTERNATIONAL EQUITY FUNDS | | 106,865,528 |
TOTAL EQUITY FUNDS (Cost $347,743,291) |
390,285,978
|
Fixed-Income Funds - 29.8% |
| Shares | | Value |
Fidelity Floating Rate High Income Fund | 1,274,202 | | $ 12,283,304 |
Fidelity Focused High Income Fund | 590,015 | | 5,280,635 |
Fidelity High Income Fund | 1,270,948 | | 10,980,991 |
Fidelity New Markets Income Fund | 231,663 | | 3,667,224 |
Fidelity Real Estate Income Fund | 214,079 | | 2,194,310 |
Spartan U.S. Bond Index Fund Investor Class | 11,193,127 | | 131,855,035 |
TOTAL FIXED-INCOME FUNDS (Cost $156,240,878) |
166,261,499
|
Money Market Funds - 0.2% |
| | | |
Fidelity Institutional Prime Money Market Portfolio Class I
(Cost $1,372,032) | 1,372,032 | |
1,372,032
|
TOTAL INVESTMENT PORTFOLIO - 100.0% (Cost $505,356,201) | | 557,919,509 |
NET OTHER ASSETS (LIABILITIES) - 0.0% | | (92,943) |
NET ASSETS - 100% | $ 557,826,566 |
Legend |
(a) Non-income producing |
Other Information |
All investments are categorized as Level 1 under the Fair Value Hierarchy. The inputs or methodology used for valuing securities may not be an indication of the risk associated with investing in those securities. For more information on valuation inputs, please refer to the Security Valuation section in the accompanying Notes to Financial Statements. |
See accompanying notes which are an integral part of the financial statements.
Annual Report
VIP FundsManager 70% Portfolio
Statement of Assets and Liabilities
| December 31, 2011 |
| | |
Assets | | |
Investment in securities, at value (cost $505,356,201) - See accompanying schedule | | $ 557,919,509 |
Receivable for fund shares sold | | 79,462 |
Total assets | | 557,998,971 |
| | |
Liabilities | | |
Payable to custodian bank | $ 5 | |
Payable for investments purchased | 78,888 | |
Payable for fund shares redeemed | 575 | |
Accrued management fee | 92,488 | |
Distribution and service plan fees payable | 449 | |
Total liabilities | | 172,405 |
| | |
Net Assets | | $ 557,826,566 |
Net Assets consist of: | | |
Paid in capital | | $ 631,435,311 |
Accumulated undistributed net realized gain (loss) on investments | | (126,172,053) |
Net unrealized appreciation (depreciation) on investments | | 52,563,308 |
Net Assets | | $ 557,826,566 |
Statement of Assets and Liabilities - continued
| December 31, 2011 |
| | |
Service Class:
Net Asset Value, offering price and redemption price per share ($62,964 ÷ 6,967 shares) | | $ 9.04 |
| | |
Service Class 2:
Net Asset Value, offering price and redemption price per share ($3,675,238 ÷ 407,514 shares) | | $ 9.02 |
| | |
Investor Class:
Net Asset Value, offering price and redemption price per share ($554,088,364 ÷ 61,334,200 shares) | | $ 9.03 |
See accompanying notes which are an integral part of the financial statements.
Annual Report
VIP FundsManager 70% Portfolio
Financial Statements - continued
Statement of Operations
| Year ended December 31, 2011 |
| | |
Investment Income | | |
Income distributions from underlying funds | | $ 10,280,656 |
| | |
Expenses | | |
Management fee | $ 1,425,749 | |
Distribution and service plan fees | 8,437 | |
Independent trustees' compensation | 2,042 | |
Total expenses before reductions | 1,436,228 | |
Expense reductions | (288,907) | 1,147,321 |
Net investment income (loss) | | 9,133,335 |
Realized and Unrealized Gain (Loss) Realized gain (loss) on sale of underlying fund shares | 4,194,111 | |
Capital gain distributions from underlying funds | 5,734,200 | |
Total net realized gain (loss) | | 9,928,311 |
Change in net unrealized appreciation (depreciation) on underlying funds | | (36,732,765) |
Net gain (loss) | | (26,804,454) |
Net increase (decrease) in net assets resulting from operations | | $ (17,671,119) |
Statement of Changes in Net Assets
| Year ended
December 31, 2011 | Year ended
December 31, 2010 |
Increase (Decrease) in Net Assets | | |
Operations | | |
Net investment income (loss) | $ 9,133,335 | $ 7,119,509 |
Net realized gain (loss) | 9,928,311 | 3,973,021 |
Change in net unrealized appreciation (depreciation) | (36,732,765) | 54,824,547 |
Net increase (decrease) in net assets resulting from operations | (17,671,119) | 65,917,077 |
Distributions to shareholders from net investment income | (9,137,988) | (7,108,246) |
Distributions to shareholders from net realized gain | (1,453,223) | (1,063,881) |
Total distributions | (10,591,211) | (8,172,127) |
Share transactions - net increase (decrease) | 46,518,567 | 34,612,388 |
Total increase (decrease) in net assets | 18,256,237 | 92,357,338 |
| | |
Net Assets | | |
Beginning of period | 539,570,329 | 447,212,991 |
End of period | $ 557,826,566 | $ 539,570,329 |
See accompanying notes which are an integral part of the financial statements.
Annual Report
Financial Highlights - Service Class
Years ended December 31, | 2011 | 2010 | 2009 | 2008 | 2007 |
Selected Per-Share Data | | | | | |
Net asset value, beginning of period | $ 9.48 | $ 8.42 | $ 6.87 | $ 10.65 | $ 10.64 |
Income from Investment Operations | | | | | |
Net investment income (loss) C | .15 | .13 | .13 | .18 | .24 |
Net realized and unrealized gain (loss) | (.41) | 1.08 | 1.55 | (3.53) | .58 |
Total from investment operations | (.26) | 1.21 | 1.68 | (3.35) | .82 |
Distributions from net investment income | (.15) | (.13) | (.12) | (.18) | (.18) |
Distributions from net realized gain | (.02) | (.02) | (.01) | (.25) | (.63) |
Total distributions | (.18) G | (.15) | (.13) | (.43) F | (.81) |
Net asset value, end of period | $ 9.04 | $ 9.48 | $ 8.42 | $ 6.87 | $ 10.65 |
Total Return A,B | (2.79)% | 14.32% | 24.44% | (32.03)% | 7.80% |
Ratios to Average Net Assets D,E | | | | | |
Expenses before reductions | .35% | .35% | .35% | .35% | .35% |
Expenses net of fee waivers, if any | .20% | .20% | .20% | .20% | .20% |
Expenses net of all reductions | .20% | .20% | .20% | .20% | .20% |
Net investment income (loss) | 1.60% | 1.49% | 1.73% | 2.01% | 2.14% |
Supplemental Data | | | | | |
Net assets, end of period (000 omitted) | $ 63 | $ 67 | $ 68 | $ 68 | $ 117 |
Portfolio turnover rate | 16% | 22% | 55% | 84% | 105% |
A Total returns do not reflect charges attributable to your insurance company's separate account. Inclusion of these charges would reduce the total returns shown.
B Total returns would have been lower if certain expenses had not been reduced during the applicable periods shown.
C Calculated based on average shares outstanding during the period.
D Amounts do not include the activity of the Underlying Funds.
E Expense ratios reflect operating expenses of the class. Expenses before reductions do not reflect amounts reimbursed by the investment adviser or reductions from expense offset arrangements and do not represent the amount paid by the class during periods when reimbursements or reductions occur. Expenses net of fee waivers reflect expenses after reimbursement by the investment adviser but prior to reductions from expense offset arrangements. Expenses net of all reductions represent the net expenses paid by the class but do not include expenses of the investment companies in which the Fund invests.
F Total distributions of $.43 per share is comprised of distributions from net investment income of $.184 and distributions from net realized gain of $.245 per share.
G Total distributions of $.18 per share is comprised of distributions from net investment income of $.151 and distributions from net realized gain of $.024 per share.
Financial Highlights - Service Class 2
Years ended December 31, | 2011 | 2010 | 2009 | 2008 | 2007 |
Selected Per-Share Data | | | | | |
Net asset value, beginning of period | $ 9.46 | $ 8.41 | $ 6.86 | $ 10.65 | $ 10.64 |
Income from Investment Operations | | | | | |
Net investment income (loss) C | .14 | .12 | .12 | .16 | .22 |
Net realized and unrealized gain (loss) | (.42) | 1.07 | 1.55 | (3.53) | .59 |
Total from investment operations | (.28) | 1.19 | 1.67 | (3.37) | .81 |
Distributions from net investment income | (.14) | (.12) | (.11) | (.18) | (.17) |
Distributions from net realized gain | (.02) | (.02) | (.01) | (.25) | (.63) |
Total distributions | (.16) | (.14) | (.12) | (.42) F | (.80) |
Net asset value, end of period | $ 9.02 | $ 9.46 | $ 8.41 | $ 6.86 | $ 10.65 |
Total Return A,B | (2.94)% | 14.09% | 24.38% | (32.18)% | 7.63% |
Ratios to Average Net Assets D,E | | | | | |
Expenses before reductions | .50% | .50% | .50% | .50% | .50% |
Expenses net of fee waivers, if any | .35% | .35% | .35% | .35% | .35% |
Expenses net of all reductions | .35% | .35% | .35% | .35% | .35% |
Net investment income (loss) | 1.45% | 1.34% | 1.58% | 1.86% | 1.99% |
Supplemental Data | | | | | |
Net assets, end of period (000 omitted) | $ 3,675 | $ 2,586 | $ 1,464 | $ 223 | $ 117 |
Portfolio turnover rate | 16% | 22% | 55% | 84% | 105% |
A Total returns do not reflect charges attributable to your insurance company's separate account. Inclusion of these charges would reduce the total returns shown.
B Total returns would have been lower if certain expenses had not been reduced during the applicable periods shown.
C Calculated based on average shares outstanding during the period.
D Amounts do not include the activity of the Underlying Funds.
E Expense ratios reflect operating expenses of the class. Expenses before reductions do not reflect amounts reimbursed by the investment adviser or reductions from expense offset arrangements and do not represent the amount paid by the class during periods when reimbursements or reductions occur. Expenses net of fee waivers reflect expenses after reimbursement by the investment adviser but prior to reductions from expense offset arrangements. Expenses net of all reductions represent the net expenses paid by the class but do not include expenses of the investment companies in which the Fund invests.
F Total distributions of $.42 per share is comprised of distributions from net investment income of $.178 and distributions from net realized gain of $.245 per share.
See accompanying notes which are an integral part of the financial statements.
Annual Report
Financial Highlights - Investor Class
Years ended December 31, | 2011 | 2010 | 2009 | 2008 | 2007 |
Selected Per-Share Data | | | | | |
Net asset value, beginning of period | $ 9.48 | $ 8.42 | $ 6.87 | $ 10.65 | $ 10.64 |
Income from Investment Operations | | | | | |
Net investment income (loss) C | .15 | .13 | .13 | .18 | .24 |
Net realized and unrealized gain (loss) | (.42) | 1.08 | 1.55 | (3.53) | .58 |
Total from investment operations | (.27) | 1.21 | 1.68 | (3.35) | .82 |
Distributions from net investment income | (.15) | (.13) | (.12) | (.18) | (.18) |
Distributions from net realized gain | (.02) | (.02) | (.01) | (.25) | (.63) |
Total distributions | (.18) G | (.15) | (.13) | (.43) F | (.81) |
Net asset value, end of period | $ 9.03 | $ 9.48 | $ 8.42 | $ 6.87 | $ 10.65 |
Total Return A,B | (2.90)% | 14.32% | 24.44% | (32.03)% | 7.80% |
Ratios to Average Net Assets D,E | | | | | |
Expenses before reductions | .25% | .25% | .25% | .25% | .25% |
Expenses net of fee waivers, if any | .20% | .20% | .20% | .20% | .20% |
Expenses net of all reductions | .20% | .20% | .20% | .20% | .20% |
Net investment income (loss) | 1.60% | 1.49% | 1.73% | 2.01% | 2.14% |
Supplemental Data | | | | | |
Net assets, end of period (000 omitted) | $ 554,088 | $ 536,918 | $ 445,681 | $ 321,938 | $ 444,467 |
Portfolio turnover rate | 16% | 22% | 55% | 84% | 105% |
A Total returns do not reflect charges attributable to your insurance company's separate account. Inclusion of these charges would reduce the total returns shown.
B Total returns would have been lower if certain expenses had not been reduced during the applicable periods shown.
C Calculated based on average shares outstanding during the period.
D Amounts do not include the activity of the Underlying Funds.
E Expense ratios reflect operating expenses of the class. Expenses before reductions do not reflect amounts reimbursed by the investment adviser or reductions from expense offset arrangements and do not represent the amount paid by the class during periods when reimbursements or reductions occur. Expenses net of fee waivers reflect expenses after reimbursement by the investment adviser but prior to reductions from expense offset arrangements. Expenses net of all reductions represent the net expenses paid by the class but do not include expenses of the investment companies in which the Fund invests.
F Total distributions of $.43 per share is comprised of distributions from net investment income of $.184 and distributions from net realized gain of $.245 per share.
G Total distributions of $.18 per share is comprised of distributions from net investment income of $.151 and distributions from net realized gain of $.024 per share.
See accompanying notes which are an integral part of the financial statements.
Annual Report
VIP FundsManager 85% Portfolio
Investment Changes (Unaudited)
Fund Holdings as of December 31, 2011 |
| % of fund's
net assets | % of fund's net assets
6 months ago |
Domestic Equity Funds | | |
Fidelity 130/30 Large Cap Fund | 0.0* | 0.0* |
Fidelity Air Transportation Portfolio | 0.2 | 0.3 |
Fidelity Automotive Portfolio | 0.4 | 0.9 |
Fidelity Banking Portfolio | 2.9 | 2.7 |
Fidelity Biotechnology Portfolio | 0.1 | 0.1 |
Fidelity Blue Chip Growth Fund | 0.3 | 0.3 |
Fidelity Brokerage & Investment Management Portfolio | 0.4 | 0.4 |
Fidelity Chemicals Portfolio | 1.2 | 1.4 |
Fidelity Commodity Strategy Fund | 0.0* | 0.0* |
Fidelity Communications Equipment Portfolio | 0.3 | 0.4 |
Fidelity Computers Portfolio | 1.6 | 1.6 |
Fidelity Construction & Housing Portfolio | 0.5 | 0.5 |
Fidelity Consumer Discretionary Portfolio | 2.2 | 2.2 |
Fidelity Consumer Finance Portfolio | 0.2 | 0.0 |
Fidelity Consumer Staples Portfolio | 6.8 | 5.6 |
Fidelity Contrafund | 0.0* | 0.0* |
Fidelity Defense & Aerospace Portfolio | 0.1 | 0.1 |
Fidelity Dividend Growth Fund | 0.0* | 0.0* |
Fidelity Electronics Portfolio | 0.8 | 0.3 |
Fidelity Energy Portfolio | 3.7 | 3.5 |
Fidelity Energy Service Portfolio | 1.3 | 3.3 |
Fidelity Environmental & Alternative Energy Portfolio | 0.2 | 0.3 |
Fidelity Equity-Income Fund | 0.0* | 0.0* |
Fidelity Equity-Income II Fund | 0.0* | 0.0* |
Fidelity Financial Services Portfolio | 1.3 | 1.7 |
Fidelity Global Commodity Stock Fund | 0.6 | 0.8 |
Fidelity Gold Portfolio | 1.6 | 1.0 |
Fidelity Growth Company Fund | 0.7 | 0.8 |
Fidelity Health Care Portfolio | 3.4 | 3.1 |
Fidelity Independence Fund | 0.0* | 0.0* |
Fidelity Industrial Equipment Portfolio | 1.0 | 1.1 |
Fidelity Industrials Portfolio | 3.3 | 3.3 |
Fidelity Insurance Portfolio | 3.4 | 3.2 |
Fidelity IT Services Portfolio | 1.0 | 0.8 |
Fidelity Large Cap Stock Fund | 0.1 | 0.2 |
Fidelity Large Cap Value Fund | 0.0* | 0.0* |
Fidelity Leisure Portfolio | 0.1 | 0.1 |
|
| % of fund's
net assets | % of fund's net assets
6 months ago |
Fidelity Leveraged Company Stock Fund | 0.0* | 0.0* |
Fidelity Magellan Fund | 0.0* | 0.0* |
Fidelity Materials Portfolio | 0.1 | 0.2 |
Fidelity Medical Delivery Portfolio | 1.6 | 1.6 |
Fidelity Medical Equipment & Systems Portfolio | 0.1 | 0.1 |
Fidelity Mega Cap Stock Fund | 0.2 | 0.2 |
Fidelity Mid Cap Value Fund | 0.3 | 0.3 |
Fidelity Mid-Cap Stock Fund | 0.0* | 0.0* |
Fidelity Multimedia Portfolio | 1.3 | 1.3 |
Fidelity Nasdaq Composite Index Fund | 0.0* | 0.0* |
Fidelity Natural Resources Portfolio | 0.1 | 0.1 |
Fidelity Pharmaceuticals Portfolio | 2.9 | 2.7 |
Fidelity Real Estate Investment Portfolio | 0.1 | 0.3 |
Fidelity Retailing Portfolio | 0.9 | 0.7 |
Fidelity Small Cap Growth Fund | 0.5 | 0.5 |
Fidelity Small Cap Stock Fund | 0.0* | 0.0* |
Fidelity Small Cap Value Fund | 0.3 | 0.7 |
Fidelity Software & Computer Services Portfolio | 1.4 | 0.3 |
Fidelity Technology Portfolio | 5.8 | 6.1 |
Fidelity Telecom and Utilities Fund | 2.1 | 1.8 |
Fidelity Telecommunications Portfolio | 1.4 | 1.5 |
Fidelity Transportation Portfolio | 0.6 | 0.7 |
Fidelity Utilities Portfolio | 1.0 | 0.9 |
Fidelity Value Discovery Fund | 0.0* | 0.0* |
Spartan 500 Index Fund Investor Class | 1.3 | 1.3 |
Spartan Extended Market Index Fund Investor Class | 0.0* | 0.0* |
Spartan Total Market Index Fund Investor Class | 1.0 | 1.0 |
VIP Energy Portfolio Investor Class | 0.1 | 0.0* |
VIP Mid Cap Portfolio Investor Class | 0.3 | 0.3 |
| 63.1 | 62.6 |
International Equity Funds | | |
Fidelity Canada Fund | 0.8 | 0.9 |
Fidelity China Region Fund | 0.1 | 0.1 |
Fidelity Diversified International Fund | 0.7 | 0.8 |
Fidelity Emerging Asia Fund | 1.0 | 1.1 |
Fund Holdings as of December 31, 2011 - continued |
| % of fund's
net assets | % of fund's net assets
6 months ago |
Fidelity Emerging Markets Fund | 0.5 | 0.6 |
Fidelity International Capital Appreciation Fund | 1.1 | 1.1 |
Fidelity International Discovery Fund | 1.9 | 2.8 |
Fidelity International Real Estate Fund | 0.0* | 0.0* |
Fidelity International Small Cap Fund | 0.3 | 0.3 |
Fidelity International Small Cap Opportunities Fund | 0.5 | 0.8 |
Fidelity International Value Fund | 1.1 | 1.3 |
Fidelity Japan Fund | 0.3 | 0.3 |
Fidelity Japan Smaller Companies Fund | 1.5 | 1.4 |
Fidelity Nordic Fund | 0.7 | 1.0 |
Fidelity Overseas Fund | 0.0* | 0.0* |
Fidelity Pacific Basin Fund | 2.2 | 2.5 |
Spartan International Index Fund Investor Class | 9.4 | 9.3 |
| 22.1 | 24.3 |
Fixed-Income Funds | | |
Fidelity Floating Rate High Income Fund | 0.1 | 0.5 |
Fidelity Focused High Income Fund | 0.4 | 0.4 |
Fidelity High Income Fund | 2.1 | 2.7 |
Fidelity New Markets Income Fund | 0.3 | 0.2 |
Fidelity Real Estate Income Fund | 0.1 | 0.1 |
Spartan U.S. Bond Index Fund Investor Class | 11.7 | 9.1 |
| 14.7 | 13.0 |
Money Market Funds | | |
Fidelity Institutional Prime Money Market Portfolio Class I | 0.1 | 0.1 |
Net Other Assets (Liabilities)* | 0.0 | 0.0 |
| 100.0 | 100.0 |
* Amount represents less than 0.1%
Asset Allocation (% of fund's net assets) |
As of December 31, 2011 |
| Domestic Equity Funds | 63.1% | |
| International Equity Funds | 22.1% | |
| Fixed Income Funds | 14.7% | |
| Money Market Funds | 0.1% | |

As of June 30, 2011 |
| Domestic Equity Funds | 62.6% | |
| International Equity Funds | 24.3% | |
| Fixed Income Funds | 13.0% | |
| Money Market Funds | 0.1% | |

Annual Report
VIP FundsManager 85% Portfolio
Investments December 31, 2011
Showing Percentage of Net Assets
Equity Funds - 85.2% |
| Shares | | Value |
Domestic Equity Funds - 63.1% |
Fidelity 130/30 Large Cap Fund | 6,357 | | $ 44,246 |
Fidelity Air Transportation Portfolio | 15,671 | | 541,104 |
Fidelity Automotive Portfolio | 29,289 | | 912,653 |
Fidelity Banking Portfolio | 431,199 | | 6,886,250 |
Fidelity Biotechnology Portfolio | 1,806 | | 155,485 |
Fidelity Blue Chip Growth Fund | 16,281 | | 690,808 |
Fidelity Brokerage & Investment Management Portfolio | 22,180 | | 886,299 |
Fidelity Chemicals Portfolio | 30,641 | | 2,915,519 |
Fidelity Commodity Strategy Fund | 1,164 | | 9,769 |
Fidelity Communications Equipment Portfolio | 33,031 | | 728,674 |
Fidelity Computers Portfolio (a) | 68,673 | | 3,700,797 |
Fidelity Construction & Housing Portfolio | 34,416 | | 1,232,773 |
Fidelity Consumer Discretionary Portfolio | 227,819 | | 5,253,502 |
Fidelity Consumer Finance Portfolio | 47,593 | | 525,429 |
Fidelity Consumer Staples Portfolio | 225,300 | | 16,099,952 |
Fidelity Contrafund | 891 | | 60,138 |
Fidelity Defense & Aerospace Portfolio | 4,367 | | 340,452 |
Fidelity Dividend Growth Fund | 2,810 | | 72,702 |
Fidelity Electronics Portfolio | 40,554 | | 1,792,897 |
Fidelity Energy Portfolio | 177,705 | | 8,767,966 |
Fidelity Energy Service Portfolio | 46,052 | | 2,994,758 |
Fidelity Environmental & Alternative Energy Portfolio | 33,166 | | 499,806 |
Fidelity Equity-Income Fund | 998 | | 41,234 |
Fidelity Equity-Income II Fund | 1,226 | | 21,336 |
Fidelity Financial Services Portfolio | 63,880 | | 3,124,372 |
Fidelity Global Commodity Stock Fund | 92,058 | | 1,283,286 |
Fidelity Gold Portfolio | 86,920 | | 3,670,615 |
Fidelity Growth Company Fund | 20,679 | | 1,672,688 |
Fidelity Health Care Portfolio | 65,577 | | 8,023,962 |
Fidelity Independence Fund | 421 | | 9,118 |
Fidelity Industrial Equipment Portfolio | 72,906 | | 2,258,627 |
Fidelity Industrials Portfolio | 350,943 | | 7,654,062 |
Fidelity Insurance Portfolio | 177,868 | | 7,890,240 |
Fidelity IT Services Portfolio | 106,686 | | 2,269,215 |
Fidelity Large Cap Stock Fund | 18,858 | | 323,413 |
Fidelity Large Cap Value Fund | 9,258 | | 95,264 |
Fidelity Leisure Portfolio | 1,601 | | 154,308 |
Fidelity Leveraged Company Stock Fund | 3,104 | | 77,942 |
Fidelity Magellan Fund | 857 | | 53,948 |
Fidelity Materials Portfolio | 4,887 | | 300,114 |
Fidelity Medical Delivery Portfolio (a) | 68,485 | | 3,750,244 |
Fidelity Medical Equipment & Systems Portfolio | 8,552 | | 215,518 |
Fidelity Mega Cap Stock Fund | 36,528 | | 368,932 |
Fidelity Mid Cap Value Fund | 40,782 | | 618,252 |
Fidelity Mid-Cap Stock Fund | 2,561 | | 68,280 |
|
| Shares | | Value |
Fidelity Multimedia Portfolio | 68,425 | | $ 2,945,684 |
Fidelity Nasdaq Composite Index Fund | 892 | | 30,862 |
Fidelity Natural Resources Portfolio | 8,616 | | 269,602 |
Fidelity Pharmaceuticals Portfolio | 505,789 | | 6,868,614 |
Fidelity Real Estate Investment Portfolio | 8,350 | | 230,628 |
Fidelity Retailing Portfolio | 43,327 | | 2,219,213 |
Fidelity Small Cap Growth Fund | 71,983 | | 1,073,273 |
Fidelity Small Cap Stock Fund | 3,373 | | 55,790 |
Fidelity Small Cap Value Fund | 44,233 | | 618,372 |
Fidelity Software & Computer Services Portfolio | 42,105 | | 3,266,915 |
Fidelity Technology Portfolio (a) | 157,876 | | 13,651,503 |
Fidelity Telecom and Utilities Fund | 280,648 | | 4,866,443 |
Fidelity Telecommunications Portfolio | 74,124 | | 3,247,375 |
Fidelity Transportation Portfolio | 28,798 | | 1,422,323 |
Fidelity Utilities Portfolio | 45,096 | | 2,414,000 |
Fidelity Value Discovery Fund | 589 | | 8,330 |
Spartan 500 Index Fund Investor Class | 70,765 | | 3,148,333 |
Spartan Extended Market Index Fund Investor Class | 190 | | 6,729 |
Spartan Total Market Index Fund Investor Class | 65,085 | | 2,350,856 |
VIP Energy Portfolio Investor Class | 16,688 | | 313,239 |
VIP Mid Cap Portfolio Investor Class | 27,076 | | 785,217 |
TOTAL DOMESTIC EQUITY FUNDS | | 148,850,250 |
International Equity Funds - 22.1% |
Fidelity Canada Fund | 39,176 | | 1,964,266 |
Fidelity China Region Fund | 5,086 | | 128,622 |
Fidelity Diversified International Fund | 65,808 | | 1,679,427 |
Fidelity Emerging Asia Fund | 95,050 | | 2,393,367 |
Fidelity Emerging Markets Fund | 53,852 | | 1,105,053 |
Fidelity International Capital Appreciation Fund | 223,614 | | 2,486,587 |
Fidelity International Discovery Fund | 166,402 | | 4,594,355 |
Fidelity International Real Estate Fund | 14,529 | | 100,973 |
Fidelity International Small Cap Fund | 36,091 | | 632,307 |
Fidelity International Small Cap Opportunities Fund | 117,547 | | 1,087,313 |
Fidelity International Value Fund | 412,827 | | 2,699,886 |
Fidelity Japan Fund | 83,442 | | 767,669 |
Fidelity Japan Smaller Companies Fund | 412,011 | | 3,522,697 |
Fidelity Nordic Fund | 57,309 | | 1,533,589 |
Fidelity Overseas Fund | 336 | | 8,906 |
Fidelity Pacific Basin Fund | 244,925 | | 5,251,186 |
Spartan International Index Fund Investor Class | 743,482 | | 22,118,590 |
TOTAL INTERNATIONAL EQUITY FUNDS | | 52,074,793 |
TOTAL EQUITY FUNDS (Cost $182,786,102) |
200,925,043
|
Fixed-Income Funds - 14.7% |
| Shares | | Value |
Fidelity Floating Rate High Income Fund | 23,365 | | $ 225,238 |
Fidelity Focused High Income Fund | 105,426 | | 943,563 |
Fidelity High Income Fund | 564,011 | | 4,873,052 |
Fidelity New Markets Income Fund | 47,586 | | 753,281 |
Fidelity Real Estate Income Fund | 27,567 | | 282,564 |
Spartan U.S. Bond Index Fund Investor Class | 2,328,111 | | 27,425,140 |
TOTAL FIXED-INCOME FUNDS (Cost $32,953,294) |
34,502,838
|
Money Market Funds - 0.1% |
| | | |
Fidelity Institutional Prime Money Market Portfolio Class I
(Cost $263,034) | 263,034 | |
263,034
|
TOTAL INVESTMENT PORTFOLIO - 100.0% (Cost $216,002,430) | | 235,690,915 |
NET OTHER ASSETS (LIABILITIES) - 0.0% | | (39,007) |
NET ASSETS - 100% | $ 235,651,908 |
Legend |
(a) Non-income producing |
Other Information |
All investments are categorized as Level 1 under the Fair Value Hierarchy. The inputs or methodology used for valuing securities may not be an indication of the risk associated with investing in those securities. For more information on valuation inputs, please refer to the Security Valuation section in the accompanying Notes to Financial Statements. |
See accompanying notes which are an integral part of the financial statements.
Annual Report
VIP FundsManager 85% Portfolio
Statement of Assets and Liabilities
| December 31, 2011 |
| | |
Assets | | |
Investment in securities, at value (cost $216,002,430) - See accompanying schedule | | $ 235,690,915 |
Cash | | 9 |
Receivable for fund shares sold | | 273,439 |
Total assets | | 235,964,363 |
| | |
Liabilities | | |
Payable for investments purchased | $ 272,876 | |
Payable for fund shares redeemed | 564 | |
Accrued management fee | 38,574 | |
Distribution and service plan fees payable | 441 | |
Total liabilities | | 312,455 |
| | |
Net Assets | | $ 235,651,908 |
Net Assets consist of: | | |
Paid in capital | | $ 273,463,806 |
Accumulated undistributed net realized gain (loss) on investments | | (57,500,383) |
Net unrealized appreciation (depreciation) on investments | | 19,688,485 |
Net Assets | | $ 235,651,908 |
Statement of Assets and Liabilities - continued
| December 31, 2011 |
| | |
Service Class:
Net Asset Value, offering price and redemption price per share ($183,016 ÷ 21,351 shares) | | $ 8.57 |
| | |
Service Class 2:
Net Asset Value, offering price and redemption price per share ($3,574,300 ÷ 418,036 shares) | | $ 8.55 |
| | |
Investor Class:
Net Asset Value, offering price and redemption price per share ($231,894,592 ÷ 27,038,032 shares) | | $ 8.58 |
See accompanying notes which are an integral part of the financial statements.
Annual Report
VIP FundsManager 85% Portfolio
Financial Statements - continued
Statement of Operations
| Year ended December 31, 2011 |
| | |
Investment Income | | |
Income distributions from underlying funds | | $ 3,473,614 |
| | |
Expenses | | |
Management fee | $ 606,665 | |
Distribution and service plan fees | 8,628 | |
Independent trustees' compensation | 869 | |
Total expenses before reductions | 616,162 | |
Expense reductions | (124,993) | 491,169 |
Net investment income (loss) | | 2,982,445 |
Realized and Unrealized Gain (Loss) Realized gain (loss) on sale of underlying fund shares | 4,217,318 | |
Capital gain distributions from underlying funds | 2,920,136 | |
Total net realized gain (loss) | | 7,137,454 |
Change in net unrealized appreciation (depreciation) on underlying funds | | (24,181,458) |
Net gain (loss) | | (17,044,004) |
Net increase (decrease) in net assets resulting from operations | | $ (14,061,559) |
Statement of Changes in Net Assets
| Year ended
December 31, 2011 | Year ended
December 31, 2010 |
Increase (Decrease) in Net Assets | | |
Operations | | |
Net investment income (loss) | $ 2,982,445 | $ 2,331,238 |
Net realized gain (loss) | 7,137,454 | 5,356,074 |
Change in net unrealized appreciation (depreciation) | (24,181,458) | 21,545,551 |
Net increase (decrease) in net assets resulting from operations | (14,061,559) | 29,232,863 |
Distributions to shareholders from net investment income | (2,967,823) | (2,346,549) |
Distributions to shareholders from net realized gain | (621,579) | (529,855) |
Total distributions | (3,589,402) | (2,876,404) |
Share transactions - net increase (decrease) | 25,585,800 | 19,899,359 |
Total increase (decrease) in net assets | 7,934,839 | 46,255,818 |
| | |
Net Assets | | |
Beginning of period | 227,717,069 | 181,461,251 |
End of period | $ 235,651,908 | $ 227,717,069 |
See accompanying notes which are an integral part of the financial statements.
Annual Report
Financial Highlights - Service Class
Years ended December 31, | 2011 | 2010 | 2009 | 2008 | 2007 |
Selected Per-Share Data | | | | | |
Net asset value, beginning of period | $ 9.19 | $ 8.02 | $ 6.32 | $ 10.76 | $ 10.72 |
Income from Investment Operations | | | | | |
Net investment income (loss) C | .11 | .10 | .11 | .13 | .17 |
Net realized and unrealized gain (loss) | (.60) | 1.19 | 1.70 | (4.14) | .74 |
Total from investment operations | (.49) | 1.29 | 1.81 | (4.01) | .91 |
Distributions from net investment income | (.11) | (.10) | (.10) | (.13) | (.13) |
Distributions from net realized gain | (.02) | (.02) | (.01) | (.30) | (.74) |
Total distributions | (.13) | (.12) | (.11) | (.43) F | (.87) |
Net asset value, end of period | $ 8.57 | $ 9.19 | $ 8.02 | $ 6.32 | $ 10.76 |
Total Return A,B | (5.30)% | 16.07% | 28.56% | (38.14)% | 8.52% |
Ratios to Average Net Assets D,E | | | | | |
Expenses before reductions | .35% | .35% | .35% | .35% | .35% |
Expenses net of fee waivers, if any | .20% | .20% | .20% | .20% | .20% |
Expenses net of all reductions | .20% | .20% | .20% | .20% | .20% |
Net investment income (loss) | 1.23% | 1.20% | 1.53% | 1.52% | 1.48% |
Supplemental Data | | | | | |
Net assets, end of period (000 omitted) | $ 183 | $ 108 | $ 112 | $ 62 | $ 118 |
Portfolio turnover rate | 26% | 38% | 66% | 92% | 104% |
A Total returns do not reflect charges attributable to your insurance company's separate account. Inclusion of these charges would reduce the total returns shown.
B Total returns would have been lower if certain expenses had not been reduced during the applicable periods shown.
C Calculated based on average shares outstanding during the period.
D Amounts do not include the activity of the Underlying Funds.
E Expense ratios reflect operating expenses of the class. Expenses before reductions do not reflect amounts reimbursed by the investment adviser or reductions from expense offset arrangements and do not represent the amount paid by the class during periods when reimbursements or reductions occur. Expenses net of fee waivers reflect expenses after reimbursement by the investment adviser but prior to reductions from expense offset arrangements. Expenses net of all reductions represent the net expenses paid by the class but do not include expenses of the investment companies in which the Fund invests.
F Total distributions of $.43 per share is comprised of distributions from net investment income of $.126 and distributions from net realized gain of $.300 per share.
Financial Highlights - Service Class 2
Years ended December 31, | 2011 | 2010 | 2009 | 2008 | 2007 |
Selected Per-Share Data | | | | | |
Net asset value, beginning of period | $ 9.17 | $ 8.00 | $ 6.32 | $ 10.76 | $ 10.72 |
Income from Investment Operations | | | | | |
Net investment income (loss) C | .10 | .09 | .10 | .11 | .15 |
Net realized and unrealized gain (loss) | (.60) | 1.19 | 1.68 | (4.13) | .74 |
Total from investment operations | (.50) | 1.28 | 1.78 | (4.02) | .89 |
Distributions from net investment income | (.10) | (.09) | (.09) | (.12) | (.11) |
Distributions from net realized gain | (.02) | (.02) | (.01) | (.30) | (.74) |
Total distributions | (.12) | (.11) | (.10) | (.42) F | (.85) |
Net asset value, end of period | $ 8.55 | $ 9.17 | $ 8.00 | $ 6.32 | $ 10.76 |
Total Return A,B | (5.44)% | 16.00% | 28.17% | (38.19)% | 8.36% |
Ratios to Average Net Assets D,E | | | | | |
Expenses before reductions | .50% | .50% | .50% | .50% | .50% |
Expenses net of fee waivers, if any | .35% | .35% | .35% | .35% | .35% |
Expenses net of all reductions | .35% | .35% | .35% | .35% | .35% |
Net investment income (loss) | 1.08% | 1.05% | 1.38% | 1.37% | 1.33% |
Supplemental Data | | | | | |
Net assets, end of period (000 omitted) | $ 3,574 | $ 2,384 | $ 886 | $ 254 | $ 118 |
Portfolio turnover rate | 26% | 38% | 66% | 92% | 104% |
A Total returns do not reflect charges attributable to your insurance company's separate account. Inclusion of these charges would reduce the total returns shown.
B Total returns would have been lower if certain expenses had not been reduced during the applicable periods shown.
C Calculated based on average shares outstanding during the period.
D Amounts do not include the activity of the Underlying Funds.
E Expense ratios reflect operating expenses of the class. Expenses before reductions do not reflect amounts reimbursed by the investment adviser or reductions from expense offset arrangements and do not represent the amount paid by the class during periods when reimbursements or reductions occur. Expenses net of fee waivers reflect expenses after reimbursement by the investment adviser but prior to reductions from expense offset arrangements. Expenses net of all reductions represent the net expenses paid by the class but do not include expenses of the investment companies in which the Fund invests.
F Total distributions of $.42 per share is comprised of distributions from net investment income of $.121 and distributions from net realized gain of $.300 per share.
See accompanying notes which are an integral part of the financial statements.
Annual Report
Financial Highlights - Investor Class
Years ended December 31, | 2011 | 2010 | 2009 | 2008 | 2007 |
Selected Per-Share Data | | | | | |
Net asset value, beginning of period | $ 9.20 | $ 8.02 | $ 6.32 | $ 10.77 | $ 10.72 |
Income from Investment Operations | | | | | |
Net investment income (loss) C | .11 | .10 | .11 | .13 | .17 |
Net realized and unrealized gain (loss) | (.60) | 1.20 | 1.70 | (4.15) | .75 |
Total from investment operations | (.49) | 1.30 | 1.81 | (4.02) | .92 |
Distributions from net investment income | (.11) | (.10) | (.10) | (.13) | (.13) |
Distributions from net realized gain | (.02) | (.02) | (.01) | (.30) | (.74) |
Total distributions | (.13) | (.12) | (.11) | (.43) F | (.87) |
Net asset value, end of period | $ 8.58 | $ 9.20 | $ 8.02 | $ 6.32 | $ 10.77 |
Total Return A,B | (5.29)% | 16.20% | 28.56% | (38.20)% | 8.63% |
Ratios to Average Net Assets D,E | | | | | |
Expenses before reductions | .25% | .25% | .25% | .25% | .25% |
Expenses net of fee waivers, if any | .20% | .20% | .20% | .20% | .20% |
Expenses net of all reductions | .20% | .20% | .20% | .20% | .20% |
Net investment income (loss) | 1.23% | 1.20% | 1.53% | 1.52% | 1.48% |
Supplemental Data | | | | | |
Net assets, end of period (000 omitted) | $ 231,895 | $ 225,225 | $ 180,463 | $ 120,650 | $ 176,456 |
Portfolio turnover rate | 26% | 38% | 66% | 92% | 104% |
A Total returns do not reflect charges attributable to your insurance company's separate account. Inclusion of these charges would reduce the total returns shown.
B Total returns would have been lower if certain expenses had not been reduced during the applicable periods shown.
C Calculated based on average shares outstanding during the period.
D Amounts do not include the activity of the Underlying Funds.
E Expense ratios reflect operating expenses of the class. Expenses before reductions do not reflect amounts reimbursed by the investment adviser or reductions from expense offset arrangements and do not represent the amount paid by the class during periods when reimbursements or reductions occur. Expenses net of fee waivers reflect expenses after reimbursement by the investment adviser but prior to reductions from expense offset arrangements. Expenses net of all reductions represent the net expenses paid by the class but do not include expenses of the investment companies in which the Fund invests.
F Total distributions of $.43 per share is comprised of distributions from net investment income of $.126 and distributions from net realized gain of $.300 per share.
See accompanying notes which are an integral part of the financial statements.
Annual Report
Notes to Financial Statements
For the period ended December 31, 2011
1. Organization.
VIP FundsManager 20% Portfolio, VIP FundsManager 50% Portfolio, VIP FundsManager 60% Portfolio, VIP FundsManager 70% Portfolio, and VIP FundsManager 85% Portfolio(the Funds) are funds of Variable Insurance Products Fund V. Variable Insurance Products Fund V (the Trust) (referred to in this report as Fidelity Variable Insurance Products) is registered under the Investment Company Act of 1940, as amended (the 1940 Act), as an open-end management investment company organized as a Massachusetts business trust. Each Fund is authorized to issue an unlimited number of shares. The Funds invest primarily in a combination of other Fidelity equity, fixed income, and short-term funds (the Underlying Funds) managed by Fidelity Management & Research Company (FMR). Shares of each Fund may only be purchased by insurance companies for the purpose of funding variable annuity or variable life insurance contracts. Each Fund offers three classes of shares: Investor Class shares, Service Class shares and Service Class 2 shares. All classes have equal rights and voting privileges, except for matters affecting a single class. Investment income, realized and unrealized capital gains and losses, the common expenses of the Fund, and certain fund-level expense reductions, if any, are allocated on a pro-rata basis to each class based on the relative net assets of each class to the total net assets of the Fund. Each class differs with respect to distribution and service plan fees incurred. Certain expense reductions may also differ by class.
2. Significant Accounting Policies.
The financial statements have been prepared in conformity with accounting principles generally accepted in the United States of America (GAAP), which require management to make certain estimates and assumptions at the date of the financial statements. Actual results could differ from those estimates. Subsequent events, if any, through the date that the financial statements were issued have been evaluated in the preparation of the financial statements. The following summarizes the significant accounting policies of the Funds:
Security Valuation. Investments are valued as of 4:00 p.m. Eastern time on the last calendar day of the period. Each Fund categorizes the inputs to valuation techniques used to value their investments into a disclosure hierarchy consisting of three levels as shown below:
Level 1 - quoted prices in active markets for identical investments
Level 2 - other significant observable inputs (including quoted prices for similar investments, interest rates, prepayment speeds, etc.)
Level 3 - unobservable inputs (including the Fund's own assumptions based on the best information available)
Valuation techniques used to value each Fund's investments by major category are as follows. Investments in the Underlying Funds are valued at their closing net asset value (NAV) each business day and are categorized as Level 1 in the hierarchy.
Investment Transactions and Income. For financial reporting purposes, the Funds' investment holdings and NAV include trades executed through the end of the last business day of the period. The NAV per share for processing shareholder transactions is calculated as of the close of business of the New York Stock Exchange (NYSE), normally 4:00 p.m. Eastern time and includes trades executed through the end of the prior business day. Gains and losses on securities sold are determined on the basis of identified cost. Income and capital gain distributions from the Underlying Funds, if any, are recorded on the ex-dividend date.
Expenses. Expenses directly attributable to a fund are charged to that fund. Expenses attributable to more than one fund are allocated among the respective funds on the basis of relative net assets or other appropriate methods. Expenses included in the accompanying financial statements reflect the expenses of the Fund and do not include any expenses associated with the Underlying Funds. Expense estimates are accrued in the period to which they relate and adjustments are made when actual amounts are known.
Income Tax Information and Distributions to Shareholders. Each year, each Fund intends to qualify as a regulated investment company, including distributing substantially all of its taxable income and realized gains under Subchapter M of the Internal Revenue Code. As a result, no provision for income taxes is required. As of December 31, 2011, each Fund did not have any unrecognized tax benefits in the financial statements; nor is the Fund aware of any tax positions for which it is reasonably possible that the total amounts of unrecognized tax benefits will significantly change in the next twelve months. The Fund files a U.S. federal tax return, in addition to state and local tax returns as required. A fund's tax returns are subject to examination by the Internal Revenue Service (IRS) for a period of three fiscal years. State and local tax returns may be subject to examination for an additional fiscal year depending on the jurisdiction.
Distributions are declared and recorded on the ex-dividend date. Income dividends and capital gain distributions are declared separately for each class. Income and capital gain distributions are determined in accordance with income tax regulations, which may differ from GAAP.
Capital accounts within the financial statements are adjusted for permanent book-tax differences. These adjustments have no impact on net assets or the results of operations. Temporary book-tax differences will reverse in a subsequent period.
Book-tax differences are primarily due to the short-term gain distributions from the Underlying Funds, capital loss carryforwards, losses deferred due to wash sales and excise tax regulations.
Annual Report
Notes to Financial Statements - continued
2. Significant Accounting Policies - continued
Income Tax Information and Distributions to Shareholders - continued
The federal tax cost of investment securities and unrealized appreciation (depreciation) as of period end were as follows for each Fund:
| Tax cost | Gross unrealized
appreciation | Gross unrealized
depreciation | Net unrealized
appreciation
(depreciation) on
securities and other investments |
VIP FundsManager 20% Portfolio | $ 515,522,952 | $ 26,885,599 | $ (7,316,481) | $ 19,569,118 |
VIP FundsManager 50% Portfolio | 706,734,525 | 77,651,608 | (18,821,326) | 58,830,282 |
VIP FundsManager 60% Portfolio | 3,976,200,967 | 307,940,973 | (143,680,790) | 164,260,183 |
VIP FundsManager 70% Portfolio | 505,894,630 | 70,571,026 | (18,546,147) | 52,024,879 |
VIP FundsManager 85% Portfolio | 216,282,652 | 31,404,091 | (11,995,828) | 19,408,263 |
The tax-based components of distributable earnings as of period end were as follows for each Fund:
| Capital loss
carryforward | Net unrealized
appreciation
(depreciation) |
VIP FundsManager 20% Portfolio | $ (5,139,798) | $ 19,569,118 |
VIP FundsManager 50% Portfolio | (74,389,846) | 58,830,282 |
VIP FundsManager 60% Portfolio | (37,214,297) | 164,260,183 |
VIP FundsManager 70% Portfolio | (125,633,624) | 52,024,879 |
VIP FundsManager 85% Portfolio | (57,220,161) | 19,408,263 |
Capital loss carryforwards are only available to offset future capital gains of the Funds to the extent provided by regulations and may be limited. Under the Regulated Investment Company Modernization Act of 2010 (the Act), the Fund is permitted to carry forward capital losses incurred in taxable years beginning after December 22, 2010 for an unlimited period and such capital losses are required to be used prior to any losses that expire. Capital loss carryforwards were as follows:
| Fiscal year of expiration | Total with expiration |
| 2016 | 2017 | |
VIP FundsManager 20% Portfolio | $ (100,811) | $ (5,038,987) | $ (5,139,798) |
VIP FundsManager 50% Portfolio | (16,594,975) | (57,794,871) | (74,389,846) |
VIP FundsManager 60% Portfolio | (-) | (37,214,297) | (37,214,297) |
VIP FundsManager 70% Portfolio | (43,028,530) | (82,605,094) | (125,633,624) |
VIP FundsManager 85% Portfolio | (12,672,252) | (44,547,909) | (57,220,161) |
| Total capital
loss carryfoward |
VIP FundsManager 20% Portfolio | $ (5,139,798) |
VIP FundsManager 50% Portfolio | (74,389,846) |
VIP FundsManager 60% Portfolio | (37,214,297) |
VIP FundsManager 70% Portfolio | (125,633,624) |
VIP FundsManager 85% Portfolio | (57,220,161) |
The tax character of distributions paid was as follows:
December 31, 2011 | Ordinary Income |
VIP FundsManager 20% Portfolio | $ 9,583,056 |
VIP FundsManager 50% Portfolio | 15,167,234 |
VIP FundsManager 60% Portfolio | 68,275,026 |
VIP FundsManager 70% Portfolio | 10,591,211 |
VIP FundsManager 85% Portfolio | 3,589,402 |
December 31, 2010 | Ordinary Income |
VIP FundsManager 20% Portfolio | $ 6,555,665 |
VIP FundsManager 50% Portfolio | 11,459,833 |
VIP FundsManager 60% Portfolio | 36,168,788 |
VIP FundsManager 70% Portfolio | 8,172,127 |
VIP FundsManager 85% Portfolio | 2,876,404 |
Annual Report
3. Purchases and Sales of Investments.
Purchases and redemptions of the Underlying Fund shares are noted in the table below.
| Purchases ($) | Redemptions ($) |
VIP FundsManager 20% Portfolio | 202,707,066 | 57,200,960 |
VIP FundsManager 50% Portfolio | 221,055,891 | 103,457,219 |
VIP FundsManager 60% Portfolio | 2,064,126,869 | 320,137,677 |
VIP FundsManager 70% Portfolio | 144,910,975 | 94,111,766 |
VIP FundsManager 85% Portfolio | 92,086,838 | 64,186,143 |
4. Fees and Other Transactions with Affiliates.
Management Fee. Strategic Advisers, Inc. (Strategic Advisers), an affiliate of FMR, provides the funds with investment management related services. For these services each fund pays a monthly management fee to Strategic Advisers. The management fee is based on an annual rate of ..25% of each fund's average net assets. The management fee is reduced by an amount equal to the fees and expenses paid by the fund to the independent Trustees.
Strategic Advisers has contractually agreed to waive 0.05% of its management fee, thereby limiting each fund's management fee to an annual rate of 0.20% of average net assets, until April 30, 2012.
Other Transactions. Strategic Advisers has entered into an administration agreement with FMR under which FMR provides management and administrative services (other than investment advisory services) necessary for the operation of each Fund. Pursuant to this agreement, FMR pays all expenses of each Fund, excluding the distribution and service fees, the compensation of the independent Trustees and certain other expenses such as interest expense. FMR also contracts with other Fidelity companies to perform the services necessary for the operation of each Fund.
Distribution and Service Plan Fees. In accordance with Rule 12b-1 of the 1940 Act, the Funds have adopted separate 12b-1 Plans for each Service Class of shares. Each Service Class pays Fidelity Distributors Corporation (FDC), an affiliate of FMR, a service fee. For the period, the service fee is based on an annual rate of .10% of Service Class' average net assets and .25% of Service Class 2's average net assets.
For the period, total fees, all of which were reallowed to insurance companies for the distribution of shares and providing shareholder support services were as follows:
| Service
Class | Service
Class 2 | Total |
VIP FundsManager 20% Portfolio | $ 66 | $ 2,543 | $ 2,609 |
VIP FundsManager 50% Portfolio | 61 | 19,318 | 19,379 |
VIP FundsManager 60% Portfolio | 60 | 44,792 | 44,852 |
VIP FundsManager 70% Portfolio | 66 | 8,371 | 8,437 |
VIP FundsManager 85% Portfolio | 126 | 8,502 | 8,628 |
5. Expense Reductions.
Strategic Advisers contractually agreed to limit each funds' management fee to an annual rate of 0.20% of each funds' average net assets until April 30, 2012. For the period, each fund's management fees were reduced by the following amounts:
| Management Fee Waiver |
VIP FundsManager 20% Portfolio | $ 233,570 |
VIP FundsManager 50% Portfolio | 367,502 |
VIP FundsManager 60% Portfolio | 1,681,247 |
VIP FundsManager 70% Portfolio | 285,488 |
VIP FundsManager 85% Portfolio | 121,461 |
Annual Report
Notes to Financial Statements - continued
5. Expense Reductions - continued
In addition, FMR has contractually agreed to reimburse 0.10% of class-level expenses for each fund's Service class and Service Class 2. During the period, this reimbursement reduced each fund's Service class and Service class 2's expenses by the following amounts:
| Reimbursement
|
VIP FundsManager 20% Portfolio | |
Service Class | $ 66 |
Service Class 2 | 1,022 |
VIP FundsManager 50% Portfolio | |
Service Class | 61 |
Service Class 2 | 7,821 |
VIP FundsManager 60% Portfolio | |
Service Class | 60 |
Service Class 2 | 18,157 |
VIP FundsManager 70% Portfolio | |
Service Class | 66 |
Service Class 2 | 3,353 |
VIP FundsManager 85% Portfolio | |
Service Class | 126 |
Service Class 2 | 3,406 |
In addition, through arrangements with each applicable Fund's custodian, credits realized as a result of uninvested cash balances were used to reduce each applicable Fund's management fee. During the period, these credits reduced management fee by the following amounts:
VIP FundsManager 20% Portfolio | $ 7 |
6. Distributions to Shareholders.
Distributions to shareholders of each class were as follows:
Years ended December 31, | 2011 | 2010 |
VIP FundsManager 20% Portfolio | | |
From net investment income | | |
Service Class | $ 1,034 | $ 1,048 |
Service Class 2 | 20,621 | 8,152 |
Investor Class | 8,578,368 | 6,075,567 |
Total | $ 8,600,023 | $ 6,084,767 |
From net realized gain | | |
Service Class | $ 118 | $ 81 |
Service Class 2 | 2,530 | 684 |
Investor Class | 980,385 | 470,133 |
Total | $ 983,033 | $ 470,898 |
VIP FundsManager 50% Portfolio | | |
From net investment income | | |
Service Class | $ 1,048 | $ 939 |
Service Class 2 | 303,133 | 14,288 |
Investor Class | 13,176,616 | 10,252,106 |
Total | $ 13,480,797 | $ 10,267,333 |
From net realized gain | | |
Service Class | $ 131 | $ 109 |
Service Class 2 | 39,229 | 1,824 |
Investor Class | 1,647,077 | 1,190,567 |
Total | $ 1,686,437 | $ 1,192,500 |
Annual Report
6. Distributions to Shareholders - continued
Years ended December 31, | 2011 | 2010 |
VIP FundsManager 60% Portfolio | | |
From net investment income | | |
Service Class | $ 827 | $ 721 |
Service Class 2 | 621,101 | 1,352 |
Investor Class | 58,688,323 | 30,779,852 |
Total | $ 59,310,251 | $ 30,781,925 |
From net realized gain | | |
Service Class | $ 125 | $ 126 |
Service Class 2 | 98,069 | 263 |
Investor Class | 8,866,581 | 5,386,474 |
Total | $ 8,964,775 | $ 5,386,863 |
VIP FundsManager 70% Portfolio | | |
From net investment income | | |
Service Class | $ 1,032 | $ 879 |
Service Class 2 | 55,238 | 31,248 |
Investor Class | 9,081,718 | 7,076,119 |
Total | $ 9,137,988 | $ 7,108,246 |
From net realized gain | | |
Service Class | $ 164 | $ 131 |
Service Class 2 | 9,607 | 5,118 |
Investor Class | 1,443,452 | 1,058,632 |
Total | $ 1,453,223 | $ 1,063,881 |
VIP FundsManager 85% Portfolio | | |
From net investment income | | |
Service Class | $ 2,313 | $ 1,117 |
Service Class 2 | 40,380 | 22,357 |
Investor Class | 2,925,130 | 2,323,075 |
Total | $ 2,967,823 | $ 2,346,549 |
From net realized gain | | |
Service Class | $ 484 | $ 265 |
Service Class 2 | 9,477 | 4,938 |
Investor Class | 611,618 | 524,652 |
Total | $ 621,579 | $ 529,855 |
7. Share Transactions.
Transactions for each class of shares were as follows:
| Shares | Dollars |
Years ended December 31, | 2011 | 2010 | 2011 | 2010 |
VIP FundsManager 20% Portfolio | | | | |
Service Class | | | | |
Shares sold | 239 | 659 | $ 2,551 | $ 6,790 |
Reinvestment of distributions | 108 | 106 | 1,152 | 1,129 |
Shares redeemed | (678) | (511) | (7,360) | (5,283) |
Net increase (decrease) | (331) | 254 | $ (3,657) | $ 2,636 |
Service Class 2 | | | | |
Shares sold | 118,036 | 41,662 | $ 1,269,205 | $ 429,404 |
Reinvestment of distributions | 2,172 | 834 | 23,152 | 8,836 |
Shares redeemed | (45,102) | (31,113) | (490,275) | (317,711) |
Net increase (decrease) | 75,106 | 11,383 | $ 802,082 | $ 120,529 |
Investor Class | | | | |
Shares sold | 14,732,018 | 11,323,659 | $ 159,190,758 | $ 117,452,842 |
Reinvestment of distributions | 895,853 | 616,937 | 9,558,752 | 6,545,700 |
Shares redeemed | (2,471,225) | (2,038,861) | (26,665,882) | (21,152,505) |
Net increase (decrease) | 13,156,646 | 9,901,735 | $ 142,083,628 | $ 102,846,037 |
Annual Report
Notes to Financial Statements - continued
7. Share Transactions - continued
| Shares | Dollars |
Years ended December 31, | 2011 | 2010 | 2011 | 2010 |
VIP FundsManager 50% Portfolio | | | | |
Service Class | | | | |
Shares sold | 230 | 5,522 | $ 2,318 | $ 51,566 |
Reinvestment of distributions | 121 | 105 | 1,179 | 1,048 |
Shares redeemed | (439) | (5,815) | (4,526) | (55,467) |
Net increase (decrease) | (88) | (188) | $ (1,029) | $ (2,853) |
Service Class 2 | | | | |
Shares sold | 1,763,410 | 75,310 | $ 17,762,571 | $ 705,935 |
Reinvestment of distributions | 35,114 | 1,613 | 342,362 | 16,112 |
Shares redeemed | (76,657) | (34,407) | (775,033) | (330,903) |
Net increase (decrease) | 1,721,867 | 42,516 | $ 17,329,900 | $ 391,144 |
Investor Class | | | | |
Shares sold | 12,811,963 | 13,058,689 | $ 130,073,867 | $ 124,486,934 |
Reinvestment of distributions | 1,517,266 | 1,143,124 | 14,823,693 | 11,442,673 |
Shares redeemed | (4,888,743) | (4,274,874) | (49,418,689) | (40,101,396) |
Net increase (decrease) | 9,440,486 | 9,926,939 | $ 95,478,871 | $ 95,828,211 |
VIP FundsManager 60% Portfolio | | | | |
Service Class | | | | |
Shares sold | 350 | 248 | $ 3,458 | $ 2,278 |
Reinvestment of distributions | 100 | 86 | 952 | 847 |
Shares redeemed | (497) | (90) | (5,030) | (820) |
Net increase (decrease) | (47) | 244 | $ (620) | $ 2,305 |
Service Class 2 | | | | |
Shares sold | 5,325,793 | 6,329 | $ 52,623,723 | $ 58,369 |
Reinvestment of distributions | 75,622 | 164 | 719,169 | 1,615 |
Shares redeemed | (632,946) | (3,203) | (6,346,164) | (30,616) |
Net increase (decrease) | 4,768,469 | 3,290 | $ 46,996,728 | $ 29,368 |
Investor Class | | | | |
Shares sold | 169,404,721 | 132,846,745 | $ 1,676,865,563 | $ 1,219,167,948 |
Reinvestment of distributions | 7,096,103 | 3,664,268 | 67,554,905 | 36,166,326 |
Shares redeemed | (8,133,825) | (6,444,533) | (80,228,829) | (58,407,482) |
Net increase (decrease) | 168,366,999 | 130,066,480 | $ 1,664,191,639 | $ 1,196,926,792 |
VIP FundsManager 70% Portfolio | | | | |
Service Class | | | | |
Shares sold | 229 | 105 | $ 2,168 | $ 916 |
Reinvestment of distributions | 132 | 107 | 1,196 | 1,010 |
Shares redeemed | (419) | (1,257) | (4,115) | (10,260) |
Net increase (decrease) | (58) | (1,045) | $ (751) | $ (8,334) |
Service Class 2 | | | | |
Shares sold | 156,009 | 117,792 | $ 1,477,158 | $ 1,007,136 |
Reinvestment of distributions | 7,189 | 3,844 | 64,845 | 36,366 |
Shares redeemed | (28,881) | (22,656) | (274,432) | (200,352) |
Net increase (decrease) | 134,317 | 98,980 | $ 1,267,571 | $ 843,150 |
Investor Class | | | | |
Shares sold | 8,466,254 | 8,149,816 | $ 81,472,928 | $ 71,824,236 |
Reinvestment of distributions | 1,165,578 | 859,002 | 10,525,170 | 8,134,751 |
Shares redeemed | (4,940,159) | (5,325,112) | (46,746,351) | (46,181,415) |
Net increase (decrease) | 4,691,673 | 3,683,706 | $ 45,251,747 | $ 33,777,572 |
VIP FundsManager 85% Portfolio | | | | |
Service Class | | | | |
Shares sold | 10,241 | 1,159 | $ 90,783 | $ 9,612 |
Reinvestment of distributions | 326 | 152 | 2,796 | 1,382 |
Shares redeemed | (999) | (3,505) | (9,246) | (28,420) |
Net increase (decrease) | 9,568 | (2,194) | $ 84,333 | $ (17,426) |
Annual Report
7. Share Transactions - continued
| Shares | Dollars |
Years ended December 31, | 2011 | 2010 | 2011 | 2010 |
Service Class 2 | | | | |
Shares sold | 197,332 | 201,721 | $ 1,805,431 | $ 1,678,857 |
Reinvestment of distributions | 5,831 | 2,991 | 49,857 | 27,295 |
Shares redeemed | (45,063) | (55,498) | (404,136) | (443,818) |
Net increase (decrease) | 158,100 | 149,214 | $ 1,451,152 | $ 1,262,334 |
Investor Class | | | | |
Shares sold | 5,516,563 | 6,173,674 | $ 51,100,108 | $ 52,921,384 |
Reinvestment of distributions | 412,208 | 312,144 | 3,536,749 | 2,847,727 |
Shares redeemed | (3,374,672) | (4,493,396) | (30,586,542) | (37,114,660) |
Net increase (decrease) | 2,554,099 | 1,992,422 | $ 24,050,315 | $ 18,654,451 |
8. Other.
The Funds' organizational documents provide former and current trustees and officers with a limited indemnification against liabilities arising in connection with the performance of their duties to the Funds. In the normal course of business, the Funds may also enter into contracts that provide general indemnifications. The Funds' maximum exposure under these arrangements is unknown as this would be dependent on future claims that may be made against the Funds. The risk of material loss from such claims is considered remote.
The Funds do not invest in the Underlying Funds for the purpose of exercising management or control; however, investments by the Funds within their principal investment strategies may represent a significant portion of the Underlying Fund's net assets. At the end of the period, the following VIP FundsManager Portfolios were each the owners of record of 10% or more of the total outstanding shares of the Underlying Funds.
Fund | VIP FundsManager
60% Portfolio |
Fidelity Consumer Discretionary Portfolio | 35% |
Fidelity Insurance Portfolio | 24% |
Fidelity Industrial Equipment Portfolio | 23% |
Fidelity International Value Fund | 19% |
Fidelity Financial Services Portfolio | 19% |
Fidelity Consumer Finance Portfolio | 18% |
Fidelity Multimedia Portfolio | 17% |
Fidelity Telecommunications Portfolio | 16% |
Fidelity Industrials Portfolio | 15% |
Fidelity Banking Portfolio | 14% |
Fidelity Nordic Fund | 13% |
Fidelity IT Services Portfolio | 12% |
Fidelity Consumer Staples Portfolio | 11% |
Fidelity Utilities Portfolio | 11% |
Spartan U.S. Bond Index Fund | 10% |
The Funds, in aggregate, were the owners of record of more than 20% of the total outstanding shares of the following Underlying Funds.
Fund | % of shares held |
Fidelity Consumer Discretionary Portfolio | 47% |
Fidelity Insurance Portfolio | 36% |
Fidelity Industrial Equipment Portfolio | 29% |
Fidelity International Value Fund | 27% |
Fidelity Financial Services Portfolio | 25% |
Fidelity Multimedia Portfolio | 25% |
Fidelity Industrials Portfolio | 22% |
Fidelity Telecommunications Portfolio | 22% |
Fidelity Banking Portfolio | 21% |
Annual Report
Notes to Financial Statements - continued
8. Other - continued
In addition, at the end of the period, FMR or its affiliates were the owners of record of more than 10% of the outstanding shares of the following funds:
| Affiliated % |
VIP FundsManager 20% Portfolio | 99% |
VIP FundsManager 50% Portfolio | 98% |
VIP FundsManager 60% Portfolio | 32% |
VIP FundsManager 70% Portfolio | 99% |
VIP FundsManager 85% Portfolio | 98% |
In addition, at the end of the period, one otherwise unaffiliated shareholder was the owner of record of more than 67% of the outstanding shares of VIP FundsManager 60% Portfolio.
Annual Report
Report of Independent Registered Public Accounting Firm
To the Trustees of Variable Insurance Products Fund V and the Shareholders of VIP FundsManager 20% Portfolio, VIP FundsManager 50% Portfolio, VIP FundsManager 60% Portfolio, VIP FundsManager 70% Portfolio and VIP FundsManager 85% Portfolio:
In our opinion, the accompanying statements of assets and liabilities, including the schedules of investments, and the related statements of operations and of changes in net assets and the financial highlights present fairly, in all material respects, the financial positions of VIP FundsManager 20% Portfolio, VIP FundsManager 50% Portfolio, VIP FundsManager 60% Portfolio, VIP FundsManager 70% Portfolio and VIP FundsManager 85% Portfolio (funds of Variable Insurance Products Fund V) at December 31, 2011, the results of each of their operations for the year then ended, the changes in each of their net assets for each of the two years in the period then ended and the financial highlights for each of the periods indicated, in conformity with accounting principles generally accepted in the United States of America. These financial statements and financial highlights (hereafter referred to as "financial statements") are the responsibility of the fund's management to express an opinion on these financial statements based on our audits. We conducted our audits of these financial statements in accordance with the standards of the Public Company Accounting Oversight Board (United States). Those standards require that we plan and perform the audit to obtain reasonable assurance about whether the financial statements are free of material misstatement. An audit includes examining, on a test basis, evidence supporting the amounts and disclosures in the financial statements, assessing the accounting principles used and significant estimates made by management, and evaluating the overall financial statement presentation. We believe that our audits, which included confirmation of securities at December 31, 2011 by correspondence with the transfer agent, provide a reasonable basis for our opinion.
/s/ PricewaterhouseCoopers LLP
PricewaterhouseCoopers LLP
Boston, Massachusetts
February 21, 2012
Annual Report
The Trustees and executive officers of the trust and funds, as applicable, are listed below. The Board of Trustees governs each fund and is responsible for protecting the interests of shareholders. The Trustees are experienced executives who meet periodically throughout the year to oversee each fund's activities, review contractual arrangements with companies that provide services to each fund, oversee management of the risks associated with such activities and contractual arrangements, and review each fund's performance. If the interests of a fund and an underlying Fidelity fund were to diverge, a conflict of interest could arise and affect how the Trustees fulfill their fiduciary duties to the affected funds. Strategic Advisers has structured the funds to avoid these potential conflicts, although there may be situations where a conflict of interest is unavoidable. In such instances, Strategic Advisers and the Trustees would take reasonable steps to minimize and, if possible, eliminate the conflict. Except for James C. Curvey, each of the Trustees oversees 203 funds advised by FMR or an affiliate. Mr. Curvey oversees 429 funds advised by FMR or an affiliate.
The Trustees hold office without limit in time except that (a) any Trustee may resign; (b) any Trustee may be removed by written instrument, signed by at least two-thirds of the number of Trustees prior to such removal; (c) any Trustee who requests to be retired or who has become incapacitated by illness or injury may be retired by written instrument signed by a majority of the other Trustees; and (d) any Trustee may be removed at any special meeting of shareholders by a two-thirds vote of the outstanding voting securities of the trust. Each Trustee who is not an interested person (as defined in the 1940 Act) (Independent Trustee), shall retire not later than the last day of the calendar year in which his or her 75th birthday occurs. The Independent Trustees may waive this mandatory retirement age policy with respect to individual Trustees. The executive officers hold office without limit in time, except that any officer may resign or may be removed by a vote of a majority of the Trustees at any regular meeting or any special meeting of the Trustees. Except as indicated, each individual has held the office shown or other offices in the same company for the past five years.
Experience, Skills, Attributes, and Qualifications of the Fund's Trustees. The Governance and Nominating Committee has adopted a statement of policy that describes the experience, qualifications, attributes, and skills that are necessary and desirable for potential Independent Trustee candidates (Statement of Policy). The Board believes that each Trustee satisfied at the time he or she was initially elected or appointed a Trustee, and continues to satisfy, the standards contemplated by the Statement of Policy. The Governance and Nominating Committee also engages professional search firms to help identify potential Independent Trustee candidates who have the experience, qualifications, attributes, and skills consistent with the Statement of Policy. From time to time, additional criteria based on the composition and skills of the current Independent Trustees, as well as experience or skills that may be appropriate in light of future changes to board composition, business conditions, and regulatory or other developments, have also been considered by the professional search firms and the Governance and Nominating Committee. In addition, the Board takes into account the Trustees' commitment and participation in Board and committee meetings, as well as their leadership of standing and ad hoc committees throughout their tenure.
In determining that a particular Trustee was and continues to be qualified to serve as a Trustee, the Board has considered a variety of criteria, none of which, in isolation, was controlling. The Board believes that, collectively, the Trustees have balanced and diverse experience, qualifications, attributes, and skills, which allow the Board to operate effectively in governing each fund and protecting the interests of shareholders. Information about the specific experience, skills, attributes, and qualifications of each Trustee, which in each case led to the Board's conclusion that the Trustee should serve (or continue to serve) as a trustee of the funds, is provided below.
Board Structure and Oversight Function. Abigail P. Johnson is an interested person (as defined in the 1940 Act) and currently serves as Chairman. The Trustees have determined that an interested Chairman is appropriate and benefits shareholders because an interested Chairman has a personal and professional stake in the quality and continuity of services provided to the funds. Independent Trustees exercise their informed business judgment to appoint an individual of their choosing to serve as Chairman, regardless of whether the Trustee happens to be independent or a member of management. The Independent Trustees have determined that they can act independently and effectively without having an Independent Trustee serve as Chairman and that a key structural component for assuring that they are in a position to do so is for the Independent Trustees to constitute a substantial majority for the Board. The Independent Trustees also regularly meet in executive session. Kenneth L. Wolfe serves as Chairman of the Independent Trustees and as such (i) acts as a liaison between the Independent Trustees and management with respect to matters important to the Independent Trustees and (ii) with management prepares agendas for Board meetings.
Fidelity funds are overseen by different Boards of Trustees. The funds' Board oversees Fidelity's investment-grade bond, money market, and asset allocation funds and another Board oversees Fidelity's equity and high income funds. The asset allocation funds may invest in Fidelity funds that are overseen by such other Board. The use of separate Boards, each with its own committee structure, allows the Trustees of each group of Fidelity funds to focus on the unique issues of the funds they oversee, including common research, investment, and operational issues. On occasion, the separate Boards establish joint committees to address issues of overlapping consequences for the Fidelity funds overseen by each Board.
The Trustees operate using a system of committees to facilitate the timely and efficient consideration of all matters of importance to the Trustees, each fund, and fund shareholders and to facilitate compliance with legal and regulatory requirements and oversight of the funds' activities and associated risks. The Board, acting through its committees, has charged FMR and its affiliates with (i) identifying events or circumstances the occurrence of which could have demonstrably adverse effects on the funds' business and/or reputation; (ii) implementing processes and controls to lessen the possibility that such events or circumstances occur or to mitigate the effects of such events or circumstances if they do occur; and (iii) creating and maintaining a system designed to evaluate continuously business and market conditions in order to facilitate the identification and implementation processes described in (i) and (ii) above. Because the day-to-day operations and activities of the funds are carried out by or through FMR, its affiliates and other service providers, the funds' exposure to risks is mitigated but not eliminated by the processes overseen by the Trustees. While each of the Board's committees has responsibility for overseeing different aspects of the funds' activities, oversight is exercised primarily through the Operations and Audit Committees. In addition, an ad hoc Board committee of Independent Trustees has worked with FMR to enhance the Board's oversight of investment and financial risks, legal and regulatory risks, technology risks, and operational risks, including the development of additional risk reporting to the Board. Appropriate personnel, including but not limited to the funds' Chief Compliance Officer (CCO), FMR's internal auditor, the independent accountants, the funds' Treasurer and portfolio management personnel, make periodic reports to the Board's committees, as appropriate, including an annual review of FMR's risk management program for the Fidelity funds. The responsibilities of each standing committee, including their oversight responsibilities, are described further under "Standing Committees of the Funds' Trustees."
Annual Report
The funds' Statement of Additional Information (SAI) includes more information about the Trustees. To request a free copy, call Fidelity at 1-877-208-0098.
Interested Trustees*:
Correspondence intended for each Trustee who is an interested person may be sent to Fidelity Investments, 82 Devonshire Street, Boston, Massachusetts 02109.
Name, Age; Principal Occupations and Other Relevant Experience+ |
Abigail P. Johnson (50) |
| Year of Election or Appointment: 2009 Ms. Johnson is Trustee and Chairman of the Board of Trustees of certain Trusts. Ms. Johnson serves as President of Personal, Workplace and Institutional Services (2005-present). Ms. Johnson is Chairman and Director of FMR Co., Inc. (2011-present), Chairman and Director of FMR (2011-present), and the Vice Chairman and Director (2007-present) of FMR LLC. Previously, Ms. Johnson served as President and a Director of FMR (2001-2005), a Trustee of other investment companies advised by FMR, Fidelity Investments Money Management, Inc., and FMR Co., Inc. (2001-2005), Senior Vice President of the Fidelity funds (2001-2005), and managed a number of Fidelity funds. Ms. Abigail P. Johnson and Mr. Arthur E. Johnson are not related. |
James C. Curvey (76) |
| Year of Election or Appointment: 2007 Mr. Curvey also serves as Trustee (2007-present) of other investment companies advised by FMR. Mr. Curvey is a Director of Fidelity Investments Money Management, Inc. (2009-present), Director of Fidelity Research & Analysis Co. (2009-present) and Director of FMR and FMR Co., Inc. (2007-present). Mr. Curvey is also Vice Chairman (2007-present) and Director of FMR LLC. In addition, Mr. Curvey serves as an Overseer for the Boston Symphony Orchestra and a member of the Trustees of Villanova University. Previously, Mr. Curvey was the Vice Chairman (2006-2007) and Director (2000-2007) of FMR Corp. |
* Trustees have been determined to be "Interested Trustees" by virtue of, among other things, their affiliation with the trust or various entities under common control with Strategic Advisers.
+ The information above includes each Trustee's principal occupation during the last five years and other information relating to the experience, attributes, and skills relevant to each Trustee's qualifications to serve as a Trustee, which led to the conclusion that each Trustee should serve as a Trustee for each fund.
Independent Trustees:
Correspondence intended for each Independent Trustee (that is, the Trustees other than the Interested Trustees) may be sent to Fidelity Investments, P.O. Box 55235, Boston, Massachusetts 02205-5235.
Name, Age; Principal Occupations and Other Relevant Experience+ |
Albert R. Gamper, Jr. (69) |
| Year of Election or Appointment: 2007 Mr. Gamper is Vice Chairman of the Independent Trustees of the Fixed Income and Asset Allocation Funds (2011-present). Prior to his retirement in December 2004, Mr. Gamper served as Chairman of the Board of CIT Group Inc. (commercial finance). During his tenure with CIT Group Inc. Mr. Gamper served in numerous senior management positions, including Chairman (1987-1989; 1999-2001; 2002-2004), Chief Executive Officer (1987-2004), and President (2002-2003). Mr. Gamper currently serves as a member of the Board of Directors of Public Service Enterprise Group (utilities, 2000-present), a member of the Board of Trustees, Rutgers University (2004-present), and Chairman of the Board of Saint Barnabas Health Care System. Previously, Mr. Gamper served as Chairman of the Board of Governors, Rutgers University (2004-2007). |
Robert F. Gartland (60) |
| Year of Election or Appointment: 2010 Mr. Gartland is a partner and investor of Vietnam Partners LLC (investments and consulting, 2008-present) and is Chairman and an investor in Gartland and Mellina Group Corp. (consulting, 2009-present). Prior to his retirement, Mr. Gartland held a variety of positions at Morgan Stanley (financial services, 1979-2007) including Managing Director (1987-2007). |
Arthur E. Johnson (64) |
| Year of Election or Appointment: 2008 Mr. Johnson serves as a member of the Board of Directors of Eaton Corporation (diversified power management, 2009-present), and AGL Resources, Inc. (holding company, 2002-present) and Booz Allen Hamilton (management consulting, 2011-present). Prior to his retirement, Mr. Johnson served as Senior Vice President of Corporate Strategic Development of Lockheed Martin Corporation (defense contractor, 1999-2009). He previously served on the Board of Directors of IKON Office Solutions, Inc. (1999-2008) and Delta Airlines (2005-2007). Mr. Arthur E. Johnson is not related to Mr. Edward C. Johnson 3d or Ms. Abigail P. Johnson. |
Michael E. Kenneally (57) |
| Year of Election or Appointment: 2009 Previously, Mr. Kenneally served as a Member of the Advisory Board for certain Fidelity Fixed Income and Asset Allocation Funds (2008-2009). Prior to his retirement, Mr. Kenneally served as Chairman and Global Chief Executive Officer of Credit Suisse Asset Management (2003-2005). Mr. Kenneally was a Director of the Credit Suisse Funds (U.S. mutual funds, 2004-2008) and certain other closed-end funds (2004-2005) and was awarded the Chartered Financial Analyst (CFA) designation in 1991. |
James H. Keyes (71) |
| Year of Election or Appointment: 2007 Mr. Keyes serves as a member of the Boards of Navistar International Corporation (manufacture and sale of trucks, buses, and diesel engines, since 2002) and Pitney Bowes, Inc. (integrated mail, messaging, and document management solutions, since 1998). Prior to his retirement, Mr. Keyes served as Chairman and Chief Executive Officer of Johnson Controls (automotive, building, and energy, 1998-2002) and as a member of the Board of LSI Logic Corporation (semiconductor technologies, 1984-2008). |
Marie L. Knowles (65) |
| Year of Election or Appointment: 2001 Prior to Ms. Knowles' retirement in June 2000, she served as Executive Vice President and Chief Financial Officer of Atlantic Richfield Company (ARCO) (diversified energy, 1996-2000). From 1993 to 1996, she was a Senior Vice President of ARCO and President of ARCO Transportation Company. She served as a Director of ARCO from 1996 to 1998. Ms. Knowles currently serves as a Director and Chairman of the Audit Committee of McKesson Corporation (healthcare service, since 2002). Ms. Knowles is an Honorary Trustee of the Brookings Institution and a member of the Board of the Catalina Island Conservancy and of the Santa Catalina Island Company (2009-present). She also serves as a member of the Advisory Board for the School of Engineering of the University of Southern California and the Foundation Board of the School of Architecture at the University of Virginia (2007-present). Previously, Ms. Knowles served as a Director of Phelps Dodge Corporation (copper mining and manufacturing, 1994-2007). |
Kenneth L. Wolfe (72) |
| Year of Election or Appointment: 2007 Mr. Wolfe is Chairman of the Independent Trustees of the Fixed Income and Asset Allocation Funds (2008-present). Prior to his retirement, Mr. Wolfe served as Chairman and a Director (2007-2009) and Chairman and Chief Executive Officer (1994-2001) of Hershey Foods Corporation. He also served as a member of the Boards of Adelphia Communications Corporation (telecommunications, 2003-2006), Bausch & Lomb, Inc. (medical/pharmaceutical, 1993-2007), and Revlon, Inc. (personal care products, 2004-2009). |
+ The information above includes each Trustee's principal occupation during the last five years and other information relating to the experience, attributes, and skills relevant to each Trustee's qualifications to serve as a Trustee, which led to the conclusion that each Trustee should serve as a Trustee for each fund.
Executive Officers:
Correspondence intended for each executive officer may be sent to Fidelity Investments, 82 Devonshire Street, Boston, Massachusetts 02109.
Name, Age; Principal Occupation |
John R. Hebble (53) |
| Year of Election or Appointment: 2008 President and Treasurer of Fidelity's Fixed Income and Asset Allocation Funds. Mr. Hebble also serves as President (2011-present), Treasurer, and Chief Financial Officer of The North Carolina Capital Management Trust: Cash and Term Portfolios (2008-present), Assistant Treasurer of other Fidelity funds (2009-present) and is an employee of Fidelity Investments. |
Derek L. Young (47) |
| Year of Election or Appointment: 2009 Vice President of Fidelity's Asset Allocation Funds. Mr. Young also serves as President and a Director of Strategic Advisers, Inc. (2011-present), President of the Global Asset Allocation Group (2011-present), and as Vice Chairman of Pyramis Global Advisers, LLC (2011-present). Previously, Mr. Young served as Chief Investment Officer of the Global Asset Allocation Group (2009-2011) and as a portfolio manager. |
Scott C. Goebel (43) |
| Year of Election or Appointment: 2008 Secretary and Chief Legal Officer (CLO) of the Fidelity funds. Mr. Goebel also serves as Secretary of Fidelity Investments Money Management, Inc. (FIMM) (2010-present) and Fidelity Research and Analysis Company (FRAC) (2010-present); Secretary and CLO of The North Carolina Capital Management Trust: Cash and Term Portfolios (2008-present); General Counsel, Secretary, and Senior Vice President of FMR (2008-present) and FMR Co., Inc. (2008-present); employed by FMR LLC or an affiliate (2001-present); Chief Legal Officer of Fidelity Management & Research (Hong Kong) Limited (2008-present) and Assistant Secretary of Fidelity Management & Research (Japan) Inc. (2008-present), and Fidelity Management & Research (U.K.) Inc. (2008-present). Previously, Mr. Goebel served as Assistant Secretary of FIMM (2008-2010), FRAC (2008-2010), and the Funds (2007-2008) and as Vice President and Secretary of Fidelity Distributors Corporation (FDC) (2005-2007). |
David J. Carter (38) |
| Year of Election or Appointment: 2010 Assistant Secretary of Fidelity's Fixed Income and Asset Allocation Funds. Mr. Carter also serves as Vice President, Associate General Counsel (2010-present) and is an employee of Fidelity Investments (2005-present). |
Holly C. Laurent (57) |
| Year of Election or Appointment: 2008 Anti-Money Laundering (AML) Officer of the Fidelity funds. Ms. Laurent also serves as AML Officer of The North Carolina Capital Management Trust: Cash and Term Portfolios (2008-present) and is an employee of Fidelity Investments. Previously, Ms. Laurent was Senior Vice President and Head of Legal for Fidelity Business Services India Pvt. Ltd. (2006-2008), and Senior Vice President, Deputy General Counsel and Group Head for FMR LLC (2005-2006). |
Christine Reynolds (53) |
| Year of Election or Appointment: 2008 Chief Financial Officer of the Fidelity funds. Ms. Reynolds became President of Fidelity Pricing and Cash Management Services (FPCMS) in August 2008. Ms. Reynolds served as Chief Operating Officer of FPCMS (2007-2008). Previously, Ms. Reynolds served as President, Treasurer, and Anti-Money Laundering officer of the Fidelity funds (2004-2007). |
Michael H. Whitaker (44) |
| Year of Election or Appointment: 2008 Chief Compliance Officer of Fidelity's Fixed Income and Asset Allocation Funds. Mr. Whitaker also serves as Chief Compliance Officer of The North Carolina Capital Management Trust: Cash and Term Portfolios (2008-present). Mr. Whitaker is an employee of Fidelity Investments (2007-present). Prior to joining Fidelity Investments, Mr. Whitaker worked at MFS Investment Management where he served as Senior Vice President and Chief Compliance Officer (2004-2006), and Assistant General Counsel. |
Jeffrey S. Christian (50) |
| Year of Election or Appointment: 2009 Deputy Treasurer of the Fidelity funds. Mr. Christian is an employee of Fidelity Investments. Previously, Mr. Christian served as Chief Financial Officer (2008-2009) of certain Fidelity funds and Senior Vice President of Fidelity Pricing and Cash Management Services (FPCMS) (2004-2009). |
Joseph F. Zambello (54) |
| Year of Election or Appointment: 2011 Deputy Treasurer of the Fidelity funds. Mr. Zambello is an employee of Fidelity Investments. Previously, Mr. Zambello served as Vice President of FMR's Program Management Group (2009-2011) and Vice President of the Transfer Agent Oversight Group (2005-2009). |
Stephanie J. Dorsey (42) |
| Year of Election or Appointment: 2008 Deputy Treasurer of Fidelity's Fixed Income and Asset Allocation Funds. Ms. Dorsey also serves as Assistant Treasurer of other Fidelity funds (2010-present) and is an employee of Fidelity Investments (2008-present). Previously, Ms. Dorsey served as Treasurer (2004-2008) of the JPMorgan Mutual Funds and Vice President (2004-2008) of JPMorgan Chase Bank. |
Adrien E. Deberghes (44) |
| Year of Election or Appointment: 2010 Assistant Treasurer of Fidelity's Fixed Income and Asset Allocation Funds. Mr. Deberghes also serves as Vice President and Assistant Treasurer of Fidelity Rutland Square Trust II and Fidelity Commonwealth Trust II (2011-present), Deputy Treasurer of other Fidelity funds (2008-present), and is an employee of Fidelity Investments (2008-present). Previously, Mr. Deberghes served as Senior Vice President of Mutual Fund Administration at State Street Corporation (2007-2008), Senior Director of Mutual Fund Administration at Investors Bank & Trust (2005-2007), and Director of Finance for Dunkin' Brands (2000-2005). |
Kenneth B. Robins (42) |
| Year of Election or Appointment: 2009 Assistant Treasurer of the Fidelity Fixed Income and Asset Allocation Funds. Mr. Robins also serves as President and Treasurer of other Fidelity funds (2008-present; 2010-present) and is an employee of Fidelity Investments (2004-present). Previously, Mr. Robins served as Deputy Treasurer of the Fidelity funds (2005-2008) and Treasurer and Chief Financial Officer of The North Carolina Capital Management Trust: Cash and Term Portfolios (2006-2008). |
Gary W. Ryan (53) |
| Year of Election or Appointment: 2005 Assistant Treasurer of the Fidelity funds. Mr. Ryan is an employee of Fidelity Investments. Previously, Mr. Ryan served as Vice President of Fund Reporting in Fidelity Pricing and Cash Management Services (FPCMS) (1999-2005). |
Jonathan Davis (43) |
| Year of Election or Appointment: 2010 Assistant Treasurer of the Fidelity funds. Mr. Davis is also Assistant Treasurer of Fidelity Rutland Square Trust II and Fidelity Commonwealth Trust II. Mr. Davis is an employee of Fidelity Investments. Previously, Mr. Davis served as Vice President and Associate General Counsel of FMR LLC (2003-2010). |
Annual Report
A percentage of the dividends distributed during the fiscal year for the following funds qualifies for the dividends-received deduction for corporate shareholders:
Fund | December, 2011 |
VIP Funds Manager 20% | |
Service Class | 6% |
Service Class 2 | 7% |
Investor Class | 6% |
VIP Funds Manager 50% | |
Service Class | 14% |
Service Class 2 | 14% |
Investor Class | 14% |
VIP Funds Manager 60% | |
Service Class | 19% |
Service Class 2 | 19% |
Investor Class | 19% |
VIP Funds Manager 70% | |
Service Class | 21% |
Service Class 2 | 23% |
Investor Class | 21% |
VIP Funds Manager 85% | |
Service Class | 31% |
Service Class 2 | 34% |
Investor Class | 31% |
A percentage of the dividends distributed during the fiscal year for the following funds was derived from interest on U.S. Government securities which is generally exempt from state income tax:
VIP Funds Manager 20% | |
Service Class | 12.17% |
Service Class 2 | 12.17% |
Investor Class | 12.17% |
VIP Funds Manager 50% | |
Service Class | 8.81% |
Service Class 2 | 8.81% |
Investor Class | 8.81% |
VIP Funds Manager 60% | |
Service Class | 6.86% |
Service Class 2 | 6.86% |
Investor Class | 6.86% |
VIP Funds Manager 70% | |
Service Class | 5.32% |
Service Class 2 | 5.32% |
Investor Class | 5.32% |
VIP Funds Manager 85% | |
Service Class | 2.55% |
Service Class 2 | 2.55% |
Investor Class | 2.55% |
Annual Report
Distributions (Unaudited) - continued
The amounts per share which represent income derived from sources within, and taxes paid to, foreign countries or possessions of the United States are as follows:
VIP Funds Manager 20% | Pay Date | Income | Taxes |
Service Class | 12/29/2011 | $0.012 | $0.001 |
Service Class 2 | 12/29/2011 | $0.011 | $0.001 |
Investor Class | 12/29/2011 | $0.012 | $0.001 |
VIP Funds Manager 50% | | | |
Service Class | 12/29/2011 | $0.022 | $0.003 |
Service Class 2 | 12/29/2011 | $0.022 | $0.003 |
Investor Class | 12/29/2011 | $0.022 | $0.003 |
VIP Funds Manager 60% | | | |
Service Class | 12/29/2011 | $0.019 | $0.003 |
Service Class 2 | 12/29/2011 | $0.018 | $0.003 |
Investor Class | 12/29/2011 | $0.019 | $0.003 |
VIP Funds Manager 70% | | | |
Service Class | 12/29/2011 | $0.028 | $0.004 |
Service Class 2 | 12/29/2011 | $0.026 | $0.004 |
Investor Class | 12/29/2011 | $0.028 | $0.004 |
VIP Funds Manager 85% | | | |
Service Class | 12/29/2011 | $0.027 | $0.004 |
Service Class 2 | 12/29/2011 | $0.024 | $0.004 |
Investor Class | 12/29/2011 | $0.027 | $0.004 |
Annual Report
Board Approval of Investment Advisory Contracts and Management Fees
VIP FundsManager Funds
Each year, the Board of Trustees, including the Independent Trustees (together, the Board), votes on the renewal of the management contract and administration agreement (together, the Advisory Contracts) for each fund. The Board, assisted by the advice of fund counsel and Independent Trustees' counsel, requests and considers a broad range of information relevant to the renewal of the Advisory Contracts throughout the year.
The Board meets regularly and considers at each of its meetings factors that are relevant to its annual consideration of the renewal of each fund's Advisory Contracts, including the services and support provided to each fund and its shareholders. The Board has established three standing committees, Operations, Audit, and Nominating and Governance, each composed of Independent Trustees with varying backgrounds, to which the Board has assigned specific subject matter responsibilities in order to enhance effective decision-making by the Board. The Operations Committee, of which all of the Independent Trustees are members, meets regularly throughout the year and, among other matters, considers matters specifically related to the annual consideration of the renewal of each fund's Advisory Contracts. The Board, acting directly and through its Committees, requests and receives information concerning the annual consideration of the renewal of each fund's Advisory Contracts. The Board also meets as needed to consider matters specifically related to the Board's annual consideration of the renewal of Advisory Contracts. Members of the Board may also meet with trustees of other Fidelity funds through ad hoc joint committees to discuss certain matters relevant to the Fidelity funds.
At its September 2011 meeting, the Board of Trustees, including the Independent Trustees, unanimously determined to renew each fund's Advisory Contracts. In reaching its determination, the Board considered all factors it believed relevant, including (i) the nature, extent, and quality of the services to be provided to each fund and its shareholders (including the investment performance of each fund); (ii) the competitiveness of each fund's management fee and total expense ratio; (iii) the total costs of the services to be provided by and the profits to be realized by Fidelity from its relationship with each fund; (iv) the extent to which economies of scale would be realized as each fund grows; and (v) whether fee levels reflect these economies of scale, if any, for the benefit of fund shareholders.
In considering whether to renew the Advisory Contracts for each fund, the Board reached a determination, with the assistance of fund counsel and Independent Trustees' counsel and through the exercise of its business judgment, that the renewal of the Advisory Contracts is in the best interests of each fund and its shareholders and that the compensation payable under the Advisory Contracts is fair and reasonable. The Board's decision to renew the Advisory Contracts was not based on any single factor, but rather was based on a comprehensive consideration of all the information provided to the Board at its meetings throughout the year. The Board, in reaching its determination to renew the Advisory Contracts, is aware that shareholders in each fund have a broad range of investment choices available to them, including a wide choice among mutual funds offered by Fidelity's competitors, and that each fund's shareholders, who have the opportunity to review and weigh the disclosure provided by the fund in its prospectus and other public disclosures, have chosen to invest in that fund, managed by Fidelity.
Nature, Extent, and Quality of Services Provided. The Board considered the staffing within the investment adviser, Strategic Advisers, Inc. (Strategic Advisers), and the administrator, FMR, including the backgrounds of the funds' investment personnel and the funds' investment objectives and disciplines. The Independent Trustees also had discussions with senior management of Fidelity's investment operations and investment groups. The Board considered the structure of the portfolio manager compensation program and whether this structure provides appropriate incentives to act in the best interests of each fund.
Resources Dedicated to Investment Management and Support Services. The Board reviewed the general qualifications and capabilities of Strategic Advisers' investment staff, including its size, education, experience, and resources, as well as Strategic Advisers' and FMR's approach to recruiting, managing, and compensating investment personnel. The Board also noted that FMR has devoted increased resources to non-U.S. offices. The Board noted that Fidelity's analysts have extensive resources, tools and capabilities which allow them to conduct sophisticated quantitative and fundamental analysis, as well as credit analysis of issuers, counterparties and enhancers. The Board also believes that Fidelity's investment professionals have sufficient access to global information and data so as to provide competitive investment results over time, and that those professionals also have access to sophisticated tools which permit them to assess portfolio construction and risk and performance attribution characteristics continuously, as well as to transmit new information and research conclusions rapidly around the world. Additionally, in its deliberations, the Board considered Strategic Advisers' trading capabilities and resources which are an integral part of the investment management process.
Shareholder and Administrative Services. The Board considered (i) the nature, extent, quality, and cost of advisory, administrative, and shareholder services performed by FMR and its affiliates under the Advisory Contracts and under separate agreements covering transfer agency, pricing and bookkeeping, and securities lending services for each fund; (ii) the nature and extent of FMR's supervision of third party service providers, principally custodians and subcustodians; and (iii) the resources devoted to, and the record of compliance with, each fund's compliance policies and procedures.
The Board noted that the growth of fund assets over time across the complex allows Fidelity to reinvest in the development of services designed to enhance the value or convenience of the Fidelity funds as investment vehicles. These services include 24-hour access to account information and market information through telephone representatives and over the Internet, investor education materials and asset allocation tools, and the expanded availability of Fidelity Investor Centers, with 35 new branches opening since 2010.
Annual Report
Board Approval of Investment Advisory Contracts and Management Fees - continued
Investment in a Large Fund Family. The Board considered the benefits to shareholders of investing in a Fidelity fund, including the benefits of investing in a fund that is part of a large family of funds offering a variety of investment disciplines and providing a large variety of mutual fund investor services. The Board noted that Fidelity had taken, or had made recommendations that resulted in the Fidelity funds taking, a number of actions over the previous year that benefited particular funds, including (i) continuing to dedicate additional resources to investment research and support of the senior management team that oversees asset management; (ii) rationalizing product lines through the mergers of six funds into other funds; (iii) continuing to migrate the Freedom Funds to dedicated lower cost underlying funds; (iv) obtaining shareholder approval to broaden the investment strategies for Fidelity Consumer Finance Portfolio, Fidelity Emerging Asia Fund, and Fidelity Environment and Alternative Energy Portfolio; (v) contractually agreeing to reduce the management fees and impose other expense limitations on Spartan 500 Index Fund and U.S. Bond Index Fund in connection with launching new institutional classes of these funds; (vi) changing the name, primary and supplemental benchmarks, and investment policies of Fidelity Global Strategies Fund to support the fund's flexible investment mandate and global orientation; and (vii) reducing the transfer agency account fee rates on certain accounts.
Investment Performance. The Board considered whether each fund has operated in accordance with its investment objective, as well as its record of compliance with its investment restrictions. It also reviewed each fund's absolute investment performance for each class, as well as each fund's relative investment performance for each class measured over multiple periods against a proprietary custom index. The Board noted that FMR does not believe that a meaningful peer group exists against which to compare any of the funds' performance. Because each fund had been in existence less than five calendar years, for each fund the following charts considered by the Board show, over the one- and three-year periods ended December 31, 2010, the cumulative total returns of Investor Class and Service Class 2 of the fund and the cumulative total returns of a proprietary custom index ("benchmark"). The returns of Investor Class and Service Class 2 show the performance of the highest and lowest performing classes, respectively (based on three-year performance). For each fund, the proprietary custom index is an index developed by FMR that represents the performance of the fund's asset classes according to their respective weightings.
VIP FundsManager 20%
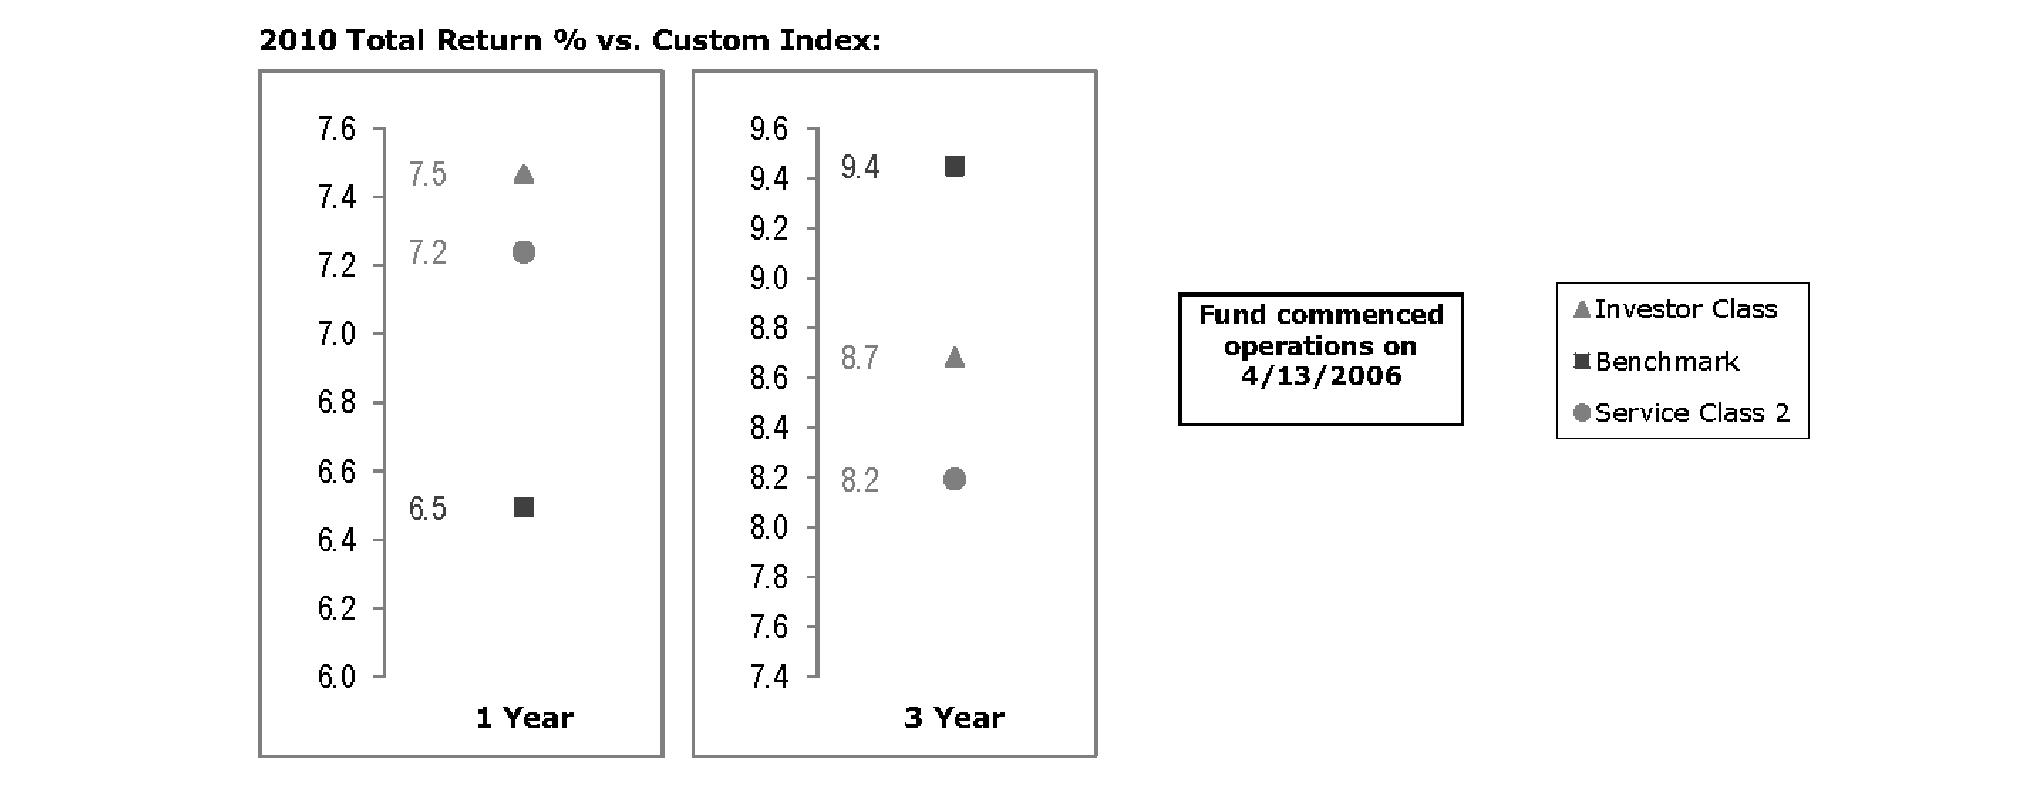
The Board noted that the investment performance of Investor Class of the fund compared favorably to its benchmark for the one-year period, although the fund's three-year cumulative total return was lower than its benchmark. The Board considered that the variations in performance among the fund's classes reflect the variations in class expenses, which result in lower performance for higher expense classes. The Board also reviewed the fund's performance since inception as well as performance in the current year.
Annual Report
VIP FundsManager 50%
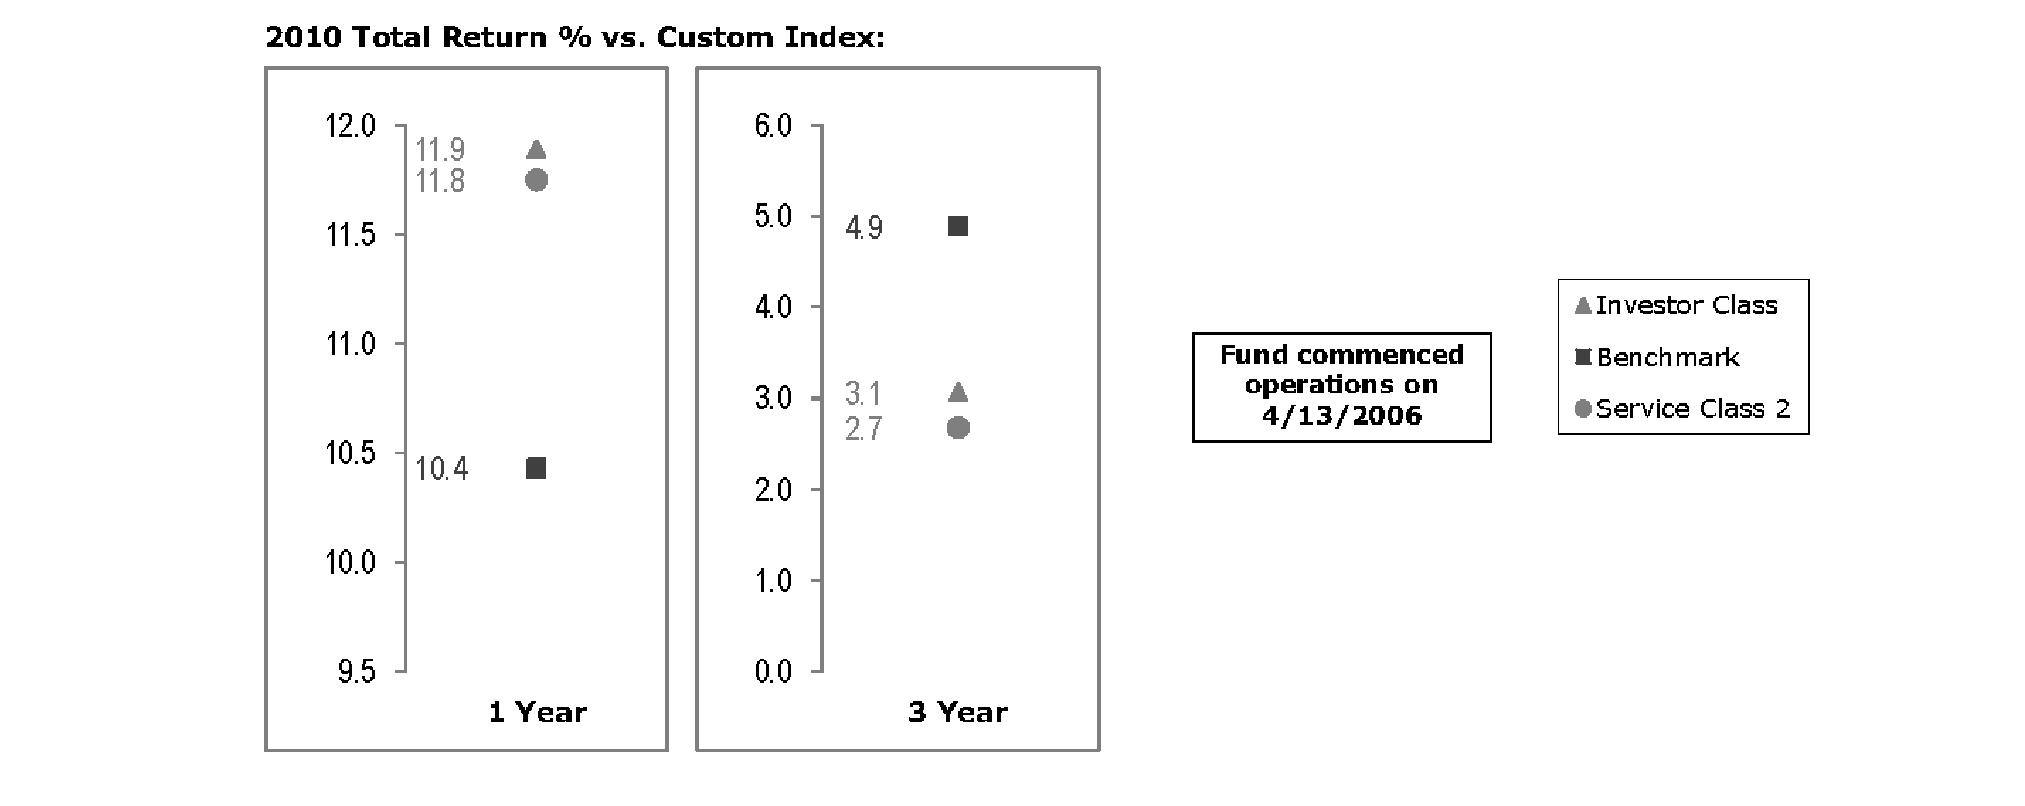
The Board noted that the investment performance of Investor Class of the fund compared favorably to its benchmark for the one-year period, although the fund's three-year cumulative total return was lower than its benchmark. The Board considered that the variations in performance among the fund's classes reflect the variations in class expenses, which result in lower performance for higher expense classes. The Board also reviewed the fund's performance since inception as well as performance in the current year.
VIP FundsManager 60%
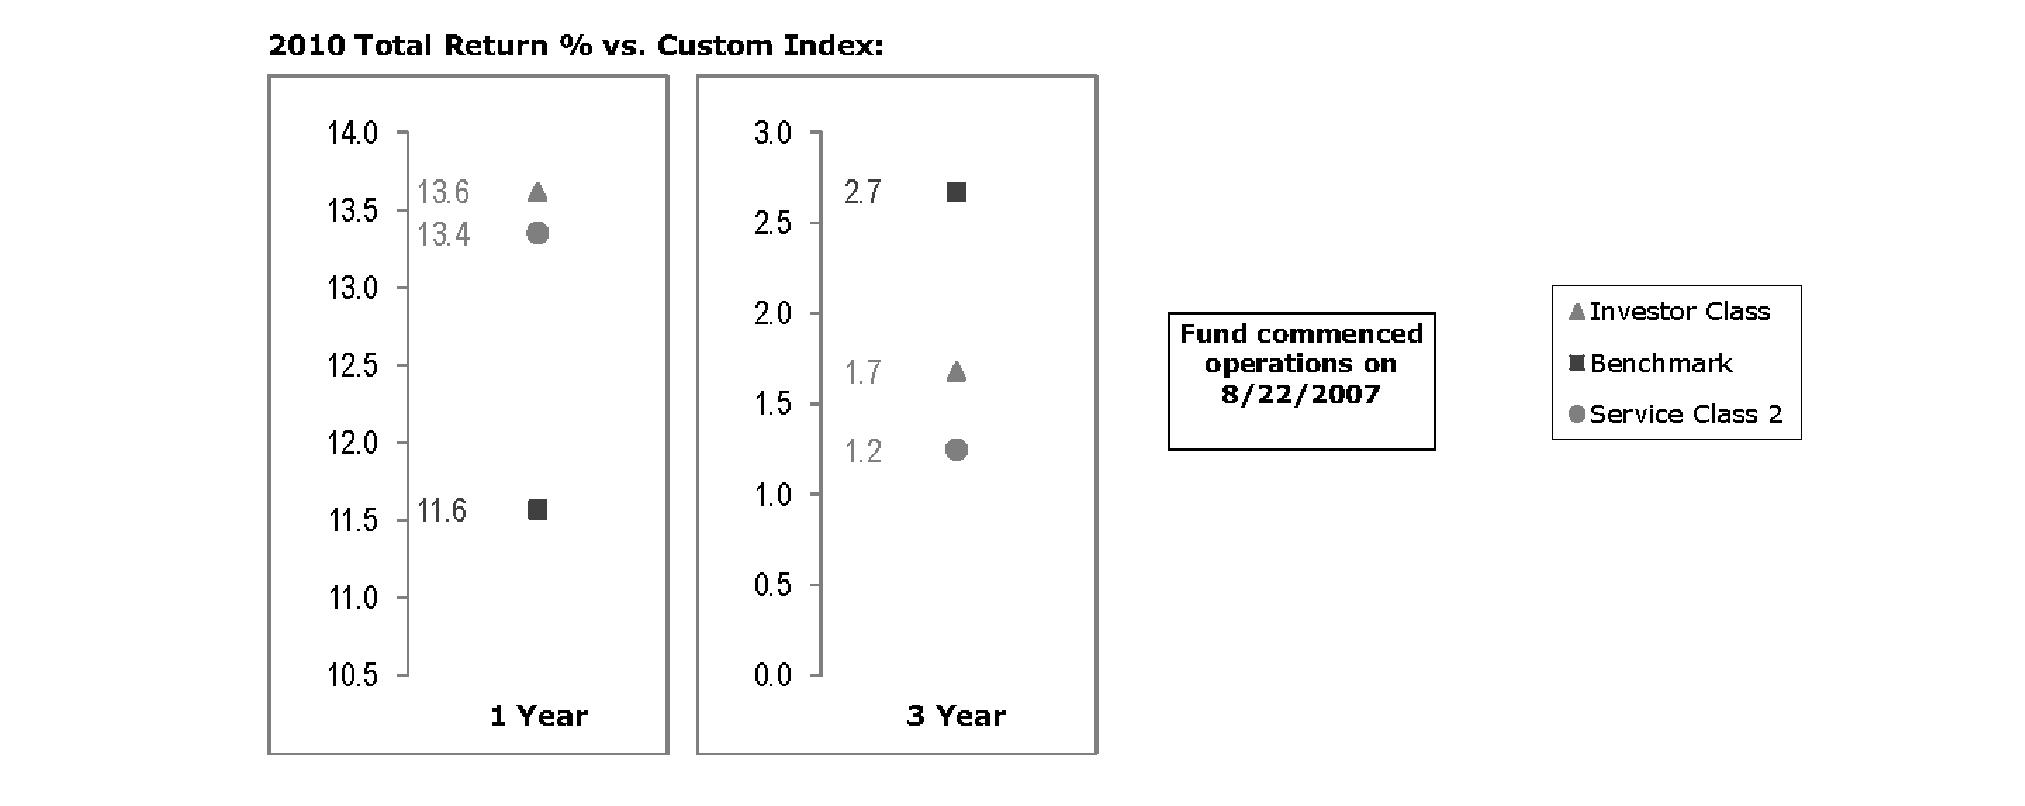
The Board noted that the investment performance of Investor Class of the fund compared favorably to its benchmark for the one-year period, although the fund's three-year cumulative total return was lower than its benchmark. The Board considered that the variations in performance among the fund's classes reflect the variations in class expenses, which result in lower performance for higher expense classes. The Board also reviewed the fund's performance since inception as well as performance in the current year.
Annual Report
Board Approval of Investment Advisory Contracts and Management Fees - continued
VIP FundsManager 70%
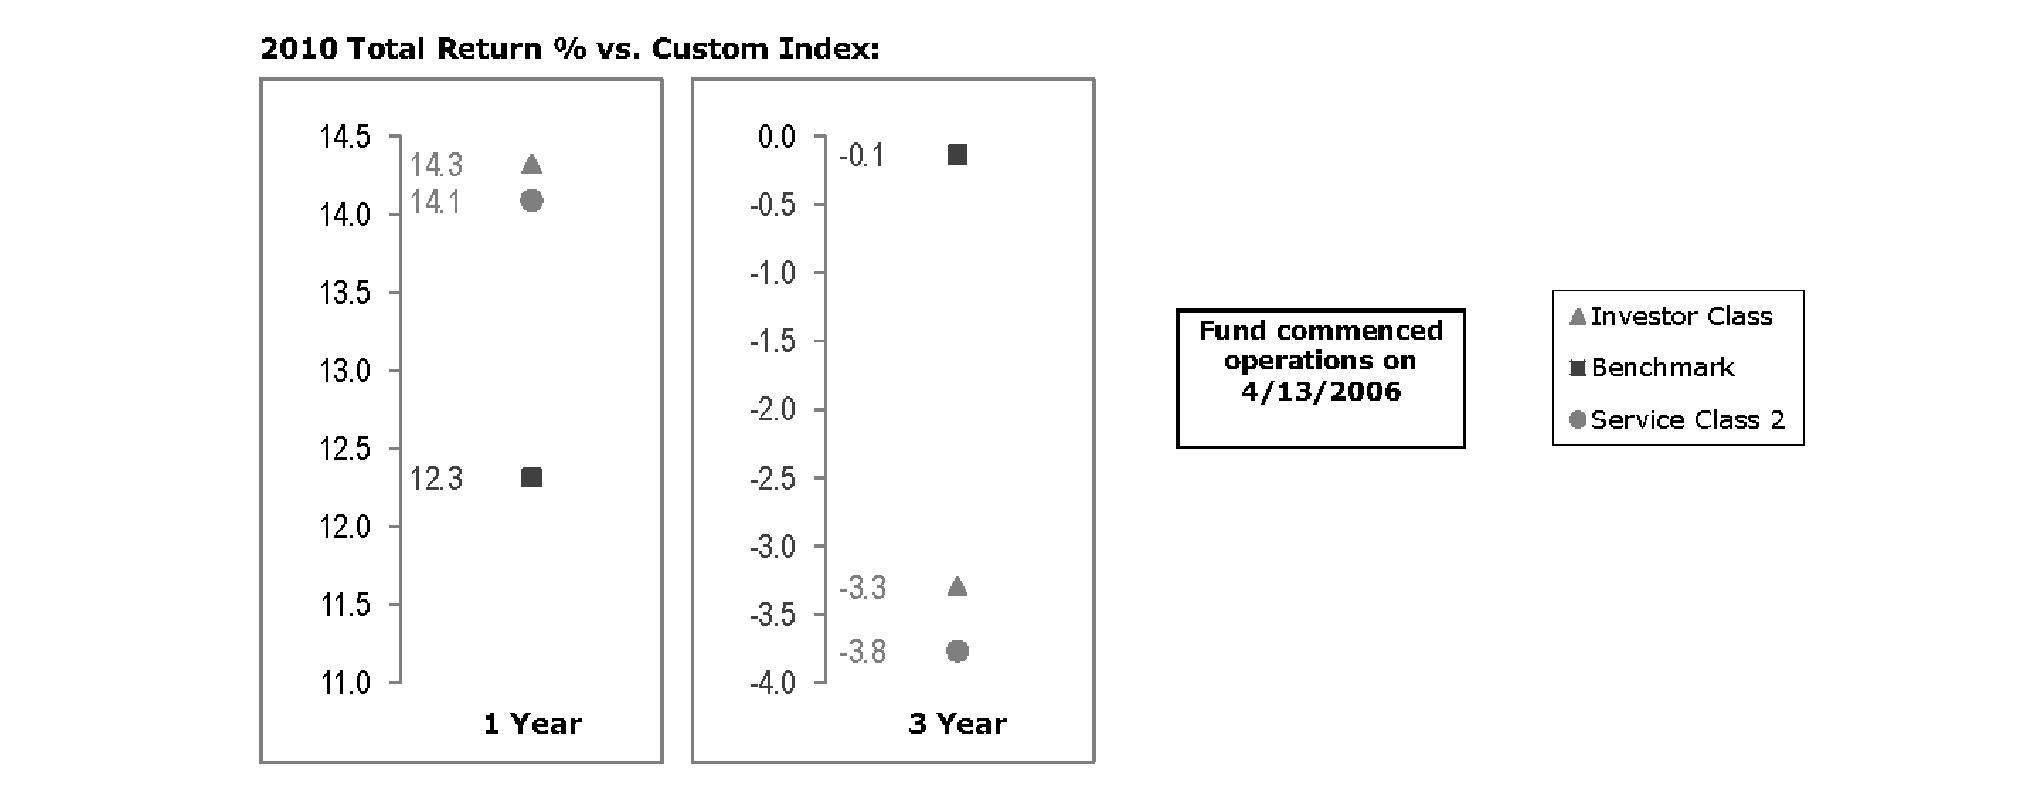
The Board noted that the investment performance of Investor Class of the fund compared favorably to its benchmark for the one-year period, although the fund's three-year cumulative total return was lower than its benchmark. The Board considered that the variations in performance among the fund's classes reflect the variations in class expenses, which result in lower performance for higher expense classes. The Board also reviewed the fund's performance since inception as well as performance in the current year.
VIP FundsManager 85%
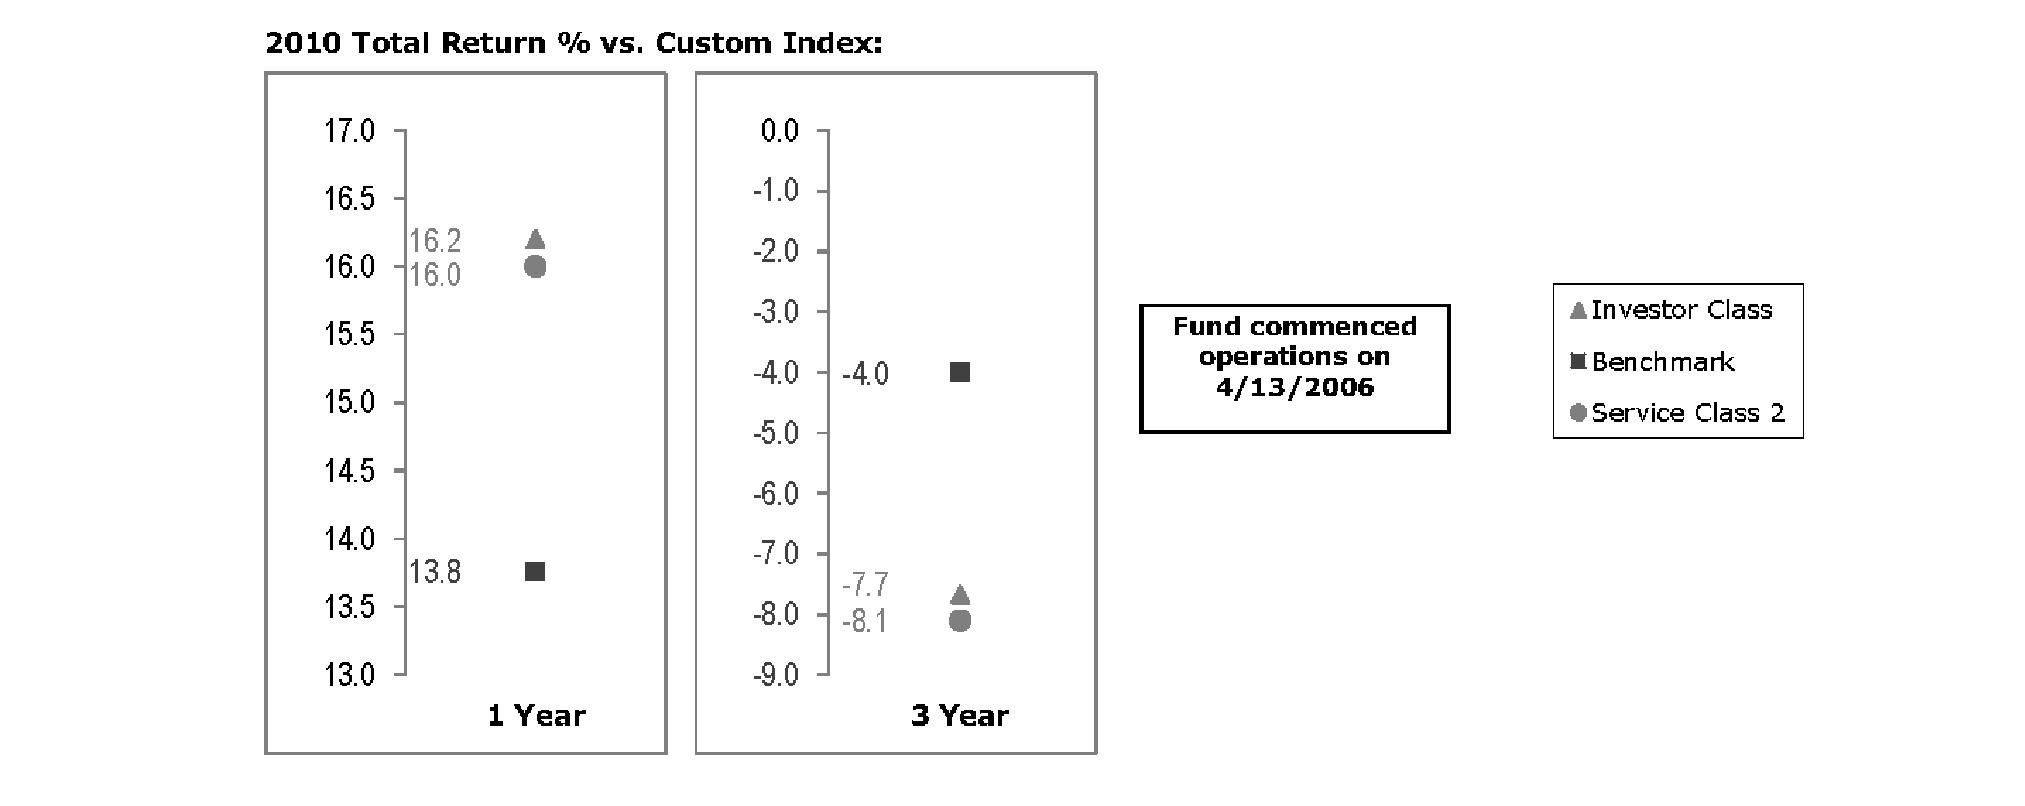
The Board noted that the investment performance of Investor Class of the fund compared favorably to its benchmark for the one-year period, although the fund's three-year cumulative total return was lower than its benchmark. The Board considered that the variations in performance among the fund's classes reflect the variations in class expenses, which result in lower performance for higher expense classes. The Board also reviewed the fund's performance since inception as well as performance in the current year.
Based on its review, the Board concluded that the nature, extent, and quality of services provided to each fund under the Advisory Contracts should benefit each fund's shareholders.
Competitiveness of Management Fee and Total Expense Ratio. The Board considered each fund's management fee and total expense ratio compared to "mapped groups" of competitive funds and classes, and also considered that each fund bears indirectly the expenses of the underlying funds in which it invests. Fidelity creates "mapped groups" by combining similar Lipper investment objective categories that have comparable management fee characteristics. Combining Lipper investment objective categories aids the Board's management fee and total expense ratio comparisons by broadening the competitive group used for comparison and by reducing the number of universes to which various Fidelity funds are compared.
Annual Report
Management Fee. The Board considered two proprietary management fee comparisons for the 12-month (or shorter) periods shown in the charts below. The group of Lipper funds used by the Board for management fee comparisons is referred to below as the "Total Mapped Group." The Total Mapped Group comparison focuses on a fund's standing relative to the total universe of comparable funds available to investors in terms of gross management fees before expense reimbursements or caps. "TMG %" represents the percentage of funds in the Total Mapped Group that had management fees that were lower than a fund's. For example, a TMG % of 77% would mean that 23% of the funds in the Total Mapped Group had higher management fees than a fund. The "Asset-Size Peer Group" (ASPG) comparison focuses on a fund's standing relative to non-Fidelity funds similar in size to the fund within the Total Mapped Group. The ASPG represents at least 15% of the funds in the Total Mapped Group with comparable asset size and management fee characteristics, subject to a minimum of 50 funds (or all funds in the Total Mapped Group if fewer than 50). Additional information, such as the ASPG quartile in which a fund's management fee ranked, is also included in the charts and considered by the Board. Because the vast majority of competitor funds' management fees do not cover non-management expenses, for a more meaningful comparison of management fees, each fund is compared on the basis of a hypothetical "net management fee," which is derived by subtracting payments made by FMR (under the administration agreement) for non-management expenses (including pricing and bookkeeping fees and fees paid to non-affiliated custodians) from the fund's all-inclusive fee. In this regard, the Board realized that net management fees can vary from year to year because of differences in non-management expenses, and that non-management expenses may exceed the fund's all-inclusive fee and result in a negative net management fee.
VIP FundsManager 20%
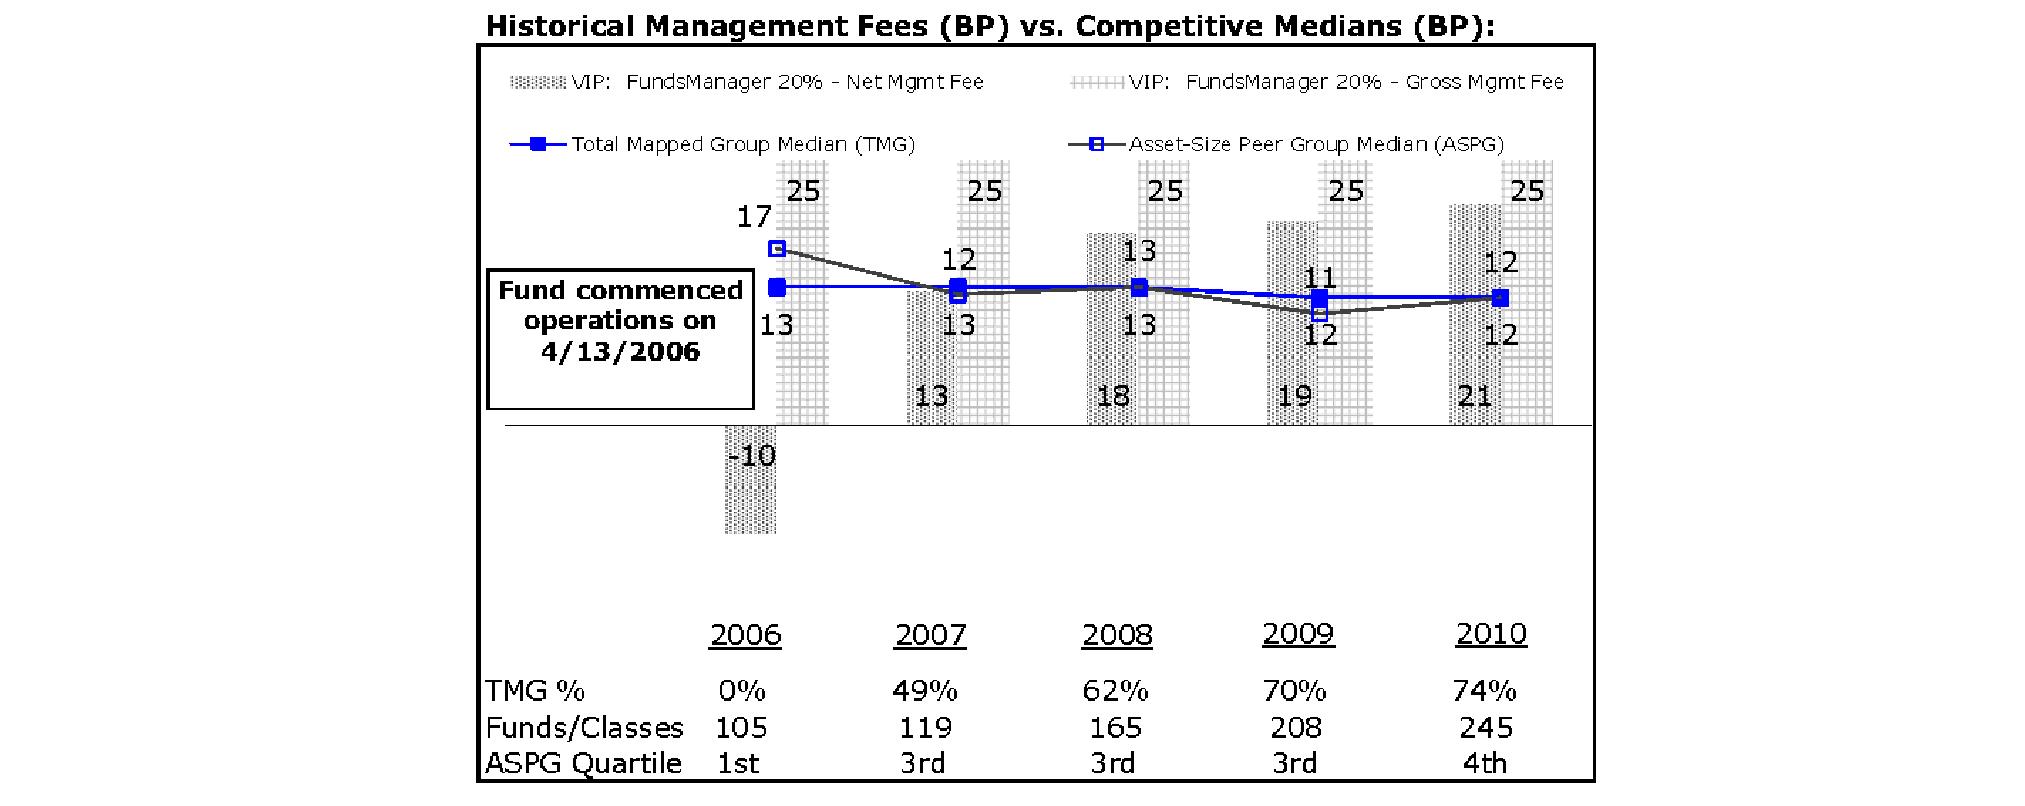
Annual Report
Board Approval of Investment Advisory Contracts and Management Fees - continued
VIP FundsManager 50%
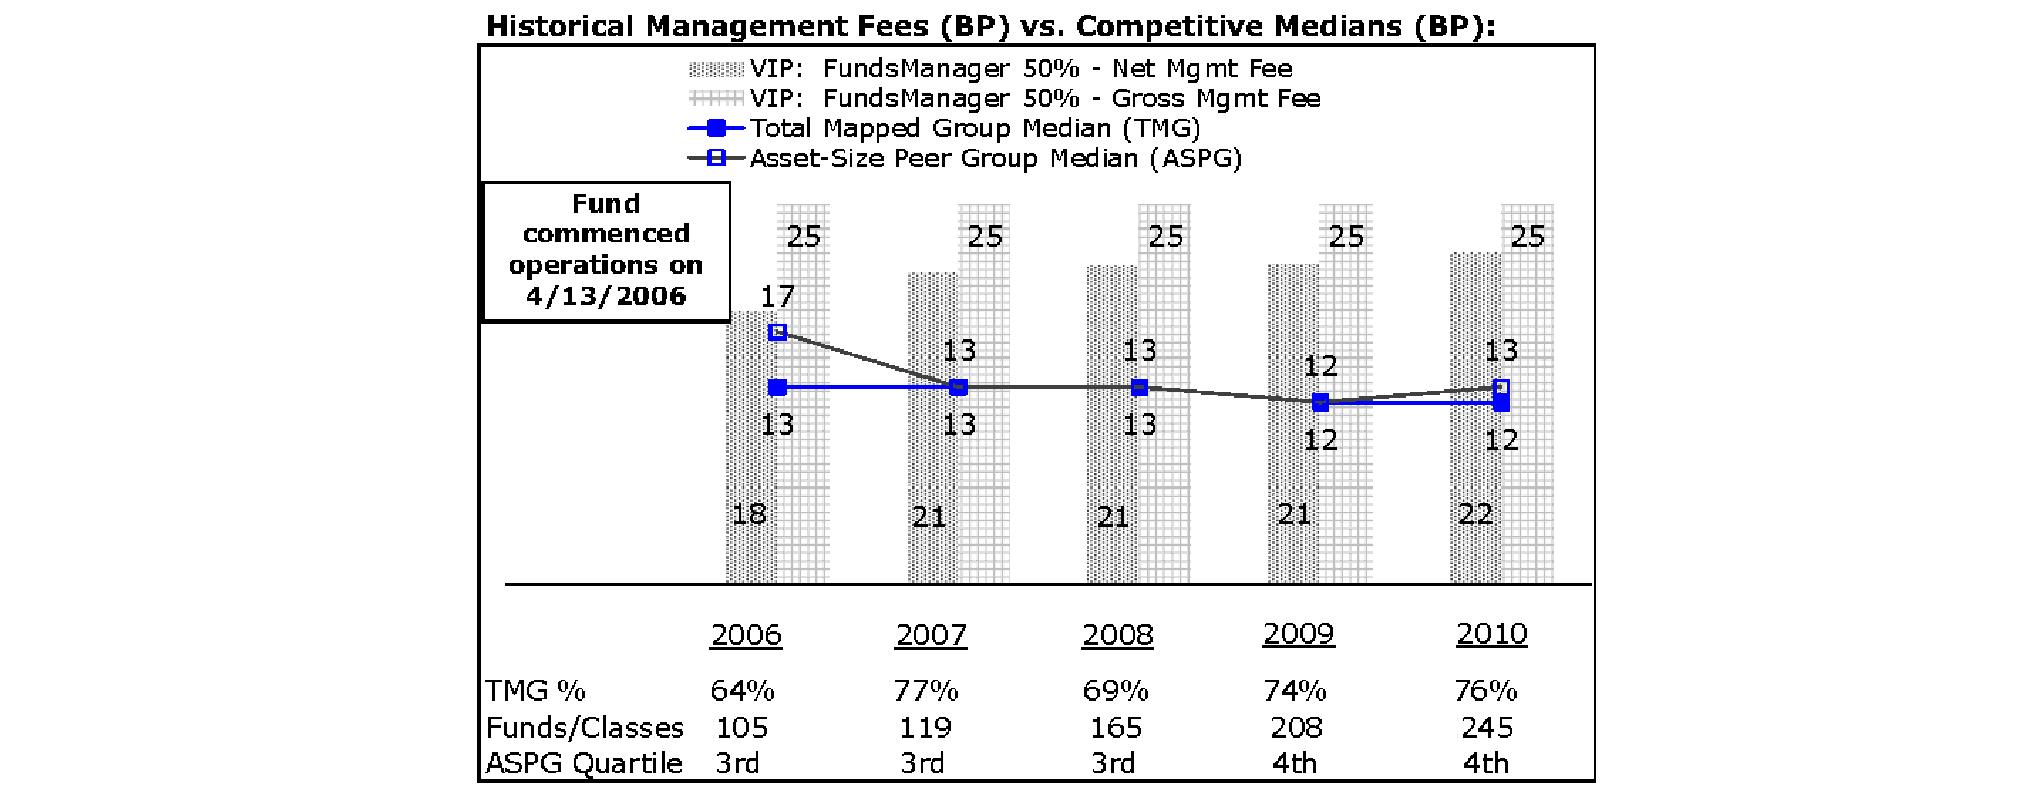
VIP FundsManager 60%

Annual Report
VIP FundsManager 70%

VIP FundsManager 85%
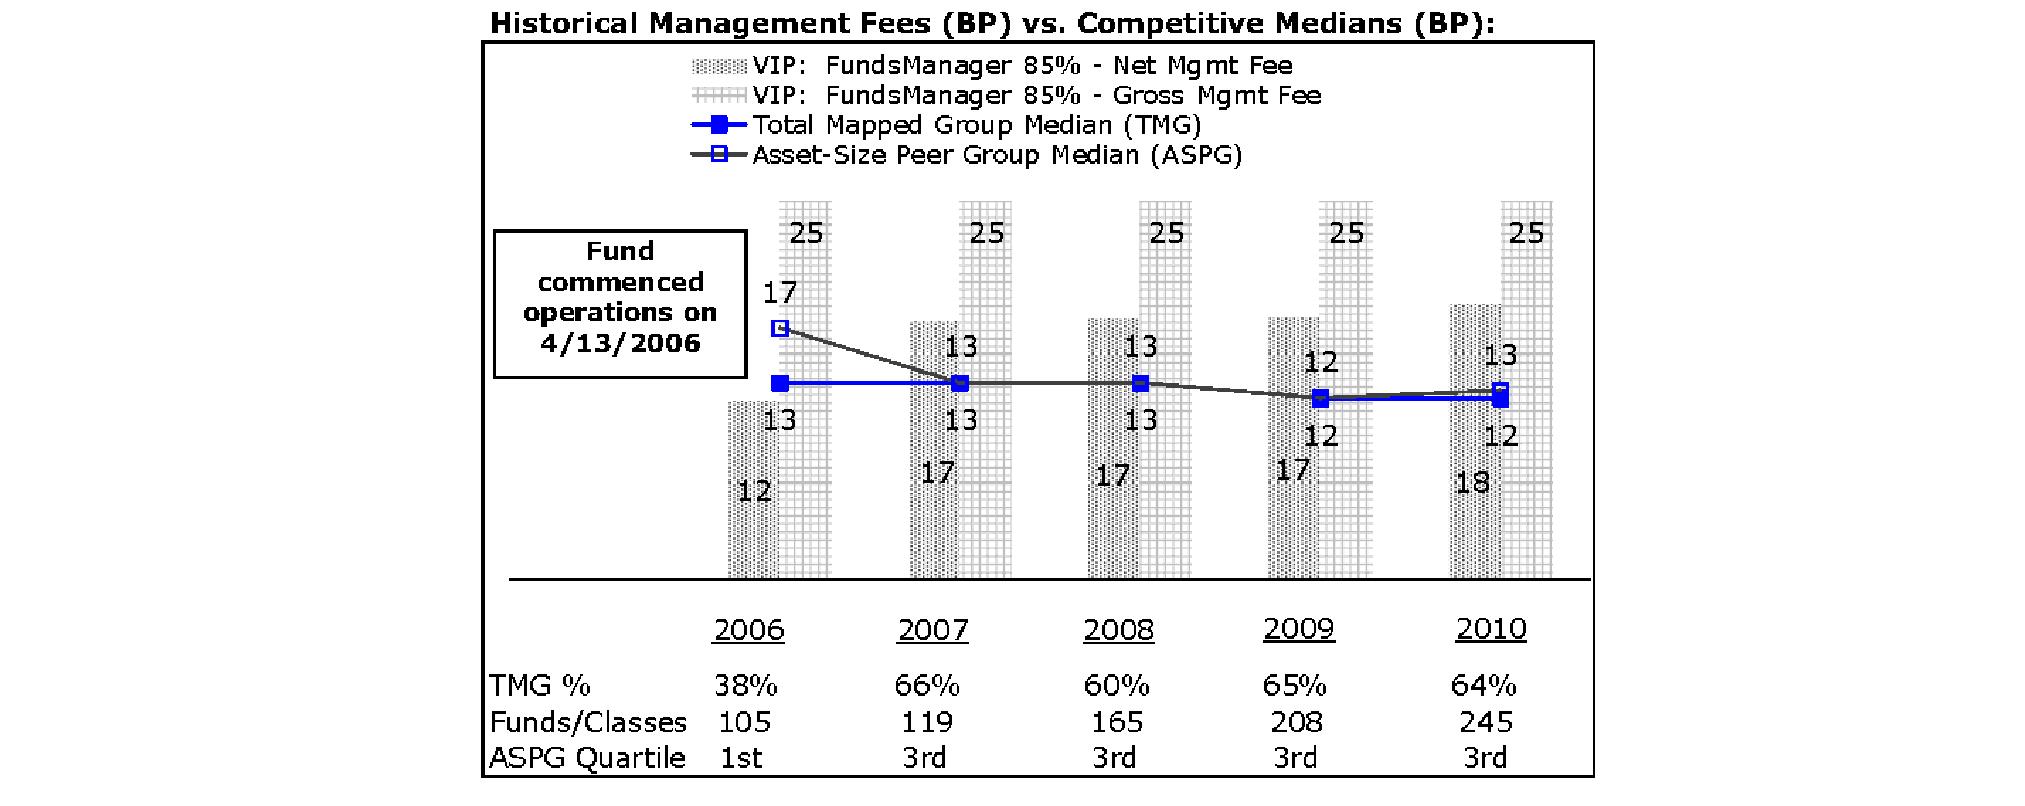
The Board noted that each fund's hypothetical net management fee ranked above the median of its Total Mapped Group and above the median of its ASPG for 2010. The Board considered that the funds are more actively managed than other funds in their Total Mapped Group.
Based on its review, the Board concluded that each fund's management fee is fair and reasonable in light of the services that the fund receives and the other factors considered.
Total Expense Ratio. In its review of the total expense ratio of each class of each fund, the Board considered the fund's hypothetical net management fee as well as the fund's all-inclusive fee. The Board also considered other expenses, such as pricing and bookkeeping fees and custodial, legal, and audit fees, paid by FMR under the administration agreement. The Board also noted the effects of any waivers and reimbursements on fees and expenses. As part of its review, the Board also considered the current and historical total expense ratios of each fund compared to competitive fund median expenses. Each fund is compared to those funds and classes in the Total Mapped Group (used by the Board for management fee comparisons) that have a similar sales load structure.
The Board noted that the total expense ratio of each of Investor Class and Service Class of each fund ranked below its competitive median for 2010 and the total expense ratio of Service Class 2 of each fund ranked above its competitive median for 2010. The Board considered that various factors, including 12b-1 fees and relatively higher other expenses in the case of small fund size, can affect total expense ratios. The Board noted that the total expense ratio of Service Class 2 of each fund was above the median due to 12b-1 fees and that the funds and classes in the Total Mapped Group that have a similar sales load structure included classes with no 12b-1 fees. Excluding the 12b-1 fees, the total expense ratio of Service Class 2 of each fund ranked below its competitive median for 2010. The Board noted that each fund offers multiple classes, each of which has a different 12b-1 fee structure, and that the multiple structures are intended to offer a range of pricing options for the intermediary market. The Board also noted that the total expense ratios of the classes of each fund vary primarily by the level of their 12b-1 fees.
Annual Report
Board Approval of Investment Advisory Contracts and Management Fees - continued
Fees Charged to Other Fidelity Clients. The Board also considered Fidelity fee structures and other information with respect to clients of FMR and its affiliates, such as other mutual funds advised or subadvised by FMR or its affiliates, pension plan clients, and other institutional clients. In March 2010, the Board created an ad hoc joint committee with the board of other Fidelity funds (the Committee) to review and compare Fidelity's institutional investment advisory business with its business of providing services to the Fidelity funds, including the differences in services provided, fees charged, and costs incurred, as well as competition in their respective marketplaces.
Based on its review of total expense ratios and fees charged to other Fidelity clients, the Board concluded that the total expense ratio of each class of each fund was reasonable, although in some cases above the median of the universe presented for comparison, in light of the services that the fund and its shareholders receive and the other factors considered, including the findings of the Committee.
Costs of the Services and Profitability. The Board considered the revenues earned and the expenses incurred by Fidelity in conducting the business of developing, marketing, distributing, managing, administering and servicing each fund and its shareholders. The Board also considered the level of Fidelity's profits in respect of all the Fidelity funds.
On an annual basis, FMR presents to the Board Fidelity's profitability for each fund. Fidelity calculates the profitability for each fund, as well as aggregate profitability for groups of Fidelity funds and all Fidelity funds, using a series of detailed revenue and cost allocation methodologies which originate with the books and records of Fidelity on which Fidelity's audited financial statements are based. The Audit Committee of the Board reviews any significant changes from the prior year's methodologies.
PricewaterhouseCoopers LLP (PwC), independent registered public accounting firm and auditor to Fidelity and certain Fidelity funds, has been engaged annually by the Board as part of the Board's assessment of Fidelity's profitability analysis. PwC's engagement includes the review and assessment of Fidelity's methodologies used in determining the revenues and expenses attributable to Fidelity's mutual fund business, and completion of agreed-upon procedures surrounding the mathematical accuracy of fund profitability and its conformity to allocation methodologies. After considering PwC's reports issued under the engagement and information provided by Fidelity, the Board concluded that while other allocation methods may also be reasonable, Fidelity's profitability methodologies are reasonable in all material respects.
The Board also reviewed Fidelity's non-fund businesses and fall-out benefits related to the mutual fund business as well as cases where Fidelity's affiliates may benefit from or be related to the funds' business.
The Board considered the costs of the services provided by and the profits realized by Fidelity in connection with the operation of each fund and was satisfied that the profitability was not excessive in the circumstances.
Economies of Scale. The Board considered whether there have been economies of scale in respect of the management of the Fidelity funds, whether the Fidelity funds (including each fund) have appropriately benefited from any such economies of scale, and whether there is potential for realization of any further economies of scale. The Board considered the extent to which each fund will benefit from economies of scale through increased services to the fund, through waivers or reimbursements, or through fee or expense reductions. The Board also noted that in 2009, it and the board of other Fidelity funds created an ad hoc committee (the Economies of Scale Committee) to analyze whether FMR attains economies of scale in respect of the management and servicing of the Fidelity funds, whether the Fidelity funds have appropriately benefited from such economies of scale, and whether there is potential for realization of any further economies of scale.
The Board concluded, taking into account the analysis of the Economies of Scale Committee, that any potential economies of scale are being appropriately shared between fund shareholders and Fidelity.
Additional Information Requested by the Board. In order to develop fully the factual basis for consideration of the Fidelity funds' Advisory Contracts, the Board requested and received additional information on certain topics, including: (i) Fidelity's fund profitability methodology, profitability trends for certain funds, and the impact of certain factors on fund profitability results; (ii) portfolio manager changes that have occurred during the past year and the amount of the investment that each portfolio manager has made in the Fidelity fund(s) that he or she manages; (iii) Fidelity's compensation structure for portfolio managers, research analysts, and other key personnel, including its effects on fund profitability, the rationale for the compensation structure, and the extent to which current market conditions have affected retention and recruitment; (iv) the compensation paid to fund sub-advisers on behalf of the Fidelity funds; (v) Fidelity's fee structures and rationale for recommending different fees among different categories of funds and classes, as well as Fidelity's voluntary waiver of its fees to maintain minimum yields for certain money market funds and classes; (vi) the reasons why certain expenses affect various funds and classes differently; (vii) Fidelity's transfer agent fees, expenses, and services and how the benefits of decreased costs and new efficiencies can be shared across all of the Fidelity funds; (viii) the reasons for and consequences of changes to certain product lines compared to competitors; (ix) the allocation of and historical trends in Fidelity's realization of fall-out benefits; and (x) explanations regarding the relative total expense ratios of certain funds and classes, total expense competitive trends, and actions that might be taken by FMR to reduce total expense ratios for certain funds and classes or to achieve further economies of scale.
Annual Report
Based on its evaluation of all of the conclusions noted above, and after considering all factors it believed relevant, the Board ultimately concluded that the advisory fee structures are fair and reasonable, and that each fund's Advisory Contracts should be renewed.
Annual Report
Investment Adviser
Strategic Advisers, Inc.
Boston, MA
General Distributor
Fidelity Distributors Corporation
Boston, MA
Transfer and Service Agents
Fidelity Investments Institutional Operations Company, Inc.
Boston, MA
Fidelity Service Company, Inc.
Boston, MA
Custodian
The Bank of New York Mellon
New York, NY
VIPFM-ANN-0212
1.843208.105
Fidelity® Variable Insurance Products:
Investment Grade Bond Portfolio
Annual Report
December 31, 2011
Contents
Performance | (Click Here) | How the fund has done over time. |
Management's Discussion of Fund Performance | (Click Here) | The Portfolio Manager's review of fund performance and strategy. |
Shareholder Expense Example | (Click Here) | An example of shareholder expenses. |
Investment Changes | (Click Here) | A summary of major shifts in the fund's investments over the past six months. |
Investments | (Click Here) | A complete list of the fund's investments with their market values. |
Financial Statements | (Click Here) | Statements of assets and liabilities, operations, and changes in net assets, as well as financial highlights. |
Notes | (Click Here) | Notes to the financial statements. |
Report of Independent Registered Public Accounting Firm | (Click Here) | |
Trustees and Officers | (Click Here) | |
Distributions | (Click Here) | |
Board Approval of Investment Advisory Contracts and Management Fees | (Click Here) | |
Fidelity® VIP Investment Grade Central Fund Financial Statements | (Click Here) | Complete list of investments and financial statements for Fidelity® VIP Investment Grade Central Fund. |
To view a fund's proxy voting guidelines and proxy voting record for the 12-month period ended June 30, visit http://www.fidelity.com/proxyvotingresults or visit the Securities and Exchange Commission's (SEC) web site at http://www.sec.gov. You may also call 1-877-208-0098 to request a free copy of the proxy voting guidelines.
Fidelity Variable Insurance Products are separate account options which are purchased through a variable insurance contract.
Standard & Poor's, S&P and S&P 500 are registered service marks of The McGraw-Hill Companies, Inc. and have been licensed for use by Fidelity Distributors Corporation.
Other third party marks appearing herein are the property of their respective owners.
All other marks appearing herein are registered or unregistered trademarks or service marks of FMR LLC or an affiliated company.
This report and the financial statements contained herein are submitted for the general information of the shareholders of the fund. This report is not authorized for distribution to prospective investors in the fund unless preceded or accompanied by an effective prospectus.
A fund files its complete schedule of portfolio holdings with the SEC for the first and third quarters of each fiscal year on Form N-Q. Forms N-Q are available on the SEC's web site at http://www.sec.gov. A fund's Forms N-Q may be reviewed and copied at the SEC's Public Reference Room in Washington, DC. Information regarding the operation of the SEC's Public Reference Room may be obtained by calling 1-800-SEC-0330. For a complete list of a fund's portfolio holdings, view the most recent holdings listing, semiannual report, or annual report on Fidelity's web site at http://www.fidelity.com, http://www.advisor.fidelity.com, or http://www.401k.com, as applicable.
NOT FDIC INSURED • MAY LOSE VALUE • NO BANK GUARANTEE
Neither the fund nor Fidelity Distributors Corporation is a bank.
Annual Report
Average annual total return reflects the change in the value of an investment, assuming reinvestment of the class' distributions from dividend income and capital gains (the profits earned upon the sale of securities that have grown in value, if any) and assuming a constant rate of performance each year. During periods of reimbursement by Fidelity, a fund's total return will be greater than it would be had the reimbursement not occurred. Performance numbers are net of all underlying fund operating expenses, but do not include any insurance charges imposed by your insurance company's separate account. If performance information included the effect of these additional charges, the total returns would have been lower. How a fund did yesterday is no guarantee of how it will do tomorrow.
Average Annual Total Returns
Periods ended December 31, 2011 | Past 1
year | Past 5
years | Past 10
years |
VIP Investment Grade Bond Portfolio - Initial Class | 7.33% | 6.21% | 5.74% |
VIP Investment Grade Bond Portfolio - Service Class | 7.21% | 6.11% | 5.63% |
VIP Investment Grade Bond Portfolio - Service Class 2 | 7.03% | 5.96% | 5.49% |
VIP Investment Grade Bond Portfolio - Investor Class A | 7.25% | 6.18% | 5.72% |
A The initial offering of Investor Class shares took place on July 21, 2005. Returns prior to July 21, 2005 are those of Initial Class. Had Investor Class's transfer agent fee been reflected, returns prior to July 21, 2005, would have been lower.
$10,000 Over 10 Years
Let's say hypothetically that $10,000 was invested in VIP Investment Grade Bond Portfolio - Initial Class on December 31, 2001. The chart shows how the value of your investment would have changed, and also shows how the Barclays Capital® U.S. Aggregate Bond Index performed over the same period.
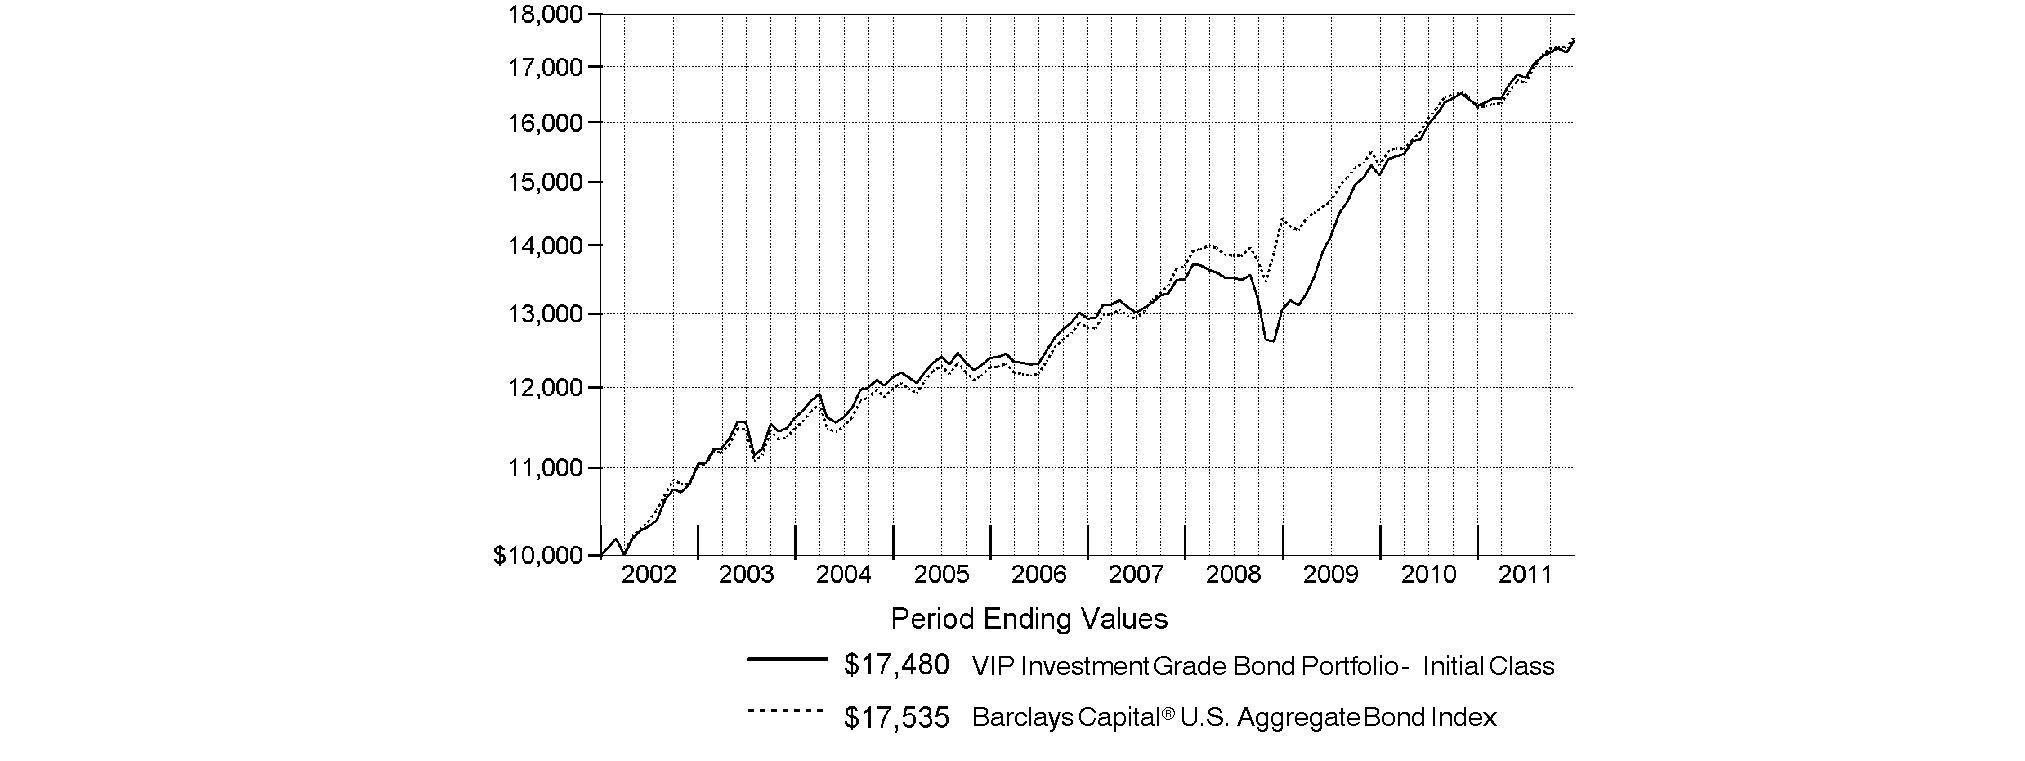
Annual Report
Market Recap: Extreme market volatility took center stage during the 12 months ending December 31, 2011, stealing the spotlight from signs of progress in the global economy. Early in the year, aggressive monetary stimulus by the U.S. federal government, improving credit-market conditions and solid corporate earnings buoyed most major asset classes. As the period progressed, however, fresh worries about sovereign debt in Europe, inflation in China, gridlock over raising the debt ceiling in the U.S. - along with Standard & Poor's early-August downgrade of the nation's long-term sovereign credit rating - and a dimmed outlook for global growth punctured investor confidence and ignited market instability. Domestic equities, as measured by the broad-based S&P 500® Index, gained 2.11%, easily outpacing the 13.61% decline of MSCI® ACWI® (All Country World Index) ex USA Index, a proxy for foreign stocks. Within the MSCI index, emerging markets declined the most (-18%), with investments here generally held back by a stronger U.S. dollar. The U.K. (-3%) fared better than the rest of Europe (-15%), which was the second-worst-performing index component. Bolstered by periodic flights to quality, U.S. investment-grade bonds posted a 7.84% advance, as reflected by the Barclays Capital® U.S. Aggregate Bond Index, outperforming the 4.37% gain of high-yield securities, as represented by The BofA Merrill LynchSM US High Yield Constrained Index. Hampered by financial woes in Europe, the sovereign debt of major developed markets outside the U.S. rose 4.86%, according to the Citigroup® Non-USD Group-of-Seven (G7) Equal Weighted Index, while the JPMorgan Emerging Markets Bond Index Global (EMBI Global) advanced 8.46%, despite the currency head wind.
Comments from Ford O'Neil, Portfolio Manager of VIP Investment Grade Bond Portfolio: For the year, the fund's share classes modestly underperformed the Barclays Capital index. (For specific portfolio performance results, please refer to the performance section of this report). Virtually all of the fund's assets were invested in VIP Investment Grade Central Fund, with the remainder invested in individual securities, short-term repurchase agreements, Fidelity® Specialized High Income Central Fund and Fidelity Cash Central Fund. This discussion of fund performance reflects its holdings in aggregate. The fund's underperformance stemmed in part from modest investments in below-investment-grade collateralized mortgage obligations and high-yield corporate bonds, both of which lagged the index. In the investment-grade portion of the fund, positioning among U.S. Treasury securities and an overweighting in corporate bonds bolstered relative performance, offsetting the negative impact of disadvantageous sector weightings elsewhere and security selection in the corporate sector. Although the fund gave up some ground by underweighting Treasuries overall, yield-curve positioning there was a plus. An out-of-benchmark stake in Treasury Inflation-Protected Securities (TIPS), with a focus on intermediate- and long-maturity bonds, further contributed. Conversely, an emphasis on lagging financials curbed our upside within corporates, while overweightings in asset-backed and commercial-backed mortgage securities also detracted.
The views expressed above reflect those of the portfolio manager(s) only through the end of the period as stated on the cover of this report and do not necessarily represent the views of Fidelity or any other person in the Fidelity organization. Any such views are subject to change at any time based upon market or other conditions and Fidelity disclaims any responsibility to update such views. These views may not be relied on as investment advice and, because investment decisions for a Fidelity fund are based on numerous factors, may not be relied on as an indication of trading intent on behalf of any Fidelity fund.
Annual Report
As a shareholder of the Fund, you incur two types of costs: (1) transaction costs, and (2) ongoing costs, including management fees, distribution and/or service (12b-1) fees and other Fund expenses. This Example is intended to help you understand your ongoing costs (in dollars) of investing in the Fund and to compare these costs with the ongoing costs of investing in other mutual funds.
The Example is based on an investment of $1,000 invested at the beginning of the period and held for the entire period (July 1, 2011 to December 31, 2011).
Actual Expenses
The first line of the accompanying table for each class of the Fund provides information about actual account values and actual expenses. You may use the information in this line, together with the amount you invested, to estimate the expenses that you paid over the period. Simply divide your account value by $1,000.00 (for example, an $8,600 account value divided by $1,000.00 = 8.6), then multiply the result by the number in the first line for a class of the Fund under the heading entitled "Expenses Paid During Period" to estimate the expenses you paid on your account during this period. The estimate of expenses does not include any fees or other expenses of any variable annuity or variable life insurance product. If they were, the estimate of expenses you paid during the period would be higher, and your ending account value would be lower. In addition, the Fund, as a shareholder in the underlying Fidelity Central Funds, will indirectly bear its pro-rata share of the fees and expenses incurred by the underlying Fidelity Central Funds. These fees and expenses are not included in the Fund's annualized expense ratio used to calculate the expense estimate in the table below.
Hypothetical Example for Comparison Purposes
The second line of the accompanying table for each class of the Fund provides information about hypothetical account values and hypothetical expenses based on a Class' actual expense ratio and an assumed rate of return of 5% per year before expenses, which is not the Class' actual return. The hypothetical account values and expenses may not be used to estimate the actual ending account balance or expenses you paid for the period. You may use this information to compare the ongoing costs of investing in the Fund and other funds. To do so, compare this 5% hypothetical example with the 5% hypothetical examples that appear in the shareholder reports of the other funds. The estimate of expenses does not include any fees or other expenses of any variable annuity or variable life insurance product. If they were, the estimate of expenses you paid during the period would be higher, and your ending account value would be lower. In addition, the Fund, as a shareholder in the underlying Fidelity Central Funds, will indirectly bear its pro-rata share of the fees and expenses incurred by the underlying Fidelity Central Funds. These fees and expenses are not included in the Fund's annualized expense ratio used to calculate the expense estimate in the table below.
Please note that the expenses shown in the table are meant to highlight your ongoing costs only and do not reflect any transaction costs. Therefore, the second line of the table is useful in comparing ongoing costs only, and will not help you determine the relative total costs of owning different funds.
| Annualized
Expense Ratio | Beginning
Account Value
July 1, 2011 | Ending
Account Value
December 31, 2011 | Expenses Paid
During Period*
July 1, 2011 to December 31, 2011 |
Initial Class | .42% | | | |
Actual | | $ 1,000.00 | $ 1,041.10 | $ 2.16 |
HypotheticalA | | $ 1,000.00 | $ 1,023.09 | $ 2.14 |
Service Class | .52% | | | |
Actual | | $ 1,000.00 | $ 1,040.50 | $ 2.67 |
HypotheticalA | | $ 1,000.00 | $ 1,022.58 | $ 2.65 |
Service Class 2 | .66% | | | |
Actual | | $ 1,000.00 | $ 1,040.10 | $ 3.39 |
HypotheticalA | | $ 1,000.00 | $ 1,021.88 | $ 3.36 |
Investor Class | .45% | | | |
Actual | | $ 1,000.00 | $ 1,040.20 | $ 2.31 |
HypotheticalA | | $ 1,000.00 | $ 1,022.94 | $ 2.29 |
A 5% return per year before expenses
* Expenses are equal to each Class' annualized expense ratio, multiplied by the average account value over the period, multiplied by 184/365 (to reflect the one-half year period). The fees and expenses of the underlying Fidelity Central Funds in which the Fund invests are not included in the Fund's annualized expense ratio.
Annual Report
Investment Changes (Unaudited)
Quality Diversification (% of fund's net assets) |
As of December 31, 2011 | As of June 30, 2011 |
| U.S. Government and U.S. Government Agency
Obligations 64.4% | | | U.S. Government and U.S. Government Agency
Obligations 63.3% | |
 | AAA 7.1% | |  | AAA 7.7% | |
 | AA 2.6% | | | AA 2.5% | |
 | A 7.4% | | | A 7.9% | |
 | BBB 14.0% | | | BBB 12.5% | |
 | BB and Below 5.3% | | | BB and Below 6.2% | |
 | Not Rated† 0.0% | | | Not Rated† 0.0% | |
 | Short-Term Investments and
Net Other Assets*** (0.8)% | |  | Short-Term Investments and
Net Other Assets*** (0.1)% | |

We have used ratings from Moody's Investors Service, Inc. Where Moody's® ratings are not available, we have used S&P® ratings. All ratings are as of the date indicated and do not reflect subsequent changes. Securities rated BB or below were rated investment grade at the time of acquisition. The information in the above table is based on the combined investments of the fund and its pro-rata share of the investments of Fidelity's fixed-income central funds. |
Weighted Average Maturity as of December 31, 2011 |
| | 6 months ago |
Years | 6.3 | 6.1 |
This is a weighted average of all the maturities of the securities held in a fund. Weighted Average Maturity (WAM) can be used as a measure of sensitivity to interest rate changes and market changes. Generally, the longer the maturity, the greater the sensitivity to such changes. WAM is based on the dollar-weighted average length of time until principal payments must be paid. Depending on the types of securities held in a fund, certain maturity shortening devices (e.g., demand features, interest rate resets, and call options) may be taken into account when calculating the WAM. |
Duration as of December 31, 2011 |
| | 6 months ago |
Years | 4.8 | 4.8 |
Duration estimates how much a bond fund's price will change with a change in comparable interest rates. If rates rise 1%, for example, a fund with a 5-year duration is likely to lose about 5% of its value. Other factors also can influence a bond fund's performance and share price. Accordingly, a bond fund's actual performance may differ from this example. Duration takes into account any call or put option embedded in the bonds. |
Asset Allocation (% of fund's net assets) |
As of December 31, 2011* | As of June 30, 2011** |
| Corporate Bonds 26.0% | | | Corporate Bonds 25.3% | |
| U.S. Government and
U.S. Government Agency
Obligations 64.4% | | | U.S. Government and
U.S. Government Agency
Obligations 63.3% | |
| Asset-Backed Securities 2.2% | | | Asset-Backed Securities 2.6% | |
| CMOs and Other
Mortgage Related Securities 7.5% | | | CMOs and Other
Mortgage Related Securities 8.4% | |
| Municipal Bonds 0.3% | | | Municipal Bonds 0.3% | |
| Other Investments 0.4% | | | Other Investments 0.2% | |
| Short-Term Investments
and Net Other Assets*** (0.8)% | | | Short-Term Investments
and Net Other Assets*** (0.1)% | |
* Foreign investments | 4.1% | | ** Foreign investments | 3.2% | |
* Futures and Swaps | 2.1% | | ** Futures and Swaps | 2.1% | |

*** Short-Term Investments and Net Other Assets are not included in the pie chart
† Amount represents less than 0.1%
The information in the above table is based on the combined investments of the Fund and its pro-rata share of the investments of Fidelity's fixed-income central funds. A holdings listing for the Fund, which presents direct holdings as well as the pro-rata share of any securities and other investments held indirectly through its investment in underlying non-money market Fidelity Central Funds, is available at advisor.fidelity.com. Fidelity VIP Investment Grade Central Fund's holdings and financial statements are included at the end of this report.
Annual Report
Investments December 31, 2011
Showing Percentage of Net Assets
Fixed-Income Central Funds - 98.2% |
| Shares | | Value |
INVESTMENT GRADE FIXED-INCOME FUNDS - 96.2% |
Fidelity VIP Investment Grade Central Fund (e) | 26,623,959 | | $ 2,865,802,940 |
HIGH YIELD FIXED-INCOME FUNDS - 2.0% |
Fidelity Specialized High Income Central Fund (d) | 592,626 | | 59,381,175 |
TOTAL FIXED-INCOME CENTRAL FUNDS (Cost $2,797,739,567) |
2,925,184,115
|
Nonconvertible Bonds - 0.1% |
| Principal Amount | | |
CONSUMER STAPLES - 0.1% |
Beverages - 0.1% |
FBG Finance Ltd. 5.125% 6/15/15 (b) (Cost $1,504,693) | | $ 1,750,000 | |
1,904,849
|
Asset-Backed Securities - 0.0% |
|
Advanta Business Card Master Trust Series 2007-D1 Class D, 1.5863% 1/22/13 (b)(c) | | 1,800,000 | | 27,000 |
AmeriCredit Prime Automobile Receivables Trust Series 2007-1 Class E, 6.96% 3/8/16 (b) | | 968,234 | | 969,294 |
National Collegiate Student Loan Trust: | | | | |
Series 2004-2 Class AIO, 9.75% 10/27/14 (f) | | 1,525,000 | | 114,375 |
Series 2006-3 Class AIO, 7.1% 1/25/12 (f) | | 6,228,924 | | 15,572 |
Series 2006-4 Class AIO, 6.35% 2/27/12 (f) | | 6,903,000 | | 24,155 |
Series 2007-1 Class AIO, 7.27% 4/25/12 (f) | | 9,280,000 | | 153,120 |
Series 2007-2 Class AIO, 6.7% 7/25/12 (f) | | 6,820,000 | | 207,379 |
Specialty Underwriting & Residential Finance Trust Series 2006-AB2 Class N1, 5.75% 6/25/37 (b) | | 180,261 | | 0 |
TOTAL ASSET-BACKED SECURITIES (Cost $1,527,307) |
1,510,895
|
Collateralized Mortgage Obligations - 0.6% |
| Principal Amount | | Value |
Private Sponsor - 0.6% |
CWALT, Inc.: | | | | |
floater Series 2005-56: | | | | |
Class 1A1, 1.0236% 11/25/35 (c) | | $ 9,694,031 | | $ 4,816,376 |
Class 2A3, 1.7178% 11/25/35 (c) | | 2,281,398 | | 1,211,806 |
Series 2005-56 Class 5A1, 0.6136% 11/25/35 (c) | | 2,908,691 | | 1,422,146 |
Luminent Mortgage Trust: | | | | |
floater Series 2006-1 Class A1, 0.5336% 4/25/36 (c) | | 4,855,293 | | 2,389,138 |
Series 2006-5 Class A1A, 0.4836% 7/25/36 (c) | | 3,648,921 | | 1,605,059 |
MASTR Adjustable Rate Mortgages Trust Series 2007-3 Class 22A2, 0.5036% 5/25/47 (c) | | 571,934 | | 353,028 |
Merrill Lynch Alternative Note Asset Trust floater Series 2007-OAR1 Class A1, 0.4636% 2/25/37 (c) | | 1,577,412 | | 1,028,925 |
Structured Asset Mortgage Investments, Inc. floater Series 2006-AR6 Class 2A1, 0.4836% 7/25/46 (c) | | 7,645,387 | | 3,888,102 |
Wells Fargo Mortgage Backed Securities Trust Series 2005-AR2 Class 1A2, 2.7278% 3/25/35 (c) | | 946,937 | | 373,804 |
TOTAL COLLATERALIZED MORTGAGE OBLIGATIONS (Cost $21,062,891) |
17,088,384
|
Money Market Funds - 1.3% |
| Shares | | |
Fidelity Cash Central Fund, 0.11% (a)
(Cost $39,614,598) | 39,614,598 | |
39,614,598
|
TOTAL INVESTMENT PORTFOLIO - 100.2% (Cost $2,861,449,056) | | 2,985,302,841 |
NET OTHER ASSETS (LIABILITIES) - (0.2)% | | (5,530,528) |
NET ASSETS - 100% | $ 2,979,772,313 |
Legend |
(a) Affiliated fund that is available only to investment companies and other accounts managed by Fidelity Investments. The rate quoted is the annualized seven-day yield of the fund at period end. A complete unaudited listing of the fund's holdings as of its most recent quarter end is available upon request. In addition, each Fidelity Central Fund's financial statements, which are not covered by the Fund's Report of Independent Registered Public Accounting Firm, are available on the SEC's website or upon request. |
(b) Security exempt from registration under Rule 144A of the Securities Act of 1933. These securities may be resold in transactions exempt from registration, normally to qualified institutional buyers. At the end of the period, the value of these securities amounted to $2,901,143 or 0.1% of net assets. |
(c) Coupon rates for floating and adjustable rate securities reflect the rates in effect at period end. |
(d) Affiliated fund that is available only to investment companies and other accounts managed by Fidelity Investments. A complete unaudited schedule of portfolio holdings for each Fidelity Central Fund is filed with the SEC for the first and third quarters of each fiscal year on Form N-Q and is available upon request or at the SEC's web site at www.sec.gov. An unaudited holdings listing for the Fund, which presents direct holdings as well as the pro rata share of securities and other investments held indirectly through its investment in underlying non-money market Fidelity Central Funds, is available at advisor.fidelity.com. In addition, each Fidelity Central Fund's financial statements, which are not covered by the Fund's Report of Independent Registered Public Accounting Firm, are available on the SEC's web site or upon request. |
(e) Affiliated central fund that is available only to investment companies and other accounts managed by Fidelity Investments. Fidelity VIP Investment Grade Central Fund's investments and financial statements are included at the end of this report as an attachment. |
(f) Security represents right to receive monthly interest payments on an underlying pool of mortgages or assets. Principal shown is the outstanding par amount of the pool as of the end of the period. |
Affiliated Central Funds |
Information regarding fiscal year to date income earned by the Fund from investments in Fidelity Central Funds is as follows: |
Fund | Income earned |
Fidelity Cash Central Fund | $ 1,032 |
Fidelity Specialized High Income Central Fund | 3,849,758 |
Fidelity VIP Investment Grade Central Fund | 101,498,353 |
Total | $ 105,349,143 |
Additional information regarding the Fund's fiscal year to date purchases and sales, including the ownership percentage, of the non Money Market Central Funds is as follows: |
Fund | Value,
beginning of period | Purchases | Sales
Proceeds | Value,
end of
period | % ownership,
end of
period |
Fidelity Specialized High Income Central Fund | $ 55,590,665 | $ 3,849,758 | $ - | $ 59,381,175 | 13.9% |
Fidelity VIP Investment Grade Central Fund | 2,820,191,876 | 150,924,147 | 169,759,781 | 2,865,802,940 | 75.6% |
Total | $ 2,875,782,541 | $ 154,773,905 | $ 169,759,781 | $ 2,925,184,115 | |
Other Information |
The following is a summary of the inputs used, as of December 31, 2011, involving the Fund's assets and liabilities carried at fair value. The inputs or methodology used for valuing securities may not be an indication of the risk associated with investing in those securities. For more information on valuation inputs, and their aggregation into the levels used in the tables below, please refer to the Security Valuation section in the accompanying Notes to Financial Statements. |
Valuation Inputs at Reporting Date: |
Description | Total | Level 1 | Level 2 | Level 3 |
Investments in Securities: | | | | |
Corporate Bonds | $ 1,904,849 | $ - | $ 1,904,849 | $ - |
Asset-Backed Securities | 1,510,895 | - | 1,483,895 | 27,000 |
Collateralized Mortgage Obligations | 17,088,384 | - | 16,714,580 | 373,804 |
Fixed-Income Funds | 2,925,184,115 | 2,925,184,115 | - | - |
Money Market Funds | 39,614,598 | 39,614,598 | - | - |
Total Investments in Securities: | $ 2,985,302,841 | $ 2,964,798,713 | $ 20,103,324 | $ 400,804 |
The following is a reconciliation of Investments in Securities for which Level 3 inputs were used in determining value: |
Investments in Securities: | |
Beginning Balance | $ 507,609 |
Total Realized Gain (Loss) | (1,728,293) |
Total Unrealized Gain (Loss) | 1,582,564 |
Cost of Purchases | - |
Proceeds of Sales | (121,832) |
Amortization/Accretion | 18,117 |
Transfers in to Level 3 | 632,248 |
Transfers out of Level 3 | (489,609) |
Ending Balance | $ 400,804 |
The change in unrealized gain (loss) for the period attributable to Level 3 securities held at December 31, 2011 | $ 1,582,564 |
The information used in the above reconciliation represents fiscal year to date activity for any Investments in Securities identified as using Level 3 inputs at either the beginning or the end of the current fiscal period. Transfers in or out of Level 3 represent the beginning value of any Security or Instrument where a change in the pricing level occurred from the beginning to the end of the period. The cost of purchases and the proceeds of sales may include securities received or delivered through corporate actions or exchanges. Realized and unrealized gains (losses) disclosed in the reconciliation are included in Net Gain (Loss) on the Fund's Statement of Operations. |
See accompanying notes which are an integral part of the financial statements.
Annual Report
Statement of Assets and Liabilities
| December 31, 2011 |
| | |
Assets | | |
Investment in securities, at value - See accompanying schedule: Unaffiliated issuers (cost $24,094,891) | $ 20,504,128 | |
Fidelity Central Funds (cost $2,837,354,165) | 2,964,798,713 | |
Total Investments (cost $2,861,449,056) | | $ 2,985,302,841 |
Receivable for fund shares sold | | 3,193,989 |
Interest receivable | | 52,398 |
Distributions receivable from Fidelity Central Funds | | 247,568 |
Prepaid expenses | | 6,772 |
Total assets | | 2,988,803,568 |
| | |
Liabilities | | |
Payable for fund shares redeemed | $ 7,724,121 | |
Accrued management fee | 787,225 | |
Distribution and service plan fees payable | 226,764 | |
Other affiliated payables | 261,178 | |
Other payables and accrued expenses | 31,967 | |
Total liabilities | | 9,031,255 |
| | |
Net Assets | | $ 2,979,772,313 |
Net Assets consist of: | | |
Paid in capital | | $ 2,834,208,447 |
Undistributed net investment income | | 160,255 |
Accumulated undistributed net realized gain (loss) on investments | | 21,549,826 |
Net unrealized appreciation (depreciation) on investments | | 123,853,785 |
Net Assets | | $ 2,979,772,313 |
Statement of Assets and Liabilities - continued
| December 31, 2011 |
| | |
Initial Class:
Net Asset Value, offering price and redemption price per share ($1,116,778,288 ÷ 86,086,811 shares) | | $ 12.97 |
| | |
Service Class:
Net Asset Value, offering price and redemption price per share ($277,731,902 ÷ 21,591,370 shares) | | $ 12.86 |
| | |
Service Class 2:
Net Asset Value, offering price and redemption price per share ($972,651,175 ÷ 76,469,499 shares) | | $ 12.72 |
| | |
Investor Class:
Net Asset Value, offering price and redemption price per share ($612,610,948 ÷ 47,363,341 shares) | | $ 12.93 |
See accompanying notes which are an integral part of the financial statements.
Annual Report
Statement of Operations
| Year ended December 31, 2011 |
| | |
Investment Income | | |
Interest | | $ 3,481,703 |
Income from Fidelity Central Funds | | 105,349,143 |
Total income | | 108,830,846 |
| | |
Expenses | | |
Management fee | $ 9,232,196 | |
Transfer agent fees | 2,320,821 | |
Distribution and service plan fees | 2,817,762 | |
Accounting fees and expenses | 937,702 | |
Custodian fees and expenses | 4,543 | |
Independent trustees' compensation | 10,728 | |
Registration fees | 8,071 | |
Audit | 49,172 | |
Legal | 10,802 | |
Interest | 1,810 | |
Miscellaneous | 30,445 | |
Total expenses before reductions | 15,424,052 | |
Expense reductions | (71,381) | 15,352,671 |
Net investment income (loss) | | 93,478,175 |
Realized and Unrealized Gain (Loss) Net realized gain (loss) on: | | |
Investment securities: | | |
Unaffiliated issuers | (2,416,844) | |
Fidelity Central Funds | 1,880,873 | |
Capital gain distributions from Fidelity Central Funds | 49,690,012 | |
Total net realized gain (loss) | | 49,154,041 |
Change in net unrealized appreciation (depreciation) on investment securities | | 60,228,957 |
Net gain (loss) | | 109,382,998 |
Net increase (decrease) in net assets resulting from operations | | $ 202,861,173 |
Statement of Changes in Net Assets
| Year ended
December 31, 2011 | Year ended
December 31, 2010 |
Increase (Decrease) in Net Assets | | |
Operations | | |
Net investment income (loss) | $ 93,478,175 | $ 102,126,066 |
Net realized gain (loss) | 49,154,041 | 110,462,115 |
Change in net unrealized appreciation (depreciation) | 60,228,957 | 20,788,788 |
Net increase (decrease) in net assets resulting from operations | 202,861,173 | 233,376,969 |
Distributions to shareholders from net investment income | (93,674,019) | (102,934,619) |
Distributions to shareholders from net realized gain | (78,248,432) | (32,318,250) |
Total distributions | (171,922,451) | (135,252,869) |
Share transactions - net increase (decrease) | 4,910,616 | (261,188,374) |
Total increase (decrease) in net assets | 35,849,338 | (163,064,274) |
| | |
Net Assets | | |
Beginning of period | 2,943,922,975 | 3,106,987,249 |
End of period (including undistributed net investment income of $160,255 and undistributed net investment income of $555,736, respectively) | $ 2,979,772,313 | $ 2,943,922,975 |
See accompanying notes which are an integral part of the financial statements.
Annual Report
Financial Highlights - Initial Class
Years ended December 31, | 2011 | 2010 | 2009 | 2008 | 2007 |
Selected Per-Share Data | | | | | |
Net asset value, beginning of period | $ 12.83 | $ 12.48 | $ 11.84 | $ 12.76 | $ 12.76 |
Income from Investment Operations | | | | | |
Net investment income (loss) C | .431 | .443 | .510 | .592 | .610 |
Net realized and unrealized gain (loss) | .492 | .528 | 1.266 | (.987) | (.076) |
Total from investment operations | .923 | .971 | 1.776 | (.395) | .534 |
Distributions from net investment income | (.436) | (.476) | (1.087) | (.515) | (.534) |
Distributions from net realized gain | (.347) | (.145) | (.049) | (.010) | - |
Total distributions | (.783) | (.621) | (1.136) | (.525) | (.534) |
Net asset value, end of period | $ 12.97 | $ 12.83 | $ 12.48 | $ 11.84 | $ 12.76 |
Total Return A, B | 7.33% | 7.80% | 15.72% | (3.25)% | 4.35% |
Ratios to Average Net Assets D, F | | | | | |
Expenses before reductions | .43% | .43% | .45% | .43% | .43% |
Expenses net of fee waivers, if any | .42% | .42% | .45% | .43% | .43% |
Expenses net of all reductions | .42% | .42% | .45% | .43% | .43% |
Net investment income (loss) | 3.30% | 3.38% | 4.19% | 4.84% | 4.88% |
Supplemental Data | | | | | |
Net assets, end of period (000 omitted) | $ 1,116,778 | $ 1,110,373 | $ 1,083,773 | $ 936,912 | $ 1,134,915 |
Portfolio turnover rate E | 5% | 8% | 3% | 14% | 2% |
A Total returns do not reflect charges attributable to your insurance company's separate account. Inclusion of these charges would reduce the total returns shown.
B Total returns would have been lower if certain expenses had not been reduced during the applicable periods shown.
C Calculated based on average shares outstanding during the period.
D Fees and expenses of any underlying Fidelity Central Funds are not included in the Fund's expense ratio. The Fund indirectly bears its proportionate share of the expenses of any underlying Fidelity Central Funds.
E Amount does not include the portfolio activity of any underlying Fidelity Central Funds.
F Expense ratios reflect operating expenses of the class. Expenses before reductions do not reflect amounts reimbursed by the investment adviser or reductions from expense offset arrangements and do not represent the amount paid by the class during periods when reimbursements or reductions occur. Expenses net of fee waivers reflect expenses after reimbursement by the investment adviser but prior to reductions from expense offset arrangements. Expenses net of all reductions represent the net expenses paid by the class. Fees and expenses of the underlying Fidelity Central Funds are not included in the Fund's expense ratio. The Fund indirectly bears its proportionate share of the expenses of any Fidelity Central Funds. Based on their most recent shareholder report date, the annualized expenses for the Fidelity VIP Investment Grade Central Fund and Fidelity Specialized High Income Central Fund were less than .01%.
Financial Highlights - Service Class
Years ended December 31, | 2011 | 2010 | 2009 | 2008 | 2007 |
Selected Per-Share Data | | | | | |
Net asset value, beginning of period | $ 12.73 | $ 12.39 | $ 11.75 | $ 12.68 | $ 12.68 |
Income from Investment Operations | | | | | |
Net investment income (loss) C | .415 | .427 | .495 | .572 | .593 |
Net realized and unrealized gain (loss) | .485 | .521 | 1.262 | (.986) | (.069) |
Total from investment operations | .900 | .948 | 1.757 | (.414) | .524 |
Distributions from net investment income | (.423) | (.463) | (1.068) | (.506) | (.524) |
Distributions from net realized gain | (.347) | (.145) | (.049) | (.010) | - |
Total distributions | (.770) | (.608) | (1.117) | (.516) | (.524) |
Net asset value, end of period | $ 12.86 | $ 12.73 | $ 12.39 | $ 11.75 | $ 12.68 |
Total Return A, B | 7.21% | 7.68% | 15.67% | (3.42)% | 4.29% |
Ratios to Average Net Assets D, F | | | | | |
Expenses before reductions | .52% | .53% | .54% | .53% | .53% |
Expenses net of fee waivers, if any | .52% | .52% | .54% | .53% | .53% |
Expenses net of all reductions | .52% | .52% | .54% | .53% | .53% |
Net investment income (loss) | 3.20% | 3.28% | 4.09% | 4.75% | 4.78% |
Supplemental Data | | | | | |
Net assets, end of period (000 omitted) | $ 277,732 | $ 283,962 | $ 259,246 | $ 202,501 | $ 147,990 |
Portfolio turnover rate E | 5% | 8% | 3% | 14% | 2% |
A Total returns do not reflect charges attributable to your insurance company's separate account. Inclusion of these charges would reduce the total returns shown.
B Total returns would have been lower if certain expenses had not been reduced during the applicable periods shown.
C Calculated based on average shares outstanding during the period.
D Fees and expenses of any underlying Fidelity Central Funds are not included in the Fund's expense ratio. The Fund indirectly bears its proportionate share of the expenses of any underlying Fidelity Central Funds.
E Amount does not include the portfolio activity of any underlying Fidelity Central Funds.
F Expense ratios reflect operating expenses of the class. Expenses before reductions do not reflect amounts reimbursed by the investment adviser or reductions from expense offset arrangements and do not represent the amount paid by the class during periods when reimbursements or reductions occur. Expenses net of fee waivers reflect expenses after reimbursement by the investment adviser but prior to reductions from expense offset arrangements. Expenses net of all reductions represent the net expenses paid by the class. Fees and expenses of the underlying Fidelity Central Funds are not included in the Fund's expense ratio. The Fund indirectly bears its proportionate share of the expenses of any Fidelity Central Funds. Based on their most recent shareholder report date, the annualized expenses for the Fidelity VIP Investment Grade Central Fund and Fidelity Specialized High Income Central Fund were less than .01%.
See accompanying notes which are an integral part of the financial statements.
Annual Report
Financial Highlights - Service Class 2
Years ended December 31, | 2011 | 2010 | 2009 | 2008 | 2007 |
Selected Per-Share Data | | | | | |
Net asset value, beginning of period | $ 12.60 | $ 12.26 | $ 11.62 | $ 12.55 | $ 12.56 |
Income from Investment Operations | | | | | |
Net investment income (loss) C | .391 | .402 | .473 | .551 | .568 |
Net realized and unrealized gain (loss) | .478 | .520 | 1.244 | (.975) | (.064) |
Total from investment operations | .869 | .922 | 1.717 | (.424) | .504 |
Distributions from net investment income | (.402) | (.437) | (1.028) | (.496) | (.514) |
Distributions from net realized gain | (.347) | (.145) | (.049) | (.010) | - |
Total distributions | (.749) | (.582) | (1.077) | (.506) | (.514) |
Net asset value, end of period | $ 12.72 | $ 12.60 | $ 12.26 | $ 11.62 | $ 12.55 |
Total Return A, B | 7.03% | 7.55% | 15.47% | (3.54)% | 4.17% |
Ratios to Average Net Assets D, F | | | | | |
Expenses before reductions | .67% | .68% | .69% | .67% | .68% |
Expenses net of fee waivers, if any | .67% | .67% | .69% | .67% | .68% |
Expenses net of all reductions | .67% | .67% | .69% | .67% | .68% |
Net investment income (loss) | 3.05% | 3.13% | 3.94% | 4.60% | 4.63% |
Supplemental Data | | | | | |
Net assets, end of period (000 omitted) | $ 972,651 | $ 1,011,652 | $ 1,240,935 | $ 930,150 | $ 1,018,017 |
Portfolio turnover rate E | 5% | 8% | 3% | 14% | 2% |
A Total returns do not reflect charges attributable to your insurance company's separate account. Inclusion of these charges would reduce the total returns shown.
B Total returns would have been lower if certain expenses had not been reduced during the applicable periods shown.
C Calculated based on average shares outstanding during the period.
D Fees and expenses of any underlying Fidelity Central Funds are not included in the Fund's expense ratio. The Fund indirectly bears its proportionate share of the expenses of any underlying Fidelity Central Funds.
E Amount does not include the portfolio activity of any underlying Fidelity Central Funds.
F Expense ratios reflect operating expenses of the class. Expenses before reductions do not reflect amounts reimbursed by the investment adviser or reductions from expense offset arrangements and do not represent the amount paid by the class during periods when reimbursements or reductions occur. Expenses net of fee waivers reflect expenses after reimbursement by the investment adviser but prior to reductions from expense offset arrangements. Expenses net of all reductions represent the net expenses paid by the class. Fees and expenses of the underlying Fidelity Central Funds are not included in the Fund's expense ratio. The Fund indirectly bears its proportionate share of the expenses of any Fidelity Central Funds. Based on their most recent shareholder report date, the annualized expenses for the Fidelity VIP Investment Grade Central Fund and Fidelity Specialized High Income Central Fund were less than .01%.
Financial Highlights - Investor Class
Years ended December 31, | 2011 | 2010 | 2009 | 2008 | 2007 |
Selected Per-Share Data | | | | | |
Net asset value, beginning of period | $ 12.80 | $ 12.45 | $ 11.81 | $ 12.73 | $ 12.74 |
Income from Investment Operations | | | | | |
Net investment income (loss) C | .426 | .438 | .511 | .586 | .603 |
Net realized and unrealized gain (loss) | .484 | .529 | 1.263 | (.983) | (.079) |
Total from investment operations | .910 | .967 | 1.774 | (.397) | .524 |
Distributions from net investment income | (.433) | (.472) | (1.085) | (.513) | (.534) |
Distributions from net realized gain | (.347) | (.145) | (.049) | (.010) | - |
Total distributions | (.780) | (.617) | (1.134) | (.523) | (.534) |
Net asset value, end of period | $ 12.93 | $ 12.80 | $ 12.45 | $ 11.81 | $ 12.73 |
Total Return A, B | 7.25% | 7.79% | 15.75% | (3.28)% | 4.28% |
Ratios to Average Net Assets D, F | | | | | |
Expenses before reductions | .46% | .46% | .48% | .46% | .46% |
Expenses net of fee waivers, if any | .45% | .45% | .45% | .45% | .46% |
Expenses net of all reductions | .45% | .45% | .45% | .45% | .46% |
Net investment income (loss) | 3.27% | 3.35% | 4.18% | 4.82% | 4.84% |
Supplemental Data | | | | | |
Net assets, end of period (000 omitted) | $ 612,611 | $ 537,936 | $ 523,032 | $ 306,413 | $ 284,223 |
Portfolio turnover rate E | 5% | 8% | 3% | 14% | 2% |
A Total returns do not reflect charges attributable to your insurance company's separate account. Inclusion of these charges would reduce the total returns shown.
B Total returns would have been lower if certain expenses had not been reduced during the applicable periods shown.
C Calculated based on average shares outstanding during the period.
D Fees and expenses of any underlying Fidelity Central Funds are not included in the Fund's expense ratio. The Fund indirectly bears its proportionate share of the expenses of any underlying Fidelity Central Funds.
E Amount does not include the portfolio activity of any underlying Fidelity Central Funds.
F Expense ratios reflect operating expenses of the class. Expenses before reductions do not reflect amounts reimbursed by the investment adviser or reductions from expense offset arrangements and do not represent the amount paid by the class during periods when reimbursements or reductions occur. Expenses net of fee waivers reflect expenses after reimbursement by the investment adviser but prior to reductions from expense offset arrangements. Expenses net of all reductions represent the net expenses paid by the class. Fees and expenses of the underlying Fidelity Central Funds are not included in the Fund's expense ratio. The Fund indirectly bears its proportionate share of the expenses of any Fidelity Central Funds. Based on their most recent shareholder report date, the annualized expenses for the Fidelity VIP Investment Grade Central Fund and Fidelity Specialized High Income Central Fund were less than .01%.
See accompanying notes which are an integral part of the financial statements.
Annual Report
Notes to Financial Statements
For the period ended December 31, 2011
1. Organization.
VIP Investment Grade Bond Portfolio (the Fund) is a fund of Variable Insurance Products Fund V (the Trust) and is authorized to issue an unlimited number of shares. The Trust is registered under the Investment Company Act of 1940, as amended (the 1940 Act), as an open-end management investment company organized as a Massachusetts business trust. Shares of the Fund may only be purchased by insurance companies for the purpose of funding variable annuity or variable life insurance contracts. The Fund offers the following classes of shares: Initial Class shares, Service Class shares, Service Class 2 shares and Investor Class shares. All classes have equal rights and voting privileges, except for matters affecting a single class. Investment income, realized and unrealized capital gains and losses, the common expenses of the Fund, and certain fund-level expense reductions, if any, are allocated on a pro-rata basis to each class based on the relative net assets of each class to the total net assets of the Fund. Each class differs with respect to transfer agent and distribution and service plan fees incurred. Certain expense reductions may also differ by class.
2. Investments in Fidelity Central Funds.
The Fund invests in Fidelity Central Funds, which are open-end investment companies available only to other investment companies and accounts managed by Fidelity Management & Research Company (FMR) and its affiliates. The Fund's Schedule of Investments lists each of the Fidelity Central Funds held as of period end, if any, as an investment of the Fund, but do not include the underlying holdings of each Fidelity Central Fund. As an Investing Fund, the Fund indirectly bears its proportionate share of the expenses of the underlying Fidelity Central Funds.
Based on their investment objective, each Fidelity Central Fund may invest or participate in various investment vehicles or strategies that are similar to those of the Fund. These strategies are consistent with the investment objectives of the Fund and may involve certain economic risks which may cause a decline in value of each of the Fidelity Central Funds and thus a decline in the value of the Fund. The Money Market Central Funds seek preservation of capital and current income and are managed by Fidelity Investments Money Management, Inc. (FIMM), an affiliate of FMR. The following summarizes the Fund's investment in each Fidelity Central Fund.
Fidelity Central Fund | Investment Manager | Investment Objective | Investment Practices |
Fidelity Specialized High Income Central Fund | FMR Co., Inc. (FMRC) | Seeks a high level of current income by normally investing in income-producing debt securities, with an emphasis on lower-quality debt securities. | Loans & Direct Debt Instruments Repurchase Agreements Restricted Securities |
VIP Investment Grade Central Fund | FIMM | Seeks a high level of current income by normally investing in investment-grade debt securities and repurchase agreements. | Delayed Delivery & When Issued Securities Repurchase Agreements Restricted Securities Swap Agreements |
An unaudited holdings listing for the Fund, which presents direct holdings as well as the pro-rata share of any securities and other investments held indirectly through its investment in underlying non-money market Fidelity Central Funds, is available at advisor.fidelity.com. A complete unaudited list of holdings for each Fidelity Central Fund is available upon request or at the Securities and Exchange Commission (the SEC) web site at www.sec.gov. In addition, the financial statements of the Fidelity Central Funds which contain the significant accounting policies (including security valuation policies) of those funds, which are not covered by the Fund's Report of Independent Registered Public Accounting Firm, are available on the SEC web site or upon request.
3. Significant Accounting Policies.
The financial statements have been prepared in conformity with accounting principles generally accepted in the United States of America (GAAP), which require management to make certain estimates and assumptions at the date of the financial statements. Actual results could differ from those estimates. Subsequent events, if any, through the date that the financial statements were issued have been evaluated in the preparation of the financial statements. The following summarizes the significant accounting policies of the Fund:
Security Valuation. Investments are valued as of 4:00 p.m. Eastern time on the last calendar day of the period. The Fund uses independent pricing services approved by the Board of Trustees to value its investments. When current market prices or quotations are not readily available or reliable, valuations may be determined in good faith in accordance with procedures adopted by the Board of Trustees. Factors used in determining value may include market or security specific events, changes in interest rates and credit quality. The frequency with which these procedures are used cannot be predicted and they may be utilized to a significant extent. The value used for net asset value (NAV) calculation under these procedures may differ from published prices for the same securities.
The Fund categorizes the inputs to valuation techniques used to value its investments into a disclosure hierarchy consisting of three levels as shown below:
Level 1 - quoted prices in active markets for identical investments
Level 2 - other significant observable inputs (including quoted prices for similar investments, interest rates, prepayment speeds, etc.)
Level 3 - unobservable inputs (including the Fund's own assumptions based on the best information available)
Annual Report
3. Significant Accounting Policies - continued
Security Valuation - continued
Changes in valuation techniques may result in transfers in or out of an assigned level within the disclosure hierarchy. The aggregate value of investments by input level, as of December 31, 2011 for the Fund's investments, as well as a roll forward of Level 3 securities, is included at the end of the Fund's Schedule of Investments. Valuation techniques used to value the Fund's investments by major category are as follows:
Debt securities, including restricted securities, are valued based on evaluated prices received from independent pricing services or from dealers who make markets in such securities. For corporate bonds, pricing services utilize matrix pricing which considers yield or price of bonds of comparable quality, coupon, maturity and type as well as dealer supplied prices and are generally categorized as Level 2 in the hierarchy. For asset backed securities and collateralized mortgage obligations, pricing services utilize matrix pricing which considers prepayment speed assumptions, attributes of the collateral, yield or price of bonds of comparable quality, coupon, maturity and type as well as dealer supplied prices and, accordingly, such securities are generally categorized as Level 2 in the hierarchy. When independent prices are unavailable or unreliable, debt securities may be valued utilizing pricing matrices which consider similar factors that would be used by independent pricing services. These are generally categorized as Level 2 in the hierarchy but may be Level 3 depending on the circumstances.
Investments in open-end mutual funds, including the Fidelity Central Funds, are valued at their closing net asset value each business day and are categorized as Level 1 in the hierarchy.
New Accounting Pronouncement. In May 2011, the Financial Accounting Standards Board issued Accounting Standard Update No. 2011-04, Fair Value Measurement (Topic 820) - Amendments to Achieve Common Fair Value Measurement and Disclosure Requirements in U.S. GAAP and IFRSs. The update is effective during interim and annual periods beginning after December 15, 2011 and will result in additional disclosure for transfers between levels as well as expanded disclosure for securities categorized as Level 3 under the fair value hierarchy.
Investment Transactions and Income. For financial reporting purposes, the Fund's investment holdings and NAV include trades executed through the end of the last business day of the period. The NAV per share for processing shareholder transactions is calculated as of the close of business of the New York Stock Exchange (NYSE), normally 4:00 p.m. Eastern time and includes trades executed through the end of the prior business day. Gains and losses on securities sold are determined on the basis of identified cost and may include proceeds received from litigation. Interest income and distributions from the Fidelity Central Funds are accrued as earned. Interest income includes coupon interest and amortization of premium and accretion of discount on debt securities.
Expenses. Expenses directly attributable to a fund are charged to that fund. Expenses attributable to more than one fund are allocated among the respective funds on the basis of relative net assets or other appropriate methods. Expense estimates are accrued in the period to which they relate and adjustments are made when actual amounts are known.
Income Tax Information and Distributions to Shareholders. Each year, the Fund intends to qualify as a regulated investment company, including distributing substantially all of its taxable income and realized gains under Subchapter M of the Internal Revenue Code. As a result, no provision for income taxes is required. As of December 31, 2011, the Fund did not have any unrecognized tax benefits in the financial statements; nor is the Fund aware of any tax positions for which it is reasonably possible that the total amounts of unrecognized tax benefits will significantly change in the next twelve months. The Fund files a U.S. federal tax return, in addition to state and local tax returns as required. A fund's tax returns are subject to examination by the Internal Revenue Service (IRS) for a period of three fiscal years. State and local tax returns may be subject to examination for an additional fiscal year depending on the jurisdiction.
Distributions are declared and recorded on the ex-dividend date. Income dividends and capital gain distributions are declared separately for each class. Income and capital gain distributions are determined in accordance with income tax regulations, which may differ from GAAP.
Capital accounts within the financial statements are adjusted for permanent book-tax differences. These adjustments have no impact on net assets or the results of operations. Temporary book-tax differences will reverse in a subsequent period.
Book-tax differences are primarily due to the short-term gain distributions from the Fidelity Central Funds, in-kind transactions, market discount, partnerships (including allocations from Fidelity Central Funds), deferred trustees compensation, and losses deferred due to wash sales.
The federal tax cost of investment securities and unrealized appreciation (depreciation) as of period end were as follows:
Gross unrealized appreciation | $ 182,679,563 |
Gross unrealized depreciation | (4,698,899) |
Net unrealized appreciation (depreciation) on securities and other investments | $ 177,980,664 |
| |
Tax Cost | $ 2,807,322,177 |
Annual Report
Notes to Financial Statements - continued
3. Significant Accounting Policies - continued
Income Tax Information and Distributions to Shareholders - continued
The tax-based components of distributable earnings as of period end were as follows:
Undistributed long-term capital gain | $ 22,335,216 |
Net unrealized appreciation (depreciation) | $ 177,980,664 |
The tax character of distributions paid was as follows:
| December 31, 2011 | December 31, 2010 |
Ordinary Income | $ 124,266,309 | $ 135,252,869 |
Long-term Capital Gains | 47,656,142 | - |
Total | $ 171,922,451 | $ 135,252,869 |
4. Operating Policies.
Restricted Securities. The Fund may invest in securities that are subject to legal or contractual restrictions on resale. These securities generally may be resold in transactions exempt from registration or to the public if the securities are registered. Disposal of these securities may involve time-consuming negotiations and expense, and prompt sale at an acceptable price may be difficult. Information regarding restricted securities is included at the end of the Fund's Schedule of Investments.
5. Purchases and Sales of Investments.
Purchases and sales of securities (including the Fixed-Income Central Funds), other than short-term securities, aggregated $154,767,652 and $178,607,988, respectively.
6. Fees and Other Transactions with Affiliates.
Management Fee. FMR and its affiliates provide the Fund with investment management related services for which the Fund pays a monthly management fee. The management fee is the sum of an individual fund fee rate that is based on an annual rate of .20% of the Fund's average net assets and an annualized group fee rate that averaged .12% during the period. The group fee rate is based upon the average net assets of all the mutual funds advised by FMR. The group fee rate decreases as assets under management increase and increases as assets under management decrease. For the period, the total annual management fee rate was .32% of the Fund's average net assets.
Distribution and Service Plan Fees. In accordance with Rule 12b-1 of the 1940 Act, the Fund has adopted separate 12b-1 Plans for each Service Class of shares. Each Service Class pays Fidelity Distributors Corporation (FDC), an affiliate of FMR, a service fee. For the period, the service fee is based on an annual rate of .10% of Service Class' average net assets and .25% of Service Class 2's average net assets.
For the period, total fees, all of which were re-allowed to insurance companies for the distribution of shares and providing shareholder support services were as follows:
Service Class | $ 275,924 |
Service Class 2 | 2,541,838 |
| $ 2,817,762 |
Transfer Agent Fees. Fidelity Investments Institutional Operations Company, Inc. (FIIOC), an affiliate of FMR, is the Fund's transfer, dividend disbursing, and shareholder servicing agent. FIIOC receives an asset-based fee with respect to each class. Each class (with the exception of Investor Class) pays a transfer agent fee, excluding out of pocket expenses, equal to an annual rate of .07% of average net assets. Investor Class pays a monthly asset-based transfer agent fee of .10% of average net assets. In addition, FIIOC receives an asset-based fee of .0045% of average net assets for typesetting, printing and mailing of shareholder reports, except proxy statements. FIIOC voluntarily agreed to waive this fee for the period August 1, 2011 through December 31, 2011 (see Expense Reductions note). For the period, transfer agent fees for each class, including printing and out of pocket expenses, were as follows:
Initial Class | $ 815,297 |
Service Class | 198,384 |
Service Class 2 | 724,667 |
Investor Class | 582,473 |
| $ 2,320,821 |
Annual Report
6. Fees and Other Transactions with Affiliates - continued
Accounting Fees. Fidelity Service Company, Inc.(FSC), an affiliate of FMR, maintains the Fund's accounting records. The fee is based on the level of average net assets for the month.
Interfund Lending Program. Pursuant to an Exemptive Order issued by the SEC, the Fund, along with other registered investment companies having management contracts with FMR, may participate in an interfund lending program. This program provides an alternative credit facility allowing the funds to borrow from, or lend money to, other participating affiliated funds. At period end, there were no interfund loans outstanding. The Fund's activity in this program during the period for which loans were outstanding was as follows:
Borrower or Lender | Average Loan
Balance | Weighted Average Interest Rate | Interest Expense |
Borrower | $ 40,723,000 | .40% | $ 1,810 |
7. Committed Line of Credit.
The Fund participates with other funds managed by FMR or an affiliate in a $4.0 billion credit facility (the "line of credit") to be utilized for temporary or emergency purposes to fund shareholder redemptions or for other short-term liquidity purposes. The Fund has agreed to pay commitment fees on its pro-rata portion of the line of credit, which amounted to $9,024 and is reflected in Miscellaneous expenses on the Statement of Operations. During the period, there were no borrowings on this line of credit.
8. Expense Reductions.
In addition to FIIOC waiving a portion of its transfer agent fees, FMR voluntarily agreed to reimburse each class to the extent annual operating expenses exceeded certain levels of average net assets as noted in the table below. Some expenses, for example interest expense, including commitment fees, are excluded from this reimbursement.
Expenses were reimbursed and/or waived for the following classes during the period:
| Expense
Limitations | Reimbursement/ Waiver |
Initial Class | 0.45% | $ 20,519 |
Service Class | 0.55% | 5,214 |
Service Class 2 | 0.70% | 19,218 |
Investor Class | 0.45% | 26,430 |
| | $ 71,381 |
Effective May 1, 2011, the expense limitations were discontinued.
9. Distributions to Shareholders.
Distributions to shareholders of each class were as follows:
Years ended December 31, | 2011 | 2010 |
From net investment income | | |
Initial Class | $ 35,870,662 | $ 39,652,079 |
Service Class | 8,762,765 | 9,934,693 |
Service Class 2 | 29,656,720 | 33,971,385 |
Investor Class | 19,383,872 | 19,376,462 |
Total | $ 93,674,019 | $ 102,934,619 |
From net realized gain | | |
Initial Class | $ 29,155,885 | $ 12,070,578 |
Service Class | 7,406,824 | 3,112,885 |
Service Class 2 | 27,082,188 | 11,186,239 |
Investor Class | 14,603,535 | 5,948,548 |
Total | $ 78,248,432 | $ 32,318,250 |
Annual Report
Notes to Financial Statements - continued
10. Share Transactions.
Transactions for each class of shares were as follows:
| Shares | Dollars |
Years ended December 31, | 2011 | 2010 | 2011 | 2010 |
Initial Class | | | | |
Shares sold | 13,978,276 | 14,591,614 | $ 182,769,488 | $ 191,644,371 |
Reinvestment of distributions | 5,066,058 | 4,047,794 | 65,026,547 | 51,722,657 |
Shares redeemed | (19,474,527) | (18,940,310) | (252,370,301) | (248,258,905) |
Net increase (decrease) | (430,193) | (300,902) | $ (4,574,266) | $ (4,891,877) |
Service Class | | | | |
Shares sold | 3,222,600 | 4,596,946 | $ 41,826,678 | $ 59,682,718 |
Reinvestment of distributions | 1,270,624 | 1,029,933 | 16,169,589 | 13,047,578 |
Shares redeemed | (5,204,902) | (4,250,312) | (67,240,590) | (55,672,659) |
Net increase (decrease) | (711,678) | 1,376,567 | $ (9,244,323) | $ 17,057,637 |
Service Class 2 | | | | |
Shares sold | 12,432,260 | 15,013,576 | $ 158,971,483 | $ 192,078,938 |
Reinvestment of distributions | 4,510,584 | 3,601,813 | 56,738,908 | 45,157,624 |
Shares redeemed | (20,782,948) | (39,548,465) | (267,706,104) | (509,866,109) |
Net increase (decrease) | (3,840,104) | (20,933,076) | $ (51,995,713) | $ (272,629,547) |
Investor Class | | | | |
Shares sold | 10,052,628 | 8,642,451 | $ 132,086,173 | $ 113,090,085 |
Reinvestment of distributions | 2,653,983 | 1,988,124 | 33,987,407 | 25,325,010 |
Shares redeemed | (7,372,329) | (10,609,871) | (95,348,662) | (139,139,682) |
Net increase (decrease) | 5,334,282 | 20,704 | $ 70,724,918 | $ (724,587) |
11. Other.
The Fund's organizational documents provide former and current trustees and officers with a limited indemnification against liabilities arising in connection with the performance of their duties to the Fund. In the normal course of business, the Fund may also enter into contracts that provide general indemnifications. The Fund's maximum exposure under these arrangements is unknown as this would be dependent on future claims that may be made against the Fund. The risk of material loss from such claims is considered remote.
At the end of the period, FMR or its affiliates were the owners of record of 29% of the total outstanding shares of the Fund and one otherwise unaffiliated shareholder was the owner of record of 20% of the total outstanding shares of the Fund.
Annual Report
Report of Independent Registered Public Accounting Firm
To the Trustees of Variable Insurance Products Fund V and Shareholders of VIP Investment Grade Bond Portfolio:
We have audited the accompanying statement of assets and liabilities of VIP Investment Grade Bond Portfolio (the Fund), a fund of Variable Insurance Products Fund V, including the schedule of investments, as of December 31, 2011, and the related statement of operations for the year then ended, the statement of changes in net assets for each of the two years in the period then ended, and the financial highlights for each of the five years in the period then ended. These financial statements and financial highlights are the responsibility of the Fund's management. Our responsibility is to express an opinion on these financial statements and financial highlights based on our audits.
We conducted our audits in accordance with the standards of the Public Company Accounting Oversight Board (United States). Those standards require that we plan and perform the audit to obtain reasonable assurance about whether the financial statements and financial highlights are free of material misstatement. The Fund is not required to have, nor were we engaged to perform, an audit of its internal control over financial reporting. Our audits included consideration of internal control over financial reporting as a basis for designing audit procedures that are appropriate in the circumstances, but not for the purpose of expressing an opinion on the effectiveness of the Fund's internal control over financial reporting. Accordingly, we express no such opinion. An audit also includes examining, on a test basis, evidence supporting the amounts and disclosures in the financial statements, assessing the accounting principles used and significant estimates made by management, as well as evaluating the overall financial statement presentation. Our procedures included confirmation of securities owned as of December 31, 2011, by correspondence with the custodians. We believe that our audits provide a reasonable basis for our opinion.
In our opinion, the financial statements and financial highlights referred to above present fairly, in all material respects, the financial position of VIP Investment Grade Bond Portfolio as of December 31, 2011, the results of its operations for the year then ended, the changes in its net assets for each of the two years in the period then ended, and the financial highlights for each of the five years in the period then ended, in conformity with accounting principles generally accepted in the United States of America.
/s/ Deloitte & Touche LLP
DELOITTE & TOUCHE LLP
Boston, Massachusetts
February 16, 2012
Annual Report
The Trustees and executive officers of the trust and fund, as applicable, are listed below. The Board of Trustees governs the fund and is responsible for protecting the interests of shareholders. The Trustees are experienced executives who meet periodically throughout the year to oversee the fund's activities, review contractual arrangements with companies that provide services to the fund, oversee management of the risks associated with such activities and contractual arrangements, and review the fund's performance. Except for James C. Curvey, each of the Trustees oversees 203 funds advised by FMR or an affiliate. Mr. Curvey oversees 429 funds advised by FMR or an affiliate.
The Trustees hold office without limit in time except that (a) any Trustee may resign; (b) any Trustee may be removed by written instrument, signed by at least two-thirds of the number of Trustees prior to such removal; (c) any Trustee who requests to be retired or who has become incapacitated by illness or injury may be retired by written instrument signed by a majority of the other Trustees; and (d) any Trustee may be removed at any special meeting of shareholders by a two-thirds vote of the outstanding voting securities of the trust. Each Trustee who is not an interested person (as defined in the 1940 Act) (Independent Trustee), shall retire not later than the last day of the calendar year in which his or her 75th birthday occurs. The Independent Trustees may waive this mandatory retirement age policy with respect to individual Trustees. The executive officers hold office without limit in time, except that any officer may resign or may be removed by a vote of a majority of the Trustees at any regular meeting or any special meeting of the Trustees. Except as indicated, each individual has held the office shown or other offices in the same company for the past five years.
Experience, Skills, Attributes, and Qualifications of the Fund's Trustees. The Governance and Nominating Committee has adopted a statement of policy that describes the experience, qualifications, attributes, and skills that are necessary and desirable for potential Independent Trustee candidates (Statement of Policy). The Board believes that each Trustee satisfied at the time he or she was initially elected or appointed a Trustee, and continues to satisfy, the standards contemplated by the Statement of Policy. The Governance and Nominating Committee also engages professional search firms to help identify potential Independent Trustee candidates who have the experience, qualifications, attributes, and skills consistent with the Statement of Policy. From time to time, additional criteria based on the composition and skills of the current Independent Trustees, as well as experience or skills that may be appropriate in light of future changes to board composition, business conditions, and regulatory or other developments, have also been considered by the professional search firms and the Governance and Nominating Committee. In addition, the Board takes into account the Trustees' commitment and participation in Board and committee meetings, as well as their leadership of standing and ad hoc committees throughout their tenure.
In determining that a particular Trustee was and continues to be qualified to serve as a Trustee, the Board has considered a variety of criteria, none of which, in isolation, was controlling. The Board believes that, collectively, the Trustees have balanced and diverse experience, qualifications, attributes, and skills, which allow the Board to operate effectively in governing the fund and protecting the interests of shareholders. Information about the specific experience, skills, attributes, and qualifications of each Trustee, which in each case led to the Board's conclusion that the Trustee should serve (or continue to serve) as a trustee of the fund, is provided below.
Board Structure and Oversight Function. Abigail P. Johnson is an interested person (as defined in the 1940 Act) and currently serves as Chairman. The Trustees have determined that an interested Chairman is appropriate and benefits shareholders because an interested Chairman has a personal and professional stake in the quality and continuity of services provided to the fund. Independent Trustees exercise their informed business judgment to appoint an individual of their choosing to serve as Chairman, regardless of whether the Trustee happens to be independent or a member of management. The Independent Trustees have determined that they can act independently and effectively without having an Independent Trustee serve as Chairman and that a key structural component for assuring that they are in a position to do so is for the Independent Trustees to constitute a substantial majority for the Board. The Independent Trustees also regularly meet in executive session. Kenneth L. Wolfe serves as Chairman of the Independent Trustees and as such (i) acts as a liaison between the Independent Trustees and management with respect to matters important to the Independent Trustees and (ii) with management prepares agendas for Board meetings.
Fidelity funds are overseen by different Boards of Trustees. The fund's Board oversees Fidelity's investment-grade bond, money market, and asset allocation funds and another Board oversees Fidelity's equity and high income funds. The asset allocation funds may invest in Fidelity funds that are overseen by such other Board. The use of separate Boards, each with its own committee structure, allows the Trustees of each group of Fidelity funds to focus on the unique issues of the funds they oversee, including common research, investment, and operational issues. On occasion, the separate Boards establish joint committees to address issues of overlapping consequences for the Fidelity funds overseen by each Board.
The Trustees operate using a system of committees to facilitate the timely and efficient consideration of all matters of importance to the Trustees, the fund, and fund shareholders and to facilitate compliance with legal and regulatory requirements and oversight of the fund's activities and associated risks. The Board, acting through its committees, has charged FMR and its affiliates with (i) identifying events or circumstances the occurrence of which could have demonstrably adverse effects on the fund's business and/or reputation; (ii) implementing processes and controls to lessen the possibility that such events or circumstances occur or to mitigate the effects of such events or circumstances if they do occur; and (iii) creating and maintaining a system designed to evaluate continuously business and market conditions in order to facilitate the identification and implementation processes described in (i) and (ii) above. Because the day-to-day operations and activities of the fund are carried out by or through FMR, its affiliates and other service providers, the fund's exposure to risks is mitigated but not eliminated by the processes overseen by the Trustees. While each of the Board's committees has responsibility for overseeing different aspects of the fund's activities, oversight is exercised primarily through the Operations and Audit Committees. In addition, an ad hoc Board committee of Independent Trustees has worked with FMR to enhance the Board's oversight of investment and financial risks, legal and regulatory risks, technology risks, and operational risks, including the development of additional risk reporting to the Board. Appropriate personnel, including but not limited to the fund's Chief Compliance Officer (CCO), FMR's internal auditor, the independent accountants, the fund's Treasurer and portfolio management personnel, make periodic reports to the Board's committees, as appropriate, including an annual review of FMR's risk management program for the Fidelity funds. The responsibilities of each standing committee, including their oversight responsibilities, are described further under "Standing Committees of the Fund's Trustees."
Annual Report
The fund's Statement of Additional Information (SAI) includes more information about the Trustees. To request a free copy, call Fidelity at 1-877-208-0098.
Interested Trustees*:
Correspondence intended for each Trustee who is an interested person may be sent to Fidelity Investments, 82 Devonshire Street, Boston, Massachusetts 02109.
Name, Age; Principal Occupations and Other Relevant Experience+ |
Abigail P. Johnson (50) |
| Year of Election or Appointment: 2009 Ms. Johnson is Trustee and Chairman of the Board of Trustees of certain Trusts. Ms. Johnson serves as President of Personal, Workplace and Institutional Services (2005-present). Ms. Johnson is Chairman and Director of FMR Co., Inc. (2011-present), Chairman and Director of FMR (2011-present), and the Vice Chairman and Director (2007-present) of FMR LLC. Previously, Ms. Johnson served as President and a Director of FMR (2001-2005), a Trustee of other investment companies advised by FMR, Fidelity Investments Money Management, Inc., and FMR Co., Inc. (2001-2005), Senior Vice President of the Fidelity funds (2001-2005), and managed a number of Fidelity funds. Ms. Abigail P. Johnson and Mr. Arthur E. Johnson are not related. |
James C. Curvey (76) |
| Year of Election or Appointment: 2007 Mr. Curvey also serves as Trustee (2007-present) of other investment companies advised by FMR. Mr. Curvey is a Director of Fidelity Investments Money Management, Inc. (2009-present), Director of Fidelity Research & Analysis Co. (2009-present) and Director of FMR and FMR Co., Inc. (2007-present). Mr. Curvey is also Vice Chairman (2007-present) and Director of FMR LLC. In addition, Mr. Curvey serves as an Overseer for the Boston Symphony Orchestra and a member of the Trustees of Villanova University. Previously, Mr. Curvey was the Vice Chairman (2006-2007) and Director (2000-2007) of FMR Corp. |
* Trustees have been determined to be "Interested Trustees" by virtue of, among other things, their affiliation with the trust or various entities under common control with FMR.
+ The information above includes each Trustee's principal occupation during the last five years and other information relating to the experience, attributes, and skills relevant to each Trustee's qualifications to serve as a Trustee, which led to the conclusion that each Trustee should serve as a Trustee for the fund.
Independent Trustees:
Correspondence intended for each Independent Trustee (that is, the Trustees other than the Interested Trustees) may be sent to Fidelity Investments, P.O. Box 55235, Boston, Massachusetts 02205-5235.
Name, Age; Principal Occupations and Other Relevant Experience+ |
Albert R. Gamper, Jr. (69) |
| Year of Election or Appointment: 2007 Mr. Gamper is Vice Chairman of the Independent Trustees of the Fixed Income and Asset Allocation Funds (2011-present). Prior to his retirement in December 2004, Mr. Gamper served as Chairman of the Board of CIT Group Inc. (commercial finance). During his tenure with CIT Group Inc. Mr. Gamper served in numerous senior management positions, including Chairman (1987-1989; 1999-2001; 2002-2004), Chief Executive Officer (1987-2004), and President (2002-2003). Mr. Gamper currently serves as a member of the Board of Directors of Public Service Enterprise Group (utilities, 2000-present), a member of the Board of Trustees, Rutgers University (2004-present), and Chairman of the Board of Saint Barnabas Health Care System. Previously, Mr. Gamper served as Chairman of the Board of Governors, Rutgers University (2004-2007). |
Robert F. Gartland (60) |
| Year of Election or Appointment: 2010 Mr. Gartland is a partner and investor of Vietnam Partners LLC (investments and consulting, 2008-present) and is Chairman and an investor in Gartland and Mellina Group Corp. (consulting, 2009-present). Prior to his retirement, Mr. Gartland held a variety of positions at Morgan Stanley (financial services, 1979-2007) including Managing Director (1987-2007). |
Arthur E. Johnson (64) |
| Year of Election or Appointment: 2008 Mr. Johnson serves as a member of the Board of Directors of Eaton Corporation (diversified power management, 2009-present), AGL Resources, Inc. (holding company, 2002-present) and Booz Allen Hamilton (management consulting, 2011-present). Prior to his retirement, Mr. Johnson served as Senior Vice President of Corporate Strategic Development of Lockheed Martin Corporation (defense contractor, 1999-2009). He previously served on the Board of Directors of IKON Office Solutions, Inc. (1999-2008) and Delta Airlines (2005-2007). Mr. Arthur E. Johnson is not related to Mr. Edward C. Johnson 3d or Ms. Abigail P. Johnson. |
Michael E. Kenneally (57) |
| Year of Election or Appointment: 2009 Previously, Mr. Kenneally served as a Member of the Advisory Board for certain Fidelity Fixed Income and Asset Allocation Funds (2008-2009). Prior to his retirement, Mr. Kenneally served as Chairman and Global Chief Executive Officer of Credit Suisse Asset Management (2003-2005). Mr. Kenneally was a Director of the Credit Suisse Funds (U.S. mutual funds, 2004-2008) and certain other closed-end funds (2004-2005) and was awarded the Chartered Financial Analyst (CFA) designation in 1991. |
James H. Keyes (71) |
| Year of Election or Appointment: 2007 Mr. Keyes serves as a member of the Boards of Navistar International Corporation (manufacture and sale of trucks, buses, and diesel engines, since 2002) and Pitney Bowes, Inc. (integrated mail, messaging, and document management solutions, since 1998). Prior to his retirement, Mr. Keyes served as Chairman and Chief Executive Officer of Johnson Controls (automotive, building, and energy, 1998-2002) and as a member of the Board of LSI Logic Corporation (semiconductor technologies, 1984-2008). |
Marie L. Knowles (65) |
| Year of Election or Appointment: 2001 Prior to Ms. Knowles' retirement in June 2000, she served as Executive Vice President and Chief Financial Officer of Atlantic Richfield Company (ARCO) (diversified energy, 1996-2000). From 1993 to 1996, she was a Senior Vice President of ARCO and President of ARCO Transportation Company. She served as a Director of ARCO from 1996 to 1998. Ms. Knowles currently serves as a Director and Chairman of the Audit Committee of McKesson Corporation (healthcare service, since 2002). Ms. Knowles is an Honorary Trustee of the Brookings Institution and a member of the Board of the Catalina Island Conservancy and of the Santa Catalina Island Company (2009-present). She also serves as a member of the Advisory Board for the School of Engineering of the University of Southern California and the Foundation Board of the School of Architecture at the University of Virginia (2007-present). Previously, Ms. Knowles served as a Director of Phelps Dodge Corporation (copper mining and manufacturing, 1994-2007). |
Kenneth L. Wolfe (72) |
| Year of Election or Appointment: 2007 Mr. Wolfe is Chairman of the Independent Trustees of the Fixed Income and Asset Allocation Funds (2008-present). Prior to his retirement, Mr. Wolfe served as Chairman and a Director (2007-2009) and Chairman and Chief Executive Officer (1994-2001) of Hershey Foods Corporation. He also served as a member of the Boards of Adelphia Communications Corporation (telecommunications, 2003-2006), Bausch & Lomb, Inc. (medical/pharmaceutical, 1993-2007), and Revlon, Inc. (personal care products, 2004-2009). |
+ The information above includes each Trustee's principal occupation during the last five years and other information relating to the experience, attributes, and skills relevant to each Trustee's qualifications to serve as a Trustee, which led to the conclusion that each Trustee should serve as a Trustee for the fund.
Executive Officers:
Correspondence intended for each executive officer may be sent to Fidelity Investments, 82 Devonshire Street, Boston, Massachusetts 02109.
Name, Age; Principal Occupation |
John R. Hebble (53) |
| Year of Election or Appointment: 2008 President and Treasurer of Fidelity's Fixed Income and Asset Allocation Funds. Mr. Hebble also serves as President (2011-present), Treasurer, and Chief Financial Officer of The North Carolina Capital Management Trust: Cash and Term Portfolios (2008-present), Assistant Treasurer of other Fidelity funds (2009-present) and is an employee of Fidelity Investments. |
Christopher P. Sullivan (57) |
| Year of Election or Appointment: 2009 Vice President of Fidelity's Bond Funds. Mr. Sullivan also serves as President of Fidelity's Bond Division (2009-present). Mr. Sullivan is Executive Vice President of Fidelity Investments Money Management, Inc. (2009-present), and a Director of Fidelity Management & Research (U.K.) Inc. (2010-present). Previously, Mr. Sullivan served as Managing Director, Co-Head of U.S. Fixed Income at Goldman Sachs Asset Management (2001-2009). |
Christine J. Thompson (53) |
| Year of Election or Appointment: 2010 Vice President of Fidelity's Bond Funds. Ms. Thompson also serves as Chief Investment Officer of FMR's Bond Group (2010-present) and is an employee of Fidelity Investments. Previously, Ms. Thompson served as Director of Municipal Bond Portfolio Managers (2002-2010). |
Scott C. Goebel (43) |
| Year of Election or Appointment: 2008 Secretary and Chief Legal Officer (CLO) of the Fidelity funds. Mr. Goebel also serves as Secretary of Fidelity Investments Money Management, Inc. (FIMM) (2010-present) and Fidelity Research and Analysis Company (FRAC) (2010-present); Secretary and CLO of The North Carolina Capital Management Trust: Cash and Term Portfolios (2008-present); General Counsel, Secretary, and Senior Vice President of FMR (2008-present) and FMR Co., Inc. (2008-present); employed by FMR LLC or an affiliate (2001-present); Chief Legal Officer of Fidelity Management & Research (Hong Kong) Limited (2008-present) and Assistant Secretary of Fidelity Management & Research (Japan) Inc. (2008-present), and Fidelity Management & Research (U.K.) Inc. (2008-present). Previously, Mr. Goebel served as Assistant Secretary of FIMM (2008-2010), FRAC (2008-2010), and the Funds (2007-2008) and as Vice President and Secretary of Fidelity Distributors Corporation (FDC) (2005-2007). |
David J. Carter (38) |
| Year of Election or Appointment: 2010 Assistant Secretary of Fidelity's Fixed Income and Asset Allocation Funds. Mr. Carter also serves as Vice President, Associate General Counsel (2010-present) and is an employee of Fidelity Investments (2005-present). |
Holly C. Laurent (57) |
| Year of Election or Appointment: 2008 Anti-Money Laundering (AML) Officer of the Fidelity funds. Ms. Laurent also serves as AML Officer of The North Carolina Capital Management Trust: Cash and Term Portfolios (2008-present) and is an employee of Fidelity Investments. Previously, Ms. Laurent was Senior Vice President and Head of Legal for Fidelity Business Services India Pvt. Ltd. (2006-2008), and Senior Vice President, Deputy General Counsel and Group Head for FMR LLC (2005-2006). |
Christine Reynolds (53) |
| Year of Election or Appointment: 2008 Chief Financial Officer of the Fidelity funds. Ms. Reynolds became President of Fidelity Pricing and Cash Management Services (FPCMS) in August 2008. Ms. Reynolds served as Chief Operating Officer of FPCMS (2007-2008). Previously, Ms. Reynolds served as President, Treasurer, and Anti-Money Laundering officer of the Fidelity funds (2004-2007). |
Michael H. Whitaker (44) |
| Year of Election or Appointment: 2008 Chief Compliance Officer of Fidelity's Fixed Income and Asset Allocation Funds. Mr. Whitaker also serves as Chief Compliance Officer of The North Carolina Capital Management Trust: Cash and Term Portfolios (2008-present). Mr. Whitaker is an employee of Fidelity Investments (2007-present). Prior to joining Fidelity Investments, Mr. Whitaker worked at MFS Investment Management where he served as Senior Vice President and Chief Compliance Officer (2004-2006), and Assistant General Counsel. |
Jeffrey S. Christian (50) |
| Year of Election or Appointment: 2009 Deputy Treasurer of the Fidelity funds. Mr. Christian is an employee of Fidelity Investments. Previously, Mr. Christian served as Chief Financial Officer (2008-2009) of certain Fidelity funds and Senior Vice President of Fidelity Pricing and Cash Management Services (FPCMS) (2004-2009). |
Joseph F. Zambello (54) |
| Year of Election or Appointment: 2011 Deputy Treasurer of the Fidelity funds. Mr. Zambello is an employee of Fidelity Investments. Previously, Mr. Zambello served as Vice President of FMR's Program Management Group (2009-2011) and Vice President of the Transfer Agent Oversight Group (2005-2009). |
Stephanie J. Dorsey (42) |
| Year of Election or Appointment: 2008 Deputy Treasurer of Fidelity's Fixed Income and Asset Allocation Funds. Ms. Dorsey also serves as Assistant Treasurer of other Fidelity funds (2010-present) and is an employee of Fidelity Investments (2008-present). Previously, Ms. Dorsey served as Treasurer (2004-2008) of the JPMorgan Mutual Funds and Vice President (2004-2008) of JPMorgan Chase Bank. |
Adrien E. Deberghes (44) |
| Year of Election or Appointment: 2010 Assistant Treasurer of Fidelity's Fixed Income and Asset Allocation Funds. Mr. Deberghes also serves as Vice President and Assistant Treasurer of Fidelity Rutland Square Trust II and Fidelity Commonwealth Trust II (2011-present), Deputy Treasurer of other Fidelity funds (2008-present), and is an employee of Fidelity Investments (2008-present). Previously, Mr. Deberghes served as Senior Vice President of Mutual Fund Administration at State Street Corporation (2007-2008), Senior Director of Mutual Fund Administration at Investors Bank & Trust (2005-2007), and Director of Finance for Dunkin' Brands (2000-2005). |
Kenneth B. Robins (42) |
| Year of Election or Appointment: 2009 Assistant Treasurer of the Fidelity Fixed Income and Asset Allocation Funds. Mr. Robins also serves as President and Treasurer of other Fidelity funds (2008-present; 2010-present) and is an employee of Fidelity Investments (2004-present). Previously, Mr. Robins served as Deputy Treasurer of the Fidelity funds (2005-2008) and Treasurer and Chief Financial Officer of The North Carolina Capital Management Trust: Cash and Term Portfolios (2006-2008). |
Gary W. Ryan (53) |
| Year of Election or Appointment: 2005 Assistant Treasurer of the Fidelity funds. Mr. Ryan is an employee of Fidelity Investments. Previously, Mr. Ryan served as Vice President of Fund Reporting in Fidelity Pricing and Cash Management Services (FPCMS) (1999-2005). |
Jonathan Davis (43) |
| Year of Election or Appointment: 2010 Assistant Treasurer of the Fidelity funds. Mr. Davis is also Assistant Treasurer of Fidelity Rutland Square Trust II and Fidelity Commonwealth Trust II. Mr. Davis is an employee of Fidelity Investments. Previously, Mr. Davis served as Vice President and Associate General Counsel of FMR LLC (2003-2010). |
Annual Report
The Board of Trustees of VIP Investment Grade Bond Portfolio voted to pay to shareholders of record at the opening of business on record date, the following distributions per share derived from capital gains realized from sales of portfolio securities, and dividends derived from net investment income:
| Pay Date | Record Date | Capital Gains |
Initial Class | 02/10/12 | 02/10/12 | $0.092 |
| | | |
Service Class | 02/10/12 | 02/10/12 | $0.092 |
| | | |
Service Class 2 | 02/10/12 | 02/10/12 | $0.092 |
| | | |
Investor Class | 02/10/12 | 02/10/12 | $0.092 |
| | | |
The fund hereby designates as a capital gain dividend with respect to the taxable year ended December 31, 2011, $23,085,466 or, if subsequently determined to be different, the net capital gain of such year.
A total of 9.66% of the dividends distributed during the fiscal year was derived from interest on U.S. Government securities which is generally exempt from state income tax.
Annual Report
Board Approval of Investment Advisory Contracts and Management Fees
VIP Investment Grade Bond Portfolio
Each year, the Board of Trustees, including the Independent Trustees (together, the Board), votes on the renewal of the management contract and sub-advisory agreements (together, the Advisory Contracts) for the fund. The Board, assisted by the advice of fund counsel and Independent Trustees' counsel, requests and considers a broad range of information relevant to the renewal of the Advisory Contracts throughout the year.
The Board meets regularly and considers at each of its meetings factors that are relevant to its annual consideration of the renewal of the fund's Advisory Contracts, including the services and support provided to the fund and its shareholders. The Board has established three standing committees, Operations, Audit, and Nominating and Governance, each composed of Independent Trustees with varying backgrounds, to which the Board has assigned specific subject matter responsibilities in order to enhance effective decision-making by the Board. The Operations Committee, of which all of the Independent Trustees are members, meets regularly throughout the year and, among other matters, considers matters specifically related to the annual consideration of the renewal of the fund's Advisory Contracts. The Board, acting directly and through its Committees, requests and receives information concerning the annual consideration of the renewal of the fund's Advisory Contracts. The Board also meets as needed to consider matters specifically related to the Board's annual consideration of the renewal of Advisory Contracts. Members of the Board may also meet with trustees of other Fidelity funds through ad hoc joint committees to discuss certain matters relevant to the Fidelity funds.
At its September 2011 meeting, the Board of Trustees, including the Independent Trustees, unanimously determined to renew the fund's Advisory Contracts. In reaching its determination, the Board considered all factors it believed relevant, including (i) the nature, extent, and quality of the services to be provided to the fund and its shareholders (including the investment performance of the fund); (ii) the competitiveness of the fund's management fee and total expense ratio; (iii) the total costs of the services to be provided by and the profits to be realized by Fidelity from its relationship with the fund; (iv) the extent to which economies of scale would be realized as the fund grows; and (v) whether fee levels reflect these economies of scale, if any, for the benefit of fund shareholders.
In considering whether to renew the Advisory Contracts for the fund, the Board reached a determination, with the assistance of fund counsel and Independent Trustees' counsel and through the exercise of its business judgment, that the renewal of the Advisory Contracts is in the best interests of the fund and its shareholders and that the compensation payable under the Advisory Contracts is fair and reasonable. The Board's decision to renew the Advisory Contracts was not based on any single factor, but rather was based on a comprehensive consideration of all the information provided to the Board at its meetings throughout the year. The Board, in reaching its determination to renew the Advisory Contracts, is aware that shareholders in the fund have a broad range of investment choices available to them, including a wide choice among mutual funds offered by Fidelity's competitors, and that the fund's shareholders, who have the opportunity to review and weigh the disclosure provided by the fund in its prospectus and other public disclosures, have chosen to invest in this fund, managed by Fidelity.
Nature, Extent, and Quality of Services Provided. The Board considered the staffing within the investment adviser, FMR, and the sub-advisers (together, the Investment Advisers), including the backgrounds of the fund's investment personnel and the fund's investment objective and discipline. The Independent Trustees also had discussions with senior management of Fidelity's investment operations and investment groups. The Board considered the structure of the portfolio manager compensation program and whether this structure provides appropriate incentives to act in the best interests of the fund.
Resources Dedicated to Investment Management and Support Services. The Board reviewed the general qualifications and capabilities of the Investment Advisers' investment staff, including its size, education, experience, and resources, as well as the Investment Advisers' approach to recruiting, managing, and compensating investment personnel. The Board also noted that FMR has devoted increased resources to non-U.S. offices. The Board noted that Fidelity's analysts have extensive resources, tools and capabilities which allow them to conduct sophisticated quantitative and fundamental analysis, as well as credit analysis of issuers, counterparties and enhancers. The Board also believes that Fidelity's investment professionals have sufficient access to global information and data so as to provide competitive investment results over time, and that those professionals also have access to sophisticated tools which permit them to assess portfolio construction and risk and performance attribution characteristics continuously, as well as to transmit new information and research conclusions rapidly around the world. Additionally, in its deliberations, the Board considered the Investment Advisers' trading capabilities and resources which are an integral part of the investment management process.
Shareholder and Administrative Services. The Board considered (i) the nature, extent, quality, and cost of advisory, administrative, and shareholder services performed by the Investment Advisers and their affiliates under the Advisory Contracts and under separate agreements covering transfer agency, pricing and bookkeeping, and securities lending services for the fund; (ii) the nature and extent of the investment adviser's supervision of third party service providers, principally custodians and subcustodians; and (iii) the resources devoted to, and the record of compliance with, the fund's compliance policies and procedures.
The Board noted that the growth of fund assets over time across the complex allows Fidelity to reinvest in the development of services designed to enhance the value or convenience of the Fidelity funds as investment vehicles. These services include 24-hour access to account information and market information through telephone representatives and over the Internet, investor education materials and asset allocation tools, and the expanded availability of Fidelity Investor Centers, with 35 new branches opening since 2010.
Annual Report
Investment in a Large Fund Family. The Board considered the benefits to shareholders of investing in a Fidelity fund, including the benefits of investing in a fund that is part of a large family of funds offering a variety of investment disciplines and providing a large variety of mutual fund investor services. The Board noted that Fidelity had taken, or had made recommendations that resulted in the Fidelity funds taking, a number of actions over the previous year that benefited particular funds, including (i) continuing to dedicate additional resources to investment research and support of the senior management team that oversees asset management; (ii) rationalizing product lines through the mergers of six funds into other funds; (iii) continuing to migrate the Freedom Funds to dedicated lower cost underlying funds; (iv) obtaining shareholder approval to broaden the investment strategies for Fidelity Consumer Finance Portfolio, Fidelity Emerging Asia Fund, and Fidelity Environment and Alternative Energy Portfolio; (v) contractually agreeing to reduce the management fees and impose other expense limitations on Spartan 500 Index Fund and U.S. Bond Index Fund in connection with launching new institutional classes of these funds; (vi) changing the name, primary and supplemental benchmarks, and investment policies of Fidelity Global Strategies Fund to support the fund's flexible investment mandate and global orientation; and (vii) reducing the transfer agency account fee rates on certain accounts.
Investment Performance. The Board considered whether the fund has operated in accordance with its investment objective, as well as its record of compliance with its investment restrictions. It also reviewed the fund's absolute investment performance for each class, as well as the fund's relative investment performance for each class measured over multiple periods against (i) a broad-based securities market index, and (ii) a peer group of mutual funds deemed appropriate by Fidelity and reviewed by the Board. The following charts considered by the Board show, over the one-, three-, and five-year periods ended December 31, 2010, the cumulative total returns of Initial Class and Service Class 2 of the fund, the cumulative total returns of a broad-based securities market index ("benchmark"), and a range of cumulative total returns of a peer group of mutual funds identified by Lipper Inc. as having an investment objective similar to that of the fund. The returns of Initial Class and Service Class 2 show the performance of the highest and lowest performing classes, respectively (based on five-year performance). The box within each chart shows the 25th percentile return (bottom of box) and the 75th percentile return (top of box) of the peer group. Returns shown above the box are in the first quartile and returns shown below the box are in the fourth quartile. The percentage beaten numbers noted below each chart correspond to the percentile box and represent the percentage of funds in the peer group whose performance was equal to or lower than that of the class indicated.
VIP Investment Grade Bond Portfolio
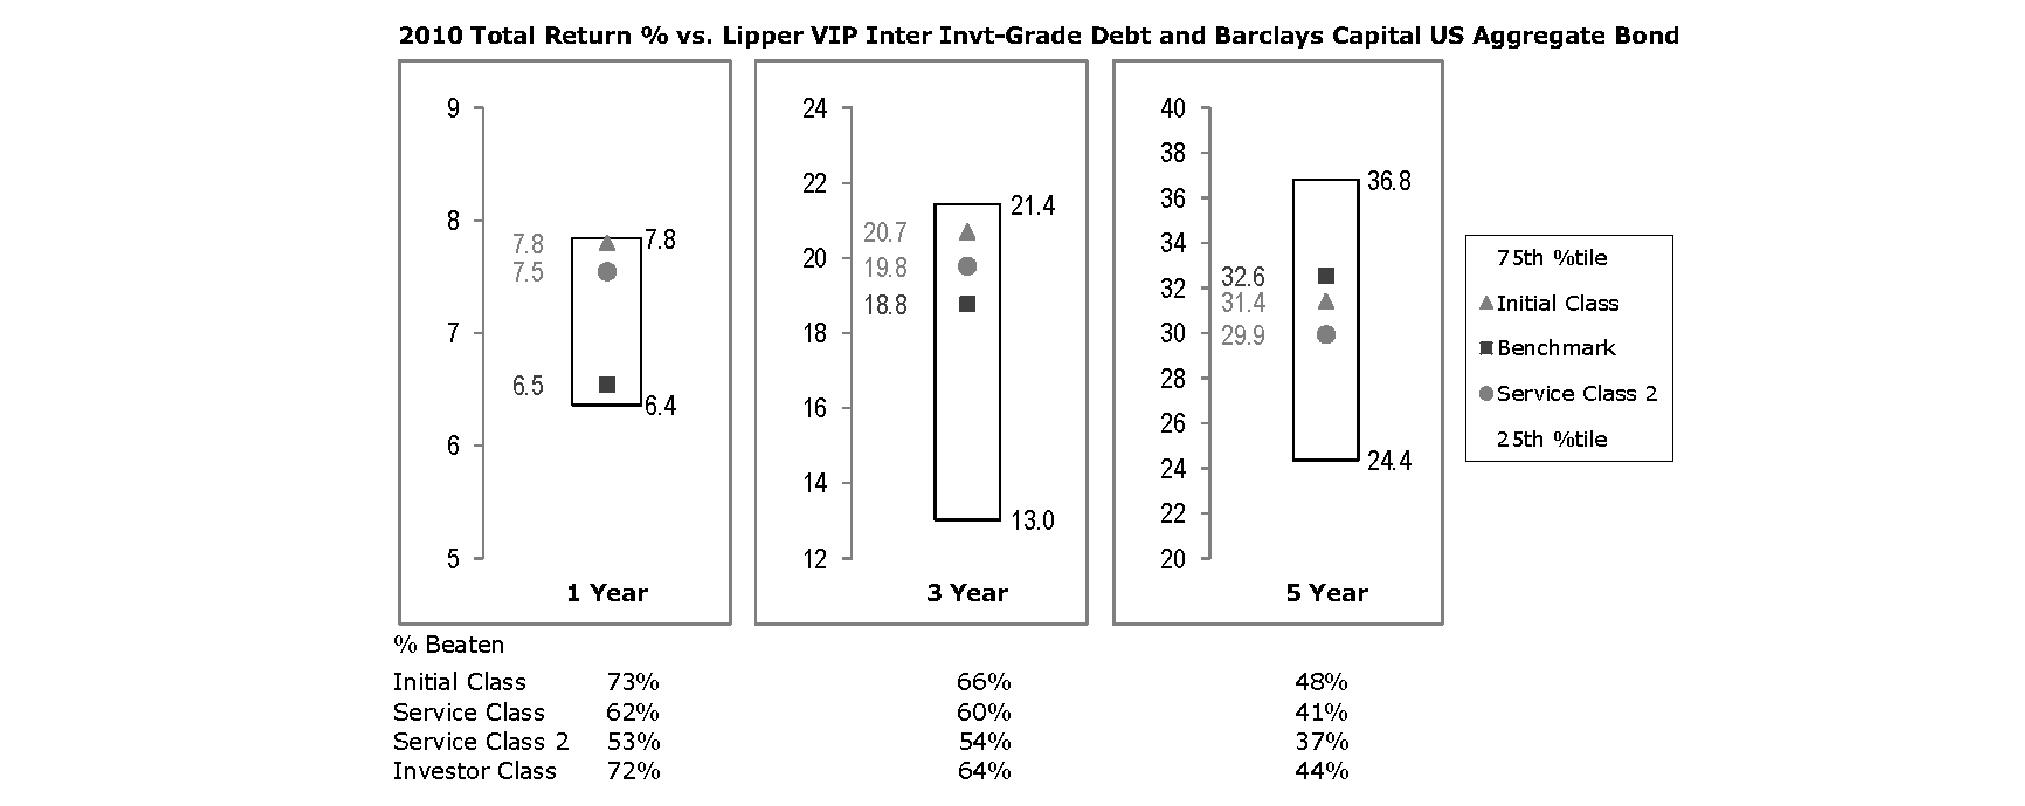
The Board reviewed the fund's relative investment performance against its peer group and noted that the performance of Initial Class of the fund was in the second quartile for the one- and three-year periods and the third quartile for the five-year period. The Board also noted that the investment performance of Initial Class of the fund compared favorably to its benchmark for the one- and three-year periods, although the fund's five-year cumulative total return was lower than its benchmark. The Board considered that the variations in performance among the fund's classes reflect the variations in class expenses, which result in lower performance for higher expense classes. The Board also reviewed the fund's performance since inception as well as performance in the current year.
Based on its review, the Board concluded that the nature, extent, and quality of services provided to the fund under the Advisory Contracts should benefit the fund's shareholders.
Competitiveness of Management Fee and Total Expense Ratio. The Board considered the fund's management fee and total expense ratio compared to "mapped groups" of competitive funds and classes. Fidelity creates "mapped groups" by combining similar Lipper investment objective categories that have comparable management fee characteristics. Combining Lipper investment objective categories aids the Board's management fee and total expense ratio comparisons by broadening the competitive group used for comparison and by reducing the number of universes to which various Fidelity funds are compared.
Annual Report
Board Approval of Investment Advisory Contracts and Management Fees - continued
Management Fee. The Board considered two proprietary management fee comparisons for the 12-month periods shown in the chart below. The group of Lipper funds used by the Board for management fee comparisons is referred to below as the "Total Mapped Group" and, for the reasons explained above, is broader than the Lipper peer group used by the Board for performance comparisons. The Total Mapped Group comparison focuses on a fund's standing relative to the total universe of comparable funds available to investors in terms of gross management fees before expense reimbursements or caps. "TMG %" represents the percentage of funds in the Total Mapped Group that had management fees that were lower than the fund's. For example, a TMG % of 3% means that 97% of the funds in the Total Mapped Group had higher management fees than the fund. The "Asset-Size Peer Group" (ASPG) comparison focuses on a fund's standing relative to non-Fidelity funds similar in size to the fund within the Total Mapped Group. The ASPG represents at least 15% of the funds in the Total Mapped Group with comparable asset size and management fee characteristics, subject to a minimum of 50 funds (or all funds in the Total Mapped Group if fewer than 50). Additional information, such as the ASPG quartile in which the fund's management fee ranked, is also included in the chart and considered by the Board.
VIP Investment Grade Bond Portfolio
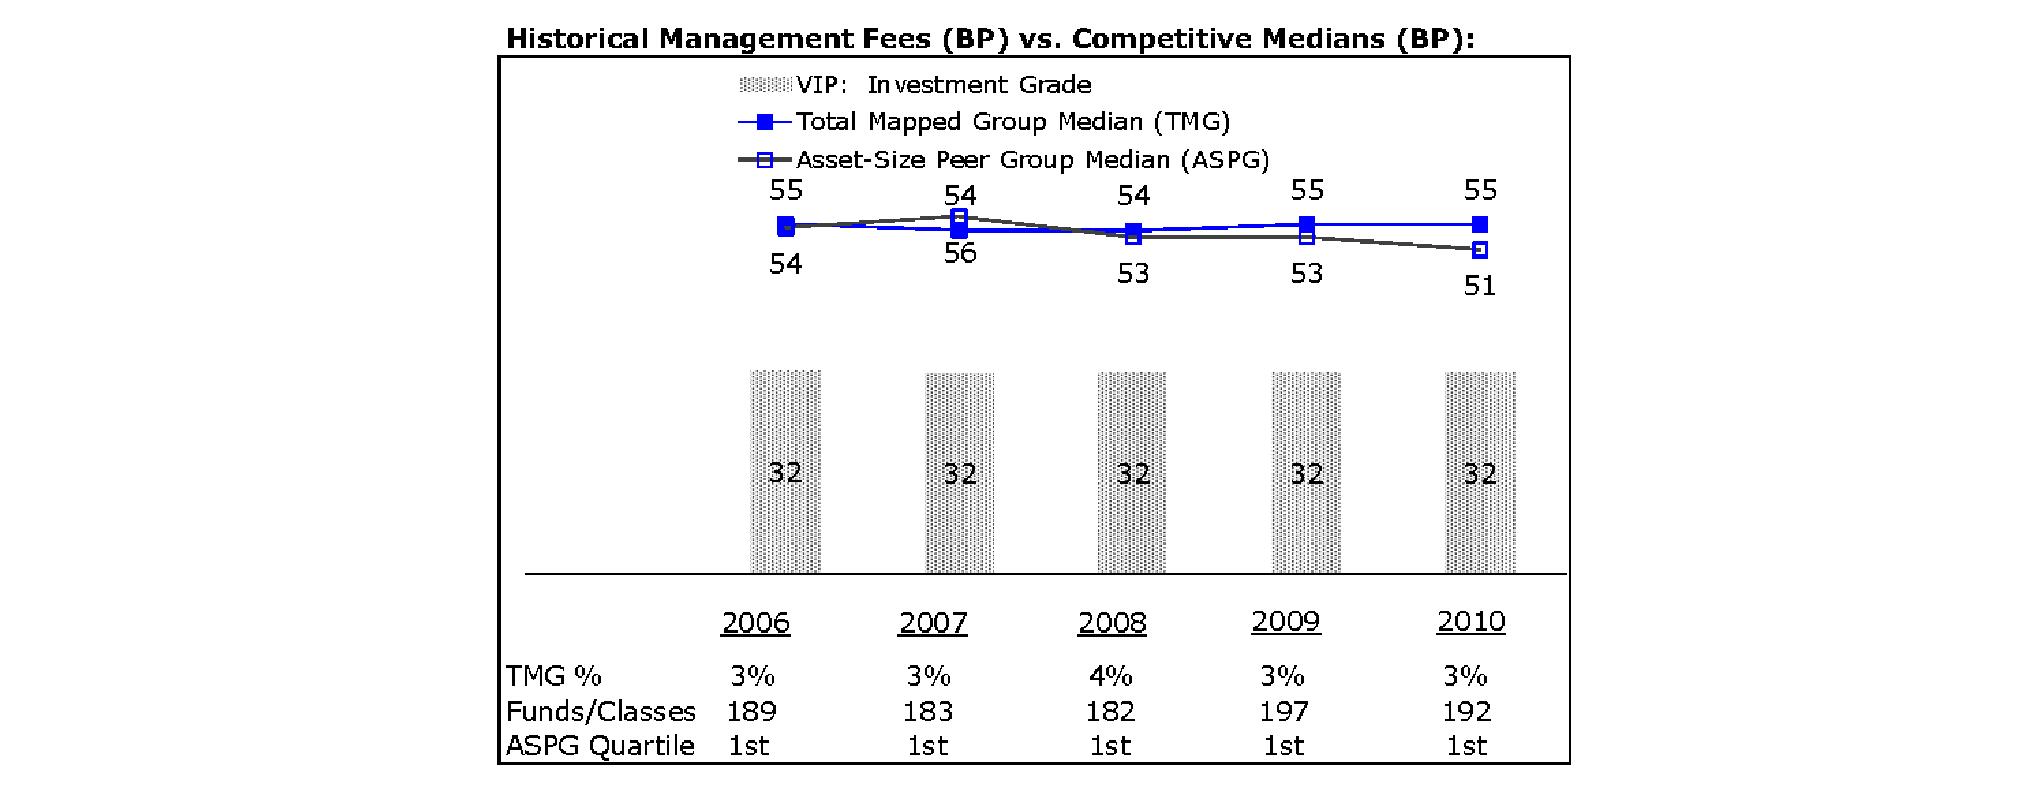
The Board noted that the fund's management fee ranked below the median of its Total Mapped Group and below the median of its ASPG for 2010.
Based on its review, the Board concluded that the fund's management fee is fair and reasonable in light of the services that the fund receives and the other factors considered.
Total Expense Ratio. In its review of each class's total expense ratio, the Board considered the fund's management fee as well as other fund or class expenses, as applicable, such as transfer agent fees, pricing and bookkeeping fees, fund-paid 12b-1 fees, and custodial, legal, and audit fees. The Board also noted the effects of any waivers and reimbursements on fees and expenses. As part of its review, the Board also considered the current and historical total expense ratios of each class of the fund compared to competitive fund median expenses. Each class of the fund is compared to those funds and classes in the Total Mapped Group (used by the Board for management fee comparisons) that have a similar sales load structure.
The Board noted that the total expense ratio of each class ranked below its competitive median for 2010. The Board also noted that Investor Class has higher transfer agent fees than traditional variable annuity classes because it is designed for lower cost annuity products, where the majority of servicing costs are incorporated into the funds' total expense ratios rather than being paid at the annuity level.
Fees Charged to Other Fidelity Clients. The Board also considered Fidelity fee structures and other information with respect to clients of FMR and its affiliates, such as other mutual funds advised or subadvised by FMR or its affiliates, pension plan clients, and other institutional clients. In March 2010, the Board created an ad hoc joint committee with the board of other Fidelity funds (the Committee) to review and compare Fidelity's institutional investment advisory business with its business of providing services to the Fidelity funds, including the differences in services provided, fees charged, and costs incurred, as well as competition in their respective marketplaces.
Based on its review of total expense ratios and fees charged to other Fidelity clients, the Board concluded that the total expense ratio of each class of the fund was reasonable in light of the services that the fund and its shareholders receive and the other factors considered, including the findings of the Committee.
Annual Report
Costs of the Services and Profitability. The Board considered the revenues earned and the expenses incurred by Fidelity in conducting the business of developing, marketing, distributing, managing, administering and servicing the fund and its shareholders. The Board also considered the level of Fidelity's profits in respect of all the Fidelity funds.
On an annual basis, FMR presents to the Board Fidelity's profitability for the fund. Fidelity calculates the profitability for each fund, as well as aggregate profitability for groups of Fidelity funds and all Fidelity funds, using a series of detailed revenue and cost allocation methodologies which originate with the books and records of Fidelity on which Fidelity's audited financial statements are based. The Audit Committee of the Board reviews any significant changes from the prior year's methodologies.
PricewaterhouseCoopers LLP (PwC), independent registered public accounting firm and auditor to Fidelity and certain Fidelity funds, has been engaged annually by the Board as part of the Board's assessment of Fidelity's profitability analysis. PwC's engagement includes the review and assessment of Fidelity's methodologies used in determining the revenues and expenses attributable to Fidelity's mutual fund business, and completion of agreed-upon procedures surrounding the mathematical accuracy of fund profitability and its conformity to allocation methodologies. After considering PwC's reports issued under the engagement and information provided by Fidelity, the Board concluded that while other allocation methods may also be reasonable, Fidelity's profitability methodologies are reasonable in all material respects.
The Board also reviewed Fidelity's non-fund businesses and fall-out benefits related to the mutual fund business as well as cases where Fidelity's affiliates may benefit from or be related to the fund's business.
The Board considered the costs of the services provided by and the profits realized by Fidelity in connection with the operation of the fund and was satisfied that the profitability was not excessive in the circumstances.
Economies of Scale. The Board considered whether there have been economies of scale in respect of the management of the Fidelity funds, whether the Fidelity funds (including the fund) have appropriately benefited from any such economies of scale, and whether there is potential for realization of any further economies of scale. The Board considered the extent to which the fund will benefit from economies of scale through increased services to the fund, through waivers or reimbursements, or through fee or expense reductions. The Board also noted that in 2009, it and the board of other Fidelity funds created an ad hoc committee (the Economies of Scale Committee) to analyze whether FMR attains economies of scale in respect of the management and servicing of the Fidelity funds, whether the Fidelity funds have appropriately benefited from such economies of scale, and whether there is potential for realization of any further economies of scale.
The Board recognized that the fund's management contract incorporates a "group fee" structure, which provides for lower group fee rates as total fund assets under FMR's management increase, and for higher group fee rates as total fund assets under FMR's management decrease. FMR calculates the group fee rates based on a tiered asset "breakpoint" schedule that varies based on asset class. The Board considered that the group fee is designed to deliver the benefits of economies of scale to fund shareholders when total Fidelity fund assets increase, even if assets of any particular fund are unchanged or have declined, because some portion of Fidelity's costs are attributable to services provided to all Fidelity funds, and all funds benefit if those costs can be allocated among more assets. The Board concluded that, given the group fee structure, fund shareholders will benefit from lower management fees as assets under FMR's management increase at the fund complex level, regardless of whether Fidelity achieves any such economies of scale.
The Board concluded, taking into account the analysis of the Economies of Scale Committee, that any potential economies of scale are being appropriately shared between fund shareholders and Fidelity.
Additional Information Requested by the Board. In order to develop fully the factual basis for consideration of the Fidelity funds' Advisory Contracts, the Board requested and received additional information on certain topics, including: (i) Fidelity's fund profitability methodology, profitability trends for certain funds, and the impact of certain factors on fund profitability results; (ii) portfolio manager changes that have occurred during the past year and the amount of the investment that each portfolio manager has made in the Fidelity fund(s) that he or she manages; (iii) Fidelity's compensation structure for portfolio managers, research analysts, and other key personnel, including its effects on fund profitability, the rationale for the compensation structure, and the extent to which current market conditions have affected retention and recruitment; (iv) the compensation paid to fund sub-advisers on behalf of the Fidelity funds; (v) Fidelity's fee structures and rationale for recommending different fees among different categories of funds and classes, as well as Fidelity's voluntary waiver of its fees to maintain minimum yields for certain money market funds and classes; (vi) the reasons why certain expenses affect various funds and classes differently; (vii) Fidelity's transfer agent fees, expenses, and services and how the benefits of decreased costs and new efficiencies can be shared across all of the Fidelity funds; (viii) the reasons for and consequences of changes to certain product lines compared to competitors; (ix) the allocation of and historical trends in Fidelity's realization of fall-out benefits; and (x) explanations regarding the relative total expense ratios of certain funds and classes, total expense competitive trends, and actions that might be taken by FMR to reduce total expense ratios for certain funds and classes or to achieve further economies of scale.
Based on its evaluation of all of the conclusions noted above, and after considering all factors it believed relevant, the Board ultimately concluded that the advisory fee structures are fair and reasonable, and that the fund's Advisory Contracts should be renewed.
Annual Report
The following are the financial statements for the Fidelity VIP Investment
Grade Central Fund as of December 31, 2011 which is a direct investment of
VIP Investment Grade Bond Portfolio.
Not Part of Financial Report
Performance: The Bottom Line
Average annual total return reflects the change in the value of an investment, assuming reinvestment of the fund's distributions from dividend income and capital gains (the profits earned upon the sale of securities that have grown in value, if any) and assuming a constant rate of performance each year. During periods of reimbursement by Fidelity, a fund's total return will be greater than it would be had the reimbursement not occurred. Performance numbers are net of all underlying fund operating expenses, but do not include any insurance charges imposed by your insurance company's separate account. If performance information included the effect of these additional charges, the total returns would have been lower. How a fund did yesterday is no guarantee of how it will do tomorrow.
Average Annual Total Returns
Periods ended December 31, 2011 | Past 1
year | Past 5
years | Life of
fund A |
Fidelity® VIP Investment Grade Central Fund | 7.96% | 6.73% | 7.19% |
A From June 23, 2006
$10,000 Over Life of Fund
Let's say hypothetically that $10,000 was invested in Fidelity® VIP Investment Grade Central Fund on June 23, 2006, when the fund started. The chart shows how the value of your investment would have changed, and also shows how the Barclays Capital® U.S. Aggregate Bond Index performed over the same period.
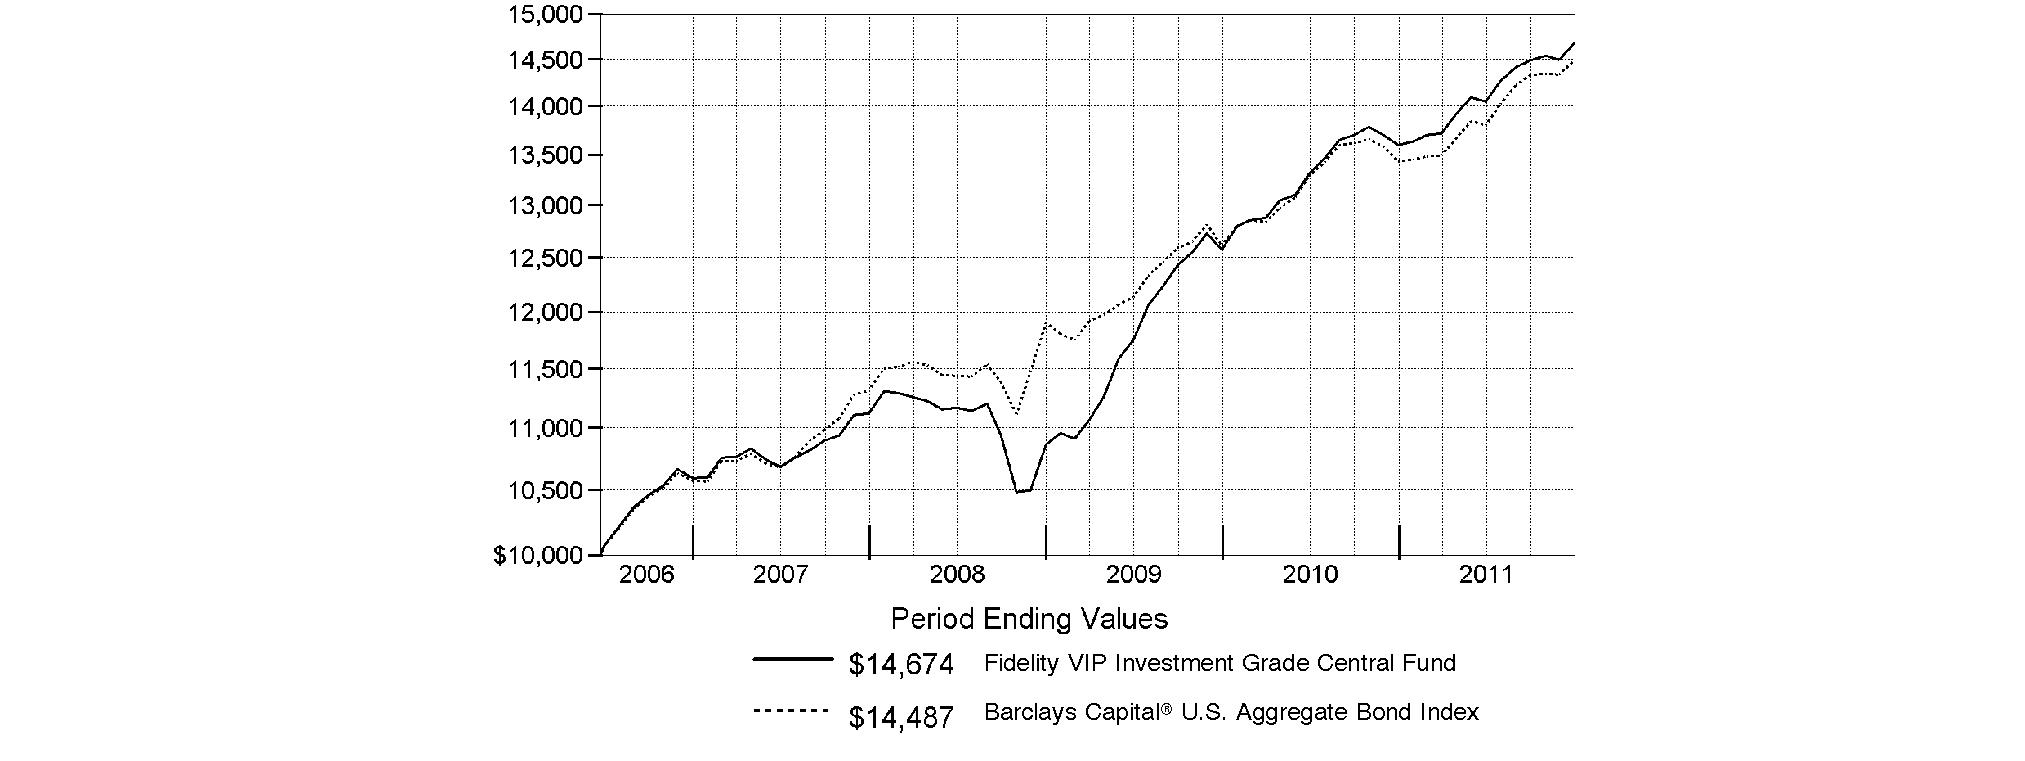
Not Part of Financial Report
Management's Discussion of Fund Performance
Market Recap: Against the backdrop of ultra-low interest rates, acute market volatility and a global flight to quality, U.S. taxable investment-grade bonds generated solid gains for the year ending December 31, 2011, as evidenced by the 7.84% return of the Barclays Capital® U.S. Aggregate Bond Index. Among the major sectors that comprise the index, U.S. Treasury bonds fared best, rising 9.81%. Treasuries benefited from robust investor demand for high-quality assets when the global economy weakened, inflation expectations fell, sovereign debt woes in Europe worsened, Congress wrangled over raising the federal debt ceiling and Standard & Poor's downgraded the U.S. long-term sovereign credit rating. Investment-grade corporate bonds gained 8.35%, bolstered by demand for higher-yielding bonds amid improved corporate profitability. Government-agency-issued residential mortgage-backed securities (MBS) rose 6.23%, receiving a boost from slower-than-expected prepayments and the Federal Reserve's program to reinvest payments from its holdings of agency debentures into the MBS sector, although the positive impact was somewhat offset by concerns that the bondholders would be negatively affected should the government modify homeowner refinancing programs. Slightly more muted returns were seen elsewhere in the market, with commercial mortgage-backed securities (CMBS), asset-backed securities (ABS) and government agency securities gaining 6.02%, 5.14% and 4.82%, respectively.
Comments from Ford O'Neil, Portfolio Manager of VIP Investment Grade Central Fund: For the year, the fund returned 7.96%, modestly outpacing the Barclays Capital index. Positioning among U.S. Treasury securities, an overweighting in corporate bonds and an underweighting in U.S. government agency securities bolstered relative performance, more than offsetting some disadvantageous sector weightings elsewhere and security selection among corporates. Although the fund gave up some ground due to an underweighting in Treasuries since they were among the U.S. fixed income market's best performers, overall yield-curve positioning within the sector was a plus. Specifically, overweighting 10- to 30-year bonds proved beneficial, as they significantly outpaced the index during the period. A corresponding underweighting in shorter-term Treasury issues also was advantageous, as this group showed more-subdued gains. An out-of-benchmark stake in Treasury Inflation-Protected Securities (TIPS), with a focus on intermediate- and long-maturity bonds, further contributed. Conversely, an emphasis on lagging financials curbed our upside within corporates, while overweightings in asset-backed and commercial-backed mortgage securities also detracted.
The views expressed above reflect those of the portfolio manager(s) only through the end of the period as stated on the cover of this report and do not necessarily represent the views of Fidelity or any other person in the Fidelity organization. Any such views are subject to change at any time based upon market or other conditions and Fidelity disclaims any responsibility to update such views. These views may not be relied on as investment advice and, because investment decisions for a Fidelity fund are based on numerous factors, may not be relied on as an indication of trading intent on behalf of any Fidelity fund.
Not Part of Financial Report
Shareholder Expense Example
As a shareholder of the Fund, you incur two types of costs: (1) transaction costs, and (2) ongoing costs, including other Fund expenses. This Example is intended to help you understand your ongoing costs (in dollars) of investing in the Fund and to compare these costs with the ongoing costs of investing in other mutual funds.
The Example is based on an investment of $1,000 invested at the beginning of the period and held for the entire period (July 1, 2011 to December 31, 2011).
Actual Expenses
The first line of the accompanying table provides information about actual account values and actual expenses. You may use the information in this line, together with the amount you invested, to estimate the expenses that you paid over the period. Simply divide your account value by $1,000.00 (for example, an $8,600 account value divided by $1,000.00 = 8.6), then multiply the result by the number in the first line under the heading entitled "Expenses Paid During Period" to estimate the expenses you paid on your account during this period. In addition, the Fund, as a shareholder in the underlying Fidelity Central Funds, will indirectly bear its pro-rata share of the fees and expenses incurred by the underlying Fidelity Central Funds. These fees and expenses are not included in the Fund's annualized expense ratio used to calculate the expense estimate in the table below.
Hypothetical Example for Comparison Purposes
The second line of the accompanying table provides information about hypothetical account values and hypothetical expenses based on the Fund's actual expense ratio and an assumed rate of return of 5% per year before expenses, which is not the Fund's actual return. The hypothetical account values and expenses may not be used to estimate the actual ending account balance or expenses you paid for the period. You may use this information to compare the ongoing costs of investing in the Fund and other funds. To do so, compare this 5% hypothetical example with the 5% hypothetical examples that appear in the shareholder reports of the other funds. In addition, the Fund, as a shareholder in the underlying Fidelity Central Funds, will indirectly bear its pro-rata share of the fees and expenses incurred by the underlying Fidelity Central Funds. These fees and expenses are not included in the Fund's annualized expense ratio used to calculate the expense estimate in the table below.
Please note that the expenses shown in the table are meant to highlight your ongoing costs only and do not reflect any transaction costs. Therefore, the second line of the table is useful in comparing ongoing costs only, and will not help you determine the relative total costs of owning different funds.
| Annualized
Expense Ratio | Beginning
Account Value
July 1, 2011 | Ending
Account Value
December 31, 2011 | Expenses Paid
During Period*
July 1, 2011 to
December 31, 2011 |
Actual | .0020% | $ 1,000.00 | $ 1,045.10 | $ .01 |
Hypothetical (5% return per year before expenses) | | $ 1,000.00 | $ 1,025.20 | $ .01 |
* Expenses are equal to the Fund's annualized expense ratio, multiplied by the average account value over the period, multiplied by 184/365 (to reflect the one-half year period).
Not Part of Financial Report
Investment Changes (Unaudited)
Quality Diversification (% of fund's net assets) |
As of December 31, 2011 | As of June 30, 2011 |
| U.S. Government and
U.S. Government
Agency Obligations 67.0% | | | U.S. Government and
U.S. Government
Agency Obligations 65.8% | |
| AAA 7.4% | | | AAA 7.9% | |
| AA 2.7% | | | AA 2.7% | |
| A 7.7% | | | A 8.3% | |
| BBB 14.5% | | | BBB 13.1% | |
| BB and Below 2.9% | | | BB and Below 3.4% | |
| Not Rated† 0.0% | | | Not Rated† 0.0% | |
| Short-Term
Investments and
Net Other Assets*** (2.2)% | | | Short-Term
Investments and
Net Other Assets*** (1.2)% | |

We have used ratings from Moody's Investors Service, Inc. Where Moody's® ratings are not available, we have used S&P® ratings. All ratings are as of the date indicated and do not reflect subsequent changes. Securities rated BB or below were rated investment grade at the time of acquisition. |
Weighted Average Maturity as of December 31, 2011 |
| | 6 months ago |
Years | 6.4 | 6.2 |
This is a weighted average of all the maturities of the securities held in a fund. Weighted Average Maturity (WAM) can be used as a measure of sensitivity to interest rate changes and market changes. Generally, the longer the maturity, the greater the sensitivity to such changes. WAM is based on the dollar-weighted average length of time until principal payments must be paid. Depending on the types of securities held in a fund, certain maturity shortening devices (e.g., demand features, interest rate resets, and call options) may be taken into account when calculating the WAM. |
Duration as of December 31, 2011 |
| | 6 months ago |
Years | 4.8 | 5.0 |
Duration estimates how much a bond fund's price will change with a change in comparable interest rates. If rates rise 1%, for example, a fund with a 5-year duration is likely to lose about 5% of its value. Other factors also can influence a bond fund's performance and share price. Accordingly, a bond fund's actual performance may differ from this example. Duration takes into account any call or put option embedded in the bonds. |
Asset Allocation (% of fund's net assets) |
As of December 31, 2011* | As of June 30, 2011** |
| Corporate Bonds 25.0% | | | Corporate Bonds 24.3% | |
| U.S. Government and
U.S. Government
Agency Obligations 67.0% | | | U.S. Government and
U.S. Government
Agency Obligations 65.8% | |
| Asset-Backed
Securities 2.3% | | | Asset-Backed
Securities 2.6% | |
| CMOs and Other
Mortgage Related
Securities 7.2% | | | CMOs and Other
Mortgage Related
Securities 8.0% | |
| Municipal Bonds 0.3% | | | Municipal Bonds 0.4% | |
| Other Investments 0.4% | | | Other Investments 0.1% | |
| Short-Term
Investments and
Net Other Assets*** (2.2)% | | | Short-Term
Investments and
Net Other Assets*** (1.2)% | |
* Foreign investments | 4.1% | | ** Foreign investments | 3.3% | |
* Futures and Swaps | 2.2% | | ** Futures and Swaps | 2.2% | |
*** Short-Term Investments and Net Other Assets are not included in the pie chart. |
† Amount represents less than 0.1% |

Not Part of Financial Report
Investments December 31, 2011
Showing Percentage of Net Assets
Nonconvertible Bonds - 25.0% |
| Principal Amount | | Value |
CONSUMER DISCRETIONARY - 1.8% |
Media - 1.8% |
AOL Time Warner, Inc. 7.625% 4/15/31 | | $ 1,625,000 | | $ 2,094,636 |
Comcast Corp.: | | | | |
4.95% 6/15/16 | | 2,975,000 | | 3,295,402 |
5.7% 5/15/18 | | 2,400,000 | | 2,761,073 |
6.4% 3/1/40 | | 2,884,000 | | 3,578,248 |
6.45% 3/15/37 | | 1,410,000 | | 1,706,255 |
COX Communications, Inc. 4.625% 6/1/13 | | 3,475,000 | | 3,663,623 |
Discovery Communications LLC: | | | | |
3.7% 6/1/15 | | 2,648,000 | | 2,785,458 |
6.35% 6/1/40 | | 2,421,000 | | 2,910,877 |
NBCUniversal Media LLC: | | | | |
3.65% 4/30/15 | | 1,200,000 | | 1,266,761 |
5.15% 4/30/20 | | 3,234,000 | | 3,599,423 |
6.4% 4/30/40 | | 3,340,000 | | 4,098,471 |
News America Holdings, Inc. 7.75% 12/1/45 | | 2,067,000 | | 2,526,289 |
News America, Inc.: | | | | |
6.15% 3/1/37 | | 2,331,000 | | 2,543,657 |
6.15% 2/15/41 | | 2,132,000 | | 2,452,698 |
Time Warner Cable, Inc.: | | | | |
5.85% 5/1/17 | | 2,467,000 | | 2,810,140 |
6.2% 7/1/13 | | 7,000,000 | | 7,512,323 |
6.75% 7/1/18 | | 4,425,000 | | 5,254,223 |
Time Warner, Inc.: | | | | |
5.375% 10/15/41 | | 1,021,000 | | 1,103,733 |
5.875% 11/15/16 | | 5,514,000 | | 6,365,764 |
6.5% 11/15/36 | | 2,337,000 | | 2,814,786 |
Viacom, Inc.: | | | | |
3.5% 4/1/17 | | 1,312,000 | | 1,367,317 |
6.75% 10/5/37 | | 935,000 | | 1,158,292 |
| | 67,669,449 |
CONSUMER STAPLES - 1.2% |
Beverages - 0.3% |
Diageo Capital PLC 5.2% 1/30/13 | | 1,705,000 | | 1,785,626 |
FBG Finance Ltd. 5.125% 6/15/15 (c) | | 2,185,000 | | 2,378,340 |
Fortune Brands, Inc.: | | | | |
5.375% 1/15/16 | | 471,000 | | 517,239 |
5.875% 1/15/36 | | 6,267,000 | | 6,554,994 |
| | 11,236,199 |
Food Products - 0.5% |
General Mills, Inc. 5.2% 3/17/15 | | 3,528,000 | | 3,930,753 |
Kraft Foods, Inc.: | | | | |
5.375% 2/10/20 | | 4,086,000 | | 4,713,062 |
6.125% 2/1/18 | | 3,684,000 | | 4,317,132 |
6.5% 8/11/17 | | 3,514,000 | | 4,181,136 |
| | 17,142,083 |
|
| Principal Amount | | Value |
Tobacco - 0.4% |
Altria Group, Inc. 9.7% 11/10/18 | | $ 4,450,000 | | $ 5,985,495 |
Philip Morris International, Inc.: | | | | |
4.875% 5/16/13 | | 2,904,000 | | 3,064,789 |
5.65% 5/16/18 | | 2,751,000 | | 3,253,060 |
Reynolds American, Inc. 7.25% 6/15/37 | | 2,962,000 | | 3,430,260 |
| | 15,733,604 |
TOTAL CONSUMER STAPLES | | 44,111,886 |
ENERGY - 3.6% |
Energy Equipment & Services - 0.5% |
DCP Midstream LLC: | | | | |
4.75% 9/30/21 (c) | | 3,739,000 | | 3,863,019 |
5.35% 3/15/20 (c) | | 3,724,000 | | 3,984,047 |
El Paso Pipeline Partners Operating Co. LLC: | | | | |
4.1% 11/15/15 | | 3,902,000 | | 3,995,297 |
5% 10/1/21 | | 1,517,000 | | 1,560,718 |
Transocean, Inc.: | | | | |
5.05% 12/15/16 | | 2,488,000 | | 2,540,984 |
6.375% 12/15/21 | | 3,286,000 | | 3,491,342 |
| | 19,435,407 |
Oil, Gas & Consumable Fuels - 3.1% |
Anadarko Petroleum Corp. 6.375% 9/15/17 | | 6,869,000 | | 7,964,029 |
Canadian Natural Resources Ltd. 5.7% 5/15/17 | | 5,685,000 | | 6,723,303 |
ConocoPhillips 5.75% 2/1/19 | | 3,900,000 | | 4,698,100 |
Duke Capital LLC 6.25% 2/15/13 | | 855,000 | | 896,431 |
Duke Energy Field Services 6.45% 11/3/36 (c) | | 2,477,000 | | 2,820,141 |
El Paso Natural Gas Co. 5.95% 4/15/17 | | 3,330,000 | | 3,740,003 |
Enbridge Energy Partners LP 4.2% 9/15/21 | | 4,399,000 | | 4,591,980 |
EnCana Holdings Finance Corp. 5.8% 5/1/14 | | 320,000 | | 347,579 |
EQT Corp. 4.875% 11/15/21 | | 1,669,000 | | 1,684,106 |
Kaneb Pipe Line Operations Participation LP 7.75% 2/15/12 | | 4,200,000 | | 4,228,228 |
Marathon Petroleum Corp. 5.125% 3/1/21 | | 2,187,000 | | 2,283,862 |
Motiva Enterprises LLC 5.75% 1/15/20 (c) | | 1,496,000 | | 1,738,038 |
Nakilat, Inc. 6.067% 12/31/33 (c) | | 1,808,000 | | 1,925,520 |
Nexen, Inc.: | | | | |
5.875% 3/10/35 | | 5,405,000 | | 5,506,436 |
6.4% 5/15/37 | | 710,000 | | 750,821 |
NGPL PipeCo LLC 6.514% 12/15/12 (c) | | 2,360,000 | | 2,384,114 |
Pemex Project Funding Master Trust 1.1272% 12/3/12 (c)(i) | | 410,000 | | 407,130 |
Nonconvertible Bonds - continued |
| Principal Amount | | Value |
ENERGY - continued |
Oil, Gas & Consumable Fuels - continued |
Petro-Canada: | | | | |
6.05% 5/15/18 | | $ 1,480,000 | | $ 1,741,742 |
6.8% 5/15/38 | | 3,485,000 | | 4,491,660 |
Petrobras International Finance Co. Ltd.: | | | | |
3.875% 1/27/16 | | 3,612,000 | | 3,721,819 |
5.75% 1/20/20 | | 5,908,000 | | 6,322,269 |
7.875% 3/15/19 | | 4,277,000 | | 5,105,442 |
Petroleos Mexicanos: | | | | |
5.5% 1/21/21 | | 3,601,000 | | 3,916,088 |
6.5% 6/2/41 (c) | | 4,805,000 | | 5,381,600 |
Plains All American Pipeline LP/PAA Finance Corp.: | | | | |
3.95% 9/15/15 | | 2,158,000 | | 2,285,581 |
5% 2/1/21 | | 1,784,000 | | 1,964,527 |
6.125% 1/15/17 | | 1,250,000 | | 1,413,484 |
Ras Laffan Liquefied Natural Gas Co. Ltd. III: | | | | |
4.5% 9/30/12 (c) | | 2,009,000 | | 2,040,140 |
5.5% 9/30/14 (c) | | 2,808,000 | | 3,004,560 |
5.832% 9/30/16 (c) | | 1,842,525 | | 1,971,502 |
6.332% 9/30/27 (c) | | 2,415,000 | | 2,624,791 |
6.75% 9/30/19 (c) | | 1,838,000 | | 2,176,192 |
Schlumberger Investment SA 3.3% 9/14/21 (c) | | 2,428,000 | | 2,493,345 |
Spectra Energy Partners, LP: | | | | |
2.95% 6/15/16 | | 668,000 | | 672,630 |
4.6% 6/15/21 | | 873,000 | | 911,897 |
Suncor Energy, Inc. 6.1% 6/1/18 | | 4,665,000 | | 5,520,766 |
Transcontinental Gas Pipe Line Corp. 6.4% 4/15/16 | | 615,000 | | 712,225 |
Western Gas Partners LP 5.375% 6/1/21 | | 3,820,000 | | 4,049,849 |
| | 115,211,930 |
TOTAL ENERGY | | 134,647,337 |
FINANCIALS - 12.1% |
Capital Markets - 1.8% |
Bear Stearns Companies, Inc. 5.3% 10/30/15 | | 2,079,000 | | 2,236,123 |
BlackRock, Inc. 4.25% 5/24/21 | | 1,183,000 | | 1,236,275 |
Goldman Sachs Group, Inc.: | | | | |
3.7% 8/1/15 | | 5,186,000 | | 5,081,585 |
5.25% 7/27/21 | | 1,823,000 | | 1,777,751 |
5.625% 1/15/17 | | 3,000,000 | | 2,942,412 |
5.95% 1/18/18 | | 755,000 | | 773,093 |
6.15% 4/1/18 | | 5,954,000 | | 6,143,474 |
6.75% 10/1/37 | | 3,421,000 | | 3,178,465 |
|
| Principal Amount | | Value |
JPMorgan Chase Capital XX 6.55% 9/29/36 | | $ 3,090,000 | | $ 3,090,000 |
JPMorgan Chase Capital XXV 6.8% 10/1/37 | | 6,975,000 | | 7,001,156 |
Lazard Group LLC: | | | | |
6.85% 6/15/17 | | 3,241,000 | | 3,400,483 |
7.125% 5/15/15 | | 5,585,000 | | 5,997,994 |
Merrill Lynch & Co., Inc.: | | | | |
5.45% 2/5/13 | | 1,820,000 | | 1,833,384 |
6.11% 1/29/37 | | 1,572,000 | | 1,210,163 |
6.4% 8/28/17 | | 1,989,000 | | 1,926,404 |
Morgan Stanley: | | | | |
4.75% 4/1/14 | | 2,554,000 | | 2,516,178 |
5.5% 7/28/21 | | 8,558,000 | | 7,910,159 |
6.625% 4/1/18 | | 10,165,000 | | 10,034,837 |
| | 68,289,936 |
Commercial Banks - 2.4% |
Bank of America NA 5.3% 3/15/17 | | 6,480,000 | | 5,845,673 |
Credit Suisse New York Branch 6% 2/15/18 | | 6,110,000 | | 6,024,350 |
Discover Bank: | | | | |
7% 4/15/20 | | 2,796,000 | | 2,924,448 |
8.7% 11/18/19 | | 6,339,000 | | 7,225,528 |
Export-Import Bank of Korea 5.5% 10/17/12 | | 6,570,000 | | 6,722,575 |
Fifth Third Bancorp: | | | | |
4.5% 6/1/18 | | 1,179,000 | | 1,181,690 |
8.25% 3/1/38 | | 4,319,000 | | 5,277,524 |
Fifth Third Bank 4.75% 2/1/15 | | 487,000 | | 504,546 |
Fifth Third Capital Trust IV 6.5% 4/15/67 (i) | | 2,412,000 | | 2,363,760 |
HBOS PLC 6.75% 5/21/18 (c) | | 2,600,000 | | 2,084,152 |
Huntington Bancshares, Inc. 7% 12/15/20 | | 1,004,000 | | 1,137,480 |
JPMorgan Chase & Co. 5.4% 1/6/42 | | 4,270,000 | | 4,447,380 |
KeyBank NA: | | | | |
5.45% 3/3/16 | | 1,618,000 | | 1,741,601 |
5.8% 7/1/14 | | 2,049,000 | | 2,187,935 |
6.95% 2/1/28 | | 800,000 | | 885,794 |
KeyCorp. 5.1% 3/24/21 | | 1,855,000 | | 1,925,635 |
Korea Development Bank 5.3% 1/17/13 | | 3,805,000 | | 3,908,542 |
Marshall & Ilsley Bank: | | | | |
4.85% 6/16/15 | | 1,796,000 | | 1,896,070 |
5% 1/17/17 | | 4,625,000 | | 4,878,663 |
5.25% 9/4/12 | | 1,200,000 | | 1,233,034 |
Regions Bank: | | | | |
6.45% 6/26/37 | | 3,952,000 | | 3,270,280 |
7.5% 5/15/18 | | 2,383,000 | | 2,359,170 |
Nonconvertible Bonds - continued |
| Principal Amount | | Value |
FINANCIALS - continued |
Commercial Banks - continued |
Regions Financial Corp.: | | | | |
5.75% 6/15/15 | | $ 814,000 | | $ 777,370 |
7.75% 11/10/14 | | 2,367,000 | | 2,378,835 |
SouthTrust Corp. 5.8% 6/15/14 | | 1,440,000 | | 1,535,057 |
SunTrust Banks, Inc. 3.6% 4/15/16 | | 3,163,000 | | 3,221,636 |
Wachovia Bank NA 4.875% 2/1/15 | | 4,405,000 | | 4,668,014 |
Wachovia Corp. 4.875% 2/15/14 | | 785,000 | | 818,892 |
Wells Fargo & Co.: | | | | |
3.625% 4/15/15 | | 2,350,000 | | 2,460,466 |
3.676% 6/15/16 | | 1,714,000 | | 1,791,493 |
3.75% 10/1/14 | | 3,750,000 | | 3,959,453 |
| | 91,637,046 |
Consumer Finance - 0.5% |
General Electric Capital Corp.: | | | | |
2.25% 11/9/15 | | 2,597,000 | | 2,609,089 |
2.95% 5/9/16 | | 774,000 | | 796,208 |
3.5% 6/29/15 | | 799,000 | | 837,925 |
5.625% 5/1/18 | | 9,700,000 | | 10,861,100 |
6.375% 11/15/67 (i) | | 4,000,000 | | 3,940,000 |
| | 19,044,322 |
Diversified Financial Services - 2.0% |
Bank of America Corp. 5.75% 12/1/17 | | 12,290,000 | | 11,611,002 |
BP Capital Markets PLC: | | | | |
3.125% 10/1/15 | | 3,694,000 | | 3,869,868 |
4.742% 3/11/21 | | 3,000,000 | | 3,396,681 |
Capital One Capital V 10.25% 8/15/39 | | 1,378,000 | | 1,429,675 |
Citigroup, Inc.: | | | | |
3.953% 6/15/16 | | 3,838,000 | | 3,825,542 |
4.75% 5/19/15 | | 10,152,000 | | 10,283,113 |
5.5% 4/11/13 | | 1,390,000 | | 1,419,222 |
6.125% 5/15/18 | | 2,692,000 | | 2,864,495 |
6.5% 8/19/13 | | 8,073,000 | | 8,404,736 |
JPMorgan Chase & Co.: | | | | |
3.15% 7/5/16 | | 4,200,000 | | 4,220,534 |
4.35% 8/15/21 | | 4,371,000 | | 4,412,581 |
6.3% 4/23/19 | | 3,920,000 | | 4,438,616 |
Prime Property Funding, Inc.: | | | | |
5.125% 6/1/15 (c) | | 3,844,000 | | 3,908,891 |
5.35% 4/15/12 (c) | | 1,700,000 | | 1,706,273 |
5.5% 1/15/14 (c) | | 2,405,000 | | 2,457,831 |
TECO Finance, Inc.: | | | | |
4% 3/15/16 | | 1,075,000 | | 1,130,812 |
5.15% 3/15/20 | | 1,545,000 | | 1,716,152 |
ZFS Finance USA Trust II 6.45% 12/15/65 (c)(i) | | 3,716,000 | | 3,381,560 |
|
| Principal Amount | | Value |
ZFS Finance USA Trust IV 5.875% 5/9/62 (c)(i) | | $ 500,000 | | $ 470,000 |
ZFS Finance USA Trust V 6.5% 5/9/67 (c)(i) | | 1,016,000 | | 914,400 |
| | 75,861,984 |
Insurance - 2.1% |
Allstate Corp. 6.2% 5/16/14 | | 2,709,000 | | 3,021,578 |
American International Group, Inc. 4.875% 9/15/16 | | 4,224,000 | | 3,998,033 |
Aon Corp.: | | | | |
3.125% 5/27/16 | | 3,681,000 | | 3,723,556 |
3.5% 9/30/15 | | 1,538,000 | | 1,578,508 |
5% 9/30/20 | | 1,402,000 | | 1,545,983 |
6.25% 9/30/40 | | 1,150,000 | | 1,413,187 |
Axis Capital Holdings Ltd. 5.75% 12/1/14 | | 420,000 | | 441,659 |
Liberty Mutual Group, Inc. 5% 6/1/21 (c) | | 4,093,000 | | 4,009,274 |
Lincoln National Corp. 7% 5/17/66 (i) | | 4,799,000 | | 4,331,098 |
Marsh & McLennan Companies, Inc. 4.8% 7/15/21 | | 2,278,000 | | 2,492,483 |
MetLife, Inc.: | | | | |
4.75% 2/8/21 | | 1,477,000 | | 1,597,215 |
5.875% 2/6/41 | | 1,577,000 | | 1,842,056 |
6.75% 6/1/16 | | 3,234,000 | | 3,726,412 |
Metropolitan Life Global Funding I 5.125% 6/10/14 (c) | | 2,884,000 | | 3,105,855 |
New York Life Global Funding 4.65% 5/9/13 (c) | | 6,045,000 | | 6,338,370 |
New York Life Insurance Co. 6.75% 11/15/39 (c) | | 1,348,000 | | 1,718,155 |
Northwestern Mutual Life Insurance Co. 6.063% 3/30/40 (c) | | 2,214,000 | | 2,652,682 |
Pacific Life Insurance Co. 9.25% 6/15/39 (c) | | 2,297,000 | | 3,054,123 |
Pacific LifeCorp 6% 2/10/20 (c) | | 2,514,000 | | 2,674,800 |
Prudential Financial, Inc.: | | | | |
4.5% 11/16/21 | | 2,700,000 | | 2,726,036 |
5.8% 11/16/41 | | 2,824,000 | | 2,853,104 |
6.2% 11/15/40 | | 1,297,000 | | 1,354,775 |
7.375% 6/15/19 | | 1,250,000 | | 1,477,140 |
8.875% 6/15/38 (i) | | 4,682,000 | | 5,360,890 |
Symetra Financial Corp. 6.125% 4/1/16 (c) | | 6,355,000 | | 6,423,151 |
The Chubb Corp. 5.75% 5/15/18 | | 1,895,000 | | 2,226,204 |
Unum Group 5.625% 9/15/20 | | 2,099,000 | | 2,160,541 |
| | 77,846,868 |
Real Estate Investment Trusts - 0.7% |
AvalonBay Communities, Inc. 5.5% 1/15/12 | | 508,000 | | 508,593 |
Camden Property Trust 5.375% 12/15/13 | | 2,985,000 | | 3,120,203 |
Developers Diversified Realty Corp.: | | | | |
4.75% 4/15/18 | | 2,883,000 | | 2,757,739 |
Nonconvertible Bonds - continued |
| Principal Amount | | Value |
FINANCIALS - continued |
Real Estate Investment Trusts - continued |
Developers Diversified Realty Corp.: - continued | | | | |
5.375% 10/15/12 | | $ 1,764,000 | | $ 1,780,560 |
7.5% 4/1/17 | | 1,944,000 | | 2,099,108 |
Duke Realty LP 4.625% 5/15/13 | | 1,047,000 | | 1,070,764 |
Equity One, Inc.: | | | | |
5.375% 10/15/15 | | 455,000 | | 468,938 |
6% 9/15/17 | | 2,405,000 | | 2,506,662 |
Federal Realty Investment Trust: | | | | |
5.4% 12/1/13 | | 1,401,000 | | 1,476,945 |
5.9% 4/1/20 | | 1,046,000 | | 1,131,755 |
HRPT Properties Trust: | | | | |
5.75% 11/1/15 | | 1,155,000 | | 1,205,834 |
6.25% 6/15/17 | | 4,455,000 | | 4,686,553 |
UDR, Inc. 5.5% 4/1/14 | | 3,685,000 | | 3,891,891 |
United Dominion Realty Trust, Inc. 5.25% 1/15/15 | | 904,000 | | 961,661 |
| | 27,667,206 |
Real Estate Management & Development - 2.4% |
AMB Property LP 5.9% 8/15/13 | | 2,575,000 | | 2,669,276 |
BioMed Realty LP: | | | | |
3.85% 4/15/16 | | 3,700,000 | | 3,650,561 |
6.125% 4/15/20 | | 1,392,000 | | 1,460,616 |
Brandywine Operating Partnership LP: | | | | |
5.7% 5/1/17 | | 5,000,000 | | 5,177,290 |
5.75% 4/1/12 | | 1,376,000 | | 1,384,795 |
Colonial Properties Trust 5.5% 10/1/15 | | 6,290,000 | | 6,422,895 |
Digital Realty Trust LP: | | | | |
4.5% 7/15/15 | | 1,829,000 | | 1,865,876 |
5.25% 3/15/21 | | 1,953,000 | | 1,955,947 |
Duke Realty LP: | | | | |
5.4% 8/15/14 | | 2,242,000 | | 2,347,605 |
5.5% 3/1/16 | | 1,270,000 | | 1,335,632 |
5.95% 2/15/17 | | 928,000 | | 997,936 |
6.25% 5/15/13 | | 2,913,000 | | 3,046,724 |
6.5% 1/15/18 | | 2,445,000 | | 2,701,094 |
ERP Operating LP: | | | | |
4.625% 12/15/21 | | 7,498,000 | | 7,643,146 |
4.75% 7/15/20 | | 2,827,000 | | 2,931,769 |
5.375% 8/1/16 | | 1,066,000 | | 1,159,990 |
5.5% 10/1/12 | | 3,560,000 | | 3,650,616 |
5.75% 6/15/17 | | 5,343,000 | | 5,925,382 |
Liberty Property LP: | | | | |
4.75% 10/1/20 | | 4,185,000 | | 4,251,182 |
5.5% 12/15/16 | | 2,290,000 | | 2,476,571 |
6.625% 10/1/17 | | 2,673,000 | | 3,023,281 |
|
| Principal Amount | | Value |
Post Apartment Homes LP 6.3% 6/1/13 | | $ 2,679,000 | | $ 2,800,198 |
Reckson Operating Partnership LP 6% 3/31/16 | | 3,099,000 | | 3,215,941 |
Regency Centers LP: | | | | |
5.875% 6/15/17 | | 1,827,000 | | 1,990,062 |
6.75% 1/15/12 | | 2,035,000 | | 2,038,103 |
Simon Property Group LP: | | | | |
2.8% 1/30/17 | | 857,000 | | 875,574 |
4.125% 12/1/21 | | 2,399,000 | | 2,507,540 |
4.2% 2/1/15 | | 1,523,000 | | 1,615,260 |
5.1% 6/15/15 | | 2,220,000 | | 2,426,156 |
Tanger Properties LP: | | | | |
6.125% 6/1/20 | | 4,625,000 | | 5,188,057 |
6.15% 11/15/15 | | 349,000 | | 386,352 |
| | 89,121,427 |
Thrifts & Mortgage Finance - 0.2% |
Bank of America Corp.: | | | | |
3.75% 7/12/16 | | 1,850,000 | | 1,713,298 |
6.5% 8/1/16 | | 3,000,000 | | 3,021,801 |
First Niagara Financial Group, Inc. 6.75% 3/19/20 | | 3,095,000 | | 3,258,107 |
| | 7,993,206 |
TOTAL FINANCIALS | | 457,461,995 |
HEALTH CARE - 0.5% |
Biotechnology - 0.1% |
Amgen, Inc. 5.15% 11/15/41 | | 4,000,000 | | 4,138,428 |
Health Care Providers & Services - 0.4% |
Aristotle Holding, Inc. 4.75% 11/15/21 (c) | | 3,953,000 | | 4,088,845 |
Express Scripts, Inc.: | | | | |
3.125% 5/15/16 | | 3,450,000 | | 3,469,827 |
5.25% 6/15/12 | | 3,016,000 | | 3,073,129 |
6.25% 6/15/14 | | 1,108,000 | | 1,207,870 |
Medco Health Solutions, Inc. 4.125% 9/15/20 | | 2,723,000 | | 2,712,427 |
| | 14,552,098 |
TOTAL HEALTH CARE | | 18,690,526 |
INDUSTRIALS - 0.5% |
Airlines - 0.3% |
Continental Airlines, Inc.: | | | | |
6.648% 3/15/19 | | 1,356,055 | | 1,384,804 |
6.795% 2/2/20 | | 2,140,621 | | 2,046,861 |
Northwest Airlines, Inc. pass-thru trust certificates 7.027% 11/1/19 | | 2,770,388 | | 2,822,195 |
Nonconvertible Bonds - continued |
| Principal Amount | | Value |
INDUSTRIALS - continued |
Airlines - continued |
U.S. Airways pass-thru trust certificates: | | | | |
6.85% 1/30/18 | | $ 1,028,020 | | $ 997,046 |
8.36% 1/20/19 | | 4,052,222 | | 4,011,700 |
| | 11,262,606 |
Industrial Conglomerates - 0.2% |
General Electric Co. 5.25% 12/6/17 | | 7,130,000 | | 8,185,654 |
TOTAL INDUSTRIALS | | 19,448,260 |
INFORMATION TECHNOLOGY - 0.0% |
Office Electronics - 0.0% |
Xerox Corp. 4.5% 5/15/21 | | 1,347,000 | | 1,364,617 |
MATERIALS - 0.9% |
Chemicals - 0.5% |
Dow Chemical Co.: | | | | |
4.125% 11/15/21 | | 3,587,000 | | 3,677,805 |
4.25% 11/15/20 | | 1,931,000 | | 2,006,417 |
4.85% 8/15/12 | | 3,520,000 | | 3,601,316 |
5.25% 11/15/41 | | 1,786,000 | | 1,874,927 |
7.6% 5/15/14 | | 7,213,000 | | 8,157,492 |
| | 19,317,957 |
Metals & Mining - 0.4% |
Anglo American Capital PLC 9.375% 4/8/14 (c) | | 2,675,000 | | 3,053,938 |
ArcelorMittal SA 3.75% 3/1/16 | | 996,000 | | 945,669 |
Corporacion Nacional del Cobre de Chile (Codelco) 3.875% 11/3/21 (c) | | 3,750,000 | | 3,792,188 |
Rio Tinto Finance Ltd. (United States) 3.75% 9/20/21 | | 2,525,000 | | 2,644,776 |
Vale Overseas Ltd. 6.25% 1/23/17 | | 3,115,000 | | 3,511,113 |
| | 13,947,684 |
TOTAL MATERIALS | | 33,265,641 |
TELECOMMUNICATION SERVICES - 1.4% |
Diversified Telecommunication Services - 0.9% |
AT&T, Inc.: | | | | |
6.3% 1/15/38 | | 364,000 | | 446,083 |
6.8% 5/15/36 | | 10,939,000 | | 13,826,229 |
CenturyLink, Inc.: | | | | |
6.15% 9/15/19 | | 1,562,000 | | 1,568,660 |
6.45% 6/15/21 | | 4,979,000 | | 4,986,429 |
7.6% 9/15/39 | | 488,000 | | 478,151 |
Embarq Corp. 7.995% 6/1/36 | | 1,808,000 | | 1,870,779 |
Telefonica Emisiones SAU: | | | | |
5.462% 2/16/21 | | 2,456,000 | | 2,342,855 |
5.855% 2/4/13 | | 1,438,000 | | 1,462,232 |
|
| Principal Amount | | Value |
Verizon Communications, Inc.: | | | | |
6.1% 4/15/18 | | $ 2,190,000 | | $ 2,630,286 |
6.25% 4/1/37 | | 1,380,000 | | 1,699,517 |
6.9% 4/15/38 | | 2,420,000 | | 3,228,708 |
| | 34,539,929 |
Wireless Telecommunication Services - 0.5% |
America Movil SAB de CV 2.375% 9/8/16 | | 5,411,000 | | 5,397,115 |
DIRECTV Holdings LLC/DIRECTV Financing, Inc.: | | | | |
4.75% 10/1/14 | | 3,759,000 | | 4,060,867 |
5.875% 10/1/19 | | 4,711,000 | | 5,301,128 |
6.35% 3/15/40 | | 1,471,000 | | 1,670,406 |
Vodafone Group PLC 5% 12/16/13 | | 2,775,000 | | 2,978,013 |
| | 19,407,529 |
TOTAL TELECOMMUNICATION SERVICES | | 53,947,458 |
UTILITIES - 3.0% |
Electric Utilities - 1.6% |
Alabama Power Co. 3.375% 10/1/20 | | 2,167,000 | | 2,292,636 |
Ameren Illinois Co. 6.125% 11/15/17 | | 1,465,000 | | 1,715,185 |
AmerenUE 6.4% 6/15/17 | | 3,819,000 | | 4,565,943 |
Commonwealth Edison Co. 1.625% 1/15/14 | | 4,011,000 | | 4,040,497 |
Duke Energy Carolinas LLC 4.25% 12/15/41 | | 1,749,000 | | 1,825,806 |
Duquesne Light Holdings, Inc.: | | | | |
5.9% 12/1/21 (c) | | 2,580,000 | | 2,662,250 |
6.4% 9/15/20 (c) | | 6,054,000 | | 6,435,493 |
Edison International 3.75% 9/15/17 | | 2,401,000 | | 2,471,340 |
EDP Finance BV: | | | | |
4.9% 10/1/19 (c) | | 1,100,000 | | 839,080 |
6% 2/2/18 (c) | | 1,864,000 | | 1,567,585 |
FirstEnergy Corp. 7.375% 11/15/31 | | 4,457,000 | | 5,473,058 |
FirstEnergy Solutions Corp.: | | | | |
4.8% 2/15/15 | | 990,000 | | 1,056,769 |
6.05% 8/15/21 | | 3,642,000 | | 4,040,016 |
LG&E and KU Energy LLC: | | | | |
2.125% 11/15/15 | | 2,670,000 | | 2,630,108 |
3.75% 11/15/20 | | 525,000 | | 529,801 |
Nevada Power Co. 6.5% 5/15/18 | | 3,165,000 | | 3,796,588 |
Pacific Gas & Electric Co. 3.25% 9/15/21 | | 585,000 | | 593,363 |
Pennsylvania Electric Co. 6.05% 9/1/17 | | 2,905,000 | | 3,324,921 |
Pepco Holdings, Inc. 2.7% 10/1/15 | | 2,535,000 | | 2,568,100 |
Nonconvertible Bonds - continued |
| Principal Amount | | Value |
UTILITIES - continued |
Electric Utilities - continued |
Progress Energy, Inc.: | | | | |
4.4% 1/15/21 | | $ 4,274,000 | | $ 4,709,397 |
5.625% 1/15/16 | | 2,000,000 | | 2,284,980 |
Wisconsin Electric Power Co. 2.95% 9/15/21 | | 679,000 | | 691,751 |
| | 60,114,667 |
Gas Utilities - 0.0% |
Southern Natural Gas Co. / Southern Natural Issuing Corp. 4.4% 6/15/21 | | 1,182,000 | | 1,215,538 |
Independent Power Producers & Energy Traders - 0.3% |
Exelon Generation Co. LLC 6.2% 10/1/17 | | 6,685,000 | | 7,678,632 |
PPL Energy Supply LLC: | | | | |
6.2% 5/15/16 | | 1,229,000 | | 1,370,946 |
6.5% 5/1/18 | | 2,640,000 | | 3,001,009 |
PSEG Power LLC 2.75% 9/15/16 | | 919,000 | | 923,703 |
| | 12,974,290 |
Multi-Utilities - 1.1% |
Consolidated Edison Co. of New York, Inc. 5.7% 6/15/40 | | 1,395,000 | | 1,746,681 |
Dominion Resources, Inc.: | | | | |
2.8793% 9/30/66 (i) | | 9,626,000 | | 8,089,402 |
6.25% 6/30/12 | | 1,938,000 | | 1,989,014 |
MidAmerican Energy Holdings, Co.: | | | | |
5.875% 10/1/12 | | 2,880,000 | | 2,981,477 |
6.5% 9/15/37 | | 1,334,000 | | 1,672,002 |
National Grid PLC 6.3% 8/1/16 | | 4,181,000 | | 4,798,785 |
NiSource Finance Corp.: | | | | |
4.45% 12/1/21 | | 1,622,000 | | 1,656,748 |
5.4% 7/15/14 | | 3,885,000 | | 4,215,656 |
5.45% 9/15/20 | | 613,000 | | 678,757 |
5.8% 2/1/42 | | 2,085,000 | | 2,176,859 |
5.95% 6/15/41 | | 3,834,000 | | 4,107,334 |
6.25% 12/15/40 | | 837,000 | | 911,044 |
6.4% 3/15/18 | | 2,760,000 | | 3,172,769 |
San Diego Gas & Electric Co. 3% 8/15/21 | | 992,000 | | 1,019,749 |
Wisconsin Energy Corp. 6.25% 5/15/67 (i) | | 1,426,000 | | 1,426,713 |
| | 40,642,990 |
TOTAL UTILITIES | | 114,947,485 |
TOTAL NONCONVERTIBLE BONDS (Cost $884,240,171) |
945,554,654
|
U.S. Government and Government Agency Obligations - 28.4% |
| Principal
Amount | | Value |
U.S. Government Agency Obligations - 1.1% |
Fannie Mae Guaranteed Mortgage pass-thru certificates: | | | | |
0.625% 10/30/14 | | $ 619,000 | | $ 619,761 |
0.75% 12/19/14 | | 195,000 | | 195,605 |
0.875% 8/28/14 | | 2,750,000 | | 2,772,484 |
Freddie Mac: | | | | |
0.375% 11/27/13 | | 30,614,000 | | 30,570,344 |
0.625% 12/29/14 | | 97,000 | | 96,929 |
1% 7/30/14 | | 1,456,000 | | 1,471,924 |
1% 8/27/14 | | 1,511,000 | | 1,525,979 |
Tennessee Valley Authority 5.375% 4/1/56 | | 2,375,000 | | 3,207,058 |
U.S. Department of Housing and Urban Development Government guaranteed participation certificates Series 1996-A, 7.63% 8/1/14 | | 200,000 | | 201,140 |
TOTAL U.S. GOVERNMENT AGENCY OBLIGATIONS | | 40,661,224 |
U.S. Treasury Inflation Protected Obligations - 2.7% |
U.S. Treasury Inflation-Indexed Bonds: | | | | |
2.125% 2/15/40 (f) | | 27,385,310 | | 36,736,584 |
2.125% 2/15/41 | | 6,710,660 | | 9,069,246 |
2.5% 1/15/29 | | 8,437,280 | | 11,255,092 |
U.S. Treasury Inflation-Indexed Notes: | | | | |
1.125% 1/15/21 | | 39,940,105 | | 44,543,017 |
1.375% 1/15/20 | | 5,236 | | 5,960 |
TOTAL U.S. TREASURY INFLATION PROTECTED OBLIGATIONS | | 101,609,899 |
U.S. Treasury Obligations - 24.6% |
U.S. Treasury Bonds 4.375% 5/15/41 | | 131,844,000 | | 171,397,200 |
U.S. Treasury Notes: | | | | |
0.5% 8/15/14 | | 20,970,000 | | 21,068,307 |
0.875% 11/30/16 | | 42,223,000 | | 42,358,240 |
1% 9/30/16 | | 9,736,000 | | 9,839,445 |
2% 11/15/21 | | 29,650,000 | | 29,974,312 |
2.125% 8/15/21 | | 17,270,000 | | 17,704,444 |
2.375% 8/31/14 | | 115,000,000 | | 121,154,340 |
2.375% 2/28/15 | | 41,183,000 | | 43,705,459 |
2.625% 7/31/14 (f) | | 245,000,000 | | 259,393,726 |
U.S. Government and Government Agency Obligations - continued |
| Principal Amount | | Value |
U.S. Treasury Obligations - continued |
U.S. Treasury Notes: - continued | | | | |
2.625% 12/31/14 | | $ 55,045,000 | | $ 58,713,254 |
3.125% 5/15/21 | | 143,205,000 | | 159,819,071 |
TOTAL U.S. TREASURY OBLIGATIONS | | 935,127,798 |
TOTAL U.S. GOVERNMENT AND GOVERNMENT AGENCY OBLIGATIONS (Cost $988,545,627) |
1,077,398,921
|
U.S. Government Agency - Mortgage Securities - 38.4% |
|
Fannie Mae Guaranteed Mortgage pass-thru certificates - 24.6% |
1.67% 9/1/33 (i) | | 710,809 | | 736,546 |
1.807% 5/1/34 (i) | | 1,222,299 | | 1,261,003 |
1.946% 7/1/35 (i) | | 45,796 | | 48,100 |
1.96% 10/1/33 (i) | | 48,339 | | 50,451 |
2.05% 3/1/35 (i) | | 19,527 | | 20,615 |
2.11% 10/1/33 (i) | | 1,046,769 | | 1,088,555 |
2.301% 7/1/34 (i) | | 57,800 | | 61,231 |
2.303% 6/1/36 (i) | | 101,216 | | 107,298 |
2.424% 10/1/33 (i) | | 91,062 | | 96,162 |
2.457% 3/1/35 (i) | | 63,743 | | 67,106 |
2.474% 11/1/36 (i) | | 1,319,802 | | 1,405,589 |
2.478% 8/1/36 (i) | | 1,776,301 | | 1,867,453 |
2.5% 7/1/35 (i) | | 118,450 | | 125,814 |
2.537% 2/1/36 (i) | | 1,122,101 | | 1,172,553 |
2.623% 5/1/36 (i) | | 400,730 | | 419,662 |
2.635% 7/1/37 (i) | | 231,692 | | 246,752 |
2.654% 5/1/35 (i) | | 232,880 | | 245,621 |
2.695% 12/1/35 (i) | | 525,216 | | 558,213 |
2.702% 9/1/36 (i) | | 1,126,250 | | 1,199,456 |
3% 1/1/27 (e) | | 9,000,000 | | 9,295,118 |
3.5% 1/1/26 to 3/1/41 | | 13,993,407 | | 14,733,546 |
3.5% 1/1/27 (e) | | 16,400,000 | | 17,149,121 |
3.5% 1/1/27 (e) | | 16,400,000 | | 17,149,121 |
3.791% 6/1/40 (i) | | 1,655,684 | | 1,726,746 |
4% 11/1/26 to 11/1/41 | | 134,830,973 | | 142,033,195 |
4% 9/1/41 | | 265,492 | | 279,363 |
4% 10/1/41 | | 7,495,660 | | 7,900,151 |
4% 10/1/41 | | 249,229 | | 262,679 |
4% 1/1/42 (e) | | 35,400,000 | | 37,185,852 |
4% 1/1/42 (e) | | 37,000,000 | | 38,866,569 |
|
| Principal
Amount | | Value |
4.5% 4/1/18 to 11/1/41 | | $ 207,069,697 | | $ 221,376,725 |
4.5% 1/1/27 (e) | | 9,600,000 | | 10,232,331 |
4.5% 1/1/42 (e) | | 33,600,000 | | 35,762,308 |
5% 2/1/18 to 6/1/40 | | 88,921,077 | | 96,168,712 |
5.5% 11/1/17 to 3/1/39 | | 111,001,841 | | 120,888,839 |
5.5% 1/1/42 (e) | | 13,000,000 | | 14,155,890 |
6% 6/1/14 to 11/1/39 | | 117,210,821 | | 128,901,939 |
6.5% 6/1/13 to 2/1/36 | | 4,816,058 | | 5,244,894 |
7% 3/1/15 to 8/1/32 | | 1,692,442 | | 1,924,724 |
7.5% 7/1/16 to 11/1/31 | | 1,414,926 | | 1,656,045 |
8% 1/1/30 to 5/1/30 | | 46,659 | | 55,621 |
8.5% 3/1/25 to 6/1/25 | | 797 | | 955 |
TOTAL FANNIE MAE GUARANTEED MORTGAGE PASS-THRU CERTIFICATES | | 933,728,624 |
Freddie Mac - 6.9% |
2.081% 4/1/35 (i) | | 862,606 | | 912,457 |
2.125% 3/1/36 (i) | | 182,234 | | 191,980 |
2.499% 1/1/35 (i) | | 193,529 | | 199,835 |
2.906% 3/1/33 (i) | | 17,706 | | 18,857 |
2.91% 11/1/35 (i) | | 382,060 | | 406,622 |
3.135% 10/1/35 (i) | | 144,193 | | 153,588 |
4% 12/1/40 to 10/1/41 | | 7,970,220 | | 8,404,791 |
4% 9/1/41 | | 946,925 | | 997,617 |
4% 1/1/42 (e) | | 37,500,000 | | 39,327,341 |
4.5% 7/1/25 to 10/1/41 | | 79,040,195 | | 84,009,732 |
4.5% 1/1/42 (e) | | 14,000,000 | | 14,841,898 |
5% 7/1/35 to 9/1/40 | | 32,544,777 | | 35,167,744 |
5.5% 1/1/38 to 1/1/40 | | 51,362,744 | | 55,625,322 |
5.5% 1/1/42 (e) | | 13,700,000 | | 14,856,053 |
6% 4/1/32 to 8/1/37 | | 5,762,179 | | 6,366,327 |
7.5% 5/1/17 to 11/1/31 | | 142,603 | | 165,429 |
8% 7/1/17 to 5/1/27 | | 9,327 | | 10,665 |
8.5% 3/1/20 to 1/1/28 | | 127,586 | | 150,476 |
TOTAL FREDDIE MAC | | 261,806,734 |
Ginnie Mae - 6.9% |
3.5% 1/15/41 to 2/15/41 | | 1,717,366 | | 1,797,004 |
3.5% 1/1/42 (e) | | 12,000,000 | | 12,534,901 |
4% 1/15/25 to 12/15/41 (e) | | 52,739,344 | | 56,691,106 |
4% 1/1/42 (e) | | 24,000,000 | | 25,745,122 |
4% 1/1/42 (e) | | 400,000 | | 429,085 |
4.5% 5/15/39 to 4/20/41 | | 63,176,035 | | 69,049,768 |
4.5% 1/1/42 (e) | | 2,800,000 | | 3,051,505 |
5% 3/15/39 to 8/15/41 (e) | | 54,053,331 | | 60,019,423 |
5% 9/15/41 (e) | | 897,543 | | 994,379 |
5% 1/1/42 (e) | | 15,100,000 | | 16,728,295 |
5% 1/1/42 (e) | | 1,700,000 | | 1,883,318 |
6% 3/15/29 to 11/15/34 | | 6,004,460 | | 6,811,239 |
U.S. Government Agency - Mortgage Securities - continued |
| Principal Amount | | Value |
Ginnie Mae - continued |
6.5% 10/15/34 to 11/15/35 | | $ 402,980 | | $ 462,375 |
7% 1/15/28 to 7/15/32 | | 2,858,268 | | 3,276,123 |
7.5% 4/15/22 to 10/15/28 | | 711,717 | | 821,413 |
8% 2/15/17 to 9/15/30 | | 57,771 | | 67,035 |
8.5% 12/15/16 to 3/15/30 | | 11,780 | | 13,463 |
TOTAL GINNIE MAE | | 260,375,554 |
TOTAL U.S. GOVERNMENT AGENCY - MORTGAGE SECURITIES (Cost $1,432,875,930) |
1,455,910,912
|
Asset-Backed Securities - 2.3% |
|
Accredited Mortgage Loan Trust Series 2005-1 Class M1, 0.7636% 4/25/35 (i) | | 451,680 | | 246,481 |
ACE Securities Corp. Home Equity Loan Trust Series 2005-HE2 Class M2, 0.7436% 4/25/35 (i) | | 40,770 | | 39,537 |
Advanta Business Card Master Trust Series 2006-C1 Class C1, 0.6758% 10/20/14 (i) | | 169,000 | | 1,690 |
Airspeed Ltd. Series 2007-1A Class C1, 2.7783% 6/15/32 (c)(i) | | 2,643,255 | | 1,361,277 |
Ally Auto Receivables Trust: | | | | |
Series 2009-A: | | | | |
Class A3, 2.33% 6/17/13 (c) | | 750,851 | | 754,273 |
Class A4, 3% 10/15/15 (c) | | 1,600,000 | | 1,630,343 |
Series 2010-5 Class A4, 1.75% 3/15/16 | | 1,430,000 | | 1,447,664 |
Series 2011-1 Class A4, 2.23% 3/15/16 | | 6,420,000 | | 6,578,167 |
Ally Master Owner Trust: | | | | |
Series 2010-3 Class A, 2.88% 4/15/15 (c) | | 3,400,000 | | 3,456,098 |
Series 2011-1 Class A2, 2.15% 1/15/16 | | 3,150,000 | | 3,183,851 |
Series 2011-3 Class A2, 1.81% 5/15/16 | | 2,760,000 | | 2,773,072 |
AmeriCredit Automobile Receivables Trust Series 2011-1 Class A3, 1.39% 9/8/15 | | 2,660,000 | | 2,671,039 |
Ameriquest Mortgage Securities, Inc. pass-thru certificates: | | | | |
Series 2003-10 Class M1, 0.9936% 12/25/33 (i) | | 29,859 | | 23,355 |
Series 2004-R2 Class M3, 0.8436% 4/25/34 (i) | | 47,022 | | 14,847 |
Series 2005-R2 Class M1, 0.7436% 4/25/35 (i) | | 727,000 | | 643,946 |
|
| Principal Amount | | Value |
Argent Securities, Inc. pass-thru certificates: | | | | |
Series 2003-W7 Class A2, 1.0372% 3/25/34 (i) | | $ 16,878 | | $ 11,273 |
Series 2004-W11 Class M2, 0.9936% 11/25/34 (i) | | 198,000 | | 137,831 |
Series 2004-W7 Class M1, 0.8436% 5/25/34 (i) | | 209,000 | | 149,783 |
Series 2006-W4 Class A2C, 0.4536% 5/25/36 (i) | | 474,181 | | 122,330 |
Asset Backed Securities Corp. Home Equity Loan Trust Series 2004-HE2 Class M1, 1.1186% 4/25/34 (i) | | 902,083 | | 613,577 |
Bank of America Auto Trust Series 2009-1A Class A4, 3.52% 6/15/16 (c) | | 3,100,000 | | 3,154,498 |
BMW Vehicle Lease Trust Series 2010-1 Class A3, 0.82% 4/15/13 | | 5,250,000 | | 5,249,069 |
Brazos Higher Education Authority, Inc. Series 2006-2 Class A9, 0.5838% 12/25/24 (i) | | 493,407 | | 434,198 |
Carmax Auto Owner Trust Series 2011-1 Class A3, 1.29% 9/15/15 | | 2,760,000 | | 2,774,199 |
Carrington Mortgage Loan Trust: | | | | |
Series 2006-FRE1 Class M1, 0.5936% 7/25/36 (i) | | 402,000 | | 14,786 |
Series 2007-RFC1 Class A3, 0.4336% 12/25/36 (i) | | 635,000 | | 196,780 |
Chrysler Financial Auto Securitization Trust Series 2010-A Class A3, 0.91% 8/8/13 | | 6,300,000 | | 6,301,721 |
Citibank Credit Card Issuance Trust Series 2009-A5 Class A5, 2.25% 12/23/14 | | 12,500,000 | | 12,684,690 |
Countrywide Home Loans, Inc.: | | | | |
Series 2003-BC1 Class B1, 5.4035% 3/25/32 (MGIC Investment Corp. Insured) (i) | | 40,946 | | 3,088 |
Series 2004-3 Class M4, 1.2636% 4/25/34 (i) | | 56,336 | | 27,234 |
Series 2004-4 Class M2, 1.0886% 6/25/34 (i) | | 207,174 | | 93,106 |
Series 2005-3 Class MV1, 0.7136% 8/25/35 (i) | | 129,199 | | 126,373 |
Series 2005-AB1 Class A2, 0.5036% 8/25/35 (i) | | 3,230 | | 3,224 |
Fannie Mae subordinate REMIC pass-thru certificates Series 2004-T5 Class AB3, 0.7513% 5/28/35 (i) | | 13,702 | | 8,735 |
Fieldstone Mortgage Investment Corp. Series 2004-3 Class M5, 2.4686% 8/25/34 (i) | | 102,000 | | 59,562 |
First Franklin Mortgage Loan Trust Series 2004-FF2 Class M3, 1.1186% 3/25/34 (i) | | 5,606 | | 687 |
Asset-Backed Securities - continued |
| Principal Amount | | Value |
Ford Credit Auto Lease Trust Series 2010-B Class A3, 0.91% 7/15/13 (c) | | $ 5,190,000 | | $ 5,191,778 |
Ford Credit Auto Owner Trust: | | | | |
Series 2009-D: | | | | |
Class A3, 2.17% 10/15/13 | | 734,023 | | 737,774 |
Class A4, 2.98% 8/15/14 | | 1,800,000 | | 1,839,452 |
Series 2010-B Class A3, 0.98% 10/15/14 | | 3,356,069 | | 3,361,786 |
Ford Credit Floorplan Master Owner Trust Series 2010-5 Class A1, 1.5% 9/15/15 | | 3,580,000 | | 3,585,844 |
Fremont Home Loan Trust Series 2005-A: | | | | |
Class M3, 0.7836% 1/25/35 (i) | | 334,000 | | 99,705 |
Class M4, 0.9736% 1/25/35 (i) | | 128,000 | | 29,336 |
GCO Education Loan Funding Master Trust II Series 2007-1A Class C1L, 0.8861% 2/25/47 (c)(i) | | 829,000 | | 414,500 |
GE Business Loan Trust Series 2003-1 Class A, 0.7083% 4/15/31 (c)(i) | | 80,277 | | 76,389 |
GSAMP Trust: | | | | |
Series 2004-AR1: | | | | |
Class B4, 4.8751% 6/25/34 (c)(i) | | 140,338 | | 40,015 |
Class M1, 0.9436% 6/25/34 (i) | | 772,000 | | 476,478 |
Series 2007-HE1 Class M1, 0.5436% 3/25/47 (i) | | 289,000 | | 11,060 |
Guggenheim Structured Real Estate Funding Ltd. Series 2006-3 Class C, 0.8436% 9/25/46 (c)(i) | | 538,000 | | 70,908 |
Home Equity Asset Trust: | | | | |
Series 2003-3 Class M1, 1.5836% 8/25/33 (i) | | 248,220 | | 194,766 |
Series 2003-5 Class A2, 0.9936% 12/25/33 (i) | | 11,595 | | 7,955 |
Series 2005-5 Class 2A2, 0.5436% 11/25/35 (i) | | 7,010 | | 6,970 |
Series 2006-1 Class 2A3, 0.5186% 4/25/36 (i) | | 154,916 | | 153,170 |
HSBC Home Equity Loan Trust Series 2006-2 Class M2, 0.5749% 3/20/36 (i) | | 220,749 | | 178,905 |
HSI Asset Securitization Corp. Trust Series 2007-HE1 Class 2A3, 0.4836% 1/25/37 (i) | | 436,000 | | 144,643 |
Hyundai Auto Receivables Trust Series 2009-A Class A3, 2.03% 8/15/13 | | 815,069 | | 818,285 |
JPMorgan Mortgage Acquisition Trust Series 2007-CH1: | | | | |
Class AV4, 0.4236% 11/25/36 (i) | | 438,000 | | 365,669 |
Class MV1, 0.5236% 11/25/36 (i) | | 356,000 | | 173,532 |
|
| Principal Amount | | Value |
Keycorp Student Loan Trust Series 1999-A Class A2, 0.9038% 12/27/29 (i) | | $ 209,085 | | $ 182,963 |
Long Beach Mortgage Loan Trust Series 2004-2 Class M2, 1.3736% 6/25/34 (i) | | 30,272 | | 19,005 |
MASTR Asset Backed Securities Trust: | | | | |
Series 2006-AM3 Class M1, 0.5536% 10/25/36 (i) | | 158,000 | | 4,359 |
Series 2007-HE1 Class M1, 0.5936% 5/25/37 (i) | | 249,000 | | 6,087 |
Merrill Lynch Mortgage Investors Trust: | | | | |
Series 2003-OPT1 Class M1, 1.2686% 7/25/34 (i) | | 30,884 | | 20,866 |
Series 2006-FM1 Class A2B, 0.4036% 4/25/37 (i) | | 497,020 | | 359,253 |
Series 2006-OPT1 Class A1A, 0.5536% 6/25/35 (i) | | 516,281 | | 368,015 |
Morgan Stanley ABS Capital I Trust: | | | | |
Series 2004-HE6 Class A2, 0.6336% 8/25/34 (i) | | 20,187 | | 14,709 |
Series 2004-NC8 Class M6, 1.5436% 9/25/34 (i) | | 100,003 | | 56,961 |
Series 2005-NC1 Class M1, 0.7336% 1/25/35 (i) | | 141,000 | | 89,004 |
New Century Home Equity Loan Trust: | | | | |
Series 2005-4 Class M2, 0.8036% 9/25/35 (i) | | 503,000 | | 217,110 |
Series 2005-D Class M2, 0.7636% 2/25/36 (i) | | 105,000 | | 9,826 |
Nissan Auto Receivables Owner Trust Series 2010-A Class A4, 1.31% 9/15/16 | | 2,140,000 | | 2,153,964 |
Ocala Funding LLC Series 2006-1A Class A, 1.6849% 3/20/11 (b)(c)(i) | | 414,000 | | 0 |
Park Place Securities, Inc.: | | | | |
Series 2004-WCW1: | | | | |
Class M3, 1.5436% 9/25/34 (i) | | 188,000 | | 64,733 |
Class M4, 1.7436% 9/25/34 (i) | | 241,000 | | 54,083 |
Series 2005-WCH1: | | | | |
Class M2, 0.8136% 1/25/36 (i) | | 1,972,000 | | 1,693,847 |
Class M3, 0.8536% 1/25/36 (i) | | 168,000 | | 104,532 |
Class M4, 1.1236% 1/25/36 (i) | | 520,000 | | 192,007 |
Series 2005-WHQ2 Class M7, 1.5436% 5/25/35 (i) | | 736,833 | | 4,780 |
Salomon Brothers Mortgage Securities VII, Inc. Series 2003-HE1 Class A, 1.0936% 4/25/33 (i) | | 1,796 | | 1,454 |
Asset-Backed Securities - continued |
| Principal Amount | | Value |
Saxon Asset Securities Trust Series 2004-1 Class M1, 1.0886% 3/25/35 (i) | | $ 481,647 | | $ 299,405 |
Sierra Receivables Funding Co. Series 2007-1A Class A2, 0.4048% 3/20/19 (FGIC Insured) (c)(i) | | 164,772 | | 157,716 |
SLM Private Credit Student Loan Trust Series 2004-A Class C, 1.4963% 6/15/33 (i) | | 448,000 | | 215,954 |
Structured Asset Investment Loan Trust Series 2004-8 Class M5, 2.0186% 9/25/34 (i) | | 23,321 | | 9,003 |
Terwin Mortgage Trust Series 2003-4HE Class A1, 1.1536% 9/25/34 (i) | | 10,148 | | 7,220 |
Volkswagen Auto Lease Trust Series 2010-A Class A3, 0.99% 11/20/13 | | 5,630,000 | | 5,638,092 |
Whinstone Capital Management Ltd. Series 1A Class B3, 2.2183% 10/25/44 (c)(i) | | 630,180 | | 277,279 |
TOTAL ASSET-BACKED SECURITIES (Cost $91,083,708) |
87,193,531
|
Collateralized Mortgage Obligations - 1.1% |
|
Private Sponsor - 0.9% |
Banc of America Mortgage Securities, Inc.: | | | | |
Series 2004-B Class 1A1, 2.7465% 3/25/34 (i) | | 19,735 | | 16,388 |
Series 2005-E Class 2A7, 2.8416% 6/25/35 (i) | | 2,680,000 | | 1,718,651 |
Bear Stearns ALT-A Trust floater Series 2005-1 Class A1, 0.8536% 1/25/35 (i) | | 687,769 | | 485,652 |
Chase Mortgage Finance Trust: | | | | |
Series 2007-A1 Class 1A5, 2.7533% 2/25/37 (i) | | 350,631 | | 312,058 |
Series 2007-A2 Class 2A1, 2.7671% 7/25/37 (i) | | 187,958 | | 184,925 |
Citigroup Mortgage Loan Trust Series 2004-UST1 Class A4, 2.2695% 8/25/34 (i) | | 2,069,311 | | 2,031,674 |
Credit Suisse First Boston Mortgage Securities Corp. floater Series 2007-AR7 Class 2A1, 2.7759% 11/25/34 (i) | | 692,952 | | 590,972 |
Granite Master Issuer PLC floater: | | | | |
Series 2006-1A Class C2, 1.4849% 12/20/54 (c)(i) | | 2,117,000 | | 1,084,963 |
Series 2006-2 Class C1, 1.2249% 12/20/54 (i) | | 1,885,000 | | 966,063 |
Series 2006-3 Class C2, 0.7849% 12/20/54 (i) | | 396,000 | | 202,950 |
|
| Principal Amount | | Value |
Series 2006-4: | | | | |
Class B1, 0.4649% 12/20/54 (i) | | $ 1,059,000 | | $ 868,380 |
Class C1, 1.0449% 12/20/54 (i) | | 647,000 | | 331,588 |
Class M1, 0.6249% 12/20/54 (i) | | 279,000 | | 202,275 |
Series 2007-1: | | | | |
Class 1C1, 0.8849% 12/20/54 (i) | | 654,000 | | 335,175 |
Class 1M1, 0.5849% 12/20/54 (i) | | 425,000 | | 308,125 |
Class 2C1, 1.2449% 12/20/54 (i) | | 298,000 | | 152,725 |
Class 2M1, 0.7849% 12/20/54 (i) | | 546,000 | | 395,850 |
Series 2007-2 Class 2C1, 0.7146% 12/17/54 (i) | | 757,000 | | 387,963 |
Granite Mortgages PLC floater Series 2003-3 Class 1C, 2.8592% 1/20/44 (i) | | 151,584 | | 97,105 |
JPMorgan Chase Commercial Mortgage Securities Trust Series 2007-CB18 Class A3, 5.447% 6/12/47 (i) | | 6,099,246 | | 6,407,167 |
JPMorgan Mortgage Trust: | | | | |
Series 2004-A5 Class 2A1, 2.3733% 12/25/34 (i) | | 632,979 | | 555,477 |
Series 2006-A2 Class 5A1, 2.6481% 11/25/33 (i) | | 775,425 | | 691,159 |
Series 2007-A1 Class 1A1, 2.8092% 7/25/35 (i) | | 1,926,149 | | 1,637,354 |
MASTR Adjustable Rate Mortgages Trust Series 2007-3 Class 22A2, 0.5036% 5/25/47 (i) | | 299,074 | | 184,604 |
Merrill Lynch Alternative Note Asset Trust floater Series 2007-OAR1 Class A1, 0.4636% 2/25/37 (i) | | 444,647 | | 290,037 |
Merrill Lynch Floating Trust floater Series 2006-1: | | | | |
Class C, 0.468% 6/15/22 (c)(i) | | 449,000 | | 438,898 |
Class D, 0.478% 6/15/22 (c)(i) | | 173,000 | | 168,675 |
Class E, 0.488% 6/15/22 (c)(i) | | 276,000 | | 268,410 |
Class F, 0.518% 6/15/22 (c)(i) | | 498,000 | | 483,060 |
Class G, 0.588% 6/15/22 (c)(i) | | 103,000 | | 99,653 |
Class H, 0.608% 6/15/22 (c)(i) | | 207,000 | | 199,755 |
Class J, 0.648% 6/15/22 (c)(i) | | 242,000 | | 232,925 |
Opteum Mortgage Acceptance Corp. floater Series 2005-3 Class APT, 0.5836% 7/25/35 (i) | | 717,264 | | 542,379 |
Option One Mortgage Loan Trust floater Series 2007-CP1 Class M1, 0.5936% 3/25/37 (i) | | 861,000 | | 33,064 |
Provident Funding Mortgage Loan Trust Series 2005-2 Class 3A, 2.6531% 10/25/35 (i) | | 1,395,452 | | 1,029,802 |
Collateralized Mortgage Obligations - continued |
| Principal Amount | | Value |
Private Sponsor - continued |
RESI Finance LP/RESI Finance DE Corp. floater Series 2003-B Class B5, 2.6263% 7/10/35 (c)(i) | | $ 239,380 | | $ 154,664 |
Residential Asset Mortgage Products, Inc. sequential payer Series 2003-SL1 Class A31, 7.125% 4/25/31 | | 47,660 | | 50,490 |
Residential Funding Securities Corp. floater Series 2003-RP2 Class A1, 0.7436% 6/25/33 (c)(i) | | 63,908 | | 58,966 |
Sequoia Mortgage Trust floater Series 2004-6 Class A3B, 1.275% 7/20/34 (i) | | 12,620 | | 8,401 |
TBW Mortgage-Backed pass-thru certificates floater Series 2006-4 Class A3, 0.4572% 9/25/36 (i) | | 1,153,000 | | 854,259 |
Wells Fargo Mortgage Backed Securities Trust: | | | | |
Series 2004-H Class A1, 2.7436% 6/25/34 (i) | | 557,916 | | 518,230 |
Series 2005-AR10 Class 2A2, 2.703% 6/25/35 (i) | | 2,340,823 | | 2,050,893 |
Series 2005-AR12: | | | | |
Class 2A5, 2.705% 7/25/35 (i) | | 3,269,322 | | 2,823,907 |
Class 2A6, 2.705% 7/25/35 (i) | | 3,063,115 | | 2,611,048 |
Series 2005-AR3 Class 2A1, 2.6974% 3/25/35 (i) | | 632,268 | | 535,613 |
TOTAL PRIVATE SPONSOR | | 33,602,372 |
U.S. Government Agency - 0.2% |
Fannie Mae Guaranteed Mortgage pass-thru certificates planned amortization class: | | | | |
Series 1999-54 Class PH, 6.5% 11/18/29 | | 1,417,148 | | 1,559,138 |
Series 1999-57 Class PH, 6.5% 12/25/29 | | 1,047,268 | | 1,169,405 |
Fannie Mae subordinate REMIC pass-thru certificates: | | | | |
planned amortization class Series 2002-9 Class PC, 6% 3/25/17 | | 139,075 | | 149,825 |
sequential payer Series 2004-86 Class KC, 4.5% 5/25/19 | | 253,109 | | 262,351 |
|
| Principal Amount | | Value |
Freddie Mac Multi-class participation certificates guaranteed planned amortization class Series 2500 Class TE, 5.5% 9/15/17 | | $ 3,376,173 | | $ 3,615,772 |
Ginnie Mae guaranteed REMIC pass-thru certificates Series 2007-35 Class SC, 38.5047% 6/16/37 (i)(k) | | 124,008 | | 240,020 |
TOTAL U.S. GOVERNMENT AGENCY | | 6,996,511 |
TOTAL COLLATERALIZED MORTGAGE OBLIGATIONS (Cost $42,805,544) |
40,598,883
|
Commercial Mortgage Securities - 6.3% |
|
Asset Securitization Corp. Series 1997-D5: | | | | |
Class A2, 7.08% 2/14/43 (i) | | 1,435,000 | | 1,461,027 |
Class A3, 7.13% 2/14/43 (i) | | 1,545,000 | | 1,581,749 |
Banc of America Commercial Mortgage Trust: | | | | |
sequential payer: | | | | |
Series 2006-2 Class AAB, 5.9029% 5/10/45 (i) | | 1,839,138 | | 1,948,097 |
Series 2006-5: | | | | |
Class A2, 5.317% 9/10/47 | | 7,446,514 | | 7,526,229 |
Class A3, 5.39% 9/10/47 | | 1,985,000 | | 2,075,161 |
Series 2007-2: | | | | |
Class B, 5.6425% 4/10/49 (i) | | 485,000 | | 130,913 |
Class C, 5.8173% 4/10/49 (i) | | 1,290,000 | | 301,888 |
Class D, 5.8173% 4/10/49 (i) | | 650,000 | | 117,033 |
Series 2007-3 Class A3, 5.8009% 6/10/49 (i) | | 6,100,000 | | 6,361,251 |
Banc of America Commercial Mortgage, Inc.: | | | | |
sequential payer: | | | | |
Series 2005-1 Class A3, 4.877% 11/10/42 | | 579,891 | | 579,495 |
Series 2007-1 Class A2, 5.381% 1/15/49 | | 739,242 | | 738,299 |
Series 2001-3 Class H, 6.562% 4/11/37 (c) | | 4,889,139 | | 4,887,183 |
Banc of America Large Loan, Inc. floater: | | | | |
Series 2005-MIB1: | | | | |
Class F, 0.7483% 3/15/22 (c)(i) | | 217,000 | | 206,150 |
Class G, 0.8083% 3/15/22 (c)(i) | | 141,000 | | 131,130 |
Series 2006-BIX1: | | | | |
Class F, 0.5883% 10/15/19 (c)(i) | | 558,000 | | 518,940 |
Class G, 0.6083% 10/15/19 (c)(i) | | 380,000 | | 336,300 |
Commercial Mortgage Securities - continued |
| Principal Amount | | Value |
Bayview Commercial Asset Trust: | | | | |
floater: | | | | |
Series 2004-1: | | | | |
Class A, 0.6536% 4/25/34 (c)(i) | | $ 440,694 | | $ 342,134 |
Class B, 2.1936% 4/25/34 (c)(i) | | 34,632 | | 19,796 |
Class M1, 0.8536% 4/25/34 (c)(i) | | 28,219 | | 20,037 |
Class M2, 1.4936% 4/25/34 (c)(i) | | 25,287 | | 17,504 |
Series 2004-2: | | | | |
Class A, 0.7236% 8/25/34 (c)(i) | | 344,887 | | 267,927 |
Class M1, 0.8736% 8/25/34 (c)(i) | | 55,701 | | 40,534 |
Series 2004-3: | | | | |
Class A1, 0.6636% 1/25/35 (c)(i) | | 700,939 | | 526,847 |
Class A2, 0.7136% 1/25/35 (c)(i) | | 91,240 | | 64,005 |
Class M1, 0.7936% 1/25/35 (c)(i) | | 93,387 | | 62,078 |
Class M2, 1.2936% 1/25/35 (c)(i) | | 60,379 | | 36,184 |
Series 2005-2A: | | | | |
Class A1, 0.6036% 8/25/35 (c)(i) | | 389,654 | | 298,094 |
Class M1, 0.7236% 8/25/35 (c)(i) | | 28,891 | | 16,671 |
Class M2, 0.7736% 8/25/35 (c)(i) | | 47,519 | | 25,541 |
Class M3, 0.7936% 8/25/35 (c)(i) | | 26,230 | | 13,901 |
Series 2005-3A: | | | | |
Class A1, 0.6136% 11/25/35 (c)(i) | | 215,488 | | 161,256 |
Class A2, 0.6936% 11/25/35 (c)(i) | | 139,629 | | 105,023 |
Series 2005-4A: | | | | |
Class A2, 0.6836% 1/25/36 (c)(i) | | 746,466 | | 515,252 |
Class M1, 0.7436% 1/25/36 (c)(i) | | 156,186 | | 87,278 |
Class M2, 0.7636% 1/25/36 (c)(i) | | 47,118 | | 24,162 |
Class M3, 0.7936% 1/25/36 (c)(i) | | 68,495 | | 32,335 |
Series 2006-1 Class A2, 0.6536% 4/25/36 (c)(i) | | 74,942 | | 54,883 |
Series 2006-2A: | | | | |
Class A1, 0.5236% 7/25/36 (c)(i) | | 730,432 | | 538,727 |
Class A2, 0.5736% 7/25/36 (c)(i) | | 65,932 | | 42,550 |
Class M1, 0.6036% 7/25/36 (c)(i) | | 69,229 | | 39,110 |
|
| Principal Amount | | Value |
Class M2, 0.6236% 7/25/36 (c)(i) | | $ 48,978 | | $ 25,269 |
Class M6, 0.8336% 7/25/36 (c)(i) | | 49,920 | | 15,163 |
Series 2006-3A: | | | | |
Class M5, 0.7736% 10/25/36 (c)(i) | | 64,655 | | 6,789 |
Class M6, 0.8536% 10/25/36 (c)(i) | | 126,260 | | 9,469 |
Series 2006-4A: | | | | |
Class A1, 0.5236% 12/25/36 (c)(i) | | 461,734 | | 281,658 |
Class A2, 0.5636% 12/25/36 (c)(i) | | 1,029,059 | | 607,145 |
Class M1, 0.5836% 12/25/36 (c)(i) | | 74,570 | | 30,596 |
Series 2007-1: | | | | |
Class A2, 0.5636% 3/25/37 (c)(i) | | 198,139 | | 85,200 |
Class B3, 3.6436% 3/25/37 (c)(i) | | 22,055 | | 441 |
Series 2007-2A: | | | | |
Class A1, 0.5636% 7/25/37 (c)(i) | | 186,365 | | 106,469 |
Class A2, 0.6136% 7/25/37 (c)(i) | | 174,438 | | 68,127 |
Class B1, 1.8936% 7/25/37 (c)(i) | | 164,001 | | 7,471 |
Class B2, 2.5436% 7/25/37 (c)(i) | | 97,204 | | 3,195 |
Class M2, 0.7036% 7/25/37 (c)(i) | | 96,910 | | 12,231 |
Class M3, 0.7836% 7/25/37 (c)(i) | | 96,910 | | 10,247 |
Class M4, 0.9436% 7/25/37 (c)(i) | | 205,001 | | 18,107 |
Class M5, 1.0436% 7/25/37 (c)(i) | | 182,638 | | 13,656 |
Class M6, 1.2936% 7/25/37 (c)(i) | | 227,365 | | 13,791 |
Series 2007-3: | | | | |
Class A2, 0.5836% 7/25/37 (c)(i) | | 286,301 | | 99,722 |
Class B1, 1.2436% 7/25/37 (c)(i) | | 132,324 | | 12,783 |
Class B2, 1.8936% 7/25/37 (c)(i) | | 462,532 | | 31,421 |
Class B3, 4.2936% 7/25/37 (c)(i) | | 90,466 | | 3,000 |
Class M1, 0.6036% 7/25/37 (c)(i) | | 117,287 | | 35,171 |
Class M2, 0.6336% 7/25/37 (c)(i) | | 123,302 | | 31,385 |
Class M3, 0.6636% 7/25/37 (c)(i) | | 269,459 | | 58,767 |
Class M4, 0.7936% 7/25/37 (c)(i) | | 425,842 | | 79,113 |
Commercial Mortgage Securities - continued |
| Principal Amount | | Value |
Bayview Commercial Asset Trust: - continued | | | | |
floater: | | | | |
Series 2007-3: | | | | |
Class M5, 0.8936% 7/25/37 (c)(i) | | $ 159,390 | | $ 25,882 |
Class M6, 1.0936% 7/25/37 (c)(i) | | 120,294 | | 14,658 |
Series 2007-4A: | | | | |
Class B1, 2.8436% 9/25/37 (c)(i) | | 233,022 | | 3,495 |
Class B2, 3.7436% 9/25/37 (c)(i) | | 24,948 | | 249 |
Class M4, 1.8936% 9/25/37 (c)(i) | | 750,491 | | 30,020 |
Class M5, 2.0436% 9/25/37 (c)(i) | | 750,491 | | 22,515 |
Class M6, 2.2436% 9/25/37 (c)(i) | | 750,491 | | 15,010 |
Series 2004-1, Class IO, 1.25% 4/25/34 (c)(j) | | 1,258,218 | | 44,667 |
Bear Stearns Commercial Mortgage Securities Trust: | | | | |
floater: | | | | |
Series 2006-BBA7: | | | | |
Class H, 0.9283% 3/15/19 (c)(i) | | 148,890 | | 142,357 |
Class J, 1.1283% 3/15/19 (c)(i) | | 143,000 | | 122,396 |
Series 2007-BBA8: | | | | |
Class D, 0.5283% 3/15/22 (c)(i) | | 147,000 | | 133,266 |
Class E, 0.5783% 3/15/22 (c)(i) | | 763,000 | | 686,374 |
Class F, 0.6283% 3/15/22 (c)(i) | | 468,000 | | 412,108 |
Class G, 0.6783% 3/15/22 (c)(i) | | 120,000 | | 104,313 |
Class H, 0.8283% 3/15/22 (c)(i) | | 147,000 | | 124,843 |
Class J, 0.9783% 3/15/22 (c)(i) | | 147,000 | | 114,553 |
Series 2006-PW13 Class A3, 5.518% 9/11/41 | | 2,010,000 | | 2,108,798 |
Series 2007-PW16: | | | | |
Class B, 5.9043% 6/11/40 (c)(i) | | 1,405,000 | | 665,849 |
Class C, 5.9043% 6/11/40 (c)(i) | | 1,170,000 | | 413,009 |
Class D, 5.9043% 6/11/40 (c)(i) | | 1,170,000 | | 321,942 |
C-BASS Trust floater Series 2006-SC1 Class A, 0.5636% 5/25/36 (c)(i) | | 268,604 | | 212,261 |
|
| Principal Amount | | Value |
Citigroup Commercial Mortgage Trust: | | | | |
floater Series 2006-FL2: | | | | |
Class G, 0.6063% 8/15/21 (c)(i) | | $ 156,000 | | $ 151,224 |
Class H, 0.6463% 8/15/21 (c)(i) | | 125,000 | | 115,406 |
sequential payer Series 2006-C5 Class A4, 5.431% 10/15/49 | | 3,810,000 | | 4,231,893 |
Series 2007-C6 Class A1, 5.622% 12/10/49 (i) | | 3,050,935 | | 3,050,069 |
Series 2007-FL3A Class A2, 0.4183% 4/15/22 (c)(i) | | 2,595,000 | | 2,445,393 |
Series 2008-C7 Class A2B, 6.2744% 12/10/49 (i) | | 6,933,340 | | 7,167,347 |
Citigroup/Deutsche Bank Commercial Mortgage Trust: | | | | |
sequential payer Series 2007-CD4 Class A4, 5.322% 12/11/49 | | 2,960,000 | | 3,139,533 |
Series 2007-CD4 Class A3, 5.293% 12/11/49 | | 6,065,000 | | 6,451,025 |
COMM pass-thru certificates: | | | | |
floater: | | | | |
Series 2005-F10A: | | | | |
Class G, 0.8283% 4/15/17 (c)(i) | | 28,059 | | 25,552 |
Class H, 0.8983% 4/15/17 (c)(i) | | 60,000 | | 50,439 |
Class J, 1.1283% 4/15/17 (c)(i) | | 46,000 | | 33,120 |
Series 2005-FL11: | | | | |
Class F, 0.7283% 11/15/17 (c)(i) | | 65,513 | | 57,652 |
Class G, 0.7783% 11/15/17 (c)(i) | | 45,227 | | 39,348 |
sequential payer Series 2006-CN2A: | | | | |
Class A2FX, 5.449% 2/5/19 (c) | | 2,775,000 | | 2,694,758 |
Class AJFX, 5.478% 2/5/19 (c) | | 2,110,000 | | 2,094,076 |
Credit Suisse Commercial Mortgage Trust: | | | | |
sequential payer: | | | | |
Series 2007-C2 Class A2, 5.448% 1/15/49 (i) | | 3,784,098 | | 3,820,648 |
Series 2007-C3 Class A4, 5.9037% 6/15/39 (i) | | 3,750,000 | | 3,936,825 |
Series 2006-C4 Class AAB, 5.439% 9/15/39 | | 3,385,979 | | 3,468,620 |
Series 2007-C5 Class A4, 5.695% 9/15/40 (i) | | 2,750,000 | | 2,869,177 |
Commercial Mortgage Securities - continued |
| Principal Amount | | Value |
Credit Suisse First Boston Mortgage Securities Corp.: | | | | |
sequential payer Series 2004-C1: | | | | |
Class A3, 4.321% 1/15/37 | | $ 291,128 | | $ 292,546 |
Class A4, 4.75% 1/15/37 | | 3,035,000 | | 3,179,257 |
Series 2001-CKN5 Class AX, 1.9234% 9/15/34 (c)(i)(j) | | 4,518,716 | | 6,615 |
Series 2002-CP3 Class G, 6.639% 7/15/35 (c) | | 250,000 | | 244,560 |
Series 2006-C1 Class A3, 5.5807% 2/15/39 (i) | | 2,735,265 | | 2,892,947 |
Credit Suisse Mortgage Capital Certificates floater Series 2007-TFL1: | | | | |
Class B, 0.4283% 2/15/22 (c)(i) | | 3,470,000 | | 3,018,900 |
Class C: | | | | |
0.4483% 2/15/22 (c)(i) | | 657,000 | | 565,020 |
0.5483% 2/15/22 (c)(i) | | 234,000 | | 198,900 |
Class F, 0.5983% 2/15/22 (c)(i) | | 469,000 | | 393,960 |
GE Capital Commercial Mortgage Corp. sequential payer Series 2007-C1 Class A4, 5.543% 12/10/49 | | 4,470,000 | | 4,704,903 |
Greenwich Capital Commercial Funding Corp.: | | | | |
floater Series 2006-FL4 Class B, 0.4614% 11/5/21 (c)(i) | | 3,490,000 | | 3,363,557 |
sequential payer Series 2007-GG11 Class A2, 5.597% 12/10/49 | | 13,805,000 | | 14,163,695 |
Series 2006-GG7 Class A3, 6.0734% 7/10/38 (i) | | 3,460,000 | | 3,458,588 |
GS Mortgage Securities Corp. II: | | | | |
floater: | | | | |
Series 2006-FL8A: | | | | |
Class E, 0.6403% 6/6/20 (c)(i) | | 1,821,615 | | 1,717,570 |
Class F, 0.7103% 6/6/20 (c)(i) | | 294,000 | | 274,356 |
Series 2007-EOP: | | | | |
Class C, 2.1455% 3/6/20 (c)(i) | | 1,335,000 | | 1,293,235 |
Class D, 2.3636% 3/6/20 (c)(i) | | 400,000 | | 385,486 |
Class E, 2.6688% 3/6/20 (c)(i) | | 670,000 | | 649,039 |
Class F, 2.8433% 3/6/20 (c)(i) | | 335,000 | | 322,845 |
Class G, 3.0177% 3/6/20 (c)(i) | | 165,000 | | 159,029 |
Class H, 3.5846% 3/6/20 (c)(i) | | 275,000 | | 266,424 |
Class J, 4.4568% 3/6/20 (c)(i) | | 395,000 | | 385,644 |
|
| Principal Amount | | Value |
sequential payer Series 2004-GG2 Class A4, 4.964% 8/10/38 | | $ 2,251,930 | | $ 2,271,362 |
Series 2006-GG6 Class A2, 5.506% 4/10/38 | | 1,649,479 | | 1,660,382 |
GS Mortgage Securities Trust sequential payer Series 2007-GG10 Class A2, 5.778% 8/10/45 | | 4,824,843 | | 4,904,077 |
JPMorgan Chase Commercial Mortgage Securities Trust: | | | | |
floater Series 2006-FLA2: | | | | |
Class E, 0.5583% 11/15/18 (c)(i) | | 75,668 | | 65,074 |
Class F, 0.6083% 11/15/18 (c)(i) | | 113,502 | | 96,477 |
Class G, 0.6383% 11/15/18 (c)(i) | | 98,884 | | 81,085 |
Class H, 0.7783% 11/15/18 (c)(i) | | 75,685 | | 59,034 |
sequential payer: | | | | |
Series 2006-CB14 Class A3B, 5.6772% 12/12/44 (i) | | 3,821,435 | | 3,918,258 |
Series 2006-LDP9 Class A2, 5.134% 5/15/47 (i) | | 4,188,269 | | 4,319,939 |
Series 2007-LDPX Class A3, 5.42% 1/15/49 | | 3,796,000 | | 4,103,670 |
Series 2005-LDP3 Class A3, 4.959% 8/15/42 | | 3,832,500 | | 3,929,623 |
Series 2007-CB19: | | | | |
Class B, 5.9313% 2/12/49 (i) | | 755,000 | | 257,127 |
Class C, 5.9313% 2/12/49 (i) | | 1,971,000 | | 572,534 |
Class D, 5.9313% 2/12/49 (i) | | 2,075,000 | | 449,267 |
Series 2007-LDP10: | | | | |
Class BS, 5.437% 1/15/49 (i) | | 1,725,000 | | 345,582 |
Class CS, 5.466% 1/15/49 (i) | | 745,000 | | 89,786 |
Class ES, 5.7317% 1/15/49 (c)(i) | | 4,663,000 | | 244,168 |
LB Commercial Conduit Mortgage Trust sequential payer Series 2007-C3 Class A4, 6.1415% 7/15/44 (i) | | 3,733,000 | | 4,063,091 |
LB-UBS Commercial Mortgage Trust: | | | | |
sequential payer: | | | | |
Series 2006-C1 Class A2, 5.084% 2/15/31 | | 422,321 | | 426,678 |
Series 2006-C6 Class A2, 5.262% 9/15/39 (i) | | 238,446 | | 238,623 |
Series 2007-C1: | | | | |
Class A3, 5.398% 2/15/40 | | 5,000,000 | | 5,173,090 |
Class A4, 5.424% 2/15/40 | | 8,620,000 | | 9,392,447 |
Series 2007-C2 Class A3, 5.43% 2/15/40 | | 1,165,000 | | 1,242,658 |
Series 2001-C3 Class B, 6.512% 6/15/36 | | 191,287 | | 192,505 |
Commercial Mortgage Securities - continued |
| Principal Amount | | Value |
Lehman Brothers Floating Rate Commercial Mortgage Trust floater Series 2006-LLFA: | | | | |
Class F, 0.6183% 9/15/21 (c)(i) | | $ 402,971 | | $ 333,523 |
Class G, 0.6383% 9/15/21 (c)(i) | | 795,609 | | 634,627 |
Class H, 0.6783% 9/15/21 (c)(i) | | 204,773 | | 155,149 |
Merrill Lynch Mortgage Trust: | | | | |
sequential payer: | | | | |
Series 2004-KEY2 Class A2, 4.166% 8/12/39 | | 72,224 | | 72,489 |
Series 2005-MCP1 Class A2, 4.556% 6/12/43 | | 461,492 | | 464,988 |
Series 2007-C1 Class A4, 6.0234% 6/12/50 (i) | | 3,796,000 | | 4,092,935 |
Merrill Lynch-CFC Commercial Mortgage Trust: | | | | |
sequential payer: | | | | |
Series 2007-5 Class A3, 5.364% 8/12/48 | | 4,298,000 | | 4,449,393 |
Series 2007-6 Class A4, 5.485% 3/12/51 (i) | | 3,875,000 | | 4,075,741 |
Series 2007-9 Class A4, 5.7% 9/12/49 | | 5,500,000 | | 5,853,788 |
Series 2006-3 Class ASB, 5.382% 7/12/46 (i) | | 4,333,801 | | 4,555,449 |
Series 2007-7 Class B, 5.9332% 6/12/50 (i) | | 770,000 | | 108,801 |
Morgan Stanley Capital I Trust: | | | | |
floater: | | | | |
Series 2006-XLF Class C, 1.479% 7/15/19 (c)(i) | | 113,478 | | 66,952 |
Series 2007-XCLA Class A1, 0.479% 7/17/17 (c)(i) | | 95,579 | | 88,171 |
Series 2007-XLFA: | | | | |
Class D, 0.469% 10/15/20 (c)(i) | | 235,000 | | 213,539 |
Class E, 0.529% 10/15/20 (c)(i) | | 294,000 | | 249,510 |
Class F, 0.579% 10/15/20 (c)(i) | | 176,000 | | 133,527 |
Class G, 0.619% 10/15/20 (c)(i) | | 218,000 | | 158,851 |
Class H, 0.709% 10/15/20 (c)(i) | | 137,000 | | 79,278 |
Class J, 0.859% 10/15/20 (c)(i) | | 80,460 | | 33,116 |
Class NHRO, 1.169% 10/15/20 (c)(i) | | 87,905 | | 71,203 |
sequential payer: | | | | |
Series 2007-HQ11 Class A31, 5.439% 2/12/44 (i) | | 4,785,000 | | 4,985,482 |
Series 2007-IQ13 Class A1, 5.05% 3/15/44 | | 93,564 | | 93,442 |
Series 2005-IQ9 Class X2, 1.21% 7/15/56 (c)(i)(j) | | 14,513,936 | | 14,180 |
|
| Principal Amount | | Value |
Series 2007-HQ12 Class A2, 5.783% 4/12/49 (i) | | $ 4,450,211 | | $ 4,544,974 |
Series 2007-IQ14 Class B, 5.9066% 4/15/49 (i) | | 2,175,000 | | 564,413 |
Providence Place Group Ltd. Partnership Series 2000-C1 Class A2, 7.75% 7/20/28 (c) | | 3,235,944 | | 3,355,351 |
Wachovia Bank Commercial Mortgage Trust: | | | | |
floater: | | | | |
Series 2006-WL7A: | | | | |
Class E, 0.5626% 9/15/21 (c)(i) | | 491,000 | | 378,416 |
Class F, 0.6226% 9/15/21 (c)(i) | | 661,000 | | 489,605 |
Class G, 0.6426% 9/15/21 (c)(i) | | 626,000 | | 444,901 |
Class J, 0.8826% 9/15/21 (c)(i) | | 139,000 | | 61,258 |
Series 2007-WHL8: | | | | |
Class AP2, 1.0783% 6/15/20 (c)(i) | | 53,945 | | 47,472 |
Class F, 0.7583% 6/15/20 (c)(i) | | 1,046,000 | | 679,900 |
sequential payer: | | | | |
Series 2003-C7 Class A1, 4.241% 10/15/35 (c) | | 424,082 | | 426,735 |
Series 2007-C30: | | | | |
Class A3, 5.246% 12/15/43 | | 5,940,000 | | 6,003,261 |
Class A4, 5.305% 12/15/43 | | 3,240,000 | | 3,384,579 |
Class A5, 5.342% 12/15/43 | | 3,796,000 | | 4,001,504 |
Series 2007-C31 Class A4, 5.509% 4/15/47 | | 2,332,000 | | 2,458,796 |
Series 2007-C32 Class A2, 5.9259% 6/15/49 (i) | | 1,093,400 | | 1,119,359 |
Series 2006-C23 Class A5, 5.416% 1/15/45 (i) | | 3,010,000 | | 3,297,572 |
Series 2007-C30 Class E, 5.553% 12/15/43 (i) | | 6,257,000 | | 1,028,651 |
Series 2007-C31 Class C, 5.8744% 4/15/47 (i) | | 2,455,000 | | 447,780 |
TOTAL COMMERCIAL MORTGAGE SECURITIES (Cost $255,070,566) |
239,232,004
|
Municipal Securities - 0.3% |
|
Beaver County Indl. Dev. Auth. Poll. Cont. Rev. Bonds (FirstEnergy Nuclear Generation Corp. Proj.) Series 2005 A, 3.375%, tender 7/1/15 (i) | | 1,200,000 | | 1,227,192 |
California Gen. Oblig. 7.5% 4/1/34 | | 2,095,000 | | 2,513,686 |
Illinois Gen. Oblig.: | | | | |
Series 2010, 4.421% 1/1/15 | | 2,850,000 | | 2,950,064 |
Municipal Securities - continued |
| Principal
Amount | | Value |
Illinois Gen. Oblig.: - continued | | | | |
Series 2011: | | | | |
5.665% 3/1/18 | | $ 1,885,000 | | $ 2,006,168 |
5.877% 3/1/19 | | 1,755,000 | | 1,889,556 |
TOTAL MUNICIPAL SECURITIES (Cost $9,770,647) |
10,586,666
|
Foreign Government and Government Agency Obligations - 0.3% |
|
Brazilian Federative Republic 5.625% 1/7/41 | | 1,920,000 | | 2,232,000 |
Chilean Republic 3.25% 9/14/21 | | 4,140,000 | | 4,233,150 |
United Mexican States: | | | | |
5.875% 1/15/14 | | 1,665,000 | | 1,798,200 |
6.05% 1/11/40 | | 2,660,000 | | 3,251,850 |
TOTAL FOREIGN GOVERNMENT AND GOVERNMENT AGENCY OBLIGATIONS (Cost $10,645,322) |
11,515,200
|
Supranational Obligations - 0.0% |
|
Corporacion Andina de Fomento 5.2% 5/21/13
(Cost $348,544) | | 350,000 | |
366,182
|
Preferred Securities - 0.1% |
|
FINANCIALS - 0.1% |
Commercial Banks - 0.1% |
Credit Suisse Ltd. (Guernsey) 5.86% (d)(i)
(Cost $4,884,698) | 4,785,000 | |
3,923,248
|
Money Market Funds - 6.0% |
| Shares | | |
Fidelity Cash Central Fund, 0.11% (a)
(Cost $227,061,250) | 227,061,250 | |
227,061,250
|
TOTAL INVESTMENT PORTFOLIO - 108.2% (Cost $3,947,332,007) | | 4,099,341,451 |
NET OTHER ASSETS (LIABILITIES) - (8.2)% | | (308,960,335) |
NET ASSETS - 100% | $ 3,790,381,116 |
TBA Sale Commitments |
| Principal
Amount | | Value |
Fannie Mae Guaranteed Mortgage pass-thru certificates |
3.5% 1/1/27 | $ (23,400,000) | | $ (24,468,867) |
3.5% 1/1/27 | (16,400,000) | | (17,149,121) |
4.5% 1/1/42 | (9,000,000) | | (9,579,190) |
5% 1/1/42 | (4,900,000) | | (5,294,403) |
5.5% 1/1/42 | (200,000) | | (217,783) |
TOTAL FANNIE MAE GUARANTEED MORTGAGE PASS-THRU CERTIFICATES | | (56,709,364) |
Freddie Mac |
5.5% 1/1/42 | (13,700,000) | | (14,856,053) |
5.5% 1/1/42 | (13,700,000) | | (14,856,053) |
TOTAL FREDDIE MAC | | (29,712,106) |
Ginnie Mae |
4% 1/1/42 | (400,000) | | (429,085) |
4% 1/1/42 | (400,000) | | (429,085) |
4% 1/1/42 | (4,000,000) | | (4,290,854) |
4.5% 1/1/42 | (100,000) | | (108,982) |
4.5% 1/1/42 | (2,500,000) | | (2,724,558) |
5% 1/1/42 | (1,700,000) | | (1,883,318) |
5% 1/1/42 | (1,700,000) | | (1,883,318) |
5% 1/1/42 | (7,600,000) | | (8,419,539) |
5% 1/1/42 | (1,000,000) | | (1,107,834) |
TOTAL GINNIE MAE | | (21,276,573) |
TOTAL TBA SALE COMMITMENTS (Proceeds $107,292,492) | $ (107,698,043) |
Swap Agreements |
| Expiration Date | | Notional
Amount | | |
Credit Default Swaps |
Receive monthly a fixed rate of .15% multiplied by the notional amount and pay to Credit Suisse First Boston upon each credit event of one of the issues of ABX AA 07-01 Index, par value of the proportional notional amount (Rating-C) (Upfront Premium Received/(Paid) $360,000) (h) | Sept. 2037 | | $ 1,722,753 | | (1,627,498) |
Swap Agreements - continued |
| Expiration Date | | Notional
Amount | | Value |
Credit Default Swaps - continued |
Receive monthly a fixed rate of .15% multiplied by the notional amount and pay to Credit Suisse First Boston upon each credit event of one of the issues of ABX AA 07-01 Index, par value of the proportional notional amount (Rating-C) (Upfront Premium Received/(Paid) $598,000) (h) | Sept. 2037 | | $ 1,493,053 | | $ (1,410,498) |
Receive monthly a fixed rate of .15% multiplied by the notional amount and pay to JPMorgan Chase, Inc. upon each credit event of one of the issues of ABX AA 07-01 Index, par value of the proportional notional amount (Rating-C) (Upfront Premium Received/(Paid) $348,750) (h) | Sept. 2037 | | 861,377 | | (813,749) |
Receive monthly a fixed rate of .15% multiplied by the notional amount and pay to JPMorgan Chase, Inc. upon each credit event of one of the issues of ABX AA 07-01 Index, par value of the proportional notional amount (Rating-C) (Upfront Premium Received/(Paid) $701,375) (h) | Sept. 2037 | | 1,780,178 | | (1,681,748) |
|
| Expiration Date | | Notional
Amount | | Value |
Credit Default Swaps - continued |
Receive monthly a fixed rate of .15% multiplied by the notional amount and pay to UBS upon each credit event of one of the issues of ABX AA 07-1 Index, par value of the proportional notional amount (Rating-C) (Upfront Premium Received/(Paid) $572,000) (h) | Sept. 2037 | | $ 2,526,705 | | $ (2,386,997) |
Receive monthly a fixed rate of .15% multiplied by the notional amount and pay to UBS upon each credit event of one of the issues of ABX AA 07-1 Index, par value of the proportional notional amount (Rating-C) (Upfront Premium Received/(Paid) $214,000) (h) | Sept. 2037 | | 918,802 | | (867,999) |
Receive monthly a fixed rate of .15% multiplied by the notional amount and pay to UBS upon each credit event of one of the issues of ABX AA 07-1 Index, par value of the proportional notional amount (Rating-C) (Upfront Premium Received/(Paid) $1,023,500) (h) | Sept. 2037 | | 2,641,555 | | (2,495,497) |
Swap Agreements - continued |
| Expiration Date | | Notional
Amount | | Value |
Credit Default Swaps - continued |
Receive monthly notional amount multiplied by .82% and pay UBS upon credit event of Morgan Stanley ABS Capital I, Inc., par value of the notional amount of Morgan Stanley ABS Capital I, Inc. Series 2004-NC6 Class M3, 5.6413% 7/25/34 (Rating-Ca) (g) | August 2034 | | $ 84,327 | | $ (46,918) |
Receive monthly notional amount multiplied by 2.4% and pay Deutsche Bank upon credit event of Fremont Home Loan Trust, par value of the notional amount of Fremont Home Loan Trust Series 2004-A Class B3, 7.2288% 1/25/34 (Rating-C) (g) | Feb. 2034 | | 4,841 | | (4,565) |
Receive monthly notional amount multiplied by 2.5% and pay Bank of America upon credit event of Ameriquest Mortgage Securities, Inc., par value of the notional amount of Ameriquest Mortgage Securities, Inc. Series 2004-R11 Class M9, 6.102% 11/25/34 (Rating-C) (g) | Dec. 2034 | | 245,904 | | (239,759) |
|
| Expiration Date | | Notional
Amount | | Value |
Credit Default Swaps - continued |
Receive monthly notional amount multiplied by 2.5% and pay Credit Suisse First Boston upon credit event of Ameriquest Mortgage Securities, Inc., par value of the notional amount of Ameriquest Mortgage Securities, Inc. Series 2004-R11 Class M9, 8.03% 11/25/34 (Rating-C) (g) | Dec. 2034 | | $ 427,179 | | $ (416,504) |
Receive monthly notional amount multiplied by 3.35% and pay Morgan Stanley, Inc. upon credit event of Morgan Stanley ABS Capital I, Inc., par value of the notional amount of Morgan Stanley ABS Capital I, Inc. Series 2004-HE7, Class B3, 9.01% 8/25/34 (Rating-C) (g) | Sept. 2034 | | 84,232 | | (63,687) |
TOTAL CREDIT DEFAULT SWAPS | | $ 12,790,906 | | $ (12,055,419) |
Interest Rate Swaps |
Receive semi-annually a fixed rate equal to 1.2857% and pay quarterly a floating rate based on 3-month LIBOR with JPMorgan Chase, Inc. | June 2012 | | 80,966,000 | | 283,446 |
| | $ 93,756,906 | | $ (11,771,973) |
Legend |
(a) Affiliated fund that is available only to investment companies and other accounts managed by Fidelity Investments. The rate quoted is the annualized seven-day yield of the fund at period end. A complete unaudited listing of the fund's holdings as of its most recent quarter end is available upon request. In addition, each Fidelity Central Fund's financial statements, which are not covered by the Fund's Report of Independent Registered Public Accounting Firm, are available on the SEC's website or upon request. |
(b) Non-income producing - Security is in default. |
(c) Security exempt from registration under Rule 144A of the Securities Act of 1933. These securities may be resold in transactions exempt from registration, normally to qualified institutional buyers. At the end of the period, the value of these securities amounted to $170,627,313 or 4.5% of net assets. |
(d) Security is perpetual in nature with no stated maturity date. |
(e) Security or a portion of the security purchased on a delayed delivery or when-issued basis. |
(f) Security or a portion of the security has been segregated as collateral for open swap agreements. At the period end, the value of securities pledged amounted to $13,825,759. |
(g) Represents a credit default swap contract in which the Fund has sold protection on the underlying reference entity. The value of each credit default swap and the credit rating can be measures of the current payment/performance risk. For the underlying reference entity, ratings disclosed are from Moody's Investors Service, Inc. Where Moody's ratings are not available, S&P ratings are disclosed and are indicated as such. All ratings are as of the report date and do not reflect subsequent changes. Where a credit rating is not disclosed, the value is used as the measure of the payment/performance risk. |
(h) Represents a credit default swap based on a tradable index of home equity asset-backed debt securities. The value of each credit default swap and the credit rating can be measures of the current payment/performance risk. In addition, the swap represents a contract in which the Fund has sold protection on the index of underlying securities. Ratings represent a weighted average of the ratings of all securities included in the index. Ratings used in the weighted average are from Moody's Investors Service, Inc., or S&P where Moody's ratings are not available. All ratings are as of the report date and do not reflect subsequent changes. |
(i) Coupon rates for floating and adjustable rate securities reflect the rates in effect at period end. |
(j) Security represents right to receive monthly interest payments on an underlying pool of mortgages or assets. Principal shown is the outstanding par amount of the pool as of the end of the period. |
(k) Coupon is inversely indexed to a floating interest rate multiplied by a specified factor. The price may be considerably more volatile than the price of a comparable fixed rate security. |
Affiliated Central Funds |
Information regarding fiscal year to date income earned by the Fund from investments in Fidelity Central Funds is as follows: |
Fund | Income earned |
Fidelity Cash Central Fund | $ 6,078 |
Other Information |
The following is a summary of the inputs used, as of December 31, 2011, involving the Fund's assets and liabilities carried at fair value. The inputs or methodology used for valuing securities may not be an indication of the risk associated with investing in those securities. For more information on valuation inputs, and their aggregation into the levels used in the tables below, please refer to the Security Valuation section in the accompanying Notes to Financial Statements. |
Valuation Inputs at Reporting Date: |
Description | Total | Level 1 | Level 2 | Level 3 |
Investments in Securities: | | | | |
Corporate Bonds | $ 945,554,654 | $ - | $ 945,554,654 | $ - |
U.S. Government and Government Agency Obligations | 1,077,398,921 | - | 1,077,398,921 | - |
U.S. Government Agency - Mortgage Securities | 1,455,910,912 | - | 1,455,910,912 | - |
Asset-Backed Securities | 87,193,531 | - | 80,859,176 | 6,334,355 |
Collateralized Mortgage Obligations | 40,598,883 | - | 40,411,155 | 187,728 |
Commercial Mortgage Securities | 239,232,004 | - | 227,871,907 | 11,360,097 |
Municipal Securities | 10,586,666 | - | 10,586,666 | - |
Foreign Government and Government Agency Obligations | 11,515,200 | - | 11,515,200 | - |
Supranational Obligations | 366,182 | - | 366,182 | - |
Preferred Securities | 3,923,248 | - | 3,923,248 | - |
Money Market Funds | 227,061,250 | 227,061,250 | - | - |
Total Investments in Securities: | $ 4,099,341,451 | $ 227,061,250 | $ 3,854,398,021 | $ 17,882,180 |
Derivative Instruments: | | | | |
Assets | | | | |
Swap Agreements | $ 283,446 | $ - | $ 283,446 | $ - |
Liabilities | | | | |
Swap Agreements | $ (12,055,419) | $ - | $ (11,283,986) | $ (771,433) |
Total Derivative Instruments: | $ (11,771,973) | $ - | $ (11,000,540) | $ (771,433) |
Other Financial Instruments: | | | | |
TBA Sale Commitments | $ (107,698,043) | $ - | $ (107,698,043) | $ - |
The following is a reconciliation of Investments in Securities and Derivative Instruments for which Level 3 inputs were used in determining value: |
Investments in Securities: | |
Beginning Balance | $ 14,900,634 |
Total Realized Gain (Loss) | 68,994 |
Total Unrealized Gain (Loss) | (473,379) |
Cost of Purchases | - |
Proceeds of Sales | (2,916,473) |
Amortization/Accretion | (1,108,684) |
Transfers in to Level 3 | 11,128,906 |
Transfers out of Level 3 | (3,717,818) |
Ending Balance | $ 17,882,180 |
The change in unrealized gain (loss) for the period attributable to Level 3 securities held at December 31, 2011 | $ (721,365) |
Derivative Instruments: | |
Swap Agreements | |
Beginning Balance | $ (1,102,753) |
Total Unrealized Gain (Loss) | 331,320 |
Transfers in to Level 3 | - |
Transfers out of Level 3 | - |
Ending Balance | $ (771,433) |
Realized gain (loss) on Swap Agreements for the period | $ (317,176) |
The change in unrealized gain (loss) for the period attributable to Level 3 Swap Agreements held at December 31, 2011 | $ 7,350 |
The information used in the above reconciliations represents fiscal year to date activity for any Investments in Securities and Derivative Instruments identified as using Level 3 inputs at either the beginning or the end of the current fiscal period. Transfers in or out of Level 3 represent the beginning value of any Security or Instrument where a change in the pricing level occurred from the beginning to the end of the period. The cost of purchases and the proceeds of sales may include securities received or delivered through corporate actions or exchanges. Realized and unrealized gains (losses) disclosed in the reconciliations are included in Net Gain (Loss) on the Fund's Statement of Operations. |
Value of Derivative Instruments |
The following table is a summary of the Fund's value of derivative instruments by risk exposure as of December 31, 2011. For additional information on derivative instruments, please refer to the Derivative Instruments section in the accompanying Notes to Financial Statements. |
Risk Exposure /
Derivative Type | Value |
| Asset | Liability |
Credit Risk | | |
Swap Agreements | $ - | $ (12,055,419) |
Interest Rate Risk | | |
Swap Agreements | 283,446 | - |
Total Value of Derivatives (a) | $ 283,446 | $ (12,055,419) |
(a) Value is disclosed on the Statement of Assets and Liabilities in the Swap agreements, at value line-items. |
See accompanying notes which are an integral part of the financial statements.
Not Part of Financial Report
Financial Statements
Statement of Assets and Liabilities
| December 31, 2011 |
| | |
Assets | | |
Investment in securities, at value - See accompanying schedule: Unaffiliated issuers (cost $3,720,270,757) | $ 3,872,280,201 | |
Fidelity Central Funds (cost $227,061,250) | 227,061,250 | |
Total Investments (cost $3,947,332,007) | | $ 4,099,341,451 |
Cash | | 64,932 |
Receivable for investments sold, regular delivery | | 48,199 |
Receivable for TBA sale commitments | | 107,292,492 |
Receivable for swap agreements | | 3,412 |
Interest receivable | | 24,583,165 |
Distributions receivable from Fidelity Central Funds | | 6,078 |
Swap agreements, at value | | 283,446 |
Total assets | | 4,231,623,175 |
| | |
Liabilities | | |
TBA sale commitments, at value | $ 107,698,043 | |
Payable for investments purchased on a delayed delivery basis | 320,948,794 | |
Payable for swap agreements | 190,095 | |
Distributions payable | 335,837 | |
Swap agreements, at value | 12,055,419 | |
Other payables and accrued expenses | 13,871 | |
Total liabilities | | 441,242,059 |
| | |
Net Assets | | $ 3,790,381,116 |
Net Assets consist of: | | |
Paid in capital | | $ 3,635,316,289 |
Undistributed net investment income | | 5,247,387 |
Accumulated undistributed net realized gain (loss) on investments | | 9,350,594 |
Net unrealized appreciation (depreciation) on investments | | 140,466,846 |
Net Assets, for 35,214,272 shares outstanding | | $ 3,790,381,116 |
Net Asset Value, offering price and redemption price per share ($3,790,381,116 ÷ 35,214,272 shares) | | $ 107.64 |
Statement of Operations
| Year ended December 31, 2011 |
| | |
Investment Income | | |
Dividends | | $ 416,908 |
Interest | | 134,707,253 |
Income from Fidelity Central Funds | | 6,078 |
Total income | | 135,130,239 |
| | |
Expenses | | |
Custodian fees and expenses | $ 89,391 | |
Independent trustees' compensation | 13,658 | |
Total expenses before reductions | 103,049 | |
Expense reductions | (14,149) | 88,900 |
Net investment income (loss) | | 135,041,339 |
Realized and Unrealized Gain (Loss) Net realized gain (loss) on: | | |
Investment securities: | | |
Unaffiliated issuers | 65,487,836 | |
Swap agreements | (1,665,378) | |
Total net realized gain (loss) | | 63,822,458 |
Change in net unrealized appreciation (depreciation) on: Investment securities | 88,672,754 | |
Swap agreements | 1,601,734 | |
Delayed delivery commitments | 1,529,504 | |
Total change in net unrealized appreciation (depreciation) | | 91,803,992 |
Net gain (loss) | | 155,626,450 |
Net increase (decrease) in net assets resulting from operations | | $ 290,667,789 |
See accompanying notes which are an integral part of the financial statements.
Not Part of Financial Report
Financial Statements - continued
Statement of Changes in Net Assets
| Year ended
December 31,
2011 | Year ended
December 31,
2010 |
Increase (Decrease) in Net Assets | | |
Operations | | |
Net investment income (loss) | $ 135,041,339 | $ 145,140,671 |
Net realized gain (loss) | 63,822,458 | 143,042,754 |
Change in net unrealized appreciation (depreciation) | 91,803,992 | 25,745,629 |
Net increase (decrease) in net assets resulting from operations | 290,667,789 | 313,929,054 |
Distributions to shareholders from net investment income | (136,408,906) | (145,185,204) |
Distributions to shareholders from net realized gain | (65,864,264) | (132,021,770) |
Total distributions | (202,273,170) | (277,206,974) |
Share transactions
Proceeds from sales of shares | 60,206,818 | 72,938,886 |
Reinvestment of distributions | 201,937,333 | 277,206,974 |
Cost of shares redeemed | (318,248,685) | (586,003,407) |
Net increase (decrease) in net assets resulting from share transactions | (56,104,534) | (235,857,547) |
Total increase (decrease) in net assets | 32,290,085 | (199,135,467) |
| | |
Net Assets | | |
Beginning of period | 3,758,091,031 | 3,957,226,498 |
End of period (including undistributed net investment income of $5,247,387 and undistributed net investment income of $8,506,392, respectively) | $ 3,790,381,116 | $ 3,758,091,031 |
Other Information Shares | | |
Sold | 564,305 | 678,877 |
Issued in reinvestment of distributions | 1,888,265 | 2,605,878 |
Redeemed | (2,967,677) | (5,416,725) |
Net increase (decrease) | (515,107) | (2,131,970) |
See accompanying notes which are an integral part of the financial statements.
Not Part of Financial Report
Financial Highlights
Years ended December 31, | 2011 | 2010 | 2009 | 2008 | 2007 |
Selected Per-Share Data | | | | | |
Net asset value, beginning of period | $ 105.18 | $ 104.52 | $ 94.78 | $ 102.50 | $ 103.02 |
Income from Investment Operations | | | | | |
Net investment income (loss) B | 3.817 | 3.943 | 4.762 | 5.319 | 5.534 |
Net realized and unrealized gain (loss) | 4.385 | 4.424 | 9.818 | (7.583) | (.594) |
Total from investment operations | 8.202 | 8.367 | 14.580 | (2.264) | 4.940 |
Distributions from net investment income | (3.851) | (3.947) | (4.580) | (5.236) | (5.385) |
Distributions from net realized gain | (1.891) | (3.760) | (.260) | (.220) | (.075) |
Total distributions | (5.742) | (7.707) | (4.840) | (5.456) | (5.460) |
Net asset value, end of period | $ 107.64 | $ 105.18 | $ 104.52 | $ 94.78 | $ 102.50 |
Total Return A | 7.96% | 8.12% | 15.71% | (2.29)% | 4.94% |
Ratios to Average Net AssetsC, F | | | | | |
Expenses before reductions E | -% | -% | -% | -% | -% |
Expenses net of fee waivers, if any E | -% | -% | -% | -% | -% |
Expenses net of all reductions E | -% | -% | -% | -% | -% |
Net investment income (loss) | 3.57% | 3.65% | 4.75% | 5.35% | 5.42% |
Supplemental Data | | | | | |
Net assets, end of period (000 omitted) | $ 3,790,381 | $ 3,758,091 | $ 3,957,226 | $ 3,162,861 | $ 3,587,807 |
Portfolio turnover rate D | 302% | 230% | 141% | 140% | 137% |
A Total returns would have been lower if certain expenses had not been reduced during the applicable periods shown.
B Calculated based on average shares outstanding during the period.
C Fees and expenses of any underlying Fidelity Central Funds are not included in the Fund's expense ratio. The Fund indirectly bears its proportionate share of the expenses of any underlying Fidelity Central Funds.
D Amount does not include the portfolio activity of any underlying Fidelity Central Funds.
E Amount represents less than .01%.
F Expense ratios reflect operating expenses of the Fund. Expenses before reductions do not reflect amounts reimbursed by the investment adviser or reductions from expense offset arrangements and do not represent the amount paid by the Fund during periods when reimbursements or reductions occur. Expenses net of fee waivers reflect expenses after reimbursement by the investment adviser but prior to reductions from expense offset arrangements. Expenses net of all reductions represent the net expenses paid by the Fund.
See accompanying notes which are an integral part of the financial statements.
Not Part of Financial Report
Notes to Financial Statements
For the period ended December 31, 2011
1. Organization.
Fidelity VIP Investment Grade Central Fund (the Fund) is a fund of Fidelity Garrison Street Trust (the Trust) and is authorized to issue an unlimited number of shares. The Trust is registered under the Investment Company Act of 1940, as amended (the 1940 Act), as an open-end management investment company organized as a Massachusetts business trust. Shares of the Fund are only offered to other investment companies and accounts managed by Fidelity Management & Research Company (FMR), or its affiliates (the Investing Funds).
2. Investments in Fidelity Central Funds.
The Fund invests in Fidelity Central Funds, which are open-end investment companies available only to other investment companies and accounts managed by FMR and its affiliates. The Fund's Schedule of Investments lists each of the Fidelity Central Funds held as of period end, if any, as an investment of the Fund, but do not include the underlying holdings of each Fidelity Central Fund. As an Investing Fund, the Fund indirectly bears its proportionate share of the expenses of the underlying Fidelity Central Funds.
The Money Market Central Funds seek preservation of capital and current income and are managed by Fidelity Investments Money Management, Inc. (FIMM), an affiliate of FMR.
A complete unaudited list of holdings for each Fidelity Central Fund is available upon request or at the Securities and Exchange Commission (the SEC) web site at www.sec.gov. In addition, the financial statements of the Fidelity Central Funds, which are not covered by the Fund's Report of Independent Registered Public Accounting Firm are available on the SEC web site or upon request.
3. Significant Accounting Policies.
The financial statements have been prepared in conformity with accounting principles generally accepted in the United States of America (GAAP), which require management to make certain estimates and assumptions at the date of the financial statements. Actual results could differ from those estimates. Subsequent events, if any, through the date that the financial statements were issued have been evaluated in the preparation of the financial statements. The following summarizes the significant accounting policies of the Fund:
Security Valuation. Investments are valued as of 4:00 p.m. Eastern time on the last calendar day of the period. The Fund uses independent pricing services approved by the Board of Trustees to value its investments. When current market prices or quotations are not readily available or reliable, valuations may be determined in good faith in accordance with procedures adopted by the Board of Trustees. Factors used in determining value may include market or security specific events, changes in interest rates and credit quality. The frequency with which these procedures are used cannot be predicted and they may be utilized to a significant extent. The value used for net asset value (NAV) calculation under these procedures may differ from published prices for the same securities.
The Fund categorizes the inputs to valuation techniques used to value its investments into a disclosure hierarchy consisting of three levels as shown below:
Level 1 - quoted prices in active markets for identical investments
Level 2 - other significant observable inputs (including quoted prices for similar investments, interest rates, prepayment speeds, etc.)
Level 3 - unobservable inputs (including the Fund's own assumptions based on the best information available)
Changes in valuation techniques may result in transfers in or out of an assigned level within the disclosure hierarchy. The aggregate value of investments by input level, as of December 31, 2011 for the Fund's investments, as well as a roll forward of Level 3 securities, is included at the end of the Fund's Schedule of Investments. Valuation techniques used to value the Fund's investments by major category are as follows:
Debt securities, including restricted securities, are valued based on evaluated prices received from independent pricing services or from dealers who make markets in such securities. For corporate bonds, foreign government and government agency obligations, municipal securities, supranational obligations and U.S. government and government agency obligations, pricing services utilize matrix pricing which considers yield or price of bonds of comparable quality, coupon, maturity and type as well as dealer supplied prices and are generally categorized as Level 2 in the hierarchy. For asset backed securities, collateralized mortgage obligations, commercial mortgage securities and U.S. government agency mortgage securities, pricing services utilize matrix pricing which considers prepayment speed assumptions, attributes of the collateral, yield or price of bonds of comparable quality, coupon, maturity and type as well as dealer supplied prices and, accordingly, such securities are generally categorized as Level 2 in the hierarchy. Dealers which make markets in asset backed securities, collateralized mortgage obligations and commercial mortgage securities may also consider such factors as the structure of the issue, cash flow assumptions, the value of underlying assets as well as any guarantees. Swaps are marked-to-market daily based on valuations from independent pricing services or dealer-supplied valuations and changes in value are recorded as unrealized appreciation (depreciation). Pricing services utilize matrix pricing which considers comparisons to interest rate curves, credit spread curves, default possibilities and recovery rates and, as a result, swaps are generally categorized as Level 2 in the hierarchy. When independent prices are unavailable or
Not Part of Financial Report
Notes to Financial Statements - continued
3. Significant Accounting Policies - continued
Security Valuation - continued
unreliable, debt securities and swaps may be valued utilizing pricing matrices which consider similar factors that would be used by independent pricing services. These are generally categorized as Level 2 in the hierarchy but may be Level 3 depending on the circumstances.
Investments in open-end mutual funds, including other Fidelity Central Funds, are valued at their closing net asset value each business day and are categorized as Level 1 in the hierarchy.
New Accounting Pronouncements. In May 2011, the Financial Accounting Standards Board issued Accounting Standard Update No. 2011-04, Fair Value Measurement (Topic 820) - Amendments to Achieve Common Fair Value Measurement and Disclosure Requirements in U.S. GAAP and IFRSs. The update is effective during interim and annual periods beginning after December 15, 2011 and will result in additional disclosure for transfers between levels as well as expanded disclosure for securities categorized as Level 3 under the fair value hierarchy.
In December 2011, the Financial Accounting Standards Board issued Accounting Standard Update No. 2011-11, Disclosures about Offsetting Assets and Liabilities. The update creates new disclosure requirements requiring entities to disclose both gross and net information for derivatives and other financial instruments that are either offset in the Statement of Assets and Liabilities or subject to an enforceable master netting arrangement or similar agreement. The disclosure requirements are effective for annual reporting periods beginning on or after January 1, 2013. Management is currently evaluating the impact of the update's adoption on the Fund's financial statement disclosures.
Investment Transactions and Income. For financial reporting purposes, the Fund's investment holdings and NAV include trades executed through the end of the last business day of the period. The NAV per share for processing shareholder transactions is calculated as of the close of business of the New York Stock Exchange (NYSE), normally 4:00 p.m. Eastern time and includes trades executed through the end of the prior business day. Gains and losses on securities sold are determined on the basis of identified cost. Dividend income is recorded on the ex-dividend date. Interest income and distributions from other Fidelity Central Funds are accrued as earned. Interest income includes coupon interest and amortization of premium and accretion of discount on debt securities. The principal amount on inflation-indexed securities is periodically adjusted to the rate of inflation and interest is accrued based on the principal amount. The adjustments to principal due to inflation are reflected as increases or decreases to interest income even though principal is not received until maturity. Debt obligations may be placed on non-accrual status and related interest income may be reduced by ceasing current accruals and writing off interest receivables when the collection of all or a portion of interest has become doubtful based on consistently applied procedures. A debt obligation is removed from non-accrual status when the issuer resumes interest payments or when collectability of interest is reasonably assured.
Expenses. Expenses directly attributable to a fund are charged to that fund. Expenses attributable to more than one fund are allocated among the respective funds on the basis of relative net assets or other appropriate methods. Expense estimates are accrued in the period to which they relate and adjustments are made when actual amounts are known.
Income Tax Information and Distributions to Shareholders. Each year, the Fund intends to qualify as a regulated investment company, including distributing substantially all of its taxable income and realized gains under Subchapter M of the Internal Revenue Code. As a result, no provision for income taxes is required. As of December 31, 2011, the Fund did not have any unrecognized tax benefits in the financial statements; nor is the Fund aware of any tax positions for which it is reasonably possible that the total amounts of unrecognized tax benefits will significantly change in the next twelve months. The Fund files a U.S. federal tax return, in addition to state and local tax returns as required. A fund's tax returns are subject to examination by the Internal Revenue Service (IRS) for a period of three fiscal years. State and local tax returns may be subject to examination for an additional fiscal year depending on the jurisdiction.
Dividends are declared and recorded daily and paid monthly from net investment income. Distributions from realized gains, if any, are declared and recorded on the ex-dividend date. Income and capital gain distributions are determined in accordance with income tax regulations, which may differ from GAAP.
Capital accounts within the financial statements are adjusted for permanent book-tax differences. These adjustments have no impact on net assets or the results of operations. Temporary book-tax differences will reverse in a subsequent period.
Book-tax differences are primarily due to swap agreements, market discount, financing transactions and losses deferred due to wash sales.
The federal tax cost of investment securities and unrealized appreciation (depreciation) as of period end were as follows:
Gross unrealized appreciation | $ 203,750,196 |
Gross unrealized depreciation | (47,355,920) |
Net unrealized appreciation (depreciation) on securities and other investments | $ 156,394,276 |
| |
Tax Cost | $ 3,942,947,175 |
Not Part of Financial Report
3. Significant Accounting Policies - continued
Income Tax Information and Distributions to Shareholders - continued
The tax-based components of distributable earnings as of period end were as follows:
Undistributed ordinary income | $ 1,397,261 |
Undistributed long-term capital gain | $ 8,867,490 |
Net unrealized appreciation (depreciation) | $ 144,800,076 |
The tax character of distributions paid was as follows:
| December 31, 2011 | December 31, 2010 |
Ordinary Income | $ 174,509,115 | $ 187,103,640 |
Long-term Capital Gains | 27,764,055 | 90,103,334 |
Total | $ 202,273,170 | $ 277,206,974 |
4. Operating Policies.
Delayed Delivery Transactions and When-Issued Securities. During the period, the Fund transacted in securities on a delayed delivery or when-issued basis. Payment and delivery may take place after the customary settlement period for that security. The price of the underlying securities and the date when the securities will be delivered and paid for are fixed at the time the transaction is negotiated. During the time a delayed delivery sell is outstanding, the contract is marked-to-market daily and equivalent deliverable securities are held for the transaction. The securities purchased on a delayed delivery or when-issued basis are identified as such in the Fund's Schedule of Investments. The Fund may receive compensation for interest forgone in the purchase of a delayed delivery or when-issued security. With respect to purchase commitments, the Fund identifies securities as segregated in its records with a value at least equal to the amount of the commitment. The payables and receivables associated with the purchases and sales of delayed delivery securities having the same coupon, settlement date and broker are offset. Delayed delivery or when-issued securities that have been purchased from and sold to different brokers are reflected as both payables and receivables in the fund's Statement of Assets and Liabilities under the caption "Delayed delivery." Losses may arise due to changes in the value of the underlying securities or if the counterparty does not perform under the contract's terms, or if the issuer does not issue the securities due to political, economic, or other factors.
To-Be-Announced (TBA) Securities and Mortgage Dollar Rolls. During the period, the Fund transacted in TBA securities that involved buying or selling mortgage-backed securities (MBS) on a forward commitment basis. A TBA transaction typically does not designate the actual security to be delivered and only includes an approximate principal amount however; delivered securities must meet specified terms defined by industry guidelines, including issuer, rate and current principal amount outstanding on underlying mortgage pools. The Fund may enter into a TBA transaction with the intent to take possession of or deliver the underlying MBS, or the Fund may elect to extend the settlement by entering into either a mortgage or reverse mortgage dollar roll. Mortgage dollar rolls are transactions where a fund sells MBS and simultaneously agrees to repurchase MBS on a later date at a lower price and with the same counterparty. Reverse mortgage dollar rolls involve the purchase and simultaneous agreement to sell MBS on a later date at a lower price. Transactions in mortgage dollar rolls and reverse mortgage dollar rolls are accounted for as purchases and sales and may result in an increase to the Fund's portfolio turnover rate.
Purchases and sales of TBA securities involve risks similar to those discussed above for delayed delivery and when-issued securities. Also, if the counterparty in a dollar roll or a reverse dollar roll transaction files for bankruptcy or becomes insolvent, the Fund's right to repurchase or sell securities may be limited. Additionally, when a fund sells TBA securities without already owning or having the right to obtain the deliverable securities (an uncovered forward commitment to sell), it incurs a risk of loss because it could have to purchase the securities at a price that is higher than the price at which it sold them. A fund may be unable to purchase the deliverable securities if the corresponding market is illiquid.
TBA securities subject to a forward commitment to sell at period end are included at the end of the Fund's Schedule of Investments under the caption "TBA Sale Commitments." The proceeds and value of these commitments are reflected in the Fund's Statement of Assets and Liabilities.
Restricted Securities. The Fund may invest in securities that are subject to legal or contractual restrictions on resale. These securities generally may be resold in transactions exempt from registration or to the public if the securities are registered. Disposal of these securities may involve time-consuming negotiations and expense, and prompt sale at an acceptable price may be difficult. Information regarding restricted securities is included at the end of the Fund's Schedule of Investments.
Not Part of Financial Report
Notes to Financial Statements - continued
5. Derivative Instruments.
Risk Exposures and the Use of Derivative Instruments. The Fund used derivative instruments (derivatives), including swap agreements, in order to meet its investment objectives. The strategy is to use derivatives to increase returns, to gain exposure to certain types of assets and to manage exposure to certain risks as defined below. The success of any strategy involving derivatives depends on analysis of numerous economic factors, and if the strategies for investment do not work as intended, the Fund may not achieve its objectives.
The Fund's use of derivatives increased or decreased its exposure to the following risks:
Credit Risk | Credit risk relates to the ability of the issuer of a financial instrument to make further principal or interest payments on an obligation or commitment that it has to the Fund. |
Interest Rate Risk | Interest rate risk relates to the fluctuations in the value of interest-bearing securities due to changes in the prevailing levels of market interest rates. |
The Fund is also exposed to additional risks from investing in derivatives, such as liquidity risk and counterparty credit risk. Liquidity risk is the risk that the Fund will be unable to sell the derivative in the open market in a timely manner. Counterparty credit risk is the risk that the counterparty will not be able to fulfill its obligation to the Fund. Derivative counterparty credit risk is managed through formal evaluation of the creditworthiness of all potential counterparties. On certain over-the-counter derivatives, the Fund attempts to reduce its exposure to counterparty credit risk by entering into an International Swaps and Derivatives Association (ISDA) Master Agreement on a bilateral basis with each of its counterparties. The ISDA Master Agreement gives the Fund the right to terminate all transactions traded under such agreement if there is a certain deterioration in the credit quality of the counterparty. The ISDA Master Agreement gives each party the right, upon an event of default by the other party or a termination of the agreement, to close out all transactions traded under such agreement and to net amounts owed under each transaction to one net payable by one party to the other. To mitigate counterparty credit risk, the Fund receives collateral in the form of cash or securities, if required, which is held in segregated accounts with the Fund's custodian bank in accordance with the collateral agreements entered into between the Fund, the swap counterparty and the Fund's custodian bank. The Fund could experience delays and costs in gaining access to the collateral even though it is held by the Fund's custodian bank. The Fund's maximum risk of loss from counterparty credit risk is generally the aggregate unrealized appreciation and unpaid counterparty payments in excess of any collateral pledged by the counterparty to the Fund. The Fund may be required to pledge collateral for the benefit of the counterparties in an amount equal to the counterparties unrealized appreciation on outstanding swaps contracts, and any such pledged collateral is identified on the Schedule of Investments. Derivatives involve, to varying degrees, risk of loss in excess of the amounts recognized in the Statement of Assets and Liabilities.
Net Realized Gain (Loss) and Change in Net Unrealized Appreciation (Depreciation) on Derivatives. The table below, which reflects the impacts of derivatives on the financial performance of the Fund, summarizes the net realized gain (loss) and change in net unrealized appreciation (depreciation) for derivatives during the period.
Risk Exposure / Derivative Type | Net Realized
Gain (Loss) | Change in Net
Unrealized Appreciation
(Depreciation) |
Credit Risk | | |
Swap Agreements | $ (2,463,050) | $ 2,222,435 |
Interest Rate Risk | | |
Swap Agreements | 797,672 | (620,701) |
Totals (a) | $ (1,665,378) | $ 1,601,734 |
(a) A summary of the value of derivatives by risk exposure as of period end is included at the end of the Schedule of Investments and is representative of activity for the period.
Swap Agreements. A swap agreement (swap) is a contract between two parties to exchange future cash flows at periodic intervals based on a notional principal amount.
Details of swaps open at period end are included in the Schedule of Investments under the caption "Swap Agreements." Swaps are marked-to-market daily and changes in value are recorded as unrealized appreciation or (depreciation) and reflected in the Statement of Assets and Liabilities. Any upfront premiums paid or received upon entering a swap to compensate for differences between stated terms of the agreement and prevailing market conditions (e.g. credit spreads, interest rates or other factors) are recorded as realized gain or (loss) ratably over the term of the swap. Payments are exchanged at specified intervals, accrued daily commencing with the effective date of the contract and recorded as realized gain or (loss). Realized gain or (loss) is also recorded in the event of an early termination of a swap. The net realized gain (loss) and change in net unrealized appreciation (depreciation) on swaps during the period is included in the Statement of Operations.
Risks of loss include credit risk and interest rate risk. In addition, there is the risk of failure by the counterparty to perform under the terms of the agreement and lack of liquidity in the market.
Not Part of Financial Report
5. Derivative Instruments - continued
Interest Rate Swaps. Interest rate swaps are agreements between counterparties to exchange cash flows, one based on a fixed rate, and the other on a floating rate. The Fund entered into interest rate swaps to manage its exposure to interest rate changes. Changes in interest rates can have an effect on both the value of bond holdings as well as the amount of interest income earned. In general, the value of bonds can fall when interest rates rise and can rise when interest rates fall.
Credit Default Swaps. Credit default swaps enable the Fund to buy or sell protection on a debt security or a basket of securities against a defined credit event. Under the terms of a credit default swap the buyer of protection (buyer) receives credit protection in exchange for making periodic payments to the seller of protection (seller) based on a fixed percentage applied to a notional principal amount. In return for these payments, the seller acts as a guarantor of the creditworthiness of a reference obligation. The Fund enters into credit default swaps as a seller to gain credit exposure to an issuer and/or as a buyer to provide a measure of protection against defaults of an issuer. The issuer may be either a single issuer or a "basket" of issuers. Periodic payments are made over the life of the contract provided that no credit event occurs.
For credit default swaps on most corporate and sovereign issuers, credit events include bankruptcy, failure to pay, obligation acceleration or repudiation/moratorium. For credit default swaps on corporate or sovereign issuers, the obligation that may be put to the seller is not limited to the specific reference obligation described in the Schedule of Investments. For credit default swaps on asset-backed securities, a credit event may be triggered by events such as failure to pay principal, maturity extension, rating downgrade or write-down. For credit default swaps on asset-backed securities, the reference obligation described represents the security that may be put to the seller.
As a seller, if an underlying credit event occurs, the Fund will either pay the buyer an amount equal to the notional amount of the swap and take delivery of the reference obligation or underlying securities comprising an index or pay a net settlement amount of cash equal to the notional amount of the swap less the recovery value of the reference obligation or underlying securities comprising an index.
As a buyer, if an underlying credit event occurs, the Fund will either receive from the seller an amount equal to the notional amount of the swap and deliver the reference obligation or underlying securities comprising an index or receive a net settlement amount of cash equal to the notional amount of the swap less the recovery value of the reference obligation or underlying securities comprising an index.
Typically, the value of each credit default swap and credit rating disclosed for each reference obligation in the Schedule of Investments, where the Fund is the seller, can be used as measures of the current payment/performance risk of the swap. As the value of the swap changes as a positive or negative percentage of the total notional amount, the payment/performance risk may decrease or increase, respectively. In addition to these measures, FMR monitors a variety of factors including cash flow assumptions, market activity and market sentiment as part of its ongoing process of assessing payment/performance risk.
The notional amount of credit default swaps is included in the Schedule of Investments and approximates the maximum potential amount of future payments that the Fund could be required to make if the Fund is the seller and a credit event were to occur. The total notional amount of all credit default swaps open at period end where the Fund is the seller amounted to $12,790,906 representing 0.34% of net assets.
6. Purchases and Sales of Investments.
Purchases and sales of securities, other than short-term securities and U.S. government securities, aggregated $300,288,689 and $317,236,469, respectively.
7. Fees and Other Transactions with Affiliates.
Management Fee and Expense Contract. FIMM, an affiliate of FMR, provides the Fund with investment management services. The Fund does not pay any fees for these services. Pursuant to the Fund's management contract with FIMM, FMR pays FIMM a portion of the management fees it receives from the Investing Funds. In addition, under an expense contract, FMR also pays all other expenses of the Fund, excluding custody fees, the compensation of the independent Trustees, and certain exceptions such as interest expense.
8. Expense Reductions.
FMR has voluntarily agreed to reimburse a portion of the Fund's operating expenses. For the period, the reimbursement reduced the expenses by $13,658.
In addition, through arrangements with the Fund's custodian, credits realized as a result of uninvested cash balances were used to reduce the Fund's expenses. During the period, these credits reduced the Fund's custody expenses by $491.
Not Part of Financial Report
Notes to Financial Statements - continued
9. Other.
The Fund's organizational documents provide former and current trustees and officers with a limited indemnification against liabilities arising in connection with the performance of their duties to the Fund. In the normal course of business, the Fund may also enter into contracts that provide general indemnifications. The Fund's maximum exposure under these arrangements is unknown as this would be dependent on future claims that may be made against the Fund. The risk of material loss from such claims is considered remote.
At the end of the period, mutual funds managed by FMR or an FMR affiliate were the owners of record of all of the outstanding shares of the Fund according to the following schedule.
Fund | Ownership % |
VIP Asset Manager Portfolio | 11.9% |
VIP Asset Manager: Growth Portfolio | 0.9% |
VIP Balanced Portfolio | 11.6% |
VIP Investment Grade Bond Portfolio | 75.6% |
Credit Risk.
The Fund invests a portion of its assets in structured securities of issuers that hold mortgage securities, including securities backed by subprime mortgage loans. The value and related income of these securities is sensitive to changes in economic conditions, including delinquencies and/or defaults. Continuing shifts in the market's perception of credit quality on securities backed by subprime mortgage loans have resulted in increased volatility of market price and periods of illiquidity that have adversely impacted the valuation of certain issuers of the Fund.
Not Part of Financial Report
Report of Independent Registered Public Accounting Firm
To the Trustees of Fidelity Garrison Street Trust and Shareholders of Fidelity VIP Investment Grade Central Fund:
We have audited the accompanying statement of assets and liabilities of Fidelity VIP Investment Grade Central Fund (the Fund), a fund of Fidelity Garrison Street Trust, including the schedule of investments, as of December 31, 2011, and the related statement of operations for the year then ended, the statement of changes in net assets for each of the two years in the period then ended, and the financial highlights for each of the five years in the period then ended. These financial statements and financial highlights are the responsibility of the Fund's management. Our responsibility is to express an opinion on these financial statements and financial highlights based on our audits.
We conducted our audits in accordance with the standards of the Public Company Accounting Oversight Board (United States). Those standards require that we plan and perform the audit to obtain reasonable assurance about whether the financial statements and financial highlights are free of material misstatement. The Fund is not required to have, nor were we engaged to perform, an audit of its internal control over financial reporting. Our audits included consideration of internal control over financial reporting as a basis for designing audit procedures that are appropriate in the circumstances, but not for the purpose of expressing an opinion on the effectiveness of the Fund's internal control over financial reporting. Accordingly, we express no such opinion. An audit also includes examining, on a test basis, evidence supporting the amounts and disclosures in the financial statements, assessing the accounting principles used and significant estimates made by management, as well as evaluating the overall financial statement presentation. Our procedures included confirmation of securities owned as of December 31, 2011, by correspondence with the custodians and brokers; where replies were not received from brokers, we performed other auditing procedures. We believe that our audits provide a reasonable basis for our opinion.
In our opinion, the financial statements and financial highlights referred to above present fairly, in all material respects, the financial position of Fidelity VIP Investment Grade Central Fund as of December 31, 2011, the results of its operations for the year then ended, the changes in its net assets for each of the two years in the period then ended, and the financial highlights for each of the five years in the period then ended in conformity with accounting principles generally accepted in the United States of America.
/s/ Deloitte & Touche LLP
DELOITTE & TOUCHE LLP
Boston, Massachusetts
February 16, 2012
Not Part of Financial Report
Trustees and Officers
The Trustees and executive officers of the trust and fund, as applicable, are listed below. The Board of Trustees governs the fund and is responsible for protecting the interests of shareholders. The Trustees are experienced executives who meet periodically throughout the year to oversee the fund's activities, review contractual arrangements with companies that provide services to the fund, oversee management of the risks associated with such activities and contractual arrangements, and review the fund's performance. Except for James C. Curvey, each of the Trustees oversees 203 funds advised by FMR or an affiliate. Mr. Curvey oversees 429 funds advised by FMR or an affiliate.
The Trustees hold office without limit in time except that (a) any Trustee may resign; (b) any Trustee may be removed by written instrument, signed by at least two-thirds of the number of Trustees prior to such removal; (c) any Trustee who requests to be retired or who has become incapacitated by illness or injury may be retired by written instrument signed by a majority of the other Trustees; and (d) any Trustee may be removed at any special meeting of shareholders by a two-thirds vote of the outstanding voting securities of the trust. Each Trustee who is not an interested person (as defined in the 1940 Act) (Independent Trustee), shall retire not later than the last day of the calendar year in which his or her 75th birthday occurs. The Independent Trustees may waive this mandatory retirement age policy with respect to individual Trustees. The executive officers hold office without limit in time, except that any officer may resign or may be removed by a vote of a majority of the Trustees at any regular meeting or any special meeting of the Trustees. Except as indicated, each individual has held the office shown or other offices in the same company for the past five years.
Experience, Skills, Attributes, and Qualifications of the Fund's Trustees. The Governance and Nominating Committee has adopted a statement of policy that describes the experience, qualifications, attributes, and skills that are necessary and desirable for potential Independent Trustee candidates (Statement of Policy). The Board believes that each Trustee satisfied at the time he or she was initially elected or appointed a Trustee, and continues to satisfy, the standards contemplated by the Statement of Policy. The Governance and Nominating Committee also engages professional search firms to help identify potential Independent Trustee candidates who have the experience, qualifications, attributes, and skills consistent with the Statement of Policy. From time to time, additional criteria based on the composition and skills of the current Independent Trustees, as well as experience or skills that may be appropriate in light of future changes to board composition, business conditions, and regulatory or other developments, have also been considered by the professional search firms and the Governance and Nominating Committee. In addition, the Board takes into account the Trustees' commitment and participation in Board and committee meetings, as well as their leadership of standing and ad hoc committees throughout their tenure.
In determining that a particular Trustee was and continues to be qualified to serve as a Trustee, the Board has considered a variety of criteria, none of which, in isolation, was controlling. The Board believes that, collectively, the Trustees have balanced and diverse experience, qualifications, attributes, and skills, which allow the Board to operate effectively in governing the fund and protecting the interests of shareholders. Information about the specific experience, skills, attributes, and qualifications of each Trustee, which in each case led to the Board's conclusion that the Trustee should serve (or continue to serve) as a trustee of the fund, is provided below.
Board Structure and Oversight Function. Abigail P. Johnson is an interested person (as defined in the 1940 Act) and currently serves as Chairman. The Trustees have determined that an interested Chairman is appropriate and benefits shareholders because an interested Chairman has a personal and professional stake in the quality and continuity of services provided to the fund. Independent Trustees exercise their informed business judgment to appoint an individual of their choosing to serve as Chairman, regardless of whether the Trustee happens to be independent or a member of management. The Independent Trustees have determined that they can act independently and effectively without having an Independent Trustee serve as Chairman and that a key structural component for assuring that they are in a position to do so is for the Independent Trustees to constitute a substantial majority for the Board. The Independent Trustees also regularly meet in executive session. Kenneth L. Wolfe serves as Chairman of the Independent Trustees and as such (i) acts as a liaison between the Independent Trustees and management with respect to matters important to the Independent Trustees and (ii) with management prepares agendas for Board meetings.
Fidelity funds are overseen by different Boards of Trustees. The fund's Board oversees Fidelity's investment-grade bond, money market, and asset allocation funds and another Board oversees Fidelity's equity and high income funds. The asset allocation funds may invest in Fidelity funds that are overseen by such other Board. The use of separate Boards, each with its own committee structure, allows the Trustees of each group of Fidelity funds to focus on the unique issues of the funds they oversee, including common research, investment, and operational issues. On occasion, the separate Boards establish joint committees to address issues of overlapping consequences for the Fidelity funds overseen by each Board.
The Trustees operate using a system of committees to facilitate the timely and efficient consideration of all matters of importance to the Trustees, the fund, and fund shareholders and to facilitate compliance with legal and regulatory requirements and oversight of the fund's activities and associated risks. The Board, acting through its committees, has charged FMR and its affiliates with (i) identifying events or circumstances the occurrence of which could have demonstrably adverse effects on the fund's business and/or reputation; (ii) implementing processes and controls to lessen the possibility that such events or circumstances occur or to mitigate the effects of such events or circumstances if they do occur; and (iii) creating and maintaining a system designed to evaluate continuously business and market conditions in order to facilitate the identification and implementation processes described in (i) and (ii) above. Because the day-to-day operations and activities of the fund are carried out by or through FMR, its affiliates and other service providers, the fund's exposure to risks is mitigated but not eliminated by the processes overseen by the Trustees. While each of the Board's committees has responsibility for overseeing different aspects of the fund's activities, oversight is exercised primarily through the Operations and Audit Committees. In addition, an ad hoc Board committee of Independent Trustees has worked with FMR to enhance the Board's oversight of investment and financial risks, legal and regulatory risks, technology risks, and operational risks, including the development of additional risk reporting to the Board. Appropriate personnel, including but not limited to the fund's Chief Compliance Officer (CCO), FMR's internal auditor, the independent accountants, the fund's Treasurer and portfolio management personnel, make periodic reports to the Board's committees, as appropriate, including an annual review of FMR's risk management program for the Fidelity funds. The responsibilities of each standing committee, including their oversight responsibilities, are described further under "Standing Committees of the Fund's Trustees."
Not Part of Financial Report
Trustees and Officers - continued
The fund's Statement of Additional Information (SAI) includes more information about the Trustees. To request a free copy, call Fidelity at 1-800-544-8544.
Interested Trustees*:
Correspondence intended for each Trustee who is an interested person may be sent to Fidelity Investments, 82 Devonshire Street, Boston, Massachusetts 02109.
Name, Age; Principal Occupations and Other Relevant Experience+ |
Abigail P. Johnson (50) |
| Year of Election or Appointment: 2009 Ms. Johnson is Trustee and Chairman of the Board of Trustees of certain Trusts. Ms. Johnson serves as President of Personal, Workplace and Institutional Services (2005-present). Ms. Johnson is Chairman and Director of FMR Co., Inc. (2011-present), Chairman and Director of FMR (2011-present), and the Vice Chairman and Director (2007-present) of FMR LLC. Previously, Ms. Johnson served as President and a Director of FMR (2001-2005), a Trustee of other investment companies advised by FMR, Fidelity Investments Money Management, Inc., and FMR Co., Inc. (2001-2005), Senior Vice President of the Fidelity funds (2001-2005), and managed a number of Fidelity funds. Ms. Abigail P. Johnson and Mr. Arthur E. Johnson are not related. |
James C. Curvey (76) |
| Year of Election or Appointment: 2007 Mr. Curvey also serves as Trustee (2007-present) of other investment companies advised by FMR. Mr. Curvey is a Director of Fidelity Investments Money Management, Inc. (2009-present), Director of Fidelity Research & Analysis Co. (2009-present) and Director of FMR and FMR Co., Inc. (2007-present). Mr. Curvey is also Vice Chairman (2007-present) and Director of FMR LLC. In addition, Mr. Curvey serves as an Overseer for the Boston Symphony Orchestra and a member of the Trustees of Villanova University. Previously, Mr. Curvey was the Vice Chairman (2006-2007) and Director (2000-2007) of FMR Corp. |
* Trustees have been determined to be "Interested Trustees" by virtue of, among other things, their affiliation with the trust or various entities under common control with FMR.
+ The information above includes each Trustee's principal occupation during the last five years and other information relating to the experience, attributes, and skills relevant to each Trustee's qualifications to serve as a Trustee, which led to the conclusion that each Trustee should serve as a Trustee for the fund.
Independent Trustees:
Correspondence intended for each Independent Trustee (that is, the Trustees other than the Interested Trustees) may be sent to Fidelity Investments, P.O. Box 55235, Boston, Massachusetts 02205-5235.
Name, Age; Principal Occupations and Other Relevant Experience+ |
Albert R. Gamper, Jr. (69) |
| Year of Election or Appointment: 2006 Mr. Gamper is Vice Chairman of the Independent Trustees of the Fixed Income and Asset Allocation Funds (2011-present). Prior to his retirement in December 2004, Mr. Gamper served as Chairman of the Board of CIT Group Inc. (commercial finance). During his tenure with CIT Group Inc. Mr. Gamper served in numerous senior management positions, including Chairman (1987-1989; 1999-2001; 2002-2004), Chief Executive Officer (1987-2004), and President (2002-2003). Mr. Gamper currently serves as a member of the Board of Directors of Public Service Enterprise Group (utilities, 2000-present), a member of the Board of Trustees, Rutgers University (2004-present), and Chairman of the Board of Saint Barnabas Health Care System. Previously, Mr. Gamper served as Chairman of the Board of Governors, Rutgers University (2004-2007). |
Robert F. Gartland (60) |
| Year of Election or Appointment: 2010 Mr. Gartland is a partner and investor of Vietnam Partners LLC (investments and consulting, 2008-present) and is Chairman and an investor in Gartland and Mellina Group Corp. (consulting, 2009-present). Prior to his retirement, Mr. Gartland held a variety of positions at Morgan Stanley (financial services, 1979-2007) including Managing Director (1987-2007). |
Arthur E. Johnson (64) |
| Year of Election or Appointment: 2008 Mr. Johnson serves as a member of the Board of Directors of Eaton Corporation (diversified power management, 2009-present), AGL Resources, Inc. (holding company, 2002-present) and Booz Allen Hamilton (management consulting, 2011-present). Prior to his retirement, Mr. Johnson served as Senior Vice President of Corporate Strategic Development of Lockheed Martin Corporation (defense contractor, 1999-2009). He previously served on the Board of Directors of IKON Office Solutions, Inc. (1999-2008) and Delta Airlines (2005-2007). Mr. Arthur E. Johnson is not related to Mr. Edward C. Johnson 3d or Ms. Abigail P. Johnson. |
Michael E. Kenneally (57) |
| Year of Election or Appointment: 2009 Previously, Mr. Kenneally served as a Member of the Advisory Board for certain Fidelity Fixed Income and Asset Allocation Funds (2008-2009). Prior to his retirement, Mr. Kenneally served as Chairman and Global Chief Executive Officer of Credit Suisse Asset Management (2003-2005). Mr. Kenneally was a Director of the Credit Suisse Funds (U.S. mutual funds, 2004-2008) and certain other closed-end funds (2004-2005) and was awarded the Chartered Financial Analyst (CFA) designation in 1991. |
James H. Keyes (71) |
| Year of Election or Appointment: 2007 Mr. Keyes serves as a member of the Boards of Navistar International Corporation (manufacture and sale of trucks, buses, and diesel engines, since 2002) and Pitney Bowes, Inc. (integrated mail, messaging, and document management solutions, since 1998). Prior to his retirement, Mr. Keyes served as Chairman and Chief Executive Officer of Johnson Controls (automotive, building, and energy, 1998-2002) and as a member of the Board of LSI Logic Corporation (semiconductor technologies, 1984-2008). |
Marie L. Knowles (65) |
| Year of Election or Appointment: 2001 Prior to Ms. Knowles' retirement in June 2000, she served as Executive Vice President and Chief Financial Officer of Atlantic Richfield Company (ARCO) (diversified energy, 1996-2000). From 1993 to 1996, she was a Senior Vice President of ARCO and President of ARCO Transportation Company. She served as a Director of ARCO from 1996 to 1998. Ms. Knowles currently serves as a Director and Chairman of the Audit Committee of McKesson Corporation (healthcare service, since 2002). Ms. Knowles is an Honorary Trustee of the Brookings Institution and a member of the Board of the Catalina Island Conservancy and of the Santa Catalina Island Company (2009-present). She also serves as a member of the Advisory Board for the School of Engineering of the University of Southern California and the Foundation Board of the School of Architecture at the University of Virginia (2007-present). Previously, Ms. Knowles served as a Director of Phelps Dodge Corporation (copper mining and manufacturing, 1994-2007). |
Kenneth L. Wolfe (72) |
| Year of Election or Appointment: 2005 Mr. Wolfe is Chairman of the Independent Trustees of the Fixed Income and Asset Allocation Funds (2008-present). Prior to his retirement, Mr. Wolfe served as Chairman and a Director (2007-2009) and Chairman and Chief Executive Officer (1994-2001) of Hershey Foods Corporation. He also served as a member of the Boards of Adelphia Communications Corporation (telecommunications, 2003-2006), Bausch & Lomb, Inc. (medical/pharmaceutical, 1993-2007), and Revlon, Inc. (personal care products, 2004-2009). |
+ The information above includes each Trustee's principal occupation during the last five years and other information relating to the experience, attributes, and skills relevant to each Trustee's qualifications to serve as a Trustee, which led to the conclusion that each Trustee should serve as a Trustee for the fund.
Executive Officers:
Correspondence intended for each executive officer may be sent to Fidelity Investments, 82 Devonshire Street, Boston, Massachusetts 02109.
Name, Age; Principal Occupation |
John R. Hebble (53) |
| Year of Election or Appointment: 2008 President and Treasurer of Fidelity's Fixed Income and Asset Allocation Funds. Mr. Hebble also serves as President (2011-present), Treasurer, and Chief Financial Officer of The North Carolina Capital Management Trust: Cash and Term Portfolios (2008-present), Assistant Treasurer of other Fidelity funds (2009-present) and is an employee of Fidelity Investments. |
Christopher P. Sullivan (57) |
| Year of Election or Appointment: 2009 Vice President of Fidelity's Bond Funds. Mr. Sullivan also serves as President of Fidelity's Bond Division (2009-present). Mr. Sullivan is Executive Vice President of Fidelity Investments Money Management, Inc. (2009-present), and a Director of Fidelity Management & Research (U.K.) Inc. (2010-present). Previously, Mr. Sullivan served as Managing Director, Co-Head of U.S. Fixed Income at Goldman Sachs Asset Management (2001-2009). |
Christine J. Thompson (53) |
| Year of Election or Appointment: 2010 Vice President of Fidelity's Bond Funds. Ms. Thompson also serves as Chief Investment Officer of FMR's Bond Group (2010-present) and is an employee of Fidelity Investments. Previously, Ms. Thompson served as Director of Municipal Bond Portfolio Managers (2002-2010). |
Scott C. Goebel (43) |
| Year of Election or Appointment: 2008 Secretary and Chief Legal Officer (CLO) of the Fidelity funds. Mr. Goebel also serves as Secretary of Fidelity Investments Money Management, Inc. (FIMM) (2010-present) and Fidelity Research and Analysis Company (FRAC) (2010-present); Secretary and CLO of The North Carolina Capital Management Trust: Cash and Term Portfolios (2008-present); General Counsel, Secretary, and Senior Vice President of FMR (2008-present) and FMR Co., Inc. (2008-present); employed by FMR LLC or an affiliate (2001-present); Chief Legal Officer of Fidelity Management & Research (Hong Kong) Limited (2008-present) and Assistant Secretary of Fidelity Management & Research (Japan) Inc. (2008-present), and Fidelity Management & Research (U.K.) Inc. (2008-present). Previously, Mr. Goebel served as Assistant Secretary of FIMM (2008-2010), FRAC (2008-2010), and the Funds (2007-2008) and as Vice President and Secretary of Fidelity Distributors Corporation (FDC) (2005-2007). |
David J. Carter (38) |
| Year of Election or Appointment: 2010 Assistant Secretary of Fidelity's Fixed Income and Asset Allocation Funds. Mr. Carter also serves as Vice President, Associate General Counsel (2010-present) and is an employee of Fidelity Investments (2005-present). |
Holly C. Laurent (57) |
| Year of Election or Appointment: 2008 Anti-Money Laundering (AML) Officer of the Fidelity funds. Ms. Laurent also serves as AML Officer of The North Carolina Capital Management Trust: Cash and Term Portfolios (2008-present) and is an employee of Fidelity Investments. Previously, Ms. Laurent was Senior Vice President and Head of Legal for Fidelity Business Services India Pvt. Ltd. (2006-2008), and Senior Vice President, Deputy General Counsel and Group Head for FMR LLC (2005-2006). |
Christine Reynolds (53) |
| Year of Election or Appointment: 2008 Chief Financial Officer of the Fidelity funds. Ms. Reynolds became President of Fidelity Pricing and Cash Management Services (FPCMS) in August 2008. Ms. Reynolds served as Chief Operating Officer of FPCMS (2007-2008). Previously, Ms. Reynolds served as President, Treasurer, and Anti-Money Laundering officer of the Fidelity funds (2004-2007). |
Michael H. Whitaker (44) |
| Year of Election or Appointment: 2008 Chief Compliance Officer of Fidelity's Fixed Income and Asset Allocation Funds. Mr. Whitaker also serves as Chief Compliance Officer of The North Carolina Capital Management Trust: Cash and Term Portfolios (2008-present). Mr. Whitaker is an employee of Fidelity Investments (2007-present). Prior to joining Fidelity Investments, Mr. Whitaker worked at MFS Investment Management where he served as Senior Vice President and Chief Compliance Officer (2004-2006), and Assistant General Counsel. |
Jeffrey S. Christian (50) |
| Year of Election or Appointment: 2009 Deputy Treasurer of the Fidelity funds. Mr. Christian is an employee of Fidelity Investments. Previously, Mr. Christian served as Chief Financial Officer (2008-2009) of certain Fidelity funds and Senior Vice President of Fidelity Pricing and Cash Management Services (FPCMS) (2004-2009). |
Joseph F. Zambello (54) |
| Year of Election or Appointment: 2011 Deputy Treasurer of the Fidelity funds. Mr. Zambello is an employee of Fidelity Investments. Previously, Mr. Zambello served as Vice President of FMR's Program Management Group (2009-2011) and Vice President of the Transfer Agent Oversight Group (2005-2009). |
Stephanie J. Dorsey (42) |
| Year of Election or Appointment: 2008 Deputy Treasurer of Fidelity's Fixed Income and Asset Allocation Funds. Ms. Dorsey also serves as Assistant Treasurer of other Fidelity funds (2010-present) and is an employee of Fidelity Investments (2008-present). Previously, Ms. Dorsey served as Treasurer (2004-2008) of the JPMorgan Mutual Funds and Vice President (2004-2008) of JPMorgan Chase Bank. |
Adrien E. Deberghes (44) |
| Year of Election or Appointment: 2010 Assistant Treasurer of Fidelity's Fixed Income and Asset Allocation Funds. Mr. Deberghes also serves as Vice President and Assistant Treasurer of Fidelity Rutland Square Trust II and Fidelity Commonwealth Trust II (2011-present), Deputy Treasurer of other Fidelity funds (2008-present), and is an employee of Fidelity Investments (2008-present). Previously, Mr. Deberghes served as Senior Vice President of Mutual Fund Administration at State Street Corporation (2007-2008), Senior Director of Mutual Fund Administration at Investors Bank & Trust (2005-2007), and Director of Finance for Dunkin' Brands (2000-2005). |
Kenneth B. Robins (42) |
| Year of Election or Appointment: 2009 Assistant Treasurer of the Fidelity Fixed Income and Asset Allocation Funds. Mr. Robins also serves as President and Treasurer of other Fidelity funds (2008-present; 2010-present) and is an employee of Fidelity Investments (2004-present). Previously, Mr. Robins served as Deputy Treasurer of the Fidelity funds (2005-2008) and Treasurer and Chief Financial Officer of The North Carolina Capital Management Trust: Cash and Term Portfolios (2006-2008). |
Gary W. Ryan (53) |
| Year of Election or Appointment: 2005 Assistant Treasurer of the Fidelity funds. Mr. Ryan is an employee of Fidelity Investments. Previously, Mr. Ryan served as Vice President of Fund Reporting in Fidelity Pricing and Cash Management Services (FPCMS) (1999-2005). |
Jonathan Davis (43) |
| Year of Election or Appointment: 2010 Assistant Treasurer of the Fidelity funds. Mr. Davis is also Assistant Treasurer of Fidelity Rutland Square Trust II and Fidelity Commonwealth Trust II. Mr. Davis is an employee of Fidelity Investments. Previously, Mr. Davis served as Vice President and Associate General Counsel of FMR LLC (2003-2010). |
Not Part of Financial Report
Distributions (Unaudited)
The Board of Trustees of VIP Investment Grade Central Fund voted to pay on February 10, 2012, to shareholders of record at the opening of business on February 10, 2012 a distribution of $0.265 per share derived from capital gains realized from sales of portfolio securities.
The fund hereby designates as a capital gain dividend with respect to the taxable year ended December 31, 2011 $27,847,127, or, if subsequently determined to be different, the net capital gain of such year.
A total of 14.05% of the dividends distributed during the fiscal year was derived from interest on U.S. Government securities which is generally exempt from state income tax.
Not Part of Financial Report
Board Approval of Investment Advisory Contracts and Management Fees
VIP Investment Grade Central Fund
Each year, the Board of Trustees, including the Independent Trustees (together, the Board), votes on the renewal of the management contract and sub-advisory agreements (together, the Advisory Contracts) for the fund. The Board, assisted by the advice of fund counsel and Independent Trustees' counsel, requests and considers a broad range of information relevant to the renewal of the Advisory Contracts throughout the year.
The Board meets regularly and considers at each of its meetings factors that are relevant to its annual consideration of the renewal of the fund's Advisory Contracts, including the services and support provided to the fund and its shareholders. The Board has established three standing committees, Operations, Audit, and Nominating and Governance, each composed of Independent Trustees with varying backgrounds, to which the Board has assigned specific subject matter responsibilities in order to enhance effective decision-making by the Board. The Operations Committee, of which all of the Independent Trustees are members, meets regularly throughout the year and, among other matters, considers matters specifically related to the annual consideration of the renewal of the fund's Advisory Contracts. The Board, acting directly and through its Committees, requests and receives information concerning the annual consideration of the renewal of the fund's Advisory Contracts. The Board also meets as needed to consider matters specifically related to the Board's annual consideration of the renewal of Advisory Contracts. Members of the Board may also meet with trustees of other Fidelity funds through ad hoc joint committees to discuss certain matters relevant to the Fidelity funds.
At its September 2011 meeting, the Board of Trustees, including the Independent Trustees, unanimously determined to renew the fund's Advisory Contracts. In reaching its determination, the Board considered all factors it believed relevant and reached a determination, with the assistance of fund counsel and Independent Trustees' counsel and through the exercise of its business judgment, that the renewal of the Advisory Contracts is in the best interests of the fund and its shareholders and that the lack of compensation payable under the management contract is fair and reasonable.
Nature, Extent, and Quality of Services Provided. The Board considered the staffing within the investment adviser, Fidelity Investments Money Management, Inc., and the sub-advisers (together, the Investment Advisers), including the backgrounds of the fund's investment personnel and the fund's investment objective and discipline. The Independent Trustees also had discussions with senior management of Fidelity's investment operations and investment groups. The Board considered the structure of the portfolio manager compensation program and whether this structure provides appropriate incentives to act in the best interests of the fund.
Resources Dedicated to Investment Management and Support Services. The Board reviewed the general qualifications and capabilities of the Investment Advisers' investment staff, including its size, education, experience, and resources, as well as the Investment Advisers' approach to recruiting, managing, and compensating investment personnel. The Board also noted that Fidelity Management & Research Company (FMR) has devoted increased resources to non U.S. offices. The Board noted that Fidelity's analysts have extensive resources, tools and capabilities which allow them to conduct sophisticated quantitative and fundamental analysis, as well as credit analysis of issuers, counterparties and enhancers. The Board also believes that Fidelity's investment professionals have sufficient access to global information and data so as to provide competitive investment results over time, and that those professionals also have access to sophisticated tools which permit them to assess portfolio construction and risk and performance attribution characteristics continuously, as well as to transmit new information and research conclusions rapidly around the world. Additionally, in its deliberations, the Board considered the Investment Advisers' trading capabilities and resources which are an integral part of the investment management process.
Administrative Services. The Board considered (i) the nature, extent, quality, and cost of advisory and administrative services performed by the Investment Advisers and their affiliates under the Advisory Contracts and under separate agreements covering transfer agency, pricing and bookkeeping, and securities lending services for the fund; (ii) the nature and extent of the investment adviser's supervision of third party service providers, principally custodians and subcustodians; and (iii) the resources devoted to, and the record of compliance with, the fund's compliance policies and procedures.
Investment Performance. The Board considered whether the fund has operated in accordance with its investment objective, as well as its record of compliance with its investment restrictions. The Board reviewed the fund's absolute investment performance, as well as the fund's relative investment performance, but did not consider performance to be a material factor in its decision to renew the fund's Advisory Contracts. The Board noted that the fund is designed to offer a liquid investment option for other investment companies and accounts managed by FMR or its affiliates and ultimately to enhance the performance of those investment companies and accounts.
Based on its review, the Board concluded that the nature, extent, and quality of services provided to the fund under the Advisory Contracts should benefit the fund's shareholders.
Competitiveness of Management Fee and Total Expense Ratio. The Board considered that while the fund does not pay a management fee, FMR pays a management fee on behalf of the fund and receives fees for providing services to funds that invest in the fund. The Board also noted that FMR bears all expenses of the fund, except expenses related to the fund's investment activities (primarily custody expenses). Based on its review, the Board concluded that the management fee paid on behalf of the fund and the fund's total expense ratio were reasonable in light of the services that the fund and its shareholders receive and the other factors considered.
Not Part of Financial Report
Board Approval of Investment Advisory Contracts and Management Fees - continued
Costs of the Services and Profitability. The Board considered the level of Fidelity's profits in respect of all the Fidelity funds, as well as the profitability of each fund that invests in this fund.
PricewaterhouseCoopers LLP (PwC), independent registered public accounting firm and auditor to Fidelity and certain Fidelity funds, has been engaged annually by the Board as part of the Board's assessment of Fidelity's profitability analysis. PwC's engagement includes the review and assessment of Fidelity's methodologies used in determining the revenues and expenses attributable to Fidelity's mutual fund business, and completion of agreed-upon procedures surrounding the mathematical accuracy of fund profitability and its conformity to allocation methodologies. After considering PwC's reports issued under the engagement and information provided by Fidelity, the Board concluded that while other allocation methods may also be reasonable, Fidelity's profitability methodologies are reasonable in all material respects.
The Board also reviewed Fidelity's non-fund businesses and fall-out benefits related to the mutual fund business as well as cases where Fidelity's affiliates may benefit from or be related to the fund's business.
The Board concluded that the costs of the services provided by and the profits realized by Fidelity in connection with the operation of the fund were not relevant to the renewal of the Advisory Contracts because the fund pays no advisory fees and FMR bears all expenses of the fund, except expenses related to the fund's investment activities.
Economies of Scale. The Board concluded that because the fund pays no advisory fees and FMR bears all expenses of the fund, except expenses related to the fund's investment activities, economies of scale cannot be realized by the fund.
Additional Information Requested by the Board. In order to develop fully the factual basis for consideration of the Fidelity funds' Advisory Contracts, the Board requested and received additional information on certain topics, including: (i) Fidelity's fund profitability methodology, profitability trends for certain funds, and the impact of certain factors on fund profitability results; (ii) portfolio manager changes that have occurred during the past year and the amount of the investment that each portfolio manager has made in the Fidelity fund(s) that he or she manages; (iii) Fidelity's compensation structure for portfolio managers, research analysts, and other key personnel, including its effects on fund profitability, the rationale for the compensation structure, and the extent to which current market conditions have affected retention and recruitment; (iv) the compensation paid to fund sub-advisers on behalf of the Fidelity funds; (v) Fidelity's fee structures and rationale for recommending different fees among different categories of funds and classes, as well as Fidelity's voluntary waiver of its fees to maintain minimum yields for certain money market funds and classes; (vi) the reasons why certain expenses affect various funds and classes differently; (vii) Fidelity's transfer agent fees, expenses, and services and how the benefits of decreased costs and new efficiencies can be shared across all of the Fidelity funds; (viii) the reasons for and consequences of changes to certain product lines compared to competitors; (ix) the allocation of and historical trends in Fidelity's realization of fall-out benefits; and (x) explanations regarding the relative total expense ratios of certain funds and classes, total expense competitive trends, and actions that might be taken by FMR to reduce total expense ratios for certain funds and classes or to achieve further economies of scale.
Based on its evaluation of all of the conclusions noted above, and after considering all factors it believed relevant, the Board ultimately concluded that the advisory fee structures are fair and reasonable, and that the fund's Advisory Contracts should be renewed.
Not Part of Financial Report
Annual Report
Investment Adviser
Fidelity Management & Research Company
Boston, MA
Investment Sub-Adviser
Fidelity Investments Money Management, Inc.
Fidelity Management & Research (U.K.) Inc.
Fidelity Management & Research (Hong Kong) Limited
Fidelity Management & Research (Japan) Inc.
General Distributor
Fidelity Distributors Corporation
Boston, MA
Transfer and Service Agents
Fidelity Investments Institutional Operations Co., Inc.
Boston, MA
Fidelity Service Company, Inc.
Boston, MA
Custodian
The Bank of New York Mellon
New York, NY
VIPIGB-ANN-0212
1.540025.114
Fidelity® Variable Insurance Products:
Investor Freedom® Funds -
Income, 2005, 2010, 2015, 2020, 2025, 2030
Annual Report
December 31, 2011
Contents
To view a fund's proxy voting guidelines and proxy voting record for the 12-month period ended June 30, visit http://www.fidelity.com/proxyvotingresults or visit the Securities and Exchange Commission's (SEC) web site at http://www.sec.gov. You may also call 1-877-208-0098 to request a free copy of the proxy voting guidelines.
Fidelity Variable Insurance Products are separate account options which are purchased through a variable insurance contract.
Standard & Poor's, S&P and S&P 500 are registered service marks of The McGraw-Hill Companies, Inc. and have been licensed for use by Fidelity Distributors Corporation.
Other third party marks appearing herein are the property of their respective owners.
All other marks appearing herein are registered or unregistered trademarks or service marks of FMR LLC or an affiliated company.
Annual Report
This report and the financial statements contained herein are submitted for the general information of the shareholders of the funds. This report is not authorized for distribution to prospective investors in the funds unless preceded or accompanied by an effective prospectus.
A fund files its complete schedule of portfolio holdings with the SEC for the first and third quarters of each fiscal year on Form N-Q. Forms N-Q are available on the SEC's web site at http://www.sec.gov. A fund's Forms N-Q may be reviewed and copied at the SEC's Public Reference Room in Washington, DC. Information regarding the operation of the SEC's Public Reference Room may be obtained by calling 1-800-SEC-0330. For a complete list of a fund's portfolio holdings, view the most recent holdings listing, semiannual report, or annual report on Fidelity's web site at http://www.fidelity.com, http://www.advisor.fidelity.com, or http://401k.com, as applicable.
NOT FDIC INSURED • MAY LOSE VALUE • NO BANK GUARANTEE
Neither the funds nor Fidelity Distributors Corporation is a bank.
Annual Report
VIP Investor Freedom Income PortfolioSM
Average annual total return reflects the change in the value of an investment, assuming reinvestment of the fund's distributions from dividend income and capital gains (the profits earned upon the sale of securities that have grown in value, if any) and assuming a constant rate of performance each year. During periods of reimbursement by Fidelity, a fund's total return will be greater than it would be had the reimbursement not occurred. Performance numbers are net of all underlying fund operating expenses, but do not include any insurance charges imposed by your insurance company's separate account. If performance information included the effect of these additional charges, the total returns would have been lower. How a fund did yesterday is no guarantee of how it will do tomorrow.
Average Annual Total Returns
Periods ended December 31, 2011 | Past 1
year | Past 5
years | Life of
fund A |
VIP Investor Freedom Income PortfolioSM | 1.54% | 3.53% | 4.03% |
A From August 3, 2005.
$10,000 Over Life of Fund
Let's say hypothetically that $10,000 was invested in VIP Investor Freedom Income Portfolio on August 3, 2005, when the fund started. The chart shows how the value of your investment would have changed, and also shows how the Barclays Capital® U.S. Aggregate Bond Index performed over the same period.
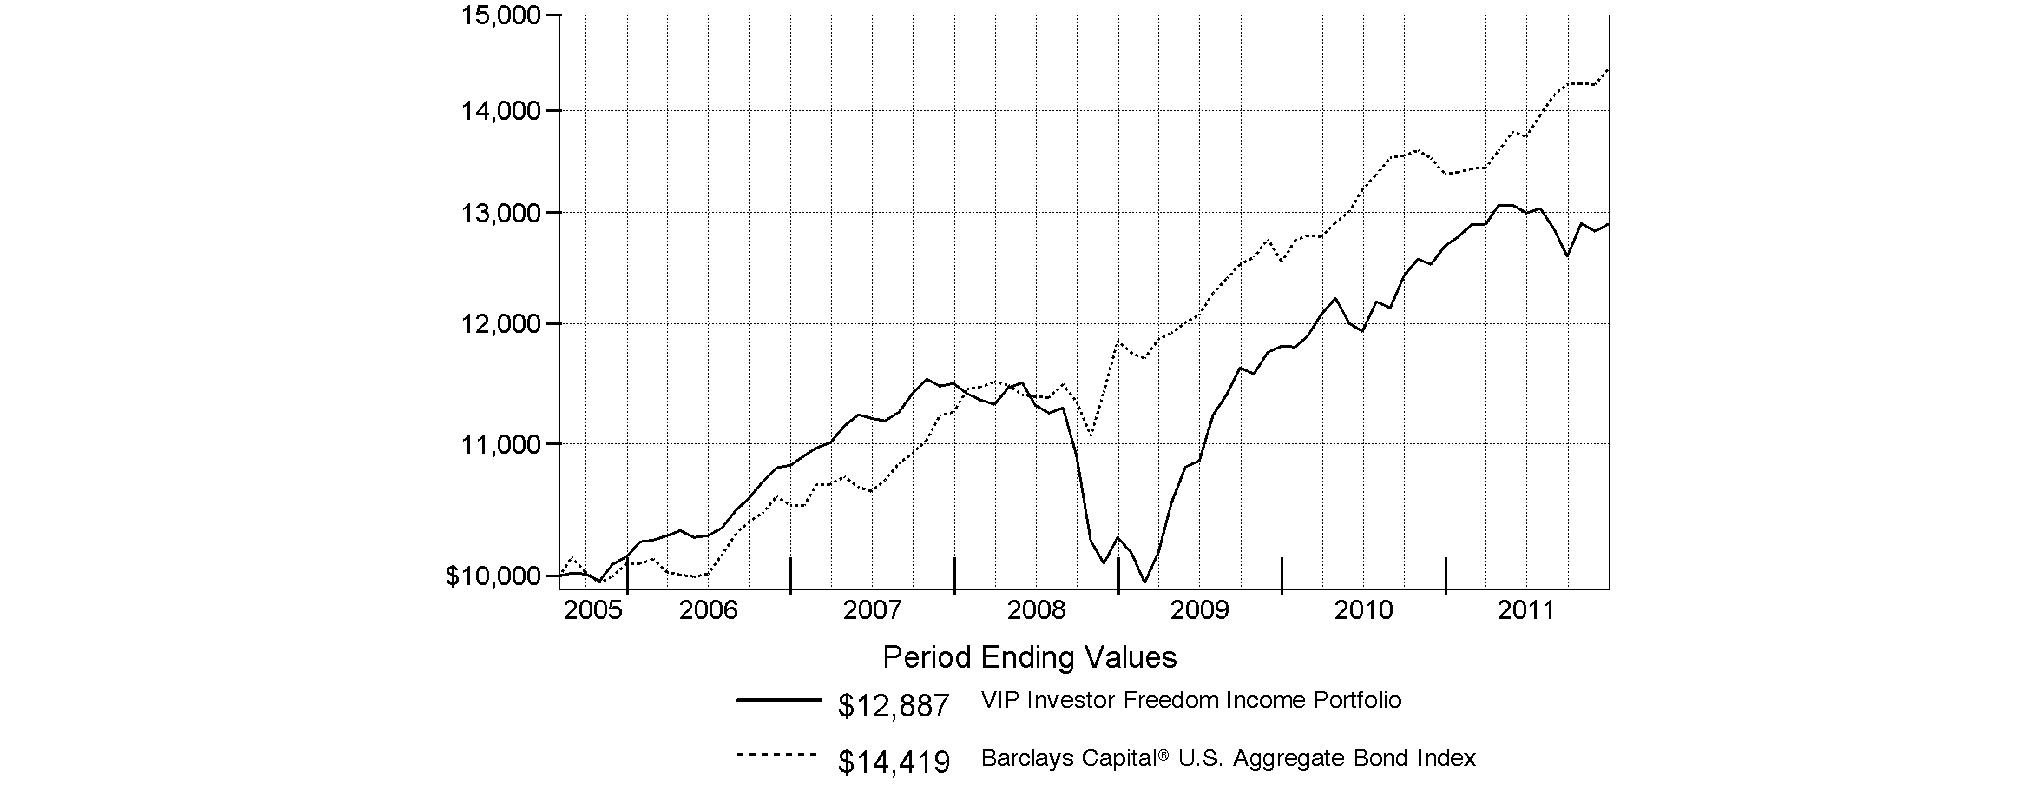
Annual Report
VIP Investor Freedom 2005 PortfolioSM
Performance: The Bottom Line
Average annual total return reflects the change in the value of an investment, assuming reinvestment of the fund's distributions from dividend income and capital gains (the profits earned upon the sale of securities that have grown in value, if any) and assuming a constant rate of performance each year. During periods of reimbursement by Fidelity, a fund's total return will be greater than it would be had the reimbursement not occurred. Performance numbers are net of all underlying fund operating expenses, but do not include any insurance charges imposed by your insurance company's separate account. If performance information included the effect of these additional charges, the total returns would have been lower. How a fund did yesterday is no guarantee of how it will do tomorrow.
Average Annual Total Returns
Periods ended December 31, 2011 | Past 1
year | Past 5
years | Life of
fund A |
VIP Investor Freedom 2005 PortfolioSM | 0.02% | 2.46% | 3.78% |
A From August 3, 2005.
$10,000 Over Life of Fund
Let's say hypothetically that $10,000 was invested in VIP Investor Freedom 2005 Portfolio on August 3, 2005, when the fund started. The chart shows how the value of your investment would have changed, and also shows how the Barclays Capital U.S. Aggregate Bond Index performed over the same period.
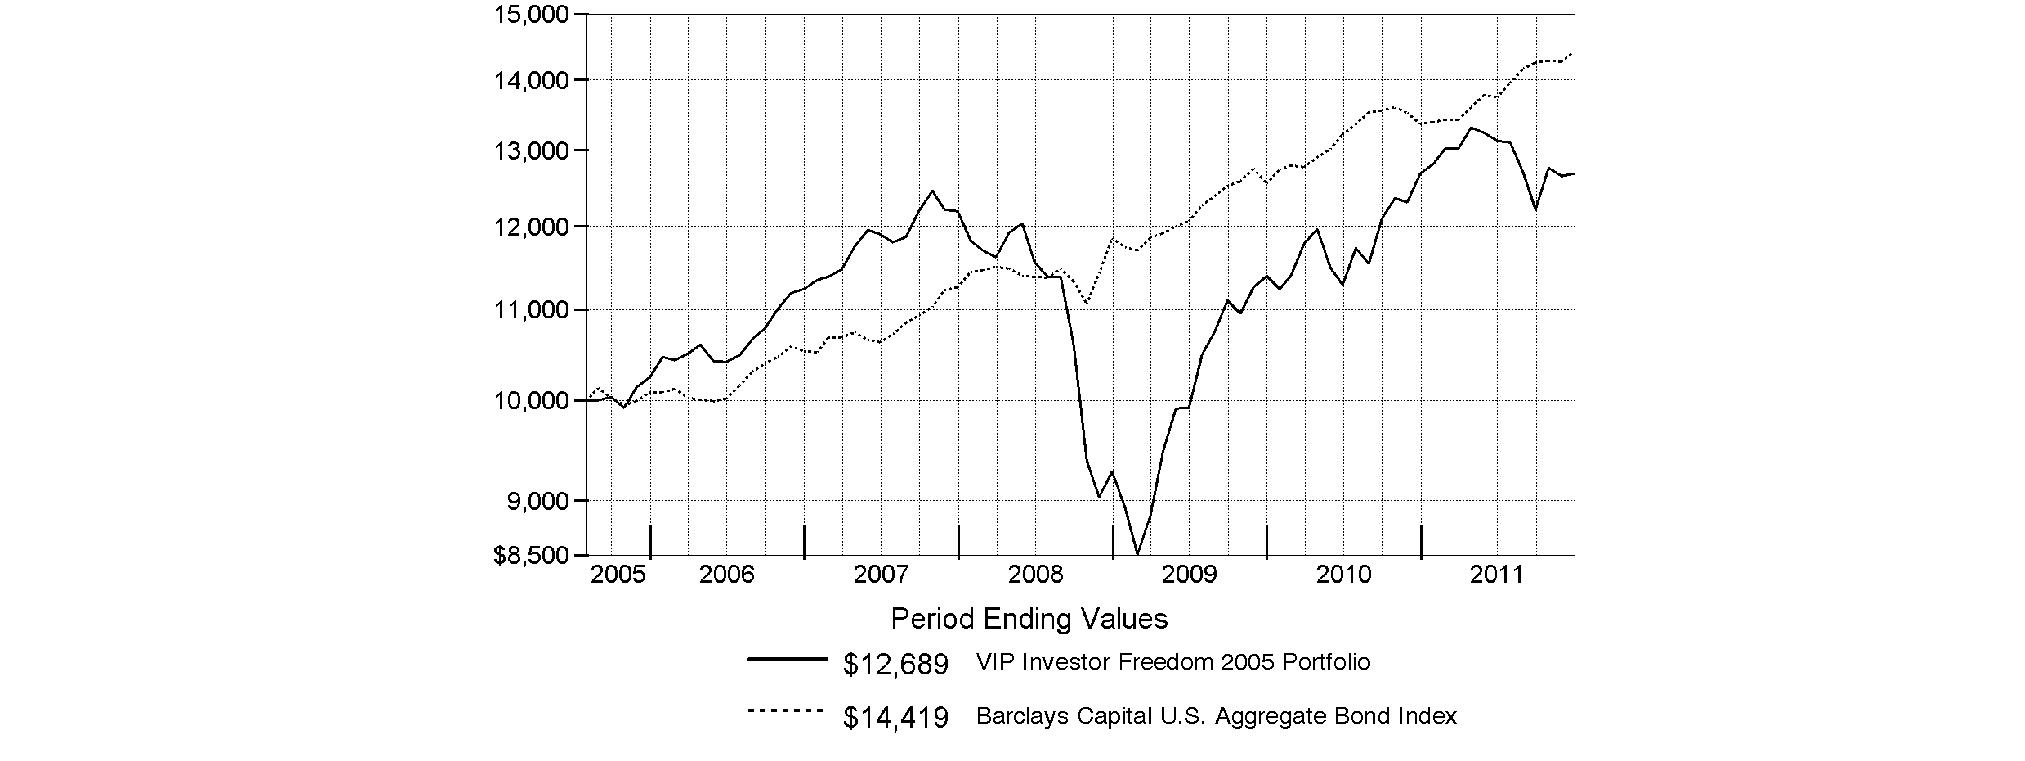
Annual Report
VIP Investor Freedom 2010 PortfolioSM
Performance: The Bottom Line
Average annual total return reflects the change in the value of an investment, assuming reinvestment of the fund's distributions from dividend income and capital gains (the profits earned upon the sale of securities that have grown in value, if any) and assuming a constant rate of performance each year. During periods of reimbursement by Fidelity, a fund's total return will be greater than it would be had the reimbursement not occurred. Performance numbers are net of all underlying fund operating expenses, but do not include any insurance charges imposed by your insurance company's separate account. If performance information included the effect of these additional charges, the total returns would have been lower. How a fund did yesterday is no guarantee of how it will do tomorrow.
Average Annual Total Returns
Periods ended December 31, 2011 | Past 1
year | Past 5
years | Life of
fund A |
VIP Investor Freedom 2010 PortfolioSM | -0.35% | 2.61% | 3.90% |
A From August 3, 2005.
$10,000 Over Life of Fund
Let's say hypothetically that $10,000 was invested in VIP Investor Freedom 2010 Portfolio on August 3, 2005, when the fund started. The chart shows how the value of your investment would have changed, and also shows how the Barclays Capital U.S. Aggregate Bond Index performed over the same period.
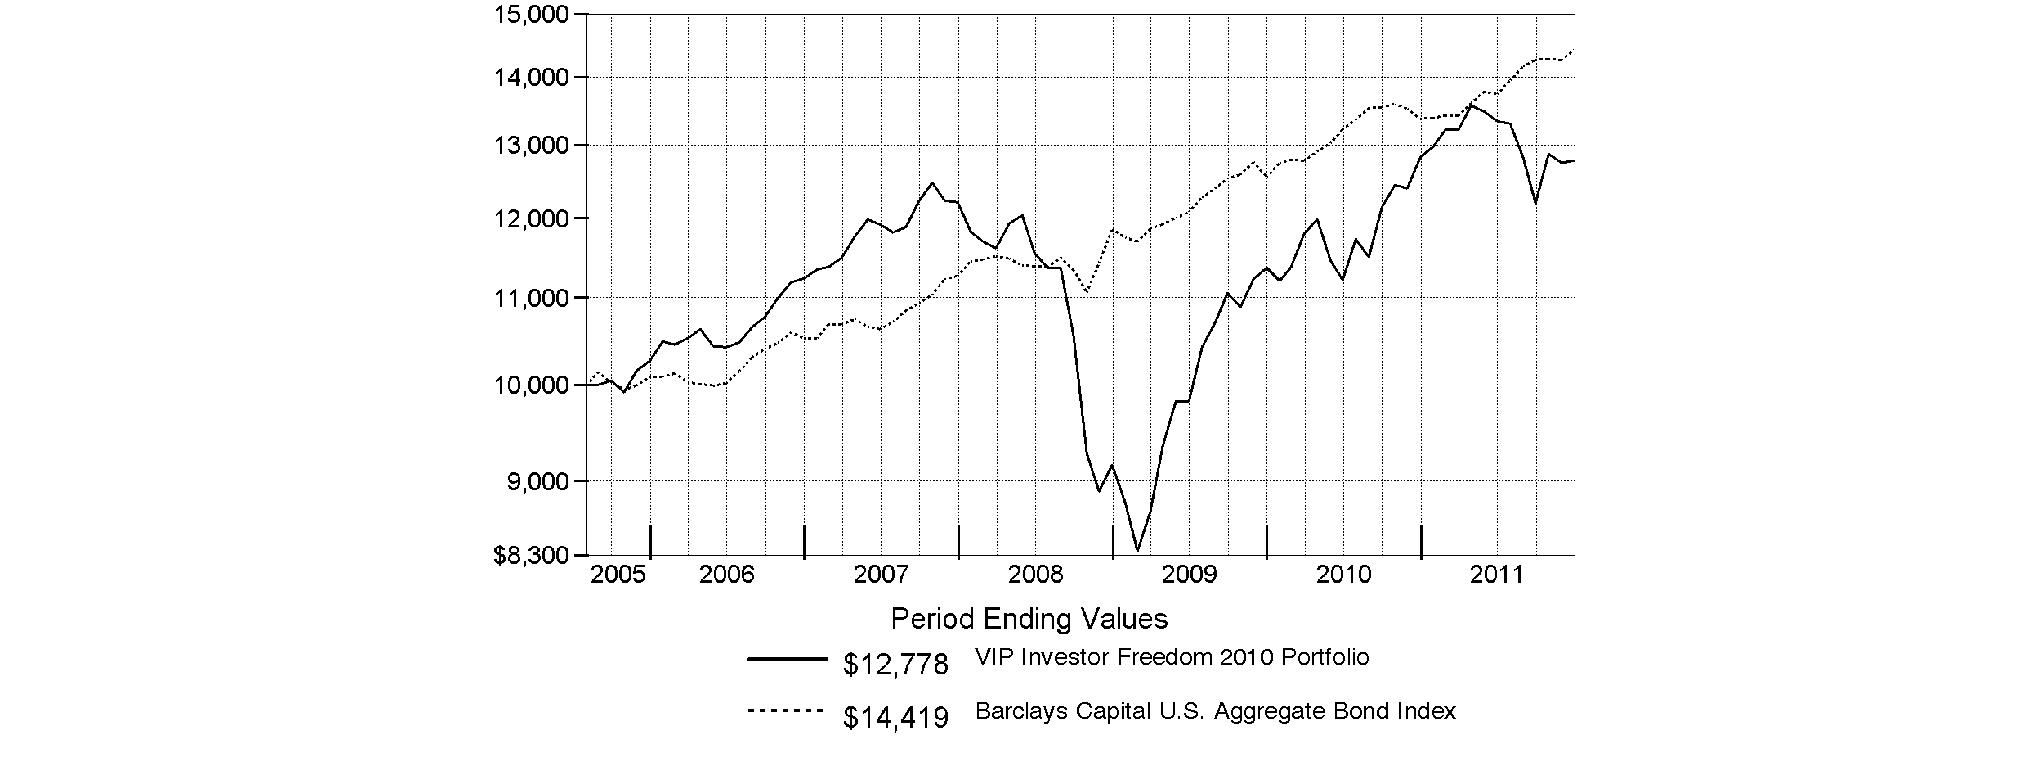
Annual Report
VIP Investor Freedom 2015 PortfolioSM
Performance: The Bottom Line
Average annual total return reflects the change in the value of an investment, assuming reinvestment of the fund's distributions from dividend income and capital gains (the profits earned upon the sale of securities that have grown in value, if any) and assuming a constant rate of performance each year. During periods of reimbursement by Fidelity, a fund's total return will be greater than it would be had the reimbursement not occurred. Performance numbers are net of all underlying fund operating expenses, but do not include any insurance charges imposed by your insurance company's separate account. If performance information included the effect of these additional charges, the total returns would have been lower. How a fund did yesterday is no guarantee of how it will do tomorrow.
Average Annual Total Returns
Periods ended December 31, 2011 | Past 1
year | Past 5
years | Life of
fund A |
VIP Investor Freedom 2015 PortfolioSM | -0.33% | 2.37% | 4.00% |
A From August 3, 2005.
$10,000 Over Life of Fund
Let's say hypothetically that $10,000 was invested in VIP Investor Freedom 2015 Portfolio on August 3, 2005, when the fund started. The chart shows how the value of your investment would have changed, and also shows how the S&P 500® Index performed over the same period.
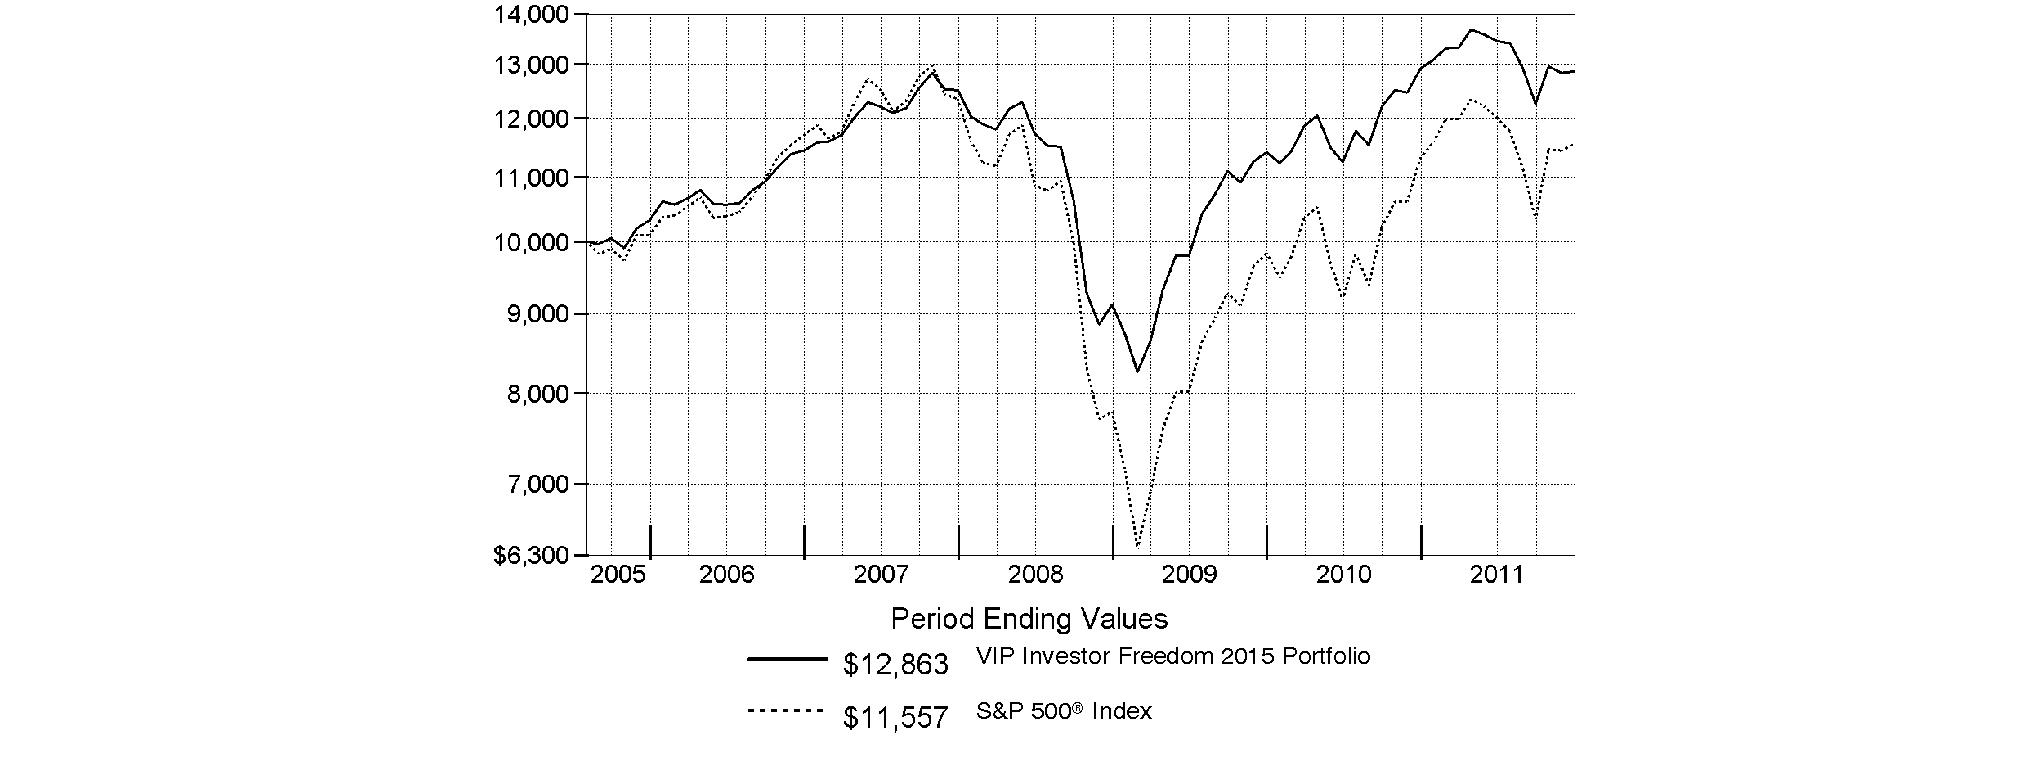
Annual Report
VIP Investor Freedom 2020 PortfolioSM
Performance: The Bottom Line
Average annual total return reflects the change in the value of an investment, assuming reinvestment of the fund's distributions from dividend income and capital gains (the profits earned upon the sale of securities that have grown in value, if any) and assuming a constant rate of performance each year. During periods of reimbursement by Fidelity, a fund's total return will be greater than it would be had the reimbursement not occurred. Performance numbers are net of all underlying fund operating expenses, but do not include any insurance charges imposed by your insurance company's separate account. If performance information included the effect of these additional charges, the total returns would have been lower. How a fund did yesterday is no guarantee of how it will do tomorrow.
Average Annual Total Returns
Periods ended December 31, 2011 | Past 1
year | Past 5
years | Life of
fund A |
VIP Investor Freedom 2020 PortfolioSM | -1.11% | 1.59% | 3.58% |
A From August 3, 2005.
$10,000 Over Life of Fund
Let's say hypothetically that $10,000 was invested in VIP Investor Freedom 2020 Portfolio on August 3, 2005, when the fund started. The chart shows how the value of your investment would have changed, and also shows how the S&P 500 Index performed over the same period.
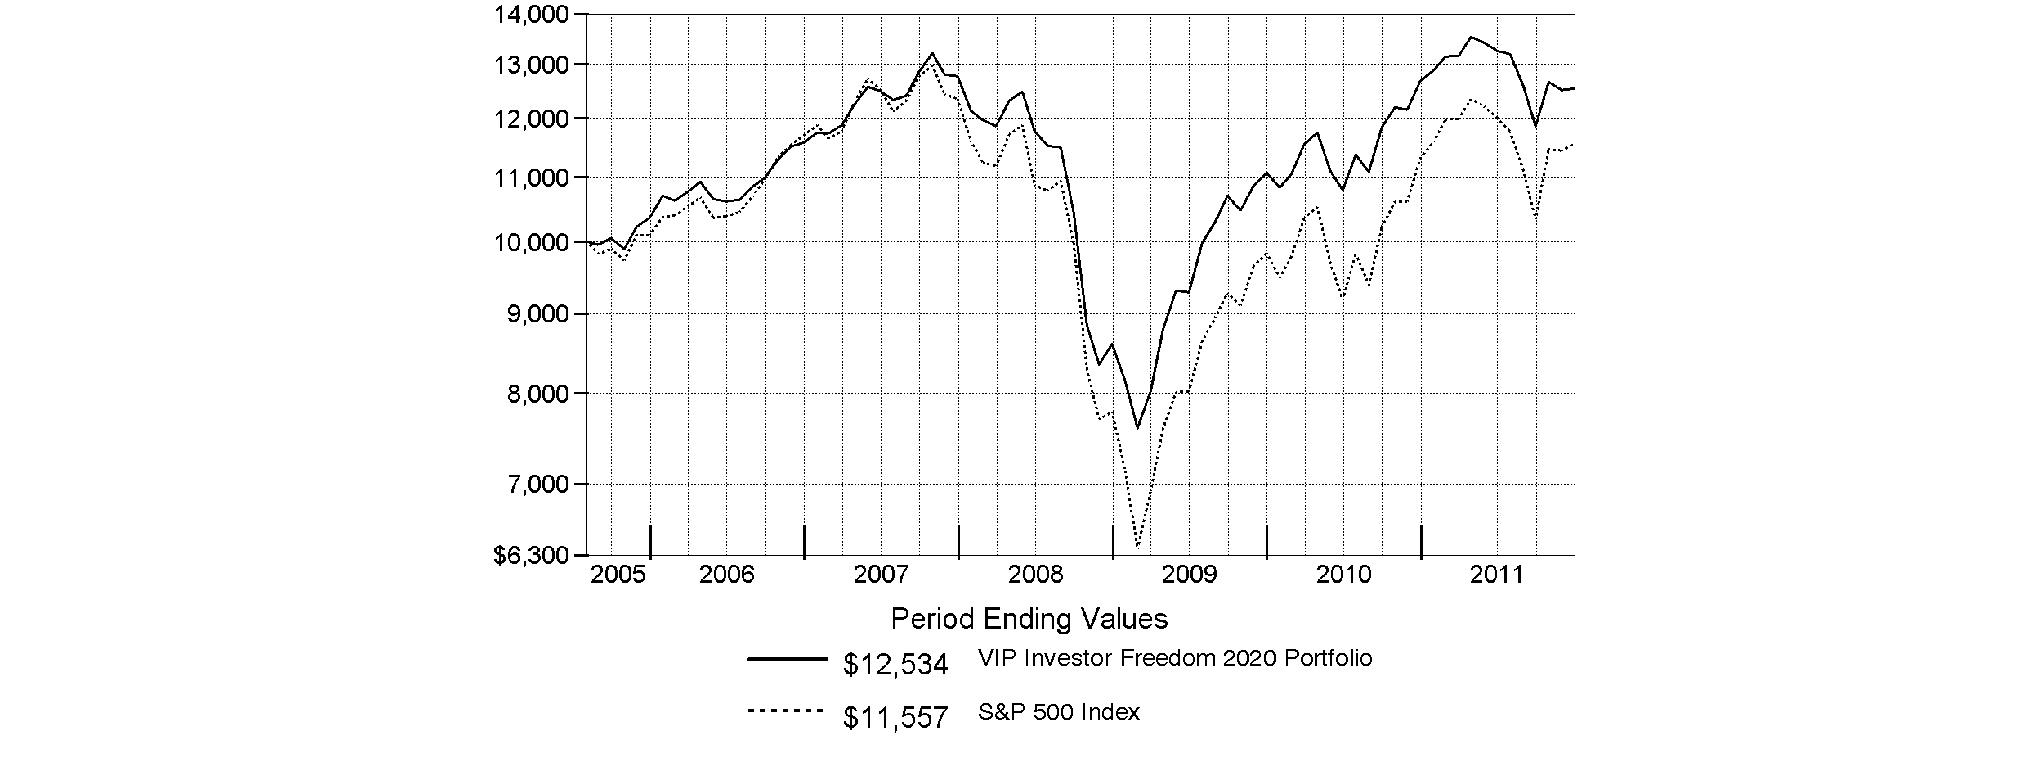
Annual Report
VIP Investor Freedom 2025 PortfolioSM
Performance: The Bottom Line
Average annual total return reflects the change in the value of an investment, assuming reinvestment of the fund's distributions from dividend income and capital gains (the profits earned upon the sale of securities that have grown in value, if any) and assuming a constant rate of performance each year. During periods of reimbursement by Fidelity, a fund's total return will be greater than it would be had the reimbursement not occurred. Performance numbers are net of all underlying fund operating expenses, but do not include any insurance charges imposed by your insurance company's separate account. If performance information included the effect of these additional charges, the total returns would have been lower. How a fund did yesterday is no guarantee of how it will do tomorrow.
Average Annual Total Returns
Periods ended December 31, 2011 | Past 1
year | Past 5
years | Life of
fund A |
VIP Investor Freedom 2025 PortfolioSM | -2.28% | 1.32% | 3.48% |
A From August 3, 2005.
$10,000 Over Life of Fund
Let's say hypothetically that $10,000 was invested in VIP Investor Freedom 2025 Portfolio on August 3, 2005, when the fund started. The chart shows how the value of your investment would have changed, and also shows how the S&P 500 Index performed over the same period.
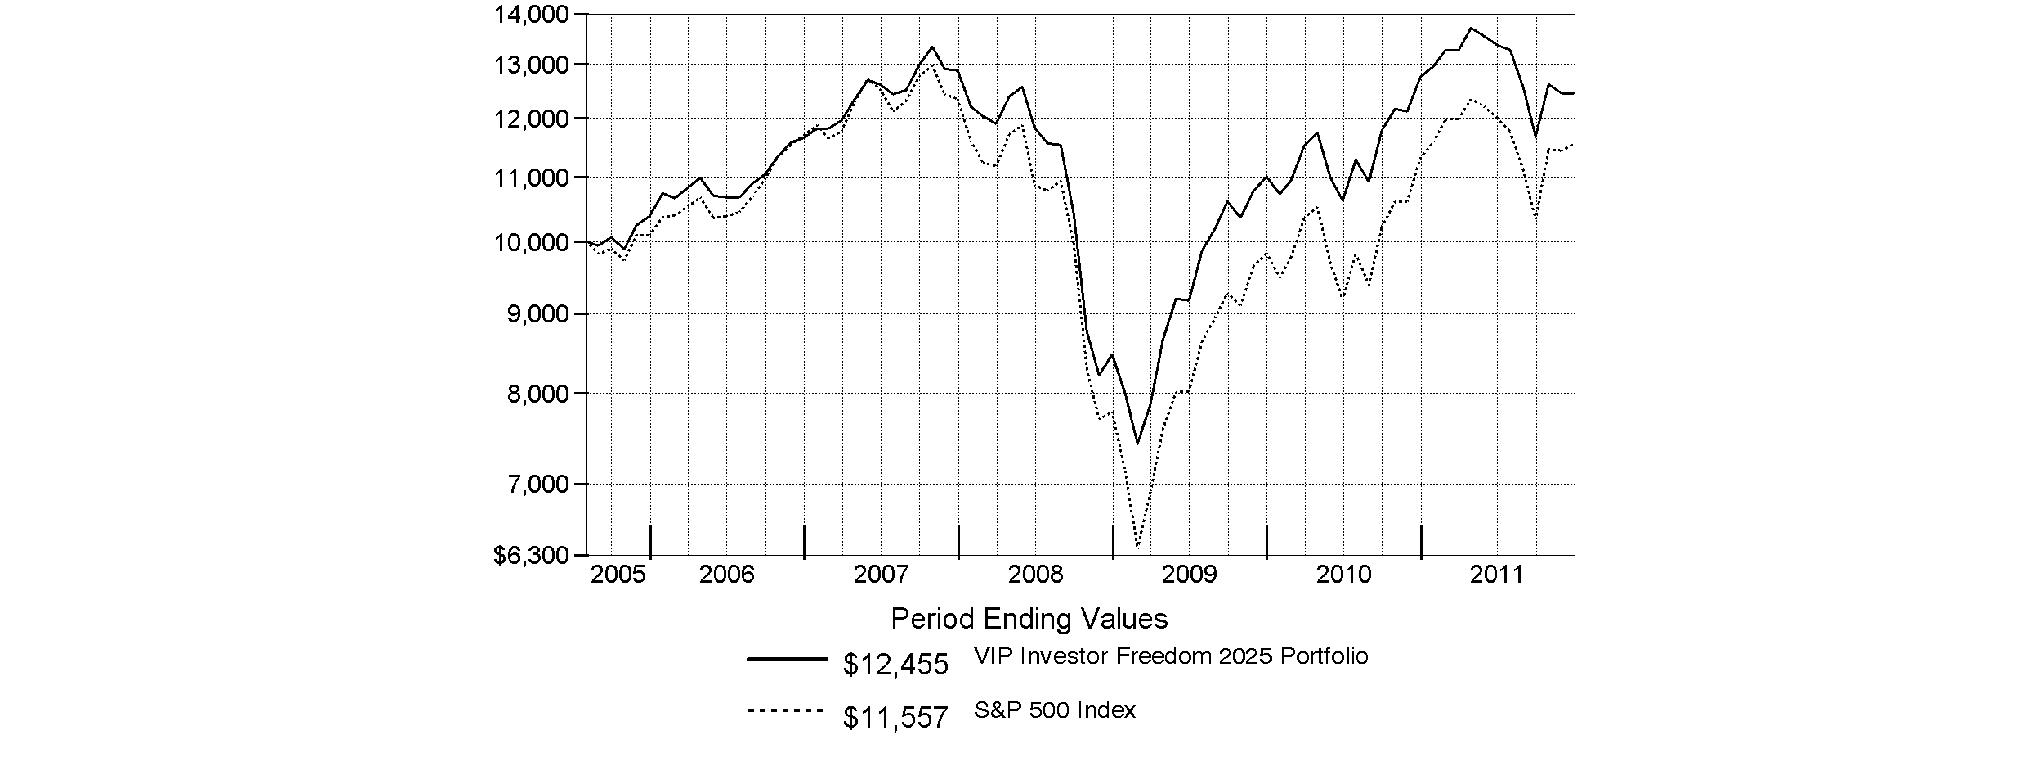
Annual Report
VIP Investor Freedom 2030 PortfolioSM
Performance: The Bottom Line
Average annual total return reflects the change in the value of an investment, assuming reinvestment of the fund's distributions from dividend income and capital gains (the profits earned upon the sale of securities that have grown in value, if any) and assuming a constant rate of performance each year. During periods of reimbursement by Fidelity, a fund's total return will be greater than it would be had the reimbursement not occurred. Performance numbers are net of all underlying fund operating expenses, but do not include any insurance charges imposed by your insurance company's separate account. If performance information included the effect of these additional charges, the total returns would have been lower. How a fund did yesterday is no guarantee of how it will do tomorrow.
Average Annual Total Returns
Periods ended December 31, 2011 | Past 1
year | Past 5
years | Life of
fund A |
VIP Investor Freedom 2030 PortfolioSM | -2.78% | 0.45% | 2.96% |
A From August 3, 2005.
$10,000 Over Life of Fund
Let's say hypothetically that $10,000 was invested in VIP Investor Freedom 2030 Portfolio on August 3, 2005, when the fund started. The chart shows how the value of your investment would have changed, and also shows how the S&P 500 Index performed over the same period.
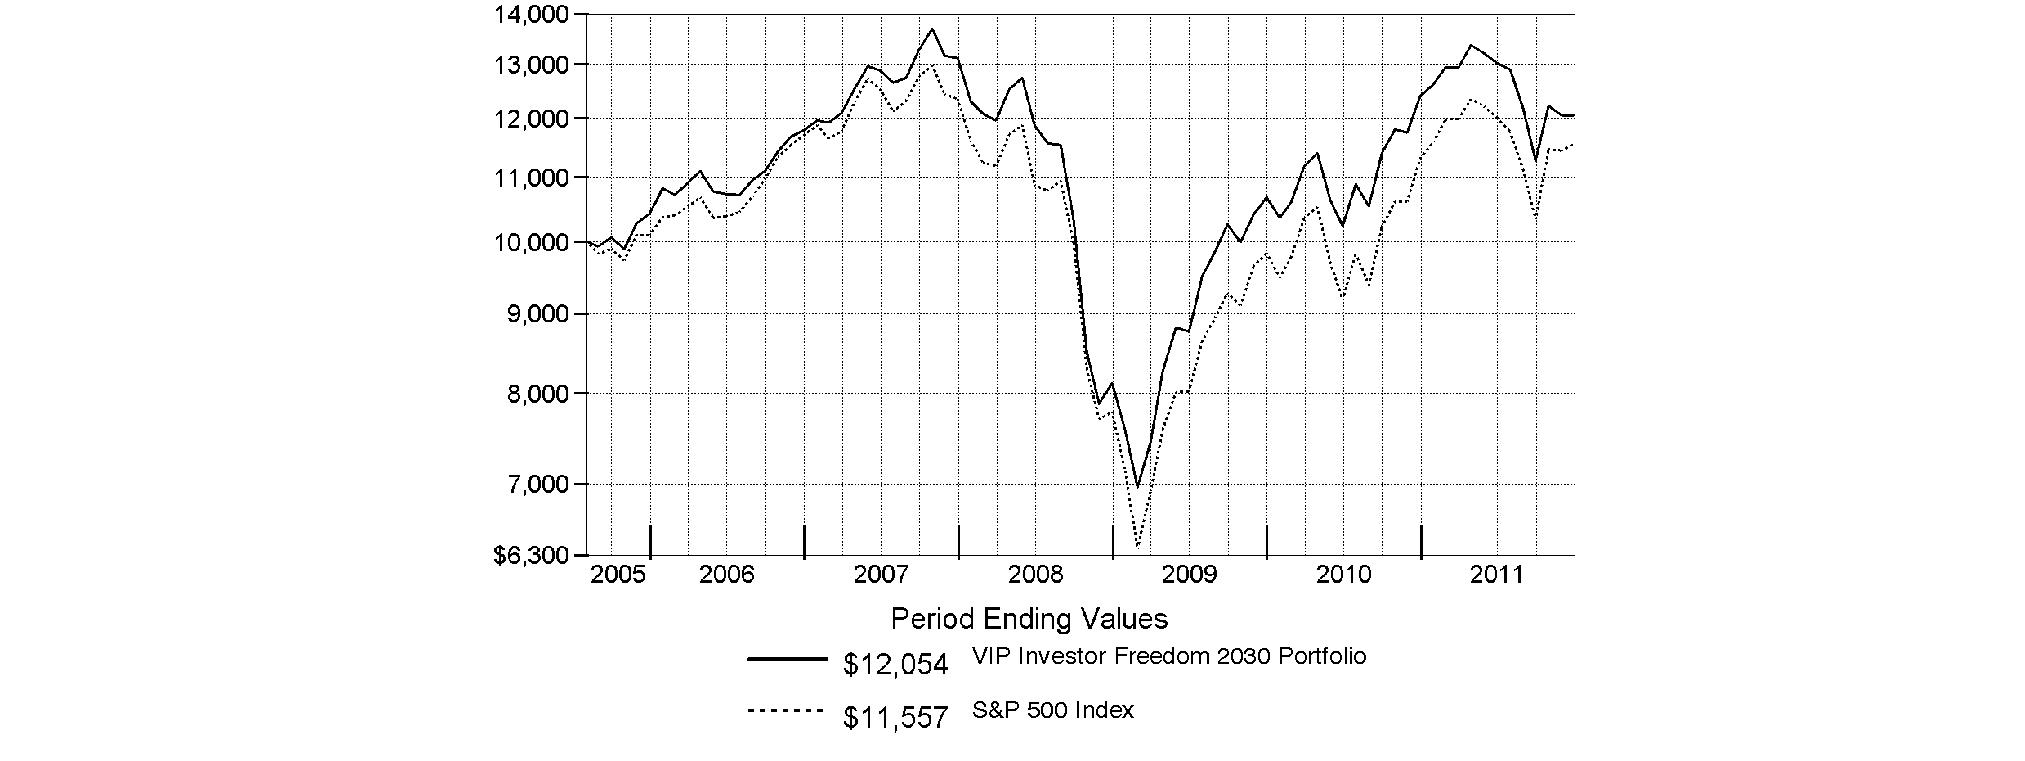
Annual Report
Market Recap: Extreme market volatility took center stage during the 12 months ending December 31, 2011, stealing the spotlight from signs of progress in the global economy. Early in the year, aggressive monetary stimulus by the U.S. federal government, improving credit-market conditions and solid corporate earnings buoyed most major asset classes. As the period progressed, however, fresh worries about sovereign debt in Europe, inflation in China, gridlock over raising the debt ceiling in the U.S. - along with Standard & Poor's early-August downgrade of the nation's long-term sovereign credit rating - and a dimmed outlook for global growth punctured investor confidence and ignited market instability. Domestic equities, as measured by the broad-based S&P 500® Index, gained 2.11%, easily outpaced the 13.61% decline of MSCI® ACWI® (All Country World Index) ex USA Index, a proxy for foreign stocks. Within the MSCI index, emerging markets declined the most (-18%), with investments here generally held back by a stronger U.S. dollar. The U.K. (-3%) fared better than the rest of Europe (-15%), which was the second-worst-performing index component. Bolstered by periodic flights to quality, U.S. investment-grade bonds posted a 7.84% advance, as reflected by the Barclays Capital® U.S. Aggregate Bond Index, outperforming the 4.37% gain of high-yield securities, as represented by The BofA Merrill LynchSM US High Yield Constrained Index. Hampered by financial woes in Europe, the sovereign debt of major developed markets outside the U.S. rose 4.86%, according to the Citigroup® Non-USD Group-of-Seven (G7) Equal Weighted Index, while the JPMorgan Emerging Markets Bond Index Global (EMBI Global) advanced 8.46%, despite the currency head wind.
Comments from Christopher Sharpe, Co-Portfolio Manager of VIP Investor Freedom Funds, and Andrew Dierdorf, who became Co-Portfolio Manager on June 21, 2011: For the year ending December 31, 2011, only the two shortest-dated, most-conservative Funds - VIP Investor Freedom Income Fund and VIP Investor Freedom 2005 Fund - delivered a positive absolute return. VIP Investor Freedom Income Fund fared best, buoyed by its higher allocation to investment-grade bonds, which performed very well during the year. In contrast, the more-equity-focused Funds declined. VIP Investor Freedom 2030 Fund, which has the highest allocation to U.S. and non-U.S. equities, saw the biggest decline. (For specific Fund results, please refer to the performance section of this report.) As volatility picked up throughout the year, returns for equities seesawed. The Funds' underlying equity funds - both U.S. and non-U.S. - also struggled to deliver positive results and keep pace with their respective benchmark indexes, due to unfavorable security selection overall. In aggregate, the Funds' U.S. equity asset class underperformed the Dow Jones U.S. Total Stock Market IndexSM, which rose 1.08% for the one-year period. Turning to the Funds' non-U.S. holdings, VIP Overseas Portfolio and VIP Emerging Markets Portfolio each experienced a double-digit decline. While financial woes across Europe plagued stocks globally, holding back the performance of VIP Overseas Portfolio, monetary tightening and signs of an economic slowdown in China, India and other developing countries presented head winds for emerging-markets stocks. In aggregate, the non-U.S. equity asset class lagged the MSCI® EAFE® (Europe, Australasia, Far East) Index, which fell 12.04%. With headline events and disappointing U.S. economic data - such as continued high levels of unemployment and a stagnant housing market - taking their toll on the equity markets, investors shifted their focus to higher-quality bonds, especially U.S. Treasuries. The performance of VIP Investment Grade Bond Portfolio fell short of the Barclays Capital® U.S. Aggregate Bond Index, and the Funds' high-yield debt allocation to VIP High Income Portfolio underperformed by an even greater degree. As a result, the Funds' bond asset class, in aggregate, detracted from overall results. Lastly, representing the Funds' short-term debt asset class, VIP Money Market Portfolio performed on par with the Barclays Capital U.S. 3 Month Treasury Bellwether Index, which increased 0.11%.
The views expressed above reflect those of the portfolio manager(s) only through the end of the period as stated on the cover of this report and do not necessarily represent the views of Fidelity or any other person in the Fidelity organization. Any such views are subject to change at any time based upon market or other conditions and Fidelity disclaims any responsibility to update such views. These views may not be relied on as investment advice and, because investment decisions for a Fidelity fund are based on numerous factors, may not be relied on as an indication of trading intent on behalf of any Fidelity fund.
Annual Report
As a shareholder of a Fund, you incur two types of costs: (1) transaction costs, and (2) ongoing costs, including other Fund expenses. This Example is intended to help you understand your ongoing costs (in dollars) of investing in the Funds and to compare these costs with the ongoing costs of investing in other mutual funds.
The Example is based on an investment of $1,000 invested at the beginning of the period and held for the entire period (July 1, 2011 to December 31, 2011).
Actual Expenses
The first line of the accompanying table for each fund provides information about actual account values and actual expenses. You may use the information in this line, together with the amount you invested, to estimate the expenses that you paid over the period. Simply divide your account value by $1,000.00 (for example, an $8,600 account value divided by $1,000.00 = 8.6), then multiply the result by the number in the first line for a fund under the heading entitled "Expenses Paid During Period" to estimate the expenses you paid on your account during this period. The estimate of expenses does not include any fees or other expenses of any variable annuity or variable life insurance product. If they were, the estimate of expenses you paid during the period would be higher, and your ending account value would be lower. In addition, each Fund, as a shareholder in underlying Fidelity Funds, will indirectly bear its pro-rata share of the fees and expenses incurred by the underlying Fidelity Funds. These fees and expenses are not included in each Fund's annualized expense ratio used to calculate the expense estimates in the table below.
Hypothetical Example for Comparison Purposes
The second line of the accompanying table for each fund provides information about hypothetical account values and hypothetical expenses based on a fund's actual expense ratio and an assumed rate of return of 5% per year before expenses, which is not the Fund's actual return. The hypothetical account values and expenses may not be used to estimate the actual ending account balance or expenses you paid for the period. You may use this information to compare the ongoing costs of investing in the Fund and other funds. To do so, compare this 5% hypothetical example with the 5% hypothetical examples that appear in the shareholder reports of the other funds. The estimate of expenses does not include any fees or other expenses of any variable annuity or variable life insurance product. If they were, the estimate of expenses you paid during the period would be higher, and your ending account value would be lower. In addition, each Fund, as a shareholder in underlying Fidelity Funds, will indirectly bear its pro-rata share of the fees and expenses incurred by the underlying Fidelity Funds. These fees and expenses are not included in each Fund's annualized expense ratio used to calculate the expense estimates in the table below.
Please note that the expenses shown in the table are meant to highlight your ongoing costs only and do not reflect any transaction costs. Therefore, the second line of the table is useful in comparing ongoing costs only, and will not help you determine the relative total costs of owning different funds.
| Annualized
Expense Ratio | Beginning
Account Value
July 1, 2011 | Ending
Account Value
December 31, 2011 | Expenses Paid
During Period*
July 1, 2011 to
December 31, 2011 |
VIP Investor Freedom Income | .00% | | | |
Actual | | $ 1,000.00 | $ 991.40 | $ .00 |
HypotheticalA | | $ 1,000.00 | $ 1,025.21 | $ .00 |
VIP Investor Freedom 2005 | .00% | | | |
Actual | | $ 1,000.00 | $ 966.80 | $ .00 |
HypotheticalA | | $ 1,000.00 | $ 1,025.21 | $ .00 |
VIP Investor Freedom 2010 | .00% | | | |
Actual | | $ 1,000.00 | $ 958.40 | $ .00 |
HypotheticalA | | $ 1,000.00 | $ 1,025.21 | $ .00 |
VIP Investor Freedom 2015 | .00% | | | |
Actual | | $ 1,000.00 | $ 956.90 | $ .00 |
HypotheticalA | | $ 1,000.00 | $ 1,025.21 | $ .00 |
VIP Investor Freedom 2020 | .00% | | | |
Actual | | $ 1,000.00 | $ 945.40 | $ .00 |
HypotheticalA | | $ 1,000.00 | $ 1,025.21 | $ .00 |
VIP Investor Freedom 2025 | .00% | | | |
Actual | | $ 1,000.00 | $ 931.70 | $ .00 |
HypotheticalA | | $ 1,000.00 | $ 1,025.21 | $ .00 |
VIP Investor Freedom 2030 | .00% | | | |
Actual | | $ 1,000.00 | $ 926.00 | $ .00 |
HypotheticalA | | $ 1,000.00 | $ 1,025.21 | $ .00 |
A 5% return per year before expenses
* Expenses are equal to each Fund's annualized expense ratio, multiplied by the average account value over the period, multiplied by 184/365 (to reflect the one-half year period). The fees and expenses of the underlying Fidelity Funds in which the Fund invests are not included in the Fund's annualized expense ratio.
Annual Report
VIP Investor Freedom Income Portfolio
Investment Changes (Unaudited)
Fund Holdings as of December 31, 2011 |
| % of fund's
net assets | % of fund's net assets
6 months ago |
Domestic Equity Funds | | |
VIP Contrafund Portfolio Investor Class | 2.4 | 2.4 |
VIP Equity-Income Portfolio Investor Class | 2.8 | 2.8 |
VIP Growth & Income Portfolio Investor Class | 2.8 | 2.8 |
VIP Growth Portfolio Investor Class | 2.7 | 2.9 |
VIP Mid Cap Portfolio Investor Class | 0.9 | 1.0 |
VIP Value Portfolio Investor Class | 2.4 | 2.4 |
VIP Value Strategies Portfolio Investor Class | 1.0 | 1.0 |
| 15.0 | 15.3 |
Developed International Equity Funds | | |
VIP Overseas Portfolio Investor Class R | 4.1 | 4.5 |
Emerging Markets Equity Funds | | |
VIP Emerging Markets Portfolio Investor Class R | 1.0 | 0.8 |
High Yield Bond Funds | | |
VIP High Income Portfolio Investor Class | 5.1 | 5.0 |
Investment Grade Bond Funds | | |
VIP Investment Grade Bond Portfolio Investor Class | 35.3 | 34.6 |
Short-Term Funds | | |
VIP Money Market Portfolio Investor Class | 39.5 | 39.8 |
Net Other Assets (Liabilities)* | 0.0 | 0.0 |
| 100.0 | 100.0 |
* Amount represents less than 0.1%
Asset Allocation (% of fund's net assets) |
Current |
| Domestic Equity Funds | 15.0% | |
| Developed International Equity Funds | 4.1% | |
| Emerging Markets Equity Funds | 1.0% | |
| High Yield Bond Funds | 5.1% | |
| Investment Grade Bond Funds | 35.3% | |
| Short-Term Funds | 39.5% | |

Six months ago |
| Domestic Equity Funds | 15.3% | |
| Developed International Equity Funds | 4.5% | |
| Emerging Markets Equity Funds | 0.8% | |
| High Yield Bond Funds | 5.0% | |
| Investment Grade Bond Funds | 34.6% | |
| Short-Term Funds | 39.8% | |

Expected |
| Domestic Equity Funds | 14.6% | |
| Developed International Equity Funds | 4.6% | |
| Emerging Markets Equity Funds | 0.8% | |
| High Yield Bond Funds | 5.0% | |
| Investment Grade Bond Funds | 35.0% | |
| Short-Term Funds | 40.0% | |

The six months ago allocation is based on the fund's holdings as of June 30, 2011. The current allocation is based on the fund's holdings as of December 31, 2011. The expected allocation represents the fund's anticipated allocation at June 30, 2012. |
Annual Report
VIP Investor Freedom Income Portfolio
Investments December 31, 2011
Showing Percentage of Net Assets
Domestic Equity Funds - 15.0% |
| Shares | | Value |
Domestic Equity Funds - 15.0% |
VIP Contrafund Portfolio Investor Class | 31,133 | | $ 714,201 |
VIP Equity-Income Portfolio Investor Class | 45,811 | | 853,922 |
VIP Growth & Income Portfolio Investor Class | 68,420 | | 859,357 |
VIP Growth Portfolio Investor Class | 22,544 | | 829,845 |
VIP Mid Cap Portfolio Investor Class | 9,876 | | 286,401 |
VIP Value Portfolio Investor Class | 69,422 | | 735,180 |
VIP Value Strategies Portfolio Investor Class | 34,337 | | 300,107 |
TOTAL DOMESTIC EQUITY FUNDS (Cost $4,997,928) |
4,579,013
|
International Equity Funds - 5.1% |
| | | |
Developed International Equity Funds - 4.1% |
VIP Overseas Portfolio Investor Class R | 91,110 | | 1,238,188 |
Emerging Markets Equity Funds - 1.0% |
VIP Emerging Markets Portfolio Investor Class R | 41,345 | | 319,180 |
TOTAL INTERNATIONAL EQUITY FUNDS (Cost $1,608,352) |
1,557,368
|
Bond Funds - 40.4% |
| Shares | | Value |
High Yield Bond Funds - 5.1% |
VIP High Income Portfolio Investor Class | 293,498 | | $ 1,576,087 |
Investment Grade Bond Funds - 35.3% |
VIP Investment Grade Bond Portfolio Investor Class | 833,759 | | 10,780,506 |
TOTAL BOND FUNDS (Cost $12,164,219) |
12,356,593
|
Short-Term Funds - 39.5% |
| | | |
VIP Money Market Portfolio Investor Class
(Cost $12,054,347) | 12,054,347 | |
12,054,347
|
TOTAL INVESTMENT PORTFOLIO - 100.0% (Cost $30,824,846) | | 30,547,321 |
NET OTHER ASSETS (LIABILITIES) - 0.0% | | 93 |
NET ASSETS - 100% | $ 30,547,414 |
Other Information |
All investments are categorized as Level 1 under the Fair Value Hierarchy. The inputs or methodology used for valuing securities may not be an indication of the risk associated with investing in those securities. For more information on valuation inputs, please refer to the Security Valuation section in the accompanying Notes to Financial Statements. |
See accompanying notes which are an integral part of the financial statements.
Annual Report
VIP Investor Freedom Income Portfolio
Statement of Assets and Liabilities
| December 31, 2011 |
| | |
Assets | | |
Investment in securities, at value (cost $30,824,846) - See accompanying schedule | | $ 30,547,321 |
Cash | | 45 |
Receivable for fund shares sold | | 20 |
Distributions receivable from underlying funds | | 44 |
Total assets | | 30,547,430 |
| | |
Liabilities | | |
Payable for fund shares redeemed | | 16 |
| | |
Net Assets | | $ 30,547,414 |
Net Assets consist of: | | |
Paid in capital | | $ 30,728,728 |
Accumulated undistributed net realized gain (loss) on investments | | 96,211 |
Net unrealized appreciation (depreciation) on investments | | (277,525) |
Net Assets, for 2,965,037 shares outstanding | | $ 30,547,414 |
Net Asset Value, offering price and redemption price per share ($30,547,414 ÷ 2,965,037 shares) | | $ 10.30 |
Statement of Operations
| Year ended December 31, 2011 |
| | |
Investment Income | | |
Income distributions from underlying funds | | $ 548,973 |
| | |
Expenses | | |
Independent trustees' compensation | $ 114 | |
Total expenses before reductions | 114 | |
Expense reductions | (114) | 0 |
Net investment income (loss) | | 548,973 |
Realized and Unrealized Gain (Loss) Realized gain (loss) on sale of underlying fund shares | 101,478 | |
Capital gain distributions from underlying funds | 302,235 | |
Total net realized gain (loss) | | 403,713 |
Change in net unrealized appreciation (depreciation) on underlying funds | | (484,167) |
Net gain (loss) | | (80,454) |
Net increase (decrease) in net assets resulting from operations | | $ 468,519 |
See accompanying notes which are an integral part of the financial statements.
Annual Report
VIP Investor Freedom Income Portfolio
Financial Statements - continued
Statement of Changes in Net Assets
| Year ended
December 31, 2011 | Year ended
December 31, 2010 |
Increase (Decrease) in Net Assets | | |
Operations | | |
Net investment income (loss) | $ 548,973 | $ 593,418 |
Net realized gain (loss) | 403,713 | 318,126 |
Change in net unrealized appreciation (depreciation) | (484,167) | 1,270,766 |
Net increase (decrease) in net assets resulting from operations | 468,519 | 2,182,310 |
Distributions to shareholders from net investment income | (550,115) | (592,180) |
Distributions to shareholders from net realized gain | (205,638) | (299,615) |
Total distributions | (755,753) | (891,795) |
Share transactions
Proceeds from sales of shares | 7,091,329 | 8,914,880 |
Reinvestment of distributions | 755,753 | 891,795 |
Cost of shares redeemed | (9,479,057) | (4,004,799) |
Net increase (decrease) in net assets resulting from share transactions | (1,631,975) | 5,801,876 |
Total increase (decrease) in net assets | (1,919,209) | 7,092,391 |
| | |
Net Assets | | |
Beginning of period | 32,466,623 | 25,374,232 |
End of period (including undistributed net investment income of $0 and undistributed net investment income of $1,670, respectively) | $ 30,547,414 | $ 32,466,623 |
Other Information Shares | | |
Sold | 672,452 | 872,042 |
Issued in reinvestment of distributions | 73,304 | 86,021 |
Redeemed | (901,357) | (387,078) |
Net increase (decrease) | (155,601) | 570,985 |
Financial Highlights
Years ended December 31, | 2011 | 2010 | 2009 | 2008 | 2007 |
Selected Per-Share Data | | | | | |
Net asset value, beginning of period | $ 10.40 | $ 9.95 | $ 9.10 | $ 10.79 | $ 10.78 |
Income from Investment Operations | | | | | |
Net investment income (loss)C | .18 | .21 | .40 | .34 | .42 |
Net realized and unrealized gain (loss) | (.02) | .54 | .94 | (1.47) | .22 |
Total from investment operations | .16 | .75 | 1.34 | (1.13) | .64 |
Distributions from net investment income | (.19) | (.20) | (.33) | (.37) | (.58) |
Distributions from net realized gain | (.07) | (.10) | (.16) | (.19) | (.06) |
Total distributions | (.26) | (.30) | (.49) | (.56) | (.63)G |
Net asset value, end of period | $ 10.30 | $ 10.40 | $ 9.95 | $ 9.10 | $ 10.79 |
Total ReturnA,B | 1.54% | 7.50% | 14.85% | (10.55)% | 6.08% |
Ratios to Average Net AssetsD,F | | | | | |
Expenses before reductionsE | .00% | .00% | .00% | .00% | .00% |
Expenses net of fee waivers, if any | .00% | .00% | .00% | .00% | .00% |
Expenses net of all reductions | .00% | .00% | .00% | .00% | .00% |
Net investment income (loss) | 1.74% | 2.00% | 4.12% | 3.33% | 3.90% |
Supplemental Data | | | | | |
Net assets, end of period (000 omitted) | $ 30,547 | $ 32,467 | $ 25,374 | $ 17,272 | $ 20,090 |
Portfolio turnover rate | 28% | 24% | 30% | 53% | 38% |
A Total returns do not reflect charges attributable to your insurance company's separate account. Inclusion of these charges would reduce the total returns shown.
B Total returns would have been lower if certain expenses had not been reduced during the applicable periods shown.
C Calculated based on average shares outstanding during the period.
D Amounts do not include the activity of the Underlying Funds.
E Amount represents less than .01%.
F Expense ratios reflect operating expenses of the Fund. Expenses before reductions do not reflect amounts reimbursed by the investment adviser or reductions from expense offset arrangements and do not represent the amount paid by the Fund during periods when reimbursements or reductions occur. Expenses net of fee waivers reflect expenses after reimbursement by the investment adviser but prior to reductions from expense offset arrangements. Expenses net of all reductions represent the net expenses paid by the Fund but do not include expenses of the investment companies in which the Fund invests.
G Total distributions of $.63 per share is comprised of distributions from net investment income of $.575 and distributions from net realized gain of $.055 per share.
See accompanying notes which are an integral part of the financial statements.
Annual Report
VIP Investor Freedom 2005 Portfolio
Investment Changes (Unaudited)
Fund Holdings as of December 31, 2011 |
| % of fund's
net assets | % of fund's net assets
6 months ago |
Domestic Equity Funds | | |
VIP Contrafund Portfolio Investor Class | 4.6 | 4.8 |
VIP Equity-Income Portfolio Investor Class | 5.5 | 5.6 |
VIP Growth & Income Portfolio Investor Class | 5.5 | 5.6 |
VIP Growth Portfolio Investor Class | 5.4 | 5.7 |
VIP Mid Cap Portfolio Investor Class | 1.9 | 2.0 |
VIP Value Portfolio Investor Class | 4.7 | 4.8 |
VIP Value Strategies Portfolio Investor Class | 1.9 | 2.0 |
| 29.5 | 30.5 |
Developed International Equity Funds | | |
VIP Overseas Portfolio Investor Class R | 7.9 | 9.2 |
Emerging Markets Equity Funds | | |
VIP Emerging Markets Portfolio Investor Class R | 2.0 | 1.6 |
High Yield Bond Funds | | |
VIP High Income Portfolio Investor Class | 5.1 | 5.0 |
Investment Grade Bond Funds | | |
VIP Investment Grade Bond Portfolio Investor Class | 30.5 | 30.6 |
Short-Term Funds | | |
VIP Money Market Portfolio Investor Class | 25.0 | 23.1 |
Net Other Assets (Liabilities)* | 0.0 | 0.0 |
| 100.0 | 100.0 |
* Amount represents less than 0.1%
Asset Allocation (% of fund's net assets) |
Current |
| Domestic Equity Funds | 29.5% | |
| Developed International Equity Funds | 7.9% | |
| Emerging Markets Equity Funds | 2.0% | |
| High Yield Bond Funds | 5.1% | |
| Investment Grade Bond Funds | 30.5% | |
| Short-Term Funds | 25.0% | |

Six months ago |
| Domestic Equity Funds | 30.5% | |
| Developed International Equity Funds | 9.2% | |
| Emerging Markets Equity Funds | 1.6% | |
| High Yield Bond Funds | 5.0% | |
| Investment Grade Bond Funds | 30.6% | |
| Short-Term Funds | 23.1% | |

Expected |
| Domestic Equity Funds | 27.2% | |
| Developed International Equity Funds | 8.4% | |
| Emerging Markets Equity Funds | 1.5% | |
| High Yield Bond Funds | 5.0% | |
| Investment Grade Bond Funds | 29.7% | |
| Short-Term Funds | 28.2% | |

The fund invests according to an asset allocation strategy that becomes increasingly conservative over time. The six months ago allocation is based on the fund's holdings as of June 30, 2011. The current allocation is based on the fund's holdings as of December 31, 2011. The expected allocation represents the fund's anticipated allocation at June 30, 2012. |
Annual Report
VIP Investor Freedom 2005 Portfolio
Investments December 31, 2011
Showing Percentage of Net Assets
Domestic Equity Funds - 29.5% |
| Shares | | Value |
Domestic Equity Funds - 29.5% |
VIP Contrafund Portfolio Investor Class | 19,628 | | $ 450,267 |
VIP Equity-Income Portfolio Investor Class | 28,877 | | 538,265 |
VIP Growth & Income Portfolio Investor Class | 43,136 | | 541,783 |
VIP Growth Portfolio Investor Class | 14,214 | | 523,228 |
VIP Mid Cap Portfolio Investor Class | 6,241 | | 180,989 |
VIP Value Portfolio Investor Class | 43,769 | | 463,517 |
VIP Value Strategies Portfolio Investor Class | 21,702 | | 189,672 |
TOTAL DOMESTIC EQUITY FUNDS (Cost $3,487,752) |
2,887,721
|
International Equity Funds - 9.9% |
| | | |
Developed International Equity Funds - 7.9% |
VIP Overseas Portfolio Investor Class R | 56,602 | | 769,221 |
Emerging Markets Equity Funds - 2.0% |
VIP Emerging Markets Portfolio Investor Class R | 25,758 | | 198,853 |
TOTAL INTERNATIONAL EQUITY FUNDS (Cost $1,308,650) |
968,074
|
Bond Funds - 35.6% |
| Shares | | Value |
High Yield Bond Funds - 5.1% |
VIP High Income Portfolio Investor Class | 93,765 | | $ 503,521 |
Investment Grade Bond Funds - 30.5% |
VIP Investment Grade Bond Portfolio Investor Class | 230,332 | | 2,978,197 |
TOTAL BOND FUNDS (Cost $3,412,850) |
3,481,718
|
Short-Term Funds - 25.0% |
| | | |
VIP Money Market Portfolio Investor Class
(Cost $2,439,593) | 2,439,593 | |
2,439,593
|
TOTAL INVESTMENT PORTFOLIO - 100.0% (Cost $10,648,845) | | 9,777,106 |
NET OTHER ASSETS (LIABILITIES) - 0.0% | | 11 |
NET ASSETS - 100% | $ 9,777,117 |
Other Information |
All investments are categorized as Level 1 under the Fair Value Hierarchy. The inputs or methodology used for valuing securities may not be an indication of the risk associated with investing in those securities. For more information on valuation inputs, please refer to the Security Valuation section in the accompanying Notes to Financial Statements. |
See accompanying notes which are an integral part of the financial statements.
Annual Report
VIP Investor Freedom 2005 Portfolio
Statement of Assets and Liabilities
| December 31, 2011 |
| | |
Assets | | |
Investment in securities, at value (cost $10,648,845) - See accompanying schedule | | $ 9,777,106 |
Receivable for fund shares sold | | 142 |
Total assets | | 9,777,248 |
| | |
Liabilities | | |
Payable to custodian bank | $ 2 | |
Payable for investments purchased | 124 | |
Payable for fund shares redeemed | 5 | |
Total liabilities | | 131 |
| | |
Net Assets | | $ 9,777,117 |
Net Assets consist of: | | |
Paid in capital | | $ 10,666,772 |
Accumulated undistributed net realized gain (loss) on investments | | (17,916) |
Net unrealized appreciation (depreciation) on investments | | (871,739) |
Net Assets, for 1,018,456 shares outstanding | | $ 9,777,117 |
Net Asset Value, offering price and redemption price per share ($9,777,117 ÷ 1,018,456 shares) | | $ 9.60 |
Statement of Operations
| Year ended December 31, 2011 |
| | |
Investment Income | | |
Income distributions from underlying funds | | $ 183,463 |
| | |
Expenses | | |
Independent trustees' compensation | $ 39 | |
Total expenses before reductions | 39 | |
Expense reductions | (39) | 0 |
Net investment income (loss) | | 183,463 |
Realized and Unrealized Gain (Loss) Realized gain (loss) on sale of underlying fund shares | 34,973 | |
Capital gain distributions from underlying funds | 88,191 | |
Total net realized gain (loss) | | 123,164 |
Change in net unrealized appreciation (depreciation) on underlying funds | | (349,244) |
Net gain (loss) | | (226,080) |
Net increase (decrease) in net assets resulting from operations | | $ (42,617) |
See accompanying notes which are an integral part of the financial statements.
Annual Report
Statement of Changes in Net Assets
| Year ended
December 31, 2011 | Year ended
December 31, 2010 |
Increase (Decrease) in Net Assets | | |
Operations | | |
Net investment income (loss) | $ 183,463 | $ 188,164 |
Net realized gain (loss) | 123,164 | 238,461 |
Change in net unrealized appreciation (depreciation) | (349,244) | 601,701 |
Net increase (decrease) in net assets resulting from operations | (42,617) | 1,028,326 |
Distributions to shareholders from net investment income | (183,967) | (188,220) |
Distributions to shareholders from net realized gain | (68,154) | (227,534) |
Total distributions | (252,121) | (415,754) |
Share transactions
Proceeds from sales of shares | 3,799,880 | 4,550,953 |
Reinvestment of distributions | 252,121 | 415,754 |
Cost of shares redeemed | (4,417,905) | (4,539,322) |
Net increase (decrease) in net assets resulting from share transactions | (365,904) | 427,385 |
Total increase (decrease) in net assets | (660,642) | 1,039,957 |
| | |
Net Assets | | |
Beginning of period | 10,437,759 | 9,397,802 |
End of period (including undistributed net investment income of $0 and undistributed net investment income of $241, respectively) | $ 9,777,117 | $ 10,437,759 |
Other Information Shares | | |
Sold | 376,243 | 476,271 |
Issued in reinvestment of distributions | 26,165 | 42,428 |
Redeemed | (444,069) | (478,599) |
Net increase (decrease) | (41,661) | 40,100 |
Financial Highlights
Years ended December 31, | 2011 | 2010 | 2009 | 2008 | 2007 |
Selected Per-Share Data | | | | | |
Net asset value, beginning of period | $ 9.85 | $ 9.21 | $ 7.91 | $ 11.53 | $ 11.17 |
Income from Investment Operations | | | | | |
Net investment income (loss)C | .17 | .18 | .35 | .32 | .35 |
Net realized and unrealized gain (loss) | (.17) | .87 | 1.41 | (3.00) | .59 |
Total from investment operations | -G | 1.05 | 1.76 | (2.68) | .94 |
Distributions from net investment income | (.19) | (.19) | (.33) | (.30) | (.46) |
Distributions from net realized gain | (.07) | (.22) | (.14) | (.64) | (.12) |
Total distributions | (.25)I | (.41) | (.46)H | (.94) | (.58) |
Net asset value, end of period | $ 9.60 | $ 9.85 | $ 9.21 | $ 7.91 | $ 11.53 |
Total ReturnA,B | .02% | 11.41% | 22.71% | (23.91)% | 8.55% |
Ratios to Average Net AssetsD,F | | | | | |
Expenses before reductionsE | .00% | .00% | .00% | .00% | .00% |
Expenses net of fee waivers, if any | .00% | .00% | .00% | .00% | .00% |
Expenses net of all reductions | .00% | .00% | .00% | .00% | .00% |
Net investment income (loss) | 1.72% | 1.90% | 4.12% | 3.19% | 3.02% |
Supplemental Data | | | | | |
Net assets, end of period (000 omitted) | $ 9,777 | $ 10,438 | $ 9,398 | $ 7,038 | $ 8,568 |
Portfolio turnover rate | 45% | 63% | 47% | 40% | 53% |
A Total returns do not reflect charges attributable to your insurance company's separate account. Inclusion of these charges would reduce the total returns shown.
B Total returns would have been lower if certain expenses had not been reduced during the applicable periods shown.
C Calculated based on average shares outstanding during the period.
D Amounts do not include the activity of the Underlying Funds.
E Amount represents less than .01%.
F Expense ratios reflect operating expenses of the Fund. Expenses before reductions do not reflect amounts reimbursed by the investment adviser or reductions from expense offset arrangements and do not represent the amount paid by the Fund during periods when reimbursements or reductions occur. Expenses net of fee waivers reflect expenses after reimbursement by the investment adviser but prior to reductions from expense offset arrangements. Expenses net of all reductions represent the net expenses paid by the Fund but do not include expenses of the investment companies in which the Fund invests.
G Amount represents less than $.01 per share.
H Total distributions of $.46 per share is comprised of distributions from net investment income of $.325 and distributions from net realized gain of $.135 per share.
I Total distributions of $.25 per share is comprised of distributions from net investment income of $.185 and distributions from net realized gain of $.067 per share.
See accompanying notes which are an integral part of the financial statements.
Annual Report
VIP Investor Freedom 2010 Portfolio
Investment Changes (Unaudited)
Fund Holdings as of December 31, 2011 |
| % of fund's
net assets | % of fund's net assets
6 months ago |
Domestic Equity Funds | | |
VIP Contrafund Portfolio Investor Class | 5.7 | 5.8 |
VIP Equity-Income Portfolio Investor Class | 6.9 | 6.7 |
VIP Growth & Income Portfolio Investor Class | 6.9 | 6.7 |
VIP Growth Portfolio Investor Class | 6.7 | 6.9 |
VIP Mid Cap Portfolio Investor Class | 2.3 | 2.4 |
VIP Value Portfolio Investor Class | 5.9 | 5.8 |
VIP Value Strategies Portfolio Investor Class | 2.4 | 2.4 |
| 36.8 | 36.7 |
Developed International Equity Funds | | |
VIP Overseas Portfolio Investor Class R | 9.8 | 11.2 |
Emerging Markets Equity Funds | | |
VIP Emerging Markets Portfolio Investor Class R | 2.5 | 1.9 |
High Yield Bond Funds | | |
VIP High Income Portfolio Investor Class | 5.1 | 5.0 |
Investment Grade Bond Funds | | |
VIP Investment Grade Bond Portfolio Investor Class | 34.8 | 34.5 |
Short-Term Funds | | |
VIP Money Market Portfolio Investor Class | 11.0 | 10.7 |
Net Other Assets (Liabilities)* | 0.0 | 0.0 |
| 100.0 | 100.0 |
* Amount represents less than 0.1%
Asset Allocation (% of fund's net assets) |
Current |
| Domestic Equity Funds | 36.8% | |
| Developed International Equity Funds | 9.8% | |
| Emerging Markets Equity Funds | 2.5% | |
| High Yield Bond Funds | 5.1% | |
| Investment Grade Bond Funds | 34.8% | |
| Short-Term Funds | 11.0% | |

Six months ago |
| Domestic Equity Funds | 36.7% | |
| Developed International Equity Funds | 11.2% | |
| Emerging Markets Equity Funds | 1.9% | |
| High Yield Bond Funds | 5.0% | |
| Investment Grade Bond Funds | 34.5% | |
| Short-Term Funds | 10.7% | |

Expected |
| Domestic Equity Funds | 35.7% | |
| Developed International Equity Funds | 11.1% | |
| Emerging Markets Equity Funds | 1.9% | |
| High Yield Bond Funds | 5.0% | |
| Investment Grade Bond Funds | 34.5% | |
| Short-Term Funds | 11.8% | |

The fund invests according to an asset allocation strategy that becomes increasingly conservative over time. The six months ago allocation is based on the fund's holdings as of June 30, 2011. The current allocation is based on the fund's holdings as of December 31, 2011. The expected allocation represents the fund's anticipated allocation at June 30, 2012. |
Annual Report
VIP Investor Freedom 2010 Portfolio
Investments December 31, 2011
Showing Percentage of Net Assets
Domestic Equity Funds - 36.8% |
| Shares | | Value |
Domestic Equity Funds - 36.8% |
VIP Contrafund Portfolio Investor Class | 127,982 | | $ 2,935,918 |
VIP Equity-Income Portfolio Investor Class | 188,071 | | 3,505,650 |
VIP Growth & Income Portfolio Investor Class | 280,898 | | 3,528,083 |
VIP Growth Portfolio Investor Class | 92,537 | | 3,406,278 |
VIP Mid Cap Portfolio Investor Class | 40,779 | | 1,182,583 |
VIP Value Portfolio Investor Class | 285,303 | | 3,021,355 |
VIP Value Strategies Portfolio Investor Class | 141,734 | | 1,238,759 |
TOTAL DOMESTIC EQUITY FUNDS (Cost $23,185,593) |
18,818,626
|
International Equity Funds - 12.3% |
| | | |
Developed International Equity Funds - 9.8% |
VIP Overseas Portfolio Investor Class R | 368,940 | | 5,013,897 |
Emerging Markets Equity Funds - 2.5% |
VIP Emerging Markets Portfolio Investor Class R | 167,708 | | 1,294,704 |
TOTAL INTERNATIONAL EQUITY FUNDS (Cost $8,941,987) |
6,308,601
|
Bond Funds - 39.9% |
| Shares | | Value |
High Yield Bond Funds - 5.1% |
VIP High Income Portfolio Investor Class | 488,923 | | $ 2,625,514 |
Investment Grade Bond Funds - 34.8% |
VIP Investment Grade Bond Portfolio Investor Class | 1,376,621 | | 17,799,705 |
TOTAL BOND FUNDS (Cost $20,341,306) |
20,425,219
|
Short-Term Funds - 11.0% |
| | | |
VIP Money Market Portfolio Investor Class
(Cost $5,614,394) | 5,614,394 | |
5,614,394
|
TOTAL INVESTMENT PORTFOLIO - 100.0% (Cost $58,083,280) | | 51,166,840 |
NET OTHER ASSETS (LIABILITIES) - 0.0% | | 28 |
NET ASSETS - 100% | $ 51,166,868 |
Other Information |
All investments are categorized as Level 1 under the Fair Value Hierarchy. The inputs or methodology used for valuing securities may not be an indication of the risk associated with investing in those securities. For more information on valuation inputs, please refer to the Security Valuation section in the accompanying Notes to Financial Statements. |
See accompanying notes which are an integral part of the financial statements.
Annual Report
VIP Investor Freedom 2010 Portfolio
Statement of Assets and Liabilities
| December 31, 2011 |
| | |
Assets | | |
Investment in securities, at value (cost $58,083,280) - See accompanying schedule | | $ 51,166,840 |
Cash | | 6 |
Receivable for investments sold | | 354 |
Total assets | | 51,167,200 |
| | |
Liabilities | | |
Payable for fund shares redeemed | | 332 |
| | |
Net Assets | | $ 51,166,868 |
Net Assets consist of: | | |
Paid in capital | | $ 58,273,709 |
Accumulated undistributed net realized gain (loss) on investments | | (190,401) |
Net unrealized appreciation (depreciation) on investments | | (6,916,440) |
Net Assets, for 5,234,518 shares outstanding | | $ 51,166,868 |
Net Asset Value, offering price and redemption price per share ($51,166,868 ÷ 5,234,518 shares) | | $ 9.77 |
Statement of Operations
| Year ended December 31, 2011 |
| | |
Investment Income | | |
Income distributions from underlying funds | | $ 1,091,211 |
| | |
Expenses | | |
Independent trustees' compensation | $ 195 | |
Total expenses before reductions | 195 | |
Expense reductions | (195) | 0 |
Net investment income (loss) | | 1,091,211 |
Realized and Unrealized Gain (Loss) Realized gain (loss) on sale of underlying fund shares | 4,698 | |
Capital gain distributions from underlying funds | 519,933 | |
Total net realized gain (loss) | | 524,631 |
Change in net unrealized appreciation (depreciation) on underlying funds | | (1,749,000) |
Net gain (loss) | | (1,224,369) |
Net increase (decrease) in net assets resulting from operations | | $ (133,158) |
See accompanying notes which are an integral part of the financial statements.
Annual Report
Statement of Changes in Net Assets
| Year ended
December 31, 2011 | Year ended
December 31, 2010 |
Increase (Decrease) in Net Assets | | |
Operations | | |
Net investment income (loss) | $ 1,091,211 | $ 1,107,059 |
Net realized gain (loss) | 524,631 | 353,427 |
Change in net unrealized appreciation (depreciation) | (1,749,000) | 4,638,516 |
Net increase (decrease) in net assets resulting from operations | (133,158) | 6,099,002 |
Distributions to shareholders from net investment income | (1,094,476) | (1,116,128) |
Distributions to shareholders from net realized gain | (209,689) | (236,914) |
Total distributions | (1,304,165) | (1,353,042) |
Share transactions
Proceeds from sales of shares | 8,154,981 | 8,523,280 |
Reinvestment of distributions | 1,304,165 | 1,353,042 |
Cost of shares redeemed | (11,446,369) | (7,702,235) |
Net increase (decrease) in net assets resulting from share transactions | (1,987,223) | 2,174,087 |
Total increase (decrease) in net assets | (3,424,546) | 6,920,047 |
| | |
Net Assets | | |
Beginning of period | 54,591,414 | 47,671,367 |
End of period | $ 51,166,868 | $ 54,591,414 |
Other Information Shares | | |
Sold | 803,730 | 893,058 |
Issued in reinvestment of distributions | 133,350 | 134,631 |
Redeemed | (1,129,252) | (814,379) |
Net increase (decrease) | (192,172) | 213,310 |
Financial Highlights
Years ended December 31, | 2011 | 2010 | 2009 | 2008 | 2007 |
Selected Per-Share Data | | | | | |
Net asset value, beginning of period | $ 10.06 | $ 9.14 | $ 7.77 | $ 11.56 | $ 11.19 |
Income from Investment Operations | | | | | |
Net investment income (loss)C | .21 | .21 | .35 | .30 | .33 |
Net realized and unrealized gain (loss) | (.24) | .97 | 1.49 | (3.12) | .62 |
Total from investment operations | (.03) | 1.18 | 1.84 | (2.82) | .95 |
Distributions from net investment income | (.21) | (.21) | (.35) | (.33) | (.44) |
Distributions from net realized gain | (.04) | (.05) | (.12) | (.64) | (.14) |
Total distributions | (.26)G | (.26) | (.47) | (.97) | (.58) |
Net asset value, end of period | $ 9.77 | $ 10.06 | $ 9.14 | $ 7.77 | $ 11.56 |
Total ReturnA,B | (.35)% | 12.88% | 24.09% | (24.99)% | 8.63% |
Ratios to Average Net AssetsD,F | | | | | |
Expenses before reductionsE | .00% | .00% | .00% | .00% | .00% |
Expenses net of fee waivers, if any | .00% | .00% | .00% | .00% | .00% |
Expenses net of all reductions | .00% | .00% | .00% | .00% | .00% |
Net investment income (loss) | 2.02% | 2.20% | 4.18% | 3.01% | 2.90% |
Supplemental Data | | | | | |
Net assets, end of period (000 omitted) | $ 51,167 | $ 54,591 | $ 47,671 | $ 41,205 | $ 57,197 |
Portfolio turnover rate | 24% | 31% | 28% | 40% | 14% |
A Total returns do not reflect charges attributable to your insurance company's separate account. Inclusion of these charges would reduce the total returns shown.
B Total returns would have been lower if certain expenses had not been reduced during the applicable periods shown.
C Calculated based on average shares outstanding during the period.
D Amounts do not include the activity of the Underlying Funds.
E Amount represents less than .01%.
F Expense ratios reflect operating expenses of the Fund. Expenses before reductions do not reflect amounts reimbursed by the investment adviser or reductions from expense offset arrangements and do not represent the amount paid by the Fund during periods when reimbursements or reductions occur. Expenses net of fee waivers reflect expenses after reimbursement by the investment adviser but prior to reductions from expense offset arrangements. Expenses net of all reductions represent the net expenses paid by the Fund but do not include expenses of the investment companies in which the Fund invests.
G Total distributions of $.26 per share is comprised of distributions from net investment income of $.214 and distributions from net realized gain of $.041 per share.
See accompanying notes which are an integral part of the financial statements.
Annual Report
VIP Investor Freedom 2015 Portfolio
Investment Changes (Unaudited)
Fund Holdings as of December 31, 2011 |
| % of fund's
net assets | % of fund's net assets
6 months ago |
Domestic Equity Funds | | |
VIP Contrafund Portfolio Investor Class | 5.9 | 6.0 |
VIP Equity-Income Portfolio Investor Class | 7.0 | 6.9 |
VIP Growth & Income Portfolio Investor Class | 7.1 | 6.9 |
VIP Growth Portfolio Investor Class | 6.8 | 7.1 |
VIP Mid Cap Portfolio Investor Class | 2.4 | 2.4 |
VIP Value Portfolio Investor Class | 6.1 | 5.9 |
VIP Value Strategies Portfolio Investor Class | 2.5 | 2.5 |
| 37.8 | 37.7 |
Developed International Equity Funds | | |
VIP Overseas Portfolio Investor Class R | 10.1 | 11.4 |
Emerging Markets Equity Funds | | |
VIP Emerging Markets Portfolio Investor Class R | 2.6 | 2.0 |
High Yield Bond Funds | | |
VIP High Income Portfolio Investor Class | 5.1 | 5.0 |
Investment Grade Bond Funds | | |
VIP Investment Grade Bond Portfolio Investor Class | 34.9 | 34.4 |
Short-Term Funds | | |
VIP Money Market Portfolio Investor Class | 9.5 | 9.5 |
Net Other Assets (Liabilities)* | 0.0 | 0.0 |
| 100.0 | 100.0 |
* Amount represents less than 0.1%
Asset Allocation (% of fund's net assets) |
Current |
| Domestic Equity Funds | 37.8% | |
| Developed International Equity Funds | 10.1% | |
| Emerging Markets Equity Funds | 2.6% | |
| High Yield Bond Funds | 5.1% | |
| Investment Grade Bond Funds | 34.9% | |
| Short-Term Funds | 9.5% | |

Six months ago |
| Domestic Equity Funds | 37.7% | |
| Developed International Equity Funds | 11.4% | |
| Emerging Markets Equity Funds | 2.0% | |
| High Yield Bond Funds | 5.0% | |
| Investment Grade Bond Funds | 34.4% | |
| Short-Term Funds | 9.5% | |

Expected |
| Domestic Equity Funds | 36.8% | |
| Developed International Equity Funds | 11.4% | |
| Emerging Markets Equity Funds | 2.0% | |
| High Yield Bond Funds | 5.0% | |
| Investment Grade Bond Funds | 34.9% | |
| Short-Term Funds | 9.9% | |

The fund invests according to an asset allocation strategy that becomes increasingly conservative over time. The six months ago allocation is based on the fund's holdings as of June 30, 2011. The current allocation is based on the fund's holdings as of December 31, 2011. The expected allocation represents the fund's anticipated allocation at June 30, 2012. |
Annual Report
VIP Investor Freedom 2015 Portfolio
Investments December 31, 2011
Showing Percentage of Net Assets
Domestic Equity Funds - 37.8% |
| Shares | | Value |
Domestic Equity Funds - 37.8% |
VIP Contrafund Portfolio Investor Class | 174,023 | | $ 3,992,084 |
VIP Equity-Income Portfolio Investor Class | 255,884 | | 4,769,679 |
VIP Growth & Income Portfolio Investor Class | 382,167 | | 4,800,016 |
VIP Growth Portfolio Investor Class | 125,944 | | 4,635,982 |
VIP Mid Cap Portfolio Investor Class | 55,404 | | 1,606,711 |
VIP Value Portfolio Investor Class | 387,855 | | 4,107,383 |
VIP Value Strategies Portfolio Investor Class | 192,508 | | 1,682,520 |
TOTAL DOMESTIC EQUITY FUNDS (Cost $30,439,281) |
25,594,375
|
International Equity Funds - 12.7% |
| | | |
Developed International Equity Funds - 10.1% |
VIP Overseas Portfolio Investor Class R | 501,992 | | 6,822,070 |
Emerging Markets Equity Funds - 2.6% |
VIP Emerging Markets Portfolio Investor Class R | 228,232 | | 1,761,948 |
TOTAL INTERNATIONAL EQUITY FUNDS (Cost $11,621,980) |
8,584,018
|
Bond Funds - 40.0% |
| Shares | | Value |
High Yield Bond Funds - 5.1% |
VIP High Income Portfolio Investor Class | 651,578 | | $ 3,498,975 |
Investment Grade Bond Funds - 34.9% |
VIP Investment Grade Bond Portfolio Investor Class | 1,829,411 | | 23,654,292 |
TOTAL BOND FUNDS (Cost $26,905,385) |
27,153,267
|
Short-Term Funds - 9.5% |
| | | |
VIP Money Market Portfolio Investor Class
(Cost $6,472,147) | 6,472,147 | |
6,472,147
|
TOTAL INVESTMENT PORTFOLIO - 100.0% (Cost $75,438,793) | | 67,803,807 |
NET OTHER ASSETS (LIABILITIES) - 0.0% | | 22 |
NET ASSETS - 100% | $ 67,803,829 |
Other Information |
All investments are categorized as Level 1 under the Fair Value Hierarchy. The inputs or methodology used for valuing securities may not be an indication of the risk associated with investing in those securities. For more information on valuation inputs, please refer to the Security Valuation section in the accompanying Notes to Financial Statements. |
See accompanying notes which are an integral part of the financial statements.
Annual Report
VIP Investor Freedom 2015 Portfolio
Statement of Assets and Liabilities
| December 31, 2011 |
| | |
Assets | | |
Investment in securities, at value (cost $75,438,793) - See accompanying schedule | | $ 67,803,807 |
Receivable for fund shares sold | | 22,292 |
Total assets | | 67,826,099 |
| | |
Liabilities | | |
Payable to custodian bank | $ 1 | |
Payable for investments purchased | 22,228 | |
Payable for fund shares redeemed | 41 | |
Total liabilities | | 22,270 |
| | |
Net Assets | | $ 67,803,829 |
Net Assets consist of: | | |
Paid in capital | | $ 75,449,001 |
Accumulated undistributed net realized gain (loss) on investments | | (10,186) |
Net unrealized appreciation (depreciation) on investments | | (7,634,986) |
Net Assets, for 7,101,624 shares outstanding | | $ 67,803,829 |
Net Asset Value, offering price and redemption price per share ($67,803,829 ÷ 7,101,624 shares) | | $ 9.55 |
Statement of Operations
| Year ended December 31, 2011 |
| | |
Investment Income | | |
Income distributions from underlying funds | | $ 1,448,227 |
| | |
Expenses | | |
Independent trustees' compensation | $ 252 | |
Total expenses before reductions | 252 | |
Expense reductions | (252) | 0 |
Net investment income (loss) | | 1,448,227 |
Realized and Unrealized Gain (Loss) Realized gain (loss) on sale of underlying fund shares | 258,473 | |
Capital gain distributions from underlying funds | 647,869 | |
Total net realized gain (loss) | | 906,342 |
Change in net unrealized appreciation (depreciation) on underlying funds | | (2,664,063) |
Net gain (loss) | | (1,757,721) |
Net increase (decrease) in net assets resulting from operations | | $ (309,494) |
See accompanying notes which are an integral part of the financial statements.
Annual Report
VIP Investor Freedom 2015 Portfolio
Financial Statements - continued
Statement of Changes in Net Assets
| Year ended
December 31, 2011 | Year ended
December 31, 2010 |
Increase (Decrease) in Net Assets | | |
Operations | | |
Net investment income (loss) | $ 1,448,227 | $ 1,402,241 |
Net realized gain (loss) | 906,342 | 1,066,132 |
Change in net unrealized appreciation (depreciation) | (2,664,063) | 5,241,793 |
Net increase (decrease) in net assets resulting from operations | (309,494) | 7,710,166 |
Distributions to shareholders from net investment income | (1,453,209) | (1,456,211) |
Distributions to shareholders from net realized gain | (523,431) | (1,381,049) |
Total distributions | (1,976,640) | (2,837,260) |
Share transactions
Proceeds from sales of shares | 16,810,073 | 11,454,850 |
Reinvestment of distributions | 1,976,640 | 2,837,260 |
Cost of shares redeemed | (17,956,170) | (9,938,186) |
Net increase (decrease) in net assets resulting from share transactions | 830,543 | 4,353,924 |
Total increase (decrease) in net assets | (1,455,591) | 9,226,830 |
| | |
Net Assets | | |
Beginning of period | 69,259,420 | 60,032,590 |
End of period | $ 67,803,829 | $ 69,259,420 |
Other Information Shares | | |
Sold | 1,669,774 | 1,201,923 |
Issued in reinvestment of distributions | 206,978 | 292,477 |
Redeemed | (1,791,441) | (1,065,623) |
Net increase (decrease) | 85,311 | 428,777 |
Financial Highlights
Years ended December 31, | 2011 | 2010 | 2009 | 2008 | 2007 |
Selected Per-Share Data | | | | | |
Net asset value, beginning of period | $ 9.87 | $ 9.11 | $ 7.69 | $ 11.86 | $ 11.40 |
Income from Investment Operations | | | | | |
Net investment income (loss)C | .21 | .21 | .34 | .30 | .33 |
Net realized and unrealized gain (loss) | (.24) | .97 | 1.58 | (3.41) | .71 |
Total from investment operations | (.03) | 1.18 | 1.92 | (3.11) | 1.04 |
Distributions from net investment income | (.21) | (.22) | (.34) | (.30) | (.42) |
Distributions from net realized gain | (.08) | (.20) | (.16) | (.76) | (.16) |
Total distributions | (.29) | (.42) | (.50) | (1.06) | (.58) |
Net asset value, end of period | $ 9.55 | $ 9.87 | $ 9.11 | $ 7.69 | $ 11.86 |
Total ReturnA,B | (.33)% | 13.06% | 25.25% | (27.11)% | 9.26% |
Ratios to Average Net AssetsD,E | | | | | |
Expenses before reductionsF | .00% | .00% | .00% | .00% | .00% |
Expenses net of fee waivers, if any | .00% | .00% | .00% | .00% | .00% |
Expenses net of all reductions | .00% | .00% | .00% | .00% | .00% |
Net investment income (loss) | 2.07% | 2.24% | 4.08% | 2.98% | 2.83% |
Supplemental Data | | | | | |
Net assets, end of period (000 omitted) | $ 67,804 | $ 69,259 | $ 60,033 | $ 48,087 | $ 61,370 |
Portfolio turnover rate | 30% | 31% | 22% | 29% | 14% |
A Total returns do not reflect charges attributable to your insurance company's separate account. Inclusion of these charges would reduce the total returns shown.
B Total returns would have been lower if certain expenses had not been reduced during the applicable periods shown.
C Calculated based on average shares outstanding during the period.
D Amounts do not include the activity of the Underlying Funds.
E Expense ratios reflect operating expenses of the Fund. Expenses before reductions do not reflect amounts reimbursed by the investment adviser or reductions from expense offset arrangements and do not represent the amount paid by the Fund during periods when reimbursements or reductions occur. Expenses net of fee waivers reflect expenses after reimbursement by the investment adviser but prior to reductions from expense offset arrangements. Expenses net of all reductions represent the net expenses paid by the Fund but do not include expenses of the investment companies in which the Fund invests.
F Amount represents less than $.01 per share.
See accompanying notes which are an integral part of the financial statements.
Annual Report
VIP Investor Freedom 2020 Portfolio
Investment Changes (Unaudited)
Fund Holdings as of December 31, 2011 |
| % of fund's
net assets | % of fund's net assets
6 months ago |
Domestic Equity Funds | | |
VIP Contrafund Portfolio Investor Class | 6.8 | 7.0 |
VIP Equity-Income Portfolio Investor Class | 8.1 | 8.1 |
VIP Growth & Income Portfolio Investor Class | 8.1 | 8.1 |
VIP Growth Portfolio Investor Class | 7.9 | 8.3 |
VIP Mid Cap Portfolio Investor Class | 2.7 | 2.8 |
VIP Value Portfolio Investor Class | 7.0 | 6.9 |
VIP Value Strategies Portfolio Investor Class | 2.9 | 2.9 |
| 43.5 | 44.1 |
Developed International Equity Funds | | |
VIP Overseas Portfolio Investor Class R | 11.6 | 13.5 |
Emerging Markets Equity Funds | | |
VIP Emerging Markets Portfolio Investor Class R | 3.0 | 2.3 |
High Yield Bond Funds | | |
VIP High Income Portfolio Investor Class | 6.4 | 6.5 |
Investment Grade Bond Funds | | |
VIP Investment Grade Bond Portfolio Investor Class | 30.7 | 29.5 |
Short-Term Funds | | |
VIP Money Market Portfolio Investor Class | 4.8 | 4.1 |
Net Other Assets (Liabilities)* | 0.0 | 0.0 |
| 100.0 | 100.0 |
* Amount represents less than 0.1%
Asset Allocation (% of fund's net assets) |
Current |
| Domestic Equity Funds | 43.5% | |
| Developed International Equity Funds | 11.6% | |
| Emerging Markets Equity Funds | 3.0% | |
| High Yield Bond Funds | 6.4% | |
| Investment Grade Bond Funds | 30.7% | |
| Short-Term Funds | 4.8% | |

Six months ago |
| Domestic Equity Funds | 44.1% | |
| Developed International Equity Funds | 13.5% | |
| Emerging Markets Equity Funds | 2.3% | |
| High Yield Bond Funds | 6.5% | |
| Investment Grade Bond Funds | 29.5% | |
| Short-Term Funds | 4.1% | |

Expected |
| Domestic Equity Funds | 41.2% | |
| Developed International Equity Funds | 12.9% | |
| Emerging Markets Equity Funds | 2.2% | |
| High Yield Bond Funds | 6.0% | |
| Investment Grade Bond Funds | 31.7% | |
| Short-Term Funds | 6.0% | |

The fund invests according to an asset allocation strategy that becomes increasingly conservative over time. The six months ago allocation is based on the fund's holdings as of June 30, 2011. The current allocation is based on the fund's holdings as of December 31, 2011. The expected allocation represents the fund's anticipated allocation at June 30, 2012. |
Annual Report
VIP Investor Freedom 2020 Portfolio
Investments December 31, 2011
Showing Percentage of Net Assets
Domestic Equity Funds - 43.5% |
| Shares | | Value |
Domestic Equity Funds - 43.5% |
VIP Contrafund Portfolio Investor Class | 303,927 | | $ 6,972,088 |
VIP Equity-Income Portfolio Investor Class | 447,151 | | 8,334,894 |
VIP Growth & Income Portfolio Investor Class | 667,901 | | 8,388,837 |
VIP Growth Portfolio Investor Class | 220,054 | | 8,100,182 |
VIP Mid Cap Portfolio Investor Class | 96,708 | | 2,804,536 |
VIP Value Portfolio Investor Class | 677,437 | | 7,174,054 |
VIP Value Strategies Portfolio Investor Class | 336,055 | | 2,937,118 |
TOTAL DOMESTIC EQUITY FUNDS (Cost $52,672,327) |
44,711,709
|
International Equity Funds - 14.6% |
| | | |
Developed International Equity Funds - 11.6% |
VIP Overseas Portfolio Investor Class R | 876,679 | | 11,914,066 |
Emerging Markets Equity Funds - 3.0% |
VIP Emerging Markets Portfolio Investor Class R | 398,128 | | 3,073,546 |
TOTAL INTERNATIONAL EQUITY FUNDS (Cost $20,011,533) |
14,987,612
|
Bond Funds - 37.1% |
| Shares | | Value |
High Yield Bond Funds - 6.4% |
VIP High Income Portfolio Investor Class | 1,231,021 | | $ 6,610,582 |
Investment Grade Bond Funds - 30.7% |
VIP Investment Grade Bond Portfolio Investor Class | 2,442,973 | | 31,587,645 |
TOTAL BOND FUNDS (Cost $38,258,923) |
38,198,227
|
Short-Term Funds - 4.8% |
| | | |
VIP Money Market Portfolio Investor Class
(Cost $4,976,932) | 4,976,932 | |
4,976,932
|
TOTAL INVESTMENT PORTFOLIO - 100.0% (Cost $115,919,715) | | 102,874,480 |
NET OTHER ASSETS (LIABILITIES) - 0.0% | | 49 |
NET ASSETS - 100% | $ 102,874,529 |
Other Information |
All investments are categorized as Level 1 under the Fair Value Hierarchy. The inputs or methodology used for valuing securities may not be an indication of the risk associated with investing in those securities. For more information on valuation inputs, please refer to the Security Valuation section in the accompanying Notes to Financial Statements. |
See accompanying notes which are an integral part of the financial statements.
Annual Report
VIP Investor Freedom 2020 Portfolio
Statement of Assets and Liabilities
| December 31, 2011 |
| | |
Assets | | |
Investment in securities, at value (cost $115,919,715) - See accompanying schedule | | $ 102,874,480 |
Cash | | 31 |
Receivable for fund shares sold | | 4,899 |
Total assets | | 102,879,410 |
| | |
Liabilities | | |
Payable for investments purchased | | 4,881 |
| | |
Net Assets | | $ 102,874,529 |
Net Assets consist of: | | |
Paid in capital | | $ 116,088,859 |
Accumulated undistributed net realized gain (loss) on investments | | (169,095) |
Net unrealized appreciation (depreciation) on investments | | (13,045,235) |
Net Assets, for 11,049,701 shares outstanding | | $ 102,874,529 |
Net Asset Value, offering price and redemption price per share ($102,874,529 ÷ 11,049,701 shares) | | $ 9.31 |
Statement of Operations
| Year ended December 31, 2011 |
| | |
Investment Income | | |
Income distributions from underlying funds | | $ 2,263,605 |
| | |
Expenses | | |
Independent trustees' compensation | $ 367 | |
Total expenses before reductions | 367 | |
Expense reductions | (367) | 0 |
Net investment income (loss) | | 2,263,605 |
Realized and Unrealized Gain (Loss) Realized gain (loss) on sale of underlying fund shares | 160,905 | |
Capital gain distributions from underlying funds | 842,264 | |
Total net realized gain (loss) | | 1,003,169 |
Change in net unrealized appreciation (depreciation) on underlying funds | | (4,808,136) |
Net gain (loss) | | (3,804,967) |
Net increase (decrease) in net assets resulting from operations | | $ (1,541,362) |
See accompanying notes which are an integral part of the financial statements.
Annual Report
Statement of Changes in Net Assets
| Year ended
December 31, 2011 | Year ended
December 31, 2010 |
Increase (Decrease) in Net Assets | | |
Operations | | |
Net investment income (loss) | $ 2,263,605 | $ 1,960,564 |
Net realized gain (loss) | 1,003,169 | 1,206,205 |
Change in net unrealized appreciation (depreciation) | (4,808,136) | 8,652,787 |
Net increase (decrease) in net assets resulting from operations | (1,541,362) | 11,819,556 |
Distributions to shareholders from net investment income | (2,265,071) | (1,970,982) |
Distributions to shareholders from net realized gain | (568,142) | (1,414,267) |
Total distributions | (2,833,213) | (3,385,249) |
Share transactions
Proceeds from sales of shares | 18,593,039 | 17,485,465 |
Reinvestment of distributions | 2,833,213 | 3,385,249 |
Cost of shares redeemed | (10,719,943) | (13,240,020) |
Net increase (decrease) in net assets resulting from share transactions | 10,706,309 | 7,630,694 |
Total increase (decrease) in net assets | 6,331,734 | 16,065,001 |
| | |
Net Assets | | |
Beginning of period | 96,542,795 | 80,477,794 |
End of period | $ 102,874,529 | $ 96,542,795 |
Other Information Shares | | |
Sold | 1,883,889 | 1,894,263 |
Issued in reinvestment of distributions | 303,630 | 354,490 |
Redeemed | (1,108,116) | (1,457,338) |
Net increase (decrease) | 1,079,403 | 791,415 |
Financial Highlights
Years ended December 31, | 2011 | 2010 | 2009 | 2008 | 2007 |
Selected Per-Share Data | | | | | |
Net asset value, beginning of period | $ 9.68 | $ 8.77 | $ 7.12 | $ 12.09 | $ 11.53 |
Income from Investment Operations | | | | | |
Net investment income (loss)C | .21 | .21 | .30 | .27 | .31 |
Net realized and unrealized gain (loss) | (.32) | 1.05 | 1.72 | (4.06) | .84 |
Total from investment operations | (.11) | 1.26 | 2.02 | (3.79) | 1.15 |
Distributions from net investment income | (.21) | (.20) | (.28) | (.27) | (.40) |
Distributions from net realized gain | (.05) | (.15) | (.09) | (.91) | (.19) |
Total distributions | (.26) | (.35) | (.37) | (1.18) | (.59) |
Net asset value, end of period | $ 9.31 | $ 9.68 | $ 8.77 | $ 7.12 | $ 12.09 |
Total ReturnA,B | (1.11)% | 14.46% | 28.75% | (32.63)% | 10.20% |
Ratios to Average Net AssetsD,F | | | | | |
Expenses before reductionsE | .00% | .00% | .00% | .00% | .00% |
Expenses net of fee waivers, if any | .00% | .00% | .00% | .00% | .00% |
Expenses net of all reductions | .00% | .00% | .00% | .00% | .00% |
Net investment income (loss) | 2.20% | 2.28% | 3.82% | 2.77% | 2.59% |
Supplemental Data | | | | | |
Net assets, end of period (000 omitted) | $ 102,875 | $ 96,543 | $ 80,478 | $ 59,123 | $ 76,369 |
Portfolio turnover rate | 16% | 31% | 20% | 26% | 12% |
A Total returns do not reflect charges attributable to your insurance company's separate account. Inclusion of these charges would reduce the total returns shown.
B Total returns would have been lower if certain expenses had not been reduced during the applicable periods shown.
C Calculated based on average shares outstanding during the period.
D Amounts do not include the activity of the Underlying Funds.
E Amount represents less than .01%.
F Expense ratios reflect operating expenses of the Fund. Expenses before reductions do not reflect amounts reimbursed by the investment adviser or reductions from expense offset arrangements and do not represent the amount paid by the Fund during periods when reimbursements or reductions occur. Expenses net of fee waivers reflect expenses after reimbursement by the investment adviser but prior to reductions from expense offset arrangements. Expenses net of all reductions represent the net expenses paid by the Fund but do not include expenses of the investment companies in which the Fund invests.
See accompanying notes which are an integral part of the financial statements.
Annual Report
VIP Investor Freedom 2025 Portfolio
Investment Changes (Unaudited)
Fund Holdings as of December 31, 2011 |
| % of fund's
net assets | % of fund's net assets
6 months ago |
Domestic Equity Funds | | |
VIP Contrafund Portfolio Investor Class | 8.0 | 8.1 |
VIP Equity-Income Portfolio Investor Class | 9.5 | 9.4 |
VIP Growth & Income Portfolio Investor Class | 9.6 | 9.4 |
VIP Growth Portfolio Investor Class | 9.3 | 9.6 |
VIP Mid Cap Portfolio Investor Class | 3.2 | 3.3 |
VIP Value Portfolio Investor Class | 8.2 | 8.0 |
VIP Value Strategies Portfolio Investor Class | 3.4 | 3.4 |
| 51.2 | 51.2 |
Developed International Equity Funds | | |
VIP Overseas Portfolio Investor Class R | 13.7 | 15.7 |
Emerging Markets Equity Funds | | |
VIP Emerging Markets Portfolio Investor Class R | 3.5 | 2.7 |
High Yield Bond Funds | | |
VIP High Income Portfolio Investor Class | 7.6 | 7.5 |
Investment Grade Bond Funds | | |
VIP Investment Grade Bond Portfolio Investor Class | 23.7 | 22.8 |
Short-Term Funds | | |
VIP Money Market Portfolio Investor Class | 0.3 | 0.1 |
Net Other Assets (Liabilities)* | 0.0 | 0.0 |
| 100.0 | 100.0 |
* Amount represents less than 0.1%
Asset Allocation (% of fund's net assets) |
Current |
| Domestic Equity Funds | 51.2% | |
| Developed International Equity Funds | 13.7% | |
| Emerging Markets Equity Funds | 3.5% | |
| High Yield Bond Funds | 7.6% | |
| Investment Grade Bond Funds | 23.7% | |
| Short-Term Funds | 0.3% | |

Six months ago |
| Domestic Equity Funds | 51.2% | |
| Developed International Equity Funds | 15.7% | |
| Emerging Markets Equity Funds | 2.7% | |
| High Yield Bond Funds | 7.5% | |
| Investment Grade Bond Funds | 22.8% | |
| Short-Term Funds | 0.1% | |

Expected |
| Domestic Equity Funds | 49.9% | |
| Developed International Equity Funds | 15.5% | |
| Emerging Markets Equity Funds | 2.7% | |
| High Yield Bond Funds | 7.4% | |
| Investment Grade Bond Funds | 24.1% | |
| Short-Term Funds | 0.4% | |

The fund invests according to an asset allocation strategy that becomes increasingly conservative over time. The six months ago allocation is based on the fund's holdings as of June 30, 2011. The current allocation is based on the fund's holdings as of December 31, 2011. The expected allocation represents the fund's anticipated allocation at June 30, 2012. |
Annual Report
VIP Investor Freedom 2025 Portfolio
Investments December 31, 2011
Showing Percentage of Net Assets
Domestic Equity Funds - 51.2% |
| Shares | | Value |
Domestic Equity Funds - 51.2% |
VIP Contrafund Portfolio Investor Class | 182,051 | | $ 4,176,243 |
VIP Equity-Income Portfolio Investor Class | 267,786 | | 4,991,537 |
VIP Growth & Income Portfolio Investor Class | 399,931 | | 5,023,139 |
VIP Growth Portfolio Investor Class | 131,796 | | 4,851,416 |
VIP Mid Cap Portfolio Investor Class | 58,041 | | 1,683,200 |
VIP Value Portfolio Investor Class | 405,649 | | 4,295,828 |
VIP Value Strategies Portfolio Investor Class | 201,592 | | 1,761,912 |
TOTAL DOMESTIC EQUITY FUNDS (Cost $28,667,813) |
26,783,275
|
International Equity Funds - 17.2% |
| | | |
Developed International Equity Funds - 13.7% |
VIP Overseas Portfolio Investor Class R | 526,101 | | 7,149,713 |
Emerging Markets Equity Funds - 3.5% |
VIP Emerging Markets Portfolio Investor Class R | 239,040 | | 1,845,388 |
TOTAL INTERNATIONAL EQUITY FUNDS (Cost $11,254,800) |
8,995,101
|
Bond Funds - 31.3% |
| Shares | | Value |
High Yield Bond Funds - 7.6% |
VIP High Income Portfolio Investor Class | 744,674 | | $ 3,998,902 |
Investment Grade Bond Funds - 23.7% |
VIP Investment Grade Bond Portfolio Investor Class | 956,506 | | 12,367,623 |
TOTAL BOND FUNDS (Cost $16,414,934) |
16,366,525
|
Short-Term Funds - 0.3% |
| | | |
VIP Money Market Portfolio Investor Class
(Cost $133,586) | 133,586 | |
133,586
|
TOTAL INVESTMENT PORTFOLIO - 100.0% (Cost $56,471,133) | | 52,278,487 |
NET OTHER ASSETS (LIABILITIES) - 0.0% | | 3 |
NET ASSETS - 100% | $ 52,278,490 |
Other Information |
All investments are categorized as Level 1 under the Fair Value Hierarchy. The inputs or methodology used for valuing securities may not be an indication of the risk associated with investing in those securities. For more information on valuation inputs, please refer to the Security Valuation section in the accompanying Notes to Financial Statements. |
See accompanying notes which are an integral part of the financial statements.
Annual Report
VIP Investor Freedom 2025 Portfolio
Statement of Assets and Liabilities
| December 31, 2011 |
| | |
Assets | | |
Investment in securities, at value (cost $56,471,133) - See accompanying schedule | | $ 52,278,487 |
Receivable for fund shares sold | | 162,076 |
Total assets | | 52,440,563 |
| | |
Liabilities | | |
Payable for investments purchased | $ 162,050 | |
Payable for fund shares redeemed | 23 | |
Total liabilities | | 162,073 |
| | |
Net Assets | | $ 52,278,490 |
Net Assets consist of: | | |
Paid in capital | | $ 56,674,596 |
Accumulated undistributed net realized gain (loss) on investments | | (203,460) |
Net unrealized appreciation (depreciation) on investments | | (4,192,646) |
Net Assets, for 5,583,722 shares outstanding | | $ 52,278,490 |
Net Asset Value, offering price and redemption price per share ($52,278,490 ÷ 5,583,722 shares) | | $ 9.36 |
Statement of Operations
| Year ended December 31, 2011 |
| | |
Investment Income | | |
Income distributions from underlying funds | | $ 1,142,604 |
| | |
Expenses | | |
Independent trustees' compensation | $ 179 | |
Total expenses before reductions | 179 | |
Expense reductions | (179) | 0 |
Net investment income (loss) | | 1,142,604 |
Realized and Unrealized Gain (Loss) Realized gain (loss) on sale of underlying fund shares | 8,308 | |
Capital gain distributions from underlying funds | 327,286 | |
Total net realized gain (loss) | | 335,594 |
Change in net unrealized appreciation (depreciation) on underlying funds | | (2,939,325) |
Net gain (loss) | | (2,603,731) |
Net increase (decrease) in net assets resulting from operations | | $ (1,461,127) |
See accompanying notes which are an integral part of the financial statements.
Annual Report
VIP Investor Freedom 2025 Portfolio
Financial Statements - continued
Statement of Changes in Net Assets
| Year ended
December 31, 2011 | Year ended
December 31, 2010 |
Increase (Decrease) in Net Assets | | |
Operations | | |
Net investment income (loss) | $ 1,142,604 | $ 857,991 |
Net realized gain (loss) | 335,594 | 245,582 |
Change in net unrealized appreciation (depreciation) | (2,939,325) | 4,556,758 |
Net increase (decrease) in net assets resulting from operations | (1,461,127) | 5,660,331 |
Distributions to shareholders from net investment income | (1,144,600) | (856,138) |
Distributions to shareholders from net realized gain | (189,863) | (339,965) |
Total distributions | (1,334,463) | (1,196,103) |
Share transactions
Proceeds from sales of shares | 14,419,993 | 11,403,282 |
Reinvestment of distributions | 1,334,462 | 1,196,103 |
Cost of shares redeemed | (5,209,901) | (5,515,442) |
Net increase (decrease) in net assets resulting from share transactions | 10,544,554 | 7,083,943 |
Total increase (decrease) in net assets | 7,748,964 | 11,548,171 |
| | |
Net Assets | | |
Beginning of period | 44,529,526 | 32,981,355 |
End of period | $ 52,278,490 | $ 44,529,526 |
Other Information Shares | | |
Sold | 1,442,734 | 1,241,922 |
Issued in reinvestment of distributions | 142,419 | 123,024 |
Redeemed | (531,486) | (613,270) |
Net increase (decrease) | 1,053,667 | 751,676 |
Financial Highlights
Years ended December 31, | 2011 | 2010 | 2009 | 2008 | 2007 |
Selected Per-Share Data | | | | | |
Net asset value, beginning of period | $ 9.83 | $ 8.73 | $ 7.04 | $ 12.21 | $ 11.62 |
Income from Investment Operations | | | | | |
Net investment income (loss)C | .22 | .21 | .28 | .27 | .32 |
Net realized and unrealized gain (loss) | (.44) | 1.17 | 1.79 | (4.29) | .86 |
Total from investment operations | (.22) | 1.38 | 2.07 | (4.02) | 1.18 |
Distributions from net investment income | (.21) | (.20) | (.25) | (.26) | (.38) |
Distributions from net realized gain | (.04) | (.08) | (.13) | (.89) | (.21) |
Total distributions | (.25) | (.28) | (.38) | (1.15) | (.59) |
Net asset value, end of period | $ 9.36 | $ 9.83 | $ 8.73 | $ 7.04 | $ 12.21 |
Total ReturnA,B | (2.28) % | 15.80% | 29.95% | (34.22) % | 10.39% |
Ratios to Average Net AssetsD,F | | | | | |
Expenses before reductionsE | .00% | .00% | .00% | .00% | .00% |
Expenses net of fee waivers, if any | .00% | .00% | .00% | .00% | .00% |
Expenses net of all reductions | .00% | .00% | .00% | .00% | .00% |
Net investment income (loss) | 2.26% | 2.28% | 3.65% | 2.77% | 2.62% |
Supplemental Data | | | | | |
Net assets, end of period (000 omitted) | $ 52,278 | $ 44,530 | $ 32,981 | $ 21,454 | $ 28,587 |
Portfolio turnover rate | 15% | 29% | 18% | 30% | 10% |
A Total returns do not reflect charges attributable to your insurance company's separate account. Inclusion of these charges would reduce the total returns shown.
B Total returns would have been lower if certain expenses had not been reduced during the applicable periods shown.
C Calculated based on average shares outstanding during the period.
D Amounts do not include the activity of the Underlying Funds.
E Amount represents less than .01%.
F Expense ratios reflect operating expenses of the Fund. Expenses before reductions do not reflect amounts reimbursed by the investment adviser or reductions from expense offset arrangements and do not represent the amount paid by the Fund during periods when reimbursements or reductions occur. Expenses net of fee waivers reflect expenses after reimbursement by the investment adviser but prior to reductions from expense offset arrangements. Expenses net of all reductions represent the net expenses paid by the Fund but do not include expenses of the investment companies in which the Fund invests.
See accompanying notes which are an integral part of the financial statements.
Annual Report
VIP Investor Freedom 2030 Portfolio
Investment Changes (Unaudited)
Fund Holdings as of December 31, 2011 |
| % of fund's
net assets | % of fund's net assets
6 months ago |
Domestic Equity Funds | | |
VIP Contrafund Portfolio Investor Class | 8.4 | 8.5 |
VIP Equity-Income Portfolio Investor Class | 10.0 | 10.0 |
VIP Growth & Income Portfolio Investor Class | 10.1 | 9.9 |
VIP Growth Portfolio Investor Class | 9.8 | 10.1 |
VIP Mid Cap Portfolio Investor Class | 3.4 | 3.5 |
VIP Value Portfolio Investor Class | 8.6 | 8.5 |
VIP Value Strategies Portfolio Investor Class | 3.6 | 3.6 |
| 53.9 | 54.1 |
Developed International Equity Funds | | |
VIP Overseas Portfolio Investor Class R | 14.3 | 16.6 |
Emerging Markets Equity Funds | | |
VIP Emerging Markets Portfolio Investor Class R | 3.7 | 2.9 |
High Yield Bond Funds | | |
VIP High Income Portfolio Investor Class | 7.7 | 7.5 |
Investment Grade Bond Funds | | |
VIP Investment Grade Bond Portfolio Investor Class | 20.4 | 18.9 |
Net Other Assets (Liabilities)* | 0.0 | 0.0 |
| 100.0 | 100.0 |
* Amount represents less than 0.1%
Asset Allocation (% of fund's net assets) |
Current |
| Domestic Equity Funds | 53.9% | |
| Developed International Equity Funds | 14.3% | |
| Emerging Markets Equity Funds | 3.7% | |
| High Yield Bond Funds | 7.7% | |
| Investment Grade Bond Funds | 20.4% | |

Six months ago |
| Domestic Equity Funds | 54.1% | |
| Developed International Equity Funds | 16.6% | |
| Emerging Markets Equity Funds | 2.9% | |
| High Yield Bond Funds | 7.5% | |
| Investment Grade Bond Funds | 18.9% | |

Expected |
| Domestic Equity Funds | 52.0% | |
| Developed International Equity Funds | 16.1% | |
| Emerging Markets Equity Funds | 2.9% | |
| High Yield Bond Funds | 7.5% | |
| Investment Grade Bond Funds | 21.5% | |

The fund invests according to an asset allocation strategy that becomes increasingly conservative over time. The six months ago allocation is based on the fund's holdings as of June 30, 2011. The current allocation is based on the fund's holdings as of December 31, 2011. The expected allocation represents the fund's anticipated allocation at June 30, 2012. |
Annual Report
VIP Investor Freedom 2030 Portfolio
Investments December 31, 2011
Showing Percentage of Net Assets
Domestic Equity Funds - 53.9% |
| Shares | | Value |
Domestic Equity Funds - 53.9% |
VIP Contrafund Portfolio Investor Class | 188,312 | | $ 4,319,874 |
VIP Equity-Income Portfolio Investor Class | 277,215 | | 5,167,292 |
VIP Growth & Income Portfolio Investor Class | 414,068 | | 5,200,694 |
VIP Growth Portfolio Investor Class | 136,419 | | 5,021,599 |
VIP Mid Cap Portfolio Investor Class | 60,067 | | 1,741,935 |
VIP Value Portfolio Investor Class | 419,755 | | 4,445,209 |
VIP Value Strategies Portfolio Investor Class | 208,758 | | 1,824,546 |
TOTAL DOMESTIC EQUITY FUNDS (Cost $31,716,411) |
27,721,149
|
International Equity Funds - 18.0% |
| | | |
Developed International Equity Funds - 14.3% |
VIP Overseas Portfolio Investor Class R | 543,535 | | 7,386,642 |
Emerging Markets Equity Funds - 3.7% |
VIP Emerging Markets Portfolio Investor Class R | 246,472 | | 1,902,767 |
TOTAL INTERNATIONAL EQUITY FUNDS (Cost $12,192,520) |
9,289,409
|
Bond Funds - 28.1% |
| Shares | | Value |
High Yield Bond Funds - 7.7% |
VIP High Income Portfolio Investor Class | 736,515 | | $ 3,955,083 |
Investment Grade Bond Funds - 20.4% |
VIP Investment Grade Bond Portfolio Investor Class | 813,053 | | 10,512,769 |
TOTAL BOND FUNDS (Cost $14,684,719) |
14,467,852
|
TOTAL INVESTMENT PORTFOLIO - 100.0% (Cost $58,593,650) | | 51,478,410 |
NET OTHER ASSETS (LIABILITIES) - 0.0% | | (1) |
NET ASSETS - 100% | $ 51,478,409 |
Other Information |
All investments are categorized as Level 1 under the Fair Value Hierarchy. The inputs or methodology used for valuing securities may not be an indication of the risk associated with investing in those securities. For more information on valuation inputs, please refer to the Security Valuation section in the accompanying Notes to Financial Statements. |
See accompanying notes which are an integral part of the financial statements.
Annual Report
VIP Investor Freedom 2030 Portfolio
Statement of Assets and Liabilities
| December 31, 2011 |
| | |
Assets | | |
Investment in securities, at value (cost $58,593,650) - See accompanying schedule | | $ 51,478,410 |
Receivable for investments sold | | 140,317 |
Receivable for fund shares sold | | 1,023 |
Total assets | | 51,619,750 |
| | |
Liabilities | | |
Payable to custodian bank | $ 2 | |
Payable for fund shares redeemed | 141,339 | |
Total liabilities | | 141,341 |
| | |
Net Assets | | $ 51,478,409 |
Net Assets consist of: | | |
Paid in capital | | $ 58,827,970 |
Accumulated undistributed net realized gain (loss) on investments | | (234,321) |
Net unrealized appreciation (depreciation) on investments | | (7,115,240) |
Net Assets, for 5,768,136 shares outstanding | | $ 51,478,409 |
Net Asset Value, offering price and redemption price per share ($51,478,409 ÷ 5,768,136 shares) | | $ 8.92 |
Statement of Operations
| Year ended December 31, 2011 |
| | |
Investment Income | | |
Income distributions from underlying funds | | $ 1,100,862 |
| | |
Expenses | | |
Independent trustees' compensation | $ 180 | |
Total expenses before reductions | 180 | |
Expense reductions | (180) | 0 |
Net investment income (loss) | | 1,100,862 |
Realized and Unrealized Gain (Loss) Realized gain (loss) on sale of underlying fund shares | 11,761 | |
Capital gain distributions from underlying funds | 282,620 | |
Total net realized gain (loss) | | 294,381 |
Change in net unrealized appreciation (depreciation) on underlying funds | | (3,043,317) |
Net gain (loss) | | (2,748,936) |
Net increase (decrease) in net assets resulting from operations | | $ (1,648,074) |
See accompanying notes which are an integral part of the financial statements.
Annual Report
Statement of Changes in Net Assets
| Year ended
December 31, 2011 | Year ended
December 31, 2010 |
Increase (Decrease) in Net Assets | | |
Operations | | |
Net investment income (loss) | $ 1,100,862 | $ 843,098 |
Net realized gain (loss) | 294,381 | 364,306 |
Change in net unrealized appreciation (depreciation) | (3,043,317) | 4,779,150 |
Net increase (decrease) in net assets resulting from operations | (1,648,074) | 5,986,554 |
Distributions to shareholders from net investment income | (1,104,616) | (850,947) |
Distributions to shareholders from net realized gain | (185,981) | (588,834) |
Total distributions | (1,290,597) | (1,439,781) |
Share transactions
Proceeds from sales of shares | 11,831,783 | 9,717,483 |
Reinvestment of distributions | 1,290,597 | 1,439,781 |
Cost of shares redeemed | (4,775,189) | (4,193,863) |
Net increase (decrease) in net assets resulting from share transactions | 8,347,191 | 6,963,401 |
Total increase (decrease) in net assets | 5,408,520 | 11,510,174 |
| | |
Net Assets | | |
Beginning of period | 46,069,889 | 34,559,715 |
End of period | $ 51,478,409 | $ 46,069,889 |
Other Information Shares | | |
Sold | 1,239,890 | 1,100,150 |
Issued in reinvestment of distributions | 144,524 | 157,171 |
Redeemed | (512,617) | (485,488) |
Net increase (decrease) | 871,797 | 771,833 |
Financial Highlights
Years ended December 31, | 2011 | 2010 | 2009 | 2008 | 2007 |
Selected Per-Share Data | | | | | |
Net asset value, beginning of period | $ 9.41 | $ 8.38 | $ 6.66 | $ 12.48 | $ 11.72 |
Income from Investment Operations | | | | | |
Net investment income (loss)C | .20 | .19 | .21 | .23 | .30 |
Net realized and unrealized gain (loss) | (.46) | 1.15 | 1.85 | (4.78) | .99 |
Total from investment operations | (.26) | 1.34 | 2.06 | (4.55) | 1.29 |
Distributions from net investment income | (.20) | (.18) | (.20) | (.29) | (.29) |
Distributions from net realized gain | (.03) | (.13) | (.14) | (.98) | (.24) |
Total distributions | (.23) | (.31) | (.34) | (1.27) | (.53) |
Net asset value, end of period | $ 8.92 | $ 9.41 | $ 8.38 | $ 6.66 | $ 12.48 |
Total ReturnA,B | (2.78)% | 16.12% | 31.57% | (38.13)% | 11.28% |
Ratios to Average Net AssetsD,F | | | | | |
Expenses before reductionsE | .00% | .00% | .00% | .00% | .00% |
Expenses net of fee waivers, if any | .00% | .00% | .00% | .00% | .00% |
Expenses net of all reductions | .00% | .00% | .00% | .00% | .00% |
Net investment income (loss) | 2.16% | 2.20% | 2.86% | 2.38% | 2.41% |
Supplemental Data | | | | | |
Net assets, end of period (000 omitted) | $ 51,478 | $ 46,070 | $ 34,560 | $ 24,786 | $ 31,355 |
Portfolio turnover rate | 14% | 26% | 21% | 19% | 12% |
A Total returns do not reflect charges attributable to your insurance company's separate account. Inclusion of these charges would reduce the total returns shown.
B Total returns would have been lower if certain expenses had not been reduced during the applicable periods shown.
C Calculated based on average shares outstanding during the period.
D Amounts do not include the activity of the Underlying Funds.
E Amount represents less than .01%.
F Expense ratios reflect operating expenses of the Fund. Expenses before reductions do not reflect amounts reimbursed by the investment adviser or reductions from expense offset arrangements and do not represent the amount paid by the Fund during periods when reimbursements or reductions occur. Expenses net of fee waivers reflect expenses after reimbursement by the investment adviser but prior to reductions from expense offset arrangements. Expenses net of all reductions represent the net expenses paid by the Fund but do not include expenses of the investment companies in which the Fund invests.
See accompanying notes which are an integral part of the financial statements.
Annual Report
Notes to Financial Statements
For the period ended December 31, 2011
1. Organization.
VIP Investor Freedom Income Portfolio, VIP Investor Freedom 2005 Portfolio, VIP Investor Freedom 2010 Portfolio, VIP Investor Freedom 2015 Portfolio, VIP Investor Freedom 2020 Portfolio, VIP Investor Freedom 2025 Portfolio and VIP Investor Freedom 2030 Portfolio (the Funds) are funds of Variable Insurance Products Fund V. The Variable Insurance Products Fund V (the Trust) (referred to in this report as Fidelity Variable Insurance Products) is registered under the Investment Company Act of 1940, as amended (the 1940 Act), as an open-end management investment company organized as a Massachusetts business trust. Each Fund is authorized to issue an unlimited number of shares. The Funds invest primarily in a combination of other VIP equity, bond, and short-term funds (the Underlying Funds) managed by Fidelity Management & Research Company (FMR). Shares of each Fund may only be purchased by insurance companies for the purpose of funding variable annuity or variable life insurance contracts.
2. Significant Accounting Policies.
The financial statements have been prepared in conformity with accounting principles generally accepted in the United States of America (GAAP), which require management to make certain estimates and assumptions at the date of the financial statements. Actual results could differ from those estimates. Subsequent events, if any, through the date that the financial statements were issued have been evaluated in the preparation of the financial statements. The following summarizes the significant accounting policies of the Funds:
Security Valuation. Investments are valued as of 4:00 p.m. Eastern time on the last calendar day of the period. Each Fund categorizes the inputs to valuation techniques used to value their investments into a disclosure hierarchy consisting of three levels as shown below:
Level 1 - quoted prices in active markets for identical investments
Level 2 - other significant observable inputs (including quoted prices for similar investments, interest rates, prepayment speeds, etc.)
Level 3 - unobservable inputs (including the Fund's own assumptions based on the best information available)
Valuation techniques used to value each Fund's investments by major category are as follows. Investments in the Underlying Funds are valued at their closing net asset value (NAV) each business day and are categorized as Level 1 in the hierarchy.
Investment Transactions and Income. For financial reporting purposes, the Funds' investment holdings and NAV include trades executed through the end of the last business day of the period. The NAV per share for processing shareholder transactions is calculated as of the close of business of the New York Stock Exchange (NYSE), normally 4:00 p.m. Eastern time and includes trades executed through the end of the prior business day. Gains and losses on securities sold are determined on the basis of identified cost. Income and capital gain distributions from the Underlying Funds, if any, are recorded on the ex-dividend date.
Expenses. Expenses directly attributable to a fund are charged to that fund. Expenses attributable to more than one fund are allocated among the respective funds on the basis of relative net assets or other appropriate methods. Expenses included in the accompanying financial statements reflect the expenses of the Fund and do not include any expenses associated with the Underlying Funds. Expense estimates are accrued in the period to which they relate and adjustments are made when actual amounts are known.
Income Tax Information and Distributions to Shareholders. Each year, each Fund intends to qualify as a regulated investment company, including distributing substantially all of its taxable income and realized gains under Subchapter M of the Internal Revenue Code. As a result, no provision for income taxes is required. As of December 31, 2011, each Fund did not have any unrecognized tax benefits in the financial statements; nor is each Fund aware of any tax positions for which it is reasonably possible that the total amounts of unrecognized tax benefits will significantly change in the next twelve months. Each Fund files a U.S. federal tax return, in addition to state and local tax returns as required. A fund's tax returns are subject to examination by the Internal Revenue Service (IRS) for a period of three fiscal years. State and local tax returns may be subject to examination for an additional fiscal year depending on the jurisdiction.
Distributions are declared and recorded on the ex-dividend date. Income and capital gain distributions are determined in accordance with income tax regulations, which may differ from GAAP.
Capital accounts within the financial statements are adjusted for permanent book-tax differences. These adjustments have no impact on net assets or the results of operations. Temporary book-tax differences will reverse in a subsequent period.
Book-tax differences are primarily due to the short-term gain distributions from the Underlying Funds, capital loss carryforwards and losses deferred due to wash sales.
Annual Report
2. Significant Accounting Policies - continued
Income Tax Information and Distributions to Shareholders - continued
The federal tax cost of investment securities and unrealized appreciation (depreciation) as of period end were as follows for each Fund:
| Tax
cost | Gross unrealized appreciation | Gross unrealized
depreciation | Net unrealized
appreciation
(depreciation) on
securities and other
investments |
VIP Investor Freedom Income | $ 30,966,536 | $ 737,758 | $ (1,156,973) | $ (419,215) |
VIP Investor Freedom 2005 | 10,739,328 | 198,366 | (1,160,588) | (962,222) |
VIP Investor Freedom 2010 | 58,482,112 | 733,150 | (8,048,422) | (7,315,272) |
VIP Investor Freedom 2015 | 75,890,979 | 1,334,380 | (9,421,552) | (8,087,172) |
VIP Investor Freedom 2020 | 116,661,298 | 1,761,888 | (15,548,706) | (13,786,818) |
VIP Investor Freedom 2025 | 56,857,806 | 2,245,971 | (6,825,290) | (4,579,319) |
VIP Investor Freedom 2030 | 58,975,246 | 1,180,579 | (8,677,415) | (7,496,836) |
The tax-based components of distributable earnings as of period end were as follows for each Fund:
| Undistributed
long-term
capital gain | Net unrealized
appreciation
(depreciation) |
VIP Investor Freedom Income | $ 237,900 | $ (419,215) |
VIP Investor Freedom 2005 | 72,567 | (962,222) |
VIP Investor Freedom 2010 | 208,432 | (7,315,272) |
VIP Investor Freedom 2015 | 442,000 | (8,087,172) |
VIP Investor Freedom 2020 | 572,488 | (13,786,818) |
VIP Investor Freedom 2025 | 183,213 | (4,579,319) |
VIP Investor Freedom 2030 | 147,275 | (7,496,836) |
The tax character of distributions paid was as follows:
December 31, 2011 | | | |
| Ordinary
Income | Long-term
Capital Gains | Total |
VIP Investor Freedom Income | $ 736,899 | $ 18,854 | $ 755,753 |
VIP Investor Freedom 2005 | 246,767 | 5,354 | 252,121 |
VIP Investor Freedom 2010 | 1,304,165 | - | 1,304,165 |
VIP Investor Freedom 2015 | 1,976,640 | - | 1,976,640 |
VIP Investor Freedom 2020 | 2,813,048 | 20,165 | 2,833,213 |
VIP Investor Freedom 2025 | 1,334,463 | - | 1,334,463 |
VIP Investor Freedom 2030 | 1,290,597 | - | 1,290,597 |
December 31, 2010 | | | |
| Ordinary
Income | Long-term
Capital Gains | Total |
VIP Investor Freedom Income | $ 821,948 | $ 69,847 | $ 891,795 |
VIP Investor Freedom 2005 | 287,925 | 127,829 | 415,754 |
VIP Investor Freedom 2010 | 1,353,042 | - | 1,353,042 |
VIP Investor Freedom 2015 | 2,362,926 | 474,334 | 2,837,260 |
VIP Investor Freedom 2020 | 2,873,180 | 512,069 | 3,385,249 |
VIP Investor Freedom 2025 | 1,152,198 | 43,905 | 1,196,103 |
VIP Investor Freedom 2030 | 1,250,065 | 189,716 | 1,439,781 |
Annual Report
Notes to Financial Statements - continued
3. Purchases and Sales of Investments.
Purchases and redemptions of the Underlying Fund shares are noted in the table below.
| Purchases ($) | Redemptions ($) |
VIP Investor Freedom Income | 8,842,731 | 10,379,301 |
VIP Investor Freedom 2005 | 4,777,920 | 5,124,302 |
VIP Investor Freedom 2010 | 12,959,318 | 14,639,543 |
VIP Investor Freedom 2015 | 22,404,585 | 21,454,610 |
VIP Investor Freedom 2020 | 27,265,290 | 16,286,354 |
VIP Investor Freedom 2025 | 18,363,745 | 7,683,773 |
VIP Investor Freedom 2030 | 15,751,019 | 7,310,943 |
4. Fees and Other Transactions with Affiliates.
Management Fee. Strategic Advisers, Inc. (Strategic Advisers), an affiliate of FMR, provides the Funds with investment management related services. The Funds do not pay any fees for these services.
Other Transactions. Strategic Advisers has entered into an administration agreement with FMR under which FMR provides management and administrative services (other than investment advisory services) necessary for the operation of each Fund. Pursuant to this agreement, FMR pays all expenses of each Fund, excluding the compensation of the independent Trustees and certain other expenses such as interest expense. FMR also contracts with other Fidelity companies to perform the services necessary for the operation of each Fund. The Funds do not pay any fees for these services.
5. Expense Reductions.
FMR voluntarily agreed to reimburse the Funds to the extent annual operating expenses exceeded certain levels of average net assets as noted in the table below. Some expenses, for example interest expense, are excluded from this reimbursement.
The following Funds were in reimbursement during the period:
| Expense
Limitations | Reimbursement
from adviser |
VIP Investor Freedom Income | 0% | $ 114 |
VIP Investor Freedom 2005 | 0% | 39 |
VIP Investor Freedom 2010 | 0% | 195 |
VIP Investor Freedom 2015 | 0% | 252 |
VIP Investor Freedom 2020 | 0% | 367 |
VIP Investor Freedom 2025 | 0% | 179 |
VIP Investor Freedom 2030 | 0% | 180 |
6. Other.
The Funds' organizational documents provide former and current trustees and officers with a limited indemnification against liabilities arising in connection with the performance of their duties to the Funds. In the normal course of business, the Funds may also enter into contracts that provide general indemnifications. The Funds' maximum exposure under these arrangements is unknown as this would be dependent on future claims that may be made against the Funds. The risk of material loss from such claims is considered remote.
At the end of the period, FMR or its affiliates were owners of record of all of the outstanding shares of the Funds.
Annual Report
Report of Independent Registered Public Accounting Firm
To the Trustees of Variable Insurance Products V and the Shareholders of VIP Investor Freedom Income Portfolio, VIP Investor Freedom 2005 Portfolio, VIP Investor Freedom 2010 Portfolio, VIP Investor Freedom 2015 Portfolio, VIP Investor Freedom 2020 Portfolio, VIP Investor Freedom 2025 Portfolio, VIP Investor Freedom 2030 Portfolio:
In our opinion, the accompanying statements of assets and liabilities, including the schedules of investments, and the related statements of operations and of changes in net assets and the financial highlights present fairly, in all material respects, the financial positions of VIP Investor Freedom Income Portfolio, VIP Investor Freedom 2005 Portfolio, VIP Investor Freedom 2010 Portfolio, VIP Investor Freedom 2015 Portfolio, VIP Investor Freedom 2020 Portfolio, VIP Investor Freedom 2025 Portfolio and VIP Investor Freedom 2030 Portfolio (the Funds), each a fund of Variable Insurance Products V Trust, at December 31, 2011, the results of each of their operations for the year then ended, the changes in each of their net assets for each of the two years in the period then ended and the financial highlights for each of the five years in the period then ended, in conformity with accounting principles generally accepted in the United States of America. These financial statements and financial highlights (hereafter referred to as "financial statements") are the responsibility of the Funds' management. Our responsibility is to express an opinion on these financial statements based on our audits. We conducted our audits of these financial statements in accordance with the standards of the Public Company Accounting Oversight Board (United States). Those standards require that we plan and perform the audit to obtain reasonable assurance about whether the financial statements are free of material misstatement. An audit includes examining, on a test basis, evidence supporting the amounts and disclosures in the financial statements, assessing the accounting principles used and significant estimates made by management, and evaluating the overall financial statement presentation. We believe that our audits, which included confirmation of securities at December 31, 2011 by correspondence with the transfer agent of the underlying funds, provide a reasonable basis for our opinion.
/s/ PricewaterhouseCoopers LLP
PricewaterhouseCoopers LLP
Boston, Massachusetts
February 17, 2012
Annual Report
The Trustees and executive officers of the trust and funds, as applicable, are listed below. The Board of Trustees governs each fund and is responsible for protecting the interests of shareholders. The Trustees are experienced executives who meet periodically throughout the year to oversee each fund's activities, review contractual arrangements with companies that provide services to each fund, oversee management of the risks associated with such activities and contractual arrangements, and review each funds' performance. If the interests of a fund and an underlying Fidelity fund were to diverge, a conflict of interest could arise and affect how the Trustees fulfill their fiduciary duties to the affected funds. Strategic Advisers has structured the funds' to avoid these potential conflicts, although there may be situations where a conflict of interest is unavoidable. In such instances, Strategic Advisers and the Trustees would take reasonable steps to minimize and, if possible, eliminate the conflict. Except for James C. Curvey, each of the Trustees oversees 203 funds advised by FMR or an affiliate. Mr. Curvey oversees 429 funds advised by FMR or an affiliate.
The Trustees hold office without limit in time except that (a) any Trustee may resign; (b) any Trustee may be removed by written instrument, signed by at least two-thirds of the number of Trustees prior to such removal; (c) any Trustee who requests to be retired or who has become incapacitated by illness or injury may be retired by written instrument signed by a majority of the other Trustees; and (d) any Trustee may be removed at any special meeting of shareholders by a two-thirds vote of the outstanding voting securities of the trust. Each Trustee who is not an interested person (as defined in the 1940 Act) (Independent Trustee), shall retire not later than the last day of the calendar year in which his or her 75th birthday occurs. The Independent Trustees may waive this mandatory retirement age policy with respect to individual Trustees. The executive officers hold office without limit in time, except that any officer may resign or may be removed by a vote of a majority of the Trustees at any regular meeting or any special meeting of the Trustees. Except as indicated, each individual has held the office shown or other offices in the same company for the past five years.
Experience, Skills, Attributes, and Qualifications of the Funds' Trustees. The Governance and Nominating Committee has adopted a statement of policy that describes the experience, qualifications, attributes, and skills that are necessary and desirable for potential Independent Trustee candidates (Statement of Policy). The Board believes that each Trustee satisfied at the time he or she was initially elected or appointed a Trustee, and continues to satisfy, the standards contemplated by the Statement of Policy. The Governance and Nominating Committee also engages professional search firms to help identify potential Independent Trustee candidates who have the experience, qualifications, attributes, and skills consistent with the Statement of Policy. From time to time, additional criteria based on the composition and skills of the current Independent Trustees, as well as experience or skills that may be appropriate in light of future changes to board composition, business conditions, and regulatory or other developments, have also been considered by the professional search firms and the Governance and Nominating Committee. In addition, the Board takes into account the Trustees' commitment and participation in Board and committee meetings, as well as their leadership of standing and ad hoc committees throughout their tenure.
In determining that a particular Trustee was and continues to be qualified to serve as a Trustee, the Board has considered a variety of criteria, none of which, in isolation, was controlling. The Board believes that, collectively, the Trustees have balanced and diverse experience, qualifications, attributes, and skills, which allow the Board to operate effectively in governing each fund and protecting the interests of shareholders. Information about the specific experience, skills, attributes, and qualifications of each Trustee, which in each case led to the Board's conclusion that the Trustee should serve (or continue to serve) as a trustee of the funds, is provided below.
Board Structure and Oversight Function. Abigail P. Johnson is an interested person (as defined in the 1940 Act) and currently serves as Chairman. The Trustees have determined that an interested Chairman is appropriate and benefits shareholders because an interested Chairman has a personal and professional stake in the quality and continuity of services provided to the funds. Independent Trustees exercise their informed business judgment to appoint an individual of their choosing to serve as Chairman, regardless of whether the Trustee happens to be independent or a member of management. The Independent Trustees have determined that they can act independently and effectively without having an Independent Trustee serve as Chairman and that a key structural component for assuring that they are in a position to do so is for the Independent Trustees to constitute a substantial majority for the Board. The Independent Trustees also regularly meet in executive session. Kenneth L. Wolfe serves as Chairman of the Independent Trustees and as such (i) acts as a liaison between the Independent Trustees and management with respect to matters important to the Independent Trustees and (ii) with management prepares agendas for Board meetings.
Fidelity funds are overseen by different Boards of Trustees. The funds' Board oversees Fidelity's investment-grade bond, money market, and asset allocation funds and another Board oversees Fidelity's equity and high income funds. The asset allocation funds may invest in Fidelity funds that are overseen by such other Board. The use of separate Boards, each with its own committee structure, allows the Trustees of each group of Fidelity funds to focus on the unique issues of the funds they oversee, including common research, investment, and operational issues. On occasion, the separate Boards establish joint committees to address issues of overlapping consequences for the Fidelity funds overseen by each Board.
The Trustees operate using a system of committees to facilitate the timely and efficient consideration of all matters of importance to the Trustees, each fund, and fund shareholders and to facilitate compliance with legal and regulatory requirements and oversight of the funds' activities and associated risks. The Board, acting through its committees, has charged FMR and its affiliates with (i) identifying events or circumstances the occurrence of which could have demonstrably adverse effects on the funds' business and/or reputation; (ii) implementing processes and controls to lessen the possibility that such events or circumstances occur or to mitigate the effects of such events or circumstances if they do occur; and (iii) creating and maintaining a system designed to evaluate continuously business and market conditions in order to facilitate the identification and implementation processes described in (i) and (ii) above. Because the day-to-day operations and activities of the funds are carried out by or through FMR, its affiliates and other service providers, the funds' exposure to risks is mitigated but not eliminated by the processes overseen by the Trustees. While each of the Board's committees has responsibility for overseeing different aspects of the funds' activities, oversight is exercised primarily through the Operations and Audit Committees. In addition, an ad hoc Board committee of Independent Trustees has worked with FMR to enhance the Board's oversight of investment and financial risks, legal and regulatory risks, technology risks, and operational risks, including the development of additional risk reporting to the Board. Appropriate personnel, including but not limited to the funds' Chief Compliance Officer (CCO), FMR's internal auditor, the independent accountants, the funds' Treasurer and portfolio management personnel, make periodic reports to the Board's committees, as appropriate, including an annual review of FMR's risk management program for the Fidelity funds. The responsibilities of each standing committee, including their oversight responsibilities, are described further under "Standing Committees of the Funds' Trustees."
Annual Report
The funds' Statement of Additional Information (SAI) includes more information about the Trustees. To request a free copy, call Fidelity at 1-877-208-0098.
Interested Trustees*:
Correspondence intended for each Trustee who is an interested person may be sent to Fidelity Investments, 82 Devonshire Street, Boston, Massachusetts 02109.
Name, Age; Principal Occupations and Other Relevant Experience+ |
Abigail P. Johnson (50) |
| Year of Election or Appointment: 2009 Ms. Johnson is Trustee and Chairman of the Board of Trustees of certain Trusts. Ms. Johnson serves as President of Personal, Workplace and Institutional Services (2005-present). Ms. Johnson is Chairman and Director of FMR Co., Inc. (2011-present), Chairman and Director of FMR (2011-present), and the Vice Chairman and Director (2007-present) of FMR LLC. Previously, Ms. Johnson served as President and a Director of FMR (2001-2005), a Trustee of other investment companies advised by FMR, Fidelity Investments Money Management, Inc., and FMR Co., Inc. (2001-2005), Senior Vice President of the Fidelity funds (2001-2005), and managed a number of Fidelity funds. Ms. Abigail P. Johnson and Mr. Arthur E. Johnson are not related. |
James C. Curvey (76) |
| Year of Election or Appointment: 2007 Mr. Curvey also serves as Trustee (2007-present) of other investment companies advised by FMR. Mr. Curvey is a Director of Fidelity Investments Money Management, Inc. (2009-present), Director of Fidelity Research & Analysis Co. (2009-present) and Director of FMR and FMR Co., Inc. (2007-present). Mr. Curvey is also Vice Chairman (2007-present) and Director of FMR LLC. In addition, Mr. Curvey serves as an Overseer for the Boston Symphony Orchestra and a member of the Trustees of Villanova University. Previously, Mr. Curvey was the Vice Chairman (2006-2007) and Director (2000-2007) of FMR Corp. |
* Trustees have been determined to be "Interested Trustees" by virtue of, among other things, their affiliation with the trust or various entities under common control with FMR.
+ The information above includes each Trustee's principal occupation during the last five years and other information relating to the experience, attributes, and skills relevant to each Trustee's qualifications to serve as a Trustee, which led to the conclusion that each Trustee should serve as a Trustee for each fund.
Independent Trustees:
Correspondence intended for each Independent Trustee (that is, the Trustees other than the Interested Trustees) may be sent to Fidelity Investments, P.O. Box 55235, Boston, Massachusetts 02205-5235.
Name, Age; Principal Occupations and Other Relevant Experience+ |
Albert R. Gamper, Jr. (69) |
| Year of Election or Appointment: 2006 Mr. Gamper is Vice Chairman of the Independent Trustees of the Fixed Income and Asset Allocation Funds (2011-present). Prior to his retirement in December 2004, Mr. Gamper served as Chairman of the Board of CIT Group Inc. (commercial finance). During his tenure with CIT Group Inc. Mr. Gamper served in numerous senior management positions, including Chairman (1987-1989; 1999-2001; 2002-2004), Chief Executive Officer (1987-2004), and President (2002-2003). Mr. Gamper currently serves as a member of the Board of Directors of Public Service Enterprise Group (utilities, 2000-present), a member of the Board of Trustees, Rutgers University (2004-present), and Chairman of the Board of Saint Barnabas Health Care System. Previously, Mr. Gamper served as Chairman of the Board of Governors, Rutgers University (2004-2007). |
Robert F. Gartland (60) |
| Year of Election or Appointment: 2010 Mr. Gartland is a partner and investor of Vietnam Partners LLC (investments and consulting, 2008-present) and is Chairman and an investor in Gartland and Mellina Group Corp. (consulting, 2009-present). Prior to his retirement, Mr. Gartland held a variety of positions at Morgan Stanley (financial services, 1979-2007) including Managing Director (1987-2007). |
Arthur E. Johnson (64) |
| Year of Election or Appointment: 2008 Mr. Johnson serves as a member of the Board of Directors of Eaton Corporation (diversified power management, 2009-present), AGL Resources, Inc. (holding company, 2002-present) and Booz Allen Hamilton (management consulting, 2011-present). Prior to his retirement, Mr. Johnson served as Senior Vice President of Corporate Strategic Development of Lockheed Martin Corporation (defense contractor, 1999-2009). He previously served on the Board of Directors of IKON Office Solutions, Inc. (1999-2008) and Delta Airlines (2005-2007). Mr. Arthur E. Johnson is not related to Mr. Edward C. Johnson 3d or Ms. Abigail P. Johnson. |
Michael E. Kenneally (57) |
| Year of Election or Appointment: 2009 Previously, Mr. Kenneally served as a Member of the Advisory Board for certain Fidelity Fixed Income and Asset Allocation Funds (2008-2009). Prior to his retirement, Mr. Kenneally served as Chairman and Global Chief Executive Officer of Credit Suisse Asset Management (2003-2005). Mr. Kenneally was a Director of the Credit Suisse Funds (U.S. mutual funds, 2004-2008) and certain other closed-end funds (2004-2005) and was awarded the Chartered Financial Analyst (CFA) designation in 1991. |
James H. Keyes (71) |
| Year of Election or Appointment: 2007 Mr. Keyes serves as a member of the Boards of Navistar International Corporation (manufacture and sale of trucks, buses, and diesel engines, since 2002) and Pitney Bowes, Inc. (integrated mail, messaging, and document management solutions, since 1998). Prior to his retirement, Mr. Keyes served as Chairman and Chief Executive Officer of Johnson Controls (automotive, building, and energy, 1998-2002) and as a member of the Board of LSI Logic Corporation (semiconductor technologies, 1984-2008). |
Marie L. Knowles (65) |
| Year of Election or Appointment: 2001 Prior to Ms. Knowles' retirement in June 2000, she served as Executive Vice President and Chief Financial Officer of Atlantic Richfield Company (ARCO) (diversified energy, 1996-2000). From 1993 to 1996, she was a Senior Vice President of ARCO and President of ARCO Transportation Company. She served as a Director of ARCO from 1996 to 1998. Ms. Knowles currently serves as a Director and Chairman of the Audit Committee of McKesson Corporation (healthcare service, since 2002). Ms. Knowles is an Honorary Trustee of the Brookings Institution and a member of the Board of the Catalina Island Conservancy and of the Santa Catalina Island Company (2009-present). She also serves as a member of the Advisory Board for the School of Engineering of the University of Southern California and the Foundation Board of the School of Architecture at the University of Virginia (2007-present). Previously, Ms. Knowles served as a Director of Phelps Dodge Corporation (copper mining and manufacturing, 1994-2007). |
Kenneth L. Wolfe (72) |
| Year of Election or Appointment: 2007 Mr. Wolfe is Chairman of the Independent Trustees of the Fixed Income and Asset Allocation Funds (2008-present). Prior to his retirement, Mr. Wolfe served as Chairman and a Director (2007-2009) and Chairman and Chief Executive Officer (1994-2001) of Hershey Foods Corporation. He also served as a member of the Boards of Adelphia Communications Corporation (telecommunications, 2003-2006), Bausch & Lomb, Inc. (medical/pharmaceutical, 1993-2007), and Revlon, Inc. (personal care products, 2004-2009). |
+ The information above includes each Trustee's principal occupation during the last five years and other information relating to the experience, attributes, and skills relevant to each Trustee's qualifications to serve as a Trustee, which led to the conclusion that each Trustee should serve as a Trustee for each fund.
Executive Officers:
Correspondence intended for each executive officer may be sent to Fidelity Investments, 82 Devonshire Street, Boston, Massachusetts 02109.
Name, Age; Principal Occupation |
John R. Hebble (53) |
| Year of Election or Appointment: 2008 President and Treasurer of Fidelity's Fixed Income and Asset Allocation Funds. Mr. Hebble also serves as President (2011-present), Treasurer, and Chief Financial Officer of The North Carolina Capital Management Trust: Cash and Term Portfolios (2008-present), Assistant Treasurer of other Fidelity funds (2009-present) and is an employee of Fidelity Investments. |
Derek L. Young (47) |
| Year of Election or Appointment: 2009 Vice President of Fidelity's Asset Allocation Funds. Mr. Young also serves as President and a Director of Strategic Advisers, Inc. (2011-present), President of the Global Asset Allocation Group (2011-present), and as Vice Chairman of Pyramis Global Advisers, LLC (2011-present). Previously, Mr. Young served as Chief Investment Officer of the Global Asset Allocation Group (2009-2011) and as a portfolio manager. |
Scott C. Goebel (43) |
| Year of Election or Appointment: 2008 Secretary and Chief Legal Officer (CLO) of the Fidelity funds. Mr. Goebel also serves as Secretary of Fidelity Investments Money Management, Inc. (FIMM) (2010-present) and Fidelity Research and Analysis Company (FRAC) (2010-present); Secretary and CLO of The North Carolina Capital Management Trust: Cash and Term Portfolios (2008-present); General Counsel, Secretary, and Senior Vice President of FMR (2008-present) and FMR Co., Inc. (2008-present); employed by FMR LLC or an affiliate (2001-present); Chief Legal Officer of Fidelity Management & Research (Hong Kong) Limited (2008-present) and Assistant Secretary of Fidelity Management & Research (Japan) Inc. (2008-present), and Fidelity Management & Research (U.K.) Inc. (2008-present). Previously, Mr. Goebel served as Assistant Secretary of FIMM (2008-2010), FRAC (2008-2010), and the Funds (2007-2008) and as Vice President and Secretary of Fidelity Distributors Corporation (FDC) (2005-2007). |
David J. Carter (38) |
| Year of Election or Appointment: 2010 Assistant Secretary of Fidelity's Fixed Income and Asset Allocation Funds. Mr. Carter also serves as Vice President, Associate General Counsel (2010-present) and is an employee of Fidelity Investments (2005-present). |
Holly C. Laurent (57) |
| Year of Election or Appointment: 2008 Anti-Money Laundering (AML) Officer of the Fidelity funds. Ms. Laurent also serves as AML Officer of The North Carolina Capital Management Trust: Cash and Term Portfolios (2008-present) and is an employee of Fidelity Investments. Previously, Ms. Laurent was Senior Vice President and Head of Legal for Fidelity Business Services India Pvt. Ltd. (2006-2008), and Senior Vice President, Deputy General Counsel and Group Head for FMR LLC (2005-2006). |
Christine Reynolds (53) |
| Year of Election or Appointment: 2008 Chief Financial Officer of the Fidelity funds. Ms. Reynolds became President of Fidelity Pricing and Cash Management Services (FPCMS) in August 2008. Ms. Reynolds served as Chief Operating Officer of FPCMS (2007-2008). Previously, Ms. Reynolds served as President, Treasurer, and Anti-Money Laundering officer of the Fidelity funds (2004-2007). |
Michael H. Whitaker (44) |
| Year of Election or Appointment: 2008 Chief Compliance Officer of Fidelity's Fixed Income and Asset Allocation Funds. Mr. Whitaker also serves as Chief Compliance Officer of The North Carolina Capital Management Trust: Cash and Term Portfolios (2008-present). Mr. Whitaker is an employee of Fidelity Investments (2007-present). Prior to joining Fidelity Investments, Mr. Whitaker worked at MFS Investment Management where he served as Senior Vice President and Chief Compliance Officer (2004-2006), and Assistant General Counsel. |
Jeffrey S. Christian (50) |
| Year of Election or Appointment: 2009 Deputy Treasurer of the Fidelity funds. Mr. Christian is an employee of Fidelity Investments. Previously, Mr. Christian served as Chief Financial Officer (2008-2009) of certain Fidelity funds and Senior Vice President of Fidelity Pricing and Cash Management Services (FPCMS) (2004-2009). |
Joseph F. Zambello (54) |
| Year of Election or Appointment: 2011 Deputy Treasurer of the Fidelity funds. Mr. Zambello is an employee of Fidelity Investments. Previously, Mr. Zambello served as Vice President of FMR's Program Management Group (2009-2011) and Vice President of the Transfer Agent Oversight Group (2005-2009). |
Stephanie J. Dorsey (42) |
| Year of Election or Appointment: 2008 Deputy Treasurer of Fidelity's Fixed Income and Asset Allocation Funds. Ms. Dorsey also serves as Assistant Treasurer of other Fidelity funds (2010-present) and is an employee of Fidelity Investments (2008-present). Previously, Ms. Dorsey served as Treasurer (2004-2008) of the JPMorgan Mutual Funds and Vice President (2004-2008) of JPMorgan Chase Bank. |
Adrien E. Deberghes (44) |
| Year of Election or Appointment: 2010 Assistant Treasurer of Fidelity's Fixed Income and Asset Allocation Funds. Mr. Deberghes also serves as Vice President and Assistant Treasurer of Fidelity Rutland Square Trust II and Fidelity Commonwealth Trust II (2011-present), Deputy Treasurer of other Fidelity funds (2008-present), and is an employee of Fidelity Investments (2008-present). Previously, Mr. Deberghes served as Senior Vice President of Mutual Fund Administration at State Street Corporation (2007-2008), Senior Director of Mutual Fund Administration at Investors Bank & Trust (2005-2007), and Director of Finance for Dunkin' Brands (2000-2005). |
Kenneth B. Robins (42) |
| Year of Election or Appointment: 2009 Assistant Treasurer of the Fidelity Fixed Income and Asset Allocation Funds. Mr. Robins also serves as President and Treasurer of other Fidelity funds (2008-present; 2010-present) and is an employee of Fidelity Investments (2004-present). Previously, Mr. Robins served as Deputy Treasurer of the Fidelity funds (2005-2008) and Treasurer and Chief Financial Officer of The North Carolina Capital Management Trust: Cash and Term Portfolios (2006-2008). |
Gary W. Ryan (53) |
| Year of Election or Appointment: 2005 Assistant Treasurer of the Fidelity funds. Mr. Ryan is an employee of Fidelity Investments. Previously, Mr. Ryan served as Vice President of Fund Reporting in Fidelity Pricing and Cash Management Services (FPCMS) (1999-2005). |
Jonathan Davis (43) |
| Year of Election or Appointment: 2010 Assistant Treasurer of the Fidelity funds. Mr. Davis is also Assistant Treasurer of Fidelity Rutland Square Trust II and Fidelity Commonwealth Trust II. Mr. Davis is an employee of Fidelity Investments. Previously, Mr. Davis served as Vice President and Associate General Counsel of FMR LLC (2003-2010). |
Annual Report
The Board of Trustees of each fund voted to pay to shareholders of record at the opening of business on record date, the following distributions per share derived from capital gains realized from sales of portfolio securities.
Fund | Pay Date | Record Date | Capital Gains |
VIP Investor Freedom Income Portfolio | 02/10/2012 | 02/10/2012 | $0.080 |
VIP Investor Freedom 2005 Portfolio | 02/10/2012 | 02/10/2012 | $0.073 |
VIP Investor Freedom 2010 Portfolio | 02/10/2012 | 02/10/2012 | $0.041 |
VIP Investor Freedom 2015 Portfolio | 02/10/2012 | 02/10/2012 | $0.063 |
VIP Investor Freedom 2020 Portfolio | 02/10/2012 | 02/10/2012 | $0.053 |
VIP Investor Freedom 2025 Portfolio | 02/10/2012 | 02/10/2012 | $0.034 |
VIP Investor Freedom 2030 Portfolio | 02/10/2012 | 02/10/2012 | $0.026 |
The funds hereby designate as capital gain dividend the amounts noted below for the taxable year ended December 31, 2011, or, if subsequently determined to be different, the net capital gain of such year.
Fund |
|
VIP Investor Freedom Income Portfolio | $239,089 |
VIP Investor Freedom 2005 Portfolio | $72,618 |
VIP Investor Freedom 2010 Portfolio | $211,966 |
VIP Investor Freedom 2015 Portfolio | $458,004 |
VIP Investor Freedom 2020 Portfolio | $583,085 |
VIP Investor Freedom 2025 Portfolio | $184,960 |
VIP Investor Freedom 2030 Portfolio | $151,746 |
A percentage of the dividends distributed during the fiscal year for the following funds was derived from interest on U.S. Government securities which is generally exempt from state income tax:
Fund |
|
VIP Investor Freedom Income Portfolio | 6.04% |
VIP Investor Freedom 2005 Portfolio | 5.22% |
VIP Investor Freedom 2010 Portfolio | 5.68% |
VIP Investor Freedom 2015 Portfolio | 5.07% |
VIP Investor Freedom 2020 Portfolio | 4.77% |
VIP Investor Freedom 2025 Portfolio | 4.04% |
VIP Investor Freedom 2030 Portfolio | 3.62% |
The amounts per share which represent income derived from sources within, and taxes paid to, foreign countries or possessions of the United States are as follows:
Fund | Pay Date | Income | Taxes |
VIP Investor Freedom Income Portfolio | 12/29/2011 | $0.010 | $0.001 |
VIP Investor Freedom 2005 Portfolio | 12/29/2011 | $0.018 | $0.001 |
VIP Investor Freedom 2010 Portfolio | 12/29/2011 | $0.022 | $0.002 |
VIP Investor Freedom 2015 Portfolio | 12/29/2011 | $0.022 | $0.002 |
VIP Investor Freedom 2020 Portfolio | 12/29/2011 | $0.025 | $0.002 |
VIP Investor Freedom 2025 Portfolio | 12/29/2011 | $0.029 | $0.002 |
VIP Investor Freedom 2030 Portfolio | 12/29/2011 | $0.029 | $0.002 |
A percentage of the dividends distributed during the fiscal year for the following funds qualifies for the dividends-received deduction for corporate shareholders:
Fund | February 2011 | December 2011 |
VIP Investor Freedom Income Portfolio | 2% | 8% |
VIP Investor Freedom 2005 Portfolio | 1% | 16% |
VIP Investor Freedom 2010 Portfolio | -% | 18% |
VIP Investor Freedom 2015 Portfolio | -% | 16% |
VIP Investor Freedom 2020 Portfolio | 2% | 20% |
VIP Investor Freedom 2025 Portfolio | -% | 25% |
VIP Investor Freedom 2030 Portfolio | -% | 27% |
Annual Report
Board Approval of Investment Advisory Contracts and Management Fees
VIP Investor Freedom Funds
Each year, the Board of Trustees, including the Independent Trustees (together, the Board), votes on the renewal of the management contract and administration agreement (together, the Advisory Contracts) for each fund. The Board, assisted by the advice of fund counsel and Independent Trustees' counsel, requests and considers a broad range of information relevant to the renewal of the Advisory Contracts throughout the year.
The Board meets regularly and considers at each of its meetings factors that are relevant to its annual consideration of the renewal of each fund's Advisory Contracts, including the services and support provided to each fund and its shareholders. The Board has established three standing committees, Operations, Audit, and Nominating and Governance, each composed of Independent Trustees with varying backgrounds, to which the Board has assigned specific subject matter responsibilities in order to enhance effective decision-making by the Board. The Operations Committee, of which all of the Independent Trustees are members, meets regularly throughout the year and, among other matters, considers matters specifically related to the annual consideration of the renewal of each fund's Advisory Contracts. The Board, acting directly and through its Committees, requests and receives information concerning the annual consideration of the renewal of each fund's Advisory Contracts. The Board also meets as needed to consider matters specifically related to the Board's annual consideration of the renewal of Advisory Contracts. Members of the Board may also meet with trustees of other Fidelity funds through ad hoc joint committees to discuss certain matters relevant to the Fidelity funds.
At its September 2011 meeting, the Board of Trustees, including the Independent Trustees, unanimously determined to renew each fund's Advisory Contracts. In reaching its determination, the Board considered all factors it believed relevant and reached a determination, with the assistance of fund counsel and Independent Trustees' counsel and through the exercise of its business judgment, that the renewal of the Advisory Contracts is in the best interests of each fund and its shareholders and that the lack of compensation payable under the Advisory Contracts is fair and reasonable. The Board's decision to renew the Advisory Contracts was not based on any single factor, but rather was based on a comprehensive consideration of all the information provided to the Board at its meetings throughout the year. In reaching its determination, the Board is aware that shareholders in each fund have a broad range of investment choices available to them, including a wide choice among mutual funds offered by Fidelity's competitors, and that each fund's shareholders, who have the opportunity to review and weigh the disclosure provided by the fund in its prospectus and other public disclosures, have chosen to invest in that fund, managed by Fidelity.
Nature, Extent, and Quality of Services Provided. The Board considered the staffing within the investment adviser, Strategic Advisers, Inc. (Strategic Advisers), and the administrator, FMR, including the backgrounds of the funds' investment personnel and the funds' investment objectives and disciplines. The Independent Trustees also had discussions with senior management of Fidelity's investment operations and investment groups. The Board considered the structure of the portfolio manager compensation program and whether this structure provides appropriate incentives to act in the best interests of each fund.
Resources Dedicated to Investment Management and Support Services. The Board reviewed the general qualifications and capabilities of Strategic Advisers' investment staff, including its size, education, experience, and resources, as well as Strategic Advisers' and FMR's approach to recruiting, managing, and compensating investment personnel. The Board also noted that FMR has devoted increased resources to non-U.S. offices. The Board noted that Fidelity's analysts have extensive resources, tools and capabilities which allow them to conduct sophisticated quantitative and fundamental analysis, as well as credit analysis of issuers, counterparties and enhancers. The Board also believes that Fidelity's investment professionals have sufficient access to global information and data so as to provide competitive investment results over time, and that those professionals also have access to sophisticated tools which permit them to assess portfolio construction and risk and performance attribution characteristics continuously, as well as to transmit new information and research conclusions rapidly around the world. Additionally, in its deliberations, the Board considered Strategic Advisers' trading capabilities and resources which are an integral part of the investment management process.
Shareholder and Administrative Services. The Board considered (i) the nature, extent, quality, and cost of advisory, administrative, and shareholder services performed by FMR and its affiliates under the Advisory Contracts and under separate agreements covering transfer agency, pricing and bookkeeping, and securities lending services for each fund; (ii) the nature and extent of FMR's supervision of third party service providers, principally custodians and subcustodians; and (iii) the resources devoted to, and the record of compliance with, each fund's compliance policies and procedures.
The Board noted that the growth of fund assets over time across the complex allows Fidelity to reinvest in the development of services designed to enhance the value or convenience of the Fidelity funds as investment vehicles. These services include 24-hour access to account information and market information through telephone representatives and over the Internet, investor education materials and asset allocation tools, and the expanded availability of Fidelity Investor Centers, with 35 new branches opening since 2010.
Investment in a Large Fund Family. The Board considered the benefits to shareholders of investing in a Fidelity fund, including the benefits of investing in a fund that is part of a large family of funds offering a variety of investment disciplines and providing a large variety of mutual fund investor services. The Board noted that Fidelity had taken, or had made recommendations that resulted in the Fidelity funds taking, a number of actions over the previous year that benefited particular funds, including (i) continuing to dedicate additional resources to investment research and support of the senior management team that oversees asset management; (ii) rationalizing product lines through the mergers of six funds into other funds; (iii) continuing to migrate the Freedom Funds to dedicated lower cost underlying funds; (iv) obtaining shareholder approval to broaden the investment strategies for Fidelity Consumer Finance Portfolio, Fidelity Emerging Asia Fund, and Fidelity Environment and Alternative Energy Portfolio; (v) contractually agreeing to reduce the management fees and impose other expense limitations on Spartan 500 Index Fund and U.S. Bond Index Fund in connection with launching new institutional classes of these funds; (vi) changing the name, primary and supplemental benchmarks, and investment policies of Fidelity Global Strategies Fund to support the fund's flexible investment mandate and global orientation; and (vii) reducing the transfer agency account fee rates on certain accounts.
Annual Report
Board Approval of Investment Advisory Contracts and Management Fees - continued
Investment Performance. The Board considered whether each fund has operated in accordance with its investment objective, as well as its record of compliance with its investment restrictions. It also reviewed each fund's absolute investment performance, as well as each fund's relative investment performance measured over multiple periods against a proprietary custom index. The Board noted that FMR does not believe that a meaningful peer group exists against which to compare any of the funds' performance, given that even competitor funds with the same target date can differ significantly in their asset allocation strategy, degree of active management, and glide path construction. For each fund, the following charts considered by the Board show, over the one-, three-, and five-year periods ended December 31, 2010, the fund's cumulative total returns and the cumulative total returns of a proprietary custom index ("benchmark"). For each fund, the proprietary custom index is an index developed by FMR that represents the performance of the fund's asset classes according to their respective weightings, adjusted on the last day of every month to reflect the fund's increasingly conservative asset allocations over time (for each fund other than VIP Investor Freedom Income Portfolio).
VIP Investor Freedom 2005 Portfolio
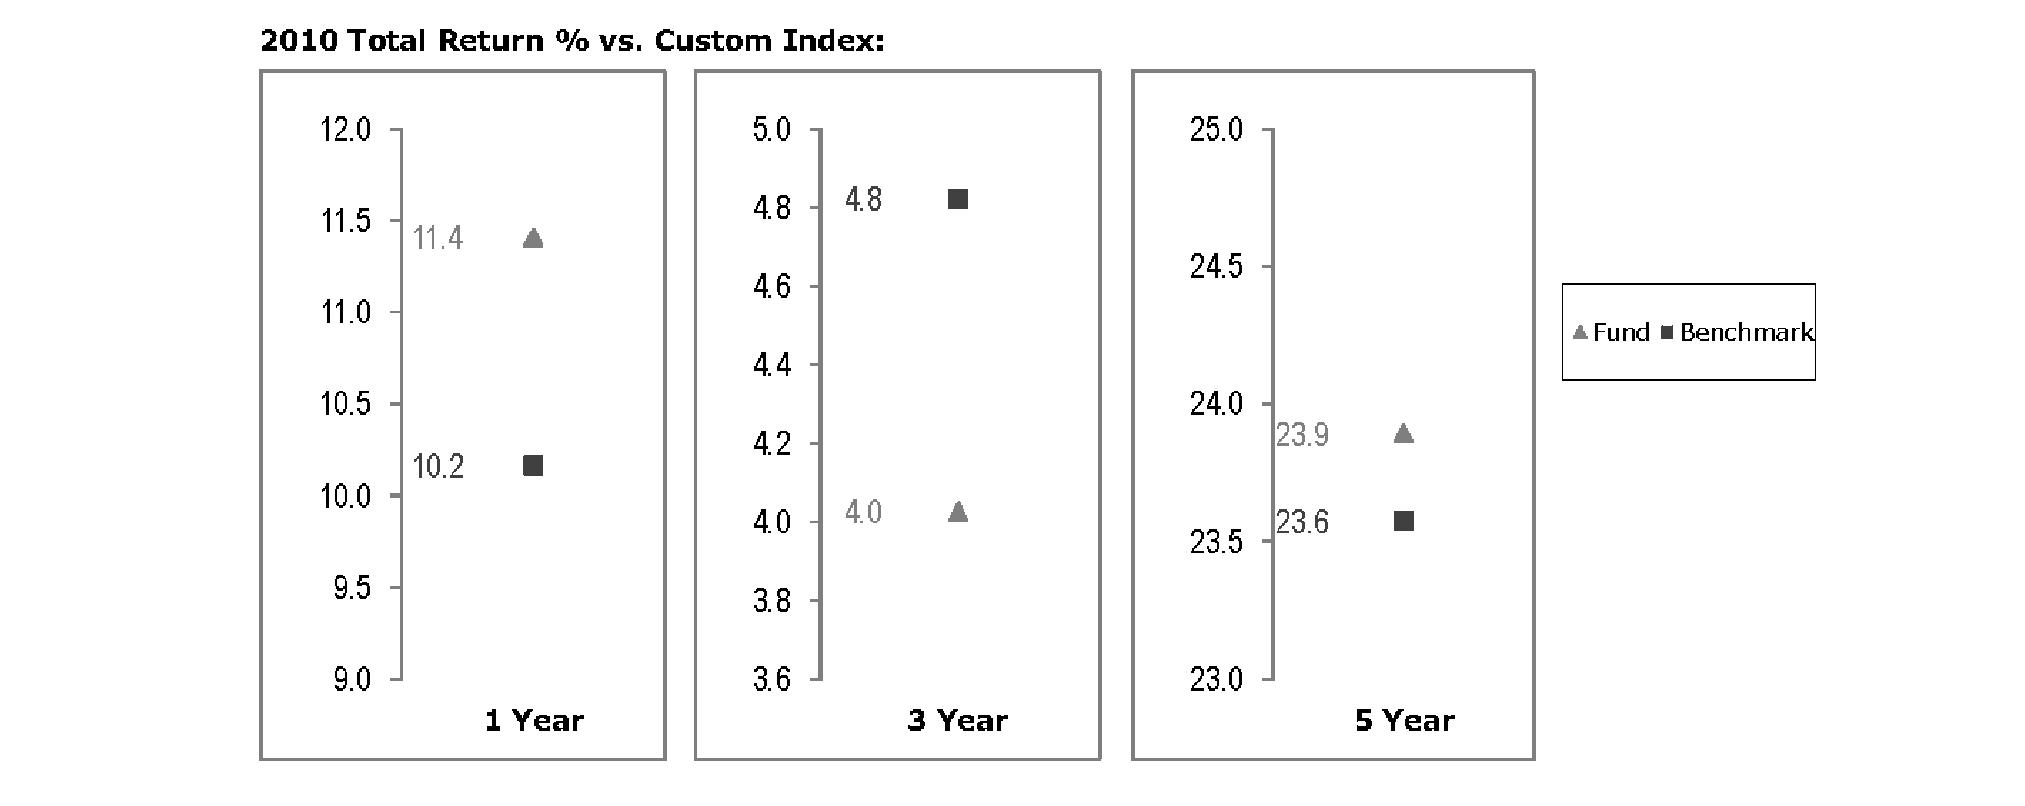
The Board noted that the investment performance of the fund compared favorably to its benchmark for the one- and five-year periods, although the fund's three-year cumulative total return was lower than its benchmark. The Board also reviewed the fund's performance since inception as well as performance in the current year.
Annual Report
VIP Investor Freedom 2010 Portfolio
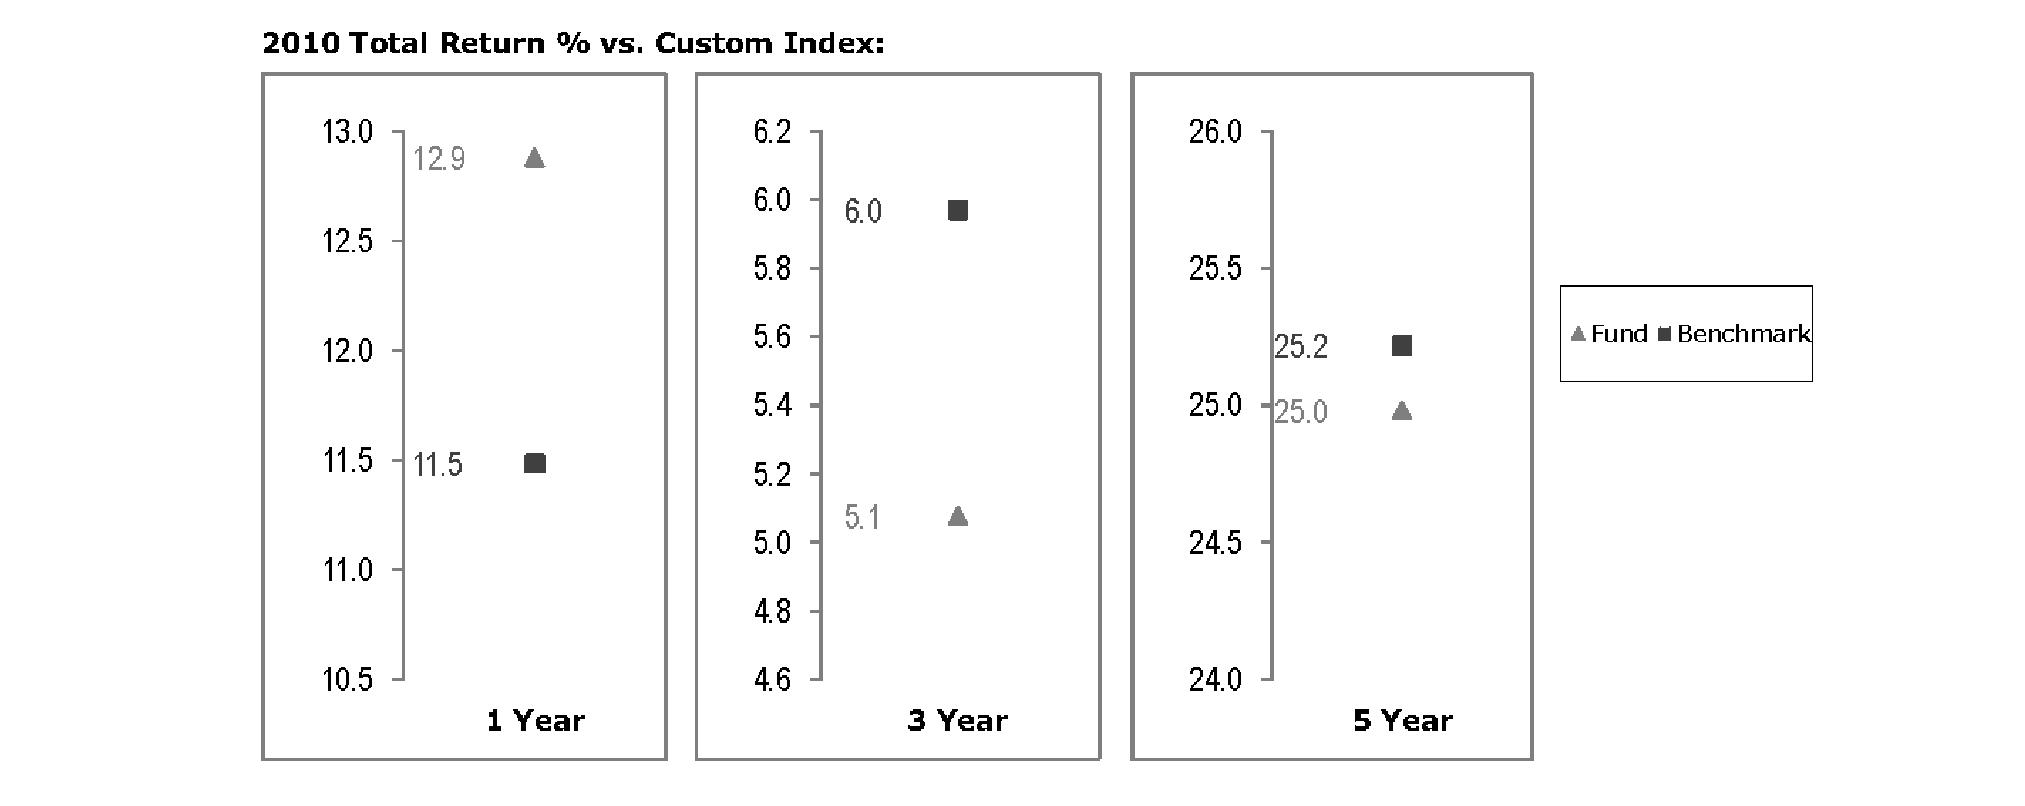
The Board noted that the investment performance of the fund was lower than its benchmark for the three- and five-year periods, although the fund's one-year total return compared favorably to its benchmark. The Board also reviewed the fund's performance since inception as well as performance in the current year.
VIP Investor Freedom 2015 Portfolio
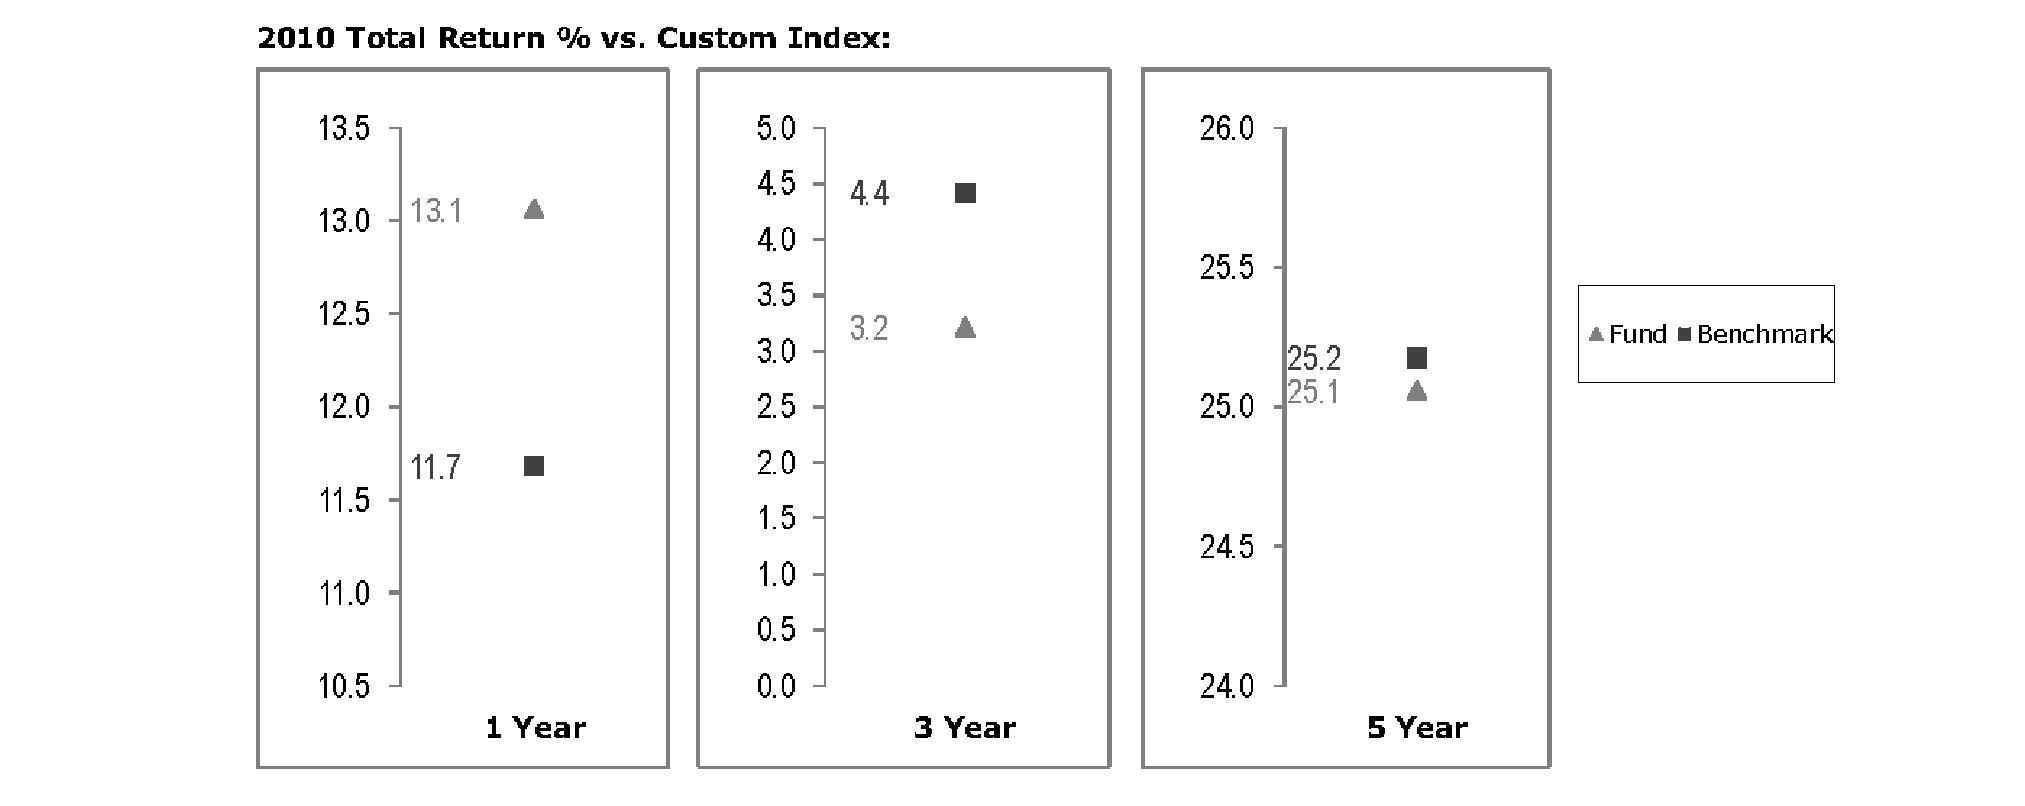
The Board noted that the investment performance of the fund was lower than its benchmark for the three- and five-year periods, although the fund's one-year total return compared favorably to its benchmark. The Board also reviewed the fund's performance since inception as well as performance in the current year.
Annual Report
Board Approval of Investment Advisory Contracts and Management Fees - continued
VIP Investor Freedom 2020 Portfolio

The Board noted that the investment performance of the fund was lower than its benchmark for the three- and five-year periods, although the fund's one-year total return compared favorably to its benchmark. The Board also reviewed the fund's performance since inception as well as performance in the current year.
VIP Investor Freedom 2025 Portfolio
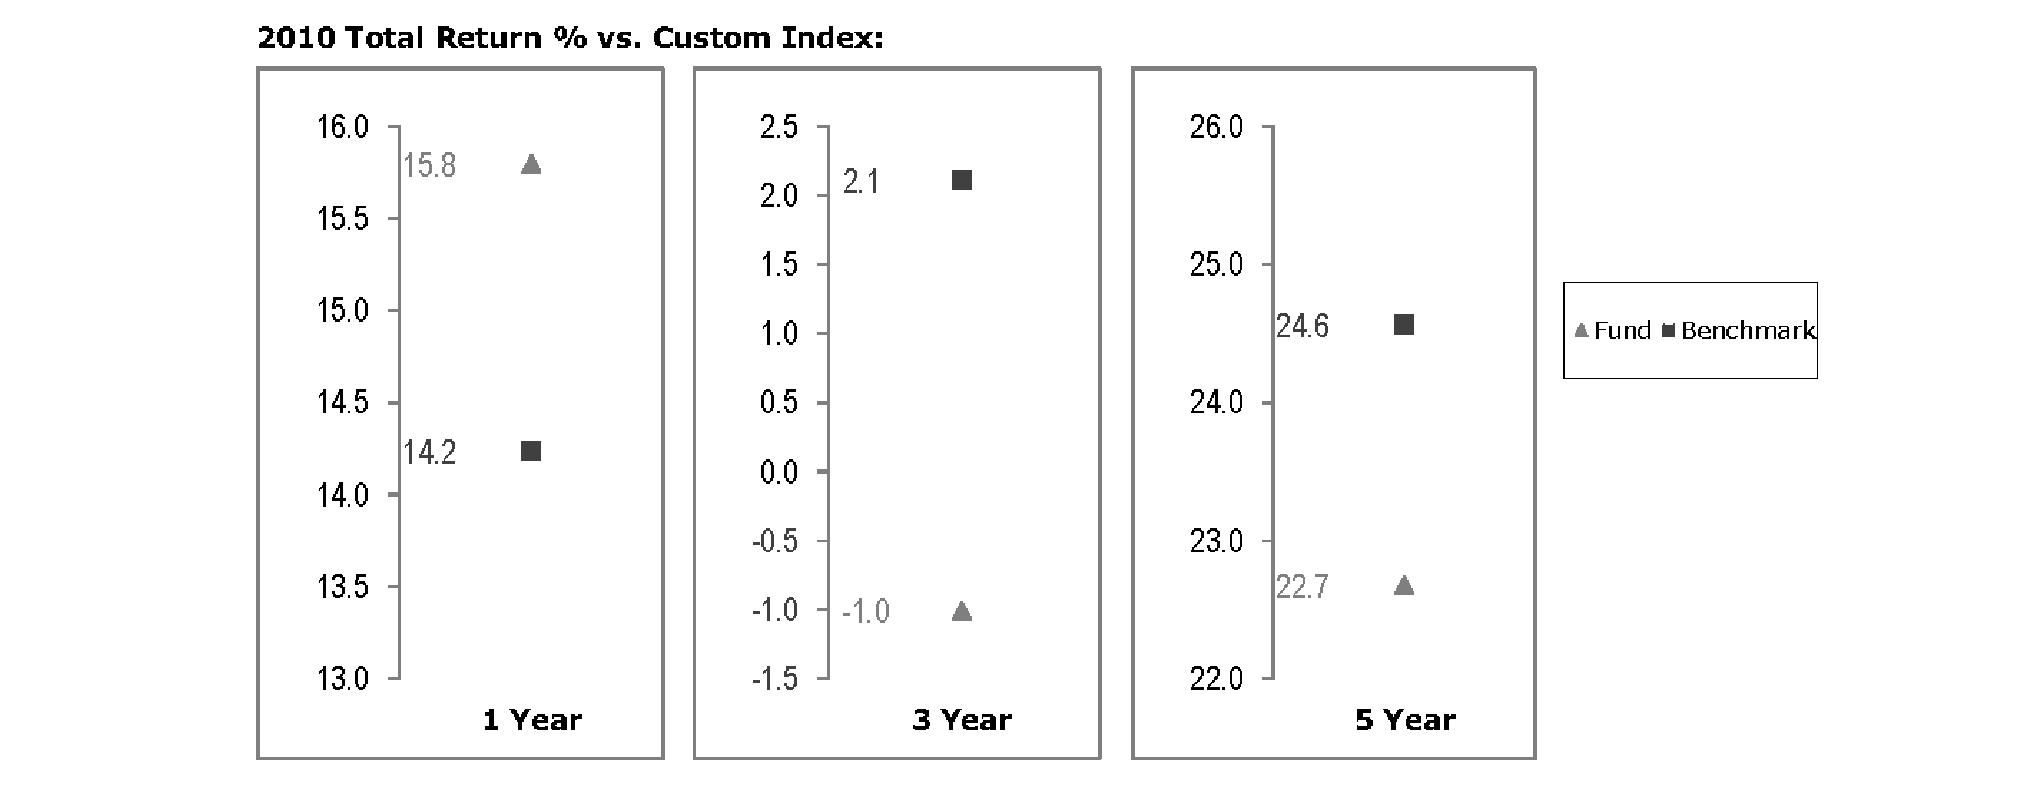
The Board noted that the investment performance of the fund was lower than its benchmark for the three- and five-year periods, although the fund's one-year total return compared favorably to its benchmark. The Board also reviewed the fund's performance since inception as well as performance in the current year.
Annual Report
VIP Investor Freedom 2030 Portfolio
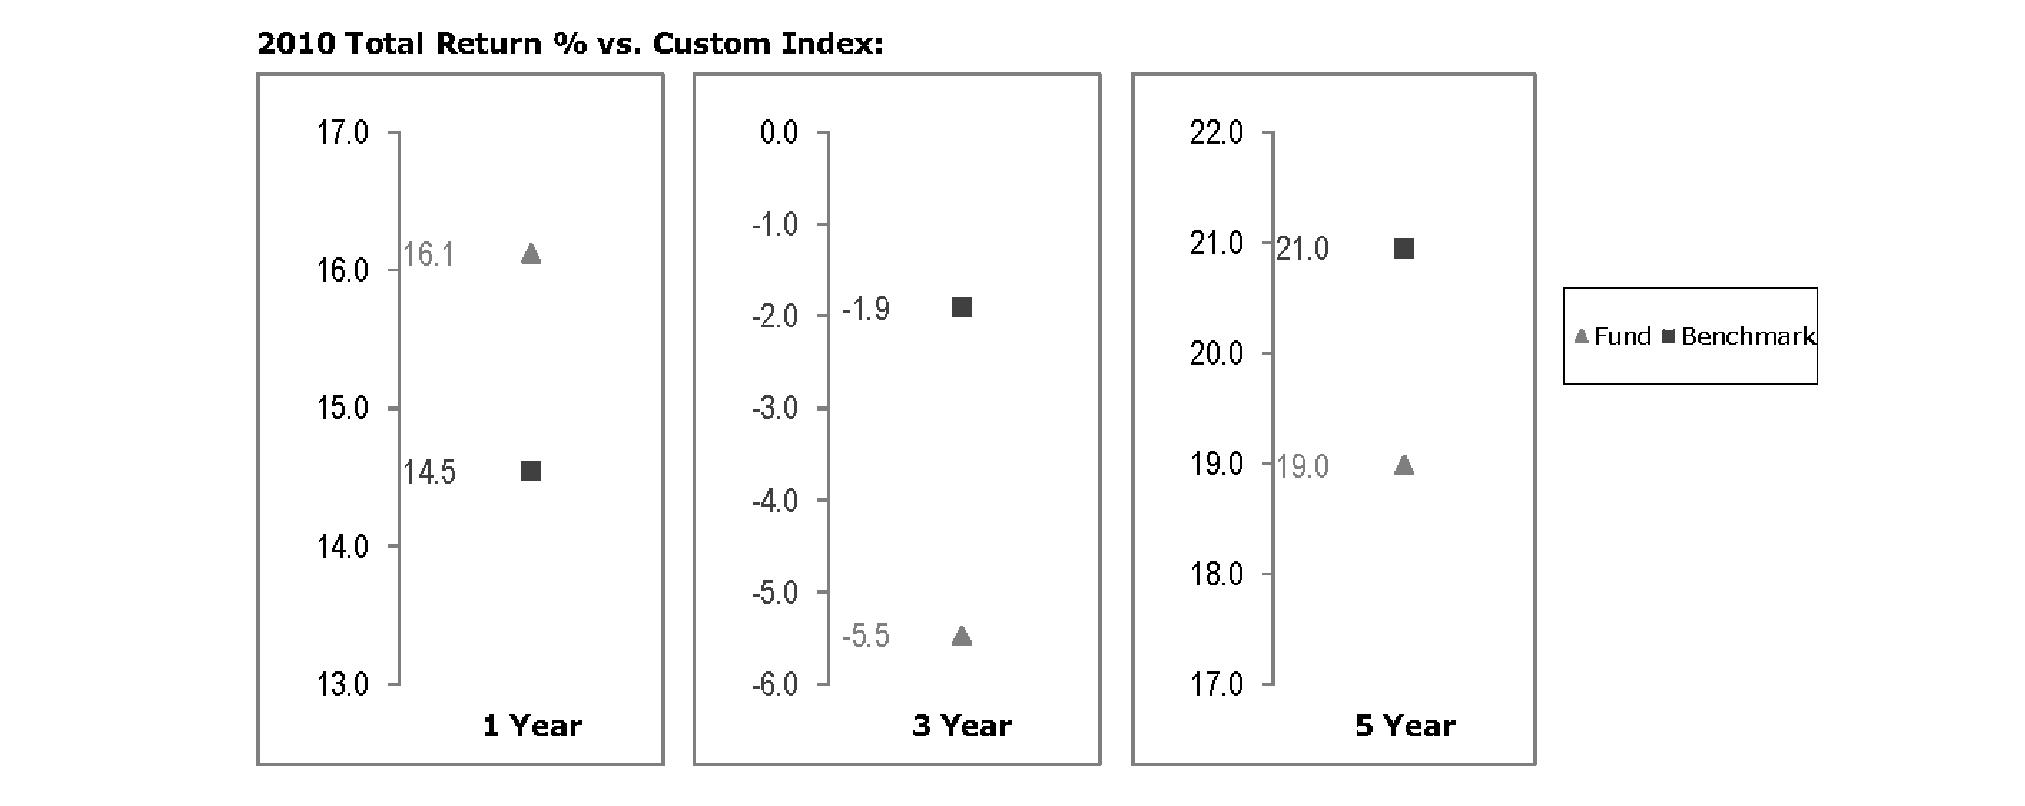
The Board noted that the investment performance of the fund was lower than its benchmark for the three- and five-year periods, although the fund's one-year total return compared favorably to its benchmark. The Board also reviewed the fund's performance since inception as well as performance in the current year.
VIP Investor Freedom Income Portfolio
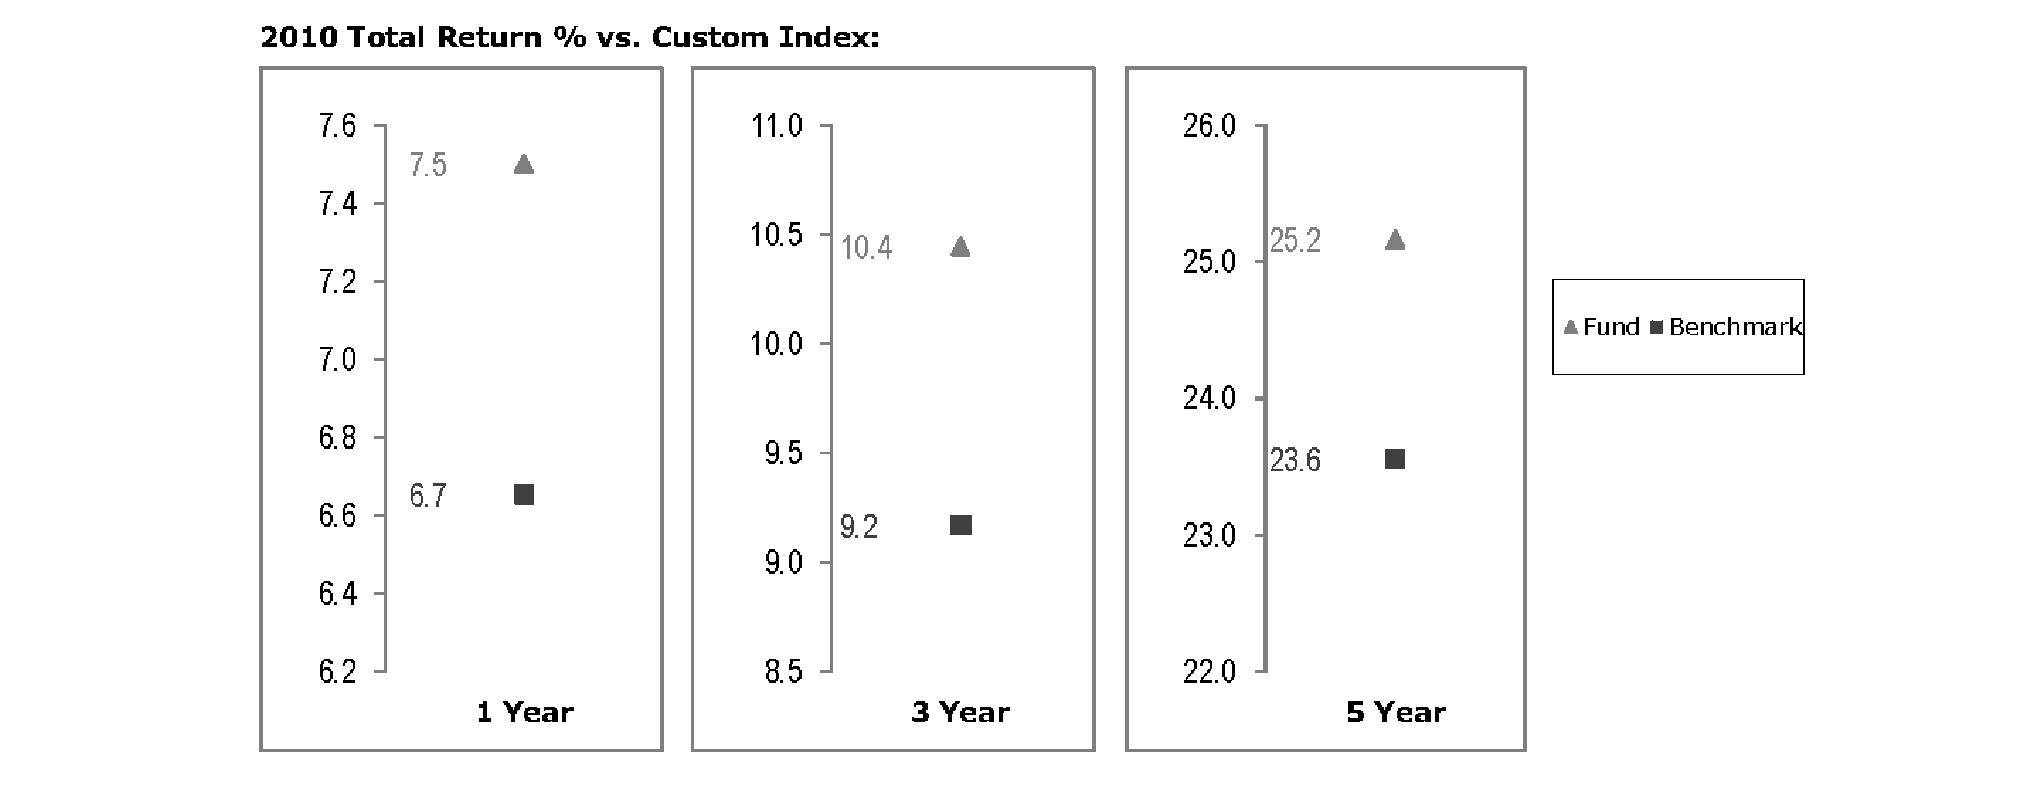
The Board noted that the investment performance of the fund compared favorably to its benchmark for all the periods shown. The Board also reviewed the fund's performance since inception as well as performance in the current year.
Based on its review, the Board concluded that the nature, extent, and quality of services provided to each fund under the Advisory Contracts should benefit each fund's shareholders.
Competitiveness of Management Fee and Total Expense Ratio. The Board noted that the funds do not pay Strategic Advisers a management fee for investment advisory services. The Board considered each fund's management fee and total expense ratio compared to "mapped groups" of competitive funds and classes, and also considered that each fund bears indirectly the expenses of the underlying funds in which it invests. Fidelity creates "mapped groups" by combining similar Lipper investment objective categories that have comparable management fee characteristics. Combining Lipper investment objective categories aids the Board's management fee and total expense ratio comparisons by broadening the competitive group used for comparison and by reducing the number of universes to which various Fidelity funds are compared.
Annual Report
Board Approval of Investment Advisory Contracts and Management Fees - continued
Management Fee. The Board considered two proprietary management fee comparisons for the 12-month periods shown in the charts below. The group of Lipper funds used by the Board for management fee comparisons is referred to below as the "Total Mapped Group." The Total Mapped Group comparison focuses on a fund's standing relative to the total universe of comparable funds available to investors in terms of gross management fees before expense reimbursements or caps. "TMG %" represents the percentage of funds in the Total Mapped Group that had management fees that were lower than a fund's. For example, a TMG % of 0% means that 100% of the funds in the Total Mapped Group had higher management fees than a fund. The "Asset-Size Peer Group" (ASPG) comparison focuses on a fund's standing relative to non-Fidelity funds similar in size to the fund within the Total Mapped Group. The ASPG represents at least 15% of the funds in the Total Mapped Group with comparable asset size and management fee characteristics, subject to a minimum of 50 funds (or all funds in the Total Mapped Group if fewer than 50). Additional information, such as the ASPG quartile in which a fund's management fee ranked, is also included in the charts and considered by the Board.
VIP Investor Freedom 2005 Portfolio
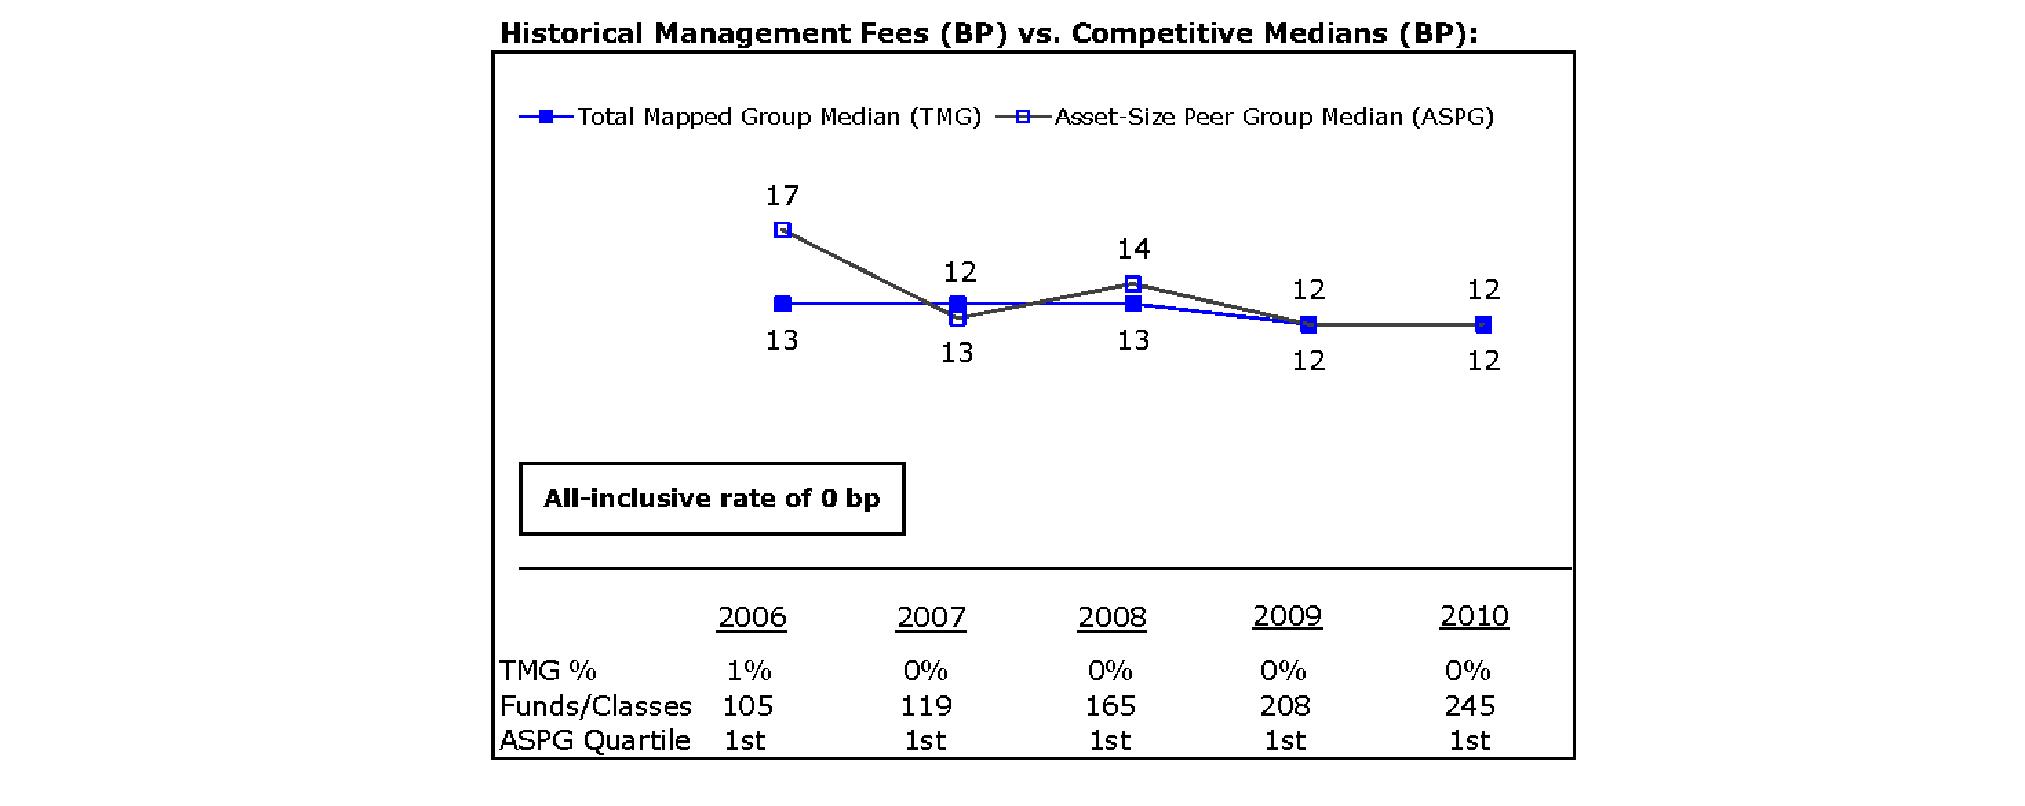
VIP Investor Freedom 2010 Portfolio
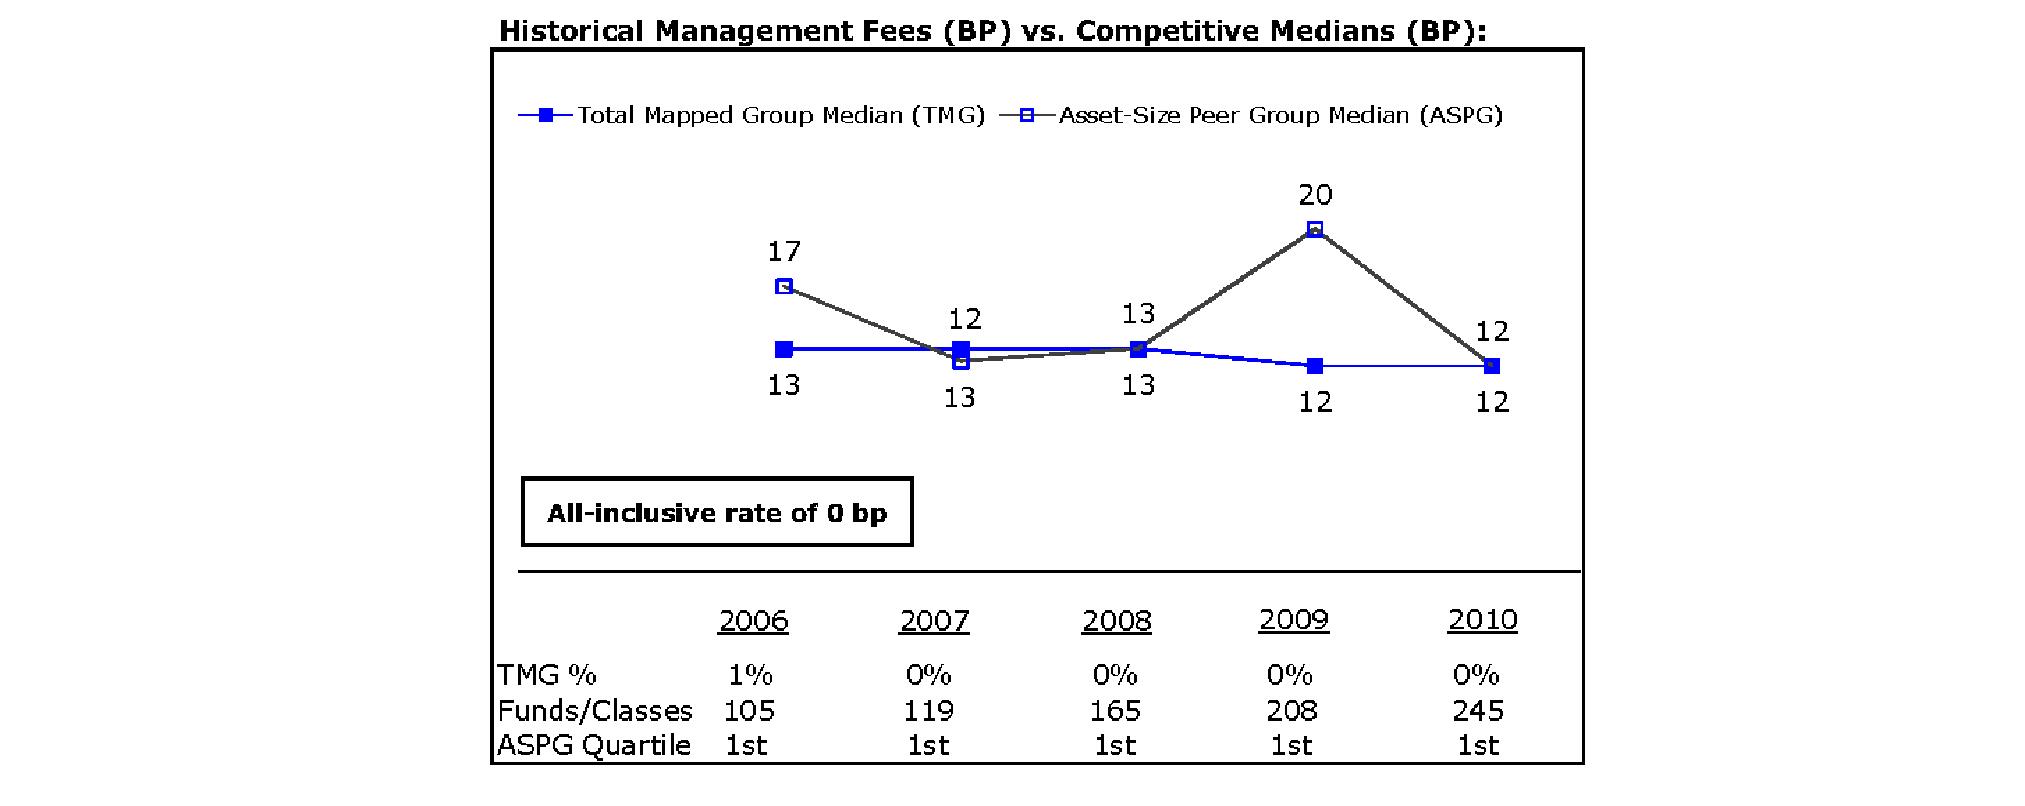
Annual Report
VIP Investor Freedom 2015 Portfolio
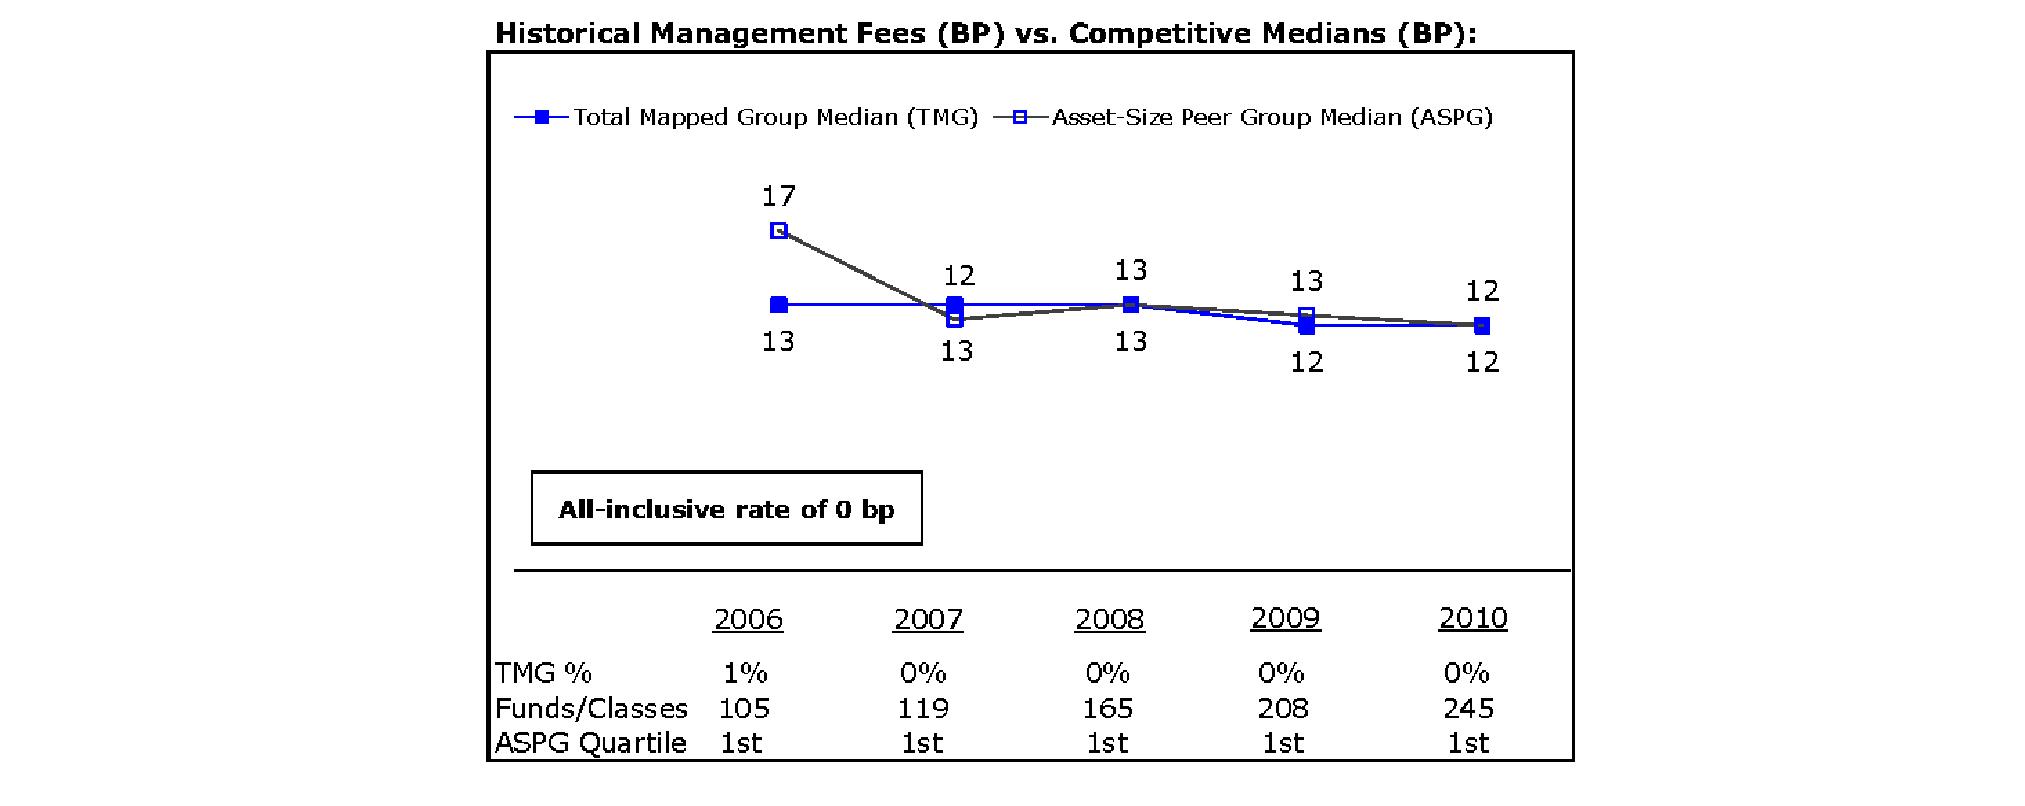
VIP Investor Freedom 2020 Portfolio
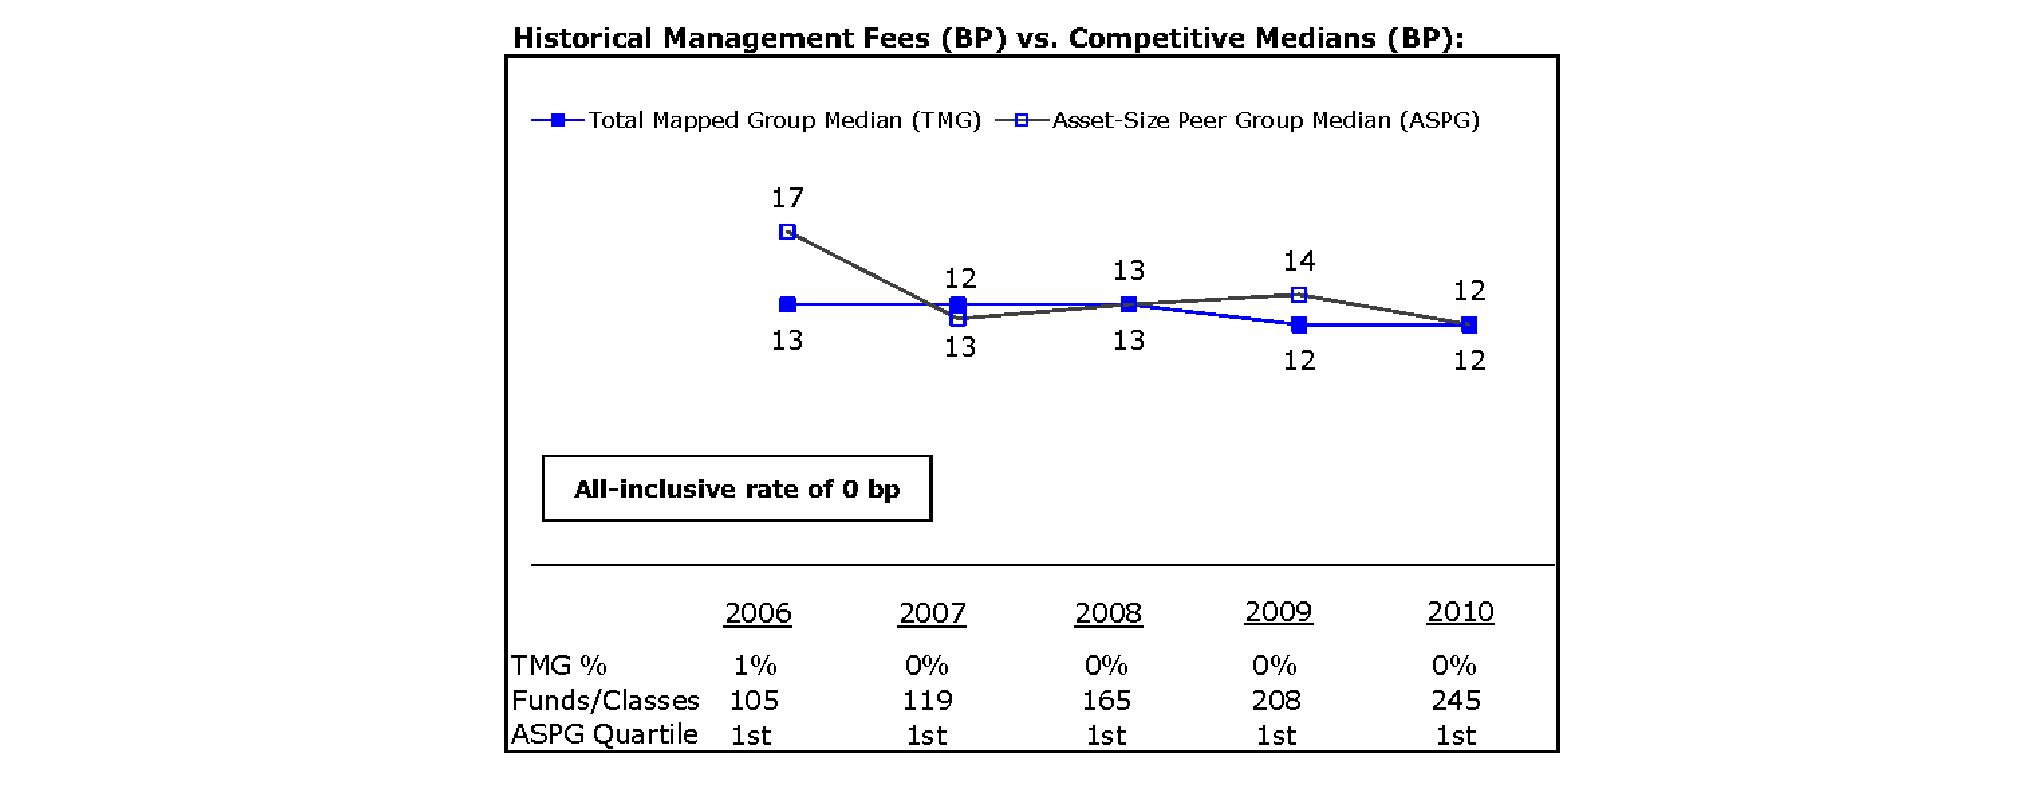
Annual Report
Board Approval of Investment Advisory Contracts and Management Fees - continued
VIP Investor Freedom 2025 Portfolio
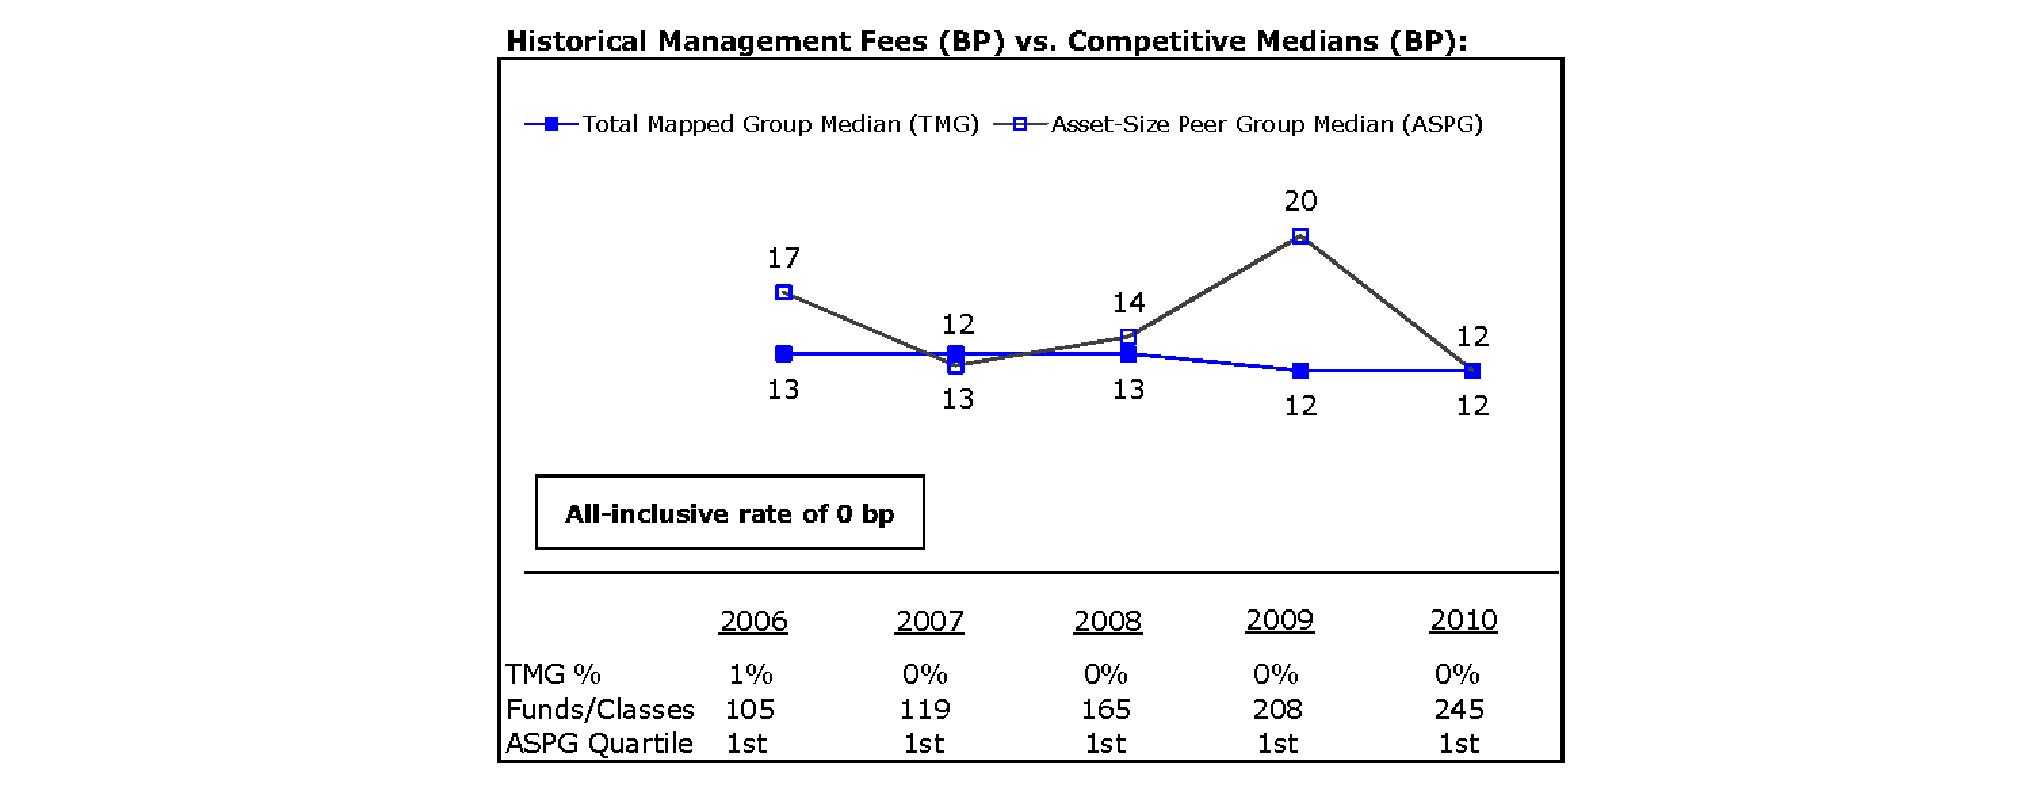
VIP Investor Freedom 2030 Portfolio
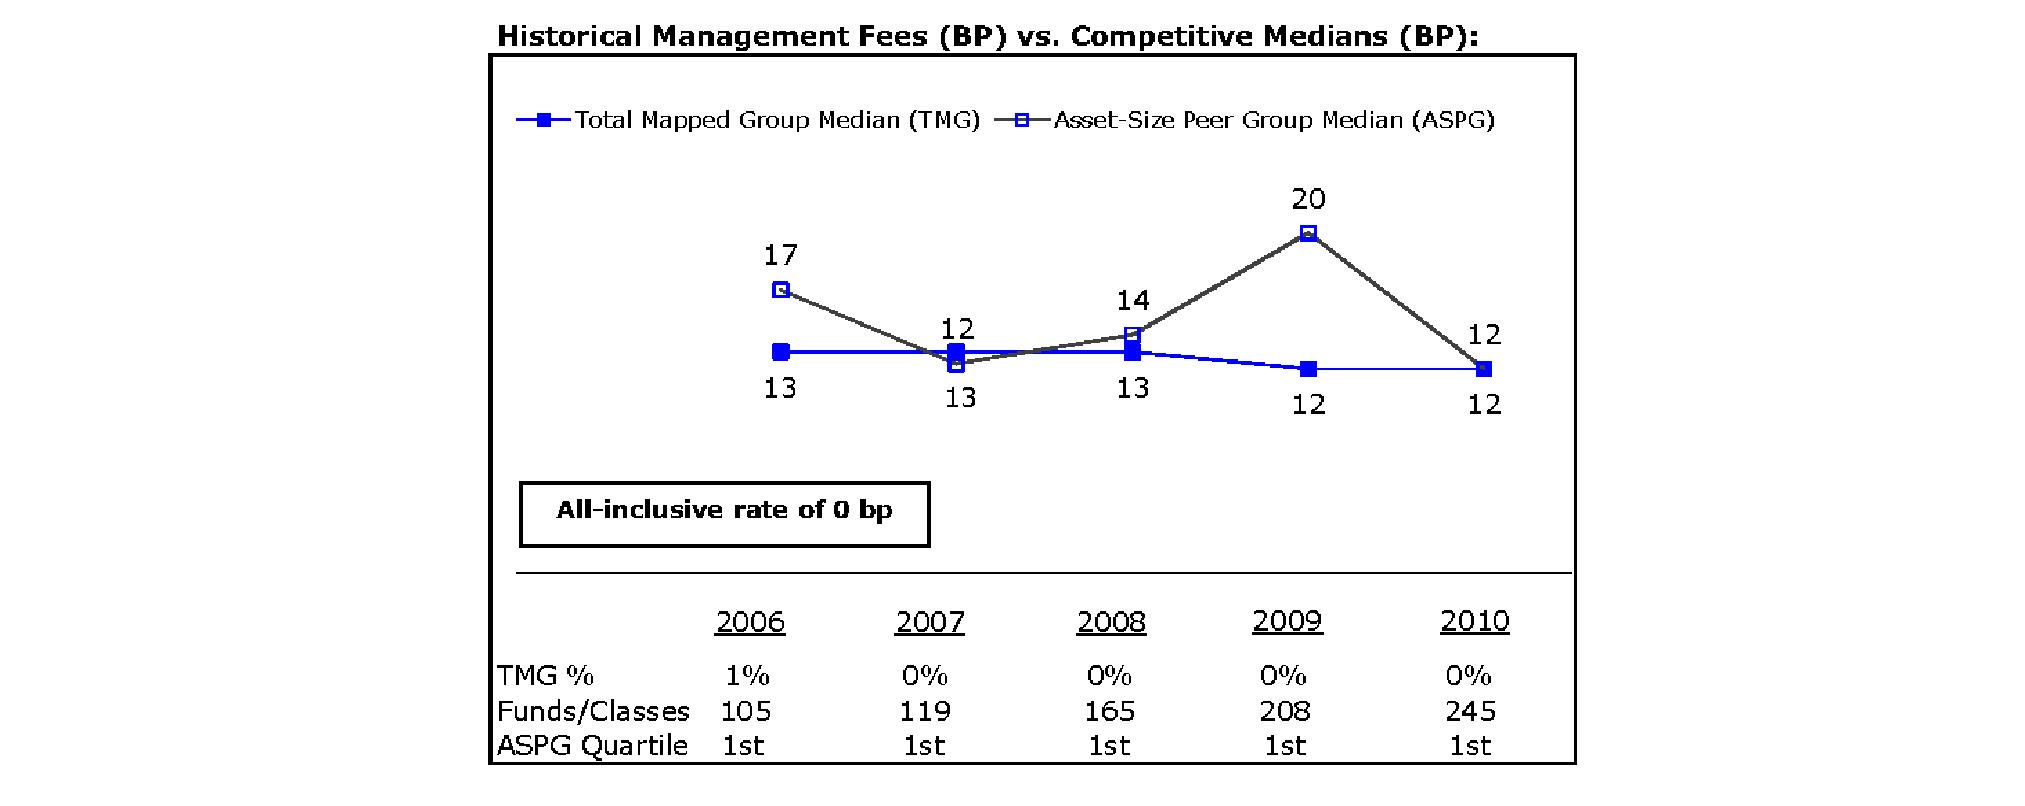
Annual Report
VIP Investor Freedom Income Portfolio
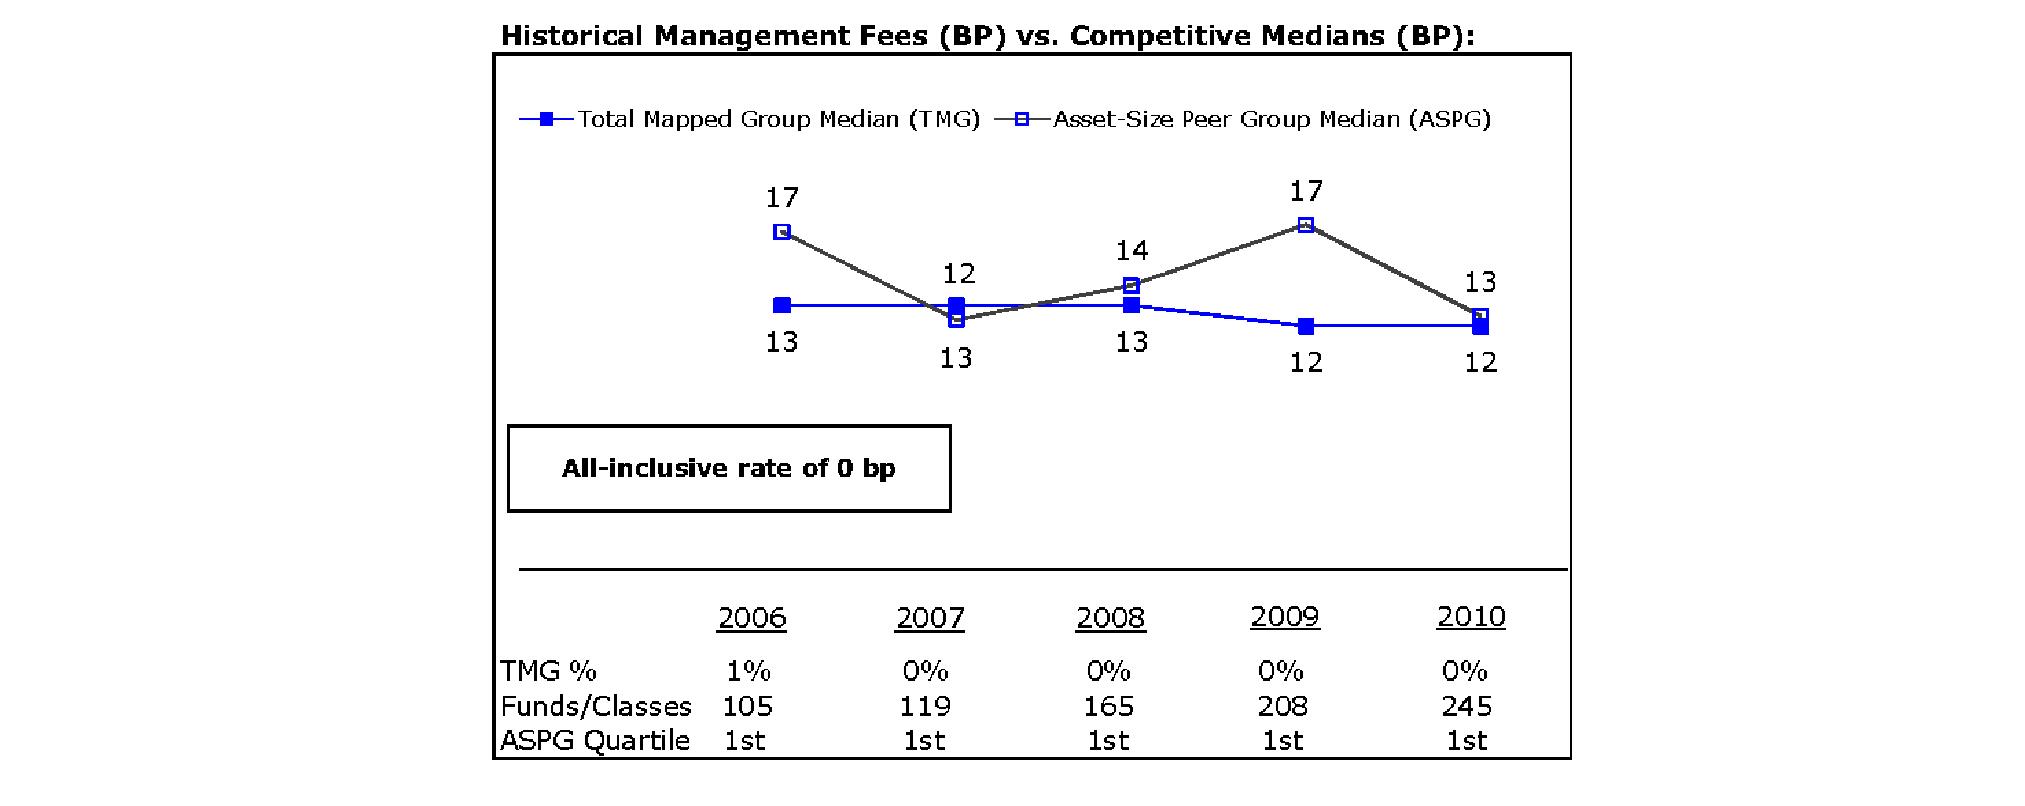
The Board noted that each fund's management fee ranked below the median of its Total Mapped Group and below the median of its ASPG for 2010.
Total Expense Ratio. In its review of each fund's total expense ratio, the Board noted that each fund invests in Investor Class of the underlying fund to avoid charging fund-paid 12b-1 fees at both fund levels. The Board considered that the funds do not pay transfer agent fees. Instead, Investor Class of each underlying fund bears its pro rata portion of each fund's transfer agent fee according to the percentage of each fund's assets invested in that underlying fund. The Board further noted that FMR pays all other expenses of each fund, with limited exceptions.
The Board noted that each fund's total expense ratio ranked below its competitive median for 2010.
Fees Charged to Other Fidelity Clients. The Board also considered Fidelity fee structures and other information with respect to clients of FMR and its affiliates, such as other mutual funds advised or subadvised by FMR or its affiliates, pension plan clients, and other institutional clients. In March 2010, the Board created an ad hoc joint committee with the board of other Fidelity funds (the Committee) to review and compare Fidelity's institutional investment advisory business with its business of providing services to the Fidelity funds, including the differences in services provided, fees charged, and costs incurred, as well as competition in their respective marketplaces.
Based on its review of management fees, total expense ratios, and fees charged to other Fidelity clients, the Board concluded that each fund's management fee and the total expense ratio of each fund were reasonable in light of the services that the fund and its shareholders receive and the other factors considered, including the findings of the Committee.
Costs of the Services and Profitability. The Board considered the level of Fidelity's profits in respect of all the Fidelity funds.
PricewaterhouseCoopers LLP (PwC), independent registered public accounting firm and auditor to Fidelity and certain Fidelity funds, has been engaged annually by the Board as part of the Board's assessment of Fidelity's profitability analysis. PwC's engagement includes the review and assessment of Fidelity's methodologies used in determining the revenues and expenses attributable to Fidelity's mutual fund business, and completion of agreed-upon procedures surrounding the mathematical accuracy of fund profitability and its conformity to allocation methodologies. After considering PwC's reports issued under the engagement and information provided by Fidelity, the Board concluded that while other allocation methods may also be reasonable, Fidelity's profitability methodologies are reasonable in all material respects.
The Board also reviewed Fidelity's non-fund businesses and fall-out benefits related to the mutual fund business as well as cases where Fidelity's affiliates may benefit from or be related to the funds' business.
The Board concluded that the costs of the services provided by and the profits realized by Fidelity in connection with the operation of each fund were not relevant to the renewal of each fund's Advisory Contracts because the funds do not pay management fees and FMR pays all other expenses of each fund, with limited exceptions.
Economies of Scale. The Board concluded that because the funds do not pay management fees and FMR pays all other expenses of each fund, with limited exceptions, economies of scale cannot be realized by the funds, but may be realized by the other Fidelity funds in which each fund invests.
Additional Information Requested by the Board. In order to develop fully the factual basis for consideration of the Fidelity funds' Advisory Contracts, the Board requested and received additional information on certain topics, including: (i) Fidelity's fund profitability methodology, profitability trends for certain funds, and the impact of certain factors on fund profitability results; (ii) portfolio manager changes that have occurred during the past year and the amount of the investment that each portfolio manager has made in the Fidelity fund(s) that he or she manages; (iii) Fidelity's compensation structure for portfolio managers, research analysts, and other key personnel, including its effects on fund profitability, the rationale for the compensation structure, and the extent to which current market conditions have affected retention and recruitment; (iv) the compensation paid to fund sub-advisers on behalf of the Fidelity funds; (v) Fidelity's fee structures and rationale for recommending different fees among different categories of funds and classes, as well as Fidelity's voluntary waiver of its fees to maintain minimum yields for certain money market funds and classes; (vi) the reasons why certain expenses affect various funds and classes differently; (vii) Fidelity's transfer agent fees, expenses, and services and how the benefits of decreased costs and new efficiencies can be shared across all of the Fidelity funds; (viii) the reasons for and consequences of changes to certain product lines compared to competitors; (ix) the allocation of and historical trends in Fidelity's realization of fall-out benefits; and (x) explanations regarding the relative total expense ratios of certain funds and classes, total expense competitive trends, and actions that might be taken by FMR to reduce total expense ratios for certain funds and classes or to achieve further economies of scale.
Annual Report
Board Approval of Investment Advisory Contracts and Management Fees - continued
Based on its evaluation of all of the conclusions noted above, and after considering all factors it believed relevant, the Board ultimately concluded that the advisory fee structures are fair and reasonable, and that each fund's Advisory Contracts should be renewed.
Annual Report
Investment Adviser
Strategic Advisers, Inc.
Boston, MA
General Distributor
Fidelity Distributors Corporation
Boston, MA
Transfer and Service Agents
Fidelity Investments Institutional Operations Company, Inc.
Boston, MA
Fidelity Service Company, Inc.
Boston, MA
Custodian
The Bank of New York Mellon
New York, NY
VIPIFF-ANN-0212
1.814507.106
Fidelity® Variable Insurance Products:
Strategic Income Portfolio
Annual Report
December 31, 2011
Contents
Performance | (Click Here) | How the fund has done over time. |
Management's Discussion of Fund Performance | (Click Here) | The Portfolio Managers' review of fund performance and strategy. |
Shareholder Expense Example | (Click Here) | An example of shareholder expenses. |
Investment Changes | (Click Here) | A summary of major shifts in the fund's investments over the past six months. |
Investments | (Click Here) | A complete list of the fund's investments with their market values. |
Financial Statements | (Click Here) | Statements of assets and liabilities, operations, and changes in net assets, as well as financial highlights. |
Notes | (Click Here) | Notes to the financial statements. |
Report of Independent Registered Public Accounting Firm | (Click Here) | |
Trustees and Officers | (Click Here) | |
Distributions | (Click Here) | |
Board Approval of Investment Advisory Contracts and Management Fees | (Click Here) | |
To view a fund's proxy voting guidelines and proxy voting record for the 12-month period ended June 30, visit http://www.fidelity.com/proxyvotingresults or visit the Securities and Exchange Commission's (SEC) web site at http://www.sec.gov. You may also call 1-877-208-0098 to request a free copy of the proxy voting guidelines.
Fidelity Variable Insurance Products are separate account options which are purchased through a variable insurance contract.
Standard & Poor's, S&P and S&P 500 are registered service marks of The McGraw-Hill Companies, Inc. and have been licensed for use by Fidelity Distributors Corporation.
Other third party marks appearing herein are the property of their respective owners.
All other marks appearing herein are registered or unregistered trademarks or service marks of FMR LLC or an affiliated company.
This report and the financial statements contained herein are submitted for the general information of the shareholders of the fund. This report is not authorized for distribution to prospective investors in the fund unless preceded or accompanied by an effective prospectus.
A fund files its complete schedule of portfolio holdings with the SEC for the first and third quarters of each fiscal year on Form N-Q. Forms N-Q are available on the SEC's web site at http://www.sec.gov. A fund's Forms N-Q may be reviewed and copied at the SEC's Public Reference Room in Washington, DC. Information regarding the operation of the SEC's Public Reference Room may be obtained by calling 1-800-SEC-0330. For a complete list of a fund's portfolio holdings, view the most recent holdings listing, semiannual report, or annual report on Fidelity's web site at http://www.fidelity.com, http://www.advisor.fidelity.com, or http://www.401k.com, as applicable.
NOT FDIC INSURED • MAY LOSE VALUE • NO BANK GUARANTEE
Neither the fund nor Fidelity Distributors Corporation is a bank.
Annual Report
Average annual total return reflects the change in the value of an investment, assuming reinvestment of the class' distributions from dividend income and capital gains (the profits earned upon the sale of securities that have grown in value, if any) and assuming a constant rate of performance each year. During periods of reimbursement by Fidelity, a fund's total return will be greater than it would be had the reimbursement not occurred. Performance numbers are net of all underlying fund operating expenses, but do not include any insurance charges imposed by your insurance company's separate account. If performance information included the effect of these additional charges, the total returns would have been lower. How a fund did yesterday is no guarantee of how it will do tomorrow.
Average Annual Total Returns
Periods ended December 31, 2011 | Past 1
year | Past 5
years | Life of
fund A |
VIP Strategic Income Portfolio - Initial Class | 4.66% | 7.18% | 6.91% |
VIP Strategic Income Portfolio - Service Class | 4.52% | 7.07% | 6.78% |
VIP Strategic Income Portfolio - Service Class 2 | 4.45% | 6.92% | 6.62% |
VIP Strategic Income Portfolio - Investor Class B | 4.55% | 7.12% | 6.86% |
A From December 23, 2003.
B The initial offering of Investor Class shares took place on July 21, 2005. Returns prior to July 21, 2005 are those of Initial Class. Had Investor Class's transfer agent fee been reflected, returns prior to July 21, 2005 would have been lower.
$10,000 Over Life of Fund
Let's say hypothetically that $10,000 was invested in VIP Strategic Income Portfolio - Initial Class on December 23, 2003, when the fund started. The chart shows how the value of your investment would have changed, and also shows how The BofA Merrill LynchSM US High Yield Constrained Index performed over the same period.
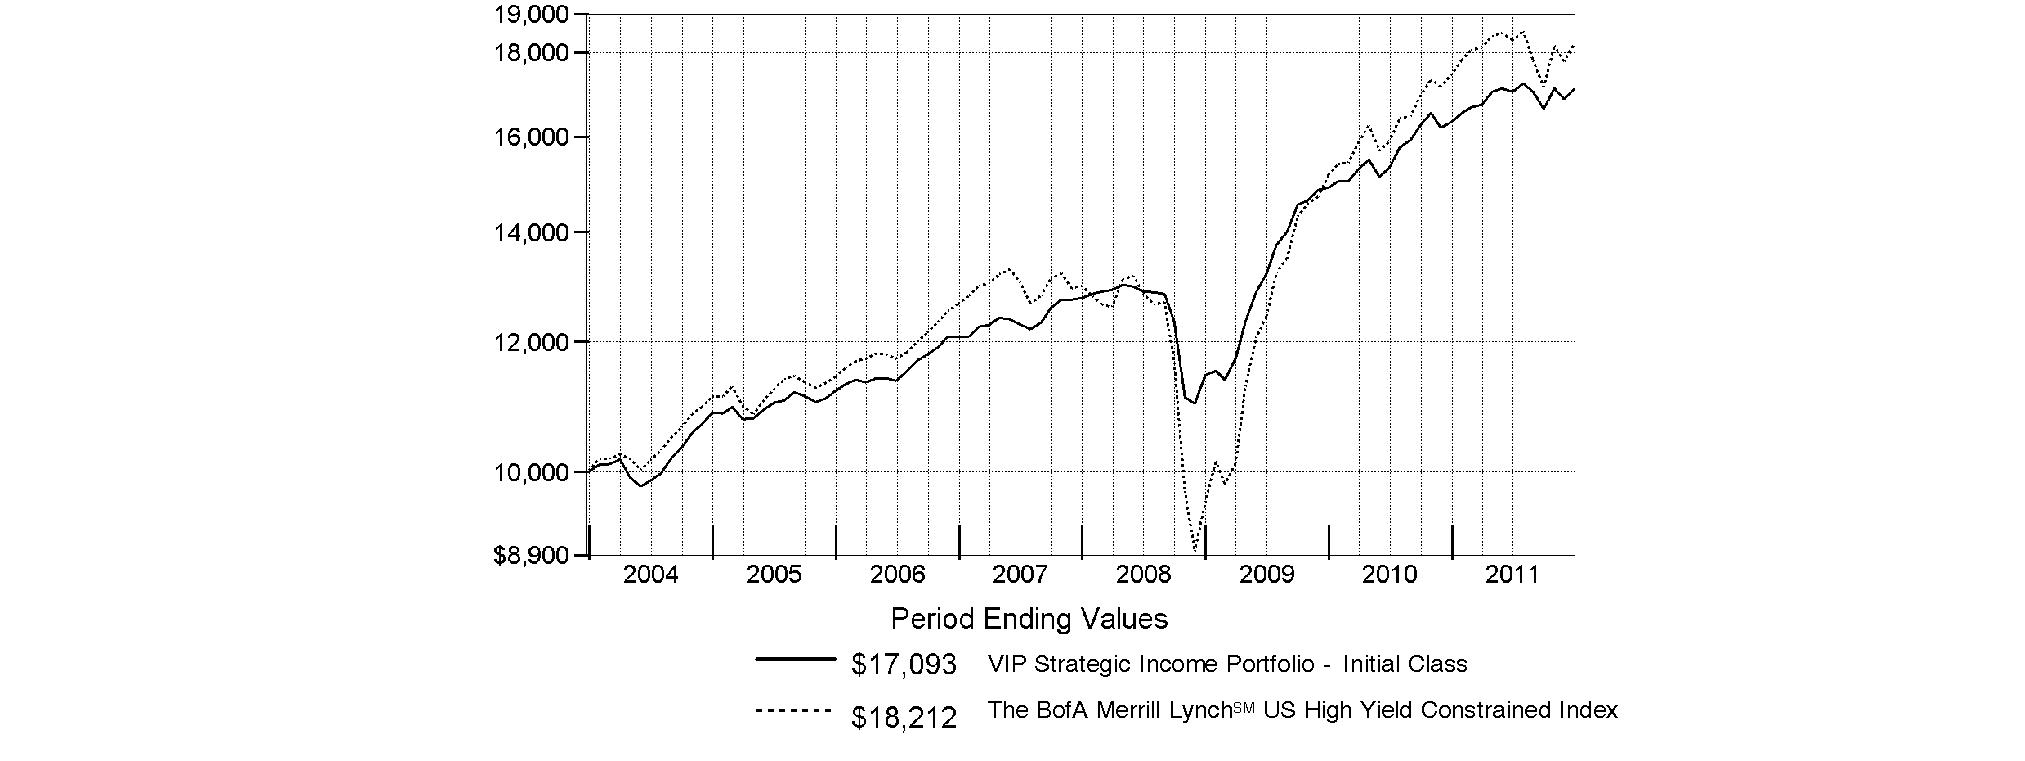
Annual Report
Market Recap: Extreme market volatility took center stage during the 12 months ending December 31, 2011, stealing the spotlight from signs of progress in the global economy. Early in the year, aggressive monetary stimulus by the U.S. federal government, improving credit-market conditions and solid corporate earnings buoyed most major asset classes. As the period progressed, however, fresh worries about sovereign debt in Europe, inflation in China, gridlock over raising the debt ceiling in the U.S. - along with Standard & Poor's early-August downgrade of the nation's long-term sovereign credit rating - and a dimmed outlook for global growth punctured investor confidence and ignited market instability. Domestic equities, as measured by the broad-based S&P 500® Index, gained 2.11%, easily outpacing the 13.61% decline of MSCI® ACWI® (All Country World Index) ex USA Index, a proxy for foreign stocks. Within the MSCI index, emerging markets declined the most (-18%), with investments here generally held back by a stronger U.S. dollar. The U.K. (-3%) fared better than the rest of Europe (-15%), which was the second-worst-performing index component. Bolstered by periodic flights to quality, U.S. investment-grade bonds posted a 7.84% advance, as reflected by the Barclays Capital® U.S. Aggregate Bond Index, outperforming the 4.37% gain of high-yield securities, as represented by The BofA Merrill LynchSM US High Yield Constrained Index. Hampered by financial woes in Europe, the sovereign debt of major developed markets outside the U.S. rose 4.86%, according to the Citigroup® Non-USD Group-of-Seven (G7) Equal Weighted Index, while the JPMorgan Emerging Markets Bond Index Global (EMBI Global) advanced 8.46%, despite the currency head wind.
Comments from Joanna Bewick and Christopher Sharpe, Lead Co-Portfolio Managers of VIP Strategic Income Portfolio: For the year, the fund's shares classes underperformed the 6.59% return of the Fidelity Strategic Income Composite Index. (For specific portfolio results, please refer to the performance section of this report). On balance, asset allocation modestly detracted from the fund's relative return. The biggest drag on performance, however, came from security selection within the subportfolios. The high-yield debt sleeve fell short of its benchmark and was the largest relative detractor, mainly due to unsuccessful security selection in the telecommunications and automotive/auto parts industries. The emerging-markets debt subportfolio had a particularly challenging third quarter and ended the period short of its index. Unfavorable market positioning more than offset positive security selection in the sleeve overall. Our U.S. government debt subportfolio delivered the biggest absolute return, but modestly trailed its benchmark, with sector selection hurting performance. Lastly, the developed-markets debt sleeve modestly lagged its index. Positive security selection in France, Japan and Italy was offset by weak picks in Canada and non-index stakes in the Netherlands and Belgium.
The views expressed above reflect those of the portfolio manager(s) only through the end of the period as stated on the cover of this report and do not necessarily represent the views of Fidelity or any other person in the Fidelity organization. Any such views are subject to change at any time based upon market or other conditions and Fidelity disclaims any responsibility to update such views. These views may not be relied on as investment advice and, because investment decisions for a Fidelity fund are based on numerous factors, may not be relied on as an indication of trading intent on behalf of any Fidelity fund.
Annual Report
As a shareholder of the Fund, you incur two types of costs: (1) transaction costs, and (2) ongoing costs, including management fees, distribution and/or service (12b-1) fees and other Fund expenses. This Example is intended to help you understand your ongoing costs (in dollars) of investing in the Fund and to compare these costs with the ongoing costs of investing in other mutual funds.
The Example is based on an investment of $1,000 invested at the beginning of the period and held for the entire period (July 1, 2011 to December 31, 2011).
Actual Expenses
The first line of the accompanying table for each class of the Fund provides information about actual account values and actual expenses. You may use the information in this line, together with the amount you invested, to estimate the expenses that you paid over the period. Simply divide your account value by $1,000.00 (for example, an $8,600 account value divided by $1,000.00 = 8.6), then multiply the result by the number in the first line for a class of the Fund under the heading entitled "Expenses Paid During Period" to estimate the expenses you paid on your account during this period. The estimate of expenses does not include any fees or other expenses of any variable annuity or variable life insurance product. If they were, the estimate of expenses you paid during the period would be higher, and your ending account value would be lower. In addition, the Fund, as a shareholder in the underlying Fidelity Central Funds, will indirectly bear its pro-rata share of the fees and expenses incurred by the underlying Fidelity Central Funds. These fees and expenses are not included in the Fund's annualized expense ratio used to calculate the expense estimate in the table below.
Hypothetical Example for Comparison Purposes
The second line of the accompanying table for each class of the Fund provides information about hypothetical account values and hypothetical expenses based on a Class' actual expense ratio and an assumed rate of return of 5% per year before expenses, which is not the Class' actual return. The hypothetical account values and expenses may not be used to estimate the actual ending account balance or expenses you paid for the period. You may use this information to compare the ongoing costs of investing in the Fund and other funds. To do so, compare this 5% hypothetical example with the 5% hypothetical examples that appear in the shareholder reports of the other funds. The estimate of expenses does not include any fees or other expenses of any variable annuity or variable life insurance product. If they were, the estimate of expenses you paid during the period would be higher, and your ending account value would be lower. In addition, the Fund, as a shareholder in the underlying Fidelity Central Funds, will indirectly bear its pro-rata share of the fees and expenses incurred by the underlying Fidelity Central Funds. These fees and expenses are not included in the Fund's annualized expense ratio used to calculate the expense estimate in the table below.
Please note that the expenses shown in the table are meant to highlight your ongoing costs only and do not reflect any transaction costs. Therefore, the second line of the table is useful in comparing ongoing costs only, and will not help you determine the relative total costs of owning different funds.
| Annualized
Expense Ratio | Beginning
Account Value
July 1, 2011 | Ending
Account Value
December 31, 2011 | Expenses Paid
During Period*
July 1, 2011 to
December 31, 2011 |
Initial Class | .69% | | | |
Actual | | $ 1,000.00 | $ 1,004.00 | $ 3.49 |
Hypothetical A | | $ 1,000.00 | $ 1,021.73 | $ 3.52 |
Service Class | .79% | | | |
Actual | | $ 1,000.00 | $ 1,003.50 | $ 3.99 |
Hypothetical A | | $ 1,000.00 | $ 1,021.22 | $ 4.02 |
Service Class 2 | .94% | | | |
Actual | | $ 1,000.00 | $ 1,002.80 | $ 4.75 |
Hypothetical A | | $ 1,000.00 | $ 1,020.47 | $ 4.79 |
Investor Class | .72% | | | |
Actual | | $ 1,000.00 | $ 1,003.70 | $ 3.64 |
Hypothetical A | | $ 1,000.00 | $ 1,021.58 | $ 3.67 |
A 5% return per year before expenses
* Expenses are equal to each Class' annualized expense ratio, multiplied by the average account value over the period, multiplied by 184/365 (to reflect the one-half year period). The fees and expenses of the underlying Fidelity Central Funds in which the Fund invests are not included in the Fund's annualized expense ratio.
Annual Report
Investment Changes (Unaudited)
The information in the following tables is based on the combined investments of the Fund and its pro-rata share of its investments in each non-money market Fidelity Central Fund.
Top Five Holdings as of December 31, 2011 |
(by issuer, excluding cash equivalents) | % of fund's
net assets | % of fund's net assets
6 months ago |
U.S. Treasury Obligations | 19.8 | 17.6 |
Japan Government | 2.3 | 2.5 |
Canadian Government | 2.1 | 2.3 |
German Federal Republic | 2.0 | 1.6 |
United Kingdom, Great Britain and Northern Ireland | 1.9 | 2.0 |
| 28.1 | |
Top Five Market Sectors as of December 31, 2011 |
| % of fund's
net assets | % of fund's net assets
6 months ago |
Energy | 6.0 | 6.1 |
Financials | 5.5 | 8.5 |
Telecommunication Services | 5.0 | 7.0 |
Consumer Discretionary | 4.6 | 5.1 |
Health Care | 4.5 | 3.6 |
Quality Diversification (% of fund's net assets) |
As of December 31, 2011 | As of June 30, 2011 |
| U.S. Government and
U.S. Government
Agency Obligations† 28.2% | |  | U.S. Government and
U.S. Government
Agency Obligations† 24.9% | |
| AAA,AA,A 14.5% | | | AAA,AA,A 12.9% | |
 | BBB 4.5% | | | BBB 4.3% | |
 | BB 14.4% | | | BB 13.1% | |
 | B 21.8% | | | B 26.0% | |
 | CCC,CC,C 4.4% | | | CCC,CC,C 4.8% | |
 | Not Rated 2.7% | |  | Not Rated 3.7% | |
| Equities 0.5% | | | Equities 1.2% | |
| Short-Term Investments
and Net Other Assets 9.0% | | | Short-Term Investments
and Net Other Assets 9.1% | |

We have used ratings from Moody's Investors Service, Inc. Where Moody's® ratings are not available, we have used S&P® ratings. All ratings are as of the date indicated and do not reflect subsequent changes. |
Asset Allocation (% of fund's net assets) |
As of December 31, 2011* | As of June 30, 2011** |
| Preferred Securities 0.3% | | | Preferred Securities 0.0% | |
 | Corporate Bonds 34.2% | | | Corporate Bonds 37.5% | |
| U.S. Government and
U.S. Government
Agency Obligations† 28.2% | | | U.S. Government and
U.S. Government
Agency Obligations† 24.9% | |
 | Foreign Government &
Government Agency
Obligations 22.4% | | | Foreign Government &
Government Agency
Obligations 21.3% | |
 | Floating Rate Loans 5.3% | | | Floating Rate Loans 5.9% | |
| Stocks 0.5% | | | Stocks 1.2% | |
 | Other Investments 0.1% | | | Other Investments 0.1% | |
| Short-Term Investments
and Net Other Assets 9.0% | | | Short-Term Investments
and Net Other Assets 9.1% | |
* Foreign investments | 33.5% | | ** Foreign investments | 33.4% | |
* Futures and Swaps | 1.1% | | ** Futures and Swaps | 0.8% | |

† Includes FDIC Guaranteed Corporate Securities and NCUA Guaranteed Notes.
An unaudited holdings listing for the Fund, which presents direct holdings as well as the pro-rata share of any securities and other investments held indirectly through its investment in underlying non-money market Fidelity Central Funds, is available at advisor.fidelity.com.
Annual Report
Investments December 31, 2011
Showing Percentage of Net Assets
Corporate Bonds - 34.1% |
| Principal Amount (d) | | Value |
Convertible Bonds - 0.6% |
CONSUMER DISCRETIONARY - 0.1% |
Auto Components - 0.1% |
TRW Automotive, Inc. 3.5% 12/1/15 | | $ 671,000 | | $ 904,173 |
ENERGY - 0.2% |
Energy Equipment & Services - 0.0% |
Cal Dive International, Inc. 3.25% 12/15/25 | | 170,000 | | 170,000 |
Oil, Gas & Consumable Fuels - 0.2% |
Chesapeake Energy Corp.: | | | | |
2.5% 5/15/37 | | 1,310,000 | | 1,164,721 |
2.5% 5/15/37 | | 370,000 | | 331,890 |
| | 1,496,611 |
TOTAL ENERGY | | 1,666,611 |
INFORMATION TECHNOLOGY - 0.0% |
Communications Equipment - 0.0% |
Lucent Technologies, Inc. 2.875% 6/15/25 | | 520,000 | | 453,700 |
TELECOMMUNICATION SERVICES - 0.3% |
Wireless Telecommunication Services - 0.3% |
NII Holdings, Inc. 3.125% 6/15/12 | | 2,610,000 | | 2,626,313 |
TOTAL CONVERTIBLE BONDS | | 5,650,797 |
Nonconvertible Bonds - 33.5% |
CONSUMER DISCRETIONARY - 3.5% |
Auto Components - 0.6% |
Affinia Group, Inc.: | | | | |
9% 11/30/14 | | 360,000 | | 356,400 |
10.75% 8/15/16 (f) | | 149,000 | | 161,665 |
Cooper Standard Auto, Inc. 8.5% 5/1/18 | | 145,000 | | 149,350 |
Dana Holding Corp.: | | | | |
6.5% 2/15/19 | | 345,000 | | 348,450 |
6.75% 2/15/21 | | 1,230,000 | | 1,242,300 |
Delphi Corp.: | | | | |
5.875% 5/15/19 (f) | | 450,000 | | 456,750 |
6.125% 5/15/21 (f) | | 415,000 | | 421,225 |
Exide Technologies 8.625% 2/1/18 | | 1,190,000 | | 922,250 |
International Automotive Components Group SA 9.125% 6/1/18 (f) | | 495,000 | | 440,550 |
Lear Corp.: | | | | |
7.875% 3/15/18 | | 110,000 | | 119,900 |
8.125% 3/15/20 | | 125,000 | | 137,500 |
RSC Equipment Rental, Inc. 10% 7/15/17 (f) | | 180,000 | | 207,900 |
|
| Principal Amount (d) | | Value |
Stoneridge, Inc. 9.5% 10/15/17 (f) | | $ 200,000 | | $ 205,000 |
Tenneco, Inc.: | | | | |
6.875% 12/15/20 | | 545,000 | | 561,350 |
7.75% 8/15/18 | | 125,000 | | 126,250 |
The Goodyear Tire & Rubber Co. 10.5% 5/15/16 | | 198,000 | | 218,790 |
Tower Automotive Holdings USA LLC / TA Holdings Finance, Inc. 10.625% 9/1/17 (f) | | 414,000 | | 416,567 |
| | 6,492,197 |
Automobiles - 0.1% |
Automotores Gildemeister SA 8.25% 5/24/21 (f) | | 210,000 | | 214,200 |
General Motors Corp.: | | | | |
6.75% 5/1/28 (c) | | 692,000 | | 4,636 |
7.125% 7/15/13 (c) | | 140,000 | | 938 |
7.2% 1/15/11 (c) | | 350,000 | | 2,345 |
7.4% 9/1/25 (c) | | 45,000 | | 302 |
7.7% 4/15/16 (c) | | 531,000 | | 3,558 |
8.25% 7/15/23 (c) | | 415,000 | | 2,781 |
8.375% 7/15/33 (c) | | 605,000 | | 4,054 |
Jaguar Holding Co. II/Jaguar Merger Sub, Inc. 9.5% 12/1/19 (f) | | 390,000 | | 405,093 |
| | 637,907 |
Diversified Consumer Services - 0.0% |
Mac-Gray Corp. 7.625% 8/15/15 | | 27,000 | | 27,640 |
Hotels, Restaurants & Leisure - 0.7% |
Arcos Dorados Holdings, Inc. 10.25% 7/13/16 (f) | BRL | 750,000 | | 412,597 |
GWR Operating Partnership LLP/Great Wolf Finance Corp. 10.875% 4/1/17 | | 355,000 | | 385,175 |
Landry's Restaurants, Inc.: | | | | |
11.625% 12/1/15 | | 110,000 | | 115,775 |
11.625% 12/1/15 (f) | | 85,000 | | 89,463 |
MCE Finance Ltd. 10.25% 5/15/18 | | 620,000 | | 675,800 |
MGM Mirage, Inc.: | | | | |
6.625% 7/15/15 | | 110,000 | | 104,500 |
10% 11/1/16 | | 365,000 | | 379,600 |
10.375% 5/15/14 | | 100,000 | | 114,000 |
Mohegan Tribal Gaming Authority 6.875% 2/15/15 | | 125,000 | | 55,625 |
MTR Gaming Group, Inc. 11.5% 8/1/19 pay-in-kind (f)(k) | | 1,205,000 | | 1,024,250 |
NAI Entertainment Holdings LLC/NAI Entertainment Finance Corp. 8.25% 12/15/17 (f) | | 240,000 | | 253,800 |
NCL Corp. Ltd. 9.5% 11/15/18 | | 125,000 | | 129,375 |
Palace Entertainment Holdings LLC/Corp. 8.875% 4/15/17 (f) | | 100,000 | | 97,750 |
Roadhouse Financing, Inc. 10.75% 10/15/17 | | 345,000 | | 329,475 |
Corporate Bonds - continued |
| Principal Amount (d) | | Value |
Nonconvertible Bonds - continued |
CONSUMER DISCRETIONARY - continued |
Hotels, Restaurants & Leisure - continued |
Seven Seas Cruises S de RL LLC 9.125% 5/15/19 (f) | | $ 60,000 | | $ 60,600 |
Shingle Springs Tribal Gaming Authority 9.375% 6/15/15 (f) | | 100,000 | | 56,000 |
Sugarhouse HSP Gaming Prop Mezz LP/Sugarhouse HSP Gaming Finance Corp. 8.625% 4/15/16 (f) | | 50,000 | | 50,875 |
Universal City Development Partners Ltd./UCDP Finance, Inc. 8.875% 11/15/15 | | 767,000 | | 849,453 |
Waterford Gaming LLC/Waterford Gaming Finance Corp. 8.625% 9/15/14 (f) | | 53,318 | | 29,058 |
Wynn Las Vegas LLC/Wynn Las Vegas Capital Corp. 7.75% 8/15/20 | | 1,890,000 | | 2,079,000 |
| | 7,292,171 |
Household Durables - 0.7% |
Jarden Corp. 6.125% 11/15/22 | | 280,000 | | 287,700 |
Reliance Intermediate Holdings LP 9.5% 12/15/19 (f) | | 485,000 | | 514,100 |
Reynolds Group Issuer, Inc./Reynolds Group Issuer LLC/Reynolds Group Issuer (Luxembourg) SA: | | | | |
7.125% 4/15/19 (f) | | 1,185,000 | | 1,196,850 |
9% 4/15/19 (f) | | 1,610,000 | | 1,517,425 |
Reynolds Group Issuer, Inc./Reynolds Group Issuer LLC/Reynolds Group Issuer (Luxembourg) SA: | | | | |
6.875% 2/15/21 (f) | | 565,000 | | 553,700 |
8.25% 2/15/21 (f) | | 1,955,000 | | 1,710,625 |
9% 5/15/18 (f) | | 45,000 | | 42,750 |
Reynolds Group Issuer, Inc./Reynolds Group Issuer LLC/Reynolds Group Issuer (Luxembourg) SA: | | | | |
7.875% 8/15/19 (f) | | 670,000 | | 693,450 |
9.875% 8/15/19 (f) | | 230,000 | | 221,950 |
Sealy Mattress Co. 10.875% 4/15/16 (f) | | 94,000 | | 102,695 |
Standard Pacific Corp.: | | | | |
8.375% 5/15/18 | | 220,000 | | 209,550 |
8.375% 1/15/21 | | 420,000 | | 396,900 |
| | 7,447,695 |
Leisure Equipment & Products - 0.1% |
Cedar Fair LP/Magnum Management Corp. 9.125% 8/1/18 | | 645,000 | | 698,987 |
|
| Principal Amount (d) | | Value |
Eastman Kodak Co. 10.625% 3/15/19 (f) | | $ 305,000 | | $ 231,800 |
Easton-Bell Sports, Inc. 9.75% 12/1/16 | | 120,000 | | 130,644 |
| | 1,061,431 |
Media - 0.8% |
Bresnan Broadband Holdings LLC 8% 12/15/18 (f) | | 195,000 | | 202,800 |
Cequel Communications Holdings I LLC/Cequel Capital Corp. 8.625% 11/15/17 (f) | | 770,000 | | 820,050 |
Charter Communications Holdings II LLC/Charter Communications Holdings II Capital Corp. 13.5% 11/30/16 | | 229,294 | | 264,835 |
Checkout Holding Corp. 0% 11/15/15 (f) | | 285,000 | | 142,500 |
DISH DBS Corp. 6.75% 6/1/21 | | 860,000 | | 922,350 |
EchoStar Communications Corp. 7.125% 2/1/16 | | 1,500,000 | | 1,616,250 |
Gray Television, Inc. 10.5% 6/29/15 | | 160,000 | | 151,200 |
Houghton Mifflin Harcourt Publishing Co. 10.5% 6/1/19 (f) | | 435,000 | | 265,350 |
Liberty Media Corp.: | | | | |
8.25% 2/1/30 | | 1,295,000 | | 1,244,819 |
8.5% 7/15/29 | | 230,000 | | 223,100 |
MDC Partners, Inc. 11% 11/1/16 | | 65,000 | | 68,250 |
MediMedia USA, Inc. 11.375% 11/15/14 (f) | | 50,000 | | 44,000 |
ONO Finance II PLC 10.875% 7/15/19 (f) | | 150,000 | | 133,500 |
Satelites Mexicanos SA de CV 9.5% 5/15/17 | | 115,000 | | 117,300 |
Sheridan Group, Inc. 12.5% 4/15/14 | | 272,335 | | 239,655 |
Sinclair Television Group, Inc. 8.375% 10/15/18 | | 300,000 | | 304,110 |
TV Azteca SA de CV 7.5% 5/25/18 (Reg. S) | | 400,000 | | 401,000 |
UPCB Finance V Ltd. 7.25% 11/15/21 (f) | | 445,000 | | 450,563 |
Videotron Ltd. 6.875% 1/15/14 | | 76,000 | | 76,190 |
| | 7,687,822 |
Specialty Retail - 0.3% |
Asbury Automotive Group, Inc. 8.375% 11/15/20 | | 125,000 | | 128,125 |
Claire's Stores, Inc. 8.875% 3/15/19 | | 155,000 | | 117,800 |
Michaels Stores, Inc. 7.75% 11/1/18 | | 940,000 | | 940,000 |
Sally Holdings LLC 6.875% 11/15/19 (f) | | 325,000 | | 339,625 |
Sonic Automotive, Inc. 9% 3/15/18 | | 760,000 | | 790,400 |
Corporate Bonds - continued |
| Principal Amount (d) | | Value |
Nonconvertible Bonds - continued |
CONSUMER DISCRETIONARY - continued |
Specialty Retail - continued |
Spencer Spirit Holdings, Inc./Spencer Gifts LLC/Spirit Halloween Superstores 11% 5/1/17 (f) | | $ 255,000 | | $ 253,725 |
| | 2,569,675 |
Textiles, Apparel & Luxury Goods - 0.2% |
Hanesbrands, Inc. 6.375% 12/15/20 | | 640,000 | | 651,200 |
Levi Strauss & Co.: | | | | |
7.625% 5/15/20 | | 775,000 | | 784,688 |
8.875% 4/1/16 | | 170,000 | | 175,950 |
Polymer Group, Inc. 7.75% 2/1/19 (f) | | 135,000 | | 139,725 |
| | 1,751,563 |
TOTAL CONSUMER DISCRETIONARY | | 34,968,101 |
CONSUMER STAPLES - 0.8% |
Beverages - 0.0% |
Cerveceria Nacional Dominicana C por A: | | | | |
8% 3/27/14 (Reg. S) | | 100,000 | | 103,000 |
16% 3/27/12 (f) | | 220,000 | | 178,926 |
| | 281,926 |
Food & Staples Retailing - 0.3% |
BFF International Ltd. 7.25% 1/28/20 (f) | | 300,000 | | 330,750 |
Bi-Lo LLC/Bi-Lo Finance Corp. 9.25% 2/15/19 (f) | | 405,000 | | 407,025 |
Grifols, Inc. 8.25% 2/1/18 | | 430,000 | | 449,350 |
Rite Aid Corp.: | | | | |
8% 8/15/20 | | 625,000 | | 695,313 |
9.375% 12/15/15 | | 500,000 | | 481,250 |
9.5% 6/15/17 | | 225,000 | | 203,625 |
9.75% 6/12/16 | | 310,000 | | 337,900 |
10.25% 10/15/19 | | 160,000 | | 176,400 |
| | 3,081,613 |
Food Products - 0.4% |
Bumble Bee Acquisition Corp. 9% 12/15/17 (f) | | 504,000 | | 511,560 |
Darling International, Inc. 8.5% 12/15/18 | | 100,000 | | 110,750 |
Dean Foods Co. 9.75% 12/15/18 | | 635,000 | | 677,037 |
Gruma SAB de CV 7.75% (Reg. S) (g) | | 525,000 | | 525,000 |
Harbinger Group, Inc. 10.625% 11/15/15 | | 230,000 | | 224,825 |
Hines Nurseries, Inc. 10.25% 10/1/49 (c) | | 120,000 | | 1,200 |
JBS USA LLC/JBS USA Finance, Inc. 11.625% 5/1/14 | | 330,000 | | 374,121 |
MHP SA 10.25% 4/29/15 (f) | | 390,000 | | 347,100 |
|
| Principal Amount (d) | | Value |
Michael Foods, Inc. 9.75% 7/15/18 | | $ 155,000 | | $ 163,138 |
Smithfield Foods, Inc. 10% 7/15/14 | | 380,000 | | 442,700 |
| | 3,377,431 |
Household Products - 0.0% |
Spectrum Brands Holdings, Inc. 9.5% 6/15/18 (f) | | 280,000 | | 302,400 |
Personal Products - 0.1% |
Elizabeth Arden, Inc. 7.375% 3/15/21 | | 135,000 | | 141,750 |
NBTY, Inc. 9% 10/1/18 | | 425,000 | | 462,188 |
Revlon Consumer Products Corp. 9.75% 11/15/15 | | 300,000 | | 319,500 |
| | 923,438 |
TOTAL CONSUMER STAPLES | | 7,966,808 |
ENERGY - 5.8% |
Energy Equipment & Services - 0.2% |
Chesapeake Oilfield Operating LLC 6.625% 11/15/19 (f) | | 560,000 | | 582,400 |
Complete Production Services, Inc. 8% 12/15/16 | | 130,000 | | 135,200 |
Forbes Energy Services Ltd. 9% 6/15/19 | | 350,000 | | 327,250 |
Helix Energy Solutions Group, Inc. 9.5% 1/15/16 (f) | | 240,000 | | 249,600 |
Oil States International, Inc. 6.5% 6/1/19 | | 360,000 | | 368,100 |
Pioneer Drilling Co. 9.875% 3/15/18 | | 275,000 | | 286,000 |
Precision Drilling Corp. 6.5% 12/15/21 (f) | | 90,000 | | 90,450 |
Pride International, Inc. 6.875% 8/15/20 | | 260,000 | | 305,302 |
Trinidad Drilling Ltd. 7.875% 1/15/19 (f) | | 140,000 | | 144,200 |
| | 2,488,502 |
Oil, Gas & Consumable Fuels - 5.6% |
Afren PLC 11.5% 2/1/16 (f) | | 200,000 | | 196,000 |
Alpha Natural Resources, Inc.: | | | | |
6% 6/1/19 | | 1,295,000 | | 1,249,675 |
6.25% 6/1/21 | | 655,000 | | 632,075 |
Arch Coal, Inc. 7.25% 10/1/20 | | 140,000 | | 143,150 |
ATP Oil & Gas Corp. 11.875% 5/1/15 | | 2,620,000 | | 1,735,750 |
Berry Petroleum Co.: | | | | |
8.25% 11/1/16 | | 150,000 | | 156,000 |
10.25% 6/1/14 | | 145,000 | | 164,213 |
Calumet Specialty Products Partners LP/Calumet Finance Corp.: | | | | |
9.375% 5/1/19 (f) | | 350,000 | | 339,500 |
Corporate Bonds - continued |
| Principal Amount (d) | | Value |
Nonconvertible Bonds - continued |
ENERGY - continued |
Oil, Gas & Consumable Fuels - continued |
Carrizo Oil & Gas, Inc. 8.625% 10/15/18 | | $ 1,295,000 | | $ 1,307,950 |
Chaparral Energy, Inc. 9.875% 10/1/20 | | 155,000 | | 165,075 |
Chesapeake Energy Corp.: | | | | |
6.125% 2/15/21 | | 750,000 | | 763,125 |
6.875% 11/15/20 | | 4,085,000 | | 4,370,950 |
Chesapeake Midstream Partners LP/CHKM Finance Corp. 5.875% 4/15/21 (f) | | 220,000 | | 220,000 |
Clayton Williams Energy, Inc. 7.75% 4/1/19 (f) | | 460,000 | | 439,300 |
Concho Resources, Inc.: | | | | |
6.5% 1/15/22 | | 575,000 | | 595,125 |
7% 1/15/21 | | 250,000 | | 268,425 |
8.625% 10/1/17 | | 155,000 | | 168,175 |
CONSOL Energy, Inc.: | | | | |
8% 4/1/17 | | 525,000 | | 573,563 |
8.25% 4/1/20 | | 540,000 | | 594,000 |
Continental Resources, Inc.: | | | | |
7.125% 4/1/21 | | 215,000 | | 232,200 |
8.25% 10/1/19 | | 65,000 | | 71,500 |
Crestwood Midstream Partners LP / Finance Corp. 7.75% 4/1/19 (f) | | 200,000 | | 194,500 |
Crosstex Energy L.P./Crosstex Energy Finance Corp. 8.875% 2/15/18 | | 390,000 | | 422,682 |
Denbury Resources, Inc.: | | | | |
8.25% 2/15/20 | | 308,000 | | 343,420 |
9.75% 3/1/16 | | 105,000 | | 115,763 |
DTEK Finance BV 9.5% 4/28/15 (f) | | 330,000 | | 300,630 |
Eagle Rock Energy Partners LP / Eagle Rock Energy Finance Corp. 8.375% 6/1/19 (f) | | 480,000 | | 480,000 |
Energy Partners Ltd. 8.25% 2/15/18 | | 585,000 | | 558,675 |
Energy Transfer Equity LP 7.5% 10/15/20 | | 860,000 | | 939,550 |
Energy XXI Gulf Coast, Inc. 9.25% 12/15/17 | | 1,110,000 | | 1,204,350 |
EXCO Resources, Inc. 7.5% 9/15/18 | | 1,300,000 | | 1,222,000 |
Goodrich Petroleum Corp. 8.875% 3/15/19 (f) | | 305,000 | | 303,475 |
KazMunaiGaz Finance Sub BV: | | | | |
6.375% 4/9/21 (f) | | 320,000 | | 320,000 |
7% 5/5/20 (f) | | 360,000 | | 378,000 |
8.375% 7/2/13 (f) | | 265,000 | | 278,515 |
9.125% 7/2/18 (f) | | 480,000 | | 553,200 |
11.75% 1/23/15 (f) | | 380,000 | | 444,600 |
|
| Principal Amount (d) | | Value |
LINN Energy LLC/LINN Energy Finance Corp.: | | | | |
7.75% 2/1/21 | | $ 1,640,000 | | $ 1,697,400 |
8.625% 4/15/20 | | 1,190,000 | | 1,291,150 |
Markwest Energy Partners LP/Markwest Energy Finance Corp.: | | | | |
6.25% 6/15/22 | | 935,000 | | 972,400 |
6.75% 11/1/20 | | 160,000 | | 167,200 |
Newfield Exploration Co. 6.875% 2/1/20 | | 1,025,000 | | 1,094,188 |
Northern Tier Energy LLC/Northern Tier Finance Corp. 10.5% 12/1/17 (f) | | 400,000 | | 428,000 |
OGX Petroleo e Gas Participacoes SA 8.5% 6/1/18 (f) | | 2,310,000 | | 2,263,800 |
Pacific Rubiales Energy Corp. 7.25% 12/12/21 (f) | | 730,000 | | 731,825 |
Pan American Energy LLC 7.875% 5/7/21 (f) | | 330,000 | | 338,250 |
Peabody Energy Corp.: | | | | |
6% 11/15/18 (f) | | 1,125,000 | | 1,147,500 |
6.25% 11/15/21 (f) | | 1,125,000 | | 1,158,750 |
7.875% 11/1/26 | | 300,000 | | 321,750 |
Pemex Project Funding Master Trust: | | | | |
5.75% 3/1/18 | | 485,000 | | 529,863 |
6.625% 6/15/35 | | 845,000 | | 950,625 |
Petrobras International Finance Co. Ltd.: | | | | |
6.875% 1/20/40 | | 310,000 | | 353,400 |
8.375% 12/10/18 | | 365,000 | | 443,475 |
Petrohawk Energy Corp. 7.875% 6/1/15 | | 1,615,000 | | 1,719,975 |
Petroleos de Venezuela SA: | | | | |
4.9% 10/28/14 | | 2,205,000 | | 1,725,413 |
5% 10/28/15 | | 275,000 | | 195,250 |
5.375% 4/12/27 | | 1,780,000 | | 867,750 |
5.5% 4/12/37 | | 1,295,000 | | 618,363 |
8% 11/17/13 | | 460,000 | | 435,850 |
8.5% 11/2/17 (f) | | 4,425,000 | | 3,340,875 |
12.75% 2/17/22 (f) | | 1,840,000 | | 1,541,000 |
Petroleos Mexicanos: | | | | |
5.5% 1/21/21 | | 455,000 | | 494,813 |
6% 3/5/20 | | 245,000 | | 276,238 |
6.5% 6/2/41 | | 200,000 | | 225,000 |
6.5% 6/2/41 (f) | | 210,000 | | 235,200 |
6.625% (f)(g) | | 1,395,000 | | 1,401,975 |
8% 5/3/19 | | 280,000 | | 349,300 |
Petroleum Co. of Trinidad & Tobago Ltd. (Reg. S) 6% 5/8/22 | | 218,750 | | 214,375 |
Petroleum Development Corp. 12% 2/15/18 | | 265,000 | | 287,525 |
Pioneer Natural Resources Co. 7.5% 1/15/20 | | 640,000 | | 745,600 |
PT Adaro Indonesia 7.625% 10/22/19 (f) | | 205,000 | | 224,475 |
Corporate Bonds - continued |
| Principal Amount (d) | | Value |
Nonconvertible Bonds - continued |
ENERGY - continued |
Oil, Gas & Consumable Fuels - continued |
PT Pertamina Persero: | | | | |
5.25% 5/23/21 (f) | | $ 295,000 | | $ 300,900 |
6.5% 5/27/41 (f) | | 215,000 | | 220,913 |
Quicksilver Resources, Inc. 11.75% 1/1/16 | | 335,000 | | 377,713 |
Regency Energy Partners LP/Regency Energy Finance Corp. 6.875% 12/1/18 | | 550,000 | | 574,750 |
Rosetta Resources, Inc. 9.5% 4/15/18 | | 290,000 | | 313,200 |
Southern Star Central Corp. 6.75% 3/1/16 | | 90,000 | | 91,575 |
Southwestern Energy Co. 7.5% 2/1/18 | | 150,000 | | 172,875 |
Targa Resources Partners LP/Targa Resources Partners Finance Corp.: | | | | |
6.875% 2/1/21 (f) | | 240,000 | | 240,000 |
11.25% 7/15/17 | | 290,000 | | 324,075 |
Teekay Corp. 8.5% 1/15/20 | | 295,000 | | 284,675 |
Tennessee Gas Pipeline Co.: | | | | |
7% 10/15/28 | | 20,000 | | 22,955 |
7.625% 4/1/37 | | 50,000 | | 59,553 |
8.375% 6/15/32 | | 40,000 | | 50,676 |
Venoco, Inc.: | | | | |
8.875% 2/15/19 | | 640,000 | | 566,400 |
11.5% 10/1/17 | | 410,000 | | 414,100 |
WPX Energy, Inc. 6% 1/15/22 (f) | | 690,000 | | 695,175 |
YPF SA 10% 11/2/28 | | 170,000 | | 186,150 |
| | 56,129,349 |
TOTAL ENERGY | | 58,617,851 |
FINANCIALS - 4.9% |
Capital Markets - 0.1% |
Equinox Holdings, Inc. 9.5% 2/1/16 (f) | | 460,000 | | 472,650 |
HSBC Bank PLC 5.75% 6/27/17 (e) | GBP | 100,000 | | 154,602 |
Penson Worldwide, Inc. 12.5% 5/15/17 (f) | | 290,000 | | 174,000 |
| | 801,252 |
Commercial Banks - 1.2% |
African Export-Import Bank 8.75% 11/13/14 | | 195,000 | | 209,138 |
Akbank T.A.S. 5.125% 7/22/15 (f) | | 510,000 | | 490,875 |
Banco Nacional de Desenvolvimento Economico e Social: | | | | |
5.5% 7/12/20 (f) | | 200,000 | | 217,000 |
|
| Principal Amount (d) | | Value |
6.5% 6/10/19 (f) | | $ 125,000 | | $ 142,500 |
BBVA Paraguay SA 9.75% 2/11/16 (f) | | 450,000 | | 472,500 |
CIT Group, Inc.: | | | | |
7% 5/1/15 | | 712 | | 714 |
7% 5/4/15 (f) | | 184,000 | | 183,540 |
7% 5/1/16 | | 853 | | 855 |
7% 5/2/16 (f) | | 37,000 | | 36,815 |
7% 5/1/17 | | 992 | | 994 |
7% 5/2/17 (f) | | 2,165,000 | | 2,151,469 |
Co-Operative Bank PLC 4.75% 11/11/21 | GBP | 200,000 | | 308,706 |
Development Bank of Kazakhstan JSC 5.5% 12/20/15 (f) | | 400,000 | | 394,000 |
Development Bank of Philippines 8.375% (g)(k) | | 620,000 | | 663,400 |
Eastern and Southern African Trade and Development Bank 6.875% 1/9/16 (Reg. S) | | 400,000 | | 364,000 |
Export-Import Bank of India 0.6957% 6/7/12 (k) | JPY | 10,000,000 | | 129,090 |
HSBK (Europe) BV: | | | | |
7.25% 5/3/17 (f) | | 535,000 | | 517,613 |
9.25% 10/16/13 (f) | | 580,000 | | 606,100 |
International Bank for Reconstruction & Development: | | | | |
8% 6/20/13 | NGN | 28,000,000 | | 159,063 |
8.2% 12/12/12 | NGN | 80,000,000 | | 465,804 |
Nordea Bank Finland PLC 2.25% 11/16/15 | EUR | 450,000 | | 588,386 |
RSHB Capital SA 6% 6/3/21 (f) | | 200,000 | | 175,000 |
Svenska Handelsbanken AB 4.375% 10/20/21 | EUR | 500,000 | | 664,913 |
The State Export-Import Bank of Ukraine JSC 5.7928% 2/9/16 (Issued by Credit Suisse First Boston International for The State Export-Import Bank of Ukraine JSC) (e) | | 500,000 | | 335,000 |
Trade & Development Bank of Mongolia LLC 8.5% 10/25/13 | | 200,000 | | 190,000 |
Turkiye Garanti Bankasi A/S 2.9092% 4/20/16 (f)(k) | | 400,000 | | 358,500 |
Turkiye Is Bankasi A/S 5.1% 2/1/16 (f) | | 500,000 | | 485,000 |
US Bank NA 4.375% 2/28/17 (k) | EUR | 100,000 | | 119,732 |
Vimpel Communications 8.25% 5/23/16 (Reg. S) (Issued by UBS Luxembourg SA for Vimpel Communications) | | 1,115,000 | | 1,109,425 |
| | 11,540,132 |
Consumer Finance - 1.3% |
Ally Financial, Inc.: | | | | |
3.6492% 2/11/14 (k) | | 1,530,000 | | 1,445,850 |
7.5% 9/15/20 | | 905,000 | | 914,050 |
Corporate Bonds - continued |
| Principal Amount (d) | | Value |
Nonconvertible Bonds - continued |
FINANCIALS - continued |
Consumer Finance - continued |
Ally Financial, Inc.: - continued | | | | |
8% 3/15/20 | | $ 2,710,000 | | $ 2,777,750 |
Ford Motor Credit Co. LLC: | | | | |
5.875% 8/2/21 | | 810,000 | | 843,880 |
12% 5/15/15 | | 1,620,000 | | 1,976,400 |
General Motors Acceptance Corp.: | | | | |
6.75% 12/1/14 | | 915,000 | | 917,288 |
8% 11/1/31 | | 490,000 | | 462,474 |
GMAC LLC: | | | | |
6.75% 12/1/14 | | 280,000 | | 281,400 |
8% 11/1/31 | | 3,883,000 | | 3,708,265 |
| | 13,327,357 |
Diversified Financial Services - 2.0% |
Aquarius Investments Luxemburg 8.25% 2/18/16 | | 400,000 | | 398,000 |
Biz Finance PLC 8.375% 4/27/15 (Reg. S) | | 550,000 | | 475,750 |
BP Capital Markets PLC: | | | | |
3.83% 10/6/17 | EUR | 250,000 | | 343,846 |
4.325% 12/10/18 | GBP | 400,000 | | 664,655 |
Bumble Bee Holdco SCA 9.625% 3/15/18 pay-in-kind (f)(k) | | 292,000 | | 259,880 |
CCO Holdings LLC/CCO Holdings Capital Corp.: | | | | |
6.5% 4/30/21 | | 935,000 | | 946,688 |
7.375% 6/1/20 | | 555,000 | | 581,363 |
7.875% 4/30/18 | | 235,000 | | 250,569 |
8.125% 4/30/20 | | 565,000 | | 618,675 |
CDW LLC/CDW Finance Corp. 8.25% 12/15/18 (e) | | 140,000 | | 145,950 |
Dignity Finance PLC: | | | | |
6.31% 12/31/23 (Reg. S) | GBP | 18,618 | | 34,589 |
8.151% 12/31/30 | GBP | 30,000 | | 62,589 |
Fibria Overseas Finance Ltd. 7.5% 5/4/20 (f) | | 225,000 | | 218,813 |
FireKeepers Development Authority 13.875% 5/1/15 (f) | | 100,000 | | 113,500 |
General Motors Financial Co., Inc. 6.75% 6/1/18 (f) | | 575,000 | | 586,500 |
Hilcorp Energy I LP/Hilcorp Finance Co. 7.625% 4/15/21 (f) | | 360,000 | | 375,300 |
Icahn Enterprises LP/Icahn Enterprises Finance Corp.: | | | | |
7.75% 1/15/16 | | 1,195,000 | | 1,239,813 |
8% 1/15/18 | | 2,308,000 | | 2,400,320 |
|
| Principal Amount (d) | | Value |
Indo Energy Finance BV 7% 5/7/18 (f) | | $ 200,000 | | $ 200,000 |
Kreditanstalt fuer Wiederaufbau 5.75% 6/7/32 | GBP | 750,000 | | 1,536,056 |
Landry's Acquisition Co. 11.625% 12/1/15 (f) | | 225,000 | | 237,375 |
Landrys Holdings, Inc. 11.5% 6/1/14 (f) | | 270,000 | | 264,600 |
NCO Group, Inc. 11.875% 11/15/14 | | 120,000 | | 112,800 |
Offshore Group Investment Ltd. 11.5% 8/1/15 | | 870,000 | | 943,950 |
Rearden G Holdings Eins GmbH 7.875% 3/30/20 (f) | | 345,000 | | 342,413 |
Reynolds Group DL Escrow LLC 8.75% 10/15/16 (f) | | 355,000 | | 373,638 |
Steel Capital SA Ln Partner Net Program 6.25% 7/26/16 (f) | | 355,000 | | 331,038 |
T2 Capital Finance Co. SA 6.95% 2/6/17 (Reg. S) (e) | | 400,000 | | 398,000 |
TMK Capital SA 7.75% 1/27/18 | | 200,000 | | 170,500 |
Transportation Union LLC/Transportation Union Financing Corp. 11.375% 6/15/18 | | 1,055,000 | | 1,200,063 |
Unitymedia Hessen GmbH & Co. KG / Unitymedia NRW GmbH 8.125% 12/1/17 (f) | | 560,000 | | 592,200 |
UPCB Finance III Ltd. 6.625% 7/1/20 (f) | | 345,000 | | 338,100 |
Vnesheconombank Via VEB Finance PLC 6.8% 11/22/25 (f) | | 200,000 | | 193,500 |
Wind Acquisition Holdings Finance SA 12.25% 7/15/17 pay-in-kind (f)(k) | | 1,576,831 | | 1,091,594 |
WM Finance Corp. 11.5% 10/1/18 (f) | | 1,460,000 | | 1,441,750 |
Zhaikmunai Finance BV 10.5% 10/19/15 (f) | | 725,000 | | 703,250 |
| | 20,187,627 |
Insurance - 0.0% |
CNO Financial Group, Inc. 9% 1/15/18 (f) | | 255,000 | | 267,750 |
Real Estate Investment Trusts - 0.2% |
MPT Operating Partnership LP/MPT Finance Corp. 6.875% 5/1/21 | | 725,000 | | 718,620 |
Omega Healthcare Investors, Inc.: | | | | |
6.75% 10/15/22 | | 725,000 | | 737,688 |
7.5% 2/15/20 | | 385,000 | | 411,950 |
Senior Housing Properties Trust 8.625% 1/15/12 | | 280,000 | | 280,493 |
| | 2,148,751 |
Corporate Bonds - continued |
| Principal Amount (d) | | Value |
Nonconvertible Bonds - continued |
FINANCIALS - continued |
Real Estate Management & Development - 0.1% |
CB Richard Ellis Services, Inc. 6.625% 10/15/20 | | $ 480,000 | | $ 492,000 |
Realogy Corp.: | | | | |
7.875% 2/15/19 (f) | | 397,000 | | 345,390 |
12% 4/15/17 | | 139,213 | | 108,586 |
Toys 'R' Us Property Co. II LLC 8.5% 12/1/17 | | 65,000 | | 67,113 |
| | 1,013,089 |
TOTAL FINANCIALS | | 49,285,958 |
HEALTH CARE - 3.7% |
Health Care Equipment & Supplies - 0.1% |
Chiron Merger Sub, Inc. 10.5% 11/1/18 (f) | | 1,400,000 | | 1,372,000 |
Health Care Providers & Services - 2.8% |
Apria Healthcare Group, Inc. 11.25% 11/1/14 | | 505,000 | | 525,200 |
Community Health Systems, Inc. 8% 11/15/19 (f) | | 1,295,000 | | 1,288,525 |
CRC Health Group, Inc. 10.75% 2/1/16 | | 90,000 | | 85,725 |
DaVita, Inc.: | | | | |
6.375% 11/1/18 | | 1,180,000 | | 1,212,450 |
6.625% 11/1/20 | | 1,375,000 | | 1,419,688 |
Emergency Medical Services Corp. 8.125% 6/1/19 | | 580,000 | | 578,550 |
ExamWorks Group, Inc. 9% 7/15/19 (f) | | 300,000 | | 271,500 |
Gentiva Health Services, Inc. 11.5% 9/1/18 | | 475,000 | | 387,125 |
Hanger Orthopedic Group, Inc. 7.125% 11/15/18 | | 1,230,000 | | 1,248,450 |
HCA Holdings, Inc. 7.75% 5/15/21 | | 6,940,000 | | 6,940,000 |
HCA, Inc.: | | | | |
6.5% 2/15/16 | | 275,000 | | 277,750 |
6.5% 2/15/20 | | 2,410,000 | | 2,509,292 |
7.25% 9/15/20 | | 1,935,000 | | 2,036,588 |
7.5% 2/15/22 | | 1,175,000 | | 1,204,375 |
8% 10/1/18 | | 135,000 | | 142,088 |
Health Management Associates, Inc. 7.375% 1/15/20 (f) | | 290,000 | | 297,250 |
HealthSouth Corp. 8.125% 2/15/20 | | 575,000 | | 578,565 |
IASIS Healthcare LLC/IASIS Capital Corp. 8.375% 5/15/19 | | 1,210,000 | | 1,055,725 |
InVentiv Health, Inc. 10% 8/15/18 (f) | | 75,000 | | 67,125 |
Kindred Healthcare, Inc. 8.25% 6/1/19 | | 190,000 | | 159,600 |
|
| Principal Amount (d) | | Value |
LifePoint Hospitals, Inc. 6.625% 10/1/20 | | $ 610,000 | | $ 632,113 |
ResCare, Inc. 10.75% 1/15/19 | | 240,000 | | 248,088 |
Rotech Healthcare, Inc.: | | | | |
10.5% 3/15/18 | | 220,000 | | 169,400 |
10.75% 10/15/15 | | 345,000 | | 336,375 |
Sabra Health Care LP/Sabra Capital Corp. 8.125% 11/1/18 | | 105,000 | | 106,050 |
Skilled Healthcare Group, Inc. 11% 1/15/14 | | 78,000 | | 73,320 |
Tenet Healthcare Corp. 6.25% 11/1/18 (f) | | 3,730,000 | | 3,795,275 |
UHS Escrow Corp. 7% 10/1/18 | | 85,000 | | 87,440 |
United Surgical Partners International, Inc. 8.875% 5/1/17 | | 55,000 | | 55,413 |
Vanguard Health Holding Co. II LLC / Vanguard Holding Co. II, Inc. 7.75% 2/1/19 | | 375,000 | | 360,000 |
Vanguard Health Systems, Inc. 0% 2/1/16 | | 21,000 | | 13,020 |
| | 28,162,065 |
Health Care Technology - 0.0% |
ConvaTec Healthcare ESA 10.5% 12/15/18 (f) | | 425,000 | | 379,313 |
Pharmaceuticals - 0.8% |
Elan Finance PLC/Elan Finance Corp. 8.75% 10/15/16 | | 435,000 | | 461,100 |
Leiner Health Products, Inc. 11% 6/1/12 (c) | | 90,000 | | 4,500 |
Mylan, Inc.: | | | | |
6% 11/15/18 (f) | | 950,000 | | 979,640 |
7.625% 7/15/17 (f) | | 315,000 | | 338,625 |
7.875% 7/15/20 (f) | | 570,000 | | 629,850 |
Valeant Pharmaceuticals International: | | | | |
6.75% 8/15/21 (f) | | 2,800,000 | | 2,716,000 |
6.875% 12/1/18 (f) | | 2,165,000 | | 2,175,825 |
7% 10/1/20 (f) | | 405,000 | | 400,950 |
| | 7,706,490 |
TOTAL HEALTH CARE | | 37,619,868 |
INDUSTRIALS - 3.5% |
Aerospace & Defense - 0.2% |
Alion Science & Technology Corp.: | | | | |
10.25% 2/1/15 | | 50,000 | | 26,000 |
12% 11/1/14 pay-in-kind | | 118,741 | | 97,566 |
Hexcel Corp. 6.75% 2/1/15 | | 34,000 | | 34,468 |
Huntington Ingalls Industries, Inc.: | | | | |
6.875% 3/15/18 (f) | | 1,750,000 | | 1,715,000 |
7.125% 3/15/21 (f) | | 150,000 | | 147,000 |
| | 2,020,034 |
Corporate Bonds - continued |
| Principal Amount (d) | | Value |
Nonconvertible Bonds - continued |
INDUSTRIALS - continued |
Air Freight & Logistics - 0.0% |
Air Medical Group Holdings, Inc. 9.25% 11/1/18 (f) | | $ 285,000 | | $ 294,975 |
Airlines - 0.7% |
Air Canada 9.25% 8/1/15 (f) | | 595,000 | | 520,625 |
American Airlines, Inc. equipment trust certificate 13% 8/1/16 | | 264,652 | | 275,238 |
American Airlines, Inc. pass-thru trust certificates 10.375% 7/2/19 | | 380,140 | | 399,147 |
Continental Airlines, Inc.: | | | | |
pass-thru trust certificates 6.903% 4/19/22 | | 48,180 | | 46,734 |
3.6539% 6/2/13 (k) | | 2,532,916 | | 2,393,605 |
Continental Airlines, Inc. 7.25% 11/10/19 | | 361,475 | | 384,971 |
Delta Air Lines, Inc. 9.5% 9/15/14 (f) | | 91,000 | | 93,384 |
Delta Air Lines, Inc. pass-thru trust certificates: | | | | |
6.821% 8/10/22 | | 555,910 | | 580,203 |
8.021% 8/10/22 | | 240,210 | | 235,694 |
Northwest Airlines, Inc. pass-thru trust certificates: | | | | |
7.027% 11/1/19 | | 120,930 | | 123,191 |
8.028% 11/1/17 | | 42,088 | | 40,826 |
United Air Lines, Inc.: | | | | |
9.875% 8/1/13 (f) | | 154,000 | | 157,265 |
12% 11/1/13 (f) | | 270,000 | | 279,774 |
United Air Lines, Inc. pass-thru trust certificates 9.75% 1/15/17 | | 591,412 | | 651,263 |
US Airways 2011-1 Class A pass-thru trust certificates 7.125% 4/22/25 | | 490,000 | | 465,500 |
| | 6,647,420 |
Building Products - 0.0% |
Building Materials Corp. of America 6.75% 5/1/21 (f) | | 425,000 | | 439,875 |
Commercial Services & Supplies - 1.4% |
ACCO Brands Corp. 10.625% 3/15/15 | | 45,000 | | 49,838 |
ADS Tactical, Inc. 11% 4/1/18 (f) | | 145,000 | | 142,274 |
American Reprographics Co. 10.5% 12/15/16 | | 395,000 | | 347,600 |
B-Corp Merger Sub, Inc. 8.25% 6/1/19 (f) | | 270,000 | | 248,400 |
Casella Waste Systems, Inc.: | | | | |
7.75% 2/15/19 | | 100,000 | | 96,000 |
11% 7/15/14 | | 105,000 | | 112,875 |
Cenveo Corp. 10.5% 8/15/16 (f) | | 175,000 | | 147,438 |
Covanta Holding Corp. 7.25% 12/1/20 | | 430,000 | | 451,876 |
|
| Principal Amount (d) | | Value |
Garda World Security Corp. 9.75% 3/15/17 (f) | | $ 185,000 | | $ 186,850 |
International Lease Finance Corp.: | | | | |
5.75% 5/15/16 | | 1,155,000 | | 1,071,263 |
6.25% 5/15/19 | | 2,090,000 | | 1,930,167 |
6.75% 9/1/16 (f) | | 1,363,000 | | 1,397,075 |
7.125% 9/1/18 (f) | | 2,505,000 | | 2,580,150 |
8.25% 12/15/20 | | 780,000 | | 787,800 |
8.625% 9/15/15 | | 655,000 | | 668,100 |
8.625% 1/15/22 | | 935,000 | | 940,844 |
8.75% 3/15/17 | | 1,570,000 | | 1,617,100 |
The Geo Group, Inc. 7.75% 10/15/17 | | 220,000 | | 233,200 |
United Rentals North America, Inc. 8.375% 9/15/20 | | 605,000 | | 582,313 |
WP Rocket Merger Sub, Inc. 10.125% 7/15/19 (f) | | 320,000 | | 288,000 |
| | 13,879,163 |
Construction & Engineering - 0.1% |
Odebrecht Finance Ltd. 7.5% (f)(g) | | 975,000 | | 953,063 |
Electrical Equipment - 0.0% |
General Cable Corp. 7.125% 4/1/17 | | 40,000 | | 39,900 |
Sensata Technologies BV 6.5% 5/15/19 (f) | | 485,000 | | 480,150 |
| | 520,050 |
Industrial Conglomerates - 0.1% |
Sequa Corp.: | | | | |
11.75% 12/1/15 (f) | | 705,000 | | 742,013 |
13.5% 12/1/15 pay-in-kind (f) | | 280,685 | | 299,631 |
| | 1,041,644 |
Machinery - 0.2% |
Accuride Corp. 9.5% 8/1/18 | | 55,000 | | 53,075 |
ArvinMeritor, Inc. 10.625% 3/15/18 | | 170,000 | | 159,800 |
Navistar International Corp. 8.25% 11/1/21 | | 639,000 | | 675,743 |
Terex Corp. 10.875% 6/1/16 | | 330,000 | | 364,650 |
Xerium Technologies, Inc. 8.875% 6/15/18 (f) | | 360,000 | | 318,600 |
| | 1,571,868 |
Marine - 0.2% |
Navios Maritime Acquisition Corp./Navios Acquisition Finance US, Inc. 8.625% 11/1/17 | | 220,000 | | 158,400 |
Navios Maritime Holdings, Inc.: | | | | |
8.125% 2/15/19 | | 385,000 | | 292,600 |
8.875% 11/1/17 | | 875,000 | | 840,000 |
Navios South American Logisitcs, Inc./Navios Logistics Finance U.S., Inc. 9.25% 4/15/19 (f) | | 120,000 | | 94,800 |
Corporate Bonds - continued |
| Principal Amount (d) | | Value |
Nonconvertible Bonds - continued |
INDUSTRIALS - continued |
Marine - continued |
SCF Capital Ltd. 5.375% 10/27/17 (f) | | $ 200,000 | | $ 172,000 |
Ultrapetrol (Bahamas) Ltd. 9% 11/24/14 | | 95,000 | | 85,500 |
| | 1,643,300 |
Road & Rail - 0.5% |
Georgian Railway Ltd. 9.875% 7/22/15 | | 200,000 | | 199,000 |
Kansas City Southern de Mexico SA de CV: | | | | |
6.125% 6/15/21 | | 230,000 | | 236,900 |
8% 2/1/18 | | 2,500,000 | | 2,718,750 |
12.5% 4/1/16 | | 855,000 | | 991,800 |
Swift Services Holdings, Inc. 10% 11/15/18 | | 935,000 | | 977,075 |
Western Express, Inc. 12.5% 4/15/15 (f) | | 485,000 | | 206,125 |
| | 5,329,650 |
Trading Companies & Distributors - 0.1% |
Aircastle Ltd. 9.75% 8/1/18 | | 755,000 | | 792,750 |
Transportation Infrastructure - 0.0% |
Aeropuertos Argentina 2000 SA 10.75% 12/1/20 (f) | | 330,240 | | 343,450 |
TOTAL INDUSTRIALS | | 35,477,242 |
INFORMATION TECHNOLOGY - 1.4% |
Communications Equipment - 0.5% |
Avaya, Inc.: | | | | |
9.75% 11/1/15 | | 555,000 | | 482,850 |
10.125% 11/1/15 pay-in-kind (k) | | 370,000 | | 323,750 |
Brocade Communications Systems, Inc.: | | | | |
6.625% 1/15/18 | | 620,000 | | 651,000 |
6.875% 1/15/20 | | 170,000 | | 181,050 |
Lucent Technologies, Inc.: | | | | |
6.45% 3/15/29 | | 3,620,000 | | 2,597,350 |
6.5% 1/15/28 | | 430,000 | | 308,525 |
ViaSat, Inc. 8.875% 9/15/16 | | 105,000 | | 107,625 |
| | 4,652,150 |
Computers & Peripherals - 0.1% |
Seagate HDD Cayman: | | | | |
7% 11/1/21 (f) | | 580,000 | | 594,500 |
7.75% 12/15/18 (f) | | 795,000 | | 846,675 |
| | 1,441,175 |
Electronic Equipment & Components - 0.1% |
Atkore International, Inc. 9.875% 1/1/18 | | 190,000 | | 180,500 |
|
| Principal Amount (d) | | Value |
Reddy Ice Corp.: | | | | |
11.25% 3/15/15 | | $ 1,075,000 | | $ 1,007,813 |
13.25% 11/1/15 | | 130,000 | | 47,450 |
| | 1,235,763 |
Internet Software & Services - 0.1% |
Equinix, Inc. 8.125% 3/1/18 | | 665,000 | | 724,850 |
IT Services - 0.2% |
Ceridian Corp. 11.25% 11/15/15 | | 275,000 | | 214,500 |
Fidelity National Information Services, Inc.: | | | | |
7.625% 7/15/17 | | 240,000 | | 259,200 |
7.875% 7/15/20 | | 320,000 | | 345,600 |
SunGard Data Systems, Inc. 7.375% 11/15/18 | | 385,000 | | 393,663 |
Telcordia Technologies, Inc. 11% 5/1/18 (f) | | 580,000 | | 739,500 |
Unisys Corp.: | | | | |
12.5% 1/15/16 | | 210,000 | | 224,175 |
12.75% 10/15/14 (f) | | 17,000 | | 19,380 |
| | 2,196,018 |
Semiconductors & Semiconductor Equipment - 0.4% |
Advanced Micro Devices, Inc.: | | | | |
7.75% 8/1/20 | | 135,000 | | 138,375 |
8.125% 12/15/17 | | 270,000 | | 280,800 |
Freescale Semiconductor, Inc. 10.75% 8/1/20 | | 198,000 | | 206,415 |
NXP BV/NXP Funding LLC 9.75% 8/1/18 (f) | | 2,645,000 | | 2,909,500 |
Spansion LLC 11.25% 1/15/16 (c)(f) | | 255,000 | | 11,724 |
Viasystems, Inc. 12% 1/15/15 (f) | | 310,000 | | 332,088 |
| | 3,878,902 |
Software - 0.0% |
Open Solutions, Inc. 9.75% 2/1/15 (f) | | 50,000 | | 32,063 |
TOTAL INFORMATION TECHNOLOGY | | 14,160,921 |
MATERIALS - 3.1% |
Chemicals - 0.8% |
Braskem America Finance Co. 7.125% 7/22/41 (f) | | 205,000 | | 198,850 |
Braskem Finance Ltd. 7% 5/7/20 (f) | | 500,000 | | 536,250 |
Celanese US Holdings LLC 5.875% 6/15/21 | | 235,000 | | 244,400 |
Ferro Corp. 7.875% 8/15/18 | | 360,000 | | 362,700 |
Georgia Gulf Corp. 9% 1/15/17 (f) | | 860,000 | | 909,450 |
Ineos Finance PLC 9% 5/15/15 (f) | | 215,000 | | 217,688 |
Inergy LP/Inergy Finance Corp. 6.875% 8/1/21 | | 382,000 | | 378,180 |
Lyondell Chemical Co. 8% 11/1/17 | | 175,000 | | 191,625 |
Corporate Bonds - continued |
| Principal Amount (d) | | Value |
Nonconvertible Bonds - continued |
MATERIALS - continued |
Chemicals - continued |
LyondellBasell Industries NV 6% 11/15/21 (f) | | $ 1,970,000 | | $ 2,038,950 |
Momentive Performance Materials, Inc. 9% 1/15/21 | | 150,000 | | 114,000 |
Nalco Co. 6.625% 1/15/19 (f) | | 555,000 | | 638,250 |
NOVA Chemicals Corp.: | | | | |
3.7836% 11/15/13 (k) | | 105,000 | | 102,900 |
6.5% 1/15/12 | | 375,000 | | 375,000 |
OMNOVA Solutions, Inc. 7.875% 11/1/18 | | 370,000 | | 317,275 |
OXEA Finance & CY S.C.A. 9.5% 7/15/17 (f) | | 294,000 | | 292,530 |
PolyOne Corp. 7.375% 9/15/20 | | 155,000 | | 156,550 |
Solutia, Inc.: | | | | |
7.875% 3/15/20 | | 175,000 | | 190,313 |
8.75% 11/1/17 | | 290,000 | | 314,650 |
TPC Group LLC 8.25% 10/1/17 | | 190,000 | | 190,475 |
| | 7,770,036 |
Construction Materials - 0.2% |
Cemex Espana SA (Luxembourg) 9.25% 5/12/20 (f) | | 115,000 | | 88,550 |
Cemex Finance LLC 9.5% 12/14/16 (f) | | 1,610,000 | | 1,400,700 |
Cemex SA de CV: | | | | |
5.5793% 9/30/15 (f)(k) | | 300,000 | | 220,500 |
9% 1/11/18 (f) | | 330,000 | | 263,175 |
| | 1,972,925 |
Containers & Packaging - 0.8% |
ARD Finance SA 11.125% 6/1/18 pay-in-kind (f) | | 434,453 | | 360,596 |
Ardagh Packaging Finance PLC: | | | | |
7.375% 10/15/17 (f) | | 200,000 | | 201,000 |
9.125% 10/15/20 (f) | | 560,000 | | 548,800 |
Ball Corp. 5.75% 5/15/21 | | 3,000,000 | | 3,135,000 |
Berry Plastics Corp.: | | | | |
8.25% 11/15/15 | | 385,000 | | 409,063 |
9.75% 1/15/21 | | 1,443,000 | | 1,435,785 |
Berry Plastics Holding Corp. 4.4213% 9/15/14 (k) | | 45,000 | | 41,625 |
BWAY Holding Co. 10% 6/15/18 | | 205,000 | | 218,325 |
BWAY Parent Co., Inc. 10.875% 11/1/15 pay-in-kind (k) | | 217,092 | | 206,916 |
Crown Americas LLC/Crown Americas Capital Corp. III 6.25% 2/1/21 | | 460,000 | | 480,700 |
|
| Principal Amount (d) | | Value |
Crown Cork & Seal, Inc.: | | | | |
7.375% 12/15/26 | | $ 1,210,000 | | $ 1,246,300 |
7.5% 12/15/96 | | 160,000 | | 128,000 |
| | 8,412,110 |
Metals & Mining - 1.1% |
Aleris International, Inc.: | | | | |
6% 6/1/20 (f) | | 1,759 | | 1,759 |
9% 12/15/14 pay-in-kind (c)(k) | | 150,000 | | 0 |
Alrosa Finance SA: | | | | |
(Reg. S) 8.875% 11/17/14 | | 450,000 | | 487,125 |
7.75% 11/3/20 (f) | | 200,000 | | 199,000 |
Aperam: | | | | |
7.375% 4/1/16 (f) | | 100,000 | | 84,500 |
7.75% 4/1/18 (f) | | 150,000 | | 123,750 |
Boart Longyear Management Pty Ltd. 7% 4/1/21 (f) | | 190,000 | | 193,800 |
Calcipar SA 6.875% 5/1/18 (f) | | 200,000 | | 185,000 |
Edgen Murray Corp. 12.25% 1/15/15 | | 675,000 | | 587,250 |
EVRAZ Group SA 8.25% 11/10/15 (f) | | 470,000 | | 472,350 |
FMG Resources (August 2006) Pty Ltd.: | | | | |
6.375% 2/1/16 (f) | | 635,000 | | 616,712 |
6.875% 2/1/18 (f) | | 1,365,000 | | 1,289,925 |
7% 11/1/15 (f) | | 790,000 | | 793,950 |
8.25% 11/1/19 (f) | | 2,260,000 | | 2,276,950 |
McJunkin Red Man Corp. 9.5% 12/15/16 | | 740,000 | | 762,200 |
Metinvest BV 10.25% 5/20/15 (f) | | 360,000 | | 339,480 |
Midwest Vanadium Pty Ltd. 11.5% 2/15/18 (f) | | 260,000 | | 189,800 |
Mirabela Nickel Ltd. 8.75% 4/15/18 (f) | | 100,000 | | 89,500 |
Rain CII Carbon LLC/CII Carbon Corp. 8% 12/1/18 (f) | | 300,000 | | 300,000 |
RathGibson, Inc. 11.25% 2/15/14 (c) | | 297,265 | | 30 |
Severstal Columbus LLC 10.25% 2/15/18 | | 555,000 | | 579,975 |
Southern Copper Corp. 6.75% 4/16/40 | | 320,000 | | 320,992 |
SunCoke Energy, Inc. 7.625% 8/1/19 (f) | | 125,000 | | 124,688 |
Vedanta Resources PLC: | | | | |
6.75% 6/7/16 (f) | | 530,000 | | 445,200 |
8.25% 6/7/21 (f) | | 200,000 | | 156,000 |
Votorantim Cimentos SA 7.25% 4/5/41 (f) | | 200,000 | | 194,000 |
| | 10,813,936 |
Paper & Forest Products - 0.2% |
ABI Escrow Corp. 10.25% 10/15/18 (f) | | 1,104,000 | | 1,217,160 |
Clearwater Paper Corp. 7.125% 11/1/18 | | 105,000 | | 109,200 |
Corporate Bonds - continued |
| Principal Amount (d) | | Value |
Nonconvertible Bonds - continued |
MATERIALS - continued |
Paper & Forest Products - continued |
Georgia-Pacific LLC 5.4% 11/1/20 (f) | | $ 560,000 | | $ 613,200 |
Glatfelter 7.125% 5/1/16 | | 40,000 | | 41,425 |
NewPage Corp.: | | | | |
6.6794% 5/1/12 (c)(k) | | 90,000 | | 6,300 |
11.375% 12/31/14 (c) | | 345,000 | | 255,300 |
Sino-Forest Corp. 6.25% 10/21/17 (f) | | 565,000 | | 141,250 |
| | 2,383,835 |
TOTAL MATERIALS | | 31,352,842 |
TELECOMMUNICATION SERVICES - 4.3% |
Diversified Telecommunication Services - 1.9% |
Alestra SA de RL de CV 11.75% 8/11/14 | | 650,000 | | 718,250 |
Citizens Communications Co.: | | | | |
7.875% 1/15/27 | | 280,000 | | 238,000 |
9% 8/15/31 | | 220,000 | | 200,750 |
Clearwire Communications LLC/Clearwire Finance, Inc.: | | | | |
12% 12/1/15 (f) | | 25,000 | | 23,938 |
12% 12/1/17 (f) | | 240,000 | | 200,400 |
Frontier Communications Corp.: | | | | |
8.25% 4/15/17 | | 275,000 | | 280,500 |
8.5% 4/15/20 | | 1,595,000 | | 1,634,875 |
8.75% 4/15/22 | | 1,090,000 | | 1,079,100 |
Sprint Capital Corp.: | | | | |
6.875% 11/15/28 | | 4,262,000 | | 3,052,444 |
6.9% 5/1/19 | | 840,000 | | 690,900 |
8.75% 3/15/32 | | 7,011,000 | | 5,670,146 |
Telemar Norte Leste SA 5.5% 10/23/20 (f) | | 140,000 | | 138,600 |
U.S. West Communications: | | | | |
6.875% 9/15/33 | | 200,000 | | 198,370 |
7.25% 9/15/25 | | 35,000 | | 38,293 |
7.25% 10/15/35 | | 70,000 | | 70,000 |
7.5% 6/15/23 | | 30,000 | | 29,925 |
Wind Acquisition Finance SA: | | | | |
7.25% 2/15/18 (f) | | 700,000 | | 637,000 |
11.75% 7/15/17 (f) | | 4,944,000 | | 4,424,880 |
| | 19,326,371 |
Wireless Telecommunication Services - 2.4% |
Clearwire Escrow Corp. 12% 12/1/15 (f) | | 295,000 | | 282,463 |
Cricket Communications, Inc. 7.75% 10/15/20 | | 3,524,000 | | 3,083,500 |
Digicel Group Ltd.: | | | | |
8.25% 9/1/17 (f) | | 990,000 | | 999,900 |
8.875% 1/15/15 (f) | | 3,050,000 | | 2,989,000 |
|
| Principal Amount (d) | | Value |
9.125% 1/15/15 pay-in-kind (f)(k) | | $ 1,297,000 | | $ 1,287,273 |
10.5% 4/15/18 (f) | | 2,845,000 | | 2,859,225 |
12% 4/1/14 (f) | | 1,145,000 | | 1,285,263 |
Intelsat Jackson Holdings SA: | | | | |
7.25% 4/1/19 (f) | | 1,000,000 | | 1,007,500 |
7.5% 4/1/21 (f) | | 1,885,000 | | 1,899,138 |
8.5% 11/1/19 | | 325,000 | | 341,673 |
9.5% 6/15/16 | | 1,215,000 | | 1,275,750 |
MetroPCS Wireless, Inc. 7.875% 9/1/18 | | 385,000 | | 389,312 |
MTS International Funding Ltd. 8.625% 6/22/20 (f) | | 810,000 | | 869,778 |
NII Capital Corp.: | | | | |
7.625% 4/1/21 | | 1,810,000 | | 1,791,900 |
10% 8/15/16 | | 765,000 | | 868,275 |
Pakistan Mobile Communications Ltd. 8.625% 11/13/13 (f) | | 1,050,000 | | 976,500 |
Telemovil Finance Co. Ltd. 8% 10/1/17 (f) | | 630,000 | | 642,600 |
VimpelCom Holdings BV 7.5043% 3/1/22 (f) | | 565,000 | | 474,600 |
VIP Finance Ireland Ltd.: | | | | |
6.493% 2/2/16 (f) | | 350,000 | | 327,250 |
7.748% 2/2/21 (f) | | 200,000 | | 170,500 |
| | 23,821,400 |
TOTAL TELECOMMUNICATION SERVICES | | 43,147,771 |
UTILITIES - 2.5% |
Electric Utilities - 0.3% |
Aguila 3 SA 7.875% 1/31/18 (f) | | 250,000 | | 242,500 |
Empresa Distribuidora y Comercializadora Norte SA 9.75% 10/25/22 (f) | | 150,000 | | 123,000 |
Empresas Publicas de Medellin 8.375% 2/1/21 (f) | COP | 236,000,000 | | 128,561 |
InterGen NV 9% 6/30/17 (f) | | 1,255,000 | | 1,320,888 |
Majapahit Holding BV: | | | | |
7.75% 1/20/20 (f) | | 265,000 | | 307,400 |
8% 8/7/19 (f) | | 165,000 | | 193,050 |
National Power Corp. 6.875% 11/2/16 (f) | | 200,000 | | 227,500 |
| | 2,542,899 |
Gas Utilities - 0.2% |
Intergas Finance BV 6.375% 5/14/17 (Reg. S) | | 155,000 | | 156,550 |
Southern Natural Gas Co.: | | | | |
7.35% 2/15/31 | | 175,000 | | 205,465 |
8% 3/1/32 | | 350,000 | | 432,278 |
Corporate Bonds - continued |
| Principal Amount (d) | | Value |
Nonconvertible Bonds - continued |
UTILITIES - continued |
Gas Utilities - continued |
Star Gas Partners LP/Star Gas Finance Co. 8.875% 12/1/17 | | $ 210,000 | | $ 213,150 |
Transportadora de Gas del Sur SA 7.875% 5/14/17 (f) | | 815,000 | | 745,725 |
| | 1,753,168 |
Independent Power Producers & Energy Traders - 2.0% |
Atlantic Power Corp. 9% 11/15/18 (f) | | 885,000 | | 887,213 |
Calpine Corp.: | | | | |
7.5% 2/15/21 (f) | | 620,000 | | 652,550 |
7.875% 7/31/20 (f) | | 1,645,000 | | 1,747,813 |
7.875% 1/15/23 (f) | | 2,345,000 | | 2,473,975 |
Dolphin Subsidiary II, Inc. 7.25% 10/15/21 (f) | | 900,000 | | 960,750 |
Energy Future Holdings Corp.: | | | | |
10% 1/15/20 | | 2,720,000 | | 2,856,000 |
10.875% 11/1/17 | | 335,000 | | 268,000 |
Energy Future Intermediate Holding Co. LLC/Energy Future Intermediate Holding Finance, Inc.: | | | | |
10% 12/1/20 | | 4,377,000 | | 4,595,850 |
11% 10/1/21 (f) | | 2,486,000 | | 2,361,700 |
NRG Energy, Inc.: | | | | |
7.625% 5/15/19 (f) | | 655,000 | | 630,438 |
7.875% 5/15/21 (f) | | 655,000 | | 630,438 |
Power Sector Assets and Liabilities Management Corp.: | | | | |
7.25% 5/27/19 (f) | | 335,000 | | 403,675 |
7.39% 12/2/24 (f) | | 280,000 | | 340,200 |
TXU Corp.: | | | | |
5.55% 11/15/14 | | 110,000 | | 78,100 |
6.5% 11/15/24 | | 1,070,000 | | 476,150 |
6.55% 11/15/34 | | 2,225,000 | | 945,625 |
| | 20,308,477 |
Multi-Utilities - 0.0% |
Emgesa SA ESP 8.75% 1/25/21 (f) | COP | 163,000,000 | | 90,813 |
|
| Principal Amount (d) | | Value |
Water Utilities - 0.0% |
Companhia de Saneamento Basico do Estado de Sao Paulo (SABESP) 6.25% 12/16/20 (f) | | $ 200,000 | | $ 205,500 |
South East Water Ltd. Class 2A, 5.5834% 3/29/29 | GBP | 165,000 | | 273,555 |
| | 479,055 |
TOTAL UTILITIES | | 25,174,412 |
TOTAL NONCONVERTIBLE BONDS | | 337,771,774 |
TOTAL CORPORATE BONDS (Cost $343,428,184) |
343,422,571
|
U.S. Government and Government Agency Obligations - 23.2% |
|
U.S. Government Agency Obligations - 1.7% |
Fannie Mae Guaranteed Mortgage pass-thru certificates: | | | | |
0.375% 12/28/12 | | 930,000 | | 931,973 |
0.625% 10/30/14 | | 184,000 | | 184,226 |
0.75% 12/19/14 | | 4,057,000 | | 4,069,577 |
Federal Home Loan Bank: | | | | |
0.375% 11/27/13 | | 885,000 | | 884,180 |
0.875% 8/22/12 | | 495,000 | | 497,004 |
0.875% 12/27/13 | | 50,000 | | 50,440 |
Freddie Mac: | | | | |
0.375% 11/30/12 | | 227,000 | | 227,442 |
0.625% 12/29/14 | | 1,361,000 | | 1,360,005 |
0.75% 11/25/14 | | 5,109,000 | | 5,118,252 |
1% 7/30/14 | | 598,000 | | 604,540 |
1% 8/27/14 | | 408,000 | | 412,045 |
Tennessee Valley Authority: | | | | |
3.875% 2/15/21 | | 500,000 | | 570,232 |
5.25% 9/15/39 | | 400,000 | | 515,824 |
5.375% 4/1/56 | | 1,200,000 | | 1,620,408 |
TOTAL U.S. GOVERNMENT AGENCY OBLIGATIONS | | 17,046,148 |
U.S. Treasury Inflation Protected Obligations - 0.3% |
U.S. Treasury Inflation-Indexed Bonds 2.125% 2/15/41 | | 796,180 | | 1,076,012 |
U.S. Treasury Inflation-Indexed Notes 2% 4/15/12 | | 1,926,009 | | 1,935,209 |
TOTAL U.S. TREASURY INFLATION PROTECTED OBLIGATIONS | | 3,011,221 |
U.S. Treasury Obligations - 19.5% |
U.S. Treasury Bonds: | | | | |
3.125% 11/15/41 | | 550,000 | | 574,750 |
3.75% 8/15/41 | | 4,463,000 | | 5,236,353 |
U.S. Government and Government Agency Obligations - continued |
| Principal Amount | | Value |
U.S. Treasury Obligations - continued |
U.S. Treasury Bonds: - continued | | | | |
4.375% 2/15/38 | | $ 675,000 | | $ 871,594 |
4.375% 5/15/41 | | 12,281,000 | | 15,965,244 |
4.75% 2/15/37 | | 450,000 | | 610,805 |
5.25% 2/15/29 | | 2,781,000 | | 3,839,952 |
6.125% 8/15/29 | | 700,000 | | 1,060,063 |
6.25% 8/15/23 (j) | | 4,224,000 | | 6,042,960 |
7.5% 11/15/16 | | 655,000 | | 863,832 |
7.5% 11/15/24 | | 780,000 | | 1,244,343 |
7.875% 2/15/21 | | 200,000 | | 305,125 |
8% 11/15/21 | | 870,000 | | 1,359,375 |
U.S. Treasury Notes: | | | | |
0.125% 8/31/13 | | 6,600,000 | | 6,589,427 |
0.125% 9/30/13 | | 2,000,000 | | 1,996,250 |
0.125% 12/31/13 | | 1,215,000 | | 1,212,152 |
0.25% 10/31/13 | | 6,000,000 | | 6,001,638 |
0.25% 11/30/13 | | 2,000,000 | | 2,000,468 |
0.25% 9/15/14 | | 5,834,000 | | 5,820,780 |
0.25% 12/15/14 | | 1,000,000 | | 996,875 |
0.375% 6/30/13 | | 7,500,000 | | 7,518,750 |
0.375% 7/31/13 | | 3,280,000 | | 3,288,072 |
0.5% 8/15/14 | | 4,306,000 | | 4,326,187 |
0.5% 10/15/14 | | 2,500,000 | | 2,510,743 |
0.625% 7/15/14 | | 2,808,000 | | 2,829,936 |
0.75% 6/15/14 | | 1,404,000 | | 1,419,357 |
0.875% 11/30/16 | | 10,560,000 | | 10,593,824 |
0.875% 12/31/16 | | 1,000,000 | | 1,002,031 |
1% 9/30/16 | | 10,684,000 | | 10,797,518 |
1% 10/31/16 | | 4,450,000 | | 4,494,500 |
1.25% 10/31/15 | | 3,260,000 | | 3,344,300 |
1.375% 12/31/18 | | 10,065,000 | | 10,083,872 |
1.75% 7/31/15 | | 4,750,000 | | 4,958,924 |
1.75% 10/31/18 | | 13,423,000 | | 13,815,207 |
1.875% 8/31/17 | | 3,300,000 | | 3,454,688 |
1.875% 9/30/17 | | 1,900,000 | | 1,986,836 |
2% 11/15/21 | | 641,000 | | 648,011 |
2.125% 11/30/14 | | 3,932,000 | | 4,130,137 |
2.125% 5/31/15 | | 438,000 | | 462,501 |
2.125% 8/15/21 | | 5,800,000 | | 5,945,905 |
2.375% 8/31/14 | | 12,800,000 | | 13,485,005 |
2.375% 9/30/14 | | 942,000 | | 994,030 |
2.375% 10/31/14 | | 4,724,000 | | 4,991,199 |
2.375% 6/30/18 | | 1,912,000 | | 2,048,978 |
2.5% 4/30/15 | | 3,089,000 | | 3,297,267 |
2.625% 7/31/14 | | 1,035,000 | | 1,095,806 |
2.75% 11/30/16 | | 1,500,000 | | 1,638,164 |
3% 2/28/17 | | 1,500,000 | | 1,659,375 |
3.125% 10/31/16 | | 1,340,000 | | 1,486,143 |
3.125% 1/31/17 | | 1,636,000 | | 1,819,028 |
|
| Principal Amount | | Value |
3.125% 5/15/19 | | $ 1,232,000 | | $ 1,380,996 |
4.25% 8/15/15 | | 1,376,000 | | 1,559,611 |
4.5% 5/15/17 | | 1,172,000 | | 1,390,285 |
TOTAL U.S. TREASURY OBLIGATIONS | | 197,049,172 |
Other Government Related - 1.7% |
Bank of America Corp.: | | | | |
2.1% 4/30/12 (FDIC Guaranteed) (h) | | 200,000 | | 201,368 |
3.125% 6/15/12 (FDIC Guaranteed) (h) | | 9,000 | | 9,121 |
Citigroup Funding, Inc.: | | | | |
1.875% 10/22/12 (FDIC Guaranteed) (h) | | 4,000,000 | | 4,055,172 |
1.875% 11/15/12 (FDIC Guaranteed) (h) | | 525,000 | | 532,576 |
2% 3/30/12 (FDIC Guaranteed) (h) | | 250,000 | | 251,122 |
2.125% 7/12/12 (FDIC Guaranteed) (h) | | 172,000 | | 173,758 |
General Electric Capital Corp.: | | | | |
2% 9/28/12 (FDIC Guaranteed) (h) | | 1,693,000 | | 1,716,082 |
2.125% 12/21/12 (FDIC Guaranteed) (h) | | 1,000,000 | | 1,018,642 |
2.625% 12/28/12 (FDIC Guaranteed) (h) | | 384,000 | | 393,206 |
GMAC, Inc. 1.75% 10/30/12 (FDIC Guaranteed) (h) | | 1,360,000 | | 1,377,586 |
Goldman Sachs Group, Inc. 3.25% 6/15/12 (FDIC Guaranteed) (h) | | 9,000 | | 9,128 |
National Credit Union Administration Guaranteed Notes: | | | | |
Series 2010-A1 Class A, 0.6241% 12/7/20 (NCUA Guaranteed) (k) | | 405,398 | | 406,577 |
Series 2011-R1 Class 1A, 0.7241% 1/8/20 (NCUA Guaranteed) (k) | | 625,566 | | 626,066 |
Series 2011-R4 Class 1A, 0.6541% 3/6/20 (NCUA Guaranteed) (k) | | 419,711 | | 419,842 |
National Credit Union Administration Guaranteed Notes Master Trust: | | | | |
1.4% 6/12/15 (NCUA Guaranteed) | | 330,000 | | 334,287 |
U.S. Government and Government Agency Obligations - continued |
| Principal Amount | | Value |
Other Government Related - continued |
National Credit Union Administration Guaranteed Notes Master Trust: - continued | | | | |
2.35% 6/12/17 (NCUA Guaranteed) | | $ 2,930,000 | | $ 3,028,975 |
3.45% 6/12/21 (NCUA Guaranteed) | | 2,400,000 | | 2,585,208 |
TOTAL OTHER GOVERNMENT RELATED | | 17,138,716 |
TOTAL U.S. GOVERNMENT AND GOVERNMENT AGENCY OBLIGATIONS (Cost $224,222,086) |
234,245,257
|
U.S. Government Agency - Mortgage Securities - 1.5% |
|
Fannie Mae Guaranteed Mortgage pass-thru certificates - 0.8% |
1.926% 9/1/33 (k) | | 42,263 | | 44,296 |
2.026% 11/1/35 (k) | | 40,095 | | 42,065 |
2.115% 10/1/35 (k) | | 5,120 | | 5,356 |
2.165% 11/1/33 (k) | | 7,404 | | 7,830 |
2.303% 6/1/36 (k) | | 3,230 | | 3,424 |
2.31% 1/1/35 (k) | | 21,639 | | 22,815 |
2.393% 9/1/36 (k) | | 10,357 | | 10,925 |
2.403% 3/1/33 (k) | | 11,828 | | 12,496 |
2.474% 11/1/36 (k) | | 5,822 | | 6,201 |
2.492% 2/1/37 (k) | | 44,485 | | 47,272 |
2.5% 7/1/35 (k) | | 40,713 | | 43,244 |
2.509% 2/1/36 (k) | | 8,971 | | 9,472 |
2.527% 6/1/47 (k) | | 11,582 | | 12,320 |
2.587% 5/1/35 (k) | | 69,586 | | 74,110 |
2.605% 5/1/36 (k) | | 5,635 | | 5,957 |
2.631% 4/1/36 (k) | | 32,471 | | 34,366 |
2.93% 8/1/35 (k) | | 60,894 | | 64,852 |
3.791% 6/1/40 (k) | | 221,450 | | 230,955 |
4% 9/1/13 | | 6,272 | | 6,616 |
4% 1/1/42 (i) | | 6,000,000 | | 6,302,687 |
5.5% 10/1/20 to 4/1/21 | | 665,051 | | 722,308 |
5.954% 3/1/37 (k) | | 6,364 | | 6,927 |
6% 6/1/16 to 10/1/16 | | 9,572 | | 10,248 |
6.5% 4/1/12 to 7/1/26 | | 31,479 | | 34,320 |
TOTAL FANNIE MAE GUARANTEED MORTGAGE PASS-THRU CERTIFICATES | | 7,761,062 |
Freddie Mac - 0.4% |
1.847% 3/1/35 (k) | | 12,539 | | 13,003 |
2.051% 5/1/37 (k) | | 7,901 | | 8,272 |
2.075% 3/1/37 (k) | | 3,074 | | 3,212 |
2.079% 1/1/36 (k) | | 6,330 | | 6,686 |
2.283% 6/1/33 (k) | | 25,343 | | 26,437 |
|
| Principal Amount | | Value |
2.35% 7/1/35 (k) | | $ 27,819 | | $ 29,609 |
2.388% 10/1/36 (k) | | 31,801 | | 33,571 |
2.395% 12/1/36 (k) | | 89,963 | | 93,983 |
2.399% 10/1/35 (k) | | 24,548 | | 25,506 |
2.415% 7/1/36 (k) | | 355,380 | | 376,528 |
2.44% 6/1/37 (k) | | 19,683 | | 20,594 |
2.456% 5/1/37 (k) | | 46,717 | | 49,510 |
2.461% 12/1/33 (k) | | 53,611 | | 56,010 |
2.469% 5/1/37 (k) | | 82,131 | | 87,482 |
2.49% 9/1/35 (k) | | 4,849 | | 5,165 |
2.5% 5/1/37 (k) | | 6,162 | | 6,367 |
2.529% 4/1/37 (k) | | 10,014 | | 10,636 |
2.622% 1/1/35 (k) | | 66,342 | | 70,504 |
2.795% 7/1/36 (k) | | 10,338 | | 10,989 |
2.798% 7/1/35 (k) | | 17,918 | | 18,934 |
2.81% 4/1/35 (k) | | 52,915 | | 55,023 |
2.93% 2/1/37 (k) | | 5,387 | | 5,604 |
3.058% 1/1/37 (k) | | 27,218 | | 28,924 |
3.135% 10/1/35 (k) | | 4,120 | | 4,388 |
3.586% 6/1/37 (k) | | 5,668 | | 5,986 |
4.5% 8/1/33 to 10/1/41 | | 937,441 | | 998,678 |
5.138% 4/1/35 (k) | | 2,593 | | 2,723 |
5.5% 2/1/19 to 11/1/21 | | 1,716,588 | | 1,860,128 |
5.847% 6/1/37 (k) | | 3,313 | | 3,457 |
6.5% 12/1/14 to 3/1/22 | | 133,586 | | 145,221 |
6.656% 8/1/37 (k) | | 11,621 | | 12,251 |
7.22% 4/1/37 (k) | | 475 | | 499 |
TOTAL FREDDIE MAC | | 4,075,880 |
Ginnie Mae - 0.3% |
4% 9/15/25 | | 87,974 | | 94,487 |
4.751% 12/20/60 (p) | | 516,915 | | 567,566 |
5.492% 4/20/60 (p) | | 755,244 | | 848,291 |
5.5% 2/20/60 (p) | | 1,606,384 | | 1,768,132 |
TOTAL GINNIE MAE | | 3,278,476 |
TOTAL U.S. GOVERNMENT AGENCY - MORTGAGE SECURITIES (Cost $14,805,448) |
15,115,418
|
Collateralized Mortgage Obligations - 3.5% |
|
U.S. Government Agency - 3.5% |
Fannie Mae Guaranteed Mortgage pass-thru certificates: | | | | |
floater: | | | | |
Series 2011-83 Class FB, 0.7936% 9/25/41 (k) | | 1,199,609 | | 1,198,251 |
Series 2011-89 Class FP, 0.5936% 3/25/39 (k) | | 1,540,919 | | 1,538,562 |
planned amortization class Series 2010-118 Class PB, 4.5% 10/25/40 | | 300,000 | | 327,248 |
Collateralized Mortgage Obligations - continued |
| Principal Amount | | Value |
U.S. Government Agency - continued |
Fannie Mae Guaranteed Mortgage pass-thru certificates: - continued | | | | |
sequential payer: | | | | |
Series 2007-113 Class DB, 4.5% 12/25/22 | | $ 440,000 | | $ 488,832 |
Series 2009-14 Class EB, 4.5% 3/25/24 | | 340,000 | | 370,918 |
Series 2010-97 Class CX, 4.5% 9/25/25 | | 500,000 | | 565,523 |
Series 2010-109 Class IM, 5.5% 9/25/40 (m) | | 917,947 | | 137,225 |
Series 2010-97 Class CI, 4.5% 8/25/25 (m) | | 474,509 | | 46,162 |
Fannie Mae subordinate REMIC pass-thru certificates: | | | | |
floater: | | | | |
Series 2008-76 Class EF, 0.7936% 9/25/23 (k) | | 149,686 | | 150,175 |
Series 2010-86 Class FE, 0.7436% 8/25/25 (k) | | 207,198 | | 208,136 |
Series 2011-104 Class FK, 0.6636% 3/25/39 (k) | | 896,879 | | 894,154 |
planned amortization class: | | | | |
Series 2002-9 Class PC, 6% 3/25/17 | | 3,907 | | 4,209 |
Series 2003-113 Class PE, 4% 11/25/18 | | 80,000 | | 85,955 |
Series 2003-70 Class BJ, 5% 7/25/33 | | 45,000 | | 50,499 |
Series 2004-80 Class LD, 4% 1/25/19 | | 73,376 | | 75,837 |
Series 2005-52 Class PB, 6.5% 12/25/34 | | 44,274 | | 47,292 |
sequential payer: | | | | |
Series 2002-57 Class BD, 5.5% 9/25/17 | | 15,159 | | 16,405 |
Series 2004-91 Class Z, 5% 12/25/34 | | 455,662 | | 513,972 |
Series 2004-95 Class AN, 5.5% 1/25/25 | | 51,001 | | 54,140 |
Series 2005-117, Class JN, 4.5% 1/25/36 | | 40,000 | | 44,333 |
Series 2005-47 Class HK, 4.5% 6/25/20 | | 340,000 | | 370,306 |
Series 2006-72 Class CY, 6% 8/25/26 | | 145,000 | | 165,293 |
Series 2009-85 Class IB, 4.5% 8/25/24 (m) | | 128,667 | | 10,952 |
Series 2009-93 Class IC, 4.5% 9/25/24 (m) | | 235,573 | | 19,145 |
Series 2010-139 Class NI, 4.5% 2/25/40 (m) | | 474,383 | | 67,216 |
|
| Principal Amount | | Value |
Fannie Mae Guaranteed pass-thru certifcates: | | | | |
floater Series 2011-63 Class FL, 0.6936% 7/25/41 (k) | | $ 1,565,026 | | $ 1,568,392 |
Series 2011-67 Class AI, 4% 7/25/26 (m) | | 232,459 | | 25,487 |
FHMLC Multi-class participation certificates guaranteed: | | | | |
floater Series 3835, 0.6283% 5/15/38 (k) | | 1,398,786 | | 1,397,684 |
planned amortization class: | | | | |
Series 3856 Class KF, 0.7283% 5/15/41 (k) | | 1,019,731 | | 1,018,501 |
Series 3867, 0.6283% 4/15/40 (k) | | 1,764,883 | | 1,765,565 |
Freddie Mac: | | | | |
floater 0.5783% 7/15/36 (k) | | 1,293,313 | | 1,290,115 |
planned amortization class: | | | | |
Series 2101 Class PD, 6% 11/15/28 | | 9,491 | | 10,480 |
Series 2115 Class PE, 6% 1/15/14 | | 1,378 | | 1,425 |
Series 3737 Class GB, 4.5% 4/15/39 | | 650,000 | | 727,063 |
Freddie Mac Multi-class participation certificates guaranteed: | | | | |
floater: | | | | |
Series 2630 Class FL, 0.7783% 6/15/18 (k) | | 2,760 | | 2,784 |
Series 3346 Class FA, 0.5083% 2/15/19 (k) | | 699,843 | | 700,842 |
planned amortization class: | | | | |
Series 2376 Class JE, 5.5% 11/15/16 | | 16,249 | | 17,400 |
Series 2381 Class OG, 5.5% 11/15/16 | | 10,288 | | 11,010 |
Series 2425 Class JH, 6% 3/15/17 | | 20,006 | | 21,596 |
Series 2672 Class MG, 5% 9/15/23 | | 310,000 | | 350,852 |
Series 2684 Class FP, 0.7783% 1/15/33 (k) | | 881,941 | | 885,460 |
Series 2695 Class DG, 4% 10/15/18 | | 220,000 | | 235,281 |
Series 2996 Class MK, 5.5% 6/15/35 | | 20,409 | | 22,729 |
Series 3147 Class PF, 0.5783% 4/15/36 (k) | | 346,170 | | 344,507 |
sequential payer: | | | | |
Series 2303 Class ZV, 6% 4/15/31 | | 25,875 | | 28,645 |
Series 2570 Class CU, 4.5% 7/15/17 | | 1,699 | | 1,725 |
Series 2877 Class ZD, 5% 10/15/34 | | 586,250 | | 659,564 |
Collateralized Mortgage Obligations - continued |
| Principal Amount | | Value |
U.S. Government Agency - continued |
Freddie Mac Multi-class participation certificates guaranteed: - continued | | | | |
sequential payer: - continued | | | | |
Series 2987 Class HE, 4.5% 6/15/20 | | $ 380,000 | | $ 406,232 |
Series 3277 Class B, 4% 2/15/22 | | 300,000 | | 326,757 |
Series 3372 Class BD, 4.5% 10/15/22 | | 790,000 | | 870,447 |
Series 3578, Class B, 4.5% 9/15/24 | | 340,000 | | 374,371 |
Series 2715 Class NG, 4.5% 12/15/18 | | 1,000,000 | | 1,086,973 |
Series 2863 Class DB, 4% 9/15/14 | | 2,120 | | 2,124 |
Ginnie Mae guaranteed REMIC pass-thru certificates: | | | | |
floater: | | | | |
Series 2010-H17 Class FA, 0.6149% 7/20/60 (k)(p) | | 668,107 | | 653,676 |
Series 2010-H18 Class AF, 0.5394% 9/20/60 (k)(p) | | 699,940 | | 687,691 |
Series 2010-H19 Class FG, 0.5849% 8/20/60 (k)(p) | | 846,541 | | 828,425 |
Series 2010-H27 Series FA, 0.6649% 12/20/60 (k)(p) | | 318,305 | | 312,608 |
Series 2011-H03 Class FA, 0.7849% 1/20/61 (k)(p) | | 864,904 | | 855,822 |
Series 2011-H05 Class FA, 0.7849% 12/20/60 (k)(p) | | 487,145 | | 482,079 |
Series 2011-H07 Class FA, 0.7849% 2/20/61 (k)(p) | | 697,349 | | 687,760 |
Series 2011-H12 Class FA, 0.7749% 2/20/61 (k)(p) | | 1,079,823 | | 1,066,995 |
Series 2011-H13 Class FA, 0.7849% 4/20/61 (k)(p) | | 440,158 | | 435,625 |
Series 2011-H14: | | | | |
Class FB, 0.7849% 5/20/61 (k)(p) | | 495,643 | | 492,614 |
Class FC, 0.7849% 5/20/61 (k)(p) | | 500,461 | | 497,454 |
Series 2011-H17 Class FA, 0.8149% 6/20/61 (k)(p) | | 633,136 | | 627,817 |
Series 2011-H21 Class FA, 0.8849% 10/20/61 (k)(p) | | 638,894 | | 635,508 |
planned amortization: | | | | |
Series 2011-61 Class OP, 0% 5/20/40 (n) | | 472,893 | | 416,497 |
Series 2011-79, 0% 6/20/40 (n) | | 864,424 | | 724,964 |
sequential payer Series 2011-69 Class GX, 4.5% 5/16/40 | | 470,000 | | 513,057 |
Series 2004-79 Class FA, 0.5849% 1/20/31 (k) | | 13,809 | | 13,810 |
Series 2010-42 Class OP, 0% 4/20/40 (n) | | 1,101,188 | | 923,531 |
|
| Principal Amount (d) | | Value |
Series 2011-71: | | | | |
Class ZB, 5.5% 8/20/34 | | $ 956,278 | | $ 1,139,976 |
Class ZC, 5.5% 7/16/34 | | 1,090,209 | | 1,288,803 |
TOTAL COLLATERALIZED MORTGAGE OBLIGATIONS (Cost $34,424,296) |
34,889,463
|
Commercial Mortgage Securities - 0.0% |
|
London & Regional Debt Securitisation No. 1 PLC Class A, 1.1767% 10/15/14 (k) | GBP | 50,000 | | 69,143 |
REC Plantation Place Ltd. Series 5 Class A, 1.2148% 7/25/16 (Reg. S) (k) | GBP | 48,031 | | 69,004 |
TOTAL COMMERCIAL MORTGAGE SECURITIES (Cost $160,736) |
138,147
|
Foreign Government and Government Agency Obligations - 22.4% |
|
Argentine Republic: | | | | |
discount (with partial capitalization through 12/31/13) 8.28% 12/31/33 | | 1,273,788 | | 926,681 |
2.5% 12/31/38 (e) | | 880,000 | | 310,200 |
7% 9/12/13 | | 2,950,000 | | 2,885,182 |
7% 10/3/15 | | 3,650,000 | | 3,338,331 |
Bahamian Republic 6.95% 11/20/29 (f) | | 340,000 | | 380,800 |
Bahrain Kingdom 5.5% 3/31/20 | | 240,000 | | 226,800 |
Banco Nacional de Desenvolvimento Economico e Social 6.369% 6/16/18 (f) | | 375,000 | | 421,313 |
Belarus Republic: | | | | |
8.75% 8/3/15 (Reg. S) | | 1,690,000 | | 1,464,047 |
8.95% 1/26/18 | | 300,000 | | 258,000 |
Bermuda Government 5.603% 7/20/20 (f) | | 185,000 | | 205,813 |
Brazilian Federative Republic: | | | | |
7.125% 1/20/37 | | 255,000 | | 352,538 |
8.25% 1/20/34 | | 250,000 | | 377,500 |
8.75% 2/4/25 | | 165,000 | | 246,263 |
8.875% 10/14/19 | | 145,000 | | 201,550 |
10.125% 5/15/27 | | 695,000 | | 1,157,175 |
12.25% 3/6/30 | | 420,000 | | 800,100 |
Canada Housing Trust No. 1 1.3293% 9/15/16 (k) | CAD | 3,050,000 | | 2,973,181 |
Canadian Government: | | | | |
1.5% 6/1/12 | CAD | 1,500,000 | | 1,476,242 |
2% 6/1/16 | CAD | 10,600,000 | | 10,743,845 |
3.25% 6/1/21 | CAD | 4,400,000 | | 4,802,671 |
5% 6/1/37 | CAD | 1,900,000 | | 2,726,418 |
City of Buenos Aires 12.5% 4/6/15 (f) | | 1,260,000 | | 1,326,150 |
Foreign Government and Government Agency Obligations - continued |
| Principal Amount (d) | | Value |
Colombian Republic: | | | | |
4.375% 7/12/21 | | $ 405,000 | | $ 433,350 |
7.375% 1/27/17 | | 285,000 | | 347,700 |
7.375% 3/18/19 | | 200,000 | | 252,500 |
7.375% 9/18/37 | | 605,000 | | 847,000 |
10.375% 1/28/33 | | 655,000 | | 1,110,225 |
11.75% 2/25/20 | | 245,000 | | 385,875 |
Congo Republic 3% 6/30/29 (e) | | 793,250 | | 563,208 |
Croatia Republic: | | | | |
6.375% 3/24/21 (f) | | 500,000 | | 457,500 |
6.625% 7/14/20 (f) | | 620,000 | | 578,150 |
6.75% 11/5/19 (f) | | 580,000 | | 552,450 |
Democratic Socialist Republic of Sri Lanka: | | | | |
6.25% 10/4/20 (f) | | 630,000 | | 628,425 |
6.25% 7/27/21 (f) | | 410,000 | | 406,925 |
7.4% 1/22/15 (f) | | 515,000 | | 533,025 |
Dominican Republic: | | | | |
1.5522% 8/30/24 (k) | | 495,000 | | 431,888 |
7.5% 5/6/21 (f) | | 590,000 | | 585,575 |
9.04% 1/23/18 (f) | | 216,409 | | 235,886 |
Dutch Government: | | | | |
1.75% 1/15/13 | EUR | 6,400,000 | | 8,420,849 |
2.75% 1/15/15 | EUR | 7,850,000 | | 10,749,161 |
El Salvador Republic: | | | | |
7.375% 12/1/19 (f) | | 180,000 | | 194,400 |
7.625% 2/1/41 (f) | | 175,000 | | 175,000 |
7.65% 6/15/35 (Reg. S) | | 240,000 | | 244,800 |
7.75% 1/24/23 (Reg. S) | | 225,000 | | 244,125 |
8.25% 4/10/32 (Reg. S) | | 140,000 | | 151,900 |
European Union 3.375% 5/10/19 | EUR | 700,000 | | 951,284 |
Export Credit Bank of Turkey 5.375% 11/4/16 (f) | | 215,000 | | 211,775 |
French Republic: | | | | |
OAT 4.5% 4/25/41 | EUR | 1,175,000 | | 1,741,514 |
2.5% 7/25/16 | EUR | 600,000 | | 795,279 |
3.25% 10/25/21 | EUR | 2,850,000 | | 3,712,133 |
4% 4/25/18 | EUR | 2,600,000 | | 3,666,613 |
4% 4/25/55 | EUR | 500,000 | | 680,557 |
Gabonese Republic 8.2% 12/12/17 (f) | | 330,000 | | 377,850 |
Georgia Republic 6.875% 4/12/21 (f) | | 630,000 | | 648,900 |
German Federal Republic: | | | | |
1.25% 10/14/16 | EUR | 6,790,000 | | 8,980,136 |
3.25% 7/4/21 | EUR | 6,030,000 | | 8,818,351 |
3.25% 7/4/42 | EUR | 1,175,000 | | 1,802,686 |
Ghana Republic: | | | | |
8.5% 10/4/17 (f) | | 235,000 | | 254,975 |
14.25% 7/29/13 | GHS | 280,000 | | 170,031 |
14.99% 3/11/13 | GHS | 1,270,000 | | 779,816 |
15.65% 6/3/13 | GHS | 175,000 | | 108,362 |
|
| Principal Amount (d) | | Value |
Hungarian Republic: | | | | |
4.75% 2/3/15 | | $ 205,000 | | $ 186,550 |
6.25% 1/29/20 | | 320,000 | | 286,400 |
6.375% 3/29/21 | | 559,000 | | 497,510 |
7.625% 3/29/41 | | 542,000 | | 474,250 |
Indonesian Republic: | | | | |
4.875% 5/5/21 (f) | | 400,000 | | 428,000 |
5.875% 3/13/20 (f) | | 630,000 | | 713,475 |
6.625% 2/17/37 (f) | | 425,000 | | 515,313 |
6.875% 1/17/18 (f) | | 450,000 | | 529,875 |
7.75% 1/17/38 (f) | | 710,000 | | 960,275 |
8.5% 10/12/35 (Reg. S) | | 675,000 | | 973,688 |
11.625% 3/4/19 (f) | | 675,000 | | 997,313 |
Islamic Republic of Pakistan 7.125% 3/31/16 (f) | | 1,225,000 | | 927,938 |
Israeli State (guaranteed by U.S. Government through Agency for International Development): | | | | |
5.5% 9/18/23 | | 1,278,000 | | 1,630,895 |
5.5% 12/4/23 | | 1,500,000 | | 1,911,773 |
Italian Republic: | | | | |
3.75% 8/1/16 | EUR | 3,650,000 | | 4,304,547 |
4.25% 3/1/20 | EUR | 3,600,000 | | 4,021,442 |
4.5% 3/1/19 | EUR | 3,200,000 | | 3,658,285 |
5% 9/1/40 | EUR | 2,440,000 | | 2,485,074 |
Japan Government: | | | | |
0.2% 7/15/12 | JPY | 408,000,000 | | 5,303,311 |
1.1% 6/20/20 | JPY | 553,500,000 | | 7,375,088 |
1.8% 6/20/18 | JPY | 395,000,000 | | 5,554,286 |
1.9% 9/20/30 | JPY | 290,000,000 | | 3,884,101 |
2% 9/20/40 | JPY | 41,000,000 | | 543,732 |
Jordanian Kingdom 3.875% 11/12/15 | | 200,000 | | 188,500 |
Lebanese Republic: | | | | |
4% 12/31/17 | | 1,008,000 | | 995,400 |
5.15% 11/12/18 | | 150,000 | | 148,500 |
Lithuanian Republic: | | | | |
5.125% 9/14/17 (f) | | 140,000 | | 137,200 |
6.125% 3/9/21 (f) | | 415,000 | | 415,540 |
6.75% 1/15/15 (f) | | 210,000 | | 219,450 |
7.375% 2/11/20 (f) | | 400,000 | | 434,000 |
Namibia Republic of 5.5% 11/3/21 (f) | | 330,000 | | 335,775 |
Peruvian Republic: | | | | |
3% 3/7/27 (e) | | 510,000 | | 438,600 |
5.625% 11/18/50 | | 355,000 | | 385,175 |
7.35% 7/21/25 | | 320,000 | | 424,800 |
8.75% 11/21/33 | | 735,000 | | 1,122,713 |
Philippine Republic: | | | | |
6.375% 1/15/32 | | 170,000 | | 201,246 |
6.5% 1/20/20 | | 250,000 | | 298,750 |
7.5% 9/25/24 | | 100,000 | | 127,000 |
Foreign Government and Government Agency Obligations - continued |
| Principal Amount (d) | | Value |
Philippine Republic: - continued | | | | |
7.75% 1/14/31 | | $ 315,000 | | $ 422,100 |
9.5% 2/2/30 | | 710,000 | | 1,090,773 |
9.875% 1/15/19 | | 245,000 | | 339,938 |
10.625% 3/16/25 | | 580,000 | | 913,500 |
Polish Government: | | | | |
3.875% 7/16/15 | | 185,000 | | 186,850 |
5.125% 4/21/21 | | 315,000 | | 320,103 |
6.375% 7/15/19 | | 700,000 | | 777,000 |
Provincia de Cordoba 12.375% 8/17/17 (f) | | 515,000 | | 432,600 |
Provincia de Neuquen Argentina 7.875% 4/26/21 (f) | | 200,000 | | 202,000 |
Republic of Iraq 5.8% 1/15/28 (Reg. S) | | 1,500,000 | | 1,230,000 |
Republic of Nigeria 6.75% 1/28/21 (f) | | 355,000 | | 369,200 |
Republic of Senegal 8.75% 5/13/21 (f) | | 235,000 | | 232,650 |
Republic of Serbia 6.75% 11/1/24 (f) | | 2,699,667 | | 2,537,687 |
Russian Federation: | | | | |
3.625% 4/29/15 (f) | | 500,000 | | 504,000 |
7.5% 3/31/30 (Reg. S) | | 5,719,750 | | 6,642,346 |
11% 7/24/18 (Reg. S) | | 270,000 | | 368,550 |
12.75% 6/24/28 (Reg. S) | | 985,000 | | 1,679,425 |
State of Qatar: | | | | |
3.125% 1/20/17 (f) | | 355,000 | | 358,550 |
5.75% 1/20/42 (f) | | 295,000 | | 318,600 |
Turkish Republic: | | | | |
0% 2/20/13 | TRY | 1,005,000 | | 471,897 |
5.125% 3/25/22 | | 285,000 | | 272,175 |
5.625% 3/30/21 | | 365,000 | | 367,738 |
6% 1/14/41 | | 200,000 | | 188,760 |
6.75% 4/3/18 | | 630,000 | | 686,700 |
6.75% 5/30/40 | | 555,000 | | 571,650 |
6.875% 3/17/36 | | 1,165,000 | | 1,211,600 |
7% 9/26/16 | | 590,000 | | 647,820 |
7.25% 3/15/15 | | 380,000 | | 413,630 |
7.25% 3/5/38 | | 775,000 | | 844,750 |
7.375% 2/5/25 | | 1,150,000 | | 1,298,120 |
7.5% 7/14/17 | | 725,000 | | 816,568 |
7.5% 11/7/19 | | 475,000 | | 539,743 |
11.875% 1/15/30 | | 520,000 | | 847,600 |
Ukraine Financing of Infrastructure Projects State Enterprise 8.375% 11/3/17 (f) | | 655,000 | | 543,650 |
Ukraine Government: | | | | |
6.25% 6/17/16 (f) | | 705,000 | | 616,875 |
6.385% 6/26/12 (f) | | 2,005,000 | | 1,984,950 |
6.75% 11/14/17 (f) | | 485,000 | | 417,100 |
6.875% 9/23/15 (f) | | 565,000 | | 507,088 |
7.65% 6/11/13 (f) | | 1,025,000 | | 985,333 |
|
| Principal Amount (d) | | Value |
7.75% 9/23/20 (f) | | $ 340,000 | | $ 294,100 |
7.95% 2/23/21 (f) | | 400,000 | | 351,000 |
United Arab Emirates 7.75% 10/5/20 (Reg. S) | | 190,000 | | 200,450 |
United Kingdom, Great Britain and Northern Ireland: | | | | |
2% 1/22/16 | GBP | 3,195,000 | | 5,209,735 |
3.75% 9/7/21 | GBP | 3,825,000 | | 6,870,950 |
4.25% 12/7/40 | GBP | 3,710,000 | | 7,093,252 |
United Mexican States: | | | | |
5.125% 1/15/20 | | 610,000 | | 698,450 |
5.625% 1/15/17 | | 380,000 | | 436,050 |
5.75% 10/12/2110 | | 504,000 | | 536,760 |
5.95% 3/19/19 | | 398,000 | | 473,023 |
6.05% 1/11/40 | | 1,062,000 | | 1,298,295 |
6.5% 6/10/21 | MXN | 6,560,000 | | 474,746 |
6.75% 9/27/34 | | 775,000 | | 1,013,313 |
7.5% 4/8/33 | | 285,000 | | 400,425 |
8.3% 8/15/31 | | 250,000 | | 374,375 |
Uruguay Republic: | | | | |
7.875% 1/15/33 pay-in-kind | | 425,001 | | 593,939 |
8% 11/18/22 | | 484,628 | | 662,729 |
Venezuelan Republic: | | | | |
oil recovery rights 4/15/20 (o) | | 8,986 | | 244,869 |
6% 12/9/20 | | 465,000 | | 283,650 |
7% 3/31/38 | | 460,000 | | 265,650 |
7.75% 10/13/19 (Reg. S) | | 700,000 | | 500,500 |
8.5% 10/8/14 | | 445,000 | | 413,850 |
9% 5/7/23 (Reg. S) | | 1,835,000 | | 1,293,675 |
9.25% 9/15/27 | | 1,250,000 | | 900,000 |
9.25% 5/7/28 (Reg. S) | | 810,000 | | 560,925 |
9.375% 1/13/34 | | 665,000 | | 457,188 |
10.75% 9/19/13 | | 745,000 | | 752,450 |
11.75% 10/21/26 (Reg. S) | | 800,000 | | 662,000 |
11.95% 8/5/31 (Reg. S) | | 1,430,000 | | 1,172,600 |
12.75% 8/23/22 | | 2,180,000 | | 1,967,450 |
13.625% 8/15/18 | | 496,000 | | 486,080 |
Vietnamese Socialist Republic: | | | | |
1.3258% 3/12/16 (k) | | 238,696 | | 202,891 |
4% 3/12/28 (e) | | 1,150,000 | | 943,000 |
6.75% 1/29/20 (f) | | 170,000 | | 170,850 |
6.875% 1/15/16 (f) | | 780,000 | | 803,400 |
TOTAL FOREIGN GOVERNMENT AND GOVERNMENT AGENCY OBLIGATIONS (Cost $222,287,637) |
226,088,988
|
Common Stocks - 0.3% |
| Shares | | Value |
CONSUMER DISCRETIONARY - 0.0% |
Auto Components - 0.0% |
Remy International, Inc. (a) | 6,195 | | $ 103,767 |
Automobiles - 0.0% |
General Motors Co. (a) | 503 | | 10,196 |
General Motors Co.: | | | |
warrants 7/10/16 (a) | 10,197 | | 119,611 |
warrants 7/10/19 (a) | 10,197 | | 79,741 |
| | 209,548 |
Media - 0.0% |
Haights Cross Communications, Inc. (a) | 107 | | 793 |
Haights Cross Communications, Inc. warrants 3/11/13 (a) | 148 | | 50 |
HMH Holdings, Inc. (a)(q) | 170,789 | | 42,697 |
HMH Holdings, Inc. warrants 3/9/17 (a)(q) | 40,350 | | 0 |
RDA Holding Co. warrants 2/19/14 (a)(q) | 510 | | 0 |
| | 43,540 |
TOTAL CONSUMER DISCRETIONARY | | 356,855 |
INDUSTRIALS - 0.1% |
Aerospace & Defense - 0.0% |
Alion Science & Technology Corp. warrants 3/15/17 (a) | 115 | | 575 |
Airlines - 0.0% |
Delta Air Lines, Inc. (a) | 1,150 | | 9,304 |
Building Products - 0.0% |
Nortek, Inc. (a) | 16,991 | | 444,485 |
Nortek, Inc. warrants 12/7/14 (a) | 524 | | 1,415 |
| | 445,900 |
Marine - 0.0% |
US Shipping Partners Corp. (a) | 644 | | 0 |
US Shipping Partners Corp. warrants 12/31/29 (a) | 6,028 | | 0 |
Trading Companies & Distributors - 0.0% |
Penhall Acquisition Co.: | | | |
Class A | 321 | | 25,680 |
Class B (a) | 107 | | 8,560 |
| | 34,240 |
Transportation Infrastructure - 0.1% |
DeepOcean Group Holding A/S (f) | 31,897 | | 506,713 |
TOTAL INDUSTRIALS | | 996,732 |
|
| Shares | | Value |
INFORMATION TECHNOLOGY - 0.0% |
Semiconductors & Semiconductor Equipment - 0.0% |
MagnaChip Semiconductor Corp. | 2,669 | | $ 19,964 |
Spansion, Inc. Class A (a) | 366 | | 3,030 |
| | 22,994 |
MATERIALS - 0.2% |
Chemicals - 0.1% |
Chemtura Corp. (a) | 7,820 | | 88,679 |
Georgia Gulf Corp. (a) | 13,526 | | 263,622 |
LyondellBasell Industries NV Class A | 21,859 | | 710,199 |
Tronox, Inc. | 448 | | 48,384 |
| | 1,110,884 |
Containers & Packaging - 0.0% |
Rock-Tenn Co. Class A | 303 | | 17,483 |
Metals & Mining - 0.1% |
Aleris International, Inc. (a)(q) | 2,037 | | 112,035 |
Rathgibson Acquisition Co. LLC
Class A (a)(q) | 11,562 | | 185,339 |
| | 297,374 |
TOTAL MATERIALS | | 1,425,741 |
UTILITIES - 0.0% |
Electric Utilities - 0.0% |
Portland General Electric Co. | 140 | | 3,541 |
TOTAL COMMON STOCKS (Cost $5,421,810) |
2,805,863
|
Preferred Stocks - 0.2% |
| | | |
Convertible Preferred Stocks - 0.1% |
CONSUMER DISCRETIONARY - 0.1% |
Automobiles - 0.1% |
General Motors Co. 4.75% | 19,735 | | 675,924 |
Media - 0.0% |
Interpublic Group of Companies, Inc. 5.25% | 300 | | 285,228 |
TOTAL CONSUMER DISCRETIONARY | | 961,152 |
Nonconvertible Preferred Stocks - 0.1% |
FINANCIALS - 0.1% |
Consumer Finance - 0.1% |
GMAC LLC 7.00% (f) | 1,542 | | 1,087,110 |
TOTAL PREFERRED STOCKS (Cost $2,130,568) |
2,048,262
|
Floating Rate Loans - 4.2% |
| Principal Amount | | Value |
CONSUMER DISCRETIONARY - 0.5% |
Diversified Consumer Services - 0.0% |
ServiceMaster Co.: | | | | |
term loan 2.8342% 7/24/14 (k) | | $ 394,184 | | $ 376,445 |
Tranche DD, term loan 2.8% 7/24/14 (k) | | 40,601 | | 38,774 |
| | 415,219 |
Hotels, Restaurants & Leisure - 0.0% |
Mesquite Gaming LLC term loan 8.5% 8/1/15 (k) | | 15,000 | | 12,750 |
Leisure Equipment & Products - 0.1% |
SRAM LLC.: | | | | |
2nd LN, term loan 8.5% 12/7/18 (k) | | 135,000 | | 134,325 |
Tranche B 1LN, term loan 4.7635% 6/7/18 (k) | | 409,231 | | 407,185 |
| | 541,510 |
Media - 0.1% |
Charter Communications Operating LLC Tranche B 1LN, term loan 2.3% 3/6/14 (k) | | 24,734 | | 24,549 |
PRIMEDIA, Inc. Tranche B, term loan 7.5% 1/13/18 (k) | | 683,283 | | 608,122 |
UPC Broadband Holding BV Tranche AB, term loan 4.75% 12/31/17 (k) | | 555,000 | | 543,900 |
| | 1,176,571 |
Specialty Retail - 0.3% |
Burlington Coat Factory Warehouse Corp. Tranche B, term loan 6.25% 2/23/17 (k) | | 1,945,500 | | 1,906,590 |
Michaels Stores, Inc. Tranche B1, term loan 2.765% 10/31/13 (k) | | 812,677 | | 800,487 |
| | 2,707,077 |
TOTAL CONSUMER DISCRETIONARY | | 4,853,127 |
CONSUMER STAPLES - 0.6% |
Food & Staples Retailing - 0.3% |
BJ's Wholesale Club, Inc. Tranche B 1LN, term loan 7% 9/30/18 (k) | | 1,670,000 | | 1,674,175 |
The Great Atlantic & Pacific Tea Co. Tranche 2 LN, term loan 8.75% 6/14/12 (k) | | 210,000 | | 210,525 |
U.S. Foodservice term loan 5.75% 3/31/17 (k) | | 744,375 | | 714,600 |
| | 2,599,300 |
Personal Products - 0.0% |
Revlon Consumer Products Corp. term loan 4.75% 11/19/17 (k) | | 437,800 | | 431,233 |
|
| Principal Amount | | Value |
Tobacco - 0.3% |
Reynolds Consumer Products Holdings, Inc. Tranche E, term loan 6.5% 2/9/18 (k) | | $ 3,398,312 | | $ 3,381,320 |
TOTAL CONSUMER STAPLES | | 6,411,853 |
FINANCIALS - 0.2% |
Diversified Financial Services - 0.1% |
Goodman Global Group, Inc. Tranche 1 LN, term loan 5.75% 10/28/16 (k) | | 330,446 | | 328,381 |
IASIS Healthcare LLC Tranche B, term loan 5% 5/3/18 (k) | | 792,105 | | 762,401 |
| | 1,090,782 |
Real Estate Management & Development - 0.1% |
Realogy Corp.: | | | | |
Credit-Linked Deposit 3.1911% 10/10/13 (k) | | 25,601 | | 23,745 |
Credit-Linked Deposit 4.4933% 10/10/16 (k) | | 62,915 | | 55,837 |
term loan 4.6914% 10/10/16 (k) | | 905,018 | | 803,203 |
Tranche B, term loan 3.4414% 10/10/13 (k) | | 266,489 | | 247,169 |
Tranche DD, term loan 3.4414% 10/10/13 (k) | | 78,268 | | 72,594 |
| | 1,202,548 |
TOTAL FINANCIALS | | 2,293,330 |
HEALTH CARE - 0.7% |
Health Care Equipment & Supplies - 0.1% |
Kinetic Concepts, Inc. Tranche B-1, term loan 7% 5/4/18 (k) | | 520,000 | | 525,200 |
Health Care Providers & Services - 0.5% |
DaVita, Inc. Tranche A, term loan 2.8% 10/20/15 (k) | | 672,896 | | 664,485 |
Emergency Medical Services Corp. Tranche B, term loan 5.25% 5/25/18 (k) | | 1,328,977 | | 1,295,753 |
Quintiles Transnational Corp. Tranche B, term loan 5% 6/8/18 (k) | | 2,890,475 | | 2,839,863 |
Sunquest Information Systems, Inc. Tranche 1 LN, term loan 6.25% 12/16/16 (k) | | 218,900 | | 216,711 |
| | 5,016,812 |
Life Sciences Tools & Services - 0.1% |
Pharmaceutical Product Development, Inc. Tranche B, term loan 6.25% 12/5/18 (k) | | 1,260,000 | | 1,256,850 |
TOTAL HEALTH CARE | | 6,798,862 |
Floating Rate Loans - continued |
| Principal Amount | | Value |
INDUSTRIALS - 0.6% |
Aerospace & Defense - 0.0% |
TransDigm, Inc. Tranche B, term loan 4% 2/14/17 (k) | | $ 148,500 | | $ 147,015 |
Airlines - 0.2% |
Northwest Airlines Corp. Tranche A, term loan 2.33% 12/31/18 (k) | | 726,292 | | 675,451 |
United Air Lines, Inc. Tranche B, term loan 2.3125% 2/1/14 (k) | | 771,771 | | 740,900 |
US Airways Group, Inc. term loan 2.7963% 3/23/14 (k) | | 862,915 | | 748,579 |
| | 2,164,930 |
Commercial Services & Supplies - 0.1% |
KAR Auction Services, Inc. Tranche B, term loan 5% 5/19/17 (k) | | 437,800 | | 432,328 |
Construction & Engineering - 0.1% |
Drumm Investors LLC Tranche B, term loan 5% 5/4/18 (k) | | 1,402,782 | | 1,227,434 |
Electrical Equipment - 0.0% |
Sensata Technologies BV Tranche B, term loan 4% 5/12/18 (k) | | 99,500 | | 98,505 |
Industrial Conglomerates - 0.2% |
Sequa Corp. term loan 3.634% 12/3/14 (k) | | 929,534 | | 906,295 |
Tomkins PLC Tranche B, term loan 4.25% 9/21/16 (k) | | 759,657 | | 756,809 |
| | 1,663,104 |
Road & Rail - 0.0% |
Swift Transportation Co. LLC Tranche B, term loan 6% 12/21/16 (k) | | 283,949 | | 283,949 |
Transportation Infrastructure - 0.0% |
Trico Shipping A/S: | | | | |
Tranche A, term loan 10% 5/13/14 (k) | | 50,040 | | 49,853 |
Tranche D, term loan 5/13/14 (r) | | 88,104 | | 87,774 |
| | 137,627 |
TOTAL INDUSTRIALS | | 6,154,892 |
INFORMATION TECHNOLOGY - 0.4% |
Communications Equipment - 0.0% |
CommScope, Inc. Tranche B, term loan 5% 1/14/18 (k) | | 84,363 | | 83,097 |
Electronic Equipment & Components - 0.1% |
Aeroflex, Inc. Tranche B, term loan 4.25% 5/9/18 (k) | | 263,675 | | 244,559 |
Flextronics International Ltd.: | | | | |
Tranche B A1, term loan 2.5463% 10/1/14 (k) | | 56,069 | | 54,948 |
|
| Principal Amount | | Value |
Tranche B A2, term loan 2.5463% 10/1/14 (k) | | $ 133,659 | | $ 130,986 |
Tranche B A3, term loan 2.5202% 10/1/14 (k) | | 155,935 | | 152,817 |
Tranche B-A, term loan 2.5218% 10/1/14 (k) | | 195,121 | | 191,219 |
| | 774,529 |
Semiconductors & Semiconductor Equipment - 0.2% |
Freescale Semiconductor, Inc. term loan 4.5202% 12/1/16 (k) | | 1,358,297 | | 1,290,382 |
NXP BV: | | | | |
term loan 4.5% 3/4/17 (k) | | 521,063 | | 495,009 |
Tranche A 2LN, term loan 5.5% 3/4/17 (k) | | 693,263 | | 668,998 |
| | 2,454,389 |
Software - 0.1% |
Kronos, Inc.: | | | | |
Tranche B 1LN, term loan 5.3292% 6/11/17 (k) | | 531,185 | | 515,250 |
Tranche B 2LN, term loan 10.5792% 6/11/18 (k) | | 125,000 | | 122,500 |
| | 637,750 |
TOTAL INFORMATION TECHNOLOGY | | 3,949,765 |
MATERIALS - 0.2% |
Construction Materials - 0.1% |
Fairmount Minerals Ltd. Tranche B, term loan 5.25% 3/15/17 (k) | | 702,150 | | 698,639 |
Containers & Packaging - 0.1% |
Berry Plastics Holding Corp. Tranche C, term loan 2.2783% 4/3/15 (k) | | 1,397,153 | | 1,334,281 |
Metals & Mining - 0.0% |
Walter Energy, Inc. Tranche B, term loan 4% 4/1/18 (k) | | 128,555 | | 127,591 |
TOTAL MATERIALS | | 2,160,511 |
TELECOMMUNICATION SERVICES - 0.3% |
Wireless Telecommunication Services - 0.3% |
Asurion LLC term loan 9% 5/24/19 (k) | | 765,000 | | 753,525 |
Digicel International Finance Ltd. term loan 3.125% 3/30/12 (k) | | 400,192 | | 398,191 |
Intelsat Jackson Holdings SA: | | | | |
term loan 3.3911% 2/1/14 (k) | | 495,000 | | 470,250 |
Tranche B, term loan 5.25% 4/2/18 (k) | | 1,009,568 | | 1,007,044 |
| | 2,629,010 |
Floating Rate Loans - continued |
| Principal Amount | | Value |
UTILITIES - 0.7% |
Electric Utilities - 0.6% |
Texas Competitive Electric Holdings Co. LLC/Texas Competitive Electric Holdings Finance, Inc. Tranche B, term loan 4.7763% 10/10/17 (k) | | $ 8,839,235 | | $ 5,601,865 |
Independent Power Producers & Energy Traders - 0.1% |
Calpine Corp. Tranche B, term loan 4.5% 4/1/18 (k) | | 454,146 | | 445,063 |
The AES Corp. Tranche B, term loan 4.25% 5/27/18 (k) | | 878,575 | | 877,521 |
| | 1,322,584 |
TOTAL UTILITIES | | 6,924,449 |
TOTAL FLOATING RATE LOANS (Cost $43,520,354) |
42,175,799
|
Sovereign Loan Participations - 0.1% |
|
Indonesian Republic loan participation: | | | | |
Citibank 1.25% 12/14/19 (k) | 419,168 | | 394,018 |
Goldman Sachs 1.25% 12/14/19 (k) | 604,444 | | 568,178 |
0% 12/14/19 (k) | 150,346 | | 141,326 |
TOTAL SOVEREIGN LOAN PARTICIPATIONS (Cost $1,042,878) |
1,103,522
|
Fixed-Income Funds - 1.2% |
| Shares | | |
Fidelity Floating Rate Central Fund (l)
(Cost $10,367,350) | 124,008 | |
12,189,986
|
Preferred Securities - 0.3% |
| Principal Amount | | |
CONSUMER DISCRETIONARY - 0.1% |
Media - 0.1% |
Globo Comunicacoes e Participacoes SA 6.25% (e)(f)(g) | $ 925,000 | | 983,874 |
FINANCIALS - 0.1% |
Commercial Banks - 0.0% |
Wells Fargo & Co. 7.98% (g)(k) | 135,000 | | 147,309 |
Diversified Financial Services - 0.1% |
Bank of America Corp.: | | | |
8% (g)(k) | 525,000 | | 469,190 |
8.125% (g)(k) | 280,000 | | 246,538 |
| | 715,728 |
TOTAL FINANCIALS | | 863,037 |
|
| Principal Amount | | Value |
MATERIALS - 0.1% |
Metals & Mining - 0.1% |
CSN Islands XII Corp. 7%
(Reg. S) (g) | $ 720,000 | | $ 692,446 |
TOTAL PREFERRED SECURITIES (Cost $2,448,794) |
2,539,357
|
Other - 0.0% |
| Shares | | |
Other - 0.0% |
Idearc, Inc. Claim (a)
(Cost $1) | 108,228 | |
1
|
Money Market Funds - 9.1% |
| | | |
Fidelity Cash Central Fund, 0.11% (b)
(Cost $92,028,181) | 92,028,181 | |
92,028,181
|
TOTAL INVESTMENT PORTFOLIO - 100.1% (Cost $996,288,323) | | 1,008,790,815 |
NET OTHER ASSETS (LIABILITIES) - (0.1)% | | (895,485) |
NET ASSETS - 100% | $ 1,007,895,330 |
Futures Contracts |
| Expiration Date | | Underlying Face Amount at Value | | Unrealized Appreciation/(Depreciation) |
Purchased |
Treasury Contracts |
51 CBOT 2 Year U.S. Treasury Notes Contracts | March 2012 | | $ 11,247,891 | | $ 9,424 |
The face value of futures purchased as a percentage of net assets is 1.1% |
Currency Abbreviations |
BRL | - | Brazilian real |
CAD | - | Canadian dollar |
COP | - | Colombian peso |
EUR | - | European Monetary Unit |
GBP | - | British pound |
GHS | - | Ghana Cedi |
JPY | - | Japanese yen |
MXN | - | Mexican peso |
NGN | - | Nigerian naira |
TRY | - | New Turkish Lira |
Legend |
(a) Non-income producing |
(b) Affiliated fund that is available only to investment companies and other accounts managed by Fidelity Investments. The rate quoted is the annualized seven-day yield of the fund at period end. A complete unaudited listing of the fund's holdings as of its most recent quarter end is available upon request. In addition, each Fidelity Central Fund's financial statements, which are not covered by the Fund's Report of Independent Registered Public Accounting Firm, are available on the SEC's website or upon request. |
(c) Non-income producing - Security is in default. |
(d) Principal amount is stated in United States dollars unless otherwise noted. |
(e) Security initially issued at one coupon which converts to a higher coupon at a specified date. The rate shown is the rate at period end. |
(f) Security exempt from registration under Rule 144A of the Securities Act of 1933. These securities may be resold in transactions exempt from registration, normally to qualified institutional buyers. At the end of the period, the value of these securities amounted to $167,169,829 or 16.6% of net assets. |
(g) Security is perpetual in nature with no stated maturity date. |
(h) Under the Temporary Liquidity Guarantee Program, the Federal Deposit Insurance Corporation guarantees principal and interest in the event of payment default or bankruptcy until the earlier of maturity date of the debt or until June 30, 2012. At the end of the period these securities amounted to $9,737,761 or 1.0% of net assets. |
(i) Security or a portion of the security purchased on a delayed delivery or when-issued basis. |
(j) Security or a portion of the security was pledged to cover margin requirements for futures contracts. At the period end, the value of securities pledged amounted to $64,378. |
(k) Coupon rates for floating and adjustable rate securities reflect the rates in effect at period end. |
(l) Affiliated fund that is available only to investment companies and other accounts managed by Fidelity Investments. A complete unaudited schedule of portfolio holdings for each Fidelity Central Fund is filed with the SEC for the first and third quarters of each fiscal year on Form N-Q and is available upon request or at the SEC's web site at www.sec.gov. An unaudited holdings listing for the Fund, which presents direct holdings as well as the pro rata share of securities and other investments held indirectly through its investment in underlying non-money market Fidelity Central Funds, is available at advisor.fidelity.com. In addition, each Fidelity Central Fund's financial statements, which are not covered by the Fund's Report of Independent Registered Public Accounting Firm, are available on the SEC's web site or upon request. |
(m) Security represents right to receive monthly interest payments on an underlying pool of mortgages or assets. Principal shown is the outstanding par amount of the pool as of the end of the period. |
(n) Principal Only Strips represent the right to receive the monthly principal payments on an underlying pool of mortgage loans. |
(o) Quantity represents share amount. |
(p) Represents an investment in an underlying pool of reverse mortgages which typically do not require regular principal and interest payments as repayment is deferred until a maturity event. |
(q) Restricted securities - Investment in securities not registered under the Securities Act of 1933 (excluding 144A issues). At the end of the period, the value of restricted securities (excluding 144A issues) amounted to $340,071 or 0.0% of net assets. |
Additional information on each restricted holding is as follows: |
Security | Acquisition Date | Acquisition Cost |
Aleris International, Inc. | 6/1/10 | $ 71,295 |
HMH Holdings, Inc. | 5/2/08 - 3/9/10 | $ 2,699,304 |
HMH Holdings, Inc. warrants 3/9/17 | 3/9/10 | $ 11,701 |
Rathgibson Acquisition Co. LLC
Class A | 6/9/10 | $ 61,360 |
RDA Holding Co. warrants 2/19/14 | 2/27/07 | $ 160,000 |
(r) Position represents an unfunded loan commitment. At period end, the total principal amount and market value of unfunded commitments totaled $88,104 and $87,774, respectively. The coupon rate will be determined at time of settlement. |
Affiliated Central Funds |
Information regarding fiscal year to date income earned by the Fund from investments in Fidelity Central Funds is as follows: |
Fund | Income earned |
Fidelity Cash Central Fund | $ 89,757 |
Fidelity Floating Rate Central Fund | 858,903 |
Total | $ 948,660 |
Additional information regarding the Fund's fiscal year to date purchases and sales, including the ownership percentage, of the non Money Market Central Funds is as follows: |
Fund | Value, beginning of period | Purchases | Sales
Proceeds | Value,
end of
period | % ownership, end of
period |
Fidelity Floating Rate Central Fund | $ 23,496,730 | $ - | $ 11,119,741 | $ 12,189,986 | 0.4% |
Other Information |
The following is a summary of the inputs used, as of December 31, 2011, involving the Fund's assets and liabilities carried at fair value. The inputs or methodology used for valuing securities may not be an indication of the risk associated with investing in those securities. For more information on valuation inputs, and their aggregation into the levels used in the tables below, please refer to the Security Valuation section in the accompanying Notes to Financial Statements. |
Valuation Inputs at Reporting Date: |
Description | Total | Level 1 | Level 2 | Level 3 |
Investments in Securities: | | | | |
Equities: | | | | |
Consumer Discretionary | $ 1,318,007 | $ 989,239 | $ 327,925 | $ 843 |
Financials | 1,087,110 | - | 1,087,110 | - |
Industrials | 996,732 | 453,789 | - | 542,943 |
Information Technology | 22,994 | 22,994 | - | - |
Materials | 1,425,741 | 1,079,983 | 48,384 | 297,374 |
Utilities | 3,541 | 3,541 | - | - |
Corporate Bonds | 343,422,571 | - | 340,496,277 | 2,926,294 |
U.S. Government and Government Agency Obligations | 234,245,257 | - | 234,245,257 | - |
U.S. Government Agency - Mortgage Securities | 15,115,418 | - | 15,115,418 | - |
Collateralized Mortgage Obligations | 34,889,463 | - | 34,889,463 | - |
Commercial Mortgage Securities | 138,147 | - | 138,147 | - |
Foreign Government and Government Agency Obligations | 226,088,988 | - | 225,202,628 | 886,360 |
Floating Rate Loans | 42,175,799 | - | 42,163,049 | 12,750 |
Sovereign Loan Participations | 1,103,522 | - | - | 1,103,522 |
Fixed-Income Funds | 12,189,986 | 12,189,986 | - | - |
Preferred Securities | 2,539,357 | - | 2,539,357 | - |
Other | 1 | - | - | 1 |
Money Market Funds | 92,028,181 | 92,028,181 | - | - |
Total Investments in Securities: | $ 1,008,790,815 | $ 106,767,713 | $ 896,253,015 | $ 5,770,087 |
Derivative Instruments: | | | | |
Assets | | | | |
Futures Contracts | $ 9,424 | $ 9,424 | $ - | $ - |
The following is a reconciliation of Investments in Securities for which Level 3 inputs were used in determining value: |
Investments in Securities: | |
Beginning Balance | $ 665,619 |
Total Realized Gain (Loss) | (35,466) |
Total Unrealized Gain (Loss) | 73,354 |
Cost of Purchases | 2,243,332 |
Proceeds of Sales | (1,595,376) |
Amortization/Accretion | 163,271 |
Transfers in to Level 3 | 4,255,353 |
Transfers out of Level 3 | - |
Ending Balance | $ 5,770,087 |
The change in unrealized gain (loss) for the period attributable to Level 3 securities held at December 31, 2011 | $ (253,060) |
The information used in the above reconciliation represents fiscal year to date activity for any Investments in Securities identified as using Level 3 inputs at either the beginning or the end of the current fiscal period. Transfers in or out of Level 3 represent the beginning value of any Security or Instrument where a change in the pricing level occurred from the beginning to the end of the period. The cost of purchases and the proceeds of sales may include securities received or delivered through corporate actions or exchanges. Realized and unrealized gains (losses) disclosed in the reconciliation are included in Net Gain (Loss) on the Fund's Statement of Operations. |
Value of Derivative Instruments |
The following table is a summary of the Fund's value of derivative instruments by risk exposure as of December 31, 2011. For additional information on derivative instruments, please refer to the Derivative Instruments section in the accompanying Notes to Financial Statements. |
Risk Exposure /
Derivative Type | Value |
| Asset | Liability |
Interest Rate Risk | | |
Futures Contracts (a) | $ 9,424 | $ - |
Total Value of Derivatives | $ 9,424 | $ - |
(a) Reflects cumulative appreciation/(depreciation) on futures contracts as disclosed on the Schedule of Investments. Only the period end variation margin is separately disclosed on the Statement of Assets and Liabilities. |
Distribution of investments by country of issue, as a percentage of total net assets, is as follows: (Unaudited) |
United States of America | 66.5% |
Netherlands | 3.4% |
Canada | 2.9% |
United Kingdom | 2.4% |
Japan | 2.3% |
Germany | 2.3% |
Venezuela | 2.1% |
Luxembourg | 1.6% |
Mexico | 1.6% |
Italy | 1.5% |
Bermuda | 1.2% |
Turkey | 1.2% |
France | 1.2% |
Russia | 1.1% |
Others (Individually Less Than 1%) | 8.7% |
| 100.0% |
The information in the above table is based on the combined investments of the Fund and its pro-rata share of its investments in each non-money market Fidelity Central Fund. |
See accompanying notes which are an integral part of the financial statements.
Annual Report
Statement of Assets and Liabilities
| December 31, 2011 |
Assets | | |
Investment in securities, at value - See accompanying schedule: Unaffiliated issuers (cost $893,892,792) | $ 904,572,648 | |
Fidelity Central Funds (cost $102,395,531) | 104,218,167 | |
Total Investments (cost $996,288,323) | | $ 1,008,790,815 |
Cash | | 213,997 |
Foreign currency held at value (cost $15,448) | | 15,448 |
Receivable for investments sold | | 10,961,965 |
Receivable for fund shares sold | | 1,029,412 |
Dividends receivable | | 15,968 |
Interest receivable | | 11,589,229 |
Distributions receivable from Fidelity Central Funds | | 59,914 |
Receivable for daily variation margin on futures contracts | | 3,985 |
Prepaid expenses | | 2,517 |
Other receivables | | 22 |
Total assets | | 1,032,683,272 |
| | |
Liabilities | | |
Payable for investments purchased
Regular delivery | $ 17,478,273 | |
Delayed delivery | 6,252,021 | |
Payable for fund shares redeemed | 393,586 | |
Accrued management fee | 475,594 | |
Distribution and service plan fees payable | 5,364 | |
Other affiliated payables | 108,546 | |
Other payables and accrued expenses | 74,558 | |
Total liabilities | | 24,787,942 |
| | |
Net Assets | | $ 1,007,895,330 |
Net Assets consist of: | | |
Paid in capital | | $ 992,013,313 |
Undistributed net investment income | | 4,146,582 |
Accumulated undistributed net realized gain (loss) on investments and foreign currency transactions | | (627,714) |
Net unrealized appreciation (depreciation) on investments and assets and liabilities in foreign currencies | | 12,363,149 |
Net Assets | | $ 1,007,895,330 |
Statement of Assets and Liabilities - continued
| December 31, 2011 |
Initial Class:
Net Asset Value, offering price and redemption price per share ($164,168,227 ÷ 14,724,343 shares) | | $ 11.15 |
| | |
Service Class:
Net Asset Value, offering price and redemption price per share ($882,837 ÷ 79,242 shares) | | $ 11.14 |
| | |
Service Class 2:
Net Asset Value, offering price and redemption price per share ($25,652,408 ÷ 2,309,498 shares) | | $ 11.11 |
| | |
Investor Class:
Net Asset Value, offering price and redemption price per share ($817,191,858 ÷ 73,460,933 shares) | | $ 11.12 |
See accompanying notes which are an integral part of the financial statements.
Annual Report
Statement of Operations
| Year ended December 31, 2011 |
Investment Income | | |
Dividends | | $ 522,770 |
Interest | | 44,361,037 |
Income from Fidelity Central Funds | | 948,660 |
Total income | | 45,832,467 |
| | |
Expenses | | |
Management fee | $ 5,109,784 | |
Transfer agent fees | 892,241 | |
Distribution and service plan fees | 38,857 | |
Accounting fees and expenses | 328,943 | |
Custodian fees and expenses | 83,726 | |
Independent trustees' compensation | 3,185 | |
Audit | 76,389 | |
Legal | 8,271 | |
Miscellaneous | 7,846 | |
Total expenses before reductions | 6,549,242 | |
Expense reductions | (18,659) | 6,530,583 |
Net investment income (loss) | | 39,301,884 |
Realized and Unrealized Gain (Loss) Net realized gain (loss) on: | | |
Investment securities: | | |
Unaffiliated issuers | 14,132,279 | |
Fidelity Central Funds | 1,419,655 | |
Foreign currency transactions | 108,859 | |
Futures contracts | 67,301 | |
Swap agreements | (11,622) | |
Total net realized gain (loss) | | 15,716,472 |
Change in net unrealized appreciation (depreciation) on: Investment securities | (16,560,861) | |
Assets and liabilities in foreign currencies | (182,626) | |
Futures contracts | 9,424 | |
Swap agreements | 8,272 | |
Delayed delivery commitments | (6,952) | |
Total change in net unrealized appreciation (depreciation) | | (16,732,743) |
Net gain (loss) | | (1,016,271) |
Net increase (decrease) in net assets resulting from operations | | $ 38,285,613 |
Statement of Changes in Net Assets
| Year ended
December 31, 2011 | Year ended
December 31, 2010 |
Increase (Decrease) in Net Assets | | |
Operations | | |
Net investment income (loss) | $ 39,301,884 | $ 36,424,252 |
Net realized gain (loss) | 15,716,472 | 21,765,656 |
Change in net unrealized appreciation (depreciation) | (16,732,743) | 6,872,569 |
Net increase (decrease) in net assets resulting from operations | 38,285,613 | 65,062,477 |
Distributions to shareholders from net investment income | (40,878,892) | (33,691,781) |
Distributions to shareholders from net realized gain | (20,231,365) | (19,090,920) |
Total distributions | (61,110,257) | (52,782,701) |
Share transactions - net increase (decrease) | 238,355,290 | 133,480,969 |
Total increase (decrease) in net assets | 215,530,646 | 145,760,745 |
| | |
Net Assets | | |
Beginning of period | 792,364,684 | 646,603,939 |
End of period (including undistributed net investment income of $4,146,582 and undistributed net investment income of $6,863,011, respectively) | $ 1,007,895,330 | $ 792,364,684 |
See accompanying notes which are an integral part of the financial statements.
Annual Report
Financial Highlights - Initial Class
Years ended December 31, | 2011 | 2010 | 2009 | 2008 | 2007 |
Selected Per-Share Data | | | | | |
Net asset value, beginning of period | $ 11.36 | $ 11.11 | $ 8.94 | $ 10.63 | $ 10.70 |
Income from Investment Operations | | | | | |
Net investment income (loss) C | .511 | .588 | .619 | .583 | .600 |
Net realized and unrealized gain (loss) | .013 F | .473 | 2.065 | (1.670) | (.007) |
Total from investment operations | .524 | 1.061 | 2.684 | (1.087) | .593 |
Distributions from net investment income | (.486) | (.517) | (.439) | (.548) | (.523) |
Distributions from net realized gain | (.248) | (.294) | (.075) | (.055) | (.140) |
Total distributions | (.734) | (.811) | (.514) | (.603) | (.663) |
Net asset value, end of period | $ 11.15 | $ 11.36 | $ 11.11 | $ 8.94 | $ 10.63 |
Total Return A,B | 4.66% | 9.64% | 30.02% | (10.20)% | 5.59% |
Ratios to Average Net Assets D,G | | | | | |
Expenses before reductions | .69% | .71% | .74% | .73% | .73% |
Expenses net of fee waivers, if any | .69% | .70% | .74% | .73% | .73% |
Expenses net of all reductions | .69% | .70% | .74% | .72% | .73% |
Net investment income (loss) | 4.38% | 5.07% | 5.98% | 5.65% | 5.49% |
Supplemental Data | | | | | |
Net assets, end of period (000 omitted) | $ 164,168 | $ 154,861 | $ 166,898 | $ 99,114 | $ 119,524 |
Portfolio turnover rate E | 224% | 208% | 199% | 256% | 152% |
A Total returns do not reflect charges attributable to your insurance company's separate account. Inclusion of these charges would reduce the total returns shown.
B Total returns would have been lower if certain expenses had not been reduced during the applicable periods shown.
C Calculated based on average shares outstanding during the period.
D Fees and expenses of any underlying Fidelity Central Funds are not included in the Fund's expense ratio. The Fund indirectly bears its proportionate share of the expenses of any underlying Fidelity Central Funds.
E Amount does not include the portfolio activity of any underlying Fidelity Central Funds.
F The amount shown for a share outstanding does not correspond with the aggregate net gain (loss) on investments for the period due to the timing of sales and repurchases of shares in relation to fluctuating market values of the investments of the Fund.
G Expense ratios reflect operating expenses of the class. Expenses before reductions do not reflect amounts reimbursed by the investment adviser or reductions from brokerage service arrangements or reductions from other expense offset arrangements and do not represent the amount paid by the class during periods when reimbursements or reductions occur. Expenses net of fee waivers reflect expenses after reimbursement by the investment adviser but prior to reductions from brokerage service arrangements or other expense offset arrangements. Expenses net of all reductions represent the net expenses paid by the class.
Financial Highlights - Service Class
Years ended December 31, | 2011 | 2010 | 2009 | 2008 | 2007 |
Selected Per-Share Data | | | | | |
Net asset value, beginning of period | $ 11.35 | $ 11.10 | $ 8.92 | $ 10.61 | $ 10.68 |
Income from Investment Operations | | | | | |
Net investment income (loss) C | .499 | .574 | .594 | .574 | .588 |
Net realized and unrealized gain (loss) | .009 F | .469 | 2.083 | (1.676) | (.005) |
Total from investment operations | .508 | 1.043 | 2.677 | (1.102) | .583 |
Distributions from net investment income | (.470) | (.499) | (.422) | (.533) | (.513) |
Distributions from net realized gain | (.248) | (.294) | (.075) | (.055) | (.140) |
Total distributions | (.718) | (.793) | (.497) | (.588) | (.653) |
Net asset value, end of period | $ 11.14 | $ 11.35 | $ 11.10 | $ 8.92 | $ 10.61 |
Total Return A,B | 4.52% | 9.48% | 30.01% | (10.37)% | 5.51% |
Ratios to Average Net Assets D,G | | | | | |
Expenses before reductions | .80% | .81% | .84% | .82% | .83% |
Expenses net of fee waivers, if any | .80% | .81% | .84% | .82% | .83% |
Expenses net of all reductions | .80% | .81% | .84% | .82% | .82% |
Net investment income (loss) | 4.28% | 4.96% | 5.88% | 5.55% | 5.39% |
Supplemental Data | | | | | |
Net assets, end of period (000 omitted) | $ 883 | $ 1,199 | $ 1,898 | $ 2,644 | $ 4,445 |
Portfolio turnover rate E | 224% | 208% | 199% | 256% | 152% |
A Total returns do not reflect charges attributable to your insurance company's separate account. Inclusion of these charges would reduce the total returns shown.
B Total returns would have been lower if certain expenses had not been reduced during the applicable periods shown.
C Calculated based on average shares outstanding during the period.
D Fees and expenses of any underlying Fidelity Central Funds are not included in the Fund's expense ratio. The Fund indirectly bears its proportionate share of the expenses of any underlying Fidelity Central Funds.
E Amount does not include the portfolio activity of any underlying Fidelity Central Funds.
F The amount shown for a share outstanding does not correspond with the aggregate net gain (loss) on investments for the period due to the timing of sales and repurchases of shares in relation to fluctuating market values of the investments of the Fund.
G Expense ratios reflect operating expenses of the class. Expenses before reductions do not reflect amounts reimbursed by the investment adviser or reductions from brokerage service arrangements or reductions from other expense offset arrangements and do not represent the amount paid by the class during periods when reimbursements or reductions occur. Expenses net of fee waivers reflect expenses after reimbursement by the investment adviser but prior to reductions from brokerage service arrangements or other expense offset arrangements. Expenses net of all reductions represent the net expenses paid by the class.
See accompanying notes which are an integral part of the financial statements.
Annual Report
Financial Highlights - Service Class 2
Years ended December 31, | 2011 | 2010 | 2009 | 2008 | 2007 |
Selected Per-Share Data | | | | | |
Net asset value, beginning of period | $ 11.33 | $ 11.11 | $ 8.92 | $ 10.61 | $ 10.67 |
Income from Investment Operations | | | | | |
Net investment income (loss) C | .478 | .560 | .578 | .558 | .571 |
Net realized and unrealized gain (loss) | .021 F | .457 | 2.087 | (1.680) | .005 |
Total from investment operations | .499 | 1.017 | 2.665 | (1.122) | .576 |
Distributions from net investment income | (.471) | (.503) | (.400) | (.513) | (.496) |
Distributions from net realized gain | (.248) | (.294) | (.075) | (.055) | (.140) |
Total distributions | (.719) | (.797) | (.475) | (.568) | (.636) |
Net asset value, end of period | $ 11.11 | $ 11.33 | $ 11.11 | $ 8.92 | $ 10.61 |
Total Return A,B | 4.45% | 9.23% | 29.88% | (10.56)% | 5.45% |
Ratios to Average Net Assets D,G | | | | | |
Expenses before reductions | .95% | .97% | .99% | .98% | .98% |
Expenses net of fee waivers, if any | .94% | .96% | .99% | .98% | .98% |
Expenses net of all reductions | .94% | .96% | .99% | .97% | .97% |
Net investment income (loss) | 4.13% | 4.81% | 5.72% | 5.40% | 5.24% |
Supplemental Data | | | | | |
Net assets, end of period (000 omitted) | $ 25,652 | $ 7,599 | $ 1,918 | $ 2,625 | $ 4,418 |
Portfolio turnover rate E | 224% | 208% | 199% | 256% | 152% |
A Total returns do not reflect charges attributable to your insurance company's separate account. Inclusion of these charges would reduce the total returns shown.
B Total returns would have been lower if certain expenses had not been reduced during the applicable periods shown.
C Calculated based on average shares outstanding during the period.
D Fees and expenses of any underlying Fidelity Central Funds are not included in the Fund's expense ratio. The Fund indirectly bears its proportionate share of the expenses of any underlying Fidelity Central Funds.
E Amount does not include the portfolio activity of any underlying Fidelity Central Funds.
F The amount shown for a share outstanding does not correspond with the aggregate net gain (loss) on investments for the period due to the timing of sales and repurchases of shares in relation to fluctuating market values of the investments of the Fund.
G Expense ratios reflect operating expenses of the class. Expenses before reductions do not reflect amounts reimbursed by the investment adviser or reductions from brokerage service arrangements or reductions from other expense offset arrangements and do not represent the amount paid by the class during periods when reimbursements or reductions occur. Expenses net of fee waivers reflect expenses after reimbursement by the investment adviser but prior to reductions from brokerage service arrangements or other expense offset arrangements. Expenses net of all reductions represent the net expenses paid by the class.
Financial Highlights - Investor Class
Years ended December 31, | 2011 | 2010 | 2009 | 2008 | 2007 |
Selected Per-Share Data | | | | | |
Net asset value, beginning of period | $ 11.34 | $ 11.09 | $ 8.92 | $ 10.62 | $ 10.69 |
Income from Investment Operations | | | | | |
Net investment income (loss) C | .506 | .584 | .617 | .577 | .591 |
Net realized and unrealized gain (loss) | .005 F | .474 | 2.065 | (1.677) | (.003) |
Total from investment operations | .511 | 1.058 | 2.682 | (1.100) | .588 |
Distributions from net investment income | (.483) | (.514) | (.437) | (.545) | (.518) |
Distributions from net realized gain | (.248) | (.294) | (.075) | (.055) | (.140) |
Total distributions | (.731) | (.808) | (.512) | (.600) | (.658) |
Net asset value, end of period | $ 11.12 | $ 11.34 | $ 11.09 | $ 8.92 | $ 10.62 |
Total Return A,B | 4.55% | 9.63% | 30.06% | (10.34)% | 5.55% |
Ratios to Average Net Assets D,G | | | | | |
Expenses before reductions | .73% | .74% | .77% | .76% | .80% |
Expenses net of fee waivers, if any | .73% | .74% | .77% | .76% | .80% |
Expenses net of all reductions | .73% | .74% | .77% | .76% | .80% |
Net investment income (loss) | 4.35% | 5.03% | 5.95% | 5.61% | 5.41% |
Supplemental Data | | | | | |
Net assets, end of period (000 omitted) | $ 817,192 | $ 628,706 | $ 475,890 | $ 234,744 | $ 228,628 |
Portfolio turnover rate E | 224% | 208% | 199% | 256% | 152% |
A Total returns do not reflect charges attributable to your insurance company's separate account. Inclusion of these charges would reduce the total returns shown.
B Total returns would have been lower if certain expenses had not been reduced during the applicable periods shown.
C Calculated based on average shares outstanding during the period.
D Fees and expenses of any underlying Fidelity Central Funds are not included in the Fund's expense ratio. The Fund indirectly bears its proportionate share of the expenses of any underlying Fidelity Central Funds.
E Amount does not include the portfolio activity of any underlying Fidelity Central Funds.
F The amount shown for a share outstanding does not correspond with the aggregate net gain (loss) on investments for the period due to the timing of sales and repurchases of shares in relation to fluctuating market values of the investments of the Fund.
G Expense ratios reflect operating expenses of the class. Expenses before reductions do not reflect amounts reimbursed by the investment adviser or reductions from brokerage service arrangements or reductions from other expense offset arrangements and do not represent the amount paid by the class during periods when reimbursements or reductions occur. Expenses net of fee waivers reflect expenses after reimbursement by the investment adviser but prior to reductions from brokerage service arrangements or other expense offset arrangements. Expenses net of all reductions represent the net expenses paid by the class.
See accompanying notes which are an integral part of the financial statements.
Annual Report
Notes to Financial Statements
For the period ended December 31, 2011
1. Organization.
VIP Strategic Income Portfolio (the Fund) is a fund of Variable Insurance Products Fund V (the Trust) and is authorized to issue an unlimited number of shares. The Trust is registered under the Investment Company Act of 1940, as amended (the 1940 Act), as an open-end management investment company organized as a Massachusetts business trust. Shares of the Fund may only be purchased by insurance companies for the purpose of funding variable annuity or variable life insurance contracts. The Fund offers the following classes of shares: Initial Class shares, Service Class shares, Service Class 2 shares and Investor Class shares. All classes have equal rights and voting privileges, except for matters affecting a single class. Investment income, realized and unrealized capital gains and losses, the common expenses of the Fund, and certain fund-level expense reductions, if any, are allocated on a pro-rata basis to each class based on the relative net assets of each class to the total net assets of the Fund. Each class differs with respect to transfer agent and distribution and service plan fees incurred. Certain expense reductions may also differ by class.
2. Investments in Fidelity Central Funds.
The Fund invests in Fidelity Central Funds, which are open-end investment companies available only to other investment companies and accounts managed by Fidelity Management & Research Company (FMR) and its affiliates. The Fund's Schedule of Investments lists each of the Fidelity Central Funds held as of period end, if any, as an investment of the Fund, but do not include the underlying holdings of each Fidelity Central Fund. As an Investing Fund, the Fund indirectly bears its proportionate share of the expenses of the underlying Fidelity Central Funds.
Based on their investment objective, each Fidelity Central Fund may invest or participate in various investment vehicles or strategies that are similar to those of the Fund. These strategies are consistent with the investment objectives of the Fund and may involve certain economic risks which may cause a decline in value of each of the Fidelity Central Funds and thus a decline in the value of the Fund. The Money Market Central Funds seek preservation of capital and current income and are managed by Fidelity Investments Money Management, Inc. (FIMM), an affiliate of FMR. The following summarizes the Fund's investment in each Fidelity Central Fund.
Fidelity Central Fund | Investment Manager | Investment Objective | Investment Practices |
Fidelity Floating Rate Central Fund | FMR Co., Inc. (FMRC) | Seeks a high level of income by normally investing in floating rate loans and other floating rate securities. | Loans & Direct Debt Instruments Repurchase Agreements Restricted Securities |
An unaudited holdings listing for the Fund, which presents direct holdings as well as the pro-rata share of any securities and other investments held indirectly through its investment in underlying non-money market Fidelity Central Funds, is available at advisor.fidelity.com. A complete unaudited list of holdings for each Fidelity Central Fund is available upon request or at the Securities and Exchange Commission (the SEC) web site at www.sec.gov. In addition, the financial statements of the Fidelity Central Funds which contain the significant accounting policies (including security valuation policies) of those funds, which are not covered by the Fund's Report of Independent Registered Public Accounting Firm, are available on the SEC web site or upon request.
3. Significant Accounting Policies.
The financial statements have been prepared in conformity with accounting principles generally accepted in the United States of America (GAAP), which require management to make certain estimates and assumptions at the date of the financial statements. Actual results could differ from those estimates. Subsequent events, if any, through the date that the financial statements were issued have been evaluated in the preparation of the financial statements. The following summarizes the significant accounting policies of the Fund:
Security Valuation. Investments are valued as of 4:00 p.m. Eastern time on the last calendar day of the period. The Fund uses independent pricing services approved by the Board of Trustees to value its investments. When current market prices or quotations are not readily available or reliable, valuations may be determined in good faith in accordance with procedures adopted by the Board of Trustees. Factors used in determining value may include market or security specific events, changes in interest rates and credit quality. The frequency with which these procedures are used cannot be predicted and they may be utilized to a significant extent. The value used for net asset value (NAV) calculation under these procedures may differ from published prices for the same securities.
The Fund categorizes the inputs to valuation techniques used to value its investments into a disclosure hierarchy consisting of three levels as shown below:
Level 1 - quoted prices in active markets for identical investments
Level 2 - other significant observable inputs (including quoted prices for similar investments, interest rates, prepayment speeds, etc.)
Level 3 - unobservable inputs (including the Fund's own assumptions based on the best information available)
Annual Report
Notes to Financial Statements - continued
3. Significant Accounting Policies - continued
Security Valuation - continued
Changes in valuation techniques may result in transfers in or out of an assigned level within the disclosure hierarchy. The aggregate value of investments by input level, as of December 31, 2011 for the Fund's investments, as well as a roll forward of Level 3 securities, is included at the end of the Fund's Schedule of Investments. Valuation techniques used to value the Fund's investments by major category are as follows:
Debt securities, including restricted securities, are valued based on evaluated prices received from independent pricing services or from dealers who make markets in such securities. For corporate bonds, floating rate loans, foreign government and government agency obligations, preferred securities, U.S. government and government agency obligations and sovereign loan participations, pricing services utilize matrix pricing which considers yield or price of bonds of comparable quality, coupon, maturity and type as well as dealer supplied prices and are generally categorized as Level 2 in the hierarchy. For collateralized mortgage obligations, commercial mortgage securities and U.S. government agency mortgage securities, pricing services utilize matrix pricing which considers prepayment speed assumptions, attributes of the collateral, yield or price of bonds of comparable quality, coupon, maturity and type as well as dealer supplied prices and, accordingly, such securities are generally categorized as Level 2 in the hierarchy. When independent prices are unavailable or unreliable, debt securities may be valued utilizing pricing matrices which consider similar factors that would be used by independent pricing services. These are generally categorized as Level 2 in the hierarchy but may be Level 3 depending on the circumstances. The Fund invests a significant portion of its assets in below investment grade securities. The value of these securities can be more volatile due to changes in the credit quality of the issuer and is sensitive to changes in economic, market and regulatory conditions.
Equity securities, including restricted securities, for which market quotations are readily available, are valued at the last reported sale price or official closing price as reported by an independent pricing service on the primary market or exchange on which they are traded and are categorized as Level 1 in the hierarchy. In the event there were no sales during the day or closing prices are not available, securities are valued at the last quoted bid price or may be valued using the last available price and are generally categorized as Level 2 in the hierarchy. For foreign equity securities, when significant market or security specific events arise, comparisons to the valuation of American Depositary Receipts (ADRs), futures contracts, Exchange-traded funds (ETFs) and certain indexes as well as quoted prices for similar securities are used and are categorized as Level 2 in the hierarchy in these circumstances. Utilizing these techniques may result in transfers between Level 1 and Level 2. For restricted securities and private placements where observable inputs are limited, assumptions about market activity and risk are used and are categorized as Level 3 in the hierarchy.
Futures contracts are valued at the settlement price established each day by the board of trade or exchange on which they are traded and are categorized as Level 1 in the hierarchy. Investments in open-end mutual funds, including the Fidelity Central Funds, are valued at their closing net asset value each business day and are categorized as Level 1 in the hierarchy.
New Accounting Pronouncements. In May 2011, the Financial Accounting Standards Board issued Accounting Standard Update No. 2011-04, Fair Value Measurement (Topic 820) - Amendments to Achieve Common Fair Value Measurement and Disclosure Requirements in U.S. GAAP and IFRSs. The update is effective during interim and annual periods beginning after December 15, 2011 and will result in additional disclosure for transfers between levels as well as expanded disclosure for securities categorized as Level 3 under the fair value hierarchy.
In December 2011, the Financial Accounting Standards Board issued Accounting Standard Update No. 2011-11, Disclosures about Offsetting Assets and Liabilities. The update creates new disclosure requirements requiring entities to disclose both gross and net information for derivatives and other financial instruments that are either offset in the Statement of Assets and Liabilities or subject to an enforceable master netting arrangement or similar agreement. The disclosure requirements are effective for annual reporting periods beginning on or after January 1, 2013. Management is currently evaluating the impact of the update's adoption on the Fund's financial statement disclosures.
Foreign Currency. The Fund may use foreign currency contracts to facilitate transactions in foreign-denominated securities. Gains and losses from these transactions may arise from changes in the value of the foreign currency or if the counterparties do not perform under the contracts' terms.
Foreign-denominated assets, including investment securities, and liabilities are translated into U.S. dollars at the exchange rate at period end. Purchases and sales of investment securities, income and dividends received and expenses denominated in foreign currencies are translated into U.S. dollars at the exchange rate in effect on the transaction date.
The effects of exchange rate fluctuations on investments are included with the net realized and unrealized gain (loss) on investment securities. Other foreign currency transactions resulting in realized and unrealized gain (loss) are disclosed separately.
Investment Transactions and Income. For financial reporting purposes, the Fund's investment holdings and NAV include trades executed through the end of the last business day of the period. The NAV per share for processing shareholder transactions is calculated as of the close of business of the New York Stock Exchange (NYSE), normally 4:00 p.m. Eastern time and includes trades executed through the end of the prior business day. Gains and losses on securities sold are determined on the basis of identified cost. Dividend income is recorded on the ex-dividend date, except for certain dividends from foreign securities where the ex-dividend date may have passed, which are recorded as soon as the Fund is informed of the ex-dividend date. Non-cash dividends included in dividend income, if any, are recorded at the fair market value of the securities received. Distributions received on
Annual Report
3. Significant Accounting Policies - continued
Investment Transactions and Income - continued
securities that represent a return of capital or capital gain are recorded as a reduction of cost of investments and/or as a realized gain. The Fund estimates the components of distributions received that may be considered return of capital distributions or capital gain distributions. Interest income and distributions from the Fidelity Central Funds are accrued as earned. Interest income includes coupon interest and amortization of premium and accretion of discount on debt securities. The principal amount on inflation-indexed securities is periodically adjusted to the rate of inflation and interest is accrued based on the principal amount. The adjustments to principal due to inflation are reflected as increases or decreases to interest income even though principal is not received until maturity. Investment income is recorded net of foreign taxes withheld where recovery of such taxes is uncertain. Debt obligations may be placed on non-accrual status and related interest income may be reduced by ceasing current accruals and writing off interest receivables when the collection of all or a portion of interest has become doubtful based on consistently applied procedures. A debt obligation is removed from non-accrual status when the issuer resumes interest payments or when collectability of interest is reasonably assured.
Expenses. Expenses directly attributable to a fund are charged to that fund. Expenses attributable to more than one fund are allocated among the respective funds on the basis of relative net assets or other appropriate methods. Expense estimates are accrued in the period to which they relate and adjustments are made when actual amounts are known.
Income Tax Information and Distributions to Shareholders. Each year, the Fund intends to qualify as a regulated investment company, including distributing substantially all of its taxable income and realized gains under Subchapter M of the Internal Revenue Code. As a result, no provision for income taxes is required. As of December 31, 2011, the Fund did not have any unrecognized tax benefits in the financial statements; nor is the Fund aware of any tax positions for which it is reasonably possible that the total amounts of unrecognized tax benefits will significantly change in the next twelve months. The Fund files a U.S. federal tax return, in addition to state and local tax returns as required. A fund's tax returns are subject to examination by the Internal Revenue Service (IRS) for a period of three fiscal years. State and local tax returns may be subject to examination for an additional fiscal year depending on the jurisdiction. Foreign taxes are provided for based on the Fund's understanding of the tax rules and rates that exist in the foreign markets in which it invests.
Distributions are declared and recorded on the ex-dividend date. Income dividends and capital gain distributions are declared separately for each class. Income and capital gain distributions are determined in accordance with income tax regulations, which may differ from GAAP.
Capital accounts within the financial statements are adjusted for permanent book-tax differences. These adjustments have no impact on net assets or the results of operations. Temporary book-tax differences will reverse in a subsequent period.
Book-tax differences are primarily due to futures transactions, swap agreements, foreign currency transactions, market discount, partnerships (including allocations from Fidelity Central Funds), and losses deferred due to wash sales and excise tax regulations.
The federal tax cost of investment securities and unrealized appreciation (depreciation) as of period end were as follows:
Gross unrealized appreciation | $ 41,309,414 |
Gross unrealized depreciation | (25,816,634) |
Net unrealized appreciation (depreciation) on securities and other investments | $ 15,492,780 |
| |
Tax Cost | $ 993,298,035 |
The tax-based components of distributable earnings as of period end were as follows:
Undistributed long-term capital gain | $ 2,205,212 |
Net unrealized appreciation (depreciation) | $ 15,344,013 |
Annual Report
Notes to Financial Statements - continued
3. Significant Accounting Policies - continued
Income Tax Information and Distributions to Shareholders - continued
The tax character of distributions paid was as follows:
| December 31, 2011 | December 31, 2010 |
Ordinary Income | $ 49,184,634 | $ 44,269,286 |
Long-term Capital Gains | 11,925,623 | 8,513,415 |
Total | $ 61,110,257 | $ 52,782,701 |
4. Operating Policies.
Delayed Delivery Transactions and When-Issued Securities. During the period, the Fund transacted in securities on a delayed delivery or when-issued basis. Payment and delivery may take place after the customary settlement period for that security. The price of the underlying securities and the date when the securities will be delivered and paid for are fixed at the time the transaction is negotiated. During the time a delayed delivery sell is outstanding, the contract is marked-to-market daily and equivalent deliverable securities are held for the transaction. The securities purchased on a delayed delivery or when-issued basis are identified as such in the Fund's Schedule of Investments. The Fund may receive compensation for interest forgone in the purchase of a delayed delivery or when-issued security. With respect to purchase commitments, the Fund identifies securities as segregated in its records with a value at least equal to the amount of the commitment. Losses may arise due to changes in the value of the underlying securities or if the counterparty does not perform under the contract's terms, or if the issuer does not issue the securities due to political, economic, or other factors.
Restricted Securities. The Fund may invest in securities that are subject to legal or contractual restrictions on resale. These securities generally may be resold in transactions exempt from registration or to the public if the securities are registered. Disposal of these securities may involve time-consuming negotiations and expense, and prompt sale at an acceptable price may be difficult. Information regarding restricted securities is included at the end of the Fund's Schedule of Investments.
Loans and Other Direct Debt Instruments. The Fund may invest in loans and loan participations, trade claims or other receivables. These investments may include standby financing commitments, including revolving credit facilities, that obligate the Fund to supply additional cash to the borrower on demand. Loan participations involve a risk of insolvency of the lending bank or other financial intermediary.
5. Derivative Instruments.
Risk Exposures and the Use of Derivative Instruments. The Fund used derivative instruments (derivatives), including futures contracts and swap agreements, in order to meet its investment objectives. The strategy is to use derivatives to increase returns and to manage exposure to certain risks as defined below. The success of any strategy involving derivatives depends on analysis of numerous economic factors, and if the strategies for investment do not work as intended, the Fund may not achieve its objectives.
The Fund's use of derivatives increased or decreased its exposure to the following risk:
Interest Rate Risk | Interest rate risk relates to the fluctuations in the value of interest-bearing securities due to changes in the prevailing levels of market interest rates. |
The Fund is also exposed to additional risks from investing in derivatives, such as liquidity risk and counterparty credit risk. Liquidity risk is the risk that the Fund will be unable to sell the derivative in the open market in a timely manner. Counterparty credit risk is the risk that the counterparty will not be able to fulfill its obligation to the Fund. Derivative counterparty credit risk is managed through formal evaluation of the creditworthiness of all potential counterparties. On certain over-the-counter derivatives, the Fund attempts to reduce its exposure to counterparty credit risk by entering into an International Swaps and Derivatives Association (ISDA) Master Agreement on a bilateral basis with each of its counterparties. The ISDA Master Agreement gives the Fund the right to terminate all transactions traded under such agreement if there is a certain deterioration in the credit quality of the counterparty. The ISDA Master Agreement gives each party the right, upon an event of default by the other party or a termination of the agreement, to close out all transactions traded under such agreement and to net amounts owed under each transaction to one net payable by one party to the other. To mitigate counterparty credit risk, the Fund receives collateral in the form of cash or securities, if required, which is held in segregated accounts with the Fund's custodian bank in accordance with the collateral agreements entered into between the Fund, the swap counterparty and the Fund's custodian bank. The Fund could experience delays and costs in gaining access to the collateral even though it is held by the Fund's custodian bank. The Fund's maximum risk of loss from counterparty credit risk is generally the aggregate unrealized appreciation and unpaid counterparty payments in
Annual Report
5. Derivative Instruments - continued
Risk Exposures and the Use of Derivative Instruments - continued
excess of any collateral pledged by the counterparty to the Fund. The Fund may be required to pledge collateral for the benefit of the counterparties in an amount equal to the counterparties unrealized appreciation on outstanding swaps contracts, and any such pledged collateral is identified on the Schedule of Investments. Counterparty risk related to exchange-traded futures contracts is minimal because of the protection provided by the exchange on which they trade. Derivatives involve, to varying degrees, risk of loss in excess of the amounts recognized in the Statement of Assets and Liabilities.
Net Realized Gain (Loss) and Change in Net Unrealized Appreciation (Depreciation) on Derivatives. The table below, which reflects the impacts of derivatives on the financial performance of the Fund, summarizes the net realized gain (loss) and change in net unrealized appreciation (depreciation) for derivatives during the period.
Risk Exposure / Derivative Type | Net Realized Gain (Loss) | Change in Net Unrealized Appreciation (Depreciation) |
Interest Rate Risk | | |
Futures Contracts | $ 67,301 | $ 9,424 |
Swap Agreements | (11,622) | 8,272 |
Totals (a) | $ 55,679 | $ 17,696 |
(a) A summary of the value of derivatives by risk exposure as of period end, if any, is included at the end of the Schedule of Investments.
Futures Contracts. A futures contract is an agreement between two parties to buy or sell a specified underlying instrument for a fixed price at a specified future date. The Fund used futures contracts to manage its exposure to the bond market and to fluctuations in interest rates.
Upon entering into a futures contract, a fund is required to deposit either cash or securities (initial margin) with a clearing broker in an amount equal to a certain percentage of the face value of the contract. Futures contracts are marked-to-market daily and subsequent payments (variation margin) are made or received by a fund depending on the daily fluctuations in the value of the futures contracts and are recorded as unrealized appreciation or (depreciation). This receivable and/or payable is included in daily variation margin on futures contracts in the Statement of Assets and Liabilities. Realized gain or (loss) is recorded upon the expiration or closing of a futures contract. The net realized gain (loss) and change in net unrealized appreciation (depreciation) on futures contracts during the period is included in the Statement of Operations.
The underlying face amount at value of open futures contracts at period end is shown in the Schedule of Investments under the caption "Futures Contracts." This amount reflects each contract's exposure to the underlying instrument at period end and is representative of activity for the period. Securities deposited to meet initial margin requirements are identified in the Schedule of Investments.
Certain risks arise upon entering into futures contracts, including the risk that an illiquid market limits the ability to close out a futures contract prior to settlement date.
Swap Agreements. A swap agreement (swap) is a contract between two parties to exchange future cash flows at periodic intervals based on a notional principal amount.
Details of swaps open at period end, if any, are included in the Schedule of Investments under the caption "Swap Agreements." Swaps are marked-to-market daily and changes in value are recorded as unrealized appreciation or (depreciation) and reflected in the Statement of Assets and Liabilities. Any upfront premiums paid or received upon entering a swap to compensate for differences between stated terms of the agreement and prevailing market conditions (e.g. credit spreads, interest rates or other factors) are recorded as realized gain or (loss) ratably over the term of the swap. Payments are exchanged at specified intervals, accrued daily commencing with the effective date of the contract and recorded as realized gain or (loss). Realized gain or (loss) is also recorded in the event of an early termination of a swap. The net realized gain (loss) and change in net unrealized appreciation (depreciation) on swaps during the period is included in the Statement of Operations.
Risks of loss include interest rate risk. In addition, there is the risk of failure by the counterparty to perform under the terms of the agreement and lack of liquidity in the market.
Interest Rate Swaps. Interest rate swaps are agreements between counterparties to exchange cash flows, one based on a fixed rate, and the other on a floating rate. The Fund entered into interest rate swaps to manage its exposure to interest rate changes. Changes in interest rates can have an effect on both the value of bond holdings as well as the amount of interest income earned. In general, the value of bonds can fall when interest rates rise and can rise when interest rates fall.
6. Purchases and Sales of Investments.
Purchases and sales of securities (including the Fixed-Income Central Funds), other than short-term securities and U.S. government securities, aggregated $1,102,118,949 and $1,003,147,451, respectively.
Annual Report
Notes to Financial Statements - continued
7. Fees and Other Transactions with Affiliates.
Management Fee. FMR and its affiliates provide the Fund with investment management related services for which the Fund pays a monthly management fee. The management fee is the sum of an individual fund fee rate that is based on an annual rate of .45% of the Fund's average net assets and an annualized group fee rate that averaged .12% during the period. The group fee rate is based upon the average net assets of all the mutual funds advised by FMR. The group fee rate decreases as assets under management increase and increases as assets under management decrease. For the period, the total annual management fee rate was .57% of the Fund's average net assets.
Distribution and Service Plan Fees. In accordance with Rule 12b-1 of the 1940 Act, the Fund has adopted separate 12b-1 Plans for each Service Class of shares. Each Service Class pays Fidelity Distributors Corporation (FDC), an affiliate of FMR, a service fee. For the period, the service fee is based on an annual rate of .10% of Service Class' average net assets and .25% of Service Class 2's average net assets.
For the period, total fees, all of which were re-allowed to insurance companies for the distribution of shares and providing shareholder support services were as follows:
Service Class | $ 1,042 |
Service Class 2 | 37,815 |
| $ 38,857 |
Transfer Agent Fees. Fidelity Investments Institutional Operations Company, Inc. (FIIOC), an affiliate of FMR, is the Fund's transfer, dividend disbursing, and shareholder servicing agent. FIIOC receives an asset-based fee with respect to each class. Each class (with the exception of Investor Class) pays a transfer agent fee, excluding out of pocket expenses, equal to an annual rate of .07% of average net assets. Investor Class pays a monthly asset-based transfer agent fee of .10% of average net assets. In addition, FIIOC receives an asset-based fee of .0045% of average net assets for typesetting, printing and mailing of shareholder reports, except proxy statements. FIIOC voluntarily agreed to waive this fee for the period August 1, 2011 through December 31, 2011 (see Expense Reductions note). For the period, transfer agent fees for each class, including printing and out of pocket expenses, were as follows:
Initial Class | $ 114,487 |
Service Class | 778 |
Service Class 2 | 11,107 |
Investor Class | 765,869 |
| $ 892,241 |
Accounting Fees. Fidelity Service Company, Inc.(FSC),an affiliate of FMR, maintains the Fund's accounting records. The fee is based on the level of average net assets for the month.
Brokerage Commissions. The Fund placed a portion of its portfolio transactions with brokerage firms which are affiliates of the investment adviser. The commissions paid to these affiliated firms were $47 for the period.
8. Committed Line of Credit.
The Fund participates with other funds managed by FMR or an affiliate in a $4.0 billion credit facility (the "line of credit") to be utilized for temporary or emergency purposes to fund shareholder redemptions or for other short-term liquidity purposes. The Fund has agreed to pay commitment fees on its pro-rata portion of the line of credit, which amounted to $2,611 and is reflected in Miscellaneous expenses on the Statement of Operations. During the period, there were no borrowings on this line of credit.
9. Expense Reductions.
FMR or its affiliates agreed to waive certain fees during the period as noted in the table below.
Initial Class | $ 3,138 |
Service Class | 21 |
Service Class 2 | 301 |
Investor Class | 14,514 |
| $ 17,974 |
Many of the brokers with whom FMR places trades on behalf of the Fund provided services to the Fund in addition to trade execution. These services included payments of certain expenses on behalf of the Fund totaling $65 for the period. In addition, through arrangements with the Fund's custodian, credits realized as a result of uninvested cash balances were used to reduce the Fund's expenses. During the period, these credits reduced the Fund's custody expenses by $620.
Annual Report
10. Distributions to Shareholders.
Distributions to shareholders of each class were as follows:
Years ended December 31, | 2011 | 2010 |
From net investment income | | |
Initial Class | $ 6,773,571 | $ 6,766,582 |
Service Class | 35,285 | 51,899 |
Service Class 2 | 1,007,372 | 304,388 |
Investor Class | 33,062,664 | 26,568,912 |
Total | $ 40,878,892 | $ 33,691,781 |
From net realized gain | | |
Initial Class | $ 3,416,993 | $ 3,891,605 |
Service Class | 19,967 | 32,045 |
Service Class 2 | 458,432 | 167,108 |
Investor Class | 16,335,973 | 15,000,162 |
Total | $ 20,231,365 | $ 19,090,920 |
11. Share Transactions.
Transactions for each class of shares were as follows:
| Shares | Dollars |
Years ended December 31, | 2011 | 2010 | 2011 | 2010 |
Initial Class | | | | |
Shares sold | 2,656,457 | 1,592,340 | $ 31,076,160 | $ 18,469,325 |
Reinvestment of distributions | 916,774 | 947,149 | 10,190,564 | 10,658,187 |
Shares redeemed | (2,481,322) | (3,923,967) | (28,834,770) | (45,593,051) |
Net increase (decrease) | 1,091,909 | (1,384,478) | $ 12,431,954 | $ (16,465,539) |
Service Class | | | | |
Shares sold | - | - | $ - | $ - |
Reinvestment of distributions | 4,970 | 7,469 | 55,252 | 83,944 |
Shares redeemed | (31,398) | (72,817) | (366,648) | (841,352) |
Net increase (decrease) | (26,428) | (65,348) | $ (311,396) | $ (757,408) |
Service Class 2 | | | | |
Shares sold | 1,728,542 | 652,109 | $ 20,060,168 | $ 7,619,023 |
Reinvestment of distributions | 132,522 | 41,955 | 1,465,804 | 471,497 |
Shares redeemed | (222,100) | (196,258) | (2,573,365) | (2,309,986) |
Net increase (decrease) | 1,638,964 | 497,806 | $ 18,952,607 | $ 5,780,534 |
Investor Class | | | | |
Shares sold | 15,647,182 | 12,462,396 | $ 182,167,424 | $ 145,050,130 |
Reinvestment of distributions | 4,453,284 | 3,700,172 | 49,398,637 | 41,569,073 |
Shares redeemed | (2,098,949) | (3,601,394) | (24,283,936) | (41,695,821) |
Net increase (decrease) | 18,001,517 | 12,561,174 | $ 207,282,125 | $ 144,923,382 |
12. Other.
The Fund's organizational documents provide former and current trustees and officers with a limited indemnification against liabilities arising in connection with the performance of their duties to the Fund. In the normal course of business, the Fund may also enter into contracts that provide general indemnifications. The Fund's maximum exposure under these arrangements is unknown as this would be dependent on future claims that may be made against the Fund. The risk of material loss from such claims is considered remote.
At the end of the period, FMR or its affiliates were the owners of record of 97% of the total outstanding shares of the Fund.
13. Credit Risk.
The Fund's relatively large investment in countries with limited or developing capital markets may involve greater risks than investments in more developed markets and the prices of such investments may be volatile. The yields of emerging market debt obligations reflect, among other things, perceived credit risk. The consequences of political, social or economic changes in these markets may have disruptive effects on the market prices of the Fund's investments and the income they generate, as well as the Fund's ability to repatriate such amounts.
Annual Report
Report of Independent Registered Public Accounting Firm
To the Trustees of Variable Insurance Products Fund V and the Shareholders of VIP Strategic Income Portfolio:
In our opinion, the accompanying statement of assets and liabilities, including the schedule of investments, and the related statements of operations and of changes in net assets and the financial highlights present fairly, in all material respects, the financial position of VIP Strategic Income Portfolio (a fund of Variable Insurance Products Fund V) at December 31, 2011, the results of its operations for the year then ended, the changes in its net assets for each of the two years in the period then ended and the financial highlights for each of the five years in the period then ended, in conformity with accounting principles generally accepted in the United States of America. These financial statements and financial highlights (hereafter referred to as "financial statements") are the responsibility of the VIP Strategic Income Portfolio's management. Our responsibility is to express an opinion on these financial statements based on our audits. We conducted our audits of these financial statements in accordance with the standards of the Public Company Accounting Oversight Board (United States). Those standards require that we plan and perform the audit to obtain reasonable assurance about whether the financial statements are free of material misstatement. An audit includes examining, on a test basis, evidence supporting the amounts and disclosures in the financial statements, assessing the accounting principles used and significant estimates made by management, and evaluating the overall financial statement presentation. We believe that our audits, which included confirmation of securities at December 31, 2011 by correspondence with the custodian, agent banks and brokers, provide a reasonable basis for our opinion.
/s/ PricewaterhouseCoopers LLP
PricewaterhouseCoopers LLP
Boston, Massachusetts
February 21, 2012
Annual Report
The Trustees and executive officers of the trust and fund, as applicable, are listed below. The Board of Trustees governs the fund and is responsible for protecting the interests of shareholders. The Trustees are experienced executives who meet periodically throughout the year to oversee the fund's activities, review contractual arrangements with companies that provide services to the fund, oversee management of the risks associated with such activities and contractual arrangements, and review the fund's performance. Except for James C. Curvey, each of the Trustees oversees 203 funds advised by FMR or an affiliate. Mr. Curvey oversees 429 funds advised by FMR or an affiliate.
The Trustees hold office without limit in time except that (a) any Trustee may resign; (b) any Trustee may be removed by written instrument, signed by at least two-thirds of the number of Trustees prior to such removal; (c) any Trustee who requests to be retired or who has become incapacitated by illness or injury may be retired by written instrument signed by a majority of the other Trustees; and (d) any Trustee may be removed at any special meeting of shareholders by a two-thirds vote of the outstanding voting securities of the trust. Each Trustee who is not an interested person (as defined in the 1940 Act) (Independent Trustee), shall retire not later than the last day of the calendar year in which his or her 75th birthday occurs. The Independent Trustees may waive this mandatory retirement age policy with respect to individual Trustees. The executive officers may resign or may be removed by a vote of a majority of the Trustees at any regular meeting or any special meeting of the Trustees. Except as indicated, each individual has held the office shown or other offices in the same company for the past five years.
Experience, Skills, Attributes, and Qualifications of the Fund's Trustees. The Governance and Nominating Committee has adopted a statement of policy that describes the experience, qualifications, attributes, and skills that are necessary and desirable for potential Independent Trustee candidates (Statement of Policy). The Board believes that each Trustee satisfied at the time he or she was initially elected or appointed a Trustee, and continues to satisfy, the standards contemplated by the Statement of Policy. The Governance and Nominating Committee also engages professional search firms to help identify potential Independent Trustee candidates who have the experience, qualifications, attributes, and skills consistent with the Statement of Policy. From time to time, additional criteria based on the composition and skills of the current Independent Trustees, as well as experience or skills that may be appropriate in light of future changes to board composition, business conditions, and regulatory or other developments, have also been considered by the professional search firms and the Governance and Nominating Committee. In addition, the Board takes into account the Trustees' commitment and participation in Board and committee meetings, as well as their leadership of standing and ad hoc committees throughout their tenure.
In determining that a particular Trustee was and continues to be qualified to serve as a Trustee, the Board has considered a variety of criteria, none of which, in isolation, was controlling. The Board believes that, collectively, the Trustees have balanced and diverse experience, qualifications, attributes, and skills, which allow the Board to operate effectively in governing the fund and protecting the interests of shareholders. Information about the specific experience, skills, attributes, and qualifications of each Trustee, which in each case led to the Board's conclusion that the Trustee should serve (or continue to serve) as a trustee of the fund, is provided below.
Board Structure and Oversight Function. Abigail P. Johnson is an interested person (as defined in the 1940 Act) and currently serves as Chairman. The Trustees have determined that an interested Chairman is appropriate and benefits shareholders because an interested Chairman has a personal and professional stake in the quality and continuity of services provided to the fund. Independent Trustees exercise their informed business judgment to appoint an individual of their choosing to serve as Chairman, regardless of whether the Trustee happens to be independent or a member of management. The Independent Trustees have determined that they can act independently and effectively without having an Independent Trustee serve as Chairman and that a key structural component for assuring that they are in a position to do so is for the Independent Trustees to constitute a substantial majority for the Board. The Independent Trustees also regularly meet in executive session. Kenneth L. Wolfe serves as Chairman of the Independent Trustees and as such (i) acts as a liaison between the Independent Trustees and management with respect to matters important to the Independent Trustees and (ii) with management prepares agendas for Board meetings.
Fidelity funds are overseen by different Boards of Trustees. The fund's Board oversees Fidelity's investment-grade bond, money market, and asset allocation funds and another Board oversees Fidelity's equity and high income funds. The asset allocation funds may invest in Fidelity funds that are overseen by such other Board. The use of separate Boards, each with its own committee structure, allows the Trustees of each group of Fidelity funds to focus on the unique issues of the funds they oversee, including common research, investment, and operational issues. On occasion, the separate Boards establish joint committees to address issues of overlapping consequences for the Fidelity funds overseen by each Board.
The Trustees operate using a system of committees to facilitate the timely and efficient consideration of all matters of importance to the Trustees, the fund, and fund shareholders and to facilitate compliance with legal and regulatory requirements and oversight of the fund's activities and associated risks. The Board, acting through its committees, has charged FMR and its affiliates with (i) identifying events or circumstances the occurrence of which could have demonstrably adverse effects on the fund's business and/or reputation; (ii) implementing processes and controls to lessen the possibility that such events or circumstances occur or to mitigate the effects of such events or circumstances if they do occur; and (iii) creating and maintaining a system designed to evaluate continuously business and market conditions in order to facilitate the identification and implementation processes described in (i) and (ii) above. Because the day-to-day operations and activities of the fund are carried out by or through FMR, its affiliates and other service providers, the fund's exposure to risks is mitigated but not eliminated by the processes overseen by the Trustees. While each of the Board's committees has responsibility for overseeing different aspects of the fund's activities, oversight is exercised primarily through the Operations and Audit Committees. In addition, an ad hoc Board committee of Independent Trustees has worked with FMR to enhance the Board's oversight of investment and financial risks, legal and regulatory risks, technology risks, and operational risks, including the development of additional risk reporting to the Board. Appropriate personnel, including but not limited to the fund's Chief Compliance Officer (CCO), FMR's internal auditor, the independent accountants, the fund's Treasurer and portfolio management personnel, make periodic reports to the Board's committees, as appropriate, including an annual review of FMR's risk management program for the Fidelity funds. The responsibilities of each standing committee, including their oversight responsibilities, are described further under "Standing Committees of the Fund's Trustees."
Annual Report
The fund's Statement of Additional Information (SAI) includes more information about the Trustees. To request a free copy, call Fidelity at 1-877-208-0098.
Interested Trustees*:
Correspondence intended for each Trustee who is an interested person may be sent to Fidelity Investments, 82 Devonshire Street, Boston, Massachusetts 02109.
Name, Age; Principal Occupations and Other Relevant Experience+ |
Abigail P. Johnson (50) |
| Year of Election or Appointment: 2009 Ms. Johnson is Trustee and Chairman of the Board of Trustees of certain Trusts. Ms. Johnson serves as President of Personal, Workplace and Institutional Services (2005-present). Ms. Johnson is Chairman and Director of FMR Co., Inc. (2011-present), Chairman and Director of FMR (2011-present), and the Vice Chairman and Director (2007-present) of FMR LLC. Previously, Ms. Johnson served as President and a Director of FMR (2001-2005), a Trustee of other investment companies advised by FMR, Fidelity Investments Money Management, Inc., and FMR Co., Inc. (2001-2005), Senior Vice President of the Fidelity funds (2001-2005), and managed a number of Fidelity funds. Ms. Abigail P. Johnson and Mr. Arthur E. Johnson are not related. |
James C. Curvey (76) |
| Year of Election or Appointment: 2007 Mr. Curvey also serves as Trustee (2007-present) of other investment companies advised by FMR. Mr. Curvey is a Director of Fidelity Investments Money Management, Inc. (2009-present), Director of Fidelity Research & Analysis Co. (2009-present) and Director of FMR and FMR Co., Inc. (2007-present). Mr. Curvey is also Vice Chairman (2007-present) and Director of FMR LLC. In addition, Mr. Curvey serves as an Overseer for the Boston Symphony Orchestra and a member of the Trustees of Villanova University. Previously, Mr. Curvey was the Vice Chairman (2006-2007) and Director (2000-2007) of FMR Corp. |
* Trustees have been determined to be "Interested Trustees" by virtue of, among other things, their affiliation with the trust or various entities under common control with FMR.
+ The information above includes each Trustee's principal occupation during the last five years and other information relating to the experience, attributes, and skills relevant to each Trustee's qualifications to serve as a Trustee, which led to the conclusion that each Trustee should serve as a Trustee for the fund.
Independent Trustees:
Correspondence intended for each Independent Trustee (that is, the Trustees other than the Interested Trustees) may be sent to Fidelity Investments, P.O. Box 55235, Boston, Massachusetts 02205-5235.
Name, Age; Principal Occupations and Other Relevant Experience+ |
Albert R. Gamper, Jr. (69) |
| Year of Election or Appointment: 2007 Mr. Gamper is Vice Chairman of the Independent Trustees of the Fixed Income and Asset Allocation Funds (2011-present). Prior to his retirement in December 2004, Mr. Gamper served as Chairman of the Board of CIT Group Inc. (commercial finance). During his tenure with CIT Group Inc. Mr. Gamper served in numerous senior management positions, including Chairman (1987-1989; 1999-2001; 2002-2004), Chief Executive Officer (1987-2004), and President (2002-2003). Mr. Gamper currently serves as a member of the Board of Directors of Public Service Enterprise Group (utilities, 2000-present), a member of the Board of Trustees, Rutgers University (2004-present), and Chairman of the Board of Saint Barnabas Health Care System. Previously, Mr. Gamper served as Chairman of the Board of Governors, Rutgers University (2004-2007). |
Robert F. Gartland (60) |
| Year of Election or Appointment: 2010 Mr. Gartland is a partner and investor of Vietnam Partners LLC (investments and consulting, 2008-present) and is Chairman and an investor in Gartland and Mellina Group Corp. (consulting, 2009-present). Prior to his retirement, Mr. Gartland held a variety of positions at Morgan Stanley (financial services, 1979-2007) including Managing Director (1987-2007). |
Arthur E. Johnson (64) |
| Year of Election or Appointment: 2008 Mr. Johnson serves as a member of the Board of Directors of Eaton Corporation (diversified power management, 2009-present), AGL Resources, Inc. (holding company, 2002-present) and Booz Allen Hamilton (management consulting, 2011-present). Prior to his retirement, Mr. Johnson served as Senior Vice President of Corporate Strategic Development of Lockheed Martin Corporation (defense contractor, 1999-2009). He previously served on the Board of Directors of IKON Office Solutions, Inc. (1999-2008) and Delta Airlines (2005-2007). Mr. Arthur E. Johnson is not related to Mr. Edward C. Johnson 3d or Ms. Abigail P. Johnson. |
Michael E. Kenneally (57) |
| Year of Election or Appointment: 2009 Previously, Mr. Kenneally served as a Member of the Advisory Board for certain Fidelity Fixed Income and Asset Allocation Funds (2008-2009). Prior to his retirement, Mr. Kenneally served as Chairman and Global Chief Executive Officer of Credit Suisse Asset Management (2003-2005). Mr. Kenneally was a Director of the Credit Suisse Funds (U.S. mutual funds, 2004-2008) and certain other closed-end funds (2004-2005) and was awarded the Chartered Financial Analyst (CFA) designation in 1991. |
James H. Keyes (71) |
| Year of Election or Appointment: 2007 Mr. Keyes serves as a member of the Boards of Navistar International Corporation (manufacture and sale of trucks, buses, and diesel engines, since 2002) and Pitney Bowes, Inc. (integrated mail, messaging, and document management solutions, since 1998). Prior to his retirement, Mr. Keyes served as Chairman and Chief Executive Officer of Johnson Controls (automotive, building, and energy, 1998-2002) and as a member of the Board of LSI Logic Corporation (semiconductor technologies, 1984-2008). |
Marie L. Knowles (65) |
| Year of Election or Appointment: 2001 Prior to Ms. Knowles' retirement in June 2000, she served as Executive Vice President and Chief Financial Officer of Atlantic Richfield Company (ARCO) (diversified energy, 1996-2000). From 1993 to 1996, she was a Senior Vice President of ARCO and President of ARCO Transportation Company. She served as a Director of ARCO from 1996 to 1998. Ms. Knowles currently serves as a Director and Chairman of the Audit Committee of McKesson Corporation (healthcare service, since 2002). Ms. Knowles is an Honorary Trustee of the Brookings Institution and a member of the Board of the Catalina Island Conservancy and of the Santa Catalina Island Company (2009-present). She also serves as a member of the Advisory Board for the School of Engineering of the University of Southern California and the Foundation Board of the School of Architecture at the University of Virginia (2007-present). Previously, Ms. Knowles served as a Director of Phelps Dodge Corporation (copper mining and manufacturing, 1994-2007). |
Kenneth L. Wolfe (72) |
| Year of Election or Appointment: 2007 Mr. Wolfe is Chairman of the Independent Trustees of the Fixed Income and Asset Allocation Funds (2008-present). Prior to his retirement, Mr. Wolfe served as Chairman and a Director (2007-2009) and Chairman and Chief Executive Officer (1994-2001) of Hershey Foods Corporation. He also served as a member of the Boards of Adelphia Communications Corporation (telecommunications, 2003-2006), Bausch & Lomb, Inc. (medical/pharmaceutical, 1993-2007), and Revlon, Inc. (personal care products, 2004-2009). |
+ The information above includes each Trustee's principal occupation during the last five years and other information relating to the experience, attributes, and skills relevant to each Trustee's qualifications to serve as a Trustee, which led to the conclusion that each Trustee should serve as a Trustee for the fund.
Executive Officers:
Correspondence intended for each executive officer may be sent to Fidelity Investments, 82 Devonshire Street, Boston, Massachusetts 02109.
Name, Age; Principal Occupation |
John R. Hebble (53) |
| Year of Election or Appointment: 2008 President and Treasurer of Fidelity's Fixed Income and Asset Allocation Funds. Mr. Hebble also serves as President (2011-present), Treasurer, and Chief Financial Officer of The North Carolina Capital Management Trust: Cash and Term Portfolios (2008-present), Assistant Treasurer of other Fidelity funds (2009-present) and is an employee of Fidelity Investments. |
Derek L. Young (47) |
| Year of Election or Appointment: 2009 Vice President of Fidelity's Asset Allocation Funds. Mr. Young also serves as President and a Director of Strategic Advisers, Inc. (2011-present), President of the Global Asset Allocation Group (2011-present), and as Vice Chairman of Pyramis Global Advisers, LLC (2011-present). Previously, Mr. Young served as Chief Investment Officer of the Global Asset Allocation Group (2009-2011) and as a portfolio manager. |
Scott C. Goebel (43) |
| Year of Election or Appointment: 2008 Secretary and Chief Legal Officer (CLO) of the Fidelity funds. Mr. Goebel also serves as Secretary of Fidelity Investments Money Management, Inc. (FIMM) (2010-present) and Fidelity Research and Analysis Company (FRAC) (2010-present); Secretary and CLO of The North Carolina Capital Management Trust: Cash and Term Portfolios (2008-present); General Counsel, Secretary, and Senior Vice President of FMR (2008-present) and FMR Co., Inc. (2008-present); employed by FMR LLC or an affiliate (2001-present); Chief Legal Officer of Fidelity Management & Research (Hong Kong) Limited (2008-present) and Assistant Secretary of Fidelity Management & Research (Japan) Inc. (2008-present), and Fidelity Management & Research (U.K.) Inc. (2008-present). Previously, Mr. Goebel served as Assistant Secretary of FIMM (2008-2010), FRAC (2008-2010), and the Funds (2007-2008) and as Vice President and Secretary of Fidelity Distributors Corporation (FDC) (2005-2007). |
David J. Carter (38) |
| Year of Election or Appointment: 2010 Assistant Secretary of Fidelity's Fixed Income and Asset Allocation Funds. Mr. Carter also serves as Vice President, Associate General Counsel (2010-present) and is an employee of Fidelity Investments (2005-present). |
Holly C. Laurent (57) |
| Year of Election or Appointment: 2008 Anti-Money Laundering (AML) Officer of the Fidelity funds. Ms. Laurent also serves as AML Officer of The North Carolina Capital Management Trust: Cash and Term Portfolios (2008-present) and is an employee of Fidelity Investments. Previously, Ms. Laurent was Senior Vice President and Head of Legal for Fidelity Business Services India Pvt. Ltd. (2006-2008), and Senior Vice President, Deputy General Counsel and Group Head for FMR LLC (2005-2006). |
Christine Reynolds (53) |
| Year of Election or Appointment: 2008 Chief Financial Officer of the Fidelity funds. Ms. Reynolds became President of Fidelity Pricing and Cash Management Services (FPCMS) in August 2008. Ms. Reynolds served as Chief Operating Officer of FPCMS (2007-2008). Previously, Ms. Reynolds served as President, Treasurer, and Anti-Money Laundering officer of the Fidelity funds (2004-2007). |
Michael H. Whitaker (44) |
| Year of Election or Appointment: 2008 Chief Compliance Officer of Fidelity's Fixed Income and Asset Allocation Funds. Mr. Whitaker also serves as Chief Compliance Officer of The North Carolina Capital Management Trust: Cash and Term Portfolios (2008-present). Mr. Whitaker is an employee of Fidelity Investments (2007-present). Prior to joining Fidelity Investments, Mr. Whitaker worked at MFS Investment Management where he served as Senior Vice President and Chief Compliance Officer (2004-2006), and Assistant General Counsel. |
Jeffrey S. Christian (50) |
| Year of Election or Appointment: 2009 Deputy Treasurer of the Fidelity funds. Mr. Christian is an employee of Fidelity Investments. Previously, Mr. Christian served as Chief Financial Officer (2008-2009) of certain Fidelity funds and Senior Vice President of Fidelity Pricing and Cash Management Services (FPCMS) (2004-2009). |
Joseph F. Zambello (54) |
| Year of Election or Appointment: 2011 Deputy Treasurer of the Fidelity funds. Mr. Zambello is an employee of Fidelity Investments. Previously, Mr. Zambello served as Vice President of FMR's Program Management Group (2009-2011) and Vice President of the Transfer Agent Oversight Group (2005-2009). |
Stephanie J. Dorsey (42) |
| Year of Election or Appointment: 2008 Deputy Treasurer of Fidelity's Fixed Income and Asset Allocation Funds. Ms. Dorsey also serves as Assistant Treasurer of other Fidelity funds (2010-present) and is an employee of Fidelity Investments (2008-present). Previously, Ms. Dorsey served as Treasurer (2004-2008) of the JPMorgan Mutual Funds and Vice President (2004-2008) of JPMorgan Chase Bank. |
Adrien E. Deberghes (44) |
| Year of Election or Appointment: 2010 Assistant Treasurer of Fidelity's Fixed Income and Asset Allocation Funds. Mr. Deberghes also serves as Vice President and Assistant Treasurer of Fidelity Rutland Square Trust II and Fidelity Commonwealth Trust II (2011-present), Deputy Treasurer of other Fidelity funds (2008-present), and is an employee of Fidelity Investments (2008-present). Previously, Mr. Deberghes served as Senior Vice President of Mutual Fund Administration at State Street Corporation (2007-2008), Senior Director of Mutual Fund Administration at Investors Bank & Trust (2005-2007), and Director of Finance for Dunkin' Brands (2000-2005). |
Kenneth B. Robins (42) |
| Year of Election or Appointment: 2009 Assistant Treasurer of the Fidelity Fixed Income and Asset Allocation Funds. Mr. Robins also serves as President and Treasurer of other Fidelity funds (2008-present; 2010-present) and is an employee of Fidelity Investments (2004-present). Previously, Mr. Robins served as Deputy Treasurer of the Fidelity funds (2005-2008) and Treasurer and Chief Financial Officer of The North Carolina Capital Management Trust: Cash and Term Portfolios (2006-2008). |
Gary W. Ryan (53) |
| Year of Election or Appointment: 2005 Assistant Treasurer of the Fidelity funds. Mr. Ryan is an employee of Fidelity Investments. Previously, Mr. Ryan served as Vice President of Fund Reporting in Fidelity Pricing and Cash Management Services (FPCMS) (1999-2005). |
Jonathan Davis (43) |
| Year of Election or Appointment: 2010 Assistant Treasurer of the Fidelity funds. Mr. Davis is also Assistant Treasurer of Fidelity Rutland Square Trust II and Fidelity Commonwealth Trust II. Mr. Davis is an employee of Fidelity Investments. Previously, Mr. Davis served as Vice President and Associate General Counsel of FMR LLC (2003-2010). |
Annual Report
The Board of Trustees of VIP Strategic Income Portfolio voted to pay to shareholders of record at the opening of business on record date, the following distributions per share derived from capital gains realized from sales of portfolio securities:
| Pay Date | Record Date | Capital Gains |
Initial Class | 02/10/2012 | 02/10/2012 | $0.025 |
Service Class | 02/10/2012 | 02/10/2012 | $0.025 |
Service Class 2 | 02/10/2012 | 02/10/2012 | $0.025 |
Investor Class | 02/10/2012 | 02/10/2012 | $0.025 |
The fund hereby designates as a capital gain dividend with respect to the taxable year ended December 31, 2011, $10,256,696 or, if subsequently determined to be different, the net capital gain of such year.
A total of 6.83% of the dividends distributed during the fiscal year was derived from interest on U.S. Government securities which is generally exempt from state income tax.
Annual Report
Board Approval of Investment Advisory Contracts and Management Fees
VIP Strategic Income Portfolio
Each year, the Board of Trustees, including the Independent Trustees (together, the Board), votes on the renewal of the management contract and sub-advisory agreements (together, the Advisory Contracts) for the fund. The Board, assisted by the advice of fund counsel and Independent Trustees' counsel, requests and considers a broad range of information relevant to the renewal of the Advisory Contracts throughout the year.
The Board meets regularly and considers at each of its meetings factors that are relevant to its annual consideration of the renewal of the fund's Advisory Contracts, including the services and support provided to the fund and its shareholders. The Board has established three standing committees, Operations, Audit, and Nominating and Governance, each composed of Independent Trustees with varying backgrounds, to which the Board has assigned specific subject matter responsibilities in order to enhance effective decision-making by the Board. The Operations Committee, of which all of the Independent Trustees are members, meets regularly throughout the year and, among other matters, considers matters specifically related to the annual consideration of the renewal of the fund's Advisory Contracts. The Board, acting directly and through its Committees, requests and receives information concerning the annual consideration of the renewal of the fund's Advisory Contracts. The Board also meets as needed to consider matters specifically related to the Board's annual consideration of the renewal of Advisory Contracts. Members of the Board may also meet with trustees of other Fidelity funds through ad hoc joint committees to discuss certain matters relevant to the Fidelity funds.
At its September 2011 meeting, the Board of Trustees, including the Independent Trustees, unanimously determined to renew the fund's Advisory Contracts. In reaching its determination, the Board considered all factors it believed relevant, including (i) the nature, extent, and quality of the services to be provided to the fund and its shareholders (including the investment performance of the fund); (ii) the competitiveness of the fund's management fee and total expense ratio; (iii) the total costs of the services to be provided by and the profits to be realized by Fidelity from its relationship with the fund; (iv) the extent to which economies of scale would be realized as the fund grows; and (v) whether fee levels reflect these economies of scale, if any, for the benefit of fund shareholders.
In considering whether to renew the Advisory Contracts for the fund, the Board reached a determination, with the assistance of fund counsel and Independent Trustees' counsel and through the exercise of its business judgment, that the renewal of the Advisory Contracts is in the best interests of the fund and its shareholders and that the compensation payable under the Advisory Contracts is fair and reasonable. The Board's decision to renew the Advisory Contracts was not based on any single factor, but rather was based on a comprehensive consideration of all the information provided to the Board at its meetings throughout the year. The Board, in reaching its determination to renew the Advisory Contracts, is aware that shareholders in the fund have a broad range of investment choices available to them, including a wide choice among mutual funds offered by Fidelity's competitors, and that the fund's shareholders, who have the opportunity to review and weigh the disclosure provided by the fund in its prospectus and other public disclosures, have chosen to invest in this fund, managed by Fidelity.
Nature, Extent, and Quality of Services Provided. The Board considered the staffing within the investment adviser, FMR, and the sub-advisers (together, the Investment Advisers), including the backgrounds of the fund's investment personnel and the fund's investment objective and discipline. The Independent Trustees also had discussions with senior management of Fidelity's investment operations and investment groups. The Board considered the structure of the portfolio manager compensation program and whether this structure provides appropriate incentives to act in the best interests of the fund.
Resources Dedicated to Investment Management and Support Services. The Board reviewed the general qualifications and capabilities of the Investment Advisers' investment staff, including its size, education, experience, and resources, as well as the Investment Advisers' approach to recruiting, managing, and compensating investment personnel. The Board also noted that FMR has devoted increased resources to non-U.S. offices. The Board noted that Fidelity's analysts have extensive resources, tools and capabilities which allow them to conduct sophisticated quantitative and fundamental analysis, as well as credit analysis of issuers, counterparties and enhancers. The Board also believes that Fidelity's investment professionals have sufficient access to global information and data so as to provide competitive investment results over time, and that those professionals also have access to sophisticated tools which permit them to assess portfolio construction and risk and performance attribution characteristics continuously, as well as to transmit new information and research conclusions rapidly around the world. Additionally, in its deliberations, the Board considered the Investment Advisers' trading capabilities and resources which are an integral part of the investment management process.
Shareholder and Administrative Services. The Board considered (i) the nature, extent, quality, and cost of advisory, administrative, and shareholder services performed by the Investment Advisers and their affiliates under the Advisory Contracts and under separate agreements covering transfer agency, pricing and bookkeeping, and securities lending services for the fund; (ii) the nature and extent of the investment adviser's supervision of third party service providers, principally custodians and subcustodians; and (iii) the resources devoted to, and the record of compliance with, the fund's compliance policies and procedures. The Board also reviewed the allocation of fund brokerage, including allocations to brokers affiliated with the Investment Advisers, the use of brokerage commissions to pay fund expenses, and the use of "soft" commission dollars to pay for research services.
The Board noted that the growth of fund assets over time across the complex allows Fidelity to reinvest in the development of services designed to enhance the value or convenience of the Fidelity funds as investment vehicles. These services include 24-hour access to account information and market information through telephone representatives and over the Internet, investor education materials and asset allocation tools, and the expanded availability of Fidelity Investor Centers, with 35 new branches opening since 2010.
Annual Report
Investment in a Large Fund Family. The Board considered the benefits to shareholders of investing in a Fidelity fund, including the benefits of investing in a fund that is part of a large family of funds offering a variety of investment disciplines and providing a large variety of mutual fund investor services. The Board noted that Fidelity had taken, or had made recommendations that resulted in the Fidelity funds taking, a number of actions over the previous year that benefited particular funds, including (i) continuing to dedicate additional resources to investment research and support of the senior management team that oversees asset management; (ii) rationalizing product lines through the mergers of six funds into other funds; (iii) continuing to migrate the Freedom Funds to dedicated lower cost underlying funds; (iv) obtaining shareholder approval to broaden the investment strategies for Fidelity Consumer Finance Portfolio, Fidelity Emerging Asia Fund, and Fidelity Environment and Alternative Energy Portfolio; (v) contractually agreeing to reduce the management fees and impose other expense limitations on Spartan 500 Index Fund and U.S. Bond Index Fund in connection with launching new institutional classes of these funds; (vi) changing the name, primary and supplemental benchmarks, and investment policies of Fidelity Global Strategies Fund to support the fund's flexible investment mandate and global orientation; and (vii) reducing the transfer agency account fee rates on certain accounts.
Investment Performance. The Board considered whether the fund has operated in accordance with its investment objective, as well as its record of compliance with its investment restrictions. It also reviewed the fund's absolute investment performance for each class, as well as the fund's relative investment performance for each class measured over multiple periods against (i) a proprietary custom index, and (ii) a peer group of mutual funds deemed appropriate by Fidelity and reviewed by the Board. The following charts considered by the Board show, over the one-, three-, and five-year periods ended December 31, 2010, the cumulative total returns of Initial Class and Service Class 2 of the fund, the cumulative total returns of a proprietary custom index ("benchmark"), and a range of cumulative total returns of a peer group of mutual funds identified by Morningstar, Inc. as having an investment style similar to that of the fund based on underlying portfolio holdings. The returns of Initial Class and Service Class 2 show the performance of the highest and lowest performing classes, respectively (based on five-year performance). The box within each chart shows the 25th percentile return (bottom of box) and the 75th percentile return (top of box) of the peer group. Returns shown above the box are in the first quartile and returns shown below the box are in the fourth quartile. The percentage beaten numbers noted below each chart correspond to the percentile box and represent the percentage of funds in the peer group whose performance was equal to or lower than that of the class indicated. The fund's proprietary custom index is an index developed by FMR that represents the performance of the fund's four general investment categories according to their respective weightings in the fund's neutral mix.
VIP Strategic Income Portfolio

The Board reviewed the fund's relative investment performance against its peer group and noted that the performance of Initial Class of the fund was in the fourth quartile for the one-year period and the first quartile for the three- and five-year periods. The Board also noted that the investment performance of Initial Class of the fund compared favorably to its benchmark for the three- and five-year periods, although the fund's one-year total return was lower than its benchmark. The Board considered that the variations in performance among the fund's classes reflect the variations in class expenses, which result in lower performance for higher expense classes. The Board also reviewed the fund's performance since inception as well as performance in the current year.
Annual Report
Board Approval of Investment Advisory Contracts and Management Fees - continued
Based on its review, the Board concluded that the nature, extent, and quality of services provided to the fund under the Advisory Contracts should benefit the fund's shareholders.
Competitiveness of Management Fee and Total Expense Ratio. The Board considered the fund's management fee and total expense ratio compared to "mapped groups" of competitive funds and classes. Fidelity creates "mapped groups" by combining similar Lipper investment objective categories that have comparable management fee characteristics. Combining Lipper investment objective categories aids the Board's management fee and total expense ratio comparisons by broadening the competitive group used for comparison and by reducing the number of universes to which various Fidelity funds are compared.
Management Fee. The Board considered two proprietary management fee comparisons for the 12-month periods shown in the chart below. The group of Lipper funds used by the Board for management fee comparisons is referred to below as the "Total Mapped Group." The Total Mapped Group comparison focuses on a fund's standing relative to the total universe of comparable funds available to investors in terms of gross management fees before expense reimbursements or caps. "TMG %" represents the percentage of funds in the Total Mapped Group that had management fees that were lower than the fund's. For example, a TMG % of 22% means that 78% of the funds in the Total Mapped Group had higher management fees than the fund. The "Asset-Size Peer Group" (ASPG) comparison focuses on a fund's standing relative to non-Fidelity funds similar in size to the fund within the Total Mapped Group. The ASPG represents at least 15% of the funds in the Total Mapped Group with comparable asset size and management fee characteristics, subject to a minimum of 50 funds (or all funds in the Total Mapped Group if fewer than 50). Additional information, such as the ASPG quartile in which the fund's management fee ranked, is also included in the chart and considered by the Board.
VIP Strategic Income Portfolio
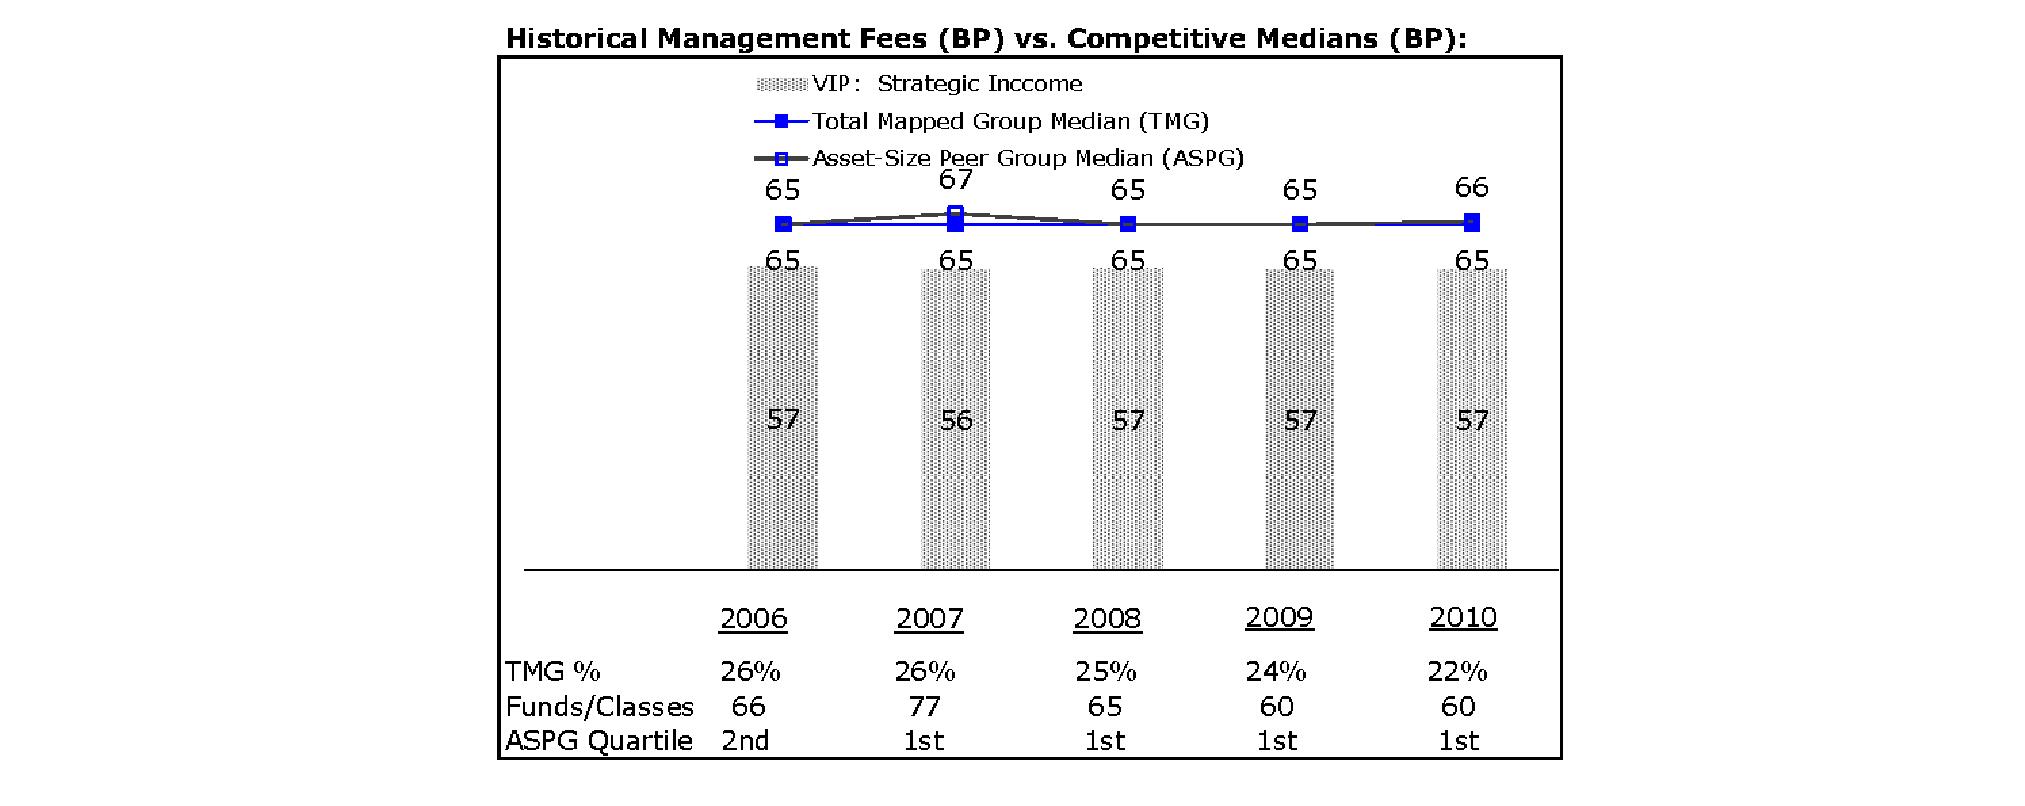
The Board noted that the fund's management fee ranked below the median of its Total Mapped Group and below the median of its ASPG for 2010.
Based on its review, the Board concluded that the fund's management fee is fair and reasonable in light of the services that the fund receives and the other factors considered.
Total Expense Ratio. In its review of each class's total expense ratio, the Board considered the fund's management fee as well as other fund or class expenses, as applicable, such as transfer agent fees, pricing and bookkeeping fees, fund-paid 12b-1 fees, and custodial, legal, and audit fees. The Board also noted the effects of any waivers and reimbursements on fees and expenses. As part of its review, the Board also considered the current and historical total expense ratios of each class of the fund compared to competitive fund median expenses. Each class of the fund is compared to those funds and classes in the Total Mapped Group (used by the Board for management fee comparisons) that have a similar sales load structure.
The Board noted that the total expense ratio of each of Initial Class and Investor Class ranked below its competitive median for 2010, the total expense ratio of Service Class ranked equal to its competitive median for 2010, and the total expense ratio of Service Class 2 ranked above its competitive median for 2010. The Board considered that various factors, including 12b-1 fees and relatively higher other expenses in the case of small fund size, can affect total expense ratios. The Board noted that the total expense ratio of Service Class 2 was above the median due to 12b-1 fees and that the funds and classes in the Total Mapped Group that have a similar sales load structure included classes with no 12b-1 fees. Excluding the 12b-1 fees, the total expense ratio of Service Class 2 ranked below its competitive median for 2010. The Board also noted that Investor Class has higher transfer agent fees than traditional variable annuity classes because it is designed for lower cost annuity products, where the majority of servicing costs are incorporated into the funds' total expense ratios rather than being paid at the annuity level. The Board noted that the fund offers multiple classes, each of which has a different 12b-1 fee structure, and that the multiple structures are intended to offer a range of pricing options for the intermediary market. The Board also noted that the total expense ratios of the classes vary primarily by the level of their 12b-1 fees, although differences in transfer agent fees may also cause expenses to vary from class to class.
Annual Report
Fees Charged to Other Fidelity Clients. The Board also considered Fidelity fee structures and other information with respect to clients of FMR and its affiliates, such as other mutual funds advised or subadvised by FMR or its affiliates, pension plan clients, and other institutional clients. In March 2010, the Board created an ad hoc joint committee with the board of other Fidelity funds (the Committee) to review and compare Fidelity's institutional investment advisory business with its business of providing services to the Fidelity funds, including the differences in services provided, fees charged, and costs incurred, as well as competition in their respective marketplaces.
Based on its review of total expense ratios and fees charged to other Fidelity clients, the Board concluded that the total expense ratio of each class of the fund was reasonable, although Service Class 2 was above the median of the universe presented for comparison, in light of the services that the fund and its shareholders receive and the other factors considered, including the findings of the Committee.
Costs of the Services and Profitability. The Board considered the revenues earned and the expenses incurred by Fidelity in conducting the business of developing, marketing, distributing, managing, administering and servicing the fund and its shareholders. The Board also considered the level of Fidelity's profits in respect of all the Fidelity funds.
On an annual basis, FMR presents to the Board Fidelity's profitability for the fund. Fidelity calculates the profitability for each fund, as well as aggregate profitability for groups of Fidelity funds and all Fidelity funds, using a series of detailed revenue and cost allocation methodologies which originate with the books and records of Fidelity on which Fidelity's audited financial statements are based. The Audit Committee of the Board reviews any significant changes from the prior year's methodologies.
PricewaterhouseCoopers LLP (PwC), independent registered public accounting firm and auditor to Fidelity and certain Fidelity funds, has been engaged annually by the Board as part of the Board's assessment of Fidelity's profitability analysis. PwC's engagement includes the review and assessment of Fidelity's methodologies used in determining the revenues and expenses attributable to Fidelity's mutual fund business, and completion of agreed-upon procedures surrounding the mathematical accuracy of fund profitability and its conformity to allocation methodologies. After considering PwC's reports issued under the engagement and information provided by Fidelity, the Board concluded that while other allocation methods may also be reasonable, Fidelity's profitability methodologies are reasonable in all material respects.
The Board also reviewed Fidelity's non-fund businesses and fall-out benefits related to the mutual fund business as well as cases where Fidelity's affiliates may benefit from or be related to the fund's business.
The Board considered the costs of the services provided by and the profits realized by Fidelity in connection with the operation of the fund and was satisfied that the profitability was not excessive in the circumstances.
Economies of Scale. The Board considered whether there have been economies of scale in respect of the management of the Fidelity funds, whether the Fidelity funds (including the fund) have appropriately benefited from any such economies of scale, and whether there is potential for realization of any further economies of scale. The Board considered the extent to which the fund will benefit from economies of scale through increased services to the fund, through waivers or reimbursements, or through fee or expense reductions. The Board also noted that in 2009, it and the board of other Fidelity funds created an ad hoc committee (the Economies of Scale Committee) to analyze whether FMR attains economies of scale in respect of the management and servicing of the Fidelity funds, whether the Fidelity funds have appropriately benefited from such economies of scale, and whether there is potential for realization of any further economies of scale.
The Board recognized that the fund's management contract incorporates a "group fee" structure, which provides for lower group fee rates as total fund assets under FMR's management increase, and for higher group fee rates as total fund assets under FMR's management decrease. FMR calculates the group fee rates based on a tiered asset "breakpoint" schedule that varies based on asset class. The Board considered that the group fee is designed to deliver the benefits of economies of scale to fund shareholders when total Fidelity fund assets increase, even if assets of any particular fund are unchanged or have declined, because some portion of Fidelity's costs are attributable to services provided to all Fidelity funds, and all funds benefit if those costs can be allocated among more assets. The Board concluded that, given the group fee structure, fund shareholders will benefit from lower management fees as assets under FMR's management increase at the fund complex level, regardless of whether Fidelity achieves any such economies of scale.
The Board concluded, taking into account the analysis of the Economies of Scale Committee, that any potential economies of scale are being appropriately shared between fund shareholders and Fidelity.
Additional Information Requested by the Board. In order to develop fully the factual basis for consideration of the Fidelity funds' Advisory Contracts, the Board requested and received additional information on certain topics, including: (i) Fidelity's fund profitability methodology, profitability trends for certain funds, and the impact of certain factors on fund profitability results; (ii) portfolio manager changes that have occurred during the past year and the amount of the investment that each portfolio manager has made in the Fidelity fund(s) that he or she manages; (iii) Fidelity's compensation structure for portfolio managers, research analysts, and other key personnel, including its effects on fund profitability, the rationale for the compensation structure, and the extent to which current market conditions have affected retention and recruitment; (iv) the compensation paid to fund sub-advisers on behalf of the Fidelity funds; (v) Fidelity's fee structures and rationale for recommending different fees among different categories of funds and classes, as well as Fidelity's voluntary waiver of its fees to maintain minimum yields for certain money market funds and classes; (vi) the reasons why certain expenses affect various funds and classes differently; (vii) Fidelity's transfer agent fees, expenses, and services and how the benefits of decreased costs and new efficiencies can be shared across all of the Fidelity funds; (viii) the reasons for and consequences of changes to certain product lines compared to competitors; (ix) the allocation of and historical trends in Fidelity's realization of fall-out benefits; and (x) explanations regarding the relative total expense ratios of certain funds and classes, total expense competitive trends, and actions that might be taken by FMR to reduce total expense ratios for certain funds and classes or to achieve further economies of scale.
Annual Report
Board Approval of Investment Advisory Contracts and Management Fees - continued
Based on its evaluation of all of the conclusions noted above, and after considering all factors it believed relevant, the Board ultimately concluded that the advisory fee structures are fair and reasonable, and that the fund's Advisory Contracts should be renewed.
Annual Report
Investment Adviser
Fidelity Management & Research Company
Boston, MA
Investment Sub-Advisers
FMR Co., Inc.
Fidelity Investments Money Management, Inc.
FIL Investments (Japan) Limited
FIL Investment Advisors
FIL Investment Advisors (U.K.) Ltd.
Fidelity Management & Research (U.K.) Inc.
Fidelity Management & Research (Japan) Inc.
Fidelity Management & Research (Hong Kong) Limited
General Distributor
Fidelity Distributors Corporation
Boston, MA
Transfer and Service Agents
Fidelity Investments Institutional Operations Company, Inc.
Boston, MA
Fidelity Service Company, Inc.
Boston, MA
Custodian
State Street Bank and Trust Company
Quincy, MA
VIPSI-ANN-0212
1.796350.109
Item 2. Code of Ethics
As of the end of the period, December 31, 2011, Variable Insurance Products Fund V (the trust) has adopted a code of ethics, as defined in Item 2 of Form N-CSR, that applies to its President and Treasurer and its Chief Financial Officer. A copy of the code of ethics is filed as an exhibit to this Form N-CSR.
Item 3. Audit Committee Financial Expert
The Board of Trustees of the trust has determined that Marie L. Knowles is an audit committee financial expert, as defined in Item 3 of Form N-CSR. Ms. Knowles is independent for purposes of Item 3 of Form N-CSR.
Item 4. Principal Accountant Fees and Services
Fees and Services
The following table presents fees billed by Deloitte & Touche LLP, the member firms of Deloitte Touche Tohmatsu, and their respective affiliates (collectively, "Deloitte Entities") in each of the last two fiscal years for services rendered to Asset Manager Portfolio, Asset Manager: Growth Portfolio, Freedom 2005 Portfolio, Freedom 2010 Portfolio, Freedom 2015 Portfolio, Freedom 2020 Portfolio, Freedom 2025 Portfolio, Freedom 2030 Portfolio, Freedom 2035 Portfolio, Freedom 2040 Portfolio, Freedom 2045 Portfolio, Freedom 2050 Portfolio, Freedom Income Portfolio, Freedom Lifetime Income I Portfolio, Freedom Lifetime Income II Portfolio, Freedom Lifetime Income III Portfolio and Investment Grade Bond Portfolio (the "Funds"):
Services Billed by Deloitte Entities
December 31, 2011 FeesA
| Audit Fees | Audit-Related Fees | Tax Fees | All Other Fees |
Asset Manager Portfolio | $31,000 | $- | $7,100 | $500 |
Asset Manager: Growth Portfolio | $31,000 | $- | $4,900 | $300 |
Freedom 2005 Portfolio | $22,000 | $- | $4,600 | $300 |
Freedom 2010 Portfolio | $22,000 | $- | $4,600 | $300 |
Freedom 2015 Portfolio | $22,000 | $- | $4,600 | $300 |
Freedom 2020 Portfolio | $22,000 | $- | $4,600 | $300 |
Freedom 2025 Portfolio | $22,000 | $- | $4,600 | $300 |
Freedom 2030 Portfolio | $22,000 | $- | $4,600 | $300 |
Freedom 2035 Portfolio | $20,000 | $- | $4,600 | $300 |
Freedom 2040 Portfolio | $20,000 | $- | $4,600 | $300 |
Freedom 2045 Portfolio | $20,000 | $- | $4,600 | $300 |
Freedom 2050 Portfolio | $20,000 | $- | $4,600 | $300 |
Freedom Income Portfolio | $22,000 | $- | $4,600 | $300 |
Freedom Lifetime Income I Portfolio | $22,000 | $- | $4,600 | $300 |
Freedom Lifetime Income II Portfolio | $22,000 | $- | $4,600 | $300 |
Freedom Lifetime Income III Portfolio | $22,000 | $- | $4,600 | $300 |
Investment Grade Bond Portfolio | $36,000 | $- | $5,700 | $600 |
December 31, 2010 FeesA
| Audit Fees | Audit-Related Fees | Tax Fees | All Other Fees |
Asset Manager Portfolio | $32,000 | $- | $7,000 | $- |
Asset Manager: Growth Portfolio | $32,000 | $- | $4,800 | $- |
Freedom 2005 Portfolio | $23,000 | $- | $4,500 | $- |
Freedom 2010 Portfolio | $23,000 | $- | $4,500 | $- |
Freedom 2015 Portfolio | $23,000 | $- | $4,500 | $- |
Freedom 2020 Portfolio | $23,000 | $- | $4,500 | $- |
Freedom 2025 Portfolio | $23,000 | $- | $4,500 | $- |
Freedom 2030 Portfolio | $23,000 | $- | $4,500 | $- |
Freedom 2035 Portfolio | $17,000 | $- | $4,500 | $- |
Freedom 2040 Portfolio | $17,000 | $- | $4,500 | $- |
Freedom 2045 Portfolio | $17,000 | $- | $4,500 | $- |
Freedom 2050 Portfolio | $17,000 | $- | $4,500 | $- |
Freedom Income Portfolio | $23,000 | $- | $4,500 | $- |
Freedom Lifetime Income I Portfolio | $23,000 | $- | $4,500 | $- |
Freedom Lifetime Income II Portfolio | $23,000 | $- | $4,500 | $- |
Freedom Lifetime Income III Portfolio | $23,000 | $- | $4,500 | $- |
Investment Grade Bond Portfolio | $34,000 | $- | $5,600 | $- |
A Amounts may reflect rounding.
The following table presents fees billed by PricewaterhouseCoopers LLP ("PwC") in each of the last two fiscal years for services rendered to FundsManager 20% Portfolio, FundsManager 50% Portfolio, FundsManager 60%, FundsManager 70% Portfolio, FundsManager 85% Portfolio, Investor Freedom 2005 Portfolio, Investor Freedom 2010 Portfolio, Investor Freedom 2015 Portfolio, Investor Freedom 2020 Portfolio, Investor Freedom 2025 Portfolio, Investor Freedom 2030 Portfolio, Investor Freedom Income Portfolio, and Strategic Income Portfolio (the "Funds"):
Services Billed by PwC
December 31, 2011 FeesA
| Audit Fees | Audit-Related Fees | Tax Fees | All Other Fees |
FundsManager 20% Portfolio | $29,000 | $- | $2,600 | $- |
FundsManager 50% Portfolio | $29,000 | $- | $2,600 | $- |
FundsManager 60% Portfolio | $29,000 | $- | $2,600 | $- |
FundsManager 70% Portfolio | $29,000 | $- | $2,600 | $- |
FundsManager 85% Portfolio | $29,000 | $- | $2,600 | $- |
Investor Freedom 2005 Portfolio | $29,000 | $- | $2,600 | $- |
Investor Freedom 2010 Portfolio | $29,000 | $- | $2,600 | $- |
Investor Freedom 2015 Portfolio | $29,000 | $- | $2,600 | $- |
Investor Freedom 2020 Portfolio | $29,000 | $- | $2,600 | $- |
Investor Freedom 2025 Portfolio | $29,000 | $- | $2,600 | $- |
Investor Freedom 2030 Portfolio | $29,000 | $- | $2,600 | $- |
Investor Freedom Income Portfolio | $29,000 | $- | $2,600 | $- |
Strategic Income Portfolio | $71,000 | $- | $3,500 | $2,000 |
December 31, 2010 FeesA
| Audit Fees | Audit-Related Fees | Tax Fees | All Other Fees |
FundsManager 20% Portfolio | $29,000 | $- | $2,600 | $100 |
FundsManager 50% Portfolio | $29,000 | $- | $2,600 | $100 |
FundsManager 60% Portfolio | $29,000 | $- | $2,600 | $100 |
FundsManager 70% Portfolio | $29,000 | $- | $2,600 | $100 |
FundsManager 85% Portfolio | $29,000 | $- | $2,600 | $100 |
Investor Freedom 2005 Portfolio | $29,000 | $- | $2,600 | $100 |
Investor Freedom 2010 Portfolio | $29,000 | $- | $2,600 | $100 |
Investor Freedom 2015 Portfolio | $29,000 | $- | $2,600 | $100 |
Investor Freedom 2020 Portfolio | $29,000 | $- | $2,600 | $100 |
Investor Freedom 2025 Portfolio | $29,000 | $- | $2,600 | $100 |
Investor Freedom 2030 Portfolio | $29,000 | $- | $2,600 | $100 |
Investor Freedom Income Portfolio | $29,000 | $- | $2,600 | $100 |
Strategic Income Portfolio | $70,000 | $- | $3,400 | $2,100 |
A Amounts may reflect rounding.
The following table presents fees billed by PwC and Deloitte Entities that were required to be approved by the Audit Committee for services that relate directly to the operations and financial reporting of the Funds and that are rendered on behalf of Fidelity Management & Research Company ("FMR") and entities controlling, controlled by, or under common control with FMR (not including any sub-adviser whose role is primarily portfolio management and is subcontracted with or overseen by another investment adviser) that provide ongoing services to the Funds ("Fund Service Providers"):
Services Billed by Deloitte Entities
| December 31, 2011A | December 31, 2010A |
Audit-Related Fees | $610,000 | $645,000 |
Tax Fees | $- | $- |
All Other Fees | $430,000 | $840,000 |
A Amounts may reflect rounding.
Services Billed by PwC
| December 31, 2011A | December 31, 2010A |
Audit-Related Fees | $3,845,000 | $2,505,000 |
Tax Fees | $- | $- |
All Other Fees | $- | $510,000 |
A Amounts may reflect rounding.
"Audit-Related Fees" represent fees billed for assurance and related services that are reasonably related to the performance of the fund audit or the review of the fund's financial statements and that are not reported under Audit Fees.
"Tax Fees" represent fees billed for tax compliance, tax advice or tax planning that relate directly to the operations and financial reporting of the fund.
"All Other Fees" represent fees billed for services provided to the fund or Fund Service Provider, a significant portion of which are assurance related, that relate directly to the operations and financial reporting of the fund, excluding those services that are reported under Audit Fees, Audit-Related Fees or Tax Fees.
Assurance services must be performed by an independent public accountant.
* * *
The aggregate non-audit fees billed by PwC and Deloitte Entities for services rendered to the Funds, FMR (not including any sub-adviser whose role is primarily portfolio management and is subcontracted with or overseen by another investment adviser), and any Fund Service Provider for each of the last two fiscal years of the Funds are as follows:
Billed By | December 31, 2011 A | December 31, 2010 A |
PwC | $5,085,000 | $5,050,000 |
Deloitte Entities | $1,225,000 | $1,660,000 |
A Amounts may reflect rounding.
The trust's Audit Committee has considered non-audit services that were not pre-approved that were provided by PwC and Deloitte Entities to Fund Service Providers to be compatible with maintaining the independence of PwC and Deloitte Entities in their audits of the Funds, taking into account representations from PwC and Deloitte Entities, in accordance with Public Company Accounting Oversight Board rules, regarding their independence from the Funds and their related entities and FMR's review of the appropriateness and permissibility under applicable law of such non-audit services prior to their provision to the Fund Service Providers.
Audit Committee Pre-Approval Policies and Procedures
The trust's Audit Committee must pre-approve all audit and non-audit services provided by a fund's independent registered public accounting firm relating to the operations or financial reporting of the fund. Prior to the commencement of any audit or non-audit services to a fund, the Audit Committee reviews the services to determine whether they are appropriate and permissible under applicable law.
The Audit Committee has adopted policies and procedures to, among other purposes, provide a framework for the Committee's consideration of non-audit services by the audit firms that audit the Fidelity funds. The policies and procedures require that any non-audit service provided by a fund audit firm to a Fidelity fund and any non-audit service provided by a fund auditor to a Fund Service Provider that relates directly to the operations and financial reporting of a Fidelity fund ("Covered Service") are subject to approval by the Audit Committee before such service is provided.
All Covered Services must be approved in advance of provision of the service either: (i) by formal resolution of the Audit Committee, or (ii) by oral or written approval of the service by the Chair of the Audit Committee (or if the Chair is unavailable, such other member of the Audit Committee as may be designated by the Chair to act in the Chair's absence). The approval contemplated by (ii) above is permitted where the Treasurer determines that action on such an engagement is necessary before the next meeting of the Audit Committee.
Non-audit services provided by a fund audit firm to a Fund Service Provider that do not relate directly to the operations and financial reporting of a Fidelity fund are reported to the Audit Committee on a periodic basis.
Non-Audit Services Approved Pursuant to Rule 2-01(c)(7)(i)(C) and (ii) of Regulation S-X ("De Minimis Exception")
There were no non-audit services approved or required to be approved by the Audit Committee pursuant to the De Minimis Exception during the Funds' last two fiscal years relating to services provided to (i) the Funds or (ii) any Fund Service Provider that relate directly to the operations and financial reporting of the Funds.
Item 5. Audit Committee of Listed Registrants
Not applicable.
Item 6. Investments
(a) Not applicable.
(b) Not applicable
Item 7. Disclosure of Proxy Voting Policies and Procedures for Closed-End Management Investment Companies
Not applicable.
Item 8. Portfolio Managers of Closed-End Management Investment Companies
Not applicable.
Item 9. Purchase of Equity Securities by Closed-End Management Investment Company and Affiliated Purchasers
Not applicable.
Item 10. Submission of Matters to a Vote of Security Holders
There were no material changes to the procedures by which shareholders may recommend nominees to the trust's Board of Trustees.
Item 11. Controls and Procedures
(a)(i) The President and Treasurer and the Chief Financial Officer have concluded that the disclosure controls and procedures (as defined in Rule 30a-3(c) under the Investment Company Act) for each Fund provide reasonable assurances that material information relating to such Fund is made known to them by the appropriate persons, based on their evaluation of these controls and procedures as of a date within 90 days of the filing date of this report.
(a)(ii) There was no change in a Fund's internal control over financial reporting (as defined in Rule 30a-3(d) under the Investment Company Act) that occurred during the second fiscal quarter of the period covered by this report that has materially affected, or is reasonably likely to materially affect, a Fund's internal control over financial reporting.
Item 12. Exhibits
(a) | (1) | Code of Ethics pursuant to Item 2 of Form N-CSR is filed and attached hereto as EX-99.CODE ETH. |
(a) | (2) | Certification pursuant to Rule 30a-2(a) under the Investment Company Act of 1940 (17 CFR 270.30a-2(a)) is filed and attached hereto as Exhibit 99.CERT. |
(a) | (3) | Not applicable. |
(b) | | Certification pursuant to Rule 30a-2(b) under the Investment Company Act of 1940 (17 CFR 270.30a-2(b)) is furnished and attached hereto as Exhibit 99.906CERT. |
SIGNATURES
Pursuant to the requirements of the Securities Exchange Act of 1934 and the Investment Company Act of 1940, the registrant has duly caused this report to be signed on its behalf by the undersigned, thereunto duly authorized.
Variable Insurance Products Fund V
By: | /s/John R. Hebble |
| John R. Hebble |
| President and Treasurer |
| |
Date: | February 27, 2012 |
Pursuant to the requirements of the Securities Exchange Act of 1934 and the Investment Company Act of 1940, this report has been signed below by the following persons on behalf of the registrant and in the capacities and on the dates indicated.
By: | /s/John R. Hebble |
| John R. Hebble |
| President and Treasurer |
| |
Date: | February 27, 2012 |
By: | /s/Christine Reynolds |
| Christine Reynolds |
| Chief Financial Officer |
| |
Date: | February 27, 2012 |