UNITED STATES
SECURITIES AND EXCHANGE COMMISSION
Washington, D.C. 20549
FORM N-CSR
CERTIFIED SHAREHOLDER REPORT OF REGISTERED
MANAGEMENT INVESTMENT COMPANIES
Investment Company Act file number 811-05361
Variable Insurance Products Fund V
(Exact name of registrant as specified in charter)
82 Devonshire St., Boston, Massachusetts 02109
(Address of principal executive offices) (Zip code)
Scott C. Goebel, Secretary
82 Devonshire St.
Boston, Massachusetts 02109
(Name and address of agent for service)
Registrant's telephone number, including area code: 617-563-7000
Date of fiscal year end: | December 31 |
| |
Date of reporting period: | June 30, 2012 |
This report on Form N-CSR relates solely to the Registrant's Asset Manager Portfolio, Asset Manager: Growth Portfolio, Freedom 2005 Portfolio, Freedom 2010 Portfolio, Freedom 2015 Portfolio, Freedom 2020 Portfolio, Freedom 2025 Portfolio, Freedom 2030 Portfolio, Freedom 2035 Portfolio, Freedom 2040 Portfolio, Freedom 2045 Portfolio, Freedom 2050 Portfolio, Freedom Income Portfolio, Freedom Lifetime Income I Portfolio, Freedom Lifetime Income II Portfolio, Freedom Lifetime Income III Portfolio, FundsManager 20% Portfolio, FundsManager 50% Portfolio, FundsManager 60%, FundsManager 70% Portfolio, FundsManager 85% Portfolio, Investment Grade Bond Portfolio, Investor Freedom 2005 Portfolio, Investor Freedom 2010 Portfolio, Investor Freedom 2015 Portfolio, Investor Freedom 2020 Portfolio, Investor Freedom 2025 Portfolio, Investor Freedom 2030 Portfolio, Investor Freedom Income Portfolio and Strategic Income Portfolio series (each, a "Fund" and collectively, the "Funds").
Item 1. Reports to Stockholders
Fidelity® Variable Insurance Products:
Asset Manager Portfolio
Semiannual Report
June 30, 2012
(Fidelity Cover Art)
Contents
Shareholder Expense Example | (Click Here) | An example of shareholder expenses. |
Investment Changes | (Click Here) | A summary of major shifts in the fund's investments over the past six months. |
Investments | (Click Here) | A complete list of the fund's investments with their
market values. |
Financial Statements | (Click Here) | Statements of assets and liabilities, operations, and
changes in net assets, as well as financial highlights. |
Notes | (Click Here) | Notes to the financial statements. |
To view a fund's proxy voting guidelines and proxy voting record for the 12-month period ended June 30, visit http://www.fidelity.com/proxyvotingresults or visit the Securities and Exchange Commission's (SEC) web site at http://www.sec.gov. You may also call 1-877-208-0098 to request a free copy of the proxy voting guidelines.
Fidelity Variable Insurance Products are separate account options which are purchased through a variable insurance contract.
Standard & Poor's, S&P and S&P 500 are registered service marks of The McGraw-Hill Companies, Inc. and have been licensed for use by Fidelity Distributors Corporation.
Other third party marks appearing herein are the property of their respective owners.
All other marks appearing herein are registered or unregistered trademarks or service marks of FMR LLC or an affiliated company. © 2012 FMR LLC. All rights reserved.
This report and the financial statements contained herein are submitted for the general information of the shareholders of the fund. This report is not authorized for distribution to prospective investors in the fund unless preceded or accompanied by an effective prospectus.
A fund files its complete schedule of portfolio holdings with the SEC for the first and third quarters of each fiscal year on Form N-Q. Forms N-Q are available on the SEC's web site at http://www.sec.gov. A fund's Forms N-Q may be reviewed and copied at the SEC's Public Reference Room in Washington, DC. Information regarding the operation of the SEC's Public Reference Room may be obtained by calling 1-800-SEC-0330. For a complete list of a fund's portfolio holdings, view the most recent holdings listing, semiannual report, or annual report on Fidelity's web site at http://www.fidelity.com, http://www.advisor.fidelity.com, or http://www.401k.com, as applicable.
NOT FDIC INSURED • MAY LOSE VALUE • NO BANK GUARANTEE
Neither the fund nor Fidelity Distributors Corporation is a bank.
Semiannual Report
As a shareholder of the Fund, you incur two types of costs: (1) transaction costs, and (2) ongoing costs, including management fees, distribution and/or service (12b-1) fees and other Fund expenses. This Example is intended to help you understand your ongoing costs (in dollars) of investing in the Fund and to compare these costs with the ongoing costs of investing in other mutual funds.
The Example is based on an investment of $1,000 invested at the beginning of the period and held for the entire period (January 1, 2012 to June 30, 2012).
Actual Expenses
The first line of the accompanying table for each class of the Fund provides information about actual account values and actual expenses. You may use the information in this line, together with the amount you invested, to estimate the expenses that you paid over the period. Simply divide your account value by $1,000.00 (for example, an $8,600 account value divided by $1,000.00 = 8.6), then multiply the result by the number in the first line for a class of the Fund under the heading entitled "Expenses Paid During Period" to estimate the expenses you paid on your account during this period. The estimate of expenses does not include any fees or other expenses of any variable annuity or variable life insurance product. If they were, the estimate of expenses you paid during the period would be higher, and your ending account value would be lower. In addition, the Fund, as a shareholder in the underlying Fidelity Central Funds, will indirectly bear its pro-rata share of the fees and expenses incurred by the underlying Fidelity Central Funds. These fees and expenses are not included in the Fund's annualized expense ratio used to calculate the expense estimate in the table below.
Hypothetical Example for Comparison Purposes
The second line of the accompanying table for each class of the Fund provides information about hypothetical account values and hypothetical expenses based on a Class' actual expense ratio and an assumed rate of return of 5% per year before expenses, which is not the Class' actual return. The hypothetical account values and expenses may not be used to estimate the actual ending account balance or expenses you paid for the period. You may use this information to compare the ongoing costs of investing in the Fund and other funds. To do so, compare this 5% hypothetical example with the 5% hypothetical examples that appear in the shareholder reports of the other funds. The estimate of expenses does not include any fees or other expenses of any variable annuity or variable life insurance product. If they were, the estimate of expenses you paid during the period would be higher, and your ending account value would be lower. In addition, the Fund, as a shareholder in the underlying Fidelity Central Funds, will indirectly bear its pro-rata share of the fees and expenses incurred by the underlying Fidelity Central Funds. These fees and expenses are not included in the Fund's annualized expense ratio used to calculate the expense estimate in the table below.
Please note that the expenses shown in the table are meant to highlight your ongoing costs only and do not reflect any transaction costs. Therefore, the second line of the table is useful in comparing ongoing costs only, and will not help you determine the relative total costs of owning different funds.
| Annualized Expense Ratio | Beginning
Account Value
January 1, 2012 | Ending
Account Value
June 30, 2012 | Expenses Paid
During Period*
January 1, 2012
to June 30, 2012 |
Initial Class | .63% | | | |
Actual | | $ 1,000.00 | $ 1,060.10 | $ 3.23 |
HypotheticalA | | $ 1,000.00 | $ 1,021.73 | $ 3.17 |
Service Class | .74% | | | |
Actual | | $ 1,000.00 | $ 1,059.80 | $ 3.79 |
HypotheticalA | | $ 1,000.00 | $ 1,021.18 | $ 3.72 |
Service Class 2 | .89% | | | |
Actual | | $ 1,000.00 | $ 1,059.00 | $ 4.56 |
HypotheticalA | | $ 1,000.00 | $ 1,020.44 | $ 4.47 |
Investor Class | .71% | | | |
Actual | | $ 1,000.00 | $ 1,060.40 | $ 3.64 |
HypotheticalA | | $ 1,000.00 | $ 1,021.33 | $ 3.57 |
A 5% return per year before expenses
* Expenses are equal to each Class' annualized expense ratio, multiplied by the average account value over the period, multiplied by 182/366 (to reflect the one-half year period). The fees and expenses of the underlying Fidelity Central Funds in which the Fund invests are not included in the Fund's annualized expense ratio.
Semiannual Report
Investment Changes (Unaudited)
The information in the following tables is based on the combined investments of the Fund and its pro-rata share of the investments of Fidelity's Central Funds, other than the Commodity Strategy and Money Market Central Funds. |
Top Five Stocks as of June 30, 2012 |
| % of fund's
net assets | % of fund's net assets
6 months ago |
Apple, Inc. | 2.8 | 2.2 |
United Continental Holdings, Inc. | 1.0 | 0.8 |
Pioneer Natural Resources Co. | 0.7 | 0.6 |
Delta Air Lines, Inc. | 0.6 | 0.5 |
United Health Group, Inc. | 0.6 | 0.5 |
| 5.7 | |
Top Five Bond Issuers as of June 30, 2012 |
(with maturities greater than one year) | % of fund's
net assets | % of fund's net assets
6 months ago |
Fannie Mae | 14.2 | 8.8 |
U.S. Treasury Obligations | 13.2 | 9.8 |
Freddie Mac | 2.7 | 2.8 |
Ginnie Mae | 2.1 | 2.5 |
Wachovia Bank Commercial Mortgage Trust | 0.2 | 0.0 |
| 32.4 | |
Top Five Market Sectors as of June 30, 2012 |
| % of fund's
net assets | % of fund's net assets
6 months ago |
Consumer Discretionary | 12.5 | 12.5 |
Financials | 9.8 | 11.1 |
Information Technology | 9.1 | 8.2 |
Health Care | 6.2 | 5.1 |
Energy | 6.2 | 9.2 |
Asset Allocation (% of fund's net assets) |
As of June 30, 2012 * | As of December 31, 2011 ** |
 | Stock Class and
Equity Futures*** 46.3% | | | Stock Class and
Equity Futures**** 46.1% | |
 | Bond Class 44.5% | | | Bond Class 45.3% | |
 | Short-Term Class 9.2% | | | Short-Term Class 8.6% | |
* Foreign investments | 15.5% | | ** Foreign investments | 18.0% | |

*** Includes investment in Fidelity Commodity Strategy Central Fund of 0.5%.
**** Includes investment in Fidelity Commodity Strategy Central Fund of 1.4%.
Asset allocations in the pie charts reflect the categorization of assets as defined in the Fund's prospectus in effect as of the time periods indicated above. Financial Statements categorizations conform to accounting standards and will differ from the pie chart. Percentages are adjusted for the effect of futures contracts and swap contracts, if applicable.
An unaudited holdings listing for the Fund, which presents direct holdings as well as the pro-rata share of any securities and other investments held indirectly through its investment in underlying Fidelity Central Funds, other than the Commodity Strategy and Money Market Central Funds, is available at advisor.fidelity.com.
Semiannual Report
Investments June 30, 2012 (Unaudited)
Showing Percentage of Net Assets
Common Stocks - 34.6% |
| Shares | | Value |
CONSUMER DISCRETIONARY - 9.6% |
Auto Components - 0.5% |
BorgWarner, Inc. (a) | 10,700 | | $ 701,813 |
Delphi Automotive PLC | 56,200 | | 1,433,100 |
TRW Automotive Holdings Corp. (a) | 118,200 | | 4,345,032 |
| | 6,479,945 |
Automobiles - 0.2% |
Harley-Davidson, Inc. | 61,200 | | 2,798,676 |
Hotels, Restaurants & Leisure - 0.6% |
Arcos Dorados Holdings, Inc. | 47,500 | | 702,050 |
Las Vegas Sands Corp. | 39,200 | | 1,704,808 |
Panera Bread Co. Class A (a) | 18,400 | | 2,565,696 |
Yum! Brands, Inc. | 40,900 | | 2,634,778 |
| | 7,607,332 |
Household Durables - 1.5% |
D.R. Horton, Inc. | 257,900 | | 4,740,202 |
KB Home | 197,600 | | 1,936,480 |
PulteGroup, Inc. (a) | 637,200 | | 6,818,040 |
Toll Brothers, Inc. (a) | 186,300 | | 5,538,699 |
| | 19,033,421 |
Internet & Catalog Retail - 0.6% |
Expedia, Inc. | 90,300 | | 4,340,721 |
Priceline.com, Inc. (a) | 4,600 | | 3,056,792 |
| | 7,397,513 |
Leisure Equipment & Products - 0.2% |
Polaris Industries, Inc. | 32,200 | | 2,301,656 |
Media - 0.7% |
CBS Corp. Class B | 116,300 | | 3,812,314 |
The Walt Disney Co. | 104,800 | | 5,082,800 |
| | 8,895,114 |
Multiline Retail - 0.7% |
Dollar Tree, Inc. (a) | 60,000 | | 3,228,000 |
Macy's, Inc. | 179,500 | | 6,165,825 |
| | 9,393,825 |
Specialty Retail - 2.4% |
Dick's Sporting Goods, Inc. | 30,800 | | 1,478,400 |
Home Depot, Inc. | 110,500 | | 5,855,395 |
Limited Brands, Inc. | 132,400 | | 5,630,972 |
Lowe's Companies, Inc. | 141,100 | | 4,012,884 |
O'Reilly Automotive, Inc. (a) | 23,300 | | 1,951,841 |
PetSmart, Inc. | 63,200 | | 4,308,976 |
Pier 1 Imports, Inc. | 58,100 | | 954,583 |
TJX Companies, Inc. | 153,100 | | 6,572,583 |
| | 30,765,634 |
Textiles, Apparel & Luxury Goods - 2.2% |
Arezzo Industria e Comercio SA | 82,600 | | 1,229,644 |
Burberry Group PLC | 62,300 | | 1,292,818 |
Coach, Inc. | 51,300 | | 3,000,024 |
Crocs, Inc. (a) | 74,700 | | 1,206,405 |
Michael Kors Holdings Ltd. | 110,163 | | 4,609,220 |
|
| Shares | | Value |
NIKE, Inc. Class B | 38,500 | | $ 3,379,530 |
Prada SpA | 250,200 | | 1,688,320 |
PVH Corp. | 28,200 | | 2,193,678 |
Ralph Lauren Corp. | 20,000 | | 2,801,200 |
Under Armour, Inc. Class A (sub. vtg.) (a) | 16,700 | | 1,577,816 |
Vera Bradley, Inc. (a) | 76,600 | | 1,614,728 |
VF Corp. | 20,700 | | 2,762,415 |
| | 27,355,798 |
TOTAL CONSUMER DISCRETIONARY | | 122,028,914 |
CONSUMER STAPLES - 1.3% |
Beverages - 0.3% |
Monster Beverage Corp. (a) | 57,200 | | 4,072,640 |
Food & Staples Retailing - 0.1% |
Drogasil SA | 92,906 | | 936,692 |
Food Products - 0.3% |
Green Mountain Coffee Roasters, Inc. (a) | 128,800 | | 2,805,264 |
Orion Corp. | 1,198 | | 995,920 |
| | 3,801,184 |
Personal Products - 0.4% |
Hengan International Group Co. Ltd. | 288,000 | | 2,805,453 |
Nu Skin Enterprises, Inc. Class A | 45,200 | | 2,119,880 |
| | 4,925,333 |
Tobacco - 0.2% |
British American Tobacco PLC sponsored ADR | 19,300 | | 1,970,916 |
Souza Cruz SA | 94,700 | | 1,389,971 |
| | 3,360,887 |
TOTAL CONSUMER STAPLES | | 17,096,736 |
ENERGY - 3.4% |
Energy Equipment & Services - 0.4% |
Cameron International Corp. (a) | 49,200 | | 2,101,332 |
Ensco PLC Class A | 10,000 | | 469,700 |
McDermott International, Inc. (a) | 145,400 | | 1,619,756 |
Noble Corp. | 26,300 | | 855,539 |
| | 5,046,327 |
Oil, Gas & Consumable Fuels - 3.0% |
Anadarko Petroleum Corp. | 60,400 | | 3,998,480 |
Concho Resources, Inc. (a) | 66,100 | | 5,626,432 |
Continental Resources, Inc. (a)(d) | 91,400 | | 6,089,068 |
EOG Resources, Inc. | 18,900 | | 1,703,079 |
Genel Energy PLC | 69,000 | | 661,354 |
Hess Corp. | 15,100 | | 656,095 |
Kosmos Energy Ltd. (a) | 62,000 | | 685,100 |
Oasis Petroleum, Inc. (a) | 73,000 | | 1,765,140 |
Occidental Petroleum Corp. | 46,700 | | 4,005,459 |
Pioneer Natural Resources Co. | 99,000 | | 8,732,790 |
SM Energy Co. | 23,800 | | 1,168,818 |
Common Stocks - continued |
| Shares | | Value |
ENERGY - continued |
Oil, Gas & Consumable Fuels - continued |
Whiting Petroleum Corp. (a) | 15,500 | | $ 637,360 |
Williams Companies, Inc. | 88,600 | | 2,553,452 |
| | 38,282,627 |
TOTAL ENERGY | | 43,328,954 |
FINANCIALS - 2.4% |
Capital Markets - 0.8% |
Apollo Global Management LLC Class A | 312,700 | | 3,877,480 |
Morgan Stanley | 419,400 | | 6,119,046 |
| | 9,996,526 |
Diversified Financial Services - 1.1% |
Bank of America Corp. | 340,500 | | 2,785,290 |
Citigroup, Inc. | 211,900 | | 5,808,179 |
JPMorgan Chase & Co. | 129,100 | | 4,612,743 |
Moody's Corp. | 34,600 | | 1,264,630 |
| | 14,470,842 |
Real Estate Investment Trusts - 0.3% |
American Tower Corp. | 61,000 | | 4,264,510 |
Real Estate Management & Development - 0.1% |
CBRE Group, Inc. (a) | 48,600 | | 795,096 |
Thrifts & Mortgage Finance - 0.1% |
Nationstar Mortgage Holdings, Inc. (d) | 31,000 | | 667,120 |
TOTAL FINANCIALS | | 30,194,094 |
HEALTH CARE - 4.9% |
Biotechnology - 1.9% |
Alexion Pharmaceuticals, Inc. (a) | 40,900 | | 4,061,370 |
ARIAD Pharmaceuticals, Inc. (a) | 51,700 | | 889,757 |
Biogen Idec, Inc. (a) | 39,100 | | 5,645,258 |
Clovis Oncology, Inc. | 20,000 | | 433,600 |
Gilead Sciences, Inc. (a) | 55,500 | | 2,846,040 |
InterMune, Inc. (a) | 38,200 | | 456,490 |
Medivation, Inc. (a) | 25,800 | | 2,358,120 |
Progenics Pharmaceuticals, Inc. (a) | 22,100 | | 216,138 |
Synageva BioPharma Corp. (a) | 14,500 | | 588,120 |
Vertex Pharmaceuticals, Inc. (a) | 113,800 | | 6,363,696 |
| | 23,858,589 |
Health Care Providers & Services - 1.5% |
Express Scripts Holding Co. (a) | 52,600 | | 2,936,658 |
Health Net, Inc. (a) | 33,900 | | 822,753 |
HMS Holdings Corp. (a) | 60,800 | | 2,025,248 |
Humana, Inc. | 73,900 | | 5,722,816 |
UnitedHealth Group, Inc. | 137,100 | | 8,020,350 |
| | 19,527,825 |
Health Care Technology - 0.2% |
SXC Health Solutions Corp. (a) | 23,600 | | 2,343,774 |
Pharmaceuticals - 1.3% |
Allergan, Inc. | 19,200 | | 1,777,344 |
|
| Shares | | Value |
Elan Corp. PLC sponsored ADR (a) | 271,600 | | $ 3,962,644 |
Perrigo Co. | 26,000 | | 3,066,180 |
Shire PLC sponsored ADR | 27,300 | | 2,358,447 |
Valeant Pharmaceuticals International, Inc. (Canada) (a) | 90,550 | | 4,061,898 |
ViroPharma, Inc. (a) | 62,300 | | 1,476,510 |
| | 16,703,023 |
TOTAL HEALTH CARE | | 62,433,211 |
INDUSTRIALS - 3.6% |
Airlines - 2.2% |
Copa Holdings SA Class A | 26,600 | | 2,193,968 |
Delta Air Lines, Inc. (a) | 771,025 | | 8,442,724 |
United Continental Holdings, Inc. (a) | 504,170 | | 12,266,456 |
US Airways Group, Inc. (a) | 425,100 | | 5,666,583 |
| | 28,569,731 |
Building Products - 0.2% |
Owens Corning (a) | 68,500 | | 1,954,990 |
Commercial Services & Supplies - 0.2% |
Aggreko PLC | 53,900 | | 1,749,089 |
Swisher Hygiene, Inc. (a) | 135,158 | | 307,755 |
| | 2,056,844 |
Construction & Engineering - 0.2% |
Fluor Corp. | 13,300 | | 656,222 |
MasTec, Inc. (a) | 45,600 | | 685,824 |
Quanta Services, Inc. (a) | 44,700 | | 1,075,929 |
| | 2,417,975 |
Electrical Equipment - 0.1% |
Hubbell, Inc. Class B | 11,900 | | 927,486 |
Machinery - 0.2% |
Chart Industries, Inc. (a) | 19,300 | | 1,327,068 |
Kennametal, Inc. | 37,800 | | 1,253,070 |
| | 2,580,138 |
Marine - 0.0% |
DryShips, Inc. (a) | 72,400 | | 158,556 |
Professional Services - 0.3% |
Qualicorp SA | 179,000 | | 1,564,969 |
Robert Half International, Inc. | 92,400 | | 2,639,868 |
| | 4,204,837 |
Trading Companies & Distributors - 0.2% |
Air Lease Corp. Class A (a) | 53,400 | | 1,035,426 |
Mills Estruturas e Servicos de Engenharia SA | 85,900 | | 1,180,403 |
| | 2,215,829 |
TOTAL INDUSTRIALS | | 45,086,386 |
INFORMATION TECHNOLOGY - 7.9% |
Communications Equipment - 0.6% |
Acme Packet, Inc. (a) | 42,200 | | 787,030 |
Common Stocks - continued |
| Shares | | Value |
INFORMATION TECHNOLOGY - continued |
Communications Equipment - continued |
QUALCOMM, Inc. | 126,400 | | $ 7,037,952 |
Riverbed Technology, Inc. (a) | 19,100 | | 308,465 |
| | 8,133,447 |
Computers & Peripherals - 3.1% |
3D Systems Corp. (a)(d) | 31,300 | | 1,068,582 |
Apple, Inc. (a) | 60,700 | | 35,448,800 |
EMC Corp. (a) | 70,600 | | 1,809,478 |
Lenovo Group Ltd. | 1,086,000 | | 926,718 |
| | 39,253,578 |
Internet Software & Services - 1.3% |
Bankrate, Inc. | 82,000 | | 1,507,980 |
Cornerstone OnDemand, Inc. (a) | 60,200 | | 1,433,362 |
eBay, Inc. (a) | 26,200 | | 1,100,662 |
Facebook, Inc.: | | | |
Class A | 24,600 | | 765,552 |
Class B (a)(g) | 8,621 | | 241,457 |
IAC/InterActiveCorp | 45,300 | | 2,065,680 |
Liquidity Services, Inc. (a) | 54,500 | | 2,789,855 |
Rackspace Hosting, Inc. (a) | 54,300 | | 2,385,942 |
VeriSign, Inc. (a) | 89,200 | | 3,886,444 |
| | 16,176,934 |
IT Services - 0.3% |
Teradata Corp. (a) | 27,400 | | 1,973,074 |
Visa, Inc. Class A | 18,500 | | 2,287,155 |
| | 4,260,229 |
Semiconductors & Semiconductor Equipment - 1.3% |
ASML Holding NV | 76,200 | | 3,918,204 |
Freescale Semiconductor Holdings I Ltd. (a) | 139,800 | | 1,432,950 |
Intel Corp. | 231,100 | | 6,158,815 |
NXP Semiconductors NV (a) | 204,900 | | 4,763,925 |
Skyworks Solutions, Inc. (a) | 25,100 | | 686,987 |
| | 16,960,881 |
Software - 1.3% |
Citrix Systems, Inc. (a) | 55,100 | | 4,625,094 |
CommVault Systems, Inc. (a) | 29,600 | | 1,467,272 |
Informatica Corp. (a) | 71,300 | | 3,020,268 |
Microsoft Corp. | 51,600 | | 1,578,444 |
RealPage, Inc. (a)(d) | 51,400 | | 1,190,424 |
salesforce.com, Inc. (a) | 15,300 | | 2,115,378 |
Splunk, Inc. | 2,500 | | 70,250 |
VMware, Inc. Class A (a) | 20,900 | | 1,902,736 |
| | 15,969,866 |
TOTAL INFORMATION TECHNOLOGY | | 100,754,935 |
|
| Shares | | Value |
MATERIALS - 1.2% |
Chemicals - 1.1% |
CF Industries Holdings, Inc. | 13,100 | | $ 2,537,994 |
Eastman Chemical Co. | 56,900 | | 2,866,053 |
FMC Corp. | 41,600 | | 2,224,768 |
Huntsman Corp. | 83,800 | | 1,084,372 |
LyondellBasell Industries NV Class A | 42,000 | | 1,691,340 |
PetroLogistics LP | 42,000 | | 451,920 |
Rockwood Holdings, Inc. | 31,800 | | 1,410,330 |
Westlake Chemical Corp. | 39,100 | | 2,043,366 |
| | 14,310,143 |
Metals & Mining - 0.1% |
First Quantum Minerals Ltd. | 70,400 | | 1,244,671 |
TOTAL MATERIALS | | 15,554,814 |
TELECOMMUNICATION SERVICES - 0.3% |
Wireless Telecommunication Services - 0.3% |
SBA Communications Corp. Class A (a) | 55,800 | | 3,183,390 |
TOTAL COMMON STOCKS (Cost $378,869,179) |
439,661,434
|
Fixed-Income Funds - 46.8% |
| | | |
Fidelity Emerging Markets Debt Central Fund (f) | 762,300 | | 7,889,807 |
Fidelity Floating Rate Central Fund (f) | 371,905 | | 37,744,683 |
Fidelity High Income Central Fund 1 (f) | 394,024 | | 39,020,192 |
Fidelity Inflation-Protected Bond Index Central Fund (f) | 432,304 | | 43,602,181 |
Fidelity VIP Investment Grade Central Fund (f) | 4,253,569 | | 465,553,147 |
TOTAL FIXED-INCOME FUNDS (Cost $559,626,051) |
593,810,010
|
Equity Funds - 10.5% |
| | | |
Domestic Equity Funds - 0.5% |
Fidelity Commodity Strategy Central Fund (f) | 630,241 | | 6,466,272 |
International Equity Funds - 10.0% |
Fidelity Emerging Markets Equity Central Fund (f) | 98,155 | | 18,045,832 |
Fidelity International Equity Central Fund (f) | 1,768,103 | | 108,349,352 |
TOTAL INTERNATIONAL EQUITY FUNDS | | 126,395,184 |
TOTAL EQUITY FUNDS (Cost $162,765,926) |
132,861,456
|
U.S. Treasury Obligations - 0.1% |
| Principal Amount | | Value |
U.S. Treasury Bills, yield at date of purchase 0.06% to 0.08% 8/2/12 to 8/23/12 (e)
(Cost $1,229,891) | | $ 1,230,000 | | $ 1,229,928 |
Money Market Funds - 8.9% |
| Shares | | |
Fidelity Cash Central Fund, 0.17% (b) | 96,640,680 | | 96,640,680 |
Fidelity Money Market Central Fund, 0.38% (b) | 10,394,656 | | 10,394,656 |
Fidelity Securities Lending Cash Central Fund, 0.18% (b)(c) | 6,509,725 | | 6,509,725 |
TOTAL MONEY MARKET FUNDS (Cost $113,545,061) |
113,545,061
|
TOTAL INVESTMENT PORTFOLIO - 100.9% (Cost $1,216,036,108) | 1,281,107,889 |
NET OTHER ASSETS (LIABILITIES) - (0.9)% | (11,837,948) |
NET ASSETS - 100% | $ 1,269,269,941 |
Futures Contracts |
| Expiration Date | | Underlying Face Amount at Value | | Unrealized Appreciation/(Depreciation) |
Purchased |
Equity Index Contracts |
79 CME E-mini S&P 500 Index Contracts | Sept. 2012 | | $ 5,357,780 | | $ 307,784 |
31 NYSE E-mini MSCI Emerging Markets Index Contracts | Sept. 2012 | | 1,464,285 | | 71,350 |
TOTAL EQUITY INDEX CONTRACTS | | $ 6,822,065 | | $ 379,134 |
|
The face value of futures purchased as a percentage of net assets is 0.5% |
Legend |
(a) Non-income producing |
(b) Affiliated fund that is available only to investment companies and other accounts managed by Fidelity Investments. The rate quoted is the annualized seven-day yield of the fund at period end. A complete unaudited listing of the fund's holdings as of its most recent quarter end is available upon request. In addition, each Fidelity Central Fund's financial statements are available on the SEC's website or upon request. |
(c) Investment made with cash collateral received from securities on loan. |
(d) Security or a portion of the security is on loan at period end. |
(e) Security or a portion of the security was pledged to cover margin requirements for futures contracts. At the period end, the value of securities pledged amounted to $1,229,928. |
(f) Affiliated fund that is available only to investment companies and other accounts managed by Fidelity Investments. A complete unaudited schedule of portfolio holdings for each Fidelity Central Fund is filed with the SEC for the first and third quarters of each fiscal year on Form N-Q and is available upon request or at the SEC's web site at www.sec.gov. An unaudited holdings listing for the Fund, which presents direct holdings as well as the pro rata share of securities and other investments held indirectly through its investment in underlying Fidelity Central Funds, other than the Commodity Strategy and Money Market Central Funds, is available at advisor.fidelity.com. In addition, each Fidelity Central Fund's financial statements are available on the SEC's web site or upon request. |
(g) Restricted securities - Investment in securities not registered under the Securities Act of 1933 (excluding 144A issues). At the end of the period, the value of restricted securities (excluding 144A issues) amounted to $241,457 or 0.0% of net assets. |
Additional information on each restricted holding is as follows: |
Security | Acquisition Date | Acquisition Cost |
Facebook, Inc. Class B | 5/19/11 | $ 215,930 |
Affiliated Central Funds |
Information regarding fiscal year to date income earned by the Fund from investments in Fidelity Central Funds is as follows: |
Fund | Income earned |
Fidelity Cash Central Fund | $ 54,642 |
Fidelity Emerging Markets Debt Central Fund | 252,571 |
Fidelity Emerging Markets Equity Central Fund | 279,679 |
Fidelity Floating Rate Central Fund | 1,198,182 |
Fidelity High Income Central Fund 1 | 1,432,043 |
Fidelity International Equity Central Fund | 2,631,897 |
Fidelity Money Market Central Fund | 20,763 |
Fidelity Securities Lending Cash Central Fund | 130,037 |
Fidelity VIP Investment Grade Central Fund | 6,683,730 |
Total | $ 12,683,544 |
Additional information regarding the Fund's fiscal year to date purchases and sales, including the ownership percentage, of the non Money Market Central Funds is as follows: |
Fund | Value,
beginning of
period | Purchases | Sales
Proceeds | Value,
end of
period | % ownership,
end of
period |
Fidelity Commodity Strategy Central Fund | $ 17,527,726 | $ 1,335,876 | $ 12,150,383 | $ 6,466,272 | 0.8% |
Fidelity Emerging Markets Debt Central Fund | 7,362,876 | 254,055 | - | 7,889,807 | 7.4% |
Fidelity Emerging Markets Equity Central Fund | 22,958,221 | 2,217,442 | 8,860,666 | 18,045,832 | 8.6% |
Fidelity Floating Rate Central Fund | 50,197,537 | 3,133,923 | 17,106,036 | 37,744,683 | 2.6% |
Fidelity High Income Central Fund 1 | 40,230,514 | 1,432,043 | 4,124,419 | 39,020,192 | 7.7% |
Fidelity Inflation-Protected Bond Index Central Fund | - | 46,927,656 | 3,685,512 | 43,602,181 | 7.1% |
Fidelity International Equity Central Fund | 121,293,806 | 5,408,090 | 21,701,570 | 108,349,352 | 7.9% |
Fidelity VIP Investment Grade Central Fund | 450,082,516 | 16,788,260 | 9,018,276 | 465,553,147 | 11.1% |
Total | $ 709,653,196 | $ 77,497,345 | $ 76,646,862 | $ 726,671,466 | |
Other Information |
The following is a summary of the inputs used, as of June 30, 2012, involving the Fund's assets and liabilities carried at fair value. The inputs or methodology used for valuing securities may not be an indication of the risk associated with investing in those securities. For more information on valuation inputs, and their aggregation into the levels used in the table below, please refer to the Security Valuation section in the accompanying Notes to Financial Statements. |
Valuation Inputs at Reporting Date: |
Description | Total | Level 1 | Level 2 | Level 3 |
Investments in Securities: | | | | |
Equities: | | | | |
Consumer Discretionary | $ 122,028,914 | $ 120,340,594 | $ 1,688,320 | $ - |
Consumer Staples | 17,096,736 | 13,295,363 | 3,801,373 | - |
Energy | 43,328,954 | 43,328,954 | - | - |
Financials | 30,194,094 | 30,194,094 | - | - |
Health Care | 62,433,211 | 62,433,211 | - | - |
Industrials | 45,086,386 | 44,778,631 | 307,755 | - |
Information Technology | 100,754,935 | 99,586,760 | 1,168,175 | - |
Materials | 15,554,814 | 15,554,814 | - | - |
Telecommunication Services | 3,183,390 | 3,183,390 | - | - |
U.S. Government and Government Agency Obligations | 1,229,928 | - | 1,229,928 | - |
Fixed-Income Funds | 593,810,010 | 593,810,010 | - | - |
Money Market Funds | 113,545,061 | 113,545,061 | - | - |
Equity Funds | 132,861,456 | 132,861,456 | - | - |
Total Investments in Securities: | $ 1,281,107,889 | $ 1,272,912,338 | $ 8,195,551 | $ - |
Derivative Instruments: | | | | |
Assets | | | | |
Futures Contracts | $ 379,134 | $ 379,134 | $ - | $ - |
Value of Derivative Instruments |
The following table is a summary of the Fund's value of derivative instruments by risk exposure as of June 30, 2012. For additional information on derivative instruments, please refer to the Derivative Instruments section in the accompanying Notes to Financial Statements. |
Risk Exposure /
Derivative Type | Value |
| Asset | Liability |
Equity Risk | | |
Futures Contracts (a) | $ 379,134 | $ - |
Total Value of Derivatives | $ 379,134 | $ - |
(a) Reflects cumulative appreciation/(depreciation) on futures contracts as disclosed on the Schedule of Investments. Only the period end variation margin is separately disclosed on the Statement of Assets and Liabilities. |
Other Information |
The information in the following tables is based on the combined investments of the Fund and its pro-rata share of the investments of Fidelity's Central Funds, other than the Commodity Strategy and Money Market Central Funds. |
The composition of credit quality ratings as a percentage of net assets is as follows (Unaudited): |
U.S. Government and U.S. Government Agency Obligations | 32.2% |
AAA,AA,A | 5.0% |
BBB | 5.7% |
BB | 2.6% |
B | 2.9% |
CCC,CC,C | 0.7% |
D | 0.0%** |
Not Rated | 0.6% |
Equities* | 44.6% |
Short-Term Investments and Net Other Assets | 5.7% |
| 100.0% |
* Includes investment in Fidelity Commodity Strategy Central Fund of 0.5%. |
** Amount represents less than 0.1% |
We have used ratings from Moody's Investors Service, Inc. Where Moody's® ratings are not available, we have used S&P® ratings. All ratings are as of the date indicated and do not reflect subsequent changes. |
Distribution of investments by country or territory of incorporation, as a percentage of total net assets, is as follows. (Unaudited) |
United States of America | 83.9% |
United Kingdom | 2.8% |
Japan | 1.6% |
Netherlands | 1.2% |
Canada | 1.1% |
Others (Individually Less Than 1%) | 9.4% |
| 100.0% |
See accompanying notes which are an integral part of the financial statements.
Semiannual Report
Statement of Assets and Liabilities
| June 30, 2012 (Unaudited) |
| | |
Assets | | |
Investment in securities, at value (including securities loaned of $6,717,890) - See accompanying schedule: Unaffiliated issuers (cost $380,099,070) | $ 440,891,362 | |
Fidelity Central Funds (cost $835,937,038) | 840,216,527 | |
Total Investments (cost $1,216,036,108) | | $ 1,281,107,889 |
Cash | | 45,288 |
Receivable for investments sold | | 1,567,050 |
Receivable for fund shares sold | | 70,546 |
Dividends receivable | | 207,828 |
Distributions receivable from Fidelity Central Funds | | 55,876 |
Receivable for daily variation margin on futures contracts | | 520,439 |
Other receivables | | 68,251 |
Total assets | | 1,283,643,167 |
| | |
Liabilities | | |
Payable for investments purchased | $ 6,747,962 | |
Payable for fund shares redeemed | 351,347 | |
Accrued management fee | 530,890 | |
Distribution and service plan fees payable | 7,203 | |
Other affiliated payables | 146,562 | |
Other payables and accrued expenses | 79,537 | |
Collateral on securities loaned, at value | 6,509,725 | |
Total liabilities | | 14,373,226 |
| | |
Net Assets | | $ 1,269,269,941 |
Net Assets consist of: | | |
Paid in capital | | $ 1,208,524,565 |
Undistributed net investment income | | 10,323,457 |
Accumulated undistributed net realized gain (loss) on investments and foreign currency transactions | | (15,028,083) |
Net unrealized appreciation (depreciation) on investments and assets and liabilities in foreign currencies | | 65,450,002 |
Net Assets | | $ 1,269,269,941 |
Statement of Assets and Liabilities - continued
| June 30, 2012 (Unaudited) |
| | |
Initial Class:
Net Asset Value, offering price and redemption price per share ($1,116,705,408 ÷ 76,306,074 shares) | | $ 14.63 |
| | |
Service Class:
Net Asset Value, offering price and redemption price per share ($8,328,866 ÷ 573,102 shares) | | $ 14.53 |
| | |
Service Class 2:
Net Asset Value, offering price and redemption price per share ($31,533,831 ÷ 2,194,348 shares) | | $ 14.37 |
| | |
Investor Class:
Net Asset Value, offering price and redemption price per share ($112,701,836 ÷ 7,734,557 shares) | | $ 14.57 |
See accompanying notes which are an integral part of the financial statements.
Semiannual Report
Statement of Operations
Six months ended June 30, 2012 (Unaudited) |
| | |
Investment Income | | |
Dividends | | $ 1,826,907 |
Interest | | 202 |
Income from Fidelity Central Funds | | 12,683,544 |
Total income | | 14,510,653 |
| | |
Expenses | | |
Management fee | $ 3,297,535 | |
Transfer agent fees | 513,981 | |
Distribution and service plan fees | 45,305 | |
Accounting and security lending fees | 265,434 | |
Custodian fees and expenses | 16,454 | |
Independent trustees' compensation | 2,396 | |
Appreciation in deferred trustee compensation account | 63 | |
Audit | 25,573 | |
Legal | 4,566 | |
Miscellaneous | 7,728 | |
Total expenses before reductions | 4,179,035 | |
Expense reductions | (43,946) | 4,135,089 |
Net investment income (loss) | | 10,375,564 |
Realized and Unrealized Gain (Loss) Net realized gain (loss) on: | | |
Investment securities: | | |
Unaffiliated issuers | 18,790,280 | |
Fidelity Central Funds | 2,596,743 | |
Foreign currency transactions | (7,927) | |
Futures contracts | 480,396 | |
Capital gain distributions from Fidelity Central Funds | 1,090,594 | |
Total net realized gain (loss) | | 22,950,086 |
Change in net unrealized appreciation (depreciation) on: Investment securities | 42,167,347 | |
Assets and liabilities in foreign currencies | 373 | |
Futures contracts | 380,790 | |
Total change in net unrealized appreciation (depreciation) | | 42,548,510 |
Net gain (loss) | | 65,498,596 |
Net increase (decrease) in net assets resulting from operations | | $ 75,874,160 |
Statement of Changes in Net Assets
| Six months ended June 30, 2012
(Unaudited) | Year ended
December 31, 2011 |
Increase (Decrease) in Net Assets | | |
Operations | | |
Net investment income (loss) | $ 10,375,564 | $ 25,911,343 |
Net realized gain (loss) | 22,950,086 | 82,535,607 |
Change in net unrealized appreciation (depreciation) | 42,548,510 | (140,707,672) |
Net increase (decrease) in net assets resulting from operations | 75,874,160 | (32,260,722) |
Distributions to shareholders from net investment income | - | (25,842,847) |
Distributions to shareholders from net realized gain | - | (6,349,020) |
Total distributions | - | (32,191,867) |
Share transactions - net increase (decrease) | (58,938,654) | (108,450,453) |
Total increase (decrease) in net assets | 16,935,506 | (172,903,042) |
| | |
Net Assets | | |
Beginning of period | 1,252,334,435 | 1,425,237,477 |
End of period (including undistributed net investment income of $10,323,457 and distributions in excess of net investment income of $52,107, respectively) | $ 1,269,269,941 | $ 1,252,334,435 |
See accompanying notes which are an integral part of the financial statements.
Semiannual Report
Financial Highlights - Initial Class
| Six months ended June 30, 2012 | Years ended December 31, |
| (Unaudited) | 2011 | 2010 | 2009 | 2008 | 2007 |
Selected Per-Share Data | | | | | | |
Net asset value, beginning of period | $ 13.80 | $ 14.54 | $ 13.00 | $ 10.31 | $ 16.58 | $ 15.71 |
Income from Investment Operations | | | | | | |
Net investment income (loss) E | .12 | .28 | .23 | .26 | .36 | .44 |
Net realized and unrealized gain (loss) | .71 | (.66) | 1.62 | 2.73 | (4.75) | 1.88 |
Total from investment operations | .83 | (.38) | 1.85 | 2.99 | (4.39) | 2.32 |
Distributions from net investment income | - | (.29) | (.24) | (.28) | (.37) | (1.00) |
Distributions from net realized gain | - | (.07) | (.07) | (.02) | (1.51) | (.45) |
Total distributions | - | (.36) | (.31) | (.30) | (1.88) | (1.45) |
Net asset value, end of period | $ 14.63 | $ 13.80 | $ 14.54 | $ 13.00 | $ 10.31 | $ 16.58 |
Total Return B,C,D | 6.01% | (2.56)% | 14.26% | 29.11% | (28.76)% | 15.57% |
Ratios to Average Net Assets F,H | | | | | | |
Expenses before reductions | .63% A | .63% | .63% | .67% | .63% | .63% |
Expenses net of fee waivers, if any | .63% A | .63% | .63% | .67% | .63% | .63% |
Expenses net of all reductions | .62% A | .62% | .62% | .66% | .63% | .62% |
Net investment income (loss) | 1.61% A | 1.91% | 1.72% | 2.31% | 2.62% | 2.75% |
Supplemental Data | | | | | | |
Net assets, end of period (000 omitted) | $ 1,116,705 | $ 1,108,494 | $ 1,279,306 | $ 1,249,955 | $ 1,093,133 | $ 1,791,647 |
Portfolio turnover rate G | 51% A | 56% | 54% | 95% | 90% | 99% |
A Annualized
B Total returns for periods of less than one year are not annualized.
C Total returns do not reflect charges attributable to your insurance company's separate account. Inclusion of these charges would reduce the total returns shown.
D Total returns would have been lower if certain expenses had not been reduced during the applicable periods shown.
E Calculated based on average shares outstanding during the period.
F Fees and expenses of any underlying Fidelity Central Funds are not included in the Fund's expense ratio. The Fund indirectly bears its proportionate share of the expenses of any underlying Fidelity Central Funds.
G Amount does not include the portfolio activity of any underlying Fidelity Central Funds.
H Expense ratios reflect operating expenses of the class. Expenses before reductions do not reflect amounts reimbursed by the investment adviser or reductions from brokerage service arrangements or reductions from other expense offset arrangements and do not represent the amount paid by the class during periods when reimbursements or reductions occur. Expenses net of fee waivers reflect expenses after reimbursement by the investment adviser but prior to reductions from brokerage service arrangements or other expense offset arrangements. Expenses net of all reductions represent the net expenses paid by the class.
Financial Highlights - Service Class
| Six months ended June 30, 2012 | Years ended December 31, |
| (Unaudited) | 2011 | 2010 | 2009 | 2008 | 2007 |
Selected Per-Share Data | | | | | | |
Net asset value, beginning of period | $ 13.71 | $ 14.45 | $ 12.92 | $ 10.25 | $ 16.48 | $ 15.61 |
Income from Investment Operations | | | | | | |
Net investment income (loss) E | .11 | .26 | .22 | .25 | .34 | .42 |
Net realized and unrealized gain (loss) | .71 | (.65) | 1.60 | 2.71 | (4.71) | 1.86 |
Total from investment operations | .82 | (.39) | 1.82 | 2.96 | (4.37) | 2.28 |
Distributions from net investment income | - | (.28) | (.22) | (.27) | (.35) | (.96) |
Distributions from net realized gain | - | (.07) | (.07) | (.02) | (1.51) | (.45) |
Total distributions | - | (.35) | (.29) | (.29) | (1.86) | (1.41) |
Net asset value, end of period | $ 14.53 | $ 13.71 | $ 14.45 | $ 12.92 | $ 10.25 | $ 16.48 |
Total Return B,C,D | 5.98% | (2.69)% | 14.14% | 28.94% | (28.82)% | 15.36% |
Ratios to Average Net Assets F,H | | | | | | |
Expenses before reductions | .74% A | .75% | .75% | .79% | .75% | .74% |
Expenses net of fee waivers, if any | .74% A | .74% | .74% | .79% | .75% | .74% |
Expenses net of all reductions | .74% A | .74% | .73% | .78% | .75% | .74% |
Net investment income (loss) | 1.50% A | 1.79% | 1.60% | 2.18% | 2.50% | 2.63% |
Supplemental Data | | | | | | |
Net assets, end of period (000 omitted) | $ 8,329 | $ 8,042 | $ 8,613 | $ 8,230 | $ 7,413 | $ 13,530 |
Portfolio turnover rate G | 51% A | 56% | 54% | 95% | 90% | 99% |
A Annualized
B Total returns for periods of less than one year are not annualized.
C Total returns do not reflect charges attributable to your insurance company's separate account. Inclusion of these charges would reduce the total returns shown.
D Total returns would have been lower if certain expenses had not been reduced during the applicable periods shown.
E Calculated based on average shares outstanding during the period.
F Fees and expenses of any underlying Fidelity Central Funds are not included in the Fund's expense ratio. The Fund indirectly bears its proportionate share of the expenses of any underlying Fidelity Central Funds.
G Amount does not include the portfolio activity of any underlying Fidelity Central Funds.
H Expense ratios reflect operating expenses of the class. Expenses before reductions do not reflect amounts reimbursed by the investment adviser or reductions from brokerage service arrangements or reductions from other expense offset arrangements and do not represent the amount paid by the class during periods when reimbursements or reductions occur. Expenses net of fee waivers reflect expenses after reimbursement by the investment adviser but prior to reductions from brokerage service arrangements or other expense offset arrangements. Expenses net of all reductions represent the net expenses paid by the class.
See accompanying notes which are an integral part of the financial statements.
Semiannual Report
Financial Highlights - Service Class 2
| Six months ended June 30, 2012 | Years ended December 31, |
| (Unaudited) | 2011 | 2010 | 2009 | 2008 | 2007 |
Selected Per-Share Data | | | | | | |
Net asset value, beginning of period | $ 13.57 | $ 14.30 | $ 12.79 | $ 10.15 | $ 16.34 | $ 15.47 |
Income from Investment Operations | | | | | | |
Net investment income (loss) E | .10 | .24 | .19 | .23 | .32 | .39 |
Net realized and unrealized gain (loss) | .70 | (.65) | 1.59 | 2.68 | (4.67) | 1.85 |
Total from investment operations | .80 | (.41) | 1.78 | 2.91 | (4.35) | 2.24 |
Distributions from net investment income | - | (.25) | (.20) | (.25) | (.33) | (.92) |
Distributions from net realized gain | - | (.07) | (.07) | (.02) | (1.51) | (.45) |
Total distributions | - | (.32) | (.27) | (.27) | (1.84) | (1.37) |
Net asset value, end of period | $ 14.37 | $ 13.57 | $ 14.30 | $ 12.79 | $ 10.15 | $ 16.34 |
Total Return B,C,D | 5.90% | (2.82)% | 13.96% | 28.76% | (28.95)% | 15.24% |
Ratios to Average Net Assets F,H | | | | | | |
Expenses before reductions | .89% A | .90% | .90% | .93% | .90% | .89% |
Expenses net of fee waivers, if any | .89% A | .89% | .89% | .93% | .90% | .89% |
Expenses net of all reductions | .88% A | .89% | .88% | .92% | .89% | .89% |
Net investment income (loss) | 1.35% A | 1.64% | 1.46% | 2.04% | 2.36% | 2.48% |
Supplemental Data | | | | | | |
Net assets, end of period (000 omitted) | $ 31,534 | $ 32,508 | $ 39,148 | $ 39,475 | $ 37,360 | $ 59,670 |
Portfolio turnover rate G | 51% A | 56% | 54% | 95% | 90% | 99% |
A Annualized
B Total returns for periods of less than one year are not annualized.
C Total returns do not reflect charges attributable to your insurance company's separate account. Inclusion of these charges would reduce the total returns shown.
D Total returns would have been lower if certain expenses had not been reduced during the applicable periods shown.
E Calculated based on average shares outstanding during the period.
F Fees and expenses of any underlying Fidelity Central Funds are not included in the Fund's expense ratio. The Fund indirectly bears its proportionate share of the expenses of any underlying Fidelity Central Funds.
G Amount does not include the portfolio activity of any underlying Fidelity Central Funds.
H Expense ratios reflect operating expenses of the class. Expenses before reductions do not reflect amounts reimbursed by the investment adviser or reductions from brokerage service arrangements or reductions from other expense offset arrangements and do not represent the amount paid by the class during periods when reimbursements or reductions occur. Expenses net of fee waivers reflect expenses after reimbursement by the investment adviser but prior to reductions from brokerage service arrangements or other expense offset arrangements. Expenses net of all reductions represent the net expenses paid by the class.
Financial Highlights - Investor Class
| Six months ended June 30, 2012 | Years ended December 31, |
| (Unaudited) | 2011 | 2010 | 2009 | 2008 | 2007 |
Selected Per-Share Data | | | | | | |
Net asset value, beginning of period | $ 13.74 | $ 14.49 | $ 12.96 | $ 10.28 | $ 16.53 | $ 15.67 |
Income from Investment Operations | | | | | | |
Net investment income (loss) E | .11 | .27 | .22 | .25 | .34 | .42 |
Net realized and unrealized gain (loss) | .72 | (.67) | 1.61 | 2.73 | (4.72) | 1.87 |
Total from investment operations | .83 | (.40) | 1.83 | 2.98 | (4.38) | 2.29 |
Distributions from net investment income | - | (.28) | (.23) | (.28) | (.36) | (.98) |
Distributions from net realized gain | - | (.07) | (.07) | (.02) | (1.51) | (.45) |
Total distributions | - | (.35) | (.30) | (.30) | (1.87) | (1.43) |
Net asset value, end of period | $ 14.57 | $ 13.74 | $ 14.49 | $ 12.96 | $ 10.28 | $ 16.53 |
Total Return B,C,D | 6.04% | (2.72)% | 14.16% | 29.01% | (28.79)% | 15.38% |
Ratios to Average Net Assets F,H | | | | | | |
Expenses before reductions | .71% A | .71% | .72% | .77% | .73% | .75% |
Expenses net of fee waivers, if any | .71% A | .71% | .71% | .77% | .73% | .75% |
Expenses net of all reductions | .71% A | .70% | .70% | .76% | .72% | .74% |
Net investment income (loss) | 1.53% A | 1.82% | 1.63% | 2.21% | 2.53% | 2.63% |
Supplemental Data | | | | | | |
Net assets, end of period (000 omitted) | $ 112,702 | $ 103,290 | $ 98,171 | $ 67,641 | $ 51,264 | $ 46,555 |
Portfolio turnover rate G | 51% A | 56% | 54% | 95% | 90% | 99% |
A Annualized
B Total returns for periods of less than one year are not annualized.
C Total returns do not reflect charges attributable to your insurance company's separate account. Inclusion of these charges would reduce the total returns shown.
D Total returns would have been lower if certain expenses had not been reduced during the applicable periods shown.
E Calculated based on average shares outstanding during the period.
F Fees and expenses of any underlying Fidelity Central Funds are not included in the Fund's expense ratio. The Fund indirectly bears its proportionate share of the expenses of any underlying Fidelity Central Funds.
G Amount does not include the portfolio activity of any underlying Fidelity Central Funds.
H Expense ratios reflect operating expenses of the class. Expenses before reductions do not reflect amounts reimbursed by the investment adviser or reductions from brokerage service arrangements or reductions from other expense offset arrangements and do not represent the amount paid by the class during periods when reimbursements or reductions occur. Expenses net of fee waivers reflect expenses after reimbursement by the investment adviser but prior to reductions from brokerage service arrangements or other expense offset arrangements. Expenses net of all reductions represent the net expenses paid by the class.
See accompanying notes which are an integral part of the financial statements.
Semiannual Report
Notes to Financial Statements
For the period ended June 30, 2012 (Unaudited)
1. Organization.
VIP Asset Manager Portfolio (the Fund) is a fund of Variable Insurance Products Fund V (the Trust) and is authorized to issue an unlimited number of shares. The Trust is registered under the Investment Company Act of 1940, as amended (the 1940 Act), as an open-end management investment company organized as a Massachusetts business trust. Shares of the Fund may only be purchased by insurance companies for the purpose of funding variable annuity or variable life insurance contracts. The Fund offers the following classes of shares: Initial Class shares, Service Class shares, Service Class 2 shares and Investor Class shares. All classes have equal rights and voting privileges, except for matters affecting a single class. Investment income, realized and unrealized capital gains and losses, the common expenses of the Fund, and certain fund-level expense reductions, if any, are allocated on a pro-rata basis to each class based on the relative net assets of each class to the total net assets of the Fund. Each class differs with respect to transfer agent and distribution and service plan fees incurred. Certain expense reductions may also differ by class.
2. Investments in Fidelity Central Funds.
The Fund invests in Fidelity Central Funds, which are open-end investment companies available only to other investment companies and accounts managed by Fidelity Management & Research Company (FMR) and its affiliates. The Fund's Schedule of Investments lists each of the Fidelity Central Funds held as of period end, if any, as an investment of the Fund, but does not include the underlying holdings of each Fidelity Central Fund. As an Investing Fund, the Fund indirectly bears its proportionate share of the expenses of the underlying Fidelity Central Funds.
Based on its investment objective, each Fidelity Central Fund may invest or participate in various investment vehicles or strategies that are similar to those of the Fund. These strategies are consistent with the investment objectives of the Fund and may involve certain economic risks which may cause a decline in value of each of the Fidelity Central Funds and thus a decline in the value of the Fund. The following summarizes the Fund's investment in each Fidelity Central Fund.
Fidelity Central Fund | Investment Manager | Investment Objective | Investment Practices | Expense Ratio* |
Fidelity Commodity Strategy Central Fund | FMR Co., Inc. (FMRC) | Seeks to provide investment returns that correspond to the performance of the commodities market. | Investment in wholly-owned subsidiary organized under the laws of the Cayman Islands Futures Repurchase Agreements Restricted Securities Swap Agreements | .04% |
Fidelity Emerging Markets Debt Central Fund | FMRC | Seeks high total return by normally investing in debt securities of issuers in emerging markets and other debt investments that are tied economically to emerging markets. | Foreign Securities Repurchase Agreements Restricted Securities | .01% |
Fidelity Emerging Markets Equity Central Fund | FMRC | Seeks capital appreciation by investing primarily in equity securities of issuers in emerging markets. | Foreign Securities Futures Repurchase Agreements | .14% |
Fidelity International Equity Central Fund | FMRC | Seeks capital appreciation by investing primarily in non-U.S. based common stocks, including securities of issuers located in emerging markets. | Foreign Securities Futures Repurchase Agreements | .02% |
Fidelity Floating Rate Central Fund | FMRC | Seeks a high level of income by normally investing in floating rate loans and other floating rate securities. | Loans & Direct Debt Instruments Repurchase Agreements Restricted Securities | .00%** |
Fidelity High Income Central Fund 1 | FMRC | Seeks a high level of income and may also seek capital appreciation by investing primarily in debt securities, preferred stocks, and convertible securities, with an emphasis on lower-quality debt securities. | Delayed Delivery & When Issued Securities Loans & Direct Debt Instruments Repurchase Agreements Restricted Securities | .00%** |
Fidelity Inflation-Protected Bond Index Central Fund | Fidelity Investment Money Management, Inc. (FIMM) | Seeks to provide investment results that correspond to the performance of the inflation-protected United States Treasury market, and may invest in derivatives. | n/a | .00%** |
VIP Investment Grade Central Fund | FIMM | Seeks a high level of current income by normally investing in investment-grade debt securities and repurchase agreements. | Delayed Delivery & When Issued Securities Repurchase Agreements Restricted Securities Swap Agreements | .00%** |
Fidelity Money Market Central Funds | FIMM | Seeks to obtain a high level of current income consistent with the preservation of capital and liquidity. | Short-term Investments | .00%** |
* Expenses expressed as a percentage of average net assets and are as of each underlying Central Fund's most recent annual or semi-annual shareholder report.
** Amount represents less than 0.01%.
Semiannual Report
Notes to Financial Statements (Unaudited) - continued
2. Investments in Fidelity Central Funds - continued
An unaudited holdings listing for the Fund, which presents direct holdings as well as the pro-rata share of any securities and other investments held indirectly through its investment in underlying Fidelity Central Funds, other than the Commodity Strategy and Money Market Central Funds, is available at advisor.fidelity.com. A complete unaudited list of holdings for each Fidelity Central Fund is available upon request or at the Securities and Exchange Commission (the SEC) web site at www.sec.gov. In addition, the financial statements of the Fidelity Central Funds which contain the significant accounting policies (including security valuation policies) of those funds are available on the SEC web site or upon request.
3. Significant Accounting Policies.
The financial statements have been prepared in conformity with accounting principles generally accepted in the United States of America (GAAP), which require management to make certain estimates and assumptions at the date of the financial statements. Actual results could differ from those estimates. Subsequent events, if any, through the date that the financial statements were issued have been evaluated in the preparation of the financial statements. The following summarizes the significant accounting policies of the Fund:
Security Valuation. Investments are valued as of 4:00 p.m. Eastern time on the last calendar day of the period. In accordance with valuation policies and procedures approved by the Board of Trustees (the Board), the Fund attempts to obtain prices from one or more third party pricing vendor or broker to value its investments. When current market prices, quotations or rates are not readily available or reliable, securities will be fair valued in good faith by the FMR Fair Value Committee (the Committee), in accordance with procedures adopted by the Fund's Board. Factors used in determining fair value vary by security type and may include market or security specific events, changes in interest rates and credit quality. The frequency with which these procedures are used cannot be predicted and they may be utilized to a significant extent. The Committee oversees the Fund's valuation policies and procedures and is responsible for approving and reporting to the Board all fair value determinations.
The Fund categorizes the inputs to valuation techniques used to value its investments into a disclosure hierarchy consisting of three levels as shown below:
Level 1 - quoted prices in active markets for identical investments
Level 2 - other significant observable inputs (including quoted prices for similar investments, interest rates, prepayment speeds, etc.)
Level 3 - unobservable inputs (including the Fund's own assumptions based on the best information available)
Valuation techniques used to value the Fund's investments by major category are as follows:
Equity securities, including restricted securities, for which market quotations are readily available, are valued at the last reported sale price or official closing price as reported by a third party pricing vendor on the primary market or exchange on which they are traded and are categorized as Level 1 in the hierarchy. In the event there were no sales during the day or closing prices are not available, securities are valued at the last quoted bid price or may be valued using the last available price and are generally categorized as Level 2 in the hierarchy. For foreign equity securities, when significant market or security specific events arise, comparisons to the valuation of American Depositary Receipts (ADRs), futures contracts, Exchange-Traded Funds (ETFs) and certain indexes as well as quoted prices for similar securities are used and are categorized as Level 2 in the hierarchy. Utilizing these techniques may result in transfers between Level 1 and Level 2. For restricted equity securities and private placements where observable inputs are limited, assumptions about market activity and risk are used and these securities are categorized as Level 3 in the hierarchy.
Debt securities, including restricted securities, are valued based on evaluated prices received from third party pricing vendors or from brokers who make markets in such securities. For U.S. government and government agency obligations, pricing vendors utilize matrix pricing which considers yield or price of bonds of comparable quality, coupon, maturity and type as well as broker-supplied prices and are generally categorized as Level 2 in the hierarchy. When independent prices are unavailable or unreliable, debt securities may be valued utilizing pricing methodologies which consider similar factors that would be used by third party pricing vendors. These are generally categorized as Level 2 in the hierarchy but may be Level 3 depending on the circumstances.
Futures contracts are valued at the settlement price established each day by the board of trade or exchange on which they are traded and are categorized as Level 1 in the hierarchy. Investments in open-end mutual funds, including the Fidelity Central Funds, are valued at their closing net asset value each business day and are categorized as Level 1 in the hierarchy.
Changes in valuation techniques may result in transfers in or out of an assigned level within the disclosure hierarchy. The aggregate value of investments by input level, as of June 30, 2012, is included at the end of the Fund's Schedule of Investments.
Semiannual Report
3. Significant Accounting Policies - continued
Foreign Currency Translation. The Fund may use foreign currency contracts to facilitate transactions in foreign-denominated securities. Gains and losses from these transactions may arise from changes in the value of the foreign currency or if the counterparties do not perform under the contracts' terms.
Foreign-denominated assets, including investment securities, and liabilities are translated into U.S. dollars at the exchange rates at period end. Purchases and sales of investment securities, income and dividends received and expenses denominated in foreign currencies are translated into U.S. dollars at the exchange rate in effect on the transaction date.
The effects of exchange rate fluctuations on investments are included with the net realized and unrealized gain (loss) on investment securities. Other foreign currency transactions resulting in realized and unrealized gain (loss) are disclosed separately.
Investment Transactions and Income. For financial reporting purposes, the Fund's investment holdings and NAV include trades executed through the end of the last business day of the period. The NAV per share for processing shareholder transactions is calculated as of the close of business of the New York Stock Exchange (NYSE), normally 4:00 p.m. Eastern time and includes trades executed through the end of the prior business day. Gains and losses on securities sold are determined on the basis of identified cost and may include proceeds received from litigation. Dividend income is recorded on the ex-dividend date, except for certain dividends from foreign securities where the ex-dividend date may have passed, which are recorded as soon as the Fund is informed of the ex-dividend date. Non-cash dividends included in dividend income, if any, are recorded at the fair market value of the securities received. Distributions received on securities that represent a return of capital or capital gain are recorded as a reduction of cost of investments and/or as a realized gain. The Fund estimates the components of distributions received that may be considered return of capital distributions or capital gain distributions. Interest income and distributions from the Fidelity Central Funds are accrued as earned. Interest income includes coupon interest and amortization of premium and accretion of discount on debt securities. Investment income is recorded net of foreign taxes withheld where recovery of such taxes is uncertain.
Expenses. Expenses directly attributable to a fund are charged to that fund. Expenses attributable to more than one fund are allocated among the respective funds on the basis of relative net assets or other appropriate methods. Expense estimates are accrued in the period to which they relate and adjustments are made when actual amounts are known. Expenses included in the accompanying financial statements reflect the expenses of the Fund and do not include any expenses of the Fidelity Central Funds. Although not included in the Fund's expenses, the Fund indirectly bears its proportionate share of the Fidelity Central Funds' expenses through the impact of these expenses on each Fidelity Central Fund's NAV. Based on their most recent shareholder report date, expenses of the Fidelity Central Funds ranged from less than 0.01% to 0.14%.
Deferred Trustee Compensation. Under a Deferred Compensation Plan (the Plan), independent Trustees may elect to defer receipt of a portion of their annual compensation. Deferred amounts are invested in a cross-section of Fidelity funds, are marked-to-market and remain in the Fund until distributed in accordance with the Plan. The investment of deferred amounts and the offsetting payable to the Trustees are included in the accompanying Statement of Assets and Liabilities.
Income Tax Information and Distributions to Shareholders. Each year, the Fund intends to qualify as a regulated investment company under Subchapter M of the Internal Revenue Code, including distributing substantially all of its taxable income and realized gains. As a result, no provision for income taxes is required. The Fund files a U.S. federal tax return, in addition to state and local tax returns as required. A fund's federal income tax returns are subject to examination by the Internal Revenue Service (IRS) for a period of three fiscal years after they are filed. State and local tax returns may be subject to examination for an additional fiscal year depending on the jurisdiction. Foreign taxes are provided for based on the Fund's understanding of the tax rules and rates that exist in the foreign markets in which it invests.
Distributions are declared and recorded on the ex-dividend date. Income dividends and capital gain distributions are declared separately for each class. Income and capital gain distributions are determined in accordance with income tax regulations, which may differ from GAAP.
Capital accounts within the financial statements are adjusted for permanent book-tax differences. These adjustments have no impact on net assets or the results of operations. Temporary book-tax differences will reverse in a subsequent period.
Book-tax differences are primarily due to short-term gain distributions from the Fidelity Central Funds, in-kind transactions, futures transactions, foreign currency transactions, market discount, partnerships (including allocations from Fidelity Central Funds), deferred trustees compensation, capital loss carryforwards and losses deferred due to wash sales.
Semiannual Report
Notes to Financial Statements (Unaudited) - continued
3. Significant Accounting Policies - continued
Income Tax Information and Distributions to Shareholders - continued
The federal tax cost of investment securities and unrealized appreciation (depreciation) as of period end were as follows:
Gross unrealized appreciation | $ 142,874,794 |
Gross unrealized depreciation | (66,696,986) |
Net unrealized appreciation (depreciation) on securities and other investments | $ 76,177,808 |
| |
Tax cost | $ 1,204,930,081 |
Capital loss carryforwards are only available to offset future capital gains of the Fund to the extent provided by regulations and may be limited. Under the Regulated Investment Company Modernization Act of 2010 (the Act), the Fund is permitted to carry forward capital losses incurred in taxable years beginning after December 22, 2010 for an unlimited period and such capital losses are required to be used prior to any losses that expire. At December 31, 2011, capital loss carryforwards were as follows:
Fiscal year of expiration | |
2016 | $ (12,728,760) |
2017 | (33,321,541) |
Total capital loss carryforward | $ (46,050,301) |
New Accounting Pronouncement. In December 2011, the Financial Accounting Standards Board issued Accounting Standard Update No. 2011-11, Disclosures about Offsetting Assets and Liabilities. The update creates new disclosure requirements requiring entities to disclose both gross and net information for derivatives and other financial instruments that are either offset in the Statement of Assets and Liabilities or subject to an enforceable master netting arrangement or similar agreement. The disclosure requirements are effective for interim and annual reporting periods beginning on or after January 1, 2013. Management is currently evaluating the impact of the update's adoption on the Fund's financial statement disclosures.
4. Operating Policies.
Restricted Securities. The Fund may invest in securities that are subject to legal or contractual restrictions on resale. These securities generally may be resold in transactions exempt from registration or to the public if the securities are registered. Disposal of these securities may involve time-consuming negotiations and expense, and prompt sale at an acceptable price may be difficult. Information regarding restricted securities is included at the end of the Fund's Schedule of Investments.
5. Derivative Instruments.
Risk Exposures and the Use of Derivative Instruments. The Fund's investment objectives allow the Fund to enter into various types of derivative contracts, including futures contracts. Derivatives are investments whose value is derived from underlying assets, indices or reference rates and may be transacted on an exchange or over-the-counter (OTC). Derivatives may involve a future commitment to buy or sell a specified instrument based on specified terms, or to exchange future cash flows at periodic intervals based on a notional principal amount. The Fund used derivatives to increase returns and to manage exposure to certain risks as defined below. The success of any strategy involving derivatives depends on analysis of numerous economic factors, and if the strategies for investment do not work as intended, the Fund may not achieve its objectives.
The Fund's use of derivatives increased or decreased its exposure to the following risk:
Equity Risk | Equity risk relates to the fluctuations in the value of financial instruments as a result of changes in market prices (other than those arising from interest rate risk or foreign exchange risk), whether caused by factors specific to an individual investment, its issuer, or all factors affecting all instruments traded in a market or market segment. |
The Fund is also exposed to additional risks from investing in derivatives, such as liquidity risk and counterparty credit risk. Liquidity risk is the risk that the Fund will be unable to close out the derivative in the open market in a timely manner. Counterparty credit risk is the risk that the counterparty will not be able to fulfill its obligation to the Fund. Counterparty credit risk related to exchange-traded futures contracts is minimal because of the protection provided by the exchange on which they trade. Investing in derivatives may involve greater risks than investing in the underlying assets directly and, to varying degrees, involves risk of loss in excess of the initial investment, if any, collateral received and amounts recognized in the Statement of Assets and Liabilities. In addition, for futures contracts, there is the risk that the change in value of the derivative contract may not correspond to the change in value of the underlying instrument.
Semiannual Report
5. Derivative Instruments - continued
Futures Contracts. A futures contract is an agreement between two parties to buy or sell a specified underlying instrument for a fixed price at a specified future date. The Fund used futures contracts to manage its exposure to the stock market.
Upon entering into a futures contract, a fund is required to deposit either cash or securities (initial margin) with a clearing broker in an amount equal to a certain percentage of the face value of the contract. Futures contracts are marked-to-market daily and subsequent payments are made or received by a fund depending on the daily fluctuations in the value of the futures contracts and are recorded as unrealized appreciation or (depreciation). This receivable and/or payable is included in daily variation margin on futures contracts in the Statement of Assets and Liabilities. Realized gain or (loss) is recorded upon the expiration or closing of a futures contract.
Any open futures contracts at period end are shown in the Schedule of Investments under the caption "Futures Contracts." The underlying face amount at value reflects each contract's exposure to the underlying instrument at period end and is representative of activity for the period. Securities deposited to meet initial margin requirements are identified in the Schedule of Investments.
During the period the Fund recognized net realized gain (loss) of $480,396 and a change in net unrealized appreciation (depreciation) of $380,790 related to its investment in futures contracts. These amounts are included in the Statement of Operations.
6. Purchases and Sales of Investments.
Purchases and sales of securities (including the Equity and Fixed-Income Central Funds), other than short-term securities, aggregated $308,646,830 and $360,248,135, respectively.
7. Fees and Other Transactions with Affiliates.
Management Fee. FMR and its affiliates provide the Fund with investment management related services for which the Fund pays a monthly management fee. The management fee is the sum of an individual fund fee rate that is based on an annual rate of .25% of the Fund's average net assets and an annualized group fee rate that averaged .26% during the period. The group fee rate is based upon the average net assets of all the mutual funds advised by FMR. The group fee rate decreases as assets under management increase and increases as assets under management decrease. For the period, the total annualized management fee rate was .51% of the Fund's average net assets.
FMR pays a portion of the management fees received from the Fund to the Fidelity Central Funds' investment advisers, who are also affiliates, for managing the assets of the Fidelity Central Funds.
During the period, FMR waived a portion of its management fee as described in the Expense Reductions note.
Distribution and Service Plan Fees. In accordance with Rule 12b-1 of the 1940 Act, the Fund has adopted separate 12b-1 Plans for each Service Class of shares. Each Service Class pays Fidelity Distributors Corporation (FDC), an affiliate of FMR, a service fee. For the period, the service fee is based on an annual rate of .10% of Service Class' average net assets and .25% of Service Class 2's average net assets.
For the period, total fees, all of which were re-allowed to insurance companies for the distribution of shares and providing shareholder support services were as follows:
Service Class | $ 4,269 |
Service Class 2 | 41,036 |
| $ 45,305 |
Transfer Agent Fees. Fidelity Investments Institutional Operations Company, Inc. (FIIOC), an affiliate of FMR, is the Fund's transfer, dividend disbursing, and shareholder servicing agent. FIIOC receives an asset-based fee with respect to each class. Each class (with the exception of Investor Class) pays a transfer agent fee, excluding out of pocket expenses, equal to an annual rate of .07% of average net assets. Investor Class pays a monthly asset-based transfer agent fee of .15% of average net assets. In addition, FIIOC receives an asset-based fee of .0038% of average net assets for typesetting, printing and mailing of shareholder reports, except proxy statements. For the period, transfer agent fees for each class, including printing and out of pocket expenses, were as follows:
Initial Class | $ 409,142 |
Service Class | 3,746 |
Service Class 2 | 13,799 |
Investor Class | 87,294 |
| $ 513,981 |
Accounting and Security Lending Fees. Fidelity Service Company, Inc. (FSC), an affiliate of FMR, maintains the Fund's accounting records. The accounting fee is based on the level of average net assets for each month. Under a separate contract, FSC administers the security lending program. The security lending fee is based on the number and duration of lending transactions.
Semiannual Report
Notes to Financial Statements (Unaudited) - continued
7. Fees and Other Transactions with Affiliates - continued
Brokerage Commissions. The Fund placed a portion of its portfolio transactions with brokerage firms which are affiliates of the investment adviser. The commissions paid to these affiliated firms were $7,471 for the period.
8. Committed Line of Credit.
The Fund participates with other funds managed by FMR or an affiliate in a $4.25 billion credit facility (the "line of credit") to be utilized for temporary or emergency purposes to fund shareholder redemptions or for other short-term liquidity purposes. The Fund has agreed to pay commitment fees on its pro-rata portion of the line of credit, which amounted to $1,944 and is reflected in Miscellaneous expenses on the Statement of Operations. During the period, there were no borrowings on this line of credit.
9. Security Lending.
The Fund lends portfolio securities through a lending agent from time to time in order to earn additional income. For equity securities, a lending agent is used and may loan securities to certain qualified borrowers, including Fidelity Capital Markets (FCM), a broker-dealer affiliated with the Fund. On the settlement date of the loan, the Fund receives collateral (in the form of U.S. Treasury obligations, letters of credit and/or cash) against the loaned securities and maintains collateral in an amount not less than 100% of the market value of the loaned securities during the period of the loan. The market value of the loaned securities is determined at the close of business of the Fund and any additional required collateral is delivered to the Fund on the next business day. If the borrower defaults on its obligation to return the securities loaned because of insolvency or other reasons, a fund could experience delays and costs in recovering the securities loaned or in gaining access to the collateral. Any cash collateral received is invested in the Fidelity Securities Lending Cash Central Fund. The value of loaned securities and cash collateral at period end are disclosed on the Fund's Statement of Assets and Liabilities. At period end, there were no security loans outstanding with FCM. Security lending income represents the income earned on investing cash collateral, less rebates paid to borrowers and any lending agent fees associated with the loan, plus any premium payments received for lending certain types of securities. Security lending income is presented in the Statement of Operations as a component of income from Fidelity Central Funds. Total security lending income during the period amounted to $130,037, including $239 from securities loaned to FCM.
10. Expense Reductions.
FMR has contractually agreed to waive the Fund's management fee in an amount equal to its proportionate share of the management fee paid to FMR by the subsidiary of Fidelity Commodity Strategy Central Fund based on the Fund's proportionate ownership of the Central Fund. During the period, this waiver reduced the Fund's management fee by $3,279.
Many of the brokers with whom FMR places trades on behalf of the Fund, and certain Central Funds, provided services in addition to trade execution. These services included payments of certain expenses on behalf of the Fund totaling $40,653 for the period. In addition, through arrangements with the Fund's custodian, credits realized as a result of uninvested cash balances were used to reduce the Fund's expenses. During the period, these credits reduced the Fund's custody expenses by $14.
11. Distributions to Shareholders.
Distributions to shareholders of each class were as follows:
| Six months ended
June 30,
2012 | Year ended
December 31,
2011 |
From net investment income | | |
Initial Class | $ - | $ 23,022,892 |
Service Class | - | 160,851 |
Service Class 2 | - | 593,309 |
Investor Class | - | 2,065,795 |
Total | $ - | $ 25,842,847 |
From net realized gain | | |
Initial Class | $ - | $ 5,619,969 |
Service Class | - | 41,281 |
Service Class 2 | - | 168,200 |
Investor Class | - | 519,570 |
Total | $ - | $ 6,349,020 |
Semiannual Report
12. Share Transactions.
Transactions for each class of shares were as follows:
| Shares | Dollars |
| Six months ended June 30,
2012 | Year ended
December 31,
2011 | Six months ended June 30,
2012 | Year ended
December 31,
2011 |
Initial Class | | | | |
Shares sold | 1,115,269 | 2,032,042 | $ 16,288,860 | $ 29,814,044 |
Reinvestment of distributions | - | 2,095,692 | - | 28,642,861 |
Shares redeemed | (5,143,180) | (11,767,286) | (75,345,840) | (172,535,615) |
Net increase (decrease) | (4,027,911) | (7,639,552) | $ (59,056,980) | $ (114,078,710) |
Service Class | | | | |
Shares sold | 64,527 | 66,601 | $ 944,718 | $ 965,850 |
Reinvestment of distributions | - | 14,888 | - | 202,132 |
Shares redeemed | (78,004) | (90,853) | (1,127,829) | (1,318,556) |
Net increase (decrease) | (13,477) | (9,364) | $ (183,111) | $ (150,574) |
Service Class 2 | | | | |
Shares sold | 111,750 | 285,148 | $ 1,612,115 | $ 4,083,615 |
Reinvestment of distributions | - | 56,660 | - | 761,509 |
Shares redeemed | (313,430) | (683,186) | (4,513,345) | (9,913,610) |
Net increase (decrease) | (201,680) | (341,378) | $ (2,901,230) | $ (5,068,486) |
Investor Class | | | | |
Shares sold | 666,994 | 1,843,689 | $ 9,712,708 | $ 27,115,486 |
Reinvestment of distributions | - | 189,888 | - | 2,585,365 |
Shares redeemed | (447,326) | (1,295,411) | (6,510,041) | (18,853,534) |
Net increase (decrease) | 219,668 | 738,166 | $ 3,202,667 | $ 10,847,317 |
13. Other.
The Fund's organizational documents provide former and current trustees and officers with a limited indemnification against liabilities arising in connection with the performance of their duties to the Fund. In the normal course of business, the Fund may also enter into contracts that provide general indemnifications. The Fund's maximum exposure under these arrangements is unknown as this would be dependent on future claims that may be made against the Fund. The risk of material loss from such claims is considered remote.
At the end of the period, FMR or its affiliates were the owners of record of 32% of the total outstanding shares of the Fund and two otherwise unaffiliated shareholders were the owners of record of 28% of the total outstanding shares of the Fund.
Semiannual Report
Investment Adviser
Fidelity Management & Research Company
Boston, MA
Investment Sub-Advisers
FMR Co., Inc.
Fidelity Management & Research (U.K.) Inc.
Fidelity Investments Money Management, Inc.
Fidelity Management & Research
(Hong Kong) Limited
Fidelity Management & Research
(Japan) Inc.
General Distributor
Fidelity Distributors Corporation
Smithfield, RI
Transfer and Service Agents
Fidelity Investments Institutional Operations Company, Inc.
Boston, MA
Fidelity Service Company, Inc.
Boston, MA
Custodian
JPMorgan Chase Bank
New York, NY
VIPAM-SANN-0812
1.705701.114
Fidelity® Variable Insurance Products:
Asset Manager: Growth Portfolio
Semiannual Report
June 30, 2012
(Fidelity Cover Art)
Contents
Shareholder Expense Example | (Click Here) | An example of shareholder expenses. |
Investment Changes | (Click Here) | A summary of major shifts in the fund's investments over the past six months. |
Investments | (Click Here) | A complete list of the fund's investments with their market values. |
Financial Statements | (Click Here) | Statements of assets and liabilities, operations, and changes in net assets, as well as financial highlights. |
Notes | (Click Here) | Notes to the financial statements. |
To view a fund's proxy voting guidelines and proxy voting record for the 12-month period ended June 30, visit http://www.fidelity.com/proxyvotingresults or visit the Securities and Exchange Commission's (SEC) web site at http://www.sec.gov. You may also call 1-877-208-0098 to request a free copy of the proxy voting guidelines.
Fidelity Variable Insurance Products are separate account options which are purchased through a variable insurance contract.
Standard & Poor's, S&P and S&P 500 are registered service marks of The McGraw-Hill Companies, Inc. and have been licensed for use by Fidelity Distributors Corporation.
Other third party marks appearing herein are the property of their respective owners.
All other marks appearing herein are registered or unregistered trademarks or service marks of FMR LLC or an affiliated company. © 2012 FMR LLC. All rights reserved.
This report and the financial statements contained herein are submitted for the general information of the shareholders of the fund. This report is not authorized for distribution to prospective investors in the fund unless preceded or accompanied by an effective prospectus.
A fund files its complete schedule of portfolio holdings with the SEC for the first and third quarters of each fiscal year on Form N-Q. Forms N-Q are available on the SEC's web site at http://www.sec.gov. A fund's Forms N-Q may be reviewed and copied at the SEC's Public Reference Room in Washington, DC. Information regarding the operation of the SEC's Public Reference Room may be obtained by calling 1-800-SEC-0330. For a complete list of a fund's portfolio holdings, view the most recent holdings listings, semiannual report, or annual report on Fidelity's web site at http://www.fidelity.com, http://www.advisor.fidelity.com, or http://www.401k.com, as applicable.
NOT FDIC INSURED • MAY LOSE VALUE • NO BANK GUARANTEE
Neither the fund nor Fidelity Distributors Corporation is a bank.
Semiannual Report
As a shareholder of the Fund, you incur two types of costs: (1) transaction costs, and (2) ongoing costs, including management fees, distribution and/or service (12b-1) fees and other Fund expenses. This Example is intended to help you understand your ongoing costs (in dollars) of investing in the Fund and to compare these costs with the ongoing costs of investing in other mutual funds.
The Example is based on an investment of $1,000 invested at the beginning of the period and held for the entire period (January 1, 2012 to June 30, 2012).
Actual Expenses
The first line of the accompanying table for each class of the Fund provides information about actual account values and actual expenses. You may use the information in this line, together with the amount you invested, to estimate the expenses that you paid over the period. Simply divide your account value by $1,000.00 (for example, an $8,600 account value divided by $1,000.00 = 8.6), then multiply the result by the number in the first line for a class of the Fund under the heading entitled "Expenses Paid During Period" to estimate the expenses you paid on your account during this period. The estimate of expenses does not include any fees or other expenses of any variable annuity or variable life insurance product. If they were, the estimate of expenses you paid during the period would be higher, and your ending account value would be lower. In addition, the Fund, as a shareholder in the underlying Fidelity Central Funds, will indirectly bear its pro-rata share of the fees and expenses incurred by the underlying Fidelity Central Funds. These fees and expenses are not included in the Fund's annualized expense ratio used to calculate the expense estimate in the table below.
Hypothetical Example for Comparison Purposes
The second line of the accompanying table for each class of the Fund provides information about hypothetical account values and hypothetical expenses based on a Class' actual expense ratio and an assumed rate of return of 5% per year before expenses, which is not the Class' actual return. The hypothetical account values and expenses may not be used to estimate the actual ending account balance or expenses you paid for the period. You may use this information to compare the ongoing costs of investing in the Fund and other funds. To do so, compare this 5% hypothetical example with the 5% hypothetical examples that appear in the shareholder reports of the other funds. The estimate of expenses does not include any fees or other expenses of any variable annuity or variable life insurance product. If they were, the estimate of expenses you paid during the period would be higher, and your ending account value would be lower. In addition, the Fund, as a shareholder in the underlying Fidelity Central Funds, will indirectly bear its pro-rata share of the fees and expenses incurred by the underlying Fidelity Central Funds. These fees and expenses are not included in the Fund's annualized expense ratio used to calculate the expense estimate in the table below.
Please note that the expenses shown in the table are meant to highlight your ongoing costs only and do not reflect any transaction costs. Therefore, the second line of the table is useful in comparing ongoing costs only, and will not help you determine the relative total costs of owning different funds.
| Annualized Expense Ratio | Beginning
Account Value
January 1, 2012 | Ending
Account Value
June 30, 2012 | Expenses Paid
During Period*
January 1, 2012
to June 30, 2012 |
Initial Class | .73% | | | |
Actual | | $ 1,000.00 | $ 1,071.20 | $ 3.76 |
HypotheticalA | | $ 1,000.00 | $ 1,021.23 | $ 3.67 |
Service Class | .83% | | | |
Actual | | $ 1,000.00 | $ 1,070.90 | $ 4.27 |
HypotheticalA | | $ 1,000.00 | $ 1,020.74 | $ 4.17 |
Service Class 2 | 1.04% | | | |
Actual | | $ 1,000.00 | $ 1,069.60 | $ 5.35 |
HypotheticalA | | $ 1,000.00 | $ 1,019.69 | $ 5.22 |
Investor Class | .81% | | | |
Actual | | $ 1,000.00 | $ 1,070.70 | $ 4.17 |
HypotheticalA | | $ 1,000.00 | $ 1,020.84 | $ 4.07 |
A 5% return per year before expenses
* Expenses are equal to each Class' annualized expense ratio, multiplied by the average account value over the period, multiplied by 182/366 (to reflect the one-half year period).
Semiannual Report
Investment Changes (Unaudited)
The information in the following tables is based on the combined investments of the Fund and its pro-rata share of the investments of Fidelity's Central Fund's, other than the Commodity Strategy and Money Market Central Funds.
Top Ten Stocks as of June 30, 2012 |
| % of fund's
net assets | % of fund's net assets
6 months ago |
Apple, Inc. | 4.0 | 3.1 |
United Continental Holdings, Inc. | 1.4 | 1.2 |
Pioneer Natural Resources Co. | 1.0 | 0.8 |
Delta Air Lines, Inc. | 1.0 | 0.8 |
UnitedHealth Group, Inc. | 0.9 | 0.7 |
QUALCOMM, Inc. | 0.8 | 0.1 |
PulteGroup, Inc. | 0.8 | 0.5 |
TJX Companies, Inc. | 0.7 | 0.6 |
Vertex Pharmaceuticals, Inc. | 0.7 | 0.4 |
Macy's, Inc. | 0.7 | 0.7 |
| 12.0 | |
Market Sectors as of June 30, 2012 |
(stocks only) | % of fund's
net assets | % of fund's net assets
6 months ago |
Consumer Discretionary | 15.2 | 14.5 |
Information Technology | 12.3 | 10.6 |
Health Care | 8.2 | 6.4 |
Industrials | 6.8 | 6.5 |
Financials | 6.6 | 5.9 |
Energy | 6.3 | 10.4 |
Consumer Staples | 3.6 | 3.7 |
Materials | 3.4 | 3.7 |
Telecommunication Services | 1.2 | 1.4 |
Utilities | 0.6 | 0.8 |
Asset Allocation (% of fund's net assets) |
As of June 30, 2012* | As of December 31, 2011** |
 | Stock Class and
Equity Futures*** 65.6% | |  | Stock Class**** 65.2% | |
 | Bond Class 29.2% | | | Bond Class 28.3% | |
 | Short-Term Class 5.2% | | | Short-Term Class 6.5% | |
* Foreign investments | 21.1% | | ** Foreign investments | 24.1% | |

*** Includes investment in Fidelity Commodity Strategy Central Fund of 0.5%
**** Includes investment in Fidelity Commodity Strategy Central Fund of 1.7%
Asset allocations in the pie charts reflect the categorization of assets as defined in the Fund's prospectus in effect as of the time periods indicated above. Financial Statement categorizations conform to accounting standards and will differ from the pie chart. Percentages are adjusted for the effect of futures contracts and swap contracts, if applicable.
An unaudited holdings listing for the Fund, which presents direct holdings as well as the pro-rata share of any securities and other investments held indirectly through its investment in underlying Fidelity Central Funds, other than the Commodity Strategy and Money Market Central Funds, is available at advisor.fidelity.com.
Semiannual Report
Investments June 30, 2012 (Unaudited)
Showing Percentage of Net Assets
Common Stocks - 49.8% |
| Shares | | Value |
CONSUMER DISCRETIONARY - 13.8% |
Auto Components - 0.7% |
BorgWarner, Inc. (a) | 2,000 | | $ 131,180 |
Delphi Automotive PLC | 10,300 | | 262,650 |
TRW Automotive Holdings Corp. (a) | 21,200 | | 779,312 |
| | 1,173,142 |
Automobiles - 0.3% |
Harley-Davidson, Inc. | 10,900 | | 498,457 |
Hotels, Restaurants & Leisure - 0.9% |
Arcos Dorados Holdings, Inc. | 8,800 | | 130,064 |
Las Vegas Sands Corp. | 7,000 | | 304,430 |
Panera Bread Co. Class A (a) | 3,300 | | 460,152 |
Yum! Brands, Inc. | 7,300 | | 470,266 |
| | 1,364,912 |
Household Durables - 2.1% |
D.R. Horton, Inc. | 46,000 | | 845,480 |
KB Home (d) | 35,500 | | 347,900 |
PulteGroup, Inc. (a) | 114,400 | | 1,224,080 |
Toll Brothers, Inc. (a) | 33,400 | | 992,982 |
| | 3,410,442 |
Internet & Catalog Retail - 0.8% |
Expedia, Inc. | 16,400 | | 788,348 |
Priceline.com, Inc. (a) | 800 | | 531,616 |
| | 1,319,964 |
Leisure Equipment & Products - 0.3% |
Polaris Industries, Inc. | 6,000 | | 428,880 |
Media - 1.0% |
CBS Corp. Class B | 20,900 | | 685,102 |
The Walt Disney Co. | 18,900 | | 916,650 |
| | 1,601,752 |
Multiline Retail - 1.1% |
Dollar Tree, Inc. (a) | 10,800 | | 581,040 |
Macy's, Inc. | 32,200 | | 1,106,070 |
| | 1,687,110 |
Specialty Retail - 3.5% |
Dick's Sporting Goods, Inc. | 5,500 | | 264,000 |
Home Depot, Inc. | 19,800 | | 1,049,202 |
Limited Brands, Inc. | 23,800 | | 1,012,214 |
Lowe's Companies, Inc. | 25,300 | | 719,532 |
O'Reilly Automotive, Inc. (a) | 4,200 | | 351,834 |
PetSmart, Inc. | 11,300 | | 770,434 |
Pier 1 Imports, Inc. | 10,400 | | 170,872 |
TJX Companies, Inc. | 27,500 | | 1,180,575 |
| | 5,518,663 |
Textiles, Apparel & Luxury Goods - 3.1% |
Arezzo Industria e Comercio SA | 14,800 | | 220,324 |
Burberry Group PLC | 11,200 | | 232,417 |
Coach, Inc. | 9,100 | | 532,168 |
Crocs, Inc. (a) | 13,500 | | 218,025 |
Michael Kors Holdings Ltd. | 21,059 | | 881,109 |
|
| Shares | | Value |
NIKE, Inc. Class B | 6,900 | | $ 605,682 |
Prada SpA | 45,900 | | 309,728 |
PVH Corp. | 5,100 | | 396,729 |
Ralph Lauren Corp. | 3,600 | | 504,216 |
Under Armour, Inc. Class A (sub. vtg.) (a) | 3,000 | | 283,440 |
Vera Bradley, Inc. (a)(d) | 14,000 | | 295,120 |
VF Corp. | 3,700 | | 493,765 |
| | 4,972,723 |
TOTAL CONSUMER DISCRETIONARY | | 21,976,045 |
CONSUMER STAPLES - 1.9% |
Beverages - 0.5% |
Monster Beverage Corp. (a) | 10,300 | | 733,360 |
Food & Staples Retailing - 0.1% |
Drogasil SA | 16,035 | | 161,667 |
Food Products - 0.4% |
Green Mountain Coffee Roasters, Inc. (a) | 23,000 | | 500,940 |
Orion Corp. | 218 | | 181,228 |
| | 682,168 |
Personal Products - 0.5% |
Hengan International Group Co. Ltd. | 51,500 | | 501,670 |
Nu Skin Enterprises, Inc. Class A | 8,100 | | 379,890 |
| | 881,560 |
Tobacco - 0.4% |
British American Tobacco PLC sponsored ADR | 3,500 | | 357,420 |
Souza Cruz SA | 17,000 | | 249,520 |
| | 606,940 |
TOTAL CONSUMER STAPLES | | 3,065,695 |
ENERGY - 4.9% |
Energy Equipment & Services - 0.6% |
Cameron International Corp. (a) | 8,800 | | 375,848 |
Ensco PLC Class A | 1,800 | | 84,546 |
McDermott International, Inc. (a) | 26,100 | | 290,754 |
Noble Corp. | 4,700 | | 152,891 |
| | 904,039 |
Oil, Gas & Consumable Fuels - 4.3% |
Anadarko Petroleum Corp. | 10,800 | | 714,960 |
Concho Resources, Inc. (a) | 11,900 | | 1,012,928 |
Continental Resources, Inc. (a)(d) | 16,400 | | 1,092,568 |
EOG Resources, Inc. | 3,400 | | 306,374 |
Genel Energy PLC | 12,600 | | 120,769 |
Hess Corp. | 2,700 | | 117,315 |
Kosmos Energy Ltd. (a) | 11,100 | | 122,655 |
Oasis Petroleum, Inc. (a) | 13,100 | | 316,758 |
Occidental Petroleum Corp. | 8,400 | | 720,468 |
Pioneer Natural Resources Co. | 17,700 | | 1,561,317 |
SM Energy Co. | 4,400 | | 216,084 |
Common Stocks - continued |
| Shares | | Value |
ENERGY - continued |
Oil, Gas & Consumable Fuels - continued |
Whiting Petroleum Corp. (a) | 2,800 | | $ 115,136 |
Williams Companies, Inc. | 15,900 | | 458,238 |
| | 6,875,570 |
TOTAL ENERGY | | 7,779,609 |
FINANCIALS - 3.4% |
Capital Markets - 1.1% |
Apollo Global Management LLC Class A | 56,100 | | 695,640 |
Morgan Stanley | 75,300 | | 1,098,627 |
| | 1,794,267 |
Diversified Financial Services - 1.6% |
Bank of America Corp. | 61,800 | | 505,524 |
Citigroup, Inc. | 38,000 | | 1,041,580 |
JPMorgan Chase & Co. | 23,100 | | 825,363 |
Moody's Corp. | 6,300 | | 230,265 |
| | 2,602,732 |
Real Estate Investment Trusts - 0.5% |
American Tower Corp. | 10,900 | | 762,019 |
Real Estate Management & Development - 0.1% |
CBRE Group, Inc. (a) | 9,000 | | 147,240 |
Thrifts & Mortgage Finance - 0.1% |
Nationstar Mortgage Holdings, Inc. (d) | 5,500 | | 118,360 |
TOTAL FINANCIALS | | 5,424,618 |
HEALTH CARE - 7.1% |
Biotechnology - 2.7% |
Alexion Pharmaceuticals, Inc. (a) | 7,300 | | 724,890 |
ARIAD Pharmaceuticals, Inc. (a) | 9,300 | | 160,053 |
Biogen Idec, Inc. (a) | 7,000 | | 1,010,660 |
Clovis Oncology, Inc. | 3,600 | | 78,048 |
Gilead Sciences, Inc. (a) | 10,100 | | 517,928 |
InterMune, Inc. (a) | 7,000 | | 83,650 |
Medivation, Inc. (a) | 4,800 | | 438,720 |
Progenics Pharmaceuticals, Inc. (a) | 4,100 | | 40,098 |
Synageva BioPharma Corp. (a) | 2,600 | | 105,456 |
Vertex Pharmaceuticals, Inc. (a) | 20,400 | | 1,140,768 |
| | 4,300,271 |
Health Care Providers & Services - 2.2% |
Express Scripts Holding Co. (a) | 9,600 | | 535,968 |
Health Net, Inc. (a) | 6,000 | | 145,620 |
HMS Holdings Corp. (a) | 11,200 | | 373,072 |
Humana, Inc. | 13,300 | | 1,029,952 |
UnitedHealth Group, Inc. | 24,700 | | 1,444,950 |
| | 3,529,562 |
Health Care Technology - 0.3% |
SXC Health Solutions Corp. (a) | 4,300 | | 427,044 |
Pharmaceuticals - 1.9% |
Allergan, Inc. | 3,400 | | 314,738 |
|
| Shares | | Value |
Elan Corp. PLC sponsored ADR (a) | 48,800 | | $ 711,992 |
Perrigo Co. | 4,700 | | 554,271 |
Shire PLC sponsored ADR | 4,900 | | 423,311 |
Valeant Pharmaceuticals International, Inc. (Canada) (a) | 16,306 | | 731,456 |
ViroPharma, Inc. (a) | 11,700 | | 277,290 |
| | 3,013,058 |
TOTAL HEALTH CARE | | 11,269,935 |
INDUSTRIALS - 5.1% |
Airlines - 3.2% |
Copa Holdings SA Class A | 4,800 | | 395,904 |
Delta Air Lines, Inc. (a) | 138,400 | | 1,515,480 |
United Continental Holdings, Inc. (a) | 90,485 | | 2,201,500 |
US Airways Group, Inc. (a)(d) | 76,400 | | 1,018,412 |
| | 5,131,296 |
Building Products - 0.2% |
Owens Corning (a) | 12,200 | | 348,188 |
Commercial Services & Supplies - 0.2% |
Aggreko PLC | 9,900 | | 321,261 |
Swisher Hygiene, Inc. (a) | 24,821 | | 56,517 |
| | 377,778 |
Construction & Engineering - 0.3% |
Fluor Corp. | 2,400 | | 118,416 |
MasTec, Inc. (a) | 8,200 | | 123,328 |
Quanta Services, Inc. (a) | 8,000 | | 192,560 |
| | 434,304 |
Electrical Equipment - 0.1% |
Hubbell, Inc. Class B | 2,200 | | 171,468 |
Machinery - 0.3% |
Chart Industries, Inc. (a) | 3,500 | | 240,660 |
Kennametal, Inc. | 6,900 | | 228,735 |
| | 469,395 |
Marine - 0.0% |
DryShips, Inc. (a) | 13,300 | | 29,127 |
Professional Services - 0.5% |
Qualicorp SA | 32,000 | | 279,771 |
Robert Half International, Inc. | 16,600 | | 474,262 |
| | 754,033 |
Trading Companies & Distributors - 0.3% |
Air Lease Corp. Class A (a) | 9,600 | | 186,144 |
Mills Estruturas e Servicos de Engenharia SA | 15,400 | | 211,621 |
| | 397,765 |
TOTAL INDUSTRIALS | | 8,113,354 |
INFORMATION TECHNOLOGY - 11.4% |
Communications Equipment - 0.9% |
Acme Packet, Inc. (a) | 7,700 | | 143,605 |
Common Stocks - continued |
| Shares | | Value |
INFORMATION TECHNOLOGY - continued |
Communications Equipment - continued |
QUALCOMM, Inc. | 22,600 | | $ 1,258,368 |
Riverbed Technology, Inc. (a) | 3,600 | | 58,140 |
| | 1,460,113 |
Computers & Peripherals - 4.5% |
3D Systems Corp. (a)(d) | 5,700 | | 194,598 |
Apple, Inc. (a) | 10,900 | | 6,365,597 |
EMC Corp. (a) | 12,600 | | 322,938 |
Lenovo Group Ltd. | 202,000 | | 172,373 |
| | 7,055,506 |
Internet Software & Services - 1.8% |
Bankrate, Inc. | 14,900 | | 274,011 |
Cornerstone OnDemand, Inc. (a) | 11,400 | | 271,434 |
eBay, Inc. (a) | 4,800 | | 201,648 |
Facebook, Inc.: | | | |
Class A | 4,400 | | 136,928 |
Class B (a)(g) | 1,580 | | 44,253 |
IAC/InterActiveCorp | 8,200 | | 373,920 |
Liquidity Services, Inc. (a) | 9,800 | | 501,662 |
Rackspace Hosting, Inc. (a) | 9,700 | | 426,218 |
VeriSign, Inc. (a) | 15,900 | | 692,763 |
| | 2,922,837 |
IT Services - 0.5% |
Teradata Corp. (a) | 5,000 | | 360,050 |
Visa, Inc. Class A | 3,400 | | 420,342 |
| | 780,392 |
Semiconductors & Semiconductor Equipment - 1.9% |
ASML Holding NV | 13,700 | | 704,454 |
Freescale Semiconductor Holdings I Ltd. (a) | 25,700 | | 263,425 |
Intel Corp. | 41,400 | | 1,103,310 |
NXP Semiconductors NV (a) | 37,600 | | 874,200 |
Skyworks Solutions, Inc. (a) | 4,400 | | 120,428 |
| | 3,065,817 |
Software - 1.8% |
Citrix Systems, Inc. (a) | 9,700 | | 814,218 |
CommVault Systems, Inc. (a) | 5,400 | | 267,678 |
Informatica Corp. (a) | 12,800 | | 542,208 |
Microsoft Corp. | 9,500 | | 290,605 |
RealPage, Inc. (a) | 9,700 | | 224,652 |
salesforce.com, Inc. (a) | 2,800 | | 387,128 |
Splunk, Inc. | 300 | | 8,430 |
VMware, Inc. Class A (a) | 3,800 | | 345,952 |
| | 2,880,871 |
TOTAL INFORMATION TECHNOLOGY | | 18,165,536 |
|
| Shares | | Value |
MATERIALS - 1.8% |
Chemicals - 1.6% |
CF Industries Holdings, Inc. | 2,300 | | $ 445,602 |
Eastman Chemical Co. | 10,300 | | 518,811 |
FMC Corp. | 7,400 | | 395,752 |
Huntsman Corp. | 15,000 | | 194,100 |
LyondellBasell Industries NV Class A | 7,500 | | 302,025 |
PetroLogistics LP | 7,700 | | 82,852 |
Rockwood Holdings, Inc. | 5,700 | | 252,795 |
Westlake Chemical Corp. | 7,000 | | 365,820 |
| | 2,557,757 |
Metals & Mining - 0.2% |
First Quantum Minerals Ltd. | 12,900 | | 228,072 |
TOTAL MATERIALS | | 2,785,829 |
TELECOMMUNICATION SERVICES - 0.4% |
Wireless Telecommunication Services - 0.4% |
SBA Communications Corp. Class A (a) | 10,000 | | 570,500 |
TOTAL COMMON STOCKS (Cost $68,263,715) |
79,151,121
|
Fixed-Income Funds - 30.8% |
| | | |
Fidelity Emerging Markets Debt Central Fund (f) | 83,482 | | 864,035 |
Fidelity Floating Rate Central Fund (f) | 38,403 | | 3,897,535 |
Fidelity High Income Central Fund 1 (f) | 41,118 | | 4,071,948 |
Fidelity Inflation-Protected Bond Index Central Fund (f) | 53,668 | | 5,412,954 |
Fidelity VIP Investment Grade Central Fund (f) | 316,280 | | 34,616,815 |
TOTAL FIXED-INCOME FUNDS (Cost $46,010,226) |
48,863,287
|
Equity Funds - 15.5% |
| | | |
Domestic Equity Funds - 0.5% |
Fidelity Commodity Strategy Central Fund (f) | 79,949 | | 820,277 |
International Equity Funds - 15.0% |
Fidelity Emerging Markets Equity Central Fund (f) | 18,922 | | 3,478,894 |
Fidelity International Equity Central Fund (f) | 331,841 | | 20,335,227 |
TOTAL INTERNATIONAL EQUITY FUNDS | | 23,814,121 |
TOTAL EQUITY FUNDS (Cost $32,792,096) |
24,634,398
|
U.S. Treasury Obligations - 0.1% |
| Principal Amount | | Value |
U.S. Treasury Bills, yield at date of purchase 0.06% to 0.08% 8/2/12 to 8/23/12 (e)
(Cost $149,989) | | $ 150,000 | | $ 149,992 |
Money Market Funds - 5.5% |
| Shares | | |
Fidelity Cash Central Fund, 0.17% (b) | 6,667,268 | | 6,667,268 |
Fidelity Securities Lending Cash Central Fund, 0.18% (b)(c) | 2,008,500 | | 2,008,500 |
TOTAL MONEY MARKET FUNDS (Cost $8,675,768) |
8,675,768
|
TOTAL INVESTMENT PORTFOLIO - 101.7% (Cost $155,891,794) | | 161,474,566 |
NET OTHER ASSETS (LIABILITIES) - (1.7)% | | (2,722,319) |
NET ASSETS - 100% | $ 158,752,247 |
Futures Contracts |
| Expiration Date | | Underlying Face Amount at Value | | Unrealized Appreciation/
(Depreciation) |
Purchased |
Equity Index Contracts |
5 NYSE E-mini MSCI Emerging Markets Index Contracts | Sept. 2012 | | $ 236,175 | | $ 11,508 |
The face value of futures purchased as a percentage of net assets is 0.1% |
Legend |
(a) Non-income producing |
(b) Affiliated fund that is available only to investment companies and other accounts managed by Fidelity Investments. The rate quoted is the annualized seven-day yield of the fund at period end. A complete unaudited listing of the fund's holdings as of its most recent quarter end is available upon request. In addition, each Fidelity Central Fund's financial statements are available on the SEC's website or upon request. |
(c) Investment made with cash collateral received from securities on loan. |
(d) Security or a portion of the security is on loan at period end. |
(e) Security or a portion of the security was pledged to cover margin requirements for futures contracts. At the period end, the value of securities pledged amounted to $149,992. |
(f) Affiliated fund that is available only to investment companies and other accounts managed by Fidelity Investments. A complete unaudited schedule of portfolio holdings for each Fidelity Central Fund is filed with the SEC for the first and third quarters of each fiscal year on Form N-Q and is available upon request or at the SEC's web site at www.sec.gov. An unaudited holdings listing for the Fund, which presents direct holdings as well as the pro rata share of securities and other investments held indirectly through its investment in underlying Fidelity Central Funds, other than the Commodity Strategy and Money Market Central Funds, is available at advisor.fidelity.com. In addition, each Fidelity Central Fund's financial statements are available on the SEC's web site or upon request. |
(g) Restricted securities - Investment in securities not registered under the Securities Act of 1933 (excluding 144A issues). At the end of the period, the value of restricted securities (excluding 144A issues) amounted to $44,253 or 0.0% of net assets. |
Additional information on each restricted holding is as follows: |
Security | Acquisition Date | Acquisition Cost |
Facebook, Inc. Class B | 5/19/11 | $ 39,574 |
Affiliated Central Funds |
Information regarding fiscal year to date income earned by the Fund from investments in Fidelity Central Funds is as follows: |
Fund | Income earned |
Fidelity Cash Central Fund | $ 3,593 |
Fidelity Emerging Markets Debt Central Fund | 30,118 |
Fidelity Emerging Markets Equity Central Fund | 51,998 |
Fidelity Floating Rate Central Fund | 104,105 |
Fidelity High Income Central Fund 1 | 156,969 |
Fidelity International Equity Central Fund | 484,971 |
Fidelity Securities Lending Cash Central Fund | 28,215 |
Fidelity VIP Investment Grade Central Fund | 492,111 |
Total | $ 1,352,080 |
Additional information regarding the Fund's fiscal year to date purchases and sales, including the ownership percentage, of the non Money Market Central Funds is as follows: |
Fund | Value, beginning of period | Purchases | Sales
Proceeds | Value,
end of
period | % ownership, end of
period |
Fidelity Commodity Strategy Central Fund | $ 2,751,623 | $ - | $ 1,913,116 | $ 820,277 | 0.1% |
Fidelity Emerging Markets Debt Central Fund | 946,655 | 30,309 | 149,721 | 864,035 | 0.8% |
Fidelity Emerging Markets Equity Central Fund | 4,119,625 | 524,851 | 1,471,780 | 3,478,894 | 1.7% |
Fidelity Floating Rate Central Fund | 4,094,560 | 807,918 | 1,127,570 | 3,897,535 | 0.3% |
Fidelity High Income Central Fund 1 | 4,627,374 | 156,969 | 881,864 | 4,071,948 | 0.8% |
Fidelity Inflation-Protected Bond Index Central Fund | - | 5,566,293 | 199,762 | 5,412,954 | 0.9% |
Fidelity International Equity Central Fund | 23,390,361 | 484,971 | 4,265,347 | 20,335,227 | 1.5% |
Fidelity VIP Investment Grade Central Fund | 33,169,163 | 3,374,840 | 2,504,137 | 34,616,815 | 0.8% |
Total | $ 73,099,361 | $ 10,946,151 | $ 12,513,297 | $ 73,497,685 | |
Other Information |
The following is a summary of the inputs used, as of June 30, 2012, involving the Fund's assets and liabilities carried at fair value. The inputs or methodology used for valuing securities may not be an indication of the risk associated with investing in those securities. For more information on valuation inputs, and their aggregation into the levels used in the tables below, please refer to the Security Valuation section in the accompanying Notes to Financial Statements. |
Valuation Inputs at Reporting Date: |
Description | Total | Level 1 | Level 2 | Level 3 |
Investments in Securities: | | | | |
Equities: | | | | |
Consumer Discretionary | $ 21,976,045 | $ 21,666,317 | $ 309,728 | $ - |
Consumer Staples | 3,065,695 | 2,382,797 | 682,898 | - |
Energy | 7,779,609 | 7,779,609 | - | - |
Financials | 5,424,618 | 5,424,618 | - | - |
Health Care | 11,269,935 | 11,269,935 | - | - |
Industrials | 8,113,354 | 8,056,837 | 56,517 | - |
Information Technology | 18,165,536 | 17,948,910 | 216,626 | - |
Materials | 2,785,829 | 2,785,829 | - | - |
Telecommunication Services | 570,500 | 570,500 | - | - |
U.S. Government and Government Agency Obligations | 149,992 | - | 149,992 | - |
Fixed-Income Funds | 48,863,287 | 48,863,287 | - | - |
Money Market Funds | 8,675,768 | 8,675,768 | - | - |
Equity Funds | 24,634,398 | 24,634,398 | - | - |
Total Investments in Securities: | $ 161,474,566 | $ 160,058,805 | $ 1,415,761 | $ - |
Derivative Instruments: | | | | |
Assets | | | | |
Futures Contracts | $ 11,508 | $ 11,508 | $ - | $ - |
Value of Derivative Instruments |
The following table is a summary of the Fund's value of derivative instruments by risk exposure as of June 30, 2012. For additional information on derivative instruments, please refer to the Derivative Instruments section in the accompanying Notes to Financial Statements. |
Risk Exposure /
Derivative Type | Value |
| Asset | Liability |
Equity Risk | | |
Futures Contracts (a) | $ 11,508 | $ - |
Total Value of Derivatives | $ 11,508 | $ - |
(a) Reflects cumulative appreciation/(depreciation) on futures contracts as disclosed on the Schedule of Investments. Only the period end variation margin is separately disclosed on the Statement of Assets and Liabilities. |
Other Information |
The information in the following tables is based on the combined investments of the Fund and its pro-rata share of the investments of Fidelity's Central Funds, other than the Commodity Strategy and Money Market Central Funds. |
The composition of credit quality ratings as a percentage of net assets is as follows (Unaudited): |
U.S. Government and U.S. Government Agency Obligations | 20.4% |
AAA,AA,A | 2.9% |
BBB | 3.6% |
BB | 1.8% |
B | 2.6% |
CCC,CC,C | 0.5% |
D | 0.0% |
Not Rated | 0.6% |
Equities* | 64.7% |
Short-Term Investments and Net Other Assets | 2.9% |
| 100.0% |
* Includes investment in Fidelity Commodity Strategy Central Fund of 0.5%
We have used ratings from Moody's Investors Service, Inc. Where Moody's® ratings are not available, we have used S&P® ratings. All ratings are as of the date indicated and do not reflect subsequent changes. |
Distribution of investments by country of issue, as a percentage of total net assets, is as follows: (Unaudited) |
United States of America | 77.8% |
United Kingdom | 3.5% |
Japan | 2.4% |
Canada | 1.6% |
Netherlands | 1.5% |
Brazil | 1.2% |
France | 1.0% |
Germany | 1.0% |
Others (Individually Less Than 1%) | 10.0% |
| 100.0% |
See accompanying notes which are an integral part of the financial statements.
Semiannual Report
Statement of Assets and Liabilities
| June 30, 2012 (Unaudited) |
| | |
Assets | | |
Investment in securities, at value (including securities loaned of $2,036,453) - See accompanying schedule: Unaffiliated issuers (cost $68,413,704) | $ 79,301,113 | |
Fidelity Central Funds (cost $87,478,090) | 82,173,453 | |
Total Investments (cost $155,891,794) | | $ 161,474,566 |
Cash | | 39,406 |
Receivable for investments sold | | 281,254 |
Receivable for fund shares sold | | 2,399 |
Dividends receivable | | 113,785 |
Distributions receivable from Fidelity Central Funds | | 123,484 |
Receivable for daily variation margin on futures contracts | | 33,580 |
Other receivables | | 3,300 |
Total assets | | 162,071,774 |
| | |
Liabilities | | |
Payable for investments purchased | $ 1,062,753 | |
Payable for fund shares redeemed | 129,103 | |
Accrued management fee | 72,556 | |
Distribution and service plan fees payable | 1,025 | |
Other affiliated payables | 20,799 | |
Other payables and accrued expenses | 24,791 | |
Collateral on securities loaned, at value | 2,008,500 | |
Total liabilities | | 3,319,527 |
| | |
Net Assets | | $ 158,752,247 |
Net Assets consist of: | | |
Paid in capital | | $ 177,869,984 |
Undistributed net investment income | | 1,059,035 |
Accumulated undistributed net realized gain (loss) on investments and foreign currency transactions | | (25,770,950) |
Net unrealized appreciation (depreciation) on investments and assets and liabilities in foreign currencies | | 5,594,178 |
Net Assets | | $ 158,752,247 |
Statement of Assets and Liabilities - continued
| June 30, 2012 (Unaudited) |
| | |
Initial Class:
Net Asset Value, offering price and redemption price per share ($114,099,297 ÷ 7,979,411 shares) | | $ 14.30 |
| | |
Service Class:
Net Asset Value, offering price and redemption price per share ($3,308,532 ÷ 232,978 shares) | | $ 14.20 |
| | |
Service Class 2:
Net Asset Value, offering price and redemption price per share ($3,683,262 ÷ 260,752 shares) | | $ 14.13 |
| | |
Investor Class:
Net Asset Value, offering price and redemption price per share ($37,661,156 ÷ 2,645,056 shares) | | $ 14.24 |
See accompanying notes which are an integral part of the financial statements.
Semiannual Report
Statement of Operations
Six months ended June 30, 2012 (Unaudited) |
| | |
Investment Income | | |
Dividends | | $ 328,087 |
Interest | | 26 |
Income from Fidelity Central Funds | | 1,352,080 |
Total income | | 1,680,193 |
| | |
Expenses | | |
Management fee | $ 459,498 | |
Transfer agent fees | 79,580 | |
Distribution and service plan fees | 6,937 | |
Accounting and security lending fees | 40,826 | |
Custodian fees and expenses | 12,013 | |
Independent trustees' compensation | 303 | |
Registration fees | 18 | |
Audit | 24,241 | |
Legal | 702 | |
Miscellaneous | 812 | |
Total expenses before reductions | 624,930 | |
Expense reductions | (7,660) | 617,270 |
Net investment income (loss) | | 1,062,923 |
Realized and Unrealized Gain (Loss) Net realized gain (loss) on: | | |
Investment securities: | | |
Unaffiliated issuers | 3,154,429 | |
Fidelity Central Funds | 282,560 | |
Foreign currency transactions | (1,427) | |
Futures contracts | (7,619) | |
Capital gain distributions from Fidelity Central Funds | 79,440 | |
Total net realized gain (loss) | | 3,507,383 |
Change in net unrealized appreciation (depreciation) on: Investment securities | 6,913,167 | |
Assets and liabilities in foreign currencies | 142 | |
Futures contracts | 11,508 | |
Total change in net unrealized appreciation (depreciation) | | 6,924,817 |
Net gain (loss) | | 10,432,200 |
Net increase (decrease) in net assets resulting from operations | | $ 11,495,123 |
Statement of Changes in Net Assets
| Six months ended June 30, 2012
(Unaudited) | Year ended
December 31,
2011 |
Increase (Decrease) in Net Assets | | |
Operations | | |
Net investment income (loss) | $ 1,062,923 | $ 2,586,176 |
Net realized gain (loss) | 3,507,383 | 11,988,321 |
Change in net unrealized appreciation (depreciation) | 6,924,817 | (25,496,503) |
Net increase (decrease) in net assets resulting from operations | 11,495,123 | (10,922,006) |
Distributions to shareholders from net investment income | - | (2,772,096) |
Distributions to shareholders from net realized gain | - | (339,717) |
Total distributions | - | (3,111,813) |
Share transactions - net increase (decrease) | (11,790,897) | (8,641,746) |
Total increase (decrease) in net assets | (295,774) | (22,675,565) |
| | |
Net Assets | | |
Beginning of period | 159,048,021 | 181,723,586 |
End of period (including undistributed net investment income of $1,059,035 and distributions in excess of net investment income of $3,888, respectively) | $ 158,752,247 | $ 159,048,021 |
See accompanying notes which are an integral part of the financial statements.
Semiannual Report
Financial Highlights - Initial Class
| Six months ended June 30, 2012 | Years ended December 31, |
| (Unaudited) | 2011 | 2010 | 2009 | 2008 | 2007 |
Selected Per-Share Data | | | | | | |
Net asset value, beginning of period | $ 13.35 | $ 14.52 | $ 12.66 | $ 9.68 | $ 15.51 | $ 13.60 |
Income from Investment Operations | | | | | | |
Net investment income (loss) E | .10 | .22 | .16 | .17 | .26 | .29 |
Net realized and unrealized gain (loss) | .85 | (1.12) | 1.91 | 3.01 | (5.82) | 2.24 |
Total from investment operations | .95 | (.90) | 2.07 | 3.18 | (5.56) | 2.53 |
Distributions from net investment income | - | (.24) | (.16) | (.18) | (.26) | (.62) |
Distributions from net realized gain | - | (.03) | (.05) | (.02) | (.01) | - |
Total distributions | - | (.27) | (.21) | (.20) | (.27) | (.62) |
Net asset value, end of period | $ 14.30 | $ 13.35 | $ 14.52 | $ 12.66 | $ 9.68 | $ 15.51 |
Total Return B, C, D | 7.12% | (6.17)% | 16.34% | 32.91% | (35.81)% | 18.97% |
Ratios to Average Net Assets F, H | | | | | | |
Expenses before reductions | .73% A | .73% | .74% | .78% | .74% | .74% |
Expenses net of fee waivers, if any | .73% A | .72% | .73% | .78% | .74% | .74% |
Expenses net of all reductions | .72% A | .71% | .72% | .77% | .73% | .73% |
Net investment income (loss) | 1.32% A | 1.49% | 1.20% | 1.57% | 1.90% | 1.98% |
Supplemental Data | | | | | | |
Net assets, end of period (000 omitted) | $ 114,099 | $ 113,899 | $ 138,051 | $ 136,479 | $ 118,672 | $ 211,867 |
Portfolio turnover rate G | 65% A | 71% | 68% | 126% | 110% | 132% |
A Annualized
B Total returns for periods of less than one year are not annualized.
C Total returns do not reflect charges attributable to your insurance company's separate account. Inclusion of these charges would reduce the total returns shown.
D Total returns would have been lower if certain expenses had not been reduced during the applicable periods shown.
E Calculated based on average shares outstanding during the period.
F Fees and expenses of any underlying Fidelity Central Funds are not included in the Fund's expense ratio. The Fund indirectly bears its proportionate share of the expenses of any underlying Fidelity Central Funds.
G Amount does not include the portfolio activity of any underlying Fidelity Central Funds.
H Expense ratios reflect operating expenses of the class. Expenses before reductions do not reflect amounts reimbursed by the investment adviser or reductions from brokerage service arrangements or reductions from other expense offset arrangements and do not represent the amount paid by the class during periods when reimbursements or reductions occur. Expenses net of fee waivers reflect expenses after reimbursement by the investment adviser but prior to reductions from brokerage service arrangements or other expense offset arrangements. Expenses net of all reductions represent the net expenses paid by the class.
Financial Highlights - Service Class
| Six months ended June 30, 2012 | Years ended December 31, |
| (Unaudited) | 2011 | 2010 | 2009 | 2008 | 2007 |
Selected Per-Share Data | | | | | | |
Net asset value, beginning of period | $ 13.26 | $ 14.42 | $ 12.58 | $ 9.62 | $ 15.41 | $ 13.51 |
Income from Investment Operations | | | | | | |
Net investment income (loss) E | .09 | .20 | .14 | .16 | .24 | .27 |
Net realized and unrealized gain (loss) | .85 | (1.11) | 1.89 | 2.99 | (5.77) | 2.22 |
Total from investment operations | .94 | (.91) | 2.03 | 3.15 | (5.53) | 2.49 |
Distributions from net investment income | - | (.22) | (.15) | (.17) | (.25) | (.59) |
Distributions from net realized gain | - | (.03) | (.05) | (.02) | (.01) | - |
Total distributions | - | (.25) | (.19) I | (.19) | (.26) | (.59) |
Net asset value, end of period | $ 14.20 | $ 13.26 | $ 14.42 | $ 12.58 | $ 9.62 | $ 15.41 |
Total Return B, C, D | 7.09% | (6.26)% | 16.18% | 32.79% | (35.88)% | 18.79% |
Ratios to Average Net Assets F, H | | | | | | |
Expenses before reductions | .83% A | .83% | .84% | .88% | .84% | .84% |
Expenses net of fee waivers, if any | .83% A | .82% | .84% | .88% | .84% | .84% |
Expenses net of all reductions | .82% A | .81% | .82% | .87% | .83% | .83% |
Net investment income (loss) | 1.22% A | 1.39% | 1.09% | 1.47% | 1.80% | 1.88% |
Supplemental Data | | | | | | |
Net assets, end of period (000 omitted) | $ 3,309 | $ 5,654 | $ 3,999 | $ 3,838 | $ 2,911 | $ 5,113 |
Portfolio turnover rate G | 65% A | 71% | 68% | 126% | 110% | 132% |
A Annualized
B Total returns for periods of less than one year are not annualized.
C Total returns do not reflect charges attributable to your insurance company's separate account. Inclusion of these charges would reduce the total returns shown.
D Total returns would have been lower if certain expenses had not been reduced during the applicable periods shown.
E Calculated based on average shares outstanding during the period.
F Fees and expenses of any underlying Fidelity Central Funds are not included in the Fund's expense ratio. The Fund indirectly bears its proportionate share of the expenses of any underlying Fidelity Central Funds.
G Amount does not include the portfolio activity of any underlying Fidelity Central Funds.
H Expense ratios reflect operating expenses of the class. Expenses before reductions do not reflect amounts reimbursed by the investment adviser or reductions from brokerage service arrangements or reductions from other expense offset arrangements and do not represent the amount paid by the class during periods when reimbursements or reductions occur. Expenses net of fee waivers reflect expenses after reimbursement by the investment adviser but prior to reductions from brokerage service arrangements or other expense offset arrangements. Expenses net of all reductions represent the net expenses paid by the class.
I Total distributions of $.19 per share is comprised of distributions from net investment income of $.148 and distributions from net realized gain of $.045 per share.
See accompanying notes which are an integral part of the financial statements.
Semiannual Report
Financial Highlights - Service Class 2
| Six months ended June 30, 2012 | Years ended December 31, |
| (Unaudited) | 2011 | 2010 | 2009 | 2008 | 2007 |
Selected Per-Share Data | | | | | | |
Net asset value, beginning of period | $ 13.21 | $ 14.36 | $ 12.51 | $ 9.57 | $ 15.34 | $ 13.42 |
Income from Investment Operations | | | | | | |
Net investment income (loss) E | .07 | .17 | .12 | .14 | .22 | .25 |
Net realized and unrealized gain (loss) | .85 | (1.09) | 1.88 | 2.97 | (5.75) | 2.21 |
Total from investment operations | .92 | (.92) | 2.00 | 3.11 | (5.53) | 2.46 |
Distributions from net investment income | - | (.20) | (.11) | (.15) | (.23) | (.54) |
Distributions from net realized gain | - | (.03) | (.05) | (.02) | (.01) | - |
Total distributions | - | (.23) | (.15) I | (.17) | (.24) | (.54) |
Net asset value, end of period | $ 14.13 | $ 13.21 | $ 14.36 | $ 12.51 | $ 9.57 | $ 15.34 |
Total Return B, C, D | 6.96% | (6.39)% | 16.02% | 32.55% | (36.05)% | 18.68% |
Ratios to Average Net Assets F, H | | | | | | |
Expenses before reductions | 1.05% A | 1.01% | 1.02% | 1.06% | 1.01% | 1.02% |
Expenses net of fee waivers, if any | 1.04% A | 1.01% | 1.02% | 1.06% | 1.01% | 1.02% |
Expenses net of all reductions | 1.04% A | 1.00% | 1.00% | 1.05% | 1.01% | 1.01% |
Net investment income (loss) | 1.00% A | 1.20% | .91% | 1.29% | 1.62% | 1.70% |
Supplemental Data | | | | | | |
Net assets, end of period (000 omitted) | $ 3,683 | $ 3,260 | $ 6,046 | $ 8,139 | $ 6,545 | $ 8,622 |
Portfolio turnover rate G | 65% A | 71% | 68% | 126% | 110% | 132% |
A Annualized
B Total returns for periods of less than one year are not annualized.
C Total returns do not reflect charges attributable to your insurance company's separate account. Inclusion of these charges would reduce the total returns shown.
D Total returns would have been lower if certain expenses had not been reduced during the applicable periods shown.
E Calculated based on average shares outstanding during the period.
F Fees and expenses of any underlying Fidelity Central Funds are not included in the Fund's expense ratio. The Fund indirectly bears its proportionate share of the expenses of any underlying Fidelity Central Funds.
G Amount does not include the portfolio activity of any underlying Fidelity Central Funds.
H Expense ratios reflect operating expenses of the class. Expenses before reductions do not reflect amounts reimbursed by the investment adviser or reductions from brokerage service arrangements or reductions from other expense offset arrangements and do not represent the amount paid by the class during periods when reimbursements or reductions occur. Expenses net of fee waivers reflect expenses after reimbursement by the investment adviser but prior to reductions from brokerage service arrangements or other expense offset arrangements. Expenses net of all reductions represent the net expenses paid by the class.
I Total distributions of $.15 per share is comprised of distributions from net investment income of $.108 and distributions from net realized gain of $.045 per share.
Financial Highlights - Investor Class
| Six months ended June 30, 2012 | Years ended December 31, |
| (Unaudited) | 2011 | 2010 | 2009 | 2008 | 2007 |
Selected Per-Share Data | | | | | | |
Net asset value, beginning of period | $ 13.30 | $ 14.46 | $ 12.61 | $ 9.65 | $ 15.46 | $ 13.56 |
Income from Investment Operations | | | | | | |
Net investment income (loss) E | .09 | .20 | .15 | .16 | .24 | .27 |
Net realized and unrealized gain (loss) | .85 | (1.10) | 1.90 | 2.99 | (5.78) | 2.23 |
Total from investment operations | .94 | (.90) | 2.05 | 3.15 | (5.54) | 2.50 |
Distributions from net investment income | - | (.23) | (.15) | (.17) | (.26) | (.60) |
Distributions from net realized gain | - | (.03) | (.05) | (.02) | (.01) | - |
Total distributions | - | (.26) | (.20) | (.19) | (.27) | (.60) |
Net asset value, end of period | $ 14.24 | $ 13.30 | $ 14.46 | $ 12.61 | $ 9.65 | $ 15.46 |
Total Return B, C, D | 7.07% | (6.20)% | 16.25% | 32.68% | (35.85)% | 18.78% |
Ratios to Average Net Assets F, H | | | | | | |
Expenses before reductions | .81% A | .81% | .83% | .89% | .83% | .86% |
Expenses net of fee waivers, if any | .81% A | .81% | .82% | .89% | .83% | .86% |
Expenses net of all reductions | .80% A | .80% | .81% | .87% | .83% | .86% |
Net investment income (loss) | 1.24% A | 1.41% | 1.11% | 1.47% | 1.81% | 1.86% |
Supplemental Data | | | | | | |
Net assets, end of period (000 omitted) | $ 37,661 | $ 36,235 | $ 33,627 | $ 26,307 | $ 20,137 | $ 16,370 |
Portfolio turnover rate G | 65% A | 71% | 68% | 126% | 110% | 132% |
A Annualized
B Total returns for periods of less than one year are not annualized.
C Total returns do not reflect charges attributable to your insurance company's separate account. Inclusion of these charges would reduce the total returns shown.
D Total returns would have been lower if certain expenses had not been reduced during the applicable periods shown.
E Calculated based on average shares outstanding during the period.
F Fees and expenses of any underlying Fidelity Central Funds are not included in the Fund's expense ratio. The Fund indirectly bears its proportionate share of the expenses of any underlying Fidelity Central Funds.
G Amount does not include the portfolio activity of any underlying Fidelity Central Funds.
H Expense ratios reflect operating expenses of the class. Expenses before reductions do not reflect amounts reimbursed by the investment adviser or reductions from brokerage service arrangements or reductions from other expense offset arrangements and do not represent the amount paid by the class during periods when reimbursements or reductions occur. Expenses net of fee waivers reflect expenses after reimbursement by the investment adviser but prior to reductions from brokerage service arrangements or other expense offset arrangements. Expenses net of all reductions represent the net expenses paid by the class.
See accompanying notes which are an integral part of the financial statements.
Semiannual Report
Notes to Financial Statements
For the period ended June 30, 2012 (Unaudited)
1. Organization.
VIP Asset Manager: Growth Portfolio (the Fund) is a fund of Variable Insurance Products Fund V (the Trust) and is authorized to issue an unlimited number of shares. The Trust is registered under the Investment Company Act of 1940, as amended (the 1940 Act), as an open-end management investment company organized as a Massachusetts business trust. Shares of the Fund may only be purchased by insurance companies for the purpose of funding variable annuity or variable life insurance contracts. The Fund offers the following classes of shares: Initial Class shares, Service Class shares, Service Class 2 shares and Investor Class shares. All classes have equal rights and voting privileges, except for matters affecting a single class. Investment income, realized and unrealized capital gains and losses, the common expenses of the Fund, and certain fund-level expense reductions, if any, are allocated on a pro-rata basis to each class based on the relative net assets of each class to the total net assets of the Fund. Each class differs with respect to transfer agent and distribution and service plan fees incurred. Certain expense reductions may also differ by class.
2. Investments in Fidelity Central Funds.
The Fund invests in Fidelity Central Funds, which are open-end investment companies available only to other investment companies and accounts managed by Fidelity Management & Research Company (FMR) and its affiliates. The Fund's Schedule of Investments lists each of the Fidelity Central Funds held as of period end, if any, as an investment of the Fund, but do not include the underlying holdings of each Fidelity Central Fund. As an Investing Fund, the Fund indirectly bears its proportionate share of the expenses of the underlying Fidelity Central Funds.
Based on their investment objective, each Fidelity Central Fund may invest or participate in various investment vehicles or strategies that are similar to those of the Fund. These strategies are consistent with the investment objectives of the Fund and may involve certain economic risks which may cause a decline in value of each of the Fidelity Central Funds and thus a decline in the value of the Fund. The following summarizes the Fund's investment in each Fidelity Central Fund.
Fidelity Central Fund | Investment Manager | Investment Objective | Investment Practices | Expense Ratio* |
Fidelity Commodity Strategy Central Fund | FMR Co., Inc. (FMRC) | Seeks to provide investment returns that correspond to the performance of the commodities market. | Investment in wholly-owned subsidiary organized under the laws of the Cayman Islands Repurchase Agreements Restricted Securities | .04% |
Fidelity Emerging Markets Debt Central Fund | FMRC | Seeks high total return by normally investing in debt securities of issuers in emerging markets and other debt investments that are tied economically to emerging markets. | Foreign Securities Repurchase Agreements Restricted Securities | .01% |
Fidelity Emerging Markets Equity Central Fund | FMRC | Seeks capital appreciation by investing primarily in equity securities of issuers in emerging markets. | Foreign Securities Repurchase Agreements Restricted Securities | .14% |
Fidelity International Equity Central Fund | FMRC | Seeks capital appreciation by investing primarily in non-U.S. based common stocks, including securities of issuers located in emerging markets. | Foreign Securities Repurchase Agreements Restricted Securities | .02% |
Fidelity Floating Rate Central Fund | FMRC | Seeks a high level of income by normally investing in floating rate loans and other floating rate securities. | Loans & Direct Debt Instruments Repurchase Agreements Restricted Securities | .00%** |
Fidelity High Income Central Fund 1 | FMRC | Seeks a high level of income and may also seek capital appreciation by investing primarily in debt securities, preferred stocks, and convertible securities, with an emphasis on lower-quality debt securities. | Loans & Direct Debt Instruments Repurchase Agreements Restricted Securities | .00%** |
Fidelity Inflation-Protected Bond Index Central Fund | Fidelity Investment Money Management, Inc. (FIMM) FIMM | Seeks to provide investment results that correspond to the performance of the inflation-protected United States Treasury market, and may invest in derivatives. | n/a | .00%** |
VIP Investment Grade Central Fund | Fidelity Investments Money Management, Inc. (FIMM) | Seeks a high level of current income by normally investing in investment-grade debt securities and repurchase agreements. | Delayed Delivery & When Issued Securities Repurchase Agreements Restricted Securities Swap Agreements | .00%** |
Fidelity Money Market Central Funds | FIMM | Seeks to obtain a high level of current income consistent with the preservation of capital and liquidity. | Short-term Investments | .00%** |
* Expenses expressed as a percentage of average net assets and are as of each underlying Central Fund's most recent annual or semi-annual shareholder report.
** Amount represents less than .01%.
Semiannual Report
Notes to Financial Statements (Unaudited) - continued
2. Investments in Fidelity Central Funds - continued
An unaudited holdings listing for the Fund, which presents direct holdings as well as the pro-rata share of any securities and other investments held indirectly through its investment in underlying Fidelity Central Funds, other than the Commodity Strategy and Money Market Central Funds, is available at advisor.fidelity.com. A complete unaudited list of holdings for each Fidelity Central Fund is available upon request or at the Securities and Exchange Commission (the SEC) web site at www.sec.gov. In addition, the financial statements of the Fidelity Central Funds which contain the significant accounting policies (including security valuation policies) of those funds are available on the SEC website or upon request.
3. Significant Accounting Policies.
The financial statements have been prepared in conformity with accounting principles generally accepted in the United States of America (GAAP), which require management to make certain estimates and assumptions at the date of the financial statements. Actual results could differ from those estimates. Subsequent events, if any, through the date that the financial statements were issued have been evaluated in the preparation of the financial statements. The following summarizes the significant accounting policies of the Fund:
Security Valuation. Investments are valued as of 4:00 p.m. Eastern time on the last calendar day of the period. In accordance with valuation policies and procedures approved by the Board of Trustees (the Board), the Fund attempts to obtain prices from one or more third party pricing vendor or broker to value its investments. When current market prices, quotations or rates are not readily available or reliable, securities will be fair valued in good faith by the FMR Fair Value Committee (the Committee), in accordance with procedures adopted by the Fund's Board. Factors used in determining fair value vary by security type and may include market or security specific events, changes in interest rates and credit quality. The frequency with which these procedures are used cannot be predicted and they may be utilized to a significant extent. The Committee oversees the Fund's valuation policies and procedures and is responsible for approving and reporting to the Board all fair value determinations.
The Fund categorizes the inputs to valuation techniques used to value its investments into a disclosure hierarchy consisting of three levels as shown below:
Level 1 - quoted prices in active markets for identical investments
Level 2 - other significant observable inputs (including quoted prices for similar investments, interest rates, prepayment speeds, etc.)
Level 3 - unobservable inputs (including the Fund's own assumptions based on the best information available)
Valuation techniques used to value the Fund's investments by major category are as follows:
Equity securities, including restricted securities, for which market quotations are readily available, are valued at the last reported sale price or official closing price as reported by a third party pricing vendor on the primary market or exchange on which they are traded and are categorized as Level 1 in the hierarchy. In the event there were no sales during the day or closing prices are not available, securities are valued at the last quoted bid price or may be valued using the last available price and are generally categorized as Level 2 in the hierarchy. For foreign equity securities, when significant market or security specific events arise, comparisons to the valuation of American Depositary Receipts (ADRs), futures contracts, Exchange-Traded Funds (ETFs) and certain indexes as well as quoted prices for similar securities are used and are categorized as Level 2 in the hierarchy. Utilizing these techniques may result in transfers between Level 1 and Level 2. For restricted equity securities and private placements where observable inputs are limited, assumptions about market activity and risk are used and these securities are categorized as Level 3 in the hierarchy.
Debt securities, including restricted securities, are valued based on evaluated prices received from third party pricing vendors or from brokers who make markets in such securities. For U.S. government and government agency obligations, pricing vendors utilize matrix pricing which considers yield or price of bonds of comparable quality, coupon, maturity and type as well as broker-supplied prices and are generally categorized as Level 2 in the hierarchy. When independent prices are unavailable or unreliable, debt securities may be valued utilizing pricing methodologies which consider similar factors that would be used by third party pricing vendors. These are generally categorized as Level 2 in the hierarchy but may be Level 3 depending on the circumstances.
Futures contracts are valued at the settlement price or official closing price established each day by the board of trade or exchange on which they are traded and are categorized as Level 1 in the hierarchy. Investments in open-end mutual funds,including the Fidelity Central Funds, are valued at their closing net asset value each business day and are categorized as Level 1 in the hierarchy.
Changes in valuation techniques may result in transfers in or out of an assigned level within the disclosure hierarchy. The aggregate value of investments by input level, as of June 30, 2012, for the Fund's investments, is included at the end of the Fund's Schedule of Investments.
Semiannual Report
3. Significant Accounting Policies - continued
Foreign Currency Translation. The Fund may use foreign currency contracts to facilitate transactions in foreign-denominated securities. Gains and losses from these transactions may arise from changes in the value of the foreign currency or if the counterparties do not perform under the contracts' terms.
Foreign-denominated assets, including investment securities, and liabilities are translated into U.S. dollars at the exchange rates at period end. Purchases and sales of investment securities, income and dividends received and expenses denominated in foreign currencies are translated into U.S. dollars at the exchange rate in effect on the transaction date.
The effects of exchange rate fluctuations on investments are included with the net realized and unrealized gain (loss) on investment securities. Other foreign currency transactions resulting in realized and unrealized gain (loss) are disclosed separately.
Investment Transactions and Income. For financial reporting purposes, the Fund's investment holdings and NAV include trades executed through the end of the last business day of the period. The NAV per share for processing shareholder transactions is calculated as of the close of business of the New York Stock Exchange (NYSE), normally 4:00 p.m. Eastern time and includes trades executed through the end of the prior business day. Gains and losses on securities sold are determined on the basis of identified cost and may include proceeds received from litigation. Dividend income is recorded on the ex-dividend date, except for certain dividends from foreign securities where the ex-dividend date may have passed, which are recorded as soon as the Fund is informed of the ex-dividend date. Non-cash dividends included in dividend income, if any, are recorded at the fair market value of the securities received. Distributions received on securities that represent a return of capital or capital gain are recorded as a reduction of cost of investments and/or as a realized gain. The Fund estimates the components of distributions received that may be considered return of capital distributions or capital gain distributions. Interest income and distributions from the Fidelity Central Funds are accrued as earned. Interest income includes coupon interest and amortization of premium and accretion of discount on debt securities. Investment income is recorded net of foreign taxes withheld where recovery of such taxes is uncertain.
Expenses. Expenses directly attributable to a fund are charged to that fund. Expenses attributable to more than one fund are allocated among the respective funds on the basis of relative net assets or other appropriate methods. Expense estimates are accrued in the period to which they relate and adjustments are made when actual amounts are known. Expenses included in the accompanying financial statements reflect the expenses of the Fund and do not include any expenses of the Fidelity Central Funds. Although not included in the Fund's expenses, the Fund indirectly bears its proportionate share of the Fidelity Central Funds' expenses through the impact of these expenses on each Fidelity Central Fund's NAV. Based on their most recent shareholder report date, expenses of the Fidelity Central Funds ranged from less than .01% to .14%.
Income Tax Information and Distributions to Shareholders. Each year, the Fund intends to qualify as a regulated investment company under Subchapter M of the Internal Revenue Code, including distributing substantially all of its taxable income and realized gains. As a result, no provision for income taxes is required. The Fund files a U.S. federal tax return, in addition to state and local tax returns as required. A fund's federal income tax returns are subject to examination by the Internal Revenue Service (IRS) for a period of three fiscal years after they are filed. State and local tax returns may be subject to examination for an additional fiscal year depending on the jurisdiction. Foreign taxes are provided for based on the Fund's understanding of the tax rules and rates that exist in the foreign markets in which it invests.
Distributions are declared and recorded on the ex-dividend date. Income dividends and capital gain distributions are declared separately for each class. Income and capital gain distributions are determined in accordance with income tax regulations, which may differ from GAAP.
Capital accounts within the financial statements are adjusted for permanent book-tax differences. These adjustments have no impact on net assets or the results of operations. Temporary book-tax differences will reverse in a subsequent period.
Book-tax differences are primarily due to the short-term gain distributions from the Fidelity Central Funds, in-kind transactions, futures transactions, foreign currency transactions, market discount, partnerships (including allocations from Fidelity Central Funds), deferred trustees compensation, capital loss carryforwards and losses deferred due to wash sales and excise tax regulations.
The federal tax cost of investment securities and unrealized appreciation (depreciation) as of period end were as follows:
Gross unrealized appreciation | $ 20,496,623 |
Gross unrealized depreciation | (14,693,697) |
Net unrealized appreciation (depreciation) on securities and other investments | $ 5,802,926 |
| |
Tax Cost | $ 155,671,640 |
Semiannual Report
Notes to Financial Statements (Unaudited) - continued
3. Significant Accounting Policies - continued
Income Tax Information and Distributions to Shareholders - continued
Capital loss carryforwards are only available to offset future capital gains of the Fund to the extent provided by regulations and may be limited. Under the Regulated Investment Company Modernization Act of 2010 (the Act), the Fund is permitted to carry forward capital losses incurred in taxable years beginning after December 22, 2010 for an unlimited period and such capital losses are required to be used prior to any losses that expire. At December 31, 2011, capital loss carryforwards were as follows:
Fiscal year of expiration | |
2016 | $ (12,878,795) |
2017 | (21,359,159) |
Total with expiration | $ (34,237,954) |
New Accounting Pronouncement. In December 2011, the Financial Accounting Standards Board issued Accounting Standard Update No. 2011-11, Disclosures about Offsetting Assets and Liabilities. The update creates new disclosure requirements requiring entities to disclose both gross and net information for derivatives and other financial instruments that are either offset in the Statement of Assets and Liabilities or subject to an enforceable master netting arrangement or similar agreement. The disclosure requirements are effective for interim and annual reporting periods beginning on or after January 1, 2013. Management is currently evaluating the impact of the update's adoption on the Fund's financial statement disclosures.
4. Operating Policies.
Restricted Securities. The Fund may invest in securities that are subject to legal or contractual restrictions on resale. These securities generally may be resold in transactions exempt from registration or to the public if the securities are registered. Disposal of these securities may involve time-consuming negotiations and expense, and prompt sale at an acceptable price may be difficult. Information regarding restricted securities is included at the end of the Fund's Schedule of Investments.
5. Derivative Instruments.
Risk Exposures and the Use of Derivative Instruments. The Fund's investment objectives allow the Fund to enter into various types of derivative contracts, including futures contracts. Derivatives are investments whose value is derived from underlying assets, indices or reference rates and may be transacted on an exchange or over-the-counter (OTC). Derivatives may involve a future commitment to buy or sell a specified instrument based on specified terms, or to exchange future cash flows at periodic intervals based on a notional principal amount. The Fund used derivatives to increase returns and to manage exposure to certain risks as defined below. The success of any strategy involving derivatives depends on analysis of numerous economic factors, and if the strategies for investment do not work as intended, the Fund may not achieve its objectives.
The Fund's use of derivatives increased or decreased its exposure to the following risk:
Equity Risk | Equity risk relates to the fluctuations in the value of financial instruments as a result of changes in market prices (other than those arising from interest rate risk or foreign exchange risk), whether caused by factors specific to an individual investment, its issuer, or all factors affecting all instruments traded in a market or market segment. |
The Fund is also exposed to additional risks from investing in derivatives, such as liquidity risk and counterparty credit risk. Liquidity risk is the risk that the Fund will be unable to close out the derivative in the open market in a timely manner. Counterparty credit risk is the risk that the counterparty will not be able to fulfill its obligation to the Fund. Counterparty credit risk related to exchange-traded futures contracts is minimal because of the protection provided by the exchange on which they trade. Investing in derivatives may involve greater risks than investing in the underlying assets directly and, to varying degrees, involves risk of loss in excess of the initial investment, if any, collateral received and amounts recognized in the Statement of Assets and Liabilities. In addition, for futures contracts, there is the risk that the change in value of the derivative contract may not correspond to the change in value of the underlying instrument.
Futures Contracts. A futures contract is an agreement between two parties to buy or sell a specified underlying instrument for a fixed price at a specified future date. The Fund used futures contracts to manage its exposure to the stock market.
Upon entering into a futures contract, a fund is required to deposit either cash or securities (initial margin) with a clearing broker in an amount equal to a certain percentage of the face value of the contract. Futures contracts are marked-to-market daily and subsequent payments (variation margin) are made or received by a fund depending on the daily fluctuations in the value of the futures contracts and are recorded as unrealized appreciation or (depreciation). This receivable and/or payable is included in daily variation margin on futures contracts in the Statement of Assets and Liabilities. Realized gain or (loss) is recorded upon the expiration or closing of a futures contract.
Semiannual Report
5. Derivative Instruments - continued
Futures Contracts - continued
Any open futures contracts at period end are shown in the Schedule of Investments under the caption "Futures Contracts." The underlying face amount at value reflects each contract's exposure to the underlying instrument at period end. Securities deposited to meet initial margin requirements are identified in the Schedule of Investments.
During the period the Fund recognized net realized gain (loss) of ($7,619) and a change in net unrealized appreciation (depreciation) of $11,508 related to its investment in futures contracts. These amounts are included in the Statement of Operations.
6. Purchases and Sales of Investments.
Purchases and sales of securities (including the Equity and Fixed-Income Central Funds), other than short-term securities, aggregated $51,917,864 and $59,892,940, respectively.
7. Fees and Other Transactions with Affiliates.
Management Fee. FMR and its affiliates provide the Fund with investment management related services for which the Fund pays a monthly management fee. The management fee is the sum of an individual fund fee rate that is based on an annual rate of .30% of the Fund's average net assets and an annualized group fee rate that averaged .26% during the period. The group fee rate is based upon the average net assets of all the mutual funds advised by FMR. The group fee rate decreases as assets under management increase and increases as assets under management decrease. For the period, the total annualized management fee rate was .56% of the Fund's average net assets.
FMR pays a portion of the management fees received from the Fund to the Fidelity Central Funds' investment advisers, who are also affiliates, for managing the assets of the Fidelity Central Funds.
During the period, FMR waived a portion of its management fee as described in the Expense Reductions note.
Distribution and Service Plan Fees. In accordance with Rule 12b-1 of the 1940 Act, the Fund has adopted separate 12b-1 Plans for each Service Class of shares. Each Service Class pays Fidelity Distributors Corporation (FDC), an affiliate of FMR, a service fee. For the period, the service fee is based on an annual rate of .10% of Service Class' average net assets and .25% of Service Class 2's average net assets.
For the period, total fees, all of which were re-allowed to insurance companies for the distribution of shares and providing shareholder support services were as follows:
Service Class | $ 2,350 |
Service Class 2 | 4,587 |
| $ 6,937 |
Transfer Agent Fees. Fidelity Investments Institutional Operations Company, Inc. (FIIOC), an affiliate of FMR, is the Fund's transfer, dividend disbursing, and shareholder servicing agent. FIIOC receives an asset-based fee with respect to each class. Each class (with the exception of Investor Class) pays a transfer agent fee, excluding out of pocket expenses, equal to an annual rate of .07% of average net assets. Investor Class pays a monthly asset-based transfer agent fee of .15% of average net assets. In addition, FIIOC receives an asset-based fee of .0038% of average net assets for typesetting, printing and mailing of shareholder reports, except proxy statements. For the period, transfer agent fees for each class, including printing and out of pocket expenses, were as follows:
Initial Class | $ 44,749 |
Service Class | 1,759 |
Service Class 2 | 2,634 |
Investor Class | 30,438 |
| $ 79,580 |
Accounting and Security Lending Fees. Fidelity Service Company, Inc. (FSC), an affiliate of FMR, maintains the Fund's accounting records. The accounting fee is based on the level of average net assets for each month. Under a separate contract, FSC administers the security lending program. The security lending fee is based on the number and duration of lending transactions.
Brokerage Commissions. The Fund placed a portion of its portfolio transactions with brokerage firms which are affiliates of the investment adviser. The commissions paid to these affiliated firms were $1,191 for the period.
Semiannual Report
Notes to Financial Statements (Unaudited) - continued
8. Committed Line of Credit.
The Fund participates with other funds managed by FMR or an affiliate in a $4.25 billion credit facility (the "line of credit") to be utilized for temporary or emergency purposes to fund shareholder redemptions or for other short-term liquidity purposes. The Fund has agreed to pay commitment fees on its pro-rata portion of the line of credit, which amounted to $248 and is reflected in Miscellaneous expenses on the Statement of Operations. During the period, there were no borrowings on this line of credit.
9. Security Lending.
The Fund lends portfolio securities through a lending agent from time to time in order to earn additional income. For equity securities, a lending agent is used and may loan securities to certain qualified borrowers, including Fidelity Capital Markets (FCM), a broker-dealer affiliated with the Fund. On the settlement date of the loan, the Fund receives collateral (in the form of U.S. Treasury obligations, letters of credit and/or cash) against the loaned securities and maintains collateral in an amount not less than 100% of the market value of the loaned securities during the period of the loan. The market value of the loaned securities is determined at the close of business of the Fund and any additional required collateral is delivered to the Fund on the next business day. If the borrower defaults on its obligation to return the securities loaned because of insolvency or other reasons, a fund could experience delays and costs in recovering the securities loaned or in gaining access to the collateral. Any cash collateral received is invested in the Fidelity Securities Lending Cash Central Fund. The value of loaned securities and cash collateral at period end are disclosed on the Fund's Statement of Assets and Liabilities. At period end, there were no security loans outstanding with FCM. Security lending income represents the income earned on investing cash collateral, less rebates paid to borrowers and any lending agent fees associated with the loan, plus any premium payments received for lending certain types of securities. Security lending income is presented in the Statement of Operations as a component of income from Fidelity Central Funds. Total security lending income during the period amounted to $28,215, including $17 from securities loaned to FCM.
10. Expense Reductions.
FMR has contractually agreed to waive the Fund's management fee in an amount equal to its proportionate share of the management fee paid to FMR by the subsidiary of Fidelity Commodity Strategy Fund based on the Fund's proportionate ownership of the Central Fund. During the period, this waiver reduced the Fund's management fee by $442.
Many of the brokers with whom FMR places trades on behalf of the Fund, and certain Central Funds, provided services to the Fund in addition to trade execution. These services included payments of certain expenses on behalf of the Fund totaling $7,218 for the period.
11. Distributions to Shareholders.
Distributions to shareholders of each class were as follows:
| Six months ended
June 30,
2012 | Year ended
December 31,
2011 |
From net investment income | | |
Initial Class | $ - | $ 2,018,353 |
Service Class | - | 50,378 |
Service Class 2 | - | 86,587 |
Investor Class | - | 616,778 |
Total | $ - | $ 2,772,096 |
From net realized gain | | |
Initial Class | $ - | $ 242,872 |
Service Class | - | 6,522 |
Service Class 2 | - | 12,555 |
Investor Class | - | 77,768 |
Total | $ - | $ 339,717 |
Semiannual Report
12. Share Transactions.
Transactions for each class of shares were as follows:
| Shares | Dollars |
| Six months ended June 30,
2012 | Year ended
December 31,
2011 | Six months ended June 30,
2012 | Year ended
December 31,
2011 |
Initial Class | | | | |
Shares sold | 84,265 | 324,970 | $ 1,220,156 | $ 4,775,569 |
Reinvestment of distributions | - | 171,956 | - | 2,261,225 |
Shares redeemed | (638,660) | (1,472,410) | (9,186,843) | (21,398,844) |
Net increase (decrease) | (554,395) | (975,484) | $ (7,966,687) | $ (14,362,050) |
Service Class | | | | |
Shares sold | 58,434 | 209,255 | $ 849,855 | $ 2,776,259 |
Reinvestment of distributions | - | 4,353 | - | 56,900 |
Shares redeemed | (251,781) | (64,541) | (3,701,926) | (925,999) |
Net increase (decrease) | (193,347) | 149,067 | $ (2,852,071) | $ 1,907,160 |
Service Class 2 | | | | |
Shares sold | 37,284 | 149,932 | $ 525,224 | $ 2,168,633 |
Reinvestment of distributions | - | 7,620 | - | 99,142 |
Shares redeemed | (23,429) | (331,565) | (331,932) | (4,516,196) |
Net increase (decrease) | 13,855 | (174,013) | $ 193,292 | $ (2,248,421) |
Investor Class | | | | |
Shares sold | 205,991 | 881,525 | $ 2,952,418 | $ 12,860,103 |
Reinvestment of distributions | - | 53,019 | - | 694,546 |
Shares redeemed | (286,260) | (534,217) | (4,117,849) | (7,493,084) |
Net increase (decrease) | (80,269) | 400,327 | $ (1,165,431) | $ 6,061,565 |
13. Other.
The Fund's organizational documents provide former and current trustees and officers with a limited indemnification against liabilities arising in connection with the performance of their duties to the Fund. In the normal course of business, the Fund may also enter into contracts that provide general indemnifications. The Fund's maximum exposure under these arrangements is unknown as this would be dependent on future claims that may be made against the Fund. The risk of material loss from such claims is considered remote.
At the end of the period, FMR or its affiliates were the owners of record of 78% of the total outstanding shares of the Fund.
Semiannual Report
Semiannual Report
Investment Adviser
Fidelity Management & Research Company
Boston, MA
Investment Sub-Advisers
FMR Co., Inc.
Fidelity Management & Research (U.K.) Inc.
Fidelity Management & Research (Hong Kong) Limited
Fidelity Management & Research (Japan) Inc.
Fidelity Investments Money Management, Inc.
General Distributor
Fidelity Distributors Corporation
Smithfield, RI
Transfer and Service Agents
Fidelity Investments Institutional Operations Company, Inc.
Boston, MA
Fidelity Service Company, Inc.
Boston, MA
Custodian
JPMorgan Chase Bank
New York, NY
VIPAMG-SANN-0812
1.705700.114
Fidelity® Variable Insurance Products:
Freedom Funds -
Income, 2005, 2010, 2015, 2020, 2025, 2030, 2035, 2040, 2045, 2050
Semiannual Report
June 30, 2012
(Fidelity Cover Art)
Contents
Semiannual Report
To view a fund's proxy voting guidelines and proxy voting record for the 12-month period ended June 30, visit http://www.fidelity.com/proxyvotingresults or visit the Securities and Exchange Commission's (SEC) web site at http://www.sec.gov. You may also call 1-877-208-0098 to request a free copy of the proxy voting guidelines.
Fidelity Variable Insurance Products are separate account options which are purchased through a variable insurance contract.
Standard & Poor's, S&P and S&P 500 are registered service marks of The McGraw-Hill Companies, Inc. and have been licensed for use by Fidelity Distributors Corporation.
Other third party marks appearing herein are the property of their respective owners.
All other marks appearing herein are registered or unregistered trademarks or service marks of FMR LLC or an affiliated company. © 2012 FMR LLC. All rights reserved.
This report and the financial statements contained herein are submitted for the general information of the shareholders of the funds. This report is not authorized for distribution to prospective investors in the funds unless preceded or accompanied by an effective prospectus.
A fund files its complete schedule of portfolio holdings with the SEC for the first and third quarters of each fiscal year on Form N-Q. Forms N-Q are available on the SEC's web site at http://www.sec.gov. A fund's Forms N-Q may be reviewed and copied at the SEC's Public Reference Room in Washington, DC. Information regarding the operation of the SEC's Public Reference Room may be obtained by calling 1-800-SEC-0330. For a complete list of a fund's portfolio holdings, view the most recent holdings listing, semiannual report, or annual report on Fidelity's web site at http://www.fidelity.com, http://www.advisor.fidelity.com, or http://www.401k.com, as applicable.
NOT FDIC INSURED • MAY LOSE VALUE • NO BANK GUARANTEE
Neither the funds nor Fidelity Distributors Corporation is a bank.
Semiannual Report
As a shareholder of a Fund, you incur two types of costs: (1) transaction costs, and (2) ongoing costs, including distribution and/or service (12b-1) fees and other Fund expenses. This Example is intended to help you understand your ongoing costs (in dollars) of investing in the Funds and to compare these costs with the ongoing costs of investing in other mutual funds.
The Example is based on an investment of $1,000 invested at the beginning of the period and held for the entire period (January 1, 2012 to June 30, 2012).
Actual Expenses
The first line of the accompanying table for each class of each fund provides information about actual account values and actual expenses. You may use the information in this line, together with the amount you invested, to estimate the expenses that you paid over the period. Simply divide your account value by $1,000.00 (for example, an $8,600 account value divided by $1,000.00 = 8.6), then multiply the result by the number in the first line for a class of the fund under the heading entitled "Expenses Paid During Period" to estimate the expenses you paid on your account during this period. The estimate of expenses does not include any fees or other expenses of any variable annuity or variable life insurance product. If they were, the estimate of expenses you paid during the period would be higher, and your ending account value would be lower. In addition, each Fund, as a shareholder in underlying Fidelity Funds, will indirectly bear its pro-rata share of the fees and expenses incurred by the underlying Fidelity Funds. These fees and expenses are not included in each Fund's annualized expense ratio used to calculate the expense estimates in the table below.
Hypothetical Example for Comparison Purposes
The second line of the accompanying table for each class of each fund provides information about hypothetical account values and hypothetical expenses based on a Class' actual expense ratio and an assumed rate of return of 5% per year before expenses, which is not the Class' actual return. The hypothetical account values and expenses may not be used to estimate the actual ending account balance or expenses you paid for the period. You may use this information to compare the ongoing costs of investing in the Fund and other funds. To do so, compare this 5% hypothetical example with the 5% hypothetical examples that appear in the shareholder reports of the other funds. The estimate of expenses does not include any fees or other expenses of any variable annuity or variable life insurance product. If they were, the estimate of expenses you paid during the period would be higher, and your ending account value would be lower. In addition, each Fund, as a shareholder in underlying Fidelity Funds, will indirectly bear its pro-rata share of the fees and expenses incurred by the underlying Fidelity Funds. These fees and expenses are not included in each Fund's annualized expense ratio used to calculate the expense estimates in the table below.
Please note that the expenses shown in the table are meant to highlight your ongoing costs only and do not reflect any transaction costs. Therefore, the second line of the table is useful in comparing ongoing costs only, and will not help you determine the relative total costs of owning different funds.
| Annualized
Expense Ratio | Beginning
Account Value
January 1, 2012 | Ending
Account Value
June 30, 2012 | Expenses Paid
During Period*
January 1, 2012
to June 30, 2012 |
VIP Freedom Income | | | | |
Initial Class | .00% | | | |
Actual | | $ 1,000.00 | $ 1,033.70 | $ .00 |
HypotheticalA | | $ 1,000.00 | $ 1,024.86 | $ .00 |
Service Class | .10% | | | |
Actual | | $ 1,000.00 | $ 1,032.60 | $ .51 |
HypotheticalA | | $ 1,000.00 | $ 1,024.37 | $ .50 |
Service Class 2 | .25% | | | |
Actual | | $ 1,000.00 | $ 1,031.80 | $ 1.26 |
HypotheticalA | | $ 1,000.00 | $ 1,023.62 | $ 1.26 |
VIP Freedom 2005 | | | | |
Initial Class | .00% | | | |
Actual | | $ 1,000.00 | $ 1,048.70 | $ .00 |
HypotheticalA | | $ 1,000.00 | $ 1,024.86 | $ .00 |
Service Class | .10% | | | |
Actual | | $ 1,000.00 | $ 1,048.70 | $ .51 |
HypotheticalA | | $ 1,000.00 | $ 1,024.37 | $ .50 |
Service Class 2 | .25% | | | |
Actual | | $ 1,000.00 | $ 1,047.70 | $ 1.27 |
HypotheticalA | | $ 1,000.00 | $ 1,023.62 | $ 1.26 |
| Annualized
Expense Ratio | Beginning
Account Value
January 1, 2012 | Ending
Account Value
June 30, 2012 | Expenses Paid
During Period*
January 1, 2012
to June 30, 2012 |
VIP Freedom 2010 | | | | |
Initial Class | .00% | | | |
Actual | | $ 1,000.00 | $ 1,057.90 | $ .00 |
HypotheticalA | | $ 1,000.00 | $ 1,024.86 | $ .00 |
Service Class | .10% | | | |
Actual | | $ 1,000.00 | $ 1,057.90 | $ .51 |
HypotheticalA | | $ 1,000.00 | $ 1,024.37 | $ .50 |
Service Class 2 | .25% | | | |
Actual | | $ 1,000.00 | $ 1,057.20 | $ 1.28 |
HypotheticalA | | $ 1,000.00 | $ 1,023.62 | $ 1.26 |
VIP Freedom 2015 | | | | |
Initial Class | .00% | | | |
Actual | | $ 1,000.00 | $ 1,060.60 | $ .00 |
HypotheticalA | | $ 1,000.00 | $ 1,024.86 | $ .00 |
Service Class | .10% | | | |
Actual | | $ 1,000.00 | $ 1,059.70 | $ .51 |
HypotheticalA | | $ 1,000.00 | $ 1,024.37 | $ .50 |
Service Class 2 | .25% | | | |
Actual | | $ 1,000.00 | $ 1,058.90 | $ 1.28 |
HypotheticalA | | $ 1,000.00 | $ 1,023.62 | $ 1.26 |
VIP Freedom 2020 | | | | |
Initial Class | .00% | | | |
Actual | | $ 1,000.00 | $ 1,066.70 | $ .00 |
HypotheticalA | | $ 1,000.00 | $ 1,024.86 | $ .00 |
Service Class | .10% | | | |
Actual | | $ 1,000.00 | $ 1,064.80 | $ .51 |
HypotheticalA | | $ 1,000.00 | $ 1,024.37 | $ .50 |
Service Class 2 | .25% | | | |
Actual | | $ 1,000.00 | $ 1,064.00 | $ 1.28 |
HypotheticalA | | $ 1,000.00 | $ 1,023.62 | $ 1.26 |
VIP Freedom 2025 | | | | |
Initial Class | .00% | | | |
Actual | | $ 1,000.00 | $ 1,072.60 | $ .00 |
HypotheticalA | | $ 1,000.00 | $ 1,024.86 | $ .00 |
Service Class | .10% | | | |
Actual | | $ 1,000.00 | $ 1,071.70 | $ .52 |
HypotheticalA | | $ 1,000.00 | $ 1,024.37 | $ .50 |
Service Class 2 | .25% | | | |
Actual | | $ 1,000.00 | $ 1,070.90 | $ 1.29 |
HypotheticalA | | $ 1,000.00 | $ 1,023.62 | $ 1.26 |
VIP Freedom 2030 | | | | |
Initial Class | .00% | | | |
Actual | | $ 1,000.00 | $ 1,075.10 | $ .00 |
HypotheticalA | | $ 1,000.00 | $ 1,024.86 | $ .00 |
Service Class | .10% | | | |
Actual | | $ 1,000.00 | $ 1,074.10 | $ .52 |
HypotheticalA | | $ 1,000.00 | $ 1,024.37 | $ .50 |
Service Class 2 | .25% | | | |
Actual | | $ 1,000.00 | $ 1,073.20 | $ 1.29 |
HypotheticalA | | $ 1,000.00 | $ 1,023.62 | $ 1.26 |
| Annualized
Expense Ratio | Beginning
Account Value
January 1, 2012 | Ending
Account Value
June 30, 2012 | Expenses Paid
During Period*
January 1, 2012
to June 30, 2012 |
VIP Freedom 2035 | | | | |
Initial Class | .00% | | | |
Actual | | $ 1,000.00 | $ 1,078.90 | $ .00 |
HypotheticalA | | $ 1,000.00 | $ 1,024.86 | $ .00 |
Service Class | .10% | | | |
Actual | | $ 1,000.00 | $ 1,078.90 | $ .52 |
HypotheticalA | | $ 1,000.00 | $ 1,024.37 | $ .50 |
Service Class 2 | .25% | | | |
Actual | | $ 1,000.00 | $ 1,078.30 | $ 1.29 |
HypotheticalA | | $ 1,000.00 | $ 1,023.62 | $ 1.26 |
VIP Freedom 2040 | | | | |
Initial Class | .00% | | | |
Actual | | $ 1,000.00 | $ 1,079.80 | $ .00 |
HypotheticalA | | $ 1,000.00 | $ 1,024.86 | $ .00 |
Service Class | .10% | | | |
Actual | | $ 1,000.00 | $ 1,079.90 | $ .52 |
HypotheticalA | | $ 1,000.00 | $ 1,024.37 | $ .50 |
Service Class 2 | .25% | | | |
Actual | | $ 1,000.00 | $ 1,078.30 | $ 1.29 |
HypotheticalA | | $ 1,000.00 | $ 1,023.62 | $ 1.26 |
VIP Freedom 2045 | | | | |
Initial Class | .00% | | | |
Actual | | $ 1,000.00 | $ 1,081.30 | $ .00 |
HypotheticalA | | $ 1,000.00 | $ 1,024.86 | $ .00 |
Service Class | .10% | | | |
Actual | | $ 1,000.00 | $ 1,080.50 | $ .52 |
HypotheticalA | | $ 1,000.00 | $ 1,024.37 | $ .50 |
Service Class 2 | .25% | | | |
Actual | | $ 1,000.00 | $ 1,079.80 | $ 1.29 |
HypotheticalA | | $ 1,000.00 | $ 1,023.62 | $ 1.26 |
VIP Freedom 2050 | | | | |
Initial Class | .00% | | | |
Actual | | $ 1,000.00 | $ 1,082.70 | $ .00 |
HypotheticalA | | $ 1,000.00 | $ 1,024.86 | $ .00 |
Service Class | .10% | | | |
Actual | | $ 1,000.00 | $ 1,082.70 | $ .52 |
HypotheticalA | | $ 1,000.00 | $ 1,024.37 | $ .50 |
Service Class 2 | .25% | | | |
Actual | | $ 1,000.00 | $ 1,082.00 | $ 1.29 |
HypotheticalA | | $ 1,000.00 | $ 1,023.62 | $ 1.26 |
A 5% return per year before expenses
* Expenses are equal to each Class' annualized expense ratio, multiplied by the average account value over the period, multiplied by 182/ 366 (to reflect the one-half year period). The fees and expenses of the underlying Fidelity Funds in which the Fund invests are not included in each class' annualized expense ratio.
Semiannual Report
VIP Freedom Income Portfolio
Investment Changes (Unaudited)
Fund Holdings as of June 30, 2012 |
| % of fund's
net assets | % of fund's net assets
6 months ago |
Domestic Equity Funds | | |
VIP Contrafund Portfolio Initial Class | 2.6 | 2.3 |
VIP Equity-Income Portfolio Initial Class | 2.7 | 2.8 |
VIP Growth & Income Portfolio Initial Class | 3.1 | 2.8 |
VIP Growth Portfolio Initial Class | 2.6 | 2.7 |
VIP Mid Cap Portfolio Initial Class | 0.8 | 1.0 |
VIP Value Portfolio Initial Class | 2.0 | 2.4 |
VIP Value Strategies Portfolio Initial Class | 1.0 | 1.0 |
| 14.8 | 15.0 |
Developed International Equity Funds | | |
VIP Overseas Portfolio Initial Class | 4.2 | 4.1 |
Emerging Markets Equity Funds | | |
VIP Emerging Markets Portfolio Initial Class | 1.3 | 1.0 |
High Yield Bond Funds | | |
VIP High Income Portfolio Initial Class | 5.1 | 5.1 |
Investment Grade Bond Funds | | |
VIP Investment Grade Bond Portfolio Initial Class | 34.9 | 35.3 |
Short-Term Funds | | |
VIP Money Market Portfolio Initial Class | 39.7 | 39.5 |
Net Other Assets (Liabilities)* | 0.0 | 0.0 |
| 100.0 | 100.0 |
* Amount represents less than 0.1% |
Asset Allocation (% of fund's net assets) |
Current |
 | Domestic Equity Funds | 14.8% | |
 | Developed International Equity Funds | 4.2% | |
 | Emerging Markets Equity Funds | 1.3% | |
 | High Yield Bond Funds | 5.1% | |
 | Investment Grade Bond Funds | 34.9% | |
 | Short-Term Funds | 39.7% | |

Six months ago |
| Domestic Equity Funds | 15.0% | |
| Developed International Equity Funds | 4.1% | |
| Emerging Markets Equity Funds | 1.0% | |
| High Yield Bond Funds | 5.1% | |
| Investment Grade Bond Funds | 35.3% | |
| Short-Term Funds | 39.5% | |

Expected |
| Domestic Equity Funds | 14.6% | |
| Developed International Equity Funds | 4.2% | |
| Emerging Markets Equity Funds | 1.2% | |
| High Yield Bond Funds | 5.0% | |
| Investment Grade Bond Funds | 35.0% | |
| Short-Term Funds | 40.0% | |

The six months ago allocation is based on the fund's holdings as of December 31, 2011. The current allocation is based on the fund's holdings as of June 30, 2012. The expected allocation represents the fund's anticipated allocation at December 31, 2012. |
Semiannual Report
VIP Freedom Income Portfolio
Investments June 30, 2012 (Unaudited)
Showing Percentage of Net Assets
Domestic Equity Funds - 14.8% |
| Shares | | Value |
Domestic Equity Funds - 14.8% |
VIP Contrafund Portfolio Initial Class | 22,523 | | $ 567,361 |
VIP Equity-Income Portfolio Initial Class | 30,796 | | 608,836 |
VIP Growth & Income Portfolio Initial Class | 49,531 | | 684,520 |
VIP Growth Portfolio Initial Class | 14,139 | | 576,870 |
VIP Mid Cap Portfolio Initial Class | 5,441 | | 169,116 |
VIP Value Portfolio Initial Class | 39,149 | | 452,560 |
VIP Value Strategies Portfolio Initial Class | 22,154 | | 218,216 |
TOTAL DOMESTIC EQUITY FUNDS (Cost $3,411,964) |
3,277,479
|
International Equity Funds - 5.5% |
| | | |
Developed International Equity Funds - 4.2% |
VIP Overseas Portfolio Initial Class | 64,528 | | 938,231 |
Emerging Markets Equity Funds - 1.3% |
VIP Emerging Markets Portfolio Initial Class | 35,122 | | 276,760 |
TOTAL INTERNATIONAL EQUITY FUNDS (Cost $1,218,799) |
1,214,991
|
Bond Funds - 40.0% |
| Shares | | Value |
High Yield Bond Funds - 5.1% |
VIP High Income Portfolio Initial Class | 193,224 | | $ 1,114,902 |
Investment Grade Bond Funds - 34.9% |
VIP Investment Grade Bond Portfolio Initial Class | 579,729 | | 7,716,197 |
TOTAL BOND FUNDS (Cost $8,408,178) |
8,831,099
|
Short-Term Funds - 39.7% |
| | | |
VIP Money Market Portfolio Initial Class
(Cost $8,769,483) | 8,769,483 | |
8,769,483
|
TOTAL INVESTMENT PORTFOLIO - 100.0% (Cost $21,808,424) | | 22,093,052 |
NET OTHER ASSETS (LIABILITIES) - 0.0% | | (1,602) |
NET ASSETS - 100% | $ 22,091,450 |
Other Information |
All investments are categorized as Level 1 under the Fair Value Hierarchy. The inputs or methodology used for valuing securities may not be an indication of the risk associated with investing in those securities. For more information on valuation inputs, please refer to the Security Valuation section in the accompanying Notes to Financial Statements. |
See accompanying notes which are an integral part of the financial statements.
Semiannual Report
VIP Freedom Income Portfolio
Statement of Assets and Liabilities
�� | June 30, 2012 (Unaudited) |
| | |
Assets | | |
Investment in securities, at value (cost $21,808,424) - See accompanying schedule | | $ 22,093,052 |
Receivable for investments sold | | 2,292 |
Receivable for fund shares sold | | 39,027 |
Total assets | | 22,134,371 |
| | |
Liabilities | | |
Payable to custodian bank | $ 317 | |
Payable for investments purchased | 38,638 | |
Payable for fund shares redeemed | 2,333 | |
Distribution and service plan fees payable | 1,633 | |
Total liabilities | | 42,921 |
| | |
Net Assets | | $ 22,091,450 |
Net Assets consist of: | | |
Paid in capital | | $ 21,834,213 |
Accumulated net investment loss | | (1,958) |
Accumulated undistributed net realized gain (loss) on investments | | (25,433) |
Net unrealized appreciation (depreciation) on investments | | 284,628 |
Net Assets | | $ 22,091,450 |
Initial Class:
Net Asset Value, offering price and redemption price per share ($12,733,356 ÷ 1,213,812 shares) | | $ 10.49 |
| | |
Service Class:
Net Asset Value, offering price and redemption price per share ($2,244,401 ÷ 213,896 shares) | | $ 10.49 |
| | |
Service Class 2:
Net Asset Value, offering price and redemption price per share ($7,113,693 ÷ 681,182 shares) | | $ 10.44 |
Statement of Operations
Six months ended June 30, 2012 (Unaudited) |
| | |
Investment Income | | |
Income distributions from underlying funds | | $ 7,202 |
| | |
Expenses | | |
Distribution and service plan fees | $ 9,697 | |
Independent trustees' compensation | 36 | |
Total expenses before reductions | 9,733 | |
Expense reductions | (36) | 9,697 |
Net investment income (loss) | | (2,495) |
Realized and Unrealized Gain (Loss) Realized gain (loss) on sale of underlying fund shares | 27,907 | |
Capital gain distributions from underlying funds | 63,875 | |
Total net realized gain (loss) | | 91,782 |
Change in net unrealized appreciation (depreciation) on underlying funds | | 590,349 |
Net gain (loss) | | 682,131 |
Net increase (decrease) in net assets resulting from operations | | $ 679,636 |
See accompanying notes which are an integral part of the financial statements.
Semiannual Report
Statement of Changes in Net Assets
| Six months ended
June 30, 2012
(Unaudited) | Year ended
December 31,
2011 |
Increase (Decrease) in Net Assets | | |
Operations | | |
Net investment income (loss) | $ (2,495) | $ 358,148 |
Net realized gain (loss) | 91,782 | 184,228 |
Change in net unrealized appreciation (depreciation) | 590,349 | (299,503) |
Net increase (decrease) in net assets resulting from operations | 679,636 | 242,873 |
Distributions to shareholders from net investment income | - | (357,612) |
Distributions to shareholders from net realized gain | (121,738) | (78,451) |
Total distributions | (121,738) | (436,063) |
Share transactions - net increase (decrease) | 359,946 | 2,716,306 |
Total increase (decrease) in net assets | 917,844 | 2,523,116 |
| | |
Net Assets | | |
Beginning of period | 21,173,606 | 18,650,490 |
End of period (including accumulated net investment loss of $1,958 and undistributed net investment income of $537, respectively) | $ 22,091,450 | $ 21,173,606 |
Financial Highlights - Initial Class
| Six months ended
June 30, 2012 | Years ended December 31, |
| (Unaudited) | 2011 | 2010 | 2009 | 2008 | 2007 |
Selected Per-Share Data | | | | | | |
Net asset value, beginning of period | $ 10.21 | $ 10.27 | $ 10.00 | $ 9.14 | $ 10.80 | $ 10.71 |
Income from Investment Operations | | | | | | |
Net investment income (loss) E | - I | .19 | .19 | .39 | .36 | .43 |
Net realized and unrealized gain (loss) | .34 | (.02) | .56 | .96 | (1.48) | .22 |
Total from investment operations | .34 | .17 | .75 | 1.35 | (1.12) | .65 |
Distributions from net investment income | - | (.19) | (.20) | (.35) | (.37) | (.44) |
Distributions from net realized gain | (.06) | (.04) | (.28) | (.15) | (.17) | (.12) |
Total distributions | (.06) | (.23) | (.48) | (.49) J | (.54) | (.56) |
Net asset value, end of period | $ 10.49 | $ 10.21 | $ 10.27 | $ 10.00 | $ 9.14 | $ 10.80 |
Total Return B, C, D | 3.37% | 1.63% | 7.49% | 14.95% | (10.45)% | 6.10% |
Ratios to Average Net Assets F, H | | | | | | |
Expenses before reductions G | .00% A | .00% | .00% | .00% | .00% | .00% |
Expenses net of fee waivers, if any | .00% A | .00% | .00% | .00% | .00% | .00% |
Expenses net of all reductions | .00% A | .00% | .00% | .00% | .00% | .00% |
Net investment income (loss) | .07% A | 1.85% | 1.88% | 4.00% | 3.50% | 3.93% |
Supplemental Data | | | | | | |
Net assets, end of period (000 omitted) | $ 12,733 | $ 10,938 | $ 11,165 | $ 12,679 | $ 8,976 | $ 10,035 |
Portfolio turnover rate | 50% A | 49% | 41% | 32% | 55% | 56% |
AAnnualized BTotal returns for periods of less than one year are not annualized. CTotal returns do not reflect charges attributable to your insurance company's separate account. Inclusion of these charges would reduce the total returns shown. DTotal returns would have been lower if certain expenses had not been reduced during the applicable periods shown. ECalculated based on average shares outstanding during the period. FAmounts do not include the activity of the Underlying Funds. GAmount represents less than .01%. HExpense ratios reflect operating expenses of the class. Expenses before reductions do not reflect amounts reimbursed by the investment adviser or reductions from expense offset arrangements and do not represent the amount paid by the class during periods when reimbursements or reductions occur. Expenses net of fee waivers reflect expenses after reimbursement by the investment adviser but prior to reductions from expense offset arrangements. Expenses net of all reductions represent the net expenses paid by the class but do not include expenses of the investment companies in which the Fund invests. IAmount represents less than $.01 per share. JTotal distributions of $.49 per share is comprised of distributions from net investment income of $.347 and distributions from net realized gain of $.146 per share. |
See accompanying notes which are an integral part of the financial statements.
Semiannual Report
Financial Highlights - Service Class
| Six months ended
June 30, 2012 | Years ended December 31, |
| (Unaudited) | 2011 | 2010 | 2009 | 2008 | 2007 |
Selected Per-Share Data | | | | | | |
Net asset value, beginning of period | $ 10.22 | $ 10.28 | $ 10.00 | $ 9.14 | $ 10.81 | $ 10.71 |
Income from Investment Operations | | | | | | |
Net investment income (loss) E | - H | .18 | .18 | .37 | .35 | .42 |
Net realized and unrealized gain (loss) | .33 | (.02) | .56 | .97 | (1.50) | .23 |
Total from investment operations | .33 | .16 | .74 | 1.34 | (1.15) | .65 |
Distributions from net investment income | - | (.18) | (.19) | (.33) | (.35) | (.43) |
Distributions from net realized gain | (.06) | (.04) | (.28) | (.15) | (.17) | (.12) |
Total distributions | (.06) | (.22) | (.46) J | (.48) I | (.52) | (.55) |
Net asset value, end of period | $ 10.49 | $ 10.22 | $ 10.28 | $ 10.00 | $ 9.14 | $ 10.81 |
Total Return B, C, D | 3.26% | 1.56% | 7.46% | 14.81% | (10.65)% | 6.10% |
Ratios to Average Net Assets F, G | | | | | | |
Expenses before reductions | .10% A | .10% | .10% | .10% | .10% | .10% |
Expenses net of fee waivers, if any | .10% A | .10% | .10% | .10% | .10% | .10% |
Expenses net of all reductions | .10% A | .10% | .10% | .10% | .10% | .10% |
Net investment income (loss) | (.03)% A | 1.75% | 1.78% | 3.90% | 3.40% | 3.83% |
Supplemental Data | | | | | | |
Net assets, end of period (000 omitted) | $ 2,244 | $ 2,505 | $ 172 | $ 163 | $ 258 | $ 414 |
Portfolio turnover rate | 50% A | 49% | 41% | 32% | 55% | 56% |
AAnnualized BTotal returns for periods of less than one year are not annualized. CTotal returns do not reflect charges attributable to your insurance company's separate account. Inclusion of these charges would reduce the total returns shown. DTotal returns would have been lower if certain expenses had not been reduced during the applicable periods shown. ECalculated based on average shares outstanding during the period. FAmounts do not include the activity of the Underlying Funds. GExpense ratios reflect operating expenses of the class. Expenses before reductions do not reflect amounts reimbursed by the investment adviser or reductions from expense offset arrangements and do not represent the amount paid by the class during periods when reimbursements or reductions occur. Expenses net of fee waivers reflect expenses after reimbursement by the investment adviser but prior to reductions from expense offset arrangements. Expenses net of all reductions represent the net expenses paid by the class but do not include expenses of the investment companies in which the Fund invests. HAmount represents less than $.01 per share. ITotal distributions of $.48 per share is comprised of distributions from net investment income of $.334 and distributions from net realized gain of $.146 per share. JTotal distributions of $.46 per share is comprised of distributions from net investment income of $.189 and distributions from net realized gain of $.275 per share. |
Financial Highlights - Service Class 2
| Six months ended
June 30, 2012 | Years ended December 31, |
| (Unaudited) | 2011 | 2010 | 2009 | 2008 | 2007 |
Selected Per-Share Data | | | | | | |
Net asset value, beginning of period | $ 10.18 | $ 10.24 | $ 9.97 | $ 9.12 | $ 10.78 | $ 10.69 |
Income from Investment Operations | | | | | | |
Net investment income (loss) E | (.01) | .17 | .17 | .36 | .33 | .40 |
Net realized and unrealized gain (loss) | .33 | (.03) | .55 | .96 | (1.48) | .23 |
Total from investment operations | .32 | .14 | .72 | 1.32 | (1.15) | .63 |
Distributions from net investment income | - | (.16) | (.18) | (.33) | (.34) | (.42) |
Distributions from net realized gain | (.06) | (.04) | (.28) | (.15) | (.17) | (.12) |
Total distributions | (.06) | (.20) | (.45) I | (.47) H | (.51) | (.54) |
Net asset value, end of period | $ 10.44 | $ 10.18 | $ 10.24 | $ 9.97 | $ 9.12 | $ 10.78 |
Total Return B, C, D | 3.18% | 1.39% | 7.25% | 14.64% | (10.70)% | 5.92% |
Ratios to Average Net Assets F, G | | | | | | |
Expenses before reductions | .25% A | .25% | .25% | .25% | .25% | .25% |
Expenses net of fee waivers, if any | .25% A | .25% | .25% | .25% | .25% | .25% |
Expenses net of all reductions | .25% A | .25% | .25% | .25% | .25% | .25% |
Net investment income (loss) | (.18)% A | 1.60% | 1.63% | 3.76% | 3.25% | 3.68% |
Supplemental Data | | | | | | |
Net assets, end of period (000 omitted) | $ 7,114 | $ 7,731 | $ 7,313 | $ 6,753 | $ 4,836 | $ 3,589 |
Portfolio turnover rate | 50% A | 49% | 41% | 32% | 55% | 56% |
AAnnualized BTotal returns for periods of less than one year are not annualized. CTotal returns do not reflect charges attributable to your insurance company's separate account. Inclusion of these charges would reduce the total returns shown. DTotal returns would have been lower if certain expenses had not been reduced during the applicable periods shown. ECalculated based on average shares outstanding during the period. FAmounts do not include the activity of the Underlying Funds. GExpense ratios reflect operating expenses of the class. Expenses before reductions do not reflect amounts reimbursed by the investment adviser or reductions from expense offset arrangements and do not represent the amount paid by the class during periods when reimbursements or reductions occur. Expenses net of fee waivers reflect expenses after reimbursement by the investment adviser but prior to reductions from expense offset arrangements. Expenses net of all reductions represent the net expenses paid by the class but do not include expenses of the investment companies in which the Fund invests. HTotal distributions of $.47 per share is comprised of distributions from net investment income of $.326 and distributions from net realized gain of $.146 per share. ITotal distributions of $.45 per share is comprised of distributions from net investment income of $.176 and distributions from net realized gain of $.275 per share. |
See accompanying notes which are an integral part of the financial statements.
Semiannual Report
VIP Freedom 2005 Portfolio
Investment Changes (Unaudited)
Fund Holdings as of June 30, 2012 |
| % of fund's
net assets | % of fund's net assets
6 months ago |
Domestic Equity Funds | | |
VIP Contrafund Portfolio Initial Class | 4.8 | 4.6 |
VIP Equity-Income Portfolio Initial Class | 5.1 | 5.6 |
VIP Growth & Income Portfolio Initial Class | 5.7 | 5.6 |
VIP Growth Portfolio Initial Class | 4.9 | 5.4 |
VIP Mid Cap Portfolio Initial Class | 1.4 | 1.8 |
VIP Value Portfolio Initial Class | 3.8 | 4.8 |
VIP Value Strategies Portfolio Initial Class | 1.8 | 2.0 |
| 27.5 | 29.8 |
Developed International Equity Funds | | |
VIP Overseas Portfolio Initial Class | 7.8 | 7.8 |
Emerging Markets Equity Funds | | |
VIP Emerging Markets Portfolio Initial Class | 2.3 | 2.0 |
High Yield Bond Funds | | |
VIP High Income Portfolio Initial Class | 5.0 | 5.2 |
Investment Grade Bond Funds | | |
VIP Investment Grade Bond Portfolio Initial Class | 29.6 | 30.5 |
Short-Term Funds | | |
VIP Money Market Portfolio Initial Class | 27.8 | 24.7 |
Net Other Assets (Liabilities)* | 0.0 | 0.0 |
| 100.0 | 100.0 |
* Amount represents less than 0.1% |
Asset Allocation (% of fund's net assets) |
Current |
| Domestic Equity Funds | 27.5% | |
| Developed International Equity Funds | 7.8% | |
| Emerging Markets Equity Funds | 2.3% | |
| High Yield Bond Funds | 5.0% | |
| Investment Grade Bond Funds | 29.6% | |
| Short-Term Funds | 27.8% | |

Six months ago |
| Domestic Equity Funds | 29.8% | |
| Developed International Equity Funds | 7.8% | |
| Emerging Markets Equity Funds | 2.0% | |
| High Yield Bond Funds | 5.2% | |
| Investment Grade Bond Funds | 30.5% | |
| Short-Term Funds | 24.7% | |

Expected |
| Domestic Equity Funds | 25.9% | |
| Developed International Equity Funds | 7.3% | |
| Emerging Markets Equity Funds | 2.1% | |
| High Yield Bond Funds | 5.0% | |
| Investment Grade Bond Funds | 29.5% | |
| Short-Term Funds | 30.2% | |

The fund invests according to an asset allocation strategy that becomes increasingly conservative over time. The six months ago allocation is based on the fund's holdings as of December 31, 2011. The current allocation is based on the fund's holdings as of June 30, 2012. The expected allocation represents the fund's anticipated allocation at December 31, 2012. |
Semiannual Report
VIP Freedom 2005 Portfolio
Investments June 30, 2012 (Unaudited)
Showing Percentage of Net Assets
Domestic Equity Funds - 27.5% |
| Shares | | Value |
Domestic Equity Funds - 27.5% |
VIP Contrafund Portfolio Initial Class | 11,195 | | $ 282,003 |
VIP Equity-Income Portfolio Initial Class | 15,306 | | 302,598 |
VIP Growth & Income Portfolio Initial Class | 24,592 | | 339,864 |
VIP Growth Portfolio Initial Class | 7,044 | | 287,414 |
VIP Mid Cap Portfolio Initial Class | 2,738 | | 85,108 |
VIP Value Portfolio Initial Class | 19,548 | | 225,975 |
VIP Value Strategies Portfolio Initial Class | 11,000 | | 108,354 |
TOTAL DOMESTIC EQUITY FUNDS (Cost $1,738,906) |
1,631,316
|
International Equity Funds - 10.1% |
| | | |
Developed International Equity Funds - 7.8% |
VIP Overseas Portfolio Initial Class | 31,667 | | 460,440 |
Emerging Markets Equity Funds - 2.3% |
VIP Emerging Markets Portfolio Initial Class | 17,191 | | 135,468 |
TOTAL INTERNATIONAL EQUITY FUNDS (Cost $755,103) |
595,908
|
Bond Funds - 34.6% |
| Shares | | Value |
High Yield Bond Funds - 5.0% |
VIP High Income Portfolio Initial Class | 51,584 | | $ 297,639 |
Investment Grade Bond Funds - 29.6% |
VIP Investment Grade Bond Portfolio Initial Class | 131,321 | | 1,747,881 |
TOTAL BOND FUNDS (Cost $1,960,231) |
2,045,520
|
Short-Term Funds - 27.8% |
| | | |
VIP Money Market Portfolio Initial Class
(Cost $1,644,076) | 1,644,076 | |
1,644,076
|
TOTAL INVESTMENT PORTFOLIO - 100.0% (Cost $6,098,316) | | 5,916,820 |
NET OTHER ASSETS (LIABILITIES) - 0.0% | | (39) |
NET ASSETS - 100% | $ 5,916,781 |
Other Information |
All investments are categorized as Level 1 under the Fair Value Hierarchy. The inputs or methodology used for valuing securities may not be an indication of the risk associated with investing in those securities. For more information on valuation inputs, please refer to the Security Valuation section in the accompanying Notes to Financial Statements. |
See accompanying notes which are an integral part of the financial statements.
Semiannual Report
VIP Freedom 2005 Portfolio
Statement of Assets and Liabilities
| June 30, 2012 (Unaudited) |
| | |
Assets | | |
Investment in securities, at value (cost $6,098,316) - See accompanying schedule | | $ 5,916,820 |
Receivable for investments sold | | 131 |
Total assets | | 5,916,951 |
| | |
Liabilities | | |
Payable for fund shares redeemed | $ 120 | |
Distribution and service plan fees payable | 50 | |
Total liabilities | | 170 |
| | |
Net Assets | | $ 5,916,781 |
Net Assets consist of: | | |
Paid in capital | | $ 6,318,930 |
Undistributed net investment income | | 1,079 |
Accumulated undistributed net realized gain (loss) on investments | | (221,732) |
Net unrealized appreciation (depreciation) on investments | | (181,496) |
Net Assets | | $ 5,916,781 |
Initial Class:
Net Asset Value, offering price and redemption price per share ($5,605,568 ÷ 542,131 shares) | | $ 10.34 |
| | |
Service Class:
Net Asset Value, offering price and redemption price per share ($126,111 ÷ 12,194 shares) | | $ 10.34 |
| | |
Service Class 2:
Net Asset Value, offering price and redemption price per share ($185,102 ÷ 17,934 shares) | | $ 10.32 |
Statement of Operations
Six months ended June 30, 2012 (Unaudited) |
| | |
Investment Income | | |
Income distributions from underlying funds | | $ 1,357 |
| | |
Expenses | | |
Distribution and service plan fees | $ 278 | |
Independent trustees' compensation | 10 | |
Total expenses before reductions | 288 | |
Expense reductions | (10) | 278 |
Net investment income (loss) | | 1,079 |
Realized and Unrealized Gain (Loss) Realized gain (loss) on sale of underlying fund shares | 30,592 | |
Capital gain distributions from underlying funds | 19,808 | |
Total net realized gain (loss) | | 50,400 |
Change in net unrealized appreciation (depreciation) on underlying funds | | 212,843 |
Net gain (loss) | | 263,243 |
Net increase (decrease) in net assets resulting from operations | | $ 264,322 |
See accompanying notes which are an integral part of the financial statements.
Semiannual Report
Statement of Changes in Net Assets
| Six months ended June 30, 2012
(Unaudited) | Year ended
December 31,
2011 |
Increase (Decrease) in Net Assets | | |
Operations | | |
Net investment income (loss) | $ 1,079 | $ 129,090 |
Net realized gain (loss) | 50,400 | (38,725) |
Change in net unrealized appreciation (depreciation) | 212,843 | (73,018) |
Net increase (decrease) in net assets resulting from operations | 264,322 | 17,347 |
Distributions to shareholders from net investment income | - | (128,904) |
Distributions to shareholders from net realized gain | - | (25,204) |
Total distributions | - | (154,108) |
Share transactions - net increase (decrease) | 107,922 | (386,788) |
Total increase (decrease) in net assets | 372,244 | (523,549) |
| | |
Net Assets | | |
Beginning of period | 5,544,537 | 6,068,086 |
End of period (including undistributed net investment income of $1,079 and undistributed net investment income of $0, respectively | $ 5,916,781 | $ 5,544,537 |
Financial Highlights - Initial Class
| Six months ended June 30, 2012 | Years ended December 31, |
| (Unaudited) | 2011 | 2010 | 2009 | 2008 | 2007 |
Selected Per-Share Data | | | | | | |
Net asset value, beginning of period | $ 9.86 | $ 10.07 | $ 9.34 | $ 8.14 | $ 11.59 | $ 11.41 |
Income from Investment Operations | | | | | | |
Net investment income (loss) E | - I | .22 | .18 | .34 | .34 | .38 |
Net realized and unrealized gain (loss) | .48 | (.20) | .87 | 1.48 | (3.06) | .60 |
Total from investment operations | .48 | .02 | 1.05 | 1.82 | (2.72) | .98 |
Distributions from net investment income | - | (.19) | (.20) | (.35) | (.34) | (.34) |
Distributions from net realized gain | - | (.04) | (.12) | (.26) | (.39) | (.47) |
Total distributions | - | (.23) | (.32) | (.62) K | (.73) | (.80) J |
Net asset value, end of period | $ 10.34 | $ 9.86 | $ 10.07 | $ 9.34 | $ 8.14 | $ 11.59 |
Total Return B, C, D | 4.87% | .18% | 11.34% | 23.02% | (23.83)% | 8.65% |
Ratios to Average Net Assets F, H | | | | | | |
Expenses before reductions G | .00% A | .00% | .00% | .00% | .00% | .00% |
Expenses net of fee waivers, if any | .00% A | .00% | .00% | .00% | .00% | .00% |
Expenses net of all reductions | .00% A | .00% | .00% | .00% | .00% | .00% |
Net investment income (loss) | .05% A | 2.17% | 1.90% | 3.95% | 3.29% | 3.20% |
Supplemental Data | | | | | | |
Net assets, end of period (000 omitted) | $ 5,606 | $ 5,224 | $ 5,733 | $ 6,833 | $ 5,993 | $ 9,203 |
Portfolio turnover rate | 44% A | 54% | 42% | 50% | 51% | 51% |
A Annualized B Total returns for periods of less than one year are not annualized. C Total returns do not reflect charges attributable to your insurance company's separate account. Inclusion of these charges would reduce the total returns shown. D Total returns would have been lower if certain expenses had not been reduced during the applicable periods shown. E Calculated based on average shares outstanding during the period. F Amounts do not include the activity of the Underlying Funds. G Amount represents less than .01%. H Expense ratios reflect operating expenses of the class. Expenses before reductions do not reflect amounts reimbursed by the investment adviser or reductions from expense offset arrangements and do not represent the amount paid by the class during periods when reimbursements or reductions occur. Expenses net of fee waivers reflect expenses after reimbursement by the investment adviser but prior to reductions from expense offset arrangements. Expenses net of all reductions represent the net expenses paid by the class but do not include expenses of the investment companies in which the Fund invests. I Amount represents less than $.01 per share. J Total distributions of $.80 per share is comprised of distributions from net investment income of $.335 and distributions from net realized gain of $.465 per share. K Total distributions of $.62 per share is comprised of distributions from net investment income of $.353 and distributions from net realized gain of $.262 per share. |
See accompanying notes which are an integral part of the financial statements.
Semiannual Report
Financial Highlights - Service Class
| Six months ended June 30, 2012 | Years ended December 31, |
| (Unaudited) | 2011 | 2010 | 2009 | 2008 | 2007 |
Selected Per-Share Data | | | | | | |
Net asset value, beginning of period | $ 9.86 | $ 10.08 | $ 9.35 | $ 8.14 | $ 11.59 | $ 11.41 |
Income from Investment Operations | | | | | | |
Net investment income (loss) E | - H | .21 | .17 | .33 | .33 | .37 |
Net realized and unrealized gain (loss) | .48 | (.21) | .87 | 1.48 | (3.06) | .60 |
Total from investment operations | .48 | - H | 1.04 | 1.81 | (2.73) | .97 |
Distributions from net investment income | - | (.18) | (.19) | (.34) | (.33) | (.32) |
Distributions from net realized gain | - | (.04) | (.12) | (.26) | (.39) | (.47) |
Total distributions | - | (.22) | (.31) | (.60) J | (.72) | (.79) I |
Net asset value, end of period | $ 10.34 | $ 9.86 | $ 10.08 | $ 9.35 | $ 8.14 | $ 11.59 |
Total Return B, C, D | 4.87% | (.04)% | 11.24% | 23.00% | (23.95)% | 8.55% |
Ratios to Average Net Assets F, G | | | | | | |
Expenses before reductions | .10% A | .10% | .10% | .10% | .10% | .10% |
Expenses net of fee waivers, if any | .10% A | .10% | .10% | .10% | .10% | .10% |
Expenses net of all reductions | .10% A | .10% | .10% | .10% | .10% | .10% |
Net investment income (loss) | (.05)% A | 2.07% | 1.80% | 3.85% | 3.19% | 3.10% |
Supplemental Data | | | | | | |
Net assets, end of period (000 omitted) | $ 126 | $ 95 | $ 179 | $ 172 | $ 250 | $ 449 |
Portfolio turnover rate | 44% A | 54% | 42% | 50% | 51% | 51% |
A Annualized B Total returns for periods of less than one year are not annualized. C Total returns do not reflect charges attributable to your insurance company's separate account. Inclusion of these charges would reduce the total returns shown. D Total returns would have been lower if certain expenses had not been reduced during the applicable periods shown. E Calculated based on average shares outstanding during the period. F Amounts do not include the activity of the Underlying Funds. G Expense ratios reflect operating expenses of the class. Expenses before reductions do not reflect amounts reimbursed by the investment adviser or reductions from expense offset arrangements and do not represent the amount paid by the class during periods when reimbursements or reductions occur. Expenses net of fee waivers reflect expenses after reimbursement by the investment adviser but prior to reductions from expense offset arrangements. Expenses net of all reductions represent the net expenses paid by the class but do not include expenses of the investment companies in which the Fund invests. H Amount represents less than $.01 per share. I Total distributions of $.79 per share is comprised of distributions from net investment income of $.323 and distributions from net realized gain of $.465 per share. J Total distributions of $.60 per share is comprised of distributions from net investment income of $.341 and distributions from net realized gain of $.262 per share. |
Financial Highlights - Service Class 2
| Six months ended June 30, 2012 | Years ended December 31, |
| (Unaudited) | 2011 | 2010 | 2009 | 2008 | 2007 |
Selected Per-Share Data | | | | | | |
Net asset value, beginning of period | $ 9.85 | $ 10.08 | $ 9.35 | $ 8.14 | $ 11.59 | $ 11.41 |
Income from Investment Operations | | | | | | |
Net investment income (loss) E | (.01) | .19 | .16 | .32 | .31 | .35 |
Net realized and unrealized gain (loss) | .48 | (.20) | .86 | 1.48 | (3.06) | .60 |
Total from investment operations | .47 | (.01) | 1.02 | 1.80 | (2.75) | .95 |
Distributions from net investment income | - | (.18) | (.18) | (.32) | (.31) | (.31) |
Distributions from net realized gain | - | (.04) | (.12) | (.26) | (.39) | (.47) |
Total distributions | - | (.22) | (.29) J | (.59) I | (.70) | (.77) H |
Net asset value, end of period | $ 10.32 | $ 9.85 | $ 10.08 | $ 9.35 | $ 8.14 | $ 11.59 |
Total Return B, C, D | 4.77% | (.09)% | 11.06% | 22.78% | (24.12)% | 8.40% |
Ratios to Average Net Assets F, G | | | | | | |
Expenses before reductions | .25% A | .25% | .25% | .25% | .25% | .25% |
Expenses net of fee waivers, if any | .25% A | .25% | .25% | .25% | .25% | .25% |
Expenses net of all reductions | .25% A | .25% | .25% | .25% | .25% | .25% |
Net investment income (loss) | (.21)% A | 1.92% | 1.65% | 3.70% | 3.04% | 2.95% |
Supplemental Data | | | | | | |
Net assets, end of period (000 omitted) | $ 185 | $ 226 | $ 157 | $ 183 | $ 271 | $ 456 |
Portfolio turnover rate | 44% A | 54% | 42% | 50% | 51% | 51% |
A Annualized B Total returns for periods of less than one year are not annualized. C Total returns do not reflect charges attributable to your insurance company's separate account. Inclusion of these charges would reduce the total returns shown. D Total returns would have been lower if certain expenses had not been reduced during the applicable periods shown. E Calculated based on average shares outstanding during the period. F Amounts do not include the activity of the Underlying Funds. G Expense ratios reflect operating expenses of the class. Expenses before reductions do not reflect amounts reimbursed by the investment adviser or reductions from expense offset arrangements and do not represent the amount paid by the class during periods when reimbursements or reductions occur. Expenses net of fee waivers reflect expenses after reimbursement by the investment adviser but prior to reductions from expense offset arrangements. Expenses net of all reductions represent the net expenses paid by the class but do not include expenses of the investment companies in which the Fund invests. H Total distributions of $.77 per share is comprised of distributions from net investment income of $.306 and distributions from net realized gain of $.465 per share. I Total distributions of $.59 per share is comprised of distributions from net investment income of $.324 and distributions from net realized gain of $.262 per share. J Total distributions of $.29 per share is comprised of distributions from net investment income of $.177 and distributions from net realized gain of $.117 per share. |
See accompanying notes which are an integral part of the financial statements.
Semiannual Report
VIP Freedom 2010 Portfolio
Investment Changes (Unaudited)
Fund Holdings as of June 30, 2012 |
| % of fund's
net assets | % of fund's net assets
6 months ago |
Domestic Equity Funds | | |
VIP Contrafund Portfolio Initial Class | 6.2 | 5.7 |
VIP Equity-Income Portfolio Initial Class | 6.7 | 6.9 |
VIP Growth & Income Portfolio Initial Class | 7.5 | 6.9 |
VIP Growth Portfolio Initial Class | 6.3 | 6.7 |
VIP Mid Cap Portfolio Initial Class | 1.9 | 2.3 |
VIP Value Portfolio Initial Class | 5.0 | 5.9 |
VIP Value Strategies Portfolio Initial Class | 2.4 | 2.4 |
| 36.0 | 36.8 |
Developed International Equity Funds | | |
VIP Overseas Portfolio Initial Class | 10.2 | 9.8 |
Emerging Markets Equity Funds | | |
VIP Emerging Markets Portfolio Initial Class | 3.0 | 2.5 |
High Yield Bond Funds | | |
VIP High Income Portfolio Initial Class | 5.0 | 5.1 |
Investment Grade Bond Funds | | |
VIP Investment Grade Bond Portfolio Initial Class | 34.2 | 34.8 |
Short-Term Funds | | |
VIP Money Market Portfolio Initial Class | 11.6 | 11.0 |
Net Other Assets (Liabilities)* | 0.0 | 0.0 |
| 100.0 | 100.0 |
* Amount represents less than 0.1% |
Asset Allocation (% of fund's net assets) |
Current |
| Domestic Equity Funds | 36.0% | |
| Developed International Equity Funds | 10.2% | |
| Emerging Markets Equity Funds | 3.0% | |
| High Yield Bond Funds | 5.0% | |
| Investment Grade Bond Funds | 34.2% | |
| Short-Term Funds | 11.6% | |

Six months ago |
| Domestic Equity Funds | 36.8% | |
| Developed International Equity Funds | 9.8% | |
| Emerging Markets Equity Funds | 2.5% | |
| High Yield Bond Funds | 5.1% | |
| Investment Grade Bond Funds | 34.8% | |
| Short-Term Funds | 11.0% | |

Expected |
| Domestic Equity Funds | 35.3% | |
| Developed International Equity Funds | 9.9% | |
| Emerging Markets Equity Funds | 3.0% | |
| High Yield Bond Funds | 5.0% | |
| Investment Grade Bond Funds | 34.1% | |
| Short-Term Funds | 12.7% | |

The fund invests according to an asset allocation strategy that becomes increasingly conservative over time. The six months ago allocation is based on the fund's holdings as of December 31, 2011. The current allocation is based on the fund's holdings as of June 30, 2012. The expected allocation represents the fund's anticipated allocation at December 31, 2012. |
Semiannual Report
VIP Freedom 2010 Portfolio
Investments June 30, 2012 (Unaudited)
Showing Percentage of Net Assets
Domestic Equity Funds - 36.0% |
| Shares | | Value |
Domestic Equity Funds - 36.0% |
VIP Contrafund Portfolio Initial Class | 483,113 | | $ 12,169,605 |
VIP Equity-Income Portfolio Initial Class | 660,671 | | 13,061,468 |
VIP Growth & Income Portfolio Initial Class | 1,059,056 | | 14,636,160 |
VIP Growth Portfolio Initial Class | 304,156 | | 12,409,578 |
VIP Mid Cap Portfolio Initial Class | 118,363 | | 3,678,737 |
VIP Value Portfolio Initial Class | 844,914 | | 9,767,208 |
VIP Value Strategies Portfolio Initial Class | 475,254 | | 4,681,254 |
TOTAL DOMESTIC EQUITY FUNDS (Cost $70,999,074) |
70,404,010
|
International Equity Funds - 13.2% |
| | | |
Developed International Equity Funds - 10.2% |
VIP Overseas Portfolio Initial Class | 1,366,762 | | 19,872,714 |
Emerging Markets Equity Funds - 3.0% |
VIP Emerging Markets Portfolio Initial Class | 740,854 | | 5,837,930 |
TOTAL INTERNATIONAL EQUITY FUNDS (Cost $30,257,160) |
25,710,644
|
Bond Funds - 39.2% |
| Shares | | Value |
High Yield Bond Funds - 5.0% |
VIP High Income Portfolio Initial Class | 1,700,404 | | $ 9,811,332 |
Investment Grade Bond Funds - 34.2% |
VIP Investment Grade Bond Portfolio Initial Class | 5,013,723 | | 66,732,658 |
TOTAL BOND FUNDS (Cost $73,567,392) |
76,543,990
|
Short-Term Funds - 11.6% |
| | | |
VIP Money Market Portfolio Initial Class
(Cost $22,742,070) | 22,742,070 | |
22,742,070
|
TOTAL INVESTMENT PORTFOLIO - 100.0% (Cost $197,565,696) | | 195,400,714 |
NET OTHER ASSETS (LIABILITIES) - 0.0% | | (30,294) |
NET ASSETS - 100% | $ 195,370,420 |
Other Information |
All investments are categorized as Level 1 under the Fair Value Hierarchy. The inputs or methodology used for valuing securities may not be an indication of the risk associated with investing in those securities. For more information on valuation inputs, please refer to the Security Valuation section in the accompanying Notes to Financial Statements. |
See accompanying notes which are an integral part of the financial statements.
Semiannual Report
VIP Freedom 2010 Portfolio
Statement of Assets and Liabilities
| June 30, 2012 (Unaudited) |
| | |
Assets | | |
Investment in securities, at value (cost $197,565,696) - See accompanying schedule | | $ 195,400,714 |
Receivable for fund shares sold | | 56,345 |
Total assets | | 195,457,059 |
| | |
Liabilities | | |
Payable to custodian bank | $ 411 | |
Payable for investments purchased | 40,907 | |
Payable for fund shares redeemed | 13,387 | |
Distribution and service plan fees payable | 31,934 | |
Total liabilities | | 86,639 |
| | |
Net Assets | | $ 195,370,420 |
Net Assets consist of: | | |
Paid in capital | | $ 197,712,961 |
Accumulated net investment loss | | (166,176) |
Accumulated undistributed net realized gain (loss) on investments | | (11,383) |
Net unrealized appreciation (depreciation) on investments | | (2,164,982) |
Net Assets | | $ 195,370,420 |
Initial Class:
Net Asset Value, offering price and redemption price per share ($24,654,749 ÷ 2,271,357 shares) | | $ 10.85 |
| | |
Service Class:
Net Asset Value, offering price and redemption price per share ($21,317,870 ÷ 1,966,655 shares) | | $ 10.84 |
| | |
Service Class 2:
Net Asset Value, offering price and redemption price per share ($149,397,801 ÷ 13,843,540 shares) | | $ 10.79 |
Statement of Operations
Six months ended June 30, 2012 (Unaudited) |
| | |
Investment Income | | |
Income distributions from underlying funds | | $ 22,211 |
| | |
Expenses | | |
Distribution and service plan fees | $ 191,644 | |
Independent trustees' compensation | 325 | |
Total expenses before reductions | 191,969 | |
Expense reductions | (325) | 191,644 |
Net investment income (loss) | | (169,433) |
Realized and Unrealized Gain (Loss) Realized gain (loss) on sale of underlying fund shares | 254,195 | |
Capital gain distributions from underlying funds | 761,052 | |
Total net realized gain (loss) | | 1,015,247 |
Change in net unrealized appreciation (depreciation) on underlying funds | | 9,514,192 |
Net gain (loss) | | 10,529,439 |
Net increase (decrease) in net assets resulting from operations | | $ 10,360,006 |
See accompanying notes which are an integral part of the financial statements.
Semiannual Report
VIP Freedom 2010 Portfolio
Financial Statements - continued
Statement of Changes in Net Assets
| Six months ended June 30, 2012
(Unaudited) | Year ended
December 31,
2011 |
Increase (Decrease) in Net Assets | | |
Operations | | |
Net investment income (loss) | $ (169,433) | $ 3,505,440 |
Net realized gain (loss) | 1,015,247 | 1,725,564 |
Change in net unrealized appreciation (depreciation) | 9,514,192 | (6,181,305) |
Net increase (decrease) in net assets resulting from operations | 10,360,006 | (950,301) |
Distributions to shareholders from net investment income | - | (3,501,665) |
Distributions to shareholders from net realized gain | (974,973) | (930,001) |
Total distributions | (974,973) | (4,431,666) |
Share transactions - net increase (decrease) | 6,368,325 | 25,200,781 |
Total increase (decrease) in net assets | 15,753,358 | 19,818,814 |
| | |
Net Assets | | |
Beginning of period | 179,617,062 | 159,798,248 |
End of period (including accumulated net investment loss of $166,176 and undistributed net investment income of $3,257, respectively) | $ 195,370,420 | $ 179,617,062 |
Financial Highlights - Initial Class
| Six months ended June 30, 2012 | Years ended December 31, |
| (Unaudited) | 2011 | 2010 | 2009 | 2008 | 2007 |
Selected Per-Share Data | | | | | | |
Net asset value, beginning of period | $ 10.31 | $ 10.61 | $ 9.77 | $ 8.23 | $ 11.96 | $ 11.59 |
Income from Investment Operations | | | | | | |
Net investment income (loss) E | - I | .24 | .24 | .38 | .35 | .36 |
Net realized and unrealized gain (loss) | .60 | (.26) | 1.02 | 1.60 | (3.32) | .64 |
Total from investment operations | .60 | (.02) | 1.26 | 1.98 | (2.97) | 1.00 |
Distributions from net investment income | - | (.23) | (.23) | (.37) | (.31) | (.30) |
Distributions from net realized gain | (.06) | (.06) | (.19) | (.07) | (.45) | (.33) |
Total distributions | (.06) | (.28) J | (.42) | (.44) | (.76) | (.63) |
Net asset value, end of period | $ 10.85 | $ 10.31 | $ 10.61 | $ 9.77 | $ 8.23 | $ 11.96 |
Total Return B, C, D | 5.79% | (.19)% | 12.95% | 24.27% | (25.05)% | 8.71% |
Ratios to Average Net Assets F, H | | | | | | |
Expenses before reductions G | .00% A | .00% | .00% | .00% | .00% | .00% |
Expenses net of fee waivers, if any | .00% A | .00% | .00% | .00% | .00% | .00% |
Expenses net of all reductions | .00% A | .00% | .00% | .00% | .00% | .00% |
Net investment income (loss) | .02% A | 2.27% | 2.38% | 4.22% | 3.27% | 2.95% |
Supplemental Data | | | | | | |
Net assets, end of period (000 omitted) | $ 24,655 | $ 22,338 | $ 22,573 | $ 21,197 | $ 24,962 | $ 26,629 |
Portfolio turnover rate | 24% A | 17% | 29% | 28% | 34% | 21% |
A Annualized B Total returns for periods of less than one year are not annualized. C Total returns do not reflect charges attributable to your insurance company's separate account. Inclusion of these charges would reduce the total returns shown. D Total returns would have been lower if certain expenses had not been reduced during the applicable periods shown. E Calculated based on average shares outstanding during the period. F Amounts do not include the activity of the Underlying Funds. G Amount represents less than .01%. H Expense ratios reflect operating expenses of the class. Expenses before reductions do not reflect amounts reimbursed by the investment adviser or reductions from expense offset arrangements and do not represent the amount paid by the class during periods when reimbursements or reductions occur. Expenses net of fee waivers reflect expenses after reimbursement by the investment adviser but prior to reductions from expense offset arrangements. Expenses net of all reductions represent the net expenses paid by the class but do not include expenses of the investment companies in which the Fund invests. I Amount represents less than $.01 per share. J Total distributions of $.28 per share is comprised of distributions from net investment income of $.225 and distributions from net realized gain of $.055 per share. |
See accompanying notes which are an integral part of the financial statements.
Semiannual Report
Financial Highlights - Service Class
| Six months ended June 30, 2012 | Years ended December 31, |
| (Unaudited) | 2011 | 2010 | 2009 | 2008 | 2007 |
Selected Per-Share Data | | | | | | |
Net asset value, beginning of period | $ 10.30 | $ 10.60 | $ 9.77 | $ 8.23 | $ 11.95 | $ 11.58 |
Income from Investment Operations | | | | | | |
Net investment income (loss) E | - H | .23 | .23 | .37 | .33 | .35 |
Net realized and unrealized gain (loss) | .60 | (.26) | 1.01 | 1.60 | (3.30) | .64 |
Total from investment operations | .60 | (.03) | 1.24 | 1.97 | (2.97) | .99 |
Distributions from net investment income | - | (.22) | (.21) | (.36) | (.30) | (.29) |
Distributions from net realized gain | (.06) | (.06) | (.19) | (.07) | (.45) | (.33) |
Total distributions | (.06) | (.27) J | (.41) I | (.43) | (.75) | (.62) |
Net asset value, end of period | $ 10.84 | $ 10.30 | $ 10.60 | $ 9.77 | $ 8.23 | $ 11.95 |
Total Return B, C, D | 5.79% | (.28)% | 12.74% | 24.15% | (25.08)% | 8.65% |
Ratios to Average Net Assets F, G | | | | | | |
Expenses before reductions | .10% A | .10% | .10% | .10% | .10% | .10% |
Expenses net of fee waivers, if any | .10% A | .10% | .10% | .10% | .10% | .10% |
Expenses net of all reductions | .10% A | .10% | .10% | .10% | .10% | .10% |
Net investment income (loss) | (.08)% A | 2.17% | 2.28% | 4.12% | 3.17% | 2.85% |
Supplemental Data | | | | | | |
Net assets, end of period (000 omitted) | $ 21,318 | $ 20,927 | $ 19,259 | $ 19,238 | $ 17,137 | $ 19,295 |
Portfolio turnover rate | 24% A | 17% | 29% | 28% | 34% | 21% |
A Annualized B Total returns for periods of less than one year are not annualized. C Total returns do not reflect charges attributable to your insurance company's separate account. Inclusion of these charges would reduce the total returns shown. D Total returns would have been lower if certain expenses had not been reduced during the applicable periods shown. E Calculated based on average shares outstanding during the period. F Amounts do not include the activity of the Underlying Funds. G Expense ratios reflect operating expenses of the class. Expenses before reductions do not reflect amounts reimbursed by the investment adviser or reductions from expense offset arrangements and do not represent the amount paid by the class during periods when reimbursements or reductions occur. Expenses net of fee waivers reflect expenses after reimbursement by the investment adviser but prior to reductions from expense offset arrangements. Expenses net of all reductions represent the net expenses paid by the class but do not include expenses of the investment companies in which the Fund invests. H Amount represents less than $.01 per share. I Total distributions of $.41 per share is comprised of distributions from net investment income of $.214 and distributions from net realized gain of $.191 per share. J Total distributions of $.27 per share is comprised of distributions from net investment income of $.215 and distributions from net realized gain of $.055 per share. |
Financial Highlights - Service Class 2
| Six months ended June 30, 2012 | Years ended December 31, |
| (Unaudited) | 2011 | 2010 | 2009 | 2008 | 2007 |
Selected Per-Share Data | | | | | | |
Net asset value, beginning of period | $ 10.26 | $ 10.56 | $ 9.74 | $ 8.21 | $ 11.92 | $ 11.56 |
Income from Investment Operations | | | | | | |
Net investment income (loss) E | (.01) | .22 | .22 | .35 | .32 | .33 |
Net realized and unrealized gain (loss) | .60 | (.26) | .99 | 1.60 | (3.29) | .64 |
Total from investment operations | .59 | (.04) | 1.21 | 1.95 | (2.97) | .97 |
Distributions from net investment income | - | (.20) | (.20) | (.35) | (.29) | (.28) |
Distributions from net realized gain | (.06) | (.06) | (.19) | (.07) | (.45) | (.33) |
Total distributions | (.06) | (.26) | (.39) | (.42) | (.74) | (.61) |
Net asset value, end of period | $ 10.79 | $ 10.26 | $ 10.56 | $ 9.74 | $ 8.21 | $ 11.92 |
Total Return B, C, D | 5.72% | (.43)% | 12.55% | 23.95% | (25.17)% | 8.42% |
Ratios to Average Net Assets F, G | | | | | | |
Expenses before reductions | .25% A | .25% | .25% | .25% | .25% | .25% |
Expenses net of fee waivers, if any | .25% A | .25% | .25% | .25% | .25% | .25% |
Expenses net of all reductions | .25% A | .25% | .25% | .25% | .25% | .25% |
Net investment income (loss) | (.23)% A | 2.02% | 2.13% | 3.97% | 3.02% | 2.70% |
Supplemental Data | | | | | | |
Net assets, end of period (000 omitted) | $ 149,398 | $ 136,353 | $ 117,966 | $ 87,791 | $ 66,370 | $ 62,510 |
Portfolio turnover rate | 24% A | 17% | 29% | 28% | 34% | 21% |
A Annualized B Total returns for periods of less than one year are not annualized. C Total returns do not reflect charges attributable to your insurance company's separate account. Inclusion of these charges would reduce the total returns shown. D Total returns would have been lower if certain expenses had not been reduced during the applicable periods shown. E Calculated based on average shares outstanding during the period. F Amounts do not include the activity of the Underlying Funds. G Expense ratios reflect operating expenses of the class. Expenses before reductions do not reflect amounts reimbursed by the investment adviser or reductions from expense offset arrangements and do not represent the amount paid by the class during periods when reimbursements or reductions occur. Expenses net of fee waivers reflect expenses after reimbursement by the investment adviser but prior to reductions from expense offset arrangements. Expenses net of all reductions represent the net expenses paid by the class but do not include expenses of the investment companies in which the Fund invests. |
See accompanying notes which are an integral part of the financial statements.
Semiannual Report
VIP Freedom 2015 Portfolio
Investment Changes (Unaudited)
Fund Holdings as of June 30, 2012 |
| % of fund's
net assets | % of fund's net assets
6 months ago |
Domestic Equity Funds | | |
VIP Contrafund Portfolio Initial Class | 6.4 | 5.9 |
VIP Equity-Income Portfolio Initial Class | 6.9 | 7.0 |
VIP Growth & Income Portfolio Initial Class | 7.7 | 7.1 |
VIP Growth Portfolio Initial Class | 6.6 | 6.8 |
VIP Mid Cap Portfolio Initial Class | 1.9 | 2.4 |
VIP Value Portfolio Initial Class | 5.1 | 6.1 |
VIP Value Strategies Portfolio Initial Class | 2.5 | 2.5 |
| 37.1 | 37.8 |
Developed International Equity Funds | | |
VIP Overseas Portfolio Initial Class | 10.5 | 10.1 |
Emerging Markets Equity Funds | | |
VIP Emerging Markets Portfolio Initial Class | 3.1 | 2.6 |
High Yield Bond Funds | | |
VIP High Income Portfolio Initial Class | 5.0 | 5.2 |
Investment Grade Bond Funds | | |
VIP Investment Grade Bond Portfolio Initial Class | 34.6 | 34.9 |
Short-Term Funds | | |
VIP Money Market Portfolio Initial Class | 9.7 | 9.5 |
| | |
Net Other Assets (Liabilities) | 0.0* | (0.1) |
| 100.0 | 100.0 |
* Amount represents less than 0.1% |
Asset Allocation (% of fund's net assets) |
Current |
| Domestic Equity Funds | 37.1% | |
| Developed International Equity Funds | 10.5% | |
| Emerging Markets Equity Funds | 3.1% | |
| High Yield Bond Funds | 5.0% | |
| Investment Grade Bond Funds | 34.6% | |
| Short-Term Funds | 9.7% | |

Six months ago |
| Domestic Equity Funds | 37.8% | |
| Developed International Equity Funds | 10.1% | |
| Emerging Markets Equity Funds | 2.6% | |
| High Yield Bond Funds | 5.2% | |
 | Investment Grade Bond Funds | 34.9% | |
| Short-Term Funds | 9.5% | |
 | Net Other Assets† | (0.1)% | |

Expected |
| Domestic Equity Funds | 36.7% | |
| Developed International Equity Funds | 10.3% | |
| Emerging Markets Equity Funds | 3.1% | |
| High Yield Bond Funds | 5.0% | |
| Investment Grade Bond Funds | 35.0% | |
| Short-Term Funds | 9.9% | |

The fund invests according to an asset allocation strategy that becomes increasingly conservative over time. The six months ago allocation is based on the fund's holdings as of December 31, 2011. The current allocation is based on the fund's holdings as of June 30, 2012. The expected allocation represents the fund's anticipated allocation at December 31, 2012. |
† Net Other Assets are not included in the pie chart. |
Semiannual Report
VIP Freedom 2015 Portfolio
Investments June 30, 2012 (Unaudited)
Showing Percentage of Net Assets
Domestic Equity Funds - 37.1% |
| Shares | | Value |
Domestic Equity Funds - 37.1% |
VIP Contrafund Portfolio Initial Class | 254,169 | | $ 6,402,505 |
VIP Equity-Income Portfolio Initial Class | 347,637 | | 6,872,784 |
VIP Growth & Income Portfolio Initial Class | 557,537 | | 7,705,155 |
VIP Growth Portfolio Initial Class | 159,871 | | 6,522,736 |
VIP Mid Cap Portfolio Initial Class | 62,093 | | 1,929,864 |
VIP Value Portfolio Initial Class | 443,177 | | 5,123,124 |
VIP Value Strategies Portfolio Initial Class | 249,519 | | 2,457,757 |
TOTAL DOMESTIC EQUITY FUNDS (Cost $35,253,317) |
37,013,925
|
International Equity Funds - 13.6% |
| | | |
Developed International Equity Funds - 10.5% |
VIP Overseas Portfolio Initial Class | 717,862 | | 10,437,716 |
Emerging Markets Equity Funds - 3.1% |
VIP Emerging Markets Portfolio Initial Class | 389,213 | | 3,066,997 |
TOTAL INTERNATIONAL EQUITY FUNDS (Cost $15,577,427) |
13,504,713
|
Bond Funds - 39.6% |
| Shares | | Value |
High Yield Bond Funds - 5.0% |
VIP High Income Portfolio Initial Class | 868,607 | | $ 5,011,863 |
Investment Grade Bond Funds - 34.6% |
VIP Investment Grade Bond Portfolio Initial Class | 2,588,448 | | 34,452,249 |
TOTAL BOND FUNDS (Cost $37,590,084) |
39,464,112
|
Short-Term Funds - 9.7% |
| | | |
VIP Money Market Portfolio Initial Class
(Cost $9,684,778) | 9,684,778 | |
9,684,778
|
TOTAL INVESTMENT PORTFOLIO - 100.0% (Cost $98,105,606) | | 99,667,528 |
NET OTHER ASSETS (LIABILITIES) - 0.0% | | (11,811) |
NET ASSETS - 100% | $ 99,655,717 |
Other Information |
All investments are categorized as Level 1 under the Fair Value Hierarchy. The inputs or methodology used for valuing securities may not be an indication of the risk associated with investing in those securities. For more information on valuation inputs, please refer to the Security Valuation section in the accompanying Notes to Financial Statements. |
See accompanying notes which are an integral part of the financial statements.
Semiannual Report
VIP Freedom 2015 Portfolio
Statement of Assets and Liabilities
| June 30, 2012 (Unaudited) |
| | |
Assets | | |
Investment in securities, at value (cost $98,105,606) - See accompanying schedule | | $ 99,667,528 |
Receivable for fund shares sold | | 32,061 |
Total assets | | 99,699,589 |
| | |
Liabilities | | |
Payable to custodian bank | $ 430 | |
Payable for investments purchased | 17,906 | |
Payable for fund shares redeemed | 13,393 | |
Distribution and service plan fees payable | 12,143 | |
Total liabilities | | 43,872 |
| | |
Net Assets | | $ 99,655,717 |
Net Assets consist of: | | |
Paid in capital | | $ 97,757,720 |
Accumulated net investment loss | | (64,609) |
Accumulated undistributed net realized gain (loss) on investments | | 400,684 |
Net unrealized appreciation (depreciation) on investments | | 1,561,922 |
Net Assets | | $ 99,655,717 |
Initial Class:
Net Asset Value, offering price and redemption price per share ($36,846,119 ÷ 3,368,370 shares) | | $ 10.94 |
| | |
Service Class:
Net Asset Value, offering price and redemption price per share ($5,347,430 ÷ 489,573 shares) | | $ 10.92 |
| | |
Service Class 2:
Net Asset Value, offering price and redemption price per share ($57,462,168 ÷ 5,281,562 shares) | | $ 10.88 |
Statement of Operations
Six months ended June 30, 2012 (Unaudited) |
| | |
Investment Income | | |
Income distributions from underlying funds | | $ 10,704 |
| | |
Expenses | | |
Distribution and service plan fees | $ 75,313 | |
Independent trustees' compensation | 177 | |
Total expenses before reductions | 75,490 | |
Expense reductions | (177) | 75,313 |
Net investment income (loss) | | (64,609) |
Realized and Unrealized Gain (Loss) Realized gain (loss) on sale of underlying fund shares | 528,433 | |
Capital gain distributions from underlying funds | 430,364 | |
Total net realized gain (loss) | | 958,797 |
Change in net unrealized appreciation (depreciation) on underlying funds | | 5,086,256 |
Net gain (loss) | | 6,045,053 |
Net increase (decrease) in net assets resulting from operations | | $ 5,980,444 |
See accompanying notes which are an integral part of the financial statements.
Semiannual Report
Financial Statements - continued
Statement of Changes in Net Assets
| Six months ended
June 30, 2012
(Unaudited) | Year ended
December 31,
2011 |
Increase (Decrease) in Net Assets | | |
Operations | | |
Net investment income (loss) | $ (64,609) | $ 2,043,578 |
Net realized gain (loss) | 958,797 | 1,133,959 |
Change in net unrealized appreciation (depreciation) | 5,086,256 | (3,546,950) |
Net increase (decrease) in net assets resulting from operations | 5,980,444 | (369,413) |
Distributions to shareholders from net investment income | - | (2,043,772) |
Distributions to shareholders from net realized gain | (656,016) | (530,501) |
Total distributions | (656,016) | (2,574,273) |
Share transactions - net increase (decrease) | (7,537,073) | 6,442,512 |
Total increase (decrease) in net assets | (2,212,645) | 3,498,826 |
| | |
Net Assets | | |
Beginning of period | 101,868,362 | 98,369,536 |
End of period (including accumulated net investment loss of $64,609 and undistributed net investment income of $0, respectively) | $ 99,655,717 | $ 101,868,362 |
Financial Highlights - Initial Class
| Six months ended June 30, 2012 | Years ended December 31, |
| (Unaudited) | 2011 | 2010 | 2009 | 2008 | 2007 |
Selected Per-Share Data | | | | | | |
Net asset value, beginning of period | $ 10.38 | $ 10.70 | $ 9.78 | $ 8.19 | $ 12.29 | $ 11.93 |
Income from Investment Operations | | | | | | |
Net investment income (loss) E | - I | .23 | .23 | .38 | .33 | .37 |
Net realized and unrealized gain (loss) | .63 | (.27) | 1.04 | 1.67 | (3.61) | .73 |
Total from investment operations | .63 | (.04) | 1.27 | 2.05 | (3.28) | 1.10 |
Distributions from net investment income | - | (.23) | (.23) | (.34) | (.30) | (.36) |
Distributions from net realized gain | (.07) | (.06) | (.13) | (.12) | (.52) | (.38) |
Total distributions | (.07) | (.28) L | (.35) K | (.46) | (.82) J | (.74) |
Net asset value, end of period | $ 10.94 | $ 10.38 | $ 10.70 | $ 9.78 | $ 8.19 | $ 12.29 |
Total Return B, C, D | 6.06% | (.36)% | 13.09% | 25.28% | (27.03)% | 9.33% |
Ratios to Average Net Assets F, H | | | | | | |
Expenses before reductions G | .00% A | .00% | .00% | .00% | .00% | .00% |
Expenses net of fee waivers, if any | .00% A | .00% | .00% | .00% | .00% | .00% |
Expenses net of all reductions | .00% A | .00% | .00% | .00% | .00% | .00% |
Net investment income (loss) | .02% A | 2.16% | 2.30% | 4.21% | 3.11% | 2.93% |
Supplemental Data | | | | | | |
Net assets, end of period (000 omitted) | $ 36,846 | $ 38,879 | $ 39,535 | $ 37,291 | $ 25,977 | $ 33,780 |
Portfolio turnover rate | 29% A | 26% | 30% | 23% | 27% | 18% |
A Annualized B Total returns for periods of less than one year are not annualized. C Total returns do not reflect charges attributable to your insurance company's separate account. Inclusion of these charges would reduce the total returns shown. D Total returns would have been lower if certain expenses had not been reduced during the applicable periods shown. E Calculated based on average shares outstanding during the period. F Amounts do not include the activity of the Underlying Funds. G Amount represents less than .01%. H Expense ratios reflect operating expenses of the class. Expenses before reductions do not reflect amounts reimbursed by the investment adviser or reductions from expense offset arrangements and do not represent the amount paid by the class during periods when reimbursements or reductions occur. Expenses net of fee waivers reflect expenses after reimbursement by the investment adviser but prior to reductions from expense offset arrangements. Expenses net of all reductions represent the net expenses paid by the class but do not include expenses of the investment companies in which the Fund invests. I Amount represents less than $.01 per share. J Total distributions of $.82 per share is comprised of distributions from net investment income of $.302 and distributions from net realized gain of $.515 per share. K Total distributions of $.35 per share is comprised of distributions from net investment income of $.227 and distributions from net realized gain of $.127 per share. L Total distributions of $.28 per share is comprised of distributions from net investment income of $.227 and distributions from net realized gain of $.055 per share. |
See accompanying notes which are an integral part of the financial statements.
Semiannual Report
Financial Highlights - Service Class
| Six months ended June 30, 2012 | Years ended December 31, |
| (Unaudited) | 2011 | 2010 | 2009 | 2008 | 2007 |
Selected Per-Share Data | | | | | | |
Net asset value, beginning of period | $ 10.37 | $ 10.69 | $ 9.77 | $ 8.19 | $ 12.29 | $ 11.93 |
Income from Investment Operations | | | | | | |
Net investment income (loss) E | - H | .22 | .22 | .37 | .31 | .35 |
Net realized and unrealized gain (loss) | .62 | (.26) | 1.05 | 1.66 | (3.60) | .74 |
Total from investment operations | .62 | (.04) | 1.27 | 2.03 | (3.29) | 1.09 |
Distributions from net investment income | - | (.22) | (.22) | (.33) | (.29) | (.35) |
Distributions from net realized gain | (.07) | (.06) | (.13) | (.12) | (.52) | (.38) |
Total distributions | (.07) | (.28) | (.35) | (.45) | (.81) I | (.73) |
Net asset value, end of period | $ 10.92 | $ 10.37 | $ 10.69 | $ 9.77 | $ 8.19 | $ 12.29 |
Total Return B, C, D | 5.97% | (.41)% | 13.00% | 25.06% | (27.10)% | 9.23% |
Ratios to Average Net Assets F, G | | | | | | |
Expenses before reductions | .10% A | .10% | .10% | .10% | .10% | .10% |
Expenses net of fee waivers, if any | .10% A | .10% | .10% | .10% | .10% | .10% |
Expenses net of all reductions | .10% A | .10% | .10% | .10% | .10% | .10% |
Net investment income (loss) | (.08)% A | 2.06% | 2.20% | 4.12% | 3.01% | 2.83% |
Supplemental Data | | | | | | |
Net assets, end of period (000 omitted) | $ 5,347 | $ 7,743 | $ 2,723 | $ 1,524 | $ 936 | $ 477 |
Portfolio turnover rate | 29% A | 26% | 30% | 23% | 27% | 18% |
A Annualized B Total returns for periods of less than one year are not annualized. C Total returns do not reflect charges attributable to your insurance company's separate account. Inclusion of these charges would reduce the total returns shown. D Total returns would have been lower if certain expenses had not been reduced during the applicable periods shown. E Calculated based on average shares outstanding during the period. F Amounts do not include the activity of the Underlying Funds. G Expense ratios reflect operating expenses of the class. Expenses before reductions do not reflect amounts reimbursed by the investment adviser or reductions from expense offset arrangements and do not represent the amount paid by the class during periods when reimbursements or reductions occur. Expenses net of fee waivers reflect expenses after reimbursement by the investment adviser but prior to reductions from expense offset arrangements. Expenses net of all reductions represent the net expenses paid by the class but do not include expenses of the investment companies in which the Fund invests. H Amount represents less than $.01 per share. I Total distributions of $.81 per share is comprised of distributions from net investment income of $.294 and distributions from net realized gain of $.515 per share. |
Financial Highlights - Service Class 2
| Six months ended June 30, 2012 | Years ended December 31, |
| (Unaudited) | 2011 | 2010 | 2009 | 2008 | 2007 |
Selected Per-Share Data | | | | | | |
Net asset value, beginning of period | $ 10.34 | $ 10.65 | $ 9.74 | $ 8.16 | $ 12.26 | $ 11.91 |
Income from Investment Operations | | | | | | |
Net investment income (loss) E | (.01) | .21 | .21 | .35 | .30 | .33 |
Net realized and unrealized gain (loss) | .62 | (.26) | 1.03 | 1.67 | (3.61) | .74 |
Total from investment operations | .61 | (.05) | 1.24 | 2.02 | (3.31) | 1.07 |
Distributions from net investment income | - | (.20) | (.20) | (.32) | (.28) | (.34) |
Distributions from net realized gain | (.07) | (.06) | (.13) | (.12) | (.52) | (.38) |
Total distributions | (.07) | (.26) | (.33) | (.44) | (.79) H | (.72) |
Net asset value, end of period | $ 10.88 | $ 10.34 | $ 10.65 | $ 9.74 | $ 8.16 | $ 12.26 |
Total Return B, C, D | 5.89% | (.52)% | 12.79% | 25.02% | (27.30)% | 9.07% |
Ratios to Average Net Assets F, G | | | | | | |
Expenses before reductions | .25% A | .25% | .25% | .25% | .25% | .25% |
Expenses net of fee waivers, if any | .25% A | .25% | .25% | .25% | .25% | .25% |
Expenses net of all reductions | .25% A | .25% | .25% | .25% | .25% | .25% |
Net investment income (loss) | (.23)% A | 1.91% | 2.05% | 3.97% | 2.86% | 2.68% |
Supplemental Data | | | | | | |
Net assets, end of period (000 omitted) | $ 57,462 | $ 55,246 | $ 56,112 | $ 42,534 | $ 25,855 | $ 24,497 |
Portfolio turnover rate | 29% A | 26% | 30% | 23% | 27% | 18% |
A Annualized B Total returns for periods of less than one year are not annualized. C Total returns do not reflect charges attributable to your insurance company's separate account. Inclusion of these charges would reduce the total returns shown. D Total returns would have been lower if certain expenses had not been reduced during the applicable periods shown. E Calculated based on average shares outstanding during the period. F Amounts do not include the activity of the Underlying Funds. G Expense ratios reflect operating expenses of the class. Expenses before reductions do not reflect amounts reimbursed by the investment adviser or reductions from expense offset arrangements and do not represent the amount paid by the class during periods when reimbursements or reductions occur. Expenses net of fee waivers reflect expenses after reimbursement by the investment adviser but prior to reductions from expense offset arrangements. Expenses net of all reductions represent the net expenses paid by the class but do not include expenses of the investment companies in which the Fund invests. H Total distributions of $.79 per share is comprised of distributions from net investment income of $.279 and distributions from net realized gain of $.515 per share. |
See accompanying notes which are an integral part of the financial statements.
Semiannual Report
VIP Freedom 2020 Portfolio
Investment Changes (Unaudited)
Fund Holdings as of June 30, 2012 |
| % of fund's
net assets | % of fund's net assets
6 months ago |
Domestic Equity Funds | | |
VIP Contrafund Portfolio Initial Class | 7.2 | 6.8 |
VIP Equity-Income Portfolio Initial Class | 7.7 | 8.1 |
VIP Growth & Income Portfolio Initial Class | 8.7 | 8.1 |
VIP Growth Portfolio Initial Class | 7.3 | 7.9 |
VIP Mid Cap Portfolio Initial Class | 2.2 | 2.7 |
VIP Value Portfolio Initial Class | 5.8 | 7.0 |
VIP Value Strategies Portfolio Initial Class | 2.8 | 2.9 |
| 41.7 | 43.5 |
Developed International Equity Funds | | |
VIP Overseas Portfolio Initial Class | 11.7 | 11.6 |
Emerging Markets Equity Funds | | |
VIP Emerging Markets Portfolio Initial Class | 3.5 | 3.0 |
High Yield Bond Funds | | |
VIP High Income Portfolio Initial Class | 6.0 | 6.4 |
Investment Grade Bond Funds | | |
VIP Investment Grade Bond Portfolio Initial Class | 31.3 | 30.7 |
Short-Term Funds | | |
VIP Money Market Portfolio Initial Class | 5.8 | 4.8 |
Net Other Assets (Liabilities)* | 0.0 | 0.0 |
| 100.0 | 100.0 |
* Amount represents less than 0.1% |
Asset Allocation (% of fund's net assets) |
Current |
| Domestic Equity Funds | 41.7% | |
| Developed International Equity Funds | 11.7% | |
| Emerging Markets Equity Funds | 3.5% | |
| High Yield Bond Funds | 6.0% | |
| Investment Grade Bond Funds | 31.3% | |
| Short-Term Funds | 5.8% | |

Six months ago |
| Domestic Equity Funds | 43.5% | |
| Developed International Equity Funds | 11.6% | |
| Emerging Markets Equity Funds | 3.0% | |
| High Yield Bond Funds | 6.4% | |
| Investment Grade Bond Funds | 30.7% | |
| Short-Term Funds | 4.8% | |

Expected |
| Domestic Equity Funds | 40.5% | |
| Developed International Equity Funds | 11.3% | |
| Emerging Markets Equity Funds | 3.4% | |
| High Yield Bond Funds | 5.8% | |
| Investment Grade Bond Funds | 32.3% | |
| Short-Term Funds | 6.7% | |

The fund invests according to an asset allocation strategy that becomes increasingly conservative over time. The six months ago allocation is based on the fund's holdings as of December 31, 2011. The current allocation is based on the fund's holdings as of June 30, 2012. The expected allocation represents the fund's anticipated allocation at December 31, 2012. |
Semiannual Report
VIP Freedom 2020 Portfolio
Investments June 30, 2012 (Unaudited)
Showing Percentage of Net Assets
Domestic Equity Funds - 41.7% |
| Shares | | Value |
Domestic Equity Funds - 41.7% |
VIP Contrafund Portfolio Initial Class | 1,661,644 | | $ 41,856,824 |
VIP Equity-Income Portfolio Initial Class | 2,272,303 | | 44,923,435 |
VIP Growth & Income Portfolio Initial Class | 3,642,710 | | 50,342,249 |
VIP Growth Portfolio Initial Class | 1,043,574 | | 42,577,805 |
VIP Mid Cap Portfolio Initial Class | 405,972 | | 12,617,623 |
VIP Value Portfolio Initial Class | 2,898,443 | | 33,506,002 |
VIP Value Strategies Portfolio Initial Class | 1,630,636 | | 16,061,764 |
TOTAL DOMESTIC EQUITY FUNDS (Cost $226,138,764) |
241,885,702
|
International Equity Funds - 15.2% |
| | | |
Developed International Equity Funds - 11.7% |
VIP Overseas Portfolio Initial Class | 4,692,590 | | 68,230,252 |
Emerging Markets Equity Funds - 3.5% |
VIP Emerging Markets Portfolio Initial Class | 2,544,962 | | 20,054,300 |
TOTAL INTERNATIONAL EQUITY FUNDS (Cost $98,945,943) |
88,284,552
|
Bond Funds - 37.3% |
| Shares | | Value |
High Yield Bond Funds - 6.0% |
VIP High Income Portfolio Initial Class | 6,026,094 | | $ 34,770,560 |
Investment Grade Bond Funds - 31.3% |
VIP Investment Grade Bond Portfolio Initial Class | 13,671,078 | | 181,962,054 |
TOTAL BOND FUNDS (Cost $209,597,433) |
216,732,614
|
Short-Term Funds - 5.8% |
| | | |
VIP Money Market Portfolio Initial Class
(Cost $33,824,182) | 33,824,182 | |
33,824,182
|
TOTAL INVESTMENT PORTFOLIO - 100.0% (Cost $568,506,322) | | 580,727,050 |
NET OTHER ASSETS (LIABILITIES) - 0.0% | | (102,929) |
NET ASSETS - 100% | $ 580,624,121 |
Other Information |
All investments are categorized as Level 1 under the Fair Value Hierarchy. The inputs or methodology used for valuing securities may not be an indication of the risk associated with investing in those securities. For more information on valuation inputs, please refer to the Security Valuation section in the accompanying Notes to Financial Statements. |
See accompanying notes which are an integral part of the financial statements.
Semiannual Report
VIP Freedom 2020 Portfolio
Statement of Assets and Liabilities
| June 30, 2012 (Unaudited) |
| | |
Assets | | |
Investment in securities, at value (cost $568,506,322) - See accompanying schedule | | $ 580,727,050 |
Receivable for investments sold | | 445,380 |
Receivable for fund shares sold | | 143,937 |
Total assets | | 581,316,367 |
| | |
Liabilities | | |
Payable to custodian bank | $ 2,683 | |
Payable for investments purchased | 132,179 | |
Payable for fund shares redeemed | 455,656 | |
Distribution and service plan fees payable | 101,728 | |
Total liabilities | | 692,246 |
| | |
Net Assets | | $ 580,624,121 |
Net Assets consist of: | | |
Paid in capital | | $ 568,574,621 |
Accumulated net investment loss | | (561,564) |
Accumulated undistributed net realized gain (loss) on investments | | 390,336 |
Net unrealized appreciation (depreciation) on investments | | 12,220,728 |
Net Assets | | $ 580,624,121 |
Initial Class:
Net Asset Value, offering price and redemption price per share ($56,093,292 ÷ 5,171,540 shares) | | $ 10.85 |
| | |
Service Class:
Net Asset Value, offering price and redemption price per share ($40,901,091 ÷ 3,778,823 shares) | | $ 10.82 |
| | |
Service Class 2:
Net Asset Value, offering price and redemption price per share ($483,629,738 ÷ 44,853,269 shares) | | $ 10.78 |
Statement of Operations
Six months ended June 30, 2012 (Unaudited) |
| | |
Investment Income | | |
Income distributions from underlying funds | | $ 42,160 |
| | |
Expenses | | |
Distribution and service plan fees | $ 603,724 | |
Independent trustees' compensation | 954 | |
Total expenses before reductions | 604,678 | |
Expense reductions | (954) | 603,724 |
Net investment income (loss) | | (561,564) |
Realized and Unrealized Gain (Loss) Realized gain (loss) on sale of underlying fund shares | 495,608 | |
Capital gain distributions from underlying funds | 2,228,175 | |
Total net realized gain (loss) | | 2,723,783 |
Change in net unrealized appreciation (depreciation) on underlying funds | | 31,276,287 |
Net gain (loss) | | 34,000,070 |
Net increase (decrease) in net assets resulting from operations | | $ 33,438,506 |
See accompanying notes which are an integral part of the financial statements.
Semiannual Report
VIP Freedom 2020 Portfolio
Financial Statements - continued
Statement of Changes in Net Assets
| Six months ended
June 30, 2012
(Unaudited) | Year ended
December 31,
2011 |
Increase (Decrease) in Net Assets | | |
Operations | | |
Net investment income (loss) | $ (561,564) | $ 10,369,544 |
Net realized gain (loss) | 2,723,783 | 3,820,804 |
Change in net unrealized appreciation (depreciation) | 31,276,287 | (22,099,443) |
Net increase (decrease) in net assets resulting from operations | 33,438,506 | (7,909,095) |
Distributions to shareholders from net investment income | - | (10,386,172) |
Distributions to shareholders from net realized gain | (2,093,685) | (1,960,572) |
Total distributions | (2,093,685) | (12,346,744) |
Share transactions - net increase (decrease) | 38,253,848 | 142,556,761 |
Total increase (decrease) in net assets | 69,598,669 | 122,300,922 |
| | |
Net Assets | | |
Beginning of period | 511,025,452 | 388,724,530 |
End of period (including accumulated net investment loss of $561,564 and undistributed net investment income of $0, respectively) | $ 580,624,121 | $ 511,025,452 |
Financial Highlights - Initial Class
| Six months ended
June 30, 2012 | Years ended December 31, |
| (Unaudited) | 2011 | 2010 | 2009 | 2008 | 2007 |
Selected Per-Share Data | | | | | | |
Net asset value, beginning of period | $ 10.21 | $ 10.59 | $ 9.52 | $ 7.71 | $ 12.63 | $ 12.10 |
Income from Investment Operations | | | | | | |
Net investment income (loss) E | - I | .26 | .26 | .33 | .32 | .35 |
Net realized and unrealized gain (loss) | .68 | (.37) | 1.11 | 1.88 | (4.38) | .88 |
Total from investment operations | .68 | (.11) | 1.37 | 2.21 | (4.06) | 1.23 |
Distributions from net investment income | - | (.23) | (.22) | (.29) | (.28) | (.27) |
Distributions from net realized gain | (.04) | (.04) | (.08) | (.11) | (.59) | (.43) |
Total distributions | (.04) | (.27) | (.30) | (.40) L | (.86) K | (.70) J |
Net asset value, end of period | $ 10.85 | $ 10.21 | $ 10.59 | $ 9.52 | $ 7.71 | $ 12.63 |
Total Return B, C, D | 6.67% | (1.03)% | 14.49% | 28.97% | (32.60)% | 10.23% |
Ratios to Average Net Assets F, H | | | | | | |
Expenses before reductions G | .00% A | .00% | .00% | .00% | .00% | .00% |
Expenses net of fee waivers, if any | .00% A | .00% | .00% | .00% | .00% | .00% |
Expenses net of all reductions | .00% A | .00% | .00% | .00% | .00% | .00% |
Net investment income (loss) | .02% A | 2.47% | 2.61% | 3.93% | 3.07% | 2.76% |
Supplemental Data | | | | | | |
Net assets, end of period (000 omitted) | $ 56,093 | $ 47,731 | $ 45,225 | $ 38,330 | $ 33,089 | $ 31,465 |
Portfolio turnover rate | 17% A | 10% | 21% | 18% | 24% | 12% |
AAnnualized BTotal returns for periods of less than one year are not annualized. CTotal returns do not reflect charges attributable to your insurance company's separate account. Inclusion of these charges would reduce the total returns shown. DTotal returns would have been lower if certain expenses had not been reduced during the applicable periods shown. ECalculated based on average shares outstanding during the period. FAmounts do not include the activity of the Underlying Funds. GAmount represents less than .01%. HExpense ratios reflect operating expenses of the class. Expenses before reductions do not reflect amounts reimbursed by the investment adviser or reductions from expense offset arrangements and do not represent the amount paid by the class during periods when reimbursements or reductions occur. Expenses net of fee waivers reflect expenses after reimbursement by the investment adviser but prior to reductions from expense offset arrangements. Expenses net of all reductions represent the net expenses paid by the class but do not include expenses of the investment companies in which the Fund invests. IAmount represents less than $.01 per share. JTotal distributions of $.70 per share is comprised of distributions from net investment income of $.273 and distributions from net realized gain of $.425 per share. KTotal distributions of $.86 per share is comprised of distributions from net investment income of $.279 and distributions from net realized gain of $.585 per share. LTotal distributions of $.40 per share is comprised of distributions from net investment income of $.293 and distributions from net realized gain of $.107 per share. |
See accompanying notes which are an integral part of the financial statements.
Semiannual Report
Financial Highlights - Service Class
| Six months ended
June 30, 2012 | Years ended December 31, |
| (Unaudited) | 2011 | 2010 | 2009 | 2008 | 2007 |
Selected Per-Share Data | | | | | | |
Net asset value, beginning of period | $ 10.20 | $ 10.58 | $ 9.50 | $ 7.70 | $ 12.62 | $ 12.09 |
Income from Investment Operations | | | | | | |
Net investment income (loss) E | - H | .25 | .25 | .32 | .31 | .34 |
Net realized and unrealized gain (loss) | .66 | (.37) | 1.12 | 1.87 | (4.38) | .88 |
Total from investment operations | .66 | (.12) | 1.37 | 2.19 | (4.07) | 1.22 |
Distributions from net investment income | - | (.22) | (.21) | (.29) | (.27) | (.26) |
Distributions from net realized gain | (.04) | (.04) | (.08) | (.11) | (.59) | (.43) |
Total distributions | (.04) | (.26) | (.29) | (.39) K | (.85) J | (.69) I |
Net asset value, end of period | $ 10.82 | $ 10.20 | $ 10.58 | $ 9.50 | $ 7.70 | $ 12.62 |
Total Return B, C, D | 6.48% | (1.12)% | 14.52% | 28.78% | (32.71)% | 10.17% |
Ratios to Average Net Assets F, G | | | | | | |
Expenses before reductions | .10% A | .10% | .10% | .10% | .10% | .10% |
Expenses net of fee waivers, if any | .10% A | .10% | .10% | .10% | .10% | .10% |
Expenses net of all reductions | .10% A | .10% | .10% | .10% | .10% | .10% |
Net investment income (loss) | (.08)% A | 2.37% | 2.51% | 3.83% | 2.97% | 2.66% |
Supplemental Data | | | | | | |
Net assets, end of period (000 omitted) | $ 40,901 | $ 36,818 | $ 33,244 | $ 25,941 | $ 18,325 | $ 19,881 |
Portfolio turnover rate | 17% A | 10% | 21% | 18% | 24% | 12% |
AAnnualized BTotal returns for periods of less than one year are not annualized. CTotal returns do not reflect charges attributable to your insurance company's separate account. Inclusion of these charges would reduce the total returns shown. DTotal returns would have been lower if certain expenses had not been reduced during the applicable periods shown. ECalculated based on average shares outstanding during the period. FAmounts do not include the activity of the Underlying Funds. GExpense ratios reflect operating expenses of the class. Expenses before reductions do not reflect amounts reimbursed by the investment adviser or reductions from expense offset arrangements and do not represent the amount paid by the class during periods when reimbursements or reductions occur. Expenses net of fee waivers reflect expenses after reimbursement by the investment adviser but prior to reductions from expense offset arrangements. Expenses net of all reductions represent the net expenses paid by the class but do not include expenses of the investment companies in which the Fund invests. HAmount represents less than $.01 per share. ITotal distributions of $.69 per share is comprised of distributions from net investment income of $.264 and distributions from net realized gain of $.425 per share. JTotal distributions of $.85 per share is comprised of distributions from net investment income of $.269 and distributions from net realized gain of $.585 per share. KTotal distributions of $.39 per share is comprised of distributions from net investment income of $.285 and distributions from net realized gain of $.107 per share. |
Financial Highlights - Service Class 2
| Six months ended
June 30, 2012 | Years ended December 31, |
| (Unaudited) | 2011 | 2010 | 2009 | 2008 | 2007 |
Selected Per-Share Data | | | | | | |
Net asset value, beginning of period | $ 10.17 | $ 10.55 | $ 9.48 | $ 7.69 | $ 12.60 | $ 12.08 |
Income from Investment Operations | | | | | | |
Net investment income (loss) E | (.01) | .24 | .23 | .31 | .30 | .32 |
Net realized and unrealized gain (loss) | .66 | (.37) | 1.12 | 1.86 | (4.37) | .87 |
Total from investment operations | .65 | (.13) | 1.35 | 2.17 | (4.07) | 1.19 |
Distributions from net investment income | - | (.21) | (.20) | (.28) | (.26) | (.25) |
Distributions from net realized gain | (.04) | (.04) | (.08) | (.11) | (.59) | (.43) |
Total distributions | (.04) | (.25) | (.28) | (.38) J | (.84) I | (.67) H |
Net asset value, end of period | $ 10.78 | $ 10.17 | $ 10.55 | $ 9.48 | $ 7.69 | $ 12.60 |
Total Return B, C, D | 6.40% | (1.24)% | 14.33% | 28.55% | (32.80)% | 9.97% |
Ratios to Average Net Assets F, G | | | | | | |
Expenses before reductions | .25% A | .25% | .25% | .25% | .25% | .25% |
Expenses net of fee waivers, if any | .25% A | .25% | .25% | .25% | .25% | .25% |
Expenses net of all reductions | .25% A | .25% | .25% | .25% | .25% | .25% |
Net investment income (loss) | (.23)% A | 2.22% | 2.36% | 3.68% | 2.82% | 2.51% |
Supplemental Data | | | | | | |
Net assets, end of period (000 omitted) | $ 483,630 | $ 426,477 | $ 310,255 | $ 189,686 | $ 106,530 | $ 119,395 |
Portfolio turnover rate | 17% A | 10% | 21% | 18% | 24% | 12% |
AAnnualized BTotal returns for periods of less than one year are not annualized. CTotal returns do not reflect charges attributable to your insurance company's separate account. Inclusion of these charges would reduce the total returns shown. DTotal returns would have been lower if certain expenses had not been reduced during the applicable periods shown. ECalculated based on average shares outstanding during the period. FAmounts do not include the activity of the Underlying Funds. GExpense ratios reflect operating expenses of the class. Expenses before reductions do not reflect amounts reimbursed by the investment adviser or reductions from expense offset arrangements and do not represent the amount paid by the class during periods when reimbursements or reductions occur. Expenses net of fee waivers reflect expenses after reimbursement by the investment adviser but prior to reductions from expense offset arrangements. Expenses net of all reductions represent the net expenses paid by the class but do not include expenses of the investment companies in which the Fund invests. HTotal distributions of $.67 per share is comprised of distributions from net investment income of $.249 and distributions from net realized gain of $.425 per share. ITotal distributions of $.84 per share is comprised of distributions from net investment income of $.255 and distributions from net realized gain of $.585 per share. JTotal distributions of $.38 per share is comprised of distributions from net investment income of $.275 and distributions from net realized gain of $.107 per share. |
See accompanying notes which are an integral part of the financial statements.
Semiannual Report
VIP Freedom 2025 Portfolio
Investment Changes (Unaudited)
Fund Holdings as of June 30, 2012 |
| % of fund's
net assets | % of fund's net assets
6 months ago |
Domestic Equity Funds | | |
VIP Contrafund Portfolio Initial Class | 8.7 | 8.0 |
VIP Equity-Income Portfolio Initial Class | 9.3 | 9.5 |
VIP Growth & Income Portfolio Initial Class | 10.4 | 9.6 |
VIP Growth Portfolio Initial Class | 8.8 | 9.3 |
VIP Mid Cap Portfolio Initial Class | 2.6 | 3.2 |
VIP Value Portfolio Initial Class | 7.0 | 8.2 |
VIP Value Strategies Portfolio Initial Class | 3.3 | 3.4 |
| 50.1 | 51.2 |
Developed International Equity Funds | | |
VIP Overseas Portfolio Initial Class | 14.1 | 13.7 |
Emerging Markets Equity Funds | | |
VIP Emerging Markets Portfolio Initial Class | 4.2 | 3.6 |
High Yield Bond Funds | | |
VIP High Income Portfolio Initial Class | 7.4 | 7.7 |
Investment Grade Bond Funds | | |
VIP Investment Grade Bond Portfolio Initial Class | 23.8 | 23.6 |
Short-Term Funds | | |
VIP Money Market Portfolio Initial Class | 0.4 | 0.2 |
Net Other Assets (Liabilities)* | 0.0 | 0.0 |
| 100.0 | 100.0 |
* Amount represents less than 0.1% |
Asset Allocation (% of fund's net assets) |
Current |
| Domestic Equity Funds | 50.1% | |
| Developed International Equity Funds | 14.1% | |
| Emerging Markets Equity Funds | 4.2% | |
| High Yield Bond Funds | 7.4% | |
| Investment Grade Bond Funds | 23.8% | |
| Short-Term Funds | 0.4% | |

Six months ago |
| Domestic Equity Funds | 51.2% | |
| Developed International Equity Funds | 13.7% | |
| Emerging Markets Equity Funds | 3.6% | |
| High Yield Bond Funds | 7.7% | |
| Investment Grade Bond Funds | 23.6% | |
| Short-Term Funds | 0.2% | |

Expected |
| Domestic Equity Funds | 49.3% | |
| Developed International Equity Funds | 13.9% | |
| Emerging Markets Equity Funds | 4.1% | |
| High Yield Bond Funds | 7.4% | |
| Investment Grade Bond Funds | 24.6% | |
| Short-Term Funds | 0.7% | |

The fund invests according to an asset allocation strategy that becomes increasingly conservative over time. The six months ago allocation is based on the fund's holdings as of December 31, 2011. The current allocation is based on the fund's holdings as of June 30, 2012. The expected allocation represents the fund's anticipated allocation at December 31, 2012. |
Semiannual Report
VIP Freedom 2025 Portfolio
Investments June 30, 2012 (Unaudited)
Showing Percentage of Net Assets
Domestic Equity Funds - 50.1% |
| Shares | | Value |
Domestic Equity Funds - 50.1% |
VIP Contrafund Portfolio Initial Class | 194,502 | | $ 4,899,505 |
VIP Equity-Income Portfolio Initial Class | 266,043 | | 5,259,673 |
VIP Growth & Income Portfolio Initial Class | 426,890 | | 5,899,624 |
VIP Growth Portfolio Initial Class | 122,338 | | 4,991,383 |
VIP Mid Cap Portfolio Initial Class | 47,561 | | 1,478,202 |
VIP Value Portfolio Initial Class | 339,697 | | 3,926,895 |
VIP Value Strategies Portfolio Initial Class | 191,445 | | 1,885,730 |
TOTAL DOMESTIC EQUITY FUNDS (Cost $26,980,017) |
28,341,012
|
International Equity Funds - 18.3% |
| | | |
Developed International Equity Funds - 14.1% |
VIP Overseas Portfolio Initial Class | 549,740 | | 7,993,225 |
Emerging Markets Equity Funds - 4.2% |
VIP Emerging Markets Portfolio Initial Class | 298,159 | | 2,349,494 |
TOTAL INTERNATIONAL EQUITY FUNDS (Cost $11,604,030) |
10,342,719
|
Bond Funds - 31.2% |
| Shares | | Value |
High Yield Bond Funds - 7.4% |
VIP High Income Portfolio Initial Class | 730,122 | | $ 4,212,806 |
Investment Grade Bond Funds - 23.8% |
VIP Investment Grade Bond Portfolio Initial Class | 1,009,584 | | 13,437,558 |
TOTAL BOND FUNDS (Cost $17,209,496) |
17,650,364
|
Short-Term Funds - 0.4% |
| | | |
VIP Money Market Portfolio Initial Class
(Cost $237,630) | 237,630 | |
237,630
|
TOTAL INVESTMENT PORTFOLIO - 100.0% (Cost $56,031,173) | | 56,571,725 |
NET OTHER ASSETS (LIABILITIES) - 0.0% | | (7,268) |
NET ASSETS - 100% | $ 56,564,457 |
Other Information |
All investments are categorized as Level 1 under the Fair Value Hierarchy. The inputs or methodology used for valuing securities may not be an indication of the risk associated with investing in those securities. For more information on valuation inputs, please refer to the Security Valuation section in the accompanying Notes to Financial Statements. |
See accompanying notes which are an integral part of the financial statements.
Semiannual Report
VIP Freedom 2025 Portfolio
Statement of Assets and Liabilities
| June 30, 2012 (Unaudited) |
| | |
Assets | | |
Investment in securities, at value (cost $56,031,173) - See accompanying schedule | | $ 56,571,725 |
Receivable for investments sold | | 94,886 |
Receivable for fund shares sold | | 92,187 |
Total assets | | 56,758,798 |
| | |
Liabilities | | |
Payable to custodian bank | $ 1,079 | |
Payable for investments purchased | 1,628 | |
Payable for fund shares redeemed | 184,376 | |
Distribution and service plan fees payable | 7,258 | |
Total liabilities | | 194,341 |
| | |
Net Assets | | $ 56,564,457 |
Net Assets consist of: | | |
Paid in capital | | $ 56,004,809 |
Distributions in excess of net investment income | | (40,796) |
Accumulated undistributed net realized gain (loss) on investments | | 59,892 |
Net unrealized appreciation (depreciation) on investments | | 540,552 |
Net Assets | | $ 56,564,457 |
Initial Class:
Net Asset Value, offering price and redemption price per share ($16,485,563 ÷ 1,539,293 shares) | | $ 10.71 |
| | |
Service Class:
Net Asset Value, offering price and redemption price per share ($7,067,065 ÷ 660,785 shares) | | $ 10.69 |
| | |
Service Class 2:
Net Asset Value, offering price and redemption price per share ($33,011,829 ÷ 3,101,234 shares) | | $ 10.64 |
Statement of Operations
Six months ended June 30, 2012 (Unaudited) |
| | |
Investment Income | | |
Income distributions from underlying funds | | $ 2,317 |
| | |
Expenses | | |
Distribution and service plan fees | $ 43,113 | |
Independent trustees' compensation | 93 | |
Total expenses before reductions | 43,206 | |
Expense reductions | (93) | 43,113 |
Net investment income (loss) | | (40,796) |
Realized and Unrealized Gain (Loss) Realized gain (loss) on sale of underlying fund shares | 161,296 | |
Capital gain distributions from underlying funds | 213,470 | |
Total net realized gain (loss) | | 374,766 |
Change in net unrealized appreciation (depreciation) on underlying funds | | 3,316,733 |
Net gain (loss) | | 3,691,499 |
Net increase (decrease) in net assets resulting from operations | | $ 3,650,703 |
See accompanying notes which are an integral part of the financial statements.
Semiannual Report
Statement of Changes in Net Assets
| Six months ended
June 30, 2012
(Unaudited) | Year ended
December 31,
2011 |
Increase (Decrease) in Net Assets | | |
Operations | | |
Net investment income (loss) | $ (40,796) | $ 971,793 |
Net realized gain (loss) | 374,766 | 309,401 |
Change in net unrealized appreciation (depreciation) | 3,316,733 | (2,312,775) |
Net increase (decrease) in net assets resulting from operations | 3,650,703 | (1,031,581) |
Distributions to shareholders from net investment income | - | (970,164) |
Distributions to shareholders from net realized gain | (190,578) | (158,174) |
Total distributions | (190,578) | (1,128,338) |
Share transactions - net increase (decrease) | 4,550,083 | 9,114,938 |
Total increase (decrease) in net assets | 8,010,208 | 6,955,019 |
| | |
Net Assets | | |
Beginning of period | 48,554,249 | 41,599,230 |
End of period (including distributions in excess of net investment income of $40,797 and undistributed net investment income of $0, respectively) | $ 56,564,457 | $ 48,554,249 |
Financial Highlights - Initial Class
| Six months ended
June 30, 2012 | Years ended December 31, |
| (Unaudited) | 2011 | 2010 | 2009 | 2008 | 2007 |
Selected Per-Share Data | | | | | | |
Net asset value, beginning of period | $ 10.02 | $ 10.49 | $ 9.30 | $ 7.49 | $ 12.71 | $ 12.18 |
Income from Investment Operations | | | | | | |
Net investment income (loss) E | - I | .24 | .28 | .32 | .31 | .38 |
Net realized and unrealized gain (loss) | .73 | (.46) | 1.19 | 1.89 | (4.58) | .89 |
Total from investment operations | .73 | (.22) | 1.47 | 2.21 | (4.27) | 1.27 |
Distributions from net investment income | - | (.22) | (.21) | (.29) | (.28) | (.27) |
Distributions from net realized gain | (.04) | (.03) | (.06) | (.12) | (.67) | (.47) |
Total distributions | (.04) | (.25) | (.28) K | (.40) J | (.95) | (.74) |
Net asset value, end of period | $ 10.71 | $ 10.02 | $ 10.49 | $ 9.30 | $ 7.49 | $ 12.71 |
Total Return B, C, D | 7.26% | (2.11)% | 15.79% | 30.05% | (34.16)% | 10.50% |
Ratios to Average Net Assets F, H | | | | | | |
Expenses before reductions G | .00% A | .00% | .00% | .00% | .00% | .00% |
Expenses net of fee waivers, if any | .00% A | .00% | .00% | .00% | .00% | .00% |
Expenses net of all reductions | .00% A | .00% | .00% | .00% | .00% | .00% |
Net investment income (loss) | .01% A | 2.25% | 2.91% | 3.84% | 2.90% | 2.95% |
Supplemental Data | | | | | | |
Net assets, end of period (000 omitted) | $ 16,486 | $ 15,537 | $ 17,388 | $ 14,888 | $ 11,015 | $ 15,197 |
Portfolio turnover rate | 38% A | 21% | 25% | 30% | 36% | 20% |
AAnnualized BTotal returns for periods of less than one year are not annualized. CTotal returns do not reflect charges attributable to your insurance company's separate account. Inclusion of these charges would reduce the total returns shown. DTotal returns would have been lower if certain expenses had not been reduced during the applicable periods shown. ECalculated based on average shares outstanding during the period. FAmounts do not include the activity of the Underlying Funds. GAmount represents less than .01%. HExpense ratios reflect operating expenses of the class. Expenses before reductions do not reflect amounts reimbursed by the investment adviser or reductions from expense offset arrangements and do not represent the amount paid by the class during periods when reimbursements or reductions occur. Expenses net of fee waivers reflect expenses after reimbursement by the investment adviser but prior to reductions from expense offset arrangements. Expenses net of all reductions represent the net expenses paid by the class but do not include expenses of the investment companies in which the Fund invests. IAmount represents less than $.01 per share. JTotal distributions of $.40 per share is comprised of distributions from net investment income of $.285 and distributions from net realized gain of $.117 per share. KTotal distributions of $.28 per share is comprised of distributions from net investment income of $.214 and distributions from net realized gain of $.061 per share. |
See accompanying notes which are an integral part of the financial statements.
Semiannual Report
Financial Highlights - Service Class
| Six months ended
June 30, 2012 | Years ended December 31, |
| (Unaudited) | 2011 | 2010 | 2009 | 2008 | 2007 |
Selected Per-Share Data | | | | | | |
Net asset value, beginning of period | $ 10.01 | $ 10.49 | $ 9.30 | $ 7.49 | $ 12.70 | $ 12.18 |
Income from Investment Operations | | | | | | |
Net investment income (loss) E | - H | .23 | .27 | .31 | .29 | .37 |
Net realized and unrealized gain (loss) | .72 | (.47) | 1.19 | 1.90 | (4.56) | .87 |
Total from investment operations | .72 | (.24) | 1.46 | 2.21 | (4.27) | 1.24 |
Distributions from net investment income | - | (.21) | (.21) | (.28) | (.27) | (.25) |
Distributions from net realized gain | (.04) | (.03) | (.06) | (.12) | (.67) | (.47) |
Total distributions | (.04) | (.24) | (.27) | (.40) I | (.94) | (.72) |
Net asset value, end of period | $ 10.69 | $ 10.01 | $ 10.49 | $ 9.30 | $ 7.49 | $ 12.70 |
Total Return B, C, D | 7.17% | (2.26)% | 15.70% | 29.96% | (34.20)% | 10.31% |
Ratios to Average Net Assets F, G | | | | | | |
Expenses before reductions | .10% A | .10% | .10% | .10% | .10% | .10% |
Expenses net of fee waivers, if any | .10% A | .10% | .10% | .10% | .10% | .10% |
Expenses net of all reductions | .10% A | .10% | .10% | .10% | .10% | .10% |
Net investment income (loss) | (.09)% A | 2.16% | 2.81% | 3.74% | 2.80% | 2.85% |
Supplemental Data | | | | | | |
Net assets, end of period (000 omitted) | $ 7,067 | $ 7,149 | $ 1,429 | $ 679 | $ 403 | $ 497 |
Portfolio turnover rate | 38% A | 21% | 25% | 30% | 36% | 20% |
AAnnualized BTotal returns for periods of less than one year are not annualized. CTotal returns do not reflect charges attributable to your insurance company's separate account. Inclusion of these charges would reduce the total returns shown. DTotal returns would have been lower if certain expenses had not been reduced during the applicable periods shown. ECalculated based on average shares outstanding during the period. FAmounts do not include the activity of the Underlying Funds. GExpense ratios reflect operating expenses of the class. Expenses before reductions do not reflect amounts reimbursed by the investment adviser or reductions from expense offset arrangements and do not represent the amount paid by the class during periods when reimbursements or reductions occur. Expenses net of fee waivers reflect expenses after reimbursement by the investment adviser but prior to reductions from expense offset arrangements. Expenses net of all reductions represent the net expenses paid by the class but do not include expenses of the investment companies in which the Fund invests. HAmount represents less than $.01 per share. ITotal distributions of $.40 per share is comprised of distributions from net investment income of $.278 and distributions from net realized gain of $.117 per share. |
Financial Highlights - Service Class 2
| Six months ended
June 30, 2012 | Years ended December 31, |
| (Unaudited) | 2011 | 2010 | 2009 | 2008 | 2007 |
Selected Per-Share Data | | | | | | |
Net asset value, beginning of period | $ 9.97 | $ 10.44 | $ 9.27 | $ 7.47 | $ 12.68 | $ 12.17 |
Income from Investment Operations | | | | | | |
Net investment income (loss) E | (.01) | .21 | .26 | .30 | .28 | .35 |
Net realized and unrealized gain (loss) | .72 | (.45) | 1.17 | 1.89 | (4.57) | .89 |
Total from investment operations | .71 | (.24) | 1.43 | 2.19 | (4.29) | 1.24 |
Distributions from net investment income | - | (.19) | (.20) | (.27) | (.25) | (.26) |
Distributions from net realized gain | (.04) | (.03) | (.06) | (.12) | (.67) | (.47) |
Total distributions | (.04) | (.23) I | (.26) | (.39) H | (.92) | (.73) |
Net asset value, end of period | $ 10.64 | $ 9.97 | $ 10.44 | $ 9.27 | $ 7.47 | $ 12.68 |
Total Return B, C, D | 7.09% | (2.35)% | 15.47% | 29.79% | (34.36)% | 10.26% |
Ratios to Average Net Assets F, G | | | | | | |
Expenses before reductions | .25% A | .25% | .25% | .25% | .25% | .25% |
Expenses net of fee waivers, if any | .25% A | .25% | .25% | .25% | .25% | .25% |
Expenses net of all reductions | .25% A | .25% | .25% | .25% | .25% | .25% |
Net investment income (loss) | (.24)% A | 2.00% | 2.67% | 3.59% | 2.65% | 2.70% |
Supplemental Data | | | | | | |
Net assets, end of period (000 omitted) | $ 33,012 | $ 25,869 | $ 22,782 | $ 8,262 | $ 3,676 | $ 3,998 |
Portfolio turnover rate | 38% A | 21% | 25% | 30% | 36% | 20% |
AAnnualized BTotal returns for periods of less than one year are not annualized. CTotal returns do not reflect charges attributable to your insurance company's separate account. Inclusion of these charges would reduce the total returns shown. DTotal returns would have been lower if certain expenses had not been reduced during the applicable periods shown. ECalculated based on average shares outstanding during the period. FAmounts do not include the activity of the Underlying Funds. GExpense ratios reflect operating expenses of the class. Expenses before reductions do not reflect amounts reimbursed by the investment adviser or reductions from expense offset arrangements and do not represent the amount paid by the class during periods when reimbursements or reductions occur. Expenses net of fee waivers reflect expenses after reimbursement by the investment adviser but prior to reductions from expense offset arrangements. Expenses net of all reductions represent the net expenses paid by the class but do not include expenses of the investment companies in which the Fund invests. HTotal distributions of $.39 per share is comprised of distributions from net investment income of $.270 and distributions from net realized gain of $.117 per share. ITotal distributions of $.23 per share is comprised of distributions from net investment income of $.192 and distributions from net realized gain of $.033 per share. |
See accompanying notes which are an integral part of the financial statements.
Semiannual Report
VIP Freedom 2030 Portfolio
Investment Changes (Unaudited)
Fund Holdings as of June 30, 2012 |
| % of fund's
net assets | % of fund's net assets
6 months ago |
Domestic Equity Funds | | |
VIP Contrafund Portfolio Initial Class | 9.0 | 8.4 |
VIP Equity-Income Portfolio Initial Class | 9.7 | 10.0 |
VIP Growth & Income Portfolio Initial Class | 10.9 | 10.1 |
VIP Growth Portfolio Initial Class | 9.2 | 9.8 |
VIP Mid Cap Portfolio Initial Class | 2.7 | 3.4 |
VIP Value Portfolio Initial Class | 7.2 | 8.6 |
VIP Value Strategies Portfolio Initial Class | 3.5 | 3.5 |
| 52.2 | 53.8 |
Developed International Equity Funds | | |
VIP Overseas Portfolio Initial Class | 14.8 | 14.4 |
Emerging Markets Equity Funds | | |
VIP Emerging Markets Portfolio Initial Class | 4.3 | 3.7 |
High Yield Bond Funds | | |
VIP High Income Portfolio Initial Class | 7.5 | 7.7 |
Investment Grade Bond Funds | | |
VIP Investment Grade Bond Portfolio Initial Class | 21.2 | 20.4 |
Net Other Assets (Liabilities)* | 0.0 | 0.0 |
| 100.0 | 100.0 |
* Amount represents less than 0.1% |
Asset Allocation (% of fund's net assets) |
Current |
| Domestic Equity Funds | 52.2% | |
 | Developed International Equity Funds | 14.8% | |
 | Emerging Markets Equity Funds | 4.3% | |
| High Yield Bond Funds | 7.5% | |
| Investment Grade Bond Funds | 21.2% | |

Six months ago |
| Domestic Equity Funds | 53.8% | |
| Developed International Equity Funds | 14.4% | |
| Emerging Markets Equity Funds | 3.7% | |
| High Yield Bond Funds | 7.7% | |
| Investment Grade Bond Funds | 20.4% | |

Expected |
| Domestic Equity Funds | 51.8% | |
| Developed International Equity Funds | 14.5% | |
| Emerging Markets Equity Funds | 4.3% | |
| High Yield Bond Funds | 7.5% | |
| Investment Grade Bond Funds | 21.9% | |

The fund invests according to an asset allocation strategy that becomes increasingly conservative over time. The six months ago allocation is based on the fund's holdings as of December 31, 2011. The current allocation is based on the fund's holdings as of June 30, 2012. The expected allocation represents the fund's anticipated allocation at December 31, 2012. |
Semiannual Report
VIP Freedom 2030 Portfolio
Investments June 30, 2012 (Unaudited)
Showing Percentage of Net Assets
Domestic Equity Funds - 52.2% |
| Shares | | Value |
Domestic Equity Funds - 52.2% |
VIP Contrafund Portfolio Initial Class | 518,525 | | $ 13,061,651 |
VIP Equity-Income Portfolio Initial Class | 709,227 | | 14,021,411 |
VIP Growth & Income Portfolio Initial Class | 1,137,287 | | 15,717,310 |
VIP Growth Portfolio Initial Class | 326,245 | | 13,310,791 |
VIP Mid Cap Portfolio Initial Class | 127,295 | | 3,956,341 |
VIP Value Portfolio Initial Class | 906,673 | | 10,481,143 |
VIP Value Strategies Portfolio Initial Class | 509,877 | | 5,022,286 |
TOTAL DOMESTIC EQUITY FUNDS (Cost $73,831,627) |
75,570,933
|
International Equity Funds - 19.1% |
| | | |
Developed International Equity Funds - 14.8% |
VIP Overseas Portfolio Initial Class | 1,466,203 | | 21,318,589 |
Emerging Markets Equity Funds - 4.3% |
VIP Emerging Markets Portfolio Initial Class | 794,909 | | 6,263,879 |
TOTAL INTERNATIONAL EQUITY FUNDS (Cost $31,583,967) |
27,582,468
|
Bond Funds - 28.7% |
| Shares | | Value |
High Yield Bond Funds - 7.5% |
VIP High Income Portfolio Initial Class | 1,877,734 | | $ 10,834,522 |
Investment Grade Bond Funds - 21.2% |
VIP Investment Grade Bond Portfolio Initial Class | 2,303,668 | | 30,661,825 |
TOTAL BOND FUNDS (Cost $40,410,815) |
41,496,347
|
TOTAL INVESTMENT PORTFOLIO - 100.0% (Cost $145,826,409) | | 144,649,748 |
NET OTHER ASSETS (LIABILITIES) - 0.0% | | (17,692) |
NET ASSETS - 100% | $ 144,632,056 |
Other Information |
All investments are categorized as Level 1 under the Fair Value Hierarchy. The inputs or methodology used for valuing securities may not be an indication of the risk associated with investing in those securities. For more information on valuation inputs, please refer to the Security Valuation section in the accompanying Notes to Financial Statements. |
See accompanying notes which are an integral part of the financial statements.
Semiannual Report
VIP Freedom 2030 Portfolio
Statement of Assets and Liabilities
| June 30, 2012 (Unaudited) |
| | |
Assets | | |
Investment in securities, at value (cost $145,826,409) - See accompanying schedule | | $ 144,649,748 |
Receivable for fund shares sold | | 539,135 |
Total assets | | 145,188,883 |
| | |
Liabilities | | |
Payable to custodian bank | $ 20,566 | |
Payable for investments purchased | 454,976 | |
Payable for fund shares redeemed | 63,593 | |
Distribution and service plan fees payable | 17,692 | |
Total liabilities | | 556,827 |
| | |
Net Assets | | $ 144,632,056 |
Net Assets consist of: | | |
Paid in capital | | $ 146,524,004 |
Accumulated net investment loss | | (96,090) |
Accumulated undistributed net realized gain (loss) on investments | | (619,197) |
Net unrealized appreciation (depreciation) on investments | | (1,176,661) |
Net Assets | | $ 144,632,056 |
Initial Class:
Net Asset Value, offering price and redemption price per share ($37,605,772 ÷ 3,617,397 shares) | | $ 10.40 |
| | |
Service Class:
Net Asset Value, offering price and redemption price per share ($30,197,673 ÷ 2,909,201 shares) | | $ 10.38 |
| | |
Service Class 2:
Net Asset Value, offering price and redemption price per share ($76,828,611 ÷ 7,425,124 shares) | | $ 10.35 |
Statement of Operations
Six months ended June 30, 2012 (Unaudited) |
| | |
Investment Income | | |
Income distributions from underlying funds | | $ 5,214 |
| | |
Expenses | | |
Distribution and service plan fees | $ 101,304 | |
Independent trustees' compensation | 227 | |
Total expenses before reductions | 101,531 | |
Expense reductions | (227) | 101,304 |
Net investment income (loss) | | (96,090) |
Realized and Unrealized Gain (Loss) Realized gain (loss) on sale of underlying fund shares | 90,033 | |
Capital gain distributions from underlying funds | 496,476 | |
Total net realized gain (loss) | | 586,509 |
Change in net unrealized appreciation (depreciation) on underlying funds | | 8,463,720 |
Net gain (loss) | | 9,050,229 |
Net increase (decrease) in net assets resulting from operations | | $ 8,954,139 |
See accompanying notes which are an integral part of the financial statements.
Semiannual Report
Statement of Changes in Net Assets
| Six months ended
June 30, 2012
(Unaudited) | Year ended
December 31,
2011 |
Increase (Decrease) in Net Assets | | |
Operations | | |
Net investment income (loss) | $ (96,090) | $ 2,411,649 |
Net realized gain (loss) | 586,509 | 571,396 |
Change in net unrealized appreciation (depreciation) | 8,463,720 | (6,493,930) |
Net increase (decrease) in net assets resulting from operations | 8,954,139 | (3,510,885) |
Distributions to shareholders from net investment income | - | (2,415,727) |
Distributions to shareholders from net realized gain | (353,242) | (360,538) |
Total distributions | (353,242) | (2,776,265) |
Share transactions - net increase (decrease) | 17,093,874 | 23,596,541 |
Total increase (decrease) in net assets | 25,694,771 | 17,309,391 |
| | |
Net Assets | | |
Beginning of period | 118,937,285 | 101,627,894 |
End of period (including accumulated net investment loss of $96,090 and undistributed net investment income of $0, respectively) | $ 144,632,056 | $ 118,937,285 |
Financial Highlights - Initial Class
| Six months ended
June 30, 2012 | Years ended December 31, |
| (Unaudited) | 2011 | 2010 | 2009 | 2008 | 2007 |
Selected Per-Share Data | | | | | | |
Net asset value, beginning of period | $ 9.70 | $ 10.21 | $ 9.03 | $ 7.12 | $ 13.02 | $ 12.44 |
Income from Investment Operations | | | | | | |
Net investment income (loss) E | - I | .23 | .21 | .24 | .28 | .34 |
Net realized and unrealized gain (loss) | .73 | (.49) | 1.24 | 1.96 | (5.14) | 1.06 |
Total from investment operations | .73 | (.26) | 1.45 | 2.20 | (4.86) | 1.40 |
Distributions from net investment income | - | (.22) | (.20) | (.18) | (.25) | (.28) |
Distributions from net realized gain | (.03) | (.03) | (.07) | (.11) | (.80) | (.54) |
Total distributions | (.03) | (.25) | (.27) | (.29) | (1.04) J | (.82) |
Net asset value, end of period | $ 10.40 | $ 9.70 | $ 10.21 | $ 9.03 | $ 7.12 | $ 13.02 |
Total Return B, C, D | 7.51% | (2.60)% | 16.08% | 31.66% | (38.04)% | 11.37% |
Ratios to Average Net Assets F, H | | | | | | |
Expenses before reductions G | .00% A | .00% | .00% | .00% | .00% | .00% |
Expenses net of fee waivers, if any | .00% A | .00% | .00% | .00% | .00% | .00% |
Expenses net of all reductions | .00% A | .00% | .00% | .00% | .00% | .00% |
Net investment income (loss) | .01% A | 2.27% | 2.25% | 3.13% | 2.69% | 2.56% |
Supplemental Data | | | | | | |
Net assets, end of period (000 omitted) | $ 37,606 | $ 30,601 | $ 28,917 | $ 23,836 | $ 19,592 | $ 23,767 |
Portfolio turnover rate | 21% A | 16% | 25% | 24% | 23% | 17% |
AAnnualized BTotal returns for periods of less than one year are not annualized. CTotal returns do not reflect charges attributable to your insurance company's separate account. Inclusion of these charges would reduce the total returns shown. DTotal returns would have been lower if certain expenses had not been reduced during the applicable periods shown. ECalculated based on average shares outstanding during the period. FAmounts do not include the activity of the Underlying Funds. GAmount represents less than .01%. HExpense ratios reflect operating expenses of the class. Expenses before reductions do not reflect amounts reimbursed by the investment adviser or reductions from expense offset arrangements and do not represent the amount paid by the class during periods when reimbursements or reductions occur. Expenses net of fee waivers reflect expenses after reimbursement by the investment adviser but prior to reductions from expense offset arrangements. Expenses net of all reductions represent the net expenses paid by the class but do not include expenses of the investment companies in which the Fund invests. IAmount represents less than $.01 per share. JTotal distributions of $1.04 per share is comprised of distributions from net investment income of $.245 and distributions from net realized gain of $.795 per share. |
See accompanying notes which are an integral part of the financial statements.
Semiannual Report
Financial Highlights - Service Class
| Six months ended
June 30, 2012 | Years ended December 31, |
| (Unaudited) | 2011 | 2010 | 2009 | 2008 | 2007 |
Selected Per-Share Data | | | | | | |
Net asset value, beginning of period | $ 9.69 | $ 10.20 | $ 9.02 | $ 7.12 | $ 13.01 | $ 12.44 |
Income from Investment Operations | | | | | | |
Net investment income (loss) E | - H | .22 | .20 | .24 | .27 | .33 |
Net realized and unrealized gain (loss) | .72 | (.49) | 1.24 | 1.94 | (5.13) | 1.05 |
Total from investment operations | .72 | (.27) | 1.44 | 2.18 | (4.86) | 1.38 |
Distributions from net investment income | - | (.21) | (.19) | (.17) | (.24) | (.27) |
Distributions from net realized gain | (.03) | (.03) | (.07) | (.11) | (.80) | (.54) |
Total distributions | (.03) | (.24) | (.26) | (.28) | (1.03) I | (.81) |
Net asset value, end of period | $ 10.38 | $ 9.69 | $ 10.20 | $ 9.02 | $ 7.12 | $ 13.01 |
Total Return B, C, D | 7.41% | (2.70)% | 16.00% | 31.40% | (38.08)% | 11.21% |
Ratios to Average Net Assets F, G | | | | | | |
Expenses before reductions | .10% A | .10% | .10% | .10% | .10% | .10% |
Expenses net of fee waivers, if any | .10% A | .10% | .10% | .10% | .10% | .10% |
Expenses net of all reductions | .10% A | .10% | .10% | .10% | .10% | .10% |
Net investment income (loss) | (.09)% A | 2.17% | 2.15% | 3.03% | 2.59% | 2.46% |
Supplemental Data | | | | | | |
Net assets, end of period (000 omitted) | $ 30,198 | $ 28,666 | $ 23,137 | $ 16,162 | $ 10,298 | $ 12,884 |
Portfolio turnover rate | 21% A | 16% | 25% | 24% | 23% | 17% |
AAnnualized BTotal returns for periods of less than one year are not annualized. CTotal returns do not reflect charges attributable to your insurance company's separate account. Inclusion of these charges would reduce the total returns shown. DTotal returns would have been lower if certain expenses had not been reduced during the applicable periods shown. ECalculated based on average shares outstanding during the period. FAmounts do not include the activity of the Underlying Funds. GExpense ratios reflect operating expenses of the class. Expenses before reductions do not reflect amounts reimbursed by the investment adviser or reductions from expense offset arrangements and do not represent the amount paid by the class during periods when reimbursements or reductions occur. Expenses net of fee waivers reflect expenses after reimbursement by the investment adviser but prior to reductions from expense offset arrangements. Expenses net of all reductions represent the net expenses paid by the class but do not include expenses of the investment companies in which the Fund invests. HAmount represents less than $.01 per share. ITotal distributions of $1.03 per share is comprised of distributions from net investment income of $.235 and distributions from net realized gain of $.795 per share. |
Financial Highlights - Service Class 2
| Six months ended
June 30, 2012 | Years ended December 31, |
| (Unaudited) | 2011 | 2010 | 2009 | 2008 | 2007 |
Selected Per-Share Data | | | | | | |
Net asset value, beginning of period | $ 9.67 | $ 10.18 | $ 9.00 | $ 7.11 | $ 12.99 | $ 12.42 |
Income from Investment Operations | | | | | | |
Net investment income (loss) E | (.01) | .21 | .19 | .23 | .26 | .31 |
Net realized and unrealized gain (loss) | .72 | (.50) | 1.24 | 1.93 | (5.12) | 1.05 |
Total from investment operations | .71 | (.29) | 1.43 | 2.16 | (4.86) | 1.36 |
Distributions from net investment income | - | (.19) | (.17) | (.16) | (.22) | (.25) |
Distributions from net realized gain | (.03) | (.03) | (.07) | (.11) | (.80) | (.54) |
Total distributions | (.03) | (.22) | (.25) H | (.27) | (1.02) I | (.79) |
Net asset value, end of period | $ 10.35 | $ 9.67 | $ 10.18 | $ 9.00 | $ 7.11 | $ 12.99 |
Total Return B, C, D | 7.32% | (2.83)% | 15.89% | 31.18% | (38.17)% | 11.08% |
Ratios to Average Net Assets F, G | | | | | | |
Expenses before reductions | .25% A | .25% | .25% | .25% | .25% | .25% |
Expenses net of fee waivers, if any | .25% A | .25% | .25% | .25% | .25% | .25% |
Expenses net of all reductions | .25% A | .25% | .25% | .25% | .25% | .25% |
Net investment income (loss) | (.24)% A | 2.02% | 2.01% | 2.88% | 2.44% | 2.31% |
Supplemental Data | | | | | | |
Net assets, end of period (000 omitted) | $ 76,829 | $ 59,671 | $ 49,574 | $ 34,809 | $ 19,273 | $ 24,148 |
Portfolio turnover rate | 21% A | 16% | 25% | 24% | 23% | 17% |
AAnnualized BTotal returns for periods of less than one year are not annualized. CTotal returns do not reflect charges attributable to your insurance company's separate account. Inclusion of these charges would reduce the total returns shown. DTotal returns would have been lower if certain expenses had not been reduced during the applicable periods shown. ECalculated based on average shares outstanding during the period. FAmounts do not include the activity of the Underlying Funds. GExpense ratios reflect operating expenses of the class. Expenses before reductions do not reflect amounts reimbursed by the investment adviser or reductions from expense offset arrangements and do not represent the amount paid by the class during periods when reimbursements or reductions occur. Expenses net of fee waivers reflect expenses after reimbursement by the investment adviser but prior to reductions from expense offset arrangements. Expenses net of all reductions represent the net expenses paid by the class but do not include expenses of the investment companies in which the Fund invests. HTotal distributions of $.25 per share is comprised of distributions from net investment income of $.173 and distributions from net realized gain of $.072 per share. ITotal distributions of $1.02 per share is comprised of distributions from net investment income of $.221 and distributions from net realized gain of $.795 per share. |
See accompanying notes which are an integral part of the financial statements.
Semiannual Report
VIP Freedom 2035 Portfolio
Investment Changes (Unaudited)
Fund Holdings as of June 30, 2012 |
| % of fund's
net assets | % of fund's net assets
6 months ago |
Domestic Equity Funds | | |
VIP Contrafund Portfolio Initial Class | 10.5 | 9.6 |
VIP Equity-Income Portfolio Initial Class | 11.2 | 11.4 |
VIP Growth & Income Portfolio Initial Class | 12.7 | 11.5 |
VIP Growth Portfolio Initial Class | 10.6 | 11.1 |
VIP Mid Cap Portfolio Initial Class | 3.0 | 3.9 |
VIP Value Portfolio Initial Class | 8.2 | 9.9 |
VIP Value Strategies Portfolio Initial Class | 4.0 | 4.0 |
| 60.2 | 61.4 |
Developed International Equity Funds | | |
VIP Overseas Portfolio Initial Class | 17.0 | 16.4 |
Emerging Markets Equity Funds | | |
VIP Emerging Markets Portfolio Initial Class | 5.0 | 4.2 |
High Yield Bond Funds | | |
VIP High Income Portfolio Initial Class | 7.5 | 7.7 |
Investment Grade Bond Funds | | |
VIP Investment Grade Bond Portfolio Initial Class | 10.3 | 10.3 |
Net Other Assets (Liabilities)* | 0.0 | 0.0 |
| 100.0 | 100.0 |
* Amount represents less than 0.1% |
Asset Allocation (% of fund's net assets) |
Current |
| Domestic Equity Funds | 60.2% | |
| Developed International Equity Funds | 17.0% | |
| Emerging Markets Equity Funds | 5.0% | |
| High Yield Bond Funds | 7.5% | |
| Investment Grade Bond Funds | 10.3% | |

Six months ago |
| Domestic Equity Funds | 61.4% | |
| Developed International Equity Funds | 16.4% | |
| Emerging Markets Equity Funds | 4.2% | |
| High Yield Bond Funds | 7.7% | |
| Investment Grade Bond Funds | 10.3% | |

Expected |
| Domestic Equity Funds | 59.7% | |
| Developed International Equity Funds | 16.7% | |
| Emerging Markets Equity Funds | 5.0% | |
| High Yield Bond Funds | 7.5% | |
| Investment Grade Bond Funds | 11.1% | |

The fund invests according to an asset allocation strategy that becomes increasingly conservative over time. The six months ago allocation is based on the fund's holdings as of December 31, 2011. The current allocation is based on the fund's holdings as of June 30, 2012. The expected allocation represents the fund's anticipated allocation at December 31, 2012. |
Semiannual Report
VIP Freedom 2035 Portfolio
Investments June 30, 2012 (Unaudited)
Showing Percentage of Net Assets
Domestic Equity Funds - 60.2% |
| Shares | | Value |
Domestic Equity Funds - 60.2% |
VIP Contrafund Portfolio Initial Class | 2,092 | | $ 52,692 |
VIP Equity-Income Portfolio Initial Class | 2,832 | | 55,991 |
VIP Growth & Income Portfolio Initial Class | 4,603 | | 63,611 |
VIP Growth Portfolio Initial Class | 1,296 | | 52,885 |
VIP Mid Cap Portfolio Initial Class | 488 | | 15,171 |
VIP Value Portfolio Initial Class | 3,537 | | 40,892 |
VIP Value Strategies Portfolio Initial Class | 2,035 | | 20,041 |
TOTAL DOMESTIC EQUITY FUNDS (Cost $185,935) |
301,283
|
International Equity Funds - 22.0% |
| | | |
Developed International Equity Funds - 17.0% |
VIP Overseas Portfolio Initial Class | 5,848 | | 85,025 |
Emerging Markets Equity Funds - 5.0% |
VIP Emerging Markets Portfolio Initial Class | 3,172 | | 24,993 |
TOTAL INTERNATIONAL EQUITY FUNDS (Cost $96,540) |
110,018
|
Bond Funds - 17.8% |
| Shares | | Value |
High Yield Bond Funds - 7.5% |
VIP High Income Portfolio Initial Class | 6,503 | | $ 37,524 |
Investment Grade Bond Funds - 10.3% |
VIP Investment Grade Bond Portfolio Initial Class | 3,903 | | 51,946 |
TOTAL BOND FUNDS (Cost $76,732) |
89,470
|
TOTAL INVESTMENT PORTFOLIO - 100.0% (Cost $359,207) | | 500,771 |
NET OTHER ASSETS (LIABILITIES) - 0.0% | | (75) |
NET ASSETS - 100% | $ 500,696 |
Other Information |
All investments are categorized as Level 1 under the Fair Value Hierarchy. The inputs or methodology used for valuing securities may not be an indication of the risk associated with investing in those securities. For more information on valuation inputs, please refer to the Security Valuation section in the accompanying Notes to Financial Statements. |
See accompanying notes which are an integral part of the financial statements.
Semiannual Report
VIP Freedom 2035 Portfolio
Statement of Assets and Liabilities
| June 30, 2012 (Unaudited) |
| | |
Assets | | |
Investment in securities, at value (cost $359,207) - See accompanying schedule | | $ 500,771 |
Cash | | 1 |
Receivable for fund shares sold | | 257 |
Total assets | | 501,029 |
| | |
Liabilities | | |
Payable for investments purchased | $ 220 | |
Payable for fund shares redeemed | 42 | |
Distribution and service plan fees payable | 71 | |
Total liabilities | | 333 |
| | |
Net Assets | | $ 500,696 |
Net Assets consist of: | | |
Paid in capital | | $ 362,236 |
Distributions in excess of net investment income | | (427) |
Accumulated undistributed net realized gain (loss) on investments | | (2,677) |
Net unrealized appreciation (depreciation) on investments | | 141,564 |
Net Assets | | $ 500,696 |
Initial Class:
Net Asset Value, offering price and redemption price per share ($116,740 ÷ 7,827.3 shares) | | $ 14.91 |
| | |
Service Class:
Net Asset Value, offering price and redemption price per share ($96,830 ÷ 6,494.4 shares) | | $ 14.91 |
| | |
Service Class 2:
Net Asset Value, offering price and redemption price per share ($287,126 ÷ 19,295.9 shares) | | $ 14.88 |
Statement of Operations
Six months ended June 30, 2012 (Unaudited) |
| | |
Investment Income | | |
Income distributions from underlying funds | | $ 20 |
| | |
Expenses | | |
Distribution and service plan fees | $ 446 | |
Total expenses | | 446 |
Net investment income (loss) | | (426) |
Realized and Unrealized Gain (Loss) Realized gain (loss) on sale of underlying fund shares | (371) | |
Capital gain distributions from underlying funds | 1,781 | |
Total net realized gain (loss) | | 1,410 |
Change in net unrealized appreciation (depreciation) on underlying funds | | 33,930 |
Net gain (loss) | | 35,340 |
Net increase (decrease) in net assets resulting from operations | | $ 34,914 |
See accompanying notes which are an integral part of the financial statements.
Semiannual Report
Statement of Changes in Net Assets
| Six months ended
June 30, 2012
(Unaudited) | Year ended
December 31,
2011 |
Increase (Decrease) in Net Assets | | |
Operations | | |
Net investment income (loss) | $ (426) | $ 8,364 |
Net realized gain (loss) | 1,410 | (2,642) |
Change in net unrealized appreciation (depreciation) | 33,930 | (29,065) |
Net increase (decrease) in net assets resulting from operations | 34,914 | (23,343) |
Distributions to shareholders from net investment income | - | (8,242) |
Distributions to shareholders from net realized gain | - | (2,047) |
Total distributions | - | (10,289) |
Share transactions - net increase (decrease) | 2,832 | 48,994 |
Total increase (decrease) in net assets | 37,746 | 15,362 |
| | |
Net Assets | | |
Beginning of period | 462,950 | 447,588 |
End of period (including distributions in excess of net investment income of $427 and undistributed net investment income of $0, respectively) | $ 500,696 | $ 462,950 |
Financial Highlights - Initial Class
| Six months ended
June 30, 2012 | Years ended December 31, |
| (Unaudited) | 2011 | 2010 | 2009 F |
Selected Per-Share Data | | | | |
Net asset value, beginning of period | $ 13.82 | $ 14.74 | $ 13.74 | $ 10.00 |
Income from Investment Operations | | | | |
Net investment income (loss) D | - H | .27 | .27 | .25 |
Net realized and unrealized gain (loss) | 1.09 | (.85) | 2.04 | 3.76 |
Total from investment operations | 1.09 | (.58) | 2.31 | 4.01 |
Distributions from net investment income | - | (.28) | (.28) | (.25) |
Distributions from net realized gain | - | (.06) | (1.03) | (.01) |
Total distributions | - | (.34) | (1.31) | (.27) I |
Net asset value, end of period | $ 14.91 | $ 13.82 | $ 14.74 | $ 13.74 |
Total Return B, C | 7.89% | (3.99)% | 17.01% | 40.04% |
Ratios to Average Net Assets E, G | | | | |
Expenses before reductions | .00% A | .00% | .00% | .00% A |
Expenses net of fee waivers, if any | .00% A | .00% | .00% | .00% A |
Expenses net of all reductions | .00% A | .00% | .00% | .00% A |
Net investment income (loss) | .01% A | 1.82% | 1.92% | 2.78% A |
Supplemental Data | | | | |
Net assets, end of period (000 omitted) | $ 117 | $ 97 | $ 121 | $ 144 |
Portfolio turnover rate | 39% A | 38% | 38% | 5% A |
AAnnualized BTotal returns for periods of less than one year are not annualized. CTotal returns do not reflect charges attributable to your insurance company's separate account. Inclusion of these charges would reduce the total returns shown. DCalculated based on average shares outstanding during the period. EAmounts do not include the activity of the Underlying Funds. FFor the period April 8, 2009 (commencement of operations) to December 31, 2009. GExpense ratios reflect operating expenses of the class. Expenses before reductions do not reflect amounts reimbursed by the investment adviser or reductions from expense offset arrangements and do not represent the amount paid by the class during periods when reimbursements or reductions occur. Expenses net of fee waivers reflect expenses after reimbursement by the investment adviser but prior to reductions from expense offset arrangements. Expenses net of all reductions represent the net expenses paid by the class but do not include expenses of the investment companies in which the Fund invests. HAmount represents less than $.01 per share. ITotal distributions of $.27 per share is comprised of distributions from net investment income of $.252 and distributions from net realized gain of $.014 per share. |
See accompanying notes which are an integral part of the financial statements.
Semiannual Report
Financial Highlights - Service Class
| Six months ended
June 30, 2012 | Years ended December 31, |
| (Unaudited) | 2011 | 2010 | 2009 F |
Selected Per-Share Data | | | | |
Net asset value, beginning of period | $ 13.82 | $ 14.74 | $ 13.73 | $ 10.00 |
Income from Investment Operations | | | | |
Net investment income (loss) D | (.01) | .25 | .26 | .24 |
Net realized and unrealized gain (loss) | 1.10 | (.85) | 2.04 | 3.75 |
Total from investment operations | 1.09 | (.60) | 2.30 | 3.99 |
Distributions from net investment income | - | (.26) | (.26) | (.24) |
Distributions from net realized gain | - | (.06) | (1.03) | (.01) |
Total distributions | - | (.32) | (1.29) | (.26) H |
Net asset value, end of period | $ 14.91 | $ 13.82 | $ 14.74 | $ 13.73 |
Total Return B, C | 7.89% | (4.10)% | 16.97% | 39.85% |
Ratios to Average Net Assets E, G | | | | |
Expenses before reductions | .10% A | .10% | .10% | .10% A |
Expenses net of fee waivers, if any | .10% A | .10% | .10% | .10% A |
Expenses net of all reductions | .10% A | .10% | .10% | .10% A |
Net investment income (loss) | (.09)% A | 1.72% | 1.82% | 2.68% A |
Supplemental Data | | | | |
Net assets, end of period (000 omitted) | $ 97 | $ 90 | $ 116 | $ 140 |
Portfolio turnover rate | 39% A | 38% | 38% | 5% A |
AAnnualized BTotal returns for periods of less than one year are not annualized. CTotal returns do not reflect charges attributable to your insurance company's separate account. Inclusion of these charges would reduce the total returns shown. DCalculated based on average shares outstanding during the period. EAmounts do not include the activity of the Underlying Funds. FFor the period April 8, 2009 (commencement of operations) to December 31, 2009. GExpense ratios reflect operating expenses of the class. Expenses before reductions do not reflect amounts reimbursed by the investment adviser or reductions from expense offset arrangements and do not represent the amount paid by the class during periods when reimbursements or reductions occur. Expenses net of fee waivers reflect expenses after reimbursement by the investment adviser but prior to reductions from expense offset arrangements. Expenses net of all reductions represent the net expenses paid by the class but do not include expenses of the investment companies in which the Fund invests. HTotal distributions of $.26 per share is comprised of distributions from net investment income of $.243 and distributions from net realized gain of $.014 per share. |
Financial Highlights - Service Class 2
| Six months ended
June 30, 2012 | Years ended December 31, |
| (Unaudited) | 2011 | 2010 | 2009 F |
Selected Per-Share Data | | | | |
Net asset value, beginning of period | $ 13.80 | $ 14.72 | $ 13.73 | $ 10.00 |
Income from Investment Operations | | | | |
Net investment income (loss) D | (.02) | .23 | .24 | .23 |
Net realized and unrealized gain (loss) | 1.10 | (.85) | 2.03 | 3.74 |
Total from investment operations | 1.08 | (.62) | 2.27 | 3.97 |
Distributions from net investment income | - | (.24) | (.26) | (.23) |
Distributions from net realized gain | - | (.06) | (1.03) | (.01) |
Total distributions | - | (.30) | (1.28) I | (.24) H |
Net asset value, end of period | $ 14.88 | $ 13.80 | $ 14.72 | $ 13.73 |
Total Return B, C | 7.83% | (4.25)% | 16.76% | 39.72% |
Ratios to Average Net Assets E, G | | | | |
Expenses before reductions | .25% A | .25% | .25% | .25% A |
Expenses net of fee waivers, if any | .25% A | .25% | .25% | .25% A |
Expenses net of all reductions | .25% A | .25% | .25% | .25% A |
Net investment income (loss) | (.24)% A | 1.57% | 1.67% | 2.53% A |
Supplemental Data | | | | |
Net assets, end of period (000 omitted) | $ 287 | $ 276 | $ 211 | $ 143 |
Portfolio turnover rate | 39% A | 38% | 38% | 5% A |
AAnnualized BTotal returns for periods of less than one year are not annualized. CTotal returns do not reflect charges attributable to your insurance company's separate account. Inclusion of these charges would reduce the total returns shown. DCalculated based on average shares outstanding during the period. EAmounts do not include the activity of the Underlying Funds. FFor the period April 8, 2009 (commencement of operations) to December 31, 2009. GExpense ratios reflect operating expenses of the class. Expenses before reductions do not reflect amounts reimbursed by the investment adviser or reductions from expense offset arrangements and do not represent the amount paid by the class during periods when reimbursements or reductions occur. Expenses net of fee waivers reflect expenses after reimbursement by the investment adviser but prior to reductions from expense offset arrangements. Expenses net of all reductions represent the net expenses paid by the class but do not include expenses of the investment companies in which the Fund invests. HTotal distributions of $.24 per share is comprised of distributions from net investment income of $.230 and distributions from net realized gain of $.014 per share. ITotal distributions of $1.28 per share is comprised of distributions from net investment income of $.255 and distributions from net realized gain of $1.029 per share. |
See accompanying notes which are an integral part of the financial statements.
Semiannual Report
VIP Freedom 2040 Portfolio
Investment Changes (Unaudited)
Fund Holdings as of June 30, 2012 |
| % of fund's
net assets | % of fund's net assets
6 months ago |
Domestic Equity Funds | | |
VIP Contrafund Portfolio Initial Class | 10.5 | 9.7 |
VIP Equity-Income Portfolio Initial Class | 11.3 | 11.5 |
VIP Growth & Income Portfolio Initial Class | 12.6 | 11.6 |
VIP Growth Portfolio Initial Class | 10.7 | 11.2 |
VIP Mid Cap Portfolio Initial Class | 3.2 | 3.9 |
VIP Value Portfolio Initial Class | 8.4 | 10.0 |
VIP Value Strategies Portfolio Initial Class | 4.0 | 4.1 |
| 60.7 | 62.0 |
Developed International Equity Funds | | |
VIP Overseas Portfolio Initial Class | 17.2 | 16.5 |
Emerging Markets Equity Funds | | |
VIP Emerging Markets Portfolio Initial Class | 5.0 | 4.2 |
High Yield Bond Funds | | |
VIP High Income Portfolio Initial Class | 7.7 | 8.2 |
Investment Grade Bond Funds | | |
VIP Investment Grade Bond Portfolio Initial Class | 9.4 | 9.1 |
Net Other Assets (Liabilities)* | 0.0 | 0.0 |
| 100.0 | 100.0 |
* Amount represents less than 0.1% |
Asset Allocation (% of fund's net assets) |
Current |
| Domestic Equity Funds | 60.7% | |
| Developed International Equity Funds | 17.2% | |
| Emerging Markets Equity Funds | 5.0% | |
| High Yield Bond Funds | 7.7% | |
| Investment Grade Bond Funds | 9.4% | |

Six months ago |
| Domestic Equity Funds | 62.0% | |
| Developed International Equity Funds | 16.5% | |
| Emerging Markets Equity Funds | 4.2% | |
| High Yield Bond Funds | 8.2% | |
| Investment Grade Bond Funds | 9.1% | |

Expected |
| Domestic Equity Funds | 60.6% | |
| Developed International Equity Funds | 17.0% | |
| Emerging Markets Equity Funds | 5.1% | |
| High Yield Bond Funds | 7.6% | |
| Investment Grade Bond Funds | 9.7% | |

The fund invests according to an asset allocation strategy that becomes increasingly conservative over time. The six months ago allocation is based on the fund's holdings as of December 31, 2011. The current allocation is based on the fund's holdings as of June 30, 2012. The expected allocation represents the fund's anticipated allocation at December 31, 2012. |
Semiannual Report
VIP Freedom 2040 Portfolio
Investments June 30, 2012 (Unaudited)
Showing Percentage of Net Assets
Domestic Equity Funds - 60.7% |
| Shares | | Value |
Domestic Equity Funds - 60.7% |
VIP Contrafund Portfolio Initial Class | 24,840 | | $ 625,717 |
VIP Equity-Income Portfolio Initial Class | 34,063 | | 673,421 |
VIP Growth & Income Portfolio Initial Class | 54,503 | | 753,227 |
VIP Growth Portfolio Initial Class | 15,661 | | 638,968 |
VIP Mid Cap Portfolio Initial Class | 6,116 | | 190,095 |
VIP Value Portfolio Initial Class | 43,598 | | 503,992 |
VIP Value Strategies Portfolio Initial Class | 24,466 | | 240,986 |
TOTAL DOMESTIC EQUITY FUNDS (Cost $3,506,000) |
3,626,406
|
International Equity Funds - 22.2% |
| | | |
Developed International Equity Funds - 17.2% |
VIP Overseas Portfolio Initial Class | 70,415 | | 1,023,835 |
Emerging Markets Equity Funds - 5.0% |
VIP Emerging Markets Portfolio Initial Class | 38,223 | | 301,196 |
TOTAL INTERNATIONAL EQUITY FUNDS (Cost $1,415,592) |
1,325,031
|
Bond Funds - 17.1% |
| Shares | | Value |
High Yield Bond Funds - 7.7% |
VIP High Income Portfolio Initial Class | 79,923 | | $ 461,157 |
Investment Grade Bond Funds - 9.4% |
VIP Investment Grade Bond Portfolio Initial Class | 41,963 | | 558,527 |
TOTAL BOND FUNDS (Cost $986,926) |
1,019,684
|
TOTAL INVESTMENT PORTFOLIO - 100.0% (Cost $5,908,518) | | 5,971,121 |
NET OTHER ASSETS (LIABILITIES) - 0.0% | | (147) |
NET ASSETS - 100% | $ 5,970,974 |
Other Information |
All investments are categorized as Level 1 under the Fair Value Hierarchy. The inputs or methodology used for valuing securities may not be an indication of the risk associated with investing in those securities. For more information on valuation inputs, please refer to the Security Valuation section in the accompanying Notes to Financial Statements. |
See accompanying notes which are an integral part of the financial statements.
Semiannual Report
VIP Freedom 2040 Portfolio
Statement of Assets and Liabilities
| June 30, 2012 (Unaudited) |
| | |
Assets | | |
Investment in securities, at value (cost $5,908,518) - See accompanying schedule | | $ 5,971,121 |
Receivable for investments sold | | 132,322 |
Receivable for fund shares sold | | 3,203 |
Total assets | | 6,106,646 |
| | |
Liabilities | | |
Payable for investments purchased | $ 2,792 | |
Payable for fund shares redeemed | 132,523 | |
Distribution and service plan fees payable | 357 | |
Total liabilities | | 135,672 |
| | |
Net Assets | | $ 5,970,974 |
Net Assets consist of: | | |
Paid in capital | | $ 5,984,615 |
Accumulated net investment loss | | (1,347) |
Accumulated undistributed net realized gain (loss) on investments | | (74,897) |
Net unrealized appreciation (depreciation) on investments | | 62,603 |
Net Assets | | $ 5,970,974 |
Initial Class:
Net Asset Value, offering price and redemption price per share ($2,174,156 ÷ 153,125 shares) | | $ 14.20 |
| | |
Service Class:
Net Asset Value, offering price and redemption price per share ($3,473,199 ÷ 244,778 shares) | | $ 14.19 |
| | |
Service Class 2:
Net Asset Value, offering price and redemption price per share ($323,619 ÷ 22,833 shares) | | $ 14.17 |
Statement of Operations
Six months ended June 30, 2012 (Unaudited) |
| | |
Investment Income | | |
Income distributions from underlying funds | | $ 131 |
| | |
Expenses | | |
Distribution and service plan fees | $ 1,478 | |
Independent trustees' compensation | 7 | |
Total expenses before reductions | 1,485 | |
Expense reductions | (7) | 1,478 |
Net investment income (loss) | | (1,347) |
Realized and Unrealized Gain (Loss) Realized gain (loss) on sale of underlying fund shares | (62,239) | |
Capital gain distributions from underlying funds | 10,348 | |
Total net realized gain (loss) | | (51,891) |
Change in net unrealized appreciation (depreciation) on underlying funds | | 180,008 |
Net gain (loss) | | 128,117 |
Net increase (decrease) in net assets resulting from operations | | $ 126,770 |
See accompanying notes which are an integral part of the financial statements.
Semiannual Report
Statement of Changes in Net Assets
| Six months ended
June 30, 2012
(Unaudited) | Year ended
December 31,
2011 |
Increase (Decrease) in Net Assets | | |
Operations | | |
Net investment income (loss) | $ (1,347) | $ 55,627 |
Net realized gain (loss) | (51,891) | (15,399) |
Change in net unrealized appreciation (depreciation) | 180,008 | (265,954) |
Net increase (decrease) in net assets resulting from operations | 126,770 | (225,726) |
Distributions to shareholders from net investment income | - | (55,567) |
Distributions to shareholders from net realized gain | (2,141) | (4,556) |
Total distributions | (2,141) | (60,123) |
Share transactions - net increase (decrease) | 3,091,762 | 2,502,045 |
Total increase (decrease) in net assets | 3,216,391 | 2,216,196 |
| | |
Net Assets | | |
Beginning of period | 2,754,583 | 538,387 |
End of period (including accumulated net investment loss of $1,347 and undistributed net investment income of $0, respectively) | $ 5,970,974 | $ 2,754,583 |
Financial Highlights - Initial Class
| Six months ended
June 30, 2012 | Years ended December 31, |
| (Unaudited) | 2011 | 2010 | 2009 H |
Selected Per-Share Data | | | | |
Net asset value, beginning of period | $ 13.16 | $ 14.02 | $ 13.82 | $ 10.00 |
Income from Investment Operations | | | | |
Net investment income (loss) E | - J | .35 | .20 | .26 |
Net realized and unrealized gain (loss) | 1.05 | (.91) | 2.15 | 3.83 |
Total from investment operations | 1.05 | (.56) | 2.35 | 4.09 |
Distributions from net investment income | - | (.27) | (.28) | (.26) |
Distributions from net realized gain | (.01) | (.02) | (1.87) | (.01) |
Total distributions | (.01) | (.30) L | (2.15) | (.27) K |
Net asset value, end of period | $ 14.20 | $ 13.16 | $ 14.02 | $ 13.82 |
Total Return B, C, D | 7.98% | (4.02)% | 17.19% | 40.89% |
Ratios to Average Net Assets F, I | | | | |
Expenses before reductions G | .00% A | .00% | .00% | .00% A |
Expenses net of fee waivers, if any | .00% A | .00% | .00% | .00% A |
Expenses net of all reductions | .00% A | .00% | .00% | .00% A |
Net investment income (loss) | .01% A | 2.50% | 1.46% | 2.81% A |
Supplemental Data | | | | |
Net assets, end of period (000 omitted) | $ 2,174 | $ 1,559 | $ 278 | $ 145 |
Portfolio turnover rate | 65% A | 42% | 194% | 5% A |
AAnnualized BTotal returns for periods of less than one year are not annualized. CTotal returns do not reflect charges attributable to your insurance company's separate account. Inclusion of these charges would reduce the total returns shown. DTotal returns would have been lower if certain expenses had not been reduced during the applicable periods shown. ECalculated based on average shares outstanding during the period. FAmounts do not include the activity of the Underlying Funds. GAmount represents less than .01%. HFor the period April 8, 2009 (commencement of operations) to December 31, 2009. IExpense ratios reflect operating expenses of the class. Expenses before reductions do not reflect amounts reimbursed by the investment adviser or reductions from expense offset arrangements and do not represent the amount paid by the class during periods when reimbursements or reductions occur. Expenses net of fee waivers reflect expenses after reimbursement by the investment adviser but prior to reductions from expense offset arrangements. Expenses net of all reductions represent the net expenses paid by the class but do not include expenses of the investment companies in which the Fund invests. JAmount represents less than $.01 per share. KTotal distributions of $.27 per share is comprised of distributions from net investment income of $.257 and distributions from net realized gain of $.014 per share. LTotal distributions of $.30 per share is comprised of distributions from net investment income of $.274 and distributions from net realized gain of $.022 per share. |
See accompanying notes which are an integral part of the financial statements.
Semiannual Report
Financial Highlights - Service Class
| Six months ended
June 30, 2012 | Years ended December 31, |
| (Unaudited) | 2011 | 2010 | 2009 G |
Selected Per-Share Data | | | | |
Net asset value, beginning of period | $ 13.15 | $ 14.02 | $ 13.82 | $ 10.00 |
Income from Investment Operations | | | | |
Net investment income (loss) E | (.01) | .33 | .19 | .25 |
Net realized and unrealized gain (loss) | 1.06 | (.91) | 2.14 | 3.83 |
Total from investment operations | 1.05 | (.58) | 2.33 | 4.08 |
Distributions from net investment income | - | (.26) | (.26) | (.25) |
Distributions from net realized gain | (.01) | (.02) | (1.87) | (.01) |
Total distributions | (.01) | (.29) J | (2.13) | (.26) I |
Net asset value, end of period | $ 14.19 | $ 13.15 | $ 14.02 | $ 13.82 |
Total Return B, C, D | 7.99% | (4.17)% | 17.05% | 40.80% |
Ratios to Average Net Assets F, H | | | | |
Expenses before reductions | .10% A | .10% | .10% | .10% A |
Expenses net of fee waivers, if any | .10% A | .10% | .10% | .10% A |
Expenses net of all reductions | .10% A | .10% | .10% | .10% A |
Net investment income (loss) | (.09)% A | 2.41% | 1.36% | 2.71% A |
Supplemental Data | | | | |
Net assets, end of period (000 omitted) | $ 3,473 | $ 1,058 | $ 116 | $ 141 |
Portfolio turnover rate | 65% A | 42% | 194% | 5% A |
AAnnualized BTotal returns for periods of less than one year are not annualized. CTotal returns do not reflect charges attributable to your insurance company's separate account. Inclusion of these charges would reduce the total returns shown. DTotal returns would have been lower if certain expenses had not been reduced during the applicable periods shown. ECalculated based on average shares outstanding during the period. FAmounts do not include the activity of the Underlying Funds. GFor the period April 8, 2009 (commencement of operations) to December 31, 2009. HExpense ratios reflect operating expenses of the class. Expenses before reductions do not reflect amounts reimbursed by the investment adviser or reductions from expense offset arrangements and do not represent the amount paid by the class during periods when reimbursements or reductions occur. Expenses net of fee waivers reflect expenses after reimbursement by the investment adviser but prior to reductions from expense offset arrangements. Expenses net of all reductions represent the net expenses paid by the class but do not include expenses of the investment companies in which the Fund invests. ITotal distributions of $.26 per share is comprised of distributions from net investment income of $.248 and distributions from net realized gain of $.014 per share. JTotal distributions of $.29 per share is comprised of distributions from net investment income of $.264 and distributions from net realized gain of $.022 per share. |
Financial Highlights - Service Class 2
| Six months ended
June 30, 2012 | Years ended December 31, |
| (Unaudited) | 2011 | 2010 | 2009 G |
Selected Per-Share Data | | | | |
Net asset value, beginning of period | $ 13.15 | $ 14.02 | $ 13.82 | $ 10.00 |
Income from Investment Operations | | | | |
Net investment income (loss) E | (.02) | .32 | .17 | .23 |
Net realized and unrealized gain (loss) | 1.05 | (.92) | 2.14 | 3.84 |
Total from investment operations | 1.03 | (.60) | 2.31 | 4.07 |
Distributions from net investment income | - | (.24) | (.24) | (.23) |
Distributions from net realized gain | (.01) | (.02) | (1.87) | (.01) |
Total distributions | (.01) | (.27) J | (2.11) | (.25) I |
Net asset value, end of period | $ 14.17 | $ 13.15 | $ 14.02 | $ 13.82 |
Total Return B, C, D | 7.83% | (4.32)% | 16.92% | 40.66% |
Ratios to Average Net Assets F, H | | | | |
Expenses before reductions | .25% A | .25% | .25% | .25% A |
Expenses net of fee waivers, if any | .25% A | .25% | .25% | .25% A |
Expenses net of all reductions | .25% A | .25% | .25% | .25% A |
Net investment income (loss) | (.24)% A | 2.25% | 1.21% | 2.56% A |
Supplemental Data | | | | |
Net assets, end of period (000 omitted) | $ 324 | $ 137 | $ 144 | $ 141 |
Portfolio turnover rate | 65% A | 42% | 194% | 5% A |
AAnnualized BTotal returns for periods of less than one year are not annualized. CTotal returns do not reflect charges attributable to your insurance company's separate account. Inclusion of these charges would reduce the total returns shown. DTotal returns would have been lower if certain expenses had not been reduced during the applicable periods shown. ECalculated based on average shares outstanding during the period. FAmounts do not include the activity of the Underlying Funds. GFor the period April 8, 2009 (commencement of operations) to December 31, 2009. HExpense ratios reflect operating expenses of the class. Expenses before reductions do not reflect amounts reimbursed by the investment adviser or reductions from expense offset arrangements and do not represent the amount paid by the class during periods when reimbursements or reductions occur. Expenses net of fee waivers reflect expenses after reimbursement by the investment adviser but prior to reductions from expense offset arrangements. Expenses net of all reductions represent the net expenses paid by the class but do not include expenses of the investment companies in which the Fund invests. ITotal distributions of $.25 per share is comprised of distributions from net investment income of $.234 and distributions from net realized gain of $.014 per share. JTotal distributions of $.27 per share is comprised of distributions from net investment income of $.243 and distributions from net realized gain of $.022 per share. |
See accompanying notes which are an integral part of the financial statements.
Semiannual Report
VIP Freedom 2045 Portfolio
Investment Changes (Unaudited)
Fund Holdings as of June 30, 2012 |
| % of fund's
net assets | % of fund's net assets
6 months ago |
Domestic Equity Funds | | |
VIP Contrafund Portfolio Initial Class | 10.8 | 9.9 |
VIP Equity-Income Portfolio Initial Class | 11.6 | 11.8 |
VIP Growth & Income Portfolio Initial Class | 13.0 | 11.9 |
VIP Growth Portfolio Initial Class | 11.0 | 11.5 |
VIP Mid Cap Portfolio Initial Class | 3.2 | 4.0 |
VIP Value Portfolio Initial Class | 8.6 | 10.2 |
VIP Value Strategies Portfolio Initial Class | 4.1 | 4.1 |
| 62.3 | 63.4 |
Developed International Equity Funds | | |
VIP Overseas Portfolio Initial Class | 17.6 | 16.9 |
Emerging Markets Equity Funds | | |
VIP Emerging Markets Portfolio Initial Class | 5.2 | 4.4 |
High Yield Bond Funds | | |
VIP High Income Portfolio Initial Class | 9.8 | 10.2 |
Investment Grade Bond Funds | | |
VIP Investment Grade Bond Portfolio Initial Class | 5.1 | 5.1 |
Net Other Assets (Liabilities)* | 0.0 | 0.0 |
| 100.0 | 100.0 |
* Amount represents less than 0.1% |
Asset Allocation (% of fund's net assets) |
Current |
| Domestic Equity Funds | 62.3% | |
| Developed International Equity Funds | 17.6% | |
| Emerging Markets Equity Funds | 5.2% | |
| High Yield Bond Funds | 9.8% | |
| Investment Grade Bond Funds | 5.1% | |

Six months ago |
| Domestic Equity Funds | 63.4% | |
| Developed International Equity Funds | 16.9% | |
| Emerging Markets Equity Funds | 4.4% | |
| High Yield Bond Funds | 10.2% | |
| Investment Grade Bond Funds | 5.1% | |

Expected |
| Domestic Equity Funds | 62.2% | |
| Developed International Equity Funds | 17.4% | |
| Emerging Markets Equity Funds | 5.2% | |
| High Yield Bond Funds | 9.8% | |
| Investment Grade Bond Funds | 5.4% | |

The fund invests according to an asset allocation strategy that becomes increasingly conservative over time. The six months ago allocation is based on the fund's holdings as of December 31, 2011. The current allocation is based on the fund's holdings as of June 30, 2012. The expected allocation represents the fund's anticipated allocation at December 31, 2012. |
Semiannual Report
VIP Freedom 2045 Portfolio
Investments June 30, 2012 (Unaudited)
Showing Percentage of Net Assets
Domestic Equity Funds - 62.3% |
| Shares | | Value |
Domestic Equity Funds - 62.3% |
VIP Contrafund Portfolio Initial Class | 1,905 | | $ 47,993 |
VIP Equity-Income Portfolio Initial Class | 2,606 | | 51,515 |
VIP Growth & Income Portfolio Initial Class | 4,180 | | 57,770 |
VIP Growth Portfolio Initial Class | 1,199 | | 48,913 |
VIP Mid Cap Portfolio Initial Class | 467 | | 14,501 |
VIP Value Portfolio Initial Class | 3,326 | | 38,453 |
VIP Value Strategies Portfolio Initial Class | 1,874 | | 18,463 |
TOTAL DOMESTIC EQUITY FUNDS (Cost $180,037) |
277,608
|
International Equity Funds - 22.8% |
| | | |
Developed International Equity Funds - 17.6% |
VIP Overseas Portfolio Initial Class | 5,393 | | 78,410 |
Emerging Markets Equity Funds - 5.2% |
VIP Emerging Markets Portfolio Initial Class | 2,929 | | 23,084 |
TOTAL INTERNATIONAL EQUITY FUNDS (Cost $86,150) |
101,494
|
Bond Funds - 14.9% |
| Shares | | Value |
High Yield Bond Funds - 9.8% |
VIP High Income Portfolio Initial Class | 7,612 | | $ 43,919 |
Investment Grade Bond Funds - 5.1% |
VIP Investment Grade Bond Portfolio Initial Class | 1,705 | | 22,687 |
TOTAL BOND FUNDS (Cost $55,537) |
66,606
|
TOTAL INVESTMENT PORTFOLIO - 100.0% (Cost $321,724) | | 445,708 |
NET OTHER ASSETS (LIABILITIES) - 0.0% | | (54) |
NET ASSETS - 100% | $ 445,654 |
Other Information |
All investments are categorized as Level 1 under the Fair Value Hierarchy. The inputs or methodology used for valuing securities may not be an indication of the risk associated with investing in those securities. For more information on valuation inputs, please refer to the Security Valuation section in the accompanying Notes to Financial Statements. |
See accompanying notes which are an integral part of the financial statements.
Semiannual Report
VIP Freedom 2045 Portfolio
Statement of Assets and Liabilities
| June 30, 2012 (Unaudited) |
| | |
Assets | | |
Investment in securities, at value (cost $321,724) - See accompanying schedule | | $ 445,708 |
Receivable for investments sold | | 2 |
Receivable for fund shares sold | | 139 |
Total assets | | 445,849 |
| | |
Liabilities | | |
Payable for investments purchased | $ 84 | |
Payable for fund shares redeemed | 57 | |
Distribution and service plan fees payable | 54 | |
Total liabilities | | 195 |
| | |
Net Assets | | $ 445,654 |
Net Assets consist of: | | |
Paid in capital | | $ 320,537 |
Accumulated net investment loss | | (238) |
Accumulated undistributed net realized gain (loss) on investments | | 1,371 |
Net unrealized appreciation (depreciation) on investments | | 123,984 |
Net Assets | | $ 445,654 |
Initial Class:
Net Asset Value, offering price and redemption price per share ($114,098 ÷ 8,133 shares) | | $ 14.03 |
| | |
Service Class:
Net Asset Value, offering price and redemption price per share ($97,698 ÷ 6,966 shares) | | $ 14.02 |
| | |
Service Class 2:
Net Asset Value, offering price and redemption price per share ($233,858 ÷ 16,695 shares) | | $ 14.01 |
Statement of Operations
Six months ended June 30, 2012 (Unaudited) |
| | |
Investment Income | | |
Income distributions from underlying funds | | $ 19 |
| | |
Expenses | | |
Distribution and service plan fees | $ 257 | |
Total expenses | | 257 |
Net investment income (loss) | | (238) |
Realized and Unrealized Gain (Loss) Realized gain (loss) on sale of underlying fund shares | 958 | |
Capital gain distributions from underlying funds | 1,139 | |
Total net realized gain (loss) | | 2,097 |
Change in net unrealized appreciation (depreciation) on underlying funds | | 29,165 |
Net gain (loss) | | 31,262 |
Net increase (decrease) in net assets resulting from operations | | $ 31,024 |
See accompanying notes which are an integral part of the financial statements.
Semiannual Report
Fidelity VIP Freedom 2045 Portfolio
Financial Statements - continued
Statement of Changes in Net Assets
| Six months ended June 30, 2012
(Unaudited) | Year ended
December 31,
2011 |
Increase (Decrease) in Net Assets | | |
Operations | | |
Net investment income (loss) | $ (238) | $ 6,226 |
Net realized gain (loss) | 2,097 | 10,806 |
Change in net unrealized appreciation (depreciation) | 29,165 | (34,585) |
Net increase (decrease) in net assets resulting from operations | 31,024 | (17,553) |
Distributions to shareholders from net investment income | - | (6,231) |
Distributions to shareholders from net realized gain | (10,798) | (8,346) |
Total distributions | (10,798) | (14,577) |
Share transactions - net increase (decrease) | 97,479 | (3,769) |
Total increase (decrease) in net assets | 117,705 | (35,899) |
| | |
Net Assets | | |
Beginning of period | 327,949 | 363,848 |
End of period (including accumulated net investment loss of $238 and undistributed net investment income of $0, respectively) | $ 445,654 | $ 327,949 |
Financial Highlights - Initial Class
| Six months ended June 30, 2012 | Years ended December 31, |
| (Unaudited) | 2011 | 2010 | 2009 F |
Selected Per-Share Data | | | | |
Net asset value, beginning of period | $ 13.38 | $ 14.61 | $ 13.86 | $ 10.00 |
Income from Investment Operations | | | | |
Net investment income (loss) D | - H | .27 | .24 | .26 |
Net realized and unrealized gain (loss) | 1.09 | (.89) | 2.14 | 3.87 |
Total from investment operations | 1.09 | (.62) | 2.38 | 4.13 |
Distributions from net investment income | - | (.28) | (.29) | (.26) |
Distributions from net realized gain | (.44) | (.34) | (1.34) | (.01) |
Total distributions | (.44) | (.61) I | (1.63) | (.27) |
Net asset value, end of period | $ 14.03 | $ 13.38 | $ 14.61 | $ 13.86 |
Total Return B, C | 8.13% | (4.41)% | 17.37% | 41.28% |
Ratios to Average Net Assets E, G | | | | |
Expenses before reductions | .00% A | .00% | .00% | .00% A |
Expenses net of fee waivers, if any | .00% A | .00% | .00% | .00% A |
Expenses net of all reductions | .00% A | .00% | .00% | .00% A |
Net investment income (loss) | .01% A | 1.88% | 1.65% | 2.83% A |
Supplemental Data | | | | |
Net assets, end of period (000 omitted) | $ 114 | $ 95 | $ 121 | $ 145 |
Portfolio turnover rate | 24% A | 29% | 17% | 5% A |
A Annualized B Total returns for periods of less than one year are not annualized. C Total returns do not reflect charges attributable to your insurance company's separate account. Inclusion of these charges would reduce the total returns shown. D Calculated based on average shares outstanding during the period. E Amounts do not include the activity of the Underlying Funds. F For the period April 8, 2009 (commencement of operations) to December 31, 2009. G Expense ratios reflect operating expenses of the class. Expenses before reductions do not reflect amounts reimbursed by the investment adviser or reductions from expense offset arrangements and do not represent the amount paid by the class during periods when reimbursements or reductions occur. Expenses net of fee waivers reflect expenses after reimbursement by the investment adviser but prior to reductions from expense offset arrangements. Expenses net of all reductions represent the net expenses paid by the class but do not include expenses of the investment companies in which the Fund invests. H Amount represents less than $.01 per share. I Total distributions of $.61 per share is comprised of distributions from net investment income of $.279 and distributions from net realized gain of $.335 per share. |
See accompanying notes which are an integral part of the financial statements.
Semiannual Report
Financial Highlights - Service Class
| Six months ended June 30, 2012 | Years ended December 31, |
| (Unaudited) | 2011 | 2010 | 2009 F |
Selected Per-Share Data | | | | |
Net asset value, beginning of period | $ 13.38 | $ 14.61 | $ 13.86 | $ 10.00 |
Income from Investment Operations | | | | |
Net investment income (loss) D | (.01) | .26 | .22 | .25 |
Net realized and unrealized gain (loss) | 1.09 | (.89) | 2.14 | 3.87 |
Total from investment operations | 1.08 | (.63) | 2.36 | 4.12 |
Distributions from net investment income | - | (.26) | (.28) | (.25) |
Distributions from net realized gain | (.44) | (.34) | (1.34) | (.01) |
Total distributions | (.44) | (.60) | (1.61) H | (.26) |
Net asset value, end of period | $ 14.02 | $ 13.38 | $ 14.61 | $ 13.86 |
Total Return B, C | 8.05% | (4.52)% | 17.23% | 41.19% |
Ratios to Average Net Assets E, G | | | | |
Expenses before reductions | .10% A | .10% | .10% | .10% A |
Expenses net of fee waivers, if any | .10% A | .10% | .10% | .10% A |
Expenses net of all reductions | .10% A | .10% | .10% | .10% A |
Net investment income (loss) | (.09)% A | 1.78% | 1.55% | 2.73% A |
Supplemental Data | | | | |
Net assets, end of period (000 omitted) | $ 98 | $ 90 | $ 117 | $ 141 |
Portfolio turnover rate | 24% A | 29% | 17% | 5% A |
A Annualized B Total returns for periods of less than one year are not annualized. C Total returns do not reflect charges attributable to your insurance company's separate account. Inclusion of these charges would reduce the total returns shown. D Calculated based on average shares outstanding during the period. E Amounts do not include the activity of the Underlying Funds. F For the period April 8, 2009 (commencement of operations) to December 31, 2009. G Expense ratios reflect operating expenses of the class. Expenses before reductions do not reflect amounts reimbursed by the investment adviser or reductions from expense offset arrangements and do not represent the amount paid by the class during periods when reimbursements or reductions occur. Expenses net of fee waivers reflect expenses after reimbursement by the investment adviser but prior to reductions from expense offset arrangements. Expenses net of all reductions represent the net expenses paid by the class but do not include expenses of the investment companies in which the Fund invests. H Total distributions of $1.61 per share is comprised of distributions from net investment income of $.276 and distributions from net realized gain of $1.335 per share. |
Financial Highlights - Service Class 2
| Six months ended June 30, 2012 | Years ended December 31, |
| (Unaudited) | 2011 | 2010 | 2009 F |
Selected Per-Share Data | | | | |
Net asset value, beginning of period | $ 13.38 | $ 14.61 | $ 13.85 | $ 10.00 |
Income from Investment Operations | | | | |
Net investment income (loss) D | (.02) | .23 | .20 | .24 |
Net realized and unrealized gain (loss) | 1.09 | (.88) | 2.15 | 3.86 |
Total from investment operations | 1.07 | (.65) | 2.35 | 4.10 |
Distributions from net investment income | - | (.25) | (.25) | (.24) |
Distributions from net realized gain | (.44) | (.34) | (1.34) | (.01) |
Total distributions | (.44) | (.58) H | (1.59) | (.25) |
Net asset value, end of period | $ 14.01 | $ 13.38 | $ 14.61 | $ 13.85 |
Total Return B, C | 7.98% | (4.64)% | 17.15% | 40.96% |
Ratios to Average Net Assets E, G | | | | |
Expenses before reductions | .25% A | .25% | .25% | .25% A |
Expenses net of fee waivers, if any | .25% A | .25% | .25% | .25% A |
Expenses net of all reductions | .25% A | .25% | .25% | .25% A |
Net investment income (loss) | (.24)% A | 1.63% | 1.40% | 2.58% A |
Supplemental Data | | | | |
Net assets, end of period (000 omitted) | $ 234 | $ 143 | $ 126 | $ 141 |
Portfolio turnover rate | 24% A | 29% | 17% | 5% A |
A Annualized B Total returns for periods of less than one year are not annualized. C Total returns do not reflect charges attributable to your insurance company's separate account. Inclusion of these charges would reduce the total returns shown. D Calculated based on average shares outstanding during the period. E Amounts do not include the activity of the Underlying Funds. F For the period April 8, 2009 (commencement of operations) to December 31, 2009. G Expense ratios reflect operating expenses of the class. Expenses before reductions do not reflect amounts reimbursed by the investment adviser or reductions from expense offset arrangements and do not represent the amount paid by the class during periods when reimbursements or reductions occur. Expenses net of fee waivers reflect expenses after reimbursement by the investment adviser but prior to reductions from expense offset arrangements. Expenses net of all reductions represent the net expenses paid by the class but do not include expenses of the investment companies in which the Fund invests. H Total distributions of $.58 per share is comprised of distributions from net investment income of $.245 and distributions from net realized gain of $.335 per share. |
See accompanying notes which are an integral part of the financial statements.
Semiannual Report
VIP Freedom 2050 Portfolio
Investment Changes (Unaudited)
Fund Holdings as of June 30, 2012 |
| % of fund's
net assets | % of fund's net assets
6 months ago |
Domestic Equity Funds | | |
VIP Contrafund Portfolio Initial Class | 11.0 | 10.3 |
VIP Equity-Income Portfolio Initial Class | 11.8 | 12.2 |
VIP Growth & Income Portfolio Initial Class | 13.3 | 12.3 |
VIP Growth Portfolio Initial Class | 11.2 | 11.9 |
VIP Mid Cap Portfolio Initial Class | 3.3 | 4.1 |
VIP Value Portfolio Initial Class | 8.9 | 10.6 |
VIP Value Strategies Portfolio Initial Class | 4.2 | 4.3 |
| 63.7 | 65.7 |
Developed International Equity Funds | | |
VIP Overseas Portfolio Initial Class | 18.0 | 17.6 |
Emerging Markets Equity Funds | | |
VIP Emerging Markets Portfolio Initial Class | 5.3 | 4.5 |
High Yield Bond Funds | | |
VIP High Income Portfolio Initial Class | 10.0 | 10.3 |
Investment Grade Bond Funds | | |
VIP Investment Grade Bond Portfolio Initial Class | 3.0 | 1.9 |
Net Other Assets (Liabilities)* | 0.0 | 0.0 |
| 100.0 | 100.0 |
* Amount represents less than 0.1% |
Asset Allocation (% of fund's net assets) |
Current |
| Domestic Equity Funds | 63.7% | |
| Developed International Equity Funds | 18.0% | |
| Emerging Markets Equity Funds | 5.3% | |
| High Yield Bond Funds | 10.0% | |
| Investment Grade Bond Funds | 3.0% | |

Six months ago |
| Domestic Equity Funds | 65.7% | |
| Developed International Equity Funds | 17.6% | |
| Emerging Markets Equity Funds | 4.5% | |
| High Yield Bond Funds | 10.3% | |
| Investment Grade Bond Funds | 1.9% | |

Expected |
| Domestic Equity Funds | 63.1% | |
| Developed International Equity Funds | 17.7% | |
| Emerging Markets Equity Funds | 5.3% | |
| High Yield Bond Funds | 10.0% | |
| Investment Grade Bond Funds | 3.9% | |

The fund invests according to an asset allocation strategy that becomes increasingly conservative over time. The six months ago allocation is based on the fund's holdings as of December 31, 2011. The current allocation is based on the fund's holdings as of June 30, 2012. The expected allocation represents the fund's anticipated allocation at December 31, 2012. |
Semiannual Report
VIP Freedom 2050 Portfolio
Investments June 30, 2012 (Unaudited)
Showing Percentage of Net Assets
Domestic Equity Funds - 63.7% |
| Shares | | Value |
Domestic Equity Funds - 63.7% |
VIP Contrafund Portfolio Initial Class | 2,667 | | $ 67,172 |
VIP Equity-Income Portfolio Initial Class | 3,652 | | 72,202 |
VIP Growth & Income Portfolio Initial Class | 5,848 | | 80,817 |
VIP Growth Portfolio Initial Class | 1,679 | | 68,511 |
VIP Mid Cap Portfolio Initial Class | 657 | | 20,406 |
VIP Value Portfolio Initial Class | 4,673 | | 54,019 |
VIP Value Strategies Portfolio Initial Class | 2,627 | | 25,878 |
TOTAL DOMESTIC EQUITY FUNDS (Cost $281,657) |
389,005
|
International Equity Funds - 23.3% |
| | | |
Developed International Equity Funds - 18.0% |
VIP Overseas Portfolio Initial Class | 7,545 | | 109,710 |
Emerging Markets Equity Funds - 5.3% |
VIP Emerging Markets Portfolio Initial Class | 4,094 | | 32,263 |
TOTAL INTERNATIONAL EQUITY FUNDS (Cost $128,169) |
141,973
|
Bond Funds - 13.0% |
| Shares | | Value |
High Yield Bond Funds - 10.0% |
VIP High Income Portfolio Initial Class | 10,530 | | $ 60,758 |
Investment Grade Bond Funds - 3.0% |
VIP Investment Grade Bond Portfolio Initial Class | 1,389 | | 18,484 |
TOTAL BOND FUNDS (Cost $68,104) |
79,242
|
TOTAL INVESTMENT PORTFOLIO - 100.0% (Cost $477,930) | | 610,220 |
NET OTHER ASSETS (LIABILITIES) - 0.0% | | (48) |
NET ASSETS - 100% | $ 610,172 |
Other Information |
All investments are categorized as Level 1 under the Fair Value Hierarchy. The inputs or methodology used for valuing securities may not be an indication of the risk associated with investing in those securities. For more information on valuation inputs, please refer to the Security Valuation section in the accompanying Notes to Financial Statements. |
See accompanying notes which are an integral part of the financial statements.
Semiannual Report
VIP Freedom 2050 Portfolio
Statement of Assets and Liabilities
| June 30, 2012 (Unaudited) |
| | |
Assets | | |
Investment in securities, at value (cost $477,930) - See accompanying schedule | | $ 610,220 |
Receivable for fund shares sold | | 857 |
Total assets | | 611,077 |
| | |
Liabilities | | |
Payable for investments purchased | $ 751 | |
Payable for fund shares redeemed | 106 | |
Distribution and service plan fees payable | 48 | |
Total liabilities | | 905 |
| | |
Net Assets | | $ 610,172 |
Net Assets consist of: | | |
Paid in capital | | $ 483,243 |
Accumulated net investment loss | | (254) |
Accumulated undistributed net realized gain (loss) on investments | | (5,107) |
Net unrealized appreciation (depreciation) on investments | | 132,290 |
Net Assets | | $ 610,172 |
Initial Class:
Net Asset Value, offering price and redemption price per share ($307,889 ÷ 24,355 shares) | | $ 12.64 |
| | |
Service Class:
Net Asset Value, offering price and redemption price per share ($98,425 ÷ 7,787 shares) | | $ 12.64 |
| | |
Service Class 2:
Net Asset Value, offering price and redemption price per share ($203,858 ÷ 16,157 shares) | | $ 12.62 |
Statement of Operations
Six months ended June 30, 2012 (Unaudited) |
| | |
Investment Income | | |
Income distributions from underlying funds | | $ 30 |
| | |
Expenses | | |
Distribution and service plan fees | $ 284 | |
Total expenses | | 284 |
Net investment income (loss) | | (254) |
Realized and Unrealized Gain (Loss) Realized gain (loss) on sale of underlying fund shares | 609 | |
Capital gain distributions from underlying funds | 1,715 | |
Total net realized gain (loss) | | 2,324 |
Change in net unrealized appreciation (depreciation) on underlying funds | | 40,724 |
Net gain (loss) | | 43,048 |
Net increase (decrease) in net assets resulting from operations | | $ 42,794 |
See accompanying notes which are an integral part of the financial statements.
Semiannual Report
VIP Freedom 2050 Portfolio
Financial Statements - continued
Statement of Changes in Net Assets
| Six months ended
June 30, 2012
(Unaudited) | Year ended
December 31,
2011 |
Increase (Decrease) in Net Assets | | |
Operations | | |
Net investment income (loss) | $ (254) | $ 9,097 |
Net realized gain (loss) | 2,324 | 109,278 |
Change in net unrealized appreciation (depreciation) | 40,724 | (124,717) |
Net increase (decrease) in net assets resulting
from operations | 42,794 | (6,342) |
Distributions to shareholders from net investment income | - | (9,104) |
Distributions to shareholders from net realized gain | (69,963) | (51,618) |
Total distributions | (69,963) | (60,722) |
Share transactions - net increase (decrease) | 130,520 | (352,075) |
Total increase (decrease) in net assets | 103,351 | (419,139) |
| | |
Net Assets | | |
Beginning of period | 506,821 | 925,960 |
End of period (including accumulated net investment loss of $254 and undistributed net investment income of $0, respectively) | $ 610,172 | $ 506,821 |
Financial Highlights - Initial Class
| Six months ended
June 30, 2012 | Years ended December 31, |
| (Unaudited) | 2011 | 2010 | 2009 F |
Selected Per-Share Data | | | | |
Net asset value, beginning of period | $ 13.34 | $ 15.82 | $ 14.01 | $ 10.00 |
Income from Investment Operations | | | | |
Net investment income (loss) D | - H | .26 | .39 | .26 |
Net realized and unrealized gain (loss) | 1.10 | (1.03) | 2.06 | 4.01 |
Total from investment operations | 1.10 | (.77) | 2.45 | 4.27 |
Distributions from net investment income | - | (.28) | (.28) | (.25) |
Distributions from net realized gain | (1.80) | (1.43) | (.36) | (.01) |
Total distributions | (1.80) | (1.71) | (.64) | (.26) |
Net asset value, end of period | $ 12.64 | $ 13.34 | $ 15.82 | $ 14.01 |
Total Return B, C | 8.27% | (4.93)% | 17.58% | 42.70% |
Ratios to Average Net Assets E, G | | | | |
Expenses before reductions | .00% A | .00% | .00% | .00% A |
Expenses net of fee waivers, if any | .00% A | .00% | .00% | .00% A |
Expenses net of all reductions | .00% A | .00% | .00% | .00% A |
Net investment income (loss) | .01% A | 1.67% | 2.64% | 2.76% A |
Supplemental Data | | | | |
Net assets, end of period (000 omitted) | $ 308 | $ 253 | $ 666 | $ 159 |
Portfolio turnover rate | 35% A | 92% | 50% | 4% A |
AAnnualized BTotal returns for periods of less than one year are not annualized. CTotal returns do not reflect charges attributable to your insurance company's separate account. Inclusion of these charges would reduce the total returns shown. DCalculated based on average shares outstanding during the period. EAmounts do not include the activity of the Underlying Funds. FFor the period April 8, 2009 (commencement of operations) to December 31, 2009. GExpense ratios reflect operating expenses of the class. Expenses before reductions do not reflect amounts reimbursed by the investment adviser or reductions from expense offset arrangements and do not represent the amount paid by the class during periods when reimbursements or reductions occur. Expenses net of fee waivers reflect expenses after reimbursement by the investment adviser but prior to reductions from expense offset arrangements. Expenses net of all reductions represent the net expenses paid by the class but do not include expenses of the investment companies in which the Fund invests. HAmount represents less than $.01 per share. |
See accompanying notes which are an integral part of the financial statements.
Semiannual Report
Financial Highlights - Service Class
| Six months ended
June 30, 2012 | Years ended December 31, |
| (Unaudited) | 2011 | 2010 | 2009 F |
Selected Per-Share Data | | | | |
Net asset value, beginning of period | $ 13.34 | $ 15.82 | $ 14.00 | $ 10.00 |
Income from Investment Operations | | | | |
Net investment income (loss) D | (.01) | .25 | .37 | .25 |
Net realized and unrealized gain (loss) | 1.11 | (1.04) | 2.07 | 4.00 |
Total from investment operations | 1.10 | (.79) | 2.44 | 4.25 |
Distributions from net investment income | - | (.26) | (.26) | (.24) |
Distributions from net realized gain | (1.80) | (1.43) | (.36) | (.01) |
Total distributions | (1.80) | (1.69) | (.62) | (.25) |
Net asset value, end of period | $ 12.64 | $ 13.34 | $ 15.82 | $ 14.00 |
Total Return B, C | 8.27% | (5.06)% | 17.53% | 42.51% |
Ratios to Average Net Assets E, G | | | | |
Expenses before reductions | .10% A | .10% | .10% | .10% A |
Expenses net of fee waivers, if any | .10% A | .10% | .10% | .10% A |
Expenses net of all reductions | .10% A | .10% | .10% | .10% A |
Net investment income (loss) | (.09)% A | 1.57% | 2.54% | 2.66% A |
Supplemental Data | | | | |
Net assets, end of period (000 omitted) | $ 98 | $ 91 | $ 118 | $ 143 |
Portfolio turnover rate | 35% A | 92% | 50% | 4% A |
AAnnualized BTotal returns for periods of less than one year are not annualized. CTotal returns do not reflect charges attributable to your insurance company's separate account. Inclusion of these charges would reduce the total returns shown. DCalculated based on average shares outstanding during the period. EAmounts do not include the activity of the Underlying Funds. FFor the period April 8, 2009 (commencement of operations) to December 31, 2009. GExpense ratios reflect operating expenses of the class. Expenses before reductions do not reflect amounts reimbursed by the investment adviser or reductions from expense offset arrangements and do not represent the amount paid by the class during periods when reimbursements or reductions occur. Expenses net of fee waivers reflect expenses after reimbursement by the investment adviser but prior to reductions from expense offset arrangements. Expenses net of all reductions represent the net expenses paid by the class but do not include expenses of the investment companies in which the Fund invests. |
Financial Highlights - Service Class 2
| Six months ended
June 30, 2012 | Years ended December 31, |
| (Unaudited) | 2011 | 2010 | 2009 F |
Selected Per-Share Data | | | | |
Net asset value, beginning of period | $ 13.33 | $ 15.81 | $ 14.00 | $ 10.00 |
Income from Investment Operations | | | | |
Net investment income (loss) D | (.02) | .22 | .35 | .23 |
Net realized and unrealized gain (loss) | 1.11 | (1.02) | 2.06 | 4.01 |
Total from investment operations | 1.09 | (.80) | 2.41 | 4.24 |
Distributions from net investment income | - | (.25) | (.24) | (.23) |
Distributions from net realized gain | (1.80) | (1.43) | (.36) | (.01) |
Total distributions | (1.80) | (1.68) | (.60) | (.24) |
Net asset value, end of period | $ 12.62 | $ 13.33 | $ 15.81 | $ 14.00 |
Total Return B, C | 8.20% | (5.16)% | 17.30% | 42.37% |
Ratios to Average Net Assets E, G | | | | |
Expenses before reductions | .25% A | .25% | .25% | .25% A |
Expenses net of fee waivers, if any | .25% A | .25% | .25% | .25% A |
Expenses net of all reductions | .25% A | .25% | .25% | .25% A |
Net investment income (loss) | (.24)% A | 1.42% | 2.39% | 2.51% A |
Supplemental Data | | | | |
Net assets, end of period (000 omitted) | $ 204 | $ 163 | $ 142 | $ 147 |
Portfolio turnover rate | 35% A | 92% | 50% | 4% A |
AAnnualized BTotal returns for periods of less than one year are not annualized. CTotal returns do not reflect charges attributable to your insurance company's separate account. Inclusion of these charges would reduce the total returns shown. DCalculated based on average shares outstanding during the period. EAmounts do not include the activity of the Underlying Funds. FFor the period April 8, 2009 (commencement of operations) to December 31, 2009. GExpense ratios reflect operating expenses of the class. Expenses before reductions do not reflect amounts reimbursed by the investment adviser or reductions from expense offset arrangements and do not represent the amount paid by the class during periods when reimbursements or reductions occur. Expenses net of fee waivers reflect expenses after reimbursement by the investment adviser but prior to reductions from expense offset arrangements. Expenses net of all reductions represent the net expenses paid by the class but do not include expenses of the investment companies in which the Fund invests. |
See accompanying notes which are an integral part of the financial statements.
Semiannual Report
Notes to Financial Statements
For the period ended June 30, 2012 (Unaudited)
1. Organization.
VIP Freedom Income PortfolioSM, VIP Freedom 2005 PortfolioSM, VIP Freedom 2010 PortfolioSM, VIP Freedom 2015 PortfolioSM, VIP Freedom 2020 PortfolioSM, VIP Freedom 2025 PortfolioSM, VIP Freedom 2030 PortfolioSM, VIP Freedom 2035 PortfolioSM, VIP Freedom 2040 PortfolioSM, VIP Freedom 2045 PortfolioSM and VIP Freedom 2050 PortfolioSM (the Funds) are funds of Variable Insurance Products Fund V. Variable Insurance Products Fund V (the Trust) (referred to in this report as Fidelity Variable Insurance Products) is registered under the Investment Company Act of 1940, as amended (the 1940 Act), as an open-end management investment company organized as a Massachusetts business trust. Each Fund is authorized to issue an unlimited number of shares. The Funds invest primarily in a combination of other VIP equity, bond, and short-term funds (the Underlying Funds) managed by Fidelity Management & Research Company (FMR). Shares of each Fund may only be purchased by insurance companies for the purpose of funding variable annuity or variable life insurance contracts. Each Fund offers three classes of shares: Initial Class shares, Service Class shares and Service Class 2 shares. All classes have equal rights and voting privileges, except for matters affecting a single class. Investment income, realized and unrealized capital gains and losses, the common expenses of each Fund, and certain fund-level expense reductions, if any, are allocated on a pro-rata basis to each class based on the relative net assets of each class to the total net assets of each Fund. Each class differs with respect to distribution and service plan fees incurred. Certain expense reductions may also differ by class.
2. Significant Accounting Policies.
The financial statements have been prepared in conformity with accounting principles generally accepted in the United States of America (GAAP), which require management to make certain estimates and assumptions at the date of the financial statements. Actual results could differ from those estimates. Subsequent events, if any, through the date that the financial statements were issued have been evaluated in the preparation of the financial statements. The following summarizes the significant accounting policies of the Funds:
Security Valuation. Investments are valued as of 4:00 p.m. Eastern time on the last calendar day of the period. Each Fund categorizes the inputs to valuation techniques used to value their investments into a disclosure hierarchy consisting of three levels as shown below:
Level 1 - quoted prices in active markets for identical investments
Level 2 - other significant observable inputs (including quoted prices for similar investments, interest rates, prepayment speeds, etc.)
Level 3 - unobservable inputs (including the Fund's own assumptions based on the best information available)
Valuation techniques used to value each Fund's investments by major category are as follows. Investments in the Underlying Funds are valued at their closing net asset value (NAV) each business day and are categorized as Level 1 in the hierarchy.
Investment Transactions and Income. For financial reporting purposes, the Funds' investment holdings and NAV include trades executed through the end of the last business day of the period. The NAV per share for processing shareholder transactions is calculated as of the close of business of the New York Stock Exchange (NYSE), normally 4:00 p.m. Eastern time and includes trades executed through the end of the prior business day. Gains and losses on securities sold are determined on the basis of identified cost. Income and capital gain distributions from the Underlying Funds, if any, are recorded on the ex-dividend date.
Expenses. Expenses directly attributable to a fund are charged to that fund. Expenses attributable to more than one fund are allocated among the respective funds on the basis of relative net assets or other appropriate methods. Expenses included in the accompanying financial statements reflect the expenses of each Fund and do not include any expenses associated with the Underlying Funds. Expense estimates are accrued in the period to which they relate and adjustments are made when actual amounts are known.
Income Tax Information and Distributions to Shareholders. Each year, each Fund intends to qualify as a regulated investment company under Subchapter M of the Internal Revenue Code, including distributing substantially all of its taxable income and realized gains. As a result, no provision for income taxes is required. Each Fund files a U.S. federal tax return, in addition to state and local tax returns as required. A fund's federal income tax returns are subject to examination by the Internal Revenue Service (IRS) for a period of three fiscal years after they are filed. State and local tax returns may be subject to examination for an additional fiscal year depending on the jurisdiction.
Distributions are declared and recorded on the ex-dividend date. Income dividends and capital gain distributions are declared separately for each class. Income and capital gain distributions are determined in accordance with income tax regulations, which may differ from GAAP.
Capital accounts within the financial statements are adjusted for permanent book-tax differences. These adjustments have no impact on net assets or the results of operations. Temporary book-tax differences will reverse in a subsequent period.
Book-tax differences are primarily due to the short-term gain distributions from the Underlying Funds, capital loss carryforwards and losses deferred due to wash sales and excise tax regulations.
Semiannual Report
2. Significant Accounting Policies - continued
Income Tax Information and Distributions to Shareholders - continued
The federal tax cost of investment securities and unrealized appreciation (depreciation) as of period end were as follows for each Fund:
| Tax cost | Gross unrealized
appreciation | Gross unrealized
depreciation | Net unrealized
appreciation
(depreciation) on
securities and
other investments |
VIP Freedom Income | $ 21,914,521 | $ 643,963 | $ (465,432) | $ 178,531 |
VIP Freedom 2005 | 6,215,500 | 165,508 | (464,188) | (298,680) |
VIP Freedom 2010 | 198,563,062 | 9,291,915 | (12,454,263) | (3,162,348) |
VIP Freedom 2015 | 98,627,581 | 7,855,878 | (6,815,931) | 1,039,947 |
VIP Freedom 2020 | 570,742,356 | 39,969,402 | (29,984,708) | 9,984,694 |
VIP Freedom 2025 | 56,319,369 | 3,720,423 | (3,468,067) | 252,356 |
VIP Freedom 2030 | 147,016,437 | 8,919,882 | (11,286,571) | (2,366,689) |
VIP Freedom 2035 | 360,709 | 144,506 | (4,444) | 140,062 |
VIP Freedom 2040 | 5,982,206 | 225,389 | (236,474) | (11,085) |
VIP Freedom 2045 | 322,214 | 125,047 | (1,553) | 123,494 |
VIP Freedom 2050 | 481,559 | 134,746 | (6,085) | 128,661 |
Capital loss carryforwards are only available to offset future capital gains of the Funds to the extent provided by regulations and may be limited. Under the Regulated Investment Company Modernization Act of 2010 (the Act), the Funds are permitted to carry forward capital losses incurred in taxable years beginning after December 22, 2010 for an unlimited period and such capital losses are required to be used prior to any losses that expire. At December 31, 2011, capital loss carryforwards were as follows:
| Fiscal year
of expiration | |
| 2018 | Total with
expiration |
VIP Freedom 2005 | $ (86,373) | $ (86,373) |
| No expiration | |
| Short-term | Long-term | Total no
expiration | Total capital loss
carryfoward |
VIP Freedom 2005 | $ (20,603) | $ (44,851) | $ (65,454) | $ (151,827) |
VIP Freedom 2035 | (2,237) | - | (2,237) | (2,237) |
3. Purchases and Sales of Investments.
Purchases and redemptions of the Underlying Fund shares are noted in the table below.
| Purchases ($) | Redemptions ($) |
VIP Freedom Income | 5,615,100 | 5,315,989 |
VIP Freedom 2005 | 1,396,183 | 1,267,648 |
VIP Freedom 2010 | 28,421,868 | 22,479,748 |
VIP Freedom 2015 | 14,639,446 | 22,510,904 |
VIP Freedom 2020 | 86,307,954 | 48,508,189 |
VIP Freedom 2025 | 14,893,926 | 10,370,795 |
VIP Freedom 2030 | 31,319,791 | 14,182,333 |
VIP Freedom 2035 | 104,201 | 99,988 |
VIP Freedom 2040 | 4,559,480 | 1,460,834 |
VIP Freedom 2045 | 132,093 | 44,482 |
VIP Freedom 2050 | 161,311 | 99,272 |
4. Fees and Other Transactions with Affiliates.
Management Fee. Strategic Advisers, Inc. (Strategic Advisers), an affiliate of FMR, provides the Funds with investment management related services. The Funds do not pay any fees for these services.
Semiannual Report
Notes to Financial Statements (Unaudited) - continued
4. Fees and Other Transactions with Affiliates - continued
Other Transactions. Strategic Advisers has entered into an administration agreement with FMR under which FMR provides management and administrative services (other than investment advisory services) necessary for the operation of each Fund. Pursuant to this agreement, FMR pays all expenses of each Fund, excluding the distribution and service fees, the compensation of the independent Trustees and certain other expenses such as interest expense. FMR also contracts with other Fidelity companies to perform the services necessary for the operation of each Fund. The Funds do not pay any fees for these services.
Distribution and Service Plan Fees. In accordance with Rule 12b-1 of the 1940 Act, the Funds have adopted separate 12b-1 Plans for each Service Class of shares. Each Service Class pays Fidelity Distributors Corporation (FDC), an affiliate of FMR, a service fee. For the period, the service fee is based on an annual rate of .10% of Service Class' average net assets and .25% of Service Class 2's average net assets.
For the period, total fees, all of which were reallowed to insurance companies for the distribution of shares and providing shareholder support services were as follows:
| Service
Class | Service
Class 2 | Total |
VIP Freedom Income | $ 1,048 | $ 8,649 | $ 9,697 |
VIP Freedom 2005 | 64 | 214 | 278 |
VIP Freedom 2010 | 11,055 | 180,589 | 191,644 |
VIP Freedom 2015 | 3,254 | 72,059 | 75,313 |
VIP Freedom 2020 | 20,006 | 583,718 | 603,724 |
VIP Freedom 2025 | 3,744 | 39,369 | 43,113 |
VIP Freedom 2030 | 15,262 | 86,042 | 101,304 |
VIP Freedom 2035 | 47 | 399 | 446 |
VIP Freedom 2040 | 1,222 | 256 | 1,478 |
VIP Freedom 2045 | 47 | 210 | 257 |
VIP Freedom 2050 | 47 | 237 | 284 |
5. Expense Reductions.
FMR voluntarily agreed to reimburse funds to the extent annual operating expenses exceeded certain levels of average net assets as noted in the table below. Some expenses, for example interest expense, are excluded from this reimbursement.
The following classes of each applicable Fund were in reimbursement during the period:
| Expense
Limitations | Reimbursement
from adviser |
| | |
VIP Freedom Income | | |
Initial Class | -% | $ 20 |
Service Class | .10% | 4 |
Service Class 2 | .25% | 12 |
VIP Freedom 2005 | | |
Initial Class | -% | 9 |
Service Class | .10% | 1 |
Service Class 2 | .25% | - |
VIP Freedom 2010 | | |
Initial Class | -% | 40 |
Service Class | .10% | 38 |
Service Class 2 | .25% | 247 |
VIP Freedom 2015 | | |
Initial Class | -% | 65 |
Service Class | .10% | 11 |
Service Class 2 | .25% | 101 |
VIP Freedom 2020 | | |
Initial Class | -% | 92 |
Service Class | .10% | 68 |
Service Class 2 | .25% | 794 |
Semiannual Report
5. Expense Reductions - continued
| Expense
Limitations | Reimbursement
from adviser |
VIP Freedom 2025 | | |
Initial Class | -% | $ 28 |
Service Class | .10% | 13 |
Service Class 2 | .25% | 52 |
VIP Freedom 2030 | | |
Initial Class | -% | 60 |
Service Class | .10% | 51 |
Service Class 2 | .25% | 116 |
VIP Freedom 2040 | | |
Initial Class | -% | 3 |
Service Class | .10% | 4 |
Service Class 2 | .25% | - |
6. Distributions to Shareholders.
Distributions to shareholders of each class were as follows:
| Six months ended
June 30,
2012 | Year ended
December 31,
2011 |
VIP Freedom Income | | |
From net investment income | | |
Initial Class | $ - | $ 195,722 |
Service Class | - | 37,230 |
Service Class 2 | - | 124,660 |
Total | $ - | $ 357,612 |
From net realized gain | | |
Initial Class | $ 69,010 | $ 40,602 |
Service Class | 12,458 | 8,022 |
Service Class 2 | 40,270 | 29,827 |
Total | $ 121,738 | $ 78,451 |
VIP Freedom 2005 | | |
From net investment income | | |
Initial Class | $ - | $ 98,956 |
Service Class | - | 2,218 |
Service Class 2 | - | 27,730 |
Total | $ - | $ 128,904 |
From net realized gain | | |
Initial Class | $ - | $ 19,170 |
Service Class | - | 458 |
Service Class 2 | - | 5,576 |
Total | $ - | $ 25,204 |
VIP Freedom 2010 | | |
From net investment income | | |
Initial Class | $ - | $ 476,833 |
Service Class | - | 427,907 |
Service Class 2 | - | 2,596,925 |
Total | $ - | $ 3,501,665 |
From net realized gain | | |
Initial Class | $ 113,389 | $ 116,725 |
Service Class | 112,975 | 108,547 |
Service Class 2 | 748,609 | 704,729 |
Total | $ 974,973 | $ 930,001 |
Semiannual Report
Notes to Financial Statements (Unaudited) - continued
6. Distributions to Shareholders - continued
| Six months ended
June 30,
2012 | Year ended
December 31,
2011 |
VIP Freedom 2015 | | |
From net investment income | | |
Initial Class | $ - | $ 826,838 |
Service Class | - | 171,855 |
Service Class 2 | - | 1,045,079 |
Total | $ - | $ 2,043,772 |
From net realized gain | | |
Initial Class | $ 242,186 | $ 200,335 |
Service Class | 45,468 | 42,769 |
Service Class 2 | 368,362 | 287,397 |
Total | $ 656,016 | $ 530,501 |
VIP Freedom 2020 | | |
From net investment income | | |
Initial Class | $ - | $ 1,049,292 |
Service Class | - | 778,227 |
Service Class 2 | - | 8,558,653 |
Total | $ - | $ 10,386,172 |
From net realized gain | | |
Initial Class | $ 197,358 | $ 181,696 |
Service Class | 147,918 | 140,856 |
Service Class 2 | 1,748,409 | 1,638,020 |
Total | $ 2,093,685 | $ 1,960,572 |
VIP Freedom 2025 | | |
From net investment income | | |
Initial Class | $ - | $ 332,511 |
Service Class | - | 150,864 |
Service Class 2 | - | 486,789 |
Total | $ - | $ 970,164 |
From net realized gain | | |
Initial Class | $ 57,378 | $ 50,800 |
Service Class | 26,744 | 23,707 |
Service Class 2 | 106,456 | 83,667 |
Total | $ 190,578 | $ 158,174 |
VIP Freedom 2030 | | |
From net investment income | | |
Initial Class | $ - | $ 662,495 |
Service Class | - | 589,888 |
Service Class 2 | - | 1,163,344 |
Total | $ - | $ 2,415,727 |
From net realized gain | | |
Initial Class | $ 90,994 | $ 92,441 |
Service Class | 83,995 | 86,325 |
Service Class 2 | 178,253 | 181,772 |
Total | $ 353,242 | $ 360,538 |
VIP Freedom 2035 | | |
From net investment income | | |
Initial Class | $ - | $ 1,899 |
Service Class | - | 1,654 |
Service Class 2 | - | 4,689 |
Total | $ - | $ 8,242 |
From net realized gain | | |
Initial Class | $ - | $ 445 |
Service Class | - | 420 |
Service Class 2 | - | 1,182 |
Total | $ - | $ 2,047 |
Semiannual Report
6. Distributions to Shareholders - continued
| Six months ended
June 30,
2012 | Year ended
December 31,
2011 |
VIP Freedom 2040 | | |
From net investment income | | |
Initial Class | $ - | $ 31,680 |
Service Class | - | 20,912 |
Service Class 2 | - | 2,975 |
Total | $ - | $ 55,567 |
From net realized gain | | |
Initial Class | $ 1,228 | $ 2,544 |
Service Class | 805 | 1,743 |
Service Class 2 | 108 | 269 |
Total | $ 2,141 | $ 4,556 |
VIP Freedom 2045 | | |
From net investment income | | |
Initial Class | $ - | $ 1,932 |
Service Class | - | 1,740 |
Service Class 2 | - | 2,559 |
Total | $ - | $ 6,231 |
From net realized gain | | |
Initial Class | $ 3,097 | $ 2,739 |
Service Class | 2,952 | 2,654 |
Service Class 2 | 4,749 | 2,953 |
Total | $ 10,798 | $ 8,346 |
VIP Freedom 2050 | | |
From net investment income | | |
Initial Class | $ - | $ 4,684 |
Service Class | - | 1,588 |
Service Class 2 | - | 2,832 |
Total | $ - | $ 9,104 |
From net realized gain | | |
Initial Class | $ 34,980 | $ 26,549 |
Service Class | 12,273 | 8,828 |
Service Class 2 | 22,710 | 16,241 |
Total | $ 69,963 | $ 51,618 |
7. Share Transactions.
Transactions for each class of shares were as follows:
| Shares | Dollars |
| Six months ended
June 30,
2012 | Year ended
December 31,
2011 | Six months ended
June 30,
2012 | Year ended
December 31,
2011 |
VIP Freedom Income | | | | |
Initial Class | | | | |
Shares sold | 286,468 | 543,622 | $ 2,983,469 | $ 5,666,542 |
Reinvestment of distributions | 6,642 | 23,169 | 69,010 | 236,324 |
Shares redeemed | (150,694) | (582,469) | (1,572,339) | (6,065,963) |
Net increase (decrease) | 142,416 | (15,678) | $ 1,480,140 | $ (163,097) |
Service Class | | | | |
Shares sold | 45,250 | 316,591 | $ 472,609 | $ 3,328,350 |
Reinvestment of distributions | 1,199 | 4,432 | 12,458 | 45,252 |
Shares redeemed | (77,795) | (92,529) | (809,400) | (964,609) |
Net increase (decrease) | (31,346) | 228,494 | $ (324,333) | $ 2,408,993 |
Service Class 2 | | | | |
Shares sold | 165,971 | 402,000 | $ 1,724,388 | $ 4,158,851 |
Reinvestment of distributions | 3,891 | 15,190 | 40,270 | 154,487 |
Shares redeemed | (248,400) | (371,665) | (2,560,519) | (3,842,928) |
Net increase (decrease) | (78,538) | 45,525 | $ (795,861) | $ 470,410 |
Semiannual Report
Notes to Financial Statements (Unaudited) - continued
7. Share Transactions - continued
| Shares | Dollars |
| Six months ended
June 30,
2012 | Year ended
December 31,
2011 | Six months ended
June 30,
2012 | Year ended
December 31,
2011 |
VIP Freedom 2005 | | | | |
Initial Class | | | | |
Shares sold | 92,959 | 127,726 | $ 961,429 | $ 1,305,070 |
Reinvestment of distributions | - | 11,980 | - | 118,126 |
Shares redeemed | (80,880) | (178,877) | (829,717) | (1,815,207) |
Net increase (decrease) | 12,079 | (39,171) | $ 131,712 | $ (392,011) |
Service Class | | | | |
Shares sold | 3,052 | 7,624 | $ 30,356 | $ 77,113 |
Reinvestment of distributions | - | 271 | - | 2,676 |
Shares redeemed | (475) | (16,002) | (4,884) | (161,474) |
Net increase (decrease) | 2,577 | (8,107) | $ 25,472 | $ (81,685) |
Service Class 2 | | | | |
Shares sold | 3,078 | 142,912 | $ 31,585 | $ 1,423,341 |
Reinvestment of distributions | - | 3,381 | - | 33,306 |
Shares redeemed | (8,074) | (138,887) | (80,847) | (1,369,739) |
Net increase (decrease) | (4,996) | 7,406 | $ (49,262) | $ 86,908 |
VIP Freedom 2010 | | | | |
Initial Class | | | | |
Shares sold | 427,134 | 464,447 | $ 4,624,080 | $ 4,963,243 |
Reinvestment of distributions | 10,548 | 57,516 | 113,389 | 593,558 |
Shares redeemed | (333,917) | (482,640) | (3,592,680) | (5,181,548) |
Net increase (decrease) | 103,765 | 39,323 | $ 1,144,789 | $ 375,253 |
Service Class | | | | |
Shares sold | 259,583 | 588,287 | $ 2,817,041 | $ 6,354,925 |
Reinvestment of distributions | 10,519 | 52,037 | 112,975 | 536,454 |
Shares redeemed | (335,917) | (425,148) | (3,601,471) | (4,547,355) |
Net increase (decrease) | (65,815) | 215,176 | $ (671,455) | $ 2,344,024 |
Service Class 2 | | | | |
Shares sold | 1,251,416 | 3,362,539 | $ 13,370,460 | $ 35,801,452 |
Reinvestment of distributions | 69,963 | 321,514 | 748,609 | 3,301,654 |
Shares redeemed | (769,126) | (1,562,905) | (8,224,078) | (16,621,602) |
Net increase (decrease) | 552,253 | 2,121,148 | $ 5,894,991 | $ 22,481,504 |
VIP Freedom 2015 | | | | |
Initial Class | | | | |
Shares sold | 313,430 | 850,771 | $ 3,426,537 | $ 9,246,584 |
Reinvestment of distributions | 22,363 | 98,957 | 242,186 | 1,027,173 |
Shares redeemed | (711,573) | (901,866) | (7,719,659) | (9,801,615) |
Net increase (decrease) | (375,780) | 47,862 | $ (4,050,936) | $ 472,142 |
Service Class | | | | |
Shares sold | 253,195 | 717,209 | $ 2,766,251 | $ 7,691,501 |
Reinvestment of distributions | 4,202 | 20,697 | 45,468 | 214,624 |
Shares redeemed | (514,220) | (246,215) | (5,621,855) | (2,641,295) |
Net increase (decrease) | (256,823) | 491,691 | $ (2,810,136) | $ 5,264,830 |
Service Class 2 | | | | |
Shares sold | 455,420 | 1,160,410 | $ 4,912,034 | $ 12,483,558 |
Reinvestment of distributions | 34,139 | 128,866 | 368,362 | 1,332,475 |
Shares redeemed | (550,324) | (1,214,512) | (5,956,397) | (13,110,493) |
Net increase (decrease) | (60,765) | 74,764 | $ (676,001) | $ 705,540 |
Semiannual Report
7. Share Transactions - continued
| Shares | Dollars |
| Six months ended
June 30,
2012 | Year ended
December 31,
2011 | Six months ended
June 30,
2012 | Year ended
December 31,
2011 |
VIP Freedom 2020 | | | | |
Initial Class | | | | |
Shares sold | 963,124 | 1,431,567 | $ 10,391,589 | $ 15,478,055 |
Reinvestment of distributions | 18,359 | 120,449 | 197,358 | 1,230,988 |
Shares redeemed | (483,357) | (1,147,522) | (5,214,478) | (12,307,636) |
Net increase (decrease) | 498,126 | 404,494 | $ 5,374,469 | $ 4,401,407 |
Service Class | | | | |
Shares sold | 492,080 | 1,052,615 | $ 5,311,363 | $ 11,359,843 |
Reinvestment of distributions | 13,785 | 90,106 | 147,918 | 919,083 |
Shares redeemed | (337,703) | (674,788) | (3,621,151) | (7,210,331) |
Net increase (decrease) | 168,162 | 467,933 | $ 1,838,130 | $ 5,068,595 |
Service Class 2 | | | | |
Shares sold | 3,827,689 | 13,613,924 | $ 40,956,524 | $ 144,846,404 |
Reinvestment of distributions | 163,403 | 1,002,623 | 1,748,409 | 10,196,673 |
Shares redeemed | (1,090,091) | (2,071,647) | (11,663,684) | (21,956,318) |
Net increase (decrease) | 2,901,001 | 12,544,900 | $ 31,041,249 | $ 133,086,759 |
VIP Freedom 2025 | | | | |
Initial Class | | | | |
Shares sold | 97,736 | 316,493 | $ 1,039,400 | $ 3,360,409 |
Reinvestment of distributions | 5,393 | 38,255 | 57,378 | 383,311 |
Shares redeemed | (114,960) | (460,823) | (1,224,358) | (4,896,785) |
Net increase (decrease) | (11,831) | (106,075) | $ (127,580) | $ (1,153,065) |
Service Class | | | | |
Shares sold | 336,839 | 664,334 | $ 3,634,794 | $ 6,956,093 |
Reinvestment of distributions | 2,518 | 17,440 | 26,744 | 174,571 |
Shares redeemed | (392,941) | (103,678) | (4,267,181) | (1,089,627) |
Net increase (decrease) | (53,584) | 578,096 | $ (605,643) | $ 6,041,037 |
Service Class 2 | | | | |
Shares sold | 811,101 | 722,933 | $ 8,538,590 | $ 7,498,084 |
Reinvestment of distributions | 10,062 | 57,217 | 106,456 | 570,455 |
Shares redeemed | (315,093) | (366,230) | (3,361,740) | (3,841,573) |
Net increase (decrease) | 506,070 | 413,920 | $ 5,283,306 | $ 4,226,966 |
VIP Freedom 2030 | | | | |
Initial Class | | | | |
Shares sold | 612,170 | 804,180 | $ 6,348,462 | $ 8,224,380 |
Reinvestment of distributions | 8,809 | 77,829 | 90,994 | 754,936 |
Shares redeemed | (158,837) | (558,805) | (1,642,374) | (5,715,678) |
Net increase (decrease) | 462,142 | 323,204 | $ 4,797,082 | $ 3,263,638 |
Service Class | | | | |
Shares sold | 453,448 | 1,124,643 | $ 4,728,138 | $ 11,604,879 |
Reinvestment of distributions | 8,139 | 69,785 | 83,995 | 676,213 |
Shares redeemed | (511,079) | (503,954) | (5,342,541) | (5,160,071) |
Net increase (decrease) | (49,492) | 690,474 | $ (530,408) | $ 7,121,021 |
Service Class 2 | | | | |
Shares sold | 1,676,971 | 2,397,724 | $ 17,218,480 | $ 24,438,048 |
Reinvestment of distributions | 17,323 | 139,102 | 178,253 | 1,345,116 |
Shares redeemed | (442,956) | (1,233,591) | (4,569,533) | (12,571,282) |
Net increase (decrease) | 1,251,338 | 1,303,235 | $ 12,827,200 | $ 13,211,882 |
Semiannual Report
Notes to Financial Statements (Unaudited) - continued
7. Share Transactions - continued
| Shares | Dollars |
| Six months ended
June 30,
2012 | Year ended
December 31,
2011 | Six months ended
June 30,
2012 | Year ended
December 31,
2011 |
VIP Freedom 2035 | | | | |
Initial Class | | | | |
Shares sold | 1,053 | 517 | $ 15,346 | $ 7,378 |
Reinvestment of distributions | - | 168 | - | 2,344 |
Shares redeemed | (259) | (1,837) | (3,840) | (27,110) |
Net increase (decrease) | 794 | (1,152) | $ 11,506 | $ (17,388) |
Service Class | | | | |
Shares sold. | - | - | $ - | $ - |
Reinvestment of distributions | - | 148 | - | 2,074 |
Shares redeemed | - | (1,496) | - | (22,170) |
Net increase (decrease) | - | (1,348) | $ - | $ (20,096) |
Service Class 2 | | | | |
Shares sold | 4,046 | 16,012 | $ 59,750 | $ 233,514 |
Reinvestment of distributions | - | 420 | - | 5,871 |
Shares redeemed | (4,744) | (10,794) | (68,424) | (152,907) |
Net increase (decrease) | (698) | 5,638 | $ (8,674) | $ 86,478 |
VIP Freedom 2040 | | | | |
Initial Class | | | | |
Shares sold | 101,170 | 114,034 | $ 1,445,610 | $ 1,616,680 |
Reinvestment of distributions | 87 | 2,599 | 1,228 | 34,224 |
Shares redeemed | (66,646) | (17,949) | (947,024) | (248,395) |
Net increase (decrease) | 34,611 | 98,684 | $ 499,814 | $ 1,402,509 |
Service Class | | | | |
Shares sold | 186,591 | 111,915 | $ 2,728,966 | $ 1,670,332 |
Reinvestment of distributions | 57 | 1,720 | 805 | 22,655 |
Shares redeemed | (22,288) | (41,524) | (314,472) | (597,686) |
Net increase (decrease) | 164,360 | 72,111 | $ 2,415,299 | $ 1,095,301 |
Service Class 2 | | | | |
Shares sold | 13,033 | 5,669 | $ 185,733 | $ 78,289 |
Reinvestment of distributions | 8 | 247 | 108 | 3,244 |
Shares redeemed | (656) | (5,726) | (9,192) | (77,298) |
Net increase (decrease) | 12,385 | 190 | $ 176,649 | $ 4,235 |
VIP Freedom 2045 | | | | |
Initial Class | | | | |
Shares sold | 953 | 215 | $ 12,983 | $ 3,017 |
Reinvestment of distributions | 221 | 328 | 3,097 | 4,671 |
Shares redeemed | (120) | (1,725) | (1,685) | (24,843) |
Net increase (decrease) | 1,054 | (1,182) | $ 14,395 | $ (17,155) |
Service Class | | | | |
Shares sold | - | - | $ - | $ - |
Reinvestment of distributions | 211 | 308 | 2,952 | 4,394 |
Shares redeemed | - | (1,560) | - | (22,468) |
Net increase (decrease) | 211 | (1,252) | $ 2,952 | $ (18,074) |
Service Class 2 | | | | |
Shares sold | 8,378 | 5,549 | $ 113,452 | $ 79,835 |
Reinvestment of distributions | 339 | 390 | 4,749 | 5,512 |
Shares redeemed | (2,699) | (3,892) | (38,069) | (53,887) |
Net increase (decrease) | 6,018 | 2,047 | $ 80,132 | $ 31,460 |
Semiannual Report
7. Share Transactions - continued
| Shares | Dollars |
| Six months ended
June 30,
2012 | Year ended
December 31,
2011 | Six months ended
June 30,
2012 | Year ended
December 31,
2011 |
VIP Freedom 2050 | | | | |
Initial Class | | | | |
Shares sold | 8,062 | 25,741 | $ 103,935 | $ 405,897 |
Reinvestment of distributions | 2,772 | 2,281 | 34,980 | 31,233 |
Shares redeemed | (5,419) | (51,164) | (70,717) | (826,168) |
Net increase (decrease) | 5,415 | (23,142) | $ 68,198 | $ (389,038) |
Service Class | | | | |
Shares sold | - | - | $ - | $ - |
Reinvestment of distributions | 973 | 770 | 12,273 | 10,416 |
Shares redeemed | - | (1,439) | - | (22,752) |
Net increase (decrease) | 973 | (669) | $ 12,273 | $ (12,336) |
Service Class 2 | | | | |
Shares sold | 2,623 | 6,757 | $ 33,901 | $ 103,745 |
Reinvestment of distributions | 1,801 | 1,417 | 22,710 | 19,073 |
Shares redeemed | (510) | (4,906) | (6,562) | (73,519) |
Net increase (decrease) | 3,914 | 3,268 | $ 50,049 | $ 49,299 |
8. Other.
The Funds' organizational documents provide former and current trustees and officers with a limited indemnification against liabilities arising in connection with the performance of their duties to the Funds. In the normal course of business, the Funds may also enter into contracts that provide general indemnifications. The Funds' maximum exposure under these arrangements is unknown as this would be dependent on future claims that may be made against the Funds. The risk of material loss from such claims is considered remote.
The Funds do not invest in the Underlying Funds for the purpose of exercising management or control; however, investments by the Funds within their principal investment strategies may represent a significant portion of the Underlying Fund's net assets. At the end of the period, VIP Freedom 2020 was the owner of record of approximately 24% of the total outstanding shares of VIP Value Portfolio, and approximately 21% of the total outstanding shares of VIP Emerging Markets Portfolio.
The Funds, in aggregate, were the owners of record of more than 20% of the total outstanding shares of the following Underlying Funds.
Fund | % of shares held |
VIP Emerging Markets Portfolio | 40 |
VIP Value Portfolio | 46 |
In addition, at the end of the period, FMR or its affiliates and certain otherwise unaffiliated shareholders each were owners of record of more than 10% of the outstanding shares of the following funds:
| Affiliated% | Number of
Unaffiliated
Shareholders | Unaffiliated
Shareholders% |
VIP Freedom Income | 53 | 1 | 16 |
VIP Freedom 2005 | 95 | - | - |
VIP Freedom 2010 | - | 1 | 74 |
VIP Freedom 2015 | 30 | 1 | 35 |
VIP Freedom 2020 | - | 1 | 76 |
VIP Freedom 2025 | 22 | 3 | 58 |
VIP Freedom 2030 | 11 | 2 | 61 |
VIP Freedom 2035 | 42 | 2 | 46 |
VIP Freedom 2040 | - | 3 | 90 |
VIP Freedom 2045 | 60 | 2 | 29 |
VIP Freedom 2050 | 28 | 2 | 62 |
Semiannual Report
Investment Adviser
Strategic Advisers, Inc.
Boston, MA
General Distributor
Fidelity Distributors Corporation
Smithfield, RI
Transfer and Service Agents
Fidelity Investments Institutional Operations Company, Inc.
Boston, MA
Fidelity Service Company, Inc.
Boston, MA
Custodian
The Bank of New York Mellon
New York, NY
VIPFF2K-SANN-0812
1.819548.108
Fidelity® Variable Insurance Products:
Freedom Lifetime Income Funds -
Portfolios I, II, & III
Semiannual Report
June 30, 2012
(Fidelity Cover Art)
Contents
To view a fund's proxy voting guidelines and proxy voting record for the 12-month period ended June 30, visit http://www.fidelity.com/proxyvotingresults or visit the Securities and Exchange Commission's (SEC) web site at http://www.sec.gov. You may also call 1-877-208-0098 to request a free copy of the proxy voting guidelines.
Fidelity Variable Insurance Products are separate account options which are purchased through a variable insurance contract.
Standard & Poor's, S&P and S&P 500 are registered service marks of The McGraw-Hill Companies, Inc. and have been licensed for use by Fidelity Distributors Corporation.
Other third party marks appearing herein are the property of their respective owners.
All other marks appearing herein are registered or unregistered trademarks or service marks of FMR LLC or an affiliated company. © 2012 FMR LLC. All rights reserved.
This report and the financial statements contained herein are submitted for the general information of the shareholders of the funds. This report is not authorized for distribution to prospective investors in the funds unless preceded or accompanied by an effective prospectus.
A fund files its complete schedule of portfolio holdings with the SEC for the first and third quarters of each fiscal year on Form N-Q. Forms N-Q are available on the SEC's web site at http://www.sec.gov. A fund's Forms N-Q may be reviewed and copied at the SEC's Public Reference Room in Washington, DC. Information regarding the operation of the SEC's Public Reference Room may be obtained by calling 1-800-SEC-0330. For a complete list of a fund's portfolio holdings, view the most recent holdings listing, semiannual report, or annual report on Fidelity's web site at http://www.fidelity.com, http://www.advisor.fidelity.com, or http://www.401k.com, as applicable.
NOT FDIC INSURED • MAY LOSE VALUE • NO BANK GUARANTEE
Neither the funds nor Fidelity Distributors Corporation is a bank.
Semiannual Report
As a shareholder of a Fund, you incur two types of costs: (1) transaction costs, and (2) ongoing costs, including other Fund expenses. This Example is intended to help you understand your ongoing costs (in dollars) of investing in the Funds and to compare these costs with the ongoing costs of investing in other mutual funds.
The Example is based on an investment of $1,000 invested at the beginning of the period and held for the entire period (January 1, 2012 to June 30, 2012).
Actual Expenses
The first line of the accompanying table for each fund provides information about actual account values and actual expenses. You may use the information in this line, together with the amount you invested, to estimate the expenses that you paid over the period. Simply divide your account value by $1,000.00 (for example, an $8,600 account value divided by $1,000.00 = 8.6), then multiply the result by the number in the first line for a fund under the heading entitled "Expenses Paid During Period" to estimate the expenses you paid on your account during this period. The estimate of expenses does not include any fees or other expenses of any variable annuity or variable life insurance product. If they were, the estimate of expenses you paid during the period would be higher, and your ending account value would be lower. In addition, each Fund, as a shareholder in underlying Fidelity Funds, will indirectly bear its pro-rata share of the fees and expenses incurred by the underlying Fidelity Funds. These fees and expenses are not included in each Fund's annualized expense ratio used to calculate the expense estimates in the table below.
Hypothetical Example for Comparison Purposes
The second line of the accompanying table for each fund provides information about hypothetical account values and hypothetical expenses based on a fund's actual expense ratio and an assumed rate of return of 5% per year before expenses, which is not the Fund's actual return. The hypothetical account values and expenses may not be used to estimate the actual ending account balance or expenses you paid for the period. You may use this information to compare the ongoing costs of investing in the Fund and other funds. To do so, compare this 5% hypothetical example with the 5% hypothetical examples that appear in the shareholder reports of the other funds. The estimate of expenses does not include any fees or other expenses of any variable annuity or variable life insurance product. If they were, the estimate of expenses you paid during the period would be higher, and your ending account value would be lower. In addition, each Fund, as a shareholder in underlying Fidelity Funds, will indirectly bear its pro-rata share of the fees and expenses incurred by the underlying Fidelity Funds. These fees and expenses are not included in each Fund's annualized expense ratio used to calculate the expense estimates in the table below.
Please note that the expenses shown in the table are meant to highlight your ongoing costs only and do not reflect any transaction costs. Therefore, the second line of the table is useful in comparing ongoing costs only, and will not help you determine the relative total costs of owning different funds.
| Annualized
Expense Ratio | Beginning
Account Value
January 1, 2012 | Ending
Account Value
June 30, 2012 | Expenses Paid
During Period*
January 1, 2012
to June 30, 2012 |
VIP Freedom Lifetime Income I | .00% | | | |
Actual | | $ 1,000.00 | $ 1,052.60 | $ .00 |
HypotheticalA | | $ 1,000.00 | $ 1,024.86 | $ .00 |
VIP Freedom Lifetime Income II | .00% | | | |
Actual | | $ 1,000.00 | $ 1,057.60 | $ .00 |
HypotheticalA | | $ 1,000.00 | $ 1,024.86 | $ .00 |
VIP Freedom Lifetime Income III | .00% | | | |
Actual | | $ 1,000.00 | $ 1,072.90 | $ .00 |
HypotheticalA | | $ 1,000.00 | $ 1,024.86 | $ .00 |
A 5% return per year before expenses
* Expenses are equal to each Fund's annualized expense ratio, multiplied by the average account value over the period, multiplied by 182/366 (to reflect the one-half year period). The fees and expenses of the underlying Fidelity Funds in which the Fund invests are not included in the Fund's annualized expense ratio.
Semiannual Report
VIP Freedom Lifetime Income I Portfolio
Investment Changes (Unaudited)
Fund Holdings as of June 30, 2012 |
| % of fund's
net assets | % of fund's net assets
6 months ago |
Domestic Equity Funds | | |
VIP Contrafund Portfolio Investor Class | 5.1 | 4.8 |
VIP Equity-Income Portfolio Investor Class | 5.5 | 5.8 |
VIP Growth & Income Portfolio Investor Class | 6.1 | 5.8 |
VIP Growth Portfolio Investor Class | 5.2 | 5.6 |
VIP Mid Cap Portfolio Investor Class | 1.5 | 1.9 |
VIP Value Portfolio Investor Class | 4.1 | 4.9 |
VIP Value Strategies Portfolio Investor Class | 2.0 | 2.0 |
| 29.5 | 30.8 |
Developed International Equity Funds | | |
VIP Overseas Portfolio Investor Class R | 8.3 | 8.1 |
Emerging Markets Equity Funds | | |
VIP Emerging Markets Portfolio Investor Class R | 2.5 | 1.9 |
High Yield Bond Funds | | |
VIP High Income Portfolio Investor Class | 5.0 | 5.1 |
Investment Grade Bond Funds | | |
VIP Investment Grade Bond Portfolio Investor Class | 39.9 | 39.1 |
Short-Term Funds | | |
VIP Money Market Portfolio Investor Class | 14.8 | 15.0 |
Net Other Assets (Liabilities)* | 0.0 | 0.0 |
| 100.0 | 100.0 |
* Amount represents less than 0.1% |
Asset Allocation (% of fund's net assets) |
Current |
 | Domestic Equity Funds | 29.5% | |
 | Developed International Equity Funds | 8.3% | |
 | Emerging Markets Equity Funds | 2.5% | |
 | High Yield Bond Funds | 5.0% | |
 | Investment Grade Bond Funds | 39.9% | |
 | Short-Term Funds | 14.8% | |

Six months ago |
| Domestic Equity Funds | 30.8% | |
| Developed International Equity Funds | 8.1% | |
| Emerging Markets Equity Funds | 1.9% | |
| High Yield Bond Funds | 5.1% | |
| Investment Grade Bond Funds | 39.1% | |
| Short-Term Funds | 15.0% | |

Expected |
| Domestic Equity Funds | 27.8% | |
| Developed International Equity Funds | 7.8% | |
| Emerging Markets Equity Funds | 2.3% | |
| High Yield Bond Funds | 5.0% | |
| Investment Grade Bond Funds | 42.1% | |
| Short-Term Funds | 15.0% | |

The fund invests according to an asset allocation strategy that becomes increasingly conservative over time. The six months ago allocation is based on the fund's holdings as of December 31, 2011. The current allocation is based on the fund's holdings as of June 30, 2012. The expected allocation represents the fund's anticipated allocation at December 31, 2012. |
Semiannual Report
VIP Freedom Lifetime Income I Portfolio
Investments June 30, 2012 (Unaudited)
Showing Percentage of Net Assets
Domestic Equity Funds - 29.5% |
| Shares | | Value |
Domestic Equity Funds - 29.5% |
VIP Contrafund Portfolio Investor Class | 23,322 | | $ 585,148 |
VIP Equity-Income Portfolio Investor Class | 31,827 | | 627,310 |
VIP Growth & Income Portfolio Investor Class | 51,131 | | 705,102 |
VIP Growth Portfolio Investor Class | 14,616 | | 594,588 |
VIP Mid Cap Portfolio Investor Class | 5,682 | | 176,035 |
VIP Value Portfolio Investor Class | 40,458 | | 466,888 |
VIP Value Strategies Portfolio Investor Class | 22,928 | | 224,919 |
TOTAL DOMESTIC EQUITY FUNDS (Cost $3,715,901) |
3,379,990
|
International Equity Funds - 10.8% |
| | | |
Developed International Equity Funds - 8.3% |
VIP Overseas Portfolio Investor Class R | 65,737 | | 953,186 |
Emerging Markets Equity Funds - 2.5% |
VIP Emerging Markets Portfolio Investor Class R | 35,750 | | 280,640 |
TOTAL INTERNATIONAL EQUITY FUNDS (Cost $1,546,549) |
1,233,826
|
Bond Funds - 44.9% |
| Shares | | Value |
High Yield Bond Funds - 5.0% |
VIP High Income Portfolio Investor Class | 100,341 | | $ 576,960 |
Investment Grade Bond Funds - 39.9% |
VIP Investment Grade Bond Portfolio Investor Class | 344,702 | | 4,570,745 |
TOTAL BOND FUNDS (Cost $4,990,759) |
5,147,705
|
Short-Term Funds - 14.8% |
| | | |
VIP Money Market Portfolio Investor Class
(Cost $1,697,468) | 1,697,468 | |
1,697,468
|
TOTAL INVESTMENT PORTFOLIO - 100.0% (Cost $11,950,677) | | 11,458,989 |
NET OTHER ASSETS (LIABILITIES) - 0.0% | | 6 |
NET ASSETS - 100% | $ 11,458,995 |
Other Information |
All investments are categorized as Level 1 under the Fair Value Hierarchy. The inputs or methodology used for valuing securities may not be an indication of the risk associated with investing in those securities. For more information on valuation inputs, please refer to the Security Valuation section in the accompanying Notes to Financial Statements. |
See accompanying notes which are an integral part of the financial statements.
Semiannual Report
VIP Freedom Lifetime Income I Portfolio
Statement of Assets and Liabilities
| June 30, 2012 (Unaudited) |
| | |
Assets | | |
Investment in securities, at value (cost $11,950,677) - See accompanying schedule | | $ 11,458,989 |
Receivable for investments sold | | 192 |
Total assets | | 11,459,181 |
| | |
Liabilities | | |
Payable for fund shares redeemed | | 186 |
| | |
Net Assets | | $ 11,458,995 |
Net Assets consist of: | | |
Paid in capital | | $ 11,935,765 |
Undistributed net investment income | | 1,469 |
Accumulated undistributed net realized gain (loss) on investments | | 13,449 |
Net unrealized appreciation (depreciation) on investments | | (491,688) |
Net Assets, for 1,134,781 shares outstanding | | $ 11,458,995 |
Net Asset Value, offering price and redemption price per share ($11,458,995 ÷ 1,134,781 shares) | | $ 10.10 |
Statement of Operations
Six months ended June 30, 2012 (Unaudited) |
| | |
Investment Income | | |
Income distributions from underlying funds | | $ 1,469 |
| | |
Expenses | | |
Independent trustees' compensation | $ 20 | |
Total expenses before reductions | 20 | |
Expense reductions | (20) | 0 |
Net investment income (loss) | | 1,469 |
Realized and Unrealized Gain (Loss) Realized gain (loss) on sale of underlying fund shares | 21,285 | |
Capital gain distributions from underlying funds | 46,638 | |
Total net realized gain (loss) | | 67,923 |
Change in net unrealized appreciation (depreciation) on underlying funds | | 497,562 |
Net gain (loss) | | 565,485 |
Net increase (decrease) in net assets resulting from operations | | $ 566,954 |
See accompanying notes which are an integral part of the financial statements.
Semiannual Report
Financial Statements - continued
Statement of Changes in Net Assets
| Six months ended June 30, 2012
(Unaudited) | Year ended
December 31, 2011 |
Increase (Decrease) in Net Assets | | |
Operations | | |
Net investment income (loss) | $ 1,469 | $ 231,643 |
Net realized gain (loss) | 67,923 | 130,438 |
Change in net unrealized appreciation (depreciation) | 497,562 | (302,019) |
Net increase (decrease) in net assets resulting from operations | 566,954 | 60,062 |
Distributions to shareholders from net investment income | - | (231,878) |
Distributions to shareholders from net realized gain | (64,764) | (68,922) |
Total distributions | (64,764) | (300,800) |
Share transactions
Proceeds from sales of shares | 552,219 | 1,633,322 |
Reinvestment of distributions | 64,764 | 300,800 |
Cost of shares redeemed | (406,952) | (1,291,500) |
Net increase (decrease) in net assets resulting from share transactions | 210,031 | 642,622 |
Total increase (decrease) in net assets | 712,221 | 401,884 |
| | |
Net Assets | | |
Beginning of period | 10,746,774 | 10,344,890 |
End of period (including undistributed net investment income of $1,469 and $0, respectively) | $ 11,458,995 | $ 10,746,774 |
Other Information Shares | | |
Sold | 54,751 | 165,152 |
Issued in reinvestment of distributions | 6,483 | 31,148 |
Redeemed | (40,612) | (129,343) |
Net increase (decrease) | 20,622 | 66,957 |
Financial Highlights
| Six months ended June 30, 2012 | Years ended December 31, |
| (Unaudited) | 2011 | 2010 | 2009 | 2008 | 2007 |
Selected Per-Share Data | | | | | | |
Net asset value, beginning of period | $ 9.65 | $ 9.88 | $ 9.13 | $ 7.81 | $ 11.21 | $ 10.98 |
Income from Investment Operations | | | | | | |
Net investment income (loss) E | - I | .22 | .21 | .36 | .33 | .36 |
Net realized and unrealized gain (loss) | .51 | (.17) | .87 | 1.40 | (2.85) | .53 |
Total from investment operations | .51 | .05 | 1.08 | 1.76 | (2.52) | .89 |
Distributions from net investment income | - | (.21) | (.22) | (.36) | (.37) | (.34) |
Distributions from net realized gain | (.06) | (.06) | (.11) | (.08) | (.51) | (.32) |
Total distributions | (.06) | (.28) J | (.33) | (.44) | (.88) | (.66) |
Net asset value, end of period | $ 10.10 | $ 9.65 | $ 9.88 | $ 9.13 | $ 7.81 | $ 11.21 |
Total Return B, C, D | 5.26% | .48% | 11.84% | 22.76% | (22.68)% | 8.16% |
Ratios to Average Net Assets F, H | | | | | | |
Expenses before reductions G | .00% A | .00% | .00% | .00% | .00% | .00% |
Expenses net of fee waivers, if any | .00% A | .00% | .00% | .00% | .00% | .00% |
Expenses net of all reductions | .00% A | .00% | .00% | .00% | .00% | .00% |
Net investment income (loss) | .03% A | 2.25% | 2.26% | 4.28% | 3.31% | 3.15% |
Supplemental Data | | | | | | |
Net assets, end of period (000 omitted) | $ 11,459 | $ 10,747 | $ 10,345 | $ 8,773 | $ 7,648 | $ 12,533 |
Portfolio turnover rate | 19% A | 17% | 26% | 20% | 25% | 16% |
A Annualized
B Total returns for periods of less than one year are not annualized.
C Total returns do not reflect charges attributable to your insurance company's separate account. Inclusion of these charges would reduce the total returns shown.
D Total returns would have been lower if certain expenses had not been reduced during the applicable periods shown.
E Calculated based on average shares outstanding during the period.
F Amounts do not include the activity of the Underlying Funds.
G Amount represents less than .01%.
H Expense ratios reflect operating expenses of the Fund. Expenses before reductions do not reflect amounts reimbursed by the investment adviser or reductions from expense offset arrangements and do not represent the amount paid by the Fund during periods when reimbursements or reductions occur. Expenses net of fee waivers reflect expenses after reimbursement by the investment adviser but prior to reductions from expense offset arrangements. Expenses net of all reductions represent the net expenses paid by the Fund but do not include expenses of the investment companies in which the Fund invests.
I Amount represents less than $.01 per share.
J Total distributions of $.28 per share is comprised of distributions from net investment income of $.214 and distributions from net realized gain of $.064 per share.
See accompanying notes which are an integral part of the financial statements.
Semiannual Report
VIP Freedom Lifetime Income II Portfolio
Investment Changes (Unaudited)
Fund Holdings as of June 30, 2012 |
| % of fund's
net assets | % of fund's net assets
6 months ago |
Domestic Equity Funds | | |
VIP Contrafund Portfolio Investor Class | 5.9 | 5.5 |
VIP Equity-Income Portfolio Investor Class | 6.4 | 6.6 |
VIP Growth & Income Portfolio Investor Class | 7.2 | 6.7 |
VIP Growth Portfolio Investor Class | 6.1 | 6.4 |
VIP Mid Cap Portfolio Investor Class | 1.8 | 2.2 |
VIP Value Portfolio Investor Class | 4.7 | 5.6 |
VIP Value Strategies Portfolio Investor Class | 2.3 | 2.3 |
| 34.4 | 35.3 |
Developed International Equity Funds | | |
VIP Overseas Portfolio Investor Class R | 9.7 | 9.3 |
Emerging Markets Equity Funds | | |
VIP Emerging Markets Portfolio Investor Class R | 2.9 | 2.1 |
High Yield Bond Funds | | |
VIP High Income Portfolio Investor Class | 5.1 | 5.4 |
Investment Grade Bond Funds | | |
VIP Investment Grade Bond Portfolio Investor Class | 38.8 | 39.3 |
Short-Term Funds | | |
VIP Money Market Portfolio Investor Class | 9.1 | 8.6 |
| | |
Net Other Assets (Liabilities)* | 0.0 | 0.0 |
| 100.0 | 100.0 |
* Amount represents less than 0.1% |
Asset Allocation (% of fund's net assets) |
Current |
| Domestic Equity Funds | 34.4% | |
| Developed International Equity Funds | 9.7% | |
| Emerging Markets Equity Funds | 2.9% | |
| High Yield Bond Funds | 5.1% | |
| Investment Grade Bond Funds | 38.8% | |
| Short-Term Funds | 9.1% | |

Six months ago |
| Domestic Equity Funds | 35.3% | |
| Developed International Equity Funds | 9.3% | |
| Emerging Markets Equity Funds | 2.1% | |
| High Yield Bond Funds | 5.4% | |
| Investment Grade Bond Funds | 39.3% | |
| Short-Term Funds | 8.6% | |

Expected |
| Domestic Equity Funds | 33.8% | |
| Developed International Equity Funds | 9.5% | |
| Emerging Markets Equity Funds | 2.8% | |
| High Yield Bond Funds | 5.1% | |
| Investment Grade Bond Funds | 39.4% | |
| Short-Term Funds | 9.4% | |

The fund invests according to an asset allocation strategy that becomes increasingly conservative over time. The six months ago allocation is based on the fund's holdings as of December 31, 2011. The current allocation is based on the fund's holdings as of June 30, 2012. The expected allocation represents the fund's anticipated allocation at December 31, 2012. |
Semiannual Report
VIP Freedom Lifetime Income II Portfolio
Investments June 30, 2012 (Unaudited)
Showing Percentage of Net Assets
Domestic Equity Funds - 34.4% |
| Shares | | Value |
Domestic Equity Funds - 34.4% |
VIP Contrafund Portfolio Investor Class | 44,607 | | $ 1,119,182 |
VIP Equity-Income Portfolio Investor Class | 60,820 | | 1,198,766 |
VIP Growth & Income Portfolio Investor Class | 97,691 | | 1,347,161 |
VIP Growth Portfolio Investor Class | 27,996 | | 1,138,860 |
VIP Mid Cap Portfolio Investor Class | 10,880 | | 337,048 |
VIP Value Portfolio Investor Class | 77,465 | | 893,948 |
VIP Value Strategies Portfolio Investor Class | 43,765 | | 429,331 |
TOTAL DOMESTIC EQUITY FUNDS (Cost $7,255,076) |
6,464,296
|
International Equity Funds - 12.6% |
| | | |
Developed International Equity Funds - 9.7% |
VIP Overseas Portfolio Investor Class R | 125,754 | | 1,823,432 |
Emerging Markets Equity Funds - 2.9% |
VIP Emerging Markets Portfolio Investor Class R | 68,407 | | 536,994 |
TOTAL INTERNATIONAL EQUITY FUNDS (Cost $3,090,303) |
2,360,426
|
Bond Funds - 43.9% |
| Shares | | Value |
High Yield Bond Funds - 5.1% |
VIP High Income Portfolio Investor Class | 167,449 | | $ 962,832 |
Investment Grade Bond Funds - 38.8% |
VIP Investment Grade Bond Portfolio Investor Class | 550,027 | | 7,293,362 |
TOTAL BOND FUNDS (Cost $7,993,327) |
8,256,194
|
Short-Term Funds - 9.1% |
| | | |
VIP Money Market Portfolio Investor Class
(Cost $1,707,473) | 1,707,473 | |
1,707,473
|
TOTAL INVESTMENT PORTFOLIO - 100.0% (Cost $20,046,179) | | 18,788,389 |
NET OTHER ASSETS (LIABILITIES) - 0.0% | | 5 |
NET ASSETS - 100% | $ 18,788,394 |
Other Information |
All investments are categorized as Level 1 under the Fair Value Hierarchy. The inputs or methodology used for valuing securities may not be an indication of the risk associated with investing in those securities. For more information on valuation inputs, please refer to the Security Valuation section in the accompanying Notes to Financial Statements. |
See accompanying notes which are an integral part of the financial statements.
Semiannual Report
VIP Freedom Lifetime Income II Portfolio
Statement of Assets and Liabilities
| June 30, 2012 (Unaudited) |
| | |
Assets | | |
Investment in securities, at value (cost $20,046,179) - See accompanying schedule | | $ 18,788,389 |
Cash | | 1 |
Receivable for investments sold | | 311 |
Total assets | | 18,788,701 |
| | |
Liabilities | | |
Payable for fund shares redeemed | | 307 |
| | |
Net Assets | | $ 18,788,394 |
Net Assets consist of: | | |
Paid in capital | | $ 20,775,897 |
Undistributed net investment income | | 1,623 |
Accumulated undistributed net realized gain (loss) on investments | | (731,336) |
Net unrealized appreciation (depreciation) on investments | | (1,257,790) |
Net Assets, for 1,860,806 shares outstanding | | $ 18,788,394 |
Net Asset Value, offering price and redemption price per share ($18,788,394 ÷ 1,860,806 shares) | | $ 10.10 |
Statement of Operations
Six months ended June 30, 2012 (Unaudited) |
| | |
Investment Income | | |
Income distributions from underlying funds | | $ 1,623 |
| | |
Expenses | | |
Independent trustees' compensation | $ 31 | |
Total expenses before reductions | 31 | |
Expense reductions | (31) | 0 |
Net investment income (loss) | | 1,623 |
Realized and Unrealized Gain (Loss) Realized gain (loss) on sale of underlying fund shares | 51,188 | |
Capital gain distributions from underlying funds | 76,426 | |
Total net realized gain (loss) | | 127,614 |
Change in net unrealized appreciation (depreciation) on underlying funds | | 843,040 |
Net gain (loss) | | 970,654 |
Net increase (decrease) in net assets resulting from operations | | $ 972,277 |
See accompanying notes which are an integral part of the financial statements.
Semiannual Report
Financial Statements - continued
Statement of Changes in Net Assets
| Six months ended
June 30, 2012
(Unaudited) | Year ended
December 31,
2011 |
Increase (Decrease) in Net Assets | | |
Operations | | |
Net investment income (loss) | $ 1,623 | $ 371,217 |
Net realized gain (loss) | 127,614 | 153,912 |
Change in net unrealized appreciation (depreciation) | 843,040 | (516,144) |
Net increase (decrease) in net assets resulting from operations | 972,277 | 8,985 |
Distributions to shareholders from net investment income | - | (372,166) |
Distributions to shareholders from net realized gain | - | (74,433) |
Total distributions | - | (446,599) |
Share transactions
Proceeds from sales of shares | 2,005,159 | 3,096,734 |
Reinvestment of distributions | - | 446,599 |
Cost of shares redeemed | (782,589) | (1,149,414) |
Net increase (decrease) in net assets resulting from share transactions | 1,222,570 | 2,393,919 |
Total increase (decrease) in net assets | 2,194,847 | 1,956,305 |
| | |
Net Assets | | |
Beginning of period | 16,593,547 | 14,637,242 |
End of period (including undistributed net investment income of $1,623 and $0, respectively) | $ 18,788,394 | $ 16,593,547 |
Other Information Shares | | |
Sold | 200,640 | 312,697 |
Issued in reinvestment of distributions | - | 46,764 |
Redeemed | (78,205) | (115,460) |
Net increase (decrease) | 122,435 | 244,001 |
Financial Highlights
| Six months ended June 30, 2012 | Years ended December 31, |
| (Unaudited) | 2011 | 2010 | 2009 | 2008 | 2007 |
Selected Per-Share Data | | | | | | |
Net asset value, beginning of period | $ 9.55 | $ 9.79 | $ 8.90 | $ 7.42 | $ 11.68 | $ 11.36 |
Income from Investment Operations | | | | | | |
Net investment income (loss) E | - I | .23 | .21 | .34 | .29 | .32 |
Net realized and unrealized gain (loss) | .55 | (.21) | .95 | 1.59 | (3.57) | .77 |
Total from investment operations | .55 | .02 | 1.16 | 1.93 | (3.28) | 1.09 |
Distributions from net investment income | - | (.22) | (.22) | (.36) | (.34) | (.30) |
Distributions from net realized gain | - | (.04) | (.05) | (.09) | (.64) | (.48) |
Total distributions | - | (.26) | (.27) | (.45) | (.98) | (.77) J |
Net asset value, end of period | $ 10.10 | $ 9.55 | $ 9.79 | $ 8.90 | $ 7.42 | $ 11.68 |
Total Return B, C, D | 5.76% | .25% | 12.99% | 26.44% | (28.49)% | 9.67% |
Ratios to Average Net Assets F, H | | | | | | |
Expenses before reductions G | .00% A | .00% | .00% | .00% | .00% | .00% |
Expenses net of fee waivers, if any | .00% A | .00% | .00% | .00% | .00% | .00% |
Expenses net of all reductions | .00% A | .00% | .00% | .00% | .00% | .00% |
Net investment income (loss) | .02% A | 2.33% | 2.22% | 4.25% | 2.91% | 2.67% |
Supplemental Data | | | | | | |
Net assets, end of period (000 omitted) | $ 18,788 | $ 16,594 | $ 14,637 | $ 14,172 | $ 12,892 | $ 22,701 |
Portfolio turnover rate | 20% A | 12% | 23% | 21% | 25% | 18% |
A Annualized
B Total returns for periods of less than one year are not annualized.
C Total returns do not reflect charges attributable to your insurance company's separate account. Inclusion of these charges would reduce the total returns shown.
D Total returns would have been lower if certain expenses had not been reduced during the applicable periods shown.
E Calculated based on average shares outstanding during the period.
F Amounts do not include the activity of the Underlying Funds.
G Amount represents less than .01%.
H Expense ratios reflect operating expenses of the Fund. Expenses before reductions do not reflect amounts reimbursed by the investment adviser or reductions from expense offset arrangements and do not represent the amount paid by the Fund during periods when reimbursements or reductions occur. Expenses net of fee waivers reflect expenses after reimbursement by the investment adviser but prior to reductions from expense offset arrangements. Expenses net of all reductions represent the net expenses paid by the Fund but do not include expenses of the investment companies in which the Fund invests.
I Amount represents less than $.01 per share.
J Total distributions of $.77 per share is comprised of distributions from net investment income of $.295 and distributions from net realized gain of $.475 per share.
See accompanying notes which are an integral part of the financial statements.
Semiannual Report
VIP Freedom Lifetime Income III Portfolio
Investment Changes (Unaudited)
Fund Holdings as of June 30, 2012 |
| % of fund's
net assets | % of fund's net assets
6 months ago |
Domestic Equity Funds | | |
VIP Contrafund Portfolio Investor Class | 8.9 | 8.2 |
VIP Equity-Income Portfolio Investor Class | 9.6 | 9.8 |
VIP Growth & Income Portfolio Investor Class | 10.7 | 9.9 |
VIP Growth Portfolio Investor Class | 9.1 | 9.5 |
VIP Mid Cap Portfolio Investor Class | 2.7 | 3.2 |
VIP Value Portfolio Investor Class | 7.1 | 8.3 |
VIP Value Strategies Portfolio Investor Class | 3.4 | 3.3 |
| 51.5 | 52.2 |
Developed International Equity Funds | | |
VIP Overseas Portfolio Investor Class R | 14.5 | 13.7 |
Emerging Markets Equity Funds | | |
VIP Emerging Markets Portfolio Investor Class R | 4.3 | 3.2 |
High Yield Bond Funds | | |
VIP High Income Portfolio Investor Class | 7.5 | 7.8 |
Investment Grade Bond Funds | | |
VIP Investment Grade Bond Portfolio Investor Class | 22.2 | 23.1 |
Net Other Assets (Liabilities)* | 0.0 | 0.0 |
| 100.0 | 100.0 |
* Amount represents less than 0.1% |
Asset Allocation (% of fund's net assets) |
Current |
| Domestic Equity Funds | 51.5% | |
 | Developed International Equity Funds | 14.5% | |
 | Emerging Markets Equity Funds | 4.3% | |
 | High Yield Bond Funds | 7.5% | |
| Investment Grade Bond Funds | 22.2% | |

Six months ago |
| Domestic Equity Funds | 52.2% | |
| Developed International Equity Funds | 13.7% | |
| Emerging Markets Equity Funds | 3.2% | |
| High Yield Bond Funds | 7.8% | |
| Investment Grade Bond Funds | 23.1% | |

Expected |
| Domestic Equity Funds | 50.9% | |
| Developed International Equity Funds | 14.3% | |
| Emerging Markets Equity Funds | 4.3% | |
| High Yield Bond Funds | 7.5% | |
| Investment Grade Bond Funds | 22.9% | |
| Short-Term Funds | 0.1% | |

The fund invests according to an asset allocation strategy that becomes increasingly conservative over time. The six months ago allocation is based on the fund's holdings as of December 31, 2011. The current allocation is based on the fund's holdings as of June 30, 2012. The expected allocation represents the fund's anticipated allocation at December 31, 2012. |
Semiannual Report
VIP Freedom Lifetime Income III Portfolio
Investments June 30, 2012 (Unaudited)
Showing Percentage of Net Assets
Domestic Equity Funds - 51.5% |
| Shares | | Value |
Domestic Equity Funds - 51.5% |
VIP Contrafund Portfolio Investor Class | 27,153 | | $ 681,270 |
VIP Equity-Income Portfolio Investor Class | 37,072 | | 730,697 |
VIP Growth & Income Portfolio Investor Class | 59,556 | | 821,282 |
VIP Growth Portfolio Investor Class | 17,052 | | 693,659 |
VIP Mid Cap Portfolio Investor Class | 6,625 | | 205,233 |
VIP Value Portfolio Investor Class | 47,101 | | 543,549 |
VIP Value Strategies Portfolio Investor Class | 26,665 | | 261,586 |
TOTAL DOMESTIC EQUITY FUNDS (Cost $4,343,554) |
3,937,276
|
International Equity Funds - 18.8% |
| | | |
Developed International Equity Funds - 14.5% |
VIP Overseas Portfolio Investor Class R | 76,632 | | 1,111,157 |
Emerging Markets Equity Funds - 4.3% |
VIP Emerging Markets Portfolio Investor Class R | 41,602 | | 326,573 |
TOTAL INTERNATIONAL EQUITY FUNDS (Cost $1,841,477) |
1,437,730
|
Bond Funds - 29.7% |
| Shares | | Value |
High Yield Bond Funds - 7.5% |
VIP High Income Portfolio Investor Class | 99,624 | | $ 572,839 |
Investment Grade Bond Funds - 22.2% |
VIP Investment Grade Bond Portfolio Investor Class | 127,952 | | 1,696,651 |
TOTAL BOND FUNDS (Cost $2,232,497) |
2,269,490
|
TOTAL INVESTMENT PORTFOLIO - 100.0% (Cost $8,417,528) | | 7,644,496 |
NET OTHER ASSETS (LIABILITIES) - 0.0% | | (2) |
NET ASSETS - 100% | $ 7,644,494 |
Other Information |
All investments are categorized as Level 1 under the Fair Value Hierarchy. The inputs or methodology used for valuing securities may not be an indication of the risk associated with investing in those securities. For more information on valuation inputs, please refer to the Security Valuation section in the accompanying Notes to Financial Statements. |
See accompanying notes which are an integral part of the financial statements.
Semiannual Report
VIP Freedom Lifetime Income III Portfolio
Statement of Assets and Liabilities
| June 30, 2012 (Unaudited) |
| | |
Assets | | |
Investment in securities, at value (cost $8,417,528) - See accompanying schedule | | $ 7,644,496 |
Receivable for fund shares sold | | 233,832 |
Total assets | | 7,878,328 |
| | |
Liabilities | | |
Payable to custodian bank | $ 1 | |
Payable for investments purchased | 233,833 | |
Total liabilities | | 233,834 |
| | |
Net Assets | | $ 7,644,494 |
Net Assets consist of: | | |
Paid in capital | | $ 8,517,042 |
Undistributed net investment income | | 294 |
Accumulated undistributed net realized gain (loss) on investments | | (99,810) |
Net unrealized appreciation (depreciation) on investments | | (773,032) |
Net Assets, for 798,803 shares outstanding | | $ 7,644,494 |
Net Asset Value, offering price and redemption price per share ($7,644,494 ÷ 798,803 shares) | | $ 9.57 |
Statement of Operations
Six months ended June 30, 2012 (Unaudited) |
| | |
Investment Income | | |
Income distributions from underlying funds | | $ 294 |
| | |
Expenses | | |
Independent trustees' compensation | $ 12 | |
Total expenses before reductions | 12 | |
Expense reductions | (12) | 0 |
Net investment income (loss) | | 294 |
Realized and Unrealized Gain (Loss) Realized gain (loss) on sale of underlying fund shares | 23,009 | |
Capital gain distributions from underlying funds | 28,544 | |
Total net realized gain (loss) | | 51,553 |
Change in net unrealized appreciation (depreciation) on underlying funds | | 451,871 |
Net gain (loss) | | 503,424 |
Net increase (decrease) in net assets resulting from operations | | $ 503,718 |
See accompanying notes which are an integral part of the financial statements.
Semiannual Report
Financial Statements - continued
Statement of Changes in Net Assets
| Six months ended
June 30, 2012
(Unaudited) | Year ended
December 31,
2011 |
Increase (Decrease) in Net Assets | | |
Operations | | |
Net investment income (loss) | $ 294 | $ 149,218 |
Net realized gain (loss) | 51,553 | 23,878 |
Change in net unrealized appreciation (depreciation) | 451,871 | (324,508) |
Net increase (decrease) in net assets resulting from operations | 503,718 | (151,412) |
Distributions to shareholders from net investment income | - | (149,868) |
Distributions to shareholders from net realized gain | - | (20,877) |
Total distributions | - | (170,745) |
Share transactions
Proceeds from sales of shares | 571,647 | 1,044,709 |
Reinvestment of distributions | - | 170,745 |
Cost of shares redeemed | (254,913) | (809,829) |
Net increase (decrease) in net assets resulting from share transactions | 316,734 | 405,625 |
Total increase (decrease) in net assets | 820,452 | 83,468 |
| | |
Net Assets | | |
Beginning of period | 6,824,042 | 6,740,574 |
End of period (including undistributed net investment income of $294 and $0, respectively) | $ 7,644,494 | $ 6,824,042 |
Other Information Shares | | |
Sold | 60,782 | 111,015 |
Issued in reinvestment of distributions | - | 19,120 |
Redeemed | (26,688) | (84,793) |
Net increase (decrease) | 34,094 | 45,342 |
Financial Highlights
| Six months ended June 30, 2012 | Years ended December 31, |
| (Unaudited) | 2011 | 2010 | 2009 | 2008 | 2007 |
Selected Per-Share Data | | | | | | |
Net asset value, beginning of period | $ 8.92 | $ 9.37 | $ 8.28 | $ 6.72 | $ 11.90 | $ 11.56 |
Income from Investment Operations | | | | | | |
Net investment income (loss) E | - I | .20 | .18 | .24 | .24 | .29 |
Net realized and unrealized gain (loss) | .65 | (.42) | 1.14 | 1.76 | (4.36) | .96 |
Total from investment operations | .65 | (.22) | 1.32 | 2.00 | (4.12) | 1.25 |
Distributions from net investment income | - | (.20) | (.19) | (.26) | (.27) | (.29) |
Distributions from net realized gain | - | (.03) | (.04) | (.18) | (.79) | (.62) |
Total distributions | - | (.23) | (.23) | (.44) | (1.06) | (.91) |
Net asset value, end of period | $ 9.57 | $ 8.92 | $ 9.37 | $ 8.28 | $ 6.72 | $ 11.90 |
Total Return B, C, D | 7.29% | (2.36)% | 15.98% | 30.34% | (35.25)% | 10.88% |
Ratios to Average Net Assets F, H | | | | | | |
Expenses before reductions G | .00% A | .00% | .00% | .00% | .00% | .00% |
Expenses net of fee waivers, if any | .00% A | .00% | .00% | .00% | .00% | .00% |
Expenses net of all reductions | .00% A | .00% | .00% | .00% | .00% | .00% |
Net investment income (loss) | .01% A | 2.13% | 2.03% | 3.33% | 2.43% | 2.41% |
Supplemental Data | | | | | | |
Net assets, end of period (000 omitted) | $ 7,644 | $ 6,824 | $ 6,741 | $ 6,630 | $ 5,419 | $ 11,085 |
Portfolio turnover rate | 18% A | 16% | 20% | 10% | 20% | 11% |
A Annualized
B Total returns for periods of less than one year are not annualized.
C Total returns do not reflect charges attributable to your insurance company's separate account. Inclusion of these charges would reduce the total returns shown.
D Total returns would have been lower if certain expenses had not been reduced during the applicable periods shown.
E Calculated based on average shares outstanding during the period.
F Amounts do not include the activity of the Underlying Funds.
G Amount represents less than .01%.
H Expense ratios reflect operating expenses of the Fund. Expenses before reductions do not reflect amounts reimbursed by the investment adviser or reductions from expense offset arrangements and do not represent the amount paid by the Fund during periods when reimbursements or reductions occur. Expenses net of fee waivers reflect expenses after reimbursement by the investment adviser but prior to reductions from expense offset arrangements. Expenses net of all reductions represent the net expenses paid by the Fund but do not include expenses of the investment companies in which the Fund invests.
I Amount represents less than $.01 per share.
See accompanying notes which are an integral part of the financial statements.
Semiannual Report
Notes to Financial Statements
For the period ended June 30, 2012 (Unaudited)
1. Organization.
VIP Freedom Lifetime Income I Portfolio, VIP Freedom Lifetime Income II Portfolio, and VIP Freedom Lifetime Income III Portfolio (the Funds) are funds of Variable Insurance Products Fund V. The Variable Insurance Products Fund V (the Trust) (referred to in this report as Fidelity Variable Insurance Products) is registered under the Investment Company Act of 1940, as amended (the 1940 Act), as an open-end management investment company organized as a Massachusetts business trust. Each Fund is authorized to issue an unlimited number of shares. The Funds invest primarily in a combination of other VIP equity, bond, and short-term funds (the Underlying Funds) managed by Fidelity Management & Research Company (FMR). Shares of each Fund may only be purchased by insurance companies for the purpose of funding variable annuity or variable life insurance contracts.
2. Significant Accounting Policies.
The financial statements have been prepared in conformity with accounting principles generally accepted in the United States of America (GAAP), which require management to make certain estimates and assumptions at the date of the financial statements. Actual results could differ from those estimates. Subsequent events, if any, through the date that the financial statements were issued have been evaluated in the preparation of the financial statements. The following summarizes the significant accounting policies of the Funds:
Security Valuation. Investments are valued as of 4:00 p.m. Eastern time on the last calendar day of the period. Each Fund categorizes the inputs to valuation techniques used to value their investments into a disclosure hierarchy consisting of three levels as shown below:
Level 1 - quoted prices in active markets for identical investments
Level 2 - other significant observable inputs (including quoted prices for similar investments, interest rates, prepayment speeds, etc.)
Level 3 - unobservable inputs (including the Fund's own assumptions based on the best information available)
Valuation techniques used to value each Fund's investments by major category are as follows. Investments in the Underlying Funds are valued at their closing net asset value (NAV) each business day and are categorized as Level 1 in the hierarchy.
Investment Transactions and Income. For financial reporting purposes, the Funds' investment holdings and NAV include trades executed through the end of the last business day of the period. The NAV per share for processing shareholder transactions is calculated as of the close of business of the New York Stock Exchange (NYSE), normally 4:00 p.m. Eastern time and includes trades executed through the end of the prior business day. Gains and losses on securities sold are determined on the basis of identified cost. Income and capital gain distributions from the Underlying Funds, if any, are recorded on the ex-dividend date.
Expenses. Expenses directly attributable to a fund are charged to that fund. Expenses attributable to more than one fund are allocated among the respective funds on the basis of relative net assets or other appropriate methods. Expenses included in the accompanying financial statements reflect the expenses of each Fund and do not include any expenses associated with the Underlying Funds. Expense estimates are accrued in the period to which they relate and adjustments are made when actual amounts are known.
Income Tax Information and Distributions to Shareholders. Each year, each Fund intends to qualify as a regulated investment company under Subchapter M of the Internal Revenue Code, including distributing substantially all of its taxable income and realized gains. As a result, no provision for income taxes is required. Each Fund files a U.S. federal tax return, in addition to state and local tax returns as required. A fund's federal income tax returns are subject to examination by the Internal Revenue Service (IRS) for a period of three fiscal years after they are filed. State and local tax returns may be subject to examination for an additional fiscal year depending on the jurisdiction.
Distributions are declared and recorded on the ex-dividend date. Income and capital gain distributions are determined in accordance with income tax regulations, which may differ from GAAP.
Capital accounts within the financial statements are adjusted for permanent book-tax differences. These adjustments have no impact on net assets or the results of operations. Temporary book-tax differences will reverse in a subsequent period.
Book-tax differences are primarily due to the short-term gain distributions from the Underlying Funds, capital loss carryforwards and losses deferred due to wash sales and excise tax regulations.
Semiannual Report
2. Significant Accounting Policies - continued
Income Tax Information and Distributions to Shareholders - continued
The federal tax cost of investment securities and unrealized appreciation (depreciation) as of period end were as follows for each Fund:
| Tax cost | Gross unrealized
appreciation | Gross unrealized
depreciation | Net unrealized
appreciation
(depreciation) on
securities and other
investments |
VIP Freedom Lifetime Income I | $ 12,002,511 | $ 352,784 | $ (896,306) | $ (543,522) |
VIP Freedom Lifetime Income II | 20,193,988 | 534,254 | (1,939,853) | (1,405,599) |
VIP Freedom Lifetime Income III | 8,477,935 | 238,205 | (1,071,644) | (833,439) |
Capital loss carryforwards are only available to offset future capital gains of the Funds to the extent provided by regulations and may be limited. Under the Regulated Investment Company Modernization Act of 2010 (the Act), the Funds are permitted to carry forward capital losses incurred in taxable years beginning after December 22, 2010 for an unlimited period and such capital losses are required to be used prior to any losses that expire. At December 31, 2011, capital loss carryforwards were as follows:
| Fiscal year of expiration | |
| 2017 | 2018 | Total with
expiration |
VIP Freedom Lifetime Income II | $ (422,746) | $ (289,171) | $ (711,917) |
VIP Freedom Lifetime Income III | - | (83,080) | (83,080) |
3. Purchases and Sales of Investments.
Purchases and redemptions of the Underlying Fund shares are noted in the table below.
| Purchases ($) | Redemptions ($) |
VIP Freedom Lifetime Income I | 1,254,882 | 1,061,510 |
VIP Freedom Lifetime Income II | 3,153,314 | 1,852,694 |
VIP Freedom Lifetime Income III | 1,009,545 | 663,973 |
4. Fees and Other Transactions with Affiliates.
Management Fee. Strategic Advisers, Inc. (Strategic Advisers), an affiliate of FMR, provides the Funds with investment management related services. The Funds do not pay any fees for these services.
Other Transactions. Strategic Advisers has entered into an administration agreement with FMR under which FMR provides management and administrative services (other than investment advisory services) necessary for the operation of each Fund. Pursuant to this agreement, FMR pays all expenses of each Fund, excluding the compensation of the independent Trustees and certain other expenses such as interest expense. FMR also contracts with other Fidelity companies to perform the services necessary for the operation of each Fund. The Funds do not pay any fees for these services.
5. Expense Reductions.
FMR voluntarily agreed to reimburse the Funds to the extent annual operating expenses exceeded certain levels of average net assets as noted in the table below. Some expenses, for example interest expense, are excluded from this reimbursement.
The following Funds were in reimbursement during the period:
| Expense
Limitations | Reimbursement
from adviser |
VIP Freedom Lifetime Income I | .00% | $ 20 |
VIP Freedom Lifetime Income II | .00% | 31 |
VIP Freedom Lifetime Income III | .00% | 12 |
Semiannual Report
Notes to Financial Statements (Unaudited) - continued
6. Other.
The Funds' organizational documents provide former and current trustees and officers with a limited indemnification against liabilities arising in connection with the performance of their duties to the Funds. In the normal course of business, the Funds may also enter into contracts that provide general indemnifications. The Funds' maximum exposure under these arrangements is unknown as this would be dependent on future claims that may be made against the Funds. The risk of material loss from such claims is considered remote.
At the end of the period, FMR or its affiliates were owners of record of all the outstanding shares of the Funds.
Semiannual Report
Investment Adviser
Strategic Advisers, Inc.
Boston, MA
General Distributor
Fidelity Distributors Corporation
Smithfield, RI
Transfer and Service Agents
Fidelity Investments Institutional Operations Company, Inc.
Boston, MA
Fidelity Service Company, Inc.
Boston, MA
Custodian
The Bank of New York Mellon
New York, NY
VIPFLI-SANN-0812
1.816202.106
Fidelity® Variable Insurance Products:
FundsManager - 20%, 50%, 60%, 70%, 85% Portfolio
Semiannual Report
June 30, 2012
(Fidelity Cover Art)
Contents
To view a fund's proxy voting guidelines and proxy voting record for the 12-month period ended June 30, visit http://www.fidelity.com/proxyvotingresults or visit the Securities and Exchange Commission's (SEC) web site at http://www.sec.gov. You may also call 1-877-208-0098 to request a free copy of the proxy voting guidelines.
Fidelity Variable Insurance Products are separate account options which are purchased through a variable insurance contract.
Standard & Poor's, S&P and S&P 500 are registered service marks of The McGraw-Hill Companies, Inc. and have been licensed for use by Fidelity Distributors Corporation.
Other third party marks appearing herein are the property of their respective owners.
All other marks appearing herein are registered or unregistered trademarks or service marks of FMR LLC or an affiliated company. © 2012 FMR LLC. All rights reserved.
This report and the financial statements contained herein are submitted for the general information of the shareholders of the funds. This report is not authorized for distribution to prospective investors in the funds unless preceded or accompanied by an effective prospectus.
A fund files its complete schedule of portfolio holdings with the SEC for the first and third quarters of each fiscal year on Form N-Q. Forms N-Q are available on the SEC's web site at http://www.sec.gov. A fund's Forms N-Q may be reviewed and copied at the SEC's Public Reference Room in Washington, DC. Information regarding the operation of the SEC's Public Reference Room may be obtained by calling 1-800-SEC-0330. For a complete list of a fund's portfolio holdings, view the most recent holdings listing, semiannual report, or annual report on Fidelity's web site at http://www.fidelity.com, http://www.advisor.fidelity.com, or http://www.401k.com, as applicable.
NOT FDIC INSURED • MAY LOSE VALUE • NO BANK GUARANTEE
Neither the funds nor Fidelity Distributors Corporation is a bank.
Semiannual Report
As a shareholder of a Fund, you incur two types of costs: (1) transaction costs, and (2) ongoing costs, including distribution and/or service (12b-1) fees and other Fund expenses. This Example is intended to help you understand your ongoing costs (in dollars) of investing in the Funds and to compare these costs with the ongoing costs of investing in other mutual funds.
The Example is based on an investment of $1,000 invested at the beginning of the period and held for the entire period (January 1, 2012 to June 30, 2012).
Actual Expenses
The first line of the accompanying table for each class of each fund provides information about actual account values and actual expenses. You may use the information in this line, together with the amount you invested, to estimate the expenses that you paid over the period. Simply divide your account value by $1,000.00 (for example, an $8,600 account value divided by $1,000.00 = 8.6), then multiply the result by the number in the first line for a class of the fund under the heading entitled "Expenses Paid During Period" to estimate the expenses you paid on your account during this period. The estimate of expenses does not include any fees or other expenses of any variable annuity or variable life insurance product. If they were, the estimate of expenses you paid during the period would be higher, and your ending account value would be lower. In addition, each Fund, as a shareholder in underlying Fidelity Funds, will indirectly bear its pro-rata share of the fees and expenses incurred by the underlying Fidelity Funds. These fees and expenses are not included in each Fund's annualized expense ratio used to calculate the expense estimates in the table below.
Hypothetical Example for Comparison Purposes
The second line of the accompanying table for each class of each fund provides information about hypothetical account values and hypothetical expenses based on a Class' actual expense ratio and an assumed rate of return of 5% per year before expenses, which is not the Class' actual return. The hypothetical account values and expenses may not be used to estimate the actual ending account balance or expenses you paid for the period. You may use this information to compare the ongoing costs of investing in the Fund and other funds. To do so, compare this 5% hypothetical example with the 5% hypothetical examples that appear in the shareholder reports of the other funds. The estimate of expenses does not include any fees or other expenses of any variable annuity or variable life insurance product. If they were, the estimate of expenses you paid during the period would be higher, and your ending account value would be lower. In addition, each Fund, as a shareholder in underlying Fidelity Funds, will indirectly bear its pro-rata share of the fees and expenses incurred by the underlying Fidelity Funds. These fees and expenses are not included in each Fund's annualized expense ratio used to calculate the expense estimates in the table below.
Please note that the expenses shown in the table are meant to highlight your ongoing costs only and do not reflect any transaction costs. Therefore, the second line of the table is useful in comparing ongoing costs only, and will not help you determine the relative total costs of owning different funds.
| Annualized
Expense Ratio | Beginning
Account Value
January 1, 2012 | Ending
Account Value
June 30, 2012 | Expenses Paid
During Period*
January 1, 2012
to June 30, 2012 |
VIP FundsManager 20% Portfolio | | | | |
Service Class | .20% | | | |
Actual | | $ 1,000.00 | $ 1,030.00 | $ 1.01 |
HypotheticalA | | $ 1,000.00 | $ 1,023.87 | $ 1.01 |
Service Class 2 | .35% | | | |
Actual | | $ 1,000.00 | $ 1,029.10 | $ 1.77 |
HypotheticalA | | $ 1,000.00 | $ 1,023.12 | $ 1.76 |
Investor Class | .20% | | | |
Actual | | $ 1,000.00 | $ 1,030.00 | $ 1.01 |
HypotheticalA | | $ 1,000.00 | $ 1,023.87 | $ 1.01 |
VIP FundsManager 50% Portfolio | | | | |
Service Class | .20% | | | |
Actual | | $ 1,000.00 | $ 1,051.10 | $ 1.02 |
HypotheticalA | | $ 1,000.00 | $ 1,023.87 | $ 1.01 |
Service Class 2 | .35% | | | |
Actual | | $ 1,000.00 | $ 1,051.30 | $ 1.79 |
HypotheticalA | | $ 1,000.00 | $ 1,023.12 | $ 1.76 |
Investor Class | .20% | | | |
Actual | | $ 1,000.00 | $ 1,051.10 | $ 1.02 |
HypotheticalA | | $ 1,000.00 | $ 1,023.87 | $ 1.01 |
| Annualized
Expense Ratio | Beginning
Account Value
January 1, 2012 | Ending
Account Value
June 30, 2012 | Expenses Paid
During Period*
January 1, 2012
to June 30, 2012 |
VIP FundsManager 60% Portfolio | | | | |
Service Class | .20% | | | |
Actual | | $ 1,000.00 | $ 1,055.60 | $ 1.02 |
HypotheticalA | | $ 1,000.00 | $ 1,023.87 | $ 1.01 |
Service Class 2 | .35% | | | |
Actual | | $ 1,000.00 | $ 1,054.60 | $ 1.79 |
HypotheticalA | | $ 1,000.00 | $ 1,023.12 | $ 1.76 |
Investor Class | .20% | | | |
Actual | | $ 1,000.00 | $ 1,056.70 | $ 1.02 |
HypotheticalA | | $ 1,000.00 | $ 1,023.87 | $ 1.01 |
VIP FundsManager 70% Portfolio | | | | |
Service Class | .20% | | | |
Actual | | $ 1,000.00 | $ 1,063.10 | $ 1.03 |
HypotheticalA | | $ 1,000.00 | $ 1,023.87 | $ 1.01 |
Service Class 2 | .35% | | | |
Actual | | $ 1,000.00 | $ 1,063.20 | $ 1.80 |
HypotheticalA | | $ 1,000.00 | $ 1,023.12 | $ 1.76 |
Investor Class | .20% | | | |
Actual | | $ 1,000.00 | $ 1,064.20 | $ 1.03 |
HypotheticalA | | $ 1,000.00 | $ 1,023.87 | $ 1.01 |
VIP FundsManager 85% Portfolio | | | | |
Service Class | .20% | | | |
Actual | | $ 1,000.00 | $ 1,066.50 | $ 1.03 |
HypotheticalA | | $ 1,000.00 | $ 1,023.87 | $ 1.01 |
Service Class 2 | .35% | | | |
Actual | | $ 1,000.00 | $ 1,065.50 | $ 1.80 |
HypotheticalA | | $ 1,000.00 | $ 1,023.12 | $ 1.76 |
Investor Class | .20% | | | |
Actual | | $ 1,000.00 | $ 1,066.40 | $ 1.03 |
HypotheticalA | | $ 1,000.00 | $ 1,023.87 | $ 1.01 |
A 5% return per year before expenses
* Expenses are equal to each Class' annualized expense ratio, multiplied by the average account value over the period, multiplied by 182/ 366 (to reflect the one-half year period). The fees and expenses of the underlying Fidelity Funds in which the Fund invests are not included in each class' annualized expense ratio.
Semiannual Report
VIP FundsManager 20% Portfolio
Investment Changes (Unaudited)
Fund Holdings as of June 30, 2012 |
| % of fund's
net assets | % of fund's net assets
6 months ago |
Domestic Equity Funds | | |
Fidelity 130/30 Large Cap Fund | 0.0 * | 0.0 * |
Fidelity Air Transportation Portfolio | 0.1 | 0.1 |
Fidelity Automotive Portfolio | 0.1 | 0.1 |
Fidelity Banking Portfolio | 0.7 | 0.6 |
Fidelity Biotechnology Portfolio | 0.3 | 0.0 * |
Fidelity Blue Chip Growth Fund | 0.0 * | 0.0 * |
Fidelity Brokerage & Investment Management Portfolio | 0.3 | 0.1 |
Fidelity Capital Appreciation Fund | 0.6 | 0.0 |
Fidelity Chemicals Portfolio | 0.0 * | 0.3 |
Fidelity Commodity Strategy Fund | 0.0 * | 0.0 * |
Fidelity Communications Equipment Portfolio | 0.2 | 0.2 |
Fidelity Computers Portfolio | 0.4 | 0.3 |
Fidelity Construction & Housing Portfolio | 0.4 | 0.1 |
Fidelity Consumer Discretionary Portfolio | 0.7 | 0.9 |
Fidelity Consumer Finance Portfolio | 0.2 | 0.2 |
Fidelity Consumer Staples Portfolio | 1.7 | 1.6 |
Fidelity Contrafund | 0.0 * | 0.1 |
Fidelity Defense & Aerospace Portfolio | 0.0 * | 0.0 * |
Fidelity Disciplined Equity Fund | 0.0 * | 0.0 * |
Fidelity Dividend Growth Fund | 0.0 * | 0.1 |
Fidelity Electronics Portfolio | 0.4 | 0.4 |
Fidelity Energy Portfolio | 0.5 | 1.0 |
Fidelity Energy Service Portfolio | 0.4 | 0.1 |
Fidelity Environmental & Alternative Energy Portfolio | 0.0 * | 0.0 * |
Fidelity Equity-Income Fund | 0.0 * | 0.0 * |
Fidelity Equity-Income II Fund | 0.0 * | 0.0 * |
Fidelity Financial Services Portfolio | 0.2 | 0.3 |
Fidelity Fund | 0.0 * | 0.0 * |
Fidelity Global Commodity Stock Fund | 0.0 * | 0.0 * |
Fidelity Gold Portfolio | 0.4 | 1.4 |
Fidelity Growth Company Fund | 0.0 * | 0.0 * |
Fidelity Health Care Portfolio | 1.3 | 1.1 |
Fidelity Independence Fund | 0.0 * | 0.0 * |
Fidelity Industrial Equipment Portfolio | 0.4 | 0.4 |
Fidelity Industrials Portfolio | 0.9 | 0.9 |
Fidelity Insurance Portfolio | 0.5 | 0.5 |
Fidelity IT Services Portfolio | 0.5 | 0.3 |
|
| % of fund's
net assets | % of fund's net assets
6 months ago |
Fidelity Large Cap Stock Fund | 0.0 * | 0.1 |
Fidelity Large Cap Value Fund | 0.0 * | 0.0 * |
Fidelity Leisure Portfolio | 0.1 | 0.1 |
Fidelity Leveraged Company Stock Fund | 0.0 * | 0.0 * |
Fidelity Magellan Fund | 0.0 * | 0.0 * |
Fidelity Materials Portfolio | 0.0 * | 0.0 * |
Fidelity Medical Delivery Portfolio | 0.1 | 0.3 |
Fidelity Medical Equipment & Systems Portfolio | 0.0 * | 0.1 |
Fidelity Mega Cap Stock Fund | 0.2 | 0.2 |
Fidelity Mid-Cap Stock Fund | 0.0 * | 0.0 * |
Fidelity Multimedia Portfolio | 0.2 | 0.2 |
Fidelity Natural Gas Portfolio | 0.0 * | 0.0 |
Fidelity Natural Resources Portfolio | 0.0 * | 0.0 * |
Fidelity Pharmaceuticals Portfolio | 0.4 | 0.4 |
Fidelity Real Estate Investment Portfolio | 0.3 | 0.3 |
Fidelity Retailing Portfolio | 0.3 | 0.2 |
Fidelity Small Cap Growth Fund | 0.0 * | 0.0 * |
Fidelity Small Cap Stock Fund | 0.0 * | 0.0 * |
Fidelity Small Cap Value Fund | 0.0 * | 0.0 * |
Fidelity Software & Computer Services Portfolio | 1.2 | 1.1 |
Fidelity Technology Portfolio | 0.2 | 0.6 |
Fidelity Telecom and Utilities Fund | 0.7 | 0.5 |
Fidelity Telecommunications Portfolio | 0.1 | 0.5 |
Fidelity Transportation Portfolio | 0.1 | 0.1 |
Fidelity Utilities Portfolio | 0.1 | 0.3 |
Spartan Extended Market Index Fund Investor Class | 0.0 * | 0.1 |
Spartan Total Market Index Fund Investor Class | 0.0 * | 0.0 * |
VIP Energy Portfolio Investor Class | 0.4 | 0.5 |
VIP Mid Cap Portfolio Investor Class | 0.0* | 0.0* |
| 15.6 | 16.7 |
International Equity Funds | | |
Fidelity Canada Fund | 0.0 * | 0.1 |
Fidelity Diversified International Fund | 0.6 | 0.5 |
Fidelity Emerging Asia Fund | 0.1 | 0.5 |
Fidelity Emerging Markets Fund | 0.0 * | 0.0 * |
Fidelity International Capital Appreciation Fund | 0.2 | 0.0 * |
Fidelity International Discovery Fund | 0.0 * | 0.4 |
Fund Holdings as of June 30, 2012 |
| % of fund's
net assets | % of fund's net assets
6 months ago |
International Equity Funds - continued | | |
Fidelity International Real Estate Fund | 0.1 | 0.0 * |
Fidelity International Small Cap Fund | 0.0 * | 0.1 |
Fidelity International Small Cap Opportunities Fund | 0.3 | 0.4 |
Fidelity International Value Fund | 0.1 | 0.4 |
Fidelity Japan Fund | 0.1 | 0.1 |
Fidelity Japan Smaller Companies Fund | 0.1 | 0.2 |
Fidelity Nordic Fund | 0.2 | 0.3 |
Fidelity Overseas Fund | 0.0 * | 0.0 * |
Fidelity Pacific Basin Fund | 0.2 | 0.2 |
Spartan International Index Fund Investor Class | 1.0 | 1.4 |
| 3.0 | 4.6 |
Fixed-Income Funds | | |
Fidelity Floating Rate High Income Fund | 2.7 | 2.9 |
Fidelity Focused High Income Fund | 0.3 | 0.3 |
Fidelity High Income Fund | 1.8 | 2.1 |
Fidelity New Markets Income Fund | 0.9 | 0.9 |
Fidelity Real Estate Income Fund | 0.2 | 0.4 |
Spartan U.S. Bond Index Fund Investor Class | 49.7 | 50.1 |
| 55.6 | 56.7 |
Money Market Funds | | |
Fidelity Institutional Money Market Portfolio Class I | 2.2 | 2.4 |
Fidelity Institutional Prime Money Market Portfolio Class I | 21.4 | 17.2 |
Fidelity Select Money Market Portfolio | 2.2 | 2.4 |
| 25.8 | 22.0 |
Net Other Assets (Liabilities)* | 0.0 | 0.0 |
| 100.0 | 100.0 |
* Amount represents less than 0.1%
Asset Allocation (% of fund's net assets) |
As of June 30, 2012 |
 | Domestic Equity Funds | 15.6% | |
 | International Equity Funds | 3.0% | |
 | Fixed Income Funds | 55.6% | |
 | Money Market Funds | 25.8% | |

As of December 31, 2011 |
 | Domestic Equity Funds | 16.7% | |
| International Equity Funds | 4.6% | |
| Fixed Income Funds | 56.7% | |
| Money Market Funds | 22.0% | |

Semiannual Report
VIP FundsManager 20% Portfolio
Investments June 30, 2012 (Unaudited)
Showing Percentage of Net Assets
Equity Funds - 18.6% |
| Shares | | Value |
Domestic Equity Funds - 15.6% |
Fidelity 130/30 Large Cap Fund | 2,955 | | $ 21,274 |
Fidelity Air Transportation Portfolio | 7,451 | | 285,522 |
Fidelity Automotive Portfolio | 7,843 | | 258,114 |
Fidelity Banking Portfolio | 222,453 | | 4,150,980 |
Fidelity Biotechnology Portfolio | 18,777 | | 1,960,129 |
Fidelity Blue Chip Growth Fund | 501 | | 23,492 |
Fidelity Brokerage & Investment Management Portfolio | 43,982 | | 1,940,911 |
Fidelity Capital Appreciation Fund | 113,451 | | 3,217,456 |
Fidelity Chemicals Portfolio | 1,625 | | 176,961 |
Fidelity Commodity Strategy Fund | 1,164 | | 9,373 |
Fidelity Communications Equipment Portfolio | 44,203 | | 911,466 |
Fidelity Computers Portfolio (a) | 37,413 | | 2,281,836 |
Fidelity Construction & Housing Portfolio | 49,741 | | 2,094,578 |
Fidelity Consumer Discretionary Portfolio | 164,104 | | 4,307,724 |
Fidelity Consumer Finance Portfolio | 106,320 | | 1,407,678 |
Fidelity Consumer Staples Portfolio | 126,359 | | 9,850,948 |
Fidelity Contrafund | 3,266 | | 244,305 |
Fidelity Defense & Aerospace Portfolio | 1,204 | | 98,118 |
Fidelity Disciplined Equity Fund | 2,072 | | 48,236 |
Fidelity Dividend Growth Fund | 2,115 | | 59,521 |
Fidelity Electronics Portfolio | 48,766 | | 2,271,510 |
Fidelity Energy Portfolio | 66,745 | | 3,126,347 |
Fidelity Energy Service Portfolio (a) | 37,250 | | 2,206,699 |
Fidelity Environmental & Alternative Energy Portfolio | 10,901 | | 167,870 |
Fidelity Equity-Income Fund | 683 | | 30,402 |
Fidelity Equity-Income II Fund | 697 | | 13,131 |
Fidelity Financial Services Portfolio | 22,936 | | 1,289,898 |
Fidelity Fund | 645 | | 22,275 |
Fidelity Global Commodity Stock Fund | 3,704 | | 50,119 |
Fidelity Gold Portfolio | 63,303 | | 2,273,837 |
Fidelity Growth Company Fund | 1,139 | | 104,247 |
Fidelity Health Care Portfolio | 55,425 | | 7,487,409 |
Fidelity Independence Fund | 310 | | 7,386 |
Fidelity Industrial Equipment Portfolio | 66,599 | | 2,267,020 |
Fidelity Industrials Portfolio | 213,814 | | 5,031,054 |
Fidelity Insurance Portfolio | 62,613 | | 2,996,681 |
Fidelity IT Services Portfolio | 113,452 | | 2,663,842 |
Fidelity Large Cap Stock Fund | 13,414 | | 252,042 |
Fidelity Large Cap Value Fund | 9,978 | | 110,461 |
Fidelity Leisure Portfolio | 3,471 | | 358,447 |
Fidelity Leveraged Company Stock Fund | 195 | | 5,511 |
Fidelity Magellan Fund | 378 | | 26,205 |
Fidelity Materials Portfolio | 793 | | 51,976 |
Fidelity Medical Delivery Portfolio (a) | 6,633 | | 405,006 |
Fidelity Medical Equipment & Systems Portfolio | 2,164 | | 60,598 |
Fidelity Mega Cap Stock Fund | 99,407 | | 1,104,411 |
Fidelity Mid-Cap Stock Fund | 2,089 | | 59,297 |
Fidelity Multimedia Portfolio | 23,186 | | 1,175,290 |
Fidelity Natural Gas Portfolio | 146 | | 4,328 |
|
| Shares | | Value |
Fidelity Natural Resources Portfolio | 3,159 | | $ 92,437 |
Fidelity Pharmaceuticals Portfolio | 167,949 | | 2,473,892 |
Fidelity Real Estate Investment Portfolio | 57,330 | | 1,813,348 |
Fidelity Retailing Portfolio | 27,472 | | 1,633,505 |
Fidelity Small Cap Growth Fund | 8,138 | | 131,183 |
Fidelity Small Cap Stock Fund | 3,191 | | 54,308 |
Fidelity Small Cap Value Fund | 13,783 | | 209,639 |
Fidelity Software & Computer Services Portfolio | 85,959 | | 7,152,622 |
Fidelity Technology Portfolio (a) | 9,748 | | 950,392 |
Fidelity Telecom and Utilities Fund | 224,412 | | 4,151,619 |
Fidelity Telecommunications Portfolio | 12,837 | | 613,370 |
Fidelity Transportation Portfolio | 10,933 | | 576,959 |
Fidelity Utilities Portfolio | 5,674 | | 322,935 |
Spartan Extended Market Index Fund Investor Class | 6,317 | | 241,437 |
Spartan Total Market Index Fund Investor Class | 3,395 | | 133,717 |
VIP Energy Portfolio Investor Class | 139,023 | | 2,482,952 |
VIP Mid Cap Portfolio Investor Class | 79 | | 2,460 |
TOTAL DOMESTIC EQUITY FUNDS | | 92,008,696 |
International Equity Funds - 3.0% |
Fidelity Canada Fund | 2,454 | | 123,373 |
Fidelity Diversified International Fund | 119,795 | | 3,238,068 |
Fidelity Emerging Asia Fund | 22,332 | | 589,119 |
Fidelity Emerging Markets Fund | 11,006 | | 230,128 |
Fidelity International Capital Appreciation Fund | 115,320 | | 1,410,360 |
Fidelity International Discovery Fund | 7,048 | | 206,780 |
Fidelity International Real Estate Fund | 31,129 | | 252,769 |
Fidelity International Small Cap Fund | 6,426 | | 118,170 |
Fidelity International Small Cap Opportunities Fund | 169,369 | | 1,683,528 |
Fidelity International Value Fund | 119,319 | | 811,367 |
Fidelity Japan Fund | 53,354 | | 517,533 |
Fidelity Japan Smaller Companies Fund | 32,927 | | 286,465 |
Fidelity Nordic Fund | 37,421 | | 1,057,895 |
Fidelity Overseas Fund | 436 | | 12,528 |
Fidelity Pacific Basin Fund | 40,095 | | 914,556 |
Spartan International Index Fund Investor Class | 193,959 | | 5,971,990 |
TOTAL INTERNATIONAL EQUITY FUNDS | | 17,424,629 |
TOTAL EQUITY FUNDS (Cost $99,714,144) |
109,433,325
|
Fixed-Income Funds - 55.6% |
| | | |
Fidelity Floating Rate High Income Fund | 1,643,422 | | 16,089,104 |
Fidelity Focused High Income Fund | 165,733 | | 1,523,085 |
Fidelity High Income Fund | 1,198,384 | | 10,761,490 |
Fidelity New Markets Income Fund | 331,341 | | 5,520,136 |
Fixed-Income Funds - continued |
| Shares | | Value |
Fidelity Real Estate Income Fund | 100,351 | | $ 1,111,888 |
Spartan U.S. Bond Index Fund Investor Class | 24,586,038 | | 292,819,709 |
TOTAL FIXED-INCOME FUNDS (Cost $308,625,227) |
327,825,412
|
Money Market Funds - 25.8% |
| | | |
Fidelity Institutional Money Market Portfolio Class I | 13,182,277 | | 13,182,277 |
Fidelity Institutional Prime Money Market Portfolio Class I | 126,024,017 | | 126,024,017 |
Fidelity Select Money Market Portfolio | 12,956,393 | | 12,956,393 |
TOTAL MONEY MARKET FUNDS (Cost $152,162,687) |
152,162,687
|
TOTAL INVESTMENT PORTFOLIO - 100.0% (Cost $560,502,058) | | 589,421,424 |
NET OTHER ASSETS (LIABILITIES) - 0.0% | | (96,909) |
NET ASSETS - 100% | $ 589,324,515 |
Legend |
(a) Non-income producing |
Other Information |
All investments are categorized as Level 1 under the Fair Value Hierarchy. The inputs or methodology used for valuing securities may not be an indication of the risk associated with investing in those securities. For more information on valuation inputs, please refer to the Security Valuation section in the accompanying Notes to Financial Statements. |
See accompanying notes which are an integral part of the financial statements.
Semiannual Report
VIP FundsManager 20% Portfolio
Statement of Assets and Liabilities
| June 30, 2012 (Unaudited) |
| | |
Assets | | |
Investment in securities, at value (cost $560,502,058) - See accompanying schedule | | $ 589,421,424 |
Receivable for fund shares sold | | 169,240 |
Total assets | | 589,590,664 |
| | |
Liabilities | | |
Payable for investments purchased | $ 168,731 | |
Payable for fund shares redeemed | 508 | |
Accrued management fee | 96,763 | |
Distribution and service plan fees payable | 147 | |
Total liabilities | | 266,149 |
| | |
Net Assets | | $ 589,324,515 |
Net Assets consist of: | | |
Paid in capital | | $ 558,648,544 |
Undistributed net investment income | | 3,969,893 |
Accumulated undistributed net realized gain (loss) on investments | | (2,213,288) |
Net unrealized appreciation (depreciation) on investments | | 28,919,366 |
Net Assets | | $ 589,324,515 |
Service Class:
Net Asset Value, offering price and redemption price per share ($68,033 ÷ 6,183 shares) | | $ 11.00 |
| | |
Service Class 2:
Net Asset Value, offering price and redemption price per share ($1,208,439 ÷ 110,069 shares) | | $ 10.98 |
| | |
Investor Class:
Net Asset Value, offering price and redemption price per share ($588,048,043 ÷ 53,470,039 shares) | | $ 11.00 |
Statement of Operations
Six months ended June 30, 2012 (Unaudited) |
| | |
Investment Income | | |
Income distributions from underlying funds | | $ 4,536,521 |
| | |
Expenses | | |
Management fee | $ 706,113 | |
Distribution and service plan fees | 1,798 | |
Independent trustees' compensation | 965 | |
Total expenses before reductions | 708,876 | |
Expense reductions | (142,248) | 566,628 |
Net investment income (loss) | | 3,969,893 |
Realized and Unrealized Gain (Loss) Realized gain (loss) on sale of underlying fund shares | 2,648,959 | |
Capital gain distributions from underlying funds | 716,738 | |
Total net realized gain (loss) | | 3,365,697 |
Change in net unrealized appreciation (depreciation) on underlying funds | | 8,935,621 |
Net gain (loss) | | 12,301,318 |
Net increase (decrease) in net assets resulting from operations | | $ 16,271,211 |
See accompanying notes which are an integral part of the financial statements.
Semiannual Report
VIP FundsManager 20% Portfolio
Financial Statements - continued
Statement of Changes in Net Assets
| Six months ended
June 30, 2012
(Unaudited) | Year ended
December 31,
2011 |
Increase (Decrease) in Net Assets | | |
Operations | | |
Net investment income (loss) | $ 3,969,893 | $ 8,603,669 |
Net realized gain (loss) | 3,365,697 | 7,076,067 |
Change in net unrealized appreciation (depreciation) | 8,935,621 | (5,837,126) |
Net increase (decrease) in net assets resulting from operations | 16,271,211 | 9,842,610 |
Distributions to shareholders from net investment income | - | (8,600,023) |
Distributions to shareholders from net realized gain | - | (983,033) |
Total distributions | - | (9,583,056) |
Share transactions - net increase (decrease) | 38,048,841 | 142,882,053 |
Total increase (decrease) in net assets | 54,320,052 | 143,141,607 |
| | |
Net Assets | | |
Beginning of period | 535,004,463 | 391,862,856 |
End of period (including undistributed net investment income of $3,969,893 and $0, respectively) | $ 589,324,515 | $ 535,004,463 |
Financial Highlights - Service Class
| Six months ended
June 30, 2012 | Years ended December 31, |
| (Unaudited) | 2011 | 2010 | 2009 | 2008 | 2007 |
Selected Per-Share Data | | | | | | |
Net asset value, beginning of period | $ 10.68 | $ 10.63 | $ 10.07 | $ 9.27 | $ 10.48 | $ 10.34 |
Income from Investment Operations | | | | | | |
Net investment income (loss) E | .08 | .20 | .19 | .21 | .34 | .45 |
Net realized and unrealized gain (loss) | .24 | .05 | .55 | .76 | (1.21) | .18 |
Total from investment operations | .32 | .25 | .74 | .97 | (.87) | .63 |
Distributions from net investment income | - | (.18) | (.17) | (.16) | (.30) | (.29) |
Distributions from net realized gain | - | (.02) | (.01) | (.01) | (.04) | (.20) |
Total distributions | - | (.20) | (.18) | (.17) I | (.34) H | (.49) |
Net asset value, end of period | $ 11.00 | $ 10.68 | $ 10.63 | $ 10.07 | $ 9.27 | $ 10.48 |
Total Return B, C, D | 3.00% | 2.30% | 7.36% | 10.43% | (8.33)% | 6.12% |
Ratios to Average Net Assets F, G | | | | | | |
Expenses before reductions | .35% A | .35% | .35% | .35% | .35% | .35% |
Expenses net of fee waivers, if any | .20% A | .20% | .20% | .20% | .20% | .20% |
Expenses net of all reductions | .20% A | .20% | .20% | .20% | .20% | .20% |
Net investment income (loss) | 1.41% A | 1.84% | 1.84% | 2.19% | 3.33% | 4.20% |
Supplemental Data | | | | | | |
Net assets, end of period (000 omitted) | $ 68 | $ 64 | $ 67 | $ 61 | $ 88 | $ 112 |
Portfolio turnover rate | 19% A | 12% | 14% | 31% | 64% | 76% |
AAnnualized BTotal returns for periods of less than one year are not annualized. CTotal returns do not reflect charges attributable to your insurance company's separate account. Inclusion of these charges would reduce the total returns shown. DTotal returns would have been lower if certain expenses had not been reduced during the applicable periods shown. ECalculated based on average shares outstanding during the period. FAmounts do not include the activity of the Underlying Funds. GExpense ratios reflect operating expenses of the class. Expenses before reductions do not reflect amounts reimbursed by the investment adviser or reductions from expense offset arrangements and do not represent the amount paid by the class during periods when reimbursements or reductions occur. Expenses net of fee waivers reflect expenses after reimbursement by the investment adviser but prior to reductions from expense offset arrangements. Expenses net of all reductions represent the net expenses paid by the class but do not include expenses of the investment companies in which the Fund invests. HTotal distributions of $.34 per share is comprised of distributions from net investment income of $.302 and distributions from net realized gain of $.035 per share. ITotal distributions of $.17 per share is comprised of distributions from net investment income of $.161 and distributions from net realized gain of $.006 per share. |
See accompanying notes which are an integral part of the financial statements.
Semiannual Report
Financial Highlights - Service Class 2
| Six months ended
June 30, 2012 | Years ended December 31, |
| (Unaudited) | 2011 | 2010 | 2009 | 2008 | 2007 |
Selected Per-Share Data | | | | | | |
Net asset value, beginning of period | $ 10.67 | $ 10.62 | $ 10.06 | $ 9.28 | $ 10.48 | $ 10.34 |
Income from Investment Operations | | | | | | |
Net investment income (loss) E | .07 | .18 | .18 | .20 | .32 | .43 |
Net realized and unrealized gain (loss) | .24 | .05 | .55 | .74 | (1.20) | .18 |
Total from investment operations | .31 | .23 | .73 | .94 | (.88) | .61 |
Distributions from net investment income | - | (.16) | (.16) | (.16) | (.29) | (.27) |
Distributions from net realized gain | - | (.02) | (.01) | (.01) | (.04) | (.20) |
Total distributions | - | (.18) | (.17) | (.16) I | (.32) H | (.47) |
Net asset value, end of period | $ 10.98 | $ 10.67 | $ 10.62 | $ 10.06 | $ 9.28 | $ 10.48 |
Total Return B, C, D | 2.91% | 2.20% | 7.24% | 10.14% | (8.40)% | 5.96% |
Ratios to Average Net Assets F, G | | | | | | |
Expenses before reductions | .50% A | .50% | .50% | .50% | .50% | .50% |
Expenses net of fee waivers, if any | .35% A | .35% | .35% | .35% | .35% | .35% |
Expenses net of all reductions | .35% A | .35% | .35% | .35% | .35% | .35% |
Net investment income (loss) | 1.26% A | 1.69% | 1.69% | 2.04% | 3.18% | 4.05% |
Supplemental Data | | | | | | |
Net assets, end of period (000 omitted) | $ 1,208 | $ 1,373 | $ 569 | $ 425 | $ 88 | $ 112 |
Portfolio turnover rate | 19% A | 12% | 14% | 31% | 64% | 76% |
AAnnualized BTotal returns for periods of less than one year are not annualized. CTotal returns do not reflect charges attributable to your insurance company's separate account. Inclusion of these charges would reduce the total returns shown. DTotal returns would have been lower if certain expenses had not been reduced during the applicable periods shown. ECalculated based on average shares outstanding during the period. FAmounts do not include the activity of the Underlying Funds. GExpense ratios reflect operating expenses of the class. Expenses before reductions do not reflect amounts reimbursed by the investment adviser or reductions from expense offset arrangements and do not represent the amount paid by the class during periods when reimbursements or reductions occur. Expenses net of fee waivers reflect expenses after reimbursement by the investment adviser but prior to reductions from expense offset arrangements. Expenses net of all reductions represent the net expenses paid by the class but do not include expenses of the investment companies in which the Fund invests. HTotal distributions of $.32 per share is comprised of distributions from net investment income of $.285 and distributions from net realized gain of $.035 per share. ITotal distributions of $.16 per share is comprised of distributions from net investment income of $.155 and distributions from net realized gain of $.006 per share. |
Financial Highlights - Investor Class
| Six months ended
June 30, 2012 | Years ended December 31, |
| (Unaudited) | 2011 | 2010 | 2009 | 2008 | 2007 |
Selected Per-Share Data | | | | | | |
Net asset value, beginning of period | $ 10.68 | $ 10.63 | $ 10.06 | $ 9.27 | $ 10.48 | $ 10.34 |
Income from Investment Operations | | | | | | |
Net investment income (loss) E | .08 | .20 | .19 | .21 | .33 | .45 |
Net realized and unrealized gain (loss) | .24 | .05 | .56 | .75 | (1.20) | .18 |
Total from investment operations | .32 | .25 | .75 | .96 | (.87) | .63 |
Distributions from net investment income | - | (.18) | (.17) | (.16) | (.30) | (.29) |
Distributions from net realized gain | - | (.02) | (.01) | (.01) | (.04) | (.20) |
Total distributions | - | (.20) | (.18) | (.17) I | (.34) H | (.49) |
Net asset value, end of period | $ 11.00 | $ 10.68 | $ 10.63 | $ 10.06 | $ 9.27 | $ 10.48 |
Total Return B, C, D | 3.00% | 2.31% | 7.47% | 10.32% | (8.33)% | 6.12% |
Ratios to Average Net Assets F, G | | | | | | |
Expenses before reductions | .25% A | .25% | .25% | .25% | .25% | .25% |
Expenses net of fee waivers, if any | .20% A | .20% | .20% | .20% | .20% | .20% |
Expenses net of all reductions | .20% A | .20% | .20% | .20% | .20% | .20% |
Net investment income (loss) | 1.40% A | 1.84% | 1.84% | 2.19% | 3.33% | 4.20% |
Supplemental Data | | | | | | |
Net assets, end of period (000 omitted) | $ 588,048 | $ 533,568 | $ 391,226 | $ 270,852 | $ 153,110 | $ 115,963 |
Portfolio turnover rate | 19% A | 12% | 14% | 31% | 64% | 76% |
AAnnualized BTotal returns for periods of less than one year are not annualized. CTotal returns do not reflect charges attributable to your insurance company's separate account. Inclusion of these charges would reduce the total returns shown. DTotal returns would have been lower if certain expenses had not been reduced during the applicable periods shown. ECalculated based on average shares outstanding during the period. FAmounts do not include the activity of the Underlying Funds. GExpense ratios reflect operating expenses of the class. Expenses before reductions do not reflect amounts reimbursed by the investment adviser or reductions from expense offset arrangements and do not represent the amount paid by the class during periods when reimbursements or reductions occur. Expenses net of fee waivers reflect expenses after reimbursement by the investment adviser but prior to reductions from expense offset arrangements. Expenses net of all reductions represent the net expenses paid by the class but do not include expenses of the investment companies in which the Fund invests. HTotal distributions of $.34 per share is comprised of distributions from net investment income of $.302 and distributions from net realized gain of $.035 per share. ITotal distributions of $.17 per share is comprised of distributions from net investment income of $.161 and distributions from net realized gain of $.006 per share. |
See accompanying notes which are an integral part of the financial statements.
Semiannual Report
VIP FundsManager 50% Portfolio
Investment Changes (Unaudited)
Fund Holdings as of June 30, 2012 |
| % of fund's
net assets | % of fund's net assets
6 months ago |
Domestic Equity Funds | | |
Fidelity 130/30 Large Cap Fund | 0.0* | 0.0* |
Fidelity Air Transportation Portfolio | 0.1 | 0.1 |
Fidelity Automotive Portfolio | 0.2 | 0.2 |
Fidelity Banking Portfolio | 1.6 | 1.0 |
Fidelity Biotechnology Portfolio | 0.9 | 0.4 |
Fidelity Blue Chip Growth Fund | 0.0* | 0.3 |
Fidelity Brokerage & Investment Management Portfolio | 0.0* | 0.3 |
Fidelity Capital Appreciation Fund | 1.1 | 0.0 |
Fidelity Chemicals Portfolio | 0.3 | 0.4 |
Fidelity Commodity Strategy Fund | 0.0* | 0.0* |
Fidelity Communications Equipment Portfolio | 0.0* | 0.2 |
Fidelity Computers Portfolio | 1.0 | 0.9 |
Fidelity Construction & Housing Portfolio | 0.8 | 0.4 |
Fidelity Consumer Discretionary Portfolio | 1.4 | 1.3 |
Fidelity Consumer Finance Portfolio | 0.1 | 0.1 |
Fidelity Consumer Staples Portfolio | 3.7 | 3.4 |
Fidelity Contrafund | 0.1 | 0.1 |
Fidelity Defense & Aerospace Portfolio | 0.1 | 0.1 |
Fidelity Disciplined Equity Fund | 0.0* | 0.0* |
Fidelity Dividend Growth Fund | 0.2 | 0.8 |
Fidelity Electronics Portfolio | 0.8 | 0.5 |
Fidelity Energy Portfolio | 1.6 | 2.3 |
Fidelity Energy Service Portfolio | 0.5 | 0.7 |
Fidelity Environmental & Alternative Energy Portfolio | 0.1 | 0.2 |
Fidelity Equity-Income Fund | 0.0* | 0.0* |
Fidelity Equity-Income II Fund | 0.0* | 0.0* |
Fidelity Financial Services Portfolio | 1.1 | 1.2 |
Fidelity Fund | 0.1 | 0.1 |
Fidelity Global Commodity Stock Fund | 0.0* | 0.1 |
Fidelity Gold Portfolio | 0.7 | 1.2 |
Fidelity Growth Company Fund | 0.7 | 0.8 |
Fidelity Health Care Portfolio | 1.2 | 1.0 |
Fidelity Independence Fund | 0.0* | 0.0* |
Fidelity Industrial Equipment Portfolio | 0.8 | 0.8 |
Fidelity Industrials Portfolio | 1.4 | 1.3 |
Fidelity Insurance Portfolio | 1.4 | 1.4 |
Fidelity IT Services Portfolio | 0.9 | 0.6 |
|
| % of fund's
net assets | % of fund's net assets
6 months ago |
Fidelity Large Cap Stock Fund | 0.0* | 0.2 |
Fidelity Large Cap Value Fund | 0.0* | 0.0* |
Fidelity Leisure Portfolio | 0.4 | 0.4 |
Fidelity Leveraged Company Stock Fund | 0.0* | 0.0* |
Fidelity Magellan Fund | 0.0* | 0.0* |
Fidelity Materials Portfolio | 0.0* | 0.0* |
Fidelity Medical Delivery Portfolio | 0.7 | 1.0 |
Fidelity Medical Equipment & Systems Portfolio | 0.1 | 0.1 |
Fidelity Mega Cap Stock Fund | 0.3 | 0.2 |
Fidelity Mid Cap Value Fund | 0.0* | 0.0* |
Fidelity Mid-Cap Stock Fund | 0.0* | 0.0* |
Fidelity Multimedia Portfolio | 0.4 | 0.4 |
Fidelity Nasdaq Composite Index Fund | 0.1 | 0.0* |
Fidelity Natural Gas Portfolio | 0.1 | 0.0 |
Fidelity Natural Resources Portfolio | 0.0* | 0.1 |
Fidelity Pharmaceuticals Portfolio | 1.3 | 1.4 |
Fidelity Real Estate Investment Portfolio | 0.4 | 0.4 |
Fidelity Retailing Portfolio | 0.8 | 0.9 |
Fidelity Small Cap Growth Fund | 0.0* | 0.0* |
Fidelity Small Cap Stock Fund | 0.0* | 0.0* |
Fidelity Small Cap Value Fund | 0.0* | 0.0* |
Fidelity Software & Computer Services Portfolio | 1.1 | 1.0 |
Fidelity Technology Portfolio | 2.4 | 2.9 |
Fidelity Telecom and Utilities Fund | 0.7 | 0.8 |
Fidelity Telecommunications Portfolio | 1.0 | 1.1 |
Fidelity Transportation Portfolio | 0.3 | 0.3 |
Fidelity Utilities Portfolio | 0.9 | 1.0 |
Spartan 500 Index Fund Investor Class | 0.0* | 0.0* |
Spartan Extended Market Index Fund Investor Class | 1.1 | 1.2 |
Spartan Total Market Index Fund Investor Class | 1.3 | 1.3 |
VIP Mid Cap Portfolio Investor Class | 0.0* | 0.2 |
| 36.3 | 37.1 |
International Equity Funds | | |
Fidelity Canada Fund | 0.2 | 0.5 |
Fidelity China Region Fund | 0.1 | 0.1 |
Fidelity Diversified International Fund | 1.2 | 0.6 |
Fidelity Emerging Asia Fund | 0.5 | 0.7 |
Fund Holdings as of June 30, 2012 |
| % of fund's
net assets | % of fund's net assets
6 months ago |
International Equity Funds - continued | | |
Fidelity Emerging Markets Fund | 0.2 | 0.3 |
Fidelity International Capital Appreciation Fund | 0.9 | 0.4 |
Fidelity International Discovery Fund | 0.0* | 0.4 |
Fidelity International Growth Fund | 0.5 | 0.0 |
Fidelity International Real Estate Fund | 0.1 | 0.1 |
Fidelity International Small Cap Fund | 0.2 | 0.2 |
Fidelity International Small Cap Opportunities Fund | 0.6 | 0.8 |
Fidelity International Value Fund | 0.1 | 0.5 |
Fidelity Japan Fund | 0.2 | 0.2 |
Fidelity Japan Smaller Companies Fund | 0.2 | 0.3 |
Fidelity Latin America Fund | 0.1 | 0.0 |
Fidelity Nordic Fund | 0.3 | 0.8 |
Fidelity Overseas Fund | 0.0* | 0.0* |
Fidelity Pacific Basin Fund | 0.8 | 0.8 |
Spartan International Index Fund Investor Class | 5.7 | 6.2 |
| 11.9 | 12.9 |
Fixed-Income Funds | | |
Fidelity Floating Rate High Income Fund | 2.7 | 2.9 |
Fidelity Focused High Income Fund | 0.3 | 0.4 |
Fidelity High Income Fund | 1.8 | 2.4 |
Fidelity New Markets Income Fund | 0.7 | 0.7 |
Fidelity Real Estate Income Fund | 0.4 | 0.4 |
Spartan U.S. Bond Index Fund Investor Class | 37.8 | 38.3 |
| 43.7 | 45.1 |
Money Market Funds | | |
Fidelity Institutional Prime Money Market Portfolio Class I | 6.9 | 3.6 |
Fidelity Select Money Market Portfolio | 1.2 | 1.3 |
| 8.1 | 4.9 |
Net Other Assets (Liabilities)* | 0.0 | 0.0 |
| 100.0 | 100.0 |
* Amount represents less than 0.1%
Asset Allocation (% of fund's net assets) |
As of June 30, 2012 |
| Domestic Equity Funds | 36.3% | |
| International Equity Funds | 11.9% | |
| Fixed Income Funds | 43.7% | |
| Money Market Funds | 8.1% | |

As of December 31, 2011 |
| Domestic Equity Funds | 37.1% | |
| International Equity Funds | 12.9% | |
| Fixed Income Funds | 45.1% | |
| Money Market Funds | 4.9% | |

Semiannual Report
VIP FundsManager 50% Portfolio
Investments June 30, 2012 (Unaudited)
Showing Percentage of Net Assets
Equity Funds - 48.2% |
| Shares | | Value |
Domestic Equity Funds - 36.3% |
Fidelity 130/30 Large Cap Fund | 11,827 | | $ 85,152 |
Fidelity Air Transportation Portfolio | 29,348 | | 1,124,621 |
Fidelity Automotive Portfolio | 50,364 | | 1,657,465 |
Fidelity Banking Portfolio | 766,868 | | 14,309,755 |
Fidelity Biotechnology Portfolio | 72,091 | | 7,525,553 |
Fidelity Blue Chip Growth Fund | 3,762 | | 176,495 |
Fidelity Brokerage & Investment Management Portfolio | 3,378 | | 149,062 |
Fidelity Capital Appreciation Fund | 343,660 | | 9,746,191 |
Fidelity Chemicals Portfolio | 23,095 | | 2,514,836 |
Fidelity Commodity Strategy Fund | 1,164 | | 9,373 |
Fidelity Communications Equipment Portfolio | 8,616 | | 177,661 |
Fidelity Computers Portfolio (a) | 148,396 | | 9,050,671 |
Fidelity Construction & Housing Portfolio | 157,168 | | 6,618,357 |
Fidelity Consumer Discretionary Portfolio | 464,565 | | 12,194,827 |
Fidelity Consumer Finance Portfolio | 32,956 | | 436,336 |
Fidelity Consumer Staples Portfolio | 416,444 | | 32,465,938 |
Fidelity Contrafund | 12,504 | | 935,422 |
Fidelity Defense & Aerospace Portfolio | 12,454 | | 1,014,766 |
Fidelity Disciplined Equity Fund | 12,778 | | 297,481 |
Fidelity Dividend Growth Fund | 66,430 | | 1,869,339 |
Fidelity Electronics Portfolio | 142,995 | | 6,660,689 |
Fidelity Energy Portfolio | 297,435 | | 13,931,844 |
Fidelity Energy Service Portfolio (a) | 65,891 | | 3,903,412 |
Fidelity Environmental & Alternative Energy Portfolio | 25,550 | | 393,472 |
Fidelity Equity-Income Fund | 1,515 | | 67,472 |
Fidelity Equity-Income II Fund | 523 | | 9,867 |
Fidelity Financial Services Portfolio | 165,686 | | 9,318,172 |
Fidelity Fund | 16,244 | | 560,565 |
Fidelity Global Commodity Stock Fund | 4,500 | | 60,888 |
Fidelity Gold Portfolio | 166,909 | | 5,995,366 |
Fidelity Growth Company Fund | 70,808 | | 6,483,187 |
Fidelity Health Care Portfolio | 77,638 | | 10,488,055 |
Fidelity Independence Fund | 977 | | 23,265 |
Fidelity Industrial Equipment Portfolio | 216,245 | | 7,360,973 |
Fidelity Industrials Portfolio | 529,850 | | 12,467,382 |
Fidelity Insurance Portfolio | 264,204 | | 12,644,792 |
Fidelity IT Services Portfolio | 327,353 | | 7,686,239 |
Fidelity Large Cap Stock Fund | 19,399 | | 364,506 |
Fidelity Large Cap Value Fund | 31,910 | | 353,245 |
Fidelity Leisure Portfolio | 33,413 | | 3,450,844 |
Fidelity Leveraged Company Stock Fund | 766 | | 21,660 |
Fidelity Magellan Fund | 2,849 | | 197,530 |
Fidelity Materials Portfolio | 2,729 | | 178,886 |
Fidelity Medical Delivery Portfolio (a) | 105,050 | | 6,414,340 |
Fidelity Medical Equipment & Systems Portfolio | 22,729 | | 636,425 |
Fidelity Mega Cap Stock Fund | 206,620 | | 2,295,552 |
Fidelity Mid Cap Value Fund | 18,884 | | 312,154 |
Fidelity Mid-Cap Stock Fund | 5,647 | | 160,255 |
Fidelity Multimedia Portfolio | 74,085 | | 3,755,379 |
|
| Shares | | Value |
Fidelity Nasdaq Composite Index Fund | 10,253 | | $ 401,608 |
Fidelity Natural Gas Portfolio | 35,426 | | 1,047,895 |
Fidelity Natural Resources Portfolio | 3,459 | | 101,198 |
Fidelity Pharmaceuticals Portfolio | 804,197 | | 11,845,820 |
Fidelity Real Estate Investment Portfolio | 117,836 | | 3,727,148 |
Fidelity Retailing Portfolio | 123,192 | | 7,325,004 |
Fidelity Small Cap Growth Fund | 3,946 | | 63,613 |
Fidelity Small Cap Stock Fund | 7,856 | | 133,716 |
Fidelity Small Cap Value Fund | 8,498 | | 129,259 |
Fidelity Software & Computer Services Portfolio | 120,517 | | 10,028,210 |
Fidelity Technology Portfolio (a) | 220,524 | | 21,501,067 |
Fidelity Telecom and Utilities Fund | 348,383 | | 6,445,087 |
Fidelity Telecommunications Portfolio | 179,849 | | 8,593,190 |
Fidelity Transportation Portfolio | 52,455 | | 2,768,047 |
Fidelity Utilities Portfolio | 142,339 | | 8,100,532 |
Spartan 500 Index Fund Investor Class | 2,852 | | 138,359 |
Spartan Extended Market Index Fund Investor Class | 242,370 | | 9,263,400 |
Spartan Total Market Index Fund Investor Class | 283,136 | | 11,152,739 |
VIP Mid Cap Portfolio Investor Class | 7,921 | | 245,390 |
TOTAL DOMESTIC EQUITY FUNDS | | 321,566,999 |
International Equity Funds - 11.8% |
Fidelity Canada Fund | 30,650 | | 1,540,760 |
Fidelity China Region Fund | 29,194 | | 770,734 |
Fidelity Diversified International Fund | 385,048 | | 10,407,850 |
Fidelity Emerging Asia Fund | 174,433 | | 4,601,544 |
Fidelity Emerging Markets Fund | 105,061 | | 2,196,825 |
Fidelity International Capital Appreciation Fund | 638,212 | | 7,805,334 |
Fidelity International Discovery Fund | 14,302 | | 419,627 |
Fidelity International Growth Fund | 479,670 | | 4,053,209 |
Fidelity International Real Estate Fund | 136,575 | | 1,108,987 |
Fidelity International Small Cap Fund | 91,540 | | 1,683,412 |
Fidelity International Small Cap Opportunities Fund | 505,284 | | 5,022,525 |
Fidelity International Value Fund | 192,914 | | 1,311,816 |
Fidelity Japan Fund | 217,420 | | 2,108,977 |
Fidelity Japan Smaller Companies Fund | 182,693 | | 1,589,426 |
Fidelity Nordic Fund | 79,758 | | 2,254,752 |
Fidelity Overseas Fund | 288 | | 8,259 |
Fidelity Pacific Basin Fund | 291,812 | | 6,656,233 |
Spartan International Index Fund Investor Class | 1,642,986 | | 50,587,549 |
TOTAL INTERNATIONAL EQUITY FUNDS | | 104,127,819 |
Latin America Stock Funds - 0.1% |
Fidelity Latin America Fund | 13,852 | | 672,780 |
TOTAL EQUITY FUNDS (Cost $365,116,339) |
426,367,598
|
Fixed-Income Funds - 43.7% |
| Shares | | Value |
Fidelity Floating Rate High Income Fund | 2,427,203 | | $ 23,762,321 |
Fidelity Focused High Income Fund | 261,997 | | 2,407,749 |
Fidelity High Income Fund | 1,798,023 | | 16,146,246 |
Fidelity New Markets Income Fund | 401,946 | | 6,696,423 |
Fidelity Real Estate Income Fund | 329,937 | | 3,655,699 |
Spartan U.S. Bond Index Fund Investor Class | 28,060,834 | | 334,204,536 |
TOTAL FIXED-INCOME FUNDS (Cost $361,451,173) |
386,872,974
|
Money Market Funds - 8.1% |
| Shares | | Value |
Fidelity Institutional Prime Money Market Portfolio Class I | 61,206,875 | | $ 61,206,875 |
Fidelity Select Money Market Portfolio | 10,210,103 | | 10,210,103 |
TOTAL MONEY MARKET FUNDS (Cost $71,416,978) |
71,416,978
|
TOTAL INVESTMENT PORTFOLIO - 100.0% (Cost $797,984,490) | | 884,657,550 |
NET OTHER ASSETS (LIABILITIES) - 0.0% | | (154,289) |
NET ASSETS - 100% | $ 884,503,261 |
Legend |
(a) Non-income producing |
Other Information |
All investments are categorized as Level 1 under the Fair Value Hierarchy. The inputs or methodology used for valuing securities may not be an indication of the risk associated with investing in those securities. For more information on valuation inputs, please refer to the Security Valuation section in the accompanying Notes to Financial Statements. |
See accompanying notes which are an integral part of the financial statements.
Semiannual Report
VIP FundsManager 50% Portfolio
Statement of Assets and Liabilities
| June 30, 2012 (Unaudited) |
| | |
Assets | | |
Investment in securities, at value (cost $797,984,490) - See accompanying schedule | | $ 884,657,550 |
Receivable for investments sold | | 60,863 |
Receivable for fund shares sold | | 20,007 |
Total assets | | 884,738,420 |
| | |
Liabilities | | |
Payable for investments purchased | $ 11,378 | |
Payable for fund shares redeemed | 69,492 | |
Accrued management fee | 144,849 | |
Distribution and service plan fees payable | 9,440 | |
Total liabilities | | 235,159 |
| | |
Net Assets | | $ 884,503,261 |
Net Assets consist of: | | |
Paid in capital | | $ 860,383,732 |
Undistributed net investment income | | 4,814,460 |
Accumulated undistributed net realized gain (loss) on investments | | (67,367,991) |
Net unrealized appreciation (depreciation) on investments | | 86,673,060 |
Net Assets | | $ 884,503,261 |
Service Class:
Net Asset Value, offering price and redemption price per share ($63,531 ÷ 6,180 shares) | | $ 10.28 |
| | |
Service Class 2:
Net Asset Value, offering price and redemption price per share ($77,512,580 ÷ 7,565,626 shares) | | $ 10.25 |
| | |
Investor Class:
Net Asset Value, offering price and redemption price per share ($806,927,150 ÷ 78,509,196 shares) | | $ 10.28 |
Statement of Operations
Six months ended June 30, 2012 (Unaudited) |
| | |
Investment Income | | |
Income distributions from underlying funds | | $ 5,727,385 |
| | |
Expenses | | |
Management fee | $ 1,077,663 | |
Distribution and service plan fees | 84,381 | |
Independent trustees' compensation | 1,463 | |
Total expenses before reductions | 1,163,507 | |
Expense reductions | (250,582) | 912,925 |
Net investment income (loss) | | 4,814,460 |
Realized and Unrealized Gain (Loss) Realized gain (loss) on sale of underlying fund shares | 6,295,071 | |
Capital gain distributions from underlying funds | 1,569,320 | |
Total net realized gain (loss) | | 7,864,391 |
Change in net unrealized appreciation (depreciation) on underlying funds | | 27,000,241 |
Net gain (loss) | | 34,864,632 |
Net increase (decrease) in net assets resulting from operations | | $ 39,679,092 |
See accompanying notes which are an integral part of the financial statements.
Semiannual Report
Statement of Changes in Net Assets
| Six months ended
June 30, 2012
(Unaudited) | Year ended
December 31,
2011 |
Increase (Decrease) in Net Assets | | |
Operations | | |
Net investment income (loss) | $ 4,814,460 | $ 13,511,476 |
Net realized gain (loss) | 7,864,391 | 12,155,241 |
Change in net unrealized appreciation (depreciation) | 27,000,241 | (30,595,195) |
Net increase (decrease) in net assets resulting from operations | 39,679,092 | (4,928,478) |
Distributions to shareholders from net investment income | - | (13,480,797) |
Distributions to shareholders from net realized gain | - | (1,686,437) |
Total distributions | - | (15,167,234) |
Share transactions - net increase (decrease) | 79,387,493 | 112,807,742 |
Total increase (decrease) in net assets | 119,066,585 | 92,712,030 |
| | |
Net Assets | | |
Beginning of period | 765,436,676 | 672,724,646 |
End of period (including undistributed net investment income of $4,814,460 and $0, respectively) | $ 884,503,261 | $ 765,436,676 |
Financial Highlights - Service Class
| Six months ended
June 30, 2012 | Years ended December 31, |
| (Unaudited) | 2011 | 2010 | 2009 | 2008 | 2007 |
Selected Per-Share Data | | | | | | |
Net asset value, beginning of period | $ 9.78 | $ 10.02 | $ 9.11 | $ 7.80 | $ 10.51 | $ 10.52 |
Income from Investment Operations | | | | | | |
Net investment income (loss) E | .06 | .19 | .17 | .17 | .25 | .32 |
Net realized and unrealized gain (loss) | .44 | (.23) | .91 | 1.30 | (2.59) | .41 |
Total from investment operations | .50 | (.04) | 1.08 | 1.47 | (2.34) | .73 |
Distributions from net investment income | - | (.18) | (.16) | (.15) | (.24) | (.24) |
Distributions from net realized gain | - | (.02) | (.02) | (.01) | (.13) | (.50) |
Total distributions | - | (.20) | (.17) I | (.16) | (.37) H | (.74) |
Net asset value, end of period | $ 10.28 | $ 9.78 | $ 10.02 | $ 9.11 | $ 7.80 | $ 10.51 |
Total Return B, C, D | 5.11% | (.42)% | 11.89% | 18.82% | (22.48)% | 6.99% |
Ratios to Average Net Assets F, G | | | | | | |
Expenses before reductions | .35% A | .35% | .35% | .35% | .35% | .35% |
Expenses net of fee waivers, if any | .20% A | .20% | .20% | .20% | .20% | .20% |
Expenses net of all reductions | .20% A | .20% | .20% | .20% | .20% | .20% |
Net investment income (loss) | 1.13% A | 1.84% | 1.78% | 2.07% | 2.65% | 2.97% |
Supplemental Data | | | | | | |
Net assets, end of period (000 omitted) | $ 64 | $ 59 | $ 62 | $ 58 | $ 76 | $ 115 |
Portfolio turnover rate | 25% A | 14% | 16% | 44% | 70% | 92% |
AAnnualized BTotal returns for periods of less than one year are not annualized. CTotal returns do not reflect charges attributable to your insurance company's separate account. Inclusion of these charges would reduce the total returns shown. DTotal returns would have been lower if certain expenses had not been reduced during the applicable periods shown. ECalculated based on average shares outstanding during the period. FAmounts do not include the activity of the Underlying Funds. GExpense ratios reflect operating expenses of the class. Expenses before reductions do not reflect amounts reimbursed by the investment adviser or reductions from expense offset arrangements and do not represent the amount paid by the class during periods when reimbursements or reductions occur. Expenses net of fee waivers reflect expenses after reimbursement by the investment adviser but prior to reductions from expense offset arrangements. Expenses net of all reductions represent the net expenses paid by the class but do not include expenses of the investment companies in which the Fund invests. HTotal distributions of $.37 per share is comprised of distributions from net investment income of $.241 and distributions from net realized gain of $.125 per share. ITotal distributions of $.17 per share is comprised of distributions from net investment income of $.155 and distributions from net realized gain of $.018 per share. |
See accompanying notes which are an integral part of the financial statements.
Semiannual Report
Financial Highlights - Service Class 2
| Six months ended
June 30, 2012 | Years ended December 31, |
| (Unaudited) | 2011 | 2010 | 2009 | 2008 | 2007 |
Selected Per-Share Data | | | | | | |
Net asset value, beginning of period | $ 9.75 | $ 10.01 | $ 9.10 | $ 7.79 | $ 10.51 | $ 10.51 |
Income from Investment Operations | | | | | | |
Net investment income (loss) E | .05 | .17 | .15 | .16 | .23 | .31 |
Net realized and unrealized gain (loss) | .45 | (.24) | .92 | 1.30 | (2.59) | .41 |
Total from investment operations | .50 | (.07) | 1.07 | 1.46 | (2.36) | .72 |
Distributions from net investment income | - | (.17) | (.14) | (.14) | (.24) | (.22) |
Distributions from net realized gain | - | (.02) | (.02) | (.01) | (.13) | (.50) |
Total distributions | - | (.19) | (.16) | (.15) | (.36) H | (.72) |
Net asset value, end of period | $ 10.25 | $ 9.75 | $ 10.01 | $ 9.10 | $ 7.79 | $ 10.51 |
Total Return B, C, D | 5.13% | (.68)% | 11.75% | 18.76% | (22.63)% | 6.93% |
Ratios to Average Net Assets F, G | | | | | | |
Expenses before reductions | .50% A | .50% | .50% | .50% | .50% | .50% |
Expenses net of fee waivers, if any | .35% A | .35% | .35% | .35% | .35% | .35% |
Expenses net of all reductions | .35% A | .35% | .35% | .35% | .35% | .35% |
Net investment income (loss) | .98% A | 1.69% | 1.63% | 1.92% | 2.50% | 2.82% |
Supplemental Data | | | | | | |
Net assets, end of period (000 omitted) | $ 77,513 | $ 17,800 | $ 1,030 | $ 550 | $ 236 | $ 115 |
Portfolio turnover rate | 25% A | 14% | 16% | 44% | 70% | 92% |
AAnnualized BTotal returns for periods of less than one year are not annualized. CTotal returns do not reflect charges attributable to your insurance company's separate account. Inclusion of these charges would reduce the total returns shown. DTotal returns would have been lower if certain expenses had not been reduced during the applicable periods shown. ECalculated based on average shares outstanding during the period. FAmounts do not include the activity of the Underlying Funds. GExpense ratios reflect operating expenses of the class. Expenses before reductions do not reflect amounts reimbursed by the investment adviser or reductions from expense offset arrangements and do not represent the amount paid by the class during periods when reimbursements or reductions occur. Expenses net of fee waivers reflect expenses after reimbursement by the investment adviser but prior to reductions from expense offset arrangements. Expenses net of all reductions represent the net expenses paid by the class but do not include expenses of the investment companies in which the Fund invests. HTotal distributions of $.36 per share is comprised of distributions from net investment income of $.235 and distributions from net realized gain of $.125 per share. |
Financial Highlights - Investor Class
| Six months ended
June 30, 2012 | Years ended December 31, |
| (Unaudited) | 2011 | 2010 | 2009 | 2008 | 2007 |
Selected Per-Share Data | | | | | | |
Net asset value, beginning of period | $ 9.78 | $ 10.02 | $ 9.11 | $ 7.79 | $ 10.51 | $ 10.52 |
Income from Investment Operations | | | | | | |
Net investment income (loss) E | .06 | .19 | .17 | .17 | .25 | .32 |
Net realized and unrealized gain (loss) | .44 | (.23) | .91 | 1.31 | (2.60) | .41 |
Total from investment operations | .50 | (.04) | 1.08 | 1.48 | (2.35) | .73 |
Distributions from net investment income | - | (.18) | (.16) | (.15) | (.24) | (.24) |
Distributions from net realized gain | - | (.02) | (.02) | (.01) | (.13) | (.50) |
Total distributions | - | (.20) | (.17) I | (.16) | (.37) H | (.74) |
Net asset value, end of period | $ 10.28 | $ 9.78 | $ 10.02 | $ 9.11 | $ 7.79 | $ 10.51 |
Total Return B, C, D | 5.11% | (.42)% | 11.89% | 18.98% | (22.57)% | 6.99% |
Ratios to Average Net Assets F, G | | | | | | |
Expenses before reductions | .25% A | .25% | .25% | .25% | .25% | .25% |
Expenses net of fee waivers, if any | .20% A | .20% | .20% | .20% | .20% | .20% |
Expenses net of all reductions | .20% A | .20% | .20% | .20% | .20% | .20% |
Net investment income (loss) | 1.13% A | 1.84% | 1.78% | 2.07% | 2.65% | 2.97% |
Supplemental Data | | | | | | |
Net assets, end of period (000 omitted) | $ 806,927 | $ 747,577 | $ 671,632 | $ 520,243 | $ 334,788 | $ 371,298 |
Portfolio turnover rate | 25% A | 14% | 16% | 44% | 70% | 92% |
AAnnualized BTotal returns for periods of less than one year are not annualized. CTotal returns do not reflect charges attributable to your insurance company's separate account. Inclusion of these charges would reduce the total returns shown. DTotal returns would have been lower if certain expenses had not been reduced during the applicable periods shown. ECalculated based on average shares outstanding during the period. FAmounts do not include the activity of the Underlying Funds. GExpense ratios reflect operating expenses of the class. Expenses before reductions do not reflect amounts reimbursed by the investment adviser or reductions from expense offset arrangements and do not represent the amount paid by the class during periods when reimbursements or reductions occur. Expenses net of fee waivers reflect expenses after reimbursement by the investment adviser but prior to reductions from expense offset arrangements. Expenses net of all reductions represent the net expenses paid by the class but do not include expenses of the investment companies in which the Fund invests. HTotal distributions of $.37 per share is comprised of distributions from net investment income of $.241 and distributions from net realized gain of $.125 per share. ITotal distributions of $.17 per share is comprised of distributions from net investment income of $.155 and distributions from net realized gain of $.018 per share. |
See accompanying notes which are an integral part of the financial statements.
Semiannual Report
VIP FundsManager 60% Portfolio
Investment Changes (Unaudited)
Fund Holdings as of June 30, 2012 |
| % of fund's
net assets | % of fund's net assets
6 months ago |
Domestic Equity Funds | | |
Fidelity 130/30 Large Cap Fund | 0.0* | 0.0* |
Fidelity Air Transportation Portfolio | 0.1 | 0.1 |
Fidelity Automotive Portfolio | 0.2 | 0.2 |
Fidelity Banking Portfolio | 1.7 | 1.3 |
Fidelity Biotechnology Portfolio | 0.6 | 0.0* |
Fidelity Blue Chip Growth Fund | 0.0* | 0.1 |
Fidelity Brokerage & Investment Management Portfolio | 0.2 | 0.1 |
Fidelity Capital Appreciation Fund | 0.6 | 0.0 |
Fidelity Chemicals Portfolio | 0.6 | 0.9 |
Fidelity Commodity Strategy Fund | 0.0* | 0.0* |
Fidelity Communications Equipment Portfolio | 0.2 | 0.5 |
Fidelity Computers Portfolio | 1.8 | 1.2 |
Fidelity Construction & Housing Portfolio | 0.7 | 0.2 |
Fidelity Consumer Discretionary Portfolio | 2.2 | 1.9 |
Fidelity Consumer Finance Portfolio | 0.6 | 0.6 |
Fidelity Consumer Staples Portfolio | 4.6 | 4.6 |
Fidelity Contrafund | 0.0* | 0.0* |
Fidelity Defense & Aerospace Portfolio | 0.0* | 0.1 |
Fidelity Disciplined Equity Fund | 0.0* | 0.0* |
Fidelity Dividend Growth Fund | 0.3 | 0.8 |
Fidelity Electronics Portfolio | 0.5 | 0.5 |
Fidelity Energy Portfolio | 2.0 | 2.8 |
Fidelity Energy Service Portfolio | 0.6 | 1.1 |
Fidelity Environmental & Alternative Energy Portfolio | 0.0* | 0.0* |
Fidelity Equity-Income Fund | 0.0* | 0.0* |
Fidelity Equity-Income II Fund | 0.0* | 0.0* |
Fidelity Financial Services Portfolio | 1.7 | 1.5 |
Fidelity Fund | 0.0* | 0.0* |
Fidelity Global Commodity Stock Fund | 0.0* | 0.2 |
Fidelity Gold Portfolio | 0.8 | 1.6 |
Fidelity Growth Company Fund | 0.4 | 0.5 |
Fidelity Health Care Portfolio | 3.4 | 3.0 |
Fidelity Independence Fund | 0.0* | 0.0* |
Fidelity Industrial Equipment Portfolio | 1.4 | 1.6 |
Fidelity Industrials Portfolio | 1.9 | 1.7 |
Fidelity Insurance Portfolio | 1.5 | 1.5 |
Fidelity IT Services Portfolio | 1.0 | 0.7 |
|
| % of fund's
net assets | % of fund's net assets
6 months ago |
Fidelity Large Cap Stock Fund | 0.6 | 0.7 |
Fidelity Large Cap Value Fund | 0.0* | 0.0* |
Fidelity Leisure Portfolio | 0.5 | 0.4 |
Fidelity Leveraged Company Stock Fund | 0.0* | 0.0* |
Fidelity Magellan Fund | 0.0* | 0.0* |
Fidelity Materials Portfolio | 0.0* | 0.2 |
Fidelity Medical Delivery Portfolio | 0.4 | 0.5 |
Fidelity Medical Equipment & Systems Portfolio | 0.0* | 0.2 |
Fidelity Mega Cap Stock Fund | 0.8 | 0.7 |
Fidelity Mid Cap Value Fund | 0.0* | 0.0* |
Fidelity Multimedia Portfolio | 0.6 | 0.6 |
Fidelity Natural Gas Portfolio | 0.0* | 0.0 |
Fidelity Natural Resources Portfolio | 0.0* | 0.0* |
Fidelity Pharmaceuticals Portfolio | 1.2 | 1.1 |
Fidelity Real Estate Investment Portfolio | 0.4 | 0.4 |
Fidelity Retailing Portfolio | 0.7 | 0.5 |
Fidelity Small Cap Growth Fund | 0.0* | 0.1 |
Fidelity Small Cap Value Fund | 0.0* | 0.0* |
Fidelity Software & Computer Services Portfolio | 2.0 | 1.9 |
Fidelity Stock Selector All Cap Fund | 0.0* | 0.0* |
Fidelity Technology Portfolio | 2.4 | 2.9 |
Fidelity Telecom and Utilities Fund | 0.4 | 0.6 |
Fidelity Telecommunications Portfolio | 1.4 | 1.3 |
Fidelity Transportation Portfolio | 0.2 | 0.4 |
Fidelity Utilities Portfolio | 1.5 | 1.7 |
Fidelity Value Fund | 0.0* | 0.0* |
Spartan 500 Index Fund Investor Class | 0.0* | 0.0* |
Spartan Total Market Index Fund Investor Class | 0.5 | 0.6 |
VIP Industrials Portfolio Investor Class | 0.0* | 0.0* |
VIP Mid Cap Portfolio Investor Class | 0.0* | 0.1 |
| 43.2 | 44.2 |
International Equity Funds | | |
Fidelity Canada Fund | 0.1 | 0.3 |
Fidelity China Region Fund | 0.0* | 0.1 |
Fidelity Diversified International Fund | 3.3 | 1.1 |
Fidelity Emerging Asia Fund | 0.7 | 0.8 |
Fidelity Emerging Markets Fund | 0.1 | 0.2 |
Fund Holdings as of June 30, 2012 |
| % of fund's
net assets | % of fund's net assets
6 months ago |
International Equity Funds - continued | | |
Fidelity International Capital Appreciation Fund | 1.4 | 0.3 |
Fidelity International Discovery Fund | 2.4 | 5.2 |
Fidelity International Growth Fund | 0.4 | 0.0 |
Fidelity International Real Estate Fund | 0.0* | 0.0* |
Fidelity International Small Cap Fund | 0.1 | 0.3 |
Fidelity International Small Cap Opportunities Fund | 0.6 | 0.8 |
Fidelity International Value Fund | 0.5 | 0.7 |
Fidelity Japan Fund | 0.4 | 0.4 |
Fidelity Japan Smaller Companies Fund | 0.3 | 0.5 |
Fidelity Latin America Fund | 0.1 | 0.0 |
Fidelity Nordic Fund | 0.6 | 1.0 |
Fidelity Overseas Fund | 0.0* | 0.0* |
Fidelity Pacific Basin Fund | 0.6 | 0.7 |
Spartan International Index Fund Investor Class | 2.8 | 3.2 |
| 14.4 | 15.6 |
Fixed-Income Funds | | |
Fidelity Floating Rate High Income Fund | 2.1 | 2.3 |
Fidelity Focused High Income Fund | 0.7 | 0.8 |
Fidelity High Income Fund | 1.5 | 1.8 |
Fidelity New Markets Income Fund | 0.6 | 0.6 |
Fidelity Real Estate Income Fund | 0.2 | 0.5 |
Spartan U.S. Bond Index Fund Investor Class | 32.8 | 32.4 |
| 37.9 | 38.4 |
Money Market Funds | | |
Fidelity Institutional Prime Money Market Portfolio Class I | 4.5 | 1.8 |
Net Other Assets (Liabilities)* | 0.0 | 0.0 |
| 100.0 | 100.0 |
* Amount represents less than 0.1%
Asset Allocation (% of fund's net assets) |
As of June 30, 2012 |
| Domestic Equity Funds | 43.2% | |
| International Equity Funds | 14.4% | |
| Fixed Income Funds | 37.9% | |
| Money Market Funds | 4.5% | |

As of December 31, 2011 |
| Domestic Equity Funds | 44.2% | |
| International Equity Funds | 15.6% | |
| Fixed Income Funds | 38.4% | |
| Money Market Funds | 1.8% | |

Semiannual Report
VIP FundsManager 60% Portfolio
Investments June 30, 2012 (Unaudited)
Showing Percentage of Net Assets
Equity Funds - 57.6% |
| Shares | | Value |
Domestic Equity Funds - 43.2% |
Fidelity 130/30 Large Cap Fund | 7,142 | | $ 51,423 |
Fidelity Air Transportation Portfolio | 136,538 | | 5,232,145 |
Fidelity Automotive Portfolio | 330,864 | | 10,888,730 |
Fidelity Banking Portfolio | 4,832,658 | | 90,177,403 |
Fidelity Biotechnology Portfolio | 289,448 | | 30,215,487 |
Fidelity Blue Chip Growth Fund | 16,378 | | 768,470 |
Fidelity Brokerage & Investment Management Portfolio | 269,578 | | 11,896,478 |
Fidelity Capital Appreciation Fund | 1,055,056 | | 29,921,400 |
Fidelity Chemicals Portfolio | 267,788 | | 29,159,405 |
Fidelity Commodity Strategy Fund | 1,228 | | 9,889 |
Fidelity Communications Equipment Portfolio | 465,879 | | 9,606,425 |
Fidelity Computers Portfolio (a) | 1,495,833 | | 91,230,881 |
Fidelity Construction & Housing Portfolio | 889,271 | | 37,447,214 |
Fidelity Consumer Discretionary Portfolio | 4,378,777 | | 114,942,909 |
Fidelity Consumer Finance Portfolio | 2,415,142 | | 31,976,480 |
Fidelity Consumer Staples Portfolio | 3,093,475 | | 241,167,320 |
Fidelity Contrafund | 8,989 | | 672,443 |
Fidelity Defense & Aerospace Portfolio | 15,659 | | 1,275,884 |
Fidelity Disciplined Equity Fund | 4,530 | | 105,460 |
Fidelity Dividend Growth Fund | 575,508 | | 16,194,791 |
Fidelity Electronics Portfolio | 534,237 | | 24,884,751 |
Fidelity Energy Portfolio | 2,254,594 | | 105,605,185 |
Fidelity Energy Service Portfolio (a) | 526,365 | | 31,181,878 |
Fidelity Environmental & Alternative Energy Portfolio | 4,585 | | 70,606 |
Fidelity Equity-Income Fund | 8,755 | | 389,880 |
Fidelity Equity-Income II Fund | 4,983 | | 93,927 |
Fidelity Financial Services Portfolio | 1,521,563 | | 85,572,718 |
Fidelity Fund | 1,846 | | 63,693 |
Fidelity Global Commodity Stock Fund | 86,333 | | 1,168,089 |
Fidelity Gold Portfolio | 1,175,226 | | 42,214,134 |
Fidelity Growth Company Fund | 248,691 | | 22,770,113 |
Fidelity Health Care Portfolio | 1,296,053 | | 175,083,804 |
Fidelity Independence Fund | 2,128 | | 50,669 |
Fidelity Industrial Equipment Portfolio | 2,171,891 | | 73,931,174 |
Fidelity Industrials Portfolio | 4,221,531 | | 99,332,618 |
Fidelity Insurance Portfolio | 1,646,821 | | 78,816,849 |
Fidelity IT Services Portfolio | 2,212,975 | | 51,960,665 |
Fidelity Large Cap Stock Fund | 1,729,480 | | 32,496,921 |
Fidelity Large Cap Value Fund | 28,104 | | 311,113 |
Fidelity Leisure Portfolio | 230,065 | | 23,761,116 |
Fidelity Leveraged Company Stock Fund | 4,331 | | 122,451 |
Fidelity Magellan Fund | 2,887 | | 200,154 |
Fidelity Materials Portfolio | 1,914 | | 125,448 |
Fidelity Medical Delivery Portfolio (a) | 351,513 | | 21,463,407 |
Fidelity Medical Equipment & Systems Portfolio | 5,283 | | 147,924 |
Fidelity Mega Cap Stock Fund | 3,481,235 | | 38,676,518 |
Fidelity Mid Cap Value Fund | 5,589 | | 92,385 |
Fidelity Multimedia Portfolio | 571,212 | | 28,954,728 |
Fidelity Natural Gas Portfolio | 49,948 | | 1,477,449 |
|
| Shares | | Value |
Fidelity Natural Resources Portfolio | 6,478 | | $ 189,538 |
Fidelity Pharmaceuticals Portfolio | 4,043,827 | | 59,565,570 |
Fidelity Real Estate Investment Portfolio | 613,426 | | 19,402,664 |
Fidelity Retailing Portfolio | 576,140 | | 34,257,293 |
Fidelity Small Cap Growth Fund | 98,822 | | 1,593,007 |
Fidelity Small Cap Value Fund | 25,096 | | 381,714 |
Fidelity Software & Computer Services Portfolio | 1,276,444 | | 106,212,916 |
Fidelity Stock Selector All Cap Fund | 4,416 | | 117,607 |
Fidelity Technology Portfolio (a) | 1,296,268 | | 126,386,123 |
Fidelity Telecom and Utilities Fund | 1,243,122 | | 22,997,757 |
Fidelity Telecommunications Portfolio | 1,475,908 | | 70,518,867 |
Fidelity Transportation Portfolio | 190,177 | | 10,035,630 |
Fidelity Utilities Portfolio | 1,405,167 | | 79,968,029 |
Fidelity Value Fund | 4,074 | | 280,540 |
Spartan 500 Index Fund Investor Class | 2,251 | | 109,232 |
Spartan Total Market Index Fund Investor Class | 690,642 | | 27,204,376 |
VIP Industrials Portfolio Investor Class | 76,397 | | 1,183,387 |
VIP Mid Cap Portfolio Investor Class | 5,000 | | 154,899 |
TOTAL DOMESTIC EQUITY FUNDS | | 2,254,520,153 |
International Equity Funds - 14.3% |
Fidelity Canada Fund | 99,438 | | 4,998,761 |
Fidelity China Region Fund | 8,502 | | 224,452 |
Fidelity Diversified International Fund | 6,332,016 | | 171,154,404 |
Fidelity Emerging Asia Fund | 1,476,122 | | 38,940,089 |
Fidelity Emerging Markets Fund | 135,048 | | 2,823,852 |
Fidelity International Capital Appreciation Fund | 5,927,715 | | 72,495,951 |
Fidelity International Discovery Fund | 4,277,278 | | 125,495,323 |
Fidelity International Growth Fund | 2,253,602 | | 19,042,933 |
Fidelity International Real Estate Fund | 162,432 | | 1,318,950 |
Fidelity International Small Cap Fund | 244,186 | | 4,490,580 |
Fidelity International Small Cap Opportunities Fund | 3,389,182 | | 33,688,468 |
Fidelity International Value Fund | 3,556,912 | | 24,187,004 |
Fidelity Japan Fund | 1,913,917 | | 18,564,997 |
Fidelity Japan Smaller Companies Fund | 1,848,053 | | 16,078,057 |
Fidelity Nordic Fund | 1,145,495 | | 32,383,151 |
Fidelity Overseas Fund | 1,178 | | 33,829 |
Fidelity Pacific Basin Fund | 1,454,004 | | 33,165,834 |
Spartan International Index Fund Investor Class | 4,752,263 | | 146,322,189 |
TOTAL INTERNATIONAL EQUITY FUNDS | | 745,408,824 |
Latin America Stock Funds - 0.1% |
Fidelity Latin America Fund | 74,430 | | 3,615,046 |
TOTAL EQUITY FUNDS (Cost $2,734,435,160) |
3,003,544,023
|
Fixed-Income Funds - 37.9% |
| Shares | | Value |
Fidelity Floating Rate High Income Fund | 11,156,831 | | $ 109,225,373 |
Fidelity Focused High Income Fund | 4,035,819 | | 37,089,180 |
Fidelity High Income Fund | 8,615,636 | | 77,368,409 |
Fidelity New Markets Income Fund | 1,936,880 | | 32,268,416 |
Fidelity Real Estate Income Fund | 994,530 | | 11,019,391 |
Spartan U.S. Bond Index Fund Investor Class | 143,379,518 | | 1,707,650,062 |
TOTAL FIXED-INCOME FUNDS (Cost $1,894,530,018) |
1,974,620,831
|
Money Market Funds - 4.5% |
| Shares | | Value |
Fidelity Institutional Prime Money Market Portfolio Class I
(Cost $234,619,552) | 234,619,552 | | $ 234,619,552 |
TOTAL INVESTMENT PORTFOLIO - 100.0% (Cost $4,863,584,730) | | 5,212,784,406 |
NET OTHER ASSETS (LIABILITIES) - 0.0% | | (870,966) |
NET ASSETS - 100% | $ 5,211,913,440 |
Legend |
(a) Non-income producing |
Other Information |
All investments are categorized as Level 1 under the Fair Value Hierarchy. The inputs or methodology used for valuing securities may not be an indication of the risk associated with investing in those securities. For more information on valuation inputs, please refer to the Security Valuation section in the accompanying Notes to Financial Statements. |
See accompanying notes which are an integral part of the financial statements.
Semiannual Report
VIP FundsManager 60% Portfolio
Statement of Assets and Liabilities
| June 30, 2012 (Unaudited) |
| | |
Assets | | |
Investment in securities, at value (cost $4,863,584,730) - See accompanying schedule | | $ 5,212,784,406 |
Receivable for fund shares sold | | 5,614,848 |
Total assets | | 5,218,399,254 |
| | |
Liabilities | | |
Payable for investments purchased | $ 5,542,051 | |
Payable for fund shares redeemed | 72,796 | |
Accrued management fee | 842,400 | |
Distribution and service plan fees payable | 28,567 | |
Total liabilities | | 6,485,814 |
| | |
Net Assets | | $ 5,211,913,440 |
Net Assets consist of: | | |
Paid in capital | | $ 4,849,026,162 |
Undistributed net investment income | | 22,499,292 |
Accumulated undistributed net realized gain (loss) on investments | | (8,811,690) |
Net unrealized appreciation (depreciation) on investments | | 349,199,676 |
Net Assets | | $ 5,211,913,440 |
Service Class:
Net Asset Value, offering price and redemption price per share ($62,009 ÷ 6,162 shares) | | $ 10.06 |
| | |
Service Class 2:
Net Asset Value, offering price and redemption price per share ($232,080,419 ÷ 23,106,750 shares) | | $ 10.04 |
| | |
Investor Class:
Net Asset Value, offering price and redemption price per share ($4,979,771,012 ÷ 494,956,817 shares) | | $ 10.06 |
Statement of Operations
Six months ended June 30, 2012 (Unaudited) |
| | |
Investment Income | | |
Income distributions from underlying funds | | $ 27,469,944 |
| | |
Expenses | | |
Management fee | $ 6,018,805 | |
Distribution and service plan fees | 256,330 | |
Independent trustees' compensation | 8,057 | |
Total expenses before reductions | 6,283,192 | |
Expense reductions | (1,312,540) | 4,970,652 |
Net investment income (loss) | | 22,499,292 |
Realized and Unrealized Gain (Loss) Realized gain (loss) on sale of underlying fund shares | 17,393,021 | |
Capital gain distributions from underlying funds | 13,279,504 | |
Total net realized gain (loss) | | 30,672,525 |
Change in net unrealized appreciation (depreciation) on underlying funds | | 182,669,575 |
Net gain (loss) | | 213,342,100 |
Net increase (decrease) in net assets resulting from operations | | $ 235,841,392 |
See accompanying notes which are an integral part of the financial statements.
Semiannual Report
VIP FundsManager 60% Portfolio
Financial Statements - continued
Statement of Changes in Net Assets
| Six months ended
June 30, 2012
(Unaudited) | Year ended
December 31,
2011 |
Increase (Decrease) in Net Assets | | |
Operations | | |
Net investment income (loss) | $ 22,499,292 | $ 59,337,413 |
Net realized gain (loss) | 30,672,525 | 50,580,828 |
Change in net unrealized appreciation (depreciation) | 182,669,575 | (197,257,071) |
Net increase (decrease) in net assets resulting from operations | 235,841,392 | (87,338,830) |
Distributions to shareholders from net investment income | - | (59,310,251) |
Distributions to shareholders from net realized gain | - | (8,964,775) |
Total distributions | - | (68,275,026) |
Share transactions - net increase (decrease) | 836,291,854 | 1,711,187,747 |
Total increase (decrease) in net assets | 1,072,133,246 | 1,555,573,891 |
| | |
Net Assets | | |
Beginning of period | 4,139,780,194 | 2,584,206,303 |
End of period (including undistributed net investment income of $22,499,292 and $0, respectively) | $ 5,211,913,440 | $ 4,139,780,194 |
Financial Highlights - Service Class
| Six months ended
June 30, 2012 | Years ended December 31, |
| (Unaudited) | 2011 | 2010 | 2009 | 2008 | 2007 G |
Selected Per-Share Data | | | | | | |
Net asset value, beginning of period | $ 9.53 | $ 9.88 | $ 8.83 | $ 7.32 | $ 10.29 | $ 10.00 |
Income from Investment Operations | | | | | | |
Net investment income (loss) E | .05 | .18 | .16 | .15 | .25 | .18 |
Net realized and unrealized gain (loss) | .48 | (.37) | 1.03 | 1.51 | (3.01) | .23 |
Total from investment operations | .53 | (.19) | 1.19 | 1.66 | (2.76) | .41 |
Distributions from net investment income | - | (.14) | (.12) | (.13) | (.13) | (.06) |
Distributions from net realized gain | - | (.02) | (.02) | (.01) | (.08) | (.06) |
Total distributions | - | (.16) | (.14) | (.15) J | (.21) I | (.12) |
Net asset value, end of period | $ 10.06 | $ 9.53 | $ 9.88 | $ 8.83 | $ 7.32 | $ 10.29 |
Total Return B, C, D | 5.56% | (1.92)% | 13.49% | 22.61% | (26.93)% | 4.07% |
Ratios to Average Net Assets F, H | | | | | | |
Expenses before reductions | .35% A | .35% | .35% | .35% | .35% | .35% A |
Expenses net of fee waivers, if any | .20% A | .20% | .20% | .20% | .20% | .20% A |
Expenses net of all reductions | .20% A | .20% | .20% | .20% | .20% | .20% A |
Net investment income (loss) | .94% A | 1.77% | 1.77% | 1.89% | 2.75% | 4.76% A |
Supplemental Data | | | | | | |
Net assets, end of period (000 omitted) | $ 62 | $ 58 | $ 60 | $ 52 | $ 65 | $ 104 |
Portfolio turnover rate | 23% A | 9% | 10% | 38% | 74% | 60% A |
AAnnualized BTotal returns for periods of less than one year are not annualized. CTotal returns do not reflect charges attributable to your insurance company's separate account. Inclusion of these charges would reduce the total returns shown. DTotal returns would have been lower if certain expenses had not been reduced during the applicable periods shown. ECalculated based on average shares outstanding during the period. FAmounts do not include the activity of the Underlying Funds. GFor the period August 22, 2007 (commencement of operations) to December 31, 2007. HExpense ratios reflect operating expenses of the class. Expenses before reductions do not reflect amounts reimbursed by the investment adviser or reductions from expense offset arrangements and do not represent the amount paid by the class during periods when reimbursements or reductions occur. Expenses net of fee waivers reflect expenses after reimbursement by the investment adviser but prior to reductions from expense offset arrangements. Expenses net of all reductions represent the net expenses paid by the class but do not include expenses of the investment companies in which the Fund invests. ITotal distributions of $.21 per share is comprised of distributions from net investment income of $.133 and distributions from net realized gain of $.080 per share. JTotal distributions of $.15 per share is comprised of distributions from net investment income of $.134 and distributions from net realized gain of $.012 per share. |
See accompanying notes which are an integral part of the financial statements.
Semiannual Report
Financial Highlights - Service Class 2
| Six months ended
June 30, 2012 | Years ended December 31, |
| (Unaudited) | 2011 | 2010 | 2009 | 2008 | 2007 G |
Selected Per-Share Data | | | | | | |
Net asset value, beginning of period | $ 9.52 | $ 9.88 | $ 8.83 | $ 7.33 | $ 10.29 | $ 10.00 |
Income from Investment Operations | | | | | | |
Net investment income (loss) E | .04 | .16 | .15 | .14 | .23 | .17 |
Net realized and unrealized gain (loss) | .48 | (.37) | 1.03 | 1.50 | (2.99) | .23 |
Total from investment operations | .52 | (.21) | 1.18 | 1.64 | (2.76) | .40 |
Distributions from net investment income | - | (.13) | (.11) | (.12) | (.12) | (.05) |
Distributions from net realized gain | - | (.02) | (.02) | (.01) | (.08) | (.06) |
Total distributions | - | (.15) | (.13) | (.14) J | (.20) I | (.11) |
Net asset value, end of period | $ 10.04 | $ 9.52 | $ 9.88 | $ 8.83 | $ 7.33 | $ 10.29 |
Total Return B, C, D | 5.46% | (2.08)% | 13.35% | 22.31% | (26.97)% | 4.01% |
Ratios to Average Net Assets F, H | | | | | | |
Expenses before reductions | .50% A | .50% | .50% | .50% | .50% | .50% A |
Expenses net of fee waivers, if any | .35% A | .35% | .35% | .35% | .35% | .35% A |
Expenses net of all reductions | .35% A | .35% | .35% | .35% | .35% | .35% A |
Net investment income (loss) | .79% A | 1.62% | 1.62% | 1.74% | 2.59% | 4.61% A |
Supplemental Data | | | | | | |
Net assets, end of period (000 omitted) | $ 232,080 | $ 45,494 | $ 125 | $ 83 | $ 76 | $ 104 |
Portfolio turnover rate | 23% A | 9% | 10% | 38% | 74% | 60% A |
AAnnualized BTotal returns for periods of less than one year are not annualized. CTotal returns do not reflect charges attributable to your insurance company's separate account. Inclusion of these charges would reduce the total returns shown. DTotal returns would have been lower if certain expenses had not been reduced during the applicable periods shown. ECalculated based on average shares outstanding during the period. FAmounts do not include the activity of the Underlying Funds. GFor the period August 22, 2007 (commencement of operations) to December 31, 2007. HExpense ratios reflect operating expenses of the class. Expenses before reductions do not reflect amounts reimbursed by the investment adviser or reductions from expense offset arrangements and do not represent the amount paid by the class during periods when reimbursements or reductions occur. Expenses net of fee waivers reflect expenses after reimbursement by the investment adviser but prior to reductions from expense offset arrangements. Expenses net of all reductions represent the net expenses paid by the class but do not include expenses of the investment companies in which the Fund invests. ITotal distributions of $.20 per share is comprised of distributions from net investment income of $.119 and distributions from net realized gain of $.080 per share. JTotal distributions of $.14 per share is comprised of distributions from net investment income of $.124 and distributions from net realized gain of $.012 per share. |
Financial Highlights - Investor Class
| Six months ended
June 30, 2012 | Years ended December 31, |
| (Unaudited) | 2011 | 2010 | 2009 | 2008 | 2007 G |
Selected Per-Share Data | | | | | | |
Net asset value, beginning of period | $ 9.52 | $ 9.88 | $ 8.82 | $ 7.32 | $ 10.29 | $ 10.00 |
Income from Investment Operations | | | | | | |
Net investment income (loss) E | .05 | .17 | .16 | .15 | .23 | .17 |
Net realized and unrealized gain (loss) | .49 | (.37) | 1.04 | 1.50 | (2.99) | .24 |
Total from investment operations | .54 | (.20) | 1.20 | 1.65 | (2.76) | .41 |
Distributions from net investment income | - | (.14) | (.12) | (.13) | (.13) | (.06) |
Distributions from net realized gain | - | (.02) | (.02) | (.01) | (.08) | (.06) |
Total distributions | - | (.16) | (.14) | (.15) J | (.21) I | (.12) |
Net asset value, end of period | $ 10.06 | $ 9.52 | $ 9.88 | $ 8.82 | $ 7.32 | $ 10.29 |
Total Return B, C, D | 5.67% | (2.02)% | 13.62% | 22.48% | (26.93)% | 4.07% |
Ratios to Average Net Assets F, H | | | | | | |
Expenses before reductions | .25% A | .25% | .25% | .25% | .25% | .25% A |
Expenses net of fee waivers, if any | .20% A | .20% | .20% | .20% | .20% | .20% A |
Expenses net of all reductions | .20% A | .20% | .20% | .20% | .20% | .20% A |
Net investment income (loss) | .94% A | 1.77% | 1.77% | 1.89% | 2.75% | 4.76% A |
Supplemental Data | | | | | | |
Net assets, end of period (000 omitted) | $ 4,979,771 | $ 4,094,228 | $ 2,584,021 | $ 1,159,764 | $ 593,277 | $ 113,806 |
Portfolio turnover rate | 23% A | 9% | 10% | 38% | 74% | 60% A |
AAnnualized BTotal returns for periods of less than one year are not annualized. CTotal returns do not reflect charges attributable to your insurance company's separate account. Inclusion of these charges would reduce the total returns shown. DTotal returns would have been lower if certain expenses had not been reduced during the applicable periods shown. ECalculated based on average shares outstanding during the period. FAmounts do not include the activity of the Underlying Funds. GFor the period August 22, 2007 (commencement of operations) to December 31, 2007. HExpense ratios reflect operating expenses of the class. Expenses before reductions do not reflect amounts reimbursed by the investment adviser or reductions from expense offset arrangements and do not represent the amount paid by the class during periods when reimbursements or reductions occur. Expenses net of fee waivers reflect expenses after reimbursement by the investment adviser but prior to reductions from expense offset arrangements. Expenses net of all reductions represent the net expenses paid by the class but do not include expenses of the investment companies in which the Fund invests. ITotal distributions of $.21 per share is comprised of distributions from net investment income of $.133 and distributions from net realized gain of $.080 per share. JTotal distributions of $.15 per share is comprised of distributions from net investment income of $.134 and distributions from net realized gain of $.012 per share. |
See accompanying notes which are an integral part of the financial statements.
Semiannual Report
VIP FundsManager 70% Portfolio
Investment Changes (Unaudited)
Fund Holdings as of June 30, 2012 |
| % of fund's
net assets | % of fund's net assets
6 months ago |
Domestic Equity Funds | | |
Fidelity 130/30 Large Cap Fund | 0.0* | 0.0* |
Fidelity Air Transportation Portfolio | 0.2 | 0.2 |
Fidelity Automotive Portfolio | 0.1 | 0.1 |
Fidelity Banking Portfolio | 2.0 | 1.1 |
Fidelity Biotechnology Portfolio | 0.8 | 0.6 |
Fidelity Blue Chip Growth Fund | 0.0* | 0.4 |
Fidelity Brokerage & Investment Management Portfolio | 0.3 | 0.4 |
Fidelity Capital Appreciation Fund | 0.5 | 0.0 |
Fidelity Chemicals Portfolio | 0.7 | 0.7 |
Fidelity Commodity Strategy Fund | 0.0* | 0.0* |
Fidelity Communications Equipment Portfolio | 0.0* | 0.2 |
Fidelity Computers Portfolio | 1.7 | 1.4 |
Fidelity Construction & Housing Portfolio | 0.8 | 0.5 |
Fidelity Consumer Discretionary Portfolio | 1.8 | 1.3 |
Fidelity Consumer Finance Portfolio | 0.2 | 0.2 |
Fidelity Consumer Staples Portfolio | 4.9 | 5.1 |
Fidelity Contrafund | 0.0* | 0.0* |
Fidelity Defense & Aerospace Portfolio | 0.1 | 0.1 |
Fidelity Dividend Growth Fund | 0.6 | 0.5 |
Fidelity Electronics Portfolio | 0.2 | 0.6 |
Fidelity Energy Portfolio | 2.3 | 2.9 |
Fidelity Energy Service Portfolio | 0.6 | 1.2 |
Fidelity Environmental & Alternative Energy Portfolio | 0.1 | 0.2 |
Fidelity Equity-Income Fund | 0.0* | 0.2 |
Fidelity Equity-Income II Fund | 0.0* | 0.0* |
Fidelity Financial Services Portfolio | 1.9 | 1.5 |
Fidelity Fund | 0.0* | 0.0* |
Fidelity Global Commodity Stock Fund | 0.0 | 0.0* |
Fidelity Gold Portfolio | 0.6 | 1.5 |
Fidelity Growth Company Fund | 0.9 | 0.8 |
Fidelity Health Care Portfolio | 1.3 | 1.1 |
Fidelity Independence Fund | 0.0* | 0.0* |
Fidelity Industrial Equipment Portfolio | 1.0 | 0.9 |
Fidelity Industrials Portfolio | 2.1 | 2.2 |
Fidelity Insurance Portfolio | 1.3 | 1.5 |
Fidelity IT Services Portfolio | 0.6 | 0.4 |
Fidelity Large Cap Stock Fund | 0.1 | 0.1 |
Fidelity Large Cap Value Fund | 0.0* | 0.0* |
Fidelity Leisure Portfolio | 0.0* | 0.0* |
|
| % of fund's
net assets | % of fund's net assets
6 months ago |
Fidelity Leveraged Company Stock Fund | 0.0* | 0.0* |
Fidelity Magellan Fund | 0.0* | 0.0* |
Fidelity Materials Portfolio | 0.0* | 0.1 |
Fidelity Medical Delivery Portfolio | 1.4 | 1.3 |
Fidelity Medical Equipment & Systems Portfolio | 0.2 | 0.2 |
Fidelity Mega Cap Stock Fund | 0.4 | 0.3 |
Fidelity Mid Cap Value Fund | 0.0* | 0.0* |
Fidelity Mid-Cap Stock Fund | 0.0* | 0.0* |
Fidelity Multimedia Portfolio | 1.1 | 1.0 |
Fidelity Nasdaq Composite Index Fund | 0.3 | 0.3 |
Fidelity Natural Gas Portfolio | 0.0* | 0.0 |
Fidelity Natural Resources Portfolio | 0.0* | 0.0* |
Fidelity Pharmaceuticals Portfolio | 1.9 | 1.9 |
Fidelity Real Estate Investment Portfolio | 0.9 | 0.9 |
Fidelity Retailing Portfolio | 0.9 | 0.6 |
Fidelity Small Cap Growth Fund | 0.0* | 0.7 |
Fidelity Small Cap Stock Fund | 0.0* | 0.0* |
Fidelity Small Cap Value Fund | 0.0* | 0.0* |
Fidelity Software & Computer Services Portfolio | 2.1 | 1.6 |
Fidelity Technology Portfolio | 3.5 | 3.8 |
Fidelity Telecom and Utilities Fund | 2.2 | 1.3 |
Fidelity Telecommunications Portfolio | 0.9 | 1.0 |
Fidelity Transportation Portfolio | 0.5 | 0.5 |
Fidelity Utilities Portfolio | 0.8 | 0.9 |
Fidelity Value Discovery Fund | 0.0* | 0.0* |
Fidelity Value Fund | 0.0* | 0.1 |
Spartan 500 Index Fund Investor Class | 1.4 | 1.4 |
Spartan Extended Market Index Fund Investor Class | 2.2 | 2.3 |
Spartan Total Market Index Fund Investor Class | 2.1 | 2.1 |
VIP Mid Cap Portfolio Investor Class | 0.1 | 0.6 |
| 50.6 | 50.8 |
International Equity Funds | | |
Fidelity Canada Fund | 0.1 | 0.7 |
Fidelity China Region Fund | 0.0* | 0.2 |
Fidelity Diversified International Fund | 1.8 | 1.0 |
Fidelity Emerging Asia Fund | 0.6 | 0.7 |
Fidelity Emerging Markets Fund | 0.5 | 0.4 |
Fund Holdings as of June 30, 2012 |
| % of fund's
net assets | % of fund's net assets
6 months ago |
International Equity Funds - continued | | |
Fidelity International Capital Appreciation Fund | 1.1 | 0.8 |
Fidelity International Discovery Fund | 0.9 | 2.2 |
Fidelity International Growth Fund | 0.1 | 0.0 |
Fidelity International Real Estate Fund | 0.0* | 0.0* |
Fidelity International Small Cap Fund | 0.2 | 0.2 |
Fidelity International Small Cap Opportunities Fund | 0.4 | 0.4 |
Fidelity International Value Fund | 0.3 | 0.7 |
Fidelity Japan Fund | 0.2 | 0.2 |
Fidelity Japan Smaller Companies Fund | 0.4 | 0.5 |
Fidelity Nordic Fund | 0.9 | 1.0 |
Fidelity Overseas Fund | 0.0* | 0.0* |
Fidelity Pacific Basin Fund | 0.9 | 0.9 |
Spartan International Index Fund Investor Class | 9.1 | 9.3 |
| 17.5 | 19.2 |
Fixed-Income Funds | | |
Fidelity Floating Rate High Income Fund | 2.0 | 2.2 |
Fidelity Focused High Income Fund | 0.9 | 0.9 |
Fidelity High Income Fund | 1.2 | 2.0 |
Fidelity New Markets Income Fund | 0.7 | 0.7 |
Fidelity Real Estate Income Fund | 0.4 | 0.4 |
Spartan U.S. Bond Index Fund Investor Class | 22.9 | 23.6 |
| 28.1 | 29.8 |
Money Market Funds | | |
Fidelity Institutional Prime Money Market Portfolio Class I | 3.8 | 0.2 |
Net Other Assets (Liabilities)* | 0.0 | 0.0 |
| 100.0 | 100.0 |
* Amount represents less than 0.1%
Asset Allocation (% of fund's net assets) |
As of June 30, 2012 |
| Domestic Equity Funds | 50.6% | |
| International Equity Funds | 17.5% | |
| Fixed Income Funds | 28.1% | |
| Money Market Funds | 3.8% | |

As of December 31, 2011 |
| Domestic Equity Funds | 50.8% | |
| International Equity Funds | 19.2% | |
| Fixed Income Funds | 29.8% | |
| Money Market Funds | 0.2% | |

Semiannual Report
VIP FundsManager 70% Portfolio
Investments June 30, 2012 (Unaudited)
Showing Percentage of Net Assets
Equity Funds - 68.1% |
| Shares | | Value |
Domestic Equity Funds - 50.6% |
Fidelity 130/30 Large Cap Fund | 10,705 | | $ 77,073 |
Fidelity Air Transportation Portfolio | 25,061 | | 960,324 |
Fidelity Automotive Portfolio | 23,104 | | 760,337 |
Fidelity Banking Portfolio | 626,297 | | 11,686,694 |
Fidelity Biotechnology Portfolio | 42,943 | | 4,482,854 |
Fidelity Blue Chip Growth Fund | 6,097 | | 286,076 |
Fidelity Brokerage & Investment Management Portfolio | 35,403 | | 1,562,341 |
Fidelity Capital Appreciation Fund | 98,442 | | 2,791,820 |
Fidelity Chemicals Portfolio | 40,261 | | 4,384,053 |
Fidelity Commodity Strategy Fund | 1,164 | | 9,373 |
Fidelity Communications Equipment Portfolio | 5,946 | | 122,613 |
Fidelity Computers Portfolio (a) | 167,467 | | 10,213,841 |
Fidelity Construction & Housing Portfolio | 108,411 | | 4,565,175 |
Fidelity Consumer Discretionary Portfolio | 413,044 | | 10,842,407 |
Fidelity Consumer Finance Portfolio | 81,130 | | 1,074,161 |
Fidelity Consumer Staples Portfolio | 377,477 | | 29,428,091 |
Fidelity Contrafund | 1,026 | | 76,742 |
Fidelity Defense & Aerospace Portfolio | 3,967 | | 323,246 |
Fidelity Dividend Growth Fund | 118,052 | | 3,321,973 |
Fidelity Electronics Portfolio | 30,806 | | 1,434,958 |
Fidelity Energy Portfolio | 289,401 | | 13,555,550 |
Fidelity Energy Service Portfolio (a) | 58,115 | | 3,442,742 |
Fidelity Environmental & Alternative Energy Portfolio | 23,319 | | 359,109 |
Fidelity Equity-Income Fund | 2,616 | | 116,471 |
Fidelity Equity-Income II Fund | 516 | | 9,731 |
Fidelity Financial Services Portfolio | 197,978 | | 11,134,269 |
Fidelity Fund | 5,392 | | 186,093 |
Fidelity Gold Portfolio | 97,686 | | 3,508,870 |
Fidelity Growth Company Fund | 58,571 | | 5,362,784 |
Fidelity Health Care Portfolio | 55,233 | | 7,461,433 |
Fidelity Independence Fund | 561 | | 13,357 |
Fidelity Industrial Equipment Portfolio | 167,561 | | 5,703,793 |
Fidelity Industrials Portfolio | 535,903 | | 12,609,795 |
Fidelity Insurance Portfolio | 157,377 | | 7,532,049 |
Fidelity IT Services Portfolio | 157,552 | | 3,699,311 |
Fidelity Large Cap Stock Fund | 38,322 | | 720,067 |
Fidelity Large Cap Value Fund | 6,408 | | 70,931 |
Fidelity Leisure Portfolio | 1,910 | | 197,244 |
Fidelity Leveraged Company Stock Fund | 964 | | 27,252 |
Fidelity Magellan Fund | 902 | | 62,519 |
Fidelity Materials Portfolio | 885 | | 57,974 |
Fidelity Medical Delivery Portfolio (a) | 133,051 | | 8,124,074 |
Fidelity Medical Equipment & Systems Portfolio | 34,353 | | 961,881 |
Fidelity Mega Cap Stock Fund | 214,530 | | 2,383,431 |
Fidelity Mid Cap Value Fund | 4,413 | | 72,947 |
Fidelity Mid-Cap Stock Fund | 6,449 | | 183,019 |
Fidelity Multimedia Portfolio | 131,177 | | 6,649,351 |
Fidelity Nasdaq Composite Index Fund | 44,371 | | 1,738,012 |
|
| Shares | | Value |
Fidelity Natural Gas Portfolio | 254 | | $ 7,524 |
Fidelity Natural Resources Portfolio | 1,786 | | 52,272 |
Fidelity Pharmaceuticals Portfolio | 784,880 | | 11,561,279 |
Fidelity Real Estate Investment Portfolio | 172,768 | | 5,464,644 |
Fidelity Retailing Portfolio | 89,608 | | 5,328,083 |
Fidelity Small Cap Growth Fund | 10,842 | | 174,780 |
Fidelity Small Cap Stock Fund | 8,255 | | 140,500 |
Fidelity Small Cap Value Fund | 11,337 | | 172,442 |
Fidelity Software & Computer Services Portfolio | 146,864 | | 12,220,585 |
Fidelity Technology Portfolio (a) | 212,130 | | 20,682,705 |
Fidelity Telecom and Utilities Fund | 705,094 | | 13,044,247 |
Fidelity Telecommunications Portfolio | 109,435 | | 5,228,788 |
Fidelity Transportation Portfolio | 55,597 | | 2,933,849 |
Fidelity Utilities Portfolio | 84,760 | | 4,823,677 |
Fidelity Value Discovery Fund | 1,624 | | 25,102 |
Fidelity Value Fund | 1,157 | | 79,681 |
Spartan 500 Index Fund Investor Class | 172,958 | | 8,391,933 |
Spartan Extended Market Index Fund Investor Class | 344,308 | | 13,159,435 |
Spartan Total Market Index Fund Investor Class | 323,646 | | 12,748,427 |
VIP Mid Cap Portfolio Investor Class | 18,547 | | 574,582 |
TOTAL DOMESTIC EQUITY FUNDS | | 301,162,746 |
International Equity Funds - 17.5% |
Fidelity Canada Fund | 16,639 | | 836,458 |
Fidelity China Region Fund | 4,500 | | 118,795 |
Fidelity Diversified International Fund | 394,670 | | 10,667,943 |
Fidelity Emerging Asia Fund | 140,165 | | 3,697,553 |
Fidelity Emerging Markets Fund | 125,656 | | 2,627,466 |
Fidelity International Capital Appreciation Fund | 554,404 | | 6,780,360 |
Fidelity International Discovery Fund | 189,142 | | 5,549,433 |
Fidelity International Growth Fund | 33,670 | | 284,512 |
Fidelity International Real Estate Fund | 21,516 | | 174,713 |
Fidelity International Small Cap Fund | 62,203 | | 1,143,917 |
Fidelity International Small Cap Opportunities Fund | 240,030 | | 2,385,894 |
Fidelity International Value Fund | 228,518 | | 1,553,925 |
Fidelity Japan Fund | 137,751 | | 1,336,187 |
Fidelity Japan Smaller Companies Fund | 272,171 | | 2,367,892 |
Fidelity Nordic Fund | 176,988 | | 5,003,459 |
Fidelity Overseas Fund | 855 | | 24,538 |
Fidelity Pacific Basin Fund | 241,276 | | 5,503,511 |
Spartan International Index Fund Investor Class | 1,758,252 | | 54,136,587 |
TOTAL INTERNATIONAL EQUITY FUNDS | | 104,193,143 |
TOTAL EQUITY FUNDS (Cost $338,519,206) |
405,355,889
|
Fixed-Income Funds - 28.1% |
| Shares | | Value |
Fidelity Floating Rate High Income Fund | 1,248,437 | | $ 12,222,200 |
Fidelity Focused High Income Fund | 607,986 | | 5,587,395 |
Fidelity High Income Fund | 792,281 | | 7,114,681 |
Fidelity New Markets Income Fund | 248,276 | | 4,136,274 |
Fidelity Real Estate Income Fund | 217,642 | | 2,411,473 |
Spartan U.S. Bond Index Fund Investor Class | 11,430,149 | | 136,133,068 |
TOTAL FIXED-INCOME FUNDS (Cost $155,546,646) |
167,605,091
|
Money Market Funds - 3.8% |
| Shares | | Value |
Fidelity Institutional Prime Money Market Portfolio Class I
(Cost $22,379,173) | 22,379,173 | | $ 22,379,173 |
TOTAL INVESTMENT PORTFOLIO - 100.0% (Cost $516,445,025) | | 595,340,153 |
NET OTHER ASSETS (LIABILITIES) - 0.0% | | (97,570) |
NET ASSETS - 100% | $ 595,242,583 |
Legend |
(a) Non-income producing |
Other Information |
All investments are categorized as Level 1 under the Fair Value Hierarchy. The inputs or methodology used for valuing securities may not be an indication of the risk associated with investing in those securities. For more information on valuation inputs, please refer to the Security Valuation section in the accompanying Notes to Financial Statements. |
See accompanying notes which are an integral part of the financial statements.
Semiannual Report
VIP FundsManager 70% Portfolio
Statement of Assets and Liabilities
| June 30, 2012 (Unaudited) |
| | |
Assets | | |
Investment in securities, at value (cost $516,445,025) - See accompanying schedule | | $ 595,340,153 |
Receivable for investments sold | | 30,741 |
Receivable for fund shares sold | | 132 |
Total assets | | 595,371,026 |
| | |
Liabilities | | |
Payable for investments purchased | $ 132 | |
Payable for fund shares redeemed | 30,741 | |
Accrued management fee | 97,035 | |
Distribution and service plan fees payable | 535 | |
Total liabilities | | 128,443 |
| | |
Net Assets | | $ 595,242,583 |
Net Assets consist of: | | |
Paid in capital | | $ 633,575,654 |
Undistributed net investment income | | 2,253,052 |
Accumulated undistributed net realized gain (loss) on investments | | (119,481,251) |
Net unrealized appreciation (depreciation) on investments | | 78,895,128 |
Net Assets | | $ 595,242,583 |
| | |
Service Class:
Net Asset Value, offering price and redemption price per share ($77,101 ÷ 8,022 shares) | | $ 9.61 |
| | |
Service Class 2:
Net Asset Value, offering price and redemption price per share ($4,417,870 ÷ 460,872 shares) | | $ 9.59 |
| | |
Investor Class:
Net Asset Value, offering price and redemption price per share ($590,747,612 ÷ 61,476,151 shares) | | $ 9.61 |
Statement of Operations
Six months ended June 30, 2012 (Unaudited) |
| | |
Investment Income | | |
Income distributions from underlying funds | | $ 2,847,565 |
| | |
Expenses | | |
Management fee | $ 738,269 | |
Distribution and service plan fees | 5,206 | |
Independent trustees' compensation | 1,018 | |
Total expenses before reductions | 744,493 | |
Expense reductions | (149,980) | 594,513 |
Net investment income (loss) | | 2,253,052 |
Realized and Unrealized Gain (Loss) Realized gain (loss) on sale of underlying fund shares | 5,096,443 | |
Capital gain distributions from underlying funds | 1,594,359 | |
Total net realized gain (loss) | | 6,690,802 |
Change in net unrealized appreciation (depreciation) on underlying funds | | 26,331,820 |
Net gain (loss) | | 33,022,622 |
Net increase (decrease) in net assets resulting from operations | | $ 35,275,674 |
See accompanying notes which are an integral part of the financial statements.
Semiannual Report
VIP FundsManager 70% Portfolio
Financial Statements - continued
Statement of Changes in Net Assets
| Six months ended
June 30, 2012
(Unaudited) | Year ended
December 31,
2011 |
Increase (Decrease) in Net Assets | | |
Operations | | |
Net investment income (loss) | $ 2,253,052 | $ 9,133,335 |
Net realized gain (loss) | 6,690,802 | 9,928,311 |
Change in net unrealized appreciation (depreciation) | 26,331,820 | (36,732,765) |
Net increase (decrease) in net assets resulting from operations | 35,275,674 | (17,671,119) |
Distributions to shareholders from net investment income | - | (9,137,988) |
Distributions to shareholders from net realized gain | - | (1,453,223) |
Total distributions | - | (10,591,211) |
Share transactions - net increase (decrease) | 2,140,343 | 46,518,567 |
Total increase (decrease) in net assets | 37,416,017 | 18,256,237 |
| | |
Net Assets | | |
Beginning of period | 557,826,566 | 539,570,329 |
End of period (including undistributed net investment income of $2,253,052 and $0, respectively) | $ 595,242,583 | $ 557,826,566 |
Financial Highlights - Service Class
| Six months ended
June 30, 2012 | Years ended December 31, |
| (Unaudited) | 2011 | 2010 | 2009 | 2008 | 2007 |
Selected Per-Share Data | | | | | | |
Net asset value, beginning of period | $ 9.04 | $ 9.48 | $ 8.42 | $ 6.87 | $ 10.65 | $ 10.64 |
Income from Investment Operations | | | | | | |
Net investment income (loss) E | .04 | .15 | .13 | .13 | .18 | .24 |
Net realized and unrealized gain (loss) | .53 | (.41) | 1.08 | 1.55 | (3.53) | .58 |
Total from investment operations | .57 | (.26) | 1.21 | 1.68 | (3.35) | .82 |
Distributions from net investment income | - | (.15) | (.13) | (.12) | (.18) | (.18) |
Distributions from net realized gain | - | (.02) | (.02) | (.01) | (.25) | (.63) |
Total distributions | - | (.18) I | (.15) | (.13) | (.43) H | (.81) |
Net asset value, end of period | $ 9.61 | $ 9.04 | $ 9.48 | $ 8.42 | $ 6.87 | $ 10.65 |
Total Return B, C, D | 6.31% | (2.79)% | 14.32% | 24.44% | (32.03)% | 7.80% |
Ratios to Average Net Assets F, G | | | | | | |
Expenses before reductions | .35% A | .35% | .35% | .35% | .35% | .35% |
Expenses net of fee waivers, if any | .20% A | .20% | .20% | .20% | .20% | .20% |
Expenses net of all reductions | .20% A | .20% | .20% | .20% | .20% | .20% |
Net investment income (loss) | .76% A | 1.60% | 1.49% | 1.73% | 2.01% | 2.14% |
Supplemental Data | | | | | | |
Net assets, end of period (000 omitted) | $ 77 | $ 63 | $ 67 | $ 68 | $ 68 | $ 117 |
Portfolio turnover rate | 28% A | 16% | 22% | 55% | 84% | 105% |
A Annualized B Total returns for periods of less than one year are not annualized. C Total returns do not reflect charges attributable to your insurance company's separate account. Inclusion of these charges would reduce the total returns shown. D Total returns would have been lower if certain expenses had not been reduced during the applicable periods shown. E Calculated based on average shares outstanding during the period. F Amounts do not include the activity of the Underlying Funds. G Expense ratios reflect operating expenses of the class. Expenses before reductions do not reflect amounts reimbursed by the investment adviser or reductions from expense offset arrangements and do not represent the amount paid by the class during periods when reimbursements or reductions occur. Expenses net of fee waivers reflect expenses after reimbursement by the investment adviser but prior to reductions from expense offset arrangements. Expenses net of all reductions represent the net expenses paid by the class but do not include expenses of the investment companies in which the Fund invests. H Total distributions of $.43 per share is comprised of distributions from net investment income of $.184 and distributions from net realized gain of $.245 per share. I Total distributions of $.18 per share is comprised of distributions from net investment income of $.151 and distributions from net realized gain of $.024 per share. |
See accompanying notes which are an integral part of the financial statements.
Semiannual Report
Financial Highlights - Service Class 2
| Six months ended
June 30, 2012 | Years ended December 31, |
| (Unaudited) | 2011 | 2010 | 2009 | 2008 | 2007 |
Selected Per-Share Data | | | | | | |
Net asset value, beginning of period | $ 9.02 | $ 9.46 | $ 8.41 | $ 6.86 | $ 10.65 | $ 10.64 |
Income from Investment Operations | | | | | | |
Net investment income (loss) E | .03 | .14 | .12 | .12 | .16 | .22 |
Net realized and unrealized gain (loss) | .54 | (.42) | 1.07 | 1.55 | (3.53) | .59 |
Total from investment operations | .57 | (.28) | 1.19 | 1.67 | (3.37) | .81 |
Distributions from net investment income | - | (.14) | (.12) | (.11) | (.18) | (.17) |
Distributions from net realized gain | - | (.02) | (.02) | (.01) | (.25) | (.63) |
Total distributions | - | (.16) | (.14) | (.12) | (.42) H | (.80) |
Net asset value, end of period | $ 9.59 | $ 9.02 | $ 9.46 | $ 8.41 | $ 6.86 | $ 10.65 |
Total Return B, C, D | 6.32% | (2.94)% | 14.09% | 24.38% | (32.18)% | 7.63% |
Ratios to Average Net Assets F, G | | | | | | |
Expenses before reductions | .50% A | .50% | .50% | .50% | .50% | .50% |
Expenses net of fee waivers, if any | .35% A | .35% | .35% | .35% | .35% | .35% |
Expenses net of all reductions | .35% A | .35% | .35% | .35% | .35% | .35% |
Net investment income (loss) | .61% A | 1.45% | 1.34% | 1.58% | 1.86% | 1.99% |
Supplemental Data | | | | | | |
Net assets, end of period (000 omitted) | $ 4,418 | $ 3,675 | $ 2,586 | $ 1,464 | $ 223 | $ 117 |
Portfolio turnover rate | 28% A | 16% | 22% | 55% | 84% | 105% |
A Annualized B Total returns for periods of less than one year are not annualized. C Total returns do not reflect charges attributable to your insurance company's separate account. Inclusion of these charges would reduce the total returns shown. D Total returns would have been lower if certain expenses had not been reduced during the applicable periods shown. E Calculated based on average shares outstanding during the period. F Amounts do not include the activity of the Underlying Funds. G Expense ratios reflect operating expenses of the class. Expenses before reductions do not reflect amounts reimbursed by the investment adviser or reductions from expense offset arrangements and do not represent the amount paid by the class during periods when reimbursements or reductions occur. Expenses net of fee waivers reflect expenses after reimbursement by the investment adviser but prior to reductions from expense offset arrangements. Expenses net of all reductions represent the net expenses paid by the class but do not include expenses of the investment companies in which the Fund invests. H Total distributions of $.42 per share is comprised of distributions from net investment income of $.178 and distributions from net realized gain of $.245 per share. |
Financial Highlights - Investor Class
| Six months ended
June 30, 2012 | Years ended December 31, |
| (Unaudited) | 2011 | 2010 | 2009 | 2008 | 2007 |
Selected Per-Share Data | | | | | | |
Net asset value, beginning of period | $ 9.03 | $ 9.48 | $ 8.42 | $ 6.87 | $ 10.65 | $ 10.64 |
Income from Investment Operations | | | | | | |
Net investment income (loss) E | .04 | .15 | .13 | .13 | .18 | .24 |
Net realized and unrealized gain (loss) | .54 | (.42) | 1.08 | 1.55 | (3.53) | .58 |
Total from investment operations | .58 | (.27) | 1.21 | 1.68 | (3.35) | .82 |
Distributions from net investment income | - | (.15) | (.13) | (.12) | (.18) | (.18) |
Distributions from net realized gain | - | (.02) | (.02) | (.01) | (.25) | (.63) |
Total distributions | - | (.18) I | (.15) | (.13) | (.43) H | (.81) |
Net asset value, end of period | $ 9.61 | $ 9.03 | $ 9.48 | $ 8.42 | $ 6.87 | $ 10.65 |
Total Return B, C, D | 6.42% | (2.90)% | 14.32% | 24.44% | (32.03)% | 7.80% |
Ratios to Average Net Assets F, G | | | | | | |
Expenses before reductions | .25% A | .25% | .25% | .25% | .25% | .25% |
Expenses net of fee waivers, if any | .20% A | .20% | .20% | .20% | .20% | .20% |
Expenses net of all reductions | .20% A | .20% | .20% | .20% | .20% | .20% |
Net investment income (loss) | .76% A | 1.60% | 1.49% | 1.73% | 2.01% | 2.14% |
Supplemental Data | | | | | | |
Net assets, end of period (000 omitted) | $ 590,748 | $ 554,088 | $ 536,918 | $ 445,681 | $ 321,938 | $ 444,467 |
Portfolio turnover rate | 28% A | 16% | 22% | 55% | 84% | 105% |
A Annualized B Total returns for periods of less than one year are not annualized. C Total returns do not reflect charges attributable to your insurance company's separate account. Inclusion of these charges would reduce the total returns shown. D Total returns would have been lower if certain expenses had not been reduced during the applicable periods shown. E Calculated based on average shares outstanding during the period. F Amounts do not include the activity of the Underlying Funds. G Expense ratios reflect operating expenses of the class. Expenses before reductions do not reflect amounts reimbursed by the investment adviser or reductions from expense offset arrangements and do not represent the amount paid by the class during periods when reimbursements or reductions occur. Expenses net of fee waivers reflect expenses after reimbursement by the investment adviser but prior to reductions from expense offset arrangements. Expenses net of all reductions represent the net expenses paid by the class but do not include expenses of the investment companies in which the Fund invests. H Total distributions of $.43 per share is comprised of distributions from net investment income of $.184 and distributions from net realized gain of $.245 per share. I Total distributions of $.18 per share is comprised of distributions from net investment income of $.151 and distributions from net realized gain of $.024 per share. |
See accompanying notes which are an integral part of the financial statements.
Semiannual Report
VIP FundsManager 85% Portfolio
Investment Changes (Unaudited)
Fund Holdings as of June 30, 2012 |
| % of fund's
net assets | % of fund's net assets
6 months ago |
Domestic Equity Funds | | |
Fidelity 130/30 Large Cap Fund | 0.0* | 0.0* |
Fidelity Air Transportation Portfolio | 0.3 | 0.2 |
Fidelity Automotive Portfolio | 0.4 | 0.4 |
Fidelity Banking Portfolio | 4.1 | 2.9 |
Fidelity Biotechnology Portfolio | 1.5 | 0.1 |
Fidelity Blue Chip Growth Fund | 0.0* | 0.3 |
Fidelity Brokerage & Investment Management Portfolio | 0.0* | 0.4 |
Fidelity Capital Appreciation Fund | 1.7 | 0.0 |
Fidelity Chemicals Portfolio | 1.3 | 1.2 |
Fidelity Commodity Strategy Fund | 0.0* | 0.0* |
Fidelity Communications Equipment Portfolio | 0.1 | 0.3 |
Fidelity Computers Portfolio | 2.2 | 1.6 |
Fidelity Construction & Housing Portfolio | 1.1 | 0.5 |
Fidelity Consumer Discretionary Portfolio | 3.1 | 2.2 |
Fidelity Consumer Finance Portfolio | 0.3 | 0.2 |
Fidelity Consumer Staples Portfolio | 6.7 | 6.8 |
Fidelity Contrafund | 0.0* | 0.0* |
Fidelity Defense & Aerospace Portfolio | 0.2 | 0.1 |
Fidelity Dividend Growth Fund | 0.0* | 0.0* |
Fidelity Electronics Portfolio | 1.5 | 0.8 |
Fidelity Energy Portfolio | 2.6 | 3.7 |
Fidelity Energy Service Portfolio | 0.6 | 1.3 |
Fidelity Environmental & Alternative Energy Portfolio | 0.0* | 0.2 |
Fidelity Equity-Income Fund | 0.0* | 0.0* |
Fidelity Equity-Income II Fund | 0.0* | 0.0* |
Fidelity Financial Services Portfolio | 0.7 | 1.3 |
Fidelity Global Commodity Stock Fund | 0.0* | 0.6 |
Fidelity Gold Portfolio | 1.1 | 1.6 |
Fidelity Growth Company Fund | 0.5 | 0.7 |
Fidelity Health Care Portfolio | 3.7 | 3.4 |
Fidelity Independence Fund | 0.0* | 0.0* |
Fidelity Industrial Equipment Portfolio | 1.1 | 1.0 |
Fidelity Industrials Portfolio | 3.2 | 3.3 |
Fidelity Insurance Portfolio | 3.4 | 3.4 |
Fidelity IT Services Portfolio | 1.7 | 1.0 |
Fidelity Large Cap Stock Fund | 0.1 | 0.1 |
Fidelity Large Cap Value Fund | 0.1 | 0.0* |
|
| % of fund's
net assets | % of fund's net assets
6 months ago |
Fidelity Leisure Portfolio | 0.1 | 0.1 |
Fidelity Leveraged Company Stock Fund | 0.0* | 0.0* |
Fidelity Magellan Fund | 0.0* | 0.0* |
Fidelity Materials Portfolio | 0.0* | 0.1 |
Fidelity Medical Delivery Portfolio | 0.9 | 1.6 |
Fidelity Medical Equipment & Systems Portfolio | 0.0* | 0.1 |
Fidelity Mega Cap Stock Fund | 0.2 | 0.2 |
Fidelity Mid Cap Value Fund | 0.0* | 0.3 |
Fidelity Mid-Cap Stock Fund | 0.0* | 0.0* |
Fidelity Multimedia Portfolio | 1.5 | 1.3 |
Fidelity Nasdaq Composite Index Fund | 0.0* | 0.0* |
Fidelity Natural Gas Portfolio | 0.4 | 0.0 |
Fidelity Natural Resources Portfolio | 0.0* | 0.1 |
Fidelity Pharmaceuticals Portfolio | 3.3 | 2.9 |
Fidelity Real Estate Investment Portfolio | 0.0* | 0.1 |
Fidelity Retailing Portfolio | 1.3 | 0.9 |
Fidelity Small Cap Growth Fund | 0.0* | 0.5 |
Fidelity Small Cap Stock Fund | 0.0* | 0.0* |
Fidelity Small Cap Value Fund | 0.1 | 0.3 |
Fidelity Software & Computer Services Portfolio | 2.3 | 1.4 |
Fidelity Technology Portfolio | 2.3 | 5.8 |
Fidelity Telecom and Utilities Fund | 3.3 | 2.1 |
Fidelity Telecommunications Portfolio | 1.3 | 1.4 |
Fidelity Transportation Portfolio | 0.7 | 0.6 |
Fidelity Utilities Portfolio | 0.4 | 1.0 |
Fidelity Value Discovery Fund | 0.0* | 0.0* |
Spartan 500 Index Fund Investor Class | 0.1 | 1.3 |
Spartan Extended Market Index Fund Investor Class | 0.0* | 0.0* |
Spartan Total Market Index Fund Investor Class | 0.5 | 1.0 |
VIP Energy Portfolio Investor Class | 0.1 | 0.1 |
VIP Mid Cap Portfolio Investor Class | 0.0* | 0.3 |
| 62.1 | 63.1 |
International Equity Funds | | |
Fidelity Canada Fund | 0.1 | 0.8 |
Fidelity China Region Fund | 0.1 | 0.1 |
Fidelity Diversified International Fund | 3.3 | 0.7 |
Fidelity Emerging Asia Fund | 1.0 | 1.0 |
Fund Holdings as of June 30, 2012 |
| % of fund's
net assets | % of fund's net assets
6 months ago |
Fidelity Emerging Markets Fund | 0.3 | 0.5 |
Fidelity International Capital Appreciation Fund | 2.9 | 1.1 |
Fidelity International Discovery Fund | 0.3 | 1.9 |
Fidelity International Real Estate Fund | 0.1 | 0.0* |
Fidelity International Small Cap Fund | 0.1 | 0.3 |
Fidelity International Small Cap Opportunities Fund | 0.5 | 0.5 |
Fidelity International Value Fund | 0.0 | 1.1 |
Fidelity Japan Fund | 0.0* | 0.3 |
Fidelity Japan Smaller Companies Fund | 0.5 | 1.5 |
Fidelity Nordic Fund | 0.1 | 0.7 |
Fidelity Overseas Fund | 0.0* | 0.0* |
Fidelity Pacific Basin Fund | 2.4 | 2.2 |
Spartan International Index Fund Investor Class | 9.3 | 9.4 |
| 21.0 | 22.1 |
Fixed-Income Funds | | |
Fidelity Floating Rate High Income Fund | 0.1 | 0.1 |
Fidelity Focused High Income Fund | 0.4 | 0.4 |
Fidelity High Income Fund | 1.8 | 2.1 |
Fidelity New Markets Income Fund | 0.4 | 0.3 |
Fidelity Real Estate Income Fund | 0.1 | 0.1 |
Spartan U.S. Bond Index Fund Investor Class | 13.7 | 11.7 |
| 16.5 | 14.7 |
Money Market Funds | | |
Fidelity Institutional Prime Money Market Portfolio Class I | 0.4 | 0.1 |
Net Other Assets (Liabilities)* | 0.0 | 0.0 |
| 100.0 | 100.0 |
* Amount represents less than 0.1%
Asset Allocation (% of fund's net assets) |
As of June 30, 2012 |
| Domestic Equity Funds | 62.1% | |
| International Equity Funds | 21.0% | |
| Fixed Income Funds | 16.5% | |
| Money Market Funds | 0.4% | |

As of December 31, 2011 |
| Domestic Equity Funds | 63.1% | |
| International Equity Funds | 22.1% | |
| Fixed Income Funds | 14.7% | |
| Money Market Funds | 0.1% | |

Semiannual Report
VIP FundsManager 85% Portfolio
Investments June 30, 2012 (Unaudited)
Showing Percentage of Net Assets
Equity Funds - 83.1% |
| Shares | | Value |
Domestic Equity Funds - 62.1% |
Fidelity 130/30 Large Cap Fund | 6,357 | | $ 45,771 |
Fidelity Air Transportation Portfolio | 15,685 | | 601,039 |
Fidelity Automotive Portfolio | 29,308 | | 964,541 |
Fidelity Banking Portfolio | 511,478 | | 9,544,174 |
Fidelity Biotechnology Portfolio | 32,868 | | 3,431,060 |
Fidelity Blue Chip Growth Fund | 2,059 | | 96,603 |
Fidelity Brokerage & Investment Management Portfolio | 1,295 | | 57,144 |
Fidelity Capital Appreciation Fund | 135,676 | | 3,847,776 |
Fidelity Chemicals Portfolio | 27,112 | | 2,952,217 |
Fidelity Commodity Strategy Fund | 1,164 | | 9,373 |
Fidelity Communications Equipment Portfolio | 6,051 | | 124,775 |
Fidelity Computers Portfolio (a) | 81,853 | | 4,992,210 |
Fidelity Construction & Housing Portfolio | 57,331 | | 2,414,211 |
Fidelity Consumer Discretionary Portfolio | 275,376 | | 7,228,615 |
Fidelity Consumer Finance Portfolio | 48,870 | | 647,033 |
Fidelity Consumer Staples Portfolio | 198,724 | | 15,492,495 |
Fidelity Contrafund | 891 | | 66,690 |
Fidelity Defense & Aerospace Portfolio | 4,384 | | 357,222 |
Fidelity Dividend Growth Fund | 2,810 | | 79,081 |
Fidelity Electronics Portfolio | 71,670 | | 3,338,408 |
Fidelity Energy Portfolio | 127,391 | | 5,966,999 |
Fidelity Energy Service Portfolio (a) | 25,028 | | 1,482,652 |
Fidelity Environmental & Alternative Energy Portfolio | 4,145 | | 63,830 |
Fidelity Equity-Income Fund | 1,004 | | 44,701 |
Fidelity Equity-Income II Fund | 1,232 | | 23,229 |
Fidelity Financial Services Portfolio | 27,902 | | 1,569,196 |
Fidelity Global Commodity Stock Fund | 1,782 | | 24,116 |
Fidelity Gold Portfolio | 68,318 | | 2,453,974 |
Fidelity Growth Company Fund | 12,516 | | 1,145,975 |
Fidelity Health Care Portfolio | 62,995 | | 8,510,019 |
Fidelity Independence Fund | 421 | | 10,027 |
Fidelity Industrial Equipment Portfolio | 73,865 | | 2,514,373 |
Fidelity Industrials Portfolio | 312,463 | | 7,352,258 |
Fidelity Insurance Portfolio | 165,015 | | 7,897,603 |
Fidelity IT Services Portfolio | 171,187 | | 4,019,481 |
Fidelity Large Cap Stock Fund | 7,857 | | 147,638 |
Fidelity Large Cap Value Fund | 9,258 | | 102,485 |
Fidelity Leisure Portfolio | 1,781 | | 183,904 |
Fidelity Leveraged Company Stock Fund | 3,104 | | 87,751 |
Fidelity Magellan Fund | 858 | | 59,517 |
Fidelity Materials Portfolio | 323 | | 21,192 |
Fidelity Medical Delivery Portfolio (a) | 34,871 | | 2,129,196 |
Fidelity Medical Equipment & Systems Portfolio | 1,975 | | 55,313 |
Fidelity Mega Cap Stock Fund | 44,237 | | 491,476 |
Fidelity Mid Cap Value Fund | 4,528 | | 74,848 |
Fidelity Mid-Cap Stock Fund | 2,614 | | 74,186 |
Fidelity Multimedia Portfolio | 68,535 | | 3,474,031 |
|
| Shares | | Value |
Fidelity Nasdaq Composite Index Fund | 892 | | $ 34,949 |
Fidelity Natural Gas Portfolio | 34,318 | | 1,015,117 |
Fidelity Natural Resources Portfolio | 727 | | 21,275 |
Fidelity Pharmaceuticals Portfolio | 512,314 | | 7,546,379 |
Fidelity Real Estate Investment Portfolio | 355 | | 11,236 |
Fidelity Retailing Portfolio | 48,400 | | 2,877,854 |
Fidelity Small Cap Growth Fund | 2,185 | | 35,218 |
Fidelity Small Cap Stock Fund | 3,469 | | 59,044 |
Fidelity Small Cap Value Fund | 10,788 | | 164,082 |
Fidelity Software & Computer Services Portfolio | 64,522 | | 5,368,885 |
Fidelity Technology Portfolio (a) | 54,586 | | 5,322,166 |
Fidelity Telecom and Utilities Fund | 405,067 | | 7,493,749 |
Fidelity Telecommunications Portfolio | 64,571 | | 3,085,214 |
Fidelity Transportation Portfolio | 29,060 | | 1,533,471 |
Fidelity Utilities Portfolio | 15,792 | | 898,695 |
Fidelity Value Discovery Fund | 589 | | 9,101 |
Spartan 500 Index Fund Investor Class | 2,628 | | 127,531 |
Spartan Extended Market Index Fund Investor Class | 192 | | 7,335 |
Spartan Total Market Index Fund Investor Class | 28,290 | | 1,114,352 |
VIP Energy Portfolio Investor Class | 16,688 | | 298,053 |
VIP Mid Cap Portfolio Investor Class | 2,527 | | 78,286 |
TOTAL DOMESTIC EQUITY FUNDS | | 143,372,400 |
International Equity Funds - 21.0% |
Fidelity Canada Fund | 5,051 | | 253,920 |
Fidelity China Region Fund | 5,086 | | 134,267 |
Fidelity Diversified International Fund | 279,467 | | 7,554,000 |
Fidelity Emerging Asia Fund | 85,869 | | 2,265,224 |
Fidelity Emerging Markets Fund | 35,758 | | 747,695 |
Fidelity International Capital Appreciation Fund | 540,299 | | 6,607,853 |
Fidelity International Discovery Fund | 22,522 | | 660,809 |
Fidelity International Real Estate Fund | 14,529 | | 117,972 |
Fidelity International Small Cap Fund | 8,843 | | 162,615 |
Fidelity International Small Cap Opportunities Fund | 117,547 | | 1,168,421 |
Fidelity Japan Fund | 8,600 | | 83,418 |
Fidelity Japan Smaller Companies Fund | 145,341 | | 1,264,469 |
Fidelity Nordic Fund | 11,056 | | 312,544 |
Fidelity Overseas Fund | 336 | | 9,656 |
Fidelity Pacific Basin Fund | 244,925 | | 5,586,733 |
Spartan International Index Fund Investor Class | 698,517 | | 21,507,349 |
TOTAL INTERNATIONAL EQUITY FUNDS | | 48,436,945 |
TOTAL EQUITY FUNDS (Cost $162,587,803) |
191,809,345
|
Fixed-Income Funds - 16.5% |
| Shares | | Value |
Fidelity Floating Rate High Income Fund | 23,738 | | $ 232,391 |
Fidelity Focused High Income Fund | 108,637 | | 998,375 |
Fidelity High Income Fund | 449,682 | | 4,038,148 |
Fidelity New Markets Income Fund | 54,589 | | 909,447 |
Fidelity Real Estate Income Fund | 25,450 | | 281,987 |
Spartan U.S. Bond Index Fund Investor Class | 2,655,350 | | 31,625,224 |
TOTAL FIXED-INCOME FUNDS (Cost $36,081,092) |
38,085,572
|
Money Market Funds - 0.4% |
| Shares | | Value |
Fidelity Institutional Prime Money Market Portfolio Class I
(Cost $1,012,574) | 1,012,574 | | $ 1,012,574 |
TOTAL INVESTMENT PORTFOLIO - 100.0% (Cost $199,681,469) | | 230,907,491 |
NET OTHER ASSETS (LIABILITIES) - 0.0% | | (39,087) |
NET ASSETS - 100% | $ 230,868,404 |
Legend |
(a) Non-income producing |
Other Information |
All investments are categorized as Level 1 under the Fair Value Hierarchy. The inputs or methodology used for valuing securities may not be an indication of the risk associated with investing in those securities. For more information on valuation inputs, please refer to the Security Valuation section in the accompanying Notes to Financial Statements. |
See accompanying notes which are an integral part of the financial statements.
Semiannual Report
VIP FundsManager 85% Portfolio
Statement of Assets and Liabilities
| June 30, 2012 (Unaudited) |
| | |
Assets | | |
Investment in securities, at value (cost $199,681,469) - See accompanying schedule | | $ 230,907,491 |
Cash | | 8 |
Receivable for fund shares sold | | 166,665 |
Total assets | | 231,074,164 |
| | |
Liabilities | | |
Payable for investments purchased | $ 165,242 | |
Payable for fund shares redeemed | 1,423 | |
Accrued management fee | 38,595 | |
Distribution and service plan fees payable | 500 | |
Total liabilities | | 205,760 |
| | |
Net Assets | | $ 230,868,404 |
Net Assets consist of: | | |
Paid in capital | | $ 253,074,082 |
Undistributed net investment income | | 472,389 |
Accumulated undistributed net realized gain (loss) on investments | | (53,904,089) |
Net unrealized appreciation (depreciation) on investments | | 31,226,022 |
Net Assets | | $ 230,868,404 |
Service Class:
Net Asset Value, offering price and redemption price per share ($208,778 ÷ 22,835 shares) | | $ 9.14 |
| | |
Service Class 2:
Net Asset Value, offering price and redemption price per share ($4,134,484 ÷ 453,695 shares) | | $ 9.11 |
| | |
Investor Class:
Net Asset Value, offering price and redemption price per share ($226,525,142 ÷ 24,762,384 shares) | | $ 9.15 |
Statement of Operations
Six months ended June 30, 2012 (Unaudited) |
| | |
Investment Income | | |
Income distributions from underlying funds | | $ 719,695 |
| | |
Expenses | | |
Management fee | $ 304,905 | |
Distribution and service plan fees | 5,107 | |
Independent trustees' compensation | 424 | |
Total expenses before reductions | 310,436 | |
Expense reductions | (63,130) | 247,306 |
Net investment income (loss) | | 472,389 |
Realized and Unrealized Gain (Loss) Realized gain (loss) on sale of underlying fund shares | 2,873,715 | |
Capital gain distributions from underlying funds | 722,579 | |
Total net realized gain (loss) | | 3,596,294 |
Change in net unrealized appreciation (depreciation) on underlying funds | | 11,537,537 |
Net gain (loss) | | 15,133,831 |
Net increase (decrease) in net assets resulting from operations | | $ 15,606,220 |
See accompanying notes which are an integral part of the financial statements.
Semiannual Report
Statement of Changes in Net Assets
| Six months ended
June 30, 2012
(Unaudited) | Year ended
December 31,
2011 |
Increase (Decrease) in Net Assets | | |
Operations | | |
Net investment income (loss) | $ 472,389 | $ 2,982,445 |
Net realized gain (loss) | 3,596,294 | 7,137,454 |
Change in net unrealized appreciation (depreciation) | 11,537,537 | (24,181,458) |
Net increase (decrease) in net assets resulting from operations | 15,606,220 | (14,061,559) |
Distributions to shareholders from net investment income | - | (2,967,823) |
Distributions to shareholders from net realized gain | - | (621,579) |
Total distributions | - | (3,589,402) |
Share transactions - net increase (decrease) | (20,389,724) | 25,585,800 |
Total increase (decrease) in net assets | (4,783,504) | 7,934,839 |
| | |
Net Assets | | |
Beginning of period | 235,651,908 | 227,717,069 |
End of period (including undistributed net investment income of $472,389 and $0, respectively) | $ 230,868,404 | $ 235,651,908 |
Financial Highlights - Service Class
| Six months ended
June 30, 2012 | Years ended December 31, |
| (Unaudited) | 2011 | 2010 | 2009 | 2008 | 2007 |
Selected Per-Share Data | | | | | | |
Net asset value, beginning of period | $ 8.57 | $ 9.19 | $ 8.02 | $ 6.32 | $ 10.76 | $ 10.72 |
Income from Investment Operations | | | | | | |
Net investment income (loss) E | .02 | .11 | .10 | .11 | .13 | .17 |
Net realized and unrealized gain (loss) | .55 | (.60) | 1.19 | 1.70 | (4.14) | .74 |
Total from investment operations | .57 | (.49) | 1.29 | 1.81 | (4.01) | .91 |
Distributions from net investment income | - | (.11) | (.10) | (.10) | (.13) | (.13) |
Distributions from net realized gain | - | (.02) | (.02) | (.01) | (.30) | (.74) |
Total distributions | - | (.13) | (.12) | (.11) | (.43) H | (.87) |
Net asset value, end of period | $ 9.14 | $ 8.57 | $ 9.19 | $ 8.02 | $ 6.32 | $ 10.76 |
Total Return B, C, D | 6.65% | (5.30)% | 16.07% | 28.56% | (38.14)% | 8.52% |
Ratios to Average Net Assets F, G | | | | | | |
Expenses before reductions | .35% A | .35% | .35% | .35% | .35% | .35% |
Expenses net of fee waivers, if any | .20% A | .20% | .20% | .20% | .20% | .20% |
Expenses net of all reductions | .20% A | .20% | .20% | .20% | .20% | .20% |
Net investment income (loss) | .39% A | 1.23% | 1.20% | 1.53% | 1.52% | 1.48% |
Supplemental Data | | | | | | |
Net assets, end of period (000 omitted) | $ 209 | $ 183 | $ 108 | $ 112 | $ 62 | $ 118 |
Portfolio turnover rate | 54% A | 26% | 38% | 66% | 92% | 104% |
A Annualized B Total returns for periods of less than one year are not annualized. C Total returns do not reflect charges attributable to your insurance company's separate account. Inclusion of these charges would reduce the total returns shown. D Total returns would have been lower if certain expenses had not been reduced during the applicable periods shown. E Calculated based on average shares outstanding during the period. F Amounts do not include the activity of the Underlying Funds. G Expense ratios reflect operating expenses of the class. Expenses before reductions do not reflect amounts reimbursed by the investment adviser or reductions from expense offset arrangements and do not represent the amount paid by the class during periods when reimbursements or reductions occur. Expenses net of fee waivers reflect expenses after reimbursement by the investment adviser but prior to reductions from expense offset arrangements. Expenses net of all reductions represent the net expenses paid by the class but do not include expenses of the investment companies in which the Fund invests. H Total distributions of $.43 per share is comprised of distributions from net investment income of $.126 and distributions from net realized gain of $.300 per share. |
See accompanying notes which are an integral part of the financial statements.
Semiannual Report
Financial Highlights - Service Class 2
| Six months ended
June 30, 2012 | Years ended December 31, |
| (Unaudited) | 2011 | 2010 | 2009 | 2008 | 2007 |
Selected Per-Share Data | | | | | | |
Net asset value, beginning of period | $ 8.55 | $ 9.17 | $ 8.00 | $ 6.32 | $ 10.76 | $ 10.72 |
Income from Investment Operations | | | | | | |
Net investment income (loss) E | .01 | .10 | .09 | .10 | .11 | .15 |
Net realized and unrealized gain (loss) | .55 | (.60) | 1.19 | 1.68 | (4.13) | .74 |
Total from investment operations | .56 | (.50) | 1.28 | 1.78 | (4.02) | .89 |
Distributions from net investment income | - | (.10) | (.09) | (.09) | (.12) | (.11) |
Distributions from net realized gain | - | (.02) | (.02) | (.01) | (.30) | (.74) |
Total distributions | - | (.12) | (.11) | (.10) | (.42) H | (.85) |
Net asset value, end of period | $ 9.11 | $ 8.55 | $ 9.17 | $ 8.00 | $ 6.32 | $ 10.76 |
Total Return B, C, D | 6.55% | (5.44)% | 16.00% | 28.17% | (38.19)% | 8.36% |
Ratios to Average Net Assets F, G | | | | | | |
Expenses before reductions | .50% A | .50% | .50% | .50% | .50% | .50% |
Expenses net of fee waivers, if any | .35% A | .35% | .35% | .35% | .35% | .35% |
Expenses net of all reductions | .35% A | .35% | .35% | .35% | .35% | .35% |
Net investment income (loss) | .24% A | 1.08% | 1.05% | 1.38% | 1.37% | 1.33% |
Supplemental Data | | | | | | |
Net assets, end of period (000 omitted) | $ 4,134 | $ 3,574 | $ 2,384 | $ 886 | $ 254 | $ 118 |
Portfolio turnover rate | 54% A | 26% | 38% | 66% | 92% | 104% |
A Annualized B Total returns for periods of less than one year are not annualized. C Total returns do not reflect charges attributable to your insurance company's separate account. Inclusion of these charges would reduce the total returns shown. D Total returns would have been lower if certain expenses had not been reduced during the applicable periods shown. E Calculated based on average shares outstanding during the period. F Amounts do not include the activity of the Underlying Funds. G Expense ratios reflect operating expenses of the class. Expenses before reductions do not reflect amounts reimbursed by the investment adviser or reductions from expense offset arrangements and do not represent the amount paid by the class during periods when reimbursements or reductions occur. Expenses net of fee waivers reflect expenses after reimbursement by the investment adviser but prior to reductions from expense offset arrangements. Expenses net of all reductions represent the net expenses paid by the class but do not include expenses of the investment companies in which the Fund invests. H Total distributions of $.42 per share is comprised of distributions from net investment income of $.121 and distributions from net realized gain of $.300 per share. |
Financial Highlights - Investor Class
| Six months ended
June 30, 2012 | Years ended December 31, |
| (Unaudited) | 2011 | 2010 | 2009 | 2008 | 2007 |
Selected Per-Share Data | | | | | | |
Net asset value, beginning of period | $ 8.58 | $ 9.20 | $ 8.02 | $ 6.32 | $ 10.77 | $ 10.72 |
Income from Investment Operations | | | | | | |
Net investment income (loss) E | .02 | .11 | .10 | .11 | .13 | .17 |
Net realized and unrealized gain (loss) | .55 | (.60) | 1.20 | 1.70 | (4.15) | .75 |
Total from investment operations | .57 | (.49) | 1.30 | 1.81 | (4.02) | .92 |
Distributions from net investment income | - | (.11) | (.10) | (.10) | (.13) | (.13) |
Distributions from net realized gain | - | (.02) | (.02) | (.01) | (.30) | (.74) |
Total distributions | - | (.13) | (.12) | (.11) | (.43) H | (.87) |
Net asset value, end of period | $ 9.15 | $ 8.58 | $ 9.20 | $ 8.02 | $ 6.32 | $ 10.77 |
Total Return B, C, D | 6.64% | (5.29)% | 16.20% | 28.56% | (38.20)% | 8.63% |
Ratios to Average Net Assets F, G | | | | | | |
Expenses before reductions | .25% A | .25% | .25% | .25% | .25% | .25% |
Expenses net of fee waivers, if any | .20% A | .20% | .20% | .20% | .20% | .20% |
Expenses net of all reductions | .20% A | .20% | .20% | .20% | .20% | .20% |
Net investment income (loss) | .39% A | 1.23% | 1.20% | 1.53% | 1.52% | 1.48% |
Supplemental Data | | | | | | |
Net assets, end of period (000 omitted) | $ 226,525 | $ 231,895 | $ 225,225 | $ 180,463 | $ 120,650 | $ 176,456 |
Portfolio turnover rate | 54% A | 26% | 38% | 66% | 92% | 104% |
A Annualized B Total returns for periods of less than one year are not annualized. C Total returns do not reflect charges attributable to your insurance company's separate account. Inclusion of these charges would reduce the total returns shown. D Total returns would have been lower if certain expenses had not been reduced during the applicable periods shown. E Calculated based on average shares outstanding during the period. F Amounts do not include the activity of the Underlying Funds. G Expense ratios reflect operating expenses of the class. Expenses before reductions do not reflect amounts reimbursed by the investment adviser or reductions from expense offset arrangements and do not represent the amount paid by the class during periods when reimbursements or reductions occur. Expenses net of fee waivers reflect expenses after reimbursement by the investment adviser but prior to reductions from expense offset arrangements. Expenses net of all reductions represent the net expenses paid by the class but do not include expenses of the investment companies in which the Fund invests. H Total distributions of $.43 per share is comprised of distributions from net investment income of $.126 and distributions from net realized gain of $.300 per share. |
See accompanying notes which are an integral part of the financial statements.
Semiannual Report
Notes to Financial Statements
For the period ended June 30, 2012 (Unaudited)
1. Organization.
VIP FundsManager® 20% Portfolio, VIP FundsManager 50% Portfolio, VIP FundsManager 60% Portfolio, VIP FundsManager 70%, and VIP FundsManager 85% Portfolio (the Funds) are funds of Variable Insurance Products Fund V. Variable Insurance Products Fund V (the Trust) (referred to in this report as Fidelity Variable Insurance Products) is registered under the Investment Company Act of 1940, as amended (the 1940 Act), as an open-end management investment company organized as a Massachusetts business trust. Each Fund is authorized to issue an unlimited number of shares. The Funds invest primarily in a combination of other Fidelity equity, fixed income, and short-term funds (the Underlying Funds) managed by Fidelity Management & Research Company (FMR). Shares of each Fund may only be purchased by insurance companies for the purpose of funding variable annuity or variable life insurance contracts. Each Fund offers three classes of shares: Service Class shares, Service Class 2 shares and Investor Class shares. All classes have equal rights and voting privileges, except for matters affecting a single class. Investment income, realized and unrealized capital gains and losses, the common expenses of each Fund, and certain fund-level expense reductions, if any, are allocated on a pro-rata basis to each class based on the relative net assets of each class to the total net assets of each Fund. Each class differs with respect to distribution and service plan fees incurred. Certain expense reductions may also differ by class.
2. Significant Accounting Policies.
The financial statements have been prepared in conformity with accounting principles generally accepted in the United States of America (GAAP), which require management to make certain estimates and assumptions at the date of the financial statements. Actual results could differ from those estimates. Subsequent events, if any, through the date that the financial statements were issued have been evaluated in the preparation of the financial statements. The following summarizes the significant accounting policies of the Funds:
Security Valuation. Investments are valued as of 4:00 p.m. Eastern time on the last calendar day of the period. Each Fund categorizes the inputs to valuation techniques used to value their investments into a disclosure hierarchy consisting of three levels as shown below:
Level 1 - quoted prices in active markets for identical investments
Level 2 - other significant observable inputs (including quoted prices for similar investments, interest rates, prepayment speeds, etc.)
Level 3 - unobservable inputs (including the Fund's own assumptions based on the best information available)
Valuation techniques used to value each Fund's investments by major category are as follows. Investments in the Underlying Funds are valued at their closing net asset value (NAV) each business day and are categorized as Level 1 in the hierarchy.
Investment Transactions and Income. For financial reporting purposes, the Funds' investment holdings and NAV include trades executed through the end of the last business day of the period. The NAV per share for processing shareholder transactions is calculated as of the close of business of the New York Stock Exchange (NYSE), normally 4:00 p.m. Eastern time and includes trades executed through the end of the prior business day. Gains and losses on securities sold are determined on the basis of identified cost. Income and capital gain distributions from the Underlying Funds, if any, are recorded on the ex-dividend date.
Expenses. Expenses directly attributable to a fund are charged to that fund. Expenses attributable to more than one fund are allocated among the respective funds on the basis of relative net assets or other appropriate methods. Expenses included in the accompanying financial statements reflect the expenses of each Fund and do not include any expenses associated with the Underlying Funds. Expense estimates are accrued in the period to which they relate and adjustments are made when actual amounts are known.
Income Tax Information and Distributions to Shareholders. Each year, each Fund intends to qualify as a regulated investment company under Subchapter M of the Internal Revenue Code, including distributing substantially all of its taxable income and realized gains. As a result, no provision for income taxes is required. Each Fund files a U.S. federal tax return, in addition to state and local tax returns as required. A fund's federal income tax returns are subject to examination by the Internal Revenue Service (IRS) for a period of three fiscal years after they are filed. State and local tax returns may be subject to examination for an additional fiscal year depending on the jurisdiction.
Distributions are declared and recorded on the ex-dividend date. Income dividends and capital gain distributions are declared separately for each class. Income and capital gain distributions are determined in accordance with income tax regulations, which may differ from GAAP.
Capital accounts within the financial statements are adjusted for permanent book-tax differences. These adjustments have no impact on net assets or the results of operations. Temporary book-tax differences will reverse in a subsequent period.
Book-tax differences are primarily due to the short-term gain distributions from Underlying Funds, capital loss carryforwards and losses deferred due to wash sales and excise tax regulations.
Semiannual Report
Notes to Financial Statements (Unaudited) - continued
2. Significant Accounting Policies - continued
Income Tax Information and Distributions to Shareholders - continued
The federal tax cost of investment securities and unrealized appreciation (depreciation) as of period end were as follows for each Fund:
| Tax cost | Gross unrealized
appreciation | Gross unrealized
depreciation | Net unrealized
appreciation
(depreciation) on
securities and other investments |
VIP FundsManager 20% Portfolio | $ 560,909,280 | $ 32,775,135 | $ (4,262,991) | $ 28,512,144 |
VIP FundsManager 50% Portfolio | 798,845,555 | 98,796,513 | (12,984,518) | 85,811,995 |
VIP FundsManager 60% Portfolio | 4,865,840,843 | 448,668,424 | (101,724,861) | 346,943,563 |
VIP FundsManager 70% Portfolio | 516,960,160 | 90,665,549 | (12,285,556) | 78,379,993 |
VIP FundsManager 85% Portfolio | 199,960,058 | 36,089,777 | (5,142,344) | 30,947,433 |
Capital loss carryforwards are only available to offset future capital gains of the Funds to the extent provided by regulations and may be limited. Under the Regulated Investment Company Modernization Act of 2010 (the Act), the Funds are permitted to carry forward capital losses incurred in taxable years beginning after December 22, 2010 for an unlimited period and such capital losses are required to be used prior to any losses that expire. At December 31, 2011, capital loss carryforwards were as follows:
| Fiscal year of
expiration | | Total capital loss
carryfoward |
| 2016 | 2017 | |
VIP FundsManager 20% Portfolio | $ (100,811) | $ (5,038,987) | $ (5,139,798) |
VIP FundsManager 50% Portfolio | (16,594,975) | (57,794,871) | (74,389,846) |
VIP FundsManager 60% Portfolio | (-) | (37,214,297) | (37,214,297) |
VIP FundsManager 70% Portfolio | (43,028,530) | (82,605,094) | (125,633,624) |
VIP FundsManager 85% Portfolio | (12,672,252) | (44,547,909) | (57,220,161) |
3. Purchases and Sales of Investments.
Purchases and redemptions of the Underlying Fund shares are noted in the table below.
| Purchases ($) | Redemptions ($) |
VIP FundsManager 20% Portfolio | 96,790,970 | 54,046,175 |
VIP FundsManager 50% Portfolio | 195,244,952 | 109,463,804 |
VIP FundsManager 60% Portfolio | 1,429,907,872 | 557,647,210 |
VIP FundsManager 70% Portfolio | 89,295,984 | 83,303,590 |
VIP FundsManager 85% Portfolio | 65,977,492 | 85,172,173 |
4. Fees and Other Transactions with Affiliates.
Management Fee. Strategic Advisers, Inc. (Strategic Advisers), an affiliate of FMR, provides the funds with investment management related services. For these services each fund pays a monthly management fee to Strategic Advisers. The management fee is based on an annual rate of ..25% of each fund's average net assets. The management fee is reduced by an amount equal to the fees and expenses paid by the fund to the independent Trustees.
Strategic Advisers has contractually agreed to waive 0.05% of its management fee, thereby limiting each fund's management fee to an annual rate of 0.20% of average net assets, until April 30, 2013.
Other Transactions. Strategic Advisers has entered into an administration agreement with FMR under which FMR provides management and administrative services (other than investment advisory services) necessary for the operation of each Fund. Pursuant to this agreement, FMR pays all expenses of each Fund, excluding the distribution and service fees, the compensation of the independent Trustees and certain other expenses such as interest expense. FMR also contracts with other Fidelity companies to perform the services necessary for the operation of each Fund.
Distribution and Service Plan Fees. In accordance with Rule 12b-1 of the 1940 Act, the Funds have adopted separate 12b-1 Plans for each Service Class of shares. Each Service Class pays Fidelity Distributors Corporation (FDC), an affiliate of FMR, a service fee. For the period, the service fee is based on an annual rate of .10% of Service Class' average net assets and .25% of Service Class 2's average net assets.
Semiannual Report
4. Fees and Other Transactions with Affiliates - continued
Distribution and Service Plan Fees - continued
For the period, total fees, all of which were reallowed to insurance companies for the distribution of shares and providing shareholder support services were as follows:
| Service
Class | Service
Class 2 | Total |
VIP FundsManager 20% Portfolio | $ 33 | $ 1,765 | $ 1,798 |
VIP FundsManager 50% Portfolio | 31 | 84,350 | 84,381 |
VIP FundsManager 60% Portfolio | 31 | 256,299 | 256,330 |
VIP FundsManager 70% Portfolio | 38 | 5,168 | 5,206 |
VIP FundsManager 85% Portfolio | 101 | 5,006 | 5,107 |
5. Expense Reductions.
Strategic Advisers contractually agreed to limit each funds' management fee to an annual rate of 0.20% of each funds' average net assets until April 30, 2013. For the period, each fund's management fees were reduced by the following amounts:
| Management Fee Waiver |
VIP FundsManager 20% Portfolio | $ 141,472 |
VIP FundsManager 50% Portfolio | 215,960 |
VIP FundsManager 60% Portfolio | 1,206,605 |
VIP FundsManager 70% Portfolio | 147,896 |
VIP FundsManager 85% Portfolio | 61,043 |
In addition, FMR has contractually agreed to reimburse 0.10% of class-level expenses for each fund's Service class and Service Class 2. During the period, this reimbursement reduced each fund's Service class and Service class 2's expenses by the following amounts:
| Reimbursement
|
VIP FundsManager 20% Portfolio | |
Service Class | $ 33 |
Service Class 2 | 743 |
VIP FundsManager 50% Portfolio | |
Service Class | 31 |
Service Class 2 | 34,591 |
VIP FundsManager 60% Portfolio | |
Service Class | 31 |
Service Class 2 | 105,904 |
VIP FundsManager 70% Portfolio | |
Service Class | 38 |
Service Class 2 | 2,046 |
VIP FundsManager 85% Portfolio | |
Service Class | 101 |
Service Class 2 | 1,986 |
6. Distributions to Shareholders.
Distributions to shareholders of each class were as follows:
| Six months ended
June 30,
2012 | Year ended
December 31,
2011 |
VIP FundsManager 20% Portfolio | | |
From net investment income | | |
Service Class | $ - | $ 1,034 |
Service Class 2 | - | 20,621 |
Investor Class | - | 8,578,368 |
Total | $ - | $ 8,600,023 |
Semiannual Report
Notes to Financial Statements (Unaudited) - continued
6. Distributions to Shareholders - continued
| Six months ended
June 30,
2012 | Year ended
December 31,
2011 |
VIP FundsManager 20% Portfolio | | |
From net realized gain | | |
Service Class | $ - | $ 118 |
Service Class 2 | - | 2,530 |
Investor Class | - | 980,385 |
Total | $ - | $ 983,033 |
VIP FundsManager 50% Portfolio | | |
From net investment income | | |
Service Class | $ - | $ 1,048 |
Service Class 2 | - | 303,133 |
Investor Class | - | 13,176,616 |
Total | $ - | $ 13,480,797 |
From net realized gain | | |
Service Class | $ - | $ 131 |
Service Class 2 | - | 39,229 |
Investor Class | - | 1,647,077 |
Total | $ - | $ 1,686,437 |
VIP FundsManager 60% Portfolio | | |
From net investment income | | |
Service Class | $ - | $ 827 |
Service Class 2 | - | 621,101 |
Investor Class | - | 58,688,323 |
Total | $ - | $ 59,310,251 |
From net realized gain | | |
Service Class | $ - | $ 125 |
Service Class 2 | - | 98,069 |
Investor Class | - | 8,866,581 |
Total | $ - | $ 8,964,775 |
VIP FundsManager 70% Portfolio | | |
From net investment income | | |
Service Class | $ - | $ 1,032 |
Service Class 2 | - | 55,238 |
Investor Class | - | 9,081,718 |
Total | $ - | $ 9,137,988 |
From net realized gain | | |
Service Class | $ - | $ 164 |
Service Class 2 | - | 9,607 |
Investor Class | - | 1,443,452 |
Total | $ - | $ 1,453,223 |
VIP FundsManager 85% Portfolio | | |
From net investment income | | |
Service Class | $ - | $ 2,313 |
Service Class 2 | - | 40,380 |
Investor Class | - | 2,925,130 |
Total | $ - | $ 2,967,823 |
From net realized gain | | |
Service Class | $ - | $ 484 |
Service Class 2 | - | 9,477 |
Investor Class | - | 611,618 |
Total | $ - | $ 621,579 |
Semiannual Report
7. Share Transactions.
Transactions for each class of shares were as follows:
| Shares | Dollars |
| Six months ended
June 30,
2012 | Year ended
December 31,
2011 | Six months ended
June 30,
2012 | Year ended
December 31,
2011 |
VIP FundsManager 20% Portfolio | | | | |
Service Class | | | | |
Shares sold | 196 | 239 | $ 2,138 | $ 2,551 |
Reinvestment of distributions | - | 108 | - | 1,152 |
Shares redeemed | (27) | (678) | (297) | (7,360) |
Net increase (decrease) | 169 | (331) | $ 1,841 | $ (3,657) |
Service Class 2 | | | | |
Shares sold | 69,982 | 118,036 | $ 763,383 | $ 1,269,205 |
Reinvestment of distributions | - | 2,172 | - | 23,152 |
Shares redeemed | (88,602) | (45,102) | (970,015) | (490,275) |
Net increase (decrease) | (18,620) | 75,106 | $ (206,632) | $ 802,082 |
Investor Class | | | | |
Shares sold | 5,014,440 | 14,732,018 | $ 54,860,016 | $ 159,190,758 |
Reinvestment of distributions | - | 895,853 | - | 9,558,752 |
Shares redeemed | (1,515,940) | (2,471,225) | (16,606,384) | (26,665,882) |
Net increase (decrease) | 3,498,500 | 13,156,646 | $ 38,253,632 | $ 142,083,628 |
VIP FundsManager 50% Portfolio | | | | |
Service Class | | | | |
Shares sold | 154 | 230 | $ 1,581 | $ 2,318 |
Reinvestment of distributions | - | 121 | - | 1,179 |
Shares redeemed | (50) | (439) | (505) | (4,526) |
Net increase (decrease) | 104 | (88) | $ 1,076 | $ (1,029) |
Service Class 2 | | | | |
Shares sold | 6,348,979 | 1,763,410 | $ 64,343,880 | $ 17,762,571 |
Reinvestment of distributions | - | 35,114 | - | 342,362 |
Shares redeemed | (608,196) | (76,657) | (6,160,291) | (775,033) |
Net increase (decrease) | 5,740,783 | 1,721,867 | $ 58,183,589 | $ 17,329,900 |
Investor Class | | | | |
Shares sold | 5,216,205 | 12,811,963 | $ 53,518,802 | $ 130,073,867 |
Reinvestment of distributions | - | 1,517,266 | - | 14,823,693 |
Shares redeemed | (3,161,378) | (4,888,743) | (32,315,974) | (49,418,689) |
Net increase (decrease) | 2,054,827 | 9,440,486 | $ 21,202,828 | $ 95,478,871 |
VIP FundsManager 60% Portfolio | | | | |
Service Class | | | | |
Shares sold | 276 | 350 | $ 2,753 | $ 3,458 |
Reinvestment of distributions | - | 100 | - | 952 |
Shares redeemed | (163) | (497) | (1,626) | (5,030) |
Net increase (decrease) | 113 | (47) | $ 1,127 | $ (620) |
Service Class 2 | | | | |
Shares sold | 19,641,372 | 5,325,793 | $ 194,855,935 | $ 52,623,723 |
Reinvestment of distributions | - | 75,622 | - | 719,169 |
Shares redeemed | (1,315,785) | (632,946) | (13,179,600) | (6,346,164) |
Net increase (decrease) | 18,325,587 | 4,768,469 | $ 181,676,335 | $ 46,996,728 |
Investor Class | | | | |
Shares sold | 69,721,545 | 169,404,721 | $ 700,892,824 | $ 1,676,865,563 |
Reinvestment of distributions | - | 7,096,103 | - | 67,554,905 |
Shares redeemed | (4,625,061) | (8,133,825) | (46,278,432) | (80,228,829) |
Net increase (decrease) | 65,096,484 | 168,366,999 | $ 654,614,392 | $ 1,664,191,639 |
VIP FundsManager 70% Portfolio | | | | |
Service Class | | | | |
Shares sold | 1,167 | 229 | $ 10,958 | $ 2,168 |
Reinvestment of distributions | - | 132 | - | 1,196 |
Shares redeemed | (112) | (419) | (1,079) | (4,115) |
Net increase (decrease) | 1,055 | (58) | $ 9,879 | $ (751) |
Semiannual Report
Notes to Financial Statements (Unaudited) - continued
7. Share Transactions - continued
| Shares | Dollars |
| Six months ended
June 30,
2012 | Year ended
December 31,
2011 | Six months ended
June 30,
2012 | Year ended
December 31,
2011 |
VIP FundsManager 70% Portfolio | | | | |
Service Class 2 | | | | |
Shares sold | 67,784 | 156,009 | $ 644,841 | $ 1,477,158 |
Reinvestment of distributions | - | 7,189 | - | 64,845 |
Shares redeemed | (14,426) | (28,881) | (136,225) | (274,432) |
Net increase (decrease) | 53,358 | 134,317 | $ 508,616 | $ 1,267,571 |
Investor Class | | | | |
Shares sold | 2,695,562 | 8,466,254 | $ 25,961,677 | $ 81,472,928 |
Reinvestment of distributions | - | 1,165,578 | - | 10,525,170 |
Shares redeemed | (2,553,611) | (4,940,159) | (24,339,829) | (46,746,351) |
Net increase (decrease) | 141,951 | 4,691,673 | $ 1,621,848 | $ 45,251,747 |
VIP FundsManager 85% Portfolio | | | | |
Service Class | | | | |
Shares sold | 2,240 | 10,241 | $ 20,618 | $ 90,783 |
Reinvestment of distributions | - | 326 | - | 2,796 |
Shares redeemed | (756) | (999) | (6,951) | (9,246) |
Net increase (decrease) | 1,484 | 9,568 | $ 13,667 | $ 84,333 |
Service Class 2 | | | | |
Shares sold | 59,185 | 197,332 | $ 536,305 | $ 1,805,431 |
Reinvestment of distributions | - | 5,831 | - | 49,857 |
Shares redeemed | (23,526) | (45,063) | (214,303) | (404,136) |
Net increase (decrease) | 35,659 | 158,100 | $ 322,002 | $ 1,451,152 |
Investor Class | | | | |
Shares sold | 1,059,516 | 5,516,563 | $ 9,693,198 | $ 51,100,108 |
Reinvestment of distributions | - | 412,208 | - | 3,536,749 |
Shares redeemed | (3,335,164) | (3,374,672) | (30,418,591) | (30,586,542) |
Net increase (decrease) | (2,275,648) | 2,554,099 | $ (20,725,393) | $ 24,050,315 |
8. Other.
The Funds' organizational documents provide former and current trustees and officers with a limited indemnification against liabilities arising in connection with the performance of their duties to the Funds. In the normal course of business, the Funds may also enter into contracts that provide general indemnifications. The Funds' maximum exposure under these arrangements is unknown as this would be dependent on future claims that may be made against the Funds. The risk of material loss from such claims is considered remote.
The Funds do not invest in the Underlying Funds for the purpose of exercising management or control; however, investments by the Funds within their principal investment strategies may represent a significant portion of the Underlying Fund's net assets. At the end of the period, the following Funds were each the owners of record of 10% or more of the total outstanding shares of the Underlying Funds.
Fund | VIP Funds Manager
60% Portfolio |
Fidelity Consumer Discretionary Portfolio | 37% |
Fidelity Insurance Portfolio | 32% |
Fidelity Industrial Equipment Portfolio | 26% |
Fidelity Financial Services Portfolio | 21% |
Fidelity Banking Portfolio | 20% |
Fidelity International Value Fund | 18% |
Fidelity Industrials Portfolio | 18% |
Fidelity Telecommunications Portfolio | 17% |
Fidelity Construction and Housing Portfolio | 17% |
Fidelity IT Services Portfolio | 16% |
Fidelity International Growth Fund | 14% |
Fidelity Utilities Portfolio | 13% |
Fidelity Consumer Staples Portfolio | 13% |
Fidelity Multimedia Portfolio | 13% |
Fidelity Consumer Finance Portfolio | 13% |
Semiannual Report
8. Other - continued
Fund | VIP Funds Manager
60% Portfolio |
Fidelity Computers Portfolio | 12% |
Spartan U.S. Bond Index Fund | 11% |
Fidelity Nordic Fund | 11% |
Fidelity International Capital Appreciation Fund | 11% |
The Funds, in aggregate, were the owners of record of more than 20% of the total outstanding shares of the following Underlying Funds.
Fund | % of shares held |
Fidelity Consumer Discretionary Portfolio | 48% |
Fidelity Insurance Portfolio | 45% |
Fidelity Industrial Equipment Portfolio | 32% |
Fidelity Banking Portfolio | 29% |
Fidelity Financial Services Portfolio | 27% |
Fidelity Industrials Portfolio | 24% |
Fidelity Construction and Housing Portfolio | 24% |
Fidelity IT Services Portfolio | 22% |
Fidelity Telecommunications Portfolio | 21% |
Fidelity International Value Fund | 21% |
In addition, at the end of the period, FMR or its affiliates were the owners of record of more than 10% of the outstanding shares of the following funds:
| Affiliated |
VIP FundsManager 20% Portfolio | 99% |
VIP FundsManager 50% Portfolio | 91% |
VIP FundsManager 60% Portfolio | 26% |
VIP FundsManager 70% Portfolio | 99% |
VIP FundsManager 85% Portfolio | 98% |
In addition, at the end of the period, one otherwise unaffiliated shareholder was the owner of record of more than 65% of the outstanding shares of VIP FundsManager 60% Portfolio.
Semiannual Report
Investment Adviser
Strategic Advisers, Inc.
Boston, MA
General Distributor
Fidelity Distributors Corporation
Smithfield, RI
Transfer and Service Agents
Fidelity Investments Institutional Operations Company, Inc.
Boston, MA
Fidelity Service Company, Inc.
Boston, MA
Custodian
The Bank of New York Mellon
New York, NY
VIPFM-SANN-0812
1.833444.106
Fidelity® Variable Insurance Products:
Investment Grade Bond Portfolio
Semiannual Report
June 30, 2012
(Fidelity Cover Art)
Contents
Shareholder Expense Example | (Click Here) | An example of shareholder expenses. |
Investment Changes | (Click Here) | A summary of major shifts in the fund's investments over the past six months. |
Investments | (Click Here) | A complete list of the fund's investments with their market values. |
Financial Statements | (Click Here) | Statements of assets and liabilities, operations, and changes in net assets, as well as financial highlights. |
Notes | (Click Here) | Notes to the financial statements. |
Fidelity® VIP Investment Grade Central Fund Financial Statements | (Click Here) | Complete list of investments and financial statements for Fidelity® VIP Investment Grade Central Fund. |
To view a fund's proxy voting guidelines and proxy voting record for the 12-month period ended June 30, visit http://www.fidelity.com/proxyvotingresults or visit the Securities and Exchange Commission's (SEC) web site at http://www.sec.gov. You may also call 1-877-208-0098 to request a free copy of the proxy voting guidelines.
Fidelity Variable Insurance Products are separate account options which are purchased through a variable insurance contract.
Standard & Poor's, S&P and S&P 500 are registered service marks of The McGraw-Hill Companies, Inc. and have been licensed for use by Fidelity Distributors Corporation.
Other third party marks appearing herein are the property of their respective owners.
All other marks appearing herein are registered or unregistered trademarks or service marks of FMR LLC or an affiliated company. © 2012 FMR LLC. All rights reserved.
This report and the financial statements contained herein are submitted for the general information of the shareholders of the fund. This report is not authorized for distribution to prospective investors in the fund unless preceded or accompanied by an effective prospectus.
A fund files its complete schedule of portfolio holdings with the SEC for the first and third quarters of each fiscal year on Form N-Q. Forms N-Q are available on the SEC's web site at http://www.sec.gov. A fund's Forms N-Q may be reviewed and copied at the SEC's Public Reference Room in Washington, DC. Information regarding the operation of the SEC's Public Reference Room may be obtained by calling 1-800-SEC-0330. For a complete list of a fund's portfolio holdings, view the most recent holdings listing, semiannual report, or annual report on Fidelity's web site at http://www.fidelity.com, http://www.advisor.fidelity.com, or http://www.401k.com, as applicable.
NOT FDIC INSURED • MAY LOSE VALUE • NO BANK GUARANTEE
Neither the fund nor Fidelity Distributors Corporation is a bank.
Semiannual Report
As a shareholder of the Fund, you incur two types of costs: (1) transaction costs, and (2) ongoing costs, including management fees, distribution and/or service (12b-1) fees and other Fund expenses. This Example is intended to help you understand your ongoing costs (in dollars) of investing in the Fund and to compare these costs with the ongoing costs of investing in other mutual funds.
The Example is based on an investment of $1,000 invested at the beginning of the period and held for the entire period (January 1, 2012 to June 30, 2012).
Actual Expenses
The first line of the accompanying table for each class of the Fund provides information about actual account values and actual expenses. You may use the information in this line, together with the amount you invested, to estimate the expenses that you paid over the period. Simply divide your account value by $1,000.00 (for example, an $8,600 account value divided by $1,000.00 = 8.6), then multiply the result by the number in the first line for a class of the Fund under the heading entitled "Expenses Paid During Period" to estimate the expenses you paid on your account during this period. The estimate of expenses does not include any fees or other expenses of any variable annuity or variable life insurance product. If they were, the estimate of expenses you paid during the period would be higher, and your ending account value would be lower. In addition, the Fund, as a shareholder in the underlying Fidelity Central Funds, will indirectly bear its pro-rata share of the fees and expenses incurred by the underlying Fidelity Central Funds. These fees and expenses are not included in the Fund's annualized expense ratio used to calculate the expense estimate in the table below.
Hypothetical Example for Comparison Purposes
The second line of the accompanying table for each class of the Fund provides information about hypothetical account values and hypothetical expenses based on a Class' actual expense ratio and an assumed rate of return of 5% per year before expenses, which is not the Class' actual return. The hypothetical account values and expenses may not be used to estimate the actual ending account balance or expenses you paid for the period. You may use this information to compare the ongoing costs of investing in the Fund and other funds. To do so, compare this 5% hypothetical example with the 5% hypothetical examples that appear in the shareholder reports of the other funds. The estimate of expenses does not include any fees or other expenses of any variable annuity or variable life insurance product. If they were, the estimate of expenses you paid during the period would be higher, and your ending account value would be lower. In addition, the Fund, as a shareholder in the underlying Fidelity Central Funds, will indirectly bear its pro-rata share of the fees and expenses incurred by the underlying Fidelity Central Funds. These fees and expenses are not included in the Fund's annualized expense ratio used to calculate the expense estimate in the table below.
Please note that the expenses shown in the table are meant to highlight your ongoing costs only and do not reflect any transaction costs. Therefore, the second line of the table is useful in comparing ongoing costs only, and will not help you determine the relative total costs of owning different funds.
| Annualized Expense Ratio | Beginning
Account Value
January 1, 2012 | Ending
Account Value
June 30, 2012 | Expenses Paid
During Period*
January 1, 2012
to June 30, 2012 |
Initial Class | .43% | | | |
Actual | | $ 1,000.00 | $ 1,033.50 | $ 2.17 |
HypotheticalA | | $ 1,000.00 | $ 1,022.73 | $ 2.16 |
Service Class | .52% | | | |
Actual | | $ 1,000.00 | $ 1,033.00 | $ 2.63 |
HypotheticalA | | $ 1,000.00 | $ 1,022.28 | $ 2.61 |
Service Class 2 | .67% | | | |
Actual | | $ 1,000.00 | $ 1,031.80 | $ 3.38 |
HypotheticalA | | $ 1,000.00 | $ 1,021.53 | $ 3.37 |
Investor Class | .46% | | | |
Actual | | $ 1,000.00 | $ 1,033.60 | $ 2.33 |
HypotheticalA | | $ 1,000.00 | $ 1,022.58 | $ 2.31 |
A 5% return per year before expenses
* Expenses are equal to each Class' annualized expense ratio, multiplied by the average account value over the period, multiplied by 182/366 (to reflect the one-half year period). The fees and expenses of the underlying Fidelity Central Funds in which the Fund invests are not included in the Fund's annualized expense ratio.
Semiannual Report
Investment Changes (Unaudited)
Quality Diversification (% of fund's net assets) |
As of June 30, 2012 | As of December 31, 2011 |
 | U.S. Government and
U.S. Government Agency
Obligations 76.3% | | | U.S. Government and
U.S. Government Agency
Obligations 64.4% | |
 | AAA 4.9% | | | AAA 7.1% | |
 | AA 1.7% | | | AA 2.6% | |
 | A 6.0% | | | A 7.4% | |
 | BBB 15.3% | | | BBB 14.0% | |
 | BB and Below 3.8% | | | BB and Below 5.3% | |
 | Not Rated † 0.0% | | | Not Rated† 0.0% | |
 | Short-Term Investments
and Net Other Assets *** (8.0)% | | | Short-Term Investments
and Net Other Assets *** (0.8)% | |
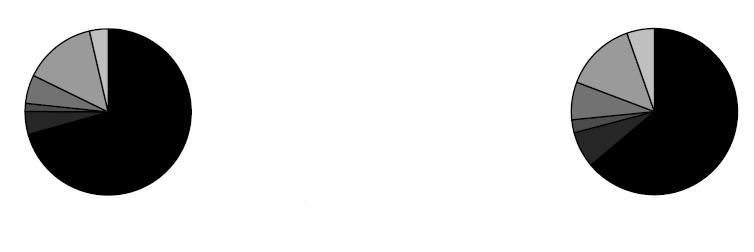
We have used ratings from Moody's Investors Service, Inc. Where Moody's® ratings are not available, we have used S&P® ratings. All ratings are as of the date indicated and do not reflect subsequent changes. Securities rated BB or below were rated investment grade at the time of acquisition. The information in the above table is based on the combined investments of the Fund and its pro-rata share of the investments of Fidelity's fixed-income central funds. |
Weighted Average Maturity as of June 30, 2012 |
| | 6 months ago |
Years | 6.0 | 6.3 |
This is a weighted average of all the maturities of the securities held in a fund. Weighted Average Maturity (WAM) can be used as a measure of sensitivity to interest rate changes and market changes. Generally, the longer the maturity, the greater the sensitivity to such changes. WAM is based on the dollar-weighted average length of time until principal payments must be paid. Depending on the types of securities held in a fund, certain maturity shortening devices (e.g., demand features, interest rate resets, and call options) may be taken into account when calculating the WAM. |
Duration as of June 30, 2012 |
| | 6 months ago |
Years | 5.0 | 4.8 |
Duration estimates how much a bond fund's price will change with a change in comparable interest rates. If rates rise 1%, for example, a fund with a 5-year duration is likely to lose about 5% of its value. Other factors also can influence a bond fund's performance and share price. Accordingly, a bond fund's actual performance may differ from this example. Duration takes into account any call or put option embedded in the bonds. |
Asset Allocation (% of fund's net assets) |
As of June 30, 2012* | As of December 31, 2011** |
| Corporate Bonds 23.7% | | | Corporate Bonds 26.0% | |
| U.S. Government and
U.S. Government Agency
Obligations 76.3% | | | U.S. Government and
U.S. Government Agency
Obligations 64.4% | |
| Asset-Backed Securities 1.6% | | | Asset-Backed Securities 2.2% | |
| CMOs and Other
Mortgage Related Securities 5.7% | | | CMOs and Other
Mortgage Related Securities 7.5% | |
| Municipal Bonds 0.5% | | | Municipal Bonds 0.3% | |
| Other Investments 0.2% | | | Other Investments 0.4% | |
| Short-Term Investments
and Net Other Assets
(Liabilities) *** (8.0)% | | | Short-Term Investments
and Net Other Assets
(Liabilities) *** (0.8)% | |
* Foreign investments | 3.5% | | ** Foreign investments | 4.1% | |
* Futures and Swaps | 0.0% | | ** Futures and Swaps | 2.1% | |

*** Short-Term Investments and Net Other Assets are not included in the pie chart.
† Amount represents less than 0.1%.
The information in the above table is based on the combined investments of the Fund and its pro-rata share of the investments of Fidelity's fixed-income central funds. A holdings listing for the Fund, which presents direct holdings as well as the pro-rata share of any securities and other investments held indirectly through its investment in underlying non-money market Fidelity Central Funds is available at advisor.fidelity.com. Fidelity VIP Investment Grade Central Fund's holdings and financial statements are included at the end of this report.
Semiannual Report
Investments June 30, 2012 (Unaudited)
Showing Percentage of Net Assets
Fixed-Income Central Funds - 99.3% |
| Shares | | Value |
INVESTMENT GRADE FIXED-INCOME FUNDS - 97.4% |
Fidelity VIP Investment Grade Central Fund (e) | 29,425,863 | | $ 3,220,660,723 |
HIGH YIELD FIXED-INCOME FUNDS - 1.9% |
Fidelity Specialized High Income Central Fund (d) | 611,643 | | 63,109,356 |
TOTAL FIXED-INCOME CENTRAL FUNDS (Cost $3,103,021,308) |
3,283,770,079
|
Nonconvertible Bonds - 0.1% |
| Principal Amount | | |
UTILITIES - 0.1% |
Multi-Utilities - 0.1% |
CMS Energy Corp. 5.05% 3/15/22 (Cost $4,502,689) | | $ 4,420,000 | |
4,584,591
|
Asset-Backed Securities - 0.0% |
|
Advanta Business Card Master Trust Series 2007-D1 Class D, 1.5863% 1/22/13 (b)(c) | | 1,800,000 | | 27,000 |
National Collegiate Student Loan Trust: | | | | |
Series 2004-2 Class AIO, 9.75% 10/27/14 (f) | | 1,525,000 | | 61,000 |
Series 2007-2 Class AIO, 6.7% 7/25/12 (f) | | 5,056,183 | | 18,669 |
Specialty Underwriting & Residential Finance Trust Series 2006-AB2 Class N1, 5.75% 6/25/37 (b) | | 180,261 | | 0 |
TOTAL ASSET-BACKED SECURITIES (Cost $94,304) |
106,669
|
Collateralized Mortgage Obligations - 0.2% |
| Principal Amount | | Value |
Private Sponsor - 0.2% |
Luminent Mortgage Trust: | | | | |
floater Series 2006-1 Class A1, 0.4853% 4/25/36 (c) | | $ 4,640,611 | | $ 2,327,657 |
Series 2006-5 Class A1A, 0.4353% 7/25/36 (c) | | 3,540,124 | | 1,603,664 |
MASTR Adjustable Rate Mortgages Trust Series 2007-3 Class 22A2, 0.4553% 5/25/47 (c) | | 530,400 | | 326,719 |
Merrill Lynch Alternative Note Asset Trust floater Series 2007-OAR1 Class A1, 0.4153% 2/25/37 (c) | | 1,420,136 | | 955,077 |
Wells Fargo Mortgage Backed Securities Trust Series 2005-AR2 Class 1A2, 2.6153% 3/25/35 (c) | | 912,601 | | 450,185 |
TOTAL COLLATERALIZED MORTGAGE OBLIGATIONS (Cost $6,808,914) |
5,663,302
|
Money Market Funds - 0.7% |
| Shares | | |
Fidelity Cash Central Fund, 0.17% (a)
(Cost $22,637,707) | 22,637,707 | |
22,637,707
|
TOTAL INVESTMENT PORTFOLIO - 100.3% (Cost $3,137,064,922) | | 3,316,762,348 |
NET OTHER ASSETS (LIABILITIES) - (0.3)% | | (10,927,552) |
NET ASSETS - 100% | $ 3,305,834,796 |
Legend |
(a) Affiliated fund that is available only to investment companies and other accounts managed by Fidelity Investments. The rate quoted is the annualized seven-day yield of the fund at period end. A complete unaudited listing of the fund's holdings as of its most recent quarter end is available upon request. In addition, each Fidelity Central Fund's financial statements are available on the SEC's website or upon request. |
(b) Security exempt from registration under Rule 144A of the Securities Act of 1933. These securities may be resold in transactions exempt from registration, normally to qualified institutional buyers. At the end of the period, the value of these securities amounted to $27,000 or 0.0% of net assets. |
(c) Coupon rates for floating and adjustable rate securities reflect the rates in effect at period end. |
(d) Affiliated fund that is available only to investment companies and other accounts managed by Fidelity Investments. A complete unaudited schedule of portfolio holdings for each Fidelity Central Fund is filed with the SEC for the first and third quarters of each fiscal year on Form N-Q and is available upon request or at the SEC's web site at www.sec.gov. An unaudited holdings listing for the Fund, which presents direct holdings as well as the pro rata share of securities and other investments held indirectly through its investment in underlying non-money market Fidelity Central Funds, is available at advisor.fidelity.com. In addition, each Fidelity Central Fund's financial statements are available on the SEC's web site or upon request. |
(e) Affiliated central fund that is available only to investment companies and other accounts managed by Fidelity Investments. Fidelity VIP Investment Grade Central Fund's investments and financial statements are included at the end of this report as an attachment. |
(f) Security represents right to receive monthly interest payments on an underlying pool of mortgages or assets. Principal shown is the outstanding par amount of the pool as of the end of the period. |
Affiliated Central Funds |
Information regarding fiscal year to date income earned by the Fund from investments in Fidelity Central Funds is as follows: |
Fund | Income earned |
Fidelity Cash Central Fund | $ 26,773 |
Fidelity Specialized High Income Central Fund | 1,957,137 |
Fidelity VIP Investment Grade Central Fund | 45,634,186 |
Total | $ 47,618,096 |
Additional information regarding the Fund's fiscal year to date purchases and sales, including the ownership percentage, of the non Money Market Central Funds is as follows: |
Fund | Value,
beginning of
period | Purchases | Sales Proceeds | Value,
end of
period | % ownership,
end of
period |
Fidelity Specialized High Income Central Fund | $ 59,381,175 | $ 1,957,138 | $ - | $ 63,109,356 | 13.9% |
Fidelity VIP Investment Grade Central Fund | 2,865,802,940 | 303,324,602 | - | 3,220,660,723 | 77.1% |
Total | $ 2,925,184,115 | $ 305,281,740 | $ - | $ 3,283,770,079 | |
Other Information |
The following is a summary of the inputs used, as of June 30, 2012, involving the Fund's assets and liabilities carried at fair value. The inputs or methodology used for valuing securities may not be an indication of the risk associated with investing in those securities. For more information on valuation inputs, and their aggregation into the levels used in the tables below, please refer to the Security Valuation section in the accompanying Notes to Financial Statements. |
Valuation Inputs at Reporting Date: |
Description | Total | Level 1 | Level 2 | Level 3 |
Investments in Securities: | | | | |
Corporate Bonds | $ 4,584,591 | $ - | $ 4,584,591 | $ - |
Asset-Backed Securities | 106,669 | - | 79,669 | 27,000 |
Collateralized Mortgage Obligations | 5,663,302 | - | 5,213,117 | 450,185 |
Fixed-Income Funds | 3,283,770,079 | 3,283,770,079 | - | - |
Money Market Funds | 22,637,707 | 22,637,707 | - | - |
Total Investments in Securities: | $ 3,316,762,348 | $ 3,306,407,786 | $ 9,877,377 | $ 477,185 |
See accompanying notes which are an integral part of the financial statements.
Semiannual Report
Statement of Assets and Liabilities
| June 30, 2012 (Unaudited) |
| | |
Assets | | |
Investment in securities, at value - See accompanying schedule: Unaffiliated issuers (cost $11,405,907) | $ 10,354,562 | |
Fidelity Central Funds (cost $3,125,659,015) | 3,306,407,786 | |
Total Investments (cost $3,137,064,922) | | $ 3,316,762,348 |
Receivable for fund shares sold | | 748,554 |
Interest receivable | | 74,529 |
Distributions receivable from Fidelity Central Funds | | 247,416 |
Total assets | | 3,317,832,847 |
| | |
Liabilities | | |
Payable for fund shares redeemed | $ 10,476,189 | |
Accrued management fee | 872,419 | |
Distribution and service plan fees payable | 274,502 | |
Other affiliated payables | 352,970 | |
Other payables and accrued expenses | 21,971 | |
Total liabilities | | 11,998,051 |
| | |
Net Assets | | $ 3,305,834,796 |
Net Assets consist of: | | |
Paid in capital | | $ 3,079,883,191 |
Undistributed net investment income | | 39,657,455 |
Accumulated undistributed net realized gain (loss) on investments | | 6,596,724 |
Net unrealized appreciation (depreciation) on investments | | 179,697,426 |
Net Assets | | $ 3,305,834,796 |
Statement of Assets and Liabilities - continued
| June 30, 2012 (Unaudited) |
| | |
Initial Class:
Net Asset Value, offering price and redemption price per share ($1,133,893,749 ÷ 85,202,689 shares) | | $ 13.31 |
| | |
Service Class:
Net Asset Value, offering price and redemption price per share ($285,978,045 ÷ 21,683,797 shares) | | $ 13.19 |
| | |
Service Class 2:
Net Asset Value, offering price and redemption price per share ($1,194,164,337 ÷ 91,643,704 shares) | | $ 13.03 |
| | |
Investor Class:
Net Asset Value, offering price and redemption price per share ($691,798,665 ÷ 52,146,549 shares) | | $ 13.27 |
See accompanying notes which are an integral part of the financial statements.
Semiannual Report
Financial Statements - continued
Statement of Operations
Six months ended June 30, 2012 (Unaudited) |
| | |
Investment Income | | |
Dividends | | $ 25,026 |
Interest | | 365,249 |
Income from Fidelity Central Funds | | 47,618,096 |
Total income | | 48,008,371 |
| | |
Expenses | | |
Management fee | $ 5,076,836 | |
Transfer agent fees | 1,268,311 | |
Distribution and service plan fees | 1,589,403 | |
Accounting fees and expenses | 512,827 | |
Custodian fees and expenses | 3,746 | |
Independent trustees' compensation | 5,570 | |
Registration fees | 8,139 | |
Audit | 24,126 | |
Legal | 6,097 | |
Miscellaneous | 16,131 | |
Total expenses before reductions | 8,511,186 | |
Expense reductions | (15) | 8,511,171 |
Net investment income (loss) | | 39,497,200 |
Realized and Unrealized Gain (Loss) Net realized gain (loss) on: | | |
Investment securities: | | |
Unaffiliated issuers | 84,585 | |
Capital gain distributions from Fidelity Central Funds | 7,564,370 | |
Total net realized gain (loss) | | 7,648,955 |
Change in net unrealized appreciation (depreciation) on investment securities | | 55,843,641 |
Net gain (loss) | | 63,492,596 |
Net increase (decrease) in net assets resulting from operations | | $ 102,989,796 |
Statement of Changes in Net Assets
| Six months ended June 30, 2012
(Unaudited) | Year ended
December 31, 2011 |
Increase (Decrease) in Net Assets | | |
Operations | | |
Net investment income (loss) | $ 39,497,200 | $ 93,478,175 |
Net realized gain (loss) | 7,648,955 | 49,154,041 |
Change in net unrealized appreciation (depreciation) | 55,843,641 | 60,228,957 |
Net increase (decrease) in net assets resulting from operations | 102,989,796 | 202,861,173 |
Distributions to shareholders from net investment income | - | (93,674,019) |
Distributions to shareholders from net realized gain | (22,602,057) | (78,248,432) |
Total distributions | (22,602,057) | (171,922,451) |
Share transactions - net increase (decrease) | 245,674,744 | 4,910,616 |
Total increase (decrease) in net assets | 326,062,483 | 35,849,338 |
| | |
Net Assets | | |
Beginning of period | 2,979,772,313 | 2,943,922,975 |
End of period (including undistributed net investment income of $39,657,455 and undistributed net investment income of $160,255, respectively) | $ 3,305,834,796 | $ 2,979,772,313 |
See accompanying notes which are an integral part of the financial statements.
Semiannual Report
Financial Highlights - Initial Class
| Six months ended June 30, 2012 | Years ended December 31, |
| (Unaudited) | 2011 | 2010 | 2009 | 2008 | 2007 |
Selected Per-Share Data | | | | | | |
Net asset value, beginning of period | $ 12.97 | $ 12.83 | $ 12.48 | $ 11.84 | $ 12.76 | $ 12.76 |
Income from Investment Operations | | | | | | |
Net investment income (loss) E | .168 | .431 | .443 | .510 | .592 | .610 |
Net realized and unrealized gain (loss) | .264 | .492 | .528 | 1.266 | (.987) | (.076) |
Total from investment operations | .432 | .923 | .971 | 1.776 | (.395) | .534 |
Distributions from net investment income | - | (.436) | (.476) | (1.087) | (.515) | (.534) |
Distributions from net realized gain | (.092) | (.347) | (.145) | (.049) | (.010) | - |
Total distributions | (.092) | (.783) | (.621) | (1.136) | (.525) | (.534) |
Net asset value, end of period | $ 13.31 | $ 12.97 | $ 12.83 | $ 12.48 | $ 11.84 | $ 12.76 |
Total Return B,C,D | 3.35% | 7.33% | 7.80% | 15.72% | (3.25)% | 4.35% |
Ratios to Average Net Assets F,H | | | | | | |
Expenses before reductions | .43% A | .43% | .43% | .45% | .43% | .43% |
Expenses net of fee waivers, if any | .43% A | .42% | .42% | .45% | .43% | .43% |
Expenses net of all reductions | .43% A | .42% | .42% | .45% | .43% | .43% |
Net investment income (loss) | 2.57% A | 3.30% | 3.38% | 4.19% | 4.84% | 4.88% |
Supplemental Data | | | | | | |
Net assets, end of period (000 omitted) | $ 1,133,894 | $ 1,116,778 | $ 1,110,373 | $ 1,083,773 | $ 936,912 | $ 1,134,915 |
Portfolio turnover rate G | 1% A | 5% | 8% | 3% | 14% | 2% |
A Annualized
B Total returns for periods of less than one year are not annualized.
C Total returns do not reflect charges attributable to your insurance company's separate account. Inclusion of these charges would reduce the total returns shown.
D Total returns would have been lower if certain expenses had not been reduced during the applicable periods shown.
E Calculated based on average shares outstanding during the period.
F Fees and expenses of any underlying Fidelity Central Funds are not included in the Fund's expense ratio. The Fund indirectly bears its proportionate share of the expenses of any underlying Fidelity Central Funds.
G Amount does not include the portfolio activity of any underlying Fidelity Central Funds.
H Expense ratios reflect operating expenses of the class. Expenses before reductions do not reflect amounts reimbursed by the investment adviser or reductions from expense offset arrangements and do not represent the amount paid by the class during periods when reimbursements or reductions occur. Expenses net of fee waivers reflect expenses after reimbursement by the investment adviser but prior to reductions from expense offset arrangements. Expenses net of all reductions represent the net expenses paid by the class. Fees and expenses of the underlying Fidelity Central Funds are not included in the Fund's expense ratio. The Fund indirectly bears its proportionate share of the expenses of any Fidelity Central Funds. Based on their most recent shareholder report date, the annualized expenses for the Fidelity VIP Investment Grade Central Fund and Fidelity Specialized High Income Central Fund were less than .01%.
Financial Highlights - Service Class
| Six months ended June 30, 2012 | Years ended December 31, |
| (Unaudited) | 2011 | 2010 | 2009 | 2008 | 2007 |
Selected Per-Share Data | | | | | | |
Net asset value, beginning of period | $ 12.86 | $ 12.73 | $ 12.39 | $ 11.75 | $ 12.68 | $ 12.68 |
Income from Investment Operations | | | | | | |
Net investment income (loss) E | .160 | .415 | .427 | .495 | .572 | .593 |
Net realized and unrealized gain (loss) | .262 | .485 | .521 | 1.262 | (.986) | (.069) |
Total from investment operations | .422 | .900 | .948 | 1.757 | (.414) | .524 |
Distributions from net investment income | - | (.423) | (.463) | (1.068) | (.506) | (.524) |
Distributions from net realized gain | (.092) | (.347) | (.145) | (.049) | (.010) | - |
Total distributions | (.092) | (.770) | (.608) | (1.117) | (.516) | (.524) |
Net asset value, end of period | $ 13.19 | $ 12.86 | $ 12.73 | $ 12.39 | $ 11.75 | $ 12.68 |
Total Return B,C,D | 3.30% | 7.21% | 7.68% | 15.67% | (3.42)% | 4.29% |
Ratios to Average Net Assets F,H | | | | | | |
Expenses before reductions | .52% A | .52% | .53% | .54% | .53% | .53% |
Expenses net of fee waivers, if any | .52% A | .52% | .52% | .54% | .53% | .53% |
Expenses net of all reductions | .52% A | .52% | .52% | .54% | .53% | .53% |
Net investment income (loss) | 2.47% A | 3.20% | 3.28% | 4.09% | 4.75% | 4.78% |
Supplemental Data | | | | | | |
Net assets, end of period (000 omitted) | $ 285,978 | $ 277,732 | $ 283,962 | $ 259,246 | $ 202,501 | $ 147,990 |
Portfolio turnover rate G | 1% A | 5% | 8% | 3% | 14% | 2% |
A Annualized
B Total returns for periods of less than one year are not annualized.
C Total returns do not reflect charges attributable to your insurance company's separate account. Inclusion of these charges would reduce the total returns shown.
D Total returns would have been lower if certain expenses had not been reduced during the applicable periods shown.
E Calculated based on average shares outstanding during the period.
F Fees and expenses of any underlying Fidelity Central Funds are not included in the Fund's expense ratio. The Fund indirectly bears its proportionate share of the expenses of any underlying Fidelity Central Funds.
G Amount does not include the portfolio activity of any underlying Fidelity Central Funds.
H Expense ratios reflect operating expenses of the class. Expenses before reductions do not reflect amounts reimbursed by the investment adviser or reductions from expense offset arrangements and do not represent the amount paid by the class during periods when reimbursements or reductions occur. Expenses net of fee waivers reflect expenses after reimbursement by the investment adviser but prior to reductions from expense offset arrangements. Expenses net of all reductions represent the net expenses paid by the class. Fees and expenses of the underlying Fidelity Central Funds are not included in the Fund's expense ratio. The Fund indirectly bears its proportionate share of the expenses of any Fidelity Central Funds. Based on their most recent shareholder report date, the annualized expenses for the Fidelity VIP Investment Grade Central Fund and Fidelity Specialized High Income Central Fund were less than .01%.
See accompanying notes which are an integral part of the financial statements.
Semiannual Report
Financial Highlights - Service Class 2
| Six months ended June 30, 2012 | Years ended December 31, |
| (Unaudited) | 2011 | 2010 | 2009 | 2008 | 2007 |
Selected Per-Share Data | | | | | | |
Net asset value, beginning of period | $ 12.72 | $ 12.60 | $ 12.26 | $ 11.62 | $ 12.55 | $ 12.56 |
Income from Investment Operations | | | | | | |
Net investment income (loss) E | .148 | .391 | .402 | .473 | .551 | .568 |
Net realized and unrealized gain (loss) | .254 | .478 | .520 | 1.244 | (.975) | (.064) |
Total from investment operations | .402 | .869 | .922 | 1.717 | (.424) | .504 |
Distributions from net investment income | - | (.402) | (.437) | (1.028) | (.496) | (.514) |
Distributions from net realized gain | (.092) | (.347) | (.145) | (.049) | (.010) | - |
Total distributions | (.092) | (.749) | (.582) | (1.077) | (.506) | (.514) |
Net asset value, end of period | $ 13.03 | $ 12.72 | $ 12.60 | $ 12.26 | $ 11.62 | $ 12.55 |
Total Return B,C,D | 3.18% | 7.03% | 7.55% | 15.47% | (3.54)% | 4.17% |
Ratios to Average Net Assets F,H | | | | | | |
Expenses before reductions | .67% A | .67% | .68% | .69% | .67% | .68% |
Expenses net of fee waivers, if any | .67% A | .67% | .67% | .69% | .67% | .68% |
Expenses net of all reductions | .67% A | .67% | .67% | .69% | .67% | .68% |
Net investment income (loss) | 2.32% A | 3.05% | 3.13% | 3.94% | 4.60% | 4.63% |
Supplemental Data | | | | | | |
Net assets, end of period (000 omitted) | $ 1,194,164 | $ 972,651 | $ 1,011,652 | $ 1,240,935 | $ 930,150 | $ 1,018,017 |
Portfolio turnover rate G | 1% A | 5% | 8% | 3% | 14% | 2% |
A Annualized
B Total returns for periods of less than one year are not annualized.
C Total returns do not reflect charges attributable to your insurance company's separate account. Inclusion of these charges would reduce the total returns shown.
D Total returns would have been lower if certain expenses had not been reduced during the applicable periods shown.
E Calculated based on average shares outstanding during the period.
F Fees and expenses of any underlying Fidelity Central Funds are not included in the Fund's expense ratio. The Fund indirectly bears its proportionate share of the expenses of any underlying Fidelity Central Funds.
G Amount does not include the portfolio activity of any underlying Fidelity Central Funds.
H Expense ratios reflect operating expenses of the class. Expenses before reductions do not reflect amounts reimbursed by the investment adviser or reductions from expense offset arrangements and do not represent the amount paid by the class during periods when reimbursements or reductions occur. Expenses net of fee waivers reflect expenses after reimbursement by the investment adviser but prior to reductions from expense offset arrangements. Expenses net of all reductions represent the net expenses paid by the class. Fees and expenses of the underlying Fidelity Central Funds are not included in the Fund's expense ratio. The Fund indirectly bears its proportionate share of the expenses of any Fidelity Central Funds. Based on their most recent shareholder report date, the annualized expenses for the Fidelity VIP Investment Grade Central Fund and Fidelity Specialized High Income Central Fund were less than .01%.
Financial Highlights - Investor Class
| Six months ended June 30, 2012 | Years ended December 31, |
| (Unaudited) | 2011 | 2010 | 2009 | 2008 | 2007 |
Selected Per-Share Data | | | | | | |
Net asset value, beginning of period | $ 12.93 | $ 12.80 | $ 12.45 | $ 11.81 | $ 12.73 | $ 12.74 |
Income from Investment Operations | | | | | | |
Net investment income (loss) E | .165 | .426 | .438 | .511 | .586 | .603 |
Net realized and unrealized gain (loss) | .267 | .484 | .529 | 1.263 | (.983) | (.079) |
Total from investment operations | .432 | .910 | .967 | 1.774 | (.397) | .524 |
Distributions from net investment income | - | (.433) | (.472) | (1.085) | (.513) | (.534) |
Distributions from net realized gain | (.092) | (.347) | (.145) | (.049) | (.010) | - |
Total distributions | (.092) | (.780) | (.617) | (1.134) | (.523) | (.534) |
Net asset value, end of period | $ 13.27 | $ 12.93 | $ 12.80 | $ 12.45 | $ 11.81 | $ 12.73 |
Total Return B,C,D | 3.36% | 7.25% | 7.79% | 15.75% | (3.28)% | 4.28% |
Ratios to Average Net Assets F,H | | | | | | |
Expenses before reductions | .46% A | .46% | .46% | .48% | .46% | .46% |
Expenses net of fee waivers, if any | .46% A | .45% | .45% | .45% | .45% | .46% |
Expenses net of all reductions | .46% A | .45% | .45% | .45% | .45% | .46% |
Net investment income (loss) | 2.54% A | 3.27% | 3.35% | 4.18% | 4.82% | 4.84% |
Supplemental Data | | | | | | |
Net assets, end of period (000 omitted) | $ 691,799 | $ 612,611 | $ 537,936 | $ 523,032 | $ 306,413 | $ 284,223 |
Portfolio turnover rate G | 1% A | 5% | 8% | 3% | 14% | 2% |
A Annualized
B Total returns for periods of less than one year are not annualized.
C Total returns do not reflect charges attributable to your insurance company's separate account. Inclusion of these charges would reduce the total returns shown.
D Total returns would have been lower if certain expenses had not been reduced during the applicable periods shown.
E Calculated based on average shares outstanding during the period.
F Fees and expenses of any underlying Fidelity Central Funds are not included in the Fund's expense ratio. The Fund indirectly bears its proportionate share of the expenses of any underlying Fidelity Central Funds.
G Amount does not include the portfolio activity of any underlying Fidelity Central Funds.
H Expense ratios reflect operating expenses of the class. Expenses before reductions do not reflect amounts reimbursed by the investment adviser or reductions from expense offset arrangements and do not represent the amount paid by the class during periods when reimbursements or reductions occur. Expenses net of fee waivers reflect expenses after reimbursement by the investment adviser but prior to reductions from expense offset arrangements. Expenses net of all reductions represent the net expenses paid by the class. Fees and expenses of the underlying Fidelity Central Funds are not included in the Fund's expense ratio. The Fund indirectly bears its proportionate share of the expenses of any Fidelity Central Funds. Based on their most recent shareholder report date, the annualized expenses for the Fidelity VIP Investment Grade Central Fund and Fidelity Specialized High Income Central Fund were less than .01%.
See accompanying notes which are an integral part of the financial statements.
Semiannual Report
Notes to Financial Statements
For the period ended June 30, 2012 (Unaudited)
1. Organization.
VIP Investment Grade Bond Portfolio (the Fund) is a fund of Variable Insurance Products Fund V (the Trust) and is authorized to issue an unlimited number of shares. The Trust is registered under the Investment Company Act of 1940, as amended (the 1940 Act), as an open-end management investment company organized as a Massachusetts business trust. Shares of the Fund may only be purchased by insurance companies for the purpose of funding variable annuity or variable life insurance contracts. The Fund offers the following classes of shares: Initial Class shares, Service Class shares, Service Class 2 shares, and Investor Class shares. All classes have equal rights and voting privileges, except for matters affecting a single class. Investment income, realized and unrealized capital gains and losses, the common expenses of the Fund, and certain fund-level expense reductions, if any, are allocated on a pro-rata basis to each class based on the relative net assets of each class to the total net assets of the Fund. Each class differs with respect to transfer agent and distribution and service plan fees incurred. Certain expense reductions may also differ by class.
2. Investments in Fidelity Central Funds.
The Fund invests in Fidelity Central Funds, which are open-end investment companies available only to other investment companies and accounts managed by Fidelity Management & Research Company (FMR) and its affiliates. The Fund's Schedule of Investments lists each of the Fidelity Central Funds held as of period end, if any, as an investment of the Fund, but do not include the underlying holdings of each Fidelity Central Fund. As an Investing Fund, the Fund indirectly bears its proportionate share of the expenses of the underlying Fidelity Central Funds.
Based on its investment objective, each Fidelity Central Fund may invest or participate in various investment vehicles or strategies that are similar to those of the Fund. These strategies are consistent with the investment objectives of the Fund and may involve certain economic risks which may cause a decline in value of each of the Fidelity Central Funds and thus a decline in the value of the Fund. The Money Market Central Funds seek preservation of capital and current income and are managed by Fidelity Investments Money Management, Inc. (FIMM), an affiliate of FMR. The following summarizes the Fund's investment in each Fidelity Central Fund.
Fidelity Central Fund | Investment Manager | Investment Objective | Investment Practices |
Fidelity Specialized High Income Central Fund | FMR Co., Inc. (FMRC) | Seeks a high level of current income by normally investing in income-producing debt securities, with an emphasis on lower-quality debt securities. | Loans & Direct Debt Instruments Repurchase Agreements Restricted Securities |
VIP Investment Grade Central Fund | FIMM | Seeks a high level of current income by normally investing in investment-grade debt securities and repurchase agreements. | Delayed Delivery & When Issued Securities Repurchase Agreements Restricted Securities Swap Agreements |
An unaudited holdings listing for the Fund, which presents direct holdings as well as the pro-rata share of any securities and other investments held indirectly through its investment in underlying non-money market Fidelity Central Funds, is available at advisor.fidelity.com. A complete unaudited list of holdings for each Fidelity Central Fund is available upon request or at the Securities and Exchange Commission (the SEC) web site at www.sec.gov. In addition, the financial statements of the Fidelity Central Funds which contain the significant accounting policies (including security valuation policies) of those funds are available on the SEC web site or upon request.
3. Significant Accounting Policies.
The financial statements have been prepared in conformity with accounting principles generally accepted in the United States of America (GAAP), which require management to make certain estimates and assumptions at the date of the financial statements. Actual results could differ from those estimates. Subsequent events, if any, through the date that the financial statements were issued have been evaluated in the preparation of the financial statements. The following summarizes the significant accounting policies of the Fund:
Security Valuation. Investments are valued as of 4:00 p.m. Eastern time on the last calendar day of the period. In accordance with valuation policies and procedures approved by the Board of Trustees (the Board), the Fund attempts to obtain prices from one or more third party pricing vendor or broker to value its investments. When current market prices, quotations or rates are not readily available or reliable, securities will be fair valued in good faith by the FMR Fair Value Committee (the Committee), in accordance with procedures adopted by the Board. Factors used in determining fair value vary by security type and may include market or security specific events, changes in interest rates and credit quality. The frequency with which these procedures are used cannot be predicted and they may be utilized to a significant extent. The Committee oversees the Fund's valuation policies and procedures and is responsible for approving and reporting to the Board all fair value determinations.
Semiannual Report
3. Significant Accounting Policies - continued
Security Valuation - continued
The Fund categorizes the inputs to valuation techniques used to value its investments into a disclosure hierarchy consisting of three levels as shown below:
Level 1 - quoted prices in active markets for identical investments
Level 2 - other significant observable inputs (including quoted prices for similar investments, interest rates, prepayment speeds, etc.)
Level 3 - unobservable inputs (including the Fund's own assumptions based on the best information available)
Valuation techniques used to value the Fund's investments by major category are as follows:
Debt securities, including restricted securities, are valued based on evaluated prices received from third party pricing vendors or from brokers who make markets in such securities. For corporate bonds, pricing vendors utilize matrix pricing which considers yield or price of bonds of comparable quality, coupon, maturity and type as well as broker-supplied prices and are generally categorized as Level 2 in the hierarchy. For asset backed securities and collateralized mortgage obligations, pricing vendors utilize matrix pricing which considers prepayment speed assumptions, attributes of the collateral, yield or price of bonds of comparable quality, coupon, maturity and type as well as broker-supplied prices and, accordingly, such securities are generally categorized as Level 2 in the hierarchy. When independent prices are unavailable or unreliable, debt securities may be valued utilizing pricing methodologies which consider similar factors that would be used by third party pricing vendors. These are generally categorized as Level 2 in the hierarchy but may be Level 3 depending on the circumstances.
Investments in open-end mutual funds, including the Fidelity Central Funds, are valued at their closing net asset value each business day and are categorized as Level 1 in the hierarchy.
Changes in valuation techniques may result in transfers in or out of an assigned level within the disclosure hierarchy. The aggregate value of investments by input level, as of June 30, 2012 for the Fund's investments, is included at the end of the Fund's Schedule of Investments.
Investment Transactions and Income. For financial reporting purposes, the Fund's investment holdings and NAV include trades executed through the end of the last business day of the period. The NAV per share for processing shareholder transactions is calculated as of the close of business of the New York Stock Exchange (NYSE), normally 4:00 p.m. Eastern time and includes trades executed through the end of the prior business day. Gains and losses on securities sold are determined on the basis of identified cost and may include proceeds received from litigation. Dividend income is recorded on the ex-dividend date, except for certain dividends from foreign securities where the ex-dividend date may have passed, which are recorded as soon as the Fund is informed of the ex-dividend date. Non-cash dividends included in dividend income, if any, are recorded at the fair market value of the securities received. Interest income and distributions from the Fidelity Central Funds are accrued as earned. Interest income includes coupon interest and amortization of premium and accretion of discount on debt securities.
Expenses. Expenses directly attributable to a fund are charged to that fund. Expenses attributable to more than one fund are allocated among the respective funds on the basis of relative net assets or other appropriate methods. Expense estimates are accrued in the period to which they relate and adjustments are made when actual amounts are known.
Income Tax Information and Distributions to Shareholders. Each year, the Fund intends to qualify as a regulated investment company under Subchapter M of the Internal Revenue Code, including distributing substantially all of its taxable income and realized gains. As a result, no provision for income taxes is required. The Fund files a U.S. federal tax return, in addition to state and local tax returns as required. A fund's federal income tax returns are subject to examination by the Internal Revenue Service (IRS) for a period of three fiscal years after they are filed. State and local tax returns may be subject to examination for an additional fiscal year depending on the jurisdiction.
Distributions are declared and recorded on the ex-dividend date. Income dividends and capital gain distributions are declared separately for each class. Income and capital gain distributions are determined in accordance with income tax regulations, which may differ from GAAP.
Capital accounts within the financial statements are adjusted for permanent book-tax differences. These adjustments have no impact on net assets or the results of operations. Temporary book-tax differences will reverse in a subsequent period.
Book-tax differences are primarily due to the short-term gain distributions from the Fidelity Central Funds, in-kind transactions, market discount, partnerships (including allocations from Fidelity Central Funds), deferred trustees compensation and losses deferred due to wash sales.
Semiannual Report
Notes to Financial Statements (Unaudited) - continued
3. Significant Accounting Policies - continued
Income Tax Information and Distributions to Shareholders - continued
The federal tax cost of investment securities and unrealized appreciation (depreciation) as of period end were as follows:
Gross unrealized appreciation | $ 236,093,352 |
Gross unrealized depreciation | (1,777,899) |
Net unrealized appreciation (depreciation) on securities and other investments | $ 234,315,453 |
| |
Tax cost | $ 3,082,446,895 |
4. Operating Policies.
Restricted Securities. The Fund may invest in securities that are subject to legal or contractual restrictions on resale. These securities generally may be resold in transactions exempt from registration or to the public if the securities are registered. Disposal of these securities may involve time-consuming negotiations and expense, and prompt sale at an acceptable price may be difficult. Information regarding restricted securities is included at the end of the Fund's Schedule of Investments.
5. Purchases and Sales of Investments.
Purchases and sales of securities (including the Fixed-Income Central Funds), other than short-term securities, aggregated $309,785,449 and $17,049,663, respectively.
6. Fees and Other Transactions with Affiliates.
Management Fee. FMR and its affiliates provide the Fund with investment management related services for which the Fund pays a monthly management fee. The management fee is the sum of an individual fund fee rate that is based on an annual rate of .20% of the Fund's average net assets and an annualized group fee rate that averaged .12% during the period. The group fee rate is based upon the average net assets of all the mutual funds advised by FMR. The group fee rate decreases as assets under management increase and increases as assets under management decrease. For the period, the total annualized management fee rate was .32% of the Fund's average net assets.
Distribution and Service Plan Fees. In accordance with Rule 12b-1 of the 1940 Act, the Fund has adopted separate 12b-1 Plans for each Service Class of shares. Each Service Class pays Fidelity Distributors Corporation (FDC), an affiliate of FMR, a service fee. For the period, the service fee is based on an annual rate of .10% of Service Class' average net assets and .25% of Service Class 2's average net assets.
For the period, total fees, all of which were re-allowed to insurance companies for the distribution of shares and providing shareholder support services were as follows:
Service Class | $ 141,434 |
Service Class 2 | 1,447,969 |
| $ 1,589,403 |
Transfer Agent Fees. Fidelity Investments Institutional Operations Company, Inc. (FIIOC), an affiliate of FMR, is the Fund's transfer, dividend disbursing, and shareholder servicing agent. FIIOC receives an asset-based fee with respect to each class. Each class (with the exception of Investor Class) pays a transfer agent fee, excluding out of pocket expenses, equal to an annual rate of .07% of average net assets. Investor Class pays a monthly asset-based transfer agent fee of .10% of average net assets. In addition, FIIOC receives an asset-based fee of .0038% of average net assets for typesetting, printing and mailing of shareholder reports, except proxy statements. For the period, transfer agent fees for each class, including printing and out of pocket expenses, were as follows:
Initial Class | $ 415,359 |
Service Class | 100,635 |
Service Class 2 | 407,491 |
Investor Class | 344,826 |
| $ 1,268,311 |
Accounting Fees. Fidelity Service Company, Inc.(FSC), an affiliate of FMR, maintains the Fund's accounting records. The fee is based on the level of average net assets for each month.
Semiannual Report
7. Committed Line of Credit.
The Fund participates with other funds managed by FMR or an affiliate in a $4.25 billion credit facility (the "line of credit") to be utilized for temporary or emergency purposes to fund shareholder redemptions or for other short-term liquidity purposes. The Fund has agreed to pay commitment fees on its pro-rata portion of the line of credit, which amounted to $4,575 and is reflected in Miscellaneous expenses on the Statement of Operations. During the period, there were no borrowings on this line of credit.
8. Expense Reductions.
Through arrangements with the Fund's custodian, credits realized as a result of uninvested cash balances were used to reduce the Fund's expenses. During the period, these credits reduced the Fund's custody expenses by $15.
9. Distributions to Shareholders.
Distributions to shareholders of each class were as follows:
| Six months ended
June 30,
2012 | Year ended
December 31,
2011 |
From net investment income | | |
Initial Class | $ - | $ 35,870,662 |
Service Class | - | 8,762,765 |
Service Class 2 | - | 29,656,720 |
Investor Class | - | 19,383,872 |
Total | $ - | $ 93,674,019 |
From net realized gain | | |
Initial Class | $ 7,756,768 | $ 29,155,885 |
Service Class | 1,972,307 | 7,406,824 |
Service Class 2 | 8,386,363 | 27,082,188 |
Investor Class | 4,486,619 | 14,603,535 |
Total | $ 22,602,057 | $ 78,248,432 |
10. Share Transactions.
Transactions for each class of shares were as follows:
| Shares | Dollars |
| Six months ended June 30,
2012 | Year ended
December 31,
2011 | Six months ended
June 30,
2012 | Year ended
December 31,
2011 |
Initial Class | | | | |
Shares sold | 6,579,983 | 13,978,276 | $ 86,051,549 | $ 182,769,488 |
Reinvestment of distributions | 595,758 | 5,066,058 | 7,756,768 | 65,026,547 |
Shares redeemed | (8,059,863) | (19,474,527) | (105,692,055) | (252,370,301) |
Net increase (decrease) | (884,122) | (430,193) | $ (11,883,738) | $ (4,574,266) |
Service Class | | | | |
Shares sold | 1,709,181 | 3,222,600 | $ 22,163,242 | $ 41,826,678 |
Reinvestment of distributions | 152,774 | 1,270,624 | 1,972,307 | 16,169,589 |
Shares redeemed | (1,769,528) | (5,204,902) | (22,995,286) | (67,240,590) |
Net increase (decrease) | 92,427 | (711,678) | $ 1,140,263 | $ (9,244,323) |
Service Class 2 | | | | |
Shares sold | 22,252,203 | 12,432,260 | $ 285,256,593 | $ 158,971,483 |
Reinvestment of distributions | 657,238 | 4,510,584 | 8,386,363 | 56,738,908 |
Shares redeemed | (7,735,236) | (20,782,948) | (99,713,751) | (267,706,104) |
Net increase (decrease) | 15,174,205 | (3,840,104) | $ 193,929,205 | $ (51,995,713) |
Investor Class | | | | |
Shares sold | 6,319,188 | 10,052,628 | $ 82,603,539 | $ 132,086,173 |
Reinvestment of distributions | 345,656 | 2,653,983 | 4,486,619 | 33,987,407 |
Shares redeemed | (1,881,636) | (7,372,329) | (24,601,144) | (95,348,662) |
Net increase (decrease) | 4,783,208 | 5,334,282 | $ 62,489,014 | $ 70,724,918 |
Semiannual Report
Notes to Financial Statements (Unaudited) - continued
11. Other.
The Fund's organizational documents provide former and current trustees and officers with a limited indemnification against liabilities arising in connection with the performance of their duties to the Fund. In the normal course of business, the Fund may also enter into contracts that provide general indemnifications. The Fund's maximum exposure under these arrangements is unknown as this would be dependent on future claims that may be made against the Fund. The risk of material loss from such claims is considered remote.
At the end of the period, FMR or its affiliates were the owners of record of 28% of the total outstanding shares of the Fund and one otherwise unaffiliated shareholder was the owner of record of 20% of the total outstanding shares of the Fund.
Semiannual Report
The following are the financial statements for the Fidelity VIP Investment
Grade Central Fund as of June 30, 2012 which is a direct investment of
VIP Investment Grade Bond Portfolio.
Not Part of Financial Report
Shareholder Expense Example
As a shareholder of the Fund, you incur two types of costs: (1) transaction costs, and (2) ongoing costs, including other Fund expenses. This Example is intended to help you understand your ongoing costs (in dollars) of investing in the Fund and to compare these costs with the ongoing costs of investing in other mutual funds.
The Example is based on an investment of $1,000 invested at the beginning of the period and held for the entire period (January 1, 2012 to June 30, 2012).
Actual Expenses
The first line of the accompanying table provides information about actual account values and actual expenses. You may use the information in this line, together with the amount you invested, to estimate the expenses that you paid over the period. Simply divide your account value by $1,000.00 (for example, an $8,600 account value divided by $1,000.00 = 8.6), then multiply the result by the number in the first line under the heading entitled "Expenses Paid During Period" to estimate the expenses you paid on your account during this period. In addition, the Fund, as a shareholder in the underlying Fidelity Central Funds, will indirectly bear its pro-rata share of the fees and expenses incurred by the underlying Fidelity Central Funds. These fees and expenses are not included in the Fund's annualized expense ratio used to calculate the expense estimate in the table below.
Hypothetical Example for Comparison Purposes
The second line of the accompanying table provides information about hypothetical account values and hypothetical expenses based on the Fund's actual expense ratio and an assumed rate of return of 5% per year before expenses, which is not the Fund's actual return. The hypothetical account values and expenses may not be used to estimate the actual ending account balance or expenses you paid for the period. You may use this information to compare the ongoing costs of investing in the Fund and other funds. To do so, compare this 5% hypothetical example with the 5% hypothetical examples that appear in the shareholder reports of the other funds. In addition, the Fund, as a shareholder in the underlying Fidelity Central Funds, will indirectly bear its pro-rata share of the fees and expenses incurred by the underlying Fidelity Central Funds. These fees and expenses are not included in the Fund's annualized expense ratio used to calculate the expense estimate in the table below.
Please note that the expenses shown in the table are meant to highlight your ongoing costs only and do not reflect any transaction costs. Therefore, the second line of the table is useful in comparing ongoing costs only, and will not help you determine the relative total costs of owning different funds.
| Annualized Expense Ratio | Beginning
Account Value
January 1, 2012 | Ending
Account Value
June 30, 2012 | Expenses Paid
During Period*
January 1, 2012 to June 30, 2012 |
Actual | .0021% | $ 1,000.00 | $ 1,034.50 | $ .01 |
Hypothetical (5% return per year before expenses) | | $ 1,000.00 | $ 1,024.85 | $ .01 |
* Expenses are equal to the Fund's annualized expense ratio, multiplied by the average account value over the period, multiplied by 182/366 (to reflect the one-half year period).
Not Part of Financial Report
Investment Changes (Unaudited)
Quality Diversification (% of fund's net assets) as of June 30, 2012 |
As of June 30, 2012 | As of December 31, 2011 |
| U.S. Government and
U.S. Government
Agency Obligations 78.2% | | | U.S. Government and
U.S. Government
Agency Obligations 67.0% | |
 | AAA 5.1% | |  | AAA 7.4% | |
 | AA 1.7% | | | AA 2.7% | |
| A 6.2% | | | A 7.7% | |
 | BBB 15.6% | | | BBB 14.5% | |
 | BB and Below 1.9% | | | BB and Below 2.9% | |
 | Not Rated† 0.0% | | | Not Rated† 0.0% | |
 | Short-Term Investments
and Net Other Assets
(Liabilities)*** (8.7)% | | | Short-Term Investments
and Net Other Assets
(Liabilities)*** (2.2)% | |
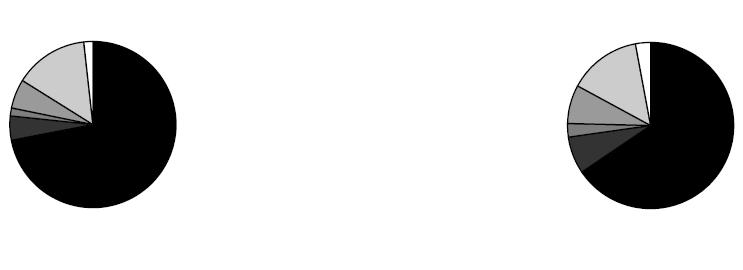
We have used ratings from Moody's Investors Service, Inc. Where Moody's® ratings are not available, we have used S&P® ratings. All ratings are as of the date indicated and do not reflect subsequent changes. Securities rated BB or below were rated investment grade at the time of acquisition. |
Weighted Average Maturity as of June 30, 2012 |
| | 6 months ago |
Years | 6.1 | 6.4 |
This is a weighted average of all the maturities of the securities held in a fund. Weighted Average Maturity (WAM) can be used as a measure of sensitivity to interest rate changes and market changes. Generally, the longer the maturity, the greater the sensitivity to such changes. WAM is based on the dollar-weighted average length of time until principal payments must be paid. Depending on the types of securities held in a fund, certain maturity shortening devices (e.g., demand features, interest rate resets, and call options) may be taken into account when calculating the WAM. |
Duration as of June 30, 2012 |
| | 6 months ago |
Years | 4.8 | 4.8 |
Duration estimates how much a bond fund's price will change with a change in comparable interest rates. If rates rise 1%, for example, a fund with a 5-year duration is likely to lose about 5% of its value. Other factors also can influence a bond fund's performance and share price. Accordingly, a bond fund's actual performance may differ from this example. Duration takes into account any call or put option embedded in the bonds. |
Asset Allocation (% of fund's net assets) |
As of June 30, 2012 * | As of December 31, 2011 ** |
| Corporate Bonds 22.5% | | | Corporate Bonds 25.0% | |
| U.S. Government and
U.S. Government
Agency Obligations 78.2% | | | U.S. Government and
U.S. Government
Agency Obligations 67.0% | |
| Asset-Backed
Securities 1.7% | | | Asset-Backed
Securities 2.3% | |
| CMOs and Other
Mortgage Related
Securities 5.7% | | | CMOs and Other
Mortgage Related
Securities 7.2% | |
| Municipal Bonds 0.5% | | | Municipal Bonds 0.3% | |
| Other Investments 0.1% | | | Other Investments 0.4% | |
| Short-Term Investments
and Net Other Assets
(Liabilities)*** (8.7)% | | | Short-Term Investments
and Net Other Assets (Liabilities)*** (2.2)% | |
* Foreign investments | 3.5% | | ** Foreign investments | 4.1% | |
* Futures and Swaps | 0.0% | | ** Futures and Swaps | 2.2% | |

*** Short-Term Investments and Net Other Assets are not included in the pie chart.
† Amount represents less than 0.1%
Not Part of Financial Report
Investments June 30, 2012
Showing Percentage of Net Assets
Nonconvertible Bonds - 22.5% |
| Principal Amount | | Value |
CONSUMER DISCRETIONARY - 1.7% |
Media - 1.7% |
AOL Time Warner, Inc. 7.625% 4/15/31 | | $ 1,625,000 | | $ 2,101,002 |
Comcast Corp.: | | | | |
3.125% 7/15/22 | | 1,711,000 | | 1,720,523 |
4.65% 7/15/42 | | 3,129,000 | | 3,134,976 |
4.95% 6/15/16 | | 2,975,000 | | 3,341,002 |
5.7% 5/15/18 | | 2,400,000 | | 2,831,842 |
6.4% 3/1/40 | | 2,058,000 | | 2,570,876 |
6.45% 3/15/37 | | 1,410,000 | | 1,716,774 |
COX Communications, Inc. 4.625% 6/1/13 | | 3,475,000 | | 3,596,952 |
Discovery Communications LLC: | | | | |
3.7% 6/1/15 | | 2,648,000 | | 2,829,473 |
6.35% 6/1/40 | | 2,421,000 | | 2,944,101 |
NBCUniversal Media LLC: | | | | |
3.65% 4/30/15 | | 1,200,000 | | 1,275,090 |
5.15% 4/30/20 | | 3,234,000 | | 3,715,290 |
6.4% 4/30/40 | | 3,340,000 | | 4,085,682 |
News America Holdings, Inc. 7.75% 12/1/45 | | 2,636,000 | | 3,227,384 |
News America, Inc.: | | | | |
6.15% 3/1/37 | | 2,331,000 | | 2,644,305 |
6.15% 2/15/41 | | 1,822,000 | | 2,133,351 |
Time Warner Cable, Inc.: | | | | |
5.85% 5/1/17 | | 2,467,000 | | 2,900,104 |
6.2% 7/1/13 | | 7,000,000 | | 7,355,782 |
6.75% 7/1/18 | | 4,425,000 | | 5,393,190 |
Time Warner, Inc.: | | | | |
5.875% 11/15/16 | | 5,514,000 | | 6,459,579 |
6.5% 11/15/36 | | 2,337,000 | | 2,768,994 |
Viacom, Inc.: | | | | |
3.5% 4/1/17 | | 1,312,000 | | 1,412,173 |
6.75% 10/5/37 | | 935,000 | | 1,189,069 |
| | 71,347,514 |
CONSUMER STAPLES - 1.2% |
Beverages - 0.4% |
Beam, Inc.: | | | | |
1.875% 5/15/17 | | 857,000 | | 861,528 |
3.25% 5/15/22 | | 1,016,000 | | 1,022,693 |
Diageo Capital PLC 5.2% 1/30/13 | | 1,705,000 | | 1,751,477 |
FBG Finance Ltd. 5.125% 6/15/15 (c) | | 2,185,000 | | 2,395,774 |
Fortune Brands, Inc.: | | | | |
5.375% 1/15/16 | | 471,000 | | 524,015 |
5.875% 1/15/36 | | 5,421,000 | | 6,264,161 |
SABMiller Holdings, Inc. 3.75% 1/15/22 (c) | | 3,034,000 | | 3,229,110 |
| | 16,048,758 |
|
| Principal Amount | | Value |
Food Products - 0.4% |
General Mills, Inc. 5.2% 3/17/15 | | $ 3,528,000 | | $ 3,916,800 |
Kraft Foods, Inc.: | | | | |
5.375% 2/10/20 | | 4,086,000 | | 4,838,269 |
6.125% 2/1/18 | | 3,684,000 | | 4,416,729 |
6.5% 8/11/17 | | 3,514,000 | | 4,265,388 |
6.5% 2/9/40 | | 822,000 | | 1,057,307 |
| | 18,494,493 |
Tobacco - 0.4% |
Altria Group, Inc. 9.7% 11/10/18 | | 4,450,000 | | 6,160,883 |
Philip Morris International, Inc.: | | | | |
4.875% 5/16/13 | | 2,904,000 | | 3,011,794 |
5.65% 5/16/18 | | 2,751,000 | | 3,324,050 |
Reynolds American, Inc. 7.25% 6/15/37 | | 2,962,000 | | 3,583,522 |
| | 16,080,249 |
TOTAL CONSUMER STAPLES | | 50,623,500 |
ENERGY - 3.6% |
Energy Equipment & Services - 0.5% |
DCP Midstream LLC: | | | | |
4.75% 9/30/21 (c) | | 3,739,000 | | 3,953,555 |
5.35% 3/15/20 (c) | | 3,724,000 | | 4,066,809 |
El Paso Pipeline Partners Operating Co. LLC: | | | | |
4.1% 11/15/15 | | 3,902,000 | | 4,082,826 |
5% 10/1/21 | | 1,517,000 | | 1,642,482 |
Transocean, Inc.: | | | | |
5.05% 12/15/16 | | 2,488,000 | | 2,699,674 |
6.375% 12/15/21 | | 3,286,000 | | 3,761,149 |
| | 20,206,495 |
Oil, Gas & Consumable Fuels - 3.1% |
Anadarko Petroleum Corp. 6.375% 9/15/17 | | 6,869,000 | | 7,982,856 |
Apache Corp.: | | | | |
3.25% 4/15/22 | | 2,590,000 | | 2,706,724 |
4.75% 4/15/43 | | 2,750,000 | | 3,059,232 |
ConocoPhillips 5.75% 2/1/19 | | 3,900,000 | | 4,758,835 |
Duke Capital LLC 6.25% 2/15/13 | | 855,000 | | 879,504 |
Duke Energy Field Services 6.45% 11/3/36 (c) | | 2,477,000 | | 2,940,647 |
El Paso Natural Gas Co. 5.95% 4/15/17 | | 3,330,000 | | 3,760,892 |
Enbridge Energy Partners LP 4.2% 9/15/21 | | 4,399,000 | | 4,656,869 |
Encana Holdings Finance Corp. 5.8% 5/1/14 | | 320,000 | | 344,425 |
Marathon Petroleum Corp. 5.125% 3/1/21 | | 2,187,000 | | 2,450,310 |
Motiva Enterprises LLC 5.75% 1/15/20 (c) | | 1,496,000 | | 1,749,394 |
Nakilat, Inc. 6.067% 12/31/33 (c) | | 1,808,000 | | 2,011,400 |
Nonconvertible Bonds - continued |
| Principal Amount | | Value |
ENERGY - continued |
Oil, Gas & Consumable Fuels - continued |
Nexen, Inc.: | | | | |
5.875% 3/10/35 | | $ 5,405,000 | | $ 5,422,674 |
6.4% 5/15/37 | | 710,000 | | 753,235 |
Pemex Project Funding Master Trust 1.0669% 12/3/12 (c)(h) | | 410,000 | | 408,360 |
Petro-Canada 6.05% 5/15/18 | | 1,480,000 | | 1,752,245 |
Petrobras International Finance Co. Ltd.: | | | | |
3.875% 1/27/16 | | 3,612,000 | | 3,730,286 |
5.375% 1/27/21 | | 6,096,000 | | 6,570,092 |
5.75% 1/20/20 | | 5,084,000 | | 5,561,276 |
6.75% 1/27/41 | | 2,327,000 | | 2,729,534 |
7.875% 3/15/19 | | 4,277,000 | | 5,202,312 |
Petroleos Mexicanos: | | | | |
4.875% 1/24/22 (c) | | 3,398,000 | | 3,686,830 |
5.5% 1/21/21 | | 3,601,000 | | 4,087,135 |
5.5% 6/27/44 (c) | | 4,171,000 | | 4,285,703 |
6.5% 6/2/41 (c) | | 8,839,000 | | 10,407,923 |
Phillips 66: | | | | |
4.3% 4/1/22 (c) | | 3,770,000 | | 3,969,079 |
5.875% 5/1/42 (c) | | 3,228,000 | | 3,479,455 |
Plains All American Pipeline LP/PAA Finance Corp.: | | | | |
3.65% 6/1/22 | | 1,784,000 | | 1,823,241 |
3.95% 9/15/15 | | 2,158,000 | | 2,311,859 |
6.125% 1/15/17 | | 1,250,000 | | 1,453,825 |
Ras Laffan Liquefied Natural Gas Co. Ltd. III: | | | | |
4.5% 9/30/12 (c) | | 2,009,000 | | 2,024,068 |
5.5% 9/30/14 (c) | | 2,808,000 | | 3,025,620 |
5.832% 9/30/16 (c) | | 1,688,863 | | 1,809,194 |
6.332% 9/30/27 (c) | | 2,415,000 | | 2,766,310 |
6.75% 9/30/19 (c) | | 1,838,000 | | 2,200,626 |
Spectra Energy Partners, LP: | | | | |
2.95% 6/15/16 | | 668,000 | | 677,684 |
4.6% 6/15/21 | | 873,000 | | 922,808 |
Suncor Energy, Inc. 6.1% 6/1/18 | | 4,665,000 | | 5,527,843 |
Transcontinental Gas Pipe Line Corp. 6.4% 4/15/16 | | 615,000 | | 710,270 |
Western Gas Partners LP 5.375% 6/1/21 | | 3,820,000 | | 4,228,320 |
| | 128,828,895 |
TOTAL ENERGY | | 149,035,390 |
FINANCIALS - 10.6% |
Capital Markets - 1.7% |
BlackRock, Inc.: | | | | |
3.375% 6/1/22 | | 3,725,000 | | 3,783,032 |
4.25% 5/24/21 | | 1,183,000 | | 1,294,666 |
|
| Principal Amount | | Value |
Goldman Sachs Group, Inc.: | | | | |
5.25% 7/27/21 | | $ 1,125,000 | | $ 1,143,614 |
5.625% 1/15/17 | | 3,000,000 | | 3,147,960 |
5.75% 1/24/22 | | 11,472,000 | | 12,118,803 |
5.95% 1/18/18 | | 755,000 | | 808,449 |
6.15% 4/1/18 | | 5,954,000 | | 6,457,744 |
6.75% 10/1/37 | | 3,421,000 | | 3,356,360 |
JPMorgan Chase Capital XX 6.55% 9/29/36 | | 3,090,000 | | 3,090,000 |
JPMorgan Chase Capital XXV 6.8% 10/1/37 | | 6,975,000 | | 6,974,965 |
Lazard Group LLC: | | | | |
6.85% 6/15/17 | | 3,241,000 | | 3,558,466 |
7.125% 5/15/15 | | 5,585,000 | | 6,099,613 |
Morgan Stanley: | | | | |
4.75% 4/1/14 | | 2,554,000 | | 2,576,692 |
5.5% 7/28/21 | | 4,338,000 | | 4,277,055 |
5.75% 1/25/21 | | 1,500,000 | | 1,480,049 |
6.625% 4/1/18 | | 10,165,000 | | 10,633,261 |
| | 70,800,729 |
Commercial Banks - 1.6% |
Bank of America NA 5.3% 3/15/17 | | 3,403,000 | | 3,544,432 |
Credit Suisse New York Branch 6% 2/15/18 | | 6,110,000 | | 6,540,621 |
Discover Bank: | | | | |
7% 4/15/20 | | 2,309,000 | | 2,689,027 |
8.7% 11/18/19 | | 6,339,000 | | 7,880,030 |
Fifth Third Bancorp: | | | | |
4.5% 6/1/18 | | 1,179,000 | | 1,253,604 |
8.25% 3/1/38 | | 4,319,000 | | 5,868,238 |
Fifth Third Bank 4.75% 2/1/15 | | 487,000 | | 518,148 |
Fifth Third Capital Trust IV 6.5% 4/15/67 (h) | | 2,412,000 | | 2,396,925 |
HBOS PLC 6.75% 5/21/18 (c) | | 2,600,000 | | 2,454,143 |
HSBC Holdings PLC 4% 3/30/22 | | 3,647,000 | | 3,790,086 |
Huntington Bancshares, Inc. 7% 12/15/20 | | 1,004,000 | | 1,176,377 |
KeyBank NA: | | | | |
5.45% 3/3/16 | | 1,618,000 | | 1,797,074 |
5.8% 7/1/14 | | 2,049,000 | | 2,196,706 |
6.95% 2/1/28 | | 800,000 | | 951,182 |
Marshall & Ilsley Bank: | | | | |
4.85% 6/16/15 | | 1,796,000 | | 1,915,229 |
5% 1/17/17 | | 4,625,000 | | 4,987,637 |
5.25% 9/4/12 | | 1,200,000 | | 1,207,807 |
Regions Bank: | | | | |
6.45% 6/26/37 | | 4,429,000 | | 4,340,420 |
7.5% 5/15/18 | | 2,383,000 | | 2,680,875 |
Regions Financial Corp.: | | | | |
5.75% 6/15/15 | | 814,000 | | 854,700 |
7.75% 11/10/14 | | 2,367,000 | | 2,556,360 |
Wachovia Corp. 4.875% 2/15/14 | | 785,000 | | 824,033 |
Nonconvertible Bonds - continued |
| Principal Amount | | Value |
FINANCIALS - continued |
Commercial Banks - continued |
Wells Fargo & Co.: | | | | |
3.625% 4/15/15 | | $ 2,350,000 | | $ 2,501,942 |
3.676% 6/15/16 | | 1,714,000 | | 1,825,053 |
| | 66,750,649 |
Consumer Finance - 0.4% |
General Electric Capital Corp.: | | | | |
2.25% 11/9/15 | | 2,597,000 | | 2,650,114 |
2.95% 5/9/16 | | 774,000 | | 799,005 |
3.5% 6/29/15 | | 799,000 | | 842,597 |
5.625% 5/1/18 | | 9,700,000 | | 11,156,154 |
| | 15,447,870 |
Diversified Financial Services - 2.0% |
Bank of America Corp.: | | | | |
3.875% 3/22/17 | | 3,077,000 | | 3,135,872 |
5.7% 1/24/22 | | 2,179,000 | | 2,401,506 |
5.75% 12/1/17 | | 12,290,000 | | 13,121,935 |
6.5% 8/1/16 | | 3,000,000 | | 3,295,587 |
BP Capital Markets PLC 4.742% 3/11/21 | | 3,000,000 | | 3,436,263 |
Capital One Capital V 10.25% 8/15/39 | | 3,830,000 | | 3,906,600 |
Citigroup, Inc.: | | | | |
3.953% 6/15/16 | | 3,838,000 | | 3,934,069 |
4.75% 5/19/15 | | 10,152,000 | | 10,657,387 |
5.875% 1/30/42 | | 3,065,000 | | 3,351,890 |
6.125% 5/15/18 | | 3,753,000 | | 4,192,585 |
6.5% 8/19/13 | | 8,073,000 | | 8,459,051 |
JPMorgan Chase & Co.: | | | | |
3.15% 7/5/16 | | 4,200,000 | | 4,320,918 |
4.35% 8/15/21 | | 4,371,000 | | 4,616,620 |
4.5% 1/24/22 | | 6,648,000 | | 7,166,936 |
6.3% 4/23/19 | | 3,920,000 | | 4,584,013 |
TECO Finance, Inc.: | | | | |
4% 3/15/16 | | 1,075,000 | | 1,150,739 |
5.15% 3/15/20 | | 1,545,000 | | 1,767,092 |
| | 83,499,063 |
Insurance - 1.7% |
Allstate Corp. 6.2% 5/16/14 | | 2,709,000 | | 2,980,082 |
American International Group, Inc. 4.875% 9/15/16 | | 2,638,000 | | 2,799,279 |
Aon Corp.: | | | | |
3.125% 5/27/16 | | 3,681,000 | | 3,836,629 |
3.5% 9/30/15 | | 1,538,000 | | 1,607,498 |
5% 9/30/20 | | 1,402,000 | | 1,556,573 |
Axis Capital Holdings Ltd. 5.75% 12/1/14 | | 420,000 | | 445,084 |
Berkshire Hathaway Finance Corp. 4.4% 5/15/42 | | 1,310,000 | | 1,345,701 |
|
| Principal Amount | | Value |
Hartford Financial Services Group, Inc.: | | | | |
5.125% 4/15/22 | | $ 3,925,000 | | $ 4,044,893 |
6.625% 4/15/42 | | 2,829,000 | | 2,917,367 |
Liberty Mutual Group, Inc. 5% 6/1/21 (c) | | 4,093,000 | | 4,122,064 |
Marsh & McLennan Companies, Inc. 4.8% 7/15/21 | | 2,278,000 | | 2,482,239 |
Massachusetts Mutual Life Insurance Co. 5.375% 12/1/41 (c) | | 2,110,000 | | 2,265,857 |
MetLife, Inc.: | | | | |
4.75% 2/8/21 | | 1,477,000 | | 1,645,397 |
6.75% 6/1/16 | | 3,234,000 | | 3,793,511 |
Metropolitan Life Global Funding I 5.125% 6/10/14 (c) | | 2,884,000 | | 3,092,983 |
New York Life Global Funding 4.65% 5/9/13 (c) | | 6,045,000 | | 6,236,246 |
Northwestern Mutual Life Insurance Co. 6.063% 3/30/40 (c) | | 2,214,000 | | 2,699,371 |
Pacific Life Insurance Co. 9.25% 6/15/39 (c) | | 2,297,000 | | 2,920,169 |
Pacific LifeCorp 6% 2/10/20 (c) | | 2,514,000 | | 2,745,811 |
Prudential Financial, Inc.: | | | | |
4.5% 11/16/21 | | 2,157,000 | | 2,240,450 |
5.8% 11/16/41 | | 2,824,000 | | 2,960,072 |
6.2% 11/15/40 | | 1,297,000 | | 1,417,028 |
7.375% 6/15/19 | | 1,250,000 | | 1,526,454 |
Symetra Financial Corp. 6.125% 4/1/16 (c) | | 6,355,000 | | 6,499,633 |
Unum Group 5.625% 9/15/20 | | 2,889,000 | | 3,109,483 |
| | 71,289,874 |
Real Estate Investment Trusts - 1.1% |
Alexandria Real Estate Equities, Inc. 4.6% 4/1/22 | | 1,200,000 | | 1,229,616 |
Boston Properties, Inc. 3.85% 2/1/23 | | 2,805,000 | | 2,833,746 |
Camden Property Trust 5.375% 12/15/13 | | 2,985,000 | | 3,132,898 |
DDR Corp. 4.625% 7/15/22 | | 1,491,000 | | 1,472,674 |
Developers Diversified Realty Corp.: | | | | |
4.75% 4/15/18 | | 3,091,000 | | 3,207,586 |
5.375% 10/15/12 | | 1,764,000 | | 1,766,117 |
7.5% 4/1/17 | | 1,944,000 | | 2,231,197 |
Duke Realty LP: | | | | |
4.375% 6/15/22 | | 2,340,000 | | 2,353,808 |
4.625% 5/15/13 | | 1,047,000 | | 1,069,880 |
5.4% 8/15/14 | | 2,242,000 | | 2,381,450 |
5.5% 3/1/16 | | 1,270,000 | | 1,354,543 |
5.95% 2/15/17 | | 928,000 | | 1,026,458 |
6.25% 5/15/13 | | 2,913,000 | | 3,010,728 |
6.5% 1/15/18 | | 2,445,000 | | 2,772,493 |
Equity One, Inc.: | | | | |
5.375% 10/15/15 | | 455,000 | | 482,060 |
6% 9/15/17 | | 2,405,000 | | 2,610,700 |
Nonconvertible Bonds - continued |
| Principal Amount | | Value |
FINANCIALS - continued |
Real Estate Investment Trusts - continued |
Federal Realty Investment Trust: | | | | |
5.4% 12/1/13 | | $ 1,401,000 | | $ 1,470,446 |
5.9% 4/1/20 | | 1,046,000 | | 1,195,783 |
HRPT Properties Trust: | | | | |
5.75% 11/1/15 | | 1,155,000 | | 1,203,382 |
6.25% 6/15/17 | | 3,000,000 | | 3,210,987 |
UDR, Inc. 5.5% 4/1/14 | | 3,685,000 | | 3,880,788 |
United Dominion Realty Trust, Inc. 5.25% 1/15/15 | | 904,000 | | 969,833 |
| | 44,867,173 |
Real Estate Management & Development - 2.1% |
AMB Property LP 5.9% 8/15/13 | | 2,575,000 | | 2,665,923 |
BioMed Realty LP: | | | | |
3.85% 4/15/16 | | 3,700,000 | | 3,809,938 |
4.25% 7/15/22 | | 1,842,000 | | 1,841,943 |
6.125% 4/15/20 | | 1,392,000 | | 1,562,239 |
Brandywine Operating Partnership LP 5.7% 5/1/17 | | 5,000,000 | | 5,310,320 |
Colonial Properties Trust 5.5% 10/1/15 | | 6,290,000 | | 6,652,109 |
Digital Realty Trust LP: | | | | |
4.5% 7/15/15 | | 1,829,000 | | 1,910,579 |
5.25% 3/15/21 | | 1,953,000 | | 2,080,447 |
ERP Operating LP: | | | | |
4.625% 12/15/21 | | 7,498,000 | | 8,150,266 |
4.75% 7/15/20 | | 2,827,000 | | 3,111,936 |
5.375% 8/1/16 | | 1,066,000 | | 1,194,431 |
5.5% 10/1/12 | | 3,560,000 | | 3,601,235 |
5.75% 6/15/17 | | 5,343,000 | | 6,167,243 |
Liberty Property LP: | | | | |
4.125% 6/15/22 | | 2,007,000 | | 2,027,010 |
4.75% 10/1/20 | | 4,185,000 | | 4,456,673 |
5.5% 12/15/16 | | 2,290,000 | | 2,540,496 |
6.625% 10/1/17 | | 2,673,000 | | 3,095,679 |
Mack-Cali Realty LP 4.5% 4/18/22 | | 1,218,000 | | 1,250,754 |
Post Apartment Homes LP 6.3% 6/1/13 | | 2,679,000 | | 2,768,556 |
Prime Property Funding, Inc.: | | | | |
5.125% 6/1/15 (c) | | 3,844,000 | | 3,912,673 |
5.5% 1/15/14 (c) | | 2,405,000 | | 2,461,542 |
Reckson Operating Partnership LP 6% 3/31/16 | | 3,099,000 | | 3,294,420 |
Regency Centers LP 5.875% 6/15/17 | | 1,827,000 | | 2,047,848 |
Simon Property Group LP: | | | | |
2.8% 1/30/17 | | 857,000 | | 882,578 |
4.125% 12/1/21 | | 2,399,000 | | 2,557,857 |
4.2% 2/1/15 | | 1,523,000 | | 1,605,821 |
5.1% 6/15/15 | | 2,220,000 | | 2,415,875 |
|
| Principal Amount | | Value |
Tanger Properties LP: | | | | |
6.125% 6/1/20 | | $ 4,876,000 | | $ 5,625,695 |
6.15% 11/15/15 | | 349,000 | | 388,032 |
| | 89,390,118 |
TOTAL FINANCIALS | | 442,045,476 |
HEALTH CARE - 0.4% |
Biotechnology - 0.1% |
Amgen, Inc. 5.15% 11/15/41 | | 4,000,000 | | 4,181,440 |
Health Care Providers & Services - 0.3% |
Aristotle Holding, Inc. 4.75% 11/15/21 (c) | | 3,953,000 | | 4,377,647 |
Express Scripts, Inc.: | | | | |
3.125% 5/15/16 | | 3,450,000 | | 3,593,344 |
6.25% 6/15/14 | | 1,108,000 | | 1,211,590 |
Medco Health Solutions, Inc. 4.125% 9/15/20 | | 2,723,000 | | 2,889,068 |
| | 12,071,649 |
TOTAL HEALTH CARE | | 16,253,089 |
INDUSTRIALS - 0.7% |
Aerospace & Defense - 0.2% |
United Technologies Corp.: | | | | |
3.1% 6/1/22 | | 4,137,000 | | 4,338,704 |
4.5% 6/1/42 | | 4,137,000 | | 4,551,064 |
| | 8,889,768 |
Airlines - 0.3% |
Continental Airlines, Inc.: | | | | |
6.648% 3/15/19 | | 1,166,474 | | 1,229,230 |
6.795% 2/2/20 | | 1,625,052 | | 1,608,802 |
Northwest Airlines, Inc. pass-thru trust certificates 7.027% 11/1/19 | | 2,720,599 | | 2,883,835 |
U.S. Airways pass-thru trust certificates: | | | | |
6.85% 1/30/18 | | 961,549 | | 1,000,011 |
8.36% 1/20/19 | | 4,052,222 | | 4,295,355 |
| | 11,017,233 |
Industrial Conglomerates - 0.2% |
General Electric Co. 5.25% 12/6/17 | | 7,130,000 | | 8,330,000 |
TOTAL INDUSTRIALS | | 28,237,001 |
INFORMATION TECHNOLOGY - 0.0% |
Office Electronics - 0.0% |
Xerox Corp. 4.5% 5/15/21 | | 1,347,000 | | 1,398,814 |
Nonconvertible Bonds - continued |
| Principal Amount | | Value |
MATERIALS - 0.7% |
Chemicals - 0.3% |
Dow Chemical Co.: | | | | |
4.125% 11/15/21 | | $ 3,587,000 | | $ 3,850,361 |
4.25% 11/15/20 | | 1,931,000 | | 2,096,361 |
7.6% 5/15/14 | | 7,213,000 | | 8,029,973 |
| | 13,976,695 |
Metals & Mining - 0.4% |
Anglo American Capital PLC 9.375% 4/8/14 (c) | | 2,675,000 | | 3,008,511 |
ArcelorMittal SA 3.75% 3/1/16 | | 346,000 | | 343,737 |
Corporacion Nacional del Cobre de Chile (Codelco) 3.875% 11/3/21 (c) | | 3,750,000 | | 3,949,125 |
Vale Overseas Ltd.: | | | | |
4.375% 1/11/22 | | 3,818,000 | | 3,890,970 |
6.25% 1/23/17 | | 3,115,000 | | 3,543,945 |
| | 14,736,288 |
TOTAL MATERIALS | | 28,712,983 |
TELECOMMUNICATION SERVICES - 1.1% |
Diversified Telecommunication Services - 0.7% |
AT&T, Inc.: | | | | |
6.3% 1/15/38 | | 364,000 | | 453,966 |
6.8% 5/15/36 | | 10,939,000 | | 14,197,553 |
CenturyLink, Inc.: | | | | |
6.15% 9/15/19 | | 1,562,000 | | 1,612,146 |
6.45% 6/15/21 | | 2,893,000 | | 3,012,429 |
Embarq Corp. 7.995% 6/1/36 | | 1,808,000 | | 1,890,476 |
Telefonica Emisiones SAU 5.462% 2/16/21 | | 2,456,000 | | 2,140,080 |
Verizon Communications, Inc.: | | | | |
6.1% 4/15/18 | | 2,190,000 | | 2,669,404 |
6.25% 4/1/37 | | 1,380,000 | | 1,758,000 |
6.9% 4/15/38 | | 2,420,000 | | 3,333,915 |
| | 31,067,969 |
Wireless Telecommunication Services - 0.4% |
America Movil SAB de CV 2.375% 9/8/16 | | 5,411,000 | | 5,553,131 |
DIRECTV Holdings LLC/DIRECTV Financing, Inc.: | | | | |
5.15% 3/15/42 | | 826,000 | | 832,464 |
5.875% 10/1/19 | | 4,711,000 | | 5,407,747 |
6.35% 3/15/40 | | 1,471,000 | | 1,668,626 |
Vodafone Group PLC 5% 12/16/13 | | 2,775,000 | | 2,941,900 |
| | 16,403,868 |
TOTAL TELECOMMUNICATION SERVICES | | 47,471,837 |
|
| Principal Amount | | Value |
UTILITIES - 2.5% |
Electric Utilities - 1.3% |
Alabama Power Co. 3.375% 10/1/20 | | $ 2,167,000 | | $ 2,320,688 |
Ameren Illinois Co. 6.125% 11/15/17 | | 1,465,000 | | 1,712,942 |
AmerenUE 6.4% 6/15/17 | | 3,819,000 | | 4,584,163 |
Duquesne Light Holdings, Inc.: | | | | |
5.9% 12/1/21 (c) | | 2,580,000 | | 2,875,333 |
6.4% 9/15/20 (c) | | 6,054,000 | | 6,856,155 |
Edison International 3.75% 9/15/17 | | 2,401,000 | | 2,532,971 |
FirstEnergy Corp. 7.375% 11/15/31 | | 4,457,000 | | 5,600,412 |
FirstEnergy Solutions Corp.: | | | | |
4.8% 2/15/15 | | 990,000 | | 1,051,083 |
6.05% 8/15/21 | | 3,642,000 | | 4,002,787 |
LG&E and KU Energy LLC: | | | | |
2.125% 11/15/15 | | 2,670,000 | | 2,663,600 |
3.75% 11/15/20 | | 525,000 | | 538,259 |
Nevada Power Co. 6.5% 5/15/18 | | 3,165,000 | | 3,897,495 |
Pacific Gas & Electric Co. 3.25% 9/15/21 | | 585,000 | | 613,460 |
Pennsylvania Electric Co. 6.05% 9/1/17 | | 2,905,000 | | 3,308,653 |
Pepco Holdings, Inc. 2.7% 10/1/15 | | 2,535,000 | | 2,602,479 |
Progress Energy, Inc.: | | | | |
4.4% 1/15/21 | | 4,274,000 | | 4,755,252 |
5.625% 1/15/16 | | 2,000,000 | | 2,280,138 |
Tampa Electric Co. 4.1% 6/15/42 | | 719,000 | | 725,426 |
| | 52,921,296 |
Gas Utilities - 0.0% |
Southern Natural Gas Co. / Southern Natural Issuing Corp. 4.4% 6/15/21 | | 1,182,000 | | 1,256,615 |
Independent Power Producers & Energy Traders - 0.1% |
PPL Energy Supply LLC: | | | | |
6.2% 5/15/16 | | 1,229,000 | | 1,377,947 |
6.5% 5/1/18 | | 2,640,000 | | 3,052,091 |
PSEG Power LLC 2.75% 9/15/16 | | 919,000 | | 935,023 |
| | 5,365,061 |
Multi-Utilities - 1.1% |
Consolidated Edison Co. of New York, Inc. 5.7% 6/15/40 | | 1,395,000 | | 1,792,370 |
Dominion Resources, Inc. 2.7606% 9/30/66 (h) | | 9,626,000 | | 8,629,738 |
MidAmerican Energy Holdings, Co.: | | | | |
5.875% 10/1/12 | | 2,880,000 | | 2,916,204 |
6.5% 9/15/37 | | 1,334,000 | | 1,758,393 |
National Grid PLC 6.3% 8/1/16 | | 4,181,000 | | 4,825,547 |
NiSource Finance Corp.: | | | | |
4.45% 12/1/21 | | 1,622,000 | | 1,702,892 |
Nonconvertible Bonds - continued |
| Principal Amount | | Value |
UTILITIES - continued |
Multi-Utilities - continued |
NiSource Finance Corp.: - continued | | | | |
5.25% 2/15/43 | | $ 2,829,000 | | $ 2,872,405 |
5.4% 7/15/14 | | 3,885,000 | | 4,187,210 |
5.45% 9/15/20 | | 613,000 | | 688,200 |
5.8% 2/1/42 | | 2,085,000 | | 2,305,570 |
5.95% 6/15/41 | | 3,834,000 | | 4,290,453 |
6.4% 3/15/18 | | 2,760,000 | | 3,225,518 |
Sempra Energy 2.3% 4/1/17 | | 4,185,000 | | 4,290,910 |
Wisconsin Energy Corp. 6.25% 5/15/67 (h) | | 1,426,000 | | 1,483,040 |
| | 44,968,450 |
TOTAL UTILITIES | | 104,511,422 |
TOTAL NONCONVERTIBLE BONDS (Cost $857,464,137) |
939,637,026
|
U.S. Government and Government Agency Obligations - 26.7% |
|
U.S. Government Agency Obligations - 0.1% |
Fannie Mae 0.5% 7/2/15 | | 696,000 | | 695,140 |
Tennessee Valley Authority 5.375% 4/1/56 | | 2,375,000 | | 3,261,352 |
U.S. Department of Housing and Urban Development Government guaranteed participation certificates Series 1996-A, 7.63% 8/1/14 | | 110,000 | | 110,029 |
TOTAL U.S. GOVERNMENT AGENCY OBLIGATIONS | | 4,066,521 |
U.S. Treasury Inflation Protected Obligations - 1.9% |
U.S. Treasury Inflation-Indexed Bonds: | | | | |
2.125% 2/15/40 (e) | | 27,823,677 | | 39,592,552 |
2.125% 2/15/41 | | 19,279,694 | | 27,600,363 |
2.5% 1/15/29 | | 8,572,400 | | 11,906,343 |
TOTAL U.S. TREASURY INFLATION PROTECTED OBLIGATIONS | | 79,099,258 |
U.S. Treasury Obligations - 24.7% |
U.S. Treasury Bonds: | | | | |
3% 5/15/42 | | 7,659,000 | | 8,039,560 |
3.125% 2/15/42 | | 53,861,000 | | 57,959,499 |
4.375% 5/15/41 | | 88,635,000 | | 118,563,140 |
U.S. Treasury Notes: | | | | |
0.25% 9/15/14 | | 59,000 | | 58,876 |
0.875% 11/30/16 | | 31,268,000 | | 31,590,436 |
|
| Principal Amount | | Value |
0.875% 4/30/17 | | $ 695,000 | | $ 700,647 |
1% 3/31/17 | | 27,344,000 | | 27,732,804 |
1% 6/30/19 | | 114,992,000 | | 114,147,499 |
1.875% 10/31/17 | | 20,552,000 | | 21,693,602 |
2% 2/15/22 | | 166,171,000 | | 171,896,089 |
2.375% 8/31/14 | | 115,000,000 | | 120,022,280 |
2.375% 2/28/15 | | 41,183,000 | | 43,345,108 |
2.625% 7/31/14 (e) | | 245,000,000 | | 256,561,056 |
2.625% 12/31/14 | | 55,045,000 | | 58,136,988 |
TOTAL U.S. TREASURY OBLIGATIONS | | 1,030,447,584 |
TOTAL U.S. GOVERNMENT AND GOVERNMENT AGENCY OBLIGATIONS (Cost $1,042,371,651) |
1,113,613,363
|
U.S. Government Agency - Mortgage Securities - 51.5% |
|
Fannie Mae - 38.7% |
1.867% 5/1/34 (h) | | 1,192,961 | | 1,240,860 |
2.019% 9/1/33 (h) | | 695,187 | | 722,184 |
2.092% 10/1/33 (h) | | 979,356 | | 1,019,348 |
2.257% 7/1/35 (h) | | 44,190 | | 46,544 |
2.301% 10/1/33 (h) | | 46,879 | | 49,247 |
2.301% 7/1/34 (h) | | 52,996 | | 56,047 |
2.32% 6/1/36 (h) | | 98,574 | | 105,181 |
2.332% 3/1/35 (h) | | 57,861 | | 60,958 |
2.383% 8/1/36 (h) | | 1,771,282 | | 1,884,324 |
2.424% 10/1/33 (h) | | 86,447 | | 91,620 |
2.425% 3/1/35 (h) | | 13,659 | | 14,144 |
2.597% 5/1/35 (h) | | 216,185 | | 230,009 |
2.609% 11/1/36 (h) | | 1,278,916 | | 1,371,637 |
2.665% 7/1/37 (h) | | 220,833 | | 236,843 |
2.688% 7/1/35 (h) | | 111,539 | | 119,246 |
2.743% 2/1/36 (h) | | 1,008,575 | | 1,081,069 |
2.796% 5/1/36 (h) | | 391,462 | | 419,843 |
2.82% 12/1/35 (h) | | 510,784 | | 547,816 |
2.858% 9/1/36 (h) | | 1,078,467 | | 1,156,656 |
3% 5/1/27 to 6/1/27 | | 15,220,027 | | 15,959,370 |
3% 7/1/27 (d) | | 31,100,000 | | 32,585,230 |
3% 7/1/27 (d) | | 11,400,000 | | 11,944,425 |
3.5% 1/1/26 to 6/1/42 | | 28,822,945 | | 30,558,498 |
3.5% 7/1/42 (d) | | 14,000,000 | | 14,717,353 |
3.5% 7/1/42 (d) | | 14,000,000 | | 14,717,353 |
3.5% 7/1/42 (d) | | 22,700,000 | | 23,863,137 |
3.5% 7/1/42 (d) | | 22,700,000 | | 23,863,137 |
3.5% 7/1/42 (d) | | 49,700,000 | | 52,246,603 |
3.5% 8/1/42 (d) | | 45,400,000 | | 47,595,040 |
U.S. Government Agency - Mortgage Securities - continued |
| Principal Amount | | Value |
Fannie Mae - continued |
3.5% 8/1/42 (d) | | $ 28,000,000 | | $ 29,353,769 |
4% 9/1/26 to 7/1/42 (d) | | 177,712,819 | | 190,781,217 |
4% 7/1/27 (d) | | 4,000,000 | | 4,254,436 |
4% 9/1/41 | | 262,696 | | 281,208 |
4% 10/1/41 | | 6,187,039 | | 6,643,077 |
4% 7/1/42 (d) | | 1,000,000 | | 1,064,412 |
4% 7/1/42 (d) | | 14,000,000 | | 14,901,764 |
4% 7/1/42 (d) | | 51,100,000 | | 54,391,438 |
4% 7/1/42 (d) | | 14,000,000 | | 14,901,764 |
4% 7/1/42 (d) | | 61,900,000 | | 65,887,084 |
4% 7/1/42 (d) | | 49,000,000 | | 52,156,173 |
4% 7/1/42 (d) | | 15,000,000 | | 15,966,176 |
4% 8/1/42 (d) | | 49,000,000 | | 52,066,209 |
4.5% 11/1/18 to 11/1/41 | | 151,427,626 | | 164,727,982 |
4.5% 7/1/42 (d) | | 37,700,000 | | 40,449,736 |
4.5% 7/1/42 (d) | | 16,300,000 | | 17,488,878 |
4.5% 7/1/42 (d) | | 9,900,000 | | 10,622,079 |
4.5% 7/1/42 (d) | | 7,400,000 | | 7,939,736 |
4.5% 7/1/42 (d) | | 200,000 | | 214,587 |
4.5% 7/1/42 (d) | | 7,400,000 | | 7,939,736 |
4.5% 7/1/42 (d) | | 37,700,000 | | 40,449,736 |
4.5% 7/1/42 (d) | | 9,600,000 | | 10,300,198 |
4.5% 8/1/42 (d) | | 29,200,000 | | 31,306,955 |
5% 2/1/18 to 6/1/40 (d) | | 69,725,746 | | 75,857,300 |
5% 7/1/42 (d) | | 15,000,000 | | 16,235,570 |
5% 7/1/42 (d) | | 26,000,000 | | 28,141,654 |
5% 7/1/42 (d) | | 1,400,000 | | 1,515,320 |
5.5% 11/1/17 to 3/1/39 (d) | | 153,739,434 | | 168,862,493 |
5.5% 7/1/42 (d) | | 23,000,000 | | 25,086,530 |
5.5% 7/1/42 (d) | | 38,000,000 | | 41,447,311 |
5.5% 7/1/42 (d) | | 28,000,000 | | 30,540,124 |
6% 1/1/23 to 7/1/41 | | 98,023,085 | | 107,868,760 |
6% 7/1/42 (d) | | 2,000,000 | | 2,197,984 |
6.5% 6/1/13 to 2/1/36 | | 3,949,497 | | 4,316,981 |
7% 3/1/15 to 8/1/32 | | 1,554,552 | | 1,760,522 |
7.5% 7/1/16 to 11/1/31 | | 1,321,357 | | 1,538,789 |
8% 1/1/30 to 5/1/30 | | 45,961 | | 54,427 |
8.5% 3/1/25 to 6/1/25 | | 711 | | 848 |
TOTAL FANNIE MAE | | 1,618,016,685 |
Freddie Mac - 7.0% |
2.188% 3/1/36 (h) | | 169,770 | | 178,573 |
2.374% 1/1/35 (h) | | 175,867 | | 185,553 |
2.399% 4/1/35 (h) | | 850,834 | | 902,768 |
3.028% 11/1/35 (h) | | 330,154 | | 351,781 |
|
| Principal Amount | | Value |
3.135% 3/1/33 (h) | | $ 17,348 | | $ 18,453 |
3.446% 10/1/35 (h) | | 140,415 | | 150,595 |
3.5% 4/1/32 to 6/1/42 | | 41,832,732 | | 44,066,754 |
4% 6/1/24 to 5/1/42 | | 50,139,439 | | 53,578,270 |
4% 9/1/41 | | 926,096 | | 992,657 |
4% 7/1/42 (d) | | 18,500,000 | | 19,635,249 |
4.5% 7/1/25 to 10/1/41 | | 71,094,838 | | 76,584,558 |
4.5% 7/1/42 (d) | | 15,600,000 | | 16,664,697 |
5% 1/1/35 to 9/1/40 | | 34,819,945 | | 37,780,746 |
5.5% 1/1/38 to 1/1/40 | | 33,964,821 | | 36,840,990 |
6% 4/1/32 to 8/1/37 | | 4,790,088 | | 5,292,258 |
7.5% 5/1/17 to 11/1/31 | | 130,065 | | 150,587 |
8% 7/1/17 to 5/1/27 | | 8,309 | | 9,430 |
8.5% 3/1/20 to 1/1/28 | | 119,099 | | 138,002 |
TOTAL FREDDIE MAC | | 293,521,921 |
Ginnie Mae - 5.8% |
3.5% 1/15/41 to 5/15/42 | | 18,674,253 | | 20,031,903 |
3.5% 7/1/42 (d) | | 12,500,000 | | 13,376,821 |
4% 1/15/25 to 12/15/41 | | 39,011,101 | | 42,546,028 |
4% 7/1/42 (d) | | 1,200,000 | | 1,311,231 |
4% 7/1/42 (d) | | 800,000 | | 873,154 |
4.5% 5/15/39 to 4/15/41 | | 70,441,450 | | 77,470,036 |
5% 3/15/39 to 9/15/41 | | 62,562,227 | | 69,331,887 |
6% 3/15/29 to 9/20/38 | | 9,702,113 | | 10,877,433 |
6.5% 10/15/34 to 11/15/35 | | 369,469 | | 425,537 |
7% 1/15/28 to 7/15/32 | | 2,678,268 | | 3,096,141 |
7.5% 4/15/22 to 10/15/28 | | 647,337 | | 747,739 |
8% 2/15/17 to 9/15/30 | | 47,545 | | 54,818 |
8.5% 12/15/16 to 3/15/30 | | 11,132 | | 12,585 |
TOTAL GINNIE MAE | | 240,155,313 |
TOTAL U.S. GOVERNMENT AGENCY - MORTGAGE SECURITIES (Cost $2,124,861,401) |
2,151,693,919
|
Asset-Backed Securities - 1.7% |
|
Accredited Mortgage Loan Trust Series 2005-1 Class M1, 0.7153% 4/25/35 (h) | | 374,405 | | 231,329 |
ACE Securities Corp. Home Equity Loan Trust Series 2005-HE2 Class M2, 0.6953% 4/25/35 (h) | | 32,964 | | 32,047 |
Advanta Business Card Master Trust Series 2006-C1 Class C1, 0.6758% 10/20/14 (h) | | 169,000 | | 1,690 |
Airspeed Ltd. Series 2007-1A Class C1, 2.7418% 6/15/32 (c)(h) | | 2,578,049 | | 1,327,695 |
Asset-Backed Securities - continued |
| Principal Amount | | Value |
Ally Auto Receivables Trust: | | | | |
Series 2009-A: | | | | |
Class A3, 2.33% 6/17/13 (c) | | $ 146,230 | | $ 146,407 |
Class A4, 3% 10/15/15 (c) | | 1,600,000 | | 1,615,958 |
Series 2010-5 Class A4, 1.75% 3/15/16 | | 1,430,000 | | 1,460,194 |
Series 2011-1 Class A4, 2.23% 3/15/16 | | 6,420,000 | | 6,621,951 |
Ally Master Owner Trust: | | | | |
Series 2010-3 Class A, 2.88% 4/15/15 (c) | | 3,400,000 | | 3,445,512 |
Series 2011-1 Class A2, 2.15% 1/15/16 | | 3,150,000 | | 3,207,116 |
Series 2011-3 Class A2, 1.81% 5/15/16 | | 2,760,000 | | 2,800,466 |
AmeriCredit Automobile Receivables Trust Series 2011-1 Class A3, 1.39% 9/8/15 | | 2,660,000 | | 2,676,417 |
Ameriquest Mortgage Securities, Inc. pass-thru certificates: | | | | |
Series 2003-10 Class M1, 0.9453% 12/25/33 (h) | | 28,167 | | 21,315 |
Series 2004-R2 Class M3, 0.7953% 4/25/34 (h) | | 38,356 | | 13,774 |
Series 2005-R2 Class M1, 0.6953% 4/25/35 (h) | | 727,000 | | 645,195 |
Argent Securities, Inc. pass-thru certificates: | | | | |
Series 2003-W7 Class A2, 1.0188% 3/25/34 (h) | | 16,878 | | 12,139 |
Series 2004-W11 Class M2, 0.9453% 11/25/34 (h) | | 198,000 | | 140,500 |
Series 2004-W7 Class M1, 0.7953% 5/25/34 (h) | | 209,000 | | 149,761 |
Series 2006-W4 Class A2C, 0.4053% 5/25/36 (h) | | 462,489 | | 116,536 |
Asset Backed Securities Corp. Home Equity Loan Trust Series 2004-HE2 Class M1, 1.0703% 4/25/34 (h) | | 852,560 | | 707,631 |
Bank of America Auto Trust Series 2009-1A Class A4, 3.52% 6/15/16 (c) | | 1,939,401 | | 1,958,197 |
BMW Vehicle Lease Trust Series 2010-1 Class A3, 0.82% 4/15/13 | | 1,697,877 | | 1,698,654 |
Carmax Auto Owner Trust Series 2011-1 Class A3, 1.29% 9/15/15 | | 2,760,000 | | 2,775,595 |
Carrington Mortgage Loan Trust Series 2007-RFC1 Class A3, 0.3853% 12/25/36 (h) | | 635,000 | | 227,373 |
Chrysler Financial Auto Securitization Trust Series 2010-A Class A3, 0.91% 8/8/13 | | 3,872,640 | | 3,874,666 |
Citibank Credit Card Issuance Trust Series 2009-A5 Class A5, 2.25% 12/23/14 | | 12,500,000 | | 12,611,319 |
|
| Principal Amount | | Value |
Countrywide Home Loans, Inc.: | | | | |
Series 2003-BC1 Class B1, 5.4888% 3/25/32 (MGIC Investment Corp. Insured) (h) | | $ 40,946 | | $ 12,694 |
Series 2004-3 Class M4, 1.2153% 4/25/34 (h) | | 56,336 | | 25,316 |
Series 2004-4 Class M2, 1.0403% 6/25/34 (h) | | 207,174 | | 111,049 |
Fannie Mae Series 2004-T5 Class AB3, 1.0694% 5/28/35 (h) | | 13,702 | | 8,629 |
Fieldstone Mortgage Investment Corp. Series 2004-3 Class M5, 2.4203% 8/25/34 (h) | | 102,000 | | 60,920 |
First Franklin Mortgage Loan Trust Series 2004-FF2 Class M3, 1.0703% 3/25/34 (h) | | 5,606 | | 2,231 |
Ford Credit Auto Lease Trust Series 2010-B Class A3, 0.91% 7/15/13 (c) | | 1,451,406 | | 1,451,984 |
Ford Credit Auto Owner Trust: | | | | |
Series 2009-D: | | | | |
Class A3, 2.17% 10/15/13 | | 209,747 | | 210,175 |
Class A4, 2.98% 8/15/14 | | 1,800,000 | | 1,826,030 |
Series 2010-B Class A3, 0.98% 10/15/14 | | 2,016,552 | | 2,021,165 |
Ford Credit Floorplan Master Owner Trust Series 2010-5 Class A1, 1.5% 9/15/15 | | 3,580,000 | | 3,613,259 |
Fremont Home Loan Trust Series 2005-A: | | | | |
Class M3, 0.9803% 1/25/35 (h) | | 334,000 | | 99,824 |
Class M4, 1.2653% 1/25/35 (h) | | 128,000 | | 18,264 |
GCO Education Loan Funding Master Trust II Series 2007-1A Class C1L, 0.8469% 2/25/47 (c)(h) | | 829,000 | | 331,186 |
GE Business Loan Trust Series 2003-1 Class A, 0.6718% 4/15/31 (c)(h) | | 71,468 | | 67,085 |
GSAMP Trust Series 2004-AR1 Class B4, 4.8193% 6/25/34 (c)(h) | | 138,597 | | 45,645 |
Guggenheim Structured Real Estate Funding Ltd. Series 2006-3 Class C, 0.7953% 9/25/46 (c)(h) | | 494,496 | | 468,436 |
Home Equity Asset Trust: | | | | |
Series 2003-3 Class M1, 1.5353% 8/25/33 (h) | | 240,201 | | 184,438 |
Series 2003-5 Class A2, 0.9453% 12/25/33 (h) | | 11,595 | | 9,153 |
Series 2006-1 Class 2A3, 0.4703% 4/25/36 (h) | | 36,536 | | 36,410 |
HSI Asset Securitization Corp. Trust Series 2007-HE1 Class 2A3, 0.4353% 1/25/37 (h) | | 436,000 | | 139,028 |
Hyundai Auto Receivables Trust Series 2009-A Class A3, 2.03% 8/15/13 | | 131,414 | | 131,559 |
Asset-Backed Securities - continued |
| Principal Amount | | Value |
JPMorgan Mortgage Acquisition Trust Series 2007-CH1 Class AV4, 0.3753% 11/25/36 (h) | | $ 438,000 | | $ 399,728 |
Keycorp Student Loan Trust Series 1999-A Class A2, 0.7906% 12/27/29 (h) | | 182,826 | | 162,054 |
MASTR Asset Backed Securities Trust Series 2007-HE1 Class M1, 0.5453% 5/25/37 (h) | | 249,000 | | 2,748 |
Merrill Lynch Mortgage Investors Trust: | | | | |
Series 2003-OPT1 Class M1, 1.2203% 7/25/34 (h) | | 27,601 | | 18,735 |
Series 2006-FM1 Class A2B, 0.3553% 4/25/37 (h) | | 435,915 | | 391,185 |
Series 2006-OPT1 Class A1A, 0.5053% 6/25/35 (h) | | 491,791 | | 394,548 |
Morgan Stanley ABS Capital I Trust: | | | | |
Series 2004-HE6 Class A2, 0.5853% 8/25/34 (h) | | 20,187 | | 15,010 |
Series 2004-NC8 Class M6, 1.4953% 9/25/34 (h) | | 96,290 | | 39,643 |
Series 2005-NC1 Class M1, 0.6853% 1/25/35 (h) | | 141,000 | | 85,587 |
New Century Home Equity Loan Trust Series 2005-4 Class M2, 0.7553% 9/25/35 (h) | | 503,000 | | 268,541 |
Nissan Auto Receivables Owner Trust Series 2010-A Class A4, 1.31% 9/15/16 | | 2,140,000 | | 2,160,605 |
Ocala Funding LLC Series 2006-1A Class A, 1.6438% 3/20/11 (b)(c)(h) | | 414,000 | | 0 |
Park Place Securities, Inc.: | | | | |
Series 2004-WCW1: | | | | |
Class M3, 1.4953% 9/25/34 (h) | | 188,000 | | 79,783 |
Class M4, 1.6953% 9/25/34 (h) | | 241,000 | | 50,574 |
Series 2005-WCH1 Class M4, 1.0753% 1/25/36 (h) | | 520,000 | | 257,586 |
Salomon Brothers Mortgage Securities VII, Inc. Series 2003-HE1 Class A, 1.0453% 4/25/33 (h) | | 1,796 | | 1,481 |
Saxon Asset Securities Trust Series 2004-1 Class M1, 1.0403% 3/25/35 (h) | | 458,580 | | 339,131 |
Sierra Receivables Funding Co. Series 2007-1A Class A2, 0.3898% 3/20/19 (FGIC Insured) (c)(h) | | 128,583 | | 125,659 |
SLM Private Credit Student Loan Trust Series 2004-A Class C, 1.4179% 6/15/33 (h) | | 448,000 | | 256,799 |
Structured Asset Investment Loan Trust Series 2004-8 Class M5, 1.9703% 9/25/34 (h) | | 22,495 | | 7,638 |
|
| Principal Amount | | Value |
Terwin Mortgage Trust Series 2003-4HE Class A1, 1.1053% 9/25/34 (h) | | $ 10,148 | | $ 7,416 |
Volkswagen Auto Lease Trust Series 2010-A Class A3, 0.99% 11/20/13 | | 4,090,623 | | 4,096,527 |
Whinstone Capital Management Ltd. Series 1A Class B3, 2.2657% 10/25/44 (c)(h) | | 630,180 | | 341,873 |
TOTAL ASSET-BACKED SECURITIES (Cost $71,487,533) |
68,896,768
|
Collateralized Mortgage Obligations - 0.5% |
|
Private Sponsor - 0.4% |
Bear Stearns ALT-A Trust floater Series 2005-1 Class A1, 0.8053% 1/25/35 (h) | | 640,586 | | 512,918 |
Granite Master Issuer PLC floater: | | | | |
Series 2006-1A Class C2, 1.4438% 12/20/54 (c)(h) | | 2,117,000 | | 1,423,683 |
Series 2006-2 Class C1, 1.1838% 12/20/54 (h) | | 1,885,000 | | 1,267,663 |
Series 2006-3 Class C2, 0.7438% 12/20/54 (h) | | 396,000 | | 266,310 |
Series 2006-4: | | | | |
Class B1, 0.4238% 12/20/54 (h) | | 1,059,000 | | 921,330 |
Class C1, 1.0038% 12/20/54 (h) | | 647,000 | | 435,108 |
Class M1, 0.5838% 12/20/54 (h) | | 279,000 | | 224,595 |
Series 2007-1: | | | | |
Class 1C1, 0.8438% 12/20/54 (h) | | 654,000 | | 439,815 |
Class 1M1, 0.5438% 12/20/54 (h) | | 425,000 | | 342,125 |
Class 2C1, 1.2038% 12/20/54 (h) | | 298,000 | | 200,405 |
Class 2M1, 0.7438% 12/20/54 (h) | | 546,000 | | 439,530 |
Series 2007-2 Class 2C1, 1.1028% 12/17/54 (h) | | 757,000 | | 509,083 |
Granite Mortgages PLC floater Series 2003-3 Class 1C, 2.9157% 1/20/44 (h) | | 151,584 | | 110,657 |
JPMorgan Chase Commercial Mortgage Securities Trust Series 2007-CB18 Class A3, 5.447% 6/12/47 (h) | | 5,195,447 | | 5,477,986 |
MASTR Adjustable Rate Mortgages Trust Series 2007-3 Class 22A2, 0.4553% 5/25/47 (h) | | 277,355 | | 170,847 |
Merrill Lynch Alternative Note Asset Trust floater Series 2007-OAR1 Class A1, 0.4153% 2/25/37 (h) | | 400,314 | | 269,221 |
Collateralized Mortgage Obligations - continued |
| Principal Amount | | Value |
Private Sponsor - continued |
Opteum Mortgage Acceptance Corp. floater Series 2005-3 Class APT, 0.5353% 7/25/35 (h) | | $ 673,315 | | $ 532,595 |
RESI Finance LP/RESI Finance DE Corp. floater Series 2003-B Class B5, 2.5908% 7/10/35 (c)(h) | | 201,348 | | 169,956 |
Residential Funding Securities Corp. floater Series 2003-RP2 Class A1, 0.6953% 6/25/33 (c)(h) | | 47,804 | | 44,980 |
Sequoia Mortgage Trust floater Series 2004-6 Class A3B, 1.668% 7/20/34 (h) | | 12,110 | | 10,002 |
TBW Mortgage-Backed pass-thru certificates floater Series 2006-4 Class A3, 0.4388% 9/25/36 (h) | | 1,153,000 | | 921,683 |
TOTAL PRIVATE SPONSOR | | 14,690,492 |
U.S. Government Agency - 0.1% |
Fannie Mae: | | | | |
planned amortization class: | | | | |
Series 1999-54 Class PH, 6.5% 11/18/29 | | 1,233,745 | | 1,357,171 |
Series 1999-57 Class PH, 6.5% 12/25/29 | | 923,319 | | 1,037,888 |
Series 2002-9 Class PC, 6% 3/25/17 | | 113,514 | | 121,853 |
sequential payer Series 2004-86 Class KC, 4.5% 5/25/19 | | 189,095 | | 194,994 |
Freddie Mac planned amortization class Series 2500 Class TE, 5.5% 9/15/17 | | 2,726,274 | | 2,920,171 |
Ginnie Mae guaranteed REMIC pass-thru certificates Series 2007-35 Class SC, 38.7435% 6/16/37 (h)(j) | | 108,854 | | 215,740 |
TOTAL U.S. GOVERNMENT AGENCY | | 5,847,817 |
TOTAL COLLATERALIZED MORTGAGE OBLIGATIONS (Cost $19,962,376) |
20,538,309
|
Commercial Mortgage Securities - 5.2% |
|
Banc of America Commercial Mortgage Trust: | | | | |
sequential payer: | | | | |
Series 2006-2 Class AAB, 5.713% 5/10/45 (h) | | 1,571,674 | | 1,660,271 |
Series 2006-5: | | | | |
Class A2, 5.317% 9/10/47 | | 7,187,150 | | 7,228,153 |
Class A3, 5.39% 9/10/47 | | 1,985,000 | | 2,088,696 |
Series 2007-3 Class A3, 5.6008% 6/10/49 (h) | | 6,100,000 | | 6,246,815 |
|
| Principal Amount | | Value |
Banc of America Commercial Mortgage, Inc.: | | | | |
sequential payer: | | | | |
Series 2005-1 Class A3, 4.877% 11/10/42 | | $ 362,295 | | $ 362,086 |
Series 2007-1 Class A2, 5.381% 1/15/49 | | 294,492 | | 294,342 |
Series 2001-3 Class H, 6.562% 4/11/37 (c) | | 4,889,139 | | 4,884,846 |
Banc of America Large Loan, Inc. floater: | | | | |
Series 2005-MIB1: | | | | |
Class F, 0.7118% 3/15/22 (c)(h) | | 217,000 | | 210,501 |
Class G, 0.7718% 3/15/22 (c)(h) | | 141,000 | | 132,547 |
Series 2006-BIX1: | | | | |
Class F, 0.5518% 10/15/19 (c)(h) | | 558,000 | | 518,940 |
Class G, 0.5718% 10/15/19 (c)(h) | | 380,000 | | 349,600 |
Bayview Commercial Asset Trust: | | | | |
floater: | | | | |
Series 2004-1: | | | | |
Class B, 2.1453% 4/25/34 (c)(h) | | 32,343 | | 18,971 |
Class M1, 0.8053% 4/25/34 (c)(h) | | 26,353 | | 18,764 |
Class M2, 1.4453% 4/25/34 (c)(h) | | 23,615 | | 16,635 |
Series 2005-2A: | | | | |
Class A1, 0.5553% 8/25/35 (c)(h) | | 367,502 | | 254,103 |
Class M1, 0.6753% 8/25/35 (c)(h) | | 27,249 | | 13,347 |
Class M2, 0.7253% 8/25/35 (c)(h) | | 44,817 | | 20,107 |
Class M3, 0.7453% 8/25/35 (c)(h) | | 24,739 | | 10,240 |
Series 2005-3A Class A2, 0.6453% 11/25/35 (c)(h) | | 128,672 | | 81,143 |
Series 2005-4A: | | | | |
Class A2, 0.6353% 1/25/36 (c)(h) | | 694,518 | | 482,493 |
Class M1, 0.6953% 1/25/36 (c)(h) | | 145,317 | | 63,263 |
Class M2, 0.7153% 1/25/36 (c)(h) | | 43,839 | | 17,057 |
Class M3, 0.7453% 1/25/36 (c)(h) | | 63,728 | | 22,270 |
Series 2006-1 Class A2, 0.6053% 4/25/36 (c)(h) | | 70,902 | | 45,801 |
Series 2006-2A: | | | | |
Class A1, 0.4753% 7/25/36 (c)(h) | | 693,813 | | 468,760 |
Class A2, 0.5253% 7/25/36 (c)(h) | | 62,627 | | 41,657 |
Commercial Mortgage Securities - continued |
| Principal Amount | | Value |
Bayview Commercial Asset Trust: - continued | | | | |
Series 2006-2A: | | | | |
Class M1, 0.5553% 7/25/36 (c)(h) | | $ 65,758 | | $ 25,436 |
Class M2, 0.5753% 7/25/36 (c)(h) | | 46,523 | | 16,375 |
Class M6, 0.7853% 7/25/36 (c)(h) | | 47,417 | | 6,117 |
Series 2006-3A: | | | | |
Class M5, 0.7253% 10/25/36 (c)(h) | | 61,880 | | 3,257 |
Class M6, 0.8053% 10/25/36 (c)(h) | | 120,982 | | 2,873 |
Series 2006-4A: | | | | |
Class A1, 0.4753% 12/25/36 (c)(h) | | 443,252 | | 286,437 |
Class A2, 0.5153% 12/25/36 (c)(h) | | 987,868 | | 430,826 |
Class M1, 0.5353% 12/25/36 (c)(h) | | 71,585 | | 19,661 |
Series 2007-1 Class A2, 0.5153% 3/25/37 (c)(h) | | 185,675 | | 92,910 |
Series 2007-2A: | | | | |
Class A1, 0.5153% 7/25/37 (c)(h) | | 180,429 | | 97,279 |
Class A2, 0.5653% 7/25/37 (c)(h) | | 168,882 | | 50,985 |
Class B1, 1.8453% 7/25/37 (c)(h) | | 131,584 | | 4,835 |
Class M2, 0.6553% 7/25/37 (c)(h) | | 93,823 | | 7,802 |
Class M3, 0.7353% 7/25/37 (c)(h) | | 93,823 | | 6,744 |
Class M4, 0.8953% 7/25/37 (c)(h) | | 198,472 | | 12,897 |
Class M5, 0.9953% 7/25/37 (c)(h) | | 176,821 | | 9,580 |
Class M6, 1.2453% 7/25/37 (c)(h) | | 220,124 | | 9,748 |
Series 2007-3: | | | | |
Class A2, 0.5353% 7/25/37 (c)(h) | | 270,130 | | 127,142 |
Class B1, 1.1953% 7/25/37 (c)(h) | | 124,850 | | 8,991 |
Class B2, 1.8453% 7/25/37 (c)(h) | | 436,407 | | 14,160 |
Class B3, 4.2453% 7/25/37 (c)(h) | | 1,551 | | 20 |
Class M1, 0.5553% 7/25/37 (c)(h) | | 110,662 | | 26,627 |
Class M2, 0.5853% 7/25/37 (c)(h) | | 116,337 | | 21,008 |
Class M3, 0.6153% 7/25/37 (c)(h) | | 254,240 | | 35,016 |
Class M4, 0.7453% 7/25/37 (c)(h) | | 401,789 | | 47,896 |
|
| Principal Amount | | Value |
Class M5, 0.8453% 7/25/37 (c)(h) | | $ 150,387 | | $ 14,412 |
Class M6, 1.0453% 7/25/37 (c)(h) | | 113,500 | | 7,970 |
Series 2007-4A: | | | | |
Class M4, 1.8453% 9/25/37 (c)(h) | | 735,034 | | 28,310 |
Class M5, 1.9953% 9/25/37 (c)(h) | | 735,034 | | 21,684 |
Class M6, 2.1953% 9/25/37 (c)(h) | | 699,863 | | 12,161 |
Series 2004-1, Class IO, 1.25% 4/25/34 (c)(i) | | 1,175,020 | | 45,826 |
Bear Stearns Commercial Mortgage Securities Trust: | | | | |
floater: | | | | |
Series 2006-BBA7: | | | | |
Class H, 0.8918% 3/15/19 (c)(h) | | 143,028 | | 137,311 |
Class J, 1.0918% 3/15/19 (c)(h) | | 143,000 | | 130,313 |
Series 2007-BBA8: | | | | |
Class D, 0.4918% 3/15/22 (c)(h) | | 147,000 | | 132,730 |
Class E, 0.5418% 3/15/22 (c)(h) | | 763,000 | | 673,674 |
Class F, 0.5918% 3/15/22 (c)(h) | | 468,000 | | 403,850 |
Class G, 0.6418% 3/15/22 (c)(h) | | 120,000 | | 101,151 |
Class H, 0.7918% 3/15/22 (c)(h) | | 147,000 | | 120,970 |
Class J, 0.9418% 3/15/22 (c)(h) | | 147,000 | | 117,295 |
Series 2006-PW13 Class A3, 5.518% 9/11/41 | | 2,010,000 | | 2,099,662 |
C-BASS Trust floater Series 2006-SC1 Class A, 0.5153% 5/25/36 (c)(h) | | 250,784 | | 209,682 |
Citigroup Commercial Mortgage Trust: | | | | |
floater Series 2006-FL2: | | | | |
Class G, 0.5718% 8/15/21 (c)(h) | | 56,688 | | 54,767 |
Class H, 0.6118% 8/15/21 (c)(h) | | 125,000 | | 116,819 |
Series 2007-FL3A Class A2, 0.3818% 4/15/22 (c)(h) | | 140,117 | | 134,043 |
Series 2008-C7 Class A2B, 6.0753% 12/10/49 (h) | | 6,548,456 | | 6,663,826 |
Citigroup/Deutsche Bank Commercial Mortgage Trust: | | | | |
sequential payer Series 2007-CD4 Class A4, 5.322% 12/11/49 | | 2,960,000 | | 3,287,725 |
Series 2007-CD4 Class A3, 5.293% 12/11/49 | | 6,065,000 | | 6,402,960 |
Commercial Mortgage Securities - continued |
| Principal Amount | | Value |
COMM pass-thru certificates: | | | | |
floater: | | | | |
Series 2005-F10A: | | | | |
Class G, 0.7918% 4/15/17 (c)(h) | | $ 23,182 | | $ 22,688 |
Class H, 0.8618% 4/15/17 (c)(h) | | 60,000 | | 46,200 |
Class J, 1.0918% 4/15/17 (c)(h) | | 46,000 | | 29,900 |
Series 2005-FL11: | | | | |
Class F, 0.6918% 11/15/17 (c)(h) | | 52,739 | | 47,943 |
Class G, 0.7418% 11/15/17 (c)(h) | | 36,409 | | 32,369 |
sequential payer Series 2006-CN2A: | | | | |
Class A2FX, 5.449% 2/5/19 (c) | | 2,775,000 | | 2,763,845 |
Class AJFX, 5.478% 2/5/19 (c) | | 2,110,000 | | 2,092,922 |
Credit Suisse Commercial Mortgage Trust: | | | | |
sequential payer: | | | | |
Series 2007-C2 Class A2, 5.448% 1/15/49 (h) | | 1,395,663 | | 1,410,721 |
Series 2007-C3 Class A4, 5.6783% 6/15/39 (h) | | 3,750,000 | | 4,015,391 |
Series 2006-C4 Class AAB, 5.439% 9/15/39 | | 2,834,372 | | 2,873,163 |
Series 2007-C5 Class A4, 5.695% 9/15/40 (h) | | 2,750,000 | | 2,949,386 |
Credit Suisse First Boston Mortgage Securities Corp.: | | | | |
sequential payer Series 2004-C1 Class A4, 4.75% 1/15/37 | | 3,013,974 | | 3,147,707 |
Series 2001-CKN5 Class AX, 1.7527% 9/15/34 (c)(h)(i) | | 3,664,616 | | 6,204 |
Series 2002-CP3 Class G, 6.639% 7/15/35 (c) | | 250,000 | | 249,459 |
Series 2006-C1 Class A3, 5.4301% 2/15/39 (h) | | 2,671,358 | | 2,719,873 |
Credit Suisse Mortgage Capital Certificates floater Series 2007-TFL1: | | | | |
Class B, 0.3918% 2/15/22 (c)(h) | | 3,470,000 | | 3,123,000 |
Class C: | | | | |
0.4118% 2/15/22 (c)(h) | | 657,000 | | 584,730 |
0.5118% 2/15/22 (c)(h) | | 234,000 | | 203,580 |
Class F, 0.5618% 2/15/22 (c)(h) | | 469,000 | | 398,650 |
GE Capital Commercial Mortgage Corp. sequential payer Series 2007-C1 Class A4, 5.543% 12/10/49 | | 4,470,000 | | 4,887,489 |
|
| Principal Amount | | Value |
Greenwich Capital Commercial Funding Corp.: | | | | |
floater Series 2006-FL4 Class B, 0.4298% 11/5/21 (c)(h) | | $ 3,490,000 | | $ 3,290,829 |
sequential payer Series 2007-GG11 Class A2, 5.597% 12/10/49 | | 13,805,000 | | 14,212,703 |
Series 2006-GG7 Class A3, 5.8742% 7/10/38 (h) | | 931,129 | | 930,887 |
GS Mortgage Securities Corp. II: | | | | |
floater: | | | | |
Series 2006-FL8A: | | | | |
Class E, 0.6088% 6/6/20 (c)(h) | | 1,821,615 | | 1,794,732 |
Class F, 0.6788% 6/6/20 (c)(h) | | 294,000 | | 285,607 |
Series 2007-EOP: | | | | |
Class C, 2.0056% 3/6/20 (c)(h) | | 1,335,000 | | 1,321,711 |
Class D, 2.2018% 3/6/20 (c)(h) | | 400,000 | | 395,990 |
Class E, 2.4764% 3/6/20 (c)(h) | | 670,000 | | 663,619 |
Class F, 2.6334% 3/6/20 (c)(h) | | 335,000 | | 331,689 |
Class G, 2.7903% 3/6/20 (c)(h) | | 165,000 | | 163,310 |
Class H, 3.3004% 3/6/20 (c)(h) | | 275,000 | | 272,795 |
Class J, 4.0852% 3/6/20 (c)(h) | | 395,000 | | 393,500 |
Series 2006-GG6 Class A2, 5.506% 4/10/38 | | 1,245,494 | | 1,250,397 |
GS Mortgage Securities Trust sequential payer Series 2007-GG10 Class A2, 5.778% 8/10/45 | | 2,404,999 | | 2,424,792 |
JPMorgan Chase Commercial Mortgage Securities Trust: | | | | |
floater Series 2006-FLA2: | | | | |
Class E, 0.5218% 11/15/18 (c)(h) | | 68,578 | | 63,520 |
Class F, 0.5718% 11/15/18 (c)(h) | | 102,866 | | 90,522 |
Class G, 0.6018% 11/15/18 (c)(h) | | 89,618 | | 72,591 |
Class H, 0.7418% 11/15/18 (c)(h) | | 68,593 | | 54,189 |
sequential payer: | | | | |
Series 2006-CB14 Class A3B, 5.4893% 12/12/44 (h) | | 3,821,435 | | 3,923,135 |
Series 2006-LDP9 Class A2, 5.134% 5/15/47 (h) | | 3,546,920 | | 3,709,248 |
Series 2007-LDPX Class A3, 5.42% 1/15/49 | | 3,796,000 | | 4,247,234 |
Series 2005-LDP3 Class A3, 4.959% 8/15/42 | | 1,395,238 | | 1,431,530 |
Commercial Mortgage Securities - continued |
| Principal Amount | | Value |
JPMorgan Chase Commercial Mortgage Securities Trust: - continued | | | | |
Series 2007-CB19: | | | | |
Class B, 5.7353% 2/12/49 (h) | | $ 755,000 | | $ 218,950 |
Class C, 5.7353% 2/12/49 (h) | | 1,971,000 | | 354,780 |
Class D, 5.7353% 2/12/49 (h) | | 2,075,000 | | 321,625 |
Series 2007-LDP10: | | | | |
Class BS, 5.437% 1/15/49 (h) | | 1,725,000 | | 345,884 |
Class CS, 5.466% 1/15/49 (h) | | 745,000 | | 93,221 |
Class ES, 5.5538% 1/15/49 (c)(h) | | 4,663,000 | | 295,355 |
LB Commercial Conduit Mortgage Trust sequential payer Series 2007-C3 Class A4, 5.9123% 7/15/44 (h) | | 3,733,000 | | 4,306,183 |
LB-UBS Commercial Mortgage Trust sequential payer: | | | | |
Series 2006-C1 Class A2, 5.084% 2/15/31 | | 422,321 | | 424,260 |
Series 2006-C6 Class A2, 5.262% 9/15/39 (h) | | 104,567 | | 104,661 |
Series 2007-C1: | | | | |
Class A3, 5.398% 2/15/40 | | 5,000,000 | | 5,151,185 |
Class A4, 5.424% 2/15/40 | | 8,620,000 | | 9,725,162 |
Series 2007-C2 Class A3, 5.43% 2/15/40 | | 1,165,000 | | 1,300,449 |
Lehman Brothers Floating Rate Commercial Mortgage Trust floater Series 2006-LLFA: | | | | |
Class F, 0.5818% 9/15/21 (c)(h) | | 402,971 | | 346,369 |
Class G, 0.6018% 9/15/21 (c)(h) | | 795,609 | | 659,989 |
Class H, 0.6418% 9/15/21 (c)(h) | | 204,773 | | 161,676 |
Merrill Lynch Mortgage Trust: | | | | |
sequential payer: | | | | |
Series 2004-KEY2 Class A2, 4.166% 8/12/39 | | 43,398 | | 43,741 |
Series 2005-MCP1 Class A2, 4.556% 6/12/43 | | 295,560 | | 296,055 |
Series 2007-C1 Class A4, 5.8473% 6/12/50 (h) | | 3,796,000 | | 4,217,641 |
Merrill Lynch-CFC Commercial Mortgage Trust: | | | | |
sequential payer: | | | | |
Series 2007-5 Class A3, 5.364% 8/12/48 | | 4,298,000 | | 4,380,526 |
Series 2007-6 Class A4, 5.485% 3/12/51 (h) | | 3,875,000 | | 4,219,247 |
Series 2007-9 Class A4, 5.7% 9/12/49 | | 5,500,000 | | 6,038,654 |
Series 2006-3 Class ASB, 5.382% 7/12/46 (h) | | 3,838,927 | | 3,996,538 |
|
| Principal Amount | | Value |
Series 2007-7 Class B, 5.7462% 6/12/50 (h) | | $ 770,000 | | $ 43,359 |
Morgan Stanley Capital I Trust: | | | | |
floater: | | | | |
Series 2006-XLF Class C, 1.442% 7/15/19 (c)(h) | | 113,478 | | 65,817 |
Series 2007-XLFA: | | | | |
Class D, 0.432% 10/15/20 (c)(h) | | 235,000 | | 202,100 |
Class E, 0.492% 10/15/20 (c)(h) | | 294,000 | | 238,140 |
Class F, 0.542% 10/15/20 (c)(h) | | 176,000 | | 139,040 |
Class G, 0.582% 10/15/20 (c)(h) | | 218,000 | | 167,860 |
Class H, 0.672% 10/15/20 (c)(h) | | 137,000 | | 89,050 |
Class J, 0.822% 10/15/20 (c)(h) | | 80,460 | | 32,184 |
sequential payer Series 2007-HQ11 Class A31, 5.439% 2/12/44 (h) | | 4,785,000 | | 5,034,150 |
Series 2007-HQ12 Class A2, 5.5994% 4/12/49 (h) | | 4,331,909 | | 4,446,137 |
Series 2007-IQ14 Class B, 5.7212% 4/15/49 (h) | | 2,175,000 | | 599,861 |
Providence Place Group Ltd. Partnership Series 2000-C1 Class A2, 7.75% 7/20/28 (c) | | 3,361,337 | | 3,968,059 |
Wachovia Bank Commercial Mortgage Trust: | | | | |
floater: | | | | |
Series 2006-WL7A: | | | | |
Class E, 0.5218% 9/15/21 (c)(h) | | 491,000 | | 388,965 |
Class F, 0.5818% 9/15/21 (c)(h) | | 661,000 | | 503,808 |
Class G, 0.6018% 9/15/21 (c)(h) | | 626,000 | | 456,786 |
Class J, 0.8418% 9/15/21 (c)(h) | | 139,000 | | 63,897 |
Series 2007-WHL8 Class F, 0.7218% 6/15/20 (c)(h) | | 1,046,000 | | 763,580 |
sequential payer: | | | | |
Series 2003-C7 Class A1, 4.241% 10/15/35 (c) | | 293,884 | | 295,986 |
Series 2007-C30: | | | | |
Class A3, 5.246% 12/15/43 | | 2,213,552 | | 2,292,496 |
Class A4, 5.305% 12/15/43 | | 3,240,000 | | 3,454,877 |
Class A5, 5.342% 12/15/43 | | 7,696,000 | | 8,304,807 |
Series 2007-C31 Class A4, 5.509% 4/15/47 | | 2,332,000 | | 2,552,204 |
Series 2007-C32: | | | | |
Class A2, 5.7307% 6/15/49 (h) | | 976,760 | | 1,004,334 |
Class A3, 5.7357% 6/15/49 (h) | | 10,000,000 | | 10,889,990 |
Commercial Mortgage Securities - continued |
| Principal Amount | | Value |
Wachovia Bank Commercial Mortgage Trust: - continued | | | | |
Series 2006-C23 Class A5, 5.416% 1/15/45 (h) | | $ 3,010,000 | | $ 3,356,036 |
Series 2007-C30 Class E, 5.553% 12/15/43 (h) | | 6,257,000 | | 1,362,768 |
Series 2007-C31 Class C, 5.6834% 4/15/47 (h) | | 2,455,000 | | 504,453 |
TOTAL COMMERCIAL MORTGAGE SECURITIES (Cost $227,631,068) |
218,985,816
|
Municipal Securities - 0.5% |
|
Beaver County Indl. Dev. Auth. Poll. Cont. Rev. Bonds (FirstEnergy Nuclear Generation Corp. Proj.) Series 2005 A, 3.375%, tender 7/1/15 (h) | | 1,200,000 | | 1,238,808 |
California Gen. Oblig.: | | | | |
7.5% 4/1/34 | | 5,055,000 | | 6,314,908 |
7.55% 4/1/39 | | 940,000 | | 1,208,765 |
7.6% 11/1/40 | | 2,640,000 | | 3,432,845 |
7.625% 3/1/40 | | 1,420,000 | | 1,835,833 |
Illinois Gen. Oblig.: | | | | |
Series 2010, 4.421% 1/1/15 | | 2,850,000 | | 2,996,120 |
Series 2010-3: | | | | |
6.725% 4/1/35 | | 1,255,000 | | 1,376,873 |
7.35% 7/1/35 | | 1,015,000 | | 1,179,552 |
Series 2011, 5.877% 3/1/19 | | 895,000 | | 992,466 |
TOTAL MUNICIPAL SECURITIES (Cost $19,766,735) |
20,576,170
|
Foreign Government and Government Agency Obligations - 0.1% |
|
Russian Federation: | | | | |
4.5% 4/4/22 (c) | | 1,800,000 | | 1,887,840 |
5.625% 4/4/42 (c) | | 2,800,000 | | 2,992,640 |
TOTAL FOREIGN GOVERNMENT AND GOVERNMENT AGENCY OBLIGATIONS (Cost $4,518,470) |
4,880,480
|
Money Market Funds - 14.7% |
| Shares | | Value |
Fidelity Cash Central Fund,
0.17% (a)
(Cost $615,539,586) | 615,539,586 | | $ 615,539,586 |
TOTAL INVESTMENT PORTFOLIO - 123.4% (Cost $4,983,602,957) | | 5,154,361,437 |
NET OTHER ASSETS (LIABILITIES) - (23.4)% | | (976,743,034) |
NET ASSETS - 100% | $ 4,177,618,403 |
TBA Sale Commitments |
| Principal Amount | | |
Fannie Mae |
3.5% 7/1/42 | $ (800,000) | | (840,992) |
3.5% 7/1/42 | (45,400,000) | | (47,726,273) |
3.5% 7/1/42 | (28,000,000) | | (29,434,706) |
4% 7/1/42 | (3,400,000) | | (3,619,000) |
4% 7/1/42 | (14,000,000) | | (14,901,764) |
4% 7/1/42 | (14,000,000) | | (14,901,764) |
4% 7/1/42 | (2,000,000) | | (2,128,823) |
4% 7/1/42 | (12,000,000) | | (12,772,940) |
4% 7/1/42 | (49,000,000) | | (52,156,173) |
4% 7/1/42 | (49,000,000) | | (52,156,173) |
4% 7/1/42 | (1,000,000) | | (1,064,412) |
4% 7/1/42 | (6,000,000) | | (6,386,470) |
4% 7/1/42 | (15,000,000) | | (15,966,176) |
4% 7/1/42 | (15,000,000) | | (15,966,176) |
4.5% 7/1/42 | (4,300,000) | | (4,613,630) |
4.5% 7/1/42 | (38,000,000) | | (40,771,617) |
4.5% 7/1/42 | (29,200,000) | | (31,329,769) |
4.5% 7/1/42 | (7,400,000) | | (7,939,736) |
4.5% 7/1/42 | (37,700,000) | | (40,449,736) |
4.5% 7/1/42 | (9,600,000) | | (10,300,198) |
5% 7/1/42 | (1,400,000) | | (1,515,320) |
5% 7/1/42 | (1,400,000) | | (1,515,320) |
5.5% 7/1/42 | (23,000,000) | | (25,086,530) |
5.5% 7/1/42 | (28,000,000) | | (30,540,124) |
5.5% 7/1/42 | (28,000,000) | | (30,540,124) |
6% 7/1/42 | (2,000,000) | | (2,197,984) |
TOTAL FANNIE MAE | | (496,821,930) |
Freddie Mac |
4% 7/1/42 | (3,000,000) | | (3,184,094) |
TOTAL TBA SALE COMMITMENTS (Proceeds $499,897,223) | $ (500,006,024) |
Swap Agreements |
| Expiration Date | | Notional Amount | | Value |
Credit Default Swaps |
Receive monthly a fixed rate of .15% multiplied by the notional amount and pay to Credit Suisse First Boston upon each credit event of one of the issues of ABX AA 07-01 Index, par value of the proportional notional amount (Rating-C) (Upfront Premium Received/(Paid) $360,000)(g) | Sept. 2037 | | $ 1,209,000 | | $ (1,144,080) |
Receive monthly a fixed rate of .15% multiplied by the notional amount and pay to Credit Suisse First Boston upon each credit event of one of the issues of ABX AA 07-01 Index, par value of the proportional notional amount (Rating-C) (Upfront Premium Received/(Paid) $598,000)(g) | Sept. 2037 | | 1,047,800 | | (991,536) |
Receive monthly a fixed rate of .15% multiplied by the notional amount and pay to JPMorgan Chase, Inc. upon each credit event of one of the issues of ABX AA 07-01 Index, par value of the proportional notional amount (Rating-C) (Upfront Premium Received/(Paid) $348,750)(g) | Sept. 2037 | | 604,500 | | (572,040) |
Receive monthly a fixed rate of .15% multiplied by the notional amount and pay to JPMorgan Chase, Inc. upon each credit event of one of the issues of ABX AA 07-01 Index, par value of the proportional notional amount (Rating-C) (Upfront Premium Received/(Paid) $701,375)(g) | Sept. 2037 | | 1,249,300 | | (1,182,216) |
Receive monthly a fixed rate of .15% multiplied by the notional amount and pay to UBS upon each credit event of one of the issues of ABX AA 07-1 Index, par value of the proportional notional amount (Rating-C) (Upfront Premium Received/(Paid) $572,000)(g) | Sept. 2037 | | 1,773,200 | | (1,677,985) |
|
| Expiration Date | | Notional Amount | | Value |
Credit Default Swaps |
Receive monthly a fixed rate of .15% multiplied by the notional amount and pay to UBS upon each credit event of one of the issues of ABX AA 07-1 Index, par value of the proportional notional amount (Rating-C) (Upfront Premium Received/(Paid) $214,000)(g) | Sept. 2037 | | $ 644,800 | | $ (610,176) |
Receive monthly a fixed rate of .15% multiplied by the notional amount and pay to UBS upon each credit event of one of the issues of ABX AA 07-1 Index, par value of the proportional notional amount (Rating-C) (Upfront Premium Received/(Paid) $1,023,500)(g) | Sept. 2037 | | 1,853,800 | | (1,754,258) |
Receive monthly notional amount multiplied by 1.545% and pay UBS upon credit event of Morgan Stanley ABS Capital I, Inc., par value of the notional amount of Morgan Stanley ABS Capital I, Inc. Series 2004-NC6 Class M3, 5.6413% 7/25/34 (Rating-Ca)(f) | August 2034 | | 80,198 | | (59,028) |
Receive monthly notional amount multiplied by 2.5% and pay Bank of America upon credit event of Ameriquest Mortgage Securities, Inc., par value of the notional amount of Ameriquest Mortgage Securities, Inc. Series 2004-R11 Class M9, 6.102% 11/25/34 (Rating-C)(f) | Dec. 2034 | | 225,354 | | (216,332) |
Receive monthly notional amount multiplied by 2.5% and pay Credit Suisse First Boston upon credit event of Ameriquest Mortgage Securities, Inc., par value of the notional amount of Ameriquest Mortgage Securities, Inc. Series 2004-R11 Class M9, 8.03% 11/25/34 (Rating-C)(f) | Dec. 2034 | | 391,480 | | (375,809) |
Swap Agreements - continued |
| Expiration Date | | Notional Amount | | Value |
Credit Default Swaps |
Receive monthly notional amount multiplied by 3.35% and pay Morgan Stanley, Inc. upon credit event of Morgan Stanley ABS Capital I, Inc., par value of the notional amount of Morgan Stanley ABS Capital I, Inc. Series 2004-HE7, Class B3, 9.01% 8/25/34 (Rating-C)(f) | Sept. 2034 | | $ 78,601 | | $ (66,707) |
| | $ 9,158,033 | | $ (8,650,167) |
Legend |
(a) Affiliated fund that is available only to investment companies and other accounts managed by Fidelity Investments. The rate quoted is the annualized seven-day yield of the fund at period end. A complete unaudited listing of the fund's holdings as of its most recent quarter end is available upon request. In addition, each Fidelity Central Fund's financial statements, which are not covered by the Fund's Report of Independent Registered Public Accounting Firm, are available on the SEC's website or upon request. |
(b) Non-income producing - Security is in default. |
(c) Security exempt from registration under Rule 144A of the Securities Act of 1933. These securities may be resold in transactions exempt from registration, normally to qualified institutional buyers. At the end of the period, the value of these securities amounted to $175,865,246 or 4.2% of net assets. |
(d) Security or a portion of the security purchased on a delayed delivery or when-issued basis. |
(e) Security or a portion of the security has been segregated as collateral for open swap agreements. At the period end, the value of securities pledged amounted to $11,510,252. |
(f) Represents a credit default swap contract in which the Fund has sold protection on the underlying reference entity. The value of each credit default swap and the credit rating can be measures of the current payment/performance risk. For the underlying reference entity, ratings disclosed are from Moody's Investors Service, Inc. Where Moody's ratings are not available, S&P ratings are disclosed and are indicated as such. All ratings are as of the report date and do not reflect subsequent changes. Where a credit rating is not disclosed, the value is used as the measure of the payment/performance risk. |
(g) Represents a credit default swap based on a tradable index of home equity asset-backed debt securities. The value of each credit default swap and the credit rating can be measures of the current payment/performance risk. In addition, the swap represents a contract in which the Fund has sold protection on the index of underlying securities. Ratings represent a weighted average of the ratings of all securities included in the index. Ratings used in the weighted average are from Moody's Investors Service, Inc., or S&P where Moody's ratings are not available. All ratings are as of the report date and do not reflect subsequent changes. |
(h) Coupon rates for floating and adjustable rate securities reflect the rates in effect at period end. |
(i) Security represents right to receive monthly interest payments on an underlying pool of mortgages or assets. Principal shown is the outstanding par amount of the pool as of the end of the period. |
(j) Coupon is inversely indexed to a floating interest rate multiplied by a specified factor. The price may be considerably more volatile than the price of a comparable fixed rate security. |
Affiliated Central Funds |
Information regarding fiscal year to date income earned by the Fund from investments in Fidelity Central Funds is as follows: |
Fund | Income earned |
Fidelity Cash Central Fund | $ 301,945 |
Other Information |
The following is a summary of the inputs used, as of June 30, 2012, involving the Fund's assets and liabilities carried at fair value. The inputs or methodology used for valuing securities may not be an indication of the risk associated with investing in those securities. For more information on valuation inputs, and their aggregation into the levels used in the tables below, please refer to the Security Valuation section in the accompanying Notes to Financial Statements. |
Valuation Inputs at Reporting Date: |
Description | Total | Level 1 | Level 2 | Level 3 |
Investments in Securities: | | | | |
Corporate Bonds | $ 939,637,026 | $ - | $ 939,637,026 | $ - |
U.S. Government and Government Agency Obligations | 1,113,613,363 | - | 1,113,613,363 | - |
U.S. Government Agency - Mortgage Securities | 2,151,693,919 | - | 2,151,693,919 | - |
Asset-Backed Securities | 68,896,768 | - | 64,688,711 | 4,208,057 |
Collateralized Mortgage Obligations | 20,538,309 | - | 20,368,353 | 169,956 |
Commercial Mortgage Securities | 218,985,816 | - | 207,781,541 | 11,204,275 |
Municipal Securities | 20,576,170 | - | 20,576,170 | - |
Foreign Government and Government Agency Obligations | 4,880,480 | - | 4,880,480 | - |
Money Market Funds | 615,539,586 | 615,539,586 | - | - |
Total Investments in Securities: | $ 5,154,361,437 | $ 615,539,586 | $ 4,523,239,563 | $ 15,582,288 |
Derivative Instruments: | | | | |
Liabilities | | | | |
Swap Agreements | $ (8,650,167) | $ - | $ (7,932,291) | $ (717,876) |
Other Financial Instruments: | | | | |
TBA Sale Commitments | $ (500,006,024) | $ - | $ (500,006,024) | $ - |
Value of Derivative Instruments |
The following table is a summary of the Fund's value of derivative instruments by risk exposure as of June 30, 2012. For additional information on derivative instruments, please refer to the Derivative Instruments section in the accompanying Notes to Financial Statements. |
Risk Exposure /
Derivative Type | Value |
| Asset | Liability |
Credit Risk | | |
Swap Agreements (a) | $ - | $ (8,650,167) |
Total Value of Derivatives | $ - | $ (8,650,167) |
(a) Value is disclosed on the Statement of Assets and Liabilities in the Swap agreements, at value line-items. |
See accompanying notes which are an integral part of the financial statements.
Not Part of Financial Report
Financial Statements
Statement of Assets and Liabilities
| June 30, 2012 |
Assets | | |
Investment in securities, at value - See accompanying schedule: Unaffiliated issuers (cost $4,368,063,371) | $ 4,538,821,851 | |
Fidelity Central Funds (cost $615,539,586) | 615,539,586 | |
Total Investments (cost $4,983,602,957) | | $ 5,154,361,437 |
Cash | | 6,885 |
Receivable for investments sold | | 120,775,556 |
Receivable for TBA sale commitments | | 499,897,223 |
Receivable for swap agreements | | 2,917 |
Interest receivable | | 25,867,748 |
Distributions receivable from Fidelity Central Funds | | 78,295 |
Other receivables | | 665,103 |
Total assets | | 5,801,655,164 |
| | |
Liabilities | | |
Payable for investments purchased
Regular delivery | $ 198,308,317 | |
Delayed delivery | 915,233,157 | |
TBA sale commitments, at value | 500,006,024 | |
Payable for swap agreements | 836,395 | |
Distributions payable | 316,859 | |
Swap agreements, at value | 8,650,167 | |
Other payables and accrued expenses | 685,842 | |
Total liabilities | | 1,624,036,761 |
| | |
Net Assets | | $ 4,177,618,403 |
Net Assets consist of: | | |
Paid in capital | | $ 3,954,971,640 |
Undistributed net investment income | | 6,910,226 |
Accumulated undistributed net realized gain (loss) on investments | | 53,427,994 |
Net unrealized appreciation (depreciation) on investments | | 162,308,543 |
Net Assets, for 38,167,344 shares outstanding | | $ 4,177,618,403 |
Net Asset Value, offering price and redemption price per share ($4,177,618,403 ÷ 38,167,344 shares) | | $ 109.46 |
Statement of Operations
| Six months ended June 30, 2012 |
Investment Income | | |
Interest | | $ 60,823,266 |
Income from Fidelity Central Funds | | 301,945 |
Total income | | 61,125,211 |
| | |
Expenses | | |
Custodian fees and expenses | $ 41,642 | |
Independent trustees' compensation | 6,893 | |
Total expenses before reductions | 48,535 | |
Expense reductions | (7,303) | 41,232 |
Net investment income (loss) | | 61,083,979 |
Realized and Unrealized Gain (Loss) Net realized gain (loss) on: | | |
Investment securities: | | |
Unaffiliated issuers | 56,865,937 | |
Swap agreements | (2,965,921) | |
Total net realized gain (loss) | | 53,900,016 |
Change in net unrealized appreciation (depreciation) on: Investment securities | 18,749,036 | |
Swap agreements | 2,795,911 | |
Delayed delivery commitments | 296,750 | |
Total change in net unrealized appreciation (depreciation) | | 21,841,697 |
Net gain (loss) | | 75,741,713 |
Net increase (decrease) in net assets resulting from operations | | $ 136,825,692 |
See accompanying notes which are an integral part of the financial statements.
Not Part of Financial Report
Financial Statements - continued
Statement of Changes in Net Assets
| Six months ended June 30,
2012 | Year ended
December 31,
2011 |
Increase (Decrease) in Net Assets | | |
Operations | | |
Net investment income (loss) | $ 61,083,979 | $ 135,041,339 |
Net realized gain (loss) | 53,900,016 | 63,822,458 |
Change in net unrealized appreciation (depreciation) | 21,841,697 | 91,803,992 |
Net increase (decrease) in net assets resulting from operations | 136,825,692 | 290,667,789 |
Distributions to shareholders from net investment income | (59,421,140) | (136,408,906) |
Distributions to shareholders from net realized gain | (9,822,616) | (65,864,264) |
Total distributions | (69,243,756) | (202,273,170) |
Share transactions
Proceeds from sales of shares | 261,915,030 | 60,206,818 |
Reinvestment of distributions | 69,262,734 | 201,937,333 |
Cost of shares redeemed | (11,522,413) | (318,248,685) |
Net increase (decrease) in net assets resulting from share transactions | 319,655,351 | (56,104,534) |
Total increase (decrease) in net assets | 387,237,287 | 32,290,085 |
| | |
Net Assets | | |
Beginning of period | 3,790,381,116 | 3,758,091,031 |
End of period (including undistributed net investment income of $6,910,226 and undistributed net investment income of $5,247,387, respectively) | $ 4,177,618,403 | $ 3,790,381,116 |
Other Information Shares | | |
Sold | 2,421,097 | 564,305 |
Issued in reinvestment of distributions | 637,994 | 1,888,265 |
Redeemed | (106,019) | (2,967,677) |
Net increase (decrease) | 2,953,072 | (515,107) |
Financial Highlights
| Six months ended June 30, | Years ended December 31, |
| 2012 | 2011 | 2010 | 2009 | 2008 | 2007 |
Selected Per-Share Data | | | | | | |
Net asset value, beginning of period | $ 107.64 | $ 105.18 | $ 104.52 | $ 94.78 | $ 102.50 | $ 103.02 |
Income from Investment Operations | | | | | | |
Net investment income (loss) D | 1.638 | 3.817 | 3.943 | 4.762 | 5.319 | 5.534 |
Net realized and unrealized gain (loss) | 2.044 | 4.385 | 4.424 | 9.818 | (7.583) | (.594) |
Total from investment operations | 3.682 | 8.202 | 8.367 | 14.580 | (2.264) | 4.940 |
Distributions from net investment income | (1.597) | (3.851) | (3.947) | (4.580) | (5.236) | (5.385) |
Distributions from net realized gain | (.265) | (1.891) | (3.760) | (.260) | (.220) | (.075) |
Total distributions | (1.862) | (5.742) | (7.707) | (4.840) | (5.456) | (5.460) |
Net asset value, end of period | $ 109.46 | $ 107.64 | $ 105.18 | $ 104.52 | $ 94.78 | $ 102.50 |
Total Return B,C | 3.45% | 7.96% | 8.12% | 15.71% | (2.29)% | 4.94% |
Ratios to Average Net Assets E,H | | | | | | |
Expenses before reductions G | -% A | -% | -% | -% | -% | -% |
Expenses net of fee waivers, if any G | -% A | -% | -% | -% | -% | -% |
Expenses net of all reductions G | -% A | -% | -% | -% | -% | -% |
Net investment income (loss) | 3.04% A | 3.57% | 3.65% | 4.75% | 5.35% | 5.42% |
Supplemental Data | | | | | | |
Net assets, end of period (000 omitted) | $ 4,177,618 | $ 3,790,381 | $ 3,758,091 | $ 3,957,226 | $ 3,162,861 | $ 3,587,807 |
Portfolio turnover rate F | 291% A | 302% | 230% | 141% | 140% | 137% |
A Annualized
B Total returns for periods of less than one year are not annualized.
C Total returns would have been lower if certain expenses had not been reduced during the applicable periods shown.
D Calculated based on average shares outstanding during the period.
E Fees and expenses of any underlying Fidelity Central Funds are not included in the Fund's expense ratio. The Fund indirectly bears its proportionate share of the expenses of any underlying Fidelity Central Funds.
F Amount does not include the portfolio activity of any underlying Fidelity Central Funds.
G Amount represents less than .01%.
H Expense ratios reflect operating expenses of the Fund. Expenses before reductions do not reflect amounts reimbursed by the investment adviser or reductions from expense offset arrangements and do not represent the amount paid by the Fund during periods when reimbursements or reductions occur. Expenses net of fee waivers reflect expenses after reimbursement by the investment adviser but prior to reductions from expense offset arrangements. Expenses net of all reductions represent the net expenses paid by the Fund.
See accompanying notes which are an integral part of the financial statements.
Not Part of Financial Report
Notes to Financial Statements
For the period ended June 30, 2012
1. Organization.
Fidelity® VIP Investment Grade Central Fund (the Fund) is a fund of Fidelity Garrison Street Trust (the Trust) and is authorized to issue an unlimited number of shares. The Trust is registered under the Investment Company Act of 1940, as amended (the 1940 Act), as an open-end management investment company organized as a Massachusetts business trust. Shares of the Fund are only offered to other investment companies and accounts managed by Fidelity Management & Research Company (FMR), or its affiliates (the Investing Funds).
2. Investments in Fidelity Central Funds.
The Fund invests in Fidelity Central Funds, which are open-end investment companies available only to other investment companies and accounts managed by FMR and its affiliates. The Fund's Schedule of Investments lists each of the Fidelity Central Funds held as of period end, if any, as an investment of the Fund, but do not include the underlying holdings of each Fidelity Central Fund. As an Investing Fund, the Fund indirectly bears its proportionate share of the expenses of the underlying Fidelity Central Funds.
The Money Market Central Funds seek preservation of capital and current income and are managed by Fidelity Investments Money Management, Inc. (FIMM), an affiliate of FMR.
A complete unaudited list of holdings for each Fidelity Central Fund is available upon request or at the Securities and Exchange Commission (the SEC) web site at www.sec.gov. In addition, the financial statements of the Fidelity Central Funds, which are not covered by the Fund's Report of Independent Registered Public Accounting Firm, are available on the SEC web site or upon request.
3. Significant Accounting Policies.
The financial statements have been prepared in conformity with accounting principles generally accepted in the United States of America (GAAP), which require management to make certain estimates and assumptions at the date of the financial statements. Actual results could differ from those estimates. Subsequent events, if any, through the date that the financial statements were issued have been evaluated in the preparation of the financial statements. The following summarizes the significant accounting policies of the Fund:
Security Valuation. Investments are valued as of 4:00 p.m. Eastern time on the last calendar day of the period. In accordance with valuation policies and procedures approved by the Board of Trustees (the Board), the Fund attempts to obtain prices from one or more third party pricing vendor or broker to value its investments. When current market prices, quotations or rates are not readily available or reliable, securities will be fair valued in good faith by the FMR Fair Value Committee (the Committee), in accordance with procedures adopted by the Board. Factors used in determining fair value vary by security type and may include market or security specific events, changes in interest rates and credit quality. The frequency with which these procedures are used cannot be predicted and they may be utilized to a significant extent. The Committee oversees the Fund's valuation policies and procedures and is responsible for approving and reporting to the Board all fair value determinations.
The Fund categorizes the inputs to valuation techniques used to value its investments into a disclosure hierarchy consisting of three levels as shown below:
Level 1 - quoted prices in active markets for identical investments
Level 2 - other significant observable inputs (including quoted prices for similar investments, interest rates, prepayment speeds, etc.)
Level 3 - unobservable inputs (including the Fund's own assumptions based on the best information available)
Valuation techniques used to value the Fund's investments by major category are as follows:
Debt securities, including restricted securities, are valued based on evaluated prices received from third party pricing vendors or from brokers who make markets in such securities. For corporate bonds, foreign government and government agency obligations, municipal securities and U.S. government and government agency obligations, pricing vendors utilize matrix pricing which considers yield or price of bonds of comparable quality, coupon, maturity and type as well as broker-supplied prices and are generally categorized as Level 2 in the hierarchy. For asset backed securities, collateralized mortgage obligations, commercial mortgage securities and U.S. government agency mortgage securities, pricing vendors utilize matrix pricing which considers prepayment speed assumptions, attributes of the collateral, yield or price of bonds of comparable quality, coupon, maturity and type as well as broker-supplied prices and, accordingly, such securities are generally categorized as Level 2 in the hierarchy. Brokers which make markets in asset backed securities, collateralized mortgage obligations and commercial mortgage securities may also consider such factors as the structure of the issue, cash flow assumptions, the value of underlying assets as well as any guarantees. Swaps are marked-to-market daily based on valuations from third party pricing vendors or broker-supplied valuations. Pricing vendors utilize matrix pricing which considers comparisons to interest rate curves, credit spread curves, default possibilities and recovery rates and, as a result, swaps are generally categorized as Level 2 in the hierarchy. When independent prices are unavailable or unreliable, debt securities and swaps may be valued utilizing pricing methodologies which consider similar factors that would be used by third party pricing vendors. These are generally categorized as Level 2 in the hierarchy but may be Level 3 depending on the circumstances.
Not Part of Financial Report
Notes to Financial Statements - continued
3. Significant Accounting Policies - continued
Security Valuation - continued
Investments in open-end mutual funds, including other Fidelity Central Funds, are valued at their closing net asset value each business day and are categorized as Level 1 in the hierarchy.
Changes in valuation techniques may result in transfers in or out of an assigned level within the disclosure hierarchy. The aggregate value of investments by input level, as of June 30, 2012 for the Fund's investments, is included at the end of the Fund's Schedule of Investments.
Investment Transactions and Income. For financial reporting purposes, the Fund's investment holdings and NAV include trades executed through the end of the last business day of the period. The NAV per share for processing shareholder transactions is calculated as of the close of business of the New York Stock Exchange (NYSE), normally 4:00 p.m. Eastern time and includes trades executed through the end of the prior business day. Gains and losses on securities sold are determined on the basis of identified cost. Interest income and distributions from other Fidelity Central Funds are accrued as earned. Interest income includes coupon interest and amortization of premium and accretion of discount on debt securities. The principal amount on inflation-indexed securities is periodically adjusted to the rate of inflation and interest is accrued based on the principal amount. The adjustments to principal due to inflation are reflected as increases or decreases to interest income even though principal is not received until maturity. Debt obligations may be placed on non-accrual status and related interest income may be reduced by ceasing current accruals and writing off interest receivables when the collection of all or a portion of interest has become doubtful based on consistently applied procedures. A debt obligation is removed from non-accrual status when the issuer resumes interest payments or when collectability of interest is reasonably assured.
Expenses. Expenses directly attributable to a fund are charged to that fund. Expenses attributable to more than one fund are allocated among the respective funds on the basis of relative net assets or other appropriate methods. Expense estimates are accrued in the period to which they relate and adjustments are made when actual amounts are known.
Income Tax Information and Distributions to Shareholders. Each year, the Fund intends to qualify as a regulated investment company under Subchapter M of the Internal Revenue Code, including distributing substantially all of its taxable income and realized gains. As a result, no provision for income taxes is required. The Fund files a U.S. federal tax return, in addition to state and local tax returns as required. A fund's federal income tax returns are subject to examination by the Internal Revenue Service (IRS) for a period of three fiscal years after they are filed. State and local tax returns may be subject to examination for an additional fiscal year depending on the jurisdiction.
Dividends are declared and recorded daily and paid monthly from net investment income. Distributions from realized gains, if any, are declared and recorded on the ex-dividend date. Income and capital gain distributions are determined in accordance with income tax regulations, which may differ from GAAP.
Capital accounts within the financial statements are adjusted for permanent book-tax differences. These adjustments have no impact on net assets or the results of operations. Temporary book-tax differences will reverse in a subsequent period.
Book-tax differences are primarily due to swap agreements, market discount, financing transactions and losses deferred due to wash sales.
The federal tax cost of investment securities and unrealized appreciation (depreciation) as of period end were as follows:
Gross unrealized appreciation | $ 205,312,474 |
Gross unrealized depreciation | (30,082,671) |
Net unrealized appreciation (depreciation) on securities and other investments | $ 175,229,803 |
| |
Tax cost | $ 4,979,131,634 |
New Accounting Pronouncement. In December 2011, the Financial Accounting Standards Board issued Accounting Standard Update No. 2011-11, Disclosures about Offsetting Assets and Liabilities. The update creates new disclosure requirements requiring entities to disclose both gross and net information for derivatives and other financial instruments that are either offset in the Statement of Assets and Liabilities or subject to an enforceable master netting arrangement or similar agreement. The disclosure requirements are effective for interim and annual reporting periods beginning on or after January 1, 2013. Management is currently evaluating the impact of the update's adoption on the Fund's financial statement disclosures.
Not Part of Financial Report
4. Operating Policies.
Delayed Delivery Transactions and When-Issued Securities. During the period, the Fund transacted in securities on a delayed delivery or when-issued basis. Payment and delivery may take place after the customary settlement period for that security. The price of the underlying securities and the date when the securities will be delivered and paid for are fixed at the time the transaction is negotiated. The securities purchased on a delayed delivery or when-issued basis are identified as such in the Fund's Schedule of Investments. The Fund may receive compensation for interest forgone in the purchase of a delayed delivery or when-issued security. With respect to purchase commitments, the Fund identifies securities as segregated in its records with a value at least equal to the amount of the commitment. Losses may arise due to changes in the value of the underlying securities or if the counterparty does not perform under the contract's terms, or if the issuer does not issue the securities due to political, economic, or other factors.
To-Be-Announced (TBA) Securities and Mortgage Dollar Rolls. During the period, the Fund transacted in TBA securities that involved buying or selling mortgage-backed securities (MBS) on a forward commitment basis. A TBA transaction typically does not designate the actual security to be delivered and only includes an approximate principal amount however; delivered securities must meet specified terms defined by industry guidelines, including issuer, rate and current principal amount outstanding on underlying mortgage pools. The Fund may enter into a TBA transaction with the intent to take possession of or deliver the underlying MBS, or the Fund may elect to extend the settlement by entering into either a mortgage or reverse mortgage dollar roll. Mortgage dollar rolls are transactions where a fund sells MBS and simultaneously agrees to repurchase MBS on a later date at a lower price and with the same counterparty. Reverse mortgage dollar rolls involve the purchase and simultaneous agreement to sell MBS on a later date at a lower price. Transactions in mortgage dollar rolls and reverse mortgage dollar rolls are accounted for as purchases and sales and may result in an increase to the Fund's portfolio turnover rate.
Purchases and sales of TBA securities involve risks similar to those discussed above for delayed delivery and when-issued securities. Also, if the counterparty in a mortgage dollar roll or a reverse mortgage dollar roll transaction files for bankruptcy or becomes insolvent, the Fund's right to repurchase or sell securities may be limited. Additionally, when a fund sells TBA securities without already owning or having the right to obtain the deliverable securities (an uncovered forward commitment to sell), it incurs a risk of loss because it could have to purchase the securities at a price that is higher than the price at which it sold them. A fund may be unable to purchase the deliverable securities if the corresponding market is illiquid.
TBA securities subject to a forward commitment to sell at period end are included at the end of the Fund's Schedule of Investments under the caption "TBA Sale Commitments." The proceeds and value of these commitments are reflected in the Fund's Statement of Assets and Liabilities.
Restricted Securities. The Fund may invest in securities that are subject to legal or contractual restrictions on resale. These securities generally may be resold in transactions exempt from registration or to the public if the securities are registered. Disposal of these securities may involve time-consuming negotiations and expense, and prompt sale at an acceptable price may be difficult. Information regarding restricted securities is included at the end of the Fund's Schedule of Investments.
5. Derivative Instruments.
Risk Exposures and the Use of Derivative Instruments. The Fund's investment objectives allow the Fund to enter into various types of derivative contracts, including swap agreements. Derivatives are investments whose value is derived from underlying assets, indices or reference rates and may be transacted on an exchange or over-the-counter (OTC). Derivatives may involve a future commitment to buy or sell a specified instrument based on specified terms, or to exchange future cash flows at periodic intervals based on a notional principal amount. The Fund used derivatives to increase returns, to gain exposure to certain types of assets and to manage exposure to certain risks as defined below. The success of any strategy involving derivatives depends on analysis of numerous economic factors, and if the strategies for investment do not work as intended, the Fund may not achieve its objectives.
The Fund's use of derivatives increased or decreased its exposure to the following risk:
Credit Risk | Credit risk relates to the ability of the issuer of a financial instrument to make further principal or interest payments on an obligation or commitment that it has to the Fund. |
The Fund is also exposed to additional risks from investing in derivatives, such as liquidity risk and counterparty credit risk. Liquidity risk is the risk that the Fund will be unable to close out the derivative in the open market in a timely manner. Counterparty credit risk is the risk that the counterparty will not be able to fulfill its obligation to the Fund. Derivative counterparty credit risk is managed through formal evaluation of the creditworthiness of all potential counterparties. On certain OTC derivatives such as and swap agreements, the Fund attempts to reduce its exposure to counterparty credit risk by entering into an International Swaps and Derivatives Association (ISDA) Master Agreement on a bilateral basis with each of its counterparties. The ISDA Master Agreement gives the Fund the right to terminate all transactions traded under such agreement if there is a certain deterioration in the credit quality of the counterparty. The ISDA Master Agreement gives each party the right, upon an event of default by the other party or a termination of the agreement, to close out all transactions traded under such agreement and to net amounts owed under each transaction to one net payable by one party to the other. To mitigate counterparty credit risk on OTC derivatives, the Fund receives collateral in the form of cash or securities once the Fund's net unrealized appreciation on outstanding derivative contracts under an ISDA Master Agreement exceeds certain applicable thresholds,
Not Part of Financial Report
Notes to Financial Statements - continued
5. Derivative Instruments - continued
Risk Exposures and the Use of Derivative Instruments - continued
subject to certain minimum transfer provisions. The collateral received is held in segregated accounts with the Fund's custodian bank in accordance with the collateral agreements entered into between the Fund, the counterparty and the Fund's custodian bank. The Fund could experience delays and costs in gaining access to the collateral even though it is held by the Fund's custodian bank. The Fund's maximum risk of loss from counterparty credit risk related to OTC derivatives is generally the aggregate unrealized appreciation and unpaid counterparty payments in excess of any collateral pledged by the counterparty to the Fund. The Fund may be required to pledge collateral for the benefit of the counterparties on OTC derivatives in an amount not less than each counterparty's unrealized appreciation on outstanding derivative contracts, subject to certain minimum transfer provisions, and any such pledged collateral is identified in the Schedule of Investments. Investing in derivatives may involve greater risks than investing in the underlying assets directly and, to varying degrees, involves risk of loss in excess of the initial investment, if any, collateral received and amounts recognized in the Statement of Assets and Liabilities.
Net Realized Gain (Loss) and Change in Net Unrealized Appreciation (Depreciation) on Derivatives. The table below, which reflects the impacts of derivatives on the financial performance of the Fund, summarizes the net realized gain (loss) and change in net unrealized appreciation (depreciation) for derivatives during the period as shown in the Statement of Operations.
Risk Exposure / Derivative Type | Net Realized
Gain (Loss) | Change in Net Unrealized
Appreciation (Depreciation) |
Credit Risk | | |
Swap Agreements | $ (3,277,695) | $ 3,079,357 |
Interest Rate Risk | | |
Swap Agreements | 311,774 | (283,446) |
Totals (a) | $ (2,965,921) | $ 2,795,911 |
(a) A summary of the value of derivatives by risk exposure as of period end, is included at the end of the Schedule of Investments and is representative of activity for the period.
Swap Agreements. A swap agreement (swap) is a contract between two parties to exchange future cash flows at periodic intervals based on a notional principal amount.
Details of swaps open at period end are included in the Schedule of Investments under the caption "Swap Agreements." Swaps are marked-to-market daily and changes in value are recorded as unrealized appreciation or (depreciation) and reflected in the Statement of Assets and Liabilities. Any upfront premiums paid or received upon entering a swap to compensate for differences between stated terms of the agreement and prevailing market conditions (e.g. credit spreads, interest rates or other factors) are recorded as realized gain or (loss) ratably over the term of the swap. Payments are exchanged at specified intervals, accrued daily commencing with the effective date of the contract and recorded as realized gain or (loss). Realized gain or (loss) is also recorded in the event of an early termination of a swap. The net realized gain (loss) and change in net unrealized appreciation (depreciation) on swaps during the period is included in the Statement of Operations.
Credit Default Swaps. Credit default swaps enable the Fund to buy or sell protection on a debt security or a basket of securities against a defined credit event. Under the terms of a credit default swap the buyer of protection (buyer) receives credit protection in exchange for making periodic payments to the seller of protection (seller) based on a fixed percentage applied to a notional principal amount. In return for these payments, the seller acts as a guarantor of the creditworthiness of a reference obligation. The Fund enters into credit default swaps as a seller to gain credit exposure to an issuer and/or as a buyer to provide a measure of protection against defaults of an issuer. The issuer may be either a single issuer or a "basket" of issuers. Periodic payments are made over the life of the contract provided that no credit event occurs.
For credit default swaps on most corporate and sovereign issuers, credit events include bankruptcy, failure to pay, obligation acceleration or repudiation/moratorium. For credit default swaps on corporate or sovereign issuers, the obligation that may be put to the seller is not limited to the specific reference obligation described in the Schedule of Investments. For credit default swaps on asset-backed securities, a credit event may be triggered by events such as failure to pay principal, maturity extension, rating downgrade or write-down. For credit default swaps on asset-backed securities, the reference obligation described represents the security that may be put to the seller.
As a seller, if an underlying credit event occurs, the Fund will either pay the buyer an amount equal to the notional amount of the swap and take delivery of the reference obligation or underlying securities comprising an index or pay a net settlement amount of cash equal to the notional amount of the swap less the recovery value of the reference obligation or underlying securities comprising an index.
As a buyer, if an underlying credit event occurs, the Fund will either receive from the seller an amount equal to the notional amount of the swap and deliver the reference obligation or underlying securities comprising an index or receive a net settlement amount of cash equal to the notional amount of the swap less the recovery value of the reference obligation or underlying securities comprising an index.
Not Part of Financial Report
5. Derivative Instruments - continued
Credit Default Swaps - continued
Typically, the value of each credit default swap and credit rating disclosed for each reference obligation in the Schedule of Investments, where the Fund is the seller, can be used as measures of the current payment/performance risk of the swap. As the value of the swap changes as a positive or negative percentage of the total notional amount, the payment/performance risk may decrease or increase, respectively. In addition to these measures, FMR monitors a variety of factors including cash flow assumptions, market activity and market sentiment as part of its ongoing process of assessing payment/performance risk.
The notional amount of credit default swaps is included in the Schedule of Investments and approximates the maximum potential amount of future payments that the Fund could be required to make if the Fund is the seller and a credit event were to occur. The total notional amount of all credit default swaps open at period end where the Fund is the sellers amounted to $9,158,033 representing 0.22% of net assets.
6. Purchases and Sales of Investments.
Purchases and sales of securities, other than short-term securities and U.S. government securities, aggregated $182,539,668 and $280,192,526, respectively.
7. Fees and Other Transactions with Affiliates.
Management Fee and Expense Contract. FIMM, an affiliate of FMR, provides the Fund with investment management services. The Fund does not pay any fees for these services. Pursuant to the Fund's management contract with FIMM, FMR pays FIMM a portion of the management fees it receives from the Investing Funds. In addition, under an expense contract, FMR also pays all other expenses of the Fund, excluding custody fees, the compensation of the independent Trustees, and certain exceptions such as interest expense.
8. Expense Reductions.
FMR has voluntarily agreed to reimburse a portion of the Fund's operating expenses. For the period, the reimbursement reduced the expenses by $6,893.
In addition, through arrangements with the Fund's custodian, credits realized as a result of uninvested cash balances were used to reduce the Fund's expenses. During the period, these credits reduced the Fund's custody expenses by $410.
9. Other.
The Fund's organizational documents provide former and current trustees and officers with a limited indemnification against liabilities arising in connection with the performance of their duties to the Fund. In the normal course of business, the Fund may also enter into contracts that provide general indemnifications. The Fund's maximum exposure under these arrangements is unknown as this would be dependent on future claims that may be made against the Fund. The risk of material loss from such claims is considered remote.
At the end of the period, mutual funds managed by FMR or an affiliate were the owners of record of all of the outstanding shares of the Fund according to the following schedule.
Fund | Ownership % |
VIP Asset Manager Portfolio | 11.2% |
VIP Asset Manager: Growth Portfolio | 0.8% |
VIP Balanced Portfolio | 10.9% |
VIP Investment Grade Bond Portfolio | 77.1% |
10. Credit Risk.
The Fund invests a portion of its assets in structured securities of issuers that hold mortgage securities, including securities backed by subprime mortgage loans. The value and related income of these securities is sensitive to changes in economic conditions, including delinquencies and/or defaults. Continuing shifts in the market's perception of credit quality on securities backed by subprime mortgage loans have resulted in increased volatility of market price and periods of illiquidity that have adversely impacted the valuation of certain issuers of the Fund.
Not Part of Financial Report
Report of Independent Registered Public Accounting Firm
To the Trustees of Fidelity Garrison Street Trust and Shareholders of Fidelity VIP Investment Grade Central Fund:
We have audited the accompanying statement of assets and liabilities of Fidelity VIP Investment Grade Central Fund (the Fund), a fund of Fidelity Garrison Street Trust, including the schedule of investments, as of June 30, 2012, and the related statement of operations for the six months then ended, the statement of changes in net assets for the six months ended June 30, 2012 and for the year ended December 31, 2011, and the financial highlights for the six months ended June 30, 2012 and for each of the five years in the period ended December 31, 2011. These financial statements and financial highlights are the responsibility of the Fund's management. Our responsibility is to express an opinion on these financial statements and financial highlights based on our audits.
We conducted our audits in accordance with the standards of the Public Company Accounting Oversight Board (United States). Those standards require that we plan and perform the audit to obtain reasonable assurance about whether the financial statements and financial highlights are free of material misstatement. The Fund is not required to have, nor were we engaged to perform, an audit of its internal control over financial reporting. Our audits included consideration of internal control over financial reporting as a basis for designing audit procedures that are appropriate in the circumstances, but not for the purpose of expressing an opinion on the effectiveness of the Fund's internal control over financial reporting. Accordingly, we express no such opinion. An audit also includes examining, on a test basis, evidence supporting the amounts and disclosures in the financial statements, assessing the accounting principles used and significant estimates made by management, as well as evaluating the overall financial statement presentation. Our procedures included confirmation of securities owned as of June 30, 2012, by correspondence with the custodians and brokers; where replies were not received from brokers, we performed other auditing procedures. We believe that our audits provide a reasonable basis for our opinion.
In our opinion, the financial statements and financial highlights referred to above present fairly, in all material respects, the financial position of Fidelity VIP Investment Grade Central Fund as of June 30, 2012, the results of its operations for the six months then ended, the changes in net assets for the six months ended June 30, 2012 and for the year ended December 31, 2011, and the financial highlights for the six months ended June 30, 2012 and for each of the five years in the period ended December 31, 2011, in conformity with accounting principles generally accepted in the United States of America.
/s/ Deloitte & Touche LLP
DELOITTE & TOUCHE LLP
Boston, Massachusetts
August 15, 2012
Not Part of Financial Report
Investment Adviser
Fidelity Management & Research Company
Boston, MA
Investment Sub-Adviser
Fidelity Investments Money Management, Inc.
Fidelity Management & Research (U.K.) Inc.
Fidelity Management & Research (Hong Kong) Limited
Fidelity Management & Research (Japan) Inc.
General Distributor
Fidelity Distributors Corporation
Smithfield, RI
Transfer and Service Agents
Fidelity Investments Institutional Operations Co., Inc.
Boston, MA
Fidelity Service Company, Inc.
Boston, MA
Custodian
The Bank of New York Mellon
New York, NY
VIPIGB-SANN-0812
1.705629.114
Fidelity® Variable Insurance Products:
Investor Freedom® Funds -
Income, 2005, 2010, 2015, 2020, 2025, 2030
Semiannual Report
June 30, 2012
(Fidelity Cover Art)
Contents
To view a fund's proxy voting guidelines and proxy voting record for the 12-month period ended June 30, visit http://www.fidelity.com/proxyvotingresults or visit the Securities and Exchange Commission's (SEC) web site at http://www.sec.gov. You may also call 1-877-208-0098 to request a free copy of the proxy voting guidelines.
Fidelity Variable Insurance Products are separate account options which are purchased through a variable insurance contract.
Standard & Poor's, S&P and S&P 500 are registered service marks of The McGraw-Hill Companies, Inc. and have been licensed for use by Fidelity Distributors Corporation.
Other third party marks appearing herein are the property of their respective owners.
All other marks appearing herein are registered or unregistered trademarks or service marks of FMR LLC or an affiliated company. © 2012 FMR LLC. All rights reserved.
This report and the financial statements contained herein are submitted for the general information of the shareholders of the funds. This report is not authorized for distribution to prospective investors in the funds unless preceded or accompanied by an effective prospectus.
A fund files its complete schedule of portfolio holdings with the SEC for the first and third quarters of each fiscal year on Form N-Q. Forms N-Q are available on the SEC's web site at http://www.sec.gov. A fund's Forms N-Q may be reviewed and copied at the SEC's Public Reference Room in Washington, DC. Information regarding the operation of the SEC's Public Reference Room may be obtained by calling 1-800-SEC-0330. For a complete list of a fund's portfolio holdings, view the most recent holdings listing, semiannual report, or annual report on Fidelity's web site at http://www.fidelity.com, http://www.advisor.fidelity.com, or http://401k.com, as applicable.
NOT FDIC INSURED • MAY LOSE VALUE • NO BANK GUARANTEE
Neither the funds nor Fidelity Distributors Corporation is a bank.
Semiannual Report
As a shareholder of a Fund, you incur two types of costs: (1) transaction costs, and (2) ongoing costs, including other Fund expenses. This Example is intended to help you understand your ongoing costs (in dollars) of investing in the Funds and to compare these costs with the ongoing costs of investing in other mutual funds.
The Example is based on an investment of $1,000 invested at the beginning of the period and held for the entire period (January 1, 2012 to June 30, 2012).
Actual Expenses
The first line of the accompanying table for each fund provides information about actual account values and actual expenses. You may use the information in this line, together with the amount you invested, to estimate the expenses that you paid over the period. Simply divide your account value by $1,000.00 (for example, an $8,600 account value divided by $1,000.00 = 8.6), then multiply the result by the number in the first line for a fund under the heading entitled "Expenses Paid During Period" to estimate the expenses you paid on your account during this period. The estimate of expenses does not include any fees or other expenses of any variable annuity or variable life insurance product. If they were, the estimate of expenses you paid during the period would be higher, and your ending account value would be lower. In addition, each Fund, as a shareholder in underlying Fidelity Funds, will indirectly bear its pro-rata share of the fees and expenses incurred by the underlying Fidelity Funds. These fees and expenses are not included in each Fund's annualized expense ratio used to calculate the expense estimates in the table below.
Hypothetical Example for Comparison Purposes
The second line of the accompanying table for each fund provides information about hypothetical account values and hypothetical expenses based on a fund's actual expense ratio and an assumed rate of return of 5% per year before expenses, which is not the Fund's actual return. The hypothetical account values and expenses may not be used to estimate the actual ending account balance or expenses you paid for the period. You may use this information to compare the ongoing costs of investing in the Fund and other funds. To do so, compare this 5% hypothetical example with the 5% hypothetical examples that appear in the shareholder reports of the other funds. The estimate of expenses does not include any fees or other expenses of any variable annuity or variable life insurance product. If they were, the estimate of expenses you paid during the period would be higher, and your ending account value would be lower. In addition, each Fund, as a shareholder in underlying Fidelity Funds, will indirectly bear its pro-rata share of the fees and expenses incurred by the underlying Fidelity Funds. These fees and expenses are not included in each Fund's annualized expense ratio used to calculate the expense estimates in the table below.
Please note that the expenses shown in the table are meant to highlight your ongoing costs only and do not reflect any transaction costs. Therefore, the second line of the table is useful in comparing ongoing costs only, and will not help you determine the relative total costs of owning different funds.
| Annualized
Expense Ratio | Beginning
Account Value
January 1, 2012 | Ending
Account Value
June 30, 2012 | Expenses Paid
During Period*
January 1, 2012
to June 30, 2012 |
VIP Investor Freedom Income | .00% | | | |
Actual | | $ 1,000.00 | $ 1,034.10 | $ .00 |
HypotheticalA | | $ 1,000.00 | $ 1,024.86 | $ .00 |
VIP Investor Freedom 2005 | .00% | | | |
Actual | | $ 1,000.00 | $ 1,048.30 | $ .00 |
HypotheticalA | | $ 1,000.00 | $ 1,024.86 | $ .00 |
VIP Investor Freedom 2010 | .00% | | | |
Actual | | $ 1,000.00 | $ 1,058.50 | $ .00 |
HypotheticalA | | $ 1,000.00 | $ 1,024.86 | $ .00 |
VIP Investor Freedom 2015 | .00% | | | |
Actual | | $ 1,000.00 | $ 1,059.00 | $ .00 |
HypotheticalA | | $ 1,000.00 | $ 1,024.86 | $ .00 |
VIP Investor Freedom 2020 | .00% | | | |
Actual | | $ 1,000.00 | $ 1,065.90 | $ .00 |
HypotheticalA | | $ 1,000.00 | $ 1,024.86 | $ .00 |
VIP Investor Freedom 2025 | .00% | | | |
Actual | | $ 1,000.00 | $ 1,073.10 | $ .00 |
HypotheticalA | | $ 1,000.00 | $ 1,024.86 | $ .00 |
VIP Investor Freedom 2030 | .00% | | | |
Actual | | $ 1,000.00 | $ 1,074.70 | $ .00 |
HypotheticalA | | $ 1,000.00 | $ 1,024.86 | $ .00 |
A 5% return per year before expenses
* Expenses are equal to each Fund's annualized expense ratio, multiplied by the average account value over the period, multiplied by 182/366 (to reflect the one-half year period). The fees and expenses of the underlying Fidelity Funds in which the Fund invests are not included in the Fund's annualized expense ratio.
Semiannual Report
VIP Investor Freedom Income Portfolio
Investment Changes (Unaudited)
Fund Holdings as of June 30, 2012 |
| % of fund's
net assets | % of fund's net assets
6 months ago |
Domestic Equity Funds | | |
VIP Contrafund Portfolio Investor Class | 2.6 | 2.4 |
VIP Equity-Income Portfolio Investor Class | 2.7 | 2.8 |
VIP Growth & Income Portfolio Investor Class | 3.1 | 2.8 |
VIP Growth Portfolio Investor Class | 2.6 | 2.7 |
VIP Mid Cap Portfolio Investor Class | 0.8 | 0.9 |
VIP Value Portfolio Investor Class | 2.0 | 2.4 |
VIP Value Strategies Portfolio Investor Class | 1.0 | 1.0 |
| 14.8 | 15.0 |
Developed International Equity Funds | | |
VIP Overseas Portfolio Investor Class R | 4.2 | 4.1 |
Emerging Markets Equity Funds | | |
VIP Emerging Markets Portfolio Investor Class R | 1.3 | 1.0 |
High Yield Bond Funds | | |
VIP High Income Portfolio Investor Class | 5.1 | 5.1 |
Investment Grade Bond Funds | | |
VIP Investment Grade Bond Portfolio Investor Class | 34.9 | 35.3 |
Short-Term Funds | | |
VIP Money Market Portfolio Investor Class | 39.7 | 39.5 |
Net Other Assets (Liabilities)* | 0.0 | 0.0 |
| 100.0 | 100.0 |
* Amount represents less than 0.1% |
Asset Allocation (% of fund's net assets) |
Current |
 | Domestic Equity Funds | 14.8% | |
 | Developed International Equity Funds | 4.2% | |
 | Emerging Markets Equity Funds | 1.3% | |
 | High Yield Bond Funds | 5.1% | |
 | Investment Grade Bond Funds | 34.9% | |
 | Short-Term Funds | 39.7% | |

Six months ago |
| Domestic Equity Funds | 15.0% | |
| Developed International Equity Funds | 4.1% | |
| Emerging Markets Equity Funds | 1.0% | |
| High Yield Bond Funds | 5.1% | |
| Investment Grade Bond Funds | 35.3% | |
| Short-Term Funds | 39.5% | |

Expected |
| Domestic Equity Funds | 14.6% | |
| Developed International Equity Funds | 4.2% | |
| Emerging Markets Equity Funds | 1.2% | |
| High Yield Bond Funds | 5.0% | |
| Investment Grade Bond Funds | 35.0% | |
| Short-Term Funds | 40.0% | |

The six months ago allocation is based on the fund's holdings as of December 31, 2011. The current allocation is based on the fund's holdings as of June 30, 2012. The expected allocation represents the fund's anticipated allocation at December 31, 2012. |
Semiannual Report
VIP Investor Freedom Income Portfolio
Investments June 30, 2012 (Unaudited)
Showing Percentage of Net Assets
Domestic Equity Funds - 14.8% |
| Shares | | Value |
Domestic Equity Funds - 14.8% |
VIP Contrafund Portfolio Investor Class | 34,866 | | $ 874,791 |
VIP Equity-Income Portfolio Investor Class | 47,754 | | 941,236 |
VIP Growth & Income Portfolio Investor Class | 76,541 | | 1,055,498 |
VIP Growth Portfolio Investor Class | 21,953 | | 893,068 |
VIP Mid Cap Portfolio Investor Class | 8,520 | | 263,962 |
VIP Value Portfolio Investor Class | 60,920 | | 703,016 |
VIP Value Strategies Portfolio Investor Class | 34,413 | | 337,591 |
TOTAL DOMESTIC EQUITY FUNDS (Cost $5,089,285) |
5,069,162
|
International Equity Funds - 5.5% |
| | | |
Developed International Equity Funds - 4.2% |
VIP Overseas Portfolio Investor Class R | 100,103 | | 1,451,494 |
Emerging Markets Equity Funds - 1.3% |
VIP Emerging Markets Portfolio Investor Class R | 54,535 | | 428,101 |
TOTAL INTERNATIONAL EQUITY FUNDS (Cost $1,833,714) |
1,879,595
|
Bond Funds - 40.0% |
| Shares | | Value |
High Yield Bond Funds - 5.1% |
VIP High Income Portfolio Investor Class | 299,839 | | $ 1,724,075 |
Investment Grade Bond Funds - 34.9% |
VIP Investment Grade Bond Portfolio Investor Class | 899,647 | | 11,929,322 |
TOTAL BOND FUNDS (Cost $13,066,155) |
13,653,397
|
Short-Term Funds - 39.7% |
| | | |
VIP Money Market Portfolio Investor Class
(Cost $13,565,730) | 13,565,730 | |
13,565,730
|
TOTAL INVESTMENT PORTFOLIO - 100.0% (Cost $33,554,884) | | 34,167,884 |
NET OTHER ASSETS (LIABILITIES) - 0.0% | | 43 |
NET ASSETS - 100% | $ 34,167,927 |
Other Information |
All investments are categorized as Level 1 under the Fair Value Hierarchy. The inputs or methodology used for valuing securities may not be an indication of the risk associated with investing in those securities. For more information on valuation inputs, please refer to the Security Valuation section in the accompanying Notes to Financial Statements. |
See accompanying notes which are an integral part of the financial statements.
Semiannual Report
VIP Investor Freedom Income Portfolio
Statement of Assets and Liabilities
| June 30, 2012 (Unaudited) |
| | |
Assets | | |
Investment in securities, at value (cost $33,554,884) - See accompanying schedule | | $ 34,167,884 |
Receivable for investments sold | | 219 |
Distributions receivable from underlying funds | | 42 |
Total assets | | 34,168,145 |
| | |
Liabilities | | |
Payable for fund shares redeemed | 218 | |
| | |
Net Assets | | $ 34,167,927 |
Net Assets consist of: | | |
Paid in capital | | $ 33,538,567 |
Undistributed net investment income | | 9,708 |
Accumulated undistributed net realized gain (loss) on investments | | 6,652 |
Net unrealized appreciation (depreciation) on investments | | 613,000 |
Net Assets, for 3,233,665 shares outstanding | | $ 34,167,927 |
Net Asset Value, offering price and redemption price per share ($34,167,927 ÷ 3,233,665 shares) | | $ 10.57 |
Statement of Operations
Six months ended June 30, 2012 (Unaudited) |
| | |
Investment Income | | |
Income distributions from underlying funds | | $ 9,708 |
| | |
Expenses | | |
Independent trustees' compensation | $ 55 | |
Total expenses before reductions | 55 | |
Expense reductions | (55) | 0 |
Net investment income (loss) | | 9,708 |
Realized and Unrealized Gain (Loss) Realized gain (loss) on sale of underlying fund shares | 51,281 | |
Capital gain distributions from underlying funds | 100,898 | |
Total net realized gain (loss) | | 152,179 |
Change in net unrealized appreciation (depreciation) on underlying funds | | 890,525 |
Net gain (loss) | | 1,042,704 |
Net increase (decrease) in net assets resulting from operations | | $ 1,052,412 |
See accompanying notes which are an integral part of the financial statements.
Semiannual Report
Statement of Changes in Net Assets
| Six months ended
June 30, 2012
(Unaudited) | Year ended
December 31,
2011 |
Increase (Decrease) in Net Assets | | |
Operations | | |
Net investment income (loss) | $ 9,708 | $ 548,973 |
Net realized gain (loss) | 152,179 | 403,713 |
Change in net unrealized appreciation (depreciation) | 890,525 | (484,167) |
Net increase (decrease) in net assets resulting from operations | 1,052,412 | 468,519 |
Distributions to shareholders from net investment income | - | (550,115) |
Distributions to shareholders from net realized gain | (241,738) | (205,638) |
Total distributions | (241,738) | (755,753) |
Share transactions
Proceeds from sales of shares | 4,852,527 | 7,091,329 |
Reinvestment of distributions | 241,738 | 755,753 |
Cost of shares redeemed | (2,284,426) | (9,479,057) |
Net increase (decrease) in net assets resulting from share transactions | 2,809,839 | (1,631,975) |
Total increase (decrease) in net assets | 3,620,513 | (1,919,209) |
| | |
Net Assets | | |
Beginning of period | 30,547,414 | 32,466,623 |
End of period (including undistributed net investment income of $9,708 and $0, respectively) | $ 34,167,927 | $ 30,547,414 |
Other Information Shares | | |
Sold | 462,972 | 672,452 |
Issued in reinvestment of distributions | 23,089 | 73,304 |
Redeemed | (217,433) | (901,357) |
Net increase (decrease) | 268,628 | (155,601) |
Financial Highlights
| Six months ended
June 30, 2012 | Years ended December 31, |
| (Unaudited) | 2011 | 2010 | 2009 | 2008 | 2007 |
Selected Per-Share Data | | | | | | |
Net asset value, beginning of period | $ 10.30 | $ 10.40 | $ 9.95 | $ 9.10 | $ 10.79 | $ 10.78 |
Income from Investment Operations | | | | | | |
Net investment income (loss) E | - J | .18 | .21 | .40 | .34 | .42 |
Net realized and unrealized gain (loss) | .35 | (.02) | .54 | .94 | (1.47) | .22 |
Total from investment operations | .35 | .16 | .75 | 1.34 | (1.13) | .64 |
Distributions from net investment income | - | (.19) | (.20) | (.33) | (.37) | (.58) |
Distributions from net realized gain | (.08) | (.07) | (.10) | (.16) | (.19) | (.06) |
Total distributions | (.08) | (.26) | (.30) | (.49) | (.56) | (.63) I |
Net asset value, end of period | $ 10.57 | $ 10.30 | $ 10.40 | $ 9.95 | $ 9.10 | $ 10.79 |
Total Return B, C, D | 3.41% | 1.54% | 7.50% | 14.85% | (10.55)% | 6.08% |
Ratios to Average Net Assets F, H | | | | | | |
Expenses before reductions G | -% A | -% | -% | -% | -% | -% |
Expenses net of fee waivers, if any | -% A | -% | -% | -% | -% | -% |
Expenses net of all reductions | -% A | -% | -% | -% | -% | -% |
Net investment income (loss) | .06% A | 1.74% | 2.00% | 4.12% | 3.33% | 3.90% |
Supplemental Data | | | | | | |
Net assets, end of period (000 omitted) | $ 34,168 | $ 30,547 | $ 32,467 | $ 25,374 | $ 17,272 | $ 20,090 |
Portfolio turnover rate | 21% A | 28% | 24% | 30% | 53% | 38% |
A Annualized
B Total returns for periods of less than one year are not annualized.
C Total returns do not reflect charges attributable to your insurance company's separate account. Inclusion of these charges would reduce the total returns shown.
D Total returns would have been lower if certain expenses had not been reduced during the applicable periods shown.
E Calculated based on average shares outstanding during the period.
F Amounts do not include the activity of the Underlying Funds.
G Amount represents less than .01%.
H Expense ratios reflect operating expenses of the Fund. Expenses before reductions do not reflect amounts reimbursed by the investment adviser or reductions from expense offset arrangements and do not represent the amount paid by the Fund during periods when reimbursements or reductions occur. Expenses net of fee waivers reflect expenses after reimbursement by the investment adviser but prior to reductions from expense offset arrangements. Expenses net of all reductions represent the net expenses paid by the Fund but do not include expenses of the investment companies in which the Fund invests.
I Total distributions of $.63 per share is comprised of distributions from net investment income of $.575 and distributions from net realized gain of $.055 per share.
J Amount represents less than $.01 per share.
See accompanying notes which are an integral part of the financial statements.
Semiannual Report
VIP Investor Freedom 2005 Portfolio
Investment Changes (Unaudited)
Fund Holdings as of June 30, 2012 |
| % of fund's
net assets | % of fund's net assets
6 months ago |
Domestic Equity Funds | | |
VIP Contrafund Portfolio Investor Class | 4.8 | 4.6 |
VIP Equity-Income Portfolio Investor Class | 5.1 | 5.5 |
VIP Growth & Income Portfolio Investor Class | 5.7 | 5.5 |
VIP Growth Portfolio Investor Class | 4.9 | 5.4 |
VIP Mid Cap Portfolio Investor Class | 1.5 | 1.9 |
VIP Value Portfolio Investor Class | 3.8 | 4.7 |
VIP Value Strategies Portfolio Investor Class | 1.8 | 1.9 |
| 27.6 | 29.5 |
Developed International Equity Funds | | |
VIP Overseas Portfolio Investor Class R | 7.8 | 7.9 |
Emerging Markets Equity Funds | | |
VIP Emerging Markets Portfolio Investor Class R | 2.3 | 2.0 |
High Yield Bond Funds | | |
VIP High Income Portfolio Investor Class | 5.0 | 5.1 |
Investment Grade Bond Funds | | |
VIP Investment Grade Bond Portfolio Investor Class | 29.5 | 30.5 |
Short-Term Funds | | |
VIP Money Market Portfolio Investor Class | 27.8 | 25.0 |
Net Other Assets (Liabilities)* | 0.0 | 0.0 |
| 100.0 | 100.0 |
* Amount represents less than 0.1% |
Asset Allocation (% of fund's net assets) |
Current |
| Domestic Equity Funds | 27.6% | |
| Developed International Equity Funds | 7.8% | |
| Emerging Markets Equity Funds | 2.3% | |
| High Yield Bond Funds | 5.0% | |
| Investment Grade Bond Funds | 29.5% | |
| Short-Term Funds | 27.8% | |

Six months ago |
| Domestic Equity Funds | 29.5% | |
| Developed International Equity Funds | 7.9% | |
| Emerging Markets Equity Funds | 2.0% | |
| High Yield Bond Funds | 5.1% | |
| Investment Grade Bond Funds | 30.5% | |
| Short-Term Funds | 25.0% | |

Expected |
| Domestic Equity Funds | 25.9% | |
| Developed International Equity Funds | 7.3% | |
| Emerging Markets Equity Funds | 2.1% | |
| High Yield Bond Funds | 5.0% | |
| Investment Grade Bond Funds | 29.5% | |
| Short-Term Funds | 30.2% | |

The fund invests according to an asset allocation strategy that becomes increasingly conservative over time. The six months ago allocation is based on the fund's holdings as of December 31, 2011. The current allocation is based on the fund's holdings as of June 30, 2012. The expected allocation represents the fund's anticipated allocation at December 31, 2012. |
Semiannual Report
VIP Investor Freedom 2005 Portfolio
Investments June 30, 2012 (Unaudited)
Showing Percentage of Net Assets
Domestic Equity Funds - 27.6% |
| Shares | | Value |
Domestic Equity Funds - 27.6% |
VIP Contrafund Portfolio Investor Class | 22,108 | | $ 554,683 |
VIP Equity-Income Portfolio Investor Class | 30,337 | | 597,934 |
VIP Growth & Income Portfolio Investor Class | 48,340 | | 666,611 |
VIP Growth Portfolio Investor Class | 13,969 | | 568,247 |
VIP Mid Cap Portfolio Investor Class | 5,509 | | 170,677 |
VIP Value Portfolio Investor Class | 38,963 | | 449,630 |
VIP Value Strategies Portfolio Investor Class | 21,813 | | 213,987 |
TOTAL DOMESTIC EQUITY FUNDS (Cost $3,533,269) |
3,221,769
|
International Equity Funds - 10.1% |
| | | |
Developed International Equity Funds - 7.8% |
VIP Overseas Portfolio Investor Class R | 62,702 | | 909,184 |
Emerging Markets Equity Funds - 2.3% |
VIP Emerging Markets Portfolio Investor Class R | 34,079 | | 267,522 |
TOTAL INTERNATIONAL EQUITY FUNDS (Cost $1,465,843) |
1,176,706
|
Bond Funds - 34.5% |
| Shares | | Value |
High Yield Bond Funds - 5.0% |
VIP High Income Portfolio Investor Class | 102,082 | | $ 586,973 |
Investment Grade Bond Funds - 29.5% |
VIP Investment Grade Bond Portfolio Investor Class | 259,846 | | 3,445,551 |
TOTAL BOND FUNDS (Cost $3,867,387) |
4,032,524
|
Short-Term Funds - 27.8% |
| | | |
VIP Money Market Portfolio Investor Class
(Cost $3,241,502) | 3,241,502 | |
3,241,502
|
TOTAL INVESTMENT PORTFOLIO - 100.0% (Cost $12,108,001) | | 11,672,501 |
NET OTHER ASSETS (LIABILITIES) - 0.0% | | 11 |
NET ASSETS - 100% | $ 11,672,512 |
Other Information |
All investments are categorized as Level 1 under the Fair Value Hierarchy. The inputs or methodology used for valuing securities may not be an indication of the risk associated with investing in those securities. For more information on valuation inputs, please refer to the Security Valuation section in the accompanying Notes to Financial Statements. |
See accompanying notes which are an integral part of the financial statements.
Semiannual Report
VIP Investor Freedom 2005 Portfolio
Statement of Assets and Liabilities
| June 30, 2012 (Unaudited) |
| | |
Assets | | |
Investment in securities, at value (cost $12,108,001) - See accompanying schedule | | $ 11,672,501 |
Receivable for investments sold | | 73 |
Distributions receivable from underlying funds | | 10 |
Total assets | | 11,672,584 |
| | |
Liabilities | | |
Payable to custodian bank | $ 3 | |
Payable for fund shares redeemed | 69 | |
Total liabilities | | 72 |
| | |
Net Assets | | $ 11,672,512 |
Net Assets consist of: | | |
Paid in capital | | $ 12,131,303 |
Undistributed net investment income | | 2,120 |
Accumulated undistributed net realized gain (loss) on investments | | (25,411) |
Net unrealized appreciation (depreciation) on investments | | (435,500) |
Net Assets, for 1,167,899 shares outstanding | | $ 11,672,512 |
Net Asset Value, offering price and redemption price per share ($11,672,512 ÷ 1,167,899 shares) | | $ 9.99 |
Statement of Operations
Six months ended June 30, 2012 (Unaudited) |
| | |
Investment Income | | |
Income distributions from underlying funds | | $ 2,120 |
| | |
Expenses | | |
Independent trustees' compensation | $ 17 | |
Total expenses before reductions | 17 | |
Expense reductions | (17) | 0 |
Net investment income (loss) | | 2,120 |
Realized and Unrealized Gain (Loss) Realized gain (loss) on sale of underlying fund shares | 31,504 | |
Capital gain distributions from underlying funds | 35,004 | |
Total net realized gain (loss) | | 66,508 |
Change in net unrealized appreciation (depreciation) on underlying funds | | 436,239 |
Net gain (loss) | | 502,747 |
Net increase (decrease) in net assets resulting from operations | | $ 504,867 |
See accompanying notes which are an integral part of the financial statements.
Semiannual Report
Statement of Changes in Net Assets
| Six months ended
June 30, 2012
(Unaudited) | Year ended
December 31,
2011 |
Increase (Decrease) in Net Assets | | |
Operations | | |
Net investment income (loss) | $ 2,120 | $ 183,463 |
Net realized gain (loss) | 66,508 | 123,164 |
Change in net unrealized appreciation (depreciation) | 436,239 | (349,244) |
Net increase (decrease) in net assets resulting from operations | 504,867 | (42,617) |
Distributions to shareholders from net investment income | - | (183,967) |
Distributions to shareholders from net realized gain | (74,003) | (68,154) |
Total distributions | (74,003) | (252,121) |
Share transactions
Proceeds from sales of shares | 3,319,066 | 3,799,880 |
Reinvestment of distributions | 74,003 | 252,121 |
Cost of shares redeemed | (1,928,538) | (4,417,905) |
Net increase (decrease) in net assets resulting from share transactions | 1,464,531 | (365,904) |
Total increase (decrease) in net assets | 1,895,395 | (660,642) |
| | |
Net Assets | | |
Beginning of period | 9,777,117 | 10,437,759 |
End of period (including undistributed net investment income of $2,120 and $0, respectively) | $ 11,672,512 | $ 9,777,117 |
Other Information Shares | | |
Sold | 335,744 | 376,243 |
Issued in reinvestment of distributions | 7,468 | 26,165 |
Redeemed | (193,769) | (444,069) |
Net increase (decrease) | 149,443 | (41,661) |
Financial Highlights
| Six months ended
June 30, 2012 | Years ended December 31, |
| (Unaudited) | 2011 | 2010 | 2009 | 2008 | 2007 |
Selected Per-Share Data | | | | | | |
Net asset value, beginning of period | $ 9.60 | $ 9.85 | $ 9.21 | $ 7.91 | $ 11.53 | $ 11.17 |
Income from Investment Operations | | | | | | |
Net investment income (loss) E | - I | .17 | .18 | .35 | .32 | .35 |
Net realized and unrealized gain (loss) | .46 | (.17) | .87 | 1.41 | (3.00) | .59 |
Total from investment operations | .46 | - I | 1.05 | 1.76 | (2.68) | .94 |
Distributions from net investment income | - | (.19) | (.19) | (.33) | (.30) | (.46) |
Distributions from net realized gain | (.07) | (.07) | (.22) | (.14) | (.64) | (.12) |
Total distributions | (.07) | (.25) K | (.41) | (.46) J | (.94) | (.58) |
Net asset value, end of period | $ 9.99 | $ 9.60 | $ 9.85 | $ 9.21 | $ 7.91 | $ 11.53 |
Total Return B, C, D | 4.83% | .02% | 11.41% | 22.71% | (23.91)% | 8.55% |
Ratios to Average Net Assets F, H | | | | | | |
Expenses before reductions G | -% A | -% | -% | -% | -% | -% |
Expenses net of fee waivers, if any | -% A | -% | -% | -% | -% | -% |
Expenses net of all reductions | -% A | -% | -% | -% | -% | -% |
Net investment income (loss) | .04% A | 1.72% | 1.90% | 4.12% | 3.19% | 3.02% |
Supplemental Data | | | | | | |
Net assets, end of period (000 omitted) | $ 11,673 | $ 9,777 | $ 10,438 | $ 9,398 | $ 7,038 | $ 8,568 |
Portfolio turnover rate | 51% A | 45% | 63% | 47% | 40% | 53% |
A Annualized
B Total returns for periods of less than one year are not annualized.
C Total returns do not reflect charges attributable to your insurance company's separate account. Inclusion of these charges would reduce the total returns shown.
D Total returns would have been lower if certain expenses had not been reduced during the applicable periods shown.
E Calculated based on average shares outstanding during the period.
F Amounts do not include the activity of the Underlying Funds.
G Amount represents less than .01%.
H Expense ratios reflect operating expenses of the Fund. Expenses before reductions do not reflect amounts reimbursed by the investment adviser or reductions from expense offset arrangements and do not represent the amount paid by the Fund during periods when reimbursements or reductions occur. Expenses net of fee waivers reflect expenses after reimbursement by the investment adviser but prior to reductions from expense offset arrangements. Expenses net of all reductions represent the net expenses paid by the Fund but do not include expenses of the investment companies in which the Fund invests.
I Amount represents less than $.01 per share.
J Total distributions of $.46 per share is comprised of distributions from net investment income of $.325 and distributions from net realized gain of $.135 per share.
K Total distributions of $.25 per share is comprised of distributions from net investment income of $.185 and distributions from net realized gain of $.067 per share.
See accompanying notes which are an integral part of the financial statements.
Semiannual Report
VIP Investor Freedom 2010 Portfolio
Investment Changes (Unaudited)
Fund Holdings as of June 30, 2012 |
| % of fund's
net assets | % of fund's net assets
6 months ago |
Domestic Equity Funds | | |
VIP Contrafund Portfolio Investor Class | 6.2 | 5.7 |
VIP Equity-Income Portfolio Investor Class | 6.7 | 6.9 |
VIP Growth & Income Portfolio Investor Class | 7.5 | 6.9 |
VIP Growth Portfolio Investor Class | 6.3 | 6.7 |
VIP Mid Cap Portfolio Investor Class | 1.9 | 2.3 |
VIP Value Portfolio Investor Class | 5.0 | 5.9 |
VIP Value Strategies Portfolio Investor Class | 2.4 | 2.4 |
| 36.0 | 36.8 |
Developed International Equity Funds | | |
VIP Overseas Portfolio Investor Class R | 10.2 | 9.8 |
Emerging Markets Equity Funds | | |
VIP Emerging Markets Portfolio Investor Class R | 3.0 | 2.5 |
High Yield Bond Funds | | |
VIP High Income Portfolio Investor Class | 5.0 | 5.1 |
Investment Grade Bond Funds | | |
VIP Investment Grade Bond Portfolio Investor Class | 34.2 | 34.8 |
Short-Term Funds | | |
VIP Money Market Portfolio Investor Class | 11.6 | 11.0 |
Net Other Assets (Liabilities)* | 0.0 | 0.0 |
| 100.0 | 100.0 |
* Amount represent less than 0.1% |
Asset Allocation (% of fund's net assets) |
Current |
| Domestic Equity Funds | 36.0% | |
| Developed International Equity Funds | 10.2% | |
| Emerging Markets Equity Funds | 3.0% | |
| High Yield Bond Funds | 5.0% | |
| Investment Grade Bond Funds | 34.2% | |
| Short-Term Funds | 11.6% | |

Six months ago |
| Domestic Equity Funds | 36.8% | |
| Developed International Equity Funds | 9.8% | |
| Emerging Markets Equity Funds | 2.5% | |
| High Yield Bond Funds | 5.1% | |
| Investment Grade Bond Funds | 34.8% | |
| Short-Term Funds | 11.0% | |

Expected |
| Domestic Equity Funds | 35.3% | |
| Developed International Equity Funds | 9.9% | |
| Emerging Markets Equity Funds | 3.0% | |
| High Yield Bond Funds | 5.0% | |
| Investment Grade Bond Funds | 34.1% | |
| Short-Term Funds | 12.7% | |

The fund invests according to an asset allocation strategy that becomes increasingly conservative over time. The six months ago allocation is based on the fund's holdings as of December 31, 2011. The current allocation is based on the fund's holdings as of June 30, 2012. The expected allocation represents the fund's anticipated allocation at December 31, 2012. |
Semiannual Report
VIP Investor Freedom 2010 Portfolio
Investments June 30, 2012 (Unaudited)
Showing Percentage of Net Assets
Domestic Equity Funds - 36.0% |
| Shares | | Value |
Domestic Equity Funds - 36.0% |
VIP Contrafund Portfolio Investor Class | 132,414 | | $ 3,322,259 |
VIP Equity-Income Portfolio Investor Class | 180,939 | | 3,566,303 |
VIP Growth & Income Portfolio Investor Class | 290,002 | | 3,999,132 |
VIP Growth Portfolio Investor Class | 83,328 | | 3,389,790 |
VIP Mid Cap Portfolio Investor Class | 32,478 | | 1,006,169 |
VIP Value Portfolio Investor Class | 231,135 | | 2,667,295 |
VIP Value Strategies Portfolio Investor Class | 130,387 | | 1,279,098 |
TOTAL DOMESTIC EQUITY FUNDS (Cost $21,839,162) |
19,230,046
|
International Equity Funds - 13.2% |
| | | |
Developed International Equity Funds - 10.2% |
VIP Overseas Portfolio Investor Class R | 374,071 | | 5,424,031 |
Emerging Markets Equity Funds - 3.0% |
VIP Emerging Markets Portfolio Investor Class R | 203,185 | | 1,594,999 |
TOTAL INTERNATIONAL EQUITY FUNDS (Cost $9,312,282) |
7,019,030
|
Bond Funds - 39.2% |
| Shares | | Value |
High Yield Bond Funds - 5.0% |
VIP High Income Portfolio Investor Class | 466,027 | | $ 2,679,656 |
Investment Grade Bond Funds - 34.2% |
VIP Investment Grade Bond Portfolio Investor Class | 1,374,857 | | 18,230,606 |
TOTAL BOND FUNDS (Cost $20,211,667) |
20,910,262
|
Short-Term Funds - 11.6% |
| | | |
VIP Money Market Portfolio Investor Class
(Cost $6,210,774) | 6,210,774 | |
6,210,774
|
TOTAL INVESTMENT PORTFOLIO - 100.0% (Cost $57,573,885) | | 53,370,112 |
NET OTHER ASSETS (LIABILITIES) - 0.0% | | 25 |
NET ASSETS - 100% | $ 53,370,137 |
Other Information |
All investments are categorized as Level 1 under the Fair Value Hierarchy. The inputs or methodology used for valuing securities may not be an indication of the risk associated with investing in those securities. For more information on valuation inputs, please refer to the Security Valuation section in the accompanying Notes to Financial Statements. |
See accompanying notes which are an integral part of the financial statements.
Semiannual Report
VIP Investor Freedom 2010 Portfolio
Statement of Assets and Liabilities
| June 30, 2012 (Unaudited) |
| | |
Assets | | |
Investment in securities, at value (cost $57,573,885) - See accompanying schedule | | $ 53,370,112 |
Cash | | 6 |
Receivable for fund shares sold | | 1,532 |
Distributions receivable from underlying funds | | 19 |
Total assets | | 53,371,669 |
| | |
Liabilities | | |
Payable for investments purchased | $ 1,495 | |
Payable for fund shares redeemed | 37 | |
Total liabilities | | 1,532 |
| | |
Net Assets | | $ 53,370,137 |
Net Assets consist of: | | |
Paid in capital | | $ 57,705,970 |
Undistributed net investment income | | 5,639 |
Accumulated undistributed net realized gain (loss) on investments | | (137,699) |
Net unrealized appreciation (depreciation) on investments | | (4,203,773) |
Net Assets, for 5,179,395 shares outstanding | | $ 53,370,137 |
Net Asset Value, offering price and redemption price per share ($53,370,137 ÷ 5,179,395 shares) | | $ 10.30 |
Statement of Operations
Six months ended June 30, 2012 (Unaudited) |
| | |
Investment Income | | |
Income distributions from underlying funds | | $ 5,639 |
| | |
Expenses | | |
Independent trustees' compensation | $ 93 | |
Total expenses before reductions | 93 | |
Expense reductions | (93) | 0 |
Net investment income (loss) | | 5,639 |
Realized and Unrealized Gain (Loss) Realized gain (loss) on sale of underlying fund shares | 48,664 | |
Capital gain distributions from underlying funds | 218,957 | |
Total net realized gain (loss) | | 267,621 |
Change in net unrealized appreciation (depreciation) on underlying funds | | 2,712,667 |
Net gain (loss) | | 2,980,288 |
Net increase (decrease) in net assets resulting from operations | | $ 2,985,927 |
See accompanying notes which are an integral part of the financial statements.
Semiannual Report
Statement of Changes in Net Assets
| Six months ended
June 30, 2012
(Unaudited) | Year ended
December 31,
2011 |
Increase (Decrease) in Net Assets | | |
Operations | | |
Net investment income (loss) | $ 5,639 | $ 1,091,211 |
Net realized gain (loss) | 267,621 | 524,631 |
Change in net unrealized appreciation (depreciation) | 2,712,667 | (1,749,000) |
Net increase (decrease) in net assets resulting from operations | 2,985,927 | (133,158) |
Distributions to shareholders from net investment income | - | (1,094,476) |
Distributions to shareholders from net realized gain | (214,919) | (209,689) |
Total distributions | (214,919) | (1,304,165) |
Share transactions
Proceeds from sales of shares | 3,247,575 | 8,154,981 |
Reinvestment of distributions | 214,919 | 1,304,165 |
Cost of shares redeemed | (4,030,233) | (11,446,369) |
Net increase (decrease) in net assets resulting from share transactions | (567,739) | (1,987,223) |
Total increase (decrease) in net assets | 2,203,269 | (3,424,546) |
| | |
Net Assets | | |
Beginning of period | 51,166,868 | 54,591,414 |
End of period (including undistributed net investment income of $5,639 and $0, respectively) | $ 53,370,137 | $ 51,166,868 |
Other Information Shares | | |
Sold | 317,434 | 803,730 |
Issued in reinvestment of distributions | 21,050 | 133,350 |
Redeemed | (393,607) | (1,129,252) |
Net increase (decrease) | (55,123) | (192,172) |
Financial Highlights
| Six months ended
June 30, 2012 | Years ended December 31, |
| (Unaudited) | 2011 | 2010 | 2009 | 2008 | 2007 |
Selected Per-Share Data | | | | | | |
Net asset value, beginning of period | $ 9.77 | $ 10.06 | $ 9.14 | $ 7.77 | $ 11.56 | $ 11.19 |
Income from Investment Operations | | | | | | |
Net investment income (loss) E | - J | .21 | .21 | .35 | .30 | .33 |
Net realized and unrealized gain (loss) | .57 | (.24) | .97 | 1.49 | (3.12) | .62 |
Total from investment operations | .57 | (.03) | 1.18 | 1.84 | (2.82) | .95 |
Distributions from net investment income | - | (.21) | (.21) | (.35) | (.33) | (.44) |
Distributions from net realized gain | (.04) | (.04) | (.05) | (.12) | (.64) | (.14) |
Total distributions | (.04) | (.26) I | (.26) | (.47) | (.97) | (.58) |
Net asset value, end of period | $ 10.30 | $ 9.77 | $ 10.06 | $ 9.14 | $ 7.77 | $ 11.56 |
Total Return B, C, D | 5.85% | (.35)% | 12.88% | 24.09% | (24.99)% | 8.63% |
Ratios to Average Net Assets F, H | | | | | | |
Expenses before reductions G | -% A | -% | -% | -% | -% | -% |
Expenses net of fee waivers, if any | -% A | -% | -% | -% | -% | -% |
Expenses net of all reductions | -% A | -% | -% | -% | -% | -% |
Net investment income (loss) | .02% A | 2.02% | 2.20% | 4.18% | 3.01% | 2.90% |
Supplemental Data | | | | | | |
Net assets, end of period (000 omitted) | $ 53,370 | $ 51,167 | $ 54,591 | $ 47,671 | $ 41,205 | $ 57,197 |
Portfolio turnover rate | 25% A | 24% | 31% | 28% | 40% | 14% |
A Annualized
B Total returns for periods of less than one year are not annualized.
C Total returns do not reflect charges attributable to your insurance company's separate account. Inclusion of these charges would reduce the total returns shown.
D Total returns would have been lower if certain expenses had not been reduced during the applicable periods shown.
E Calculated based on average shares outstanding during the period.
F Amounts do not include the activity of the Underlying Funds.
G Amount represents less than .01%.
H Expense ratios reflect operating expenses of the Fund. Expenses before reductions do not reflect amounts reimbursed by the investment adviser or reductions from expense offset arrangements and do not represent the amount paid by the Fund during periods when reimbursements or reductions occur. Expenses net of fee waivers reflect expenses after reimbursement by the investment adviser but prior to reductions from expense offset arrangements. Expenses net of all reductions represent the net expenses paid by the Fund but do not include expenses of the investment companies in which the Fund invests.
I Total distributions of $.26 per share is comprised of distributions from net investment income of $.214 and distributions from net realized gain of $.041 per share.
J Amount represents less than $.01 per share.
See accompanying notes which are an integral part of the financial statements.
Semiannual Report
VIP Investor Freedom 2015 Portfolio
Investment Changes (Unaudited)
Fund Holdings as of June 30, 2012 |
| % of fund's
net assets | % of fund's net assets
6 months ago |
Domestic Equity Funds | | |
VIP Contrafund Portfolio Investor Class | 6.4 | 5.9 |
VIP Equity-Income Portfolio Investor Class | 6.9 | 7.0 |
VIP Growth & Income Portfolio Investor Class | 7.8 | 7.1 |
VIP Growth Portfolio Investor Class | 6.5 | 6.8 |
VIP Mid Cap Portfolio Investor Class | 1.9 | 2.4 |
VIP Value Portfolio Investor Class | 5.1 | 6.1 |
VIP Value Strategies Portfolio Investor Class | 2.5 | 2.5 |
| 37.1 | 37.8 |
Developed International Equity Funds | | |
VIP Overseas Portfolio Investor Class R | 10.5 | 10.1 |
Emerging Markets Equity Funds | | |
VIP Emerging Markets Portfolio Investor Class R | 3.1 | 2.6 |
High Yield Bond Funds | | |
VIP High Income Portfolio Investor Class | 5.0 | 5.1 |
Investment Grade Bond Funds | | |
VIP Investment Grade Bond Portfolio Investor Class | 34.6 | 34.9 |
Short-Term Funds | | |
VIP Money Market Portfolio Investor Class | 9.7 | 9.5 |
Net Other Assets (Liabilities)* | 0.0 | 0.0 |
| 100.0 | 100.0 |
* Amount represents less than 0.1% |
Asset Allocation (% of fund's net assets) |
Current |
| Domestic Equity Funds | 37.1% | |
| Developed International Equity Funds | 10.5% | |
| Emerging Markets Equity Funds | 3.1% | |
| High Yield Bond Funds | 5.0% | |
| Investment Grade Bond Funds | 34.6% | |
| Short-Term Funds | 9.7% | |

Six months ago |
| Domestic Equity Funds | 37.8% | |
| Developed International Equity Funds | 10.1% | |
| Emerging Markets Equity Funds | 2.6% | |
| High Yield Bond Funds | 5.1% | |
| Investment Grade Bond Funds | 34.9% | |
| Short-Term Funds | 9.5% | |

Expected |
| Domestic Equity Funds | 36.7% | |
| Developed International Equity Funds | 10.3% | |
| Emerging Markets Equity Funds | 3.1% | |
| High Yield Bond Funds | 5.0% | |
| Investment Grade Bond Funds | 35.0% | |
| Short-Term Funds | 9.9% | |

The fund invests according to an asset allocation strategy that becomes increasingly conservative over time. The six months ago allocation is based on the fund's holdings as of December 31, 2011. The current allocation is based on the fund's holdings as of June 30, 2012. The expected allocation represents the fund's anticipated allocation at December 31, 2012. |
Semiannual Report
VIP Investor Freedom 2015 Portfolio
Investments June 30, 2012 (Unaudited)
Showing Percentage of Net Assets
Domestic Equity Funds - 37.1% |
| Shares | | Value |
Domestic Equity Funds - 37.1% |
VIP Contrafund Portfolio Investor Class | 185,624 | | $ 4,657,303 |
VIP Equity-Income Portfolio Investor Class | 253,382 | | 4,994,151 |
VIP Growth & Income Portfolio Investor Class | 406,980 | | 5,612,251 |
VIP Growth Portfolio Investor Class | 116,495 | | 4,738,999 |
VIP Mid Cap Portfolio Investor Class | 45,154 | | 1,398,873 |
VIP Value Portfolio Investor Class | 321,866 | | 3,714,335 |
VIP Value Strategies Portfolio Investor Class | 182,144 | | 1,786,835 |
TOTAL DOMESTIC EQUITY FUNDS (Cost $29,464,114) |
26,902,747
|
International Equity Funds - 13.6% |
| | | |
Developed International Equity Funds - 10.5% |
VIP Overseas Portfolio Investor Class R | 523,298 | | 7,587,820 |
Emerging Markets Equity Funds - 3.1% |
VIP Emerging Markets Portfolio Investor Class R | 284,001 | | 2,229,411 |
TOTAL INTERNATIONAL EQUITY FUNDS (Cost $12,379,617) |
9,817,231
|
Bond Funds - 39.6% |
| Shares | | Value |
High Yield Bond Funds - 5.0% |
VIP High Income Portfolio Investor Class | 633,735 | | $ 3,643,978 |
Investment Grade Bond Funds - 34.6% |
VIP Investment Grade Bond Portfolio Investor Class | 1,889,010 | | 25,048,270 |
TOTAL BOND FUNDS (Cost $27,580,956) |
28,692,248
|
Short-Term Funds - 9.7% |
| | | |
VIP Money Market Portfolio Investor Class
(Cost $7,040,653) | 7,040,653 | |
7,040,653
|
TOTAL INVESTMENT PORTFOLIO - 100.0% (Cost $76,465,340) | | 72,452,879 |
NET OTHER ASSETS (LIABILITIES) - 0.0% | | 18 |
NET ASSETS - 100% | $ 72,452,897 |
Other Information |
All investments are categorized as Level 1 under the Fair Value Hierarchy. The inputs or methodology used for valuing securities may not be an indication of the risk associated with investing in those securities. For more information on valuation inputs, please refer to the Security Valuation section in the accompanying Notes to Financial Statements. |
See accompanying notes which are an integral part of the financial statements.
Semiannual Report
VIP Investor Freedom 2015 Portfolio
Statement of Assets and Liabilities
| June 30, 2012 (Unaudited) |
| | |
Assets | | |
Investment in securities, at value (cost $76,465,340) - See accompanying schedule | | $ 72,452,879 |
Receivable for fund shares sold | | 550 |
Distributions receivable from underlying funds | | 22 |
Total assets | | 72,453,451 |
| | |
Liabilities | | |
Payable to custodian bank | $ 2 | |
Payable for investments purchased | 507 | |
Payable for fund shares redeemed | 45 | |
Total liabilities | | 554 |
| | |
Net Assets | | $ 72,452,897 |
Net Assets consist of: | | |
Paid in capital | | $ 76,517,801 |
Undistributed net investment income | | 6,755 |
Accumulated undistributed net realized gain (loss) on investments | | (59,198) |
Net unrealized appreciation (depreciation) on investments | | (4,012,461) |
Net Assets, for 7,207,057 shares outstanding | | $ 72,452,897 |
Net Asset Value, offering price and redemption price per share ($72,452,897 ÷ 7,207,057 shares) | | $ 10.05 |
Statement of Operations
Six months ended June 30, 2012 (Unaudited) |
| | |
Investment Income | | |
Income distributions from underlying funds | | $ 6,755 |
| | |
Expenses | | |
Independent trustees' compensation | $ 123 | |
Total expenses before reductions | 123 | |
Expense Reductions | (123) | 0 |
Net investment income (loss) | | 6,755 |
Realized and Unrealized Gain (Loss) Realized gain (loss) on sale of underlying fund shares | 105,988 | |
Capital gain distributions from underlying funds | 295,154 | |
Total net realized gain (loss) | | 401,142 |
Change in net unrealized appreciation (depreciation) on underlying funds | | 3,622,525 |
Net gain (loss) | | 4,023,667 |
Net increase (decrease) in net assets resulting from operations | | $ 4,030,422 |
See accompanying notes which are an integral part of the financial statements.
Semiannual Report
Statement of Changes in Net Assets
| Six months ended
June 30, 2012
(Unaudited) | Year ended
December 31,
2011 |
Increase (Decrease) in Net Assets | | |
Operations | | |
Net investment income (loss) | $ 6,755 | $ 1,448,227 |
Net realized gain (loss) | 401,142 | 906,342 |
Change in net unrealized appreciation (depreciation) | 3,622,525 | (2,664,063) |
Net increase (decrease) in net assets resulting from operations | 4,030,422 | (309,494) |
Distributions to shareholders from net investment income | - | (1,453,209) |
Distributions to shareholders from net realized gain | (450,154) | (523,431) |
Total distributions | (450,154) | (1,976,640) |
Share transactions
Proceeds from sales of shares | 4,641,482 | 16,810,073 |
Reinvestment of distributions | 450,154 | 1,976,640 |
Cost of shares redeemed | (4,022,836) | (17,956,170) |
Net increase (decrease) in net assets resulting from share transactions | 1,068,800 | 830,543 |
Total increase (decrease) in net assets | 4,649,068 | (1,455,591) |
| | |
Net Assets | | |
Beginning of period | 67,803,829 | 69,259,420 |
End of period (including undistributed net investment income of $6,755 and $0, respectively) | $ 72,452,897 | $ 67,803,829 |
Other Information Shares | | |
Sold | 465,548 | 1,669,774 |
Issued in reinvestment of distributions | 45,196 | 206,978 |
Redeemed | (405,311) | (1,791,441) |
Net increase (decrease) | 105,433 | 85,311 |
Financial Highlights
| Six months ended
June 30, 2012 | Years ended December 31, |
| (Unaudited) | 2011 | 2010 | 2009 | 2008 | 2007 |
Selected Per-Share Data | | | | | | |
Net asset value, beginning of period | $ 9.55 | $ 9.87 | $ 9.11 | $ 7.69 | $ 11.86 | $ 11.40 |
Income from Investment Operations | | | | | | |
Net investment income (loss) E | - I | .21 | .21 | .34 | .30 | .33 |
Net realized and unrealized gain (loss) | .56 | (.24) | .97 | 1.58 | (3.41) | .71 |
Total from investment operations | .56 | (.03) | 1.18 | 1.92 | (3.11) | 1.04 |
Distributions from net investment income | - | (.21) | (.22) | (.34) | (.30) | (.42) |
Distributions from net realized gain | (.06) | (.08) | (.20) | (.16) | (.76) | (.16) |
Total distributions | (.06) | (.29) | (.42) | (.50) | (1.06) | (.58) |
Net asset value, end of period | $ 10.05 | $ 9.55 | $ 9.87 | $ 9.11 | $ 7.69 | $ 11.86 |
Total Return B, C, D | 5.90% | (.33)% | 13.06% | 25.25% | (27.11)% | 9.26% |
Ratios to Average Net Assets F, H | | | | | | |
Expenses before reductions G | -% A | -% | -% | -% | -% | -% |
Expenses net of fee waivers, if any | -% A | -% | -% | -% | -% | -% |
Expenses net of all reductions | -% A | -% | -% | -% | -% | -% |
Net investment income (loss) | .02% A | 2.07% | 2.24% | 4.08% | 2.98% | 2.83% |
Supplemental Data | | | | | | |
Net assets, end of period (000 omitted) | $ 72,453 | $ 67,804 | $ 69,259 | $ 60,033 | $ 48,087 | $ 61,370 |
Portfolio turnover rate | 23% A | 30% | 31% | 22% | 29% | 14% |
A Annualized
B Total returns for periods of less than one year are not annualized.
C Total returns do not reflect charges attributable to your insurance company's separate account. Inclusion of these charges would reduce the total returns shown.
D Total returns would have been lower if certain expenses had not been reduced during the applicable periods shown.
E Calculated based on average shares outstanding during the period.
F Amounts do not include the activity of the Underlying Funds.
G Amount represents less than .01%.
H Expense ratios reflect operating expenses of the Fund. Expenses before reductions do not reflect amounts reimbursed by the investment adviser or reductions from expense offset arrangements and do not represent the amount paid by the Fund during periods when reimbursements or reductions occur. Expenses net of fee waivers reflect expenses after reimbursement by the investment adviser but prior to reductions from expense offset arrangements. Expenses net of all reductions represent the net expenses paid by the Fund but do not include expenses of the investment companies in which the Fund invests.
I Amount represents less than $.01 per share.
See accompanying notes which are an integral part of the financial statements.
Semiannual Report
VIP Investor Freedom 2020 Portfolio
Investment Changes (Unaudited)
Fund Holdings as of June 30, 2012 |
| % of fund's
net assets | % of fund's net assets
6 months ago |
Domestic Equity Funds | | |
VIP Contrafund Portfolio Investor Class | 7.2 | 6.8 |
VIP Equity-Income Portfolio Investor Class | 7.7 | 8.1 |
VIP Growth & Income Portfolio Investor Class | 8.7 | 8.1 |
VIP Growth Portfolio Investor Class | 7.3 | 7.9 |
VIP Mid Cap Portfolio Investor Class | 2.2 | 2.7 |
VIP Value Portfolio Investor Class | 5.8 | 7.0 |
VIP Value Strategies Portfolio Investor Class | 2.8 | 2.9 |
| 41.7 | 43.5 |
Developed International Equity Funds | | |
VIP Overseas Portfolio Investor Class R | 11.7 | 11.6 |
Emerging Markets Equity Funds | | |
VIP Emerging Markets Portfolio Investor Class R | 3.5 | 3.0 |
High Yield Bond Funds | | |
VIP High Income Portfolio Investor Class | 6.0 | 6.4 |
Investment Grade Bond Funds | | |
VIP Investment Grade Bond Portfolio Investor Class | 31.3 | 30.7 |
Short-Term Funds | | |
VIP Money Market Portfolio Investor Class | 5.8 | 4.8 |
Net Other Assets (Liabilities)* | 0.0 | 0.0 |
| 100.0 | 100.0 |
* Amount represents less than 0.1% |
Asset Allocation (% of fund's net assets) |
Current |
| Domestic Equity Funds | 41.7% | |
| Developed International Equity Funds | 11.7% | |
| Emerging Markets Equity Funds | 3.5% | |
| High Yield Bond Funds | 6.0% | |
| Investment Grade Bond Funds | 31.3% | |
| Short-Term Funds | 5.8% | |

Six months ago |
| Domestic Equity Funds | 43.5% | |
| Developed International Equity Funds | 11.6% | |
| Emerging Markets Equity Funds | 3.0% | |
| High Yield Bond Funds | 6.4% | |
| Investment Grade Bond Funds | 30.7% | |
| Short-Term Funds | 4.8% | |

Expected |
| Domestic Equity Funds | 40.5% | |
| Developed International Equity Funds | 11.3% | |
| Emerging Markets Equity Funds | 3.4% | |
| High Yield Bond Funds | 5.8% | |
| Investment Grade Bond Funds | 32.3% | |
| Short-Term Funds | 6.7% | |

The fund invests according to an asset allocation strategy that becomes increasingly conservative over time. The six months ago allocation is based on the fund's holdings as of December 31, 2011. The current allocation is based on the fund's holdings as of June 30, 2012. The expected allocation represents the fund's anticipated allocation at December 31, 2012. |
Semiannual Report
VIP Investor Freedom 2020 Portfolio
Investments June 30, 2012 (Unaudited)
Showing Percentage of Net Assets
Domestic Equity Funds - 41.7% |
| Shares | | Value |
Domestic Equity Funds - 41.7% |
VIP Contrafund Portfolio Investor Class | 325,278 | | $ 8,161,221 |
VIP Equity-Income Portfolio Investor Class | 444,240 | | 8,755,969 |
VIP Growth & Income Portfolio Investor Class | 712,588 | | 9,826,586 |
VIP Growth Portfolio Investor Class | 204,025 | | 8,299,730 |
VIP Mid Cap Portfolio Investor Class | 79,362 | | 2,458,637 |
VIP Value Portfolio Investor Class | 565,357 | | 6,524,220 |
VIP Value Strategies Portfolio Investor Class | 319,297 | | 3,132,306 |
TOTAL DOMESTIC EQUITY FUNDS (Cost $51,137,123) |
47,158,669
|
International Equity Funds - 15.2% |
| | | |
Developed International Equity Funds - 11.7% |
VIP Overseas Portfolio Investor Class R | 917,637 | | 13,305,730 |
Emerging Markets Equity Funds - 3.5% |
VIP Emerging Markets Portfolio Investor Class R | 498,195 | | 3,910,834 |
TOTAL INTERNATIONAL EQUITY FUNDS (Cost $21,405,051) |
17,216,564
|
Bond Funds - 37.3% |
| Shares | | Value |
High Yield Bond Funds - 6.0% |
VIP High Income Portfolio Investor Class | 1,179,219 | | $ 6,780,511 |
Investment Grade Bond Funds - 31.3% |
VIP Investment Grade Bond Portfolio Investor Class | 2,675,987 | | 35,483,583 |
TOTAL BOND FUNDS (Cost $41,003,221) |
42,264,094
|
Short-Term Funds - 5.8% |
| | | |
VIP Money Market Portfolio Investor Class
(Cost $6,595,707) | 6,595,707 | |
6,595,707
|
TOTAL INVESTMENT PORTFOLIO - 100.0% (Cost $120,141,102) | | 113,235,034 |
NET OTHER ASSETS (LIABILITIES) - 0.0% | | 19 |
NET ASSETS - 100% | $ 113,235,053 |
Other Information |
All investments are categorized as Level 1 under the Fair Value Hierarchy. The inputs or methodology used for valuing securities may not be an indication of the risk associated with investing in those securities. For more information on valuation inputs, please refer to the Security Valuation section in the accompanying Notes to Financial Statements. |
See accompanying notes which are an integral part of the financial statements.
Semiannual Report
VIP Investor Freedom 2020 Portfolio
Statement of Assets and Liabilities
| June 30, 2012 (Unaudited) |
| | |
Assets | | |
Investment in securities, at value (cost $120,141,102) - See accompanying schedule | | $ 113,235,034 |
Receivable for fund shares sold | | 2,324 |
Distributions receivable from underlying funds | | 20 |
Total assets | | 113,237,378 |
| | |
Liabilities | | |
Payable for investments purchased | $ 2,252 | |
Payable for fund shares redeemed | 73 | |
Total liabilities | | 2,325 |
| | |
Net Assets | | $ 113,235,053 |
Net Assets consist of: | | |
Paid in capital | | $ 120,270,443 |
Undistributed net investment income | | 7,719 |
Accumulated undistributed net realized gain (loss) on investments | | (137,041) |
Net unrealized appreciation (depreciation) on investments | | (6,906,068) |
Net Assets, for 11,474,898 shares outstanding | | $ 113,235,053 |
Net Asset Value, offering price and redemption price per share ($113,235,053 ÷ 11,474,898 shares) | | $ 9.87 |
Statement of Operations
Six months ended June 30, 2012 (Unaudited) |
| | |
Investment Income | | |
Income distributions from underlying funds | | $ 7,719 |
| | |
Expenses | | |
Independent trustees' compensation | $ 189 | |
Total expenses before reductions | 189 | |
Expense reductions | (189) | 0 |
Net investment income (loss) | | 7,719 |
Realized and Unrealized Gain (Loss) Realized gain (loss) on sale of underlying fund shares | 174,466 | |
Capital gain distributions from underlying funds | 444,919 | |
Total net realized gain (loss) | | 619,385 |
Change in net unrealized appreciation (depreciation) on underlying funds | | 6,139,167 |
Net gain (loss) | | 6,758,552 |
Net increase (decrease) in net assets resulting from operations | | $ 6,766,271 |
See accompanying notes which are an integral part of the financial statements.
Semiannual Report
Statement of Changes in Net Assets
| Six months ended
June 30, 2012
(Unaudited) | Year ended
December 31,
2011 |
Increase (Decrease) in Net Assets | | |
Operations | | |
Net investment income (loss) | $ 7,719 | $ 2,263,605 |
Net realized gain (loss) | 619,385 | 1,003,169 |
Change in net unrealized appreciation (depreciation) | 6,139,167 | (4,808,136) |
Net increase (decrease) in net assets resulting from operations | 6,766,271 | (1,541,362) |
Distributions to shareholders from net investment income | - | (2,265,071) |
Distributions to shareholders from net realized gain | (587,331) | (568,142) |
Total distributions | (587,331) | (2,833,213) |
Share transactions
Proceeds from sales of shares | 8,564,246 | 18,593,039 |
Reinvestment of distributions | 587,331 | 2,833,213 |
Cost of shares redeemed | (4,969,993) | (10,719,943) |
Net increase (decrease) in net assets resulting from share transactions | 4,181,584 | 10,706,309 |
Total increase (decrease) in net assets | 10,360,524 | 6,331,734 |
| | |
Net Assets | | |
Beginning of period | 102,874,529 | 96,542,795 |
End of period (including undistributed net investment income of $7,719 and $0, respectively) | $ 113,235,053 | $ 102,874,529 |
Other Information Shares | | |
Sold | 869,586 | 1,883,889 |
Issued in reinvestment of distributions | 60,054 | 303,630 |
Redeemed | (504,443) | (1,108,116) |
Net increase (decrease) | 425,197 | 1,079,403 |
Financial Highlights
| Six months ended
June 30, 2012 | Years ended December 31, |
| (Unaudited) | 2011 | 2010 | 2009 | 2008 | 2007 |
Selected Per-Share Data | | | | | | |
Net asset value, beginning of period | $ 9.31 | $ 9.68 | $ 8.77 | $ 7.12 | $ 12.09 | $ 11.53 |
Income from Investment Operations | | | | | | |
Net investment income (loss) E | - I | .21 | .21 | .30 | .27 | .31 |
Net realized and unrealized gain (loss) | .61 | (.32) | 1.05 | 1.72 | (4.06) | .84 |
Total from investment operations | .61 | (.11) | 1.26 | 2.02 | (3.79) | 1.15 |
Distributions from net investment income | - | (.21) | (.20) | (.28) | (.27) | (.40) |
Distributions from net realized gain | (.05) | (.05) | (.15) | (.09) | (.91) | (.19) |
Total distributions | (.05) | (.26) | (.35) | (.37) | (1.18) | (.59) |
Net asset value, end of period | $ 9.87 | $ 9.31 | $ 9.68 | $ 8.77 | $ 7.12 | $ 12.09 |
Total Return B, C, D | 6.59% | (1.11)% | 14.46% | 28.75% | (32.63)% | 10.20% |
Ratios to Average Net Assets F, H | | | | | | |
Expenses before reductions G | -% A | -% | -% | -% | -% | -% |
Expenses net of fee waivers, if any | -% A | -% | -% | -% | -% | -% |
Expenses net of all reductions | -% A | -% | -% | -% | -% | -% |
Net investment income (loss) | .01% A | 2.20% | 2.28% | 3.82% | 2.77% | 2.59% |
Supplemental Data | | | | | | |
Net assets, end of period (000 omitted) | $ 113,235 | $ 102,875 | $ 96,543 | $ 80,478 | $ 59,123 | $ 76,369 |
Portfolio turnover rate | 23% A | 16% | 31% | 20% | 26% | 12% |
A Annualized
B Total returns for periods of less than one year are not annualized.
C Total returns do not reflect charges attributable to your insurance company's separate account. Inclusion of these charges would reduce the total returns shown.
D Total returns would have been lower if certain expenses had not been reduced during the applicable periods shown.
E Calculated based on average shares outstanding during the period.
F Amounts do not include the activity of the Underlying Funds.
G Amount represents less than .01%.
H Expense ratios reflect operating expenses of the Fund. Expenses before reductions do not reflect amounts reimbursed by the investment adviser or reductions from expense offset arrangements and do not represent the amount paid by the Fund during periods when reimbursements or reductions occur. Expenses net of fee waivers reflect expenses after reimbursement by the investment adviser but prior to reductions from expense offset arrangements. Expenses net of all reductions represent the net expenses paid by the Fund but do not include expenses of the investment companies in which the Fund invests.
I Amount represents less than $.01 per share.
See accompanying notes which are an integral part of the financial statements.
Semiannual Report
VIP Investor Freedom 2025 Portfolio
Investment Changes (Unaudited)
Fund Holdings as of June 30, 2012 |
| % of fund's
net assets | % of fund's net assets
6 months ago |
Domestic Equity Funds | | |
VIP Contrafund Portfolio Investor Class | 8.7 | 8.0 |
VIP Equity-Income Portfolio Investor Class | 9.3 | 9.5 |
VIP Growth & Income Portfolio Investor Class | 10.4 | 9.6 |
VIP Growth Portfolio Investor Class | 8.8 | 9.3 |
VIP Mid Cap Portfolio Investor Class | 2.6 | 3.2 |
VIP Value Portfolio Investor Class | 7.0 | 8.2 |
VIP Value Strategies Portfolio Investor Class | 3.3 | 3.4 |
| 50.1 | 51.2 |
Developed International Equity Funds | | |
VIP Overseas Portfolio Investor Class R | 14.1 | 13.7 |
Emerging Markets Equity Funds | | |
VIP Emerging Markets Portfolio Investor Class R | 4.2 | 3.5 |
High Yield Bond Funds | | |
VIP High Income Portfolio Investor Class | 7.4 | 7.6 |
Investment Grade Bond Funds | | |
VIP Investment Grade Bond Portfolio Investor Class | 23.8 | 23.7 |
Short-Term Funds | | |
VIP Money Market Portfolio Investor Class | 0.4 | 0.3 |
Net Other Assets (Liabilities)* | 0.0 | 0.0 |
| 100.0 | 100.0 |
* Amount represents less than 0.1% |
Asset Allocation (% of fund's net assets) |
Current |
| Domestic Equity Funds | 50.1% | |
| Developed International Equity Funds | 14.1% | |
| Emerging Markets Equity Funds | 4.2% | |
| High Yield Bond Funds | 7.4% | |
| Investment Grade Bond Funds | 23.8% | |
| Short-Term Funds | 0.4% | |

Six months ago |
| Domestic Equity Funds | 51.2% | |
| Developed International Equity Funds | 13.7% | |
| Emerging Markets Equity Funds | 3.5% | |
| High Yield Bond Funds | 7.6% | |
| Investment Grade Bond Funds | 23.7% | |
| Short-Term Funds | 0.3% | |

Expected |
| Domestic Equity Funds | 49.3% | |
| Developed International Equity Funds | 13.9% | |
| Emerging Markets Equity Funds | 4.1% | |
| High Yield Bond Funds | 7.4% | |
| Investment Grade Bond Funds | 24.6% | |
| Short-Term Funds | 0.7% | |

The fund invests according to an asset allocation strategy that becomes increasingly conservative over time. The six months ago allocation is based on the fund's holdings as of December 31, 2011. The current allocation is based on the fund's holdings as of June 30, 2012. The expected allocation represents the fund's anticipated allocation at December 31, 2012. |
Semiannual Report
VIP Investor Freedom 2025 Portfolio
Investments June 30, 2012 (Unaudited)
Showing Percentage of Net Assets
Domestic Equity Funds - 50.1% |
| Shares | | Value |
Domestic Equity Funds - 50.1% |
VIP Contrafund Portfolio Investor Class | 211,019 | | $ 5,294,457 |
VIP Equity-Income Portfolio Investor Class | 288,923 | | 5,694,669 |
VIP Growth & Income Portfolio Investor Class | 462,508 | | 6,377,988 |
VIP Growth Portfolio Investor Class | 132,957 | | 5,408,677 |
VIP Mid Cap Portfolio Investor Class | 52,009 | | 1,611,237 |
VIP Value Portfolio Investor Class | 369,557 | | 4,264,688 |
VIP Value Strategies Portfolio Investor Class | 208,246 | | 2,042,896 |
TOTAL DOMESTIC EQUITY FUNDS (Cost $30,146,483) |
30,694,612
|
International Equity Funds - 18.3% |
| | | |
Developed International Equity Funds - 14.1% |
VIP Overseas Portfolio Investor Class R | 597,257 | | 8,660,231 |
Emerging Markets Equity Funds - 4.2% |
VIP Emerging Markets Portfolio Investor Class R | 324,261 | | 2,545,453 |
TOTAL INTERNATIONAL EQUITY FUNDS (Cost $12,964,065) |
11,205,684
|
Bond Funds - 31.2% |
| Shares | | Value |
High Yield Bond Funds - 7.4% |
VIP High Income Portfolio Investor Class | 793,531 | | $ 4,562,806 |
Investment Grade Bond Funds - 23.8% |
VIP Investment Grade Bond Portfolio Investor Class | 1,097,485 | | 14,552,652 |
TOTAL BOND FUNDS (Cost $18,532,696) |
19,115,458
|
Short-Term Funds - 0.4% |
| | | |
VIP Money Market Portfolio Investor Class
(Cost $257,109) | 257,109 | |
257,109
|
TOTAL INVESTMENT PORTFOLIO - 100.0% (Cost $61,900,353) | | 61,272,863 |
NET OTHER ASSETS (LIABILITIES) - 0.0% | | 3 |
NET ASSETS - 100% | $ 61,272,866 |
Other Information |
All investments are categorized as Level 1 under the Fair Value Hierarchy. The inputs or methodology used for valuing securities may not be an indication of the risk associated with investing in those securities. For more information on valuation inputs, please refer to the Security Valuation section in the accompanying Notes to Financial Statements. |
See accompanying notes which are an integral part of the financial statements.
Semiannual Report
VIP Investor Freedom 2025 Portfolio
Statement of Assets and Liabilities
| June 30, 2012 (Unaudited) |
| | |
Assets | | |
Investment in securities, at value (cost $61,900,353) - See accompanying schedule | | $ 61,272,863 |
Receivable for fund shares sold | | 5,403 |
Distributions receivable from underlying funds | | 1 |
Total assets | | 61,278,267 |
| | |
Liabilities | | |
Payable for investments purchased | $ 5,372 | |
Payable for fund shares redeemed | 29 | |
Total liabilities | | 5,401 |
| | |
Net Assets | | $ 61,272,866 |
Net Assets consist of: | | |
Paid in capital | | $ 62,031,944 |
Undistributed net investment income | | 2,395 |
Accumulated undistributed net realized gain (loss) on investments | | (133,983) |
Net unrealized appreciation (depreciation) on investments | | (627,490) |
Net Assets, for 6,122,399 shares outstanding | | $ 61,272,866 |
Net Asset Value, offering price and redemption price per share ($61,272,866 ÷ 6,122,399 shares) | | $ 10.01 |
Statement of Operations
Six months ended June 30, 2012 (Unaudited) |
| | |
Investment Income | | |
Income distributions from underlying funds | | $ 2,395 |
| | |
Expenses | | |
Independent trustees' compensation | $ 97 | |
Total expenses before reductions | 97 | |
Expense reductions | (97) | 0 |
Net investment income (loss) | | 2,395 |
Realized and Unrealized Gain (Loss) Realized gain (loss) on sale of underlying fund shares | 40,445 | |
Capital gain distributions from underlying funds | 220,267 | |
Total net realized gain (loss) | | 260,712 |
Change in net unrealized appreciation (depreciation) on underlying funds | | 3,565,156 |
Net gain (loss) | | 3,825,868 |
Net increase (decrease) in net assets resulting from operations | | $ 3,828,263 |
See accompanying notes which are an integral part of the financial statements.
Semiannual Report
Statement of Changes in Net Assets
| Six months ended
June 30, 2012
(Unaudited) | Year ended
December 31,
2011 |
Increase (Decrease) in Net Assets | | |
Operations | | |
Net investment income (loss) | $ 2,395 | $ 1,142,604 |
Net realized gain (loss) | 260,712 | 335,594 |
Change in net unrealized appreciation (depreciation) | 3,565,156 | (2,939,325) |
Net increase (decrease) in net assets resulting from operations | 3,828,263 | (1,461,127) |
Distributions to shareholders from net investment income | - | (1,144,600) |
Distributions to shareholders from net realized gain | (191,235) | (189,863) |
Total distributions | (191,235) | (1,334,463) |
Share transactions
Proceeds from sales of shares | 6,822,729 | 14,419,993 |
Reinvestment of distributions | 191,235 | 1,334,462 |
Cost of shares redeemed | (1,656,616) | (5,209,901) |
Net increase (decrease) in net assets resulting from share transactions | 5,357,348 | 10,544,554 |
Total increase (decrease) in net assets | 8,994,376 | 7,748,964 |
| | |
Net Assets | | |
Beginning of period | 52,278,490 | 44,529,526 |
End of period (including undistributed net investment income of $2,395 and $0, respectively) | $ 61,272,866 | $ 52,278,490 |
Other Information Shares | | |
Sold | 685,119 | 1,442,734 |
Issued in reinvestment of distributions | 19,239 | 142,419 |
Redeemed | (165,681) | (531,486) |
Net increase (decrease) | 538,677 | 1,053,667 |
Financial Highlights
| Six months ended
June 30, 2012 | Years ended December 31, |
| (Unaudited) | 2011 | 2010 | 2009 | 2008 | 2007 |
Selected Per-Share Data | | | | | | |
Net asset value, beginning of period | $ 9.36 | $ 9.83 | $ 8.73 | $ 7.04 | $ 12.21 | $ 11.62 |
Income from Investment Operations | | | | | | |
Net investment income (loss) E | - I | .22 | .21 | .28 | .27 | .32 |
Net realized and unrealized gain (loss) | .68 | (.44) | 1.17 | 1.79 | (4.29) | .86 |
Total from investment operations | .68 | (.22) | 1.38 | 2.07 | (4.02) | 1.18 |
Distributions from net investment income | - | (.21) | (.20) | (.25) | (.26) | (.38) |
Distributions from net realized gain | (.03) | (.04) | (.08) | (.13) | (.89) | (.21) |
Total distributions | (.03) | (.25) | (.28) | (.38) | (1.15) | (.59) |
Net asset value, end of period | $ 10.01 | $ 9.36 | $ 9.83 | $ 8.73 | $ 7.04 | $ 12.21 |
Total Return B, C, D | 7.31% | (2.28)% | 15.80% | 29.95% | (34.22)% | 10.39% |
Ratios to Average Net Assets F, H | | | | | | |
Expenses before reductions G | -% A | -% | -% | -% | -% | -% |
Expenses net of fee waivers, if any | -% A | -% | -% | -% | -% | -% |
Expenses net of all reductions | -% A | -% | -% | -% | -% | -% |
Net investment income (loss) | .01% A | 2.26% | 2.28% | 3.65% | 2.77% | 2.62% |
Supplemental Data | | | | | | |
Net assets, end of period (000 omitted) | $ 61,273 | $ 52,278 | $ 44,530 | $ 32,981 | $ 21,454 | $ 28,587 |
Portfolio turnover rate | 18% A | 15% | 29% | 18% | 30% | 10% |
A Annualized
B Total returns for periods of less than one year are not annualized.
C Total returns do not reflect charges attributable to your insurance company's separate account. Inclusion of these charges would reduce the total returns shown.
D Total returns would have been lower if certain expenses had not been reduced during the applicable periods shown.
E Calculated based on average shares outstanding during the period.
F Amounts do not include the activity of the Underlying Funds.
G Amount represents less than .01%.
H Expense ratios reflect operating expenses of the Fund. Expenses before reductions do not reflect amounts reimbursed by the investment adviser or reductions from expense offset arrangements and do not represent the amount paid by the Fund during periods when reimbursements or reductions occur. Expenses net of fee waivers reflect expenses after reimbursement by the investment adviser but prior to reductions from expense offset arrangements. Expenses net of all reductions represent the net expenses paid by the Fund but do not include expenses of the investment companies in which the Fund invests.
I Amount represents less than $.01 per share.
See accompanying notes which are an integral part of the financial statements.
Semiannual Report
VIP Investor Freedom 2030 Portfolio
Investment Changes (Unaudited)
Fund Holdings as of June 30, 2012 |
| % of fund's
net assets | % of fund's net assets
6 months ago |
Domestic Equity Funds | | |
VIP Contrafund Portfolio Investor Class | 9.0 | 8.4 |
VIP Equity-Income Portfolio Investor Class | 9.7 | 10.0 |
VIP Growth & Income Portfolio Investor Class | 10.9 | 10.1 |
VIP Growth Portfolio Investor Class | 9.2 | 9.8 |
VIP Mid Cap Portfolio Investor Class | 2.7 | 3.4 |
VIP Value Portfolio Investor Class | 7.2 | 8.6 |
VIP Value Strategies Portfolio Investor Class | 3.5 | 3.6 |
| 52.2 | 53.9 |
Developed International Equity Funds | | |
VIP Overseas Portfolio Investor Class R | 14.8 | 14.3 |
Emerging Markets Equity Funds | | |
VIP Emerging Markets Portfolio Investor Class R | 4.3 | 3.7 |
High Yield Bond Funds | | |
VIP High Income Portfolio Investor Class | 7.5 | 7.7 |
Investment Grade Bond Funds | | |
VIP Investment Grade Bond Portfolio Investor Class | 21.2 | 20.4 |
Net Other Assets (Liabilities)* | 0.0 | 0.0 |
| 100.0 | 100.0 |
* Amount represents less than 0.1% |
Asset Allocation (% of fund's net assets) |
Current |
| Domestic Equity Funds | 52.2% | |
 | Developed International Equity Funds | 14.8% | |
 | Emerging Markets Equity Funds | 4.3% | |
 | High Yield Bond Funds | 7.5% | |
| Investment Grade Bond Funds | 21.2% | |

Six months ago |
| Domestic Equity Funds | 53.9% | |
| Developed International Equity Funds | 14.3% | |
| Emerging Markets Equity Funds | 3.7% | |
| High Yield Bond Funds | 7.7% | |
| Investment Grade Bond Funds | 20.4% | |

Expected |
| Domestic Equity Funds | 51.8% | |
| Developed International Equity Funds | 14.5% | |
| Emerging Markets Equity Funds | 4.3% | |
| High Yield Bond Funds | 7.5% | |
| Investment Grade Bond Funds | 21.9% | |

The fund invests according to an asset allocation strategy that becomes increasingly conservative over time. The six months ago allocation is based on the fund's holdings as of December 31, 2011. The current allocation is based on the fund's holdings as of June 30, 2012. The expected allocation represents the fund's anticipated allocation at December 31, 2012. |
Semiannual Report
VIP Investor Freedom 2030 Portfolio
Investments June 30, 2012 (Unaudited)
Showing Percentage of Net Assets
Domestic Equity Funds - 52.2% |
| Shares | | Value |
Domestic Equity Funds - 52.2% |
VIP Contrafund Portfolio Investor Class | 215,951 | | $ 5,418,216 |
VIP Equity-Income Portfolio Investor Class | 294,737 | | 5,809,258 |
VIP Growth & Income Portfolio Investor Class | 473,490 | | 6,529,422 |
VIP Growth Portfolio Investor Class | 135,498 | | 5,512,059 |
VIP Mid Cap Portfolio Investor Class | 52,728 | | 1,633,521 |
VIP Value Portfolio Investor Class | 375,239 | | 4,330,259 |
VIP Value Strategies Portfolio Investor Class | 212,187 | | 2,081,553 |
TOTAL DOMESTIC EQUITY FUNDS (Cost $32,825,538) |
31,314,288
|
International Equity Funds - 19.1% |
| | | |
Developed International Equity Funds - 14.8% |
VIP Overseas Portfolio Investor Class R | 609,336 | | 8,835,375 |
Emerging Markets Equity Funds - 4.3% |
VIP Emerging Markets Portfolio Investor Class R | 330,660 | | 2,595,683 |
TOTAL INTERNATIONAL EQUITY FUNDS (Cost $13,843,007) |
11,431,058
|
Bond Funds - 28.7% |
| Shares | | Value |
High Yield Bond Funds - 7.5% |
VIP High Income Portfolio Investor Class | 781,042 | | $ 4,490,991 |
Investment Grade Bond Funds - 21.2% |
VIP Investment Grade Bond Portfolio Investor Class | 958,486 | | 12,709,517 |
TOTAL BOND FUNDS (Cost $16,818,848) |
17,200,508
|
TOTAL INVESTMENT PORTFOLIO - 100.0% (Cost $63,487,393) | | 59,945,854 |
NET OTHER ASSETS (LIABILITIES) - 0.0% | | (1) |
NET ASSETS - 100% | $ 59,945,853 |
Other Information |
All investments are categorized as Level 1 under the Fair Value Hierarchy. The inputs or methodology used for valuing securities may not be an indication of the risk associated with investing in those securities. For more information on valuation inputs, please refer to the Security Valuation section in the accompanying Notes to Financial Statements. |
See accompanying notes which are an integral part of the financial statements.
Semiannual Report
VIP Investor Freedom 2030 Portfolio
Statement of Assets and Liabilities
| June 30, 2012 (Unaudited) |
| | |
Assets | | |
Investment in securities, at value (cost $63,487,393) - See accompanying schedule | | $ 59,945,854 |
Receivable for fund shares sold | | 55,103 |
Total assets | | 60,000,957 |
| | |
Liabilities | | |
Payable to custodian bank | $ 2 | |
Payable for investments purchased | 55,102 | |
Total liabilities | | 55,104 |
| | |
Net Assets | | $ 59,945,853 |
Net Assets consist of: | | |
Paid in capital | | $ 63,613,048 |
Undistributed net investment income | | 2,260 |
Accumulated undistributed net realized gain (loss) on investments | | (127,916) |
Net unrealized appreciation (depreciation) on investments | | (3,541,539) |
Net Assets, for 6,268,516 shares outstanding | | $ 59,945,853 |
Net Asset Value, offering price and redemption price per share ($59,945,853 ÷ 6,268,516 shares) | | $ 9.56 |
Statement of Operations
Six months ended June 30, 2012 (Unaudited) |
| | |
Investment Income | | |
Income distributions from underlying funds | | $ 2,260 |
| | |
Expenses | | |
Independent trustees' compensation | $ 99 | |
Total expenses before reductions | 99 | |
Expense reductions | (99) | 0 |
Net investment income (loss) | | 2,260 |
Realized and Unrealized Gain (Loss) Realized gain (loss) on sale of underlying fund shares | 44,789 | |
Capital gain distributions from underlying funds | 215,490 | |
Total net realized gain (loss) | | 260,279 |
Change in net unrealized appreciation (depreciation) on underlying funds | | 3,573,701 |
Net gain (loss) | | 3,833,980 |
Net increase (decrease) in net assets resulting from operations | | $ 3,836,240 |
See accompanying notes which are an integral part of the financial statements.
Semiannual Report
Statement of Changes in Net Assets
| Six months ended
June 30, 2012
(Unaudited) | Year ended
December 31,
2011 |
Increase (Decrease) in Net Assets | | |
Operations | | |
Net investment income (loss) | $ 2,260 | $ 1,100,862 |
Net realized gain (loss) | 260,279 | 294,381 |
Change in net unrealized appreciation (depreciation) | 3,573,701 | (3,043,317) |
Net increase (decrease) in net assets resulting from operations | 3,836,240 | (1,648,074) |
Distributions to shareholders from net investment income | - | (1,104,616) |
Distributions to shareholders from net realized gain | (153,874) | (185,981) |
Total distributions | (153,874) | (1,290,597) |
Share transactions
Proceeds from sales of shares | 6,236,797 | 11,831,783 |
Reinvestment of distributions | 153,874 | 1,290,597 |
Cost of shares redeemed | (1,605,593) | (4,775,189) |
Net increase (decrease) in net assets resulting from share transactions | 4,785,078 | 8,347,191 |
Total increase (decrease) in net assets | 8,467,444 | 5,408,520 |
| | |
Net Assets | | |
Beginning of period | 51,478,409 | 46,069,889 |
End of period (including undistributed net investment income of $2,260 and $0, respectively) | $ 59,945,853 | $ 51,478,409 |
Other Information Shares | | |
Sold | 655,118 | 1,239,890 |
Issued in reinvestment of distributions | 16,180 | 144,524 |
Redeemed | (170,918) | (512,617) |
Net increase (decrease) | 500,380 | 871,797 |
Financial Highlights
| Six months ended
June 30, 2012 | Years ended December 31, |
| (Unaudited) | 2011 | 2010 | 2009 | 2008 | 2007 |
Selected Per-Share Data | | | | | | |
Net asset value, beginning of period | $ 8.92 | $ 9.41 | $ 8.38 | $ 6.66 | $ 12.48 | $ 11.72 |
Income from Investment Operations | | | | | | |
Net investment income (loss) E | - I | .20 | .19 | .21 | .23 | .30 |
Net realized and unrealized gain (loss) | .67 | (.46) | 1.15 | 1.85 | (4.78) | .99 |
Total from investment operations | .67 | (.26) | 1.34 | 2.06 | (4.55) | 1.29 |
Distributions from net investment income | - | (.20) | (.18) | (.20) | (.29) | (.29) |
Distributions from net realized gain | (.03) | (.03) | (.13) | (.14) | (.98) | (.24) |
Total distributions | (.03) | (.23) | (.31) | (.34) | (1.27) | (.53) |
Net asset value, end of period | $ 9.56 | $ 8.92 | $ 9.41 | $ 8.38 | $ 6.66 | $ 12.48 |
Total Return B, C, D | 7.47% | (2.78)% | 16.12% | 31.57% | (38.13)% | 11.28% |
Ratios to Average Net Assets F, H | | | | | | |
Expenses before reductions G | -% A | -% | -% | -% | -% | -% |
Expenses net of fee waivers, if any | -% A | -% | -% | -% | -% | -% |
Expenses net of all reductions | -% A | -% | -% | -% | -% | -% |
Net investment income (loss) | .01% A | 2.16% | 2.20% | 2.86% | 2.38% | 2.41% |
Supplemental Data | | | | | | |
Net assets, end of period (000 omitted) | $ 59,946 | $ 51,478 | $ 46,070 | $ 34,560 | $ 24,786 | $ 31,355 |
Portfolio turnover rate | 17% A | 14% | 26% | 21% | 19% | 12% |
A Annualized
B Total returns for periods of less than one year are not annualized.
C Total returns do not reflect charges attributable to your insurance company's separate account. Inclusion of these charges would reduce the total returns shown.
D Total returns would have been lower if certain expenses had not been reduced during the applicable periods shown.
E Calculated based on average shares outstanding during the period.
F Amounts do not include the activity of the Underlying Funds.
G Amount represents less than .01%.
H Expense ratios reflect operating expenses of the Fund. Expenses before reductions do not reflect amounts reimbursed by the investment adviser or reductions from expense offset arrangements and do not represent the amount paid by the Fund during periods when reimbursements or reductions occur. Expenses net of fee waivers reflect expenses after reimbursement by the investment adviser but prior to reductions from expense offset arrangements. Expenses net of all reductions represent the net expenses paid by the Fund but do not include expenses of the investment companies in which the Fund invests.
I Amount represents less than $.01 per share.
See accompanying notes which are an integral part of the financial statements.
Semiannual Report
Notes to Financial Statements
For the period ended June 30, 2012 (Unaudited)
1. Organization.
VIP Investor Freedom Income PortfolioSM, VIP Investor Freedom 2005 PortfolioSM, VIP Investor Freedom 2010 PortfolioSM, VIP Investor Freedom 2015 PortfolioSM, VIP Investor Freedom 2020 PortfolioSM, VIP Investor Freedom 2025 PortfolioSM and VIP Investor Freedom 2030 PortfolioSM (the Funds) are funds of Variable Insurance Products Fund V. The Variable Insurance Products Fund V (the Trust) (referred to in this report as Fidelity Variable Insurance Products) is registered under the Investment Company Act of 1940, as amended (the 1940 Act), as an open-end management investment company organized as a Massachusetts business trust. Each Fund is authorized to issue an unlimited number of shares. The Funds invest primarily in a combination of other VIP equity, bond, and short-term funds (the Underlying Funds) managed by Fidelity Management & Research Company (FMR). Shares of each Fund may only be purchased by insurance companies for the purpose of funding variable annuity or variable life insurance contracts.
2. Significant Accounting Policies.
The financial statements have been prepared in conformity with accounting principles generally accepted in the United States of America (GAAP), which require management to make certain estimates and assumptions at the date of the financial statements. Actual results could differ from those estimates. Subsequent events, if any, through the date that the financial statements were issued have been evaluated in the preparation of the financial statements. The following summarizes the significant accounting policies of the Funds:
Security Valuation. Investments are valued as of 4:00 p.m. Eastern time on the last calendar day of the period. Each Fund categorizes the inputs to valuation techniques used to value their investments into a disclosure hierarchy consisting of three levels as shown below:
Level 1 - quoted prices in active markets for identical investments
Level 2 - other significant observable inputs (including quoted prices for similar investments, interest rates, prepayment speeds, etc.)
Level 3 - unobservable inputs (including the Fund's own assumptions based on the best information available)
Valuation techniques used to value each Fund's investments by major category are as follows. Investments in the Underlying Funds are valued at their closing net asset value (NAV) each business day and are categorized as Level 1 in the hierarchy.
Investment Transactions and Income. For financial reporting purposes, the Funds' investment holdings and NAV include trades executed through the end of the last business day of the period. The NAV per share for processing shareholder transactions is calculated as of the close of business of the New York Stock Exchange (NYSE), normally 4:00 p.m. Eastern time and includes trades executed through the end of the prior business day. Gains and losses on securities sold are determined on the basis of identified cost. Income and capital gain distributions from the Underlying Funds, if any, are recorded on the ex-dividend date.
Expenses. Expenses directly attributable to a fund are charged to that fund. Expenses attributable to more than one fund are allocated among the respective funds on the basis of relative net assets or other appropriate methods. Expenses included in the accompanying financial statements reflect the expenses of the Fund and do not include any expenses associated with the Underlying Funds. Expense estimates are accrued in the period to which they relate and adjustments are made when actual amounts are known.
Income Tax Information and Distributions to Shareholders. Each year, each Fund intends to qualify as a regulated investment company under Subchapter M of the Internal Revenue Code, including distributing substantially all of its taxable income and realized gains. As a result, no provision for income taxes is required. Each Fund files a U.S. federal tax return, in addition to state and local tax returns as required. A fund's federal income tax returns are subject to examination by the Internal Revenue Service (IRS) for a period of three fiscal years after they are filed. State and local tax returns may be subject to examination for an additional fiscal year depending on the jurisdiction.
Distributions are declared and recorded on the ex-dividend date. Income and capital gain distributions are determined in accordance with income tax regulations, which may differ from GAAP.
Capital accounts within the financial statements are adjusted for permanent book-tax differences. These adjustments have no impact on net assets or the results of operations. Temporary book-tax differences will reverse in a subsequent period.
Book-tax differences are primarily due to the short-term gain distributions from the Underlying Funds, capital loss carryforwards and losses deferred due to wash sales.
The federal tax cost of investment securities and unrealized appreciation (depreciation) as of period end were as follows for each Fund:
Semiannual Report
Notes to Financial Statements (Unaudited) - continued
2. Significant Accounting Policies - continued
Income Tax Information and Distributions to Shareholders - continued
| Tax cost | Gross unrealized
appreciation | Gross unrealized
depreciation | Net unrealized
appreciation
(depreciation) on
securities and
other investments |
VIP Investor Freedom Income | $ 33,688,929 | $ 1,229,992 | $ (751,037) | $ 478,955 |
VIP Investor Freedom 2005 | 12,200,777 | 314,139 | (842,415) | (528,276) |
VIP Investor Freedom 2010 | 57,947,753 | 1,474,931 | (6,052,572) | (4,577,641) |
VIP Investor Freedom 2015 | 76,881,982 | 2,496,018 | (6,925,121) | (4,429,103) |
VIP Investor Freedom 2020 | 120,841,907 | 3,760,608 | (11,367,481) | (7,606,873) |
VIP Investor Freedom 2025 | 62,271,994 | 3,863,900 | (4,863,031) | (999,131) |
VIP Investor Freedom 2030 | 63,859,206 | 2,453,824 | (6,367,176) | (3,913,352) |
3. Purchases and Sales of Investments.
Purchases and redemptions of the Underlying Fund shares are noted in the table below.
| Purchases ($) | Redemptions ($) |
VIP Investor Freedom Income | 6,051,504 | 3,372,746 |
VIP Investor Freedom 2005 | 4,041,527 | 2,613,876 |
VIP Investor Freedom 2010 | 6,643,904 | 7,201,964 |
VIP Investor Freedom 2015 | 9,183,454 | 8,262,894 |
VIP Investor Freedom 2020 | 16,567,801 | 12,520,880 |
VIP Investor Freedom 2025 | 10,488,190 | 5,099,438 |
VIP Investor Freedom 2030 | 9,704,408 | 4,855,453 |
4. Fees and Other Transactions with Affiliates.
Management Fee. Strategic Advisers, Inc. (Strategic Advisers), an affiliate of FMR, provides the Funds with investment management related services. The Funds do not pay any fees for these services.
Other Transactions. Strategic Advisers has entered into an administration agreement with FMR under which FMR provides management and administrative services (other than investment advisory services) necessary for the operation of each Fund. Pursuant to this agreement, FMR pays all expenses of each Fund, excluding the compensation of the independent Trustees and certain other expenses such as interest expense. FMR also contracts with other Fidelity companies to perform the services necessary for the operation of each Fund. The Funds do not pay any fees for these services.
5. Expense Reductions.
FMR voluntarily agreed to reimburse the Funds to the extent annual operating expenses exceeded certain levels of average net assets as noted in the table below. Some expenses, for example interest expense, are excluded from this reimbursement.
The following Funds were in reimbursement during the period:
| Expense
Limitations | Reimbursement
from adviser |
| | |
VIP Investor Freedom Income | 0% | $ 55 |
VIP Investor Freedom 2005 | 0% | 17 |
VIP Investor Freedom 2010 | 0% | 93 |
VIP Investor Freedom 2015 | 0% | 123 |
VIP Investor Freedom 2020 | 0% | 189 |
VIP Investor Freedom 2025 | 0% | 97 |
VIP Investor Freedom 2030 | 0% | 99 |
Semiannual Report
6. Other.
The Funds' organizational documents provide former and current trustees and officers with a limited indemnification against liabilities arising in connection with the performance of their duties to the Funds. In the normal course of business, the Funds may also enter into contracts that provide general indemnifications. The Funds' maximum exposure under these arrangements is unknown as this would be dependent on future claims that may be made against the Funds. The risk of material loss from such claims is considered remote.
At period end, FMR or its affiliates were owners of record of all of the outstanding shares of the Funds.
Semiannual Report
Investment Adviser
Strategic Advisers, Inc.
Boston, MA
General Distributor
Fidelity Distributors Corporation
Smithfield, RI
Transfer and Service Agents
Fidelity Investments Institutional Operations Company, Inc.
Boston, MA
Fidelity Service Company, Inc.
Boston, MA
Custodian
The Bank of New York Mellon
New York, NY
VIPIFF-SANN-0812
1.833440.106
Fidelity® Variable Insurance Products:
Strategic Income Portfolio
Semiannual Report
June 30, 2012
(Fidelity Cover Art)
Contents
Shareholder Expense Example | (Click Here) | An example of shareholder expenses. |
Investment Changes | (Click Here) | A summary of major shifts in the fund's investments over the past six months. |
Investments | (Click Here) | A complete list of the fund's investments with their market values. |
Financial Statements | (Click Here) | Statements of assets and liabilities, operations, and changes in net assets, as well as financial highlights. |
Notes | (Click Here) | Notes to the financial statements. |
To view a fund's proxy voting guidelines and proxy voting record for the 12-month period ended June 30, visit http://www.fidelity.com/proxyvotingresults or visit the Securities and Exchange Commission's (SEC) web site at http://www.sec.gov. You may also call 1-877-208-0098 to request a free copy of the proxy voting guidelines.
Fidelity Variable Insurance Products are separate account options which are purchased through a variable insurance contract.
Standard & Poor's, S&P and S&P 500 are registered service marks of The McGraw-Hill Companies, Inc. and have been licensed for use by Fidelity Distributors Corporation.
Other third party marks appearing herein are the property of their respective owners.
All other marks appearing herein are registered or unregistered trademarks or service marks of FMR LLC or an affiliated company. © 2012 FMR LLC. All rights reserved.
This report and the financial statements contained herein are submitted for the general information of the shareholders of the fund. This report is not authorized for distribution to prospective investors in the fund unless preceded or accompanied by an effective prospectus.
A fund files its complete schedule of portfolio holdings with the SEC for the first and third quarters of each fiscal year on Form N-Q. Forms N-Q are available on the SEC's web site at http://www.sec.gov. A fund's Forms N-Q may be reviewed and copied at the SEC's Public Reference Room in Washington, DC. Information regarding the operation of the SEC's Public Reference Room may be obtained by calling 1-800-SEC-0330. For a complete list of a fund's portfolio holdings, view the most recent holdings listing, semiannual report, or annual report on Fidelity's web site at http://www.fidelity.com, http://www.advisor.fidelity.com, or http://www.401k.com, as applicable.
NOT FDIC INSURED • MAY LOSE VALUE • NO BANK GUARANTEE
Neither the fund nor Fidelity Distributors Corporation is a bank.
Semiannual Report
As a shareholder of the Fund, you incur two types of costs: (1) transaction costs, and (2) ongoing costs, including management fees, distribution and/or service (12b-1) fees and other Fund expenses. This Example is intended to help you understand your ongoing costs (in dollars) of investing in the Fund and to compare these costs with the ongoing costs of investing in other mutual funds.
The Example is based on an investment of $1,000 invested at the beginning of the period and held for the entire period (January 1, 2012 to June 30, 2012).
Actual Expenses
The first line of the accompanying table for each class of the Fund provides information about actual account values and actual expenses. You may use the information in this line, together with the amount you invested, to estimate the expenses that you paid over the period. Simply divide your account value by $1,000.00 (for example, an $8,600 account value divided by $1,000.00 = 8.6), then multiply the result by the number in the first line for a class of the Fund under the heading entitled "Expenses Paid During Period" to estimate the expenses you paid on your account during this period. The estimate of expenses does not include any fees or other expenses of any variable annuity or variable life insurance product. If they were, the estimate of expenses you paid during the period would be higher, and your ending account value would be lower. In addition, the Fund, as a shareholder in the underlying Fidelity Central Funds, will indirectly bear its pro-rata share of the fees and expenses incurred by the underlying Fidelity Central Funds. These fees and expenses are not included in the Fund's annualized expense ratio used to calculate the expense estimate in the table below.
Hypothetical Example for Comparison Purposes
The second line of the accompanying table for each class of the Fund provides information about hypothetical account values and hypothetical expenses based on a Class' actual expense ratio and an assumed rate of return of 5% per year before expenses, which is not the Class' actual return. The hypothetical account values and expenses may not be used to estimate the actual ending account balance or expenses you paid for the period. You may use this information to compare the ongoing costs of investing in the Fund and other funds. To do so, compare this 5% hypothetical example with the 5% hypothetical examples that appear in the shareholder reports of the other funds. The estimate of expenses does not include any fees or other expenses of any variable annuity or variable life insurance product. If they were, the estimate of expenses you paid during the period would be higher, and your ending account value would be lower. In addition, the Fund, as a shareholder in the underlying Fidelity Central Funds, will indirectly bear its pro-rata share of the fees and expenses incurred by the underlying Fidelity Central Funds. These fees and expenses are not included in the Fund's annualized expense ratio used to calculate the expense estimate in the table below.
Please note that the expenses shown in the table are meant to highlight your ongoing costs only and do not reflect any transaction costs. Therefore, the second line of the table is useful in comparing ongoing costs only, and will not help you determine the relative total costs of owning different funds.
| Annualized Expense Ratio | Beginning
Account Value
January 1, 2012 | Ending
Account Value
June 30, 2012 | Expenses Paid
During Period*
January 1, 2012
to June 30, 2012 |
Initial Class | .69% | | | |
Actual | | $ 1,000.00 | $ 1,044.40 | $ 3.51 |
HypotheticalA | | $ 1,000.00 | $ 1,021.43 | $ 3.47 |
Service Class | .79% | | | |
Actual | | $ 1,000.00 | $ 1,044.50 | $ 4.02 |
HypotheticalA | | $ 1,000.00 | $ 1,020.93 | $ 3.97 |
Service Class 2 | .94% | | | |
Actual | | $ 1,000.00 | $ 1,042.80 | $ 4.77 |
HypotheticalA | | $ 1,000.00 | $ 1,020.19 | $ 4.72 |
Investor Class | .72% | | | |
Actual | | $ 1,000.00 | $ 1,044.60 | $ 3.66 |
HypotheticalA | | $ 1,000.00 | $ 1,021.28 | $ 3.62 |
A 5% return per year before expenses
* Expenses are equal to each Class' annualized expense ratio, multiplied by the average account value over the period, multiplied by 182/366 (to reflect the one-half year period). The fees and expenses of the underlying Fidelity Central Funds in which the Fund invests are not included in the Fund's annualized expense ratio.
Semiannual Report
Investment Changes (Unaudited)
The information in the following tables is based on the combined investments of the Fund and its pro-rata share of its investments in each non-money market Fidelity Central Fund.
Top Five Holdings as of June 30, 2012 |
(by issuer, excluding cash equivalents) | % of fund's
net assets | % of fund's net assets
6 months ago |
U.S. Treasury Obligations | 20.5 | 19.8 |
Fannie Mae | 2.8 | 1.8 |
German Federal Republic | 2.7 | 2.0 |
Freddie Mac | 2.2 | 1.3 |
Italian Republic | 2.2 | 1.5 |
| 30.4 | |
Top Five Market Sectors as of June 30, 2012 |
| % of fund's
net assets | % of fund's net assets
6 months ago |
Financials | 8.0 | 5.5 |
Energy | 5.3 | 6.0 |
Consumer Discretionary | 5.3 | 4.6 |
Industrials | 4.6 | 4.3 |
Health Care | 4.3 | 4.5 |
Quality Diversification (% of fund's net assets) |
As of June 30, 2012 | As of December 31, 2011 |
 | U.S. Government and
U.S. Government
Agency Obligations† 30.6% | | | U.S. Government and
U.S. Government
Agency Obligations† 28.2% | |
 | AAA,AA,A 14.0% | | | AAA,AA,A 14.5% | |
 | BBB 6.1% | | | BBB 4.5% | |
 | BB 15.5% | | | BB 14.4% | |
 | B 20.4% | |  | B 21.8% | |
 | CCC,CC,C 5.2% | | | CCC,CC,C 4.4% | |
 | Not Rated 2.4% | |  | Not Rated 2.7% | |
 | Equities 0.5% | | | Equities 0.5% | |
 | Short-Term Investments
and Net Other Assets 5.3% | | | Short-Term Investments
and Net Other Assets 9.0% | |

We have used ratings from Moody's Investors Service, Inc. Where Moody's® ratings are not available, we have used S&P® ratings. All ratings are as of the date indicated and do not reflect subsequent changes. |
Asset Allocation (% of fund's net assets) |
As of June 30, 2012* | As of December 31, 2011** |
| Preferred Securities 0.2% | | | Preferred Securities 0.3% | |
 | Corporate Bonds 36.3% | | | Corporate Bonds 34.2% | |
 | U.S. Government and
U.S. Government
Agency Obligations† 30.6% | | | U.S. Government and
U.S. Government
Agency Obligations† 28.2% | |
 | Foreign Government &
Government Agency
Obligations 21.7% | | | Foreign Government &
Government Agency
Obligations 22.4% | |
 | Floating Rate Loans 5.3% | | | Floating Rate Loans 5.3% | |
| Stocks 0.5% | | | Stocks 0.5% | |
 | Other Investments 0.1% | | | Other Investments 0.1% | |
| Short-Term Investments
and Net Other Assets 5.3% | | | Short-Term Investments
and Net Other Assets 9.0% | |
* Foreign investments | 33.1% | | ** Foreign investments | 33.5% | |
* Futures and Swaps | 1.3% | | ** Futures and Swaps | 1.1% | |

† Includes FDIC Guaranteed Corporate Securities and NCUA Guaranteed Notes.
An unaudited holdings listing for the Fund, which presents direct holdings as well as the pro-rata share of any securities and other investments held indirectly through its investment in underlying non-money market Fidelity Central Funds, is available at advisor.fidelity.com.
Semiannual Report
Investments June 30, 2012 (Unaudited)
Showing Percentage of Net Assets
Corporate Bonds - 36.3% |
| Principal Amount (d) | | Value |
Convertible Bonds - 0.2% |
CONSUMER DISCRETIONARY - 0.1% |
Auto Components - 0.1% |
TRW Automotive, Inc. 3.5% 12/1/15 | | $ 671,000 | | $ 976,305 |
ENERGY - 0.0% |
Energy Equipment & Services - 0.0% |
Cal Dive International, Inc. 3.25% 12/15/25 | | 170,000 | | 169,150 |
INFORMATION TECHNOLOGY - 0.0% |
Communications Equipment - 0.0% |
Lucent Technologies, Inc. 2.875% 6/15/25 | | 210,000 | | 206,850 |
MATERIALS - 0.1% |
Metals & Mining - 0.1% |
Vedanta Resources Jersey II Ltd.: | | | | |
4% 3/30/17 | | 600,000 | | 588,000 |
5.5% 7/13/16 | | 400,000 | | 368,000 |
| | 956,000 |
TOTAL CONVERTIBLE BONDS | | 2,308,305 |
Nonconvertible Bonds - 36.1% |
CONSUMER DISCRETIONARY - 4.5% |
Auto Components - 0.5% |
Affinia Group, Inc.: | | | | |
9% 11/30/14 | | 360,000 | | 363,150 |
10.75% 8/15/16 (f) | | 132,000 | | 141,570 |
Cooper Standard Auto, Inc. 8.5% 5/1/18 | | 145,000 | | 156,600 |
Dana Holding Corp.: | | | | |
6.5% 2/15/19 | | 345,000 | | 367,425 |
6.75% 2/15/21 | | 1,230,000 | | 1,328,400 |
Delphi Corp.: | | | | |
5.875% 5/15/19 | | 500,000 | | 532,500 |
6.125% 5/15/21 | | 490,000 | | 535,325 |
Exide Technologies 8.625% 2/1/18 | | 1,190,000 | | 937,125 |
International Automotive Components Group SA 9.125% 6/1/18 (f) | | 495,000 | | 454,163 |
Stoneridge, Inc. 9.5% 10/15/17 (f) | | 200,000 | | 205,250 |
Tenneco, Inc.: | | | | |
6.875% 12/15/20 | | 545,000 | | 588,600 |
7.75% 8/15/18 | | 125,000 | | 134,063 |
Tower Automotive Holdings USA LLC / TA Holdings Finance, Inc. 10.625% 9/1/17 (f) | | 414,000 | | 440,910 |
| | 6,185,081 |
|
| Principal Amount (d) | | Value |
Automobiles - 0.1% |
Automotores Gildemeister SA 8.25% 5/24/21 (f) | | $ 210,000 | | $ 217,350 |
Ford Motor Co. 7.45% 7/16/31 | | 238,000 | | 298,095 |
General Motors Corp.: | | | | |
6.75% 5/1/28 (c) | | 692,000 | | 0 |
7.125% 7/15/13 (c) | | 140,000 | | 0 |
7.2% 1/15/2011 (c) | | 350,000 | | 0 |
7.4% 9/1/25 (c) | | 45,000 | | 0 |
7.7% 4/15/16 (c) | | 531,000 | | 0 |
8.25% 7/15/23 (c) | | 415,000 | | 0 |
8.375% 7/15/33 (c) | | 605,000 | | 0 |
Jaguar Holding Co. II/Jaguar Merger Sub, Inc. 9.5% 12/1/19 (f) | | 390,000 | | 423,150 |
| | 938,595 |
Diversified Consumer Services - 0.0% |
ServiceMaster Co. 8% 2/15/20 | | 290,000 | | 315,738 |
Hotels, Restaurants & Leisure - 1.3% |
Arcos Dorados Holdings, Inc. 10.25% 7/13/16 (f) | BRL | 1,550,000 | | 812,236 |
Caesars Operating Escrow LLC / Caesars Escrow Corp. 8.5% 2/15/20 (f) | | 3,095,000 | | 3,118,213 |
Chester Downs & Marina LLC 9.25% 2/1/20 (f) | | 150,000 | | 155,250 |
Choice Hotels International, Inc. 5.75% 7/1/22 | | 145,000 | | 151,163 |
GWR Operating Partnership LLP/Great Wolf Finance Corp. 10.875% 4/1/17 | | 355,000 | | 395,825 |
MCE Finance Ltd. 10.25% 5/15/18 | | 620,000 | | 705,250 |
MGM Mirage, Inc. 10.375% 5/15/14 | | 100,000 | | 113,380 |
Mohegan Tribal Gaming Authority 11% 9/15/18 pay-in-kind (f)(k) | | 125,000 | | 82,813 |
MTR Gaming Group, Inc. 11.5% 8/1/19 pay-in-kind | | 1,211,025 | | 1,260,542 |
NAI Entertainment Holdings LLC/NAI Entertainment Finance Corp. 8.25% 12/15/17 (f) | | 240,000 | | 266,400 |
NCL Corp. Ltd. 9.5% 11/15/18 | | 125,000 | | 136,563 |
Palace Entertainment Holdings LLC/Corp. 8.875% 4/15/17 (f) | | 100,000 | | 103,250 |
Roadhouse Financing, Inc. 10.75% 10/15/17 | | 130,000 | | 124,800 |
Seven Seas Cruises S de RL LLC 9.125% 5/15/19 | | 60,000 | | 61,800 |
Shingle Springs Tribal Gaming Authority 9.375% 6/15/15 (f) | | 100,000 | | 76,500 |
Station Casinos LLC 3.66% 6/18/18 (e)(f) | | 2,035,000 | | 1,531,338 |
Sugarhouse HSP Gaming Prop Mezz LP/Sugarhouse HSP Gaming Finance Corp. 8.625% 4/15/16 (f) | | 50,000 | | 52,250 |
Corporate Bonds - continued |
| Principal Amount (d) | | Value |
Nonconvertible Bonds - continued |
CONSUMER DISCRETIONARY - continued |
Hotels, Restaurants & Leisure - continued |
Universal City Development Partners Ltd./UCDP Finance, Inc. 8.875% 11/15/15 | | $ 767,000 | | $ 821,857 |
Waterford Gaming LLC/Waterford Gaming Finance Corp. 8.625% 9/15/14 (f) | | 48,902 | | 18,583 |
Wok Acquisition Corp. 10.25% 6/30/20 (f) | | 260,000 | | 269,100 |
Wynn Las Vegas LLC/Wynn Las Vegas Capital Corp.: | | | | |
5.375% 3/15/22 (f) | | 1,440,000 | | 1,432,800 |
7.75% 8/15/20 | | 2,890,000 | | 3,179,000 |
| | 14,868,913 |
Household Durables - 0.9% |
Jarden Corp. 6.125% 11/15/22 | | 280,000 | | 299,600 |
Reliance Intermediate Holdings LP 9.5% 12/15/19 (f) | | 485,000 | | 533,500 |
Reynolds Group Issuer, Inc./Reynolds Group Issuer LLC/Reynolds Group Issuer (Luxembourg) SA: | | | | |
6.875% 2/15/21 (f) | | 565,000 | | 584,775 |
7.125% 4/15/19 (f) | | 1,185,000 | | 1,238,325 |
7.875% 8/15/19 (f) | | 670,000 | | 720,250 |
8.5% 5/15/18 (e)(f) | | 45,000 | | 43,200 |
8.5% 2/15/21 (e)(f) | | 1,955,000 | | 1,832,813 |
9% 4/15/19 (f) | | 2,275,000 | | 2,218,125 |
9.875% 8/15/19 (f) | | 1,095,000 | | 1,119,638 |
9.875% 8/15/19 (f) | | 345,000 | | 357,938 |
Sealy Mattress Co. 10.875% 4/15/16 (f) | | 86,000 | | 93,095 |
Standard Pacific Corp.: | | | | |
8.375% 5/15/18 | | 220,000 | | 240,350 |
8.375% 1/15/21 | | 420,000 | | 457,800 |
Toll Brothers Finance Corp. 5.875% 2/15/22 | | 515,000 | | 544,613 |
| | 10,284,022 |
Leisure Equipment & Products - 0.1% |
Cedar Fair LP/Magnum Management Corp. 9.125% 8/1/18 | | 645,000 | | 709,500 |
Easton-Bell Sports, Inc. 9.75% 12/1/16 | | 120,000 | | 131,400 |
| | 840,900 |
Media - 1.2% |
Bresnan Broadband Holdings LLC 8% 12/15/18 (f) | | 195,000 | | 203,775 |
|
| Principal Amount (d) | | Value |
CCO Holdings LLC/CCO Holdings Capital Corp.: | | | | |
6.5% 4/30/21 | | $ 935,000 | | $ 995,775 |
6.625% 1/31/22 | | 820,000 | | 877,400 |
7.375% 6/1/20 | | 555,000 | | 609,113 |
7.875% 4/30/18 | | 235,000 | | 255,563 |
8.125% 4/30/20 | | 565,000 | | 629,975 |
Cequel Communications Holdings I LLC/Cequel Capital Corp. 8.625% 11/15/17 (f) | | 770,000 | | 827,750 |
Charter Communications Holdings II LLC/Charter Communications Holdings II Capital Corp. 13.5% 11/30/16 | | 229,294 | | 255,663 |
Checkout Holding Corp. 0% 11/15/15 (f) | | 280,000 | | 130,200 |
DISH DBS Corp.: | | | | |
5.875% 7/15/22 (f) | | 1,465,000 | | 1,479,650 |
6.75% 6/1/21 | | 860,000 | | 926,650 |
EchoStar Communications Corp. 7.125% 2/1/16 | | 1,500,000 | | 1,642,500 |
Harron Communications LP/Harron Finance Corp. 9.125% 4/1/20 (f) | | 180,000 | | 186,300 |
Liberty Media Corp.: | | | | |
8.25% 2/1/30 | | 1,295,000 | | 1,330,613 |
8.5% 7/15/29 | | 230,000 | | 236,900 |
MDC Partners, Inc. 11% 11/1/16 | | 65,000 | | 69,225 |
MediMedia USA, Inc. 11.375% 11/15/14 (f) | | 50,000 | | 45,000 |
Sheridan Group, Inc. 12.5% 4/15/14 | | 272,335 | | 226,038 |
Sinclair Television Group, Inc. 8.375% 10/15/18 | | 300,000 | | 328,110 |
TV Azteca SA de CV 7.5% 5/25/18 (Reg. S) | | 400,000 | | 405,000 |
WMG Acquisition Corp. 11.5% 10/1/18 | | 1,460,000 | | 1,584,100 |
| | 13,245,300 |
Specialty Retail - 0.3% |
Asbury Automotive Group, Inc. 8.375% 11/15/20 | | 125,000 | | 135,625 |
Claire's Stores, Inc. 8.875% 3/15/19 | | 155,000 | | 132,525 |
Limited Brands, Inc. 5.625% 2/15/22 | | 805,000 | | 821,100 |
Office Depot, Inc. 9.75% 3/15/19 (f) | | 370,000 | | 360,750 |
Sally Holdings LLC 6.875% 11/15/19 | | 325,000 | | 352,625 |
Sonic Automotive, Inc. 9% 3/15/18 | | 760,000 | | 822,700 |
Spencer Spirit Holdings, Inc./Spencer Gifts LLC/Spirit Halloween Superstores 11% 5/1/17 (f) | | 255,000 | | 261,375 |
| | 2,886,700 |
Corporate Bonds - continued |
| Principal Amount (d) | | Value |
Nonconvertible Bonds - continued |
CONSUMER DISCRETIONARY - continued |
Textiles, Apparel & Luxury Goods - 0.1% |
Hanesbrands, Inc. 6.375% 12/15/20 | | $ 640,000 | | $ 675,200 |
Levi Strauss & Co. 7.625% 5/15/20 | | 775,000 | | 833,125 |
Polymer Group, Inc. 7.75% 2/1/19 | | 135,000 | | 142,763 |
| | 1,651,088 |
TOTAL CONSUMER DISCRETIONARY | | 51,216,337 |
CONSUMER STAPLES - 0.7% |
Beverages - 0.0% |
Cerveceria Nacional Dominicana C por A 8% 3/27/14 (Reg. S) | | 100,000 | | 103,000 |
Food & Staples Retailing - 0.3% |
Bi-Lo LLC/Bi-Lo Finance Corp. 9.25% 2/15/19 (f) | | 405,000 | | 435,375 |
Grifols, Inc. 8.25% 2/1/18 | | 430,000 | | 461,175 |
Rite Aid Corp.: | | | | |
8% 8/15/20 | | 370,000 | | 418,100 |
9.25% 3/15/20 (f) | | 825,000 | | 829,125 |
9.25% 3/15/20 (f) | | 500,000 | | 502,500 |
9.75% 6/12/16 | | 50,000 | | 55,250 |
10.25% 10/15/19 | | 160,000 | | 180,000 |
| | 2,881,525 |
Food Products - 0.3% |
Darling International, Inc. 8.5% 12/15/18 | | 100,000 | | 112,500 |
Dean Foods Co. 9.75% 12/15/18 | | 635,000 | | 711,200 |
Gruma SAB de CV 7.75% (Reg. S) (g) | | 625,000 | | 625,000 |
JBS USA LLC/JBS USA Finance, Inc.: | | | | |
8.25% 2/1/20 (f) | | 330,000 | | 325,050 |
11.625% 5/1/14 | | 330,000 | | 376,200 |
MHP SA 10.25% 4/29/15 (f) | | 390,000 | | 372,450 |
Michael Foods, Inc. 9.75% 7/15/18 | | 155,000 | | 170,113 |
Smithfield Foods, Inc. 10% 7/15/14 | | 380,000 | | 432,250 |
| | 3,124,763 |
Household Products - 0.0% |
Harbinger Group, Inc. 10.625% 11/15/15 | | 230,000 | | 239,775 |
Spectrum Brands Holdings, Inc. 9.5% 6/15/18 (f) | | 280,000 | | 316,400 |
| | 556,175 |
|
| Principal Amount (d) | | Value |
Personal Products - 0.1% |
Elizabeth Arden, Inc. 7.375% 3/15/21 | | $ 135,000 | | $ 147,488 |
NBTY, Inc. 9% 10/1/18 | | 425,000 | | 470,178 |
Prestige Brands, Inc. 8.125% 2/1/20 (f) | | 75,000 | | 81,938 |
Revlon Consumer Products Corp. 9.75% 11/15/15 | | 300,000 | | 321,750 |
| | 1,021,354 |
TOTAL CONSUMER STAPLES | | 7,686,817 |
ENERGY - 5.1% |
Energy Equipment & Services - 0.2% |
Atwood Oceanics, Inc. 6.5% 2/1/20 | | 110,000 | | 114,950 |
Chesapeake Oilfield Operating LLC 6.625% 11/15/19 (f) | | 560,000 | | 504,000 |
Forbes Energy Services Ltd. 9% 6/15/19 | | 350,000 | | 325,500 |
Helix Energy Solutions Group, Inc. 9.5% 1/15/16 (f) | | 139,000 | | 145,255 |
Oil States International, Inc. 6.5% 6/1/19 | | 360,000 | | 374,400 |
Pioneer Drilling Co. 9.875% 3/15/18 | | 275,000 | | 288,750 |
Precision Drilling Corp. 6.5% 12/15/21 | | 90,000 | | 91,800 |
Pride International, Inc. 6.875% 8/15/20 | | 260,000 | | 320,128 |
Trinidad Drilling Ltd. 7.875% 1/15/19 (f) | | 140,000 | | 149,100 |
| | 2,313,883 |
Oil, Gas & Consumable Fuels - 4.9% |
Afren PLC 11.5% 2/1/16 (f) | | 200,000 | | 211,500 |
Alpha Natural Resources, Inc.: | | | | |
6% 6/1/19 | | 345,000 | | 294,113 |
6.25% 6/1/21 | | 135,000 | | 113,400 |
ATP Oil & Gas Corp. 11.875% 5/1/15 | | 960,000 | | 441,600 |
Berry Petroleum Co. 10.25% 6/1/14 | | 145,000 | | 162,400 |
Calumet Specialty Products Partners LP/Calumet Finance Corp.: | | | | |
9.375% 5/1/19 | | 350,000 | | 353,750 |
9.625% 8/1/20 (f) | | 485,000 | | 485,000 |
Carrizo Oil & Gas, Inc. 8.625% 10/15/18 | | 2,295,000 | | 2,386,800 |
Chaparral Energy, Inc. 9.875% 10/1/20 | | 155,000 | | 172,050 |
Clayton Williams Energy, Inc. 7.75% 4/1/19 | | 460,000 | | 450,800 |
Concho Resources, Inc.: | | | | |
6.5% 1/15/22 | | 575,000 | | 598,000 |
Corporate Bonds - continued |
| Principal Amount (d) | | Value |
Nonconvertible Bonds - continued |
ENERGY - continued |
Oil, Gas & Consumable Fuels - continued |
Concho Resources, Inc.: - continued | | | | |
7% 1/15/21 | | $ 250,000 | | $ 266,875 |
8.625% 10/1/17 | | 155,000 | | 171,663 |
Continental Resources, Inc.: | | | | |
5% 9/15/22 (f) | | 960,000 | | 973,248 |
7.125% 4/1/21 | | 215,000 | | 237,575 |
8.25% 10/1/19 | | 65,000 | | 72,475 |
Crestwood Midstream Partners LP / Finance Corp. 7.75% 4/1/19 | | 200,000 | | 198,500 |
Crosstex Energy L.P./Crosstex Energy Finance Corp. 8.875% 2/15/18 | | 390,000 | | 408,525 |
Denbury Resources, Inc.: | | | | |
8.25% 2/15/20 | | 308,000 | | 336,490 |
9.75% 3/1/16 | | 105,000 | | 114,713 |
DTEK Finance BV 9.5% 4/28/15 (f) | | 130,000 | | 126,100 |
Eagle Rock Energy Partners LP / Eagle Rock Energy Finance Corp. 8.375% 6/1/19 | | 480,000 | | 478,800 |
Endeavour International Corp. 12% 3/1/18 (f) | | 590,000 | | 616,550 |
Energy Partners Ltd. 8.25% 2/15/18 | | 585,000 | | 577,688 |
Energy Transfer Equity LP 7.5% 10/15/20 | | 860,000 | | 943,850 |
Energy XXI Gulf Coast, Inc. 9.25% 12/15/17 | | 1,110,000 | | 1,187,700 |
EXCO Resources, Inc. 7.5% 9/15/18 | | 1,300,000 | | 1,072,500 |
Goodrich Petroleum Corp. 8.875% 3/15/19 | | 305,000 | | 289,750 |
KazMunaiGaz Finance Sub BV: | | | | |
6.375% 4/9/21 (f) | | 320,000 | | 352,800 |
7% 5/5/20 (f) | | 360,000 | | 409,500 |
9.125% 7/2/18 (f) | | 480,000 | | 595,824 |
11.75% 1/23/15 (f) | | 370,000 | | 440,300 |
Laredo Pete, Inc. 7.375% 5/1/22 (f) | | 600,000 | | 622,500 |
LINN Energy LLC/LINN Energy Finance Corp.: | | | | |
7.75% 2/1/21 | | 2,640,000 | | 2,778,600 |
8.625% 4/15/20 | | 1,190,000 | | 1,282,225 |
Markwest Energy Partners LP/Markwest Energy Finance Corp.: | | | | |
6.25% 6/15/22 | | 935,000 | | 963,050 |
6.75% 11/1/20 | | 160,000 | | 169,200 |
Naftogaz of Ukraine NJSC 9.5% 9/30/14 | | 425,000 | | 405,365 |
Newfield Exploration Co.: | | | | |
5.625% 7/1/24 | | 525,000 | | 536,813 |
|
| Principal Amount (d) | | Value |
6.875% 2/1/20 | | $ 1,025,000 | | $ 1,086,500 |
Northern Tier Energy LLC/Northern Tier Finance Corp. 10.5% 12/1/17 | | 400,000 | | 428,000 |
OGX Petroleo e Gas Participacoes SA 8.5% 6/1/18 (f) | | 2,510,000 | | 2,246,450 |
Pacific Rubiales Energy Corp. 7.25% 12/12/21 (f) | | 830,000 | | 904,700 |
Pan American Energy LLC 7.875% 5/7/21 (f) | | 310,000 | | 261,950 |
PBF Holding Co. LLC/PBF Finance Corp. 8.25% 2/15/20 (f) | | 930,000 | | 925,350 |
Pemex Project Funding Master Trust: | | | | |
5.75% 3/1/18 | | 485,000 | | 549,263 |
6.625% 6/15/35 | | 1,320,000 | | 1,584,000 |
PetroBakken Energy Ltd. 8.625% 2/1/20 (f) | | 665,000 | | 658,350 |
Petrobras International Finance Co. Ltd.: | | | | |
5.375% 1/27/21 | | 525,000 | | 565,830 |
6.875% 1/20/40 | | 310,000 | | 372,248 |
8.375% 12/10/18 | | 445,000 | | 550,821 |
Petrohawk Energy Corp. 7.875% 6/1/15 | | 1,615,000 | | 1,678,896 |
Petroleos de Venezuela SA: | | | | |
4.9% 10/28/14 | | 2,255,000 | | 1,939,300 |
5% 10/28/15 | | 295,000 | | 229,363 |
5.375% 4/12/27 | | 1,700,000 | | 973,250 |
5.5% 4/12/37 | | 800,000 | | 454,000 |
8% 11/17/13 | | 460,000 | | 457,700 |
8.5% 11/2/17 (f) | | 4,950,000 | | 4,009,500 |
9% 11/17/21 (Reg. S) | | 800,000 | | 586,000 |
12.75% 2/17/22 (f) | | 1,840,000 | | 1,729,600 |
Petroleos Mexicanos: | | | | |
4.875% 1/24/22 (f) | | 410,000 | | 444,850 |
5.5% 1/21/21 | | 455,000 | | 516,425 |
5.5% 6/27/44 (f) | | 370,000 | | 380,175 |
6% 3/5/20 | | 345,000 | | 402,356 |
6.5% 6/2/41 | | 200,000 | | 233,500 |
6.5% 6/2/41 (f) | | 210,000 | | 247,275 |
6.625% (f)(g) | | 1,395,000 | | 1,422,900 |
8% 5/3/19 | | 280,000 | | 359,100 |
Petroleum Development Corp. 12% 2/15/18 | | 265,000 | | 283,550 |
Pioneer Natural Resources Co. 7.5% 1/15/20 | | 640,000 | | 793,600 |
PT Adaro Indonesia 7.625% 10/22/19 (f) | | 405,000 | | 427,291 |
PT Pertamina Persero: | | | | |
4.875% 5/3/22 (f) | | 475,000 | | 475,000 |
5.25% 5/23/21 (f) | | 295,000 | | 303,850 |
6% 5/3/42 (f) | | 475,000 | | 469,063 |
6.5% 5/27/41 (f) | | 315,000 | | 329,963 |
Corporate Bonds - continued |
| Principal Amount (d) | | Value |
Nonconvertible Bonds - continued |
ENERGY - continued |
Oil, Gas & Consumable Fuels - continued |
Regency Energy Partners LP/Regency Energy Finance Corp. 6.875% 12/1/18 | | $ 550,000 | | $ 580,250 |
Rosetta Resources, Inc. 9.5% 4/15/18 | | 290,000 | | 310,648 |
Southern Star Central Corp. 6.75% 3/1/16 | | 90,000 | | 90,900 |
Targa Resources Partners LP/Targa Resources Partners Finance Corp.: | | | | |
6.375% 8/1/22 (f) | | 265,000 | | 264,338 |
6.875% 2/1/21 | | 240,000 | | 249,600 |
11.25% 7/15/17 | | 290,000 | | 326,975 |
Teekay Corp. 8.5% 1/15/20 | | 295,000 | | 300,163 |
Tennessee Gas Pipeline Co.: | | | | |
7% 10/15/28 | | 20,000 | | 25,041 |
7.625% 4/1/37 | | 50,000 | | 61,468 |
8.375% 6/15/32 | | 40,000 | | 52,323 |
Venoco, Inc.: | | | | |
8.875% 2/15/19 | | 640,000 | | 571,200 |
11.5% 10/1/17 | | 410,000 | | 430,500 |
WPX Energy, Inc. 6% 1/15/22 | | 690,000 | | 686,550 |
YPF SA 10% 11/2/28 | | 280,000 | | 274,400 |
| | 55,802,917 |
TOTAL ENERGY | | 58,116,800 |
FINANCIALS - 7.1% |
Capital Markets - 0.1% |
Equinox Holdings, Inc. 9.5% 2/1/16 (f) | | 460,000 | | 487,600 |
Lloyds TSB Bank PLC 4.875% 3/30/27 | GBP | 500,000 | | 831,413 |
Penson Worldwide, Inc. 12.5% 5/15/17 (f) | | 290,000 | | 37,700 |
| | 1,356,713 |
Commercial Banks - 1.9% |
Abbey National Treasury Services PLC 5.25% 2/16/29 | GBP | 350,000 | | 575,666 |
African Export-Import Bank 8.75% 11/13/14 | | 195,000 | | 213,769 |
Akbank T.A.S.: | | | | |
5.125% 7/22/15 (f) | | 610,000 | | 616,863 |
6.5% 3/9/18 (f) | | 150,000 | | 156,375 |
Banco Nacional de Desenvolvimento Economico e Social 6.5% 6/10/19 (f) | | 125,000 | | 149,063 |
Barclays Bank PLC 4.25% 1/12/22 | GBP | 350,000 | | 583,722 |
BBVA Paraguay SA 9.75% 2/11/16 (f) | | 450,000 | | 459,000 |
|
| Principal Amount (d) | | Value |
CIT Group, Inc.: | | | | |
5% 5/15/17 | | $ 1,220,000 | | $ 1,250,500 |
5.25% 3/15/18 | | 2,400,000 | | 2,478,000 |
5.375% 5/15/20 | | 1,055,000 | | 1,078,738 |
5.5% 2/15/19 (f) | | 3,535,000 | | 3,632,213 |
7% 5/2/17 (f) | | 831,167 | | 832,206 |
Co-Operative Bank PLC 4.75% 11/11/21 | GBP | 400,000 | | 665,815 |
Development Bank of Philippines 8.375% (g)(k) | | 620,000 | | 666,500 |
Eastern and Southern African Trade and Development Bank 6.875% 1/9/16 (Reg. S) | | 400,000 | | 388,000 |
European Investment Bank 5.375% 6/7/21 | GBP | 500,000 | | 933,848 |
Georgia Bank Joint Stock Co. 7.75% 7/5/17 (f) | | 290,000 | | 286,375 |
HSBK (Europe) BV: | | | | |
7.25% 5/3/17 (f) | | 535,000 | | 536,338 |
9.25% 10/16/13 (f) | | 330,000 | | 341,550 |
International Bank for Reconstruction & Development: | | | | |
8% 6/20/13 | NGN | 40,000,000 | | 225,892 |
8.2% 12/12/12 | NGN | 80,000,000 | | 464,516 |
JSC Kazkommertsbank BV 8% 11/3/15 (f) | | 455,000 | | 420,875 |
Kazkommerts International BV 7.875% 4/7/14 (Reg. S) | | 170,000 | | 166,813 |
Nordea Bank Finland PLC 2.25% 11/16/15 | EUR | 450,000 | | 590,876 |
Royal Bank of Scotland PLC 5.125% 1/13/24 | GBP | 500,000 | | 881,623 |
RSHB Capital SA: | | | | |
6% 6/3/21 (f) | | 200,000 | | 196,500 |
9% 6/11/14 (f) | | 210,000 | | 231,000 |
SSB #1 PLC 8.25% 3/10/16 | | 200,000 | | 169,500 |
The State Export-Import Bank of Ukraine JSC 5.7928% 2/9/16 (Issued by Credit Suisse First Boston International for The State Export-Import Bank of Ukraine JSC) (e) | | 500,000 | | 385,000 |
Trade & Development Bank of Mongolia LLC 8.5% 10/25/13 | | 400,000 | | 400,000 |
US Bank NA 1.076% 2/28/17 (k) | EUR | 100,000 | | 115,464 |
Vimpel Communications 8.25% 5/23/16 (Reg. S) (Issued by UBS Luxembourg SA for Vimpel Communications) | | 1,015,000 | | 1,058,138 |
Vnesheconombank Via VEB Finance PLC 6.025% 7/5/22 (f) | | 300,000 | | 302,640 |
Yapi ve Kredi Bankasi A/S 6.75% 2/8/17 (f) | | 470,000 | | 474,700 |
| | 21,928,078 |
Corporate Bonds - continued |
| Principal Amount (d) | | Value |
Nonconvertible Bonds - continued |
FINANCIALS - continued |
Consumer Finance - 2.6% |
Ally Financial, Inc.: | | | | |
3.6669% 2/11/14 (k) | | $ 750,000 | | $ 735,000 |
5.5% 2/15/17 | | 750,000 | | 763,125 |
7.5% 9/15/20 | | 3,970,000 | | 4,466,250 |
8% 3/15/20 | | 3,835,000 | | 4,410,250 |
Ford Motor Credit Co. LLC: | | | | |
4.25% 2/3/17 | | 2,390,000 | | 2,505,265 |
5.75% 2/1/21 | | 240,000 | | 263,400 |
5.875% 8/2/21 | | 1,760,000 | | 1,958,014 |
12% 5/15/15 | | 1,620,000 | | 2,016,900 |
General Motors Acceptance Corp.: | | | | |
6.75% 12/1/14 | | 915,000 | | 951,600 |
8% 11/1/31 | | 2,545,000 | | 2,940,625 |
GMAC LLC: | | | | |
6.75% 12/1/14 | | 280,000 | | 295,400 |
8% 11/1/31 | | 5,653,000 | | 6,599,878 |
SLM Corp.: | | | | |
6% 1/25/17 | | 930,000 | | 955,575 |
7.25% 1/25/22 | | 475,000 | | 494,000 |
8% 3/25/20 | | 725,000 | | 793,875 |
| | 30,149,157 |
Diversified Financial Services - 1.8% |
Aquarius Investments Luxemburg 8.25% 2/18/16 | | 600,000 | | 630,000 |
Biz Finance PLC 8.375% 4/27/15 (Reg. S) | | 650,000 | | 581,750 |
BP Capital Markets PLC 3.83% 10/6/17 | EUR | 250,000 | | 343,982 |
CDW LLC/CDW Finance Corp. 8% 12/15/18 (e) | | 140,000 | | 151,200 |
Dignity Finance PLC: | | | | |
6.31% 12/31/23 (Reg. S) | GBP | 18,102 | | 34,076 |
8.151% 12/31/30 | GBP | 30,000 | | 64,670 |
European Economic Community 2.875% 4/4/28 | EUR | 600,000 | | 749,546 |
Everest Acquisition LLC / Everest Acquisition Finance, Inc.: | | | | |
6.875% 5/1/19 (f) | | 560,000 | | 582,400 |
9.375% 5/1/20 (f) | | 2,340,000 | | 2,421,900 |
Fibria Overseas Finance Ltd. 7.5% 5/4/20 (f) | | 415,000 | | 431,600 |
GE Capital UK Funding 4.375% 7/31/19 | GBP | 550,000 | | 904,217 |
General Motors Financial Co., Inc. 6.75% 6/1/18 | | 575,000 | | 628,188 |
Hilcorp Energy I LP/Hilcorp Finance Co. 7.625% 4/15/21 (f) | | 360,000 | | 381,600 |
Icahn Enterprises LP/Icahn Enterprises Finance Corp.: | | | | |
7.75% 1/15/16 | | 1,195,000 | | 1,256,244 |
|
| Principal Amount (d) | | Value |
8% 1/15/18 | | $ 3,243,000 | | $ 3,445,688 |
Indo Energy Finance BV 7% 5/7/18 (f) | | 425,000 | | 414,375 |
Magnesita Finance Ltd. 8.625% (f)(g) | | 400,000 | | 398,000 |
Offshore Group Investment Ltd. 11.5% 8/1/15 | | 500,000 | | 537,500 |
Porterbrook Rail Finance Ltd. 5.5% 4/20/19 | GBP | 150,000 | | 255,058 |
Regions Financing Trust II 6.625% 5/15/47 (k) | | 470,000 | | 446,500 |
TMK Capital SA 7.75% 1/27/18 | | 450,000 | | 420,750 |
Transportation Union LLC/Transportation Union Financing Corp. 11.375% 6/15/18 | | 1,055,000 | | 1,242,263 |
TransUnion Holding Co., Inc. 9.625% 6/15/18 pay-in-kind (f)(k) | | 290,000 | | 311,750 |
Unitymedia Hessen GmbH & Co. KG/Unitymedia NRW GmbH 8.125% 12/1/17 (f) | | 560,000 | | 600,600 |
Vnesheconombank Via VEB Finance PLC: | | | | |
5.375% 2/13/17 (f) | | 300,000 | | 310,500 |
6.8% 11/22/25 (f) | | 300,000 | | 313,500 |
6.902% 7/9/20 (f) | | 725,000 | | 786,625 |
Wind Acquisition Holdings Finance SA 12.25% 7/15/17 pay-in-kind (f)(k) | | 1,673,411 | | 1,052,901 |
Zhaikmunai Finance BV 10.5% 10/19/15 (f) | | 975,000 | | 970,125 |
| | 20,667,508 |
Insurance - 0.0% |
CNO Financial Group, Inc. 9% 1/15/18 (f) | | 255,000 | | 271,575 |
Real Estate Investment Trusts - 0.3% |
MPT Operating Partnership LP/MPT Finance Corp. 6.875% 5/1/21 | | 725,000 | | 754,000 |
Omega Healthcare Investors, Inc.: | | | | |
5.875% 3/15/24 (f) | | 1,385,000 | | 1,381,538 |
6.75% 10/15/22 | | 725,000 | | 772,125 |
7.5% 2/15/20 | | 385,000 | | 420,613 |
| | 3,328,276 |
Real Estate Management & Development - 0.4% |
CB Richard Ellis Services, Inc. 6.625% 10/15/20 | | 480,000 | | 508,800 |
Realogy Corp.: | | | | |
7.625% 1/15/20 (f) | | 630,000 | | 653,625 |
7.875% 2/15/19 (f) | | 677,000 | | 668,538 |
9% 1/15/20 (f) | | 1,515,000 | | 1,556,663 |
11.5% 4/15/17 | | 30,000 | | 28,350 |
12% 4/15/17 | | 139,213 | | 130,164 |
Corporate Bonds - continued |
| Principal Amount (d) | | Value |
Nonconvertible Bonds - continued |
FINANCIALS - continued |
Real Estate Management & Development - continued |
Taylor Morrison Community Monarch 7.75% 4/15/20 (f) | | $ 385,000 | | $ 399,438 |
Tesco Property Finance 5 PLC 5.6611% 10/13/41 | GBP | 249,206 | | 401,504 |
Toys 'R' Us Property Co. II LLC 8.5% 12/1/17 | | 65,000 | | 67,925 |
| | 4,415,007 |
TOTAL FINANCIALS | | 82,116,314 |
HEALTH CARE - 3.6% |
Health Care Equipment & Supplies - 0.2% |
DJO Finance LLC/DJO Finance Corp. 8.75% 3/15/18 (f) | | 175,000 | | 181,125 |
Kinetic Concepts, Inc./KCI (USA), Inc.: | | | | |
10.5% 11/1/18 (f) | | 1,400,000 | | 1,463,000 |
12.5% 11/1/19 (f) | | 945,000 | | 845,775 |
| | 2,489,900 |
Health Care Providers & Services - 2.9% |
Community Health Systems, Inc. 8% 11/15/19 | | 1,295,000 | | 1,372,700 |
CRC Health Group, Inc. 10.75% 2/1/16 | | 90,000 | | 79,200 |
DaVita, Inc.: | | | | |
6.375% 11/1/18 | | 1,180,000 | | 1,227,200 |
6.625% 11/1/20 | | 1,375,000 | | 1,430,000 |
Emergency Medical Services Corp. 8.125% 6/1/19 | | 580,000 | | 605,375 |
Fresenius Medical Care US Finance II, Inc.: | | | | |
5.625% 7/31/19 (f) | | 1,510,000 | | 1,574,175 |
5.875% 1/31/22 (f) | | 1,670,000 | | 1,745,150 |
Gentiva Health Services, Inc. 11.5% 9/1/18 | | 475,000 | | 408,500 |
Hanger, Inc. 7.125% 11/15/18 | | 1,230,000 | | 1,266,900 |
HCA Holdings, Inc. 7.75% 5/15/21 | | 6,940,000 | | 7,434,475 |
HCA, Inc.: | | | | |
5.875% 3/15/22 | | 1,915,000 | | 1,998,781 |
6.5% 2/15/16 | | 275,000 | | 294,938 |
6.5% 2/15/20 | | 2,410,000 | | 2,620,875 |
7.25% 9/15/20 | | 1,935,000 | | 2,113,988 |
7.5% 2/15/22 | | 1,175,000 | | 1,277,813 |
8% 10/1/18 | | 135,000 | | 151,200 |
Health Management Associates, Inc. 7.375% 1/15/20 (f) | | 290,000 | | 308,125 |
HealthSouth Corp. 8.125% 2/15/20 | | 575,000 | | 626,750 |
|
| Principal Amount (d) | | Value |
IASIS Healthcare LLC/IASIS Capital Corp. 8.375% 5/15/19 | | $ 1,210,000 | | $ 1,191,850 |
InVentiv Health, Inc. 10% 8/15/18 (f) | | 75,000 | | 61,875 |
Radiation Therapy Services, Inc. 8.875% 1/15/17 (f) | | 410,000 | | 393,600 |
ResCare, Inc. 10.75% 1/15/19 | | 240,000 | | 265,800 |
Rotech Healthcare, Inc. 10.5% 3/15/18 | | 220,000 | | 110,000 |
Sabra Health Care LP/Sabra Capital Corp. 8.125% 11/1/18 | | 105,000 | | 112,875 |
Tenet Healthcare Corp. 6.25% 11/1/18 | | 3,730,000 | | 3,925,825 |
UHS Escrow Corp. 7% 10/1/18 | | 85,000 | | 91,588 |
Vanguard Health Holding Co. II LLC / Vanguard Holding Co. II, Inc. 7.75% 2/1/19 | | 375,000 | | 378,750 |
Vanguard Health Systems, Inc. 0% 2/1/16 | | 21,000 | | 14,490 |
| | 33,082,798 |
Health Care Technology - 0.1% |
ConvaTec Healthcare ESA 10.5% 12/15/18 (f) | | 425,000 | | 430,313 |
Thomson Reuters Healthcare, Inc. 10.625% 6/1/20 (f) | | 435,000 | | 454,575 |
| | 884,888 |
Pharmaceuticals - 0.4% |
Elan Finance PLC/Elan Finance Corp. 8.75% 10/15/16 | | 435,000 | | 474,150 |
Leiner Health Products, Inc. 11% 6/1/49 (c) | | 90,000 | | 0 |
Mylan, Inc.: | | | | |
6% 11/15/18 (f) | | 950,000 | | 995,125 |
7.625% 7/15/17 (f) | | 315,000 | | 346,500 |
7.875% 7/15/20 (f) | | 570,000 | | 641,250 |
Valeant Pharmaceuticals International: | | | | |
6.75% 8/15/21 (f) | | 1,250,000 | | 1,225,000 |
6.875% 12/1/18 (f) | | 805,000 | | 833,175 |
| | 4,515,200 |
TOTAL HEALTH CARE | | 40,972,786 |
INDUSTRIALS - 3.9% |
Aerospace & Defense - 0.2% |
Alion Science & Technology Corp.: | | | | |
10.25% 2/1/15 | | 50,000 | | 21,000 |
12% 11/1/14 pay-in-kind | | 119,928 | | 112,046 |
Huntington Ingalls Industries, Inc.: | | | | |
6.875% 3/15/18 | | 1,750,000 | | 1,824,375 |
7.125% 3/15/21 | | 150,000 | | 156,750 |
| | 2,114,171 |
Corporate Bonds - continued |
| Principal Amount (d) | | Value |
Nonconvertible Bonds - continued |
INDUSTRIALS - continued |
Air Freight & Logistics - 0.0% |
Air Medical Group Holdings, Inc. 9.25% 11/1/18 (f) | | $ 285,000 | | $ 296,400 |
Airlines - 0.6% |
Air Canada 9.25% 8/1/15 (f) | | 595,000 | | 577,150 |
American Airlines, Inc. equipment trust certificate 13% 8/1/16 | | 243,820 | | 259,668 |
American Airlines, Inc. pass-thru trust certificates 10.375% 7/2/19 | | 363,756 | | 391,037 |
Continental Airlines, Inc.: | | | | |
pass-thru trust certificates 6.903% 4/19/22 | | 47,696 | | 49,007 |
3.5919% 6/2/13 (k) | | 2,532,916 | | 2,482,257 |
Continental Airlines, Inc. 7.25% 11/10/19 | | 351,681 | | 398,278 |
Delta Air Lines, Inc. 9.5% 9/15/14 (f) | | 91,000 | | 96,460 |
Delta Air Lines, Inc. pass-thru trust certificates: | | | | |
6.821% 8/10/22 | | 538,706 | | 579,109 |
8.021% 8/10/22 | | 227,595 | | 230,167 |
Northwest Airlines, Inc. pass-thru trust certificates: | | | | |
7.027% 11/1/19 | | 118,756 | | 125,882 |
8.028% 11/1/17 | | 38,465 | | 38,850 |
United Air Lines, Inc.: | | | | |
9.875% 8/1/13 (f) | | 137,000 | | 142,480 |
12% 11/1/13 (f) | | 270,000 | | 281,475 |
United Air Lines, Inc. pass-thru trust certificates 9.75% 1/15/17 | | 555,199 | | 631,539 |
US Airways 2011-1 Class A pass-thru trust certificates 7.125% 4/22/25 | | 482,128 | | 511,056 |
| | 6,794,415 |
Building Products - 0.1% |
Building Materials Corp. of America 6.75% 5/1/21 (f) | | 425,000 | | 454,750 |
HD Supply, Inc. 11% 4/15/20 (f) | | 1,110,000 | | 1,193,250 |
| | 1,648,000 |
Commercial Services & Supplies - 1.9% |
ADS Tactical, Inc. 11% 4/1/18 (f) | | 145,000 | | 142,825 |
American Reprographics Co. 10.5% 12/15/16 | | 395,000 | | 395,000 |
B-Corp Merger Sub, Inc. 8.25% 6/1/19 (f) | | 270,000 | | 267,975 |
Casella Waste Systems, Inc.: | | | | |
7.75% 2/15/19 | | 100,000 | | 98,000 |
11% 7/15/14 | | 105,000 | | 110,250 |
Covanta Holding Corp. 7.25% 12/1/20 | | 430,000 | | 465,868 |
|
| Principal Amount (d) | | Value |
Garda World Security Corp. 9.75% 3/15/17 (f) | | $ 185,000 | | $ 195,638 |
International Lease Finance Corp.: | | | | |
5.75% 5/15/16 | | 1,155,000 | | 1,172,325 |
5.875% 4/1/19 | | 3,665,000 | | 3,628,350 |
6.25% 5/15/19 | | 2,320,000 | | 2,363,500 |
6.75% 9/1/16 (f) | | 1,363,000 | | 1,475,448 |
7.125% 9/1/18 (f) | | 2,505,000 | | 2,780,550 |
8.25% 12/15/20 | | 1,220,000 | | 1,393,850 |
8.625% 9/15/15 | | 655,000 | | 725,413 |
8.625% 1/15/22 | | 2,890,000 | | 3,345,175 |
8.75% 3/15/17 | | 1,570,000 | | 1,766,250 |
The Geo Group, Inc. 7.75% 10/15/17 | | 220,000 | | 234,300 |
United Rentals North America, Inc. 8.375% 9/15/20 | | 605,000 | | 627,688 |
WP Rocket Merger Sub, Inc. 10.125% 7/15/19 (f) | | 320,000 | | 310,400 |
| | 21,498,805 |
Construction & Engineering - 0.1% |
Odebrecht Finance Ltd. 7.5% (f)(g) | | 1,075,000 | | 1,104,885 |
Electrical Equipment - 0.0% |
General Cable Corp. 7.125% 4/1/17 | | 40,000 | | 41,000 |
Sensata Technologies BV 6.5% 5/15/19 (f) | | 485,000 | | 501,975 |
| | 542,975 |
Industrial Conglomerates - 0.0% |
Sequa Corp. 13.5% 12/1/15 pay-in-kind (f) | | 280,685 | | 298,930 |
Machinery - 0.1% |
Accuride Corp. 9.5% 8/1/18 | | 55,000 | | 56,650 |
ArvinMeritor, Inc. 10.625% 3/15/18 | | 170,000 | | 178,925 |
Terex Corp. 10.875% 6/1/16 | | 330,000 | | 367,950 |
| | 603,525 |
Marine - 0.1% |
Navios Maritime Acquisition Corp./Navios Acquisition Finance US, Inc. 8.625% 11/1/17 | | 220,000 | | 205,700 |
Navios Maritime Holdings, Inc.: | | | | |
8.125% 2/15/19 | | 420,000 | | 367,500 |
8.875% 11/1/17 | | 925,000 | | 943,500 |
Navios South American Logisitcs, Inc./Navios Logistics Finance U.S., Inc. 9.25% 4/15/19 | | 120,000 | | 110,400 |
Ultrapetrol (Bahamas) Ltd. 9% 11/24/14 | | 95,000 | | 76,000 |
| | 1,703,100 |
Road & Rail - 0.5% |
JSC Georgian Railway 7.75% 7/11/22 (f) | | 200,000 | | 200,250 |
Corporate Bonds - continued |
| Principal Amount (d) | | Value |
Nonconvertible Bonds - continued |
INDUSTRIALS - continued |
Road & Rail - continued |
Kansas City Southern de Mexico SA de CV: | | | | |
6.125% 6/15/21 | | $ 230,000 | | $ 253,000 |
8% 2/1/18 | | 2,500,000 | | 2,784,500 |
12.5% 4/1/16 | | 855,000 | | 966,150 |
NESCO LLC/NESCO Holdings Corp. 11.75% 4/15/17 (f) | | 350,000 | | 358,750 |
Swift Services Holdings, Inc. 10% 11/15/18 | | 870,000 | | 939,600 |
Western Express, Inc. 12.5% 4/15/15 (f) | | 485,000 | | 293,425 |
| | 5,795,675 |
Trading Companies & Distributors - 0.2% |
Aircastle Ltd.: | | | | |
6.75% 4/15/17 | | 680,000 | | 686,800 |
7.625% 4/15/20 | | 305,000 | | 311,100 |
9.75% 8/1/18 | | 755,000 | | 834,275 |
| | 1,832,175 |
Transportation Infrastructure - 0.1% |
Aeropuertos Argentina 2000 SA 10.75% 12/1/20 (f) | | 537,680 | | 440,898 |
Great Rolling Stock Co. Ltd. 6.25% 7/27/20 | GBP | 100,000 | | 177,284 |
| | 618,182 |
TOTAL INDUSTRIALS | | 44,851,238 |
INFORMATION TECHNOLOGY - 1.4% |
Communications Equipment - 0.3% |
Avaya, Inc.: | | | | |
9.75% 11/1/15 | | 555,000 | | 448,163 |
10.125% 11/1/15 pay-in-kind (k) | | 370,000 | | 299,700 |
Brocade Communications Systems, Inc.: | | | | |
6.625% 1/15/18 | | 620,000 | | 647,900 |
6.875% 1/15/20 | | 170,000 | | 184,450 |
Lucent Technologies, Inc.: | | | | |
6.45% 3/15/29 | | 3,375,000 | | 2,295,000 |
6.5% 1/15/28 | | 430,000 | | 290,250 |
| | 4,165,463 |
Computers & Peripherals - 0.1% |
Seagate HDD Cayman: | | | | |
7% 11/1/21 | | 580,000 | | 624,950 |
7.75% 12/15/18 | | 795,000 | | 876,488 |
| | 1,501,438 |
Electronic Equipment & Components - 0.1% |
Atkore International, Inc. 9.875% 1/1/18 | | 190,000 | | 184,300 |
|
| Principal Amount (d) | | Value |
Reddy Ice Corp.: | | | | |
11.25% 3/15/15 | | $ 1,075,000 | | $ 1,025,228 |
13.25% 11/1/15 (c) | | 130,000 | | 29,900 |
| | 1,239,428 |
Internet Software & Services - 0.1% |
Equinix, Inc. 8.125% 3/1/18 | | 665,000 | | 736,488 |
IT Services - 0.4% |
Ceridian Corp.: | | | | |
8.875% 7/15/19 (f)(i) | | 420,000 | | 433,650 |
11.25% 11/15/15 | | 425,000 | | 409,063 |
Fidelity National Information Services, Inc.: | | | | |
7.625% 7/15/17 | | 240,000 | | 264,600 |
7.875% 7/15/20 | | 320,000 | | 357,600 |
First Data Corp. 7.375% 6/15/19 (f) | | 2,420,000 | | 2,474,450 |
SunGard Data Systems, Inc. 7.375% 11/15/18 | | 385,000 | | 411,950 |
Unisys Corp.: | | | | |
12.5% 1/15/16 | | 154,000 | | 163,240 |
12.75% 10/15/14 (f) | | 17,000 | | 18,530 |
| | 4,533,083 |
Semiconductors & Semiconductor Equipment - 0.4% |
Advanced Micro Devices, Inc.: | | | | |
7.75% 8/1/20 | | 135,000 | | 147,825 |
8.125% 12/15/17 | | 270,000 | | 292,950 |
Freescale Semiconductor, Inc.: | | | | |
8.05% 2/1/20 | | 410,000 | | 405,900 |
10.75% 8/1/20 | | 393,000 | | 422,475 |
NXP BV/NXP Funding LLC 9.75% 8/1/18 (f) | | 2,645,000 | | 3,018,606 |
Spansion LLC 11.25% 1/15/16 (c)(f) | | 255,000 | | 14,395 |
| | 4,302,151 |
Software - 0.0% |
Open Solutions, Inc. 9.75% 2/1/15 (f) | | 50,000 | | 44,000 |
TOTAL INFORMATION TECHNOLOGY | | 16,522,051 |
MATERIALS - 3.6% |
Chemicals - 0.8% |
Braskem America Finance Co. 7.125% 7/22/41 (f) | | 205,000 | | 205,000 |
Ferro Corp. 7.875% 8/15/18 | | 360,000 | | 351,000 |
INEOS Finance PLC: | | | | |
7.5% 5/1/20 (f) | | 370,000 | | 373,700 |
8.375% 2/15/19 (f) | | 485,000 | | 501,975 |
9% 5/15/15 (f) | | 215,000 | | 226,825 |
INEOS Group Holdings PLC 8.5% 2/15/16 (f) | | 645,000 | | 593,400 |
Inergy LP/Inergy Finance Corp. 6.875% 8/1/21 | | 381,000 | | 381,000 |
Corporate Bonds - continued |
| Principal Amount (d) | | Value |
Nonconvertible Bonds - continued |
MATERIALS - continued |
Chemicals - continued |
LyondellBasell Industries NV: | | | | |
5% 4/15/19 (f) | | $ 725,000 | | $ 757,625 |
5.75% 4/15/24 (f) | | 725,000 | | 772,995 |
6% 11/15/21 (f) | | 1,970,000 | | 2,162,075 |
Momentive Performance Materials, Inc. 9% 1/15/21 | | 1,420,000 | | 1,075,650 |
NOVA Chemicals Corp. 3.8549% 11/15/13 (k) | | 105,000 | | 104,869 |
OMNOVA Solutions, Inc. 7.875% 11/1/18 | | 335,000 | | 336,675 |
OXEA Finance & CY S.C.A. 9.5% 7/15/17 (f) | | 279,000 | | 291,555 |
PolyOne Corp. 7.375% 9/15/20 | | 155,000 | | 164,300 |
Solutia, Inc.: | | | | |
7.875% 3/15/20 | | 175,000 | | 204,750 |
8.75% 11/1/17 | | 290,000 | | 326,250 |
Taminco Global Chemical Corp. 9.75% 3/31/20 (f) | | 125,000 | | 128,438 |
TPC Group LLC 8.25% 10/1/17 | | 190,000 | | 199,500 |
| | 9,157,582 |
Construction Materials - 0.6% |
CEMEX Espana SA (Luxembourg): | | | | |
9.25% 5/12/20 (f) | | 285,000 | | 245,100 |
9.875% 4/30/19 (f) | | 565,000 | | 505,675 |
CEMEX Finance LLC 9.5% 12/14/16 (f) | | 2,320,000 | | 2,273,600 |
CEMEX SA de CV: | | | | |
5.4697% 9/30/15 (f)(k) | | 1,305,000 | | 1,187,550 |
9% 1/11/18 (f) | | 1,820,000 | | 1,624,350 |
Rearden G Holdings Eins GmbH 7.875% 3/30/20 (f) | | 420,000 | | 441,000 |
Summit Materials LLC/Summit Materials Finance Corp. 10.5% 1/31/20 (f) | | 520,000 | | 546,000 |
| | 6,823,275 |
Containers & Packaging - 0.7% |
ARD Finance SA 11.125% 6/1/18 pay-in-kind (f) | | 408,347 | | 375,679 |
Ball Corp. 5.75% 5/15/21 | | 3,000,000 | | 3,225,000 |
Berry Plastics Holding Corp. 4.3429% 9/15/14 (k) | | 45,000 | | 44,100 |
BWAY Holding Co. 10% 6/15/18 | | 205,000 | | 225,500 |
BWAY Parent Co., Inc. 10.875% 11/1/15 pay-in-kind (k) | | 228,896 | | 228,319 |
Consolidated Container Co. LLC/Consolidated Container Capital, Inc. 10.125% 7/15/20 (f) | | 210,000 | | 214,725 |
Crown Cork & Seal, Inc.: | | | | |
7.375% 12/15/26 | | 1,210,000 | | 1,282,600 |
|
| Principal Amount (d) | | Value |
7.5% 12/15/96 | | $ 160,000 | | $ 135,200 |
Rock-Tenn Co.: | | | | |
4.45% 3/1/19 (f) | | 150,000 | | 154,095 |
4.9% 3/1/22 (f) | | 140,000 | | 144,998 |
Sappi Papier Holding GmbH: | | | | |
7.75% 7/15/17 (f)(i) | | 265,000 | | 268,313 |
8.375% 6/15/19 (f)(i) | | 355,000 | | 356,775 |
Silgan Holdings, Inc. 5% 4/1/20 (f) | | 960,000 | | 979,200 |
Tekni-Plex, Inc. 9.75% 6/1/19 (f) | | 445,000 | | 449,450 |
| | 8,083,954 |
Metals & Mining - 1.3% |
Aleris International, Inc.: | | | | |
6% 6/1/20 (f) | | 1,759 | | 1,693 |
9% 12/15/14 pay-in-kind (c)(k) | | 150,000 | | 0 |
Alrosa Finance SA 7.75% 11/3/20 (f) | | 200,000 | | 209,500 |
Edgen Murray Corp. 12.25% 1/15/15 | | 645,000 | | 635,325 |
EVRAZ Group SA: | | | | |
7.4% 4/24/17 (f) | | 260,000 | | 254,847 |
8.25% 11/10/15 (f) | | 770,000 | | 806,575 |
FMG Resources (August 2006) Pty Ltd.: | | | | |
6% 4/1/17 (f) | | 635,000 | | 638,175 |
6.375% 2/1/16 (f) | | 635,000 | | 641,350 |
6.875% 2/1/18 (f) | | 1,988,000 | | 2,007,880 |
6.875% 4/1/22 (f) | | 1,970,000 | | 1,989,700 |
7% 11/1/15 (f) | | 790,000 | | 807,775 |
8.25% 11/1/19 (f) | | 3,835,000 | | 4,084,275 |
Metinvest BV 10.25% 5/20/15 (f) | | 360,000 | | 352,800 |
Midwest Vanadium Pty Ltd. 11.5% 2/15/18 (f) | | 190,000 | | 117,800 |
Mirabela Nickel Ltd. 8.75% 4/15/18 (f) | | 100,000 | | 68,500 |
Mongolian Mining Corp. 8.875% 3/29/17 (f) | | 455,000 | | 456,138 |
MRC Global, Inc. 9.5% 12/15/16 | | 365,000 | | 394,200 |
New Gold, Inc. 7% 4/15/20 (f) | | 125,000 | | 128,438 |
Rain CII Carbon LLC/CII Carbon Corp. 8% 12/1/18 (f) | | 300,000 | | 303,000 |
RathGibson, Inc. 11.25% 2/15/14 (c) | | 297,265 | | 0 |
Southern Copper Corp. 6.75% 4/16/40 | | 250,000 | | 267,223 |
SunCoke Energy, Inc. 7.625% 8/1/19 | | 125,000 | | 122,500 |
Votorantim Cimentos SA 7.25% 4/5/41 (f) | | 400,000 | | 401,000 |
| | 14,688,694 |
Paper & Forest Products - 0.2% |
AbitibiBowater, Inc. 10.25% 10/15/18 | | 1,104,000 | | 1,225,440 |
Clearwater Paper Corp. 7.125% 11/1/18 | | 105,000 | | 111,300 |
Corporate Bonds - continued |
| Principal Amount (d) | | Value |
Nonconvertible Bonds - continued |
MATERIALS - continued |
Paper & Forest Products - continued |
Glatfelter 7.125% 5/1/16 | | $ 40,000 | | $ 40,900 |
NewPage Corp.: | | | | |
6.7159% 5/1/49 (c)(k) | | 90,000 | | 3,150 |
11.375% 12/31/14 (c) | | 345,000 | | 222,525 |
Sino-Forest Corp. 6.25% 10/21/17 (c)(f) | | 565,000 | | 159,613 |
Verso Paper Holdings LLC/Verso Paper, Inc. 11.75% 1/15/19 (f) | | 705,000 | | 712,050 |
| | 2,474,978 |
TOTAL MATERIALS | | 41,228,483 |
TELECOMMUNICATION SERVICES - 3.3% |
Diversified Telecommunication Services - 1.2% |
Alestra SA de RL de CV 11.75% 8/11/14 | | 750,000 | | 840,000 |
Citizens Communications Co.: | | | | |
7.875% 1/15/27 | | 280,000 | | 246,400 |
9% 8/15/31 | | 220,000 | | 210,100 |
Clearwire Communications LLC/Clearwire Finance, Inc.: | | | | |
12% 12/1/15 (f) | | 1,705,000 | | 1,551,550 |
14.75% 12/1/16 (f) | | 390,000 | | 379,275 |
Consolidated Communications Finance Co. 10.875% 6/1/20 (f) | | 245,000 | | 251,125 |
Eileme 1 AB 14.25% 8/15/20 (f) | | 470,000 | | 446,500 |
Eileme 2 AB 11.625% 1/31/20 (f) | | 935,000 | | 972,400 |
Frontier Communications Corp.: | | | | |
8.5% 4/15/20 | | 1,010,000 | | 1,070,600 |
8.75% 4/15/22 | | 565,000 | | 593,250 |
Level 3 Financing, Inc.: | | | | |
8.125% 7/1/19 | | 380,000 | | 389,500 |
8.625% 7/15/20 | | 875,000 | | 916,563 |
10% 2/1/18 | | 385,000 | | 416,763 |
Sprint Capital Corp.: | | | | |
6.875% 11/15/28 | | 1,842,000 | | 1,480,415 |
8.75% 3/15/32 | | 3,866,000 | | 3,518,060 |
U.S. West Communications: | | | | |
6.875% 9/15/33 | | 200,000 | | 199,000 |
7.25% 9/15/25 | | 35,000 | | 38,407 |
7.25% 10/15/35 | | 70,000 | | 71,750 |
7.5% 6/15/23 | | 30,000 | | 30,075 |
Wind Acquisition Finance SA 11.75% 7/15/17 (f) | | 529,000 | | 427,168 |
| | 14,048,901 |
Wireless Telecommunication Services - 2.1% |
Clearwire Escrow Corp. 12% 12/1/15 (f) | | 260,000 | | 235,300 |
|
| Principal Amount (d) | | Value |
Cricket Communications, Inc. 7.75% 10/15/20 | | $ 1,719,000 | | $ 1,641,645 |
Digicel Group Ltd.: | | | | |
7% 2/15/20 (f) | | 1,200,000 | | 1,155,000 |
8.25% 9/1/17 (f) | | 990,000 | | 1,014,750 |
8.875% 1/15/15 (f) | | 3,050,000 | | 3,080,500 |
9.125% 1/15/15 pay-in-kind (f)(k) | | 1,297,000 | | 1,309,970 |
10.5% 4/15/18 (f) | | 2,845,000 | | 2,973,025 |
12% 4/1/14 (f) | | 1,145,000 | | 1,270,950 |
Intelsat Jackson Holdings SA: | | | | |
7.25% 4/1/19 | | 1,000,000 | | 1,055,000 |
7.25% 10/15/20 (f) | | 1,545,000 | | 1,622,250 |
7.5% 4/1/21 | | 2,485,000 | | 2,634,100 |
8.5% 11/1/19 | | 325,000 | | 360,750 |
MetroPCS Wireless, Inc. 7.875% 9/1/18 | | 385,000 | | 399,438 |
MTS International Funding Ltd. 8.625% 6/22/20 (f) | | 1,010,000 | | 1,158,975 |
NII Capital Corp.: | | | | |
7.625% 4/1/21 | | 828,000 | | 705,870 |
8.875% 12/15/19 | | 245,000 | | 222,950 |
Pakistan Mobile Communications Ltd. 8.625% 11/13/13 (f) | | 1,050,000 | | 1,021,125 |
Telemovil Finance Co. Ltd. 8% 10/1/17 (f) | | 730,000 | | 750,988 |
Vimpel Communications OJSC 7.748% 2/2/21 (Issued by VIP Finance Ireland Ltd. for Vimpel Communications) (f) | | 400,000 | | 385,000 |
VimpelCom Holdings BV 7.5043% 3/1/22 (f) | | 365,000 | | 342,188 |
| | 23,339,774 |
TOTAL TELECOMMUNICATION SERVICES | | 37,388,675 |
UTILITIES - 2.9% |
Electric Utilities - 0.3% |
Aguila 3 SA 7.875% 1/31/18 (f) | | 250,000 | | 257,500 |
Empresa Distribuidora y Comercializadora Norte SA 9.75% 10/25/22 (f) | | 400,000 | | 140,000 |
InterGen NV 9% 6/30/17 (f) | | 315,000 | | 308,700 |
Majapahit Holding BV: | | | | |
7.75% 1/20/20 (f) | | 265,000 | | 316,013 |
8% 8/7/19 (f) | | 165,000 | | 198,000 |
Mirant Americas Generation LLC 9.125% 5/1/31 | | 410,000 | | 364,900 |
National Grid Electricity Transmission PLC 4% 6/8/27 | GBP | 200,000 | | 315,346 |
National Power Corp. 6.875% 11/2/16 (f) | | 200,000 | | 230,000 |
Texas Competitive Electric Holdings Co. LLC/Texas Competitive Electric Holdings Finance, Inc. 11.5% 10/1/20 (f) | | 1,495,000 | | 1,020,338 |
| | 3,150,797 |
Corporate Bonds - continued |
| Principal Amount (d) | | Value |
Nonconvertible Bonds - continued |
UTILITIES - continued |
Gas Utilities - 0.2% |
Holly Energy Partners LP/Holly Finance Corp. 6.5% 3/1/20 (f) | | $ 485,000 | | $ 489,850 |
Intergas Finance BV 6.375% 5/14/17 (Reg. S) | | 255,000 | | 274,125 |
Southern Natural Gas Co.: | | | | |
7.35% 2/15/31 | | 175,000 | | 212,243 |
8% 3/1/32 | | 350,000 | | 453,936 |
Star Gas Partners LP/Star Gas Finance Co. 8.875% 12/1/17 | | 210,000 | | 205,800 |
Transportadora de Gas del Sur SA 7.875% 5/14/17 (f) | | 1,489,000 | | 1,016,243 |
| | 2,652,197 |
Independent Power Producers & Energy Traders - 2.3% |
Atlantic Power Corp. 9% 11/15/18 (f) | | 885,000 | | 904,913 |
Calpine Corp.: | | | | |
7.5% 2/15/21 (f) | | 620,000 | | 671,150 |
7.875% 7/31/20 (f) | | 1,645,000 | | 1,801,275 |
7.875% 1/15/23 (f) | | 2,345,000 | | 2,573,638 |
Dolphin Subsidiary II, Inc. 7.25% 10/15/21 (f) | | 900,000 | | 999,000 |
Energy Future Holdings Corp.: | | | | |
10% 1/15/20 | | 2,955,000 | | 3,176,625 |
10.875% 11/1/17 | | 340,000 | | 288,150 |
Energy Future Intermediate Holding Co. LLC/Energy Future Intermediate Holding Finance, Inc.: | | | | |
10% 12/1/20 | | 5,360,000 | | 5,869,200 |
11% 10/1/21 | | 2,486,000 | | 2,405,205 |
11.75% 3/1/22 (f) | | 2,610,000 | | 2,668,725 |
GenOn Energy, Inc.: | | | | |
9.5% 10/15/18 | | 315,000 | | 311,456 |
9.875% 10/15/20 | | 1,150,000 | | 1,121,250 |
Listrindo Capital BV 6.95% 2/21/19 (f) | | 200,000 | | 206,000 |
NRG Energy, Inc.: | | | | |
7.625% 5/15/19 | | 320,000 | | 325,600 |
7.875% 5/15/21 | | 375,000 | | 377,813 |
Power Sector Assets and Liabilities Management Corp. 7.39% 12/2/24 (f) | | 280,000 | | 360,500 |
TXU Corp.: | | | | |
5.55% 11/15/14 | | 185,000 | | 132,738 |
6.5% 11/15/24 | | 2,870,000 | | 1,370,425 |
6.55% 11/15/34 | | 2,815,000 | | 1,287,863 |
| | 26,851,526 |
|
| Principal Amount (d) | | Value |
Multi-Utilities - 0.1% |
Centrica PLC 4.375% 3/13/29 | GBP | 250,000 | | $ 405,751 |
Puget Energy, Inc. 5.625% 7/15/22 (f) | | $ 375,000 | | 390,450 |
| | 796,201 |
Water Utilities - 0.0% |
South East Water Ltd. Class 2A, 5.5834% 3/29/29 | GBP | 165,000 | | 284,944 |
TOTAL UTILITIES | | 33,735,665 |
TOTAL NONCONVERTIBLE BONDS | | 413,835,166 |
TOTAL CORPORATE BONDS (Cost $402,122,688) |
416,143,471
|
U.S. Government and Government Agency Obligations - 22.7% |
|
U.S. Government Agency Obligations - 1.3% |
Fannie Mae: | | | | |
0.5% 5/27/15 | | 424,000 | | 423,692 |
0.5% 7/2/15 | | 7,007,000 | | 6,998,339 |
Federal Home Loan Bank: | | | | |
0.375% 11/27/13 | | 280,000 | | 280,185 |
0.875% 8/22/12 | | 495,000 | | 495,498 |
0.875% 12/27/13 | | 50,000 | | 50,397 |
1% 6/21/17 | | 880,000 | | 881,073 |
Freddie Mac: | | | | |
0.625% 12/29/14 | | 566,000 | | 568,171 |
0.75% 11/25/14 | | 170,000 | | 171,275 |
1% 7/30/14 | | 403,000 | | 407,970 |
1% 8/27/14 | | 408,000 | | 413,545 |
1.25% 5/12/17 | | 2,761,000 | | 2,798,806 |
Tennessee Valley Authority: | | | | |
5.25% 9/15/39 | | 400,000 | | 525,525 |
5.375% 4/1/56 | | 1,200,000 | | 1,647,841 |
TOTAL U.S. GOVERNMENT AGENCY OBLIGATIONS | | 15,662,317 |
U.S. Treasury Inflation Protected Obligations - 0.1% |
U.S. Treasury Inflation-Indexed Bonds 0.75% 2/15/42 | | 1,064,985 | | 1,123,209 |
U.S. Treasury Obligations - 20.4% |
U.S. Treasury Bonds: | | | | |
3% 5/15/42 | | 3,136,000 | | 3,291,822 |
3.125% 2/15/42 | | 3,026,000 | | 3,256,260 |
3.75% 8/15/41 | | 4,463,000 | | 5,391,166 |
4.375% 2/15/38 | | 675,000 | | 897,117 |
4.375% 5/15/41 | | 9,227,000 | | 12,342,552 |
4.75% 2/15/37 | | 450,000 | | 628,101 |
5.25% 2/15/29 | | 2,993,000 | | 4,225,742 |
5.375% 2/15/31 | | 4,230,000 | | 6,169,853 |
U.S. Government and Government Agency Obligations - continued |
| Principal Amount (d) | | Value |
U.S. Treasury Obligations - continued |
U.S. Treasury Bonds: - continued | | | | |
6.125% 8/15/29 | | $ 700,000 | | $ 1,082,266 |
6.25% 8/15/23 (j) | | 3,549,000 | | 5,158,805 |
7.5% 11/15/16 | | 655,000 | | 847,611 |
7.875% 2/15/21 | | 200,000 | | 306,141 |
U.S. Treasury Notes: | | | | |
0.125% 8/31/13 | | 3,600,000 | | 3,593,952 |
0.125% 12/31/13 | | 7,500,000 | | 7,480,373 |
0.25% 10/31/13 | | 6,000,000 | | 5,997,420 |
0.25% 1/31/14 | | 5,225,000 | | 5,220,512 |
0.25% 2/28/14 | | 8,000,000 | | 7,992,496 |
0.25% 3/31/14 | | 502,000 | | 501,451 |
0.25% 4/30/14 | | 14,091,000 | | 14,075,035 |
0.25% 5/31/14 | | 3,030,000 | | 3,026,449 |
0.25% 9/15/14 | | 5,834,000 | | 5,821,696 |
0.25% 2/15/15 | | 6,586,000 | | 6,563,357 |
0.25% 5/15/15 | | 12,809,000 | | 12,755,958 |
0.5% 8/15/14 | | 4,306,000 | | 4,320,804 |
0.625% 7/15/14 | | 2,808,000 | | 2,824,452 |
0.625% 5/31/17 | | 4,690,000 | | 4,670,579 |
0.75% 6/15/14 | | 1,404,000 | | 1,415,736 |
0.75% 6/30/17 | | 600,000 | | 600,890 |
0.875% 11/30/16 | | 3,939,000 | | 3,979,619 |
0.875% 4/30/17 | | 4,330,000 | | 4,365,181 |
1% 9/30/16 | | 10,684,000 | | 10,854,282 |
1% 10/31/16 | | 4,450,000 | | 4,519,184 |
1% 6/30/19 | | 17,201,000 | | 17,074,612 |
1.25% 10/31/15 | | 1,715,000 | | 1,757,875 |
1.75% 5/15/22 | | 651,000 | | 656,899 |
1.875% 6/30/15 | | 493,000 | | 514,106 |
1.875% 8/31/17 | | 3,300,000 | | 3,482,790 |
1.875% 9/30/17 | | 1,900,000 | | 2,005,243 |
1.875% 10/31/17 | | 1,898,000 | | 2,003,428 |
2% 2/15/22 | | 4,331,000 | | 4,480,216 |
2.125% 11/30/14 | | 3,932,000 | | 4,097,883 |
2.125% 5/31/15 | | 438,000 | | 459,524 |
2.125% 8/15/21 | | 2,621,000 | | 2,757,169 |
2.375% 8/31/14 | | 12,800,000 | | 13,359,002 |
2.375% 9/30/14 | | 942,000 | | 985,052 |
2.375% 10/31/14 | | 4,724,000 | | 4,944,701 |
2.375% 2/28/15 | | 4,000,000 | | 4,210,000 |
2.375% 6/30/18 | | 1,912,000 | | 2,074,073 |
2.5% 4/30/15 | | 2,576,000 | | 2,727,139 |
2.625% 7/31/14 | | 1,035,000 | | 1,083,840 |
2.75% 11/30/16 | | 1,500,000 | | 1,636,875 |
3% 2/28/17 | | 1,500,000 | | 1,658,438 |
3.125% 10/31/16 | | 1,340,000 | | 1,481,957 |
3.125% 1/31/17 | | 1,636,000 | | 1,815,960 |
3.125% 5/15/19 | | 1,232,000 | | 1,401,016 |
|
| Principal Amount (d) | | Value |
4.25% 8/15/15 | | $ 1,376,000 | | $ 1,537,573 |
4.5% 5/15/17 | | 1,172,000 | | 1,383,234 |
TOTAL U.S. TREASURY OBLIGATIONS | | 233,765,467 |
Other Government Related - 0.9% |
General Electric Capital Corp. 2.625% 12/28/12 (FDIC Guaranteed) (h) | | 384,000 | | 388,371 |
National Credit Union Administration Guaranteed Notes: | | | | |
Series 2010-A1 Class A, 0.5888% 12/7/20 (NCUA Guaranteed) (k) | | 378,153 | | 379,507 |
Series 2011-R1 Class 1A, 0.6888% 1/8/20 (NCUA Guaranteed) (k) | | 589,857 | | 590,986 |
Series 2011-R4 Class 1A, 0.6188% 3/6/20 (NCUA Guaranteed) (k) | | 351,694 | | 351,807 |
National Credit Union Administration Guaranteed Notes Master Trust: | | | | |
1.4% 6/12/15 (NCUA Guaranteed) | | 330,000 | | 336,514 |
2.35% 6/12/17 (NCUA Guaranteed) | | 2,930,000 | | 3,095,604 |
3% 6/12/19 (NCUA Guaranteed) | | 2,293,000 | | 2,517,599 |
3.45% 6/12/21 (NCUA Guaranteed) | | 2,400,000 | | 2,677,560 |
TOTAL OTHER GOVERNMENT RELATED | | 10,337,948 |
TOTAL U.S. GOVERNMENT AND GOVERNMENT AGENCY OBLIGATIONS (Cost $250,583,629) |
260,888,941
|
U.S. Government Agency - Mortgage Securities - 3.3% |
|
Fannie Mae - 1.4% |
2.122% 10/1/35 (k) | | 4,080 | | 4,248 |
2.172% 11/1/35 (k) | | 39,435 | | 41,510 |
2.223% 11/1/33 (k) | | 7,393 | | 7,824 |
2.293% 9/1/33 (k) | | 37,397 | | 39,210 |
2.32% 6/1/36 (k) | | 3,146 | | 3,357 |
2.384% 2/1/36 (k) | | 8,837 | | 9,365 |
2.388% 1/1/35 (k) | | 21,340 | | 22,707 |
2.393% 9/1/36 (k) | | 10,331 | | 11,080 |
2.525% 3/1/33 (k) | | 10,518 | | 11,181 |
2.609% 11/1/36 (k) | | 5,642 | | 6,051 |
2.63% 2/1/37 (k) | | 40,643 | | 43,515 |
2.63% 6/1/47 (k) | | 10,867 | | 11,652 |
2.688% 7/1/35 (k) | | 38,338 | | 40,987 |
2.763% 5/1/36 (k) | | 5,314 | | 5,699 |
2.975% 8/1/35 (k) | | 58,482 | | 62,557 |
U.S. Government Agency - Mortgage Securities - continued |
| Principal Amount (d) | | Value |
Fannie Mae - continued |
2.996% 4/1/36 (k) | | $ 30,891 | | $ 33,131 |
3.5% 7/1/42 (i) | | 400,000 | | 420,496 |
4% 6/1/42 to 7/1/42 | | 1,800,000 | | 1,942,800 |
4% 7/1/42 (i) | | 8,000,000 | | 8,515,294 |
4% 7/1/42 (i) | | 1,800,000 | | 1,915,941 |
4% 7/1/42 (i) | | 1,800,000 | | 1,915,941 |
5.5% 10/1/20 to 4/1/21 | | 547,773 | | 595,549 |
5.984% 3/1/37 (k) | | 5,969 | | 6,382 |
6% 6/1/16 to 10/1/16 | | 7,833 | | 8,357 |
6.5% 12/1/12 to 7/1/26 | | 26,423 | | 28,985 |
TOTAL FANNIE MAE | | 15,703,819 |
Freddie Mac - 0.5% |
2.139% 1/1/36 (k) | | 5,941 | | 6,261 |
2.149% 3/1/35 (k) | | 10,546 | | 10,912 |
2.2% 3/1/37 (k) | | 3,030 | | 3,191 |
2.203% 6/1/33 (k) | | 23,961 | | 25,016 |
2.312% 2/1/37 (k) | | 4,398 | | 4,621 |
2.35% 7/1/35 (k) | | 27,147 | | 28,932 |
2.357% 5/1/37 (k) | | 6,565 | | 6,950 |
2.375% 5/1/37 (k) | | 4,646 | | 4,850 |
2.451% 1/1/37 (k) | | 26,818 | | 28,507 |
2.478% 6/1/37 (k) | | 2,523 | | 2,639 |
2.492% 4/1/35 (k) | | 2,583 | | 2,738 |
2.638% 4/1/37 (k) | | 8,871 | | 9,503 |
2.64% 10/1/35 (k) | | 23,165 | | 24,651 |
2.651% 6/1/37 (k) | | 19,673 | | 21,099 |
2.667% 10/1/36 (k) | | 29,087 | | 30,958 |
2.686% 7/1/36 (k) | | 350,394 | | 373,376 |
2.712% 5/1/37 (k) | | 79,192 | | 84,933 |
2.743% 5/1/37 (k) | | 42,708 | | 45,697 |
2.795% 7/1/36 (k) | | 9,984 | | 10,708 |
2.798% 7/1/35 (k) | | 17,630 | | 18,841 |
2.865% 9/1/35 (k) | | 4,780 | | 5,119 |
2.97% 4/1/37 (k) | | 475 | | 509 |
3.446% 10/1/35 (k) | | 4,012 | | 4,303 |
3.949% 6/1/37 (k) | | 4,894 | | 5,239 |
4% 3/1/42 to 5/1/42 | | 2,409,994 | | 2,599,923 |
4.5% 8/1/33 to 10/1/41 | | 837,453 | | 901,906 |
5.5% 2/1/19 to 7/1/35 | | 1,896,613 | | 2,061,352 |
5.919% 8/1/37 (k) | | 9,816 | | 10,211 |
6.5% 12/1/14 to 3/1/22 | | 110,444 | | 120,532 |
TOTAL FREDDIE MAC | | 6,453,477 |
Ginnie Mae - 1.4% |
4% 9/15/25 | | 81,892 | | 88,464 |
4.5% 3/15/25 to 6/15/25 | | 997,001 | | 1,082,186 |
4.515% 3/20/62 (p) | | 1,208,930 | | 1,348,408 |
4.55% 5/20/62 (p) | | 2,199,016 | | 2,457,888 |
4.556% 12/20/61 (p) | | 1,294,100 | | 1,441,643 |
|
| Principal Amount (d) | | Value |
4.604% 3/20/62 (p) | | $ 629,702 | | $ 704,720 |
4.626% 3/20/62 (p) | | 449,896 | | 503,314 |
4.65% 3/20/62 (p) | | 404,558 | | 453,300 |
4.684% 1/20/62 (p) | | 1,366,232 | | 1,529,924 |
4.751% 12/20/60 (p) | | 520,279 | | 578,369 |
4.804% 3/20/61 (p) | | 826,463 | | 922,789 |
4.834% 3/20/61 (p) | | 1,440,579 | | 1,610,901 |
5.492% 4/20/60 (p) | | 759,872 | | 861,256 |
5.5% 2/20/60 (p) | | 1,620,073 | | 1,803,407 |
5.612% 4/20/58 (p) | | 574,283 | | 611,590 |
TOTAL GINNIE MAE | | 15,998,159 |
TOTAL U.S. GOVERNMENT AGENCY - MORTGAGE SECURITIES (Cost $37,709,373) |
38,155,455
|
Collateralized Mortgage Obligations - 3.8% |
|
U.S. Government Agency - 3.8% |
Fannie Mae: | | | | |
floater: | | | | |
Series 2008-76 Class EF, 0.7453% 9/25/23 (k) | | 123,964 | | 124,458 |
Series 2010-15 Class FJ, 1.1753% 6/25/36 (k) | | 1,265,643 | | 1,286,470 |
Series 2010-86 Class FE, 0.6953% 8/25/25 (k) | | 156,643 | | 157,460 |
Series 2011-104 Class FK, 0.6153% 3/25/39 (k) | | 823,712 | | 823,476 |
Series 2011-63 Class FL, 0.6453% 7/25/41 (k) | | 1,353,179 | | 1,360,427 |
planned amortization: | | | | |
Series 2005-19 Class PA, 5.5% 7/25/34 | | 374,222 | | 412,482 |
Series 2005-64 Class PX, 5.5% 6/25/35 | | 367,029 | | 410,024 |
planned amortization class: | | | | |
Series 2002-9 Class PC, 6% 3/25/17 | | 3,189 | | 3,423 |
Series 2003-113 Class PE, 4% 11/25/18 | | 80,000 | | 85,267 |
Series 2003-70 Class BJ, 5% 7/25/33 | | 45,000 | | 50,417 |
Series 2004-80 Class LD, 4% 1/25/19 | | 55,737 | | 57,334 |
Series 2005-52 Class PB, 6.5% 12/25/34 | | 33,565 | | 35,628 |
Series 2010-118 Class PB, 4.5% 10/25/40 | | 300,000 | | 333,996 |
sequential payer: | | | | |
Series 2002-57 Class BD, 5.5% 9/25/17 | | 12,484 | | 13,443 |
Series 2004-91 Class Z, 5% 12/25/34 | | 467,173 | | 527,017 |
Collateralized Mortgage Obligations - continued |
| Principal Amount (d) | | Value |
U.S. Government Agency - continued |
Fannie Mae: - continued | | | | |
sequential payer: - continued | | | | |
Series 2004-95 Class AN, 5.5% 1/25/25 | | $ 42,501 | | $ 44,713 |
Series 2005-117, Class JN, 4.5% 1/25/36 | | 40,000 | | 45,040 |
Series 2005-14 Class ZB, 5% 3/25/35 | | 216,273 | | 243,023 |
Series 2005-47 Class HK, 4.5% 6/25/20 | | 340,000 | | 368,807 |
Series 2006-72 Class CY, 6% 8/25/26 | | 145,000 | | 167,045 |
Series 2007-113 Class DB, 4.5% 12/25/22 | | 440,000 | | 489,372 |
Series 2009-14 Class EB, 4.5% 3/25/24 | | 340,000 | | 369,485 |
Series 2010-97 Class CX, 4.5% 9/25/25 | | 500,000 | | 574,223 |
Series 2009-82 Class FD, 1.0953% 10/25/39 (k) | | 560,086 | | 570,026 |
Series 2009-85 Class IB, 4.5% 8/25/24 (m) | | 101,550 | | 8,404 |
Series 2009-93 Class IC, 4.5% 9/25/24 (m) | | 173,897 | | 13,706 |
Series 2010-109 Class IM, 5.5% 9/25/40 (m) | | 835,304 | | 123,779 |
Series 2010-139 Class NI, 4.5% 2/25/40 (m) | | 438,580 | | 71,252 |
Series 2010-39 Class FG, 1.1653% 3/25/36 (k) | | 691,314 | | 705,236 |
Series 2010-97 Class CI, 4.5% 8/25/25 (m) | | 354,001 | | 27,622 |
Series 2011-67 Class AI, 4% 7/25/26 (m) | | 208,095 | | 20,678 |
Federal National Mortgage Association planned amortization class Series 2011-126 Class KB, 4% 12/25/41 | | 380,000 | | 414,462 |
FHMLC Multi-class participation certificates guaranteed floater Series 3835 Class FC, 0.5918% 5/15/38 (k) | | 1,340,593 | | 1,341,870 |
Freddie Mac: | | | | |
floater: | | | | |
Series 240 Class F30, 0.5418% 7/15/36 (k) | | 1,038,915 | | 1,039,572 |
Series 2630 Class FL, 0.7418% 6/15/18 (k) | | 2,225 | | 2,242 |
Series 2711 Class FC, 1.1418% 2/15/33 (k) | | 470,000 | | 477,627 |
Series 3419 Class FD, 1.0118% 2/15/38 (k) | | 561,046 | | 570,185 |
planned amortization class: | | | | |
Series 2101 Class PD, 6% 11/15/28 | | 7,690 | | 8,502 |
Series 2115 Class PE, 6% 1/15/14 | | 891 | | 915 |
|
| Principal Amount (d) | | Value |
Series 2376 Class JE, 5.5% 11/15/16 | | $ 13,109 | | $ 14,012 |
Series 2381 Class OG, 5.5% 11/15/16 | | 8,144 | | 8,674 |
Series 2425 Class JH, 6% 3/15/17 | | 16,413 | | 17,691 |
Series 2672 Class MG, 5% 9/15/23 | | 310,000 | | 357,230 |
Series 2684 Class FP, 0.7418% 1/15/33 (k) | | 689,709 | | 692,295 |
Series 2695 Class DG, 4% 10/15/18 | | 220,000 | | 232,948 |
Series 2996 Class MK, 5.5% 6/15/35 | | 17,959 | | 20,053 |
Series 3737 Class GB, 4.5% 4/15/39 | | 650,000 | | 731,433 |
sequential payer: | | | | |
Series 2303 Class ZV, 6% 4/15/31 | | 20,657 | | 22,911 |
Series 2570 Class CU, 4.5% 7/15/17 | | 466 | | 466 |
Series 2877 Class ZD, 5% 10/15/34 | | 601,060 | | 673,831 |
Series 2987 Class HE, 4.5% 6/15/20 | | 380,000 | | 404,218 |
Series 3277 Class B, 4% 2/15/22 | | 300,000 | | 327,520 |
Series 3372 Class BD, 4.5% 10/15/22 | | 790,000 | | 873,595 |
Series 3578, Class B, 4.5% 9/15/24 | | 340,000 | | 371,689 |
Series 2715 Class NG, 4.5% 12/15/18 | | 1,000,000 | | 1,079,382 |
Ginnie Mae Series 2012-64 Class KB 3.035% 5/20/41 (k) | | 305,086 | | 329,587 |
Ginnie Mae guaranteed REMIC pass-thru certificates: | | | | |
floater: | | | | |
Series 2008-2 Class FD, 0.7198% 1/20/38 (k) | | 60,254 | | 60,646 |
Series 2007-59 Class FC, 0.7398% 7/20/37 (k) | | 224,620 | | 226,423 |
Series 2008-73 Class FA, 1.0998% 8/20/38 (k) | | 342,188 | | 348,223 |
Series 2008-83 Class FB, 1.1398% 9/20/38 (k) | | 332,486 | | 338,441 |
Series 2010-14 Class QF, 0.6928% 2/16/40 (k) | | 1,314,947 | | 1,327,510 |
Series 2010-H17 Class FA, 0.5688% 7/20/60 (k)(p) | | 646,785 | | 638,798 |
Series 2010-H18 Class AF, 0.5413% 9/20/60 (k)(p) | | 695,779 | | 686,961 |
Series 2010-H19 Class FG, 0.5413% 8/20/60 (k)(p) | | 835,100 | | 824,698 |
Series 2010-H27 Series FA, 0.6213% 12/20/60 (k)(p) | | 316,048 | | 313,314 |
Series 2011-H03 Class FA, 0.7413% 1/20/61 (k)(p) | | 847,124 | | 845,410 |
Collateralized Mortgage Obligations - continued |
| Principal Amount (d) | | Value |
U.S. Government Agency - continued |
Ginnie Mae guaranteed REMIC pass-thru certificates: - continued | | | | |
floater: - continued | | | | |
Series 2011-H05 Class FA, 0.7413% 12/20/60 (k)(p) | | $ 475,989 | | $ 475,030 |
Series 2011-H07 Class FA, 0.7413% 2/20/61 (k)(p) | | 692,912 | | 691,509 |
Series 2011-H12 Class FA, 0.7313% 2/20/61 (k)(p) | | 1,068,049 | | 1,065,343 |
Series 2011-H13 Class FA, 0.7413% 4/20/61 (k)(p) | | 425,894 | | 425,055 |
Series 2011-H14: | | | | |
Class FB, 0.7413% 5/20/61 (k)(p) | | 479,235 | | 478,170 |
Class FC, 0.7413% 5/20/61 (k)(p) | | 479,998 | | 478,991 |
Series 2011-H17 Class FA, 0.7713% 6/20/61 (k)(p) | | 615,149 | | 614,856 |
Series 2011-H21 Class FA, 0.8413% 10/20/61 (k)(p) | | 708,112 | | 710,252 |
Series 2012-H01 Class FA, 0.9413% 11/20/61 (k)(p) | | 570,053 | | 574,855 |
Series 2012-H03 Class FA, 0.9413% 1/20/62 (k)(p) | | 345,365 | | 348,310 |
Series 2012-H06 Class FA, 0.8713% 1/20/62 (k)(p) | | 543,748 | | 546,320 |
Series 2012-H07 Class FA, 0.8713% 3/20/62 (k)(p) | | 318,271 | | 319,807 |
planned amortization Series 2011-61 Class OP, 5/20/40 (n) | | 446,699 | | 408,125 |
planned amortization class: | | | | |
Series 2010-112 Class PM 3.25% 9/20/33 | | 171,853 | | 177,497 |
Series 2010-99 Class PT, 3.5% 8/20/33 | | 214,214 | | 222,011 |
Series 2011-79 Class PO, 6/20/40 (n) | | 820,117 | | 748,115 |
sequential payer Series 2011-69 Class GX, 4.5% 5/16/40 | | 470,000 | | 529,028 |
Series 2010-42 Class OP, 4/20/40 (n) | | 1,040,062 | | 948,759 |
Series 2010-H13 Class JA, 5.46% 10/20/59 (p) | | 1,008,693 | | 1,108,977 |
Series 2010-H15 Class TP, 5.15% 8/20/60 (p) | | 1,170,110 | | 1,317,594 |
Series 2010-H17 Class XP, 5.302% 7/20/60 (p) | | 1,717,385 | | 1,937,494 |
Series 2010-H18 Class PL, 5.01% 9/20/60 (p) | | 1,289,167 | | 1,444,118 |
Series 2011-71: | | | | |
Class ZB, 5.5% 8/20/34 | | 982,879 | | 1,186,050 |
Class ZC, 5.5% 7/16/34 | | 1,120,535 | | 1,334,328 |
|
| Principal Amount (d) | | Value |
Government National Mortgage Association: | | | | |
floater sequential payer Series 2011-150 Class D, 3% 4/20/37 | | $ 248,740 | | $ 255,421 |
planned amortization class Series 2011-136 Class WI, 4.5% 5/20/40 (m) | | 252,434 | | 50,194 |
TOTAL COLLATERALIZED MORTGAGE OBLIGATIONS (Cost $42,762,674) |
43,543,276
|
Commercial Mortgage Securities - 0.8% |
|
Freddie Mac: | | | | |
pass-thru certificates Series K708 Class A1, 1.67% 10/25/18 | | 360,000 | | 366,914 |
sequential payer: | | | | |
Series K009 Class A2, 3.808% 8/25/20 | | 330,000 | | 366,266 |
Series K006 Class A2, 4.251% 1/25/20 | | 1,410,000 | | 1,601,096 |
Series K017 Class A2, 2.873% 12/25/21 | | 1,560,000 | | 1,628,545 |
Series K705 Class A1, 1.626% 7/25/18 | | 984,143 | | 1,001,768 |
Series K706: | | | | |
Class A1, 1.691% 6/25/18 | | 690,742 | | 703,815 |
Class A2, 2.323% 10/25/18 | | 1,360,000 | | 1,406,226 |
Series K709 Class A1, 1.56% 10/25/18 | | 570,000 | | 579,274 |
Freddie Mac Multi-Class pass-thru certificates: | | | | |
floater Series K707 Class A2, 2.22% 12/25/18 | | 1,220,000 | | 1,251,507 |
Series K501 Class A2, 1.655% 11/25/16 | | 550,000 | | 561,072 |
REC Plantation Place Ltd. Series 5 Class A, 1.2431% 7/25/16 (Reg. S) (k) | GBP | 47,806 | | 71,876 |
TOTAL COMMERCIAL MORTGAGE SECURITIES (Cost $9,383,957) |
9,538,359
|
Foreign Government and Government Agency Obligations - 21.7% |
|
Arab Republic of Egypt 6.875% 4/30/40 (f) | | 150,000 | | 129,000 |
Argentine Republic: | | | | |
discount (with partial capitalization through 12/31/13) 8.28% 12/31/33 | | 1,242,505 | | 813,841 |
0.785% 8/3/12 (k) | | 895,000 | | 882,146 |
2.5% 12/31/38 (e) | | 1,365,000 | | 440,213 |
7% 9/12/13 | | 2,865,000 | | 2,524,622 |
7% 10/3/15 | | 3,075,000 | | 2,326,238 |
Foreign Government and Government Agency Obligations - continued |
| Principal Amount (d) | | Value |
Bahamian Republic 6.95% 11/20/29 (f) | | $ 340,000 | | $ 394,400 |
Belarus Republic: | | | | |
8.75% 8/3/15 (Reg. S) | | 1,450,000 | | 1,417,375 |
8.95% 1/26/18 | | 640,000 | | 589,632 |
Brazilian Federative Republic: | | | | |
7.125% 1/20/37 | | 755,000 | | 1,091,957 |
8.25% 1/20/34 | | 525,000 | | 829,500 |
8.75% 2/4/25 | | 165,000 | | 255,750 |
10.125% 5/15/27 | | 735,000 | | 1,247,663 |
12.25% 3/6/30 | | 460,000 | | 909,650 |
Canadian Government: | | | | |
1% 2/1/14 | CAD | 3,200,000 | | 3,142,041 |
1.5% 12/1/12 | CAD | 2,400,000 | | 2,362,896 |
2% 6/1/16 | CAD | 9,875,000 | | 9,988,871 |
3.25% 6/1/21 | CAD | 4,100,000 | | 4,564,124 |
5% 6/1/37 | CAD | 3,300,000 | | 4,843,231 |
City of Buenos Aires 12.5% 4/6/15 (f) | | 1,360,000 | | 1,183,200 |
Colombian Republic: | | | | |
6.125% 1/18/41 | | 420,000 | | 551,250 |
7.375% 9/18/37 | | 605,000 | | 898,425 |
10.375% 1/28/33 | | 685,000 | | 1,222,725 |
11.75% 2/25/20 | | 245,000 | | 393,225 |
Congo Republic 3% 6/30/29 (e) | | 1,220,750 | | 903,355 |
Croatia Republic: | | | | |
6.25% 4/27/17 (f) | | 1,115,000 | | 1,109,425 |
6.375% 3/24/21 (f) | | 500,000 | | 484,400 |
6.625% 7/14/20 (f) | | 520,000 | | 513,500 |
6.75% 11/5/19 (f) | | 580,000 | | 585,800 |
Democratic Socialist Republic of Sri Lanka: | | | | |
6.25% 10/4/20 (f) | | 730,000 | | 746,425 |
6.25% 7/27/21 (f) | | 410,000 | | 418,200 |
7.4% 1/22/15 (f) | | 515,000 | | 552,338 |
Dominican Republic: | | | | |
1.2754% 8/30/24 (k) | | 495,000 | | 445,500 |
7.5% 5/6/21 (f) | | 690,000 | | 736,575 |
9.04% 1/23/18 (f) | | 325,707 | | 365,606 |
El Salvador Republic: | | | | |
7.375% 12/1/19 (f) | | 180,000 | | 198,900 |
7.625% 2/1/41 (f) | | 175,000 | | 184,013 |
7.65% 6/15/35 (Reg. S) | | 240,000 | | 252,000 |
8.25% 4/10/32 (Reg. S) | | 140,000 | | 156,100 |
European Economic Community 2.75% 4/4/22 (Reg. S) | EUR | 250,000 | | 322,992 |
European Union 3.375% 5/10/19 | EUR | 700,000 | | 968,943 |
Finnish Government 2.75% 7/4/28 | EUR | 550,000 | | 712,109 |
French Government: | | | | |
OAT: | | | | |
3% 4/25/22 | EUR | 5,700,000 | | 7,396,528 |
4.5% 4/25/41 | EUR | 905,000 | | 1,333,825 |
2.5% 7/25/16 | EUR | 1,500,000 | | 1,995,251 |
|
| Principal Amount (d) | | Value |
4% 4/25/18 | EUR | 2,600,000 | | $ 3,696,323 |
4% 4/25/55 | EUR | 500,000 | | 686,178 |
Gabonese Republic 8.2% 12/12/17 (f) | | $ 230,000 | | 273,125 |
Georgia Republic 6.875% 4/12/21 (f) | | 630,000 | | 670,950 |
German Federal Republic: | | | | |
0.75% 2/24/17 | EUR | 5,000,000 | | 6,373,374 |
1.75% 6/14/13 | EUR | 1,920,000 | | 2,468,733 |
2.5% 2/27/15 | EUR | 7,750,000 | | 10,405,302 |
3.25% 7/4/21 | EUR | 6,205,000 | | 9,056,519 |
3.25% 7/4/42 | EUR | 1,475,000 | | 2,232,842 |
Ghana Republic: | | | | |
8.5% 10/4/17 (f) | | 335,000 | | 371,850 |
14.25% 7/29/13 | GHS | 280,000 | | 134,190 |
14.99% 3/11/13 | GHS | 1,070,000 | | 527,614 |
15.65% 6/3/13 | GHS | 245,000 | | 119,937 |
Government of Bermuda 4.138% 1/3/23 (f) | | 200,000 | | 203,000 |
Guatemalan Republic 5.75% 6/6/22 (f) | | 290,000 | | 300,150 |
Hungarian Republic: | | | | |
4.75% 2/3/15 | | 1,575,000 | | 1,512,000 |
7.625% 3/29/41 | | 876,000 | | 858,480 |
Indonesian Republic: | | | | |
4.875% 5/5/21 (f) | | 700,000 | | 761,250 |
5.25% 1/17/42 (f) | | 695,000 | | 725,441 |
5.875% 3/13/20 (f) | | 730,000 | | 837,675 |
6.625% 2/17/37 (f) | | 525,000 | | 648,375 |
6.875% 1/17/18 (f) | | 450,000 | | 532,125 |
7.75% 1/17/38 (f) | | 810,000 | | 1,115,775 |
8.5% 10/12/35 (Reg. S) | | 775,000 | | 1,131,500 |
11.625% 3/4/19 (f) | | 875,000 | | 1,284,063 |
Islamic Republic of Pakistan 7.125% 3/31/16 (f) | | 1,325,000 | | 1,146,125 |
Israeli State (guaranteed by U.S. Government through Agency for International Development): | | | | |
5.5% 9/18/23 | | 2,468,000 | | 3,232,557 |
5.5% 12/4/23 | | 1,500,000 | | 1,974,116 |
Italian Republic: | | | | |
4% 2/1/17 | EUR | 5,200,000 | | 6,367,678 |
4.25% 8/1/14 | EUR | 4,500,000 | | 5,742,142 |
4.25% 3/1/20 | EUR | 3,300,000 | | 3,865,829 |
5% 3/1/22 | EUR | 5,500,000 | | 6,640,496 |
5% 9/1/40 | EUR | 2,440,000 | | 2,592,636 |
Japan Government: | | | | |
0.2% 7/15/12 | JPY | 102,350,000 | | 1,280,446 |
1.1% 6/20/20 | JPY | 720,000,000 | | 9,371,485 |
1.8% 6/20/18 | JPY | 590,000,000 | | 8,020,841 |
1.9% 9/20/30 | JPY | 310,000,000 | | 4,064,551 |
Foreign Government and Government Agency Obligations - continued |
| Principal Amount (d) | | Value |
Japan Government: - continued | | | | |
2% 9/20/40 | JPY | 135,000,000 | | $ 1,732,291 |
Jordanian Kingdom 3.875% 11/12/15 | | $ 200,000 | | 194,000 |
Latvian Republic 5.25% 2/22/17 (f) | | 555,000 | | 575,119 |
Lebanese Republic: | | | | |
4% 12/31/17 | | 1,157,750 | | 1,134,595 |
5.15% 11/12/18 | | 150,000 | | 148,125 |
Lithuanian Republic: | | | | |
6.125% 3/9/21 (f) | | 540,000 | | 592,650 |
6.625% 2/1/22 (f) | | 375,000 | | 429,375 |
7.375% 2/11/20 (f) | | 575,000 | | 681,375 |
Peruvian Republic: | | | | |
3% 3/7/27 (e) | | 570,000 | | 547,200 |
5.625% 11/18/50 | | 440,000 | | 535,700 |
7.35% 7/21/25 | | 320,000 | | 448,000 |
8.75% 11/21/33 | | 735,000 | | 1,207,238 |
Philippine Republic: | | | | |
7.5% 9/25/24 | | 100,000 | | 132,750 |
7.75% 1/14/31 | | 575,000 | | 817,938 |
9.5% 2/2/30 | | 710,000 | | 1,151,123 |
9.875% 1/15/19 | | 245,000 | | 346,675 |
10.625% 3/16/25 | | 580,000 | | 959,900 |
Polish Government: | | | | |
3.875% 7/16/15 | | 185,000 | | 195,175 |
5% 3/23/22 | | 265,000 | | 289,513 |
6.375% 7/15/19 | | 700,000 | | 826,000 |
Provincia de Cordoba 12.375% 8/17/17 (f) | | 865,000 | | 510,350 |
Republic of Iceland 5.875% 5/11/22 (f) | | 420,000 | | 412,663 |
Republic of Iraq 5.8% 1/15/28 (Reg. S) | | 1,500,000 | | 1,237,500 |
Republic of Namibia 5.5% 11/3/21 (f) | | 330,000 | | 342,692 |
Republic of Nigeria: | | | | |
0% 3/7/13 | NGN | 23,000,000 | | 125,963 |
6.75% 1/28/21 (f) | | 155,000 | | 167,400 |
Republic of Serbia 6.75% 11/1/24 (f) | | 2,845,834 | | 2,724,886 |
Romanian Republic 6.75% 2/7/22 (f) | | 750,000 | | 783,750 |
Russian Federation: | | | | |
3.25% 4/4/17 (f) | | 400,000 | | 402,000 |
4.5% 4/4/22 (f) | | 400,000 | | 419,520 |
5.625% 4/4/42 (f) | | 800,000 | | 855,040 |
7.5% 3/31/30 (Reg. S) | | 4,898,425 | | 5,872,232 |
11% 7/24/18 (Reg. S) | | 270,000 | | 378,000 |
12.75% 6/24/28 (Reg. S) | | 1,420,000 | | 2,556,000 |
Slovakia Republic 4.375% 5/21/22 (f) | | 425,000 | | 414,375 |
|
| Principal Amount (d) | | Value |
State of Qatar 5.75% 1/20/42 (f) | | $ 295,000 | | $ 348,838 |
State Oil Company of Azerbaijan Republic 5.45% 2/9/17 | | 200,000 | | 205,534 |
Turkish Republic: | | | | |
0% 5/15/13 | TRY | 655,000 | | 336,210 |
5.125% 3/25/22 | | 485,000 | | 506,243 |
5.625% 3/30/21 | | 365,000 | | 398,763 |
6% 1/14/41 | | 575,000 | | 605,188 |
6.25% 9/26/22 | | 475,000 | | 537,368 |
6.75% 4/3/18 | | 780,000 | | 896,064 |
6.75% 5/30/40 | | 555,000 | | 646,575 |
6.875% 3/17/36 | | 1,165,000 | | 1,373,302 |
7% 9/26/16 | | 590,000 | | 667,290 |
7.25% 3/15/15 | | 780,000 | | 859,950 |
7.25% 3/5/38 | | 775,000 | | 954,258 |
7.375% 2/5/25 | | 1,150,000 | | 1,426,000 |
7.5% 7/14/17 | | 825,000 | | 965,250 |
7.5% 11/7/19 | | 575,000 | | 696,498 |
8% 2/14/34 | | 210,000 | | 277,473 |
11.875% 1/15/30 | | 620,000 | | 1,098,206 |
Ukraine Financing of Infrastructure Projects State Enterprise 8.375% 11/3/17 (f) | | 655,000 | | 550,200 |
Ukraine Government: | | | | |
6.25% 6/17/16 (f) | | 430,000 | | 385,409 |
6.75% 11/14/17 (f) | | 260,000 | | 230,750 |
7.65% 6/11/13 (f) | | 1,200,000 | | 1,179,000 |
7.75% 9/23/20 (f) | | 340,000 | | 306,850 |
7.95% 2/23/21 (f) | | 400,000 | | 366,000 |
United Arab Emirates 7.75% 10/5/20 (Reg. S) | | 190,000 | | 213,988 |
United Kingdom, Great Britain and Northern Ireland: | | | | |
1.75% 1/22/17 | GBP | 4,875,000 | | 7,974,891 |
4.25% 12/7/40 | GBP | 3,210,000 | | 6,190,166 |
4.5% 3/7/13 | GBP | 1,025,000 | | 1,651,071 |
4.5% 12/7/42 | GBP | 650,000 | | 1,311,079 |
United Mexican States: | | | | |
4.75% 3/8/44 | | 276,000 | | 296,700 |
5.125% 1/15/20 | | 610,000 | | 714,920 |
5.75% 10/12/2110 | | 634,000 | | 724,345 |
6.05% 1/11/40 | | 1,236,000 | | 1,588,260 |
6.75% 9/27/34 | | 1,050,000 | | 1,428,000 |
7.5% 4/8/33 | | 285,000 | | 415,388 |
8.3% 8/15/31 | | 250,000 | | 386,875 |
Uruguay Republic: | | | | |
7.875% 1/15/33 pay-in-kind | | 575,000 | | 836,625 |
8% 11/18/22 | | 484,628 | | 682,114 |
Venezuelan Republic: | | | | |
oil recovery rights 4/15/20 (o) | | 10,236 | | 299,403 |
6% 12/9/20 | | 465,000 | | 316,200 |
7% 3/31/38 | | 460,000 | | 299,000 |
7.75% 10/13/19 (Reg. S) | | 700,000 | | 539,000 |
8.5% 10/8/14 | | 595,000 | | 587,563 |
Foreign Government and Government Agency Obligations - continued |
| Principal Amount (d) | | Value |
Venezuelan Republic: - continued | | | | |
9% 5/7/23 (Reg. S) | | $ 1,935,000 | | $ 1,489,950 |
9.25% 9/15/27 | | 1,250,000 | | 1,018,750 |
9.25% 5/7/28 (Reg. S) | | 710,000 | | 537,825 |
9.375% 1/13/34 | | 665,000 | | 508,725 |
10.75% 9/19/13 | | 745,000 | | 763,625 |
11.75% 10/21/26 (Reg. S) | | 1,080,000 | | 953,100 |
11.95% 8/5/31 (Reg. S) | | 1,750,000 | | 1,548,750 |
12.75% 8/23/22 | | 2,280,000 | | 2,188,800 |
13.625% 8/15/18 | | 496,000 | | 503,440 |
Vietnamese Socialist Republic: | | | | |
1.5567% 3/12/16 (k) | | 473,043 | | 421,009 |
4% 3/12/28 (e) | | 1,525,000 | | 1,235,250 |
6.875% 1/15/16 (f) | | 680,000 | | 722,500 |
TOTAL FOREIGN GOVERNMENT AND GOVERNMENT AGENCY OBLIGATIONS (Cost $240,668,835) |
248,921,077
|
Common Stocks - 0.2% |
| Shares | | |
CONSUMER DISCRETIONARY - 0.0% |
Auto Components - 0.0% |
Remy International, Inc. | 6,195 | | 93,235 |
Automobiles - 0.0% |
General Motors Co. (a) | 503 | | 9,919 |
General Motors Co.: | | | |
warrants 7/10/16 (a) | 10,197 | | 112,371 |
warrants 7/10/19 (a) | 10,197 | | 69,136 |
Motors Liquidation Co. GUC Trust (a) | 2,816 | | 34,496 |
| | 225,922 |
Media - 0.0% |
Haights Cross Communications, Inc. (a) | 107 | | 793 |
Haights Cross Communications, Inc. warrants 3/11/13 (a) | 148 | | 50 |
HMH Holdings, Inc. warrants
6/22/19 (a)(q) | 2,218 | | 4,270 |
HMH Holdings, Inc. warrants 3/9/17 (a)(q) | 40,350 | | 4 |
RDA Holding Co. warrants 2/19/14 (a)(q) | 510 | | 0 |
| | 5,117 |
TOTAL CONSUMER DISCRETIONARY | | 324,274 |
CONSUMER STAPLES - 0.0% |
Food Products - 0.0% |
Reddy Ice Holdings, Inc. | 5,683 | | 0 |
|
| Shares | | Value |
INDUSTRIALS - 0.1% |
Aerospace & Defense - 0.0% |
Alion Science & Technology Corp. warrants 3/15/17 (a) | 115 | | $ 575 |
Airlines - 0.0% |
Delta Air Lines, Inc. (a) | 1,150 | | 12,593 |
Building Products - 0.1% |
Nortek, Inc. (a) | 16,991 | | 850,230 |
Nortek, Inc. warrants 12/7/14 (a) | 524 | | 2,620 |
| | 852,850 |
Marine - 0.0% |
US Shipping Partners Corp. (a) | 644 | | 0 |
US Shipping Partners Corp. warrants 12/31/29 (a) | 6,028 | | 0 |
Trading Companies & Distributors - 0.0% |
Penhall Acquisition Co.: | | | |
Class A (a) | 321 | | 25,680 |
Class B (a) | 107 | | 8,560 |
| | 34,240 |
Transportation Infrastructure - 0.0% |
DeepOcean Group Holding A/S (a)(f) | 31,897 | | 426,782 |
TOTAL INDUSTRIALS | | 1,327,040 |
INFORMATION TECHNOLOGY - 0.0% |
Semiconductors & Semiconductor Equipment - 0.0% |
MagnaChip Semiconductor Corp. (a) | 2,669 | | 25,436 |
Spansion, Inc. Class A (a) | 470 | | 5,161 |
| | 30,597 |
MATERIALS - 0.1% |
Chemicals - 0.1% |
Chemtura Corp. (a) | 7,820 | | 113,390 |
LyondellBasell Industries NV Class A | 14,559 | | 586,291 |
Tronox Ltd. Class A | 448 | | 54,083 |
| | 753,764 |
Containers & Packaging - 0.0% |
Rock-Tenn Co. Class A | 303 | | 16,529 |
Metals & Mining - 0.0% |
Aleris International, Inc. (a)(q) | 2,037 | | 95,484 |
TOTAL MATERIALS | | 865,777 |
UTILITIES - 0.0% |
Electric Utilities - 0.0% |
Portland General Electric Co. | 140 | | 3,732 |
TOTAL COMMON STOCKS (Cost $2,635,035) |
2,551,420
|
Preferred Stocks - 0.3% |
| Shares | | Value |
Convertible Preferred Stocks - 0.1% |
CONSUMER DISCRETIONARY - 0.1% |
Automobiles - 0.1% |
General Motors Co. 4.75% | 17,735 | | $ 588,802 |
Media - 0.0% |
Interpublic Group of Companies, Inc. 5.25% | 300 | | 311,397 |
TOTAL CONSUMER DISCRETIONARY | | 900,199 |
CONSUMER STAPLES - 0.0% |
Food Products - 0.0% |
Reddy Ice Holdings, Inc. 7.00% pay-in-kind | 2,286 | | 16,317 |
TOTAL CONVERTIBLE PREFERRED STOCKS | | 916,516 |
Nonconvertible Preferred Stocks - 0.2% |
FINANCIALS - 0.2% |
Consumer Finance - 0.2% |
Ally Financial, Inc. 7.00% (f) | 2,620 | | 2,318,700 |
TOTAL PREFERRED STOCKS (Cost $2,914,925) |
3,235,216
|
Floating Rate Loans - 4.6% |
| Principal Amount | | |
CONSUMER DISCRETIONARY - 0.4% |
Diversified Consumer Services - 0.0% |
ServiceMaster Co.: | | | | |
term loan 2.7902% 7/24/14 (k) | | $ 390,543 | | 385,661 |
Tranche DD, term loan 2.75% 7/24/14 (k) | | 40,225 | | 39,722 |
| | 425,383 |
Hotels, Restaurants & Leisure - 0.1% |
Harrah's Entertainment, Inc. Tranche B-6, term loan 5.4952% 1/28/18 (k) | | 370,000 | | 327,450 |
Mesquite Gaming LLC term loan 8.5% 8/1/15 (k) | | 15,000 | | 12,750 |
Stockbridge SBE Holdings LLC Tranche B, term loan 13% 5/2/17 (k) | | 90,000 | | 88,650 |
Wok Acquisition Corp. Tranche B, term loan 6/22/19 (k) | | 120,000 | | 120,300 |
| | 549,150 |
Leisure Equipment & Products - 0.0% |
SRAM LLC. 2nd LN, term loan 8.5% 12/7/18 (k) | | 135,000 | | 135,675 |
|
| Principal Amount | | Value |
Media - 0.1% |
Bragg Communications, Inc. Tranche B, term loan 4% 2/28/18 (k) | | $ 384,038 | | $ 382,117 |
Kabel Deutschland GmbH Tranche F, term loan 4.25% 2/1/19 (k) | | 140,000 | | 138,775 |
PRIMEDIA, Inc. Tranche B, term loan 7.5% 1/13/18 (k) | | 679,850 | | 601,667 |
| | 1,122,559 |
Specialty Retail - 0.2% |
Burlington Coat Factory Warehouse Corp. Tranche B 1LN, term loan 5.5% 2/23/17 (k) | | 1,853,968 | | 1,844,698 |
Michaels Stores, Inc. Tranche B1, term loan 2.75% 10/31/13 (k) | | 812,677 | | 810,645 |
| | 2,655,343 |
TOTAL CONSUMER DISCRETIONARY | | 4,888,110 |
CONSUMER STAPLES - 0.5% |
Food & Staples Retailing - 0.1% |
Focus Brands, Inc.: | | | | |
Tranche 2LN, term loan 10.25% 8/21/18 (k) | | 235,000 | | 235,588 |
Tranche B 1LN, term loan 6.2657% 2/21/18 (k) | | 43,019 | | 42,912 |
Roundy's, Inc. Tranche B, term loan 5.75% 2/13/19 (k) | | 174,563 | | 172,817 |
U.S. Foodservice term loan 5.75% 3/31/17 (k) | | 742,500 | | 709,088 |
| | 1,160,405 |
Personal Products - 0.1% |
Prestige Brands, Inc. Tranche B, term loan 5.25% 1/31/19 (k) | | 236,894 | | 237,782 |
Revlon Consumer Products Corp. term loan 4.7525% 11/19/17 (k) | | 435,600 | | 432,878 |
| | 670,660 |
Tobacco - 0.3% |
Reynolds Consumer Products Holdings, Inc. Tranche E, term loan 6.5% 2/9/18 (k) | | 3,381,006 | | 3,397,911 |
TOTAL CONSUMER STAPLES | | 5,228,976 |
ENERGY - 0.2% |
Oil, Gas & Consumable Fuels - 0.2% |
Arch Coal, Inc. Tranche B, term loan 5.75% 5/16/18 (k) | | 330,000 | | 323,400 |
Chesapeake Energy Corp. term loan 8.5% 12/2/17 (k) | | 495,000 | | 489,431 |
Floating Rate Loans - continued |
| Principal Amount | | Value |
ENERGY - continued |
Oil, Gas & Consumable Fuels - continued |
Crestwood Holdings Partners LLC Tranche B, term loan 9.75% 3/26/18 (k) | | $ 610,000 | | $ 613,050 |
Energy Transfer Equity LP Tranche B, term loan 3.75% 3/23/17 (k) | | 1,110,000 | | 1,087,800 |
| | 2,513,681 |
FINANCIALS - 0.5% |
Diversified Financial Services - 0.1% |
Flying Fortress, Inc. Tranche 3, term loan 5% 6/30/17 (k) | | 1,675,000 | | 1,681,365 |
Goodman Global Group, Inc. Tranche 1 LN, term loan 5.75% 10/28/16 (k) | | 330,446 | | 330,446 |
| | 2,011,811 |
Insurance - 0.3% |
Asurion Corp.: | | | | |
Tranche 1st LN, term loan 5.5% 5/24/18 (k) | | 1,374,864 | | 1,369,777 |
Tranche 2nd LN, term loan 9% 5/24/19 (k) | | 765,000 | | 780,300 |
Lonestar Intermediate Super Holdings LLC term loan 11% 9/2/19 (k) | | 980,000 | | 1,024,100 |
| | 3,174,177 |
Real Estate Management & Development - 0.1% |
Realogy Corp.: | | | | |
Credit-Linked Deposit 3.2413% 10/10/13 (k) | | 25,473 | | 23,817 |
Credit-Linked Deposit 4.4913% 10/10/16 (k) | | 62,600 | | 59,157 |
term loan 4.4908% 10/10/16 (k) | | 905,018 | | 855,242 |
| | 938,216 |
TOTAL FINANCIALS | | 6,124,204 |
HEALTH CARE - 0.6% |
Health Care Providers & Services - 0.5% |
DaVita, Inc. Tranche A, term loan 2.75% 10/20/15 (k) | | 655,188 | | 650,274 |
Emergency Medical Services Corp. Tranche B, term loan 5.25% 5/25/18 (k) | | 1,183,153 | | 1,172,801 |
IASIS Healthcare LLC Tranche B, term loan 5% 5/3/18 (k) | | 788,114 | | 774,322 |
Quintiles Transnational Corp. Tranche B, term loan 5% 6/8/18 (k) | | 2,875,950 | | 2,840,001 |
Sunquest Information Systems, Inc. Tranche 1 LN, term loan 6.25% 12/16/16 (k) | | 217,800 | | 217,800 |
| | 5,655,198 |
|
| Principal Amount | | Value |
Life Sciences Tools & Services - 0.1% |
Pharmaceutical Product Development, Inc. Tranche B, term loan 6.25% 12/5/18 (k) | | $ 1,253,700 | | $ 1,261,536 |
TOTAL HEALTH CARE | | 6,916,734 |
INDUSTRIALS - 0.5% |
Aerospace & Defense - 0.0% |
TransDigm, Inc. Tranche B, term loan 4% 2/14/17 (k) | | 147,750 | | 147,750 |
Airlines - 0.2% |
Northwest Airlines Corp. Tranche A, term loan 2.22% 12/31/18 (k) | | 695,226 | | 656,988 |
United Air Lines, Inc. Tranche B, term loan 2.25% 2/1/14 (k) | | 766,073 | | 743,091 |
US Airways Group, Inc. term loan 2.7453% 3/23/14 (k) | | 850,761 | | 808,223 |
| | 2,208,302 |
Building Products - 0.0% |
HD Supply, Inc. Tranche B 1LN, term loan 7.25% 10/12/17 (k) | | 210,000 | | 211,575 |
Commercial Services & Supplies - 0.1% |
Delos Aircraft, Inc. Tranche T 2LN, term loan 4.75% 4/12/16 (k) | | 110,000 | | 110,418 |
KAR Auction Services, Inc. Tranche B, term loan 5% 5/19/17 (k) | | 435,600 | | 436,689 |
| | 547,107 |
Construction & Engineering - 0.1% |
Drumm Investors LLC Tranche B, term loan 5% 5/4/18 (k) | | 1,395,563 | | 1,315,318 |
Electrical Equipment - 0.0% |
Sensata Technologies BV Tranche B, term loan 4% 5/12/18 (k) | | 99,000 | | 98,381 |
Industrial Conglomerates - 0.1% |
Tomkins PLC Tranche B, term loan 4.25% 9/21/16 (k) | | 755,821 | | 753,931 |
Road & Rail - 0.0% |
Swift Transportation Co. LLC Tranche B-2, term loan 5% 12/21/17 (k) | | 496,380 | | 498,266 |
Transportation Infrastructure - 0.0% |
Trico Shipping A/S: | | | | |
Tranche A, term loan 10% 5/13/14 (k) | | 50,040 | | 49,853 |
Tranche D, term loan 5/13/14 (r) | | 88,104 | | 87,774 |
| | 137,627 |
TOTAL INDUSTRIALS | | 5,918,257 |
Floating Rate Loans - continued |
| Principal Amount | | Value |
INFORMATION TECHNOLOGY - 0.6% |
Communications Equipment - 0.1% |
Cequel Communications LLC Tranche B, term loan 4% 2/14/19 (k) | | $ 1,261,838 | | $ 1,236,601 |
Electronic Equipment & Components - 0.1% |
Aeroflex, Inc. Tranche B, term loan 5.75% 5/9/18 (k) | | 234,434 | | 226,815 |
Flextronics International Ltd.: | | | | |
Tranche B A1, term loan 2.4953% 10/1/14 (k) | | 55,777 | | 54,940 |
Tranche B A2, term loan 2.4953% 10/1/14 (k) | | 132,963 | | 130,968 |
Tranche B A3, term loan 2.4888% 10/1/14 (k) | | 155,123 | | 152,796 |
Tranche B-A, term loan 2.4891% 10/1/14 (k) | | 194,102 | | 191,191 |
| | 756,710 |
Semiconductors & Semiconductor Equipment - 0.2% |
NXP BV: | | | | |
term loan 4.5% 3/4/17 (k) | | 518,438 | | 511,957 |
Tranche A 2LN, term loan 5.5% 3/4/17 (k) | | 689,788 | | 691,512 |
Tranche A6, term loan 5.25% 3/19/19 (k) | | 1,506,225 | | 1,506,225 |
| | 2,709,694 |
Software - 0.2% |
Kronos, Inc.: | | | | |
Tranche B 1LN, term loan 5.2106% 6/11/17 (k) | | 528,529 | | 528,529 |
Tranche B 2LN, term loan 10.4606% 6/11/18 (k) | | 125,000 | | 125,000 |
Lawson Software, Inc. Tranche B, term loan 6.25% 4/5/18 (k) | | 1,025,000 | | 1,030,125 |
| | 1,683,654 |
TOTAL INFORMATION TECHNOLOGY | | 6,386,659 |
MATERIALS - 0.2% |
Chemicals - 0.1% |
INEOS U.S. Finance LLC term loan 6.5% 4/27/18 (k) | | 758,100 | | 742,938 |
PL Propylene LLC Tranche B, term loan 7% 3/27/17 (k) | | 94,763 | | 95,473 |
| | 838,411 |
Construction Materials - 0.1% |
Fairmount Minerals Ltd. Tranche B, term loan 5.25% 3/15/17 (k) | | 702,150 | | 696,884 |
Summit Materials LLC Tranche B, term loan 6% 1/30/19 (k) | | 154,613 | | 154,613 |
| | 851,497 |
|
| Principal Amount | | Value |
Metals & Mining - 0.0% |
Walter Energy, Inc. Tranche B, term loan 4% 4/1/18 (k) | | $ 122,785 | | $ 120,483 |
TOTAL MATERIALS | | 1,810,391 |
TELECOMMUNICATION SERVICES - 0.2% |
Wireless Telecommunication Services - 0.2% |
Crown Castle Operating Co. Tranche B, term loan 4% 1/31/19 (k) | | 492,525 | | 484,546 |
Intelsat Jackson Holdings SA: | | | | |
term loan 3.2408% 2/1/14 (k) | | 495,000 | | 480,150 |
Tranche B, term loan 5.25% 4/2/18 (k) | | 1,004,495 | | 1,004,495 |
| | 1,969,191 |
UTILITIES - 0.9% |
Electric Utilities - 0.4% |
Texas Competitive Electric Holdings Co. LLC/Texas Competitive Electric Holdings Finance, Inc. Tranche B, term loan 4.7408% 10/10/17 (k) | | 7,269,235 | | 4,334,281 |
Gas Utilities - 0.0% |
Everest Acquisition LLC Tranche B, term loan 6.5% 4/24/18 (k) | | 265,000 | | 267,650 |
Independent Power Producers & Energy Traders - 0.5% |
Calpine Corp. Tranche B, term loan 4.5% 4/1/18 (k) | | 4,431,419 | | 4,403,723 |
LSP Madison Funding LLC Tranche 1LN, term loan 0% 6/28/19 (k) | | 590,000 | | 581,150 |
The AES Corp. Tranche B, term loan 4.25% 5/27/18 (k) | | 872,424 | | 872,424 |
| | 5,857,297 |
TOTAL UTILITIES | | 10,459,228 |
TOTAL FLOATING RATE LOANS (Cost $53,319,075) |
52,215,431
|
Sovereign Loan Participations - 0.1% |
|
Indonesian Republic loan participation: | | | | |
Citibank 1.25% 12/14/19 (k) | | 379,871 | | 355,179 |
Goldman Sachs 1.25% 12/14/19 (k) | | 683,715 | | 639,274 |
1.25% 12/14/19 (k) | | 136,252 | | 127,395 |
TOTAL SOVEREIGN LOAN PARTICIPATIONS (Cost $1,075,514) |
1,121,848
|
Fixed-Income Funds - 0.7% |
| Shares | | Value |
Fidelity Floating Rate Central Fund (l)
(Cost $7,125,146) | 81,812 | | $ 8,303,100 |
Preferred Securities - 0.2% |
| Principal Amount | | |
CONSUMER DISCRETIONARY - 0.0% |
Media - 0.0% |
Globo Comunicacoes e Participacoes SA 6.25% (e)(f)(g) | $ 575,000 | | 618,046 |
FINANCIALS - 0.1% |
Commercial Banks - 0.0% |
Wells Fargo & Co. 7.98% (g)(k) | 135,000 | | 151,662 |
Diversified Financial Services - 0.1% |
Bank of America Corp.: | | | |
8% (g)(k) | 525,000 | | 566,279 |
8.125% (g)(k) | 280,000 | | 296,206 |
| | 862,485 |
TOTAL FINANCIALS | | 1,014,147 |
MATERIALS - 0.1% |
Metals & Mining - 0.1% |
CSN Islands XII Corp. 7% (Reg. S) (g) | 820,000 | | 815,098 |
TOTAL PREFERRED SECURITIES (Cost $2,191,842) |
2,447,291
|
Other - 0.0% |
| Shares | | |
Other - 0.0% |
Idearc, Inc. Claim (a)
(Cost $1) | 108,228 | |
1
|
Money Market Funds - 5.8% |
| | | |
Fidelity Cash Central Fund, 0.17% (b)
(Cost $66,127,556) | 66,127,556 | |
66,127,556
|
TOTAL INVESTMENT PORTFOLIO - 100.5% (Cost $1,118,620,250) | | 1,153,192,442 |
NET OTHER ASSETS (LIABILITIES) - (0.5)% | | (5,572,676) |
NET ASSETS - 100% | $ 1,147,619,766 |
TBA Sale Commitments |
| Principal Amount | | Value |
Fannie Mae |
3.5% 7/1/42 | $ (400,000) | | $ (420,496) |
4% 7/1/42 | (1,800,000) | | (1,915,941) |
4% 7/1/42 | (1,800,000) | | (1,915,941) |
4% 7/1/42 | (8,000,000) | | (8,515,294) |
TOTAL TBA SALE COMMITMENTS (Proceeds $12,726,836) | $ (12,767,672) |
Futures Contracts |
| Expiration Date | | Underlying Face Amount at Value | | Unrealized Appreciation/
(Depreciation) |
Purchased |
Treasury Contracts |
44 CBOT 10-Year U.S. Treasury Note Contracts | Sept. 2012 | | $ 5,868,500 | | $ 42,188 |
39 CBOT 2-Year U.S. Treasury Note Contracts | Sept. 2012 | | 8,587,313 | | (1,305) |
7 CBOT Long Term U.S. Treasury Bond Contracts | Sept. 2012 | | 1,035,781 | | 8,627 |
TOTAL TREASURY CONTRACTS | | $ 15,491,594 | | $ 49,510 |
|
The face value of futures purchased as a percentage of net assets is 1.3% |
Swap Agreements |
| Expiration Date | | Notional Amount | | Value |
Interest Rate Swaps |
Receive quarterly a floating rate based on 3-month LIBOR and pay semi-annually a fixed rate equal to 2.4375% with JPMorgan Chase, Inc. | June 2042 | | $ 200,000 | | $ 3,142 |
Currency Abbreviations |
BRL | - | Brazilian real |
CAD | - | Canadian dollar |
EUR | - | European Monetary Unit |
GBP | - | British pound |
GHS | - | Ghana Cedi |
JPY | - | Japanese yen |
NGN | - | Nigerian naira |
TRY | - | Turkish Lira |
Legend |
(a) Non-income producing |
(b) Affiliated fund that is available only to investment companies and other accounts managed by Fidelity Investments. The rate quoted is the annualized seven-day yield of the fund at period end. A complete unaudited listing of the fund's holdings as of its most recent quarter end is available upon request. In addition, each Fidelity Central Fund's financial statements are available on the SEC's website or upon request. |
(c) Non-income producing - Security is in default. |
(d) Principal amount is stated in United States dollars unless otherwise noted. |
(e) Security initially issued at one coupon which converts to a higher coupon at a specified date. The rate shown is the rate at period end. |
(f) Security exempt from registration under Rule 144A of the Securities Act of 1933. These securities may be resold in transactions exempt from registration, normally to qualified institutional buyers. At the end of the period, the value of these securities amounted to $196,074,761 or 17.1% of net assets. |
(g) Security is perpetual in nature with no stated maturity date. |
(h) Under the Temporary Liquidity Guarantee Program, the Federal Deposit Insurance Corporation guarantees principal and interest in the event of payment default or bankruptcy until the earlier of maturity date of the debt or until June 30, 2012. At the end of the period these securities amounted to $388,371 or 0.0% of net assets. |
(i) Security or a portion of the security purchased on a delayed delivery or when-issued basis. |
(j) Security or a portion of the security was pledged to cover margin requirements for futures contracts. At the period end, the value of securities pledged amounted to $116,288. |
(k) Coupon rates for floating and adjustable rate securities reflect the rates in effect at period end. |
(l) Affiliated fund that is available only to investment companies and other accounts managed by Fidelity Investments. A complete unaudited schedule of portfolio holdings for each Fidelity Central Fund is filed with the SEC for the first and third quarters of each fiscal year on Form N-Q and is available upon request or at the SEC's web site at www.sec.gov. An unaudited holdings listing for the Fund, which presents direct holdings as well as the pro rata share of securities and other investments held indirectly through its investment in underlying non-money market Fidelity Central Funds, is available at advisor.fidelity.com. In addition, each Fidelity Central Fund's financial statements are available on the SEC's web site or upon request. |
(m) Security represents right to receive monthly interest payments on an underlying pool of mortgages or assets. Principal shown is the outstanding par amount of the pool as of the end of the period. |
(n) Principal Only Strips represent the right to receive the monthly principal payments on an underlying pool of mortgage loans. |
(o) Quantity represents share amount. |
(p) Represents an investment in an underlying pool of reverse mortgages which typically do not require regular principal and interest payments as repayment is deferred until a maturity event. |
(q) Restricted securities - Investment in securities not registered under the Securities Act of 1933 (excluding 144A issues). At the end of the period, the value of restricted securities (excluding 144A issues) amounted to $99,758 or 0.0% of net assets. |
Additional information on each restricted holding is as follows: |
Security | Acquisition Date | Acquisition Cost |
Aleris International, Inc. | 6/1/10 | $ 71,295 |
HMH Holdings, Inc. warrants 6/22/19 | 6/22/12 | $ 4,281 |
HMH Holdings, Inc. warrants 3/9/17 | 3/9/10 | $ 11,701 |
RDA Holding Co. warrants 2/19/14 | 2/27/07 | $ 160,000 |
(r) Position represents an unfunded loan commitment. At period end, the total principal amount and market value of unfunded commitments totaled $88,104 and $87,774, respectively. The coupon rate will be determined at time of settlement. |
Affiliated Central Funds |
Information regarding fiscal year to date income earned by the Fund from investments in Fidelity Central Funds is as follows: |
Fund | Income earned |
Fidelity Cash Central Fund | $ 42,712 |
Fidelity Floating Rate Central Fund | 315,332 |
Total | $ 358,044 |
Additional information regarding the Fund's fiscal year to date purchases and sales, including the ownership percentage, of the non Money Market Central Funds is as follows: |
Fund | Value, beginning of period | Purchases | Sales Proceeds | Value,
end of
period | % ownership,
end of
period |
Fidelity Floating Rate Central Fund | $ 12,189,986 | $ - | $ 4,253,507 | $ 8,303,100 | 0.6% |
Other Information |
The following is a summary of the inputs used, as of June 30, 2012, involving the Fund's assets and liabilities carried at fair value. The inputs or methodology used for valuing securities may not be an indication of the risk associated with investing in those securities. For more information on valuation inputs, and their aggregation into the levels used in the table below, please refer to the Security Valuation section in the accompanying Notes to Financial Statements. |
Valuation Inputs at Reporting Date: |
Description | Total | Level 1 | Level 2 | Level 3 |
Investments in Securities: | | | | |
Equities: | | | | |
Consumer Discretionary | $ 1,224,473 | $ 907,959 | $ 311,397 | $ 5,117 |
Consumer Staples | 16,317 | - | - | 16,317 |
Financials | 2,318,700 | - | 2,318,700 | - |
Industrials | 1,327,040 | 862,823 | - | 464,217 |
Information Technology | 30,597 | 30,597 | - | - |
Materials | 865,777 | 770,293 | 95,484 | - |
Utilities | 3,732 | 3,732 | - | - |
Corporate Bonds | 416,143,471 | - | 416,108,800 | 34,671 |
U.S. Government and Government Agency Obligations | 260,888,941 | - | 260,888,941 | - |
U.S. Government Agency - Mortgage Securities | 38,155,455 | - | 38,155,455 | - |
Collateralized Mortgage Obligations | 43,543,276 | - | 43,543,276 | - |
Commercial Mortgage Securities | 9,538,359 | - | 9,538,359 | - |
Foreign Government and Government Agency Obligations | 248,921,077 | - | 248,921,077 | - |
Floating Rate Loans | 52,215,431 | - | 52,215,431 | - |
Sovereign Loan Participations | 1,121,848 | - | - | 1,121,848 |
Fixed-Income Funds | 8,303,100 | 8,303,100 | - | - |
Preferred Securities | 2,447,291 | - | 2,447,291 | - |
Other | 1 | - | - | 1 |
Money Market Funds | 66,127,556 | 66,127,556 | - | - |
Total Investments in Securities: | $ 1,153,192,442 | $ 77,006,060 | $ 1,074,544,211 | $ 1,642,171 |
Derivative Instruments: | | | | |
Assets | | | | |
Futures Contracts | $ 50,815 | $ 50,815 | $ - | $ - |
Swap Agreements | 3,142 | - | 3,142 | - |
Total Assets | $ 53,957 | $ 50,815 | $ 3,142 | $ - |
Liabilities | | | | |
Futures Contracts | $ (1,305) | $ (1,305) | $ - | $ - |
Total Derivative Instruments: | $ 52,652 | $ 49,510 | $ 3,142 | $ - |
Other Financial Instruments: | | | | |
TBA Sale Commitments | $ (12,767,672) | $ - | $ (12,767,672) | $ - |
Value of Derivative Instruments |
The following table is a summary of the Fund's value of derivative instruments by risk exposure as of June 30, 2012. For additional information on derivative instruments, please refer to the Derivative Instruments section in the accompanying Notes to Financial Statements. |
Risk Exposure /
Derivative Type | Value |
| Asset | Liability |
Interest Rate Risk | | |
Futures Contracts (a) | $ 50,815 | $ (1,305) |
Swap Agreements (b) | 3,142 | - |
Total Value of Derivatives | $ 53,957 | $ (1,305) |
(a) Reflects cumulative appreciation/(depreciation) on futures contracts as disclosed on the Schedule of Investments. Only the period end variation margin is separately disclosed on the Statement of Assets and Liabilities. |
(b) Value is disclosed on the Statement of Assets and Liabilities in the Swap agreements, at value line-items. |
Distribution of investments by country or territory of incorporation, as a percentage of total net assets, is as follows. (Unaudited) |
United States of America | 66.8% |
Germany | 2.8% |
Canada | 2.6% |
United Kingdom | 2.6% |
Italy | 2.2% |
Japan | 2.2% |
Venezuela | 2.0% |
Mexico | 1.4% |
Turkey | 1.4% |
Netherlands | 1.3% |
France | 1.3% |
Bermuda | 1.2% |
Luxembourg | 1.1% |
Indonesia | 1.1% |
Australia | 1.1% |
Others (Individually Less Than 1%) | 8.9% |
| 100.0% |
The information in the above table is based on the combined investments of the Fund and its pro-rata share of its investments in each non-money market Fidelity Central Fund. |
See accompanying notes which are an integral part of the financial statements.
Semiannual Report
Statement of Assets and Liabilities
| June 30, 2012 (Unaudited) |
| | |
Assets | | |
Investment in securities, at value - See accompanying schedule: Unaffiliated issuers (cost $1,045,367,548) | $ 1,078,761,786 | |
Fidelity Central Funds (cost $73,252,702) | 74,430,656 | |
Total Investments (cost $1,118,620,250) | | $ 1,153,192,442 |
Cash | | 831,614 |
Receivable for investments sold, regular delivery | | 22,916,265 |
Receivable for TBA sale commitments | | 12,726,836 |
Receivable for fund shares sold | | 826,064 |
Dividends receivable | | 3,975 |
Interest receivable | | 13,417,843 |
Distributions receivable from Fidelity Central Funds | | 53,406 |
Swap agreements, at value | | 3,142 |
Other receivables | | 30 |
Total assets | | 1,203,971,617 |
| | |
Liabilities | | |
Payable for investments purchased
Regular delivery | $ 29,028,327 | |
Delayed delivery | 13,771,199 | |
TBA sale commitments, at value | 12,767,672 | |
Payable for fund shares redeemed | 564 | |
Accrued management fee | 540,732 | |
Distribution and service plan fees payable | 6,268 | |
Payable for daily variation margin on futures contracts | 38,406 | |
Other affiliated payables | 145,055 | |
Other payables and accrued expenses | 53,628 | |
Total liabilities | | 56,351,851 |
| | |
Net Assets | | $ 1,147,619,766 |
Net Assets consist of: | | |
Paid in capital | | $ 1,088,097,170 |
Undistributed net investment income | | 26,552,957 |
Accumulated undistributed net realized gain (loss) on investments and foreign currency transactions | | (1,458,964) |
Net unrealized appreciation (depreciation) on investments and assets and liabilities in foreign currencies | | 34,428,603 |
Net Assets | | $ 1,147,619,766 |
Statement of Assets and Liabilities - continued
| June 30, 2012 (Unaudited) |
| | |
Initial Class:
Net Asset Value, offering price and redemption price per share ($159,389,701 ÷ 13,715,914 shares) | | $ 11.62 |
| | |
Service Class:
Net Asset Value, offering price and redemption price per share ($921,725 ÷ 79,416 shares) | | $ 11.61 |
| | |
Service Class 2:
Net Asset Value, offering price and redemption price per share ($29,769,889 ÷ 2,574,726 shares) | | $ 11.56 |
| | |
Investor Class:
Net Asset Value, offering price and redemption price per share ($957,538,451 ÷ 82,599,781 shares) | | $ 11.59 |
See accompanying notes which are an integral part of the financial statements.
Semiannual Report
Financial Statements - continued
Statement of Operations
Six months ended June 30, 2012 (Unaudited) |
| | |
Investment Income | | |
Dividends | | $ 156,153 |
Interest | | 25,818,068 |
Income from Fidelity Central Funds | | 358,044 |
Total income | | 26,332,265 |
| | |
Expenses | | |
Management fee | $ 3,078,646 | |
Transfer agent fees | 535,718 | |
Distribution and service plan fees | 38,548 | |
Accounting and security lending fees | 192,364 | |
Custodian fees and expenses | 34,671 | |
Independent trustees' compensation | 1,848 | |
Audit | 36,692 | |
Legal | 2,021 | |
Miscellaneous | 5,432 | |
Total expenses before reductions | 3,925,940 | |
Expense reductions | (50) | 3,925,890 |
Net investment income (loss) | | 22,406,375 |
Realized and Unrealized Gain (Loss) Net realized gain (loss) on: | | |
Investment securities: | | |
Unaffiliated issuers | 341,813 | |
Fidelity Central Funds | 1,011,303 | |
Foreign currency transactions | (36,000) | |
Futures contracts | 155,450 | |
Swap agreements | 4,491 | |
Total net realized gain (loss) | | 1,477,057 |
Change in net unrealized appreciation (depreciation) on: Investment securities | 22,069,700 | |
Assets and liabilities in foreign currencies | (6,638) | |
Futures contracts | 40,086 | |
Swap agreements | 3,142 | |
Delayed delivery commitments | (40,836) | |
Total change in net unrealized appreciation (depreciation) | | 22,065,454 |
Net gain (loss) | | 23,542,511 |
Net increase (decrease) in net assets resulting from operations | | $ 45,948,886 |
Statement of Changes in Net Assets
| Six months ended June 30, 2012
(Unaudited) | Year ended
December 31, 2011 |
Increase (Decrease) in Net Assets | | |
Operations | | |
Net investment income (loss) | $ 22,406,375 | $ 39,301,884 |
Net realized gain (loss) | 1,477,057 | 15,716,472 |
Change in net unrealized appreciation (depreciation) | 22,065,454 | (16,732,743) |
Net increase (decrease) in net assets resulting from operations | 45,948,886 | 38,285,613 |
Distributions to shareholders from net investment income | - | (40,878,892) |
Distributions to shareholders from net realized gain | (2,308,307) | (20,231,365) |
Total distributions | (2,308,307) | (61,110,257) |
Share transactions - net increase (decrease) | 96,083,857 | 238,355,290 |
Total increase (decrease) in net assets | 139,724,436 | 215,530,646 |
| | |
Net Assets | | |
Beginning of period | 1,007,895,330 | 792,364,684 |
End of period (including undistributed net investment income of $26,552,957 and undistributed net investment income of $4,146,582, respectively) | $ 1,147,619,766 | $ 1,007,895,330 |
See accompanying notes which are an integral part of the financial statements.
Semiannual Report
Financial Highlights - Initial Class
| Six months ended June 30, 2012 | Years ended December 31, |
| (Unaudited) | 2011 | 2010 | 2009 | 2008 | 2007 |
Selected Per-Share Data | | | | | | |
Net asset value, beginning of period | $ 11.15 | $ 11.36 | $ 11.11 | $ 8.94 | $ 10.63 | $ 10.70 |
Income from Investment Operations | | | | | | |
Net investment income (loss) E | .238 | .511 | .588 | .619 | .583 | .600 |
Net realized and unrealized gain (loss) | .257 | .013 H | .473 | 2.065 | (1.670) | (.007) |
Total from investment operations | .495 | .524 | 1.061 | 2.684 | (1.087) | .593 |
Distributions from net investment income | - | (.486) | (.517) | (.439) | (.548) | (.523) |
Distributions from net realized gain | (.025) | (.248) | (.294) | (.075) | (.055) | (.140) |
Total distributions | (.025) | (.734) | (.811) | (.514) | (.603) | (.663) |
Net asset value, end of period | $ 11.62 | $ 11.15 | $ 11.36 | $ 11.11 | $ 8.94 | $ 10.63 |
Total Return B,C,D | 4.44% | 4.66% | 9.64% | 30.02% | (10.20)% | 5.59% |
Ratios to Average Net Assets F,I | | | | | | |
Expenses before reductions | .69% A | .69% | .71% | .74% | .73% | .73% |
Expenses net of fee waivers, if any | .69% A | .69% | .70% | .74% | .73% | .73% |
Expenses net of all reductions | .69% A | .69% | .70% | .74% | .72% | .73% |
Net investment income (loss) | 4.17% A | 4.38% | 5.07% | 5.98% | 5.65% | 5.49% |
Supplemental Data | | | | | | |
Net assets, end of period (000 omitted) | $ 159,390 | $ 164,168 | $ 154,861 | $ 166,898 | $ 99,114 | $ 119,524 |
Portfolio turnover rate G | 143% A | 224% | 208% | 199% | 256% | 152% |
A Annualized
B Total returns for periods of less than one year are not annualized.
C Total returns do not reflect charges attributable to your insurance company's separate account. Inclusion of these charges would reduce the total returns shown.
D Total returns would have been lower if certain expenses had not been reduced during the applicable periods shown.
E Calculated based on average shares outstanding during the period.
F Fees and expenses of any underlying Fidelity Central Funds are not included in the Fund's expense ratio. The Fund indirectly bears its proportionate share of the expenses of any underlying Fidelity Central Funds.
G Amount does not include the portfolio activity of any underlying Fidelity Central Funds.
H The amount shown for a share outstanding does not correspond with the aggregate net gain (loss) on investments for the period due to the timing of sales and repurchases of shares in relation to fluctuating market values of the investments of the Fund.
I Expense ratios reflect operating expenses of the class. Expenses before reductions do not reflect amounts reimbursed by the investment adviser or reductions from brokerage service arrangements or reductions from other expense offset arrangements and do not represent the amount paid by the class during periods when reimbursements or reductions occur. Expenses net of fee waivers reflect expenses after reimbursement by the investment adviser but prior to reductions from brokerage service arrangements or other expense offset arrangements. Expenses net of all reductions represent the net expenses paid by the class.
Financial Highlights - Service Class
| Six months ended June 30, 2012 | Years ended December 31, |
| (Unaudited) | 2011 | 2010 | 2009 | 2008 | 2007 |
Selected Per-Share Data | | | | | | |
Net asset value, beginning of period | $ 11.14 | $ 11.35 | $ 11.10 | $ 8.92 | $ 10.61 | $ 10.68 |
Income from Investment Operations | | | | | | |
Net investment income (loss) E | .232 | .499 | .574 | .594 | .574 | .588 |
Net realized and unrealized gain (loss) | .263 | .009 H | .469 | 2.083 | (1.676) | (.005) |
Total from investment operations | .495 | .508 | 1.043 | 2.677 | (1.102) | .583 |
Distributions from net investment income | - | (.470) | (.499) | (.422) | (.533) | (.513) |
Distributions from net realized gain | (.025) | (.248) | (.294) | (.075) | (.055) | (.140) |
Total distributions | (.025) | (.718) | (.793) | (.497) | (.588) | (.653) |
Net asset value, end of period | $ 11.61 | $ 11.14 | $ 11.35 | $ 11.10 | $ 8.92 | $ 10.61 |
Total Return B,C,D | 4.45% | 4.52% | 9.48% | 30.01% | (10.37)% | 5.51% |
Ratios to Average Net Assets F,I | | | | | | |
Expenses before reductions | .79% A | .80% | .81% | .84% | .82% | .83% |
Expenses net of fee waivers, if any | .79% A | .80% | .81% | .84% | .82% | .83% |
Expenses net of all reductions | .79% A | .80% | .81% | .84% | .82% | .82% |
Net investment income (loss) | 4.07% A | 4.28% | 4.96% | 5.88% | 5.55% | 5.39% |
Supplemental Data | | | | | | |
Net assets, end of period (000 omitted) | $ 922 | $ 883 | $ 1,199 | $ 1,898 | $ 2,644 | $ 4,445 |
Portfolio turnover rate G | 143% A | 224% | 208% | 199% | 256% | 152% |
A Annualized
B Total returns for periods of less than one year are not annualized.
C Total returns do not reflect charges attributable to your insurance company's separate account. Inclusion of these charges would reduce the total returns shown.
D Total returns would have been lower if certain expenses had not been reduced during the applicable periods shown.
E Calculated based on average shares outstanding during the period.
F Fees and expenses of any underlying Fidelity Central Funds are not included in the Fund's expense ratio. The Fund indirectly bears its proportionate share of the expenses of any underlying Fidelity Central Funds.
G Amount does not include the portfolio activity of any underlying Fidelity Central Funds.
H The amount shown for a share outstanding does not correspond with the aggregate net gain (loss) on investments for the period due to the timing of sales and repurchases of shares in relation to fluctuating market values of the investments of the Fund.
I Expense ratios reflect operating expenses of the class. Expenses before reductions do not reflect amounts reimbursed by the investment adviser or reductions from brokerage service arrangements or reductions from other expense offset arrangements and do not represent the amount paid by the class during periods when reimbursements or reductions occur. Expenses net of fee waivers reflect expenses after reimbursement by the investment adviser but prior to reductions from brokerage service arrangements or other expense offset arrangements. Expenses net of all reductions represent the net expenses paid by the class.
See accompanying notes which are an integral part of the financial statements.
Semiannual Report
Financial Highlights - Service Class 2
| Six months ended June 30, 2012 | Years ended December 31, |
| (Unaudited) | 2011 | 2010 | 2009 | 2008 | 2007 |
Selected Per-Share Data | | | | | | |
Net asset value, beginning of period | $ 11.11 | $ 11.33 | $ 11.11 | $ 8.92 | $ 10.61 | $ 10.67 |
Income from Investment Operations | | | | | | |
Net investment income (loss) E | .222 | .478 | .560 | .578 | .558 | .571 |
Net realized and unrealized gain (loss) | .253 | .021 H | .457 | 2.087 | (1.680) | .005 |
Total from investment operations | .475 | .499 | 1.017 | 2.665 | (1.122) | .576 |
Distributions from net investment income | - | (.471) | (.503) | (.400) | (.513) | (.496) |
Distributions from net realized gain | (.025) | (.248) | (.294) | (.075) | (.055) | (.140) |
Total distributions | (.025) | (.719) | (.797) | (.475) | (.568) | (.636) |
Net asset value, end of period | $ 11.56 | $ 11.11 | $ 11.33 | $ 11.11 | $ 8.92 | $ 10.61 |
Total Return B,C,D | 4.28% | 4.45% | 9.23% | 29.88% | (10.56)% | 5.45% |
Ratios to Average Net Assets F,I | | | | | | |
Expenses before reductions | .94% A | .95% | .97% | .99% | .98% | .98% |
Expenses net of fee waivers, if any | .94% A | .94% | .96% | .99% | .98% | .98% |
Expenses net of all reductions | .94% A | .94% | .96% | .99% | .97% | .97% |
Net investment income (loss) | 3.92% A | 4.13% | 4.81% | 5.72% | 5.40% | 5.24% |
Supplemental Data | | | | | | |
Net assets, end of period (000 omitted) | $ 29,770 | $ 25,652 | $ 7,599 | $ 1,918 | $ 2,625 | $ 4,418 |
Portfolio turnover rate G | 143% A | 224% | 208% | 199% | 256% | 152% |
A Annualized
B Total returns for periods of less than one year are not annualized.
C Total returns do not reflect charges attributable to your insurance company's separate account. Inclusion of these charges would reduce the total returns shown.
D Total returns would have been lower if certain expenses had not been reduced during the applicable periods shown.
E Calculated based on average shares outstanding during the period.
F Fees and expenses of any underlying Fidelity Central Funds are not included in the Fund's expense ratio. The Fund indirectly bears its proportionate share of the expenses of any underlying Fidelity Central Funds.
G Amount does not include the portfolio activity of any underlying Fidelity Central Funds.
H The amount shown for a share outstanding does not correspond with the aggregate net gain (loss) on investments for the period due to the timing of sales and repurchases of shares in relation to fluctuating market values of the investments of the Fund.
I Expense ratios reflect operating expenses of the class. Expenses before reductions do not reflect amounts reimbursed by the investment adviser or reductions from brokerage service arrangements or reductions from other expense offset arrangements and do not represent the amount paid by the class during periods when reimbursements or reductions occur. Expenses net of fee waivers reflect expenses after reimbursement by the investment adviser but prior to reductions from brokerage service arrangements or other expense offset arrangements. Expenses net of all reductions represent the net expenses paid by the class.
Financial Highlights - Investor Class
| Six months ended June 30, 2012 | Years ended December 31, |
| (Unaudited) | 2011 | 2010 | 2009 | 2008 | 2007 |
Selected Per-Share Data | | | | | | |
Net asset value, beginning of period | $ 11.12 | $ 11.34 | $ 11.09 | $ 8.92 | $ 10.62 | $ 10.69 |
Income from Investment Operations | | | | | | |
Net investment income (loss) E | .235 | .506 | .584 | .617 | .577 | .591 |
Net realized and unrealized gain (loss) | .260 | .005 H | .474 | 2.065 | (1.677) | (.003) |
Total from investment operations | .495 | .511 | 1.058 | 2.682 | (1.100) | .588 |
Distributions from net investment income | - | (.483) | (.514) | (.437) | (.545) | (.518) |
Distributions from net realized gain | (.025) | (.248) | (.294) | (.075) | (.055) | (.140) |
Total distributions | (.025) | (.731) | (.808) | (.512) | (.600) | (.658) |
Net asset value, end of period | $ 11.59 | $ 11.12 | $ 11.34 | $ 11.09 | $ 8.92 | $ 10.62 |
Total Return B,C,D | 4.46% | 4.55% | 9.63% | 30.06% | (10.34)% | 5.55% |
Ratios to Average Net Assets F,I | | | | | | |
Expenses before reductions | .72% A | .73% | .74% | .77% | .76% | .80% |
Expenses net of fee waivers, if any | .72% A | .73% | .74% | .77% | .76% | .80% |
Expenses net of all reductions | .72% A | .73% | .74% | .77% | .76% | .80% |
Net investment income (loss) | 4.14% A | 4.35% | 5.03% | 5.95% | 5.61% | 5.41% |
Supplemental Data | | | | | | |
Net assets, end of period (000 omitted) | $ 957,538 | $ 817,192 | $ 628,706 | $ 475,890 | $ 234,744 | $ 228,628 |
Portfolio turnover rate G | 143% A | 224% | 208% | 199% | 256% | 152% |
A Annualized
B Total returns for periods of less than one year are not annualized.
C Total returns do not reflect charges attributable to your insurance company's separate account. Inclusion of these charges would reduce the total returns shown.
D Total returns would have been lower if certain expenses had not been reduced during the applicable periods shown.
E Calculated based on average shares outstanding during the period.
F Fees and expenses of any underlying Fidelity Central Funds are not included in the Fund's expense ratio. The Fund indirectly bears its proportionate share of the expenses of any underlying Fidelity Central Funds.
G Amount does not include the portfolio activity of any underlying Fidelity Central Funds.
H The amount shown for a share outstanding does not correspond with the aggregate net gain (loss) on investments for the period due to the timing of sales and repurchases of shares in relation to fluctuating market values of the investments of the Fund.
I Expense ratios reflect operating expenses of the class. Expenses before reductions do not reflect amounts reimbursed by the investment adviser or reductions from brokerage service arrangements or reductions from other expense offset arrangements and do not represent the amount paid by the class during periods when reimbursements or reductions occur. Expenses net of fee waivers reflect expenses after reimbursement by the investment adviser but prior to reductions from brokerage service arrangements or other expense offset arrangements. Expenses net of all reductions represent the net expenses paid by the class.
See accompanying notes which are an integral part of the financial statements.
Semiannual Report
Notes to Financial Statements
For the period ended June 30, 2012 (Unaudited)
1. Organization.
VIP Strategic Income Portfolio (the Fund) is a fund of Variable Insurance Products Fund V (the Trust) and is authorized to issue an unlimited number of shares. The Trust is registered under the Investment Company Act of 1940, as amended (the 1940 Act), as an open-end management investment company organized as a Massachusetts business trust. Shares of the Fund may only be purchased by insurance companies for the purpose of funding variable annuity or variable life insurance contracts. The Fund offers the following classes of shares: Initial Class shares, Service Class shares, Service Class 2 shares and Investor Class shares. All classes have equal rights and voting privileges, except for matters affecting a single class. Investment income, realized and unrealized capital gains and losses, the common expenses of the Fund, and certain fund-level expense reductions, if any, are allocated on a pro-rata basis to each class based on the relative net assets of each class to the total net assets of the Fund. Each class differs with respect to transfer agent and distribution and service plan fees incurred. Certain expense reductions may also differ by class.
2. Investments in Fidelity Central Funds.
The Fund invests in Fidelity Central Funds, which are open-end investment companies available only to other investment companies and accounts managed by Fidelity Management & Research Company (FMR) and its affiliates. The Fund's Schedule of Investments lists each of the Fidelity Central Funds held as of period end, if any, as an investment of the Fund, but does not include the underlying holdings of each Fidelity Central Fund. As an Investing Fund, the Fund indirectly bears its proportionate share of the expenses of the underlying Fidelity Central Funds.
Based on its investment objective, each Fidelity Central Fund may invest or participate in various investment vehicles or strategies that are similar to those of the Fund. These strategies are consistent with the investment objectives of the Fund and may involve certain economic risks which may cause a decline in value of each of the Fidelity Central Funds and thus a decline in the value of the Fund. The Money Market Central Funds seek preservation of capital and current income and are managed by Fidelity Investments Money Management, Inc. (FIMM), an affiliate of FMR. The following summarizes the Fund's investment in each non-money market Fidelity Central Fund.
Fidelity Central Fund | Investment Manager | Investment Objective | Investment Practices |
Fidelity Floating Rate Central Fund | FMR Co., Inc. (FMRC) | Seeks a high level of income by normally investing in floating rate loans and other floating rate securities. | Loans & Direct Debt Instruments Repurchase Agreements Restricted Securities |
An unaudited holdings listing for the Fund, which presents direct holdings as well as the pro-rata share of any securities and other investments held indirectly through its investment in underlying non-money market Fidelity Central Funds, is available at advisor.fidelity.com. A complete unaudited list of holdings for each Fidelity Central Fund is available upon request or at the Securities and Exchange Commission (the SEC) web site at www.sec.gov. In addition, the financial statements of the Fidelity Central Funds which contain the significant accounting policies (including security valuation policies) of those funds are available on the SEC web site or upon request.
3. Significant Accounting Policies.
The financial statements have been prepared in conformity with accounting principles generally accepted in the United States of America (GAAP), which require management to make certain estimates and assumptions at the date of the financial statements. Actual results could differ from those estimates. Subsequent events, if any, through the date that the financial statements were issued have been evaluated in the preparation of the financial statements. The following summarizes the significant accounting policies of the Fund:
Security Valuation. Investments are valued as of 4:00 p.m. Eastern time on the last calendar day of the period. In accordance with valuation policies and procedures approved by the Board of Trustees (the Board), the Fund attempts to obtain prices from one or more third party pricing vendor or broker to value its investments. When current market prices, quotations or rates are not readily available or reliable, securities will be fair valued in good faith by the FMR Fair Value Committee (the Committee), in accordance with procedures adopted by the Board. Factors used in determining fair value vary by security type and may include market or security specific events, changes in interest rates and credit quality. The frequency with which these procedures are used cannot be predicted and they may be utilized to a significant extent. The Committee oversees the Fund's valuation policies and procedures and is responsible for approving and reporting to the Board all fair value determinations.
The Fund categorizes the inputs to valuation techniques used to value its investments into a disclosure hierarchy consisting of three levels as shown below:
Level 1 - quoted prices in active markets for identical investments
Level 2 - other significant observable inputs (including quoted prices for similar investments, interest rates, prepayment speeds, etc.)
Level 3 - unobservable inputs (including the Fund's own assumptions based on the best information available)
Semiannual Report
3. Significant Accounting Policies - continued
Security Valuation - continued
Valuation techniques used to value the Fund's investments by major category are as follows:
Debt securities, including restricted securities, are valued based on evaluated prices received from third party pricing vendors or from brokers who make markets in such securities. For corporate bonds, floating rate loans, foreign government and government agency obligations, preferred securities, U.S. government and government agency obligations and sovereign loan participations, pricing vendors utilize matrix pricing which considers yield or price of bonds of comparable quality, coupon, maturity and type as well as broker-supplied prices and are generally categorized as Level 2 in the hierarchy. For collateralized mortgage obligations, commercial mortgage securities and U.S. government agency mortgage securities, pricing vendors utilize matrix pricing which considers prepayment speed assumptions, attributes of the collateral, yield or price of bonds of comparable quality, coupon, maturity and type as well as broker-supplied prices and, accordingly, such securities are generally categorized as Level 2 in the hierarchy. Swaps are marked-to-market daily based on valuations from third party pricing vendors or broker-supplied valuations. Pricing vendors utilize matrix pricing which considers comparisons to interest rate curves, credit spread curves, default possibilities and recovery rates and, as a result, swaps are generally categorized as Level 2 in the hierarchy. When independent prices are unavailable or unreliable, debt securities and swaps may be valued utilizing pricing methodologies which consider similar factors that would be used by third party pricing vendors. These are generally categorized as Level 2 in the hierarchy but may be Level 3 depending on the circumstances. The Fund invests a significant portion of its assets in below investment grade securities. The value of these securities can be more volatile due to changes in the credit quality of the issuer and is sensitive to changes in economic, market and regulatory conditions.
Equity securities, including restricted securities, for which market quotations are readily available, are valued at the last reported sale price or official closing price as reported by a third party pricing vendor on the primary market or exchange on which they are traded and are categorized as Level 1 in the hierarchy. In the event there were no sales during the day or closing prices are not available, securities are valued at the last quoted bid price or may be valued using the last available price and are generally categorized as Level 2 in the hierarchy. For foreign equity securities, when significant market or security specific events arise, comparisons to the valuation of American Depositary Receipts (ADRs), futures contracts, Exchange-Traded Funds (ETFs) and certain indexes as well as quoted prices for similar securities are used and are categorized as Level 2 in the hierarchy. Utilizing these techniques may result in transfers between Level 1 and Level 2. For restricted securities and private placements where observable inputs are limited, assumptions about market activity and risk are used and these securities are categorized as Level 3 in the hierarchy.
Futures contracts are valued at the settlement price established each day by the board of trade or exchange on which they are traded and are categorized as Level 1 in the hierarchy. Investments in open-end mutual funds, including the Fidelity Central Funds, are valued at their closing net asset value each business day and are categorized as Level 1 in the hierarchy.
Changes in valuation techniques may result in transfers in or out of an assigned level within the disclosure hierarchy. The aggregate value of investments by input level, as of June 30, 2012 for the Fund's investments, is included at the end of Fund's Schedule of Investments.
Foreign Currency Translation. The Fund may use foreign currency contracts to facilitate transactions in foreign-denominated securities. Gains and losses from these transactions may arise from changes in the value of the foreign currency or if the counterparties do not perform under the contracts' terms.
Foreign-denominated assets, including investment securities, and liabilities are translated into U.S. dollars at the exchange rates at period end. Purchases and sales of investment securities, income and dividends received and expenses denominated in foreign currencies are translated into U.S. dollars at the exchange rate in effect on the transaction date.
The effects of exchange rate fluctuations on investments are included with the net realized and unrealized gain (loss) on investment securities. Other foreign currency transactions resulting in realized and unrealized gain (loss) are disclosed separately.
Investment Transactions and Income. For financial reporting purposes, the Fund's investment holdings and NAV include trades executed through the end of the last business day of the period. The NAV per share for processing shareholder transactions is calculated as of the close of business of the New York Stock Exchange (NYSE), normally 4:00 p.m. Eastern time and includes trades executed through the end of the prior business day. Gains and losses on securities sold are determined on the basis of identified cost and may include proceeds received from litigation. Dividend income is recorded on the ex-dividend date, except for certain dividends from foreign securities where the ex-dividend date may have passed, which are recorded as soon as the Fund is informed of the ex-dividend date. Non-cash dividends included in dividend income, if any, are recorded at the fair market value of the securities received. Distributions received on securities that represent a return of capital or capital gain are recorded as a reduction of cost of investments and/or as a realized gain. The Fund estimates the components of distributions received that may be considered return of capital distributions or capital gain distributions. Interest income and distributions from the Fidelity Central Funds are accrued as earned. Interest income includes coupon interest and amortization of premium and accretion of discount on debt securities. The principal amount on inflation-indexed securities is periodically
Semiannual Report
Notes to Financial Statements (Unaudited) - continued
3. Significant Accounting Policies - continued
Investment Transactions and Income - continued
adjusted to the rate of inflation and interest is accrued based on the principal amount. The adjustments to principal due to inflation are reflected as increases or decreases to interest income even though principal is not received until maturity. Investment income is recorded net of foreign taxes withheld where recovery of such taxes is uncertain. Debt obligations may be placed on non-accrual status and related interest income may be reduced by ceasing current accruals and writing off interest receivables when the collection of all or a portion of interest has become doubtful based on consistently applied procedures. A debt obligation is removed from non-accrual status when the issuer resumes interest payments or when collectability of interest is reasonably assured.
Expenses. Expenses directly attributable to a fund are charged to that fund. Expenses attributable to more than one fund are allocated among the respective funds on the basis of relative net assets or other appropriate methods. Expense estimates are accrued in the period to which they relate and adjustments are made when actual amounts are known.
Income Tax Information and Distributions to Shareholders. Each year, the Fund intends to qualify as a regulated investment company under Subchapter M of the Internal Revenue Code, including distributing substantially all of its taxable income and realized gains. As a result, no provision for income taxes is required. The Fund files a U.S. federal tax return, in addition to state and local tax returns as required. A fund's federal income tax returns are subject to examination by the Internal Revenue Service (IRS) for a period of three fiscal years after they are filed. State and local tax returns may be subject to examination for an additional fiscal year depending on the jurisdiction. Foreign taxes are provided for based on the Fund's understanding of the tax rules and rates that exist in the foreign markets in which it invests.
Distributions are declared and recorded on the ex-dividend date. Income dividends and capital gain distributions are declared separately for each class. Income and capital gain distributions are determined in accordance with income tax regulations, which may differ from GAAP.
Capital accounts within the financial statements are adjusted for permanent book-tax differences. These adjustments have no impact on net assets or the results of operations. Temporary book-tax differences will reverse in a subsequent period.
Book-tax differences are primarily due to futures transactions, swap agreements, foreign currency transactions, market discount, partnerships (including allocations from Fidelity Central Funds) and losses deferred due to wash sales and excise tax regulations.
The federal tax cost of investment securities and unrealized appreciation (depreciation) as of period end were as follows:
Gross unrealized appreciation | $ 56,995,563 |
Gross unrealized depreciation | (18,783,623) |
Net unrealized appreciation (depreciation) on securities and other investments | $ 38,211,940 |
| |
Tax cost | $ 1,114,980,502 |
New Accounting Pronouncement. In December 2011, the Financial Accounting Standards Board issued Accounting Standard Update No. 2011-11, Disclosures about Offsetting Assets and Liabilities. The update creates new disclosure requirements requiring entities to disclose both gross and net information for derivatives and other financial instruments that are either offset in the Statement of Assets and Liabilities or subject to an enforceable master netting arrangement or similar agreement. The disclosure requirements are effective for interim and annual reporting periods beginning on or after January 1, 2013. Management is currently evaluating the impact of the update's adoption on the Fund's financial statement disclosures.
4. Operating Policies.
Delayed Delivery Transactions and When-Issued Securities. During the period, the Fund transacted in securities on a delayed delivery or when-issued basis. Payment and delivery may take place after the customary settlement period for that security. The price of the underlying securities and the date when the securities will be delivered and paid for are fixed at the time the transaction is negotiated. The securities purchased on a delayed delivery or when-issued basis are identified as such in the Fund's Schedule of Investments. The Fund may receive compensation for interest forgone in the purchase of a delayed delivery or when-issued security. With respect to purchase commitments, the Fund identifies securities as segregated in its records with a value at least equal to the amount of the commitment. Losses may arise due to changes in the value of the underlying securities or if the counterparty does not perform under the contract's terms, or if the issuer does not issue the securities due to political, economic, or other factors.
Semiannual Report
4. Operating Policies - continued
To-Be-Announced (TBA) Securities and Mortgage Dollar Rolls. During the period, the Fund transacted in TBA securities that involved buying or selling mortgage-backed securities (MBS) on a forward commitment basis. A TBA transaction typically does not designate the actual security to be delivered and only includes an approximate principal amount however; delivered securities must meet specified terms defined by industry guidelines, including issuer, rate and current principal amount outstanding on underlying mortgage pools. The Fund may enter into a TBA transaction with the intent to take possession of or deliver the underlying MBS, or the Fund may elect to extend the settlement by entering into either a mortgage or reverse mortgage dollar roll. Mortgage dollar rolls are transactions where a fund sells MBS and simultaneously agrees to repurchase MBS on a later date at a lower price and with the same counterparty. Reverse mortgage dollar rolls involve the purchase and simultaneous agreement to sell MBS on a later date at a lower price. Transactions in mortgage dollar rolls and reverse mortgage dollar rolls are accounted for as purchases and sales and may result in an increase to the Fund's portfolio turnover rate.
Purchases and sales of TBA securities involve risks similar to those discussed above for delayed delivery and when-issued securities. Also, if the counterparty in a mortgage dollar roll or a reverse mortgage dollar roll transaction files for bankruptcy or becomes insolvent, the Fund's right to repurchase or sell securities may be limited. Additionally, when a fund sells TBA securities without already owning or having the right to obtain the deliverable securities (an uncovered forward commitment to sell), it incurs a risk of loss because it could have to purchase the securities at a price that is higher than the price at which it sold them. A fund may be unable to purchase the deliverable securities if the corresponding market is illiquid.
TBA securities subject to a forward commitment to sell at period end are included at the end of the Fund's Schedule of Investments under the caption "TBA Sale Commitments." The proceeds and value of these commitments are reflected in the Fund's Statement of Assets and Liabilities.
Restricted Securities. The Fund may invest in securities that are subject to legal or contractual restrictions on resale. These securities generally may be resold in transactions exempt from registration or to the public if the securities are registered. Disposal of these securities may involve time-consuming negotiations and expense, and prompt sale at an acceptable price may be difficult. Information regarding restricted securities is included at the end of the Fund's Schedule of Investments.
Loans and Other Direct Debt Instruments. The Fund invests in direct debt instruments which are interests in amounts owed to lenders by corporate or other borrowers. These instruments may be in the form of loans, trade claims or other receivables and may include standby financing commitments such as revolving credit facilities that obligate the Fund to supply additional cash to the borrower on demand. Loans may be acquired through assignment or participation, or may be made directly to a borrower. The Fund may be contractually obligated to receive approval from the agent bank and/or borrower prior to the sale of these loans. The Fund also invests in unfunded loan commitments, which are contractual obligations for future funding. Information regarding unfunded commitments is included at the end of the Fund's Schedule of Investments.
5. Derivative Instruments.
Risk Exposures and the Use of Derivative Instruments. The Fund's investment objectives allow the Fund to enter into various types of derivative contracts, including futures contracts and swap agreements. Derivatives are investments whose value is derived from underlying assets, indices or reference rates and may be transacted on an exchange or over-the-counter (OTC). Derivatives may involve a future commitment to buy or sell a specified instrument based on specified terms, or to exchange future cash flows at periodic intervals based on a notional principal amount. The Fund used derivatives to increase returns, to gain exposure to certain types of assets and to manage exposure to certain risks as defined below. The success of any strategy involving derivatives depends on analysis of numerous economic factors, and if the strategies for investment do not work as intended, the Fund may not achieve its objectives.
The Fund's use of derivatives increased or decreased its exposure to the following risk:
Interest Rate Risk | Interest rate risk relates to the fluctuations in the value of interest-bearing securities due to changes in the prevailing levels of market interest rates. |
The Fund is also exposed to additional risks from investing in derivatives, such as liquidity risk and counterparty credit risk. Liquidity risk is the risk that the Fund will be unable to close out the derivative in the open market in a timely manner. Counterparty credit risk is the risk that the counterparty will not be able to fulfill its obligation to the Fund. Derivative counterparty credit risk is managed through formal evaluation of the creditworthiness of all potential counterparties. On certain OTC derivatives such as swap agreements, the Fund attempts to reduce its exposure to counterparty credit risk by entering into an International Swaps and Derivatives Association (ISDA) Master Agreement on a bilateral basis with each of its counterparties. The ISDA Master Agreement gives the Fund the right to terminate all transactions traded under such agreement if there is a certain deterioration in the credit quality of the counterparty. The ISDA Master Agreement gives each party the right, upon an event of default by the other party or a termination of the agreement, to close out all transactions traded under such agreement and to net amounts owed under each transaction to one net payable by one party to the other. To mitigate counterparty credit risk on OTC derivatives, the Fund receives collateral in the form of cash or securities once the Fund's net unrealized appreciation on outstanding derivative contracts under an ISDA Master Agreement exceeds certain applicable thresholds, subject to certain minimum transfer provisions. The collateral received is held in segregated accounts with the Fund's custodian bank in accordance with the
Semiannual Report
Notes to Financial Statements (Unaudited) - continued
5. Derivative Instruments - continued
Risk Exposures and the Use of Derivative Instruments - continued
collateral agreements entered into between the Fund, the counterparty and the Fund's custodian bank. The Fund could experience delays and costs in gaining access to the collateral even though it is held by the Fund's custodian bank. The Fund's maximum risk of loss from counterparty credit risk related to OTC derivatives is generally the aggregate unrealized appreciation and unpaid counterparty payments in excess of any collateral pledged by the counterparty to the Fund. The Fund may be required to pledge collateral for the benefit of the counterparties on OTC derivatives in an amount not less than each counterparty's unrealized appreciation on outstanding derivative contracts, subject to certain minimum transfer provisions, and any such pledged collateral is identified in the Schedule of Investments. Exchange-traded futures contracts are not covered by the ISDA Master Agreement, however, counterparty credit risk related to exchange-traded futures contracts is minimal because of the protection provided by the exchange on which they trade. Investing in derivatives may involve greater risks than investing in the underlying assets directly and, to varying degrees, involves risk of loss in excess of the initial investment, if any, collateral received and amounts recognized in the Statement of Assets and Liabilities. In addition, for futures contracts, there is the risk that the change in value of the derivative contract may not correspond to the change in value of the underlying instrument.
Net Realized Gain (Loss) and Change in Net Unrealized Appreciation (Depreciation) on Derivatives. The table below, which reflects the impacts of derivatives on the financial performance of the Fund, summarizes the net realized gain (loss) and change in net unrealized appreciation (depreciation) for derivatives during the period as shown in the Statement of Operations.
Risk Exposure / Derivative Type | Net Realized Gain (Loss) | Change in Net Unrealized Appreciation (Depreciation) |
Interest Rate Risk | | |
Futures Contracts | $ 155,450 | $ 40,086 |
Swap Agreements | 4,491 | 3,142 |
Totals (a) | $ 159,941 | $ 43,228 |
(a) A summary of the value of derivatives by risk exposure as of period end is included at the end of the Schedule of Investments and is representative of activity for the period.
Futures Contracts. A futures contract is an agreement between two parties to buy or sell a specified underlying instrument for a fixed price at a specified future date. The Fund used futures contracts to manage its exposure to the bond market and to fluctuations in interest rates.
Upon entering into a futures contract, a fund is required to deposit either cash or securities (initial margin) with a clearing broker in an amount equal to a certain percentage of the face value of the contract. Futures contracts are marked-to-market daily and subsequent payments (variation margin) are made or received by a fund depending on the daily fluctuations in the value of the futures contracts and are recorded as unrealized appreciation or (depreciation). This receivable and/or payable is included in daily variation margin on futures contracts in the Statement of Assets and Liabilities. Realized gain or (loss) is recorded upon the expiration or closing of a futures contract. The net realized gain (loss) and change in net unrealized appreciation (depreciation) on futures contracts during the period is included in the Statement of Operations.
Any open futures contracts at period end are shown in the Schedule of Investments under the caption "Futures Contracts." The underlying face amount at value reflects each contract's exposure to the underlying instrument at period end. Securities deposited to meet initial margin requirements are identified in the Schedule of Investments.
Swap Agreements. A swap agreement (swap) is a contract between two parties to exchange future cash flows at periodic intervals based on a notional principal amount.
Details of swaps open at period end are included in the Schedule of Investments under the caption "Swap Agreements." Swaps are marked-to-market daily and changes in value are recorded as unrealized appreciation or (depreciation) and reflected in the Statement of Assets and Liabilities. Any upfront premiums paid or received upon entering a swap to compensate for differences between stated terms of the agreement and prevailing market conditions (e.g. credit spreads, interest rates or other factors) are recorded as realized gain or (loss) ratably over the term of the swap. Payments are exchanged at specified intervals, accrued daily commencing with the effective date of the contract and recorded as realized gain or (loss). Realized gain or (loss) is also recorded in the event of an early termination of a swap. The net realized gain (loss) and change in net unrealized appreciation (depreciation) on swaps during the period is included in the Statement of Operations.
Interest Rate Swaps. Interest rate swaps are agreements between counterparties to exchange cash flows, one based on a fixed rate, and the other on a floating rate. The Fund entered into interest rate swaps to manage its exposure to interest rate changes. Changes in interest rates can have an effect on both the value of bond holdings as well as the amount of interest income earned. In general, the value of bonds can fall when interest rates rise and can rise when interest rates fall.
Semiannual Report
6. Purchases and Sales of Investments.
Purchases and sales of securities (including the Fixed-Income Central Funds), other than short-term securities and U.S. government securities, aggregated $401,219,053 and $320,497,885, respectively.
7. Fees and Other Transactions with Affiliates.
Management Fee. FMR and its affiliates provide the Fund with investment management related services for which the Fund pays a monthly management fee. The management fee is the sum of an individual fund fee rate that is based on an annual rate of .45% of the Fund's average net assets and an annualized group fee rate that averaged .12% during the period. The group fee rate is based upon the average net assets of all the mutual funds advised by FMR. The group fee rate decreases as assets under management increase and increases as assets under management decrease. For the period, the total annualized management fee rate was .57% of the Fund's average net assets.
Distribution and Service Plan Fees. In accordance with Rule 12b-1 of the 1940 Act, the Fund has adopted separate 12b-1 Plans for each Service Class of shares. Each Service Class pays Fidelity Distributors Corporation (FDC), an affiliate of FMR, a service fee. For the period, the service fee is based on an annual rate of .10% of Service Class' average net assets and .25% of Service Class 2's average net assets.
For the period, total fees, all of which were re-allowed to insurance companies for the distribution of shares and providing shareholder support services were as follows:
Service Class | $ 454 |
Service Class 2 | 38,094 |
| $ 38,548 |
Transfer Agent Fees. Fidelity Investments Institutional Operations Company, Inc. (FIIOC), an affiliate of FMR, is the Fund's transfer, dividend disbursing, and shareholder servicing agent. FIIOC receives an asset-based fee with respect to each class. Each class (with the exception of Investor Class) pays a transfer agent fee, excluding out of pocket expenses, equal to an annual rate of .07% of average net assets. Investor Class pays a monthly asset-based transfer agent fee of .10% of average net assets. In addition, FIIOC receives an asset-based fee of .0038% of average net assets for typesetting, printing and mailing of shareholder reports, except proxy statements. For the period, transfer agent fees for each class, including printing and out of pocket expenses, were as follows:
Initial Class | $ 57,502 |
Service Class | 317 |
Service Class 2 | 10,869 |
Investor Class | 467,030 |
| $ 535,718 |
Accounting and Security Lending Fees. Fidelity Service Company, Inc. (FSC), an affiliate of FMR, maintains the Fund's accounting records. The accounting fee is based on the level of average net assets for each month. Under a separate contract, FSC administers the security lending program. The security lending fee is based on the number and duration of lending transactions.
8. Committed Line of Credit.
The Fund participates with other funds managed by FMR or an affiliate in a $4.25 billion credit facility (the "line of credit") to be utilized for temporary or emergency purposes to fund shareholder redemptions or for other short-term liquidity purposes. The Fund has agreed to pay commitment fees on its pro-rata portion of the line of credit, which amounted to $1,523 and is reflected in Miscellaneous expenses on the Statement of Operations. During the period, there were no borrowings on this line of credit.
9. Security Lending.
The Fund lends portfolio securities from time to time in order to earn additional income. On the settlement date of the loan, the Fund receives collateral (in the form of U.S. Treasury obligations, letters of credit and/or cash) against the loaned securities and maintains collateral in an amount not less than 100% of the market value of the loaned securities during the period of the loan. The market value of the loaned securities is determined at the close of business of the Fund and any additional required collateral is delivered to the Fund on the next business day. If the borrower defaults on its obligation to return the securities loaned because of insolvency or other reasons, a fund could experience delays and costs in recovering the securities loaned or in gaining access to the collateral. Any cash collateral received is maintained at the Fund's custodian and/or invested in cash equivalents. At period end, there were no security loans outstanding. Security lending income represents the income earned on investing cash collateral, less rebates paid to borrowers, plus any premium payments received for lending certain types of securities. Security lending income is presented in the Statement of Operations as a component of interest income. Total security lending income during the period amounted to $140.
Semiannual Report
Notes to Financial Statements (Unaudited) - continued
10. Expense Reductions.
Many of the brokers with whom FMR places trades on behalf of the Fund provided services to the Fund in addition to trade execution. These services included payments of certain expenses on behalf of the Fund totaling $50 for the period.
11. Distributions to Shareholders.
Distributions to shareholders of each class were as follows:
| Six months ended
June 30,
2012 | Year ended
December 31,
2011 |
From net investment income | | |
Initial Class | $ - | $ 6,773,571 |
Service Class | - | 35,285 |
Service Class 2 | - | 1,007,372 |
Investor Class | - | 33,062,664 |
Total | $ - | $ 40,878,892 |
From net realized gain | | |
Initial Class | $ 353,027 | $ 3,416,993 |
Service Class | 1,981 | 19,967 |
Service Class 2 | 64,392 | 458,432 |
Investor Class | 1,888,907 | 16,335,973 |
Total | $ 2,308,307 | $ 20,231,365 |
12. Share Transactions.
Transactions for each class of shares were as follows:
| Shares | Dollars |
| Six months ended June 30,
2012 | Year ended
December 31,
2011 | Six months ended June 30,
2012 | Year ended
December 31,
2011 |
Initial Class | | | | |
Shares sold | 696,848 | 2,656,457 | $ 7,997,755 | $ 31,076,160 |
Reinvestment of distributions | 30,967 | 916,774 | 353,027 | 10,190,564 |
Shares redeemed | (1,736,244) | (2,481,322) | (19,761,252) | (28,834,770) |
Net increase (decrease) | (1,008,429) | 1,091,909 | $ (11,410,470) | $ 12,431,954 |
Service Class | | | | |
Shares sold | - | - | - | - |
Reinvestment of distributions | 174 | 4,970 | 1,981 | 55,252 |
Shares redeemed | - | (31,398) | - | (366,648) |
Net increase (decrease) | 174 | (26,428) | $ 1,981 | $ (311,396) |
Service Class 2 | | | | |
Shares sold | 915,735 | 1,728,542 | $ 10,441,171 | $ 20,060,168 |
Reinvestment of distributions | 5,673 | 132,522 | 64,392 | 1,465,804 |
Shares redeemed | (656,180) | (222,100) | (7,523,115) | (2,573,365) |
Net increase (decrease) | 265,228 | 1,638,964 | $ 2,982,448 | $ 18,952,607 |
Investor Class | | | | |
Shares sold | 9,975,850 | 15,647,182 | $ 114,115,906 | $ 182,167,424 |
Reinvestment of distributions | 166,131 | 4,453,284 | 1,888,907 | 49,398,637 |
Shares redeemed | (1,003,133) | (2,098,949) | (11,494,915) | (24,283,936) |
Net increase (decrease) | 9,138,848 | 18,001,517 | $ 104,509,898 | $ 207,282,125 |
Semiannual Report
13. Other.
The Fund's organizational documents provide former and current trustees and officers with a limited indemnification against liabilities arising in connection with the performance of their duties to the Fund. In the normal course of business, the Fund may also enter into contracts that provide general indemnifications. The Fund's maximum exposure under these arrangements is unknown as this would be dependent on future claims that may be made against the Fund. The risk of material loss from such claims is considered remote.
At the end of the period, FMR or its affiliates were the owners of record of 97% of the total outstanding shares of the Fund.
14. Credit Risk.
The Fund's relatively large investment in countries with limited or developing capital markets may involve greater risks than investments in more developed markets and the prices of such investments may be volatile. The yields of emerging market debt obligations reflect, among other things, perceived credit risk. The consequences of political, social or economic changes in these markets may have disruptive effects on the market prices of the Fund's investments and the income they generate, as well as the Fund's ability to repatriate such amounts.
Semiannual Report
Investment Adviser
Fidelity Management & Research Company
Boston, MA
Investment Sub-Advisers
FMR Co., Inc.
Fidelity Investments Money Management, Inc.
FIL Investments (Japan) Limited
FIL Investment Advisors
FIL Investment Advisors (U.K.) Ltd.
Fidelity Management & Research (U.K.) Inc.
Fidelity Management & Research (Japan) Inc.
Fidelity Management & Research (Hong Kong) Limited
General Distributor
Fidelity Distributors Corporation
Smithfield, RI
Transfer and Service Agents
Fidelity Investments Institutional Operations Company, Inc.
Boston, MA
Fidelity Service Company, Inc.
Boston, MA
Custodian
State Street Bank and Trust Company
Quincy, MA
VIPSI-SANN-0812
1.803539.108
Item 2. Code of Ethics
Not applicable.
Item 3. Audit Committee Financial Expert
Not applicable.
Item 4. Principal Accountant Fees and Services
Not applicable.
Item 5. Audit Committee of Listed Registrants
Not applicable.
Item 6. Investments
(a) Not applicable.
(b) Not applicable
Item 7. Disclosure of Proxy Voting Policies and Procedures for Closed-End Management Investment Companies
Not applicable.
Item 8. Portfolio Managers of Closed-End Management Investment Companies
Not applicable.
Item 9. Purchase of Equity Securities by Closed-End Management Investment Company and Affiliated Purchasers
Not applicable.
Item 10. Submission of Matters to a Vote of Security Holders
There were no material changes to the procedures by which shareholders may recommend nominees to the Variable Insurance Products Fund V's Board of Trustees.
Item 11. Controls and Procedures
(a)(i) The President and Treasurer and the Chief Financial Officer have concluded that the Variable Insurance Products Fund V's (the "Trust") disclosure controls and procedures (as defined in Rule 30a-3(c) under the Investment Company Act) provide reasonable assurances that material information relating to the Trust is made known to them by the appropriate persons, based on their evaluation of these controls and procedures as of a date within 90 days of the filing date of this report.
(a)(ii) There was no change in the Trust's internal control over financial reporting (as defined in Rule 30a-3(d) under the Investment Company Act) that occurred during the second fiscal quarter of the period covered by this report that has materially affected, or is reasonably likely to materially affect, the Trust's internal control over financial reporting.
Item 12. Exhibits
(a) | (1) | Not applicable. |
(a) | (2) | Certification pursuant to Rule 30a-2(a) under the Investment Company Act of 1940 (17 CFR 270.30a-2(a)) is filed and attached hereto as Exhibit 99.CERT. |
(a) | (3) | Not applicable. |
(b) | | Certification pursuant to Rule 30a-2(b) under the Investment Company Act of 1940 (17 CFR 270.30a-2(b)) is furnished and attached hereto as Exhibit 99.906CERT. |
SIGNATURES
Pursuant to the requirements of the Securities Exchange Act of 1934 and the Investment Company Act of 1940, the registrant has duly caused this report to be signed on its behalf by the undersigned, thereunto duly authorized.
Variable Insurance Products Fund V
By: | /s/John R. Hebble |
| John R. Hebble |
| President and Treasurer |
| |
Date: | August 24, 2012 |
Pursuant to the requirements of the Securities Exchange Act of 1934 and the Investment Company Act of 1940, this report has been signed below by the following persons on behalf of the registrant and in the capacities and on the dates indicated.
By: | /s/John R. Hebble |
| John R. Hebble |
| President and Treasurer |
| |
Date: | August 24, 2012 |
By: | /s/Christine Reynolds |
| Christine Reynolds |
| Chief Financial Officer |
| |
Date: | August 24, 2012 |