UNITED STATES
SECURITIES AND EXCHANGE COMMISSION
Washington, D.C. 20549
FORM N-CSR
CERTIFIED SHAREHOLDER REPORT OF REGISTERED
MANAGEMENT INVESTMENT COMPANIES
Investment Company Act file number 811-05361
Variable Insurance Products Fund V
(Exact name of registrant as specified in charter)
82 Devonshire St., Boston, Massachusetts 02109
(Address of principal executive offices) (Zip code)
Scott C. Goebel, Secretary
82 Devonshire St.
Boston, Massachusetts 02109
(Name and address of agent for service)
Registrant's telephone number, including area code: 617-563-7000
Date of fiscal year end: | December 31 |
| |
Date of reporting period: | June 30, 2011 |
This report on Form N-CSR relates solely to the Registrant's Asset Manager Portfolio, Asset Manager: Growth Portfolio, Freedom 2005 Portfolio, Freedom 2010 Portfolio, Freedom 2015 Portfolio, Freedom 2020 Portfolio, Freedom 2025 Portfolio, Freedom 2030 Portfolio, Freedom 2035 Portfolio, Freedom 2040 Portfolio, Freedom 2045 Portfolio, Freedom 2050 Portfolio, Freedom Income Portfolio, Freedom Lifetime Income I Portfolio, Freedom Lifetime Income II Portfolio, Freedom Lifetime Income III Portfolio, FundsManager 20% Portfolio, FundsManager 50% Portfolio, FundsManager 60%, FundsManager 70% Portfolio, FundsManager 85% Portfolio, Investment Grade Bond Portfolio, Investor Freedom 2005 Portfolio, Investor Freedom 2010 Portfolio, Investor Freedom 2015 Portfolio, Investor Freedom 2020 Portfolio, Investor Freedom 2025 Portfolio, Investor Freedom 2030 Portfolio, Investor Freedom Income Portfolio and Strategic Income Portfolio series (each, a "Fund" and collectively, the "Funds").
Item 1. Reports to Stockholders
Fidelity® Variable Insurance Products:
Asset Manager Portfolio
Semiannual Report
June 30, 2011
(2_fidelity_logos) (Registered_Trademark)
Contents
Shareholder Expense Example | <Click Here> | An example of shareholder expenses. |
Investment Changes | <Click Here> | A summary of major shifts in the fund's investments over the past six months. |
Investments | <Click Here> | A complete list of the fund's investments with their market values. |
Financial Statements | <Click Here> | Statements of assets and liabilities, operations, and changes in net assets, as well as financial highlights. |
Notes | <Click Here> | Notes to the financial statements. |
To view a fund's proxy voting guidelines and proxy voting record for the 12-month period ended June 30, visit http://www.fidelity.com/proxyvotingresults or visit the Securities and Exchange Commission's (SEC) web site at http://www.sec.gov. You may also call 1-877-208-0098 to request a free copy of the proxy voting guidelines.
Fidelity Variable Insurance Products are separate account options which are purchased through a variable insurance contract.
Standard & Poor's, S&P and S&P 500 are registered service marks of The McGraw-Hill Companies, Inc. and have been licensed for use by Fidelity Distributors Corporation.
Other third party marks appearing herein are the property of their respective owners.
All other marks appearing herein are registered or unregistered trademarks or service marks of FMR LLC or an affiliated company.
This report and the financial statements contained herein are submitted for the general information of the shareholders of the fund. This report is not authorized for distribution to prospective investors in the fund unless preceded or accompanied by an effective prospectus.
A fund files its complete schedule of portfolio holdings with the SEC for the first and third quarters of each fiscal year on Form N-Q. Forms N-Q are available on the SEC's web site at http://www.sec.gov. A fund's Forms N-Q may be reviewed and copied at the SEC's Public Reference Room in Washington, DC. Information regarding the operation of the SEC's Public Reference Room may be obtained by calling 1-800-SEC-0330. For a complete list of a fund's portfolio holdings, view the most recent holdings listing, semiannual report, or annual report on Fidelity's web site at http://www.fidelity.com, http://www.advisor.fidelity.com, or http://www.401k.com, as applicable.
NOT FDIC INSURED • MAY LOSE VALUE • NO BANK GUARANTEE
Neither the fund nor Fidelity Distributors Corporation is a bank.
Semiannual Report
As a shareholder of the Fund, you incur two types of costs: (1) transaction costs, and (2) ongoing costs, including management fees, distribution and/or service (12b-1) fees and other Fund expenses. This Example is intended to help you understand your ongoing costs (in dollars) of investing in the Fund and to compare these costs with the ongoing costs of investing in other mutual funds.
The Example is based on an investment of $1,000 invested at the beginning of the period and held for the entire period (January 1, 2011 to June 30, 2011).
Actual Expenses
The first line of the accompanying table for each class of the Fund provides information about actual account values and actual expenses. You may use the information in this line, together with the amount you invested, to estimate the expenses that you paid over the period. Simply divide your account value by $1,000.00 (for example, an $8,600 account value divided by $1,000.00 = 8.6), then multiply the result by the number in the first line for a class of the Fund under the heading entitled "Expenses Paid During Period" to estimate the expenses you paid on your account during this period. The estimate of expenses does not include any fees or other expenses of any variable annuity or variable life insurance product. If they were, the estimate of expenses you paid during the period would be higher, and your ending account value would be lower. In addition, the Fund, as a shareholder in the underlying Fidelity Central Funds, will indirectly bear its pro-rata share of the fees and expenses incurred by the underlying Fidelity Central Funds. These fees and expenses are not included in the Fund's annualized expense ratio used to calculate the expense estimate in the table below.
Hypothetical Example for Comparison Purposes
The second line of the accompanying table for each class of the Fund provides information about hypothetical account values and hypothetical expenses based on a Class' actual expense ratio and an assumed rate of return of 5% per year before expenses, which is not the Class' actual return. The hypothetical account values and expenses may not be used to estimate the actual ending account balance or expenses you paid for the period. You may use this information to compare the ongoing costs of investing in the Fund and other funds. To do so, compare this 5% hypothetical example with the 5% hypothetical examples that appear in the shareholder reports of the other funds. The estimate of expenses does not include any fees or other expenses of any variable annuity or variable life insurance product. If they were, the estimate of expenses you paid during the period would be higher, and your ending account value would be lower. In addition, the Fund, as a shareholder in the underlying Fidelity Central Funds, will indirectly bear its pro-rata share of the fees and expenses incurred by the underlying Fidelity Central Funds. These fees and expenses are not included in the Fund's annualized expense ratio used to calculate the expense estimate in the table below.
Please note that the expenses shown in the table are meant to highlight your ongoing costs only and do not reflect any transaction costs. Therefore, the second line of the table is useful in comparing ongoing costs only, and will not help you determine the relative total costs of owning different funds.
| Annualized Expense Ratio | Beginning
Account Value
January 1, 2011 | Ending
Account Value
June 30, 2011 | Expenses Paid
During Period*
January 1, 2011
to June 30, 2011 |
Initial Class | .63% | | | |
Actual | | $ 1,000.00 | $ 1,042.30 | $ 3.19 |
HypotheticalA | | $ 1,000.00 | $ 1,021.67 | $ 3.16 |
Service Class | .74% | | | |
Actual | | $ 1,000.00 | $ 1,041.90 | $ 3.75 |
HypotheticalA | | $ 1,000.00 | $ 1,021.12 | $ 3.71 |
Service Class 2 | .89% | | | |
Actual | | $ 1,000.00 | $ 1,040.90 | $ 4.50 |
HypotheticalA | | $ 1,000.00 | $ 1,020.38 | $ 4.46 |
Investor Class | .71% | | | |
Actual | | $ 1,000.00 | $ 1,041.10 | $ 3.59 |
HypotheticalA | | $ 1,000.00 | $ 1,021.27 | $ 3.56 |
A 5% return per year before expenses
* Expenses are equal to each Class' annualized expense ratio, multiplied by the average account value over the period, multiplied by 181/365 (to reflect the one-half year period). The fees and expenses of the underlying Fidelity Central Funds in which the Fund invests are not included in the Fund's annualized expense ratio.
Semiannual Report
Investment Changes (Unaudited)
The information in the following tables is based on the combined investments of the Fund and its pro-rata share of the investments of Fidelity's Central Funds, other than the Commodity Strategy and Money Market Central Funds. |
Top Five Stocks as of June 30, 2011 |
| % of fund's
net assets | % of fund's net assets
6 months ago |
Apple, Inc. | 1.4 | 2.1 |
Chevron Corp. | 0.9 | 0.0 |
United Continental Holdings, Inc. | 0.8 | 0.8 |
Schlumberger Ltd. | 0.8 | 0.6 |
Green Mountain Coffee Roasters, Inc. | 0.8 | 0.0 |
| 4.7 | |
Top Five Bond Issuers as of June 30, 2011 |
(with maturities greater than one year) | % of fund's
net assets | % of fund's net assets
6 months ago |
U.S. Treasury Obligations | 9.8 | 10.2 |
Fannie Mae | 8.6 | 12.4 |
Ginnie Mae | 2.7 | 1.2 |
Freddie Mac | 1.8 | 1.0 |
Citigroup, Inc. | 0.3 | 0.4 |
| 23.2 | |
Top Five Market Sectors as of June 30, 2011 |
| % of fund's
net assets | % of fund's net assets
6 months ago |
Financials | 10.4 | 12.1 |
Consumer Discretionary | 9.9 | 12.4 |
Energy | 9.1 | 6.1 |
Information Technology | 8.8 | 11.3 |
Industrials | 7.3 | 8.6 |
Asset Allocation (% of fund's net assets) |
As of June 30, 2011 * | As of December 31, 2010 ** |
 | Stock Class *** 50.3% | | | Stock Class **** 54.2% | |
 | Bond Class 42.2% | | | Bond Class 40.7% | |
 | Short-Term Class 7.5% | | | Short-Term Class 5.1% | |
* Foreign investments | 23.0% | | ** Foreign investments | 23.6% | |

*** Includes investment in Fidelity Commodity Strategy Central Fund of 1.0%.
**** Includes investment in Fidelity Commodity Strategy Central Fund of 1.6%.
Asset allocations in the pie charts reflect the categorization of assets as defined in the fund's prospectus in effect as of the time periods indicated above. Financial Statement categorizations conform to accounting standards and will differ from the pie chart. Percentages are adjusted for the effect of futures contracts and swap contracts, if applicable.
An unaudited holdings listing for the Fund, which presents direct holdings as well as the pro-rata share of any securities and other investments held indirectly through its investment in underlying Fidelity Central Funds, other than the Commodity Strategy and Money Market Central Funds, is available at advisor.fidelity.com.
Semiannual Report
Investments June 30, 2011 (Unaudited)
Showing Percentage of Net Assets
Common Stocks - 35.2% |
| Shares | | Value |
CONSUMER DISCRETIONARY - 6.2% |
Auto Components - 0.2% |
BorgWarner, Inc. (a) | 31,800 | | $ 2,569,122 |
Automobiles - 0.4% |
Bayerische Motoren Werke AG (BMW) | 51,818 | | 5,171,185 |
Diversified Consumer Services - 0.4% |
Anhanguera Educacional Participacoes SA | 55,400 | | 1,178,905 |
Weight Watchers International, Inc. | 66,700 | | 5,033,849 |
| | 6,212,754 |
Hotels, Restaurants & Leisure - 0.8% |
Arcos Dorados Holdings, Inc. | 61,400 | | 1,294,926 |
Chipotle Mexican Grill, Inc. (a) | 11,000 | | 3,390,090 |
Panera Bread Co. Class A (a) | 53,300 | | 6,697,678 |
| | 11,382,694 |
Household Durables - 0.2% |
Gafisa SA sponsored ADR | 249,300 | | 2,358,378 |
Internet & Catalog Retail - 0.4% |
Amazon.com, Inc. (a) | 7,000 | | 1,431,430 |
Priceline.com, Inc. (a) | 9,500 | | 4,863,335 |
| | 6,294,765 |
Media - 0.2% |
Bankrate, Inc. | 43,600 | | 722,888 |
Focus Media Holding Ltd. ADR (a) | 66,400 | | 2,065,040 |
| | 2,787,928 |
Multiline Retail - 0.5% |
Lojas Renner SA | 14,100 | | 537,410 |
Macy's, Inc. | 203,000 | | 5,935,720 |
Marisa Lojas SA | 14,500 | | 221,062 |
| | 6,694,192 |
Specialty Retail - 0.8% |
China ZhengTong Auto Services Holdings Ltd. | 566,000 | | 648,062 |
Tiffany & Co., Inc. | 51,400 | | 4,035,928 |
Vitamin Shoppe, Inc. (a) | 10,800 | | 494,208 |
Williams-Sonoma, Inc. | 171,300 | | 6,250,737 |
| | 11,428,935 |
Textiles, Apparel & Luxury Goods - 2.3% |
Arezzo Industria e Comercio SA | 64,700 | | 905,576 |
Burberry Group PLC | 93,200 | | 2,168,862 |
Coach, Inc. | 93,700 | | 5,990,241 |
Deckers Outdoor Corp. (a) | 90,800 | | 8,003,112 |
Fossil, Inc. (a) | 59,900 | | 7,051,428 |
Phillips-Van Heusen Corp. | 79,100 | | 5,178,677 |
The Swatch Group AG (Bearer) | 4,360 | | 2,197,892 |
Vera Bradley, Inc. | 35,500 | | 1,356,100 |
| | 32,851,888 |
TOTAL CONSUMER DISCRETIONARY | | 87,751,841 |
|
| Shares | | Value |
CONSUMER STAPLES - 1.7% |
Beverages - 0.3% |
Hansen Natural Corp. (a) | 51,700 | | $ 4,185,115 |
Food & Staples Retailing - 0.1% |
Droga Raia SA | 43,000 | | 716,162 |
Food Products - 0.8% |
Green Mountain Coffee Roasters, Inc. (a) | 126,000 | | 11,246,760 |
Smithfield Foods, Inc. (a) | 32,500 | | 710,775 |
| | 11,957,535 |
Personal Products - 0.5% |
Estee Lauder Companies, Inc. Class A | 42,800 | | 4,502,132 |
Hengan International Group Co. Ltd. | 335,500 | | 3,009,336 |
| | 7,511,468 |
TOTAL CONSUMER STAPLES | | 24,370,280 |
ENERGY - 6.3% |
Energy Equipment & Services - 2.7% |
Baker Hughes, Inc. | 116,600 | | 8,460,496 |
Carbo Ceramics, Inc. | 34,200 | | 5,572,890 |
Halliburton Co. | 183,700 | | 9,368,700 |
Petrofac Ltd. | 47,800 | | 1,161,453 |
Saipem SpA | 41,709 | | 2,153,464 |
Schlumberger Ltd. | 133,813 | | 11,561,443 |
| | 38,278,446 |
Oil, Gas & Consumable Fuels - 3.6% |
Alpha Natural Resources, Inc. (a) | 45,497 | | 2,067,384 |
Cabot Oil & Gas Corp. | 11,600 | | 769,196 |
Chevron Corp. | 125,600 | | 12,916,704 |
Concho Resources, Inc. (a) | 60,100 | | 5,520,185 |
Continental Resources, Inc. (a) | 97,900 | | 6,354,689 |
Denbury Resources, Inc. (a) | 24,200 | | 484,000 |
Kosmos Energy Ltd. | 62,000 | | 1,052,760 |
Oasis Petroleum, Inc. (a) | 105,100 | | 3,119,368 |
Occidental Petroleum Corp. | 44,300 | | 4,608,972 |
Pioneer Natural Resources Co. | 80,500 | | 7,210,385 |
Western Refining, Inc. (a)(d) | 52,300 | | 945,061 |
Whiting Petroleum Corp. (a) | 113,600 | | 6,464,976 |
| | 51,513,680 |
TOTAL ENERGY | | 89,792,126 |
FINANCIALS - 0.9% |
Capital Markets - 0.4% |
Apollo Global Management LLC Class A | 315,200 | | 5,421,440 |
Commercial Banks - 0.2% |
Itau Unibanco Banco Multiplo SA sponsored ADR | 122,500 | | 2,884,875 |
Insurance - 0.1% |
Qualicorp SA | 108,000 | | 1,030,812 |
Common Stocks - continued |
| Shares | | Value |
FINANCIALS - continued |
Real Estate Management & Development - 0.2% |
CB Richard Ellis Group, Inc. Class A (a) | 131,500 | | $ 3,301,965 |
TOTAL FINANCIALS | | 12,639,092 |
HEALTH CARE - 4.2% |
Biotechnology - 0.9% |
Amgen, Inc. (a) | 12,200 | | 711,870 |
Biogen Idec, Inc. (a) | 26,700 | | 2,854,764 |
United Therapeutics Corp. (a) | 69,600 | | 3,834,960 |
Vertex Pharmaceuticals, Inc. (a) | 92,300 | | 4,798,677 |
| | 12,200,271 |
Health Care Equipment & Supplies - 0.3% |
Edwards Lifesciences Corp. (a) | 24,000 | | 2,092,320 |
IDEXX Laboratories, Inc. (a)(d) | 13,000 | | 1,008,280 |
St. Jude Medical, Inc. | 2,400 | | 114,432 |
Volcano Corp. (a) | 46,500 | | 1,501,485 |
| | 4,716,517 |
Health Care Providers & Services - 1.6% |
Accretive Health, Inc. (a) | 61,000 | | 1,756,190 |
Express Scripts, Inc. (a) | 36,900 | | 1,991,862 |
HMS Holdings Corp. (a) | 27,800 | | 2,136,986 |
Humana, Inc. | 70,400 | | 5,670,016 |
McKesson Corp. | 46,400 | | 3,881,360 |
Medco Health Solutions, Inc. (a) | 37,100 | | 2,096,892 |
UnitedHealth Group, Inc. | 51,000 | | 2,630,580 |
WellPoint, Inc. | 38,600 | | 3,040,522 |
| | 23,204,408 |
Health Care Technology - 0.2% |
Epocrates, Inc. (a) | 33,400 | | 615,896 |
SXC Health Solutions Corp. (a) | 37,200 | | 2,197,516 |
| | 2,813,412 |
Pharmaceuticals - 1.2% |
Elan Corp. PLC sponsored ADR (a) | 136,600 | | 1,553,142 |
Novo Nordisk A/S Series B sponsored ADR | 44,400 | | 5,562,432 |
Shire PLC sponsored ADR | 30,400 | | 2,863,984 |
Valeant Pharmaceuticals International, Inc. (Canada) | 130,150 | | 6,767,962 |
| | 16,747,520 |
TOTAL HEALTH CARE | | 59,682,128 |
INDUSTRIALS - 4.6% |
Aerospace & Defense - 0.2% |
Goodrich Corp. | 24,000 | | 2,292,000 |
Airlines - 1.5% |
Copa Holdings SA Class A | 23,100 | | 1,541,694 |
Delta Air Lines, Inc. (a) | 799,825 | | 7,334,395 |
|
| Shares | | Value |
United Continental Holdings, Inc. (a) | 523,870 | | $ 11,855,178 |
US Airways Group, Inc. (a) | 118,700 | | 1,057,617 |
| | 21,788,884 |
Commercial Services & Supplies - 0.0% |
Swisher Hygiene, Inc. (g) | 135,158 | | 684,846 |
Construction & Engineering - 0.3% |
Fluor Corp. | 68,700 | | 4,442,142 |
Electrical Equipment - 0.1% |
Roper Industries, Inc. | 24,100 | | 2,007,530 |
Industrial Conglomerates - 0.1% |
Carlisle Companies, Inc. | 32,300 | | 1,590,129 |
Machinery - 1.9% |
Caterpillar, Inc. | 49,900 | | 5,312,354 |
Changsha Zoomlion Heavy Industry Science & Technology Development Co. Ltd. (H Shares) | 512,720 | | 976,453 |
Cummins, Inc. | 42,500 | | 4,398,325 |
Dover Corp. | 67,400 | | 4,569,720 |
Kennametal, Inc. | 99,300 | | 4,191,453 |
Parker Hannifin Corp. | 55,600 | | 4,989,544 |
Sandvik AB | 66,400 | | 1,164,341 |
Weg SA | 81,700 | | 931,561 |
| | 26,533,751 |
Road & Rail - 0.2% |
CSX Corp. | 84,000 | | 2,202,480 |
Trading Companies & Distributors - 0.3% |
Air Lease Corp.: | | | |
Class A (a)(e) | 59,100 | | 1,435,539 |
Class A | 46,500 | | 1,129,485 |
Mills Estruturas e Servicos de Engenharia SA | 91,000 | | 1,311,575 |
| | 3,876,599 |
TOTAL INDUSTRIALS | | 65,418,361 |
INFORMATION TECHNOLOGY - 7.5% |
Communications Equipment - 1.7% |
Alcatel-Lucent SA sponsored ADR (a) | 983,500 | | 5,674,795 |
HTC Corp. | 103,000 | | 3,454,972 |
JDS Uniphase Corp. (a) | 67,600 | | 1,126,216 |
Juniper Networks, Inc. (a) | 36,000 | | 1,134,000 |
Polycom, Inc. (a) | 49,700 | | 3,195,710 |
QUALCOMM, Inc. | 96,400 | | 5,474,556 |
Riverbed Technology, Inc. (a) | 98,900 | | 3,915,451 |
| | 23,975,700 |
Computers & Peripherals - 1.8% |
Apple, Inc. (a) | 60,600 | | 20,341,602 |
EMC Corp. (a) | 130,900 | | 3,606,295 |
Fusion-io, Inc. | 10,100 | | 303,909 |
NetApp, Inc. (a) | 29,200 | | 1,541,176 |
| | 25,792,982 |
Common Stocks - continued |
| Shares | | Value |
INFORMATION TECHNOLOGY - continued |
Internet Software & Services - 0.9% |
Active Network, Inc. | 57,900 | | $ 1,019,040 |
Baidu.com, Inc. sponsored ADR (a) | 22,500 | | 3,152,925 |
Cornerstone Ondemand, Inc. | 63,700 | | 1,124,305 |
Demand Media, Inc. | 64,500 | | 873,975 |
Facebook, Inc. Class B (a)(g) | 8,621 | | 215,525 |
Rackspace Hosting, Inc. (a) | 24,100 | | 1,030,034 |
Renren, Inc. ADR | 58,200 | | 515,070 |
Tencent Holdings Ltd. | 146,600 | | 3,978,786 |
YouKu.com, Inc. ADR (a)(d) | 20,200 | | 693,870 |
| | 12,603,530 |
IT Services - 0.5% |
Cognizant Technology Solutions Corp. Class A (a) | 80,400 | | 5,896,536 |
Fidelity National Information Services, Inc. | 10,509 | | 323,572 |
Jack Henry & Associates, Inc. | 44,600 | | 1,338,446 |
| | 7,558,554 |
Semiconductors & Semiconductor Equipment - 0.7% |
ARM Holdings PLC sponsored ADR | 66,100 | | 1,879,223 |
Broadcom Corp. Class A | 32,700 | | 1,100,028 |
Freescale Semiconductor Holdings I Ltd. | 104,400 | | 1,919,916 |
NVIDIA Corp. (a) | 55,600 | | 885,986 |
NXP Semiconductors NV | 126,800 | | 3,389,364 |
| | 9,174,517 |
Software - 1.9% |
Ariba, Inc. (a) | 60,500 | | 2,085,435 |
Citrix Systems, Inc. (a) | 53,100 | | 4,248,000 |
Informatica Corp. (a) | 153,900 | | 8,992,377 |
RealPage, Inc. | 52,000 | | 1,376,440 |
Rovi Corp. (a) | 61,100 | | 3,504,696 |
Taleo Corp. Class A (a) | 59,800 | | 2,214,394 |
VMware, Inc. Class A (a) | 44,800 | | 4,490,304 |
| | 26,911,646 |
TOTAL INFORMATION TECHNOLOGY | | 106,016,929 |
MATERIALS - 3.8% |
Chemicals - 2.8% |
Celanese Corp. Class A | 78,300 | | 4,174,173 |
CF Industries Holdings, Inc. | 48,200 | | 6,828,494 |
Dow Chemical Co. | 162,900 | | 5,864,400 |
Ferro Corp. (a) | 18,000 | | 241,920 |
FMC Corp. | 34,500 | | 2,967,690 |
|
| Shares | | Value |
LyondellBasell Industries NV Class A | 179,000 | | $ 6,895,080 |
PPG Industries, Inc. | 30,000 | | 2,723,700 |
Rockwood Holdings, Inc. (a) | 54,000 | | 2,985,660 |
Umicore SA | 23,053 | | 1,257,444 |
Uralkali JSC GDR (Reg. S) | 60,200 | | 2,709,000 |
Westlake Chemical Corp. | 50,400 | | 2,615,760 |
| | 39,263,321 |
Metals & Mining - 1.0% |
Alcoa, Inc. | 192,500 | | 3,053,050 |
Anglo American PLC (United Kingdom) | 1,600 | | 79,282 |
First Quantum Minerals Ltd. | 27,500 | | 4,009,799 |
Stillwater Mining Co. (a) | 149,100 | | 3,281,691 |
United States Steel Corp. (d) | 62,500 | | 2,877,500 |
Vallares PLC | 73,100 | | 1,179,048 |
| | 14,480,370 |
TOTAL MATERIALS | | 53,743,691 |
UTILITIES - 0.0% |
Multi-Utilities - 0.0% |
TECO Energy, Inc. | 39,600 | | 748,044 |
TOTAL COMMON STOCKS (Cost $382,538,190) | 500,162,492 |
Investment Companies - 2.7% |
| | | |
iShares Barclays TIPS Bond ETF
(Cost $38,291,511) | 345,600 | | 38,237,181 |
Fixed-Income Funds - 42.1% |
| | | |
Fidelity Emerging Markets Debt Central Fund (f) | 711,260 | | 7,240,630 |
Fidelity Floating Rate Central Fund (f) | 439,284 | | 44,525,786 |
Fidelity High Income Central Fund 1 (f) | 487,824 | | 48,099,438 |
Fidelity VIP Investment Grade Central Fund (f) | 4,670,528 | | 497,504,640 |
TOTAL FIXED-INCOME FUNDS (Cost $573,609,092) | 597,370,494 |
Money Market Funds - 5.6% |
| | | |
Fidelity Cash Central Fund, 0.11% (b) | 43,883,216 | | 43,883,216 |
Fidelity Money Market Central Fund, 0.31% (b) | 30,351,185 | | 30,351,185 |
Fidelity Securities Lending Cash Central Fund, 0.11% (b)(c) | 5,101,550 | | 5,101,550 |
TOTAL MONEY MARKET FUNDS (Cost $79,335,951) | 79,335,951 |
Equity Funds - 15.1% |
| | | |
Commodity Funds - 1.0% |
Fidelity Commodity Strategy Central Fund (f) | 1,172,742 | | 14,424,727 |
Equity Funds - continued |
| Shares | | Value |
International Equity Funds - 14.1% |
Fidelity Emerging Markets Equity Central Fund (f) | 127,336 | | $ 27,999,913 |
Fidelity International Equity Central Fund (f) | 2,328,277 | | 171,477,587 |
TOTAL INTERNATIONAL EQUITY FUNDS | | 199,477,500 |
TOTAL EQUITY FUNDS (Cost $208,519,287) | 213,902,227 |
TOTAL INVESTMENT PORTFOLIO - 100.7% (Cost $1,282,294,031) | 1,429,008,345 |
NET OTHER ASSETS (LIABILITIES) - (0.7)% | (10,618,091) |
NET ASSETS - 100% | $ 1,418,390,254 |
Futures Contracts |
| Expiration Date | | Underlying Face Amount at Value | | Unrealized Appreciation/
(Depreciation) |
Purchased |
Equity Index Contracts |
132 CME E-mini S&P 500 Index Contracts | Sept. 2011 | | $ 8,682,300 | | $ 1,532 |
328 NYSE E-mini MSCI EAFE Index Contracts | Sept. 2011 | | 14,671,440 | | (66,223) |
TOTAL EQUITY INDEX CONTRACTS | | $ 23,353,740 | | $ (64,691) |
|
The face value of futures purchased as a percentage of net assets is 1.6% |
Security Type Abbreviations |
ETFs - Exchange-Traded Funds |
Legend |
(a) Non-income producing |
(b) Affiliated fund that is available only to investment companies and other accounts managed by Fidelity Investments. The rate quoted is the annualized seven-day yield of the fund at period end. A complete unaudited listing of the fund's holdings as of its most recent quarter end is available upon request. In addition, each Fidelity Central Fund's financial statements are available on the SEC's website or upon request. |
(c) Investment made with cash collateral received from securities on loan. |
(d) Security or a portion of the security is on loan at period end. |
(e) Security exempt from registration under Rule 144A of the Securities Act of 1933. These securities may be resold in transactions exempt from registration, normally to qualified institutional buyers. At the end of the period, the value of these securities amounted to $1,435,539 or 0.1% of net assets. |
(f) Affiliated fund that is available only to investment companies and other accounts managed by Fidelity Investments. A complete unaudited schedule of portfolio holdings for each Fidelity Central Fund is filed with the SEC for the first and third quarters of each fiscal year on Form N-Q and is available upon request or at the SEC's web site at www.sec.gov. An unaudited holdings listing for the Fund, which presents direct holdings as well as the pro rata share of securities and other investments held indirectly through its investment in underlying Fidelity Central Funds, other than the Commodity Strategy and Money Market Central Funds, is available at advisor.fidelity.com. In addition, each Fidelity Central Fund's financial statements are available on the SEC's web site or upon request. |
(g) Restricted securities - Investment in securities not registered under the Securities Act of 1933 (excluding 144A issues). At the end of the period, the value of restricted securities (excluding 144A issues) amounted to $900,371 or 0.1% of net assets. |
Additional information on each restricted holding is as follows: |
Security | Acquisition Date | Acquisition Cost |
Facebook, Inc. Class B | 5/19/11 | $ 215,930 |
Swisher Hygiene, Inc. | 4/15/11 | $ 1,040,717 |
Affiliated Central Funds |
Information regarding fiscal year to date income earned by the Fund from investments in Fidelity Central Funds is as follows: |
Fund | Income earned |
Fidelity Cash Central Fund | $ 40,508 |
Fidelity Emerging Markets Debt Central Fund | 113,764 |
Fidelity Emerging Markets Equity Central Fund | 216,471 |
Fidelity Floating Rate Central Fund | 1,043,684 |
Fidelity High Income Central Fund 1 | 1,809,451 |
Fidelity International Equity Central Fund | 3,486,363 |
Fidelity Money Market Central Fund | 55,095 |
Fidelity Securities Lending Cash Central Fund | 56,762 |
Fidelity VIP Investment Grade Central Fund | 8,596,573 |
Total | $ 15,418,671 |
Additional information regarding the Fund's fiscal year to date purchases and sales, including the ownership percentage, of the non Money Market Central Funds is as follows: |
Fund | Value,
beginning of period | Purchases | Sales
Proceeds | Value,
end of
period | % ownership, end of
period |
Fidelity Commodity Strategy Central Fund | $ 22,829,987 | $ 7,886,752 | $ 15,513,763 | $ 14,424,727 | 1.4% |
Fidelity Emerging Markets Debt Central Fund | - | 7,114,105 | - | 7,240,630 | 6.9% |
Fidelity Emerging Markets Equity Central Fund | 44,864,395 | - | 15,498,967 | 27,999,913 | 8.7% |
Fidelity Floating Rate Central Fund | 45,723,024 | 1,043,684 | 2,939,440 | 44,525,786 | 1.5% |
Fidelity High Income Central Fund 1 | 52,973,765 | 1,809,451 | 7,395,713 | 48,099,438 | 8.8% |
Fidelity International Equity Central Fund | 162,878,293 | 11,514,278 | 8,494,395 | 171,477,587 | 9.1% |
Fidelity VIP Investment Grade Central Fund | 494,551,472 | 24,072,291 | 27,474,171 | 497,504,640 | 13.1% |
Total | $ 823,820,936 | $ 53,440,561 | $ 77,316,449 | $ 811,272,721 | |
Other Information |
The following is a summary of the inputs used, as of June 30, 2011, involving the Fund's assets and liabilities carried at fair value. The inputs or methodology used for valuing securities may not be an indication of the risk associated with investing in those securities. For more information on valuation inputs, and their aggregation into the levels used in the tables below, please refer to the Security Valuation section in the accompanying Notes to Financial Statements. |
Valuation Inputs at Reporting Date: |
Description | Total | Level 1 | Level 2 | Level 3 |
Investments in Securities: | | | | |
Equities: | | | | |
Consumer Discretionary | $ 87,751,841 | $ 87,751,841 | $ - | $ - |
Consumer Staples | 24,370,280 | 24,370,280 | - | - |
Energy | 89,792,126 | 89,792,126 | - | - |
Financials | 12,639,092 | 12,639,092 | - | - |
Health Care | 59,682,128 | 59,682,128 | - | - |
Industrials | 65,418,361 | 64,733,515 | 684,846 | - |
Information Technology | 106,016,929 | 105,801,404 | - | 215,525 |
Materials | 53,743,691 | 53,743,691 | - | - |
Utilities | 748,044 | 748,044 | - | - |
Investment Companies | 38,237,181 | 38,237,181 | - | - |
Fixed-Income Funds | 597,370,494 | 597,370,494 | - | - |
Money Market Funds | 79,335,951 | 79,335,951 | - | - |
Equity Funds | 213,902,227 | 213,902,227 | - | - |
Total Investments in Securities: | $ 1,429,008,345 | $ 1,428,107,974 | $ 684,846 | $ 215,525 |
Derivative Instruments: | | | | |
Assets | | | | |
Futures Contracts | $ 1,532 | $ 1,532 | $ - | $ - |
Liabilities | | | | |
Futures Contracts | $ (66,223) | $ (66,223) | $ - | $ - |
Total Derivative Instruments: | $ (64,691) | $ (64,691) | $ - | $ - |
The following is a reconciliation of Investments in Securities for which Level 3 inputs were used in determining value: |
Investments in Securities: | |
Beginning Balance | $ 1,211,550 |
Total Realized Gain (Loss) | - |
Total Unrealized Gain (Loss) | (405) |
Cost of Purchases | 215,930 |
Proceeds of Sales | - |
Amortization/Accretion | - |
Transfers in to Level 3 | - |
Transfers out of Level 3 | (1,211,550) |
Ending Balance | $ 215,525 |
The change in unrealized gain (loss) for the period attributable to Level 3 securities held at June 30, 2011 | $ (405) |
The information used in the above reconciliation represents fiscal year to date activity for any Investments in Securities identified as using Level 3 inputs at either the beginning or the end of the current fiscal period. Transfers in or out of Level 3 represent the beginning value of any Security or Instrument where a change in the pricing level occurred from the beginning to the end of the period. The cost of purchases and the proceeds of sales may include securities received or delivered through corporate actions or exchanges. Realized and unrealized gains (losses) disclosed in the reconciliation are included in Net Gain (Loss) on the Fund's Statement of Operations. |
Value of Derivative Instruments |
The following table is a summary of the Fund's value of derivative instruments by risk exposure as of June 30, 2011. For additional information on derivative instruments, please refer to the Derivative Instruments section in the accompanying Notes to Financial Statements. |
Risk Exposure /
Derivative Type | Value |
| Asset | Liability |
Equity Risk | | |
Futures Contracts | $ 1,532 | $ (66,223) |
Total Equity Risk | $ 1,532 | $ (66,223) |
(a) Reflects cumulative appreciation/(depreciation) on futures contracts as disclosed on the Schedule of Investments. Only the period end variation margin is separately disclosed on the Statement of Assets and Liabilities. |
The information in the following tables is based on the combined investments of the Fund and its pro-rata share of the investments of Fidelity's Central Funds, other than the Commodity Strategy and Money Market Central Funds. |
The composition of credit quality ratings as a percentage of net assets is as follows (Unaudited): |
U.S. Government and U.S. Government Agency Obligations | 23.1% |
AAA,AA,A | 6.9% |
BBB | 4.3% |
BB | 2.4% |
B | 3.8% |
CCC,CC,C | 0.6% |
D | 0.0% |
Not Rated | 0.6% |
Equities* | 54.9% |
Short-Term Investments and Net Other Assets | 3.4% |
| 100.0% |
* Includes investment in Fidelity Commodity Strategy Central Fund of 1.0%.
We have used ratings from Moody's Investors Service, Inc. Where Moody's® ratings are not available, we have used S&P® ratings. All ratings are as of the date indicated and do not reflect subsequent changes. Percentages are adjusted for the effect of futures contracts, if applicable. |
Distribution of investments by country of issue, as a percentage of total net assets, is as follows: (Unaudited) |
United States of America | 77.0% |
United Kingdom | 3.5% |
Japan | 1.7% |
France | 1.7% |
Germany | 1.7% |
Canada | 1.5% |
Brazil | 1.4% |
Netherlands | 1.2% |
Others (Individually Less Than 1%) | 10.3% |
| 100.0% |
Income Tax Information |
At December 31, 2010, the Fund had a capital loss carryforward of approximately $137,245,675 of which $103,924,134 and $33,321,541 will expire in fiscal 2016 and 2017, respectively. Capital loss carryforwards are only available to offset future capital gains of the Fund to the extent provided by regulations and may be limited. |
See accompanying notes which are an integral part of the financial statements.
Semiannual Report
Statement of Assets and Liabilities
| June 30, 2011 (Unaudited) |
| | |
Assets | | |
Investment in securities, at value (including securities loaned of $5,025,546) - See accompanying schedule: Unaffiliated issuers (cost $420,829,701) | $ 538,399,673 | |
Fidelity Central Funds (cost $861,464,330) | 890,608,672 | |
Total Investments (cost $1,282,294,031) | | $ 1,429,008,345 |
Cash | | 98 |
Receivable for investments sold | | 35,070,740 |
Receivable for fund shares sold | | 104,574 |
Dividends receivable | | 760,840 |
Distributions receivable from Fidelity Central Funds | | 2,058,961 |
Other receivables | | 81,600 |
Total assets | | 1,467,085,158 |
| | |
Liabilities | | |
Payable for investments purchased | $ 42,390,117 | |
Payable for fund shares redeemed | 277,894 | |
Accrued management fee | 591,138 | |
Distribution and service plan fees payable | 8,192 | |
Payable for daily variation on futures contracts | 64,691 | |
Other affiliated payables | 133,650 | |
Other payables and accrued expenses | 127,672 | |
Collateral on securities loaned, at value | 5,101,550 | |
Total liabilities | | 48,694,904 |
| | |
Net Assets | | $ 1,418,390,254 |
Net Assets consist of: | | |
Paid in capital | | $ 1,312,319,220 |
Undistributed net investment income | | 12,967,551 |
Accumulated undistributed net realized gain (loss) on investments and foreign currency transactions | | (53,544,512) |
Net unrealized appreciation (depreciation) on investments and assets and liabilities in foreign currencies | | 146,647,995 |
Net Assets | | $ 1,418,390,254 |
Statement of Assets and Liabilities - continued
| June 30, 2011 (Unaudited) |
| | |
Initial Class:
Net Asset Value, offering price and redemption price per share ($1,261,113,561 ÷ 83,253,876 shares) | | $ 15.15 |
| | |
Service Class:
Net Asset Value, offering price and redemption price per share ($8,590,739 ÷ 570,984 shares) | | $ 15.05 |
| | |
Service Class 2:
Net Asset Value, offering price and redemption price per share ($36,233,931 ÷ 2,435,513 shares) | | $ 14.88 |
| | |
Investor Class:
Net Asset Value, offering price and redemption price per share ($112,452,023 ÷ 7,455,243 shares) | | $ 15.08 |
See accompanying notes which are an integral part of the financial statements.
Semiannual Report
Statement of Operations
Six months ended June 30, 2011 (Unaudited) |
| | |
Investment Income | | |
Dividends | | $ 2,063,466 |
Interest | | 361 |
Income from Fidelity Central Funds | | 15,418,671 |
Total income | | 17,482,498 |
| | |
Expenses | | |
Management fee | $ 3,619,577 | |
Transfer agent fees | 568,163 | |
Distribution and service plan fees | 51,690 | |
Accounting and security lending fees | 288,029 | |
Custodian fees and expenses | 18,490 | |
Independent trustees' compensation | 2,717 | |
Appreciation in deferred trustee compensation account | 131 | |
Audit | 28,938 | |
Legal | 3,733 | |
Miscellaneous | 8,120 | |
Total expenses before reductions | 4,589,588 | |
Expense reductions | (61,587) | 4,528,001 |
Net investment income (loss) | | 12,954,497 |
Realized and Unrealized Gain (Loss) Net realized gain (loss) on: | | |
Investment securities: | | |
Unaffiliated issuers | 57,387,473 | |
Fidelity Central Funds | 3,534,055 | |
Foreign currency transactions | (65,887) | |
Futures contracts | 516,775 | |
Capital gain distributions from Fidelity Central Funds | 1,461,377 | |
Total net realized gain (loss) | | 62,833,793 |
Change in net unrealized appreciation (depreciation) on: Investment securities | (16,741,014) | |
Assets and liabilities in foreign currencies | (2,632) | |
Futures contracts | (217,523) | |
Total change in net unrealized appreciation (depreciation) | | (16,961,169) |
Net gain (loss) | | 45,872,624 |
Net increase (decrease) in net assets resulting from operations | | $ 58,827,121 |
Statement of Changes in Net Assets
| Six months ended June 30, 2011 (Unaudited) | Year ended December 31, 2010 |
Increase (Decrease) in Net Assets | | |
Operations | | |
Net investment income (loss) | $ 12,954,497 | $ 23,180,903 |
Net realized gain (loss) | 62,833,793 | 111,599,649 |
Change in net unrealized appreciation (depreciation) | (16,961,169) | 46,878,640 |
Net increase (decrease) in net assets resulting from operations | 58,827,121 | 181,659,192 |
Distributions to shareholders from net investment income | - | (22,808,550) |
Distributions to shareholders from net realized gain | (484,669) | (6,928,726) |
Total distributions | (484,669) | (29,737,276) |
Share transactions - net increase (decrease) | (65,189,675) | (91,985,209) |
Total increase (decrease) in net assets | (6,847,223) | 59,936,707 |
| | |
Net Assets | | |
Beginning of period | 1,425,237,477 | 1,365,300,770 |
End of period (including undistributed net investment income of $12,967,551 and undistributed net investment income of $13,054, respectively) | $ 1,418,390,254 | $ 1,425,237,477 |
See accompanying notes which are an integral part of the financial statements.
Semiannual Report
Financial Highlights - Initial Class
| Six months ended June 30, 2011 | Years ended December 31, |
| (Unaudited) | 2010 | 2009 | 2008 | 2007 | 2006 |
Selected Per-Share Data | | | | | | |
Net asset value, beginning of period | $ 14.54 | $ 13.00 | $ 10.31 | $ 16.58 | $ 15.71 | $ 15.04 |
Income from Investment Operations | | | | | | |
Net investment income (loss) E | .14 | .23 | .26 | .36 | .44 | .44 |
Net realized and unrealized gain (loss) | .48 | 1.62 | 2.73 | (4.75) | 1.88 | .64 |
Total from investment operations | .62 | 1.85 | 2.99 | (4.39) | 2.32 | 1.08 |
Distributions from net investment income | - | (.24) | (.28) | (.37) | (1.00) | (.41) |
Distributions from net realized gain | (.01) | (.07) | (.02) | (1.51) | (.45) | - |
Total distributions | (.01) | (.31) | (.30) | (1.88) | (1.45) | (.41) |
Net asset value, end of period | $ 15.15 | $ 14.54 | $ 13.00 | $ 10.31 | $ 16.58 | $ 15.71 |
Total Return B,C,D | 4.23% | 14.26% | 29.11% | (28.76)% | 15.57% | 7.32% |
Ratios to Average Net Assets F,H | | | | | | |
Expenses before reductions | .63% A | .63% | .67% | .63% | .63% | .65% |
Expenses net of fee waivers, if any | .63% A | .63% | .67% | .63% | .63% | .65% |
Expenses net of all reductions | .62% A | .62% | .66% | .63% | .62% | .63% |
Net investment income (loss) | 1.83% A | 1.72% | 2.31% | 2.62% | 2.75% | 2.90% |
Supplemental Data | | | | | | |
Net assets, end of period (000 omitted) | $ 1,261,114 | $ 1,279,306 | $ 1,249,955 | $ 1,093,133 | $ 1,791,647 | $ 2,080,545 |
Portfolio turnover rate G | 57% A | 54% | 95% | 90% | 99% | 173% |
A Annualized
B Total returns for periods of less than one year are not annualized.
C Total returns do not reflect charges attributable to your insurance company's separate account. Inclusion of these charges would reduce the total returns shown.
D Total returns would have been lower if certain expenses had not been reduced during the applicable periods shown.
E Calculated based on average shares outstanding during the period.
F Fees and expenses of any underlying Fidelity Central Funds are not included in the Fund's expense ratio. The Fund indirectly bears its proportionate share of the expenses of any underlying Fidelity Central Funds.
G Amount does not include the portfolio activity of any underlying Fidelity Central Funds.
H Expense ratios reflect operating expenses of the class. Expenses before reductions do not reflect amounts reimbursed by the investment adviser or reductions from brokerage service arrangements or reductions from other expense offset arrangements and do not represent the amount paid by the class during periods when reimbursements or reductions occur. Expenses net of fee waivers reflect expenses after reimbursement by the investment adviser but prior to reductions from brokerage service arrangements or other expense offset arrangements. Expenses net of all reductions represent the net expenses paid by the class.
Financial Highlights - Service Class
| Six months ended June 30, 2011 | Years ended December 31, |
| (Unaudited) | 2010 | 2009 | 2008 | 2007 | 2006 |
Selected Per-Share Data | | | | | | |
Net asset value, beginning of period | $ 14.45 | $ 12.92 | $ 10.25 | $ 16.48 | $ 15.61 | $ 14.94 |
Income from Investment Operations | | | | | | |
Net investment income (loss) E | .13 | .22 | .25 | .34 | .42 | .42 |
Net realized and unrealized gain (loss) | .48 | 1.60 | 2.71 | (4.71) | 1.86 | .64 |
Total from investment operations | .61 | 1.82 | 2.96 | (4.37) | 2.28 | 1.06 |
Distributions from net investment income | - | (.22) | (.27) | (.35) | (.96) | (.39) |
Distributions from net realized gain | (.01) | (.07) | (.02) | (1.51) | (.45) | - |
Total distributions | (.01) | (.29) | (.29) | (1.86) | (1.41) | (.39) |
Net asset value, end of period | $ 15.05 | $ 14.45 | $ 12.92 | $ 10.25 | $ 16.48 | $ 15.61 |
Total Return B,C,D | 4.19% | 14.14% | 28.94% | (28.82)% | 15.36% | 7.24% |
Ratios to Average Net Assets F,H | | | | | | |
Expenses before reductions | .74% A | .75% | .79% | .75% | .74% | .76% |
Expenses net of fee waivers, if any | .74% A | .74% | .79% | .75% | .74% | .76% |
Expenses net of all reductions | .74% A | .73% | .78% | .75% | .74% | .74% |
Net investment income (loss) | 1.71% A | 1.60% | 2.18% | 2.50% | 2.63% | 2.79% |
Supplemental Data | | | | | | |
Net assets, end of period (000 omitted) | $ 8,591 | $ 8,613 | $ 8,230 | $ 7,413 | $ 13,530 | $ 24,021 |
Portfolio turnover rate G | 57% A | 54% | 95% | 90% | 99% | 173% |
A Annualized
B Total returns for periods of less than one year are not annualized.
C Total returns do not reflect charges attributable to your insurance company's separate account. Inclusion of these charges would reduce the total returns shown.
D Total returns would have been lower if certain expenses had not been reduced during the applicable periods shown.
E Calculated based on average shares outstanding during the period.
F Fees and expenses of any underlying Fidelity Central Funds are not included in the Fund's expense ratio. The Fund indirectly bears its proportionate share of the expenses of any underlying Fidelity Central Funds.
G Amount does not include the portfolio activity of any underlying Fidelity Central Funds.
H Expense ratios reflect operating expenses of the class. Expenses before reductions do not reflect amounts reimbursed by the investment adviser or reductions from brokerage service arrangements or reductions from other expense offset arrangements and do not represent the amount paid by the class during periods when reimbursements or reductions occur. Expenses net of fee waivers reflect expenses after reimbursement by the investment adviser but prior to reductions from brokerage service arrangements or other expense offset arrangements. Expenses net of all reductions represent the net expenses paid by the class.
See accompanying notes which are an integral part of the financial statements.
Semiannual Report
Financial Highlights - Service Class 2
| Six months ended June 30, 2011 | Years ended December 31, |
| (Unaudited) | 2010 | 2009 | 2008 | 2007 | 2006 |
Selected Per-Share Data | | | | | | |
Net asset value, beginning of period | $ 14.30 | $ 12.79 | $ 10.15 | $ 16.34 | $ 15.47 | $ 14.82 |
Income from Investment Operations | | | | | | |
Net investment income (loss) E | .11 | .19 | .23 | .32 | .39 | .39 |
Net realized and unrealized gain (loss) | .48 | 1.59 | 2.68 | (4.67) | 1.85 | .63 |
Total from investment operations | .59 | 1.78 | 2.91 | (4.35) | 2.24 | 1.02 |
Distributions from net investment income | - | (.20) | (.25) | (.33) | (.92) | (.37) |
Distributions from net realized gain | (.01) | (.07) | (.02) | (1.51) | (.45) | - |
Total distributions | (.01) | (.27) | (.27) | (1.84) | (1.37) | (.37) |
Net asset value, end of period | $ 14.88 | $ 14.30 | $ 12.79 | $ 10.15 | $ 16.34 | $ 15.47 |
Total Return B,C,D | 4.09% | 13.96% | 28.76% | (28.95)% | 15.24% | 7.06% |
Ratios to Average Net Assets F,H | | | | | | |
Expenses before reductions | .89% A | .90% | .93% | .90% | .89% | .92% |
Expenses net of fee waivers, if any | .89% A | .89% | .93% | .90% | .89% | .92% |
Expenses net of all reductions | .88% A | .88% | .92% | .89% | .89% | .90% |
Net investment income (loss) | 1.56% A | 1.46% | 2.04% | 2.36% | 2.48% | 2.64% |
Supplemental Data | | | | | | |
Net assets, end of period (000 omitted) | $ 36,234 | $ 39,148 | $ 39,475 | $ 37,360 | $ 59,670 | $ 55,585 |
Portfolio turnover rate G | 57% A | 54% | 95% | 90% | 99% | 173% |
A Annualized
B Total returns for periods of less than one year are not annualized.
C Total returns do not reflect charges attributable to your insurance company's separate account. Inclusion of these charges would reduce the total returns shown.
D Total returns would have been lower if certain expenses had not been reduced during the applicable periods shown.
E Calculated based on average shares outstanding during the period.
F Fees and expenses of any underlying Fidelity Central Funds are not included in the Fund's expense ratio. The Fund indirectly bears its proportionate share of the expenses of any underlying Fidelity Central Funds.
G Amount does not include the portfolio activity of any underlying Fidelity Central Funds.
H Expense ratios reflect operating expenses of the class. Expenses before reductions do not reflect amounts reimbursed by the investment adviser or reductions from brokerage service arrangements or reductions from other expense offset arrangements and do not represent the amount paid by the class during periods when reimbursements or reductions occur. Expenses net of fee waivers reflect expenses after reimbursement by the investment adviser but prior to reductions from brokerage service arrangements or other expense offset arrangements. Expenses net of all reductions represent the net expenses paid by the class.
Financial Highlights - Investor Class
| Six months ended June 30, 2011 | Years ended December 31, |
| (Unaudited) | 2010 | 2009 | 2008 | 2007 | 2006 |
Selected Per-Share Data | | | | | | |
Net asset value, beginning of period | $ 14.49 | $ 12.96 | $ 10.28 | $ 16.53 | $ 15.67 | $ 15.03 |
Income from Investment Operations | | | | | | |
Net investment income (loss) E | .13 | .22 | .25 | .34 | .42 | .42 |
Net realized and unrealized gain (loss) | .47 | 1.61 | 2.73 | (4.72) | 1.87 | .63 |
Total from investment operations | .60 | 1.83 | 2.98 | (4.38) | 2.29 | 1.05 |
Distributions from net investment income | - | (.23) | (.28) | (.36) | (.98) | (.41) |
Distributions from net realized gain | (.01) | (.07) | (.02) | (1.51) | (.45) | - |
Total distributions | (.01) | (.30) | (.30) | (1.87) | (1.43) | (.41) |
Net asset value, end of period | $ 15.08 | $ 14.49 | $ 12.96 | $ 10.28 | $ 16.53 | $ 15.67 |
Total Return B,C,D | 4.11% | 14.16% | 29.01% | (28.79)% | 15.38% | 7.16% |
Ratios to Average Net Assets F,H | | | | | | |
Expenses before reductions | .71% A | .72% | .77% | .73% | .75% | .78% |
Expenses net of fee waivers, if any | .71% A | .71% | .77% | .73% | .75% | .78% |
Expenses net of all reductions | .70% A | .70% | .76% | .72% | .74% | .76% |
Net investment income (loss) | 1.74% A | 1.63% | 2.21% | 2.53% | 2.63% | 2.77% |
Supplemental Data | | | | | | |
Net assets, end of period (000 omitted) | $ 112,452 | $ 98,171 | $ 67,641 | $ 51,264 | $ 46,555 | $ 27,092 |
Portfolio turnover rate G | 57% A | 54% | 95% | 90% | 99% | 173% |
A Annualized
B Total returns for periods of less than one year are not annualized.
C Total returns do not reflect charges attributable to your insurance company's separate account. Inclusion of these charges would reduce the total returns shown.
D Total returns would have been lower if certain expenses had not been reduced during the applicable periods shown.
E Calculated based on average shares outstanding during the period.
F Fees and expenses of any underlying Fidelity Central Funds are not included in the Fund's expense ratio. The Fund indirectly bears its proportionate share of the expenses of any underlying Fidelity Central Funds.
G Amount does not include the portfolio activity of any underlying Fidelity Central Funds.
H Expense ratios reflect operating expenses of the class. Expenses before reductions do not reflect amounts reimbursed by the investment adviser or reductions from brokerage service arrangements or reductions from other expense offset arrangements and do not represent the amount paid by the class during periods when reimbursements or reductions occur. Expenses net of fee waivers reflect expenses after reimbursement by the investment adviser but prior to reductions from brokerage service arrangements or other expense offset arrangements. Expenses net of all reductions represent the net expenses paid by the class.
See accompanying notes which are an integral part of the financial statements.
Semiannual Report
Notes to Financial Statements
For the period ended June 30, 2011 (Unaudited)
1. Organization.
VIP Asset Manager Portfolio (the Fund) is a fund of Variable Insurance Products Fund V (the Trust) and is authorized to issue an unlimited number of shares. The Trust is registered under the Investment Company Act of 1940, as amended (the 1940 Act), as an open-end management investment company organized as a Massachusetts business trust. Shares of the Fund may only be purchased by insurance companies for the purpose of funding variable annuity or variable life insurance contracts. The Fund offers the following classes of shares: Initial Class shares, Service Class shares, Service Class 2 shares and Investor Class shares. All classes have equal rights and voting privileges, except for matters affecting a single class. Investment income, realized and unrealized capital gains and losses, the common expenses of the Fund, and certain fund-level expense reductions, if any, are allocated on a pro-rata basis to each class based on the relative net assets of each class to the total net assets of the Fund. Each class differs with respect to transfer agent and distribution and service plan fees incurred. Certain expense reductions may also differ by class.
2. Investments in Fidelity Central Funds.
The Fund invests in Fidelity Central Funds, which are open-end investment companies available only to other investment companies and accounts managed by Fidelity Management & Research Company (FMR) and its affiliates. The Fund's Schedule of Investments lists each of the Fidelity Central Funds held as of period end, if any, as an investment of the Fund, but does not include the underlying holdings of each Fidelity Central Fund. As an Investing Fund, the Fund indirectly bears its proportionate share of the expenses of the underlying Fidelity Central Funds.
Based on their investment objective, each Fidelity Central Fund may invest or participate in various investment vehicles or strategies that are similar to those of the Fund. These strategies are consistent with the investment objectives of the Fund and may involve certain economic risks which may cause a decline in value of each of the Fidelity Central Funds and thus a decline in the value of the Fund. The following summarizes the Fund's investment in each Fidelity Central Fund.
Fidelity Central Fund | Investment Manager | Investment Objective | Investment Practices |
Fidelity Commodity Strategy Central Fund | FMR Co., Inc. (FMRC) | Seeks to provide investment returns that correspond to the performance of the commodities market. | Investment in wholly-owned subsidiary organized under the laws of the Cayman Islands Futures Repurchase Agreements Swap Agreements |
Fidelity Emerging Markets Debt Central Fund | FMRC | Seeks high total return by normally investing in debt securities of issuers in emerging markets and other debt investments that are tied economically to emerging markets. | Foreign Securities Repurchase Agreements Restricted Securities |
Fidelity Emerging Markets Equity Central Fund | FMRC | Seeks capital appreciation by investing primarily in equity securities of issuers in emerging markets. | Delayed Delivery Securities Foreign Securities Futures Repurchase Agreements Restricted Securities |
Fidelity International Equity Central Fund | FMRC | Seeks capital appreciation by investing primarily in non-U.S. based common stocks, including securities of issuers located in emerging markets. | Foreign Securities Repurchase Agreements Restricted Securities |
Fidelity Floating Rate Central Fund | FMRC | Seeks a high level of income by normally investing in floating rate loans and other floating rate securities. | Loans & Direct Debt Instruments Repurchase Agreements Restricted Securities |
Fidelity High Income Central Fund 1 | FMRC | Seeks a high level of income and may also seek capital appreciation by investing primarily in debt securities, preferred stocks, and convertible securities, with an emphasis on lower-quality debt securities. | Loans & Direct Debt Instruments Repurchase Agreements Restricted Securities |
VIP Investment Grade Central Fund | Fidelity Investments Money Management, Inc. (FIMM) | Seeks a high level of current income by normally investing in investment-grade debt securities and repurchase agreements. | Delayed Delivery Securities Repurchase Agreements Restricted Securities Swap Agreements |
Fidelity Money Market Central Funds | FIMM | Seek to obtain a high level of current income consistent with the preservation of capital and liquidity. | Short-term Investments |
Semiannual Report
Notes to Financial Statements (Unaudited) - continued
2. Investments in Fidelity Central Funds - continued
An unaudited holdings listing for the Fund, which presents direct holdings as well as the pro-rata share of any securities and other investments held indirectly through its investment in underlying non-money market Fidelity Central Funds, is available at advisor.fidelity.com. A complete unaudited list of holdings for each Fidelity Central Fund is available upon request or at the Securities and Exchange Commission (the SEC) web site at www.sec.gov. In addition, the financial statements of the Fidelity Central Funds which contain the significant accounting policies (including security valuation policies) of those funds, are available on the SEC web site or upon request.
3. Significant Accounting Policies.
The financial statements have been prepared in conformity with accounting principles generally accepted in the United States of America (GAAP), which require management to make certain estimates and assumptions at the date of the financial statements. Actual results could differ from those estimates. Subsequent events, if any, through the date that the financial statements were issued have been evaluated in the preparation of the financial statements. The following summarizes the significant accounting policies of the Fund:
Security Valuation. Investments are valued as of 4:00 p.m. Eastern time on the last calendar day of the period. The Fund uses independent pricing services approved by the Board of Trustees to value its investments. When current market prices or quotations are not readily available or reliable, valuations may be determined in good faith in accordance with procedures adopted by the Board of Trustees. Factors used in determining value may include market or security specific events, changes in interest rates and credit quality. The frequency with which these procedures are used cannot be predicted and they may be utilized to a significant extent. The value used for net asset value (NAV) calculation under these procedures may differ from published prices for the same securities.
The Fund categorizes the inputs to valuation techniques used to value its investments into a disclosure hierarchy consisting of three levels as shown below:
Level 1 - quoted prices in active markets for identical investments
Level 2 - other significant observable inputs (including quoted prices for similar investments, interest rates, prepayment speeds, etc.)
Level 3 - unobservable inputs (including the Fund's own assumptions based on the best information available)
Changes in valuation techniques may result in transfers in or out of an assigned level within the disclosure hierarchy. The aggregate value of investments by input level, as of June 30, 2011, as well as a roll forward of Level 3 securities, is included at the end of the Fund's Schedule of Investments. Valuation techniques used to value the Fund's investments by major category are as follows:
Equity securities, including restricted securities, for which market quotations are readily available, are valued at the last reported sale price or official closing price as reported by an independent pricing service on the primary market or exchange on which they are traded and are categorized as Level 1 in the hierarchy. In the event there were no sales during the day or closing prices are not available, securities are valued at the last quoted bid price or may be valued using the last available price and are generally categorized as Level 2 in the hierarchy. For foreign equity securities, when significant market or security specific events arise, comparisons to the valuation of American Depositary Receipts (ADRs), futures contracts, Exchange-traded funds (ETFs) and certain indexes as well as quoted prices for similar securities are used and are categorized as Level 2 in the hierarchy in these circumstances. Utilizing these techniques may result in transfers between Level 1 and Level 2. For restricted equity securities and private placements where observable inputs are limited, assumptions about market activity and risk are used and are categorized as Level 3 in the hierarchy.
ETFs are valued at their last sale price or official closing price as reported by an independent pricing service on the primary market or exchange on which they are traded and are categorized as Level 1 in the hierarchy. In the event there were no sales during the day but the exchange reports a closing bid level, ETFs are valued at the closing bid and would be categorized as Level 1 in the hierarchy. In the event there was no closing bid, ETFs may be valued by another method that the Board of Trustees believes reflects fair value in accordance with the Board's fair value pricing policies and may be categorized as Level 2 in the hierarchy.
Futures contracts are valued at the settlement price established each day by the board of trade or exchange on which they are traded and are categorized as Level 1 in the hierarchy. Investments in open-end mutual funds, including other Fidelity Central Funds, are valued at their closing net asset value each business day and are categorized as Level 1 in the hierarchy.
Foreign Currency. The Fund may use foreign currency contracts to facilitate transactions in foreign-denominated securities. Gains and losses from these transactions may arise from changes in the value of the foreign currency or if the counterparties do not perform under the contracts' terms.
Foreign-denominated assets, including investment securities, and liabilities are translated into U.S. dollars at the exchange rate at period end. Purchases and sales of investment securities, income and dividends received and expenses denominated in foreign currencies are translated into U.S. dollars at the exchange rate in effect on the transaction date.
The effects of exchange rate fluctuations on investments are included with the net realized and unrealized gain (loss) on investment securities. Other foreign currency transactions resulting in realized and unrealized gain (loss) are disclosed separately.
Semiannual Report
3. Significant Accounting Policies - continued
Investment Transactions and Income. For financial reporting purposes, the Fund's investment holdings and NAV include trades executed through the end of the last business day of the period. The NAV per share for processing shareholder transactions is calculated as of the close of business of the New York Stock Exchange (NYSE), normally 4:00 p.m. Eastern time and includes trades executed through the end of the prior business day. Gains and losses on securities sold are determined on the basis of identified cost and may include proceeds received from litigation. Dividend income is recorded on the ex-dividend date, except for certain dividends from foreign securities where the ex-dividend date may have passed, which are recorded as soon as the Fund is informed of the ex-dividend date. Non-cash dividends included in dividend income, if any, are recorded at the fair market value of the securities received. Distributions received on securities that represent a return of capital or capital gain are recorded as a reduction of cost of investments and/or as a realized gain. The Fund estimates the components of distributions received that may be considered return of capital distributions or capital gain distributions. Interest income and distributions from the Fidelity Central Funds are accrued as earned. Interest income includes coupon interest and amortization of premium and accretion of discount on debt securities. Investment income is recorded net of foreign taxes withheld where recovery of such taxes is uncertain.
Expenses. Expenses directly attributable to a fund are charged to that fund. Expenses attributable to more than one fund are allocated among the respective funds on the basis of relative net assets or other appropriate methods. Expense estimates are accrued in the period to which they relate and adjustments are made when actual amounts are known.
Deferred Trustee Compensation. Under a Deferred Compensation Plan (the Plan), independent Trustees may elect to defer receipt of a portion of their annual compensation. Deferred amounts are invested in a cross-section of Fidelity funds, are marked-to-market and remain in the Fund until distributed in accordance with the Plan. The investment of deferred amounts and the offsetting payable to the Trustees are included in the accompanying Statement of Assets and Liabilities.
Income Tax Information and Distributions to Shareholders. Each year, the Fund intends to qualify as a regulated investment company, including distributing substantially all of its taxable income and realized gains under Subchapter M of the Internal Revenue Code and filing its U.S. federal tax return. As a result, no provision for income taxes is required. A fund's federal tax return is subject to examination by the Internal Revenue Service (IRS) for a period of three years. Foreign taxes are provided for based on the Fund's understanding of the tax rules and rates that exist in the foreign markets in which it invests.
Distributions are declared and recorded on the ex-dividend date. Income dividends and capital gain distributions are declared separately for each class. Income and capital gain distributions are determined in accordance with income tax regulations, which may differ from GAAP.
Capital accounts within the financial statements are adjusted for permanent book-tax differences. These adjustments have no impact on net assets or the results of operations. Temporary book-tax differences will reverse in a subsequent period.
Book-tax differences are primarily due to the short-term gain distributions from the Fidelity Central Funds, in-kind transactions, futures transactions, foreign currency transactions, market discount, partnerships (including allocations from Fidelity Central Funds), deferred trustees compensation, capital loss carryforwards and losses deferred due to wash sales.
The federal tax cost of investment securities and unrealized appreciation (depreciation) as of period end were as follows:
Gross unrealized appreciation | $ 194,792,779 |
Gross unrealized depreciation | (34,301,865) |
Net unrealized appreciation (depreciation) on securities and other investments | $ 160,490,914 |
| |
Tax cost | $ 1,268,517,431 |
Under the recently enacted Regulated Investment Company Modernization Act of 2010 (the Act), the Fund will be permitted to carry forward capital losses incurred in taxable years beginning after December 22, 2010 for an unlimited period. However, any losses incurred during those future taxable years will be required to be utilized prior to any losses incurred in pre-enactment taxable years, which generally expire after eight years from when they are incurred. Additionally, post-enactment capital losses that are carried forward will retain their character as either short-term or long-term capital losses rather than being considered all short-term as under previous law. The Fund's first fiscal year end subject to the Act will be December, 31, 2011.
New Accounting Pronouncement. In May 2011, the Financial Accounting Standards Board issued Accounting Standard Update No. 2011-04, Fair Value Measurement (Topic 820) - Amendments to Achieve Common Fair Value Measurement and Disclosure Requirements in U.S. GAAP and IFRSs. The update changes the wording used to describe the requirements in GAAP for measuring fair value and for disclosing information about fair value measurements. The update is effective during interim and annual periods beginning after December 15, 2011. Management is currently evaluating the impact of the update's adoption on the Fund's financial statement disclosures.
Semiannual Report
Notes to Financial Statements (Unaudited) - continued
4. Operating Policies.
Restricted Securities. The Fund may invest in securities that are subject to legal or contractual restrictions on resale. These securities generally may be resold in transactions exempt from registration or to the public if the securities are registered. Disposal of these securities may involve time-consuming negotiations and expense, and prompt sale at an acceptable price may be difficult. Information regarding restricted securities is included at the end of the Fund's Schedule of Investments.
5. Derivative Instruments.
Risk Exposures and the Use of Derivative Instruments. The Fund used derivative instruments (derivatives), including futures contracts in order to meet its investment objectives. The strategy is to use derivatives to increase returns, to gain exposure to certain types of assets and to manage exposure to certain risks as defined below. The success of any strategy involving derivatives depends on analysis of numerous economic factors, and if the strategies for investment do not work as intended, the Fund may not achieve its objectives.
The Fund's use of derivatives increased or decreased its exposure to the following risk:
Equity Risk | Equity risk relates to the fluctuations in the value of financial instruments as a result of changes in market prices (other than those arising from interest rate risk or foreign exchange risk), whether caused by factors specific to an individual investment, its issuer, or all factors affecting all instruments traded in a market or market segment. |
The Fund is also exposed to additional risks from investing in derivatives, such as liquidity risk and counterparty credit risk. Liquidity risk is the risk that the Fund will be unable to sell the derivative in the open market in a timely manner. Counterparty credit risk is the risk that the counterparty will not be able to fulfill its obligation to the Fund. The Fund's maximum risk of loss from counterparty credit risk is generally the aggregate unrealized appreciation and unpaid counterparty payments in excess of any collateral pledged by the counterparty to the Fund. Counterparty risk related to exchange-traded futures contracts is minimal because of the protection provided by the exchange on which they trade. Derivatives involve, to varying degrees, risk of loss in excess of the amounts recognized in the Statement of Assets and Liabilities.
Futures Contracts. A futures contract is an agreement between two parties to buy or sell a specified underlying instrument for a fixed price at a specified future date. The Fund used futures contracts to manage its exposure to the stock markets.
Upon entering into a futures contract, a fund is required to deposit either cash or securities (initial margin) with a clearing broker in an amount equal to a certain percentage of the face value of the contract. Futures contracts are marked-to-market daily and subsequent payments (variation margin) are made or received by a fund depending on the daily fluctuations in the value of the futures contracts and are recorded as unrealized appreciation or (depreciation). Realized gain or (loss) is recorded upon the expiration or closing of a futures contract.
The underlying face amount at value of open futures contracts at period end is shown in the Schedule of Investments under the caption "Futures Contracts." This amount reflects each contract's exposure to the underlying instrument at period end and is representative of activity for the period. The receivable and/or payable for the variation margin are reflected in the Statement of Assets and Liabilities.
Certain risks arise upon entering into futures contracts, including the risk that an illiquid market limits the ability to close out a futures contract prior to settlement date.
During the period the Fund recognized net realized gain (loss) of $516,775 and a change in unrealized appreciation (depreciation) of $(217,523) related to its investment in futures contracts. These amounts are included in the Statement of Operations.
6. Purchases and Sales of Investments.
Purchases and sales of securities (including the Equity and Fixed-Income Central Funds), other than short-term securities, aggregated $388,174,082 and $440,694,458, respectively.
7. Fees and Other Transactions with Affiliates.
Management Fee. FMR and its affiliates provide the Fund with investment management related services for which the Fund pays a monthly management fee. The management fee is the sum of an individual fund fee rate that is based on an annual rate of .25% of the Fund's average net assets and a group fee rate that averaged .26% during the period. The group fee rate is based upon the average net assets of all the mutual funds advised by FMR. The group fee rate decreases as assets under management increase and increases as assets under management decrease. For the period, the total annualized management fee rate was .51% of the Fund's average net assets.
Semiannual Report
7. Fees and Other Transactions with Affiliates - continued
Management Fee - continued
The Fund invests in the Fidelity Commodity Strategy Central Fund, which in turn invests in a wholly-owned subsidiary that invests in commodity-linked derivative instruments. FMR has contractually agreed to waive the Fund's management fee in an amount equal to its proportionate share of the management fee paid to FMR by the subsidiary based on the Fund's proportionate ownership of the Fidelity Commodity Strategy Central Fund. Fees waived totaled $6,070 for the period and is reflected in Expense reductions on the Statement of Operations.
Distribution and Service Plan Fees. In accordance with Rule 12b-1 of the 1940 Act, the Fund has adopted separate 12b-1 Plans for each Service Class of shares. Each Service Class pays Fidelity Distributors Corporation (FDC), an affiliate of FMR, a service fee. For the period, the service fee is based on an annual rate of .10% of Service Class' average net assets and .25% of Service Class 2's average net assets.
For the period, total fees, all of which were re-allowed to insurance companies for the distribution of shares and providing shareholder support services were as follows:
Service Class | $ 4,326 |
Service Class 2 | 47,364 |
| $ 51,690 |
Transfer Agent Fees. Fidelity Investments Institutional Operations Company, Inc. (FIIOC), an affiliate of FMR, is the Fund's transfer, dividend disbursing, and shareholder servicing agent. FIIOC receives an asset-based fee with respect to each class. Each class (with the exception of Investor Class) pays a transfer agent fee, excluding out of pocket expenses, equal to an annual rate of .07% of average net assets. Investor Class pays a monthly asset-based transfer agent fee of .15% of average net assets. In addition, FIIOC receives an asset-based fee of .0045% of average net assets for typesetting, printing and mailing of shareholder reports, except proxy statements. For the period, transfer agent fees for each class, including printing and out of pocket expenses, were as follows:
Initial Class | $ 464,934 |
Service Class | 3,828 |
Service Class 2 | 16,195 |
Investor Class | 83,206 |
| $ 568,163 |
Accounting and Security Lending Fees. Fidelity Service Company, Inc. (FSC), an affiliate of FMR, maintains the Fund's accounting records. The accounting fee is based on the level of average net assets for the month. Under a separate contract, FSC administers the security lending program. The security lending fee is based on the number and duration of lending transactions.
Brokerage Commissions. The Fund placed a portion of its portfolio transactions with brokerage firms which are affiliates of the investment adviser. The commissions paid to these affiliated firms were $4,274 for the period.
8. Committed Line of Credit.
The Fund participates with other funds managed by FMR or an affiliate in a $4.0 billion credit facility (the "line of credit") to be utilized for temporary or emergency purposes to fund shareholder redemptions or for other short-term liquidity purposes. The Fund has agreed to pay commitment fees on its pro-rata portion of the line of credit, which amounted to $2,461 and is reflected in Miscellaneous expenses on the Statement of Operations. During the period, there were no borrowings on this line of credit.
9. Security Lending.
The Fund lends portfolio securities through a lending agent from time to time in order to earn additional income. The lending agent may loan securities to certain qualified borrowers, including Fidelity Capital Markets (FCM), a broker-dealer affiliated with the Fund. On the settlement date of the loan, the Fund receives collateral (in the form of U.S. Treasury obligations, letters of credit and/or cash) against the loaned securities and maintains collateral in an amount not less than 100% of the market value of the loaned securities during the period of the loan. The market value of the loaned securities is determined at the close of business of the Fund and any additional required collateral is delivered to the Fund on the next business day. If the
Semiannual Report
Notes to Financial Statements (Unaudited) - continued
9. Security Lending - continued
borrower defaults on its obligation to return the securities loaned because of insolvency or other reasons, a fund could experience delays and costs in recovering the securities loaned or in gaining access to the collateral. Any cash collateral received is invested in the Fidelity Securities Lending Cash Central Fund. The value of loaned securities and cash collateral at period end are disclosed on the Fund's Statement of Assets and Liabilities. Security lending income represents the income earned on investing cash collateral, less rebates paid to borrowers and lending agent fees associated with the loan, plus any premium payments received for lending certain types of securities. Security lending income is presented in the Statement of Operations as a component of income from Fidelity Central Funds. Total security lending income during the period amounted to $56,762. During the period, there were no securities loaned to FCM.
10. Expense Reductions.
Many of the brokers with whom FMR places trades on behalf of the Fund provided services to the Fund in addition to trade execution. These services included payments of certain expenses on behalf of the Fund totaling $55,517 for the period.
11. Distributions to Shareholders.
Distributions to shareholders of each class were as follows:
| Six months ended
June 30, 2011 | Year ended
December 31, 2010 |
From net investment income | | |
Initial Class | $ - | $ 20,670,020 |
Service Class | - | 130,466 |
Service Class 2 | - | 539,940 |
Investor Class | - | 1,468,124 |
Total | $ - | $ 22,808,550 |
From net realized gain | | |
Initial Class | $ 433,925 | $ 6,228,074 |
Service Class | 2,955 | 42,354 |
Service Class 2 | 13,424 | 193,184 |
Investor Class | 34,365 | 465,114 |
Total | $ 484,669 | $ 6,928,726 |
12. Share Transactions.
Transactions for each class of shares were as follows:
| Shares | Dollars |
| Six months ended June 30, 2011 | Year ended
December 31, 2010 | Six months ended June 30, 2011 | Year ended
December 31, 2010 |
Initial Class | | | | |
Shares sold | 1,145,147 | 2,953,816 | $ 17,095,677 | $ 40,305,021 |
Reinvestment of distributions | 29,103 | 1,875,132 | 433,925 | 26,898,094 |
Shares redeemed | (5,893,911) | (12,990,962) | (88,059,402) | (175,862,426) |
Net increase (decrease) | (4,719,661) | (8,162,014) | $ (70,529,800) | $ (108,659,311) |
Service Class | | | | |
Shares sold | 23,737 | 217,938 | $ 353,169 | $ 2,870,314 |
Reinvestment of distributions | 199 | 12,117 | 2,955 | 172,820 |
Shares redeemed | (48,895) | (270,940) | (725,096) | (3,659,374) |
Net increase (decrease) | (24,959) | (40,885) | $ (368,972) | $ (616,240) |
Service Class 2 | | | | |
Shares sold | 117,588 | 317,970 | $ 1,723,088 | $ 4,248,620 |
Reinvestment of distributions | 916 | 51,977 | 13,424 | 733,124 |
Shares redeemed | (420,397) | (718,587) | (6,188,074) | (9,598,684) |
Net increase (decrease) | (301,893) | (348,640) | $ (4,451,562) | $ (4,616,940) |
Investor Class | | | | |
Shares sold | 1,185,440 | 2,175,761 | $ 17,656,572 | $ 30,128,589 |
Reinvestment of distributions | 2,314 | 135,106 | 34,365 | 1,933,238 |
Shares redeemed | (509,234) | (754,597) | (7,530,278) | (10,154,545) |
Net increase (decrease) | 678,520 | 1,556,270 | $ 10,160,659 | $ 21,907,282 |
Semiannual Report
13. Other.
The Fund's organizational documents provide former and current trustees and officers with a limited indemnification against liabilities arising in connection with the performance of their duties to the Fund. In the normal course of business, the Fund may also enter into contracts that provide general indemnifications. The Fund's maximum exposure under these arrangements is unknown as this would be dependent on future claims that may be made against the Fund. The risk of material loss from such claims is considered remote.
At the end of the period, FMR or its affiliates were owners of record of 32% of the total outstanding shares of the Fund and two otherwise unaffiliated shareholders were owners of 28% of the total outstanding shares of the fund.
Semiannual Report
Investment Adviser
Fidelity Management & Research Company
Boston, MA
Investment Sub-Advisers
FMR Co., Inc.
Fidelity Management & Research (U.K.) Inc.
Fidelity Investments Money Management, Inc.
Fidelity Management & Research
(Hong Kong) Limited
Fidelity Management & Research
(Japan) Inc.
General Distributor
Fidelity Distributors Corporation
Boston, MA
Transfer and Service Agents
Fidelity Investments Institutional Operations Company, Inc.
Boston, MA
Fidelity Service Company, Inc.
Boston, MA
Custodian
JPMorgan Chase Bank
New York, NY
VIPAM-SANN-0811
1.705701.113
Fidelity® Variable Insurance Products:
Asset Manager: Growth Portfolio
Semiannual Report
June 30, 2011
(2_fidelity_logos) (Registered_Trademark)
Contents
Shareholder Expense Example | <Click Here> | An example of shareholder expenses. |
Investment Changes | <Click Here> | A summary of major shifts in the fund's investments over the past six months. |
Investments | <Click Here> | A complete list of the fund's investments with their market values. |
Financial Statements | <Click Here> | Statements of assets and liabilities, operations, and changes in net assets, as well as financial highlights. |
Notes | <Click Here> | Notes to the financial statements. |
To view a fund's proxy voting guidelines and proxy voting record for the 12-month period ended June 30, visit http://www.fidelity.com/proxyvotingresults or visit the Securities and Exchange Commission's (SEC) web site at http://www.sec.gov. You may also call 1-877-208-0098 to request a free copy of the proxy voting guidelines.
Fidelity Variable Insurance Products are separate account options which are purchased through a variable insurance contract.
Standard & Poor's, S&P and S&P 500 are registered service marks of The McGraw-Hill Companies, Inc. and have been licensed for use by Fidelity Distributors Corporation.
Other third party marks appearing herein are the property of their respective owners.
All other marks appearing herein are registered or unregistered trademarks or service marks of FMR LLC or an affiliated company.
This report and the financial statements contained herein are submitted for the general information of the shareholders of the fund. This report is not authorized for distribution to prospective investors in the fund unless preceded or accompanied by an effective prospectus.
A fund files its complete schedule of portfolio holdings with the SEC for the first and third quarters of each fiscal year on Form N-Q. Forms N-Q are available on the SEC's web site at http://www.sec.gov. A fund's Forms N-Q may be reviewed and copied at the SEC's Public Reference Room in Washington, DC. Information regarding the operation of the SEC's Public Reference Room may be obtained by calling 1-800-SEC-0330. For a complete list of a fund's portfolio holdings, view the most recent holdings listings, semiannual report, or annual report on Fidelity's web site at http://www.fidelity.com, http://www.advisor.fidelity.com, or http://www.401k.com, as applicable.
NOT FDIC INSURED • MAY LOSE VALUE • NO BANK GUARANTEE
Neither the fund nor Fidelity Distributors Corporation is a bank.
Semiannual Report
As a shareholder of the Fund, you incur two types of costs: (1) transaction costs, and (2) ongoing costs, including management fees, distribution and/or service (12b-1) fees and other Fund expenses. This Example is intended to help you understand your ongoing costs (in dollars) of investing in the Fund and to compare these costs with the ongoing costs of investing in other mutual funds.
The Example is based on an investment of $1,000 invested at the beginning of the period and held for the entire period (January 1, 2011 to June 30, 2011).
Actual Expenses
The first line of the accompanying table for each class of the Fund provides information about actual account values and actual expenses. You may use the information in this line, together with the amount you invested, to estimate the expenses that you paid over the period. Simply divide your account value by $1,000.00 (for example, an $8,600 account value divided by $1,000.00 = 8.6), then multiply the result by the number in the first line for a class of the Fund under the heading entitled "Expenses Paid During Period" to estimate the expenses you paid on your account during this period. The estimate of expenses does not include any fees or other expenses of any variable annuity or variable life insurance product. If they were, the estimate of expenses you paid during the period would be higher, and your ending account value would be lower. In addition, the Fund, as a shareholder in the underlying Fidelity Central Funds, will indirectly bear its pro-rata share of the fees and expenses incurred by the underlying Fidelity Central Funds. These fees and expenses are not included in the Fund's annualized expense ratio used to calculate the expense estimate in the table below.
Hypothetical Example for Comparison Purposes
The second line of the accompanying table for each class of the Fund provides information about hypothetical account values and hypothetical expenses based on a Class' actual expense ratio and an assumed rate of return of 5% per year before expenses, which is not the Class' actual return. The hypothetical account values and expenses may not be used to estimate the actual ending account balance or expenses you paid for the period. You may use this information to compare the ongoing costs of investing in the Fund and other funds. To do so, compare this 5% hypothetical example with the 5% hypothetical examples that appear in the shareholder reports of the other funds. The estimate of expenses does not include any fees or other expenses of any variable annuity or variable life insurance product. If they were, the estimate of expenses you paid during the period would be higher, and your ending account value would be lower. In addition, the Fund, as a shareholder in the underlying Fidelity Central Funds, will indirectly bear its pro-rata share of the fees and expenses incurred by the underlying Fidelity Central Funds. These fees and expenses are not included in the Fund's annualized expense ratio used to calculate the expense estimate in the table below.
Please note that the expenses shown in the table are meant to highlight your ongoing costs only and do not reflect any transaction costs. Therefore, the second line of the table is useful in comparing ongoing costs only, and will not help you determine the relative total costs of owning different funds.
| Annualized Expense Ratio | Beginning
Account Value
January 1, 2011 | Ending
Account Value
June 30, 2011 | Expenses Paid
During Period*
January 1, 2011
to June 30, 2011 |
Initial Class | .73% | | | |
Actual | | $ 1,000.00 | $ 1,046.10 | $ 3.70 |
HypotheticalA | | $ 1,000.00 | $ 1,021.17 | $ 3.66 |
Service Class | .83% | | | |
Actual | | $ 1,000.00 | $ 1,045.80 | $ 4.21 |
HypotheticalA | | $ 1,000.00 | $ 1,020.68 | $ 4.16 |
Service Class 2 | 1.01% | | | |
Actual | | $ 1,000.00 | $ 1,045.30 | $ 5.12 |
HypotheticalA | | $ 1,000.00 | $ 1,019.79 | $ 5.06 |
Investor Class | .81% | | | |
Actual | | $ 1,000.00 | $ 1,046.30 | $ 4.11 |
HypotheticalA | | $ 1,000.00 | $ 1,020.78 | $ 4.06 |
A 5% return per year before expenses
* Expenses are equal to each Class' annualized expense ratio, multiplied by the average account value over the period, multiplied by 181/365 (to reflect the one-half year period). The fees and expenses of the underlying Fidelity Central Funds in which the Fund invests are not included in the Fund's annualized expense ratio.
Semiannual Report
Investment Changes (Unaudited)
The information in the following tables is based on the combined investments of the Fund and its pro-rata share of the investments of Fidelity's Central Funds, other than the Commodity Strategy and Money Market Central Funds.
Top Ten Stocks as of June 30, 2011 |
| % of fund's
net assets | % of fund's net assets
6 months ago |
Apple, Inc. | 2.0 | 2.9 |
Chevron Corp. | 1.3 | 0.0 |
United Continental Holdings, Inc. | 1.2 | 1.1 |
Schlumberger Ltd. | 1.2 | 0.9 |
Green Mountain Coffee Roasters, Inc. | 1.0 | 0.0 |
Halliburton Co. | 1.0 | 0.0 |
Informatica Corp. | 0.9 | 0.7 |
Baker Hughes, Inc. | 0.8 | 0.0 |
Deckers Outdoor Corp. | 0.8 | 0.7 |
Delta Air Lines, Inc. | 0.7 | 1.3 |
| 10.9 | |
Market Sectors as of June 30, 2011 |
(stocks only) | % of fund's
net assets | % of fund's net assets
6 months ago |
Information Technology | 11.4 | 14.6 |
Consumer Discretionary | 10.8 | 13.1 |
Energy | 10.6 | 6.6 |
Industrials | 8.8 | 10.2 |
Materials | 7.6 | 8.8 |
Health Care | 7.2 | 4.9 |
Financials | 5.7 | 7.4 |
Consumer Staples | 4.2 | 2.5 |
Telecommunication Services | 1.1 | 1.3 |
Utilities | 1.0 | 0.9 |
Asset Allocation (% of fund's net assets) |
As of June 30, 2011* | As of December 31, 2010** |
 | Stock Class and
Equity Futures*** 69.7% | | | Stock Class and
Equity Futures**** 72.2% | |
 | Bond Class 26.5% | | | Bond Class 25.9% | |
 | Short-Term Class 3.8% | | | Short-Term Class 1.9% | |
* Foreign investments | 30.4% | | ** Foreign investments | 31.0% | |

*** Includes investment in Fidelity Commodity Strategy Central Fund of 1.1%
**** Includes investment in Fidelity Commodity Strategy Central Fund of 1.6%
Asset allocations in the pie charts reflect the categorization of assets as defined in the fund's prospectus in effect as of the time periods indicated above. Financial Statement categorizations conform to accounting standards and will differ from the pie chart. Percentages are adjusted for the effect of futures contracts and swap contracts, if applicable.
An unaudited holdings listing for the Fund, which presents direct holdings as well as the pro-rata share of any securities and other investments held indirectly through its investment in underlying Fidelity Central Funds, other than the Commodity Strategy and Money Market Central Funds, is available at advisor.fidelity.com.
Semiannual Report
Investments June 30, 2011 (Unaudited)
Showing Percentage of Net Assets
Common Stocks - 48.9% |
| Shares | | Value |
CONSUMER DISCRETIONARY - 8.6% |
Auto Components - 0.3% |
BorgWarner, Inc. (a) | 5,800 | | $ 468,582 |
Automobiles - 0.5% |
Bayerische Motoren Werke AG (BMW) | 9,516 | | 949,651 |
Diversified Consumer Services - 0.6% |
Anhanguera Educacional Participacoes SA | 9,200 | | 195,775 |
Weight Watchers International, Inc. | 12,200 | | 920,734 |
| | 1,116,509 |
Hotels, Restaurants & Leisure - 1.1% |
Arcos Dorados Holdings, Inc. | 11,300 | | 238,317 |
Chipotle Mexican Grill, Inc. (a) | 2,000 | | 616,380 |
Panera Bread Co. Class A (a) | 9,700 | | 1,218,902 |
| | 2,073,599 |
Household Durables - 0.2% |
Gafisa SA sponsored ADR | 45,800 | | 433,268 |
Internet & Catalog Retail - 0.6% |
Amazon.com, Inc. (a) | 1,300 | | 265,837 |
Priceline.com, Inc. (a) | 1,700 | | 870,281 |
| | 1,136,118 |
Media - 0.3% |
Bankrate, Inc. | 5,700 | | 94,506 |
Focus Media Holding Ltd. ADR (a) | 12,200 | | 379,420 |
| | 473,926 |
Multiline Retail - 0.7% |
Lojas Renner SA | 2,600 | | 99,097 |
Macy's, Inc. | 37,300 | | 1,090,652 |
Marisa Lojas SA | 2,700 | | 41,163 |
| | 1,230,912 |
Specialty Retail - 1.1% |
China ZhengTong Auto Services Holdings Ltd. | 98,000 | | 112,209 |
Tiffany & Co., Inc. | 9,400 | | 738,088 |
Vitamin Shoppe, Inc. (a) | 2,000 | | 91,520 |
Williams-Sonoma, Inc. | 31,500 | | 1,149,435 |
| | 2,091,252 |
Textiles, Apparel & Luxury Goods - 3.2% |
Arezzo Industria e Comercio SA | 12,000 | | 167,958 |
Burberry Group PLC | 17,100 | | 397,935 |
Coach, Inc. | 17,200 | | 1,099,596 |
Deckers Outdoor Corp. (a) | 16,700 | | 1,471,938 |
Fossil, Inc. (a) | 11,000 | | 1,294,920 |
Phillips-Van Heusen Corp. | 14,400 | | 942,768 |
The Swatch Group AG (Bearer) | 800 | | 403,283 |
Vera Bradley, Inc. (d) | 6,100 | | 233,020 |
| | 6,011,418 |
TOTAL CONSUMER DISCRETIONARY | | 15,985,235 |
|
| Shares | | Value |
CONSUMER STAPLES - 2.3% |
Beverages - 0.4% |
Hansen Natural Corp. (a) | 9,500 | | $ 769,025 |
Food & Staples Retailing - 0.1% |
Droga Raia SA | 7,000 | | 116,584 |
Food Products - 1.1% |
Green Mountain Coffee Roasters, Inc. (a) | 21,700 | | 1,936,942 |
Smithfield Foods, Inc. (a) | 6,000 | | 131,220 |
| | 2,068,162 |
Personal Products - 0.7% |
Estee Lauder Companies, Inc. Class A | 7,900 | | 831,001 |
Hengan International Group Co. Ltd. | 61,500 | | 551,637 |
| | 1,382,638 |
TOTAL CONSUMER STAPLES | | 4,336,409 |
ENERGY - 8.8% |
Energy Equipment & Services - 3.8% |
Baker Hughes, Inc. | 21,400 | | 1,552,784 |
Carbo Ceramics, Inc. | 6,300 | | 1,026,585 |
Halliburton Co. | 33,700 | | 1,718,700 |
Petrofac Ltd. | 8,800 | | 213,824 |
Saipem SpA | 7,660 | | 395,491 |
Schlumberger Ltd. | 24,514 | | 2,118,010 |
| | 7,025,394 |
Oil, Gas & Consumable Fuels - 5.0% |
Alpha Natural Resources, Inc. (a) | 8,355 | | 379,651 |
Cabot Oil & Gas Corp. | 2,100 | | 139,251 |
Chevron Corp. | 23,100 | | 2,375,604 |
Concho Resources, Inc. (a) | 11,000 | | 1,010,350 |
Continental Resources, Inc. (a) | 17,900 | | 1,161,889 |
Denbury Resources, Inc. (a) | 4,800 | | 96,000 |
Kosmos Energy Ltd. | 10,300 | | 174,894 |
Oasis Petroleum, Inc. (a) | 19,300 | | 572,824 |
Occidental Petroleum Corp. | 8,100 | | 842,724 |
Pioneer Natural Resources Co. | 14,800 | | 1,325,636 |
Western Refining, Inc. (a)(d) | 10,100 | | 182,507 |
Whiting Petroleum Corp. (a) | 20,800 | | 1,183,728 |
| | 9,445,058 |
TOTAL ENERGY | | 16,470,452 |
FINANCIALS - 1.2% |
Capital Markets - 0.5% |
Apollo Global Management LLC Class A | 58,300 | | 1,002,760 |
Commercial Banks - 0.3% |
Itau Unibanco Banco Multiplo SA sponsored ADR | 22,500 | | 529,875 |
Insurance - 0.1% |
Qualicorp SA | 19,000 | | 181,346 |
Common Stocks - continued |
| Shares | | Value |
FINANCIALS - continued |
Real Estate Management & Development - 0.3% |
CB Richard Ellis Group, Inc. Class A (a) | 24,100 | | $ 605,151 |
TOTAL FINANCIALS | | 2,319,132 |
HEALTH CARE - 5.9% |
Biotechnology - 1.2% |
Amgen, Inc. (a) | 2,200 | | 128,370 |
Biogen Idec, Inc. (a) | 4,900 | | 523,908 |
United Therapeutics Corp. (a) | 12,800 | | 705,280 |
Vertex Pharmaceuticals, Inc. (a) | 17,000 | | 883,830 |
| | 2,241,388 |
Health Care Equipment & Supplies - 0.5% |
Edwards Lifesciences Corp. (a) | 4,400 | | 383,592 |
IDEXX Laboratories, Inc. (a)(d) | 2,500 | | 193,900 |
St. Jude Medical, Inc. | 500 | | 23,840 |
Volcano Corp. (a) | 8,500 | | 274,465 |
| | 875,797 |
Health Care Providers & Services - 2.3% |
Accretive Health, Inc. (a) | 11,000 | | 316,690 |
Express Scripts, Inc. (a) | 6,800 | | 367,064 |
HMS Holdings Corp. (a) | 5,100 | | 392,037 |
Humana, Inc. | 12,900 | | 1,038,966 |
McKesson Corp. | 8,500 | | 711,025 |
Medco Health Solutions, Inc. (a) | 6,900 | | 389,988 |
UnitedHealth Group, Inc. | 9,400 | | 484,852 |
WellPoint, Inc. | 7,200 | | 567,144 |
| | 4,267,766 |
Health Care Technology - 0.3% |
Epocrates, Inc. (a) | 6,100 | | 112,484 |
SXC Health Solutions Corp. (a) | 6,800 | | 401,696 |
| | 514,180 |
Pharmaceuticals - 1.6% |
Elan Corp. PLC sponsored ADR (a) | 25,100 | | 285,387 |
Novo Nordisk A/S Series B sponsored ADR | 8,200 | | 1,027,296 |
Shire PLC sponsored ADR | 5,600 | | 527,576 |
Valeant Pharmaceuticals International, Inc. (Canada) | 23,906 | | 1,243,142 |
| | 3,083,401 |
TOTAL HEALTH CARE | | 10,982,532 |
INDUSTRIALS - 6.4% |
Aerospace & Defense - 0.2% |
Goodrich Corp. | 4,400 | | 420,200 |
Airlines - 2.1% |
Copa Holdings SA Class A | 4,200 | | 280,308 |
Delta Air Lines, Inc. (a) | 147,200 | | 1,349,824 |
|
| Shares | | Value |
United Continental Holdings, Inc. (a) | 96,185 | | $ 2,176,667 |
US Airways Group, Inc. (a) | 22,600 | | 201,366 |
| | 4,008,165 |
Commercial Services & Supplies - 0.1% |
Swisher Hygiene, Inc. (g) | 24,821 | | 125,768 |
Construction & Engineering - 0.4% |
Fluor Corp. | 12,600 | | 814,716 |
Electrical Equipment - 0.2% |
Roper Industries, Inc. | 4,400 | | 366,520 |
Industrial Conglomerates - 0.2% |
Carlisle Companies, Inc. | 6,000 | | 295,380 |
Machinery - 2.6% |
Caterpillar, Inc. | 9,100 | | 968,786 |
Changsha Zoomlion Heavy Industry Science & Technology Development Co. Ltd. (H Shares) | 92,560 | | 176,276 |
Cummins, Inc. | 7,900 | | 817,571 |
Dover Corp. | 12,400 | | 840,720 |
Kennametal, Inc. | 18,200 | | 768,222 |
Parker Hannifin Corp. | 10,200 | | 915,348 |
Sandvik AB | 12,200 | | 213,930 |
Weg SA | 14,700 | | 167,613 |
| | 4,868,466 |
Road & Rail - 0.2% |
CSX Corp. | 15,300 | | 401,166 |
Trading Companies & Distributors - 0.4% |
Air Lease Corp.: | | | |
Class A (a)(e) | 10,900 | | 264,761 |
Class A | 8,500 | | 206,465 |
Mills Estruturas e Servicos de Engenharia SA | 16,000 | | 230,607 |
| | 701,833 |
TOTAL INDUSTRIALS | | 12,002,214 |
INFORMATION TECHNOLOGY - 10.3% |
Communications Equipment - 2.4% |
Alcatel-Lucent SA sponsored ADR (a) | 178,600 | | 1,030,522 |
HTC Corp. | 19,000 | | 637,325 |
JDS Uniphase Corp. (a) | 12,400 | | 206,584 |
Juniper Networks, Inc. (a) | 6,700 | | 211,050 |
Polycom, Inc. (a) | 9,200 | | 591,560 |
QUALCOMM, Inc. | 17,700 | | 1,005,183 |
Riverbed Technology, Inc. (a) | 18,000 | | 712,620 |
| | 4,394,844 |
Computers & Peripherals - 2.5% |
Apple, Inc. (a) | 11,200 | | 3,759,504 |
EMC Corp. (a) | 24,000 | | 661,200 |
Fusion-io, Inc. | 1,300 | | 39,117 |
NetApp, Inc. (a) | 5,400 | | 285,012 |
| | 4,744,833 |
Common Stocks - continued |
| Shares | | Value |
INFORMATION TECHNOLOGY - continued |
Internet Software & Services - 1.2% |
Active Network, Inc. | 7,600 | | $ 133,760 |
Baidu.com, Inc. sponsored ADR (a) | 4,100 | | 574,533 |
Cornerstone Ondemand, Inc. (d) | 11,800 | | 208,270 |
Demand Media, Inc. (d) | 11,700 | | 158,535 |
Facebook, Inc. Class B (a)(g) | 1,580 | | 39,500 |
Rackspace Hosting, Inc. (a) | 4,400 | | 188,056 |
Renren, Inc. ADR | 10,200 | | 90,270 |
Tencent Holdings Ltd. | 26,900 | | 730,077 |
YouKu.com, Inc. ADR (a)(d) | 3,700 | | 127,095 |
| | 2,250,096 |
IT Services - 0.7% |
Cognizant Technology Solutions Corp. Class A (a) | 14,800 | | 1,085,432 |
Jack Henry & Associates, Inc. | 8,200 | | 246,082 |
| | 1,331,514 |
Semiconductors & Semiconductor Equipment - 0.9% |
ARM Holdings PLC sponsored ADR | 12,100 | | 344,003 |
Broadcom Corp. Class A | 6,200 | | 208,568 |
Freescale Semiconductor Holdings I Ltd. | 19,400 | | 356,766 |
NVIDIA Corp. (a) | 9,700 | | 154,570 |
NXP Semiconductors NV | 23,400 | | 625,482 |
| | 1,689,389 |
Software - 2.6% |
Ariba, Inc. (a) | 11,100 | | 382,617 |
Citrix Systems, Inc. (a) | 9,600 | | 768,000 |
Informatica Corp. (a) | 28,300 | | 1,653,569 |
RealPage, Inc. | 8,900 | | 235,583 |
Rovi Corp. (a) | 11,000 | | 630,960 |
Taleo Corp. Class A (a) | 11,000 | | 407,330 |
VMware, Inc. Class A (a) | 8,200 | | 821,886 |
| | 4,899,945 |
TOTAL INFORMATION TECHNOLOGY | | 19,310,621 |
MATERIALS - 5.3% |
Chemicals - 3.9% |
Celanese Corp. Class A | 14,400 | | 767,664 |
CF Industries Holdings, Inc. | 8,800 | | 1,246,696 |
Dow Chemical Co. | 29,900 | | 1,076,400 |
Ferro Corp. (a) | 3,500 | | 47,040 |
FMC Corp. | 6,400 | | 550,528 |
|
| Shares | | Value |
LyondellBasell Industries NV Class A | 32,900 | | $ 1,267,308 |
PPG Industries, Inc. | 5,500 | | 499,345 |
Rockwood Holdings, Inc. (a) | 10,000 | | 552,900 |
Umicore SA | 4,394 | | 239,674 |
Uralkali JSC GDR (Reg. S) | 11,100 | | 499,500 |
Westlake Chemical Corp. | 9,300 | | 482,670 |
| | 7,229,725 |
Metals & Mining - 1.4% |
Alcoa, Inc. | 35,400 | | 561,444 |
Anglo American PLC (United Kingdom) | 300 | | 14,865 |
First Quantum Minerals Ltd. | 5,100 | | 743,635 |
Stillwater Mining Co. (a) | 27,400 | | 603,074 |
United States Steel Corp. (d) | 11,500 | | 529,460 |
Vallares PLC | 13,400 | | 216,132 |
| | 2,668,610 |
TOTAL MATERIALS | | 9,898,335 |
UTILITIES - 0.1% |
Multi-Utilities - 0.1% |
TECO Energy, Inc. | 7,300 | | 137,897 |
TOTAL COMMON STOCKS (Cost $70,155,175) | 91,442,827 |
Investment Companies - 1.8% |
| | | |
iShares Barclays TIPS Bond ETF
(Cost $3,357,152) | 30,300 | | 3,352,392 |
Fixed-Income Funds - 26.0% |
| | | |
Fidelity Emerging Markets Debt Central Fund (f) | 91,448 | | 930,938 |
Fidelity Floating Rate Central Fund (f) | 51,945 | | 5,265,123 |
Fidelity High Income Central Fund 1 (f) | 59,783 | | 5,894,589 |
Fidelity VIP Investment Grade Central Fund (f) | 344,169 | | 36,660,907 |
TOTAL FIXED-INCOME FUNDS (Cost $46,343,549) | 48,751,557 |
Equity Funds - 20.8% |
| | | |
Domestic Equity Funds - 1.1% |
Fidelity Commodity Strategy Central Fund (f) | 168,465 | | 2,072,124 |
Equity Funds - continued |
| Shares | | Value |
International Equity Funds - 19.7% |
Fidelity Emerging Markets Equity Central Fund (f) | 22,959 | | $ 5,048,455 |
Fidelity International Equity Central Fund (f) | 432,512 | | 31,854,483 |
TOTAL INTERNATIONAL EQUITY FUNDS | | 36,902,938 |
TOTAL EQUITY FUNDS (Cost $41,011,567) | 38,975,062 |
Money Market Funds - 3.0% |
| | | |
Fidelity Cash Central Fund, 0.11% (b) | 3,995,251 | | 3,995,251 |
Fidelity Securities Lending Cash Central Fund, 0.11% (b)(c) | 1,568,158 | | 1,568,158 |
TOTAL MONEY MARKET FUNDS (Cost $5,563,409) | 5,563,409 |
TOTAL INVESTMENT PORTFOLIO - 100.5% (Cost $166,430,852) | 188,085,247 |
NET OTHER ASSETS (LIABILITIES) - (0.5)% | (911,016) |
NET ASSETS - 100% | $ 187,174,231 |
Futures Contracts |
| Expiration Date | | Underlying Face Amount at Value | | Unrealized Appreciation/(Depreciation) |
Purchased |
Equity Index Contracts |
19 CME E-mini S&P 500 Index Contracts | Sept. 2011 | | $ 1,249,725 | | $ 221 |
61 NYSE E-mini MSCI EAFE Index Contracts | Sept. 2011 | | 2,728,530 | | (12,316) |
TOTAL EQUITY INDEX CONTRACTS | | $ 3,978,255 | | $ (12,095) |
|
The face value of futures purchased as a percentage of net assets is 2.1% |
Security Type Abbreviations |
ETFs - Exchange-Trade Funds |
Legend |
(a) Non-income producing |
(b) Affiliated fund that is available only to investment companies and other accounts managed by Fidelity Investments. The rate quoted is the annualized seven-day yield of the fund at period end. A complete unaudited listing of the fund's holdings as of its most recent quarter end is available upon request. In addition, each Fidelity Central Fund's financial statements are available on the SEC's website or upon request. |
(c) Investment made with cash collateral received from securities on loan. |
(d) Security or a portion of the security is on loan at period end. |
(e) Security exempt from registration under Rule 144A of the Securities Act of 1933. These securities may be resold in transactions exempt from registration, normally to qualified institutional buyers. At the end of the period, the value of these securities amounted to $264,761 or 0.1% of net assets. |
(f) Affiliated fund that is available only to investment companies and other accounts managed by Fidelity Investments. A complete unaudited schedule of portfolio holdings for each Fidelity Central Fund is filed with the SEC for the first and third quarters of each fiscal year on Form N-Q and is available upon request or at the SEC's web site at www.sec.gov. An unaudited holdings listing for the Fund, which presents direct holdings as well as the pro rata share of securities and other investments held indirectly through its investment in underlying Fidelity Central Funds, other than the Commodity Strategy and Money Market Central Funds, is available at advisor.fidelity.com. In addition, each Fidelity Central Fund's financial statements are available on the SEC's web site or upon request. |
(g) Restricted securities - Investment in securities not registered under the Securities Act of 1933 (excluding 144A issues). At the end of the period, the value of restricted securities (excluding 144A issues) amounted to $165,268 or 0.1% of net assets. |
Additional information on each restricted holding is as follows: |
Security | Acquisition Date | Acquisition Cost |
Facebook, Inc. Class B | 5/19/11 | $ 39,574 |
Swisher Hygiene, Inc. | 4/15/11 | $ 191,122 |
Affiliated Central Funds |
Information regarding fiscal year to date income earned by the Fund from investments in Fidelity Central Funds is as follows: |
Fund | Income earned |
Fidelity Cash Central Fund | $ 3,051 |
Fidelity Emerging Markets Debt Central Fund | 14,627 |
Fidelity Emerging Markets Equity Central Fund | 39,030 |
Fidelity Floating Rate Central Fund | 131,126 |
Fidelity High Income Central Fund 1 | 231,069 |
Fidelity International Equity Central Fund | 617,369 |
Fidelity Securities Lending Cash Central Fund | 15,872 |
Fidelity VIP Investment Grade Central Fund | 633,405 |
Total | $ 1,685,549 |
Additional information regarding the Fund's fiscal year to date purchases and sales, including the ownership percentage, of the non Money Market Central Funds is as follows: |
Fund | Value, beginning of period | Purchases | Sales Proceeds | Value, end of period | % ownership, end of period |
Fidelity Commodity Strategy Central Fund | $ 2,907,291 | $ 1,306,371 | $ 2,031,823 | $ 2,072,124 | 0.2% |
Fidelity Emerging Markets Debt Central Fund | - | 914,671 | - | 930,938 | 0.9% |
Fidelity Emerging Markets Equity Central Fund | 7,858,662 | - | 2,571,973 | 5,048,455 | 1.6% |
Fidelity Floating Rate Central Fund | 5,416,203 | 581,202 | 810,880 | 5,265,123 | 0.2% |
Fidelity High Income Central Fund 1 | 6,768,440 | 231,069 | 1,195,925 | 5,894,589 | 1.1% |
Fidelity International Equity Central Fund | 26,462,332 | 4,960,983 | 346,155 | 31,854,483 | 1.7% |
Fidelity VIP Investment Grade Central Fund | 36,250,066 | 2,342,097 | 2,397,765 | 36,660,907 | 1.0% |
Total | $ 85,662,994 | $ 10,336,393 | $ 9,354,521 | $ 87,726,619 | |
Other Information |
The following is a summary of the inputs used, as of June 30, 2011, involving the Fund's assets and liabilities carried at fair value. The inputs or methodology used for valuing securities may not be an indication of the risk associated with investing in those securities. For more information on valuation inputs, and their aggregation into the levels used in the tables below, please refer to the Security Valuation section in the accompanying Notes to Financial Statements. |
Valuation Inputs at Reporting Date: |
Description | Total | Level 1 | Level 2 | Level 3 |
Investments in Securities: | | | | |
Equities: | | | | |
Consumer Discretionary | $ 15,985,235 | $ 15,985,235 | $ - | $ - |
Consumer Staples | 4,336,409 | 4,336,409 | - | - |
Energy | 16,470,452 | 16,470,452 | - | - |
Financials | 2,319,132 | 2,319,132 | - | - |
Health Care | 10,982,532 | 10,982,532 | - | - |
Industrials | 12,002,214 | 11,876,446 | 125,768 | - |
Information Technology | 19,310,621 | 19,271,121 | - | 39,500 |
Materials | 9,898,335 | 9,898,335 | - | - |
Utilities | 137,897 | 137,897 | - | - |
Investment Companies | 3,352,392 | 3,352,392 | - | - |
Fixed-Income Funds | 48,751,557 | 48,751,557 | - | - |
Money Market Funds | 5,563,409 | 5,563,409 | - | - |
Equity Funds | 38,975,062 | 38,975,062 | - | - |
Total Investments in Securities: | $ 188,085,247 | $ 187,919,979 | $ 125,768 | $ 39,500 |
Derivative Instruments: | | | | |
Assets | | | | |
Futures Contracts | $ 221 | $ 221 | $ - | $ - |
Liabilities | | | | |
Futures Contracts | $ (12,316) | $ (12,316) | $ - | $ - |
Total Derivative Instruments: | $ (12,095) | $ (12,095) | $ - | $ - |
The following is a reconciliation of Investments in Securities for which Level 3 inputs were used in determining value: |
Investments in Securities: | |
Beginning Balance | $ 223,450 |
Total Realized Gain (Loss) | - |
Total Unrealized Gain (Loss) | (74) |
Cost of Purchases | 39,574 |
Proceeds of Sales | - |
Amortization/Accretion | - |
Transfers in to Level 3 | - |
Transfers out of Level 3 | (223,450) |
Ending Balance | $ 39,500 |
The change in unrealized gain (loss) for the period attributable to Level 3 securities held at June 30, 2011 | $ (74) |
The information used in the above reconciliation represents fiscal year to date activity for any Investments in Securities identified as using Level 3 inputs at either the beginning or the end of the current fiscal period. Transfers in or out of Level 3 represent the beginning value of any Security or Instrument where a change in the pricing level occurred from the beginning to the end of the period. The cost of purchases and the proceeds of sales may include securities received or delivered through corporate actions or exchanges. Realized and unrealized gains (losses) disclosed in the reconciliation are included in Net Gain (Loss) on the Fund's Statement of Operations. |
Value of Derivative Instruments |
The following table is a summary of the Fund's value of derivative instruments by risk exposure as of June 30, 2011. For additional information on derivative instruments, please refer to the Derivative Instruments section in the accompanying Notes to Financial Statements. |
Risk Exposure /
Derivative Type | Value |
| Asset | Liability |
Equity Risk | | |
Futures Contracts (a) | $ 221 | $ (12,316) |
Total Value of Derivatives | $ 221 | $ (12,316) |
(a) Reflects cumulative appreciation/(depreciation) on futures contracts as disclosed on the Schedule of Investments. Only the period end variation margin is separately disclosed on the Statement of Assets and Liabilities. |
The information in the following tables is based on the combined investments of the Fund and its pro-rata share of the investments of Fidelity's Central Funds, other than the Commodity Strategy and Money Market Central Funds. |
The composition of credit quality ratings as a percentage of net assets is as follows (Unaudited): |
U.S. Government and U.S. Government Agency Obligations | 12.9% |
AAA,AA,A | 4.1% |
BBB | 2.2% |
BB | 2.0% |
B | 3.3% |
CCC,CC,C | 0.6% |
D | 0.0% |
Not Rated | 0.5% |
Equities* | 73.9% |
Short-Term Investments and Net Other Assets | 0.5% |
| 100.0% |
* Includes investment in Fidelity Commodity Strategy Central Fund of 1.1%
We have used ratings from Moody's Investors Service, Inc. Where Moody's® ratings are not available, we have used S&P® ratings. All ratings are as of the date indicated and do not reflect subsequent changes. Percentages are adjusted for the effect of futures contracts, if applicable. |
Distribution of investments by country of issue, as a percentage of total net assets, is as follows: (Unaudited) |
United States of America | 69.6% |
United Kingdom | 4.4% |
Japan | 2.6% |
France | 2.6% |
Germany | 2.2% |
Canada | 1.8% |
Brazil | 1.7% |
Netherlands | 1.4% |
Switzerland | 1.4% |
Cayman Islands | 1.2% |
Netherlands Antilles | 1.2% |
Korea (South) | 1.0% |
Others (Individually Less Than 1%) | 8.9% |
| 100.0% |
Income Tax Information |
At December 31, 2010, the Fund had a capital loss carryforward of approximately $47,330,506 of which $1,637,275, $24,334,072 and $21,359,159 will expire in fiscal 2011, 2016 and 2017, respectively. Capital loss carryforwards are only available to offset future capital gains of the Fund to the extent provided by regulations and may be limited. |
See accompanying notes which are an integral part of the financial statements.
Semiannual Report
Statement of Assets and Liabilities
| June 30, 2011 (Unaudited) |
| | |
Assets | | |
Investment in securities, at value (including securities loaned of $1,532,942) - See accompanying schedule: Unaffiliated issuers (cost $73,512,327) | $ 94,795,219 | |
Fidelity Central Funds (cost $92,918,525) | 93,290,028 | |
Total Investments (cost $166,430,852) | | $ 188,085,247 |
Cash | | 34,470 |
Receivable for investments sold | | 4,295,111 |
Receivable for fund shares sold | | 103,210 |
Dividends receivable | | 65,924 |
Distributions receivable from Fidelity Central Funds | | 256,195 |
Other receivables | | 4,290 |
Total assets | | 192,844,447 |
| | |
Liabilities | | |
Payable for investments purchased | $ 3,909,142 | |
Payable for fund shares redeemed | 40,707 | |
Accrued management fee | 84,944 | |
Distribution and service plan fees payable | 1,730 | |
Payable for daily variation on futures contracts | 12,095 | |
Other affiliated payables | 20,378 | |
Other payables and accrued expenses | 33,062 | |
Collateral on securities loaned, at value | 1,568,158 | |
Total liabilities | | 5,670,216 |
| | |
Net Assets | | $ 187,174,231 |
Net Assets consist of: | | |
Paid in capital | | $ 195,481,150 |
Undistributed net investment income | | 1,359,626 |
Accumulated undistributed net realized gain (loss) on investments and foreign currency transactions | | (31,308,425) |
Net unrealized appreciation (depreciation) on investments and assets and liabilities in foreign currencies | | 21,641,880 |
Net Assets | | $ 187,174,231 |
Statement of Assets and Liabilities - continued
| June 30, 2011 (Unaudited) |
| | |
Initial Class:
Net Asset Value, offering price and redemption price per share ($135,567,210 ÷ 8,925,170 shares) | | $ 15.19 |
| | |
Service Class:
Net Asset Value, offering price and redemption price per share ($3,824,816 ÷ 253,585 shares) | | $ 15.08 |
| | |
Service Class 2:
Net Asset Value, offering price and redemption price per share ($6,848,349 ÷ 456,333 shares) | | $ 15.01 |
| | |
Investor Class:
Net Asset Value, offering price and redemption price per share ($40,933,856 ÷ 2,706,167 shares) | | $ 15.13 |
See accompanying notes which are an integral part of the financial statements.
Semiannual Report
Statement of Operations
Six months ended June 30, 2011 (Unaudited) |
| | |
Investment Income | | |
Dividends | | $ 376,244 |
Interest | | 158 |
Income from Fidelity Central Funds | | 1,685,549 |
Total income | | 2,061,951 |
| | |
Expenses | | |
Management fee | $ 517,411 | |
Transfer agent fees | 88,360 | |
Distribution and service plan fees | 10,254 | |
Accounting and security lending fees | 45,945 | |
Custodian fees and expenses | 12,416 | |
Independent trustees' compensation | 349 | |
Audit | 28,957 | |
Legal | 610 | |
Miscellaneous | 809 | |
Total expenses before reductions | 705,111 | |
Expense reductions | (10,284) | 694,827 |
Net investment income (loss) | | 1,367,124 |
Realized and Unrealized Gain (Loss) Net realized gain (loss) on: | | |
Investment securities: | | |
Unaffiliated issuers | 8,463,058 | |
Fidelity Central Funds | 700,961 | |
Foreign currency transactions | (12,191) | |
Futures contracts | 174,016 | |
Capital gain distributions from Fidelity Central Funds | 107,117 | |
Total net realized gain (loss) | | 9,432,961 |
Change in net unrealized appreciation (depreciation) on: Investment securities | (2,459,585) | |
Assets and liabilities in foreign currencies | (841) | |
Futures contracts | (63,558) | |
Total change in net unrealized appreciation (depreciation) | | (2,523,984) |
Net gain (loss) | | 6,908,977 |
Net increase (decrease) in net assets resulting from operations | | $ 8,276,101 |
Statement of Changes in Net Assets
| Six months ended June 30, 2011 (Unaudited) | Year ended December 31, 2010 |
Increase (Decrease) in Net Assets | | |
Operations | | |
Net investment income (loss) | $ 1,367,124 | $ 2,006,745 |
Net realized gain (loss) | 9,432,961 | 15,906,125 |
Change in net unrealized appreciation (depreciation) | (2,523,984) | 8,032,692 |
Net increase (decrease) in net assets resulting from operations | 8,276,101 | 25,945,562 |
Distributions to shareholders from net investment income | - | (1,957,332) |
Distributions to shareholders from net realized gain | - | (557,354) |
Total distributions | - | (2,514,686) |
Share transactions - net increase (decrease) | (2,825,456) | (16,470,726) |
Total increase (decrease) in net assets | 5,450,645 | 6,960,150 |
| | |
Net Assets | | |
Beginning of period | 181,723,586 | 174,763,436 |
End of period (including undistributed net investment income of $1,359,626 and distributions in excess of net investment income of $7,498, respectively) | $ 187,174,231 | $ 181,723,586 |
See accompanying notes which are an integral part of the financial statements.
Semiannual Report
Financial Highlights - Initial Class
| Six months ended June 30, 2011 | Years ended December 31, |
| (Unaudited) | 2010 | 2009 | 2008 | 2007 | 2006 |
Selected Per-Share Data | | | | | | |
Net asset value, beginning of period | $ 14.52 | $ 12.66 | $ 9.68 | $ 15.51 | $ 13.60 | $ 12.97 |
Income from Investment Operations | | | | | | |
Net investment income (loss) E | .11 | .16 | .17 | .26 | .29 | .26 |
Net realized and unrealized gain (loss) | .56 | 1.91 | 3.01 | (5.82) | 2.24 | .63 |
Total from investment operations | .67 | 2.07 | 3.18 | (5.56) | 2.53 | .89 |
Distributions from net investment income | - | (.16) | (.18) | (.26) | (.62) | (.26) |
Distributions from net realized gain | - | (.05) | (.02) | (.01) | - | - |
Total distributions | - | (.21) | (.20) | (.27) | (.62) | (.26) |
Net asset value, end of period | $ 15.19 | $ 14.52 | $ 12.66 | $ 9.68 | $ 15.51 | $ 13.60 |
Total Return B,C,D | 4.61% | 16.34% | 32.91% | (35.81)% | 18.97% | 6.99% |
Ratios to Average Net Assets F,H | | | | | | |
Expenses before reductions | .73% A | .74% | .78% | .74% | .74% | .77% |
Expenses net of fee waivers, if any | .73% A | .73% | .78% | .74% | .74% | .77% |
Expenses net of all reductions | .72% A | .72% | .77% | .73% | .73% | .73% |
Net investment income (loss) | 1.50% A | 1.20% | 1.57% | 1.90% | 1.98% | 2.01% |
Supplemental Data | | | | | | |
Net assets, end of period (000 omitted) | $ 135,567 | $ 138,051 | $ 136,479 | $ 118,672 | $ 211,867 | $ 212,222 |
Portfolio turnover rate G | 74% A | 68% | 126% | 110% | 132% | 233% |
A Annualized
B Total returns for periods of less than one year are not annualized.
C Total returns do not reflect charges attributable to your insurance company's separate account. Inclusion of these charges would reduce the total returns shown.
D Total returns would have been lower if certain expenses had not been reduced during the applicable periods shown.
E Calculated based on average shares outstanding during the period.
F Fees and expenses of any underlying Fidelity Central Funds are not included in the Fund's expense ratio. The Fund indirectly bears its proportionate share of the expenses of any underlying Fidelity Central Funds.
G Amount does not include the portfolio activity of any underlying Fidelity Central Funds.
H Expense ratios reflect operating expenses of the class. Expenses before reductions do not reflect amounts reimbursed by the investment adviser or reductions from brokerage service arrangements or reductions from other expense offset arrangements and do not represent the amount paid by the class during periods when reimbursements or reductions occur. Expenses net of fee waivers reflect expenses after reimbursement by the investment adviser but prior to reductions from brokerage service arrangements or other expense offset arrangements. Expenses net of all reductions represent the net expenses paid by the class.
Financial Highlights - Service Class
| Six months ended June 30, 2011 | Years ended December 31, |
| (Unaudited) | 2010 | 2009 | 2008 | 2007 | 2006 |
Selected Per-Share Data | | | | | | |
Net asset value, beginning of period | $ 14.42 | $ 12.58 | $ 9.62 | $ 15.41 | $ 13.51 | $ 12.88 |
Income from Investment Operations | | | | | | |
Net investment income (loss) E | .10 | .14 | .16 | .24 | .27 | .25 |
Net realized and unrealized gain (loss) | .56 | 1.89 | 2.99 | (5.77) | 2.22 | .63 |
Total from investment operations | .66 | 2.03 | 3.15 | (5.53) | 2.49 | .88 |
Distributions from net investment income | - | (.15) | (.17) | (.25) | (.59) | (.25) |
Distributions from net realized gain | - | (.05) | (.02) | (.01) | - | - |
Total distributions | - | (.19) I | (.19) | (.26) | (.59) | (.25) |
Net asset value, end of period | $ 15.08 | $ 14.42 | $ 12.58 | $ 9.62 | $ 15.41 | $ 13.51 |
Total Return B,C,D | 4.58% | 16.18% | 32.79% | (35.88)% | 18.79% | 6.93% |
Ratios to Average Net Assets F,H | | | | | | |
Expenses before reductions | .83% A | .84% | .88% | .84% | .84% | .87% |
Expenses net of fee waivers, if any | .83% A | .84% | .88% | .84% | .84% | .87% |
Expenses net of all reductions | .82% A | .82% | .87% | .83% | .83% | .83% |
Net investment income (loss) | 1.40% A | 1.09% | 1.47% | 1.80% | 1.88% | 1.91% |
Supplemental Data | | | | | | |
Net assets, end of period (000 omitted) | $ 3,825 | $ 3,999 | $ 3,838 | $ 2,911 | $ 5,113 | $ 4,977 |
Portfolio turnover rate G | 74% A | 68% | 126% | 110% | 132% | 233% |
A Annualized
B Total returns for periods of less than one year are not annualized.
C Total returns do not reflect charges attributable to your insurance company's separate account. Inclusion of these charges would reduce the total returns shown.
D Total returns would have been lower if certain expenses had not been reduced during the applicable periods shown.
E Calculated based on average shares outstanding during the period.
F Fees and expenses of any underlying Fidelity Central Funds are not included in the Fund's expense ratio. The Fund indirectly bears its proportionate share of the expenses of any underlying Fidelity Central Funds.
G Amount does not include the portfolio activity of any underlying Fidelity Central Funds.
H Expense ratios reflect operating expenses of the class. Expenses before reductions do not reflect amounts reimbursed by the investment adviser or reductions from brokerage service arrangements or reductions from other expense offset arrangements and do not represent the amount paid by the class during periods when reimbursements or reductions occur. Expenses net of fee waivers reflect expenses after reimbursement by the investment adviser but prior to reductions from brokerage service arrangements or other expense offset arrangements. Expenses net of all reductions represent the net expenses paid by the class.
I Total distributions of $.19 per share is comprised of distributions from net investment income of $.148 and distributions from net realized gain of $.045 per share.
See accompanying notes which are an integral part of the financial statements.
Semiannual Report
Financial Highlights - Service Class 2
| Six months ended June 30, 2011 | Years ended December 31, |
| (Unaudited) | 2010 | 2009 | 2008 | 2007 | 2006 |
Selected Per-Share Data | | | | | | |
Net asset value, beginning of period | $ 14.36 | $ 12.51 | $ 9.57 | $ 15.34 | $ 13.42 | $ 12.81 |
Income from Investment Operations | | | | | | |
Net investment income (loss) E | .09 | .12 | .14 | .22 | .25 | .22 |
Net realized and unrealized gain (loss) | .56 | 1.88 | 2.97 | (5.75) | 2.21 | .62 |
Total from investment operations | .65 | 2.00 | 3.11 | (5.53) | 2.46 | .84 |
Distributions from net investment income | - | (.11) | (.15) | (.23) | (.54) | (.23) |
Distributions from net realized gain | - | (.05) | (.02) | (.01) | - | - |
Total distributions | - | (.15) I | (.17) | (.24) | (.54) | (.23) |
Net asset value, end of period | $ 15.01 | $ 14.36 | $ 12.51 | $ 9.57 | $ 15.34 | $ 13.42 |
Total ReturnB,C,D | 4.53% | 16.02% | 32.55% | (36.05)% | 18.68% | 6.64% |
Ratios to Average Net Assets F,H | | | | | | |
Expenses before reductions | 1.01% A | 1.02% | 1.06% | 1.01% | 1.02% | 1.05% |
Expenses net of fee waivers, if any | 1.01% A | 1.02% | 1.06% | 1.01% | 1.02% | 1.05% |
Expenses net of all reductions | 1.00% A | 1.00% | 1.05% | 1.01% | 1.01% | 1.02% |
Net investment income (loss) | 1.22% A | .91% | 1.29% | 1.62% | 1.70% | 1.73% |
Supplemental Data | | | | | | |
Net assets, end of period (000 omitted) | $ 6,848 | $ 6,046 | $ 8,139 | $ 6,545 | $ 8,622 | $ 6,205 |
Portfolio turnover rate G | 74% A | 68% | 126% | 110% | 132% | 233% |
A Annualized
B Total returns for periods of less than one year are not annualized.
C Total returns do not reflect charges attributable to your insurance company's separate account. Inclusion of these charges would reduce the total returns shown.
D Total returns would have been lower if certain expenses had not been reduced during the applicable periods shown.
E Calculated based on average shares outstanding during the period.
F Fees and expenses of any underlying Fidelity Central Funds are not included in the Fund's expense ratio. The Fund indirectly bears its proportionate share of the expenses of any underlying Fidelity Central Funds.
G Amount does not include the portfolio activity of any underlying Fidelity Central Funds.
H Expense ratios reflect operating expenses of the class. Expenses before reductions do not reflect amounts reimbursed by the investment adviser or reductions from brokerage service arrangements or reductions from other expense offset arrangements and do not represent the amount paid by the class during periods when reimbursements or reductions occur. Expenses net of fee waivers reflect expenses after reimbursement by the investment adviser but prior to reductions from brokerage service arrangements or other expense offset arrangements. Expenses net of all reductions represent the net expenses paid by the class.
I Total distributions of $.15 per share is comprised of distributions from net investment income of $.108 and distributions from net realized gain of $.045 per share.
Financial Highlights - Investor Class
| Six months ended June 30, 2011 | Years ended December 31, |
| (Unaudited) | 2010 | 2009 | 2008 | 2007 | 2006 |
Selected Per-Share Data | | | | | | |
Net asset value, beginning of period | $ 14.46 | $ 12.61 | $ 9.65 | $ 15.46 | $ 13.56 | $ 12.96 |
Income from Investment Operations | | | | | | |
Net investment income (loss) E | .11 | .15 | .16 | .24 | .27 | .24 |
Net realized and unrealized gain (loss) | .56 | 1.90 | 2.99 | (5.78) | 2.23 | .63 |
Total from investment operations | .67 | 2.05 | 3.15 | (5.54) | 2.50 | .87 |
Distributions from net investment income | - | (.15) | (.17) | (.26) | (.60) | (.27) |
Distributions from net realized gain | - | (.05) | (.02) | (.01) | - | - |
Total distributions | - | (.20) | (.19) | (.27) | (.60) | (.27) |
Net asset value, end of period | $ 15.13 | $ 14.46 | $ 12.61 | $ 9.65 | $ 15.46 | $ 13.56 |
Total Return B,C,D | 4.63% | 16.25% | 32.68% | (35.85)% | 18.78% | 6.80% |
Ratios to Average Net Assets F,H | | | | | | |
Expenses before reductions | .81% A | .83% | .89% | .83% | .86% | .92% |
Expenses net of fee waivers, if any | .81% A | .82% | .89% | .83% | .86% | .92% |
Expenses net of all reductions | .80% A | .81% | .87% | .83% | .86% | .89% |
Net investment income (loss) | 1.41% A | 1.11% | 1.47% | 1.81% | 1.86% | 1.86% |
Supplemental Data | | | | | | |
Net assets, end of period (000 omitted) | $ 40,934 | $ 33,627 | $ 26,307 | $ 20,137 | $ 16,370 | $ 6,882 |
Portfolio turnover rate G | 74% A | 68% | 126% | 110% | 132% | 233% |
A Annualized
B Total returns for periods of less than one year are not annualized.
C Total returns do not reflect charges attributable to your insurance company's separate account. Inclusion of these charges would reduce the total returns shown.
D Total returns would have been lower if certain expenses had not been reduced during the applicable periods shown.
E Calculated based on average shares outstanding during the period.
F Fees and expenses of any underlying Fidelity Central Funds are not included in the Fund's expense ratio. The Fund indirectly bears its proportionate share of the expenses of any underlying Fidelity Central Funds.
G Amount does not include the portfolio activity of any underlying Fidelity Central Funds.
H Expense ratios reflect operating expenses of the class. Expenses before reductions do not reflect amounts reimbursed by the investment adviser or reductions from brokerage service arrangements or reductions from other expense offset arrangements and do not represent the amount paid by the class during periods when reimbursements or reductions occur. Expenses net of fee waivers reflect expenses after reimbursement by the investment adviser but prior to reductions from brokerage service arrangements or other expense offset arrangements. Expenses net of all reductions represent the net expenses paid by the class.
See accompanying notes which are an integral part of the financial statements.
Semiannual Report
Notes to Financial Statements
For the period ended June 30, 2011 (Unaudited)
1. Organization.
VIP Asset Manager: Growth Portfolio (the Fund) is a fund of Variable Insurance Products Fund V (the Trust) and is authorized to issue an unlimited number of shares. The Trust is registered under the Investment Company Act of 1940, as amended (the 1940 Act), as an open-end management investment company organized as a Massachusetts business trust. Shares of the Fund may only be purchased by insurance companies for the purpose of funding variable annuity or variable life insurance contracts. The Fund offers the following classes of shares: Initial Class shares, Service Class shares, Service Class 2 shares and Investor Class shares. All classes have equal rights and voting privileges, except for matters affecting a single class. Investment income, realized and unrealized capital gains and losses, the common expenses of the Fund, and certain fund-level expense reductions, if any, are allocated on a pro-rata basis to each class based on the relative net assets of each class to the total net assets of the Fund. Each class differs with respect to transfer agent and distribution and service plan fees incurred. Certain expense reductions may also differ by class. The Fund's investments in emerging markets can be subject to social, economic, regulatory, and political uncertainties and can be extremely volatile.
2. Investments in Fidelity Central Funds.
The Fund invests in Fidelity Central Funds, which are open-end investment companies available only to other investment companies and accounts managed by Fidelity Management & Research Company (FMR) and its affiliates. The Fund's Schedule of Investments lists each of the Fidelity Central Funds held as of period end, if any, as an investment of the Fund, but does not include the underlying holdings of each Fidelity Central Fund. As an Investing Fund, the Fund indirectly bears its proportionate share of the expenses of the underlying Fidelity Central Funds.
Based on their investment objective, each Fidelity Central Fund may invest or participate in various investment vehicles or strategies that are similar to those of the Fund. These strategies are consistent with the investment objectives of the Fund and may involve certain economic risks which may cause a decline in value of each of the Fidelity Central Funds and thus a decline in the value of the Fund. The following summarizes the Fund's investment in each Fidelity Central Fund.
Fidelity Central Fund | Investment Manager | Investment Objective | Investment Practices |
Fidelity Commodity Strategy Central Fund | FMR Co., Inc. (FMRC) | Seeks to provide investment returns that correspond to the performance of the commodities market. | Investment in wholly-owned subsidiary organized under the laws of the Cayman Islands Futures Repurchase Agreements Swap Agreements |
Fidelity Emerging Markets Debt Central Fund | FMRC | Seeks high total return by normally investing in debt securities of issuers in emerging markets and other debt investments that are tied economically to emerging markets. | Foreign Securities Repurchase Agreements Restricted Securities |
Fidelity Emerging Markets Equity Central Fund | FMRC | Seeks capital appreciation by investing primarily in equity securities of issuers in emerging markets. | Delayed Delivery & When Issued Securities Foreign Securities Futures Repurchase Agreements Restricted Securities |
Fidelity International Equity Central Fund | FMRC | Seeks capital appreciation by investing primarily in non-U.S. based common stocks, including securities of issuers located in emerging markets. | Foreign Securities Repurchase Agreements Restricted Securities |
Fidelity Floating Rate Central Fund | FMRC | Seeks a high level of income by normally investing in floating rate loans and other floating rate securities. | Loans & Direct Debt Instruments Repurchase Agreements Restricted Securities |
Fidelity High Income Central Fund 1 | FMRC | Seeks a high level of income and may also seek capital appreciation by investing primarily in debt securities, preferred stocks, and convertible securities, with an emphasis on lower-quality debt securities. | Loans & Direct Debt Instruments Repurchase Agreements Restricted Securities |
VIP Investment Grade Central Fund | Fidelity Investments Money Management, Inc. (FIMM) | Seeks a high level of current income by normally investing in investment-grade debt securities and repurchase agreements. | Delayed Delivery & When Issued Securities Repurchase Agreements Restricted Securities Swap Agreements |
Fidelity Money Market Central Funds | FIMM | Seeks to obtain a high level of current income consistent with the preservation of capital and liquidity. | Short-term Investments |
Semiannual Report
Notes to Financial Statements (Unaudited) - continued
2. Investments in Fidelity Central Funds - continued
An unaudited holdings listing for the Fund, which presents direct holdings as well as the pro-rata share of any securities and other investments held indirectly through its investment in underlying non-money market Fidelity Central Funds, is available at advisor.fidelity.com. A complete unaudited list of holdings for each Fidelity Central Fund is available upon request or at the Securities and Exchange Commission (the SEC) web site at www.sec.gov. In addition, the financial statements of the Fidelity Central Funds which contain the significant accounting policies (including security valuation policies) of those funds, are available on the SEC web site or upon request.
3. Significant Accounting Policies.
The financial statements have been prepared in conformity with accounting principles generally accepted in the United States of America (GAAP), which require management to make certain estimates and assumptions at the date of the financial statements. Actual results could differ from those estimates. Subsequent events, if any, through the date that the financial statements were issued have been evaluated in the preparation of the financial statements. The following summarizes the significant accounting policies of the Fund:
Security Valuation. Investments are valued as of 4:00 p.m. Eastern time on the last calendar day of the period. The Fund uses independent pricing services approved by the Board of Trustees to value its investments. When current market prices or quotations are not readily available or reliable, valuations may be determined in good faith in accordance with procedures adopted by the Board of Trustees. Factors used in determining value may include market or security specific events. The frequency with which these procedures are used cannot be predicted and they may be utilized to a significant extent. The value used for net asset value (NAV) calculation under these procedures may differ from published prices for the same securities.
The Fund categorizes the inputs to valuation techniques used to value its investments into a disclosure hierarchy consisting of three levels as shown below:
Level 1 - quoted prices in active markets for identical investments
Level 2 - other significant observable inputs (including quoted prices for similar investments, interest rates, prepayment speeds, etc.)
Level 3 - unobservable inputs (including the Fund's own assumptions based on the best information available)
Changes in valuation techniques may result in transfers in or out of an assigned level within the disclosure hierarchy. The aggregate value of investments by input level, as of June 30, 2011, as well as a roll forward of Level 3 securities, is included at the end of the Fund's Schedule of Investments. Valuation techniques used to value the Fund's investments by major category are as follows:
Equity securities, including restricted securities, for which market quotations are readily available, are valued at the last reported sale price or official closing price as reported by an independent pricing service on the primary market or exchange on which they are traded and are categorized as Level 1 in the hierarchy. In the event there were no sales during the day or closing prices are not available, securities are valued at the last quoted bid price or may be valued using the last available price and are generally categorized as Level 2 in the hierarchy. For foreign equity securities, when significant market or security specific events arise, comparisons to the valuation of American Depositary Receipts (ADRs), futures contracts, Exchange-traded funds (ETFs) and certain indexes as well as quoted prices for similar securities are used and are categorized as Level 2 in the hierarchy in these circumstances. Utilizing these techniques may result in transfers between Level 1 and Level 2. For restricted equity securities and private placements where observable inputs are limited, assumptions about market activity and risk are used and are categorized as Level 3 in the hierarchy.
ETFs are valued at their last sale price or official closing price as reported by an independent pricing service on the primary market or exchange on which they are traded and are categorized as Level 1 in the hierarchy. In the event there were no sales during the day but the exchange reports a closing bid level, ETFs are valued at the closing bid and would be categorized as Level 1 in the hierarchy. In the event there was no closing bid, ETFs may be valued by another method that the Board of Trustees believes reflects fair value in accordance with the Board's fair value pricing policies and may be categorized as Level 2 in the hierarchy.
Futures contracts are valued at the settlement price established each day by the board of trade or exchange on which they are traded and are categorized as Level 1 in the hierarchy. Investments in open-end mutual funds, including the Fidelity Central Funds, are valued at their closing net asset value each business day and are categorized as Level 1 in the hierarchy.
Foreign Currency. The Fund may use foreign currency contracts to facilitate transactions in foreign-denominated securities. Gains and losses from these transactions may arise from changes in the value of the foreign currency or if the counterparties do not perform under the contracts' terms.
Foreign-denominated assets, including investment securities, and liabilities are translated into U.S. dollars at the exchange rate at period end. Purchases and sales of investment securities, income and dividends received and expenses denominated in foreign currencies are translated into U.S. dollars at the exchange rate in effect on the transaction date.
The effects of exchange rate fluctuations on investments are included with the net realized and unrealized gain (loss) on investment securities. Other foreign currency transactions resulting in realized and unrealized gain (loss) are disclosed separately.
Semiannual Report
3. Significant Accounting Policies - continued
Investment Transactions and Income. For financial reporting purposes, the Fund's investment holdings and NAV include trades executed through the end of the last business day of the period. The NAV per share for processing shareholder transactions is calculated as of the close of business of the New York Stock Exchange (NYSE), normally 4:00 p.m. Eastern time and includes trades executed through the end of the prior business day. Gains and losses on securities sold are determined on the basis of identified cost and may include proceeds received from litigation. Dividend income is recorded on the ex-dividend date, except for certain dividends from foreign securities where the ex-dividend date may have passed, which are recorded as soon as the Fund is informed of the ex-dividend date. Non-cash dividends included in dividend income, if any, are recorded at the fair market value of the securities received. Distributions received on securities that represent a return of capital or capital gain are recorded as a reduction of cost of investments and/or as a realized gain. The Fund estimates the components of distributions received that may be considered return of capital distributions or capital gain distributions. Interest income and distributions from the Fidelity Central Funds are accrued as earned. Interest income includes coupon interest and amortization of premium and accretion of discount on debt securities. Investment income is recorded net of foreign taxes withheld where recovery of such taxes is uncertain.
Expenses. Expenses directly attributable to a fund are charged to that fund. Expenses attributable to more than one fund are allocated among the respective funds on the basis of relative net assets or other appropriate methods. Expense estimates are accrued in the period to which they relate and adjustments are made when actual amounts are known.
Income Tax Information and Distributions to Shareholders. Each year, the Fund intends to qualify as a regulated investment company, including distributing substantially all of its taxable income and realized gains under Subchapter M of the Internal Revenue Code and filing its U.S. federal tax return. As a result, no provision for income taxes is required. A fund's federal tax return is subject to examination by the Internal Revenue Service (IRS) for a period of three years. Foreign taxes are provided for based on the Fund's understanding of the tax rules and rates that exist in the foreign markets in which it invests.
Distributions are declared and recorded on the ex-dividend date. Income dividends and capital gain distributions are declared separately for each class. Income and capital gain distributions are determined in accordance with income tax regulations, which may differ from GAAP.
Capital accounts within the financial statements are adjusted for permanent book-tax differences. These adjustments have no impact on net assets or the results of operations. Temporary book-tax differences will reverse in a subsequent period.
Book-tax differences are primarily due to the short-term gain distributions from the Fidelity Central Funds, in-kind transactions, futures transactions, foreign currency transactions, partnerships (including allocations from Fidelity Central Funds), capital loss carryforwards and losses deferred due to wash sales and excise tax regulations.
The federal tax cost of investment securities and unrealized appreciation (depreciation) as of period end were as follows:
Gross unrealized appreciation | $ 29,883,970 |
Gross unrealized depreciation | (7,834,684) |
Net unrealized appreciation (depreciation) on securities and other investments | $ 22,049,286 |
| |
Tax cost | $ 166,035,961 |
Under the recently enacted Regulated Investment Company Modernization Act of 2010 (the Act), the Fund will be permitted to carry forward capital losses incurred in taxable years beginning after December 22, 2010 for an unlimited period. However, any losses incurred during those future taxable years will be required to be utilized prior to any losses incurred in pre-enactment taxable years, which generally expire after eight years from when they are incurred. Additionally, post-enactment capital losses that are carried forward will retain their character as either short-term or long-term capital losses rather than being considered all short-term as under previous law. The Fund's first fiscal year end subject to the Act will be December 31, 2011.
New Accounting Pronouncement. In May 2011, the Financial Accounting Standards Board issued Accounting Standard Update No. 2011-04, Fair Value Measurement (Topic 820) - Amendments to Achieve Common Fair Value Measurement and Disclosure Requirements in U.S. GAAP and IFRSs. The update changes the wording used to describe the requirements in GAAP for measuring fair value and for disclosing information about fair value measurements. The update is effective during interim and annual periods beginning after December 15, 2011. Management is currently evaluating the impact of the update's adoption on the Fund's financial statement disclosures.
4. Operating Policies.
Restricted Securities. The Fund may invest in securities that are subject to legal or contractual restrictions on resale. These securities generally may be resold in transactions exempt from registration or to the public if the securities are registered. Disposal of these securities may involve time-consuming negotiations and expense, and prompt sale at an acceptable price may be difficult. Information regarding restricted securities is included at the end of the Fund's Schedule of Investments.
Semiannual Report
Notes to Financial Statements (Unaudited) - continued
5. Derivative Instruments.
Risk Exposures and the Use of Derivative Instruments. The Fund used derivative instruments (derivatives), including futures contracts, in order to meet its investment objectives. The strategy is to use derivatives to increase returns and to manage exposure to certain risks as defined below. The success of any strategy involving derivatives depends on analysis of numerous economic factors, and if the strategies for investment do not work as intended, the Fund may not achieve its objectives.
The Fund's use of derivatives increased or decreased its exposure to the following risk:
Equity Risk | Equity risk relates to the fluctuations in the value of financial instruments as a result of changes in market prices (other than those arising from interest rate risk or foreign exchange risk), whether caused by factors specific to an individual investment, its issuer, or all factors affecting all instruments traded in a market or market segment. |
The Fund is also exposed to additional risks from investing in derivatives, such as liquidity risk and counterparty credit risk. Liquidity risk is the risk that the Fund will be unable to sell the derivative in the open market in a timely manner. Counterparty credit risk is the risk that the counterparty will not be able to fulfill its obligation to the Fund. The Fund's maximum risk of loss from counterparty credit risk is generally the aggregate unrealized appreciation and unpaid counterparty payments in excess of any collateral pledged by the counterparty to the Fund. Counterparty risk related to exchange-traded futures contracts is minimal because of the protection provided by the exchange on which they trade. Derivatives involve, to varying degrees, risk of loss in excess of the amounts recognized in the Statement of Assets and Liabilities.
Futures Contracts. A futures contract is an agreement between two parties to buy or sell a specified underlying instrument for a fixed price at a specified future date. The Fund used futures contracts to manage its exposure to the stock market.
Upon entering into a futures contract, a fund is required to deposit either cash or securities (initial margin) with a clearing broker in an amount equal to a certain percentage of the face value of the contract. Futures contracts are marked-to-market daily and subsequent payments (variation margin) are made or received by a fund depending on the daily fluctuations in the value of the futures contracts and are recorded as unrealized appreciation or (depreciation). Realized gain or (loss) is recorded upon the expiration or closing of a futures contract.
The underlying face amount at value of open futures contracts at period end is shown in the Schedule of Investments under the caption "Futures Contracts." This amount reflects each contract's exposure to the underlying instrument at period end and is representative of activity for the period. The receivable and/or payable for the variation margin are reflected in the Statement of Assets and Liabilities.
Certain risks arise upon entering into futures contracts, including the risk that an illiquid market limits the ability to close out a futures contract prior to settlement date.
During the period the Fund recognized net realized gain (loss) of $174,016 and a change in net unrealized appreciation (depreciation) of ($63,558) related to its investment in futures contracts. These amounts are included in the Statement of Operations.
6. Purchases and Sales of Investments.
Purchases and sales of securities (including the Equity and Fixed-Income Central Funds), other than short-term securities, aggregated $68,021,459 and $69,838,543, respectively.
7. Fees and Other Transactions with Affiliates.
Management Fee. FMR and its affiliates provide the Fund with investment management related services for which the Fund pays a monthly management fee. The management fee is the sum of an individual fund fee rate that is based on an annual rate of .30% of the Fund's average net assets and a group fee rate that averaged .26% during the period. The group fee rate is based upon the average net assets of all the mutual funds advised by FMR. The group fee rate decreases as assets under management increase and increases as assets under management decrease. For the period, the total annualized management fee rate was .56% of the Fund's average net assets.
The Fund invests in the Fidelity Commodity Strategy Central Fund, which in turn invests in a wholly-owned subsidiary that invests in commodity-linked derivative instruments. FMR has contractually agreed to waive the Fund's management fee in an amount equal to its proportionate share of the management fee paid to FMR by the subsidiary based on the Fund's proportionate ownership of the Fidelity Commodity Strategy Central Fund. Fees waived totaled $825 for the period and is reflected in Expense reductions on the Statement of Operations.
Semiannual Report
7. Fees and Other Transactions with Affiliates - continued
Distribution and Service Plan Fees. In accordance with Rule 12b-1 of the 1940 Act, the Fund has adopted separate 12b-1 Plans for each Service Class of shares. Each Service Class pays Fidelity Distributors Corporation (FDC), an affiliate of FMR, a service fee. For the period, the service fee is based on an annual rate of .10% of Service Class' average net assets and .25% of Service Class 2's average net assets.
For the period, total fees, all of which were re-allowed to insurance companies for the distribution of shares and providing shareholder support services were as follows:
Service Class | $ 1,985 |
Service Class 2 | 8,269 |
| $ 10,254 |
Transfer Agent Fees. Fidelity Investments Institutional Operations Company, Inc. (FIIOC), an affiliate of FMR, is the Fund's transfer, dividend disbursing, and shareholder servicing agent. FIIOC receives an asset-based fee with respect to each class. Each class (with the exception of Investor Class) pays a transfer agent fee, excluding out of pocket expenses, equal to an annual rate of .07% of average net assets. Investor Class pays a monthly asset-based transfer agent fee of .15% of average net assets. In addition, FIIOC receives an asset-based fee of .0045% of average net assets for typesetting, printing and mailing of shareholder reports, except proxy statements. For the period, transfer agent fees for each class, including printing and out of pocket expenses, were as follows:
Initial Class | $ 53,024 |
Service Class | 1,555 |
Service Class 2 | 3,658 |
Investor Class | 30,123 |
| $ 88,360 |
Accounting and Security Lending Fees. Fidelity Service Company, Inc. (FSC), an affiliate of FMR, maintains the Fund's accounting records. The accounting fee is based on the level of average net assets for the month. Under a separate contract, FSC administers the security lending program. The security lending fee is based on the number and duration of lending transactions.
Brokerage Commissions. The Fund placed a portion of its portfolio transactions with brokerage firms which are affiliates of the investment adviser. The commissions paid to these affiliated firms were $736 for the period.
8. Committed Line of Credit.
The Fund participates with other funds managed by FMR or an affiliate in a $4.0 billion credit facility (the "line of credit") to be utilized for temporary or emergency purposes to fund shareholder redemptions or for other short-term liquidity purposes. The Fund has agreed to pay commitment fees on its pro-rata portion of the line of credit, which amounted to $315 and is reflected in Miscellaneous expenses on the Statement of Operations. During the period, there were no borrowings on this line of credit.
9. Security Lending.
The Fund lends portfolio securities through a lending agent from time to time in order to earn additional income. The lending agent may loan securities to certain qualified borrowers, including Fidelity Capital Markets (FCM), a broker-dealer affiliated with the Fund. On the settlement date of the loan, the Fund receives collateral (in the form of U.S. Treasury obligations, letters of credit and/or cash) against the loaned securities and maintains collateral in an amount not less than 100% of the market value of the loaned securities during the period of the loan. The market value of the loaned securities is determined at the close of business of the Fund and any additional required collateral is delivered to the Fund on the next business day. If the borrower defaults on its obligation to return the securities loaned because of insolvency or other reasons, a fund could experience delays and costs in recovering the securities loaned or in gaining access to the collateral. Any cash collateral received is invested in the Fidelity Securities Lending Cash Central Fund. The value of loaned securities and cash collateral at period end are disclosed on the Fund's Statement of Assets and Liabilities. Security lending income represents the income earned on investing cash collateral, less rebates paid to borrowers and lending agent fees associated with the loan, plus any premium payments received for lending certain types of securities. Security lending income is presented in the Statement of Operations as a component of income from Fidelity Central Funds. Total security lending income during the period amounted to $15,872. During the period, there were no securities loaned to FCM.
10. Expense Reductions.
Many of the brokers with whom FMR places trades on behalf of the Fund provided services to the Fund in addition to trade execution. These services included payments of certain expenses on behalf of the Fund totaling $9,459 for the period.
Semiannual Report
Notes to Financial Statements (Unaudited) - continued
11. Distributions to Shareholders.
Distributions to shareholders of each class were as follows:
| Six months ended
June 30, 2011 | Year ended
December 31, 2010 |
From net investment income | | |
Initial Class | $ - | $ 1,524,495 |
Service Class | - | 40,585 |
Service Class 2 | - | 44,899 |
Investor Class | - | 347,353 |
Total | $ - | $ 1,957,332 |
From net realized gain | | |
Initial Class | $ - | $ 423,471 |
Service Class | - | 12,340 |
Service Class 2 | - | 18,708 |
Investor Class | - | 102,835 |
Total | $ - | $ 557,354 |
12. Share Transactions.
Transactions for each class of shares were as follows:
| Shares | Dollars |
| Six months ended June 30, 2011 | Year ended
December 31, 2010 | Six months ended June 30, 2011 | Year ended
December 31, 2010 |
Initial Class | | | | |
Shares sold | 208,663 | 314,056 | $ 3,126,954 | $ 4,175,708 |
Reinvestment of distributions | - | 135,558 | - | 1,947,966 |
Shares redeemed | (792,783) | (1,723,443) | (11,877,901) | (22,677,836) |
Net increase (decrease) | (584,120) | (1,273,829) | $ (8,750,947) | $ (16,554,162) |
Service Class | | | | |
Shares sold | 8,736 | 27,481 | $ 128,086 | $ 366,364 |
Reinvestment of distributions | - | 3,706 | - | 52,925 |
Shares redeemed | (32,409) | (59,096) | (479,718) | (772,171) |
Net increase (decrease) | (23,673) | (27,909) | $ (351,632) | $ (352,882) |
Service Class 2 | | | | |
Shares sold | 104,039 | 229,882 | $ 1,542,989 | $ 3,022,061 |
Reinvestment of distributions | - | 4,473 | - | 63,607 |
Shares redeemed | (68,616) | (463,914) | (1,004,736) | (6,116,111) |
Net increase (decrease) | 35,423 | (229,559) | $ 538,253 | $ (3,030,443) |
Investor Class | | | | |
Shares sold | 540,501 | 645,314 | $ 8,116,714 | $ 8,630,814 |
Reinvestment of distributions | - | 31,438 | - | 450,188 |
Shares redeemed | (159,332) | (437,500) | (2,377,844) | (5,614,241) |
Net increase (decrease) | 381,169 | 239,252 | $ 5,738,870 | $ 3,466,761 |
13. Other.
The Fund's organizational documents provide former and current trustees and officers with a limited indemnification against liabilities arising in connection with the performance of their duties to the Fund. In the normal course of business, the Fund may also enter into contracts that provide general indemnifications. The Fund's maximum exposure under these arrangements is unknown as this would be dependent on future claims that may be made against the Fund. The risk of material loss from such claims is considered remote.
At the end of the period, FMR or its affiliates were the owners of record of 77% of the total outstanding shares of the Fund.
Semiannual Report
Investment Adviser
Fidelity Management & Research Company
Boston, MA
Investment Sub-Advisers
FMR Co., Inc.
Fidelity Management & Research (U.K.) Inc.
Fidelity Management & Research (Hong Kong) Limited
Fidelity Management & Research (Japan) Inc.
Fidelity Investments Money Management, Inc.
General Distributor
Fidelity Distributors Corporation
Boston, MA
Transfer and Service Agents
Fidelity Investments Institutional Operations Company, Inc.
Boston, MA
Fidelity Service Company, Inc.
Boston, MA
Custodian
JPMorgan Chase Bank
New York, NY
VIPAMG-SANN-0811
1.705700.113
Fidelity® Variable Insurance Products:
Freedom Funds -
Income, 2005, 2010, 2015, 2020, 2025, 2030, 2035, 2040, 2045, 2050
Semiannual Report
June 30, 2011
(2_fidelity_logos) (Registered_Trademark)
Contents
To view a fund's proxy voting guidelines and proxy voting record for the 12-month period ended June 30, visit http://www.fidelity.com/proxyvotingresults or visit the Securities and Exchange Commission's (SEC) web site at http://www.sec.gov. You may also call 1-877-208-0098 to request a free copy of the proxy voting guidelines.
Fidelity Variable Insurance Products are separate account options which are purchased through a variable insurance contract.
Standard & Poor's, S&P and S&P 500 are registered service marks of The McGraw-Hill Companies, Inc. and have been licensed for use by Fidelity Distributors Corporation.
Other third party marks appearing herein are the property of their respective owners.
All other marks appearing herein are registered or unregistered trademarks or service marks of FMR LLC or an affiliated company.
Semiannual Report
This report and the financial statements contained herein are submitted for the general information of the shareholders of the funds. This report is not authorized for distribution to prospective investors in the funds unless preceded or accompanied by an effective prospectus.
A fund files its complete schedule of portfolio holdings with the SEC for the first and third quarters of each fiscal year on Form N-Q. Forms N-Q are available on the SEC's web site at http://www.sec.gov. A fund's Forms N-Q may be reviewed and copied at the SEC's Public Reference Room in Washington, DC. Information regarding the operation of the SEC's Public Reference Room may be obtained by calling 1-800-SEC-0330. For a complete list of a fund's portfolio holdings, view the most recent holdings listing, semiannual report, or annual report on Fidelity's web site at http://www.fidelity.com, http://www.advisor.fidelity.com, or http://www.401k.com, as applicable.
NOT FDIC INSURED • MAY LOSE VALUE • NO BANK GUARANTEE
Neither the funds nor Fidelity Distributors Corporation is a bank.
Semiannual Report
As a shareholder of a Fund, you incur two types of costs: (1) transaction costs, and (2) ongoing costs, including distribution and/or service (12b-1) fees and other Fund expenses. This Example is intended to help you understand your ongoing costs (in dollars) of investing in the Funds and to compare these costs with the ongoing costs of investing in other mutual funds.
The Example is based on an investment of $1,000 invested at the beginning of the period and held for the entire period (January 1, 2011 to June 30, 2011).
Actual Expenses
The first line of the accompanying table for each class of each fund provides information about actual account values and actual expenses. You may use the information in this line, together with the amount you invested, to estimate the expenses that you paid over the period. Simply divide your account value by $1,000.00 (for example, an $8,600 account value divided by $1,000.00 = 8.6), then multiply the result by the number in the first line for a class of the fund under the heading entitled "Expenses Paid During Period" to estimate the expenses you paid on your account during this period. The estimate of expenses does not include any fees or other expenses of any variable annuity or variable life insurance product. If they were, the estimate of expenses you paid during the period would be higher, and your ending account value would be lower. In addition, each Fund, as a shareholder in underlying Fidelity Funds, will indirectly bear its pro-rata share of the fees and expenses incurred by the underlying Fidelity Funds. These fees and expenses are not included in each Fund's annualized expense ratio used to calculate the expense estimates in the table below.
Hypothetical Example for Comparison Purposes
The second line of the accompanying table for each class of each fund provides information about hypothetical account values and hypothetical expenses based on a Class' actual expense ratio and an assumed rate of return of 5% per year before expenses, which is not the Class' actual return. The hypothetical account values and expenses may not be used to estimate the actual ending account balance or expenses you paid for the period. You may use this information to compare the ongoing costs of investing in the Fund and other funds. To do so, compare this 5% hypothetical example with the 5% hypothetical examples that appear in the shareholder reports of the other funds. The estimate of expenses does not include any fees or other expenses of any variable annuity or variable life insurance product. If they were, the estimate of expenses you paid during the period would be higher, and your ending account value would be lower. In addition, each Fund, as a shareholder in underlying Fidelity Funds, will indirectly bear its pro-rata share of the fees and expenses incurred by the underlying Fidelity Funds. These fees and expenses are not included in each Fund's annualized expense ratio used to calculate the expense estimates in the table below.
Please note that the expenses shown in the table are meant to highlight your ongoing costs only and do not reflect any transaction costs. Therefore, the second line of the table is useful in comparing ongoing costs only, and will not help you determine the relative total costs of owning different funds.
| Annualized
Expense Ratio | Beginning
Account Value
January 1, 2011 | Ending
Account Value
June 30, 2011 | Expenses Paid
During Period*
January 1, 2011 to June 30, 2011 |
VIP Freedom Income | | | | |
Initial Class | .00% | | | |
Actual | | $ 1,000.00 | $ 1,025.30 | $ .00 |
HypotheticalA | | $ 1,000.00 | $ 1,024.79 | $ .00 |
Service Class | .10% | | | |
Actual | | $ 1,000.00 | $ 1,024.30 | $ .50 |
HypotheticalA | | $ 1,000.00 | $ 1,024.30 | $ .50 |
Service Class 2 | .25% | | | |
Actual | | $ 1,000.00 | $ 1,023.40 | $ 1.25 |
HypotheticalA | | $ 1,000.00 | $ 1,023.55 | $ 1.25 |
VIP Freedom 2005 | | | | |
Initial Class | .00% | | | |
Actual | | $ 1,000.00 | $ 1,035.70 | $ .00 |
HypotheticalA | | $ 1,000.00 | $ 1,024.79 | $ .00 |
Service Class | .10% | | | |
Actual | | $ 1,000.00 | $ 1,034.70 | $ .50 |
HypotheticalA | | $ 1,000.00 | $ 1,024.30 | $ .50 |
Service Class 2 | .25% | | | |
Actual | | $ 1,000.00 | $ 1,034.70 | $ 1.26 |
HypotheticalA | | $ 1,000.00 | $ 1,023.55 | $ 1.25 |
| Annualized
Expense Ratio | Beginning
Account Value
January 1, 2011 | Ending
Account Value
June 30, 2011 | Expenses Paid
During Period*
January 1, 2011 to June 30, 2011 |
VIP Freedom 2010 | | | | |
Initial Class | .00% | | | |
Actual | | $ 1,000.00 | $ 1,040.10 | $ .00 |
HypotheticalA | | $ 1,000.00 | $ 1,024.79 | $ .00 |
Service Class | .10% | | | |
Actual | | $ 1,000.00 | $ 1,040.10 | $ .51 |
HypotheticalA | | $ 1,000.00 | $ 1,024.30 | $ .50 |
Service Class 2 | .25% | | | |
Actual | | $ 1,000.00 | $ 1,039.30 | $ 1.26 |
HypotheticalA | | $ 1,000.00 | $ 1,023.55 | $ 1.25 |
VIP Freedom 2015 | | | | |
Initial Class | .00% | | | |
Actual | | $ 1,000.00 | $ 1,041.10 | $ .00 |
HypotheticalA | | $ 1,000.00 | $ 1,024.79 | $ .00 |
Service Class | .10% | | | |
Actual | | $ 1,000.00 | $ 1,041.20 | $ .51 |
HypotheticalA | | $ 1,000.00 | $ 1,024.30 | $ .50 |
Service Class 2 | .25% | | | |
Actual | | $ 1,000.00 | $ 1,040.40 | $ 1.26 |
HypotheticalA | | $ 1,000.00 | $ 1,023.55 | $ 1.25 |
VIP Freedom 2020 | | | | |
Initial Class | .00% | | | |
Actual | | $ 1,000.00 | $ 1,046.30 | $ .00 |
HypotheticalA | | $ 1,000.00 | $ 1,024.79 | $ .00 |
Service Class | .10% | | | |
Actual | | $ 1,000.00 | $ 1,045.40 | $ .51 |
HypotheticalA | | $ 1,000.00 | $ 1,024.30 | $ .50 |
Service Class 2 | .25% | | | |
Actual | | $ 1,000.00 | $ 1,044.50 | $ 1.27 |
HypotheticalA | | $ 1,000.00 | $ 1,023.55 | $ 1.25 |
VIP Freedom 2025 | | | | |
Initial Class | .00% | | | |
Actual | | $ 1,000.00 | $ 1,049.60 | $ .00 |
HypotheticalA | | $ 1,000.00 | $ 1,024.79 | $ .00 |
Service Class | .10% | | | |
Actual | | $ 1,000.00 | $ 1,048.60 | $ .51 |
HypotheticalA | | $ 1,000.00 | $ 1,024.30 | $ .50 |
Service Class 2 | .25% | | | |
Actual | | $ 1,000.00 | $ 1,047.90 | $ 1.27 |
HypotheticalA | | $ 1,000.00 | $ 1,023.55 | $ 1.25 |
VIP Freedom 2030 | | | | |
Initial Class | .00% | | | |
Actual | | $ 1,000.00 | $ 1,050.90 | $ .00 |
HypotheticalA | | $ 1,000.00 | $ 1,024.79 | $ .00 |
Service Class | .10% | | | |
Actual | | $ 1,000.00 | $ 1,050.00 | $ .51 |
HypotheticalA | | $ 1,000.00 | $ 1,024.30 | $ .50 |
Service Class 2 | .25% | | | |
Actual | | $ 1,000.00 | $ 1,049.10 | $ 1.27 |
HypotheticalA | | $ 1,000.00 | $ 1,023.55 | $ 1.25 |
| Annualized
Expense Ratio | Beginning
Account Value
January 1, 2011 | Ending
Account Value
June 30, 2011 | Expenses Paid
During Period*
January 1, 2011 to June 30, 2011 |
VIP Freedom 2035 | | | | |
Initial Class | .00% | | | |
Actual | | $ 1,000.00 | $ 1,051.60 | $ .00 |
HypotheticalA | | $ 1,000.00 | $ 1,024.79 | $ .00 |
Service Class | .10% | | | |
Actual | | $ 1,000.00 | $ 1,051.60 | $ .51 |
HypotheticalA | | $ 1,000.00 | $ 1,024.30 | $ .50 |
Service Class 2 | .25% | | | |
Actual | | $ 1,000.00 | $ 1,051.00 | $ 1.27 |
HypotheticalA | | $ 1,000.00 | $ 1,023.55 | $ 1.25 |
VIP Freedom 2040 | | | | |
Initial Class | .00% | | | |
Actual | | $ 1,000.00 | $ 1,052.80 | $ .00 |
HypotheticalA | | $ 1,000.00 | $ 1,024.79 | $ .00 |
Service Class | .10% | | | |
Actual | | $ 1,000.00 | $ 1,052.10 | $ .51 |
HypotheticalA | | $ 1,000.00 | $ 1,024.30 | $ .50 |
Service Class 2 | .25% | | | |
Actual | | $ 1,000.00 | $ 1,050.60 | $ 1.27 |
HypotheticalA | | $ 1,000.00 | $ 1,023.55 | $ 1.25 |
VIP Freedom 2045 | | | | |
Initial Class | .00% | | | |
Actual | | $ 1,000.00 | $ 1,053.20 | $ .00 |
HypotheticalA | | $ 1,000.00 | $ 1,024.79 | $ .00 |
Service Class | .10% | | | |
Actual | | $ 1,000.00 | $ 1,052.50 | $ .51 |
HypotheticalA | | $ 1,000.00 | $ 1,024.30 | $ .50 |
Service Class 2 | .25% | | | |
Actual | | $ 1,000.00 | $ 1,051.80 | $ 1.27 |
HypotheticalA | | $ 1,000.00 | $ 1,023.55 | $ 1.25 |
VIP Freedom 2050 | | | | |
Initial Class | .00% | | | |
Actual | | $ 1,000.00 | $ 1,053.10 | $ .00 |
HypotheticalA | | $ 1,000.00 | $ 1,024.79 | $ .00 |
Service Class | .10% | | | |
Actual | | $ 1,000.00 | $ 1,053.10 | $ .51 |
HypotheticalA | | $ 1,000.00 | $ 1,024.30 | $ .50 |
Service Class 2 | .25% | | | |
Actual | | $ 1,000.00 | $ 1,052.50 | $ 1.27 |
HypotheticalA | | $ 1,000.00 | $ 1,023.55 | $ 1.25 |
A 5% return per year before expenses
* Expenses are equal to each Class' annualized expense ratio, multiplied by the average account value over the period, multiplied by 181/ 365 (to reflect the one-half year period). The fees and expenses of the underlying Fidelity Funds in which the Fund invests are not included in each class' annualized expense ratio.
Semiannual Report
VIP Freedom Income Portfolio
Investment Changes (Unaudited)
Fund Holdings as of June 30, 2011 |
| % of fund's
net assets | % of fund's net assets
6 months ago |
Domestic Equity Funds | | |
VIP Contrafund Portfolio Initial Class | 2.4 | 2.5 |
VIP Equity-Income Portfolio Initial Class | 2.8 | 2.9 |
VIP Growth & Income Portfolio Initial Class | 2.8 | 2.9 |
VIP Growth Portfolio Initial Class | 2.9 | 2.9 |
VIP Mid Cap Portfolio Initial Class | 1.0 | 1.0 |
VIP Value Portfolio Initial Class | 2.4 | 2.5 |
VIP Value Strategies Portfolio Initial Class | 1.0 | 1.1 |
| 15.3 | 15.8 |
Developed International Equity Funds | | |
VIP Overseas Portfolio Initial Class | 4.5 | 4.6 |
Emerging Markets Equity Funds | | |
VIP Emerging Markets Portfolio Initial Class | 0.8 | 0.7 |
High Yield Bond Funds | | |
VIP High Income Portfolio Initial Class | 5.0 | 5.0 |
Investment Grade Bond Funds | | |
VIP Investment Grade Bond Portfolio Initial Class | 34.7 | 34.2 |
Short-Term Funds | | |
VIP Money Market Portfolio Initial Class | 39.8 | 39.6 |
Net Other Assets (Liabilities) | (0.1) | 0.1 |
| 100.0 | 100.0 |
Asset Allocation (% of fund's net assets) |
Current |
 | Domestic Equity Funds | 15.3% | |
 | Developed International Equity Funds | 4.5% | |
 | Emerging Markets Equity Funds | 0.8% | |
 | High Yield Bond Funds | 5.0% | |
 | Investment Grade Bond Funds | 34.7% | |
 | Short-Term Funds | 39.8% | |
 | Net Other Assets† | (0.1)% | |

Six months ago |
| Domestic Equity Funds | 15.8% | |
| Developed International Equity Funds | 4.6% | |
| Emerging Markets Equity Funds | 0.7% | |
| High Yield Bond Funds | 5.0% | |
| Investment Grade Bond Funds | 34.2% | |
| Short-Term Funds | 39.6% | |
| Net Other Assets | 0.1% | |

Expected |
| Domestic Equity Funds | 14.6% | |
| Developed International Equity Funds | 4.6% | |
| Emerging Markets Equity Funds | 0.8% | |
| High Yield Bond Funds | 5.0% | |
| Investment Grade Bond Funds | 35.0% | |
| Short-Term Funds | 40.0% | |

The six months ago allocation is based on the fund's holdings as of December 31, 2010. The current allocation is based on the fund's holdings as of June 30, 2011. The expected allocation represents the fund's anticipated allocation at December 31, 2011. |
† Net Other Assets are not included in the pie chart. |
Semiannual Report
VIP Freedom Income Portfolio
Investments June 30, 2011 (Unaudited)
Showing Percentage of Net Assets
Domestic Equity Funds - 15.3% |
| Shares | | Value |
Domestic Equity Funds - 15.3% |
VIP Contrafund Portfolio Initial Class | 20,259 | | $ 508,902 |
VIP Equity-Income Portfolio Initial Class | 29,273 | | 592,770 |
VIP Growth & Income Portfolio Initial Class | 44,807 | | 591,459 |
VIP Growth Portfolio Initial Class | 14,999 | | 603,563 |
VIP Mid Cap Portfolio Initial Class | 6,252 | | 206,326 |
VIP Value Portfolio Initial Class | 43,819 | | 507,866 |
VIP Value Strategies Portfolio Initial Class | 20,564 | | 212,832 |
TOTAL DOMESTIC EQUITY FUNDS (Cost $3,367,708) | 3,223,718 |
International Equity Funds - 5.3% |
| | | |
Developed International Equity Funds - 4.5% |
VIP Overseas Portfolio Initial Class | 54,489 | | 962,278 |
Emerging Markets Equity Funds - 0.8% |
VIP Emerging Markets Portfolio Initial Class | 16,665 | | 164,648 |
TOTAL INTERNATIONAL EQUITY FUNDS (Cost $922,092) | 1,126,926 |
Bond Funds - 39.7% |
| Shares | | Value |
High Yield Bond Funds - 5.0% |
VIP High Income Portfolio Initial Class | 181,018 | | $ 1,053,527 |
Investment Grade Bond Funds - 34.7% |
VIP Investment Grade Bond Portfolio Initial Class | 564,016 | | 7,332,203 |
TOTAL BOND FUNDS (Cost $8,132,673) | 8,385,730 |
Short-Term Funds - 39.8% |
| | | |
VIP Money Market Portfolio Initial Class
(Cost $8,406,615) | 8,406,615 | | 8,406,615 |
TOTAL INVESTMENT PORTFOLIO - 100.1% (Cost $20,829,088) | | 21,142,989 |
NET OTHER ASSETS (LIABILITIES) - (0.1)% | | (21,498) |
NET ASSETS - 100% | $ 21,121,491 |
Other Information |
All investments are categorized as Level 1 under the Fair Value Hierarchy. The inputs or methodology used for valuing securities may not be an indication of the risk associated with investing in those securities. For more information on valuation inputs, please refer to the Security Valuation section in the accompanying Notes to Financial Statements. |
See accompanying notes which are an integral part of the financial statements.
Semiannual Report
VIP Freedom Income Portfolio
Statement of Assets and Liabilities
| June 30, 2011 (Unaudited) |
| | |
Assets | | |
Investment in securities, at value (cost $20,829,088) - See accompanying schedule | | $ 21,142,989 |
Receivable for investments sold | | 76,288 |
Receivable for fund shares sold | | 322,596 |
Total assets | | 21,541,873 |
| | |
Liabilities | | |
Payable to custodian bank | $ 152 | |
Payable for investments purchased | 321,018 | |
Payable for fund shares redeemed | 97,513 | |
Distribution and service plan fees payable | 1,699 | |
Total liabilities | | 420,382 |
| | |
Net Assets | | $ 21,121,491 |
Net Assets consist of: | | |
Paid in capital | | $ 20,769,749 |
Accumulated net investment loss | | (1,003) |
Accumulated undistributed net realized gain (loss) on investments | | 38,844 |
Net unrealized appreciation (depreciation) on investments | | 313,901 |
Net Assets | | $ 21,121,491 |
| | |
Initial Class:
Net Asset Value, offering price and redemption price per share ($11,240,638 ÷ 1,067,934 shares) | | $ 10.53 |
| | |
Service Class:
Net Asset Value, offering price and redemption price per share ($2,497,016 ÷ 237,102 shares) | | $ 10.53 |
| | |
Service Class 2:
Net Asset Value, offering price and redemption price per share ($7,383,837 ÷ 704,554 shares) | | $ 10.48 |
Statement of Operations
Six months ended June 30, 2011 (Unaudited) |
| | |
Investment Income | | |
Income distributions from underlying funds | | $ 8,646 |
| | |
Expenses | | |
Distribution and service plan fees | $ 9,649 | |
Independent trustees' compensation | 35 | |
Total expenses before reductions | 9,684 | |
Expense reductions | (35) | 9,649 |
Net investment income (loss) | | (1,003) |
Realized and Unrealized Gain (Loss) Realized gain (loss) on sale of underlying fund shares | 30,683 | |
Capital gain distributions from underlying funds | 109,416 | |
Total net realized gain (loss) | | 140,099 |
Change in net unrealized appreciation (depreciation) on underlying funds | | 320,119 |
Net gain (loss) | | 460,218 |
Net increase (decrease) in net assets resulting from operations | | $ 459,215 |
See accompanying notes which are an integral part of the financial statements.
Semiannual Report
Statement of Changes in Net Assets
| Six months ended
June 30, 2011
(Unaudited) | Year ended
December 31,
2010 |
Increase (Decrease) in Net Assets | | |
Operations | | |
Net investment income (loss) | $ (1,003) | $ 324,248 |
Net realized gain (loss) | 140,099 | 453,688 |
Change in net unrealized appreciation (depreciation) | 320,119 | 547,661 |
Net increase (decrease) in net assets resulting from operations | 459,215 | 1,325,597 |
Distributions to shareholders from net investment income | - | (329,236) |
Distributions to shareholders from net realized gain | - | (476,604) |
Total distributions | - | (805,840) |
Share transactions - net increase (decrease) | 2,011,786 | (1,464,915) |
Total increase (decrease) in net assets | 2,471,001 | (945,158) |
| | |
Net Assets | | |
Beginning of period | 18,650,490 | 19,595,648 |
End of period (including accumulated net investment loss of $1,003 and undistributed net investment income of $0, respectively) | $ 21,121,491 | $ 18,650,490 |
Financial Highlights - Initial Class
| Six months ended
June 30, 2011 | Years ended December 31, |
| (Unaudited) | 2010 | 2009 | 2008 | 2007 | 2006 |
Selected Per-Share Data | | | | | | |
Net asset value, beginning of period | $ 10.27 | $ 10.00 | $ 9.14 | $ 10.80 | $ 10.71 | $ 10.36 |
Income from Investment Operations | | | | | | |
Net investment income (loss) E | - I | .19 | .39 | .36 | .43 | .40 |
Net realized and unrealized gain (loss) | .26 | .56 | .96 | (1.48) | .22 | .32 |
Total from investment operations | .26 | .75 | 1.35 | (1.12) | .65 | .72 |
Distributions from net investment income | - | (.20) | (.35) | (.37) | (.44) | (.32) |
Distributions from net realized gain | - | (.28) | (.15) | (.17) | (.12) | (.05) |
Total distributions | - | (.48) | (.49) J | (.54) | (.56) | (.37) |
Net asset value, end of period | $ 10.53 | $ 10.27 | $ 10.00 | $ 9.14 | $ 10.80 | $ 10.71 |
Total Return B, C, D | 2.53% | 7.49% | 14.95% | (10.45)% | 6.10% | 6.94% |
Ratios to Average Net Assets F, H | | | | | | |
Expenses before reductions G | .00% A | .00% | .00% | .00% | .00% | .00% |
Expenses net of fee waivers, if any | .00% A | .00% | .00% | .00% | .00% | .00% |
Expenses net of all reductions | .00% A | .00% | .00% | .00% | .00% | .00% |
Net investment income (loss) | .09% A | 1.88% | 4.00% | 3.50% | 3.93% | 3.75% |
Supplemental Data | | | | | | |
Net assets, end of period (000 omitted) | $ 11,241 | $ 11,165 | $ 12,679 | $ 8,976 | $ 10,035 | $ 9,398 |
Portfolio turnover rate | 62% A | 41% | 32% | 55% | 56% | 44% |
A Annualized B Total returns for periods of less than one year are not annualized. C Total returns do not reflect charges attributable to your insurance company's separate account. Inclusion of these charges would reduce the total returns shown. D Total returns would have been lower if certain expenses had not been reduced during the applicable periods shown. E Calculated based on average shares outstanding during the period. F Amounts do not include the activity of the underlying funds. G Amount represents less than .01%. H Expense ratios reflect operating expenses of the class. Expenses before reductions do not reflect amounts reimbursed by the investment adviser or reductions from expense offset arrangements and do not represent the amount paid by the class during periods when reimbursements or reductions occur. Expenses net of fee waivers reflect expenses after reimbursement by the investment adviser but prior to reductions from expense offset arrangements. Expenses net of all reductions represent the net expenses paid by the class but do not include expenses of the investment companies in which the Fund invests. I Amount represents less than $.01 per share. J Total distributions of $.49 per share is comprised of distributions from net investment income of $.347 and distributions from net realized gain of $.146 per share. |
See accompanying notes which are an integral part of the financial statements.
Semiannual Report
VIP Freedom Income Portfolio
Financial Statements - continued
Financial Highlights - Service Class
| Six months ended
June 30, 2011 | Years ended December 31, |
| (Unaudited) | 2010 | 2009 | 2008 | 2007 | 2006 |
Selected Per-Share Data | | | | | | |
Net asset value, beginning of period | $ 10.28 | $ 10.00 | $ 9.14 | $ 10.81 | $ 10.71 | $ 10.36 |
Income from Investment Operations | | | | | | |
Net investment income (loss) E | - H | .18 | .37 | .35 | .42 | .39 |
Net realized and unrealized gain (loss) | .25 | .56 | .97 | (1.50) | .23 | .32 |
Total from investment operations | .25 | .74 | 1.34 | (1.15) | .65 | .71 |
Distributions from net investment income | - | (.19) | (.33) | (.35) | (.43) | (.31) |
Distributions from net realized gain | - | (.28) | (.15) | (.17) | (.12) | (.05) |
Total distributions | - | (.46) J | (.48) I | (.52) | (.55) | (.36) |
Net asset value, end of period | $ 10.53 | $ 10.28 | $ 10.00 | $ 9.14 | $ 10.81 | $ 10.71 |
Total Return B, C, D | 2.43% | 7.46% | 14.81% | (10.65)% | 6.10% | 6.83% |
Ratios to Average Net Assets F, G | | | | | | |
Expenses before reductions | .10% A | .10% | .10% | .10% | .10% | .10% |
Expenses net of fee waivers, if any | .10% A | .10% | .10% | .10% | .10% | .10% |
Expenses net of all reductions | .10% A | .10% | .10% | .10% | .10% | .10% |
Net investment income (loss) | (.01)% A | 1.78% | 3.90% | 3.40% | 3.83% | 3.65% |
Supplemental Data | | | | | | |
Net assets, end of period (000 omitted) | $ 2,497 | $ 172 | $ 163 | $ 258 | $ 414 | $ 391 |
Portfolio turnover rate | 62% A | 41% | 32% | 55% | 56% | 44% |
A Annualized B Total returns for periods of less than one year are not annualized. C Total returns do not reflect charges attributable to your insurance company's separate account. Inclusion of these charges would reduce the total returns shown. D Total returns would have been lower if certain expenses had not been reduced during the applicable periods shown. E Calculated based on average shares outstanding during the period. F Amounts do not include the activity of the underlying funds. G Expense ratios reflect operating expenses of the class. Expenses before reductions do not reflect amounts reimbursed by the investment adviser or reductions from expense offset arrangements and do not represent the amount paid by the class during periods when reimbursements or reductions occur. Expenses net of fee waivers reflect expenses after reimbursement by the investment adviser but prior to reductions from expense offset arrangements. Expenses net of all reductions represent the net expenses paid by the class but do not include expenses of the investment companies in which the Fund invests. H Amount represents less than $.01 per share. I Total distributions of $.48 per share is comprised of distributions from net investment income of $.334 and distributions from net realized gain of $.146 per share. J Total distributions of $.46 per share is comprised of distributions from net investment income of $.189 and distributions from net realized gain of $.275 per share. |
Financial Highlights - Service Class 2
| Six months ended
June 30, 2011 | Years ended December 31, |
| (Unaudited) | 2010 | 2009 | 2008 | 2007 | 2006 |
Selected Per-Share Data | | | | | | |
Net asset value, beginning of period | $ 10.24 | $ 9.97 | $ 9.12 | $ 10.78 | $ 10.69 | $ 10.36 |
Income from Investment Operations | | | | | | |
Net investment income (loss) E | (.01) | .17 | .36 | .33 | .40 | .37 |
Net realized and unrealized gain (loss) | .25 | .55 | .96 | (1.48) | .23 | .32 |
Total from investment operations | .24 | .72 | 1.32 | (1.15) | .63 | .69 |
Distributions from net investment income | - | (.18) | (.33) | (.34) | (.42) | (.31) |
Distributions from net realized gain | - | (.28) | (.15) | (.17) | (.12) | (.05) |
Total distributions | - | (.45) I | (.47) H | (.51) | (.54) | (.36) |
Net asset value, end of period | $ 10.48 | $ 10.24 | $ 9.97 | $ 9.12 | $ 10.78 | $ 10.69 |
Total Return B, C, D | 2.34% | 7.25% | 14.64% | (10.70)% | 5.92% | 6.61% |
Ratios to Average Net Assets F, G | | | | | | |
Expenses before reductions | .25% A | .25% | .25% | .25% | .25% | .25% |
Expenses net of fee waivers, if any | .25% A | .25% | .25% | .25% | .25% | .25% |
Expenses net of all reductions | .25% A | .25% | .25% | .25% | .25% | .25% |
Net investment income (loss) | (.16)% A | 1.63% | 3.76% | 3.25% | 3.68% | 3.50% |
Supplemental Data | | | | | | |
Net assets, end of period (000 omitted) | $ 7,384 | $ 7,313 | $ 6,753 | $ 4,836 | $ 3,589 | $ 1,061 |
Portfolio turnover rate | 62% A | 41% | 32% | 55% | 56% | 44% |
A Annualized B Total returns for periods of less than one year are not annualized. C Total returns do not reflect charges attributable to your insurance company's separate account. Inclusion of these charges would reduce the total returns shown. D Total returns would have been lower if certain expenses had not been reduced during the applicable periods shown. E Calculated based on average shares outstanding during the period. F Amounts do not include the activity of the underlying funds. G Expense ratios reflect operating expenses of the class. Expenses before reductions do not reflect amounts reimbursed by the investment adviser or reductions from expense offset arrangements and do not represent the amount paid by the class during periods when reimbursements or reductions occur. Expenses net of fee waivers reflect expenses after reimbursement by the investment adviser but prior to reductions from expense offset arrangements. Expenses net of all reductions represent the net expenses paid by the class but do not include expenses of the investment companies in which the Fund invests. H Total distributions of $.47 per share is comprised of distributions from net investment income of $.326 and distributions from net realized gain of $.146 per share. I Total distributions of $.45 per share is comprised of distributions from net investment income of $.176 and distributions from net realized gain of $.275 per share. |
See accompanying notes which are an integral part of the financial statements.
Semiannual Report
VIP Freedom 2005 Portfolio
Investment Changes (Unaudited)
Fund Holdings as of June 30, 2011 |
| % of fund's
net assets | % of fund's net assets
6 months ago |
Domestic Equity Funds | | |
VIP Contrafund Portfolio Initial Class | 4.8 | 5.2 |
VIP Equity-Income Portfolio Initial Class | 5.6 | 6.1 |
VIP Growth & Income Portfolio Initial Class | 5.6 | 6.0 |
VIP Growth Portfolio Initial Class | 5.8 | 6.1 |
VIP Mid Cap Portfolio Initial Class | 2.0 | 2.1 |
VIP Value Portfolio Initial Class | 4.8 | 5.2 |
VIP Value Strategies Portfolio Initial Class | 2.0 | 2.2 |
| 30.6 | 32.9 |
Developed International Equity Funds | | |
VIP Overseas Portfolio Initial Class | 9.2 | 9.7 |
Emerging Markets Equity Funds | | |
VIP Emerging Markets Portfolio Initial Class | 1.6 | 1.6 |
High Yield Bond Funds | | |
VIP High Income Portfolio Initial Class | 5.0 | 4.9 |
Investment Grade Bond Funds | | |
VIP Investment Grade Bond Portfolio Initial Class | 30.5 | 30.2 |
Short-Term Funds | | |
VIP Money Market Portfolio Initial Class | 23.1 | 20.7 |
Net Other Assets (Liabilities)* | 0.0 | 0.0 |
| 100.0 | 100.0 |
* Amount represents less than 0.1% |
Asset Allocation (% of fund's net assets) |
Current |
| Domestic Equity Funds | 30.6% | |
| Developed International Equity Funds | 9.2% | |
| Emerging Markets Equity Funds | 1.6% | |
| High Yield Bond Funds | 5.0% | |
| Investment Grade Bond Funds | 30.5% | |
| Short-Term Funds | 23.1% | |

Six months ago |
| Domestic Equity Funds | 32.9% | |
| Developed International Equity Funds | 9.7% | |
| Emerging Markets Equity Funds | 1.6% | |
| High Yield Bond Funds | 4.9% | |
| Investment Grade Bond Funds | 30.2% | |
| Short-Term Funds | 20.7% | |

Expected |
 | Domestic Equity Funds | 28.4% | |
| Developed International Equity Funds | 8.8% | |
 | Emerging Markets Equity Funds | 1.6% | |
 | High Yield Bond Funds | 5.0% | |
 | Investment Grade Bond Funds | 30.1% | |
| Short-Term Funds | 26.1% | |

The fund invests according to an asset allocation strategy that becomes increasingly conservative over time. The six months ago allocation is based on the fund's holdings as of December 31, 2010. The current allocation is based on the fund's holdings as of June 30, 2011. The expected allocation represents the fund's anticipated allocation at December 31, 2011. |
Semiannual Report
VIP Freedom 2005 Portfolio
Investments June 30, 2011 (Unaudited)
Showing Percentage of Net Assets
Domestic Equity Funds - 30.6% |
| Shares | | Value |
Domestic Equity Funds - 30.6% |
VIP Contrafund Portfolio Initial Class | 11,125 | | $ 279,464 |
VIP Equity-Income Portfolio Initial Class | 16,112 | | 326,273 |
VIP Growth & Income Portfolio Initial Class | 24,658 | | 325,482 |
VIP Growth Portfolio Initial Class | 8,257 | | 332,250 |
VIP Mid Cap Portfolio Initial Class | 3,435 | | 113,364 |
VIP Value Portfolio Initial Class | 24,044 | | 278,673 |
VIP Value Strategies Portfolio Initial Class | 11,303 | | 116,990 |
TOTAL DOMESTIC EQUITY FUNDS (Cost $1,909,101) | 1,772,496 |
International Equity Funds - 10.8% |
| | | |
Developed International Equity Funds - 9.2% |
VIP Overseas Portfolio Initial Class | 30,378 | | 536,467 |
Emerging Markets Equity Funds - 1.6% |
VIP Emerging Markets Portfolio Initial Class | 9,298 | | 91,867 |
TOTAL INTERNATIONAL EQUITY FUNDS (Cost $680,186) | 628,334 |
Bond Funds - 35.5% |
| Shares | | Value |
High Yield Bond Funds - 5.0% |
VIP High Income Portfolio Initial Class | 49,753 | | $ 289,565 |
Investment Grade Bond Funds - 30.5% |
VIP Investment Grade Bond Portfolio Initial Class | 135,760 | | 1,764,883 |
TOTAL BOND FUNDS (Cost $1,999,751) | 2,054,448 |
Short-Term Funds - 23.1% |
| | | |
VIP Money Market Portfolio Initial Class
(Cost $1,339,044) | 1,339,044 | | 1,339,044 |
TOTAL INVESTMENT PORTFOLIO - 100.0% (Cost $5,928,082) | | 5,794,322 |
NET OTHER ASSETS (LIABILITIES) - 0.0% | | (45) |
NET ASSETS - 100% | $ 5,794,277 |
Other Information |
All investments are categorized as Level 1 under the Fair Value Hierarchy. The inputs or methodology used for valuing securities may not be an indication of the risk associated with investing in those securities. For more information on valuation inputs, please refer to the Security Valuation section in the accompanying Notes to Financial Statements. |
Income Tax Information |
At December 31, 2010, the Fund had a capital loss carryforward of approximately $86,373 all of which will expire in fiscal 2018. Capital loss carryforwards are only available to offset future capital gains of the Fund to the extent provided by regulations and may be limited. |
See accompanying notes which are an integral part of the financial statements.
Semiannual Report
VIP Freedom 2005 Portfolio
Statement of Assets and Liabilities
| June 30, 2011 (Unaudited) |
| | |
Assets | | |
Investment in securities, at value (cost $5,928,082) - See accompanying schedule | | $ 5,794,322 |
Receivable for investments sold | | 35,406 |
Total assets | | 5,829,728 |
| | |
Liabilities | | |
Payable for fund shares redeemed | $ 35,402 | |
Distribution and service plan fees payable | 49 | |
Total liabilities | | 35,451 |
| | |
Net Assets | | $ 5,794,277 |
Net Assets consist of: | | |
Paid in capital | | $ 6,122,701 |
Undistributed net investment income | | 1,559 |
Accumulated undistributed net realized gain (loss) on investments | | (196,223) |
Net unrealized appreciation (depreciation) on investments | | (133,760) |
Net Assets | | $ 5,794,277 |
| | |
Initial Class:
Net Asset Value, offering price and redemption price per share ($5,457,157 ÷ 523,184 shares) | | $ 10.43 |
| | |
Service Class:
Net Asset Value, offering price and redemption price per share ($175,734 ÷ 16,849 shares) | | $ 10.43 |
| | |
Service Class 2:
Net Asset Value, offering price and redemption price per share ($161,386 ÷ 15,471 shares) | | $ 10.43 |
Statement of Operations
Six months ended June 30, 2011 (Unaudited) |
| | |
Investment Income | | |
Income distributions from underlying funds | | $ 1,852 |
| | |
Expenses | | |
Distribution and service plan fees | $ 293 | |
Independent trustees' compensation | 11 | |
Total expenses before reductions | 304 | |
Expense reductions | (11) | 293 |
Net investment income (loss) | | 1,559 |
Realized and Unrealized Gain (Loss) Realized gain (loss) on sale of underlying fund shares | (17,971) | |
Capital gain distributions from underlying funds | 31,468 | |
Total net realized gain (loss) | | 13,497 |
Change in net unrealized appreciation (depreciation) on underlying funds | | 187,561 |
Net gain (loss) | | 201,058 |
Net increase (decrease) in net assets resulting from operations | | $ 202,617 |
See accompanying notes which are an integral part of the financial statements.
Semiannual Report
Statement of Changes in Net Assets
| Six months ended
June 30, 2011
(Unaudited) | Year ended
December 31,
2010 |
Increase (Decrease) in Net Assets | | |
Operations | | |
Net investment income (loss) | $ 1,559 | $ 117,868 |
Net realized gain (loss) | 13,497 | (54,409) |
Change in net unrealized appreciation (depreciation) | 187,561 | 602,863 |
Net increase (decrease) in net assets resulting from operations | 202,617 | 666,322 |
Distributions to shareholders from net investment income | - | (118,355) |
Distributions to shareholders from net realized gain | - | (79,802) |
Total distributions | - | (198,157) |
Share transactions - net increase (decrease) | (476,426) | (1,588,370) |
Total increase (decrease) in net assets | (273,809) | (1,120,205) |
| | |
Net Assets | | |
Beginning of period | 6,068,086 | 7,188,291 |
End of period (including undistributed net investment income of $1,559 and undistributed net investment income of $0, respectively) | $ 5,794,277 | $ 6,068,086 |
Financial Highlights - Initial Class
| Six months ended
June 30, 2011 | Years ended December 31, |
| (Unaudited) | 2010 | 2009 | 2008 | 2007 | 2006 |
Selected Per-Share Data | | | | | | |
Net asset value, beginning of period | $ 10.07 | $ 9.34 | $ 8.14 | $ 11.59 | $ 11.41 | $ 10.74 |
Income from Investment Operations | | | | | | |
Net investment income (loss) E | - I | .18 | .34 | .34 | .38 | .31 |
Net realized and unrealized gain (loss) | .36 | .87 | 1.48 | (3.06) | .60 | .72 |
Total from investment operations | .36 | 1.05 | 1.82 | (2.72) | .98 | 1.03 |
Distributions from net investment income | - | (.20) | (.35) | (.34) | (.34) | (.31) |
Distributions from net realized gain | - | (.12) | (.26) | (.39) | (.47) | (.05) |
Total distributions | - | (.32) | (.62) K | (.73) | (.80) J | (.36) |
Net asset value, end of period | $ 10.43 | $ 10.07 | $ 9.34 | $ 8.14 | $ 11.59 | $ 11.41 |
Total Return B, C, D | 3.57% | 11.34% | 23.02% | (23.83)% | 8.65% | 9.59% |
Ratios to Average Net Assets F, H | | | | | | |
Expenses before reductions G | .00% A | .00% | .00% | .00% | .00% | .00% |
Expenses net of fee waivers, if any | .00% A | .00% | .00% | .00% | .00% | .00% |
Expenses net of all reductions | .00% A | .00% | .00% | .00% | .00% | .00% |
Net investment income (loss) | .06% A | 1.90% | 3.95% | 3.29% | 3.20% | 2.82% |
Supplemental Data | | | | | | |
Net assets, end of period (000 omitted) | $ 5,457 | $ 5,733 | $ 6,833 | $ 5,993 | $ 9,203 | $ 7,871 |
Portfolio turnover rate | 33% A | 42% | 50% | 51% | 51% | 56% |
A Annualized B Total returns for periods of less than one year are not annualized. C Total returns do not reflect charges attributable to your insurance company's separate account. Inclusion of these charges would reduce the total returns shown. D Total returns would have been lower if certain expenses had not been reduced during the applicable periods shown. E Calculated based on average shares outstanding during the period. F Amounts do not include the activity of the underlying funds. G Amount represents less than .01%. H Expense ratios reflect operating expenses of the class. Expenses before reductions do not reflect amounts reimbursed by the investment adviser or reductions from expense offset arrangements and do not represent the amount paid by the class during periods when reimbursements or reductions occur. Expenses net of fee waivers reflect expenses after reimbursement by the investment adviser but prior to reductions from expense offset arrangements. Expenses net of all reductions represent the net expenses paid by the class but do not include expenses of the investment companies in which the Fund invests. I Amount represents less than $.01 per share. J Total distributions of $.80 per share is comprised of distributions from net investment income of $.335 and distributions from net realized gain of $.465 per share. K Total distributions of $.62 per share is comprised of distributions from net investment income of $.353 and distributions from net realized gain of $.262 per share. |
See accompanying notes which are an integral part of the financial statements.
Semiannual Report
Financial Highlights - Service Class
| Six months ended
June 30, 2011 | Years ended December 31, |
| (Unaudited) | 2010 | 2009 | 2008 | 2007 | 2006 |
Selected Per-Share Data | | | | | | |
Net asset value, beginning of period | $ 10.08 | $ 9.35 | $ 8.14 | $ 11.59 | $ 11.41 | $ 10.74 |
Income from Investment Operations | | | | | | |
Net investment income (loss) E | - H | .17 | .33 | .33 | .37 | .30 |
Net realized and unrealized gain (loss) | .35 | .87 | 1.48 | (3.06) | .60 | .72 |
Total from investment operations | .35 | 1.04 | 1.81 | (2.73) | .97 | 1.02 |
Distributions from net investment income | - | (.19) | (.34) | (.33) | (.32) | (.30) |
Distributions from net realized gain | - | (.12) | (.26) | (.39) | (.47) | (.05) |
Total distributions | - | (.31) | (.60) J | (.72) | (.79) I | (.35) |
Net asset value, end of period | $ 10.43 | $ 10.08 | $ 9.35 | $ 8.14 | $ 11.59 | $ 11.41 |
Total Return B, C, D | 3.47% | 11.24% | 23.00% | (23.95)% | 8.55% | 9.48% |
Ratios to Average Net Assets F, G | | | | | | |
Expenses before reductions | .10% A | .10% | .10% | .10% | .10% | .10% |
Expenses net of fee waivers, if any | .10% A | .10% | .10% | .10% | .10% | .10% |
Expenses net of all reductions | .10% A | .10% | .10% | .10% | .10% | .10% |
Net investment income (loss) | (.04)% A | 1.80% | 3.85% | 3.19% | 3.10% | 2.72% |
Supplemental Data | | | | | | |
Net assets, end of period (000 omitted) | $ 176 | $ 179 | $ 172 | $ 250 | $ 449 | $ 414 |
Portfolio turnover rate | 33% A | 42% | 50% | 51% | 51% | 56% |
A Annualized B Total returns for periods of less than one year are not annualized. C Total returns do not reflect charges attributable to your insurance company's separate account. Inclusion of these charges would reduce the total returns shown. D Total returns would have been lower if certain expenses had not been reduced during the applicable periods shown. E Calculated based on average shares outstanding during the period. F Amounts do not include the activity of the underlying funds. G Expense ratios reflect operating expenses of the class. Expenses before reductions do not reflect amounts reimbursed by the investment adviser or reductions from expense offset arrangements and do not represent the amount paid by the class during periods when reimbursements or reductions occur. Expenses net of fee waivers reflect expenses after reimbursement by the investment adviser but prior to reductions from expense offset arrangements. Expenses net of all reductions represent the net expenses paid by the class but do not include expenses of the investment companies in which the Fund invests. H Amount represents less than $.01 per share. I Total distributions of $.79 per share is comprised of distributions from net investment income of $.323 and distributions from net realized gain of $.465 per share. J Total distributions of $.60 per share is comprised of distributions from net investment income of $.341 and distributions from net realized gain of $.262 per share. |
Financial Highlights - Service Class 2
| Six months ended
June 30, 2011 | Years ended December 31, |
| (Unaudited) | 2010 | 2009 | 2008 | 2007 | 2006 |
Selected Per-Share Data | | | | | | |
Net asset value, beginning of period | $ 10.08 | $ 9.35 | $ 8.14 | $ 11.59 | $ 11.41 | $ 10.74 |
Income from Investment Operations | | | | | | |
Net investment income (loss) E | (.01) | .16 | .32 | .31 | .35 | .29 |
Net realized and unrealized gain (loss) | .36 | .86 | 1.48 | (3.06) | .60 | .71 |
Total from investment operations | .35 | 1.02 | 1.80 | (2.75) | .95 | 1.00 |
Distributions from net investment income | - | (.18) | (.32) | (.31) | (.31) | (.28) |
Distributions from net realized gain | - | (.12) | (.26) | (.39) | (.47) | (.05) |
Total distributions | - | (.29) J | (.59) I | (.70) | (.77) H | (.33) |
Net asset value, end of period | $ 10.43 | $ 10.08 | $ 9.35 | $ 8.14 | $ 11.59 | $ 11.41 |
Total Return B, C, D | 3.47% | 11.06% | 22.78% | (24.12)% | 8.40% | 9.34% |
Ratios to Average Net Assets F, G | | | | | | |
Expenses before reductions | .25% A | .25% | .25% | .25% | .25% | .25% |
Expenses net of fee waivers, if any | .25% A | .25% | .25% | .25% | .25% | .25% |
Expenses net of all reductions | .25% A | .25% | .25% | .25% | .25% | .25% |
Net investment income (loss) | (.19)% A | 1.65% | 3.70% | 3.04% | 2.95% | 2.57% |
Supplemental Data | | | | | | |
Net assets, end of period (000 omitted) | $ 161 | $ 157 | $ 183 | $ 271 | $ 456 | $ 413 |
Portfolio turnover rate | 33% A | 42% | 50% | 51% | 51% | 56% |
A Annualized B Total returns for periods of less than one year are not annualized. C Total returns do not reflect charges attributable to your insurance company's separate account. Inclusion of these charges would reduce the total returns shown. D Total returns would have been lower if certain expenses had not been reduced during the applicable periods shown. E Calculated based on average shares outstanding during the period. F Amounts do not include the activity of the underlying funds. G Expense ratios reflect operating expenses of the class. Expenses before reductions do not reflect amounts reimbursed by the investment adviser or reductions from expense offset arrangements and do not represent the amount paid by the class during periods when reimbursements or reductions occur. Expenses net of fee waivers reflect expenses after reimbursement by the investment adviser but prior to reductions from expense offset arrangements. Expenses net of all reductions represent the net expenses paid by the class but do not include expenses of the investment companies in which the Fund invests. H Total distributions of $.77 per share is comprised of distributions from net investment income of $.306 and distributions from net realized gain of $.465 per share. I Total distributions of $.59 per share is comprised of distributions from net investment income of $.324 and distributions from net realized gain of $.262 per share. J Total distributions of $.29 per share is comprised of distributions from net investment income of $.177 and distributions from net realized gain of $.117 per share. |
See accompanying notes which are an integral part of the financial statements.
Semiannual Report
VIP Freedom 2010 Portfolio
Investment Changes (Unaudited)
Fund Holdings as of June 30, 2011 |
| % of fund's
net assets | % of fund's net assets
6 months ago |
Domestic Equity Funds | | |
VIP Contrafund Portfolio Initial Class | 5.8 | 6.0 |
VIP Equity-Income Portfolio Initial Class | 6.7 | 7.1 |
VIP Growth & Income Portfolio Initial Class | 6.7 | 7.0 |
VIP Growth Portfolio Initial Class | 6.9 | 7.0 |
VIP Mid Cap Portfolio Initial Class | 2.4 | 2.4 |
VIP Value Portfolio Initial Class | 5.8 | 6.1 |
VIP Value Strategies Portfolio Initial Class | 2.4 | 2.6 |
| 36.7 | 38.2 |
Developed International Equity Funds | | |
VIP Overseas Portfolio Initial Class | 11.2 | 11.3 |
Emerging Markets Equity Funds | | |
VIP Emerging Markets Portfolio Initial Class | 1.9 | 1.9 |
High Yield Bond Funds | | |
VIP High Income Portfolio Initial Class | 5.0 | 4.9 |
Investment Grade Bond Funds | | |
VIP Investment Grade Bond Portfolio Initial Class | 34.6 | 33.5 |
Short-Term Funds | | |
VIP Money Market Portfolio Initial Class | 10.7 | 10.2 |
Net Other Assets (Liabilities) | (0.1) | 0.0* |
| 100.0 | 100.0 |
* Amount represents less than 0.1% |
Asset Allocation (% of fund's net assets) |
Current |
| Domestic Equity Funds | 36.7% | |
| Developed International Equity Funds | 11.2% | |
| Emerging Markets Equity Funds | 1.9% | |
| High Yield Bond Funds | 5.0% | |
| Investment Grade Bond Funds | 34.6% | |
| Short-Term Funds | 10.7% | |
| Net Other Assets † | (0.1)% | |

Six months ago |
| Domestic Equity Funds | 38.2% | |
| Developed International Equity Funds | 11.3% | |
| Emerging Markets Equity Funds | 1.9% | |
| High Yield Bond Funds | 4.9% | |
| Investment Grade Bond Funds | 33.5% | |
| Short-Term Funds | 10.2% | |

Expected |
| Domestic Equity Funds | 36.0% | |
| Developed International Equity Funds | 11.1% | |
| Emerging Markets Equity Funds | 2.0% | |
| High Yield Bond Funds | 5.0% | |
| Investment Grade Bond Funds | 34.6% | |
| Short-Term Funds | 11.3% | |

The fund invests according to an asset allocation strategy that becomes increasingly conservative over time. The six months ago allocation is based on the fund's holdings as of December 31, 2010. The current allocation is based on the fund's holdings as of June 30, 2011. The expected allocation represents the fund's anticipated allocation at December 31, 2011. |
† Net Other Assets are not included in the pie chart. |
Semiannual Report
VIP Freedom 2010 Portfolio
Investments June 30, 2011 (Unaudited)
Showing Percentage of Net Assets
Domestic Equity Funds - 36.7% |
| Shares | | Value |
Domestic Equity Funds - 36.7% |
VIP Contrafund Portfolio Initial Class | 400,901 | | $ 10,070,637 |
VIP Equity-Income Portfolio Initial Class | 579,205 | | 11,728,892 |
VIP Growth & Income Portfolio Initial Class | 886,666 | | 11,703,992 |
VIP Growth Portfolio Initial Class | 296,813 | | 11,943,735 |
VIP Mid Cap Portfolio Initial Class | 124,023 | | 4,092,762 |
VIP Value Portfolio Initial Class | 866,895 | | 10,047,313 |
VIP Value Strategies Portfolio Initial Class | 407,663 | | 4,219,316 |
TOTAL DOMESTIC EQUITY FUNDS (Cost $65,089,293) | 63,806,647 |
International Equity Funds - 13.1% |
| | | |
Developed International Equity Funds - 11.2% |
VIP Overseas Portfolio Initial Class | 1,099,614 | | 19,419,180 |
Emerging Markets Equity Funds - 1.9% |
VIP Emerging Markets Portfolio Initial Class | 337,490 | | 3,334,404 |
TOTAL INTERNATIONAL EQUITY FUNDS (Cost $23,086,352) | 22,753,584 |
Bond Funds - 39.6% |
| Shares | | Value |
High Yield Bond Funds - 5.0% |
VIP High Income Portfolio Initial Class | 1,491,337 | | $ 8,679,582 |
Investment Grade Bond Funds - 34.6% |
VIP Investment Grade Bond Portfolio Initial Class | 4,617,198 | | 60,023,567 |
TOTAL BOND FUNDS (Cost $67,249,722) | 68,703,149 |
Short-Term Funds - 10.7% |
| | | |
VIP Money Market Portfolio Initial Class
(Cost $18,621,981) | 18,621,981 | | 18,621,981 |
TOTAL INVESTMENT PORTFOLIO - 100.1% (Cost $174,047,348) | | 173,885,361 |
NET OTHER ASSETS (LIABILITIES) - (0.1)% | | (115,545) |
NET ASSETS - 100% | $ 173,769,816 |
Other Information |
All investments are categorized as Level 1 under the Fair Value Hierarchy. The inputs or methodology used for valuing securities may not be an indication of the risk associated with investing in those securities. For more information on valuation inputs, please refer to the Security Valuation section in the accompanying Notes to Financial Statements. |
See accompanying notes which are an integral part of the financial statements.
Semiannual Report
VIP Freedom 2010 Portfolio
Statement of Assets and Liabilities
| June 30, 2011 (Unaudited) |
| | |
Assets | | |
Investment in securities, at value (cost $174,047,348) - See accompanying schedule | | $ 173,885,361 |
Receivable for investments sold | | 384,757 |
Receivable for fund shares sold | | 100,869 |
Total assets | | 174,370,987 |
| | |
Liabilities | | |
Payable to custodian bank | $ 6,252 | |
Payable for fund shares redeemed | 566,522 | |
Distribution and service plan fees payable | 28,397 | |
Total liabilities | | 601,171 |
| | |
Net Assets | | $ 173,769,816 |
Net Assets consist of: | | |
Paid in capital | | $ 173,806,439 |
Accumulated net investment loss | | (116,798) |
Accumulated undistributed net realized gain (loss) on investments | | 242,162 |
Net unrealized appreciation (depreciation) on investments | | (161,987) |
Net Assets | | $ 173,769,816 |
| | |
Initial Class:
Net Asset Value, offering price and redemption price per share ($23,504,729 ÷ 2,130,158 shares) | | $ 11.03 |
| | |
Service Class:
Net Asset Value, offering price and redemption price per share ($20,727,281 ÷ 1,880,887 shares) | | $ 11.02 |
| | |
Service Class 2:
Net Asset Value, offering price and redemption price per share ($129,537,806 ÷ 11,804,721 shares) | | $ 10.97 |
Statement of Operations
Six months ended June 30, 2011 (Unaudited) |
| | |
Investment Income | | |
Income distributions from underlying funds | | $ 40,273 |
| | |
Expenses | | |
Distribution and service plan fees | $ 164,916 | |
Independent trustees' compensation | 293 | |
Total expenses before reductions | 165,209 | |
Expense reductions | (293) | 164,916 |
Net investment income (loss) | | (124,643) |
Realized and Unrealized Gain (Loss) Realized gain (loss) on sale of underlying fund shares | 202,312 | |
Capital gain distributions from underlying funds | 970,728 | |
Total net realized gain (loss) | | 1,173,040 |
Change in net unrealized appreciation (depreciation) on underlying funds | | 5,335,882 |
Net gain (loss) | | 6,508,922 |
Net increase (decrease) in net assets resulting from operations | | $ 6,384,279 |
See accompanying notes which are an integral part of the financial statements.
Semiannual Report
VIP Freedom 2010 Portfolio
Financial Statements - continued
Statement of Changes in Net Assets
| Six months ended
June 30, 2011
(Unaudited) | Year ended
December 31,
2010 |
Increase (Decrease) in Net Assets | | |
Operations | | |
Net investment income (loss) | $ (124,643) | $ 3,027,486 |
Net realized gain (loss) | 1,173,040 | 2,094,428 |
Change in net unrealized appreciation (depreciation) | 5,335,882 | 11,980,452 |
Net increase (decrease) in net assets resulting from operations | 6,384,279 | 17,102,366 |
Distributions to shareholders from net investment income | - | (3,027,992) |
Distributions to shareholders from net realized gain | (75,293) | (2,711,578) |
Total distributions | (75,293) | (5,739,570) |
Share transactions - net increase (decrease) | 7,662,582 | 20,210,504 |
Total increase (decrease) in net assets | 13,971,568 | 31,573,300 |
| | |
Net Assets | | |
Beginning of period | 159,798,248 | 128,224,948 |
End of period (including accumulated net investment loss of $116,798 and undistributed net investment income of $7,845, respectively) | $ 173,769,816 | $ 159,798,248 |
Financial Highlights - Initial Class
| Six months ended
June 30, 2011 | Years ended December 31, |
| (Unaudited) | 2010 | 2009 | 2008 | 2007 | 2006 |
Selected Per-Share Data | | | | | | |
Net asset value, beginning of period | $ 10.61 | $ 9.77 | $ 8.23 | $ 11.96 | $ 11.59 | $ 10.78 |
Income from Investment Operations | | | | | | |
Net investment income (loss) E | - I | .24 | .38 | .35 | .36 | .28 |
Net realized and unrealized gain (loss) | .43 | 1.02 | 1.60 | (3.32) | .64 | .78 |
Total from investment operations | .43 | 1.26 | 1.98 | (2.97) | 1.00 | 1.06 |
Distributions from net investment income | - | (.23) | (.37) | (.31) | (.30) | (.20) |
Distributions from net realized gain | (.01) | (.19) | (.07) | (.45) | (.33) | (.05) |
Total distributions | (.01) | (.42) | (.44) | (.76) | (.63) | (.25) |
Net asset value, end of period | $ 11.03 | $ 10.61 | $ 9.77 | $ 8.23 | $ 11.96 | $ 11.59 |
Total Return B, C, D | 4.01% | 12.95% | 24.27% | (25.05)% | 8.71% | 9.82% |
Ratios to Average Net Assets F, H | | | | | | |
Expenses before reductions G | .00% A | .00% | .00% | .00% | .00% | .00% |
Expenses net of fee waivers, if any | .00% A | .00% | .00% | .00% | .00% | .00% |
Expenses net of all reductions | .00% A | .00% | .00% | .00% | .00% | .00% |
Net investment income (loss) | .05% A | 2.38% | 4.22% | 3.27% | 2.95% | 2.48% |
Supplemental Data | | | | | | |
Net assets, end of period (000 omitted) | $ 23,505 | $ 22,573 | $ 21,197 | $ 24,962 | $ 26,629 | $ 20,992 |
Portfolio turnover rate | 17% A | 29% | 28% | 34% | 21% | 24% |
A Annualized B Total returns for periods of less than one year are not annualized. C Total returns do not reflect charges attributable to your insurance company's separate account. Inclusion of these charges would reduce the total returns shown. D Total returns would have been lower if certain expenses had not been reduced during the applicable periods shown. E Calculated based on average shares outstanding during the period. F Amounts do not include the activity of the underlying funds. G Amount represents less than .01%. H Expense ratios reflect operating expenses of the class. Expenses before reductions do not reflect amounts reimbursed by the investment adviser or reductions from expense offset arrangements and do not represent the amount paid by the class during periods when reimbursements or reductions occur. Expenses net of fee waivers reflect expenses after reimbursement by the investment adviser but prior to reductions from expense offset arrangements. Expenses net of all reductions represent the net expenses paid by the class but do not include expenses of the investment companies in which the Fund invests. I Amount represents less than $.01 per share. |
See accompanying notes which are an integral part of the financial statements.
Semiannual Report
Financial Highlights - Service Class
| Six months ended
June 30, 2011 | Years ended December 31, |
| (Unaudited) | 2010 | 2009 | 2008 | 2007 | 2006 |
Selected Per-Share Data | | | | | | |
Net asset value, beginning of period | $ 10.60 | $ 9.77 | $ 8.23 | $ 11.95 | $ 11.58 | $ 10.77 |
Income from Investment Operations | | | | | | |
Net investment income (loss) E | - H | .23 | .37 | .33 | .35 | .27 |
Net realized and unrealized gain (loss) | .43 | 1.01 | 1.60 | (3.30) | .64 | .78 |
Total from investment operations | .43 | 1.24 | 1.97 | (2.97) | .99 | 1.05 |
Distributions from net investment income | - | (.21) | (.36) | (.30) | (.29) | (.19) |
Distributions from net realized gain | (.01) | (.19) | (.07) | (.45) | (.33) | (.05) |
Total distributions | (.01) | (.41) I | (.43) | (.75) | (.62) | (.24) |
Net asset value, end of period | $ 11.02 | $ 10.60 | $ 9.77 | $ 8.23 | $ 11.95 | $ 11.58 |
Total Return B, C, D | 4.01% | 12.74% | 24.15% | (25.08)% | 8.65% | 9.78% |
Ratios to Average Net Assets F, G | | | | | | |
Expenses before reductions | .10% A | .10% | .10% | .10% | .10% | .10% |
Expenses net of fee waivers, if any | .10% A | .10% | .10% | .10% | .10% | .10% |
Expenses net of all reductions | .10% A | .10% | .10% | .10% | .10% | .10% |
Net investment income (loss) | (.05)% A | 2.28% | 4.12% | 3.17% | 2.85% | 2.39% |
Supplemental Data | | | | | | |
Net assets, end of period (000 omitted) | $ 20,727 | $ 19,259 | $ 19,238 | $ 17,137 | $ 19,295 | $ 5,984 |
Portfolio turnover rate | 17% A | 29% | 28% | 34% | 21% | 24% |
A Annualized B Total returns for periods of less than one year are not annualized. C Total returns do not reflect charges attributable to your insurance company's separate account. Inclusion of these charges would reduce the total returns shown. D Total returns would have been lower if certain expenses had not been reduced during the applicable periods shown. E Calculated based on average shares outstanding during the period. F Amounts do not include the activity of the underlying funds. G Expense ratios reflect operating expenses of the class. Expenses before reductions do not reflect amounts reimbursed by the investment adviser or reductions from expense offset arrangements and do not represent the amount paid by the class during periods when reimbursements or reductions occur. Expenses net of fee waivers reflect expenses after reimbursement by the investment adviser but prior to reductions from expense offset arrangements. Expenses net of all reductions represent the net expenses paid by the class but do not include expenses of the investment companies in which the Fund invests. H Amount represents less than $.01 per share. I Total distributions of $.41 per share is comprised of distributions from net investment income of $.214 and distributions from net realized gain of $.191 per share. |
Financial Highlights - Service Class 2
| Six months ended
June 30, 2011 | Years ended December 31, |
| (Unaudited) | 2010 | 2009 | 2008 | 2007 | 2006 |
Selected Per-Share Data | | | | | | |
Net asset value, beginning of period | $ 10.56 | $ 9.74 | $ 8.21 | $ 11.92 | $ 11.56 | $ 10.76 |
Income from Investment Operations | | | | | | |
Net investment income (loss) E | (.01) | .22 | .35 | .32 | .33 | .25 |
Net realized and unrealized gain (loss) | .43 | .99 | 1.60 | (3.29) | .64 | .78 |
Total from investment operations | .42 | 1.21 | 1.95 | (2.97) | .97 | 1.03 |
Distributions from net investment income | - | (.20) | (.35) | (.29) | (.28) | (.18) |
Distributions from net realized gain | (.01) | (.19) | (.07) | (.45) | (.33) | (.05) |
Total distributions | (.01) | (.39) | (.42) | (.74) | (.61) | (.23) |
Net asset value, end of period | $ 10.97 | $ 10.56 | $ 9.74 | $ 8.21 | $ 11.92 | $ 11.56 |
Total Return B, C, D | 3.93% | 12.55% | 23.95% | (25.17)% | 8.42% | 9.58% |
Ratios to Average Net Assets F, G | | | | | | |
Expenses before reductions | .25% A | .25% | .25% | .25% | .25% | .25% |
Expenses net of fee waivers, if any | .25% A | .25% | .25% | .25% | .25% | .25% |
Expenses net of all reductions | .25% A | .25% | .25% | .25% | .25% | .25% |
Net investment income (loss) | (.20)% A | 2.13% | 3.97% | 3.02% | 2.70% | 2.24% |
Supplemental Data | | | | | | |
Net assets, end of period (000 omitted) | $ 129,538 | $ 117,966 | $ 87,791 | $ 66,370 | $ 62,510 | $ 38,662 |
Portfolio turnover rate | 17% A | 29% | 28% | 34% | 21% | 24% |
A Annualized B Total returns for periods of less than one year are not annualized. C Total returns do not reflect charges attributable to your insurance company's separate account. Inclusion of these charges would reduce the total returns shown. D Total returns would have been lower if certain expenses had not been reduced during the applicable periods shown. E Calculated based on average shares outstanding during the period. F Amounts do not include the activity of the underlying funds. G Expense ratios reflect operating expenses of the class. Expenses before reductions do not reflect amounts reimbursed by the investment adviser or reductions from expense offset arrangements and do not represent the amount paid by the class during periods when reimbursements or reductions occur. Expenses net of fee waivers reflect expenses after reimbursement by the investment adviser but prior to reductions from expense offset arrangements. Expenses net of all reductions represent the net expenses paid by the class but do not include expenses of the investment companies in which the Fund invests. |
See accompanying notes which are an integral part of the financial statements.
Semiannual Report
VIP Freedom 2015 Portfolio
Investment Changes (Unaudited)
Fund Holdings as of June 30, 2011 |
| % of fund's
net assets | % of fund's net assets
6 months ago |
Domestic Equity Funds | | |
VIP Contrafund Portfolio Initial Class | 5.9 | 6.2 |
VIP Equity-Income Portfolio Initial Class | 6.9 | 7.3 |
VIP Growth & Income Portfolio Initial Class | 6.9 | 7.2 |
VIP Growth Portfolio Initial Class | 7.1 | 7.2 |
VIP Mid Cap Portfolio Initial Class | 2.4 | 2.5 |
VIP Value Portfolio Initial Class | 5.9 | 6.2 |
VIP Value Strategies Portfolio Initial Class | 2.5 | 2.6 |
| 37.6 | 39.2 |
Developed International Equity Funds | | |
VIP Overseas Portfolio Initial Class | 11.4 | 11.7 |
Emerging Markets Equity Funds | | |
VIP Emerging Markets Portfolio Initial Class | 2.0 | 1.9 |
High Yield Bond Funds | | |
VIP High Income Portfolio Initial Class | 5.1 | 5.0 |
Investment Grade Bond Funds | | |
VIP Investment Grade Bond Portfolio Initial Class | 34.4 | 33.1 |
Short-Term Funds | | |
VIP Money Market Portfolio Initial Class | 9.5 | 9.1 |
Net Other Assets (Liabilities)* | 0.0 | 0.0 |
| 100.0 | 100.0 |
* Amount represents less than 0.1% |
Asset Allocation (% of fund's net assets) |
Current |
| Domestic Equity Funds | 37.6% | |
| Developed International Equity Funds | 11.4% | |
| Emerging Markets Equity Funds | 2.0% | |
| High Yield Bond Funds | 5.1% | |
| Investment Grade Bond Funds | 34.4% | |
| Short-Term Funds | 9.5% | |

Six months ago |
| Domestic Equity Funds | 39.2% | |
| Developed International Equity Funds | 11.7% | |
| Emerging Markets Equity Funds | 1.9% | |
| High Yield Bond Funds | 5.0% | |
| Investment Grade Bond Funds | 33.1% | |
| Short-Term Funds | 9.1% | |

Expected |
| Domestic Equity Funds | 37.0% | |
| Developed International Equity Funds | 11.5% | |
| Emerging Markets Equity Funds | 2.0% | |
| High Yield Bond Funds | 5.0% | |
| Investment Grade Bond Funds | 34.7% | |
| Short-Term Funds | 9.8% | |

The fund invests according to an asset allocation strategy that becomes increasingly conservative over time. The six months ago allocation is based on the fund's holdings as of December 31, 2010. The current allocation is based on the fund's holdings as of June 30, 2011. The expected allocation represents the fund's anticipated allocation at December 31, 2011. |
Semiannual Report
VIP Freedom 2015 Portfolio
Investments June 30, 2011 (Unaudited)
Showing Percentage of Net Assets
Domestic Equity Funds - 37.6% |
| Shares | | Value |
Domestic Equity Funds - 37.6% |
VIP Contrafund Portfolio Initial Class | 246,678 | | $ 6,196,559 |
VIP Equity-Income Portfolio Initial Class | 356,766 | | 7,224,518 |
VIP Growth & Income Portfolio Initial Class | 546,161 | | 7,209,323 |
VIP Growth Portfolio Initial Class | 182,828 | | 7,356,997 |
VIP Mid Cap Portfolio Initial Class | 76,342 | | 2,519,292 |
VIP Value Portfolio Initial Class | 533,351 | | 6,181,535 |
VIP Value Strategies Portfolio Initial Class | 251,008 | | 2,597,935 |
TOTAL DOMESTIC EQUITY FUNDS (Cost $37,466,716) | 39,286,159 |
International Equity Funds - 13.4% |
| | | |
Developed International Equity Funds - 11.4% |
VIP Overseas Portfolio Initial Class | 676,961 | | 11,955,133 |
Emerging Markets Equity Funds - 2.0% |
VIP Emerging Markets Portfolio Initial Class | 207,613 | | 2,051,217 |
TOTAL INTERNATIONAL EQUITY FUNDS (Cost $13,508,365) | 14,006,350 |
Bond Funds - 39.5% |
| Shares | | Value |
High Yield Bond Funds - 5.1% |
VIP High Income Portfolio Initial Class | 904,936 | | $ 5,266,725 |
Investment Grade Bond Funds - 34.4% |
VIP Investment Grade Bond Portfolio Initial Class | 2,764,125 | | 35,933,621 |
TOTAL BOND FUNDS (Cost $40,113,015) | 41,200,346 |
Short-Term Funds - 9.5% |
| | | |
VIP Money Market Portfolio Initial Class
(Cost $9,959,058) | 9,959,058 | | 9,959,058 |
TOTAL INVESTMENT PORTFOLIO - 100.0% (Cost $101,047,154) | | 104,451,913 |
NET OTHER ASSETS (LIABILITIES) - 0.0% | | (12,315) |
NET ASSETS - 100% | $ 104,439,598 |
Other Information |
All investments are categorized as Level 1 under the Fair Value Hierarchy. The inputs or methodology used for valuing securities may not be an indication of the risk associated with investing in those securities. For more information on valuation inputs, please refer to the Security Valuation section in the accompanying Notes to Financial Statements. |
See accompanying notes which are an integral part of the financial statements.
Semiannual Report
VIP Freedom 2015 Portfolio
Statement of Assets and Liabilities
| June 30, 2011 (Unaudited) |
| | |
Assets | | |
Investment in securities, at value (cost $101,047,154) - See accompanying schedule | | $ 104,451,913 |
Cash | | 49,908 |
Receivable for investments sold | | 69,503 |
Receivable for fund shares sold | | 50,015 |
Total assets | | 104,621,339 |
| | |
Liabilities | | |
Payable for investments purchased | $ 80,456 | |
Payable for fund shares redeemed | 89,061 | |
Distribution and service plan fees payable | 12,224 | |
Total liabilities | | 181,741 |
| | |
Net Assets | | $ 104,439,598 |
Net Assets consist of: | | |
Paid in capital | | $ 100,844,701 |
Accumulated net investment loss | | (49,469) |
Accumulated undistributed net realized gain (loss) on investments | | 239,607 |
Net unrealized appreciation (depreciation) on investments | | 3,404,759 |
Net Assets | | $ 104,439,598 |
| | |
Initial Class:
Net Asset Value, offering price and redemption price per share ($41,493,600 ÷ 3,724,619 shares) | | $ 11.14 |
| | |
Service Class:
Net Asset Value, offering price and redemption price per share ($5,365,761 ÷ 482,139 shares) | | $ 11.13 |
| | |
Service Class 2:
Net Asset Value, offering price and redemption price per share ($57,580,237 ÷ 5,196,201 shares) | | $ 11.08 |
Statement of Operations
Six months ended June 30, 2011 (Unaudited) |
| | |
Investment Income | | |
Income distributions from underlying funds | | $ 24,368 |
| | |
Expenses | | |
Distribution and service plan fees | $ 73,837 | |
Independent trustees' compensation | 182 | |
Total expenses before reductions | 74,019 | |
Expense reductions | (182) | 73,837 |
Net investment income (loss) | | (49,469) |
Realized and Unrealized Gain (Loss) Realized gain (loss) on sale of underlying fund shares | 137,958 | |
Capital gain distributions from underlying funds | 607,010 | |
Total net realized gain (loss) | | 744,968 |
Change in net unrealized appreciation (depreciation) on underlying funds | | 3,382,143 |
Net gain (loss) | | 4,127,111 |
Net increase (decrease) in net assets resulting from operations | | $ 4,077,642 |
See accompanying notes which are an integral part of the financial statements.
Semiannual Report
Statement of Changes in Net Assets
| Six months ended June 30, 2011
(Unaudited) | Year ended
December 31, 2010 |
Increase (Decrease) in Net Assets | | |
Operations | | |
Net investment income (loss) | $ (49,469) | $ 1,902,444 |
Net realized gain (loss) | 744,968 | 866,011 |
Change in net unrealized appreciation (depreciation) | 3,382,143 | 8,117,654 |
Net increase (decrease) in net assets resulting from operations | 4,077,642 | 10,886,109 |
Distributions to shareholders from net investment income | - | (1,907,875) |
Distributions to shareholders from net realized gain | - | (1,118,696) |
Total distributions | - | (3,026,571) |
Share transactions - net increase (decrease) | 1,992,420 | 9,160,517 |
Total increase (decrease) in net assets | 6,070,062 | 17,020,055 |
| | |
Net Assets | | |
Beginning of period | 98,369,536 | 81,349,481 |
End of period (including accumulated net investment loss of $49,469 and undistributed net investment income of $0, respectively) | $ 104,439,598 | $ 98,369,536 |
Financial Highlights - Initial Class
| Six months ended June 30, 2011 | Years ended December 31, |
| (Unaudited) | 2010 | 2009 | 2008 | 2007 | 2006 |
Selected Per-Share Data | | | | | | |
Net asset value, beginning of period | $ 10.70 | $ 9.78 | $ 8.19 | $ 12.29 | $ 11.93 | $ 10.95 |
Income from Investment Operations | | | | | | |
Net investment income (loss) E | - I | .23 | .38 | .33 | .37 | .27 |
Net realized and unrealized gain (loss) | .44 | 1.04 | 1.67 | (3.61) | .73 | .94 |
Total from investment operations | .44 | 1.27 | 2.05 | (3.28) | 1.10 | 1.21 |
Distributions from net investment income | - | (.23) | (.34) | (.30) | (.36) | (.14) |
Distributions from net realized gain | - | (.13) | (.12) | (.52) | (.38) | (.09) |
Total distributions | - | (.35) J | (.46) | (.82) K | (.74) | (.23) |
Net asset value, end of period | $ 11.14 | $ 10.70 | $ 9.78 | $ 8.19 | $ 12.29 | $ 11.93 |
Total Return B,C,D | 4.11% | 13.09% | 25.28% | (27.03)% | 9.33% | 11.04% |
Ratios to Average Net Assets F, H | | | | | | |
Expenses before reductions G | .00% A | .00% | .00% | .00% | .00% | .00% |
Expenses net of fee waivers, if any | .00% A | .00% | .00% | .00% | .00% | .00% |
Expenses net of all reductions | .00%A | .00% | .00% | .00% | .00% | .00% |
Net investment income (loss) | .05% A | 2.30% | 4.21% | 3.11% | 2.93% | 2.34% |
Supplemental Data | | | | | | |
Net assets, end of period (000 omitted) | $ 41,494 | $ 39,535 | $ 37,291 | $ 25,977 | $ 33,780 | $ 23,712 |
Portfolio turnover rate | 24% A | 30% | 23% | 27% | 18% | 24% |
A Annualized B Total returns for periods of less than one year are not annualized. C Total returns do not reflect charges attributable to your insurance company's separate account. Inclusion of these charges would reduce the total returns shown. D Total returns would have been lower if certain expenses had not been reduced during the applicable periods shown. E Calculated based on average shares outstanding during the period. F Amounts do not include the activity of the underlying funds. G Amount represents less than .01%. H Expense ratios reflect operating expenses of the class. Expenses before reductions do not reflect amounts reimbursed by the investment adviser or reductions from expense offset arrangements and do not represent the amount paid by the class during periods when reimbursements or reductions occur. Expenses net of fee waivers reflect expenses after reimbursement by the investment adviser but prior to reductions from expense offset arrangements. Expenses net of all reductions represent the net expenses paid by the class but do not include expenses of the investment companies in which the Fund invests. I Amount represents less than $.01 per share. J Total distributions of $.35 per share is comprised of distributions from net investment income of $.227 and distributions from net realized gain of $.127 per share. K Total distributions of $.82 per share is comprised of distributions from net investment income of $.302 and distributions from net realized gain of $.515 per share. |
See accompanying notes which are an integral part of the financial statements.
Semiannual Report
Financial Highlights - Service Class
| Six months ended June 30, 2011 | Years ended December 31, |
| (Unaudited) | 2010 | 2009 | 2008 | 2007 | 2006 |
Selected Per-Share Data | | | | | | |
Net asset value, beginning of period | $ 10.69 | $ 9.77 | $ 8.19 | $ 12.29 | $ 11.93 | $ 10.95 |
Income from Investment Operations | | | | | | |
Net investment income (loss) E | - H | .22 | .37 | .31 | .35 | .26 |
Net realized and unrealized gain (loss) | .44 | 1.05 | 1.66 | (3.60) | .74 | .94 |
Total from investment operations | .44 | 1.27 | 2.03 | (3.29) | 1.09 | 1.20 |
Distributions from net investment income | - | (.22) | (.33) | (.29) | (.35) | (.13) |
Distributions from net realized gain | - | (.13) | (.12) | (.52) | (.38) | (.09) |
Total distributions | - | (.35) | (.45) | (.81) I | (.73) | (.22) |
Net asset value, end of period | $ 11.13 | $ 10.69 | $ 9.77 | $ 8.19 | $ 12.29 | $ 11.93 |
Total Return B,C,D | 4.12% | 13.00% | 25.06% | (27.10)% | 9.23% | 10.94% |
Ratios to Average Net Assets F,G | | | | | | |
Expenses before reductions | .10% A | .10% | .10% | .10% | .10% | .10% |
Expenses net of fee waivers, if any | .10% A | .10% | .10% | .10% | .10% | .10% |
Expenses net of all reductions | .10% A | .10% | .10% | .10% | .10% | .10% |
Net investment income (loss) | (.05)% A | 2.20% | 4.12% | 3.01% | 2.83% | 2.24% |
Supplemental Data | | | | | | |
Net assets, end of period (000 omitted) | $ 5,366 | $ 2,723 | $ 1,524 | $ 936 | $ 477 | $ 427 |
Portfolio turnover rate | 24% A | 30% | 23% | 27% | 18% | 24% |
A Annualized B Total returns for periods of less than one year are not annualized. C Total returns do not reflect charges attributable to your insurance company's separate account. Inclusion of these charges would reduce the total returns shown. D Total returns would have been lower if certain expenses had not been reduced during the applicable periods shown. E Calculated based on average shares outstanding during the period. F Amounts do not include the activity of the underlying funds. G Expense ratios reflect operating expenses of the class. Expenses before reductions do not reflect amounts reimbursed by the investment adviser or reductions from expense offset arrangements and do not represent the amount paid by the class during periods when reimbursements or reductions occur. Expenses net of fee waivers reflect expenses after reimbursement by the investment adviser but prior to reductions from expense offset arrangements. Expenses net of all reductions represent the net expenses paid by the class but do not include expenses of the investment companies in which the Fund invests. H Amount represents less than $.01 per share. I Total distributions of $.81 per share is comprised of distributions from net investment income of $.294 and distributions from net realized gain of $.515 per share. |
Financial Highlights - Service Class 2
| Six months ended June 30, 2011 | Years ended December 31, |
| (Unaudited) | 2010 | 2009 | 2008 | 2007 | 2006 |
Selected Per-Share Data | | | | | | |
Net asset value, beginning of period | $ 10.65 | $ 9.74 | $ 8.16 | $ 12.26 | $ 11.91 | $ 10.94 |
Income from Investment Operations | | | | | | |
Net investment income (loss) E | (.01) | .21 | .35 | .30 | .33 | .24 |
Net realized and unrealized gain (loss) | .44 | 1.03 | 1.67 | (3.61) | .74 | .95 |
Total from investment operations | .43 | 1.24 | 2.02 | (3.31) | 1.07 | 1.19 |
Distributions from net investment income | - | (.20) | (.32) | (.28) | (.34) | (.13) |
Distributions from net realized gain | - | (.13) | (.12) | (.52) | (.38) | (.09) |
Total distributions | - | (.33) | (.44) | (.79) H | (.72) | (.22) |
Net asset value, end of period | $ 11.08 | $ 10.65 | $ 9.74 | $ 8.16 | $ 12.26 | $ 11.91 |
Total Return B,C,D | 4.04% | 12.79% | 25.02% | (27.30)% | 9.07% | 10.84% |
Ratios to Average Net Assets F,G | | | | | | |
Expenses before reductions | .25% A | .25% | .25% | .25% | .25% | .25% |
Expenses net of fee waivers, if any | .25% A | .25% | .25% | .25% | .25% | .25% |
Expenses net of all reductions | .25% A | .25% | .25% | .25% | .25% | .25% |
Net investment income (loss) | (.20)% A | 2.05% | 3.97% | 2.86% | 2.68% | 2.09% |
Supplemental Data | | | | | | |
Net assets, end of period (000 omitted) | $ 57,580 | $ 56,112 | $ 42,534 | $ 25,855 | $ 24,497 | $ 9,984 |
Portfolio turnover rate | 24% A | 30% | 23% | 27% | 18% | 24% |
A Annualized B Total returns for periods of less than one year are not annualized. C Total returns do not reflect charges attributable to your insurance company's separate account. Inclusion of these charges would reduce the total returns shown. D Total returns would have been lower if certain expenses had not been reduced during the applicable periods shown. E Calculated based on average shares outstanding during the period. F Amounts do not include the activity of the underlying funds. G Expense ratios reflect operating expenses of the class. Expenses before reductions do not reflect amounts reimbursed by the investment adviser or reductions from expense offset arrangements and do not represent the amount paid by the class during periods when reimbursements or reductions occur. Expenses net of fee waivers reflect expenses after reimbursement by the investment adviser but prior to reductions from expense offset arrangements. Expenses net of all reductions represent the net expenses paid by the class but do not include expenses of the investment companies in which the Fund invests. H Total distributions of $.79 per share is comprised of distributions from net investment income of $.279 and distributions from net realized gain of $.515 per share. |
See accompanying notes which are an integral part of the financial statements.
Semiannual Report
VIP Freedom 2020 Portfolio
Investment Changes (Unaudited)
Fund Holdings as of June 30, 2011 |
| % of fund's
net assets | % of fund's net assets
6 months ago |
Domestic Equity Funds | | |
VIP Contrafund Portfolio Initial Class | 7.0 | 7.3 |
VIP Equity-Income Portfolio Initial Class | 8.1 | 8.6 |
VIP Growth & Income Portfolio Initial Class | 8.1 | 8.5 |
VIP Growth Portfolio Initial Class | 8.3 | 8.6 |
VIP Mid Cap Portfolio Initial Class | 2.8 | 3.0 |
VIP Value Portfolio Initial Class | 6.9 | 7.3 |
VIP Value Strategies Portfolio Initial Class | 2.9 | 3.1 |
| 44.1 | 46.4 |
Developed International Equity Funds | | |
VIP Overseas Portfolio Initial Class | 13.5 | 13.8 |
Emerging Markets Equity Funds | | |
VIP Emerging Markets Portfolio Initial Class | 2.3 | 2.3 |
High Yield Bond Funds | | |
VIP High Income Portfolio Initial Class | 6.5 | 6.5 |
Investment Grade Bond Funds | | |
VIP Investment Grade Bond Portfolio Initial Class | 29.5 | 27.6 |
Short-Term Funds | | |
VIP Money Market Portfolio Initial Class | 4.1 | 3.4 |
Net Other Assets (Liabilities)* | 0.0 | 0.0 |
| 100.0 | 100.0 |
* Amount represents less than 0.1% |
Asset Allocation (% of fund's net assets) |
Current |
 | Domestic Equity Funds | 44.1% | |
| Developed International Equity Funds | 13.5% | |
| Emerging Markets Equity Funds | 2.3% | |
| High Yield Bond Funds | 6.5% | |
| Investment Grade Bond Funds | 29.5% | |
| Short-Term Funds | 4.1% | |

Six months ago |
| Domestic Equity Funds | 46.4% | |
| Developed International Equity Funds | 13.8% | |
| Emerging Markets Equity Funds | 2.3% | |
| High Yield Bond Funds | 6.5% | |
| Investment Grade Bond Funds | 27.6% | |
| Short-Term Funds | 3.4% | |

Expected |
| Domestic Equity Funds | 42.3% | |
| Developed International Equity Funds | 13.1% | |
| Emerging Markets Equity Funds | 2.3% | |
| High Yield Bond Funds | 6.2% | |
| Investment Grade Bond Funds | 30.9% | |
| Short-Term Funds | 5.2% | |

The fund invests according to an asset allocation strategy that becomes increasingly conservative over time. The six months ago allocation is based on the fund's holdings as of December 31, 2010. The current allocation is based on the fund's holdings as of June 30, 2011. The expected allocation represents the fund's anticipated allocation at December 31, 2011. |
Semiannual Report
VIP Freedom 2020 Portfolio
Investments June 30, 2011 (Unaudited)
Showing Percentage of Net Assets
Domestic Equity Funds - 44.1% |
| Shares | | Value |
Domestic Equity Funds - 44.1% |
VIP Contrafund Portfolio Initial Class | 1,327,479 | | $ 33,346,285 |
VIP Equity-Income Portfolio Initial Class | 1,917,621 | | 38,831,833 |
VIP Growth & Income Portfolio Initial Class | 2,935,597 | | 38,749,880 |
VIP Growth Portfolio Initial Class | 982,481 | | 39,535,031 |
VIP Mid Cap Portfolio Initial Class | 411,122 | | 13,567,015 |
VIP Value Portfolio Initial Class | 2,870,855 | | 33,273,205 |
VIP Value Strategies Portfolio Initial Class | 1,350,654 | | 13,979,273 |
TOTAL DOMESTIC EQUITY FUNDS (Cost $198,478,741) | 211,282,522 |
International Equity Funds - 15.8% |
| | | |
Developed International Equity Funds - 13.5% |
VIP Overseas Portfolio Initial Class | 3,656,600 | | 64,575,563 |
Emerging Markets Equity Funds - 2.3% |
VIP Emerging Markets Portfolio Initial Class | 1,123,596 | | 11,101,127 |
TOTAL INTERNATIONAL EQUITY FUNDS (Cost $72,291,066) | 75,676,690 |
Bond Funds - 36.0% |
| Shares | | Value |
High Yield Bond Funds - 6.5% |
VIP High Income Portfolio Initial Class | 5,354,051 | | $ 31,160,580 |
Investment Grade Bond Funds - 29.5% |
VIP Investment Grade Bond Portfolio Initial Class | 10,878,449 | | 141,419,831 |
TOTAL BOND FUNDS (Cost $169,550,320) | 172,580,411 |
Short-Term Funds - 4.1% |
| | | |
VIP Money Market Portfolio Initial Class
(Cost $19,936,655) | 19,936,655 | | 19,936,655 |
TOTAL INVESTMENT PORTFOLIO - 100.0% (Cost $460,256,782) | | 479,476,278 |
NET OTHER ASSETS (LIABILITIES) - 0.0% | | (81,243) |
NET ASSETS - 100% | $ 479,395,035 |
Other Information |
All investments are categorized as Level 1 under the Fair Value Hierarchy. The inputs or methodology used for valuing securities may not be an indication of the risk associated with investing in those securities. For more information on valuation inputs, please refer to the Security Valuation section in the accompanying Notes to Financial Statements. |
See accompanying notes which are an integral part of the financial statements.
Semiannual Report
VIP Freedom 2020 Portfolio
Statement of Assets and Liabilities
| June 30, 2011 (Unaudited) |
| | |
Assets | | |
Investment in securities, at value (cost $460,256,782) - See accompanying schedule | | $ 479,476,278 |
Cash | | 37,255 |
Receivable for fund shares sold | | 685,009 |
Total assets | | 480,198,542 |
| | |
Liabilities | | |
Payable for investments purchased | $ 703,955 | |
Payable for fund shares redeemed | 17,635 | |
Distribution and service plan fees payable | 81,917 | |
Total liabilities | | 803,507 |
| | |
Net Assets | | $ 479,395,035 |
Net Assets consist of: | | |
Paid in capital | | $ 460,196,033 |
Accumulated net investment loss | | (379,346) |
Accumulated undistributed net realized gain (loss) on investments | | 358,852 |
Net unrealized appreciation (depreciation) on investments | | 19,219,496 |
Net Assets | | $ 479,395,035 |
| | |
Initial Class:
Net Asset Value, offering price and redemption price per share ($52,531,317 ÷ 4,740,600 shares) | | $ 11.08 |
| | |
Service Class:
Net Asset Value, offering price and redemption price per share ($38,620,225 ÷ 3,492,234 shares) | | $ 11.06 |
| | |
Service Class 2:
Net Asset Value, offering price and redemption price per share ($388,243,493 ÷ 35,225,861 shares) | | $ 11.02 |
Statement of Operations
Six months ended June 30, 2011 (Unaudited) |
| | |
Investment Income | | |
Income distributions from underlying funds | | $ 80,540 |
Interest | | 3 |
Total income | | 80,543 |
| | |
Expenses | | |
Distribution and service plan fees | $ 459,889 | |
Independent trustees' compensation | 752 | |
Total expenses before reductions | 460,641 | |
Expense reductions | (752) | 459,889 |
Net investment income (loss) | | (379,346) |
Realized and Unrealized Gain (Loss) Realized gain (loss) on sale of underlying fund shares | 326,532 | |
Capital gain distributions from underlying funds | 2,115,689 | |
Total net realized gain (loss) | | 2,442,221 |
Change in net unrealized appreciation (depreciation) on underlying funds | | 16,175,612 |
Net gain (loss) | | 18,617,833 |
Net increase (decrease) in net assets resulting from operations | | $ 18,238,487 |
See accompanying notes which are an integral part of the financial statements.
Semiannual Report
VIP Freedom 2020 Portfolio
Financial Statements - continued
Statement of Changes in Net Assets
| Six months ended June 30, 2011
(Unaudited) | Year ended
December 31, 2010 |
Increase (Decrease) in Net Assets | | |
Operations | | |
Net investment income (loss) | $ (379,346) | $ 7,410,113 |
Net realized gain (loss) | 2,442,221 | 1,627,031 |
Change in net unrealized appreciation (depreciation) | 16,175,612 | 35,177,912 |
Net increase (decrease) in net assets resulting from operations | 18,238,487 | 44,215,056 |
Distributions to shareholders from net investment income | - | (7,414,198) |
Distributions to shareholders from net realized gain | - | (2,619,651) |
Total distributions | - | (10,033,849) |
Share transactions - net increase (decrease) | 72,432,018 | 100,585,667 |
Total increase (decrease) in net assets | 90,670,505 | 134,766,874 |
| | |
Net Assets | | |
Beginning of period | 388,724,530 | 253,957,656 |
End of period (including accumulated net investment loss of $379,346 and undistributed net investment income of $0, respectively) | $ 479,395,035 | $ 388,724,530 |
Financial Highlights - Initial Class
| Six months ended June 30, 2011 | Years ended December 31, |
| (Unaudited) | 2010 | 2009 | 2008 | 2007 | 2006 |
Selected Per-Share Data | | | | | | |
Net asset value, beginning of period | $ 10.59 | $ 9.52 | $ 7.71 | $ 12.63 | $ 12.10 | $ 11.07 |
Income from Investment Operations | | | | | | |
Net investment income (loss) E | - H | .26 | .33 | .32 | .35 | .26 |
Net realized and unrealized gain (loss) | .49 | 1.11 | 1.88 | (4.38) | .88 | 1.06 |
Total from investment operations | .49 | 1.37 | 2.21 | (4.06) | 1.23 | 1.32 |
Distributions from net investment income | - | (.22) | (.29) | (.28) | (.27) | (.18) |
Distributions from net realized gain | - | (.08) | (.11) | (.59) | (.43) | (.11) |
Total distributions | - | (.30) | (.40) I | (.86) J | (.70) K | (.29) |
Net asset value, end of period | $ 11.08 | $ 10.59 | $ 9.52 | $ 7.71 | $ 12.63 | $ 12.10 |
Total Return B, C, D | 4.63% | 14.49% | 28.97% | (32.60)% | 10.23% | 11.95% |
Ratios to Average Net Assets F, G | | | | | | |
Expenses before reductions L | .00% A | .00% | .00% | .00% | .00% | .00% |
Expenses net of fee waivers, if any | .00% A | .00% | .00% | .00% | .00% | .00% |
Expenses net of all reductions | .00% A | .00% | .00% | .00% | .00% | .00% |
Net investment income (loss) | .04% A | 2.61% | 3.93% | 3.07% | 2.76% | 2.21% |
Supplemental Data | | | | | | |
Net assets, end of period (000 omitted) | $ 52,531 | $ 45,225 | $ 38,330 | $ 33,089 | $ 31,465 | $ 21,356 |
Portfolio turnover rate | 11% A | 21% | 18% | 24% | 12% | 21% |
A Annualized B Total returns for periods of less than one year are not annualized. C Total returns do not reflect charges attributable to your insurance company's separate account. Inclusion of these charges would reduce the total returns shown. D Total returns would have been lower if certain expenses had not been reduced during the applicable periods shown. E Calculated based on average shares outstanding during the period. F Amounts do not include the activity of the underlying funds. G Expense ratios reflect operating expenses of the class. Expenses before reductions do not reflect amounts reimbursed by the investment adviser or reductions from expense offset arrangements and do not represent the amount paid by the class during periods when reimbursements or reductions occur. Expenses net of fee waivers reflect expenses after reimbursement by the investment adviser but prior to reductions from expense offset arrangements. Expenses net of all reductions represent the net expenses paid by the class but do not include expenses of the investment companies in which the Fund invests. H Amount represents less than $.01 per share. I Total distributions of $.40 per share is comprised of distributions from net investment income of $.293 and distributions from net realized gain of $.107 per share. J Total distributions of $.86 per share is comprised of distributions from net investment income of $.279 and distributions from net realized gain of $.585 per share. K Total distributions of $.70 per share is comprised of distributions from net investment income of $.273 and distributions from net realized gain of $.425 per share. L Amount represents less than .01%. |
See accompanying notes which are an integral part of the financial statements.
Semiannual Report
Financial Highlights - Service Class
| Six months ended June 30, 2011 | Years ended December 31, |
| (Unaudited) | 2010 | 2009 | 2008 | 2007 | 2006 |
Selected Per-Share Data | | | | | | |
Net asset value, beginning of period | $ 10.58 | $ 9.50 | $ 7.70 | $ 12.62 | $ 12.09 | $ 11.07 |
Income from Investment Operations | | | | | | |
Net investment income (loss) E | - H | .25 | .32 | .31 | .34 | .25 |
Net realized and unrealized gain (loss) | .48 | 1.12 | 1.87 | (4.38) | .88 | 1.06 |
Total from investment operations | .48 | 1.37 | 2.19 | (4.07) | 1.22 | 1.31 |
Distributions from net investment income | - | (.21) | (.29) | (.27) | (.26) | (.18) |
Distributions from net realized gain | - | (.08) | (.11) | (.59) | (.43) | (.11) |
Total distributions | - | (.29) | (.39) I | (.85) J | (.69) K | (.29) |
Net asset value, end of period | $ 11.06 | $ 10.58 | $ 9.50 | $ 7.70 | $ 12.62 | $ 12.09 |
Total Return B,C,D | 4.54% | 14.52% | 28.78% | (32.71)% | 10.17% | 11.81% |
Ratios to Average Net Assets F,G | | | | | | |
Expenses before reductions | .10% A | .10% | .10% | .10% | .10% | .10% |
Expenses net of fee waivers, if any | .10% A | .10% | .10% | .10% | .10% | .10% |
Expenses net of all reductions | .10% A | .10% | .10% | .10% | .10% | .10% |
Net investment income (loss) | (.06)% A | 2.51% | 3.83% | 2.97% | 2.66% | 2.11% |
Supplemental Data | | | | | | |
Net assets, end of period (000 omitted) | $ 38,620 | $ 33,244 | $ 25,941 | $ 18,325 | $ 19,881 | $ 6,555 |
Portfolio turnover rate | 11% A | 21% | 18% | 24% | 12% | 21% |
A Annualized B Total returns for periods of less than one year are not annualized. C Total returns do not reflect charges attributable to your insurance company's separate account. Inclusion of these charges would reduce the total returns shown. D Total returns would have been lower if certain expenses had not been reduced during the applicable periods shown. E Calculated based on average shares outstanding during the period. F Amounts do not include the activity of the underlying funds. G Expense ratios reflect operating expenses of the class. Expenses before reductions do not reflect amounts reimbursed by the investment adviser or reductions from expense offset arrangements and do not represent the amount paid by the class during periods when reimbursements or reductions occur. Expenses net of fee waivers reflect expenses after reimbursement by the investment adviser but prior to reductions from expense offset arrangements. Expenses net of all reductions represent the net expenses paid by the class but do not include expenses of the investment companies in which the Fund invests. H Amount represents less than $.01 per share. I Total distributions of $.39 per share is comprised of distributions from net investment income of $.285 and distributions from net realized gain of $.107 per share. J Total distributions of $.85 per share is comprised of distributions from net investment income of $.269 and distributions from net realized gain of $.585 per share. K Total distributions of $.69 per share is comprised of distributions from net investment income of $.264 and distributions from net realized gain of $.425 per share. |
Financial Highlights - Service Class 2
| Six months ended June 30, 2011 | Years ended December 31, |
| (Unaudited) | 2010 | 2009 | 2008 | 2007 | 2006 |
Selected Per-Share Data | | | | | | |
Net asset value, beginning of period | $ 10.55 | $ 9.48 | $ 7.69 | $ 12.60 | $ 12.08 | $ 11.06 |
Income from Investment Operations | | | | | | |
Net investment income (loss) E | (.01) | .23 | .31 | .30 | .32 | .23 |
Net realized and unrealized gain (loss) | .48 | 1.12 | 1.86 | (4.37) | .87 | 1.07 |
Total from investment operations | .47 | 1.35 | 2.17 | (4.07) | 1.19 | 1.30 |
Distributions from net investment income | - | (.20) | (.28) | (.26) | (.25) | (.17) |
Distributions from net realized gain | - | (.08) | (.11) | (.59) | (.43) | (.11) |
Total distributions | - | (.28) | (.38) H | (.84) I | (.67) J | (.28) |
Net asset value, end of period | $ 11.02 | $ 10.55 | $ 9.48 | $ 7.69 | $ 12.60 | $ 12.08 |
Total Return B,C,D | 4.45% | 14.33% | 28.55% | (32.80)% | 9.97% | 11.70% |
Ratios to Average Net Assets F,G | | | | | | |
Expenses before reductions | .25% A | .25% | .25% | .25% | .25% | .25% |
Expenses net of fee waivers, if any | .25% A | .25% | .25% | .25% | .25% | .25% |
Expenses net of all reductions | .25% A | .25% | .25% | .25% | .25% | .25% |
Net investment income (loss) | (.21)% A | 2.36% | 3.68% | 2.82% | 2.51% | 1.96% |
Supplemental Data | | | | | | |
Net assets, end of period (000 omitted) | $ 388,243 | $ 310,255 | $ 189,686 | $ 106,530 | $ 119,395 | $ 56,810 |
Portfolio turnover rate | 11% A | 21% | 18% | 24% | 12% | 21% |
A Annualized B Total returns for periods of less than one year are not annualized. C Total returns do not reflect charges attributable to your insurance company's separate account. Inclusion of these charges would reduce the total returns shown. D Total returns would have been lower if certain expenses had not been reduced during the applicable periods shown. E Calculated based on average shares outstanding during the period. F Amounts do not include the activity of the underlying funds. G Expense ratios reflect operating expenses of the class. Expenses before reductions do not reflect amounts reimbursed by the investment adviser or reductions from expense offset arrangements and do not represent the amount paid by the class during periods when reimbursements or reductions occur. Expenses net of fee waivers reflect expenses after reimbursement by the investment adviser but prior to reductions from expense offset arrangements. Expenses net of all reductions represent the net expenses paid by the class but do not include expenses of the investment companies in which the Fund invests. H Total distributions of $.38 per share is comprised of distributions from net investment income of $.275 and distributions from net realized gain of $.107 per share. I Total distributions of $.84 per share is comprised of distributions from net investment income of $.255 and distributions from net realized gain of $.585 per share. J Total distributions of $.67 per share is comprised of distributions from net investment income of $.249 and distributions from net realized gain of $.425 per share. |
See accompanying notes which are an integral part of the financial statements.
Semiannual Report
VIP Freedom 2025 Portfolio
Investment Changes (Unaudited)
Fund Holdings as of June 30, 2011 |
| % of fund's
net assets | % of fund's net assets
6 months ago |
Domestic Equity Funds | | |
VIP Contrafund Portfolio Initial Class | 8.1 | 8.3 |
VIP Equity-Income Portfolio Initial Class | 9.4 | 9.7 |
VIP Growth & Income Portfolio Initial Class | 9.4 | 9.7 |
VIP Growth Portfolio Initial Class | 9.6 | 9.7 |
VIP Mid Cap Portfolio Initial Class | 3.3 | 3.4 |
VIP Value Portfolio Initial Class | 8.0 | 8.3 |
VIP Value Strategies Portfolio Initial Class | 3.4 | 3.5 |
| 51.2 | 52.6 |
Developed International Equity Funds | | |
VIP Overseas Portfolio Initial Class | 15.7 | 15.7 |
Emerging Markets Equity Funds | | |
VIP Emerging Markets Portfolio Initial Class | 2.7 | 2.6 |
High Yield Bond Funds | | |
VIP High Income Portfolio Initial Class | 7.5 | 7.3 |
Investment Grade Bond Funds | | |
VIP Investment Grade Bond Portfolio Initial Class | 22.8 | 21.7 |
Short-Term Funds | | |
VIP Money Market Portfolio Initial Class | 0.1 | 0.1 |
Net Other Assets (Liabilities)* | 0.0 | 0.0 |
| 100.0 | 100.0 |
* Amount represents less than 0.1% |
Asset Allocation (% of fund's net assets) |
Current |
| Domestic Equity Funds | 51.2% | |
| Developed International Equity Funds | 15.7% | |
| Emerging Markets Equity Funds | 2.7% | |
| High Yield Bond Funds | 7.5% | |
| Investment Grade Bond Funds | 22.8% | |
| Short-Term Funds | 0.1% | |

Six months ago |
| Domestic Equity Funds | 52.6% | |
| Developed International Equity Funds | 15.7% | |
| Emerging Markets Equity Funds | 2.6% | |
| High Yield Bond Funds | 7.3% | |
| Investment Grade Bond Funds | 21.7% | |
| Short-Term Funds | 0.1% | |

Expected |
| Domestic Equity Funds | 50.2% | |
| Developed International Equity Funds | 15.6% | |
| Emerging Markets Equity Funds | 2.7% | |
| High Yield Bond Funds | 7.5% | |
| Investment Grade Bond Funds | 23.7% | |
| Short-Term Funds | 0.3% | |

The fund invests according to an asset allocation strategy that becomes increasingly conservative over time. The six months ago allocation is based on the fund's holdings as of December 31, 2010. The current allocation is based on the fund's holdings as of June 30, 2011. The expected allocation represents the fund's anticipated allocation at December 31, 2011. |
Semiannual Report
VIP Freedom 2025 Portfolio
Investments June 30, 2011 (Unaudited)
Showing Percentage of Net Assets
Domestic Equity Funds - 51.2% |
| Shares | | Value |
Domestic Equity Funds - 51.2% |
VIP Contrafund Portfolio Initial Class | 152,545 | | $ 3,831,931 |
VIP Equity-Income Portfolio Initial Class | 220,548 | | 4,466,098 |
VIP Growth & Income Portfolio Initial Class | 337,638 | | 4,456,823 |
VIP Growth Portfolio Initial Class | 113,040 | | 4,548,742 |
VIP Mid Cap Portfolio Initial Class | 47,299 | | 1,560,863 |
VIP Value Portfolio Initial Class | 329,757 | | 3,821,885 |
VIP Value Strategies Portfolio Initial Class | 155,497 | | 1,609,392 |
TOTAL DOMESTIC EQUITY FUNDS (Cost $23,234,970) | 24,295,734 |
International Equity Funds - 18.4% |
| | | |
Developed International Equity Funds - 15.7% |
VIP Overseas Portfolio Initial Class | 421,404 | | 7,442,001 |
Emerging Markets Equity Funds - 2.7% |
VIP Emerging Markets Portfolio Initial Class | 129,631 | | 1,280,754 |
TOTAL INTERNATIONAL EQUITY FUNDS (Cost $8,413,607) | 8,722,755 |
Bond Funds - 30.3% |
| Shares | | Value |
High Yield Bond Funds - 7.5% |
VIP High Income Portfolio Initial Class | 612,189 | | $ 3,562,937 |
Investment Grade Bond Funds - 22.8% |
VIP Investment Grade Bond Portfolio Initial Class | 831,607 | | 10,810,888 |
TOTAL BOND FUNDS (Cost $14,268,051) | 14,373,825 |
Short-Term Funds - 0.1% |
| | | |
VIP Money Market Portfolio Initial Class
(Cost $71,105) | 71,105 | | 71,105 |
TOTAL INVESTMENT PORTFOLIO - 100.0% (Cost $45,987,733) | | 47,463,419 |
NET OTHER ASSETS (LIABILITIES) - 0.0% | | 398 |
NET ASSETS - 100% | $ 47,463,817 |
Other Information |
All investments are categorized as Level 1 under the Fair Value Hierarchy. The inputs or methodology used for valuing securities may not be an indication of the risk associated with investing in those securities. For more information on valuation inputs, please refer to the Security Valuation section in the accompanying Notes to Financial Statements. |
See accompanying notes which are an integral part of the financial statements.
Semiannual Report
VIP Freedom 2025 Portfolio
Statement of Assets and Liabilities
| June 30, 2011 (Unaudited) |
| | |
Assets | | |
Investment in securities, at value (cost $45,987,733) - See accompanying schedule | | $ 47,463,419 |
Receivable for investments sold | | 8,868 |
Receivable for fund shares sold | | 12,178 |
Total assets | | 47,484,465 |
| | |
Liabilities | | |
Payable to custodian bank | $ 35 | |
Payable for investments purchased | 4,855 | |
Payable for fund shares redeemed | 10,174 | |
Distribution and service plan fees payable | 5,584 | |
Total liabilities | | 20,648 |
| | |
Net Assets | | $ 47,463,817 |
Net Assets consist of: | | |
Paid in capital | | $ 46,072,945 |
Accumulated net investment loss | | (25,589) |
Accumulated undistributed net realized gain (loss) on investments | | (59,225) |
Net unrealized appreciation (depreciation) on investments | | 1,475,686 |
Net Assets | | $ 47,463,817 |
| | |
Initial Class:
Net Asset Value, offering price and redemption price per share ($17,294,563 ÷ 1,571,271 shares) | | $ 11.01 |
| | |
Service Class:
Net Asset Value, offering price and redemption price per share ($5,058,392 ÷ 460,008 shares) | | $ 11.00 |
| | |
Service Class 2:
Net Asset Value, offering price and redemption price per share ($25,110,862 ÷ 2,294,707 shares) | | $ 10.94 |
Statement of Operations
Six months ended June 30, 2011 (Unaudited) |
| | |
Investment Income | | |
Income distributions from underlying funds | | $ 6,892 |
| | |
Expenses | | |
Distribution and service plan fees | $ 32,481 | |
Independent trustees' compensation | 80 | |
Total expenses before reductions | 32,561 | |
Expense reductions | (80) | 32,481 |
Net investment income (loss) | | (25,589) |
Realized and Unrealized Gain (Loss) Realized gain (loss) on sale of underlying fund shares | 29,910 | |
Capital gain distributions from underlying funds | 188,470 | |
Total net realized gain (loss) | | 218,380 |
Change in net unrealized appreciation (depreciation) on underlying funds | | 1,939,092 |
Net gain (loss) | | 2,157,472 |
Net increase (decrease) in net assets resulting from operations | | $ 2,131,883 |
See accompanying notes which are an integral part of the financial statements.
Semiannual Report
Statement of Changes in Net Assets
| Six months ended June 30, 2011
(Unaudited) | Year ended
December 31, 2010 |
Increase (Decrease) in Net Assets | | |
Operations | | |
Net investment income (loss) | $ (25,589) | $ 797,639 |
Net realized gain (loss) | 218,380 | 159,679 |
Change in net unrealized appreciation (depreciation) | 1,939,092 | 3,475,839 |
Net increase (decrease) in net assets resulting from operations | 2,131,883 | 4,433,157 |
Distributions to shareholders from net investment income | - | (799,512) |
Distributions to shareholders from net realized gain | - | (217,768) |
Total distributions | - | (1,017,280) |
Share transactions - net increase (decrease) | 3,732,704 | 14,354,269 |
Total increase (decrease) in net assets | 5,864,587 | 17,770,146 |
| | |
Net Assets | | |
Beginning of period | 41,599,230 | 23,829,084 |
End of period (including accumulated net investment loss of $25,589 and undistributed net investment income of $0, respectively) | $ 47,463,817 | $ 41,599,230 |
Financial Highlights - Initial Class
| Six months ended June 30, 2011 | Years ended December 31, |
| (Unaudited) | 2010 | 2009 | 2008 | 2007 | 2006 |
Selected Per-Share Data | | | | | | |
Net asset value, beginning of period | $ 10.49 | $ 9.30 | $ 7.49 | $ 12.71 | $ 12.18 | $ 11.16 |
Income from Investment Operations | | | | | | |
Net investment income (loss) E | - I | .28 | .32 | .31 | .38 | .23 |
Net realized and unrealized gain (loss) | .52 | 1.19 | 1.89 | (4.58) | .89 | 1.17 |
Total from investment operations | .52 | 1.47 | 2.21 | (4.27) | 1.27 | 1.40 |
Distributions from net investment income | - | (.21) | (.29) | (.28) | (.27) | (.21) |
Distributions from net realized gain | - | (.06) | (.12) | (.67) | (.47) | (.17) |
Total distributions | - | (.28) J | (.40) K | (.95) | (.74) | (.38) |
Net asset value, end of period | $ 11.01 | $ 10.49 | $ 9.30 | $ 7.49 | $ 12.71 | $ 12.18 |
Total Return B,C,D | 4.96% | 15.79% | 30.05% | (34.16)% | 10.50% | 12.49% |
Ratios to Average Net Assets F, H | | | | | | |
Expenses before reductions G | .00% A | .00% | .00% | .00% | .00% | .00% |
Expenses net of fee waivers, if any | .00% A | .00% | .00% | .00% | .00% | .00% |
Expenses net of all reductions | .00% A | .00% | .00% | .00% | .00% | .00% |
Net investment income (loss) | .03% A | 2.91% | 3.84% | 2.90% | 2.95% | 1.95% |
Supplemental Data | | | | | | |
Net assets, end of period (000 omitted) | $ 17,295 | $ 17,388 | $ 14,888 | $ 11,015 | $ 15,197 | $ 8,363 |
Portfolio turnover rate | 23% A | 25% | 30% | 36% | 20% | 49% |
A Annualized B Total returns for periods of less than one year are not annualized. C Total returns do not reflect charges attributable to your insurance company's separate account. Inclusion of these charges would reduce the total returns shown. D Total returns would have been lower if certain expenses had not been reduced during the applicable periods shown. E Calculated based on average shares outstanding during the period. F Amounts do not include the activity of the underlying funds. G Amount represents less than .01%. H Expense ratios reflect operating expenses of the class. Expenses before reductions do not reflect amounts reimbursed by the investment adviser or reductions from expense offset arrangements and do not represent the amount paid by the class during periods when reimbursements or reductions occur. Expenses net of fee waivers reflect expenses after reimbursement by the investment adviser but prior to reductions from expense offset arrangements. Expenses net of all reductions represent the net expenses paid by the class but do not include expenses of the investment companies in which the Fund invests. I Amount represents less than $.01 per share. J Total distributions of $.28 per share is comprised of distributions from net investment income of $.214 and distributions from net realized gain of $.061 per share. K Total distributions of $.40 per share is comprised of distributions from net investment income of $.285 and distributions from net realized gain of $.117 per share. |
See accompanying notes which are an integral part of the financial statements.
Semiannual Report
Financial Highlights - Service Class
| Six months ended June 30, 2011 | Years ended December 31, |
| (Unaudited) | 2010 | 2009 | 2008 | 2007 | 2006 |
Selected Per-Share Data | | | | | | |
Net asset value, beginning of period | $ 10.49 | $ 9.30 | $ 7.49 | $ 12.70 | $ 12.18 | $ 11.16 |
Income from Investment Operations | | | | | | |
Net investment income (loss) E | - H | .27 | .31 | .29 | .37 | .22 |
Net realized and unrealized gain (loss) | .51 | 1.19 | 1.90 | (4.56) | .87 | 1.16 |
Total from investment operations | .51 | 1.46 | 2.21 | (4.27) | 1.24 | 1.38 |
Distributions from net investment income | - | (.21) | (.28) | (.27) | (.25) | (.19) |
Distributions from net realized gain | - | (.06) | (.12) | (.67) | (.47) | (.17) |
Total distributions | - | (.27) | (.40) I | (.94) | (.72) | (.36) |
Net asset value, end of period | $ 11.00 | $ 10.49 | $ 9.30 | $ 7.49 | $ 12.70 | $ 12.18 |
Total Return B,C,D | 4.86% | 15.70% | 29.96% | (34.20)% | 10.31% | 12.39% |
Ratios to Average Net Assets F,G | | | | | | |
Expenses before reductions | .10% A | .10% | .10% | .10% | .10% | .10% |
Expenses net of fee waivers, if any | .10% A | .10% | .10% | .10% | .10% | .10% |
Expenses net of all reductions | .10% A | .10% | .10% | .10% | .10% | .10% |
Net investment income (loss) | (.07)% A | 2.81% | 3.74% | 2.80% | 2.85% | 1.85% |
Supplemental Data | | | | | | |
Net assets, end of period (000 omitted) | $ 5,058 | $ 1,429 | $ 679 | $ 403 | $ 497 | $ 441 |
Portfolio turnover rate | 23% A | 25% | 30% | 36% | 20% | 49% |
A Annualized B Total returns for periods of less than one year are not annualized. C Total returns do not reflect charges attributable to your insurance company's separate account. Inclusion of these charges would reduce the total returns shown. D Total returns would have been lower if certain expenses had not been reduced during the applicable periods shown. E Calculated based on average shares outstanding during the period. F Amounts do not include the activity of the underlying funds. G Expense ratios reflect operating expenses of the class. Expenses before reductions do not reflect amounts reimbursed by the investment adviser or reductions from expense offset arrangements and do not represent the amount paid by the class during periods when reimbursements or reductions occur. Expenses net of fee waivers reflect expenses after reimbursement by the investment adviser but prior to reductions from expense offset arrangements. Expenses net of all reductions represent the net expenses paid by the class but do not include expenses of the investment companies in which the Fund invests. H Amount represents less than $.01 per share. I Total distributions of $.40 per share is comprised of distributions from net investment income of $.278 and distributions from net realized gain of $.117 per share. |
Financial Highlights - Service Class 2
| Six months ended June 30, 2011 | Years ended December 31, |
| (Unaudited) | 2010 | 2009 | 2008 | 2007 | 2006 |
Selected Per-Share Data | | | | | | |
Net asset value, beginning of period | $ 10.44 | $ 9.27 | $ 7.47 | $ 12.68 | $ 12.17 | $ 11.16 |
Income from Investment Operations | | | | | | |
Net investment income (loss) E | (.01) | .26 | .30 | .28 | .35 | .20 |
Net realized and unrealized gain (loss) | .51 | 1.17 | 1.89 | (4.57) | .89 | 1.16 |
Total from investment operations | .50 | 1.43 | 2.19 | (4.29) | 1.24 | 1.36 |
Distributions from net investment income | - | (.20) | (.27) | (.25) | (.26) | (.18) |
Distributions from net realized gain | - | (.06) | (.12) | (.67) | (.47) | (.17) |
Total distributions | - | (.26) | (.39) H | (.92) | (.73) | (.35) |
Net asset value, end of period | $ 10.94 | $ 10.44 | $ 9.27 | $ 7.47 | $ 12.68 | $ 12.17 |
Total Return B,C,D | 4.79% | 15.47% | 29.79% | (34.36)% | 10.26% | 12.18% |
Ratios to Average Net Assets F,G | | | | | | |
Expenses before reductions | .25% A | .25% | .25% | .25% | .25% | .25% |
Expenses net of fee waivers, if any | .25% A | .25% | .25% | .25% | .25% | .25% |
Expenses net of all reductions | .25% A | .25% | .25% | .25% | .25% | .25% |
Net investment income (loss) | (.22)% A | 2.67% | 3.59% | 2.65% | 2.70% | 1.70% |
Supplemental Data | | | | | | |
Net assets, end of period (000 omitted) | $ 25,111 | $ 22,782 | $ 8,262 | $ 3,676 | $ 3,998 | $ 556 |
Portfolio turnover rate | 23% A | 25% | 30% | 36% | 20% | 49% |
A Annualized B Total returns for periods of less than one year are not annualized. C Total returns do not reflect charges attributable to your insurance company's separate account. Inclusion of these charges would reduce the total returns shown. D Total returns would have been lower if certain expenses had not been reduced during the applicable periods shown. E Calculated based on average shares outstanding during the period. F Amounts do not include the activity of the underlying funds. G Expense ratios reflect operating expenses of the class. Expenses before reductions do not reflect amounts reimbursed by the investment adviser or reductions from expense offset arrangements and do not represent the amount paid by the class during periods when reimbursements or reductions occur. Expenses net of fee waivers reflect expenses after reimbursement by the investment adviser but prior to reductions from expense offset arrangements. Expenses net of all reductions represent the net expenses paid by the class but do not include expenses of the investment companies in which the Fund invests. H Total distributions of $.39 per share is comprised of distributions from net investment income of $.270 and distributions from net realized gain of $.117 per share. |
See accompanying notes which are an integral part of the financial statements.
Semiannual Report
VIP Freedom 2030 Portfolio
Investment Changes (Unaudited)
Fund Holdings as of June 30, 2011 |
| % of fund's
net assets | % of fund's net assets
6 months ago |
Domestic Equity Funds | | |
VIP Contrafund Portfolio Initial Class | 8.5 | 8.9 |
VIP Equity-Income Portfolio Initial Class | 10.0 | 10.4 |
VIP Growth & Income Portfolio Initial Class | 9.9 | 10.3 |
VIP Growth Portfolio Initial Class | 10.1 | 10.4 |
VIP Mid Cap Portfolio Initial Class | 3.5 | 3.6 |
VIP Value Portfolio Initial Class | 8.5 | 8.9 |
VIP Value Strategies Portfolio Initial Class | 3.6 | 3.8 |
| 54.1 | 56.3 |
Developed International Equity Funds | | |
VIP Overseas Portfolio Initial Class | 16.6 | 16.7 |
Emerging Markets Equity Funds | | |
VIP Emerging Markets Portfolio Initial Class | 2.9 | 2.8 |
High Yield Bond Funds | | |
VIP High Income Portfolio Initial Class | 7.5 | 7.2 |
Investment Grade Bond Funds | | |
VIP Investment Grade Bond Portfolio Initial Class | 18.9 | 17.0 |
Net Other Assets (Liabilities)* | 0.0 | 0.0 |
| 100.0 | 100.0 |
* Amount represents less than 0.1% |
Asset Allocation (% of fund's net assets) |
Current |
| Domestic Equity Funds | 54.1% | |
| Developed International Equity Funds | 16.6% | |
| Emerging Markets Equity Funds | 2.9% | |
| High Yield Bond Funds | 7.5% | |
| Investment Grade Bond Funds | 18.9% | |

Six months ago |
| Domestic Equity Funds | 56.3% | |
| Developed International Equity Funds | 16.7% | |
| Emerging Markets Equity Funds | 2.8% | |
| High Yield Bond Funds | 7.2% | |
| Investment Grade Bond Funds | 17.0% | |

Expected |
| Domestic Equity Funds | 52.6% | |
| Developed International Equity Funds | 16.3% | |
| Emerging Markets Equity Funds | 2.9% | |
| High Yield Bond Funds | 7.5% | |
| Investment Grade Bond Funds | 20.7% | |

The fund invests according to an asset allocation strategy that becomes increasingly conservative over time. The six months ago allocation is based on the fund's holdings as of December 31, 2010. The current allocation is based on the fund's holdings as of June 30, 2011. The expected allocation represents the fund's anticipated allocation at December 31, 2011. |
Semiannual Report
VIP Freedom 2030 Portfolio
Investments June 30, 2011 (Unaudited)
Showing Percentage of Net Assets
Domestic Equity Funds - 54.1% |
| Shares | | Value |
Domestic Equity Funds - 54.1% |
VIP Contrafund Portfolio Initial Class | 402,114 | | $ 10,101,106 |
VIP Equity-Income Portfolio Initial Class | 581,693 | | 11,779,289 |
VIP Growth & Income Portfolio Initial Class | 890,455 | | 11,754,006 |
VIP Growth Portfolio Initial Class | 298,065 | | 11,994,153 |
VIP Mid Cap Portfolio Initial Class | 124,607 | | 4,112,035 |
VIP Value Portfolio Initial Class | 869,503 | | 10,077,545 |
VIP Value Strategies Portfolio Initial Class | 409,639 | | 4,239,759 |
TOTAL DOMESTIC EQUITY FUNDS (Cost $62,975,591) | 64,057,893 |
International Equity Funds - 19.5% |
| | | |
Developed International Equity Funds - 16.6% |
VIP Overseas Portfolio Initial Class | 1,111,876 | | 19,635,727 |
Emerging Markets Equity Funds - 2.9% |
VIP Emerging Markets Portfolio Initial Class | 342,003 | | 3,378,992 |
TOTAL INTERNATIONAL EQUITY FUNDS (Cost $22,759,103) | 23,014,719 |
Bond Funds - 26.4% |
| Shares | | Value |
High Yield Bond Funds - 7.5% |
VIP High Income Portfolio Initial Class | 1,529,999 | | $ 8,904,592 |
Investment Grade Bond Funds - 18.9% |
VIP Investment Grade Bond Portfolio Initial Class | 1,719,930 | | 22,359,093 |
TOTAL BOND FUNDS (Cost $30,881,055) | 31,263,685 |
TOTAL INVESTMENT PORTFOLIO - 100.0% (Cost $116,615,749) | | 118,336,297 |
NET OTHER ASSETS (LIABILITIES) - 0.0% | | (40,488) |
NET ASSETS - 100% | $ 118,295,809 |
Other Information |
All investments are categorized as Level 1 under the Fair Value Hierarchy. The inputs or methodology used for valuing securities may not be an indication of the risk associated with investing in those securities. For more information on valuation inputs, please refer to the Security Valuation section in the accompanying Notes to Financial Statements. |
See accompanying notes which are an integral part of the financial statements.
Semiannual Report
VIP Freedom 2030 Portfolio
Statement of Assets and Liabilities
| June 30, 2011 (Unaudited) |
Assets | | |
Investment in securities, at value (cost $116,615,749) - See accompanying schedule | | $ 118,336,297 |
Receivable for fund shares sold | | 298,308 |
Total assets | | 118,634,605 |
| | |
Liabilities | | |
Payable to custodian bank | $ 18,637 | |
Payable for investments purchased | 204,019 | |
Payable for fund shares redeemed | 102,081 | |
Distribution and service plan fees payable | 14,059 | |
Total liabilities | | 338,796 |
| | |
Net Assets | | $ 118,295,809 |
Net Assets consist of: | | |
Paid in capital | | $ 117,311,610 |
Accumulated net investment loss | | (67,212) |
Accumulated undistributed net realized gain (loss) on investments | | (669,137) |
Net unrealized appreciation (depreciation) on investments | | 1,720,548 |
Net Assets | | $ 118,295,809 |
| |
Initial Class:
Net Asset Value, offering price and redemption price per share ($32,357,829 ÷ 3,017,027 shares) | | $ 10.73 |
| | |
Service Class:
Net Asset Value, offering price and redemption price per share ($28,971,510 ÷ 2,705,332 shares) | | $ 10.71 |
| | |
Service Class 2:
Net Asset Value, offering price and redemption price per share ($56,966,470 ÷ 5,335,080 shares) | | $ 10.68 |
Statement of Operations
Six months ended June 30, 2011 (Unaudited) |
| | |
Investment Income | | |
Income distributions from underlying funds | | $ 14,555 |
Interest | | 1 |
Total income | | 14,556 |
| | |
Expenses | | |
Distribution and service plan fees | $ 81,768 | |
Independent trustees' compensation | 196 | |
Total expenses before reductions | 81,964 | |
Expense reductions | (196) | 81,768 |
Net investment income (loss) | | (67,212) |
Realized and Unrealized Gain (Loss) Realized gain (loss) on sale of underlying fund shares | 15,383 | |
Capital gain distributions from underlying funds | 374,725 | |
Total net realized gain (loss) | | 390,108 |
Change in net unrealized appreciation (depreciation) on underlying funds | | 4,866,999 |
Net gain (loss) | | 5,257,107 |
Net increase (decrease) in net assets resulting from operations | | $ 5,189,895 |
See accompanying notes which are an integral part of the financial statements.
Semiannual Report
VIP Freedom 2030 Portfolio
Financial Statements - continued
Statement of Changes in Net Assets
| Six months ended
June 30, 2011
(Unaudited) | Year ended
December 31,
2010 |
Increase (Decrease) in Net Assets | | |
Operations | | |
Net investment income (loss) | $ (67,212) | $ 1,775,471 |
Net realized gain (loss) | 390,108 | 472,595 |
Change in net unrealized appreciation (depreciation) | 4,866,999 | 10,749,816 |
Net increase (decrease) in net assets resulting from operations | 5,189,895 | 12,997,882 |
Distributions to shareholders from net investment income | - | (1,775,488) |
Distributions to shareholders from net realized gain | - | (668,951) |
Total distributions | - | (2,444,439) |
Share transactions - net increase (decrease) | 11,478,020 | 16,267,172 |
Total increase (decrease) in net assets | 16,667,915 | 26,820,615 |
| | |
Net Assets | | |
Beginning of period | 101,627,894 | 74,807,279 |
End of period (including accumulated net investment loss of $67,212 and undistributed net investment income of $0 respectively) | $ 118,295,809 | $ 101,627,894 |
Financial Highlights - Initial Class
| Six months ended
June 30, 2011 | Years ended December 31, |
| (Unaudited) | 2010 | 2009 | 2008 | 2007 | 2006 |
Selected Per-Share Data | | | | | | |
Net asset value, beginning of period | $ 10.21 | $ 9.03 | $ 7.12 | $ 13.02 | $ 12.44 | $ 11.27 |
Income from Investment Operations | | | | | | |
Net investment income (loss) E | - I | .21 | .24 | .28 | .34 | .24 |
Net realized and unrealized gain (loss) | .52 | 1.24 | 1.96 | (5.14) | 1.06 | 1.25 |
Total from investment operations | .52 | 1.45 | 2.20 | (4.86) | 1.40 | 1.49 |
Distributions from net investment income | - | (.20) | (.18) | (.25) | (.28) | (.19) |
Distributions from net realized gain | - | (.07) | (.11) | (.80) | (.54) | (.13) |
Total distributions | - | (.27) | (.29) | (1.04) J | (.82) | (.32) |
Net asset value, end of period | $ 10.73 | $ 10.21 | $ 9.03 | $ 7.12 | $ 13.02 | $ 12.44 |
Total Return B, C, D | 5.09% | 16.08% | 31.66% | (38.04)% | 11.37% | 13.20% |
Ratios to Average Net Assets F, H | | | | | | |
Expenses before reductions G | .00% A | .00% | .00% | .00% | .00% | .00% |
Expenses net of fee waivers, if any | .00% A | .00% | .00% | .00% | .00% | .00% |
Expenses net of all reductions | .00% A | .00% | .00% | .00% | .00% | .00% |
Net investment income (loss) | .03% A | 2.25% | 3.13% | 2.69% | 2.56% | 2.05% |
Supplemental Data | | | | | | |
Net assets, end of period (000 omitted) | $ 32,358 | $ 28,917 | $ 23,836 | $ 19,592 | $ 23,767 | $ 14,298 |
Portfolio turnover rate | 17% A | 25% | 24% | 23% | 17% | 32% |
A Annualized B Total returns for periods of less than one year are not annualized. C Total returns do not reflect charges attributable to your insurance company's separate account. Inclusion of these charges would reduce the total returns shown. D Total returns would have been lower if certain expenses had not been reduced during the applicable periods shown. E Calculated based on average shares outstanding during the period. F Amounts do not include the activity of the underlying funds. G Amount represents less than .01%. H Expense ratios reflect operating expenses of the class. Expenses before reductions do not reflect amounts reimbursed by the investment adviser or reductions from expense offset arrangements and do not represent the amount paid by the class during periods when reimbursements or reductions occur. Expenses net of fee waivers reflect expenses after reimbursement by the investment adviser but prior to reductions from expense offset arrangements. Expenses net of all reductions represent the net expenses paid by the class but do not include expenses of the investment companies in which the Fund invests. I Amount represents less than $.01 per share. J Total distributions of $1.04 per share is comprised of distributions from net investment income of $.245 and distributions from net realized gain of $.795 per share. |
See accompanying notes which are an integral part of the financial statements.
Semiannual Report
Financial Highlights - Service Class
| Six months ended
June 30, 2011 | Years ended December 31, |
| (Unaudited) | 2010 | 2009 | 2008 | 2007 | 2006 |
Selected Per-Share Data | | | | | | |
Net asset value, beginning of period | $ 10.20 | $ 9.02 | $ 7.12 | $ 13.01 | $ 12.44 | $ 11.27 |
Income from Investment Operations | | | | | | |
Net investment income (loss) E | - H | .20 | .24 | .27 | .33 | .23 |
Net realized and unrealized gain (loss) | .51 | 1.24 | 1.94 | (5.13) | 1.05 | 1.25 |
Total from investment operations | .51 | 1.44 | 2.18 | (4.86) | 1.38 | 1.48 |
Distributions from net investment income | - | (.19) | (.17) | (.24) | (.27) | (.18) |
Distributions from net realized gain | - | (.07) | (.11) | (.80) | (.54) | (.13) |
Total distributions | - | (.26) | (.28) | (1.03) I | (.81) | (.31) |
Net asset value, end of period | $ 10.71 | $ 10.20 | $ 9.02 | $ 7.12 | $ 13.01 | $ 12.44 |
Total Return B, C, D | 5.00% | 16.00% | 31.40% | (38.08)% | 11.21% | 13.15% |
Ratios to Average Net Assets F, G | | | | | | |
Expenses before reductions | .10% A | .10% | .10% | .10% | .10% | .10% |
Expenses net of fee waivers, if any | .10% A | .10% | .10% | .10% | .10% | .10% |
Expenses net of all reductions | .10% A | .10% | .10% | .10% | .10% | .10% |
Net investment income (loss) | (.07)% A | 2.15% | 3.03% | 2.59% | 2.46% | 1.95% |
Supplemental Data | | | | | | |
Net assets, end of period (000 omitted) | $ 28,972 | $ 23,137 | $ 16,162 | $ 10,298 | $ 12,884 | $ 3,867 |
Portfolio turnover rate | 17% A | 25% | 24% | 23% | 17% | 32% |
A Annualized B Total returns for periods of less than one year are not annualized. C Total returns do not reflect charges attributable to your insurance company's separate account. Inclusion of these charges would reduce the total returns shown. D Total returns would have been lower if certain expenses had not been reduced during the applicable periods shown. E Calculated based on average shares outstanding during the period. F Amounts do not include the activity of the underlying funds. G Expense ratios reflect operating expenses of the class. Expenses before reductions do not reflect amounts reimbursed by the investment adviser or reductions from expense offset arrangements and do not represent the amount paid by the class during periods when reimbursements or reductions occur. Expenses net of fee waivers reflect expenses after reimbursement by the investment adviser but prior to reductions from expense offset arrangements. Expenses net of all reductions represent the net expenses paid by the class but do not include expenses of the investment companies in which the Fund invests. H Amount represents less than $.01 per share. I Total distributions of $1.03 per share is comprised of distributions from net investment income of $.235 and distributions from net realized gain of $.795 per share. |
Financial Highlights - Service Class 2
| Six months ended
June 30, 2011 | Years ended December 31, |
| (Unaudited) | 2010 | 2009 | 2008 | 2007 | 2006 |
Selected Per-Share Data | | | | | | |
Net asset value, beginning of period | $ 10.18 | $ 9.00 | $ 7.11 | $ 12.99 | $ 12.42 | $ 11.26 |
Income from Investment Operations | | | | | | |
Net investment income (loss) E | (.01) | .19 | .23 | .26 | .31 | .21 |
Net realized and unrealized gain (loss) | .51 | 1.24 | 1.93 | (5.12) | 1.05 | 1.25 |
Total from investment operations | .50 | 1.43 | 2.16 | (4.86) | 1.36 | 1.46 |
Distributions from net investment income | - | (.17) | (.16) | (.22) | (.25) | (.17) |
Distributions from net realized gain | - | (.07) | (.11) | (.80) | (.54) | (.13) |
Total distributions | - | (.25) H | (.27) | (1.02) I | (.79) | (.30) |
Net asset value, end of period | $ 10.68 | $ 10.18 | $ 9.00 | $ 7.11 | $ 12.99 | $ 12.42 |
Total Return B, C, D | 4.91% | 15.89% | 31.18% | (38.17)% | 11.08% | 12.92% |
Ratios to Average Net Assets F, G | | | | | | |
Expenses before reductions | .25% A | .25% | .25% | .25% | .25% | .25% |
Expenses net of fee waivers, if any | .25% A | .25% | .25% | .25% | .25% | .25% |
Expenses net of all reductions | .25% A | .25% | .25% | .25% | .25% | .25% |
Net investment income (loss) | (.22)% A | 2.01% | 2.88% | 2.44% | 2.31% | 1.80% |
Supplemental Data | | | | | | |
Net assets, end of period (000 omitted) | $ 56,966 | $ 49,574 | $ 34,809 | $ 19,273 | $ 24,148 | $ 15,774 |
Portfolio turnover rate | 17% A | 25% | 24% | 23% | 17% | 32% |
A Annualized B Total returns for periods of less than one year are not annualized. C Total returns do not reflect charges attributable to your insurance company's separate account. Inclusion of these charges would reduce the total returns shown. D Total returns would have been lower if certain expenses had not been reduced during the applicable periods shown. E Calculated based on average shares outstanding during the period. F Amounts do not include the activity of the underlying funds. G Expense ratios reflect operating expenses of the class. Expenses before reductions do not reflect amounts reimbursed by the investment adviser or reductions from expense offset arrangements and do not represent the amount paid by the class during periods when reimbursements or reductions occur. Expenses net of fee waivers reflect expenses after reimbursement by the investment adviser but prior to reductions from expense offset arrangements. Expenses net of all reductions represent the net expenses paid by the class but do not include expenses of the investment companies in which the Fund invests. H Total distributions of $.25 per share is comprised of distributions from net investment income of $.173 and distributions from net realized gain of $.072 per share. I Total distributions of 1.02 per is comprised of distributions from net investment income of $.221 and distributions from net realized gain of $.795 per share. |
See accompanying notes which are an integral part of the financial statements.
Semiannual Report
VIP Freedom 2035 Portfolio
Investment Changes (Unaudited)
Fund Holdings as of June 30, 2011 |
| % of fund's
net assets | % of fund's net assets
6 months ago |
Domestic Equity Funds | | |
VIP Contrafund Portfolio Initial Class | 9.7 | 9.8 |
VIP Equity-Income Portfolio Initial Class | 11.2 | 11.5 |
VIP Growth & Income Portfolio Initial Class | 11.2 | 11.4 |
VIP Growth Portfolio Initial Class | 11.4 | 11.4 |
VIP Mid Cap Portfolio Initial Class | 3.9 | 4.0 |
VIP Value Portfolio Initial Class | 9.6 | 9.8 |
VIP Value Strategies Portfolio Initial Class | 4.1 | 4.2 |
| 61.1 | 62.1 |
Developed International Equity Funds | | |
VIP Overseas Portfolio Initial Class | 18.8 | 18.4 |
Emerging Markets Equity Funds | | |
VIP Emerging Markets Portfolio Initial Class | 3.2 | 3.0 |
High Yield Bond Funds | | |
VIP High Income Portfolio Initial Class | 7.5 | 7.1 |
Investment Grade Bond Funds | | |
VIP Investment Grade Bond Portfolio Initial Class | 9.4 | 9.4 |
Net Other Assets (Liabilities)* | 0.0 | 0.0 |
| 100.0 | 100.0 |
* Amount represents less than 0.1% |
Asset Allocation (% of fund's net assets) |
Current |
| Domestic Equity Funds | 61.1% | |
| Developed International Equity Funds | 18.8% | |
| Emerging Markets Equity Funds | 3.2% | |
| High Yield Bond Funds | 7.5% | |
| Investment Grade Bond Funds | 9.4% | |

Six months ago |
 | Domestic Equity Funds | 62.1% | |
 | Developed International Equity Funds | 18.4% | |
| Emerging Markets Equity Funds | 3.0% | |
 | High Yield Bond Funds | 7.1% | |
| Investment Grade Bond Funds | 9.4% | |

Expected |
| Domestic Equity Funds | 60.3% | |
| Developed International Equity Funds | 18.6% | |
| Emerging Markets Equity Funds | 3.3% | |
| High Yield Bond Funds | 7.5% | |
| Investment Grade Bond Funds | 10.3% | |

The fund invests according to an asset allocation strategy that becomes increasingly conservative over time. The six months ago allocation is based on the fund's holdings as of December 31, 2010. The current allocation is based on the fund's holdings as of June 30, 2011. The expected allocation represents the fund's anticipated allocation at December 31, 2011. |
Semiannual Report
VIP Freedom 2035 Portfolio
Investments June 30, 2011 (Unaudited)
Showing Percentage of Net Assets
Domestic Equity Funds - 61.1% |
| Shares | | Value |
Domestic Equity Funds - 61.1% |
VIP Contrafund Portfolio Initial Class | 2,139 | | $ 53,732 |
VIP Equity-Income Portfolio Initial Class | 3,091 | | 62,587 |
VIP Growth & Income Portfolio Initial Class | 4,732 | | 62,461 |
VIP Growth Portfolio Initial Class | 1,584 | | 63,723 |
VIP Mid Cap Portfolio Initial Class | 663 | | 21,883 |
VIP Value Portfolio Initial Class | 4,625 | | 53,604 |
VIP Value Strategies Portfolio Initial Class | 2,178 | | 22,543 |
TOTAL DOMESTIC EQUITY FUNDS (Cost $223,523) | 340,533 |
International Equity Funds - 22.0% |
| | | |
Developed International Equity Funds - 18.8% |
VIP Overseas Portfolio Initial Class | 5,916 | | 104,472 |
Emerging Markets Equity Funds - 3.2% |
VIP Emerging Markets Portfolio Initial Class | 1,824 | | 18,023 |
TOTAL INTERNATIONAL EQUITY FUNDS (Cost $89,290) | 122,495 |
Bond Funds - 16.9% |
| Shares | | Value |
High Yield Bond Funds - 7.5% |
VIP High Income Portfolio Initial Class | 7,220 | | $ 42,021 |
Investment Grade Bond Funds - 9.4% |
VIP Investment Grade Bond Portfolio Initial Class | 4,036 | | 52,472 |
TOTAL BOND FUNDS (Cost $82,852) | 94,493 |
TOTAL INVESTMENT PORTFOLIO - 100.0% (Cost $395,665) | | 557,521 |
NET OTHER ASSETS (LIABILITIES) - 0.0% | | (74) |
NET ASSETS - 100% | $ 557,447 |
Other Information |
All investments are categorized as Level 1 under the Fair Value Hierarchy. The inputs or methodology used for valuing securities may not be an indication of the risk associated with investing in those securities. For more information on valuation inputs, please refer to the Security Valuation section in the accompanying Notes to Financial Statements. |
See accompanying notes which are an integral part of the financial statements.
Semiannual Report
VIP Freedom 2035 Portfolio
Statement of Assets and Liabilities
| June 30, 2011 (Unaudited) |
| | |
Assets | | |
Investment in securities, at value (cost $395,665) - See accompanying schedule | | $ 557,521 |
Cash | | 1 |
Receivable for investments sold | | 3 |
Receivable for fund shares sold | | 2,153 |
Total assets | | 559,678 |
| | |
Liabilities | | |
Payable for investments purchased | $ 2,133 | |
Payable for fund shares redeemed | 24 | |
Distribution and service plan fees payable | 74 | |
Total liabilities | | 2,231 |
| | |
Net Assets | | $ 557,447 |
Net Assets consist of: | | |
Paid in capital | | $ 396,099 |
Accumulated net investment loss | | (380) |
Accumulated undistributed net realized gain (loss) on investments | | (128) |
Net unrealized appreciation (depreciation) on investments | | 161,856 |
Net Assets | | $ 557,447 |
| | |
Initial Class:
Net Asset Value, offering price and redemption price per share ($115,461 ÷ 7,461.4 shares) | | $ 15.47 |
| | |
Service Class:
Net Asset Value, offering price and redemption price per share ($109,555 ÷ 7,083.0 shares) | | $ 15.47 |
| | |
Service Class 2:
Net Asset Value, offering price and redemption price per share ($332,431 ÷ 21,534.4 shares) | | $ 15.44 |
Statement of Operations
Six months ended June 30, 2011 (Unaudited) |
| | |
Investment Income | | |
Income distributions from underlying funds | | $ 56 |
| | |
Expenses | | |
Distribution and service plan fees | $ 436 | |
Total expenses | | 436 |
Net investment income (loss) | | (380) |
Realized and Unrealized Gain (Loss) Realized gain (loss) on sale of underlying fund shares | (634) | |
Capital gain distributions from underlying funds | 1,182 | |
Total net realized gain (loss) | | 548 |
Change in net unrealized appreciation (depreciation) on underlying funds | | 25,157 |
Net gain (loss) | | 25,705 |
Net increase (decrease) in net assets resulting from operations | | $ 25,325 |
See accompanying notes which are an integral part of the financial statements.
Semiannual Report
Statement of Changes in Net Assets
| Six months ended
June 30, 2011
(Unaudited) | Year ended
December 31,
2010 |
Increase (Decrease) in Net Assets | | |
Operations | | |
Net investment income (loss) | $ (380) | $ 7,448 |
Net realized gain (loss) | 548 | 25,939 |
Change in net unrealized appreciation (depreciation) | 25,157 | 27,693 |
Net increase (decrease) in net assets resulting from operations | 25,325 | 61,080 |
Distributions to shareholders from net investment income | - | (7,448) |
Distributions to shareholders from net realized gain | (1,094) | (29,333) |
Total distributions | (1,094) | (36,781) |
Share transactions - net increase (decrease) | 85,628 | (3,350) |
Total increase (decrease) in net assets | 109,859 | 20,949 |
| | |
Net Assets | | |
Beginning of period | 447,588 | 426,639 |
End of period (including accumulated net investment loss of $380 and undistributed net investment income of $0, respectively) | $ 557,447 | $ 447,588 |
Financial Highlights - Initial Class
| Six months ended
June 30, 2011 | Years ended December 31, |
| (Unaudited) | 2010 | 2009 F |
Selected Per-Share Data | | | |
Net asset value, beginning of period | $ 14.74 | $ 13.74 | $ 10.00 |
Income from Investment Operations | | | |
Net investment income (loss) D | - H | .27 | .25 |
Net realized and unrealized gain (loss) | .76 | 2.04 | 3.76 |
Total from investment operations | .77 | 2.31 | 4.01 |
Distributions from net investment income | - | (.28) | (.25) |
Distributions from net realized gain | (.03) | (1.03) | (.01) |
Total distributions | (.03) | (1.31) | (.27) I |
Net asset value, end of period | $ 15.47 | $ 14.74 | $ 13.74 |
Total Return B, C | 5.16% | 17.01% | 40.04% |
Ratios to Average Net Assets E, G | | | |
Expenses before reductions | .00% A | .00% | .00% A |
Expenses net of fee waivers, if any | .00% A | .00% | .00% A |
Expenses net of all reductions | .00% A | .00% | .00% A |
Net investment income (loss) | .02% A | 1.92% | 2.78% A |
Supplemental Data | | | |
Net assets, end of period (000 omitted) | $ 115 | $ 121 | $ 144 |
Portfolio turnover rate | 27% A | 38% | 5% A |
A Annualized B Total returns for periods of less than one year are not annualized. C Total returns do not reflect charges attributable to your insurance company's separate account. Inclusion of these charges would reduce the total returns shown. D Calculated based on average shares outstanding during the period. E Amounts do not include the activity of the underlying funds. F For the period April 8, 2009 (commencement of operations) to December 31, 2009. G Expense ratios reflect operating expenses of the class. Expenses before reductions do not reflect amounts reimbursed by the investment adviser or reductions from expense offset arrangements and do not represent the amount paid by the class during periods when reimbursements or reductions occur. Expense ratios before reductions for start-up periods may not be representative of longer-term operating periods. Expenses net of fee waivers reflect expenses after reimbursement by the investment adviser but prior to reductions from expense offset arrangements. Expenses net of all reductions represent the net expenses paid by the class but do not include expenses of the investment companies in which the Fund invests. H Amount represents less than $.01 per share. I Total distributions of $.27 per share is comprised of distributions from net investment income of $.252 and distributions from net realized gain of $.014 per share. |
See accompanying notes which are an integral part of the financial statements.
Semiannual Report
Financial Highlights - Service Class
| Six months ended
June 30, 2011 | Years ended December 31, |
| (Unaudited) | 2010 | 2009 F |
Selected Per-Share Data | | | |
Net asset value, beginning of period | $ 14.74 | $ 13.73 | $ 10.00 |
Income from Investment Operations | | | |
Net investment income (loss) D | (.01) | .26 | .24 |
Net realized and unrealized gain (loss) | .77 | 2.04 | 3.75 |
Total from investment operations | .76 | 2.30 | 3.99 |
Distributions from net investment income | - | (.26) | (.24) |
Distributions from net realized gain | (.03) | (1.03) | (.01) |
Total distributions | (.03) | (1.29) | (.26) H |
Net asset value, end of period | $ 15.47 | $ 14.74 | $ 13.73 |
Total Return B, C | 5.16% | 16.97% | 39.85% |
Ratios to Average Net Assets E, G | | | |
Expenses before reductions | .10% A | .10% | .10% A |
Expenses net of fee waivers, if any | .10% A | .10% | .10% A |
Expenses net of all reductions | .10% A | .10% | .10% A |
Net investment income (loss) | (.08)% A | 1.82% | 2.68% A |
Supplemental Data | | | |
Net assets, end of period (000 omitted) | $ 110 | $ 116 | $ 140 |
Portfolio turnover rate | 27% A | 38% | 5% A |
A Annualized B Total returns for periods of less than one year are not annualized. C Total returns do not reflect charges attributable to your insurance company's separate account. Inclusion of these charges would reduce the total returns shown. D Calculated based on average shares outstanding during the period. E Amounts do not include the activity of the underlying funds. F For the period April 8, 2009 (commencement of operations) to December 31, 2009. G Expense ratios reflect operating expenses of the class. Expenses before reductions do not reflect amounts reimbursed by the investment adviser or reductions from expense offset arrangements and do not represent the amount paid by the class during periods when reimbursements or reductions occur. Expense ratios before reductions for start-up periods may not be representative of longer-term operating periods. Expenses net of fee waivers reflect expenses after reimbursement by the investment adviser but prior to reductions from expense offset arrangements. Expenses net of all reductions represent the net expenses paid by the class but do not include expenses of the investment companies in which the Fund invests. H Total distributions of $.26 per share is comprised of distributions from net investment income of $.243 and distributions from net realized gain of $.014 per share. |
Financial Highlights - Service Class 2
| Six months ended
June 30, 2011 | Years ended December 31, |
| (Unaudited) | 2010 | 2009 F |
Selected Per-Share Data | | | |
Net asset value, beginning of period | $ 14.72 | $ 13.73 | $ 10.00 |
Income from Investment Operations | | | |
Net investment income (loss) D | (.02) | .24 | .23 |
Net realized and unrealized gain (loss) | .77 | 2.03 | 3.74 |
Total from investment operations | .75 | 2.27 | 3.97 |
Distributions from net investment income | - | (.26) | (.23) |
Distributions from net realized gain | (.03) | (1.03) | (.01) |
Total distributions | (.03) | (1.28) H | (.24) I |
Net asset value, end of period | $ 15.44 | $ 14.72 | $ 13.73 |
Total Return B, C | 5.10% | 16.76% | 39.72% |
Ratios to Average Net Assets E, G | | | |
Expenses before reductions | .25% A | .25% | .25% A |
Expenses net of fee waivers, if any | .25% A | .25% | .25% A |
Expenses net of all reductions | .25% A | .25% | .25% A |
Net investment income (loss) | (.23)% A | 1.67% | 2.53% A |
Supplemental Data | | | |
Net assets, end of period (000 omitted) | $ 332 | $ 211 | $ 143 |
Portfolio turnover rate | 27% A | 38% | 5% A |
A Annualized B Total returns for periods of less than one year are not annualized. C Total returns do not reflect charges attributable to your insurance company's separate account. Inclusion of these charges would reduce the total returns shown. D Calculated based on average shares outstanding during the period. E Amounts do not include the activity of the underlying funds. F For the period April 8, 2009 (commencement of operations) to December 31, 2009. G Expense ratios reflect operating expenses of the class. Expenses before reductions do not reflect amounts reimbursed by the investment adviser or reductions from expense offset arrangements and do not represent the amount paid by the class during periods when reimbursements or reductions occur. Expense ratios before reductions for start-up periods may not be representative of longer-term operating periods. Expenses net of fee waivers reflect expenses after reimbursement by the investment adviser but prior to reductions from expense offset arrangements. Expenses net of all reductions represent the net expenses paid by the class but do not include expenses of the investment companies in which the Fund invests. H Total distributions of $1.28 per share is comprised of distributions from net investment income of $.255 and distributions from net realized gain of $1.029 per share. I Total distributions of $.24 per share is comprised of distributions from net investment income of $.230 and distributions from net realized gain of $.014 per share. |
See accompanying notes which are an integral part of the financial statements.
Semiannual Report
VIP Freedom 2040 Portfolio
Investment Changes (Unaudited)
Fund Holdings as of June 30, 2011 |
| % of fund's
net assets | % of fund's net assets
6 months ago |
Domestic Equity Funds | | |
VIP Contrafund Portfolio Initial Class | 9.7 | 9.9 |
VIP Equity-Income Portfolio Initial Class | 11.3 | 11.5 |
VIP Growth & Income Portfolio Initial Class | 11.2 | 11.5 |
VIP Growth Portfolio Initial Class | 11.4 | 11.5 |
VIP Mid Cap Portfolio Initial Class | 3.9 | 4.0 |
VIP Value Portfolio Initial Class | 9.7 | 9.9 |
VIP Value Strategies Portfolio Initial Class | 4.1 | 4.2 |
| 61.3 | 62.5 |
Developed International Equity Funds | | |
VIP Overseas Portfolio Initial Class | 18.8 | 18.6 |
Emerging Markets Equity Funds | | |
VIP Emerging Markets Portfolio Initial Class | 3.3 | 3.2 |
High Yield Bond Funds | | |
VIP High Income Portfolio Initial Class | 8.3 | 8.1 |
Investment Grade Bond Funds | | |
VIP Investment Grade Bond Portfolio Initial Class | 8.3 | 7.6 |
Net Other Assets (Liabilities)* | 0.0 | 0.0 |
| 100.0 | 100.0 |
* Amount represents less than 0.1% |
Asset Allocation (% of fund's net assets) |
Current |
| Domestic Equity Funds | 61.3% | |
| Developed International Equity Funds | 18.8% | |
| Emerging Markets Equity Funds | 3.3% | |
| High Yield Bond Funds | 8.3% | |
| Investment Grade Bond Funds | 8.3% | |

Six months ago |
| Domestic Equity Funds | 62.5% | |
| Developed International Equity Funds | 18.6% | |
| Emerging Markets Equity Funds | 3.2% | |
| High Yield Bond Funds | 8.1% | |
| Investment Grade Bond Funds | 7.6% | |

Expected |
| Domestic Equity Funds | 60.8% | |
| Developed International Equity Funds | 18.8% | |
| Emerging Markets Equity Funds | 3.3% | |
| High Yield Bond Funds | 7.9% | |
| Investment Grade Bond Funds | 9.2% | |

The fund invests according to an asset allocation strategy that becomes increasingly conservative over time. The six months ago allocation is based on the fund's holdings as of December 31, 2010. The current allocation is based on the fund's holdings as of June 30, 2011. The expected allocation represents the fund's anticipated allocation at December 31, 2011. |
Semiannual Report
VIP Freedom 2040 Portfolio
Investments June 30, 2011 (Unaudited)
Showing Percentage of Net Assets
Domestic Equity Funds - 61.3% |
| Shares | | Value |
Domestic Equity Funds - 61.3% |
VIP Contrafund Portfolio Initial Class | 10,825 | | $ 271,915 |
VIP Equity-Income Portfolio Initial Class | 15,684 | | 317,611 |
VIP Growth & Income Portfolio Initial Class | 24,003 | | 316,836 |
VIP Growth Portfolio Initial Class | 8,004 | | 322,089 |
VIP Mid Cap Portfolio Initial Class | 3,370 | | 111,195 |
VIP Value Portfolio Initial Class | 23,469 | | 272,002 |
VIP Value Strategies Portfolio Initial Class | 11,022 | | 114,074 |
TOTAL DOMESTIC EQUITY FUNDS (Cost $1,598,503) | 1,725,722 |
International Equity Funds - 22.1% |
| | | |
Developed International Equity Funds - 18.8% |
VIP Overseas Portfolio Initial Class | 30,054 | | 530,760 |
Emerging Markets Equity Funds - 3.3% |
VIP Emerging Markets Portfolio Initial Class | 9,319 | | 92,071 |
TOTAL INTERNATIONAL EQUITY FUNDS (Cost $586,963) | 622,831 |
Bond Funds - 16.6% |
| Shares | | Value |
High Yield Bond Funds - 8.3% |
VIP High Income Portfolio Initial Class | 40,162 | | $ 233,740 |
Investment Grade Bond Funds - 8.3% |
VIP Investment Grade Bond Portfolio Initial Class | 18,025 | | 234,321 |
TOTAL BOND FUNDS (Cost $452,870) | 468,061 |
TOTAL INVESTMENT PORTFOLIO - 100.0% (Cost $2,638,336) | | 2,816,614 |
NET OTHER ASSETS (LIABILITIES) - 0.0% | | (280) |
NET ASSETS - 100% | $ 2,816,334 |
Other Information |
All investments are categorized as Level 1 under the Fair Value Hierarchy. The inputs or methodology used for valuing securities may not be an indication of the risk associated with investing in those securities. For more information on valuation inputs, please refer to the Security Valuation section in the accompanying Notes to Financial Statements. |
See accompanying notes which are an integral part of the financial statements.
Semiannual Report
VIP Freedom 2040 Portfolio
Statement of Assets and Liabilities
| June 30, 2011 (Unaudited) |
| | |
Assets | | |
Investment in securities, at value (cost $2,638,336) - See accompanying schedule | | $ 2,816,614 |
Receivable for fund shares sold | | 149,604 |
Total assets | | 2,966,218 |
| | |
Liabilities | | |
Payable to custodian bank | $ 812 | |
Payable for investments purchased | 148,640 | |
Payable for fund shares redeemed | 308 | |
Distribution and service plan fees payable | 124 | |
Total liabilities | | 149,884 |
| | |
Net Assets | | $ 2,816,334 |
Net Assets consist of: | | |
Paid in capital | | $ 2,645,702 |
Accumulated net investment loss | | (264) |
Accumulated undistributed net realized gain (loss) on investments | | (7,382) |
Net unrealized appreciation (depreciation) on investments | | 178,278 |
Net Assets | | $ 2,816,334 |
| | |
Initial Class:
Net Asset Value, offering price and redemption price per share ($1,446,502 ÷ 98,024 shares) | | $ 14.76 |
| | |
Service Class:
Net Asset Value, offering price and redemption price per share ($1,205,998 ÷ 81,759 shares) | | $ 14.75 |
| | |
Service Class 2:
Net Asset Value, offering price and redemption price per share ($163,834 ÷ 11,119 shares) | | $ 14.73 |
Statement of Operations
Six months ended June 30, 2011 (Unaudited) |
| | |
Investment Income | | |
Income distributions from underlying funds | | $ 150 |
| | |
Expenses | | |
Distribution and service plan fees | $ 414 | |
Total expenses | | 414 |
Net investment income (loss) | | (264) |
Realized and Unrealized Gain (Loss) Realized gain (loss) on sale of underlying fund shares | (9,123) | |
Capital gain distributions from underlying funds | 2,712 | |
Total net realized gain (loss) | | (6,411) |
Change in net unrealized appreciation (depreciation) on underlying funds | | 29,729 |
Net gain (loss) | | 23,318 |
Net increase (decrease) in net assets resulting from operations | | $ 23,054 |
See accompanying notes which are an integral part of the financial statements.
Semiannual Report
VIP Freedom 2040 Portfolio
Financial Statements - continued
Statement of Changes in Net Assets
| Six months ended
June 30, 2011
(Unaudited) | Year ended
December 31,
2010 |
Increase (Decrease) in Net Assets | | |
Operations | | |
Net investment income (loss) | $ (264) | $ 8,762 |
Net realized gain (loss) | (6,411) | 56,775 |
Change in net unrealized appreciation (depreciation) | 29,729 | 37,318 |
Net increase (decrease) in net assets resulting from operations | 23,054 | 102,855 |
Distributions to shareholders from net investment income | - | (8,846) |
Distributions to shareholders from net realized gain | - | (62,347) |
Total distributions | - | (71,193) |
Share transactions - net increase (decrease) | 2,254,893 | 80,183 |
Total increase (decrease) in net assets | 2,277,947 | 111,845 |
| | |
Net Assets | | |
Beginning of period | 538,387 | 426,542 |
End of period (including accumulated net investment loss of $264 and undistributed net investment income of $0, respectively) | $ 2,816,334 | $ 538,387 |
Financial Highlights - Initial Class
| Six months ended
June 30, 2011 | Years ended December 31, |
| (Unaudited) | 2010 | 2009 F |
Selected Per-Share Data | | | |
Net asset value, beginning of period | $ 14.02 | $ 13.82 | $ 10.00 |
Income from Investment Operations | | | |
Net investment income (loss) D | - H | .20 | .26 |
Net realized and unrealized gain (loss) | .74 | 2.15 | 3.83 |
Total from investment operations | .74 | 2.35 | 4.09 |
Distributions from net investment income | - | (.28) | (.26) |
Distributions from net realized gain | - | (1.87) | (.01) |
Total distributions | - | (2.15) | (.27) I |
Net asset value, end of period | $ 14.76 | $ 14.02 | $ 13.82 |
Total Return B, C | 5.28% | 17.19% | 40.89% |
Ratios to Average Net Assets E, G | | | |
Expenses before reductions | .00% A | .00% | .00% A |
Expenses net of fee waivers, if any | .00% A | .00% | .00% A |
Expenses net of all reductions | .00% A | .00% | .00% A |
Net investment income (loss) | .02% A | 1.46% | 2.81% A |
Supplemental Data | | | |
Net assets, end of period (000 omitted) | $ 1,447 | $ 278 | $ 145 |
Portfolio turnover rate | 62% A | 194% | 5% A |
A Annualized B Total returns for periods of less than one year are not annualized. C Total returns do not reflect charges attributable to your insurance company's separate account. Inclusion of these charges would reduce the total returns shown. D Calculated based on average shares outstanding during the period. E Amounts do not include the activity of the underlying funds. F For the period April 8, 2009 (commencement of operations) to December 31, 2009. G Expense ratios reflect operating expenses of the class. Expenses before reductions do not reflect amounts reimbursed by the investment adviser or reductions from expense offset arrangements and do not represent the amount paid by the class during periods when reimbursements or reductions occur. Expenses net of fee waivers reflect expenses after reimbursement by the investment adviser but prior to reductions from expense offset arrangements. Expenses net of all reductions represent the net expenses paid by the class but do not include expenses of the investment companies in which the Fund invests. H Amount represents less than $.01 per share. I Total distributions of $.27 per share is comprised of distributions from net investment income of $.257 and distributions from net realized gain of $.014 per share. |
See accompanying notes which are an integral part of the financial statements.
Semiannual Report
Financial Highlights - Service Class
| Six months ended
June 30, 2011 | Years ended December 31, |
| (Unaudited) | 2010 | 2009 F |
Selected Per-Share Data | | | |
Net asset value, beginning of period | $ 14.02 | $ 13.82 | $ 10.00 |
Income from Investment Operations | | | |
Net investment income (loss) D | (.01) | .19 | .25 |
Net realized and unrealized gain (loss) | .74 | 2.14 | 3.83 |
Total from investment operations | .73 | 2.33 | 4.08 |
Distributions from net investment income | - | (.26) | (.25) |
Distributions from net realized gain | - | (1.87) | (.01) |
Total distributions | - | (2.13) | (.26) H |
Net asset value, end of period | $ 14.75 | $ 14.02 | $ 13.82 |
Total Return B, C | 5.21% | 17.05% | 40.80% |
Ratios to Average Net Assets E, G | | | |
Expenses before reductions | .10% A | .10% | .10% A |
Expenses net of fee waivers, if any | .10% A | .10% | .10% A |
Expenses net of all reductions | .10% A | .10% | .10% A |
Net investment income (loss) | (.08)% A | 1.36% | 2.71% A |
Supplemental Data | | | |
Net assets, end of period (000 omitted) | $ 1,206 | $ 116 | $ 141 |
Portfolio turnover rate | 62% A | 194% | 5% A |
A Annualized B Total returns for periods of less than one year are not annualized. C Total returns do not reflect charges attributable to your insurance company's separate account. Inclusion of these charges would reduce the total returns shown. D Calculated based on average shares outstanding during the period. E Amounts do not include the activity of the underlying funds. F For the period April 8, 2009 (commencement of operations) to December 31, 2009. G Expense ratios reflect operating expenses of the class. Expenses before reductions do not reflect amounts reimbursed by the investment adviser or reductions from expense offset arrangements and do not represent the amount paid by the class during periods when reimbursements or reductions occur. Expenses net of fee waivers reflect expenses after reimbursement by the investment adviser but prior to reductions from expense offset arrangements. Expenses net of all reductions represent the net expenses paid by the class but do not include expenses of the investment companies in which the Fund invests. H Total distributions of $.26 per share is comprised of distributions from net investment income of $.248 and distributions from net realized gain of $.014 per share. |
Financial Highlights - Service Class 2
| Six months ended
June 30, 2011 | Years ended December 31, |
| (Unaudited) | 2010 | 2009 F |
Selected Per-Share Data | | | |
Net asset value, beginning of period | $ 14.02 | $ 13.82 | $ 10.00 |
Income from Investment Operations | | | |
Net investment income (loss) D | (.02) | .17 | .23 |
Net realized and unrealized gain (loss) | .73 | 2.14 | 3.84 |
Total from investment operations | .71 | 2.31 | 4.07 |
Distributions from net investment income | - | (.24) | (.23) |
Distributions from net realized gain | - | (1.87) | (.01) |
Total distributions | - | (2.11) | (.25) H |
Net asset value, end of period | $ 14.73 | $ 14.02 | $ 13.82 |
Total Return B, C | 5.06% | 16.92% | 40.66% |
Ratios to Average Net Assets E, G | | | |
Expenses before reductions | .25% A | .25% | .25% A |
Expenses net of fee waivers, if any | .25% A | .25% | .25% A |
Expenses net of all reductions | .25% A | .25% | .25% A |
Net investment income (loss) | (.23)% A | 1.21% | 2.56% A |
Supplemental Data | | | |
Net assets, end of period (000 omitted) | $ 164 | $ 144 | $ 141 |
Portfolio turnover rate | 62% A | 194% | 5% A |
A Annualized B Total returns for periods of less than one year are not annualized. C Total returns do not reflect charges attributable to your insurance company's separate account. Inclusion of these charges would reduce the total returns shown. D Calculated based on average shares outstanding during the period. E Amounts do not include the activity of the underlying funds. F For the period April 8, 2009 (commencement of operations) to December 31, 2009. G Expense ratios reflect operating expenses of the class. Expenses before reductions do not reflect amounts reimbursed by the investment adviser or reductions from expense offset arrangements and do not represent the amount paid by the class during periods when reimbursements or reductions occur. Expenses net of fee waivers reflect expenses after reimbursement by the investment adviser but prior to reductions from expense offset arrangements. Expenses net of all reductions represent the net expenses paid by the class but do not include expenses of the investment companies in which the Fund invests. H Total distributions of $.25 per share is comprised of distributions from net investment income of $.234 and distributions from net realized gain of $.014 per share. |
See accompanying notes which are an integral part of the financial statements.
Semiannual Report
VIP Freedom 2045 Portfolio
Investment Changes (Unaudited)
Fund Holdings as of June 30, 2011 |
| % of fund's
net assets | % of fund's net assets
6 months ago |
Domestic Equity Funds | | |
VIP Contrafund Portfolio Initial Class | 9.9 | 10.1 |
VIP Equity-Income Portfolio Initial Class | 11.6 | 11.8 |
VIP Growth & Income Portfolio Initial Class | 11.6 | 11.7 |
VIP Growth Portfolio Initial Class | 11.8 | 11.8 |
VIP Mid Cap Portfolio Initial Class | 4.0 | 4.0 |
VIP Value Portfolio Initial Class | 9.9 | 10.1 |
VIP Value Strategies Portfolio Initial Class | 4.2 | 4.3 |
| 63.0 | 63.8 |
Developed International Equity Funds | | |
VIP Overseas Portfolio Initial Class | 19.3 | 18.9 |
Emerging Markets Equity Funds | | |
VIP Emerging Markets Portfolio Initial Class | 3.4 | 3.1 |
High Yield Bond Funds | | |
VIP High Income Portfolio Initial Class | 10.0 | 9.5 |
Investment Grade Bond Funds | | |
VIP Investment Grade Bond Portfolio Initial Class | 4.3 | 4.7 |
Net Other Assets (Liabilities)* | 0.0 | 0.0 |
| 100.0 | 100.0 |
* Amount represents less than 0.1% |
Asset Allocation (% of fund's net assets) |
Current |
| Domestic Equity Funds | 63.0% | |
| Developed International Equity Funds | 19.3% | |
| Emerging Markets Equity Funds | 3.4% | |
| High Yield Bond Funds | 10.0% | |
| Investment Grade Bond Funds | 4.3% | |

Six months ago |
| Domestic Equity Funds | 63.8% | |
| Developed International Equity Funds | 18.9% | |
| Emerging Markets Equity Funds | 3.1% | |
| High Yield Bond Funds | 9.5% | |
| Investment Grade Bond Funds | 4.7% | |

Expected |
| Domestic Equity Funds | 62.2% | |
| Developed International Equity Funds | 19.3% | |
| Emerging Markets Equity Funds | 3.4% | |
| High Yield Bond Funds | 10.0% | |
| Investment Grade Bond Funds | 5.1% | |

The fund invests according to an asset allocation strategy that becomes increasingly conservative over time. The six months ago allocation is based on the fund's holdings as of December 31, 2010. The current allocation is based on the fund's holdings as of June 30, 2011. The expected allocation represents the fund's anticipated allocation at December 31, 2011. |
Semiannual Report
VIP Freedom 2045 Portfolio
Investments June 30, 2011 (Unaudited)
Showing Percentage of Net Assets
Domestic Equity Funds - 63.0% |
| Shares | | Value |
Domestic Equity Funds - 63.0% |
VIP Contrafund Portfolio Initial Class | 1,601 | | $ 40,214 |
VIP Equity-Income Portfolio Initial Class | 2,315 | | 46,869 |
VIP Growth & Income Portfolio Initial Class | 3,544 | | 46,786 |
VIP Growth Portfolio Initial Class | 1,186 | | 47,730 |
VIP Mid Cap Portfolio Initial Class | 496 | | 16,382 |
VIP Value Portfolio Initial Class | 3,464 | | 40,145 |
VIP Value Strategies Portfolio Initial Class | 1,630 | | 16,871 |
TOTAL DOMESTIC EQUITY FUNDS (Cost $157,563) | 254,997 |
International Equity Funds - 22.7% |
| | | |
Developed International Equity Funds - 19.3% |
VIP Overseas Portfolio Initial Class | 4,426 | | 78,153 |
Emerging Markets Equity Funds - 3.4% |
VIP Emerging Markets Portfolio Initial Class | 1,368 | | 13,513 |
TOTAL INTERNATIONAL EQUITY FUNDS (Cost $62,418) | 91,666 |
Bond Funds - 14.3% |
| Shares | | Value |
High Yield Bond Funds - 10.0% |
VIP High Income Portfolio Initial Class | 6,962 | | $ 40,517 |
Investment Grade Bond Funds - 4.3% |
VIP Investment Grade Bond Portfolio Initial Class | 1,337 | | 17,385 |
TOTAL BOND FUNDS (Cost $46,944) | 57,902 |
TOTAL INVESTMENT PORTFOLIO - 100.0% (Cost $266,925) | | 404,565 |
NET OTHER ASSETS (LIABILITIES) - 0.0% | | (43) |
NET ASSETS - 100% | $ 404,522 |
Other Information |
All investments are categorized as Level 1 under the Fair Value Hierarchy. The inputs or methodology used for valuing securities may not be an indication of the risk associated with investing in those securities. For more information on valuation inputs, please refer to the Security Valuation section in the accompanying Notes to Financial Statements. |
See accompanying notes which are an integral part of the financial statements.
Semiannual Report
VIP Freedom 2045 Portfolio
Statement of Assets and Liabilities
| June 30, 2011 (Unaudited) |
| | |
Assets | | |
Investment in securities, at value (cost $266,925) - See accompanying schedule | | $ 404,565 |
Cash | | 1 |
Receivable for investments sold | | 41 |
Total assets | | 404,607 |
| | |
Liabilities | | |
Payable for fund shares redeemed | $ 43 | |
Distribution and service plan fees payable | 42 | |
Total liabilities | | 85 |
| | |
Net Assets | | $ 404,522 |
Net Assets consist of: | | |
Paid in capital | | $ 255,901 |
Distributions in excess of net investment income | | (192) |
Accumulated undistributed net realized gain (loss) on investments | | 11,173 |
Net unrealized appreciation (depreciation) on investments | | 137,640 |
Net Assets | | $ 404,522 |
| | |
Initial Class:
Net Asset Value, offering price and redemption price per share ($114,965 ÷ 7,629 shares) | | $ 15.07 |
| | |
Service Class:
Net Asset Value, offering price and redemption price per share ($110,974 ÷ 7,369 shares) | | $ 15.06 |
| | |
Service Class 2:
Net Asset Value, offering price and redemption price per share ($178,583 ÷ 11,869 shares) | | $ 15.05 |
Statement of Operations
Six months ended June 30, 2011 (Unaudited) |
| | |
Investment Income | | |
Income distributions from underlying funds | | $ 37 |
| | |
Expenses | | |
Distribution and service plan fees | $ 229 | |
Total expenses | | 229 |
Net investment income (loss) | | (192) |
Realized and Unrealized Gain (Loss) Realized gain (loss) on sale of underlying fund shares | 10,914 | |
Capital gain distributions from underlying funds | 508 | |
Total net realized gain (loss) | | 11,422 |
Change in net unrealized appreciation (depreciation) on underlying funds | | 8,236 |
Net gain (loss) | | 19,658 |
Net increase (decrease) in net assets resulting from operations | | $ 19,466 |
See accompanying notes which are an integral part of the financial statements.
Semiannual Report
Statement of Changes in Net Assets
| Six months ended June 30, 2011
(Unaudited) | Year ended
December 31, 2010 |
Increase (Decrease) in Net Assets | | |
Operations | | |
Net investment income (loss) | $ (192) | $ 6,151 |
Net realized gain (loss) | 11,422 | 34,905 |
Change in net unrealized appreciation (depreciation) | 8,236 | 16,858 |
Net increase (decrease) in net assets resulting from operations | 19,466 | 57,914 |
Distributions to shareholders from net investment income | - | (6,187) |
Distributions to shareholders from net realized gain | (7,868) | (31,255) |
Total distributions | (7,868) | (37,442) |
Share transactions - net increase (decrease) | 29,076 | (84,084) |
Total increase (decrease) in net assets | 40,674 | (63,612) |
| | |
Net Assets | | |
Beginning of period | 363,848 | 427,460 |
End of period (including distributions in excess of net investment income of $192 and undistributed net investment income of $0, respectively) | $ 404,522 | $ 363,848 |
Financial Highlights - Initial Class
| Six months ended June 30, 2011 | Years ended December 31, |
| (Unaudited) | 2010 | 2009 F |
Selected Per-Share Data | | | |
Net asset value, beginning of period | $ 14.61 | $ 13.86 | $ 10.00 |
Income from Investment Operations | | | |
Net investment income (loss) D | - H | .24 | .26 |
Net realized and unrealized gain (loss) | .78 | 2.14 | 3.87 |
Total from investment operations | .78 | 2.38 | 4.13 |
Distributions from net investment income | - | (.29) | (.26) |
Distributions from net realized gain | (.32) | (1.34) | (.01) |
Total distributions | (.32) | (1.63) | (.27) |
Net asset value, end of period | $ 15.07 | $ 14.61 | $ 13.86 |
Total Return B,C | 5.32% | 17.37% | 41.28% |
Ratios to Average Net Assets E,G | | | |
Expenses before reductions | .00% A | .00% | .00% A |
Expenses net of fee waivers, if any | .00% A | .00% | .00% A |
Expenses net of all reductions | .00% A | .00% | .00% A |
Net investment income (loss) | .02% A | 1.65% | 2.83% A |
Supplemental Data | | | |
Net assets, end of period (000 omitted) | $ 115 | $ 121 | $ 145 |
Portfolio turnover rate | 25% A | 17% | 5% A |
A Annualized B Total returns for periods of less than one year are not annualized. C Total returns do not reflect charges attributable to your insurance company's separate account. Inclusion of these charges would reduce the total returns shown. D Calculated based on average shares outstanding during the period. E Amounts do not include the activity of the underlying funds. F For the period April 8, 2009 (commencement of operations) to December 31, 2009. G Expense ratios reflect operating expenses of the class. Expenses before reductions do not reflect amounts reimbursed by the investment adviser or reductions from expense offset arrangements and do not represent the amount paid by the class during periods when reimbursements or reductions occur. Expense ratios before reductions for start-up periods may not be representative of longer-term operating periods. Expenses net of fee waivers reflect expenses after reimbursement by the investment adviser but prior to reductions from expense offset arrangements. Expenses net of all reductions represent the net expenses paid by the class but do not include expenses of the investment companies in which the Fund invests. H Amount represents less than $.01 per share. |
See accompanying notes which are an integral part of the financial statements.
Semiannual Report
Financial Highlights - Service Class
| Six months ended June 30, 2011 | Years ended December 31, |
| (Unaudited) | 2010 | 2009 F |
Selected Per-Share Data | | | |
Net asset value, beginning of period | $ 14.61 | $ 13.86 | $ 10.00 |
Income from Investment Operations | | | |
Net investment income (loss) D | (.01) | .22 | .25 |
Net realized and unrealized gain (loss) | .78 | 2.14 | 3.87 |
Total from investment operations | .77 | 2.36 | 4.12 |
Distributions from net investment income | - | (.28) | (.25) |
Distributions from net realized gain | (.32) | (1.34) | (.01) |
Total distributions | (.32) | (1.61) H | (.26) |
Net asset value, end of period | $ 15.06 | $ 14.61 | $ 13.86 |
Total Return B,C | 5.25% | 17.23% | 41.19% |
Ratios to Average Net Assets E,G | | | |
Expenses before reductions | .10% A | .10% | .10% A |
Expenses net of fee waivers, if any | .10% A | .10% | .10% A |
Expenses net of all reductions | .10%A | .10% | .10% A |
Net investment income (loss) | (.08)% A | 1.55% | 2.73% A |
Supplemental Data | | | |
Net assets, end of period (000 omitted) | $ 111 | $ 117 | $ 141 |
Portfolio turnover rate | 25% A | 17% | 5% A |
A Annualized B Total returns for periods of less than one year are not annualized. C Total returns do not reflect charges attributable to your insurance company's separate account. Inclusion of these charges would reduce the total returns shown. D Calculated based on average shares outstanding during the period. E Amounts do not include the activity of the underlying funds. F For the period April 8, 2009 (commencement of operations) to December 31, 2009. G Expense ratios reflect operating expenses of the class. Expenses before reductions do not reflect amounts reimbursed by the investment adviser or reductions from expense offset arrangements and do not represent the amount paid by the class during periods when reimbursements or reductions occur. Expense ratios before reductions for start-up periods may not be representative of longer-term operating periods. Expenses net of fee waivers reflect expenses after reimbursement by the investment adviser but prior to reductions from expense offset arrangements. Expenses net of all reductions represent the net expenses paid by the class but do not include expenses of the investment companies in which the Fund invests. H Total distributions of $1.61 per share is comprised of distributions from net investment income of $.276 and distributions from net realized gain of $1.335 per share. |
Financial Highlights - Service Class 2
| Six months ended June 30, 2011 | Years ended December 31, |
| (Unaudited) | 2010 | 2009 F |
Selected Per-Share Data | | | |
Net asset value, beginning of period | $ 14.61 | $ 13.85 | $ 10.00 |
Income from Investment Operations | | | |
Net investment income (loss) D | (.02) | .20 | .24 |
Net realized and unrealized gain (loss) | .78 | 2.15 | 3.86 |
Total from investment operations | .76 | 2.35 | 4.10 |
Distributions from net investment income | - | (.25) | (.24) |
Distributions from net realized gain | (.32) | (1.34) | (.01) |
Total distributions | (.32) | (1.59) | (.25) |
Net asset value, end of period | $ 15.05 | $ 14.61 | $ 13.85 |
Total Return B,C | 5.18% | 17.15% | 40.96% |
Ratios to Average Net Assets E,G | | | |
Expenses before reductions | .25% A | .25% | .25% A |
Expenses net of fee waivers, if any | .25% A | .25% | .25% A |
Expenses net of all reductions | .25% A | .25% | .25% A |
Net investment income (loss) | (.23)% A | 1.40% | 2.58% A |
Supplemental Data | | | |
Net assets, end of period (000 omitted) | $ 179 | $ 126 | $ 141 |
Portfolio turnover rate | 25% A | 17% | 5% A |
A Annualized B Total returns for periods of less than one year are not annualized. C Total returns do not reflect charges attributable to your insurance company's separate account. Inclusion of these charges would reduce the total returns shown. D Calculated based on average shares outstanding during the period. E Amounts do not include the activity of the underlying funds. F For the period April 8, 2009 (commencement of operations) to December 31, 2009. G Expense ratios reflect operating expenses of the class. Expenses before reductions do not reflect amounts reimbursed by the investment adviser or reductions from expense offset arrangements and do not represent the amount paid by the class during periods when reimbursements or reductions occur. Expense ratios before reductions for start-up periods may not be representative of longer-term operating periods. Expenses net of fee waivers reflect expenses after reimbursement by the investment adviser but prior to reductions from expense offset arrangements. Expenses net of all reductions represent the net expenses paid by the class but do not include expenses of the investment companies in which the Fund invests. |
See accompanying notes which are an integral part of the financial statements.
Semiannual Report
VIP Freedom 2050 Portfolio
Investment Changes (Unaudited)
Fund Holdings as of June 30, 2011 |
| % of fund's
net assets | % of fund's net assets
6 months ago |
Domestic Equity Funds | | |
VIP Contrafund Portfolio Initial Class | 10.4 | 10.5 |
VIP Equity-Income Portfolio Initial Class | 12.1 | 12.3 |
VIP Growth & Income Portfolio Initial Class | 12.1 | 12.3 |
VIP Growth Portfolio Initial Class | 12.3 | 12.3 |
VIP Mid Cap Portfolio Initial Class | 4.2 | 4.2 |
VIP Value Portfolio Initial Class | 10.4 | 10.6 |
VIP Value Strategies Portfolio Initial Class | 4.3 | 4.5 |
| 65.8 | 66.7 |
Developed International Equity Funds | | |
VIP Overseas Portfolio Initial Class | 20.2 | 19.8 |
Emerging Markets Equity Funds | | |
VIP Emerging Markets Portfolio Initial Class | 3.5 | 3.3 |
High Yield Bond Funds | | |
VIP High Income Portfolio Initial Class | 10.1 | 9.5 |
Investment Grade Bond Funds | | |
VIP Investment Grade Bond Portfolio Initial Class | 0.4 | 0.7 |
Net Other Assets (Liabilities)* | 0.0 | 0.0 |
| 100.0 | 100.0 |
* Amount represents less than 0.1% |
Asset Allocation (% of fund's net assets) |
Current |
| Domestic Equity Funds | 65.8% | |
| Developed International Equity Funds | 20.2% | |
| Emerging Markets Equity Funds | 3.5% | |
| High Yield Bond Funds | 10.1% | |
| Investment Grade Bond Funds | 0.4% | |

Six months ago |
| Domestic Equity Funds | 66.7% | |
| Developed International Equity Funds | 19.8% | |
| Emerging Markets Equity Funds | 3.3% | |
| High Yield Bond Funds | 9.5% | |
| Investment Grade Bond Funds | 0.7% | |

Expected |
| Domestic Equity Funds | 64.4% | |
| Developed International Equity Funds | 19.9% | |
| Emerging Markets Equity Funds | 3.5% | |
| High Yield Bond Funds | 10.0% | |
| Investment Grade Bond Funds | 2.2% | |

The fund invests according to an asset allocation strategy that becomes increasingly conservative over time. The six months ago allocation is based on the fund's holdings as of December 31, 2010. The current allocation is based on the fund's holdings as of June 30, 2011. The expected allocation represents the fund's anticipated allocation at December 31, 2011. |
Semiannual Report
VIP Freedom 2050 Portfolio
Investments June 30, 2011 (Unaudited)
Showing Percentage of Net Assets
Domestic Equity Funds - 65.8% |
| Shares | | Value |
Domestic Equity Funds - 65.8% |
VIP Contrafund Portfolio Initial Class | 2,310 | | $ 58,028 |
VIP Equity-Income Portfolio Initial Class | 3,339 | | 67,620 |
VIP Growth & Income Portfolio Initial Class | 5,113 | | 67,485 |
VIP Growth Portfolio Initial Class | 1,709 | | 68,761 |
VIP Mid Cap Portfolio Initial Class | 717 | | 23,672 |
VIP Value Portfolio Initial Class | 4,997 | | 57,917 |
VIP Value Strategies Portfolio Initial Class | 2,351 | | 24,336 |
TOTAL DOMESTIC EQUITY FUNDS (Cost $266,017) | 367,819 |
International Equity Funds - 23.7% |
| | | |
Developed International Equity Funds - 20.2% |
VIP Overseas Portfolio Initial Class | 6,403 | | 113,075 |
Emerging Markets Equity Funds - 3.5% |
VIP Emerging Markets Portfolio Initial Class | 1,978 | | 19,545 |
TOTAL INTERNATIONAL EQUITY FUNDS (Cost $98,025) | 132,620 |
Bond Funds - 10.5% |
| Shares | | Value |
High Yield Bond Funds - 10.1% |
VIP High Income Portfolio Initial Class | 9,677 | | $ 56,322 |
Investment Grade Bond Funds - 0.4% |
VIP Investment Grade Bond Portfolio Initial Class | 187 | | 2,435 |
TOTAL BOND FUNDS (Cost $48,296) | 58,757 |
TOTAL INVESTMENT PORTFOLIO - 100.0% (Cost $412,338) | | 559,196 |
NET OTHER ASSETS (LIABILITIES) - 0.0% | | (44) |
NET ASSETS - 100% | $ 559,152 |
Other Information |
All investments are categorized as Level 1 under the Fair Value Hierarchy. The inputs or methodology used for valuing securities may not be an indication of the risk associated with investing in those securities. For more information on valuation inputs, please refer to the Security Valuation section in the accompanying Notes to Financial Statements. |
See accompanying notes which are an integral part of the financial statements.
Semiannual Report
VIP Freedom 2050 Portfolio
Statement of Assets and Liabilities
| June 30, 2011 (Unaudited) |
| | |
Assets | | |
Investment in securities, at value (cost $412,338) - See accompanying schedule | | $ 559,196 |
Receivable for fund shares sold | | 696 |
Total assets | | 559,892 |
| | |
Liabilities | | |
Payable for investments purchased | $ 630 | |
Payable for fund shares redeemed | 68 | |
Distribution and service plan fees payable | 42 | |
Total liabilities | | 740 |
| | |
Net Assets | | $ 559,152 |
Net Assets consist of: | | |
Paid in capital | | $ 297,732 |
Accumulated net investment loss | | (165) |
Accumulated undistributed net realized gain (loss) on investments | | 114,727 |
Net unrealized appreciation (depreciation) on investments | | 146,858 |
Net Assets | | $ 559,152 |
| | |
Initial Class:
Net Asset Value, offering price and redemption price per share ($282,167 ÷ 17,026 shares) | | $ 16.57 |
| | |
Service Class:
Net Asset Value, offering price and redemption price per share ($112,320 ÷ 6,780 shares) | | $ 16.57 |
| | |
Service Class 2:
Net Asset Value, offering price and redemption price per share ($164,665 ÷ 9,951 shares) | | $ 16.55 |
Statement of Operations
Six months ended June 30, 2011 (Unaudited) |
| | |
Investment Income | | |
Income distributions from underlying funds | | $ 88 |
| | |
Expenses | | |
Distribution and service plan fees | $ 253 | |
Total expenses | | 253 |
Net investment income (loss) | | (165) |
Realized and Unrealized Gain (Loss) Realized gain (loss) on sale of underlying fund shares | 114,670 | |
Capital gain distributions from underlying funds | 720 | |
Total net realized gain (loss) | | 115,390 |
Change in net unrealized appreciation (depreciation) on underlying funds | | (69,425) |
Net gain (loss) | | 45,965 |
Net increase (decrease) in net assets resulting from operations | | $ 45,800 |
See accompanying notes which are an integral part of the financial statements.
Semiannual Report
VIP Freedom 2050 Portfolio
Financial Statements - continued
Statement of Changes in Net Assets
| Six months ended
June 30, 2011
(Unaudited) | Year ended
December 31,
2010 |
Increase (Decrease) in Net Assets | | |
Operations | | |
Net investment income (loss) | $ (165) | $ 15,147 |
Net realized gain (loss) | 115,390 | 22,127 |
Change in net unrealized appreciation (depreciation) | (69,425) | 95,990 |
Net increase (decrease) in net assets resulting from operations | 45,800 | 133,264 |
Distributions to shareholders from net investment income | - | (15,204) |
Distributions to shareholders from net realized gain | (5,542) | (18,973) |
Total distributions | (5,542) | (34,177) |
Share transactions - net increase (decrease) | (407,066) | 378,806 |
Total increase (decrease) in net assets | (366,808) | 477,893 |
| | |
Net Assets | | |
Beginning of period | 925,960 | 448,067 |
End of period (including accumulated net investment loss of $165 and undistributed net investment income of $0, respectively) | $ 559,152 | $ 925,960 |
Financial Highlights - Initial Class
| Six months ended
June 30, 2011 | Years ended December 31, |
| (Unaudited) | 2010 | 2009 F |
Selected Per-Share Data | | | |
Net asset value, beginning of period | $ 15.82 | $ 14.01 | $ 10.00 |
Income from Investment Operations | | | |
Net investment income (loss) D | - H | .39 | .26 |
Net realized and unrealized gain (loss) | .84 | 2.06 | 4.01 |
Total from investment operations | .84 | 2.45 | 4.27 |
Distributions from net investment income | - | (.28) | (.25) |
Distributions from net realized gain | (.09) | (.36) | (.01) |
Total distributions | (.09) | (.64) | (.26) |
Net asset value, end of period | $ 16.57 | $ 15.82 | $ 14.01 |
Total Return B,C | 5.31% | 17.58% | 42.70% |
Ratios to Average Net Assets E,G | | | |
Expenses before reductions | .00% A | .00% | .00% A |
Expenses net of fee waivers, if any | .00% A | .00% | .00% A |
Expenses net of all reductions | .00% A | .00% | .00% A |
Net investment income (loss) | .03% A | 2.64% | 2.76% A |
Supplemental Data | | | |
Net assets, end of period (000 omitted) | $ 282 | $ 666 | $ 159 |
Portfolio turnover rate | 106% A | 50% | 4% A |
A Annualized B Total returns for periods of less than one year are not annualized. C Total returns do not reflect charges attributable to your insurance company's separate account. Inclusion of these charges would reduce the total returns shown. D Calculated based on average shares outstanding during the period. E Amounts do not include the activity of the underlying funds. F For the period April 8, 2009 (commencement of operations) to December 31, 2009. G Expense ratios reflect operating expenses of the class. Expenses before reductions do not reflect amounts reimbursed by the investment adviser or reductions from expense offset arrangements and do not represent the amount paid by the class during periods when reimbursements or reductions occur. Expenses net of fee waivers reflect expenses after reimbursement by the investment adviser but prior to reductions from expense offset arrangements. Expenses net of all reductions represent the net expenses paid by the class but do not include expenses of the investment companies in which the Fund invests. H Amount represents less than $.01 per share. |
See accompanying notes which are an integral part of the financial statements.
Semiannual Report
Financial Highlights - Service Class
| Six months ended
June 30, 2011 | Years ended December 31, |
| (Unaudited) | 2010 | 2009 F |
Selected Per-Share Data | | | |
Net asset value, beginning of period | $ 15.82 | $ 14.00 | $ 10.00 |
Income from Investment Operations | | | |
Net investment income (loss) D | (.01) | .37 | .25 |
Net realized and unrealized gain (loss) | .85 | 2.07 | 4.00 |
Total from investment operations | .84 | 2.44 | 4.25 |
Distributions from net investment income | - | (.26) | (.24) |
Distributions from net realized gain | (.09) | (.36) | (.01) |
Total distributions | (.09) | (.62) | (.25) |
Net asset value, end of period | $ 16.57 | $ 15.82 | $ 14.00 |
Total Return B,C | 5.31% | 17.53% | 42.51% |
Ratios to Average Net Assets E,G | | | |
Expenses before reductions | .10% A | .10% | .10% A |
Expenses net of fee waivers, if any | .10% A | .10% | .10% A |
Expenses net of all reductions | .10% A | .10% | .10% A |
Net investment income (loss) | (.07)% A | 2.54% | 2.66% A |
Supplemental Data | | | |
Net assets, end of period (000 omitted) | $ 112 | $ 118 | $ 143 |
Portfolio turnover rate | 106% A | 50% | 4% A |
A Annualized B Total returns for periods of less than one year are not annualized. C Total returns do not reflect charges attributable to your insurance company's separate account. Inclusion of these charges would reduce the total returns shown. D Calculated based on average shares outstanding during the period. E Amounts do not include the activity of the underlying funds. F For the period April 8, 2009 (commencement of operations) to December 31, 2009. G Expense ratios reflect operating expenses of the class. Expenses before reductions do not reflect amounts reimbursed by the investment adviser or reductions from expense offset arrangements and do not represent the amount paid by the class during periods when reimbursements or reductions occur. Expenses net of fee waivers reflect expenses after reimbursement by the investment adviser but prior to reductions from expense offset arrangements. Expenses net of all reductions represent the net expenses paid by the class but do not include expenses of the investment companies in which the Fund invests. |
Financial Highlights - Service Class 2
| Six months ended
June 30, 2011 | Years ended December 31, |
| (Unaudited) | 2010 | 2009 F |
Selected Per-Share Data | | | |
Net asset value, beginning of period | $ 15.81 | $ 14.00 | $ 10.00 |
Income from Investment Operations | | | |
Net investment income (loss) D | (.02) | .35 | .23 |
Net realized and unrealized gain (loss) | .85 | 2.06 | 4.01 |
Total from investment operations | .83 | 2.41 | 4.24 |
Distributions from net investment income | - | (.24) | (.23) |
Distributions from net realized gain | (.09) | (.36) | (.01) |
Total distributions | (.09) | (.60) | (.24) |
Net asset value, end of period | $ 16.55 | $ 15.81 | $ 14.00 |
Total Return B,C | 5.25% | 17.30% | 42.37% |
Ratios to Average Net Assets E,G | | | |
Expenses before reductions | .25% A | .25% | .25% A |
Expenses net of fee waivers, if any | .25% A | .25% | .25% A |
Expenses net of all reductions | .25% A | .25% | .25% A |
Net investment income (loss) | (.22)% A | 2.39% | 2.51% A |
Supplemental Data | | | |
Net assets, end of period (000 omitted) | $ 165 | $ 142 | $ 147 |
Portfolio turnover rate | 106% A | 50% | 4% A |
A Annualized B Total returns for periods of less than one year are not annualized. C Total returns do not reflect charges attributable to your insurance company's separate account. Inclusion of these charges would reduce the total returns shown. D Calculated based on average shares outstanding during the period. E Amounts do not include the activity of the underlying funds. F For the period April 8, 2009 (commencement of operations) to December 31, 2009. G Expense ratios reflect operating expenses of the class. Expenses before reductions do not reflect amounts reimbursed by the investment adviser or reductions from expense offset arrangements and do not represent the amount paid by the class during periods when reimbursements or reductions occur. Expenses net of fee waivers reflect expenses after reimbursement by the investment adviser but prior to reductions from expense offset arrangements. Expenses net of all reductions represent the net expenses paid by the class but do not include expenses of the investment companies in which the Fund invests. |
See accompanying notes which are an integral part of the financial statements.
Semiannual Report
Notes to Financial Statements
For the period ended June 30, 2011 (Unaudited)
1. Organization.
VIP Freedom Income Portfolio, VIP Freedom 2005 Portfolio, VIP Freedom 2010 Portfolio, VIP Freedom 2015 Portfolio, VIP Freedom 2020 Portfolio, VIP Freedom 2025 Portfolio, VIP Freedom 2030 Portfolio, VIP Freedom 2035 Portfolio, VIP Freedom 2040 Portfolio, VIP Freedom 2045 Portfolio and VIP Freedom 2050 Portfolio (the Funds) are funds of Variable Insurance Products Fund V. Variable Insurance Products Fund V (the Trust) (referred to in this report as Fidelity Variable Insurance Products) is registered under the Investment Company Act of 1940, as amended (the 1940 Act), as an open-end management investment company organized as a Massachusetts business trust. Each Fund is authorized to issue an unlimited number of shares. The Funds invest primarily in a combination of other VIP equity, bond, and short-term funds (the Underlying Funds) managed by Fidelity Management & Research Company (FMR). Shares of each Fund may only be purchased by insurance companies for the purpose of funding variable annuity or variable life insurance contracts. Each Fund offers three classes of shares: Initial Class shares, Service Class shares and Service Class 2 shares. All classes have equal rights and voting privileges, except for matters affecting a single class. Investment income, realized and unrealized capital gains and losses, the common expenses of the Fund, and certain fund-level expense reductions, if any, are allocated on a pro-rata basis to each class based on the relative net assets of each class to the total net assets of the Fund. Each class differs with respect to distribution and service plan fees incurred. Certain expense reductions may also differ by class.
2. Significant Accounting Policies.
The financial statements have been prepared in conformity with accounting principles generally accepted in the United States of America (GAAP), which require management to make certain estimates and assumptions at the date of the financial statements. Actual results could differ from those estimates. Subsequent events, if any, through the date that the financial statements were issued have been evaluated in the preparation of the financial statements. The following summarizes the significant accounting policies of the Funds:
Security Valuation. Investments are valued as of 4:00 p.m. Eastern time on the last calendar day of the period. Each Fund categorizes the inputs to valuation techniques used to value their investments into a disclosure hierarchy consisting of three levels as shown below:
Level 1 - quoted prices in active markets for identical investments
Level 2 - other significant observable inputs (including quoted prices for similar investments, interest rates, prepayment speeds, etc.)
Level 3 - unobservable inputs (including the Fund's own assumptions based on the best information available)
Valuation techniques used to value each Fund's investments by major category are as follows. Investments in the Underlying Funds are valued at their closing net asset value (NAV) each business day and are categorized as Level 1 in the hierarchy.
Investment Transactions and Income. For financial reporting purposes, the Funds' investment holdings and NAV include trades executed through the end of the last business day of the period. The NAV per share for processing shareholder transactions is calculated as of the close of business of the New York Stock Exchange (NYSE), normally 4:00 p.m. Eastern time and includes trades executed through the end of the prior business day. Gains and losses on securities sold are determined on the basis of identified cost. Income and capital gain distributions from the Underlying Funds, if any, are recorded on the ex-dividend date. Interest income is accrued as earned. Interest income includes coupon interest and amortization of premium and accretion of discount on debt securities.
Expenses. Expenses directly attributable to a fund are charged to that fund. Expenses attributable to more than one fund are allocated among the respective funds on the basis of relative net assets or other appropriate methods. Expenses included in the accompanying financial statements reflect the expenses of the Fund and do not include any expenses associated with the Underlying Funds. Expense estimates are accrued in the period to which they relate and adjustments are made when actual amounts are known.
Income Tax Information and Distributions to Shareholders. Each year, each Fund intends to qualify as a regulated investment company, including distributing substantially all of its taxable income and realized gains under Subchapter M of the Internal Revenue Code and filing its U.S. federal tax return. As a result, no provision for income taxes is required. A fund's federal tax return is subject to examination by the Internal Revenue Service (IRS) for a period of three years.
Distributions are declared and recorded on the ex-dividend date. Income dividends and capital gain distributions are declared separately for each class. Income and capital gain distributions are determined in accordance with income tax regulations, which may differ from GAAP.
Capital accounts within the financial statements are adjusted for permanent book-tax differences. These adjustments have no impact on net assets or the results of operations. Temporary book-tax differences will reverse in a subsequent period.
Book-tax differences are primarily due to the short-term gain distributions from the Underlying Funds, capital loss carryforwards and losses deferred due to wash sales and excise tax regulations.
Semiannual Report
2. Significant Accounting Policies - continued
Income Tax Information and Distributions to Shareholders - continued
The federal tax cost of investment securities and unrealized appreciation (depreciation) as of period end were as follows for each Fund:
| Tax cost | Gross unrealized
appreciation | Gross unrealized
depreciation | Net unrealized
appreciation
(depreciation) on
securities and
other investments |
VIP Freedom Income | $ 20,923,131 | $ 629,507 | $ (409,649) | $ 219,858 |
VIP Freedom 2005 | 6,036,504 | 152,635 | (394,817) | (242,182) |
VIP Freedom 2010 | 174,929,859 | 8,611,789 | (9,656,287) | (1,044,498) |
VIP Freedom 2015 | 101,559,296 | 8,346,638 | (5,454,021) | 2,892,617 |
VIP Freedom 2020 | 462,309,287 | 39,114,811 | (21,947,820) | 17,166,991 |
VIP Freedom 2025 | 46,261,731 | 3,701,008 | (2,499,320) | 1,201,688 |
VIP Freedom 2030 | 117,717,689 | 9,074,603 | (8,455,995) | 618,608 |
VIP Freedom 2035 | 396,652 | 161,447 | (578) | 160,869 |
VIP Freedom 2040 | 2,648,909 | 199,405 | (31,700) | 167,705 |
VIP Freedom 2045 | 267,148 | 137,534 | (117) | 137,417 |
VIP Freedom 2050 | 414,115 | 146,892 | (1,811) | 145,081 |
Under the recently enacted Regulated Investment Company Modernization Act of 2010 (the Act), The Funds will be permitted to carry forward capital losses incurred in taxable years beginning after December 22, 2010 for an unlimited period. However, any losses incurred during those future taxable years will be required to be utilized prior to any losses incurred in pre-enactment taxable years, which generally expire after eight years from when they are incurred. Additionally, post-enactment capital losses that are carried forward will retain their character as either short-term or long-term capital losses rather than being considered all short-term as under previous law. The Funds' first fiscal year end subject to the Act will be December 31, 2011.
3. Purchases and Sales of Investments.
Purchases and redemptions of the Underlying Fund shares are noted in the table below.
| Purchases ($) | Redemptions ($) |
VIP Freedom Income | 8,360,560 | 6,199,252 |
VIP Freedom 2005 | 1,007,677 | 1,451,075 |
VIP Freedom 2010 | 22,964,964 | 14,442,278 |
VIP Freedom 2015 | 14,937,744 | 12,387,175 |
VIP Freedom 2020 | 97,582,182 | 23,399,123 |
VIP Freedom 2025 | 9,127,140 | 5,236,320 |
VIP Freedom 2030 | 21,236,596 | 9,422,603 |
VIP Freedom 2035 | 158,460 | 73,111 |
VIP Freedom 2040 | 2,806,802 | 549,224 |
VIP Freedom 2045 | 68,305 | 46,788 |
VIP Freedom 2050 | 334,152 | 746,214 |
4. Fees and Other Transactions with Affiliates.
Management Fee. Strategic Advisers, Inc. (Strategic Advisers), an affiliate of FMR, provides the Funds with investment management related services. The Funds do not pay any fees for these services.
Other Transactions. Strategic Advisers has entered into an administration agreement with FMR under which FMR provides management and administrative services (other than investment advisory services) necessary for the operation of each Fund. Pursuant to this agreement, FMR pays all expenses of each Fund, excluding the distribution and service fees, the compensation of the independent Trustees and certain other expenses such as interest expense. FMR also contracts with other Fidelity companies to perform the services necessary for the operation of each Fund. The Funds do not pay any fees for these services.
Distribution and Service Plan Fees. In accordance with Rule 12b-1 of the 1940 Act, the Funds have adopted separate 12b-1 Plans for each Service Class of shares. Each Service Class pays Fidelity Distributors Corporation (FDC), an affiliate of FMR, a service fee. For the period, the service fee is based on an annual rate of .10% of Service Class' average net assets and .25% of Service Class 2's average net assets.
Semiannual Report
Notes to Financial Statements (Unaudited) - continued
4. Fees and Other Transactions with Affiliates - continued
Distribution and Service Plan Fees - continued
For the period, total fees, all of which were reallowed to insurance companies for the distribution of shares and providing shareholder support services were as follows:
| Service
Class | Service
Class 2 | Total |
VIP Freedom Income | $ 435 | $ 9,214 | $ 9,649 |
VIP Freedom 2005 | 94 | 199 | 293 |
VIP Freedom 2010 | 9,976 | 154,940 | 164,916 |
VIP Freedom 2015 | 2,144 | 71,693 | 73,837 |
VIP Freedom 2020 | 18,134 | 441,755 | 459,889 |
VIP Freedom 2025 | 2,227 | 30,254 | 32,481 |
VIP Freedom 2030 | 13,575 | 68,193 | 81,768 |
VIP Freedom 2035 | 58 | 378 | 436 |
VIP Freedom 2040 | 220 | 194 | 414 |
VIP Freedom 2045 | 58 | 171 | 229 |
VIP Freedom 2050 | 59 | 194 | 253 |
5. Expense Reductions.
FMR voluntarily agreed to reimburse funds to the extent annual operating expenses exceeded certain levels of average net assets as noted in the table below. Some expenses, for example interest expense, are excluded from this reimbursement.
The following classes of each applicable Fund were in reimbursement during the period:
| Expense
Limitations | Reimbursement
from adviser |
VIP Freedom Income | | |
Initial Class | -% | 20 |
Service Class | .10% | 2 |
Service Class 2 | .25% | 13 |
VIP Freedom 2005 | | |
Initial Class | -% | 11 |
Service Class | .10% | - |
Service Class 2 | .25% | - |
VIP Freedom 2010 | | |
Initial Class | -% | 41 |
Service Class | .10% | 35 |
Service Class 2 | .25% | 217 |
VIP Freedom 2015 | | |
Initial Class | -% | 73 |
Service Class | .10% | 8 |
Service Class 2 | .25% | 101 |
VIP Freedom 2020 | | |
Initial Class | -% | 84 |
Service Class | .10% | 62 |
Service Class 2 | .25% | 606 |
VIP Freedom 2025 | | |
Initial Class | -% | 30 |
Service Class | .10% | 8 |
Service Class 2 | .25% | 42 |
VIP Freedom 2030 | | |
Initial Class | -% | 54 |
Service Class | .10% | 47 |
Service Class 2 | .25% | 95 |
Semiannual Report
6. Distributions to Shareholders.
Distributions to shareholders of each class were as follows:
| Six months ended
June 30,
2011 | Year ended
December 31,
2010 |
VIP Freedom Income | | |
From net investment income | | |
Initial Class | $ - | $ 210,386 |
Service Class | - | 3,035 |
Service Class 2 | - | 115,815 |
Total | $ - | $ 329,236 |
From net realized gain | | |
Initial Class | $ - | $ 290,719 |
Service Class | - | 4,582 |
Service Class 2 | - | 181,303 |
Total | $ - | $ 476,604 |
VIP Freedom 2005 | | |
From net investment income | | |
Initial Class | $ - | $ 112,320 |
Service Class | - | 3,344 |
Service Class 2 | - | 2,691 |
Total | $ - | $ 118,355 |
From net realized gain | | |
Initial Class | $ - | $ 76,130 |
Service Class | - | 2,040 |
Service Class 2 | - | 1,632 |
Total | $ - | $ 79,802 |
VIP Freedom 2010 | | |
From net investment income | | |
Initial Class | $ - | $ 463,722 |
Service Class | - | 377,308 |
Service Class 2 | - | 2,186,962 |
Total | $ - | $ 3,027,992 |
From net realized gain | | |
Initial Class | $ 10,762 | $ 398,603 |
Service Class | 9,034 | 350,127 |
Service Class 2 | 55,497 | 1,962,848 |
Total | $ 75,293 | $ 2,711,578 |
VIP Freedom 2015 | | |
From net investment income | | |
Initial Class | $ - | $ 813,676 |
Service Class | - | 54,230 |
Service Class 2 | - | 1,039,969 |
Total | $ - | $ 1,907,875 |
From net realized gain | | |
Initial Class | $ - | $ 461,272 |
Service Class | - | 28,463 |
Service Class 2 | - | 628,961 |
Total | $ - | $ 1,118,696 |
Semiannual Report
Notes to Financial Statements (Unaudited) - continued
6. Distributions to Shareholders - continued
| Six months ended
June 30,
2011 | Year ended
December 31,
2010 |
VIP Freedom 2020 | | |
From net investment income | | |
Initial Class | $ - | $ 930,464 |
Service Class | - | 654,671 |
Service Class 2 | - | 5,829,063 |
Total | $ - | $ 7,414,198 |
From net realized gain | | |
Initial Class | $ - | $ 331,668 |
Service Class | - | 235,505 |
Service Class 2 | - | 2,052,478 |
Total | $ - | $ 2,619,651 |
VIP Freedom 2025 | | |
From net investment income | | |
Initial Class | $ - | $ 346,092 |
Service Class | - | 27,402 |
Service Class 2 | - | 426,018 |
Total | $ - | $ 799,512 |
From net realized gain | | |
Initial Class | $ - | $ 98,389 |
Service Class | - | 7,360 |
Service Class 2 | - | 112,019 |
Total | $ - | $ 217,768 |
VIP Freedom 2030 | | |
From net investment income | | |
Initial Class | $ - | $ 539,256 |
Service Class | - | 411,502 |
Service Class 2 | - | 824,730 |
Total | $ - | $ 1,775,488 |
From net realized gain | | |
Initial Class | $ - | $ 194,726 |
Service Class | - | 151,508 |
Service Class 2 | - | 322,717 |
Total | $ - | $ 668,951 |
VIP Freedom 2035 | | |
From net investment income | | |
Initial Class | $ - | $ 2,136 |
Service Class | - | 1,918 |
Service Class 2 | - | 3,394 |
Total | $ - | $ 7,448 |
From net realized gain | | |
Initial Class | $ 246 | $ 8,162 |
Service Class | 235 | 7,842 |
Service Class 2 | 613 | 13,329 |
Total | $ 1,094 | $ 29,333 |
VIP Freedom 2040 | | |
From net investment income | | |
Initial Class | $ - | $ 4,811 |
Service Class | - | 1,884 |
Service Class 2 | - | 2,151 |
Total | $ - | $ 8,846 |
From net realized gain | | |
Initial Class | $ - | $ 31,376 |
Service Class | - | 13,997 |
Service Class 2 | - | 16,974 |
Total | $ - | $ 62,347 |
Semiannual Report
6. Distributions to Shareholders - continued
| Six months ended
June 30,
2011 | Year ended
December 31,
2010 |
VIP Freedom 2045 | | |
From net investment income | | |
Initial Class | $ - | $ 2,203 |
Service Class | - | 2,006 |
Service Class 2 | - | 1,978 |
Total | $ - | $ 6,187 |
From net realized gain | | |
Initial Class | $ 2,601 | $ 10,391 |
Service Class | 2,522 | 10,084 |
Service Class 2 | 2,745 | 10,780 |
Total | $ 7,868 | $ 31,255 |
VIP Freedom 2050 | | |
From net investment income | | |
Initial Class | $ - | $ 11,275 |
Service Class | - | 1,872 |
Service Class 2 | - | 2,057 |
Total | $ - | $ 15,204 |
From net realized gain | | |
Initial Class | $ 4,054 | $ 12,930 |
Service Class | 674 | 2,793 |
Service Class 2 | 814 | 3,250 |
Total | $ 5,542 | $ 18,973 |
7. Share Transactions.
Transactions for each class of shares were as follows:
| Shares | Dollars |
| Six months ended June 30,
2011 | Year ended
December 31,
2010 | Six months ended June 30,
2011 | Year ended
December 31,
2010 |
VIP Freedom Income | | | | |
Initial Class | | | | |
Shares sold | 397,337 | 258,557 | $ 4,139,902 | $ 2,671,849 |
Reinvestment of distributions | - | 48,930 | - | 501,105 |
Shares redeemed | (416,477) | (488,726) | (4,354,889) | (5,003,766) |
Net increase (decrease) | (19,140) | (181,239) | $ (214,987) | $ (1,830,812) |
Service Class | | | | |
Shares sold | 260,514 | 14,564 | $ 2,753,754 | $ 146,987 |
Reinvestment of distributions | - | 743 | - | 7,617 |
Shares redeemed | (40,160) | (14,887) | (421,745) | (152,852) |
Net increase (decrease) | 220,354 | 420 | $ 2,332,009 | $ 1,752 |
Service Class 2 | | | | |
Shares sold | 131,858 | 357,073 | $ 1,369,527 | $ 3,636,152 |
Reinvestment of distributions | - | 29,093 | - | 297,118 |
Shares redeemed | (141,499) | (349,472) | (1,474,763) | (3,569,125) |
Net increase (decrease) | (9,641) | 36,694 | $ (105,236) | $ 364,145 |
VIP Freedom 2005 | | | | |
Initial Class | | | | |
Shares sold | 67,438 | 134,064 | $ 700,276 | $ 1,286,624 |
Reinvestment of distributions | - | 19,288 | - | 188,450 |
Shares redeemed | (113,477) | (315,687) | (1,167,509) | (3,018,853) |
Net increase (decrease) | (46,039) | (162,335) | $ (467,233) | $ (1,543,779) |
Semiannual Report
Notes to Financial Statements (Unaudited) - continued
7. Share Transactions - continued
| Shares | Dollars |
| Six months ended June 30,
2011 | Year ended
December 31,
2010 | Six months ended June 30,
2011 | Year ended
December 31,
2010 |
Service Class | | | | |
Shares sold | 4,014 | 6,760 | $ 41,367 | $ 68,354 |
Reinvestment of distributions | - | 549 | - | 5,384 |
Shares redeemed | (4,889) | (7,984) | (49,976) | (77,087) |
Net increase (decrease) | (875) | (675) | $ (8,609) | $ (3,349) |
Service Class 2 | | | | |
Shares sold | 1,813 | 9,995 | $ 18,678 | $ 93,487 |
Reinvestment of distributions | - | 440 | - | 4,323 |
Shares redeemed | (1,866) | (14,517) | (19,262) | (139,052) |
Net increase (decrease) | (53) | (4,082) | $ (584) | $ (41,242) |
VIP Freedom 2010 | | | | |
Initial Class | | | | |
Shares sold | 222,657 | 436,778 | $ 2,422,341 | $ 4,483,599 |
Reinvestment of distributions | 989 | 82,723 | 10,762 | 862,325 |
Shares redeemed | (221,757) | (559,697) | (2,423,565) | (5,705,979) |
Net increase (decrease) | 1,889 | (40,196) | $ 9,538 | $ (360,055) |
Service Class | | | | |
Shares sold | 260,093 | 560,883 | $ 2,854,424 | $ 5,683,418 |
Reinvestment of distributions | 831 | 69,957 | 9,034 | 727,435 |
Shares redeemed | (197,331) | (783,131) | (2,149,933) | (8,010,814) |
Net increase (decrease) | 63,593 | (152,291) | $ 713,525 | $ (1,599,961) |
Service Class 2 | | | | |
Shares sold | 1,481,870 | 3,191,303 | $ 16,097,915 | $ 32,493,399 |
Reinvestment of distributions | 5,124 | 398,872 | 55,497 | 4,149,810 |
Shares redeemed | (852,412) | (1,434,821) | (9,213,893) | (14,472,689) |
Net increase (decrease) | 634,582 | 2,155,354 | $ 6,939,519 | $ 22,170,520 |
VIP Freedom 2015 | | | | |
Initial Class | | | | |
Shares sold | 486,479 | 670,873 | $ 5,359,664 | $ 6,860,434 |
Reinvestment of distributions | - | 120,777 | - | 1,274,948 |
Shares redeemed | (458,148) | (909,179) | (5,041,796) | (9,208,564) |
Net increase (decrease) | 28,331 | (117,529) | $ 317,868 | $ (1,073,182) |
Service Class | | | | |
Shares sold | 326,288 | 156,503 | $ 3,557,121 | $ 1,583,510 |
Reinvestment of distributions | - | 7,803 | - | 82,693 |
Shares redeemed | (98,854) | (65,542) | (1,071,580) | (664,170) |
Net increase (decrease) | 227,434 | 98,764 | $ 2,485,541 | $ 1,002,033 |
Service Class 2 | | | | |
Shares sold | 535,412 | 1,421,812 | $ 5,844,784 | $ 14,400,184 |
Reinvestment of distributions | - | 158,545 | - | 1,668,930 |
Shares redeemed | (606,774) | (678,716) | (6,655,773) | (6,837,448) |
Net increase (decrease) | (71,362) | 901,641 | $ (810,989) | $ 9,231,666 |
VIP Freedom 2020 | | | | |
Initial Class | | | | |
Shares sold | 931,320 | 920,774 | $ 10,195,354 | $ 9,150,944 |
Reinvestment of distributions | - | 120,936 | - | 1,262,132 |
Shares redeemed | (459,640) | (799,922) | (5,014,977) | (7,947,958) |
Net increase (decrease) | 471,680 | 241,788 | $ 5,180,377 | $ 2,465,118 |
Service Class | | | | |
Shares sold | 676,468 | 1,051,011 | $ 7,435,964 | $ 10,406,571 |
Reinvestment of distributions | - | 85,322 | - | 890,176 |
Shares redeemed | (326,962) | (722,926) | (3,583,403) | (7,208,777) |
Net increase (decrease) | 349,506 | 413,407 | $ 3,852,561 | $ 4,087,970 |
Semiannual Report
7. Share Transactions - continued
| Shares | Dollars |
| Six months ended June 30,
2011 | Year ended
December 31,
2010 | Six months ended June 30,
2011 | Year ended
December 31,
2010 |
Service Class 2 | | | | |
Shares sold | 6,779,926 | 10,438,161 | $ 73,868,895 | $ 103,574,788 |
Reinvestment of distributions | - | 756,007 | - | 7,881,541 |
Shares redeemed | (961,433) | (1,785,393) | (10,469,815) | (17,423,750) |
Net increase (decrease) | 5,818,493 | 9,408,775 | $ 63,399,080 | $ 94,032,579 |
VIP Freedom 2025 | | | | |
Initial Class | | | | |
Shares sold | 198,896 | 210,663 | $ 2,156,722 | $ 2,056,243 |
Reinvestment of distributions | - | 42,774 | - | 444,481 |
Shares redeemed | (284,824) | (197,611) | (3,093,798) | (1,893,385) |
Net increase (decrease) | (85,928) | 55,826 | $ (937,076) | $ 607,339 |
Service Class | | | | |
Shares sold | 377,540 | 96,750 | $ 4,027,667 | $ 938,977 |
Reinvestment of distributions | - | 3,336 | - | 34,762 |
Shares redeemed | (53,805) | (36,867) | (588,029) | (368,024) |
Net increase (decrease) | 323,735 | 63,219 | $ 3,439,638 | $ 605,715 |
Service Class 2 | | | | |
Shares sold | 285,891 | 1,456,760 | $ 3,092,767 | $ 14,706,194 |
Reinvestment of distributions | - | 51,796 | - | 538,037 |
Shares redeemed | (172,428) | (218,947) | (1,862,625) | (2,103,016) |
Net increase (decrease) | 113,463 | 1,289,609 | $ 1,230,142 | $ 13,141,215 |
VIP Freedom 2030 | | | | |
Initial Class | | | | |
Shares sold | 429,424 | 775,263 | $ 4,529,625 | $ 7,430,999 |
Reinvestment of distributions | - | 73,020 | - | 733,982 |
Shares redeemed | (244,448) | (656,437) | (2,592,965) | (6,157,596) |
Net increase (decrease) | 184,976 | 191,846 | $ 1,936,660 | $ 2,007,385 |
Service Class | | | | |
Shares sold | 723,739 | 826,988 | $ 7,637,933 | $ 7,926,058 |
Reinvestment of distributions | - | 56,031 | - | 563,009 |
Shares redeemed | (286,626) | (406,449) | (3,013,605) | (3,785,635) |
Net increase (decrease) | 437,113 | 476,570 | $ 4,624,328 | $ 4,703,432 |
Service Class 2 | | | | |
Shares sold | 1,057,291 | 1,644,957 | $ 11,123,218 | $ 15,476,635 |
Reinvestment of distributions | - | 114,453 | - | 1,147,447 |
Shares redeemed | (592,762) | (754,936) | (6,206,186) | (7,067,727) |
Net increase (decrease) | 464,529 | 1,004,474 | $ 4,917,032 | $ 9,556,355 |
VIP Freedom 2035 | | | | |
Initial Class | | | | |
Shares sold | 114 | 169 | $ 1,753 | $ 2,393 |
Reinvestment of distributions | 16 | 710 | 246 | 10,298 |
Shares redeemed | (854) | (3,191) | (12,985) | (45,336) |
Net increase (decrease) | (724) | (2,312) | $ (10,986) | $ (32,645) |
Service Class | | | | |
Shares sold | - | - | $ - | $ - |
Reinvestment of distributions | 15 | 673 | 235 | 9,760 |
Shares redeemed | (774) | (3,018) | (11,760) | (42,843) |
Net increase (decrease) | (759) | (2,345) | $ (11,525) | $ (33,083) |
Service Class 2 | | | | |
Shares sold | 9,726 | 6,219 | $ 146,588 | $ 94,194 |
Reinvestment of distributions | 40 | 1,147 | 613 | 16,723 |
Shares redeemed | (2,588) | (3,391) | (39,062) | (48,539) |
Net increase (decrease) | 7,178 | 3,975 | $ 108,139 | $ 62,378 |
Semiannual Report
Notes to Financial Statements (Unaudited) - continued
7. Share Transactions - continued
| Shares | Dollars |
| Six months ended June 30,
2011 | Year ended
December 31,
2010 | Six months ended June 30,
2011 | Year ended
December 31,
2010 |
VIP Freedom 2040 | | | | |
Initial Class | | | | |
Shares sold | 86,127 | 70,337 | $ 1,244,241 | $ 989,272 |
Reinvestment of distributions | - | 2,586 | - | 36,187 |
Shares redeemed | (7,933) | (63,590) | (116,357) | (920,096) |
Net increase (decrease) | 78,194 | 9,333 | $ 1,127,884 | $ 105,363 |
Service Class | | | | |
Shares sold | 102,314 | - | $ 1,540,338 | $ - |
Reinvestment of distributions | - | 1,138 | - | 15,881 |
Shares redeemed | (28,861) | (3,021) | (426,337) | (43,092) |
Net increase (decrease) | 73,453 | (1,883) | $ 1,114,001 | $ (27,211) |
Service Class 2 | | | | |
Shares sold | 1,957 | 1,870 | $ 28,881 | $ 28,133 |
Reinvestment of distributions | - | 1,370 | - | 19,125 |
Shares redeemed | (1,096) | (3,161) | (15,873) | (45,227) |
Net increase (decrease) | 861 | 79 | $ 13,008 | $ 2,031 |
VIP Freedom 2045 | | | | |
Initial Class | | | | |
Shares sold | 70 | 38 | $ 1,051 | $ 576 |
Reinvestment of distributions | 173 | 872 | 2,601 | 12,594 |
Shares redeemed | (875) | (3,131) | (12,951) | (44,833) |
Net increase (decrease) | (632) | (2,221) | $ (9,299) | $ (31,663) |
Service Class | | | | |
Shares sold | - | - | $ - | $ - |
Reinvestment of distributions | 168 | 837 | 2,522 | 12,090 |
Shares redeemed | (806) | (3,018) | (11,927) | (43,180) |
Net increase (decrease) | (638) | (2,181) | $ (9,405) | $ (31,090) |
Service Class 2 | | | | |
Shares sold | 3,997 | 617 | $ 58,961 | $ 9,521 |
Reinvestment of distributions | 183 | 883 | 2,745 | 12,757 |
Shares redeemed | (941) | (3,049) | (13,926) | (43,609) |
Net increase (decrease) | 3,239 | (1,549) | $ 47,780 | $ (21,331) |
VIP Freedom 2050 | | | | |
Initial Class | | | | |
Shares sold | 17,178 | 38,491 | $ 279,626 | $ 556,062 |
Reinvestment of distributions | 246 | 1,539 | 4,054 | 24,205 |
Shares redeemed | (42,480) | (9,291) | (695,904) | (141,310) |
Net increase (decrease) | (25,056) | 30,739 | $ (412,224) | $ 438,957 |
Service Class | | | | |
Shares sold | - | - | $ - | $ - |
Reinvestment of distributions | 41 | 302 | 674 | 4,665 |
Shares redeemed | (744) | (2,999) | (12,090) | (43,436) |
Net increase (decrease) | (703) | (2,697) | $ (11,416) | $ (38,771) |
Service Class 2 | | | | |
Shares sold | 2,254 | 1,782 | $ 37,305 | $ 26,095 |
Reinvestment of distributions | 49 | 343 | 814 | 5,307 |
Shares redeemed | (1,327) | (3,620) | (21,545) | (52,782) |
Net increase (decrease) | 976 | (1,495) | $ 16,574 | $ (21,380) |
8. Other.
The Funds' organizational documents provide former and current trustees and officers with a limited indemnification against liabilities arising in connection with the performance of their duties to the Funds. In the normal course of business, the Funds may also enter into contracts that provide general indemnifications. The Funds' maximum exposure under these arrangements is unknown as this would be dependent on future claims that may be made against the Funds. The risk of material loss from such claims is considered remote.
Semiannual Report
8. Other - continued
The Funds do not invest in the Underlying Funds for the purpose of exercising management or control; however, investments by the Funds within their principal investment strategies may represent a significant portion of the Underlying Fund's net assets. At the end of the period, VIP Freedom 2020 was the owner of record of approximately 21% of the total outstanding shares of VIP Value Portfolio, and approximately 11% of the total outstanding shares of VIP Emerging Markets Portfolio.
The Funds, in aggregate, were the owners of record of more than 20% of the total outstanding shares of the following Underlying Funds.
Fund | % of shares held |
VIP Emerging Markets Portfolio | 22% |
VIP Value Portfolio | 41% |
In addition, at the end of the period, FMR or its affiliates and certain otherwise unaffiliated shareholders each were owners of record of more than 10% of the outstanding shares of the following funds:
| Affiliated % | Number of
Unaffiliated
Shareholders | Unaffiliated
Shareholders % |
VIP Freedom Income | 52% | 2 | 27% |
VIP Freedom 2005 | 96% | - | -% |
VIP Freedom 2010 | 11% | 1 | 70% |
VIP Freedom 2015 | 33% | 1 | 35% |
VIP Freedom 2020 | -% | 2 | 81% |
VIP Freedom 2025 | 29% | 3 | 43% |
VIP Freedom 2030 | 14% | 2 | 60% |
VIP Freedom 2035 | 54% | 2 | 41% |
VIP Freedom 2040 | -% | 3 | 87% |
VIP Freedom 2045 | 81% | 1 | 14% |
VIP Freedom 2050 | 40% | 1 | 41% |
Semiannual Report
Investment Adviser
Strategic Advisers, Inc.
Boston, MA
General Distributor
Fidelity Distributors Corporation
Boston, MA
Transfer and Service Agents
Fidelity Investments Institutional Operations Company, Inc.
Boston, MA
Fidelity Service Company, Inc.
Boston, MA
Custodian
The Bank of New York Mellon
New York, NY
VIPFF2K-SANN-0811
1.819548.107
Fidelity® Variable Insurance Products:
Freedom Lifetime Income Funds -
Portfolios I, II, & III
Semiannual Report
June 30, 2011
(2_fidelity_logos) (Registered_Trademark)
Contents
To view a fund's proxy voting guidelines and proxy voting record for the 12-month period ended June 30, visit http://www.fidelity.com/proxyvotingresults or visit the Securities and Exchange Commission's (SEC) web site at http://www.sec.gov. You may also call 1-877-208-0098 to request a free copy of the proxy voting guidelines.
Fidelity Variable Insurance Products are separate account options which are purchased through a variable insurance contract.
Standard & Poor's, S&P and S&P 500 are registered service marks of The McGraw-Hill Companies, Inc. and have been licensed for use by Fidelity Distributors Corporation.
Other third party marks appearing herein are the property of their respective owners.
All other marks appearing herein are registered or unregistered trademarks or service marks of FMR LLC or an affiliated company.
This report and the financial statements contained herein are submitted for the general information of the shareholders of the funds. This report is not authorized for distribution to prospective investors in the funds unless preceded or accompanied by an effective prospectus.
A fund files its complete schedule of portfolio holdings with the SEC for the first and third quarters of each fiscal year on Form N-Q. Forms N-Q are available on the SEC's web site at http://www.sec.gov. A fund's Forms N-Q may be reviewed and copied at the SEC's Public Reference Room in Washington, DC. Information regarding the operation of the SEC's Public Reference Room may be obtained by calling 1-800-SEC-0330. For a complete list of a fund's portfolio holdings, view the most recent holdings listing, semiannual report, or annual report on Fidelity's web site at http://www.fidelity.com, http://www.advisor.fidelity.com, or http://www.401k.com, as applicable.
NOT FDIC INSURED • MAY LOSE VALUE • NO BANK GUARANTEE
Neither the funds nor Fidelity Distributors Corporation is a bank.
Semiannual Report
As a shareholder of a Fund, you incur two types of costs: (1) transaction costs, and (2) ongoing costs, including other Fund expenses. This Example is intended to help you understand your ongoing costs (in dollars) of investing in the Funds and to compare these costs with the ongoing costs of investing in other mutual funds.
The Example is based on an investment of $1,000 invested at the beginning of the period and held for the entire period (January 1, 2011 to June 30, 2011).
Actual Expenses
The first line of the accompanying table for each fund provides information about actual account values and actual expenses. You may use the information in this line, together with the amount you invested, to estimate the expenses that you paid over the period. Simply divide your account value by $1,000.00 (for example, an $8,600 account value divided by $1,000.00 = 8.6), then multiply the result by the number in the first line for a fund under the heading entitled "Expenses Paid During Period" to estimate the expenses you paid on your account during this period. The estimate of expenses does not include any fees or other expenses of any variable annuity or variable life insurance product. If they were, the estimate of expenses you paid during the period would be higher, and your ending account value would be lower. In addition, each Fund, as a shareholder in underlying Fidelity Funds, will indirectly bear its pro-rata share of the fees and expenses incurred by the underlying Fidelity Funds. These fees and expenses are not included in each Fund's annualized expense ratio used to calculate the expense estimates in the table below.
Hypothetical Example for Comparison Purposes
The second line of the accompanying table for each fund provides information about hypothetical account values and hypothetical expenses based on a fund's actual expense ratio and an assumed rate of return of 5% per year before expenses, which is not the Fund's actual return. The hypothetical account values and expenses may not be used to estimate the actual ending account balance or expenses you paid for the period. You may use this information to compare the ongoing costs of investing in the Fund and other funds. To do so, compare this 5% hypothetical example with the 5% hypothetical examples that appear in the shareholder reports of the other funds. The estimate of expenses does not include any fees or other expenses of any variable annuity or variable life insurance product. If they were, the estimate of expenses you paid during the period would be higher, and your ending account value would be lower. In addition, each Fund, as a shareholder in underlying Fidelity Funds, will indirectly bear its pro-rata share of the fees and expenses incurred by the underlying Fidelity Funds. These fees and expenses are not included in each Fund's annualized expense ratio used to calculate the expense estimates in the table below.
Please note that the expenses shown in the table are meant to highlight your ongoing costs only and do not reflect any transaction costs. Therefore, the second line of the table is useful in comparing ongoing costs only, and will not help you determine the relative total costs of owning different funds.
| Annualized
Expense Ratio | Beginning
Account Value
January 1, 2011 | Ending
Account Value
June 30, 2011 | Expenses Paid
During Period*
January 1, 2011 to June 30, 2011 |
VIP Freedom Lifetime Income I | .00% | | | |
Actual | | $ 1,000.00 | $ 1,037.00 | $ .00 |
Hypothetical A | | $ 1,000.00 | $ 1,024.79 | $ .00 |
VIP Freedom Lifetime Income II | .00% | | | |
Actual | | $ 1,000.00 | $ 1,041.90 | $ .00 |
Hypothetical A | | $ 1,000.00 | $ 1,024.79 | $ .00 |
VIP Freedom Lifetime Income III | .00% | | | |
Actual | | $ 1,000.00 | $ 1,048.00 | $ .00 |
Hypothetical A | | $ 1,000.00 | $ 1,024.79 | $ .00 |
A 5% return per year before expenses
* Expenses are equal to each Fund's annualized expense ratio, multiplied by the average account value over the period, multiplied by 181/365 (to reflect the one-half year period). The fees and expenses of the underlying Fidelity Funds in which the Fund invests are not included in the Fund's annualized expense ratio.
Semiannual Report
VIP Freedom Lifetime Income I Portfolio
Investment Changes (Unaudited)
Fund Holdings as of June 30, 2011 |
| % of fund's
net assets | % of fund's net assets
6 months ago |
Domestic Equity Funds | | |
VIP Contrafund Portfolio Investor Class | 5.0 | 5.3 |
VIP Equity-Income Portfolio Investor Class | 5.8 | 6.2 |
VIP Growth & Income Portfolio Investor Class | 5.8 | 6.1 |
VIP Growth Portfolio Investor Class | 5.9 | 6.2 |
VIP Mid Cap Portfolio Investor Class | 2.0 | 2.1 |
VIP Value Portfolio Investor Class | 5.0 | 5.3 |
VIP Value Strategies Portfolio Investor Class | 2.1 | 2.2 |
| 31.6 | 33.4 |
Developed International Equity Funds | | |
VIP Overseas Portfolio Investor Class R | 9.6 | 9.9 |
Emerging Markets Equity Funds | | |
VIP Emerging Markets Portfolio Investor Class R | 1.6 | 1.6 |
High Yield Bond Funds | | |
VIP High Income Portfolio Investor Class | 5.0 | 4.9 |
Investment Grade Bond Funds | | |
VIP Investment Grade Bond Portfolio Investor Class | 37.3 | 35.6 |
Short-Term Funds | | |
VIP Money Market Portfolio Investor Class | 14.9 | 14.6 |
Net Other Assets (Liabilities)* | 0.0 | 0.0 |
| 100.0 | 100.0 |
* Amount represents less than .01%. |
Asset Allocation (% of fund's net assets) |
Current |
| Domestic Equity Funds | 31.6% | |
| Developed International Equity Funds | 9.6% | |
 | Emerging Markets Equity Funds | 1.6% | |
| High Yield Bond Funds | 5.0% | |
| Investment Grade Bond Funds | 37.3% | |
| Short-Term Funds | 14.9% | |

Six months ago |
| Domestic Equity Funds | 33.4% | |
| Developed International Equity Funds | 9.9% | |
| Emerging Markets Equity Funds | 1.6% | |
| High Yield Bond Funds | 4.9% | |
| Investment Grade Bond Funds | 35.6% | |
| Short-Term Funds | 14.6% | |

Expected |
| Domestic Equity Funds | 30.0% | |
| Developed International Equity Funds | 9.3% | |
| Emerging Markets Equity Funds | 1.6% | |
| High Yield Bond Funds | 5.0% | |
| Investment Grade Bond Funds | 39.1% | |
| Short-Term Funds | 15.0% | |

The fund invests according to an asset allocation strategy that becomes increasingly conservative over time. The six months ago allocation is based on the fund's holdings as of December 30, 2010. The current allocation is based on the fund's holdings as of June 30, 2011. The expected allocation represents the fund's anticipated allocation at December 31, 2011. |
Semiannual Report
VIP Freedom Lifetime Income I Portfolio
Investments June 30, 2011 (Unaudited)
Showing Percentage of Net Assets
Domestic Equity Funds - 31.6% |
| Shares | | Value |
Domestic Equity Funds - 31.6% |
VIP Contrafund Portfolio Investor Class | 20,852 | | $ 521,713 |
VIP Equity-Income Portfolio Investor Class | 30,120 | | 608,131 |
VIP Growth & Income Portfolio Investor Class | 46,078 | | 606,851 |
VIP Growth Portfolio Investor Class | 15,434 | | 619,351 |
VIP Mid Cap Portfolio Investor Class | 6,440 | | 211,806 |
VIP Value Portfolio Investor Class | 44,959 | | 520,178 |
VIP Value Strategies Portfolio Investor Class | 21,210 | | 218,462 |
TOTAL DOMESTIC EQUITY FUNDS (Cost $3,664,224) | 3,306,492 |
International Equity Funds - 11.2% |
| | | |
Developed International Equity Funds - 9.6% |
VIP Overseas Portfolio Investor Class R | 56,808 | | 999,817 |
Emerging Markets Equity Funds - 1.6% |
VIP Emerging Markets Portfolio Investor Class R | 17,482 | | 172,199 |
TOTAL INTERNATIONAL EQUITY FUNDS (Cost $1,271,600) | 1,172,016 |
Bond Funds - 42.3% |
| Shares | | Value |
High Yield Bond Funds - 5.0% |
VIP High Income Portfolio Investor Class | 89,730 | | $ 520,432 |
Investment Grade Bond Funds - 37.3% |
VIP Investment Grade Bond Portfolio Investor Class | 300,773 | | 3,898,020 |
TOTAL BOND FUNDS (Cost $4,360,095) | 4,418,452 |
Short-Term Funds - 14.9% |
| | | |
VIP Money Market Portfolio Investor Class
(Cost $1,559,307) | 1,559,307 | | 1,559,307 |
TOTAL INVESTMENT PORTFOLIO - 100.0% (Cost $10,855,226) | | 10,456,267 |
NET OTHER ASSETS (LIABILITIES) - 0.0% | | (1) |
NET ASSETS - 100% | $ 10,456,266 |
Other Information |
All investments are categorized as Level 1 under the Fair Value Hierarchy. The inputs or methodology used for valuing securities may not be an indication of the risk associated with investing in those securities. For more information on valuation inputs, please refer to the Security Valuation section in the accompanying Notes to Financial Statements. |
See accompanying notes which are an integral part of the financial statements.
Semiannual Report
VIP Freedom Lifetime Income I Portfolio
Statement of Assets and Liabilities
| June 30, 2011 (Unaudited) |
| | |
Assets | | |
Investment in securities, at value (cost $10,855,226) - See accompanying schedule | | $ 10,456,267 |
Receivable for investments sold | | 172 |
Total assets | | 10,456,439 |
| | |
Liabilities | | |
Payable to custodian bank | $ 1 | |
Payable for fund shares redeemed | 172 | |
Total liabilities | | 173 |
| | |
Net Assets | | $ 10,456,266 |
Net Assets consist of: | | |
Paid in capital | | $ 10,822,346 |
Undistributed net investment income | | 2,721 |
Accumulated undistributed net realized gain (loss) on investments | | 30,158 |
Net unrealized appreciation (depreciation) on investments | | (398,959) |
Net Assets, for 1,020,800 shares outstanding | | $ 10,456,266 |
Net Asset Value, offering price and redemption price per share ($10,456,266 ÷ 1,020,800 shares) | | $ 10.24 |
Statement of Operations
Six months ended June 30, 2011 (Unaudited) |
| | |
Investment Income | | |
Income distributions from underlying funds | | $ 2,721 |
| | |
Expenses | | |
Independent trustees' compensation | $ 19 | |
Total expenses before reductions | 19 | |
Expense reductions | (19) | 0 |
Net investment income (loss) | | 2,721 |
Realized and Unrealized Gain (Loss) Realized gain (loss) on sale of underlying fund shares | 22,652 | |
Capital gain distributions from underlying funds | 63,490 | |
Total net realized gain (loss) | | 86,142 |
Change in net unrealized appreciation (depreciation) on underlying funds | | 288,272 |
Net gain (loss) | | 374,414 |
Net increase (decrease) in net assets resulting from operations | | $ 377,135 |
See accompanying notes which are an integral part of the financial statements.
Semiannual Report
Financial Statements - continued
Statement of Changes in Net Assets
| Six months ended June 30, 2011
(Unaudited) | Year ended
December 31, 2010 |
Increase (Decrease) in Net Assets | | |
Operations | | |
Net investment income (loss) | $ 2,721 | $ 212,825 |
Net realized gain (loss) | 86,142 | 110,224 |
Change in net unrealized appreciation (depreciation) | 288,272 | 753,750 |
Net increase (decrease) in net assets resulting from operations | 377,135 | 1,076,799 |
Distributions to shareholders from net investment income | - | (222,558) |
Distributions to shareholders from net realized gain | (4,993) | (110,575) |
Total distributions | (4,993) | (333,133) |
Share transactions
Proceeds from sales of shares | 514,510 | 1,364,399 |
Reinvestment of distributions | 4,993 | 333,133 |
Cost of shares redeemed | (780,269) | (869,595) |
Net increase (decrease) in net assets resulting from share transactions | (260,766) | 827,937 |
Total increase (decrease) in net assets | 111,376 | 1,571,603 |
| | |
Net Assets | | |
Beginning of period | 10,344,890 | 8,773,287 |
End of period (including undistributed net investment income of $2,721 and $0, respectively) | $ 10,456,266 | $ 10,344,890 |
Other Information Shares | | |
Sold | 50,847 | 143,545 |
Issued in reinvestment of distributions | 495 | 33,844 |
Redeemed | (77,744) | (91,110) |
Net increase (decrease) | (26,402) | 86,279 |
Financial Highlights
| Six months ended June 30, 2011 | Years ended December 31, |
| (Unaudited) | 2010 | 2009 | 2008 | 2007 | 2006 |
Selected Per-Share Data | | | | | | |
Net asset value, beginning of period | $ 9.88 | $ 9.13 | $ 7.81 | $ 11.21 | $ 10.98 | $ 10.27 |
Income from Investment Operations | | | | | | |
Net investment income (loss) E | - I | .21 | .36 | .33 | .36 | .27 |
Net realized and unrealized gain (loss) | .37 | .87 | 1.40 | (2.85) | .53 | .67 |
Total from investment operations | .37 | 1.08 | 1.76 | (2.52) | .89 | .94 |
Distributions from net investment income | - | (.22) | (.36) | (.37) | (.34) | (.18) |
Distributions from net realized gain | (.01) | (.11) | (.08) | (.51) | (.32) | (.05) |
Total distributions | (.01) | (.33) | (.44) | (.88) | (.66) | (.23) |
Net asset value, end of period | $ 10.24 | $ 9.88 | $ 9.13 | $ 7.81 | $ 11.21 | $ 10.98 |
Total Return B,C,D | 3.70% | 11.84% | 22.76% | (22.68)% | 8.16% | 9.15% |
Ratios to Average Net Assets F,H | | | | | | |
Expenses before reductions G | .00% A | .00% | .00% | .00% | .00% | .00% |
Expenses net of fee waivers, if any | .00% A | .00% | .00% | .00% | .00% | .00% |
Expenses net of all reductions | .00% A | .00% | .00% | .00% | .00% | .00% |
Net investment income (loss) | .05% A | 2.26% | 4.28% | 3.31% | 3.15% | 2.50% |
Supplemental Data | | | | | | |
Net assets, end of period (000 omitted) | $ 10,456 | $ 10,345 | $ 8,773 | $ 7,648 | $ 12,533 | $ 10,106 |
Portfolio turnover rate | 17% A | 26% | 20% | 25% | 16% | 28% |
A Annualized
B Total returns for periods of less than one year are not annualized.
C Total returns do not reflect charges attributable to your insurance company's separate account. Inclusion of these charges would reduce the total returns shown.
D Total returns would have been lower if certain expenses had not been reduced during the applicable periods shown.
E Calculated based on average shares outstanding during the period.
F Amounts do not include the activity of the underlying funds.
G Amount represents less than .01%.
H Expense ratios reflect operating expenses of the Fund. Expenses before reductions do not reflect amounts reimbursed by the investment adviser or reductions from expense offset arrangements and do not represent the amount paid by the Fund during periods when reimbursements or reductions occur. Expenses net of fee waivers reflect expenses after reimbursement by the investment adviser but prior to reductions from expense offset arrangements. Expenses net of all reductions represent the net expenses paid by the Fund but do not include expenses of the investment companies in which the Fund invests.
I Amount represents less than $.01 per share.
See accompanying notes which are an integral part of the financial statements.
Semiannual Report
VIP Freedom Lifetime Income II Portfolio
Investment Changes (Unaudited)
Fund Holdings as of June 30, 2011 |
| % of fund's
net assets | % of fund's net assets
6 months ago |
Domestic Equity Funds | | |
VIP Contrafund Portfolio Investor Class | 5.6 | 6.0 |
VIP Equity-Income Portfolio Investor Class | 6.6 | 7.0 |
VIP Growth & Income Portfolio Investor Class | 6.6 | 7.0 |
VIP Growth Portfolio Investor Class | 6.7 | 7.0 |
VIP Mid Cap Portfolio Investor Class | 2.3 | 2.4 |
VIP Value Portfolio Investor Class | 5.6 | 6.0 |
VIP Value Strategies Portfolio Investor Class | 2.4 | 2.6 |
| 35.8 | 38.0 |
Developed International Equity Funds | | |
VIP Overseas Portfolio Investor Class R | 10.9 | 11.3 |
Emerging Markets Equity Funds | | |
VIP Emerging Markets Portfolio Investor Class R | 1.9 | 1.9 |
High Yield Bond Funds | | |
VIP High Income Portfolio Investor Class | 5.3 | 5.3 |
Investment Grade Bond Funds | | |
VIP Investment Grade Bond Portfolio Investor Class | 37.8 | 35.9 |
Short-Term Funds | | |
VIP Money Market Portfolio Investor Class | 8.3 | 7.6 |
Net Other Assets (Liabilities)* | 0.0 | 0.0 |
| 100.0 | 100.0 |
* Amount represents less than .01%. |
Asset Allocation (% of fund's net assets) |
Current |
| Domestic Equity Funds | 35.8% | |
| Developed International Equity Funds | 10.9% | |
| Emerging Markets Equity Funds | 1.9% | |
| High Yield Bond Funds | 5.3% | |
| Investment Grade Bond Funds | 37.8% | |
| Short-Term Funds | 8.3% | |

Six months ago |
| Domestic Equity Funds | 38.0% | |
| Developed International Equity Funds | 11.3% | |
| Emerging Markets Equity Funds | 1.9% | |
| High Yield Bond Funds | 5.3% | |
| Investment Grade Bond Funds | 35.9% | |
| Short-Term Funds | 7.6% | |

Expected |
| Domestic Equity Funds | 34.6% | |
| Developed International Equity Funds | 10.7% | |
| Emerging Markets Equity Funds | 1.9% | |
| High Yield Bond Funds | 5.2% | |
| Investment Grade Bond Funds | 38.7% | |
| Short-Term Funds | 8.9% | |

The fund invests according to an asset allocation strategy that becomes increasingly conservative over time. The six months ago allocation is based on the fund's holdings as of December 30, 2010. The current allocation is based on the fund's holdings as of June 30, 2011. The expected allocation represents the fund's anticipated allocation at December 31, 2011. |
Semiannual Report
VIP Freedom Lifetime Income II Portfolio
Investments June 30, 2011 (Unaudited)
Showing Percentage of Net Assets
Domestic Equity Funds - 35.8% |
| Shares | | Value |
Domestic Equity Funds - 35.8% |
VIP Contrafund Portfolio Investor Class | 36,653 | | $ 917,058 |
VIP Equity-Income Portfolio Investor Class | 52,929 | | 1,068,642 |
VIP Growth & Income Portfolio Investor Class | 80,970 | | 1,066,376 |
VIP Growth Portfolio Investor Class | 27,115 | | 1,088,138 |
VIP Mid Cap Portfolio Investor Class | 11,357 | | 373,525 |
VIP Value Portfolio Investor Class | 79,027 | | 914,343 |
VIP Value Strategies Portfolio Investor Class | 37,373 | | 384,940 |
TOTAL DOMESTIC EQUITY FUNDS (Cost $6,633,234) | 5,813,022 |
International Equity Funds - 12.8% |
| | | |
Developed International Equity Funds - 10.9% |
VIP Overseas Portfolio Investor Class R | 100,373 | | 1,766,572 |
Emerging Markets Equity Funds - 1.9% |
VIP Emerging Markets Portfolio Investor Class R | 30,909 | | 304,452 |
TOTAL INTERNATIONAL EQUITY FUNDS (Cost $2,406,269) | 2,071,024 |
Bond Funds - 43.1% |
| Shares | | Value |
High Yield Bond Funds - 5.3% |
VIP High Income Portfolio Investor Class | 148,026 | | $ 858,550 |
Investment Grade Bond Funds - 37.8% |
VIP Investment Grade Bond Portfolio Investor Class | 472,432 | | 6,122,725 |
TOTAL BOND FUNDS (Cost $6,879,821) | 6,981,275 |
Short-Term Funds - 8.3% |
| | | |
VIP Money Market Portfolio Investor Class
(Cost $1,341,046) | 1,341,046 | | 1,341,046 |
TOTAL INVESTMENT PORTFOLIO - 100.0% (Cost $17,260,370) | | 16,206,367 |
NET OTHER ASSETS (LIABILITIES) - 0.0% | | (2) |
NET ASSETS - 100% | $ 16,206,365 |
Other Information |
All investments are categorized as Level 1 under the Fair Value Hierarchy. The inputs or methodology used for valuing securities may not be an indication of the risk associated with investing in those securities. For more information on valuation inputs, please refer to the Security Valuation section in the accompanying Notes to Financial Statements. |
Income Tax Information |
At December 31, 2010, the Fund had a capital loss carryforward of approximately $792,228 of which $503,057 and $289,171 will expire in fiscal 2017 and 2018, respectively. Capital loss carryforwards are only available to offset future capital gains of the Fund to the extent provided by regulations and may be limited. |
See accompanying notes which are an integral part of the financial statements.
Semiannual Report
VIP Freedom Lifetime Income II Portfolio
Statement of Assets and Liabilities
| June 30, 2011 (Unaudited) |
| | |
Assets | | |
Investment in securities, at value (cost $17,260,370) - See accompanying schedule | | $ 16,206,367 |
Cash | | 1 |
Receivable for investments sold | | 266 |
Total assets | | 16,206,634 |
| | |
Liabilities | | |
Payable for fund shares redeemed | | 269 |
| | |
Net Assets | | $ 16,206,365 |
Net Assets consist of: | | |
Paid in capital | | $ 18,104,300 |
Undistributed net investment income | | 3,687 |
Accumulated undistributed net realized gain (loss) on investments | | (847,619) |
Net unrealized appreciation (depreciation) on investments | | (1,054,003) |
Net Assets, for 1,589,264 shares outstanding | | $ 16,206,365 |
Net Asset Value, offering price and redemption price per share ($16,206,365 ÷ 1,589,264 shares) | | $ 10.20 |
Statement of Operations
Six months ended June 30, 2011 (Unaudited) |
| | |
Investment Income | | |
Income distributions from underlying funds | | $ 3,687 |
| | |
Expenses | | |
Independent trustees' compensation | $ 28 | |
Total expenses before reductions | 28 | |
Expense reductions | (28) | 0 |
Net investment income (loss) | | 3,687 |
Realized and Unrealized Gain (Loss) Realized gain (loss) on sale of underlying fund shares | (9,203) | |
Capital gain distributions from underlying funds | 100,858 | |
Total net realized gain (loss) | | 91,655 |
Change in net unrealized appreciation (depreciation) on underlying funds | | 530,683 |
Net gain (loss) | | 622,338 |
Net increase (decrease) in net assets resulting from operations | | $ 626,025 |
See accompanying notes which are an integral part of the financial statements.
Semiannual Report
Statement of Changes in Net Assets
| Six months ended June 30, 2011
(Unaudited) | Year ended
December 31, 2010 |
Increase (Decrease) in Net Assets | | |
Operations | | |
Net investment income (loss) | $ 3,687 | $ 314,795 |
Net realized gain (loss) | 91,655 | (234,213) |
Change in net unrealized appreciation (depreciation) | 530,683 | 1,664,188 |
Net increase (decrease) in net assets resulting from operations | 626,025 | 1,744,770 |
Distributions to shareholders from net investment income | - | (312,980) |
Distributions to shareholders from net realized gain | - | (73,409) |
Total distributions | - | (386,389) |
Share transactions
Proceeds from sales of shares | 1,499,407 | 407,181 |
Reinvestment of distributions | - | 386,389 |
Cost of shares redeemed | (556,309) | (1,687,084) |
Net increase (decrease) in net assets resulting from share transactions | 943,098 | (893,514) |
Total increase (decrease) in net assets | 1,569,123 | 464,867 |
| | |
Net Assets | | |
Beginning of period | 14,637,242 | 14,172,375 |
End of period (including undistributed net investment income of $3,687 and $0, respectively) | $ 16,206,365 | $ 14,637,242 |
Other Information Shares | | |
Sold | 149,925 | 44,625 |
Issued in reinvestment of distributions | - | 39,603 |
Redeemed | (55,031) | (182,338) |
Net increase (decrease) | 94,894 | (98,110) |
Financial Highlights
| Six months ended June 30, 2011 | Years ended December 31, |
| (Unaudited) | 2010 | 2009 | 2008 | 2007 | 2006 |
Selected Per-Share Data | | | | | | |
Net asset value, beginning of period | $ 9.79 | $ 8.90 | $ 7.42 | $ 11.68 | $ 11.36 | $ 10.37 |
Income from Investment Operations | | | | | | |
Net investment income (loss) E | - I | .21 | .34 | .29 | .32 | .23 |
Net realized and unrealized gain (loss) | .41 | .95 | 1.59 | (3.57) | .77 | .95 |
Total from investment operations | .41 | 1.16 | 1.93 | (3.28) | 1.09 | 1.18 |
Distributions from net investment income | - | (.22) | (.36) | (.34) | (.30) | (.14) |
Distributions from net realized gain | - | (.05) | (.09) | (.64) | (.48) | (.05) |
Total distributions | - | (.27) | (.45) | (.98) | (.77) J | (.19) |
Net asset value, end of period | $ 10.20 | $ 9.79 | $ 8.90 | $ 7.42 | $ 11.68 | $ 11.36 |
Total Return B,C,D | 4.19% | 12.99% | 26.44% | (28.49)% | 9.67% | 11.38% |
Ratios to Average Net Assets F,H | | | | | | |
Expenses before reductions G | .00% A | 00% | .00% | .00% | .00% | .00% |
Expenses net of fee waivers, if any | .00% A | .00% | .00% | .00% | .00% | .00% |
Expenses net of all reductions | .00% A | .00% | .00% | .00% | .00% | .00% |
Net investment income (loss) | .05% A | 2.22% | 4.25% | 2.91% | 2.67% | 2.12% |
Supplemental Data | | | | | | |
Net assets, end of period (000 omitted) | $ 16,206 | $ 14,637 | $ 14,172 | $ 12,892 | $ 22,701 | $ 17,221 |
Portfolio turnover rate | 14% A | 23% | 21% | 25% | 18% | 16% |
A Annualized
B Total returns for periods of less than one year are not annualized.
C Total returns do not reflect charges attributable to your insurance company's separate account. Inclusion of these charges would reduce the total returns shown.
D Total returns would have been lower if certain expenses had not been reduced during the applicable periods shown.
E Calculated based on average shares outstanding during the period.
F Amounts do not include the activity of the underlying funds.
G Amount represents less than .01%.
H Expense ratios reflect operating expenses of the Fund. Expenses before reductions do not reflect amounts reimbursed by the investment adviser or reductions from expense offset arrangements and do not represent the amount paid by the Fund during periods when reimbursements or reductions occur. Expenses net of fee waivers reflect expenses after reimbursement by the investment adviser but prior to reductions from expense offset arrangements. Expenses net of all reductions represent the net expenses paid by the Fund but do not include expenses of the investment companies in which the Fund invests.
I Amount represents less than $.01 per share.
J Total distributions of $.77 per share is comprised of distributions from net investment income of $.295 and distributions from net realized gain of $.475 per share.
See accompanying notes which are an integral part of the financial statements.
Semiannual Report
VIP Freedom Lifetime Income III Portfolio
Investment Changes (Unaudited)
Fund Holdings as of June 30, 2011 |
| % of fund's
net assets | % of fund's net assets
6 months ago |
Domestic Equity Funds | | |
VIP Contrafund Portfolio Investor Class | 8.2 | 8.4 |
VIP Equity-Income Portfolio Investor Class | 9.6 | 9.9 |
VIP Growth & Income Portfolio Investor Class | 9.5 | 9.8 |
VIP Growth Portfolio Investor Class | 9.7 | 9.8 |
VIP Mid Cap Portfolio Investor Class | 3.3 | 3.4 |
VIP Value Portfolio Investor Class | 8.2 | 8.4 |
VIP Value Strategies Portfolio Investor Class | 3.4 | 3.6 |
| 51.9 | 53.3 |
Developed International Equity Funds | | |
VIP Overseas Portfolio Investor Class R | 15.9 | 15.8 |
Emerging Markets Equity Funds | | |
VIP Emerging Markets Portfolio Investor Class R | 2.7 | 2.6 |
High Yield Bond Funds | | |
VIP High Income Portfolio Investor Class | 7.5 | 7.2 |
Investment Grade Bond Funds | | |
VIP Investment Grade Bond Portfolio Investor Class | 22.0 | 21.1 |
Net Other Assets (Liabilities)* | 0.0 | 0.0 |
| 100.0 | 100.0 |
* Amount represents less than .01%. |
Asset Allocation (% of fund's net assets) |
Current |
| Domestic Equity Funds | 51.9% | |
| Developed International Equity Funds | 15.9% | |
| Emerging Markets Equity Funds | 2.7% | |
| High Yield Bond Funds | 7.5% | |
| Investment Grade Bond Funds | 22.0% | |

Six months ago |
| Domestic Equity Funds | 53.3% | |
| Developed International Equity Funds | 15.8% | |
| Emerging Markets Equity Funds | 2.6% | |
| High Yield Bond Funds | 7.2% | |
| Investment Grade Bond Funds | 21.1% | |

Expected |
| Domestic Equity Funds | 51.3% | |
| Developed International Equity Funds | 15.9% | |
| Emerging Markets Equity Funds | 2.8% | |
| High Yield Bond Funds | 7.5% | |
| Investment Grade Bond Funds | 22.5% | |

The fund invests according to an asset allocation strategy that becomes increasingly conservative over time. The six months ago allocation is based on the fund's holdings as of December 30, 2010. The current allocation is based on the fund's holdings as of June 30, 2011. The expected allocation represents the fund's anticipated allocation at December 31, 2011. |
Semiannual Report
VIP Freedom Lifetime Income III Portfolio
Investments June 30, 2011 (Unaudited)
Showing Percentage of Net Assets
Domestic Equity Funds - 51.9% |
| Shares | | Value |
Domestic Equity Funds - 51.9% |
VIP Contrafund Portfolio Investor Class | 24,295 | | $ 607,856 |
VIP Equity-Income Portfolio Investor Class | 35,109 | | 708,844 |
VIP Growth & Income Portfolio Investor Class | 53,711 | | 707,370 |
VIP Growth Portfolio Investor Class | 17,994 | | 722,081 |
VIP Mid Cap Portfolio Investor Class | 7,520 | | 247,339 |
VIP Value Portfolio Investor Class | 52,403 | | 606,308 |
VIP Value Strategies Portfolio Investor Class | 24,760 | | 255,024 |
TOTAL DOMESTIC EQUITY FUNDS (Cost $4,288,138) | 3,854,822 |
International Equity Funds - 18.6% |
| | | |
Developed International Equity Funds - 15.9% |
VIP Overseas Portfolio Investor Class R | 67,032 | | 1,179,771 |
Emerging Markets Equity Funds - 2.7% |
VIP Emerging Markets Portfolio Investor Class R | 20,597 | | 202,878 |
TOTAL INTERNATIONAL EQUITY FUNDS (Cost $1,547,534) | 1,382,649 |
Bond Funds - 29.5% |
| Shares | | Value |
High Yield Bond Funds - 7.5% |
VIP High Income Portfolio Investor Class | 96,522 | | $ 559,827 |
Investment Grade Bond Funds - 22.0% |
VIP Investment Grade Bond Portfolio Investor Class | 126,219 | | 1,635,795 |
TOTAL BOND FUNDS (Cost $2,192,307) | 2,195,622 |
TOTAL INVESTMENT PORTFOLIO - 100.0% (Cost $8,027,979) | | 7,433,093 |
NET OTHER ASSETS (LIABILITIES) - 0.0% | | 47 |
NET ASSETS - 100% | $ 7,433,140 |
Other Information |
All investments are categorized as Level 1 under the Fair Value Hierarchy. The inputs or methodology used for valuing securities may not be an indication of the risk associated with investing in those securities. For more information on valuation inputs, please refer to the Security Valuation section in the accompanying Notes to Financial Statements. |
Income Tax Information |
At December 31, 2010, the Fund had a capital loss carryforward of approximately $96,950 all of which will expire in fiscal 2018. Capital loss carryforwards are only available to offset future capital gains of the Fund to the extent provided by regulations and may be limited. |
See accompanying notes which are an integral part of the financial statements.
Semiannual Report
VIP Freedom Lifetime Income III Portfolio
Statement of Assets and Liabilities
| June 30, 2011 (Unaudited) |
| | |
Assets | | |
Investment in securities, at value (cost $8,027,979) - See accompanying schedule | | $ 7,433,093 |
Cash | | 49 |
Receivable for investments sold | | 122 |
Total assets | | 7,433,264 |
| | |
Liabilities | | |
Payable for fund shares redeemed | | 124 |
| | |
Net Assets | | $ 7,433,140 |
Net Assets consist of: | | |
Paid in capital | | $ 8,163,510 |
Undistributed net investment income | | 1,052 |
Accumulated undistributed net realized gain (loss) on investments | | (136,536) |
Net unrealized appreciation (depreciation) on investments | | (594,886) |
Net Assets, for 756,555 shares outstanding | | $ 7,433,140 |
Net Asset Value, offering price and redemption price per share ($7,433,140 ÷ 756,555 shares) | | $ 9.82 |
Statement of Operations
Six months ended June 30, 2011 (Unaudited) |
| | |
Investment Income | | |
Income distributions from underlying funds | | $ 1,052 |
| | |
Expenses | | |
Independent trustees' compensation | $ 13 | |
Total expenses before reductions | 13 | |
Expense reductions | (13) | 0 |
Net investment income (loss) | | 1,052 |
Realized and Unrealized Gain (Loss) Realized gain (loss) on sale of underlying fund shares | (10,928) | |
Capital gain distributions from underlying funds | 28,697 | |
Total net realized gain (loss) | | 17,769 |
Change in net unrealized appreciation (depreciation) on underlying funds | | 305,509 |
Net gain (loss) | | 323,278 |
Net increase (decrease) in net assets resulting from operations | | $ 324,330 |
See accompanying notes which are an integral part of the financial statements.
Semiannual Report
Statement of Changes in Net Assets
| Six months ended June 30, 2011
(Unaudited) | Year ended
December 31, 2010 |
Increase (Decrease) in Net Assets | | |
Operations | | |
Net investment income (loss) | $ 1,052 | $ 131,619 |
Net realized gain (loss) | 17,769 | (82,518) |
Change in net unrealized appreciation (depreciation) | 305,509 | 919,548 |
Net increase (decrease) in net assets resulting from operations | 324,330 | 968,649 |
Distributions to shareholders from net investment income | - | (133,615) |
Distributions to shareholders from net realized gain | - | (29,512) |
Total distributions | - | (163,127) |
Share transactions
Proceeds from sales of shares | 560,942 | 87,477 |
Reinvestment of distributions | - | 163,127 |
Cost of shares redeemed | (192,706) | (945,584) |
Net increase (decrease) in net assets resulting from share transactions | 368,236 | (694,980) |
Total increase (decrease) in net assets | 692,566 | 110,542 |
| | |
Net Assets | | |
Beginning of period | 6,740,574 | 6,630,032 |
End of period (including undistributed net investment income of $1,052 and $0, respectively) | $ 7,433,140 | $ 6,740,574 |
Other Information Shares | | |
Sold | 56,917 | 9,419 |
Issued in reinvestment of distributions | - | 17,634 |
Redeemed | (19,729) | (108,174) |
Net increase (decrease) | 37,188 | (81,121) |
Financial Highlights
| Six months ended June 30, 2011 | Years ended December 31, |
| (Unaudited) | 2010 | 2009 | 2008 | 2007 | 2006 |
Selected Per-Share Data | | | | | | |
Net asset value, beginning of period | $ 9.37 | $ 8.28 | $ 6.72 | $ 11.90 | $ 11.56 | $ 10.48 |
Income from Investment Operations | | | | | | |
Net investment income (loss) E | - I | .18 | .24 | .24 | .29 | .19 |
Net realized and unrealized gain (loss) | .45 | 1.14 | 1.76 | (4.36) | .96 | 1.15 |
Total from investment operations | .45 | 1.32 | 2.00 | (4.12) | 1.25 | 1.34 |
Distributions from net investment income | - | (.19) | (.26) | (.27) | (.29) | (.15) |
Distributions from net realized gain | - | (.04) | (.18) | (.79) | (.62) | (.11) |
Total distributions | - | (.23) | (.44) | (1.06) | (.91) | (.26) |
Net asset value, end of period | $ 9.82 | $ 9.37 | $ 8.28 | $ 6.72 | $ 11.90 | $ 11.56 |
Total Return B,C,D | 4.80% | 15.98% | 30.34% | (35.25)% | 10.88% | 12.78% |
Ratios to Average Net Assets F,H | | | | | | |
Expenses before reductions G | .00% A | .00% | .00% | .00% | .00% | .00% |
Expenses net of fee waivers, if any | .00% A | .00% | .00% | .00% | .00% | .00% |
Expenses net of all reductions | .00% A | .00% | .00% | .00% | .00% | .00% |
Net investment income (loss) | .03% A | 2.03% | 3.33% | 2.43% | 2.41% | 1.76% |
Supplemental Data | | | | | | |
Net assets, end of period (000 omitted) | $ 7,433 | $ 6,741 | $ 6,630 | $ 5,419 | $ 11,085 | $ 8,835 |
Portfolio turnover rate | 10% A | 20% | 10% | 20% | 11% | 15% |
A Annualized
B Total returns for periods of less than one year are not annualized.
C Total returns do not reflect charges attributable to your insurance company's separate account. Inclusion of these charges would reduce the total returns shown.
D Total returns would have been lower if certain expenses had not been reduced during the applicable periods shown.
E Calculated based on average shares outstanding during the period.
F Amounts do not include the activity of the underlying funds.
G Amount represents less than .01%.
H Expense ratios reflect operating expenses of the Fund. Expenses before reductions do not reflect amounts reimbursed by the investment adviser or reductions from expense offset arrangements and do not represent the amount paid by the Fund during periods when reimbursements or reductions occur. Expenses net of fee waivers reflect expenses after reimbursement by the investment adviser but prior to reductions from expense offset arrangements. Expenses net of all reductions represent the net expenses paid by the Fund but do not include expenses of the investment companies in which the Fund invests.
I Amount represents less than $.01 per share.
See accompanying notes which are an integral part of the financial statements.
Semiannual Report
Notes to Financial Statements
For the period ended June 30, 2011 (Unaudited)
1. Organization.
VIP Freedom Lifetime Income I Portfolio, VIP Freedom Lifetime Income II Portfolio, and VIP Freedom Lifetime Income III Portfolio (the Funds) are funds of Variable Insurance Products Fund V. The Variable Insurance Products Fund V (the Trust) (referred to in this report as Fidelity Variable Insurance Products) is registered under the Investment Company Act of 1940, as amended (the 1940 Act), as an open-end management investment company organized as a Massachusetts business trust. Each Fund is authorized to issue an unlimited number of shares. The Funds invest primarily in a combination of other VIP equity, bond, and short-term funds (the Underlying Funds) managed by Fidelity Management & Research Company (FMR). Shares of each Fund may only be purchased by insurance companies for the purpose of funding variable annuity or variable life insurance contracts.
2. Significant Accounting Policies.
The financial statements have been prepared in conformity with accounting principles generally accepted in the United States of America (GAAP), which require management to make certain estimates and assumptions at the date of the financial statements. Actual results could differ from those estimates. Subsequent events, if any, through the date that the financial statements were issued have been evaluated in the preparation of the financial statements. The following summarizes the significant accounting policies of the Funds:
Security Valuation. Investments are valued as of 4:00 p.m. Eastern time on the last calendar day of the period. Each Fund categorizes the inputs to valuation techniques used to value their investments into a disclosure hierarchy consisting of three levels as shown below:
Level 1 - quoted prices in active markets for identical investments
Level 2 - other significant observable inputs (including quoted prices for similar investments, interest rates, prepayment speeds, etc.)
Level 3 - unobservable inputs (including the Fund's own assumptions based on the best information available)
Valuation techniques used to value each Fund's investments by major category are as follows. Investments in the Underlying Funds are valued at their closing net asset value (NAV) each business day and are categorized as Level 1 in the hierarchy.
Investment Transactions and Income. For financial reporting purposes, the Funds' investment holdings and NAV include trades executed through the end of the last business day of the period. The NAV per share for processing shareholder transactions is calculated as of the close of business of the New York Stock Exchange (NYSE), normally 4:00 p.m. Eastern time and includes trades executed through the end of the prior business day. Gains and losses on securities sold are determined on the basis of identified cost. Income and capital gain distributions from the Underlying Funds, if any, are recorded on the ex-dividend date.
Expenses. Expenses directly attributable to a fund are charged to that fund. Expenses attributable to more than one fund are allocated among the respective funds on the basis of relative net assets or other appropriate methods. Expenses included in the accompanying financial statements reflect the expenses of the Fund and do not include any expenses associated with the Underlying Funds. Expense estimates are accrued in the period to which they relate and adjustments are made when actual amounts are known.
Income Tax Information and Distributions to Shareholders. Each year, each Fund intends to qualify as a regulated investment company, including distributing substantially all of its taxable income and realized gains under Subchapter M of the Internal Revenue Code and filing its U.S. federal tax return. As a result, no provision for income taxes is required. A fund's federal tax return is subject to examination by the Internal Revenue Service (IRS) for a period of three years.
Distributions are declared and recorded on the ex-dividend date. Income and capital gain distributions are determined in accordance with income tax regulations, which may differ from GAAP.
Capital accounts within the financial statements are adjusted for permanent book-tax differences. These adjustments have no impact on net assets or the results of operations. Temporary book-tax differences will reverse in a subsequent period.
Book-tax differences are primarily due to short-term gain distributions from the Underlying Funds, capital loss carryforwards and losses deferred due to wash sales and excise tax regulations.
The federal tax cost of investment securities and unrealized appreciation (depreciation) as of period end were as follows for each Fund:
| Tax cost | Gross unrealized
appreciation | Gross unrealized
depreciation | Net unrealized
appreciation
(depreciation) on
securities and other investments |
VIP Freedom Lifetime Income I | $ 10,905,761 | $ 296,020 | $ (745,514) | $ (449,494) |
VIP Freedom Lifetime Income II | 17,401,056 | 383,366 | (1,578,055) | (1,194,689) |
VIP Freedom Lifetime Income III | 8,081,569 | 227,478 | (875,954) | (648,476) |
Semiannual Report
Notes to Financial Statements - continued
2. Significant Accounting Policies - continued
Income Tax Information and Distributions to Shareholders - continued
Under the recently enacted Regulated Investment Company Modernization Act of 2010 (the Act), the Funds will be permitted to carry forward capital losses incurred in taxable years beginning after December 22, 2010 for an unlimited period. However, any losses incurred during those future taxable years will be required to be utilized prior to any losses incurred in pre-enactment taxable years, which generally expire after eight years from when they are incurred. Additionally, post-enactment capital losses that are carried forward will retain their character as either short-term or long-term capital losses rather than being considered all short-term as under previous law. The Funds' first fiscal year end subject to the Act will be December 31, 2011.
3. Purchases and Sales of Investments.
Purchases and redemptions of the Underlying Fund shares are noted in the table below.
| Purchases ($) | Redemptions ($) |
VIP Freedom Lifetime Income I | 890,987 | 1,090,536 |
VIP Freedom Lifetime Income II | 2,138,623 | 1,090,981 |
VIP Freedom Lifetime Income III | 754,538 | 356,604 |
4. Fees and Other Transactions with Affiliates.
Management Fee. Strategic Advisers, Inc. (Strategic Advisers), an affiliate of FMR, provides the Funds with investment management related services. The Funds do not pay any fees for these services.
Other Transactions. Strategic Advisers has entered into an administration agreement with FMR under which FMR provides management and administrative services (other than investment advisory services) necessary for the operation of each Fund. Pursuant to this agreement, FMR pays all expenses of each Fund, excluding the compensation of the independent Trustees and certain other expenses such as interest expense. FMR also contracts with other Fidelity companies to perform the services necessary for the operation of each Fund. The Funds do not pay any fees for these services.
5. Expense Reductions.
FMR voluntarily agreed to reimburse the Funds to the extent annual operating expenses exceeded certain levels of average net assets as noted in the table below. Some expenses, for example interest expense, are excluded from this reimbursement.
The following Funds were in reimbursement during the period:
| Expense
Limitations | Reimbursement
from adviser |
VIP Freedom Lifetime Income I | .00% | $ 19 |
VIP Freedom Lifetime Income II | .00% | $ 28 |
VIP Freedom Lifetime Income III | .00% | $ 13 |
6. Other.
The Funds' organizational documents provide former and current trustees and officers with a limited indemnification against liabilities arising in connection with the performance of their duties to the Funds. In the normal course of business, the Funds may also enter into contracts that provide general indemnifications. The Funds' maximum exposure under these arrangements is unknown as this would be dependent on future claims that may be made against the Funds. The risk of material loss from such claims is considered remote.
At the end of the period, FMR or its affiliates were owners of record of all of the outstanding shares of the Funds.
Semiannual Report
Investment Adviser
Strategic Advisers, Inc.
Boston, MA
General Distributor
Fidelity Distributors Corporation
Boston, MA
Transfer and Service Agents
Fidelity Investments Institutional Operations Company, Inc.
Boston, MA
Fidelity Service Company, Inc.
Boston, MA
Custodian
The Bank of New York Mellon
New York, NY
VIPFLI-SANN-0811
1.816202.105
Fidelity® Variable Insurance Products:
FundsManager - 20%, 50%, 60%, 70%, 85% Portfolio
Semiannual Report
June 30, 2011
(2_fidelity_logos) (Registered_Trademark)
Contents
To view a fund's proxy voting guidelines and proxy voting record for the 12-month period ended June 30, visit http://www.fidelity.com/proxyvotingresults or visit the Securities and Exchange Commission's (SEC) web site at http://www.sec.gov. You may also call 1-877-208-0098 to request a free copy of the proxy voting guidelines.
Fidelity Variable Insurance Products are separate account options which are purchased through a variable insurance contract.
Standard & Poor's, S&P and S&P 500 are registered service marks of The McGraw-Hill Companies, Inc. and have been licensed for use by Fidelity Distributors Corporation.
Other third party marks appearing herein are the property of their respective owners.
All other marks appearing herein are registered or unregistered trademarks or service marks of FMR LLC or an affiliated company.
This report and the financial statements contained herein are submitted for the general information of the shareholders of the funds. This report is not authorized for distribution to prospective investors in the funds unless preceded or accompanied by an effective prospectus.
A fund files its complete schedule of portfolio holdings with the SEC for the first and third quarters of each fiscal year on Form N-Q. Forms N-Q are available on the SEC's web site at http://www.sec.gov. A fund's Forms N-Q may be reviewed and copied at the SEC's Public Reference Room in Washington, DC. Information regarding the operation of the SEC's Public Reference Room may be obtained by calling 1-800-SEC-0330. For a complete list of a fund's portfolio holdings, view the most recent holdings listing, semiannual report, or annual report on Fidelity's web site at http://www.fidelity.com, http://www.advisor.fidelity.com, or http://www.401k.com, as applicable.
NOT FDIC INSURED • MAY LOSE VALUE • NO BANK GUARANTEE
Neither the funds nor Fidelity Distributors Corporation is a bank.
Semiannual Report
As a shareholder of a Fund, you incur two types of costs: (1) transaction costs, and (2) ongoing costs, including distribution and/or service (12b-1) fees and other Fund expenses. This Example is intended to help you understand your ongoing costs (in dollars) of investing in the Funds and to compare these costs with the ongoing costs of investing in other mutual funds.
The Example is based on an investment of $1,000 invested at the beginning of the period and held for the entire period (January 1, 2011 to June 30, 2011).
Actual Expenses
The first line of the accompanying table for each class of each fund provides information about actual account values and actual expenses. You may use the information in this line, together with the amount you invested, to estimate the expenses that you paid over the period. Simply divide your account value by $1,000.00 (for example, an $8,600 account value divided by $1,000.00 = 8.6), then multiply the result by the number in the first line for a class of the fund under the heading entitled "Expenses Paid During Period" to estimate the expenses you paid on your account during this period. The estimate of expenses does not include any fees or other expenses of any variable annuity or variable life insurance product. If they were, the estimate of expenses you paid during the period would be higher, and your ending account value would be lower. In addition, each Fund, as a shareholder in underlying Fidelity Funds, will indirectly bear its pro-rata share of the fees and expenses incurred by the underlying Fidelity Funds. These fees and expenses are not included in each Fund's annualized expense ratio used to calculate the expense estimates in the table below.
Hypothetical Example for Comparison Purposes
The second line of the accompanying table for each class of each fund provides information about hypothetical account values and hypothetical expenses based on a Class' actual expense ratio and an assumed rate of return of 5% per year before expenses, which is not the Class' actual return. The hypothetical account values and expenses may not be used to estimate the actual ending account balance or expenses you paid for the period. You may use this information to compare the ongoing costs of investing in the Fund and other funds. To do so, compare this 5% hypothetical example with the 5% hypothetical examples that appear in the shareholder reports of the other funds. The estimate of expenses does not include any fees or other expenses of any variable annuity or variable life insurance product. If they were, the estimate of expenses you paid during the period would be higher, and your ending account value would be lower. In addition, each Fund, as a shareholder in underlying Fidelity Funds, will indirectly bear its pro-rata share of the fees and expenses incurred by the underlying Fidelity Funds. These fees and expenses are not included in each Fund's annualized expense ratio used to calculate the expense estimates in the table below.
Please note that the expenses shown in the table are meant to highlight your ongoing costs only and do not reflect any transaction costs. Therefore, the second line of the table is useful in comparing ongoing costs only, and will not help you determine the relative total costs of owning different funds.
| Annualized Expense Ratio | Beginning
Account Value
January 1, 2011 | Ending
Account Value
June 30, 2011 | Expenses Paid
During Period*
January 1, 2011
to June 30, 2011 |
VIP FundsManager 20% Portfolio | | | | |
Service Class | .20% | | | |
Actual | | $ 1,000.00 | $ 1,024.50 | $ 1.00 |
Hypothetical A | | $ 1,000.00 | $ 1,023.80 | $ 1.00 |
Service Class 2 | .35% | | | |
Actual | | $ 1,000.00 | $ 1,023.50 | $ 1.76 |
Hypothetical A | | $ 1,000.00 | $ 1,023.06 | $ 1.76 |
Investor Class | .20% | | | |
Actual | | $ 1,000.00 | $ 1,023.50 | $ 1.00 |
Hypothetical A | | $ 1,000.00 | $ 1,023.80 | $ 1.00 |
VIP FundsManager 50% Portfolio | | | | |
Service Class | .20% | | | |
Actual | | $ 1,000.00 | $ 1,037.90 | $ 1.01 |
Hypothetical A | | $ 1,000.00 | $ 1,023.80 | $ 1.00 |
Service Class 2 | .35% | | | |
Actual | | $ 1,000.00 | $ 1,036.00 | $ 1.77 |
Hypothetical A | | $ 1,000.00 | $ 1,023.06 | $ 1.76 |
Investor Class | .20% | | | |
Actual | | $ 1,000.00 | $ 1,036.90 | $ 1.01 |
Hypothetical A | | $ 1,000.00 | $ 1,023.80 | $ 1.00 |
| Annualized Expense Ratio | Beginning
Account Value
January 1, 2011 | Ending
Account Value
June 30, 2011 | Expenses Paid
During Period*
January 1, 2011
to June 30, 2011 |
VIP FundsManager 60% Portfolio | | | | |
Service Class | .20% | | | |
Actual | | $ 1,000.00 | $ 1,037.40 | $ 1.01 |
Hypothetical A | | $ 1,000.00 | $ 1,023.80 | $ 1.00 |
Service Class 2 | .35% | | | |
Actual | | $ 1,000.00 | $ 1,036.40 | $ 1.77 |
Hypothetical A | | $ 1,000.00 | $ 1,023.06 | $ 1.76 |
Investor Class | .20% | | | |
Actual | | $ 1,000.00 | $ 1,037.40 | $ 1.01 |
Hypothetical A | | $ 1,000.00 | $ 1,023.80 | $ 1.00 |
VIP FundsManager 70% Portfolio | | | | |
Service Class | .20% | | | |
Actual | | $ 1,000.00 | $ 1,045.40 | $ 1.01 |
Hypothetical A | | $ 1,000.00 | $ 1,023.80 | $ 1.00 |
Service Class 2 | .35% | | | |
Actual | | $ 1,000.00 | $ 1,045.50 | $ 1.78 |
Hypothetical A | | $ 1,000.00 | $ 1,023.06 | $ 1.76 |
Investor Class | .20% | | | |
Actual | | $ 1,000.00 | $ 1,045.40 | $ 1.01 |
Hypothetical A | | $ 1,000.00 | $ 1,023.80 | $ 1.00 |
VIP FundsManager 85% Portfolio | | | | |
Service Class | .20% | | | |
Actual | | $ 1,000.00 | $ 1,043.50 | $ 1.01 |
Hypothetical A | | $ 1,000.00 | $ 1,023.80 | $ 1.00 |
Service Class 2 | .35% | | | |
Actual | | $ 1,000.00 | $ 1,042.50 | $ 1.77 |
Hypothetical A | | $ 1,000.00 | $ 1,023.06 | $ 1.76 |
Investor Class | .20% | | | |
Actual | | $ 1,000.00 | $ 1,043.50 | $ 1.01 |
Hypothetical A | | $ 1,000.00 | $ 1,023.80 | $ 1.00 |
A 5% return per year before expenses
* Expenses are equal to each Class' annualized expense ratio, multiplied by the average account value over the period, multiplied by 181/365 (to reflect the one-half year period). The fees and expenses of the underlying Fidelity Funds in which the Fund invests are not included in each class' annualized expense ratio.
Semiannual Report
VIP FundsManager 20% Portfolio
Investment Changes (Unaudited)
Fund Holdings as of June 30, 2011 |
| % of fund's
net assets | % of fund's net assets
6 months ago |
Domestic Equity Funds | | |
Fidelity 130/30 Large Cap Fund | 0.0 * | 0.0 * |
Fidelity Air Transportation Portfolio | 0.1 | 0.1 |
Fidelity Automotive Portfolio | 0.1 | 0.1 |
Fidelity Banking Portfolio | 0.9 | 0.6 |
Fidelity Biotechnology Portfolio | 0.0 * | 0.0 * |
Fidelity Blue Chip Growth Fund | 0.0 * | 0.1 |
Fidelity Brokerage & Investment Management Portfolio | 0.1 | 0.2 |
Fidelity Chemicals Portfolio | 0.3 | 0.2 |
Fidelity Commodity Strategy Fund | 0.0 * | 0.0 * |
Fidelity Communications Equipment Portfolio | 0.2 | 0.2 |
Fidelity Computers Portfolio | 0.3 | 0.5 |
Fidelity Construction & Housing Portfolio | 0.1 | 0.2 |
Fidelity Consumer Discretionary Portfolio | 0.9 | 1.1 |
Fidelity Consumer Staples Portfolio | 1.1 | 1.2 |
Fidelity Contrafund | 0.0 * | 0.1 |
Fidelity Defense & Aerospace Portfolio | 0.0 * | 0.0 * |
Fidelity Disciplined Equity Fund | 0.0 * | 0.0 * |
Fidelity Dividend Growth Fund | 0.5 | 0.6 |
Fidelity Electronics Portfolio | 0.1 | 0.1 |
Fidelity Energy Portfolio | 0.8 | 0.9 |
Fidelity Energy Service Portfolio | 0.9 | 1.1 |
Fidelity Environmental & Alternative Energy Portfolio | 0.0 * | 0.0 * |
Fidelity Equity-Income Fund | 0.0 * | 0.0 * |
Fidelity Equity-Income II Fund | 0.0 * | 0.0 * |
Fidelity Financial Services Portfolio | 0.1 | 0.2 |
Fidelity Fund | 0.0 * | 0.0 * |
Fidelity Global Commodity Stock Fund | 0.1 | 0.0 * |
Fidelity Gold Portfolio | 0.8 | 1.0 |
Fidelity Growth Company Fund | 0.0 * | 0.0 * |
Fidelity Health Care Portfolio | 1.3 | 0.3 |
Fidelity Independence Fund | 0.0 * | 0.0 * |
Fidelity Industrial Equipment Portfolio | 0.3 | 0.2 |
Fidelity Industrials Portfolio | 0.6 | 1.2 |
Fidelity Insurance Portfolio | 0.7 | 0.8 |
Fidelity IT Services Portfolio | 0.1 | 0.1 |
Fidelity Large Cap Stock Fund | 0.1 | 0.4 |
Fidelity Large Cap Value Fund | 0.0 * | 0.0 * |
Fidelity Leisure Portfolio | 0.1 | 0.1 |
|
| % of fund's
net assets | % of fund's net assets
6 months ago |
Fidelity Leveraged Company Stock Fund | 0.0 * | 0.0 * |
Fidelity Magellan Fund | 0.0 * | 0.0 * |
Fidelity Materials Portfolio | 0.0 * | 0.2 |
Fidelity Medical Delivery Portfolio | 0.4 | 0.4 |
Fidelity Medical Equipment & Systems Portfolio | 0.1 | 0.1 |
Fidelity Mega Cap Stock Fund | 0.2 | 0.3 |
Fidelity Mid-Cap Stock Fund | 0.0 * | 0.0 * |
Fidelity Multimedia Portfolio | 0.2 | 0.2 |
Fidelity Natural Resources Portfolio | 0.0 * | 0.0 * |
Fidelity Pharmaceuticals Portfolio | 0.5 | 1.0 |
Fidelity Real Estate Investment Portfolio | 0.3 | 0.3 |
Fidelity Retailing Portfolio | 0.2 | 0.2 |
Fidelity Small Cap Growth Fund | 0.0 * | 0.0 * |
Fidelity Small Cap Stock Fund | 0.0 * | 0.0 * |
Fidelity Small Cap Value Fund | 0.0 * | 0.4 |
Fidelity Software & Computer Services Portfolio | 0.4 | 0.4 |
Fidelity Technology Portfolio | 0.8 | 1.8 |
Fidelity Telecom and Utilities Fund | 0.6 | 0.2 |
Fidelity Telecommunications Portfolio | 0.4 | 0.4 |
Fidelity Transportation Portfolio | 0.1 | 0.2 |
Fidelity Utilities Portfolio | 0.1 | 0.2 |
Spartan Extended Market Index Fund Investor Class | 0.1 | 0.1 |
Spartan Total Market Index Fund Investor Class | 0.0 * | 0.0 * |
VIP Mid Cap Portfolio Investor Class | 0.0 * | 0.0 * |
| 15.0 | 18.0 |
International Equity Funds | | |
Fidelity Canada Fund | 0.1 | 0.1 |
Fidelity Diversified International Fund | 0.2 | 0.2 |
Fidelity Emerging Asia Fund | 0.6 | 0.0 * |
Fidelity Emerging Markets Fund | 0.0 * | 1.2 |
Fidelity International Capital Appreciation Fund | 0.0 * | 0.3 |
Fidelity International Discovery Fund | 0.4 | 1.1 |
Fidelity International Real Estate Fund | 0.1 | 0.5 |
Fidelity International Small Cap Fund | 0.2 | 0.2 |
Fidelity International Small Cap Opportunities Fund | 0.6 | 0.7 |
Fund Holdings as of June 30, 2011 |
| % of fund's
net assets | % of fund's net assets
6 months ago |
Fidelity International Value Fund | 0.5 | 0.4 |
Fidelity Japan Fund | 0.1 | 0.1 |
Fidelity Japan Smaller Companies Fund | 0.1 | 0.0 * |
Fidelity Nordic Fund | 0.5 | 0.7 |
Fidelity Overseas Fund | 0.0 * | 0.0 * |
Fidelity Pacific Basin Fund | 0.2 | 0.2 |
Spartan International Index Fund Investor Class | 1.5 | 1.8 |
| 5.1 | 7.5 |
Fixed-Income Funds | | |
Fidelity Floating Rate High Income Fund | 3.4 | 3.2 |
Fidelity Focused High Income Fund | 0.3 | 0.3 |
Fidelity High Income Fund | 2.6 | 2.9 |
Fidelity New Markets Income Fund | 1.0 | 1.1 |
Fidelity Real Estate Income Fund | 0.5 | 0.6 |
Spartan U.S. Bond Index Fund Investor Class | 47.7 | 45.0 |
| 55.5 | 53.1 |
Money Market Funds | | |
Fidelity Institutional Money Market Portfolio Class I | 2.8 | 3.4 |
Fidelity Institutional Prime Money Market Portfolio Class I | 18.9 | 16.2 |
Fidelity Select Money Market Portfolio | 2.7 | 1.8 |
| 24.4 | 21.4 |
Net Other Assets (Liabilities)* | 0.0 | 0.0 |
| 100.0 | 100.0 |
* Amount represents less than 0.1%
Asset Allocation (% of fund's net assets) |
As of June 30, 2011 |
| Domestic Equity Funds | 15.0% | |
| International Equity Funds | 5.1% | |
| Fixed Income Funds | 55.5% | |
| Money Market Funds | 24.4% | |

As of December 31, 2010 |
| Domestic Equity Funds | 18.0% | |
| International Equity Funds | 7.5% | |
| Fixed Income Funds | 53.1% | |
| Money Market Funds | 21.4% | |

Semiannual Report
VIP FundsManager 20% Portfolio
Investments June 30, 2011 (Unaudited)
Showing Percentage of Net Assets
Equity Funds - 20.1% |
| Shares | | Value |
Domestic Equity Funds - 15.0% |
Fidelity 130/30 Large Cap Fund (a) | 2,952 | | $ 23,023 |
Fidelity Air Transportation Portfolio | 7,013 | | 279,947 |
Fidelity Automotive Portfolio | 10,363 | | 460,120 |
Fidelity Banking Portfolio (a) | 233,676 | | 4,096,340 |
Fidelity Biotechnology Portfolio (a) | 1,153 | | 99,711 |
Fidelity Blue Chip Growth Fund | 482 | | 23,215 |
Fidelity Brokerage & Investment Management Portfolio | 13,913 | | 678,262 |
Fidelity Chemicals Portfolio | 12,625 | | 1,354,143 |
Fidelity Commodity Strategy Fund (a) | 958 | | 11,017 |
Fidelity Communications Equipment Portfolio (a) | 33,062 | | 908,871 |
Fidelity Computers Portfolio (a) | 22,720 | | 1,350,500 |
Fidelity Construction & Housing Portfolio | 17,837 | | 640,542 |
Fidelity Consumer Discretionary Portfolio | 164,958 | | 4,051,358 |
Fidelity Consumer Staples Portfolio | 75,615 | | 5,460,132 |
Fidelity Contrafund | 3,261 | | 230,233 |
Fidelity Defense & Aerospace Portfolio | 1,192 | | 98,558 |
Fidelity Disciplined Equity Fund | 2,042 | | 48,783 |
Fidelity Dividend Growth Fund | 73,731 | | 2,182,433 |
Fidelity Electronics Portfolio | 6,805 | | 341,821 |
Fidelity Energy Portfolio | 68,737 | | 3,968,899 |
Fidelity Energy Service Portfolio (a) | 53,401 | | 4,409,844 |
Fidelity Environmental & Alternative Energy Portfolio | 10,770 | | 208,621 |
Fidelity Equity-Income Fund | 666 | | 30,824 |
Fidelity Equity-Income II Fund | 681 | | 13,006 |
Fidelity Financial Services Portfolio | 7,276 | | 424,322 |
Fidelity Fund | 641 | | 22,009 |
Fidelity Global Commodity Stock Fund | 25,476 | | 438,451 |
Fidelity Gold Portfolio | 77,590 | | 3,630,432 |
Fidelity Growth Company Fund | 1,100 | | 100,812 |
Fidelity Health Care Portfolio | 42,834 | | 6,150,501 |
Fidelity Independence Fund (a) | 309 | | 7,947 |
Fidelity Industrial Equipment Portfolio | 33,439 | | 1,184,402 |
Fidelity Industrials Portfolio | 109,440 | | 2,723,956 |
Fidelity Insurance Portfolio | 69,618 | | 3,323,550 |
Fidelity IT Services Portfolio | 27,682 | | 626,992 |
Fidelity Large Cap Stock Fund | 20,006 | | 366,305 |
Fidelity Large Cap Value Fund | 9,788 | | 108,937 |
Fidelity Leisure Portfolio | 3,104 | | 301,065 |
Fidelity Leveraged Company Stock Fund | 193 | | 5,796 |
Fidelity Magellan Fund | 375 | | 27,356 |
Fidelity Materials Portfolio | 777 | | 55,613 |
Fidelity Medical Delivery Portfolio (a) | 31,868 | | 1,902,215 |
Fidelity Medical Equipment & Systems Portfolio | 13,627 | | 422,448 |
Fidelity Mega Cap Stock Fund | 98,216 | | 1,024,391 |
Fidelity Mid-Cap Stock Fund | 2,038 | | 59,634 |
Fidelity Multimedia Portfolio | 18,639 | | 893,171 |
|
| Shares | | Value |
Fidelity Natural Resources Portfolio | 3,135 | | $ 117,107 |
Fidelity Pharmaceuticals Portfolio | 161,990 | | 2,243,561 |
Fidelity Real Estate Investment Portfolio | 43,583 | | 1,231,669 |
Fidelity Retailing Portfolio | 13,567 | | 736,663 |
Fidelity Small Cap Growth Fund | 7,959 | | 136,018 |
Fidelity Small Cap Stock Fund | 3,102 | | 63,167 |
Fidelity Small Cap Value Fund | 12,810 | | 205,216 |
Fidelity Software & Computer Services Portfolio | 20,250 | | 1,764,377 |
Fidelity Technology Portfolio (a) | 40,455 | | 3,982,824 |
Fidelity Telecom and Utilities Fund | 156,597 | | 2,731,048 |
Fidelity Telecommunications Portfolio | 34,569 | | 1,743,649 |
Fidelity Transportation Portfolio | 12,291 | | 699,973 |
Fidelity Utilities Portfolio | 11,656 | | 614,023 |
Spartan Extended Market Index Fund Investor Class | 6,109 | | 246,682 |
Spartan Total Market Index Fund Investor Class | 3,333 | | 128,669 |
VIP Mid Cap Portfolio Investor Class | 79 | | 2,601 |
TOTAL DOMESTIC EQUITY FUNDS | | 71,417,755 |
International Equity Funds - 5.1% |
Fidelity Canada Fund | 9,919 | | 592,938 |
Fidelity Diversified International Fund | 30,158 | | 939,121 |
Fidelity Emerging Asia Fund | 86,891 | | 2,728,363 |
Fidelity Emerging Markets Fund | 8,495 | | 223,345 |
Fidelity International Capital Appreciation Fund | 10,386 | | 138,964 |
Fidelity International Discovery Fund | 61,000 | | 2,066,086 |
Fidelity International Real Estate Fund | 29,661 | | 276,741 |
Fidelity International Small Cap Fund | 38,815 | | 868,672 |
Fidelity International Small Cap Opportunities Fund | 252,048 | | 2,724,644 |
Fidelity International Value Fund | 276,127 | | 2,355,365 |
Fidelity Japan Fund | 43,877 | | 460,268 |
Fidelity Japan Smaller Companies Fund | 72,677 | | 667,175 |
Fidelity Nordic Fund | 62,945 | | 2,237,077 |
Fidelity Overseas Fund | 423 | | 14,406 |
Fidelity Pacific Basin Fund | 39,733 | | 1,042,992 |
Spartan International Index Fund Investor Class | 186,996 | | 6,911,389 |
TOTAL INTERNATIONAL EQUITY FUNDS | | 24,247,546 |
TOTAL EQUITY FUNDS (Cost $76,626,422) | 95,665,301 |
Fixed-Income Funds - 55.5% |
| | | |
Fidelity Floating Rate High Income Fund | 1,656,718 | | 16,252,404 |
Fidelity Focused High Income Fund | 153,829 | | 1,415,222 |
Fidelity High Income Fund | 1,393,282 | | 12,609,206 |
Fidelity New Markets Income Fund | 287,585 | | 4,578,353 |
Fixed-Income Funds - continued |
| Shares | | Value |
Fidelity Real Estate Income Fund | 223,361 | | $ 2,396,667 |
Spartan U.S. Bond Index Fund Investor Class | 19,814,671 | | 226,877,982 |
TOTAL FIXED-INCOME FUNDS (Cost $254,563,547) | 264,129,834 |
Money Market Funds - 24.4% |
| | | |
Fidelity Institutional Money Market Portfolio Class I | 13,159,809 | | 13,159,809 |
Fidelity Institutional Prime Money Market Portfolio Class I | 90,127,282 | | 90,127,282 |
Fidelity Select Money Market Portfolio | 12,946,453 | | 12,946,453 |
TOTAL MONEY MARKET FUNDS (Cost $116,233,544) | 116,233,544 |
TOTAL INVESTMENT PORTFOLIO - 100.0% (Cost $447,423,513) | 476,028,679 |
NET OTHER ASSETS (LIABILITIES) - 0.0% | (77,829) |
NET ASSETS - 100% | $ 475,950,850 |
Legend |
(a) Non-income producing |
Other Information |
All investments are categorized as Level 1 under the Fair Value Hierarchy. The inputs or methodology used for valuing securities may not be an indication of the risk associated with investing in those securities. For more information on valuation inputs, please refer to the Security Valuation section in the accompanying Notes to Financial Statements. |
Income Tax Information |
At December 31, 2010, the Fund had a capital loss carryforward of approximately $11,488,547 of which $6,448,435 and $5,040,112 will expire in fiscal 2016 and 2017, respectively. Capital loss carryforwards are only available to offset future capital gains of the Fund to the extent provided by regulations and may be limited. |
See accompanying notes which are an integral part of the financial statements.
Semiannual Report
VIP FundsManager 20% Portfolio
Statement of Assets and Liabilities
| June 30, 2011 (Unaudited) |
| | |
Assets | | |
Investment in securities, at value (cost $447,423,513) - See accompanying schedule | | $ 476,028,679 |
Receivable for investments sold | | 397,658 |
Receivable for fund shares sold | | 3,318 |
Total assets | | 476,429,655 |
| | |
Liabilities | | |
Payable to custodian bank | $ 9 | |
Payable for investments purchased | 5 | |
Payable for fund shares redeemed | 400,971 | |
Accrued management fee | 77,699 | |
Distribution and service plan fees payable | 121 | |
Total liabilities | | 478,805 |
| | |
Net Assets | | $ 475,950,850 |
Net Assets consist of: | | |
Paid in capital | | $ 451,886,524 |
Undistributed net investment income | | 3,447,981 |
Accumulated undistributed net realized gain (loss) on investments | | (7,988,821) |
Net unrealized appreciation (depreciation) on investments | | 28,605,166 |
Net Assets | | $ 475,950,850 |
Statement of Assets and Liabilities - continued
| June 30, 2011 (Unaudited) |
| | |
Service Class:
Net Asset Value, offering price and redemption price per share ($68,317 ÷ 6,273 shares) | | $ 10.89 |
| | |
Service Class 2:
Net Asset Value, offering price and redemption price per share ($1,041,274 ÷ 95,809 shares) | | $ 10.87 |
| | |
Investor Class:
Net Asset Value, offering price and redemption price per share ($474,841,259 ÷ 43,632,514 shares) | | $ 10.88 |
See accompanying notes which are an integral part of the financial statements.
Semiannual Report
VIP FundsManager 20% Portfolio
Financial Statements - continued
Statement of Operations
Six months ended June 30, 2011 (Unaudited) |
| | |
Investment Income | | |
Income distributions from underlying funds | | $ 3,880,907 |
| | |
Expenses | | |
Management fee | $ 539,860 | |
Distribution and service plan fees | 1,042 | |
Independent trustees' compensation | 745 | |
Total expenses before reductions | 541,647 | |
Expense reductions | (108,721) | 432,926 |
Net investment income (loss) | | 3,447,981 |
Realized and Unrealized Gain (Loss) Realized gain (loss) on sale of underlying fund shares | 3,083,297 | |
Capital gain distributions from underlying funds | 696,706 | |
Total net realized gain (loss) | | 3,780,003 |
Change in net unrealized appreciation (depreciation) on underlying funds | | 2,784,295 |
Net gain (loss) | | 6,564,298 |
Net increase (decrease) in net assets resulting from operations | | $ 10,012,279 |
Statement of Changes in Net Assets
| Six months ended June 30, 2011 (Unaudited) | Year ended December 31, 2010 |
Increase (Decrease) in Net Assets | | |
Operations | | |
Net investment income (loss) | $ 3,447,981 | $ 6,065,820 |
Net realized gain (loss) | 3,780,003 | 2,867,619 |
Change in net unrealized appreciation (depreciation) | 2,784,295 | 15,177,948 |
Net increase (decrease) in net assets resulting from operations | 10,012,279 | 24,111,387 |
Distributions to shareholders from net investment income | - | (6,084,767) |
Distributions to shareholders from net realized gain | - | (470,898) |
Total distributions | - | (6,555,665) |
Share transactions - net increase (decrease) | 74,075,715 | 102,969,202 |
Total increase (decrease) in net assets | 84,087,994 | 120,524,924 |
| | |
Net Assets | | |
Beginning of period | 391,862,856 | 271,337,932 |
End of period (including undistributed net investment income of $3,447,981 and undistributed net investment income of $0, respectively) | $ 475,950,850 | $ 391,862,856 |
See accompanying notes which are an integral part of the financial statements.
Semiannual Report
Financial Highlights - Service Class
| Six months ended June 30, 2011 | Years ended December 31, |
| (Unaudited) | 2010 | 2009 | 2008 | 2007 | 2006 G |
Selected Per-Share Data | | | | | | |
Net asset value, beginning of period | $ 10.63 | $ 10.07 | $ 9.27 | $ 10.48 | $ 10.34 | $ 10.00 |
Income from Investment Operations | | | | | | |
Net investment income (loss) E | .09 | .19 | .21 | .34 | .45 | .33 |
Net realized and unrealized gain (loss) | .17 | .55 | .76 | (1.21) | .18 | .20 |
Total from investment operations | .26 | .74 | .97 | (.87) | .63 | .53 |
Distributions from net investment income | - | (.17) | (.16) | (.30) | (.29) | (.14) |
Distributions from net realized gain | - | (.01) | (.01) | (.04) | (.20) | (.05) |
Total distributions | - | (.18) | (.17) J | (.34) I | (.49) | (.19) |
Net asset value, end of period | $ 10.89 | $ 10.63 | $ 10.07 | $ 9.27 | $ 10.48 | $ 10.34 |
Total Return B,C,D | 2.45% | 7.36% | 10.43% | (8.33)% | 6.12% | 5.34% |
Ratios to Average Net Assets F,H | | | | | | |
Expenses before reductions | .35% A | .35% | .35% | .35% | .35% | .35% A |
Expenses net of fee waivers, if any | .20% A | .20% | .20% | .20% | .20% | .20% A |
Expenses net of all reductions | .20% A | .20% | .20% | .20% | .20% | .20% A |
Net investment income (loss) | 1.59% A | 1.84% | 2.19% | 3.33% | 4.20% | 4.52% A |
Supplemental Data | | | | | | |
Net assets, end of period (000 omitted) | $ 68 | $ 67 | $ 61 | $ 88 | $ 112 | $ 105 |
Portfolio turnover rate | 14% A | 14% | 31% | 64% | 76% | 92% A |
A Annualized
B Total returns for periods of less than one year are not annualized.
C Total returns do not reflect charges attributable to your insurance company's separate account. Inclusion of these charges would reduce the total returns shown.
D Total returns would have been lower if certain expenses had not been reduced during the applicable periods shown.
E Calculated based on average shares outstanding during the period.
F Amounts do not include the activity of the underlying funds.
G For the period April 13, 2006 (commencement of operations) to December 31, 2006.
H Expense ratios reflect operating expenses of the class. Expenses before reductions do not reflect amounts reimbursed by the investment adviser or reductions from expense offset arrangements and do not represent the amount paid by the class during periods when reimbursements or reductions occur. Expenses net of fee waivers reflect expenses after reimbursement by the investment adviser but prior to reductions from expense offset arrangements. Expenses net of all reductions represent the net expenses paid by the class but do not include expenses of the investment companies in which the Fund invests.
I Total distributions of $.34 per share is comprised of distributions from net investment income of $.302 and distributions from net realized gain of $.035 per share.
J Total distributions of $.17 per share is comprised of distributions from net investment income of $.161 and distributions from net realized gain of $.006 per share.
Financial Highlights - Service Class 2
| Six months ended June 30, 2011 | Years ended December 31, |
| (Unaudited) | 2010 | 2009 | 2008 | 2007 | 2006 G |
Selected Per-Share Data | | | | | | |
Net asset value, beginning of period | $ 10.62 | $ 10.06 | $ 9.28 | $ 10.48 | $ 10.34 | $ 10.00 |
Income from Investment Operations | | | | | | |
Net investment income (loss) E | .08 | .18 | .20 | .32 | .43 | .32 |
Net realized and unrealized gain (loss) | .17 | .55 | .74 | (1.20) | .18 | .20 |
Total from investment operations | .25 | .73 | .94 | (.88) | .61 | .52 |
Distributions from net investment income | - | (.16) | (.16) | (.29) | (.27) | (.13) |
Distributions from net realized gain | - | (.01) | (.01) | (.04) | (.20) | (.05) |
Total distributions | - | (.17) | (.16) J | (.32) I | (.47) | (.18) |
Net asset value, end of period | $ 10.87 | $ 10.62 | $ 10.06 | $ 9.28 | $ 10.48 | $ 10.34 |
Total Return B,C,D | 2.35% | 7.24% | 10.14% | (8.40)% | 5.96% | 5.23% |
Ratios to Average Net Assets F,H | | | | | | |
Expenses before reductions | .50% A | .50% | .50% | .50% | .50% | .50% A |
Expenses net of fee waivers, if any | .35% A | .35% | .35% | .35% | .35% | .35% A |
Expenses net of all reductions | .35% A | .35% | .35% | .35% | .35% | .35% A |
Net investment income (loss) | 1.44% A | 1.69% | 2.04% | 3.18% | 4.05% | 4.38% A |
Supplemental Data | | | | | | |
Net assets, end of period (000 omitted) | $ 1,041 | $ 569 | $ 425 | $ 88 | $ 112 | $ 105 |
Portfolio turnover rate | 14% A | 14% | 31% | 64% | 76% | 92% A |
A Annualized
B Total returns for periods of less than one year are not annualized.
C Total returns do not reflect charges attributable to your insurance company's separate account. Inclusion of these charges would reduce the total returns shown.
D Total returns would have been lower if certain expenses had not been reduced during the applicable periods shown.
E Calculated based on average shares outstanding during the period.
F Amounts do not include the activity of the underlying funds.
G For the period April 13, 2006 (commencement of operations) to December 31, 2006.
H Expense ratios reflect operating expenses of the class. Expenses before reductions do not reflect amounts reimbursed by the investment adviser or reductions from expense offset arrangements and do not represent the amount paid by the class during periods when reimbursements or reductions occur. Expenses net of fee waivers reflect expenses after reimbursement by the investment adviser but prior to reductions from expense offset arrangements. Expenses net of all reductions represent the net expenses paid by the class but do not include expenses of the investment companies in which the Fund invests.
I Total distributions of $.32 per share is comprised of distributions from net investment income of $.285 and distributions from net realized gain of $.035 per share.
J Total distributions of $.16 per share is comprised of distributions from net investment income of $.155 and distributions from net realized gain of $.006 per share.
See accompanying notes which are an integral part of the financial statements.
Semiannual Report
Financial Highlights - Investor Class
| Six months ended June 30, 2011 | Years ended December 31, |
| (Unaudited) | 2010 | 2009 | 2008 | 2007 | 2006 G |
Selected Per-Share Data | | | | | | |
Net asset value, beginning of period | $ 10.63 | $ 10.06 | $ 9.27 | $ 10.48 | $ 10.34 | $ 10.00 |
Income from Investment Operations | | | | | | |
Net investment income (loss) E | .09 | .19 | .21 | .33 | .45 | .33 |
Net realized and unrealized gain (loss) | .16 | .56 | .75 | (1.20) | .18 | .20 |
Total from investment operations | .25 | .75 | .96 | (.87) | .63 | .53 |
Distributions from net investment income | - | (.17) | (.16) | (.30) | (.29) | (.14) |
Distributions from net realized gain | - | (.01) | (.01) | (.04) | (.20) | (.05) |
Total distributions | - | (.18) | (.17) J | (.34) I | (.49) | (.19) |
Net asset value, end of period | $ 10.88 | $ 10.63 | $ 10.06 | $ 9.27 | $ 10.48 | $ 10.34 |
Total Return B,C,D | 2.35% | 7.47% | 10.32% | (8.33)% | 6.12% | 5.34% |
Ratios to Average Net Assets F,H | | | | | | |
Expenses before reductions | .25% A | .25% | .25% | .25% | .25% | .25% A |
Expenses net of fee waivers, if any | .20% A | .20% | .20% | .20% | .20% | .20% A |
Expenses net of all reductions | .20% A | .20% | .20% | .20% | .20% | .20% A |
Net investment income (loss) | 1.59% A | 1.84% | 2.19% | 3.33% | 4.20% | 4.52% A |
Supplemental Data | | | | | | |
Net assets, end of period (000 omitted) | $ 474,841 | $ 391,226 | $ 270,852 | $ 153,110 | $ 115,963 | $ 24,045 |
Portfolio turnover rate | 14% A | 14% | 31% | 64% | 76% | 92% A |
A Annualized
B Total returns for periods of less than one year are not annualized.
C Total returns do not reflect charges attributable to your insurance company's separate account. Inclusion of these charges would reduce the total returns shown.
D Total returns would have been lower if certain expenses had not been reduced during the applicable periods shown.
E Calculated based on average shares outstanding during the period.
F Amounts do not include the activity of the underlying funds.
G For the period April 13, 2006 (commencement of operations) to December 31, 2006.
H Expense ratios reflect operating expenses of the class. Expenses before reductions do not reflect amounts reimbursed by the investment adviser or reductions from expense offset arrangements and do not represent the amount paid by the class during periods when reimbursements or reductions occur. Expenses net of fee waivers reflect expenses after reimbursement by the investment adviser but prior to reductions from expense offset arrangements. Expenses net of all reductions represent the net expenses paid by the class but do not include expenses of the investment companies in which the Fund invests.
I Total distributions of $.34 per share is comprised of distributions from net investment income of $.302 and distributions from net realized gain of $.035 per share.
J Total distributions of $.17 per share is comprised of distributions from net investment income of $.161 and distributions from net realized gain of $.006 per share.
See accompanying notes which are an integral part of the financial statements.
Semiannual Report
VIP FundsManager 50% Portfolio
Investment Changes (Unaudited)
Fund Holdings as of June 30, 2011 |
| % of fund's
net assets | % of fund's net assets
6 months ago |
Domestic Equity Funds | | |
Fidelity 130/30 Large Cap Fund | 0.0 * | 0.0* |
Fidelity Air Transportation Portfolio | 0.1 | 0.2 |
Fidelity Automotive Portfolio | 0.4 | 0.1 |
Fidelity Banking Portfolio | 1.2 | 1.3 |
Fidelity Biotechnology Portfolio | 0.4 | 0.4 |
Fidelity Blue Chip Growth Fund | 0.4 | 0.4 |
Fidelity Brokerage & Investment Management Portfolio | 0.4 | 0.5 |
Fidelity Chemicals Portfolio | 0.4 | 0.4 |
Fidelity Commodity Strategy Fund | 0.0* | 0.0* |
Fidelity Communications Equipment Portfolio | 0.2 | 0.2 |
Fidelity Computers Portfolio | 0.7 | 0.8 |
Fidelity Construction & Housing Portfolio | 0.4 | 0.4 |
Fidelity Consumer Discretionary Portfolio | 1.0 | 1.1 |
Fidelity Consumer Finance Portfolio | 0.0* | 0.0 |
Fidelity Consumer Staples Portfolio | 2.9 | 2.9 |
Fidelity Contrafund | 0.1 | 0.1 |
Fidelity Defense & Aerospace Portfolio | 0.1 | 0.1 |
Fidelity Disciplined Equity Fund | 0.0* | 0.0* |
Fidelity Dividend Growth Fund | 1.3 | 1.7 |
Fidelity Electronics Portfolio | 0.1 | 0.2 |
Fidelity Energy Portfolio | 2.2 | 2.2 |
Fidelity Energy Service Portfolio | 1.6 | 1.4 |
Fidelity Environmental & Alternative Energy Portfolio | 0.2 | 0.2 |
Fidelity Equity-Income Fund | 0.0* | 0.1 |
Fidelity Equity-Income II Fund | 0.0* | 0.0* |
Fidelity Financial Services Portfolio | 1.2 | 1.4 |
Fidelity Fund | 0.1 | 0.1 |
Fidelity Global Commodity Stock Fund | 0.1 | 0.0* |
Fidelity Gold Portfolio | 1.0 | 1.2 |
Fidelity Growth Company Fund | 0.8 | 0.9 |
Fidelity Health Care Portfolio | 0.9 | 0.6 |
Fidelity Independence Fund | 0.0* | 0.0* |
Fidelity Industrial Equipment Portfolio | 0.9 | 0.8 |
Fidelity Industrials Portfolio | 1.4 | 1.7 |
Fidelity Insurance Portfolio | 1.1 | 1.1 |
Fidelity IT Services Portfolio | 0.3 | 0.3 |
Fidelity Large Cap Stock Fund | 0.3 | 0.8 |
|
| % of fund's
net assets | % of fund's net assets
6 months ago |
Fidelity Large Cap Value Fund | 0.0* | 0.1 |
Fidelity Leisure Portfolio | 0.5 | 0.8 |
Fidelity Leveraged Company Stock Fund | 0.0* | 0.0* |
Fidelity Magellan Fund | 0.0* | 0.0* |
Fidelity Materials Portfolio | 0.0* | 0.3 |
Fidelity Medical Delivery Portfolio | 1.1 | 1.0 |
Fidelity Medical Equipment & Systems Portfolio | 0.1 | 0.1 |
Fidelity Mega Cap Stock Fund | 0.3 | 0.4 |
Fidelity Mid Cap Value Fund | 0.3 | 0.4 |
Fidelity Mid-Cap Stock Fund | 0.0* | 0.0* |
Fidelity Multimedia Portfolio | 0.4 | 0.4 |
Fidelity Nasdaq Composite Index Fund | 0.0* | 0.1 |
Fidelity Natural Resources Portfolio | 0.1 | 0.1 |
Fidelity Pharmaceuticals Portfolio | 1.4 | 1.4 |
Fidelity Real Estate Investment Portfolio | 0.4 | 0.6 |
Fidelity Retailing Portfolio | 0.3 | 0.5 |
Fidelity Small Cap Growth Fund | 0.0* | 0.2 |
Fidelity Small Cap Stock Fund | 0.0* | 0.0* |
Fidelity Small Cap Value Fund | 0.0* | 0.0* |
Fidelity Software & Computer Services Portfolio | 0.5 | 0.5 |
Fidelity Technology Portfolio | 3.2 | 3.3 |
Fidelity Telecom and Utilities Fund | 0.8 | 0.8 |
Fidelity Telecommunications Portfolio | 0.7 | 0.9 |
Fidelity Transportation Portfolio | 0.4 | 0.5 |
Fidelity Utilities Portfolio | 0.6 | 0.6 |
Spartan 500 Index Fund Investor Class | 0.0* | 0.1 |
Spartan Extended Market Index Fund Investor Class | 1.3 | 1.5 |
Spartan Total Market Index Fund Investor Class | 1.4 | 1.5 |
VIP Mid Cap Portfolio Investor Class | 0.3 | 0.3 |
| 36.3 | 40.0 |
International Equity Funds | | |
Fidelity Canada Fund | 0.5 | 0.6 |
Fidelity China Region Fund | 0.1 | 0.1 |
Fidelity Diversified International Fund | 0.2 | 1.0 |
Fidelity Emerging Asia Fund | 0.7 | 0.0* |
Fund Holdings as of June 30, 2011 |
| % of fund's
net assets | % of fund's net assets
6 months ago |
Fidelity Emerging Markets Fund | 0.4 | 1.6 |
Fidelity International Capital Appreciation Fund | 0.5 | 0.5 |
Fidelity International Discovery Fund | 0.7 | 1.3 |
Fidelity International Real Estate Fund | 0.2 | 0.3 |
Fidelity International Small Cap Fund | 0.3 | 0.3 |
Fidelity International Small Cap Opportunities Fund | 0.9 | 1.0 |
Fidelity International Value Fund | 0.7 | 0.2 |
Fidelity Japan Fund | 0.3 | 0.3 |
Fidelity Japan Smaller Companies Fund | 0.3 | 0.0* |
Fidelity Nordic Fund | 1.0 | 1.2 |
Fidelity Overseas Fund | 0.0* | 0.0* |
Fidelity Pacific Basin Fund | 1.0 | 0.4 |
Spartan International Index Fund Investor Class | 7.0 | 7.5 |
| 14.8 | 16.3 |
Fixed-Income Funds | | |
Fidelity Floating Rate High Income Fund | 2.9 | 2.0 |
Fidelity Focused High Income Fund | 0.4 | 0.3 |
Fidelity High Income Fund | 2.6 | 2.3 |
Fidelity New Markets Income Fund | 0.7 | 0.7 |
Fidelity Real Estate Income Fund | 0.4 | 0.5 |
Spartan U.S. Bond Index Fund Investor Class | 35.6 | 34.7 |
| 42.6 | 40.5 |
Money Market Funds | | |
Fidelity Institutional Prime Money Market Portfolio Class I | 4.9 | 3.2 |
Fidelity Select Money Market Portfolio | 1.4 | 0.0 |
| 6.3 | 3.2 |
Net Other Assets (Liabilities)* | 0.0 | 0.0 |
| 100.0 | 100.0 |
* Amount represents less than 0.1%
Asset Allocation (% of fund's net assets) |
As of June 30, 2011 |
| Domestic Equity Funds | 36.3% | |
| International Equity Funds | 14.8% | |
| Fixed Income Funds | 42.6% | |
| Money Market Funds | 6.3% | |

As of December 31, 2010 |
| Domestic Equity Funds | 40.0% | |
| International Equity Funds | 16.3% | |
| Fixed Income Funds | 40.5% | |
| Money Market Funds | 3.2% | |

Semiannual Report
VIP FundsManager 50% Portfolio
Investments June 30, 2011 (Unaudited)
Showing Percentage of Net Assets
Equity Funds - 51.1% |
| Shares | | Value |
Domestic Equity Funds - 36.3% |
Fidelity 130/30 Large Cap Fund (a) | 11,814 | | $ 92,153 |
Fidelity Air Transportation Portfolio | 26,665 | | 1,064,450 |
Fidelity Automotive Portfolio | 60,614 | | 2,691,253 |
Fidelity Banking Portfolio (a) | 508,125 | | 8,907,438 |
Fidelity Biotechnology Portfolio (a) | 32,641 | | 2,821,792 |
Fidelity Blue Chip Growth Fund | 56,907 | | 2,743,505 |
Fidelity Brokerage & Investment Management Portfolio | 59,546 | | 2,902,890 |
Fidelity Chemicals Portfolio | 30,118 | | 3,230,509 |
Fidelity Commodity Strategy Fund (a) | 958 | | 11,017 |
Fidelity Communications Equipment Portfolio (a) | 57,480 | | 1,580,118 |
Fidelity Computers Portfolio (a) | 91,536 | | 5,440,921 |
Fidelity Construction & Housing Portfolio | 76,017 | | 2,729,780 |
Fidelity Consumer Discretionary Portfolio | 306,188 | | 7,519,984 |
Fidelity Consumer Finance Portfolio | 1,891 | | 23,019 |
Fidelity Consumer Staples Portfolio | 306,090 | | 22,102,725 |
Fidelity Contrafund | 12,485 | | 881,541 |
Fidelity Defense & Aerospace Portfolio | 4,709 | | 389,437 |
Fidelity Disciplined Equity Fund | 12,593 | | 300,857 |
Fidelity Dividend Growth Fund | 326,774 | | 9,672,514 |
Fidelity Electronics Portfolio | 22,879 | | 1,149,195 |
Fidelity Energy Portfolio | 290,809 | | 16,791,308 |
Fidelity Energy Service Portfolio (a) | 143,723 | | 11,868,620 |
Fidelity Environmental & Alternative Energy Portfolio | 87,771 | | 1,700,128 |
Fidelity Equity-Income Fund | 1,479 | | 68,410 |
Fidelity Equity-Income II Fund | 512 | | 9,773 |
Fidelity Financial Services Portfolio | 158,547 | | 9,246,481 |
Fidelity Fund | 16,124 | | 553,852 |
Fidelity Global Commodity Stock Fund | 33,820 | | 582,050 |
Fidelity Gold Portfolio | 163,914 | | 7,669,555 |
Fidelity Growth Company Fund | 68,423 | | 6,269,556 |
Fidelity Health Care Portfolio | 46,668 | | 6,701,102 |
Fidelity Independence Fund (a) | 974 | | 25,034 |
Fidelity Industrial Equipment Portfolio | 190,229 | | 6,737,911 |
Fidelity Industrials Portfolio | 427,180 | | 10,632,498 |
Fidelity Insurance Portfolio | 176,029 | | 8,403,608 |
Fidelity IT Services Portfolio | 109,342 | | 2,476,605 |
Fidelity Large Cap Stock Fund | 104,418 | | 1,911,885 |
Fidelity Large Cap Value Fund | 31,300 | | 348,370 |
Fidelity Leisure Portfolio | 38,037 | | 3,689,627 |
Fidelity Leveraged Company Stock Fund | 757 | | 22,783 |
Fidelity Magellan Fund | 2,829 | | 206,200 |
Fidelity Materials Portfolio | 2,673 | | 191,404 |
Fidelity Medical Delivery Portfolio (a) | 137,017 | | 8,178,571 |
Fidelity Medical Equipment & Systems Portfolio | 21,201 | | 657,217 |
Fidelity Mega Cap Stock Fund | 197,567 | | 2,060,625 |
Fidelity Mid Cap Value Fund | 148,331 | | 2,505,316 |
Fidelity Mid-Cap Stock Fund | 5,508 | | 161,166 |
|
| Shares | | Value |
Fidelity Multimedia Portfolio | 70,354 | | $ 3,371,374 |
Fidelity Nasdaq Composite Index Fund | 10,173 | | 375,266 |
Fidelity Natural Resources Portfolio | 13,715 | | 512,398 |
Fidelity Pharmaceuticals Portfolio | 784,540 | | 10,865,875 |
Fidelity Real Estate Investment Portfolio | 110,720 | | 3,128,957 |
Fidelity Retailing Portfolio | 47,830 | | 2,597,153 |
Fidelity Small Cap Growth Fund | 3,859 | | 65,958 |
Fidelity Small Cap Stock Fund | 7,639 | | 155,526 |
Fidelity Small Cap Value Fund | 7,898 | | 126,532 |
Fidelity Software & Computer Services Portfolio | 42,002 | | 3,659,644 |
Fidelity Technology Portfolio (a) | 247,192 | | 24,336,018 |
Fidelity Telecom and Utilities Fund | 337,917 | | 5,893,279 |
Fidelity Telecommunications Portfolio | 102,407 | | 5,165,428 |
Fidelity Transportation Portfolio | 52,260 | | 2,976,206 |
Fidelity Utilities Portfolio | 91,246 | | 4,806,826 |
Spartan 500 Index Fund Investor Class | 2,797 | | 131,334 |
Spartan Extended Market Index Fund Investor Class | 246,203 | | 9,941,691 |
Spartan Total Market Index Fund Investor Class | 277,953 | | 10,731,764 |
VIP Mid Cap Portfolio Investor Class | 63,337 | | 2,083,146 |
TOTAL DOMESTIC EQUITY FUNDS | | 276,849,128 |
International Equity Funds - 14.8% |
Fidelity Canada Fund | 67,144 | | 4,013,840 |
Fidelity China Region Fund | 28,512 | | 909,522 |
Fidelity Diversified International Fund | 63,094 | | 1,964,748 |
Fidelity Emerging Asia Fund | 177,495 | | 5,573,346 |
Fidelity Emerging Markets Fund | 120,825 | | 3,176,477 |
Fidelity International Capital Appreciation Fund | 263,723 | | 3,528,609 |
Fidelity International Discovery Fund | 152,783 | | 5,174,757 |
Fidelity International Real Estate Fund | 130,135 | | 1,214,161 |
Fidelity International Small Cap Fund | 89,309 | | 1,998,742 |
Fidelity International Small Cap Opportunities Fund | 642,891 | | 6,949,654 |
Fidelity International Value Fund | 595,837 | | 5,082,491 |
Fidelity Japan Fund | 194,904 | | 2,044,542 |
Fidelity Japan Smaller Companies Fund | 266,836 | | 2,449,557 |
Fidelity Nordic Fund | 210,202 | | 7,470,576 |
Fidelity Overseas Fund | 279 | | 9,497 |
Fidelity Pacific Basin Fund | 289,181 | | 7,591,008 |
Spartan International Index Fund Investor Class | 1,441,609 | | 53,281,851 |
TOTAL INTERNATIONAL EQUITY FUNDS | | 112,433,378 |
TOTAL EQUITY FUNDS (Cost $299,083,471) | 389,282,506 |
Fixed-Income Funds - 42.6% |
| | | |
Fidelity Floating Rate High Income Fund | 2,228,854 | | 21,865,058 |
Fidelity Focused High Income Fund | 341,232 | | 3,139,339 |
Fixed-Income Funds - continued |
| Shares | | Value |
Fidelity High Income Fund | 2,207,723 | | $ 19,979,891 |
Fidelity New Markets Income Fund | 326,970 | | 5,205,369 |
Fidelity Real Estate Income Fund | 303,468 | | 3,256,216 |
Spartan U.S. Bond Index Fund Investor Class | 23,712,012 | | 271,502,535 |
TOTAL FIXED-INCOME FUNDS (Cost $310,956,724) | 324,948,408 |
Money Market Funds - 6.3% |
| | | |
Fidelity Institutional Prime Money Market Portfolio Class I | 37,501,974 | | 37,501,974 |
Fidelity Select Money Market Portfolio | 10,202,270 | | 10,202,270 |
TOTAL MONEY MARKET FUNDS (Cost $47,704,244) | 47,704,244 |
TOTAL INVESTMENT PORTFOLIO - 100.0% (Cost $657,744,439) | 761,935,158 |
NET OTHER ASSETS (LIABILITIES) - 0.0% | (125,862) |
NET ASSETS - 100% | $ 761,809,296 |
Legend |
(a) Non-income producing |
Other Information |
All investments are categorized as Level 1 under the Fair Value Hierarchy. The inputs or methodology used for valuing securities may not be an indication of the risk associated with investing in those securities. For more information on valuation inputs, please refer to the Security Valuation section in the accompanying Notes to Financial Statements. |
Income Tax Information |
At December 31, 2010, the Fund had a capital loss carryforward of approximately $85,066,507 of which $27,271,636 and $57,794,871 will expire in fiscal 2016 and 2017, respectively. Capital loss carryforwards are only available to offset future capital gains of the Fund to the extent provided by regulations and may be limited. |
See accompanying notes which are an integral part of the financial statements.
Semiannual Report
VIP FundsManager 50% Portfolio
Statement of Assets and Liabilities
| June 30, 2011 (Unaudited) |
| | |
Assets | | |
Investment in securities, at value (cost $657,744,439) - See accompanying schedule | | $ 761,935,158 |
Cash | | 5 |
Receivable for fund shares sold | | 176,724 |
Total assets | | 762,111,887 |
| | |
Liabilities | | |
Payable for investments purchased | $ 108,426 | |
Payable for fund shares redeemed | 68,298 | |
Accrued management fee | 125,035 | |
Distribution and service plan fees payable | 832 | |
Total liabilities | | 302,591 |
| | |
Net Assets | | $ 761,809,296 |
Net Assets consist of: | | |
Paid in capital | | $ 731,794,601 |
Undistributed net investment income | | 4,540,122 |
Accumulated undistributed net realized gain (loss) on investments | | (78,716,146) |
Net unrealized appreciation (depreciation) on investments | | 104,190,719 |
Net Assets | | $ 761,809,296 |
Statement of Assets and Liabilities - continued
| June 30, 2011 (Unaudited) |
| | |
Service Class:
Net Asset Value, offering price and redemption price per share ($64,536 ÷ 6,208 shares) | | $ 10.40 |
| | |
Service Class 2:
Net Asset Value, offering price and redemption price per share ($7,629,061 ÷ 735,691 shares) | | $ 10.37 |
| | |
Investor Class:
Net Asset Value, offering price and redemption price per share ($754,115,699 ÷ 72,557,642 shares) | | $ 10.39 |
See accompanying notes which are an integral part of the financial statements.
Semiannual Report
Statement of Operations
Six months ended June 30, 2011 (Unaudited) |
| | |
Investment Income | | |
Income distributions from underlying funds | | $ 5,269,636 |
| | |
Expenses | | |
Management fee | $ 907,866 | |
Distribution and service plan fees | 3,988 | |
Independent trustees' compensation | 1,267 | |
Total expenses before reductions | 913,121 | |
Expense reductions | (183,606) | 729,515 |
Net investment income (loss) | | 4,540,121 |
Realized and Unrealized Gain (Loss) Realized gain (loss) on sale of underlying fund shares | 5,198,463 | |
Capital gain distributions from underlying funds | 1,918,069 | |
Total net realized gain (loss) | | 7,116,532 |
Change in net unrealized appreciation (depreciation) on underlying funds | | 13,922,705 |
Net gain (loss) | | 21,039,237 |
Net increase (decrease) in net assets resulting from operations | | $ 25,579,358 |
Statement of Changes in Net Assets
| Six months ended June 30, 2011 (Unaudited) | Year ended December 31, 2010 |
Increase (Decrease) in Net Assets | | |
Operations | | |
Net investment income (loss) | $ 4,540,121 | $ 10,262,548 |
Net realized gain (loss) | 7,116,532 | 6,631,989 |
Change in net unrealized appreciation (depreciation) | 13,922,705 | 50,222,599 |
Net increase (decrease) in net assets resulting from operations | 25,579,358 | 67,117,136 |
Distributions to shareholders from net investment income | - | (10,267,333) |
Distributions to shareholders from net realized gain | - | (1,192,500) |
Total distributions | - | (11,459,833) |
Share transactions - net increase (decrease) | 63,505,292 | 96,216,502 |
Total increase (decrease) in net assets | 89,084,650 | 151,873,805 |
| | |
Net Assets | | |
Beginning of period | 672,724,646 | 520,850,841 |
End of period (including undistributed net investment income of $4,540,122 and undistributed net investment income of $0, respectively) | $ 761,809,296 | $ 672,724,646 |
See accompanying notes which are an integral part of the financial statements.
Semiannual Report
Financial Highlights - Service Class
| Six months ended June 30, 2011 | Years ended December 31, |
| (Unaudited) | 2010 | 2009 | 2008 | 2007 | 2006 G |
Selected Per-Share Data | | | | | | |
Net asset value, beginning of period | $ 10.02 | $ 9.11 | $ 7.80 | $ 10.51 | $ 10.52 | $ 10.00 |
Income from Investment Operations | | | | | | |
Net investment income (loss) E | .06 | .17 | .17 | .25 | .32 | .26 |
Net realized and unrealized gain (loss) | .32 | .91 | 1.30 | (2.59) | .41 | .47 |
Total from investment operations | .38 | 1.08 | 1.47 | (2.34) | .73 | .73 |
Distributions from net investment income | - | (.16) | (.15) | (.24) | (.24) | (.12) |
Distributions from net realized gain | - | (.02) | (.01) | (.13) | (.50) | (.09) |
Total distributions | - | (.17) J | (.16) | (.37) I | (.74) | (.21) |
Net asset value, end of period | $ 10.40 | $ 10.02 | $ 9.11 | $ 7.80 | $ 10.51 | $ 10.52 |
Total Return B,C,D | 3.79% | 11.89% | 18.82% | (22.48)% | 6.99% | 7.31% |
Ratios to Average Net Assets F,H | | | | | | |
Expenses before reductions | .35% A | .35% | .35% | .35% | .35% | .35% A |
Expenses net of fee waivers, if any | .20% A | .20% | .20% | .20% | .20% | .20% A |
Expenses net of all reductions | .20% A | .20% | .20% | .20% | .20% | .20% A |
Net investment income (loss) | 1.25% A | 1.78% | 2.07% | 2.65% | 2.97% | 3.48% A |
Supplemental Data | | | | | | |
Net assets, end of period (000 omitted) | $ 65 | $ 62 | $ 58 | $ 76 | $ 115 | $ 107 |
Portfolio turnover rate | 14% A | 16% | 44% | 70% | 92% | 103% A |
A Annualized
B Total returns for periods of less than one year are not annualized.
C Total returns do not reflect charges attributable to your insurance company's separate account. Inclusion of these charges would reduce the total returns shown.
D Total returns would have been lower if certain expenses had not been reduced during the applicable periods shown.
E Calculated based on average shares outstanding during the period.
F Amounts do not include the activity of the underlying funds.
G For the period April 13, 2006 (commencement of operations) to December 31, 2006.
H Expense ratios reflect operating expenses of the class. Expenses before reductions do not reflect amounts reimbursed by the investment adviser or reductions from expense offset arrangements and do not represent the amount paid by the class during periods when reimbursements or reductions occur. Expenses net of fee waivers reflect expenses after reimbursement by the investment adviser but prior to reductions from expense offset arrangements. Expenses net of all reductions represent the net expenses paid by the class but do not include expenses of the investment companies in which the Fund invests.
I Total distributions of $.37 per share is comprised of distributions from net investment income of $.241 and distributions from net realized gain of $.125 per share.
J Total distributions of $.17 per share is comprised of distributions from net investment income of $.155 and distributions from net realized gain of $.018 per share.
Financial Highlights - Service Class 2
| Six months ended June 30, 2011 | Years ended December 31, |
| (Unaudited) | 2010 | 2009 | 2008 | 2007 | 2006 G |
Selected Per-Share Data | | | | | | |
Net asset value, beginning of period | $ 10.01 | $ 9.10 | $ 7.79 | $ 10.51 | $ 10.51 | $ 10.00 |
Income from Investment Operations | | | | | | |
Net investment income (loss) E | .06 | .15 | .16 | .23 | .31 | .24 |
Net realized and unrealized gain (loss) | .30 | .92 | 1.30 | (2.59) | .41 | .47 |
Total from investment operations | .36 | 1.07 | 1.46 | (2.36) | .72 | .71 |
Distributions from net investment income | - | (.14) | (.14) | (.24) | (.22) | (.11) |
Distributions from net realized gain | - | (.02) | (.01) | (.13) | (.50) | (.09) |
Total distributions | - | (.16) | (.15) | (.36) I | (.72) | (.20) |
Net asset value, end of period | $ 10.37 | $ 10.01 | $ 9.10 | $ 7.79 | $ 10.51 | $ 10.51 |
Total Return B,C,D | 3.60% | 11.75% | 18.76% | (22.63)% | 6.93% | 7.09% |
Ratios to Average Net Assets F,H | | | | | | |
Expenses before reductions | .50% A | .50% | .50% | .50% | .50% | .50% A |
Expenses net of fee waivers, if any | .35% A | .35% | .35% | .35% | .35% | .35% A |
Expenses net of all reductions | .35% A | .35% | .35% | .35% | .35% | .35% A |
Net investment income (loss) | 1.10% A | 1.63% | 1.92% | 2.50% | 2.82% | 3.34% A |
Supplemental Data | | | | | | |
Net assets, end of period (000 omitted) | $ 7,629 | $ 1,030 | $ 550 | $ 236 | $ 115 | $ 107 |
Portfolio turnover rate | 14% A | 16% | 44% | 70% | 92% | 103% A |
A Annualized
B Total returns for periods of less than one year are not annualized.
C Total returns do not reflect charges attributable to your insurance company's separate account. Inclusion of these charges would reduce the total returns shown.
D Total returns would have been lower if certain expenses had not been reduced during the applicable periods shown.
E Calculated based on average shares outstanding during the period.
F Amounts do not include the activity of the underlying funds.
G For the period April 13, 2006 (commencement of operations) to December 31, 2006.
H Expense ratios reflect operating expenses of the class. Expenses before reductions do not reflect amounts reimbursed by the investment adviser or reductions from expense offset arrangements and do not represent the amount paid by the class during periods when reimbursements or reductions occur. Expenses net of fee waivers reflect expenses after reimbursement by the investment adviser but prior to reductions from expense offset arrangements. Expenses net of all reductions represent the net expenses paid by the class but do not include expenses of the investment companies in which the Fund invests.
I Total distributions of $.36 per share is comprised of distributions from net investment income of $.235 and distributions from net realized gain of $.125 per share.
See accompanying notes which are an integral part of the financial statements.
Semiannual Report
Financial Highlights - Investor Class
| Six months ended June 30, 2011 | Years ended December 31, |
| (Unaudited) | 2010 | 2009 | 2008 | 2007 | 2006 G |
Selected Per-Share Data | | | | | | |
Net asset value, beginning of period | $ 10.02 | $ 9.11 | $ 7.79 | $ 10.51 | $ 10.52 | $ 10.00 |
Income from Investment Operations | | | | | | |
Net investment income (loss) E | .06 | .17 | .17 | .25 | .32 | .26 |
Net realized and unrealized gain (loss) | .31 | .91 | 1.31 | (2.60) | .41 | .47 |
Total from investment operations | .37 | 1.08 | 1.48 | (2.35) | .73 | .73 |
Distributions from net investment income | - | (.16) | (.15) | (.24) | (.24) | (.12) |
Distributions from net realized gain | - | (.02) | (.01) | (.13) | (.50) | (.09) |
Total distributions | - | (.17) J | (.16) | (.37) I | (.74) | (.21) |
Net asset value, end of period | $ 10.39 | $ 10.02 | $ 9.11 | $ 7.79 | $ 10.51 | $ 10.52 |
Total Return B,C,D | 3.69% | 11.89% | 18.98% | (22.57)% | 6.99% | 7.31% |
Ratios to Average Net Assets F,H | | | | | | |
Expenses before reductions | .25% A | .25% | .25% | .25% | .25% | .25% A |
Expenses net of fee waivers, if any | .20% A | .20% | .20% | .20% | .20% | .20% A |
Expenses net of all reductions | .20% A | .20% | .20% | .20% | .20% | .20% A |
Net investment income (loss) | 1.25% A | 1.78% | 2.07% | 2.65% | 2.97% | 3.48% A |
Supplemental Data | | | | | | |
Net assets, end of period (000 omitted) | $ 754,116 | $ 671,632 | $ 520,243 | $ 334,788 | $ 371,298 | $ 143,744 |
Portfolio turnover rate | 14% A | 16% | 44% | 70% | 92% | 103% A |
A Annualized
B Total returns for periods of less than one year are not annualized.
C Total returns do not reflect charges attributable to your insurance company's separate account. Inclusion of these charges would reduce the total returns shown.
D Total returns would have been lower if certain expenses had not been reduced during the applicable periods shown.
E Calculated based on average shares outstanding during the period.
F Amounts do not include the activity of the underlying funds.
G For the period April 13, 2006 (commencement of operations) to December 31, 2006.
H Expense ratios reflect operating expenses of the class. Expenses before reductions do not reflect amounts reimbursed by the investment adviser or reductions from expense offset arrangements and do not represent the amount paid by the class during periods when reimbursements or reductions occur. Expenses net of fee waivers reflect expenses after reimbursement by the investment adviser but prior to reductions from expense offset arrangements. Expenses net of all reductions represent the net expenses paid by the class but do not include expenses of the investment companies in which the Fund invests.
I Total distributions of $.37 per share is comprised of distributions from net investment income of $.241 and distributions from net realized gain of $.125 per share.
J Total distributions of $.17 per share is comprised of distributions from net investment income of $.155 and distributions from net realized gain of $.018 per share.
See accompanying notes which are an integral part of the financial statements.
Semiannual Report
VIP FundsManager 60% Portfolio
Investment Changes (Unaudited)
Fund Holdings as of June 30, 2011 |
| % of fund's
net assets | % of fund's net assets
6 months ago |
Domestic Equity Funds | | |
Fidelity 130/30 Large Cap Fund | 0.0 * | 0.0 * |
Fidelity Air Transportation Portfolio | 0.1 | 0.2 |
Fidelity Automotive Portfolio | 0.3 | 0.1 |
Fidelity Banking Portfolio | 1.5 | 1.4 |
Fidelity Biotechnology Portfolio | 0.0 * | 0.0 * |
Fidelity Blue Chip Growth Fund | 0.1 | 0.1 |
Fidelity Brokerage & Investment Management Portfolio | 0.2 | 0.2 |
Fidelity Chemicals Portfolio | 0.9 | 0.5 |
Fidelity Commodity Strategy Fund | 0.0 * | 0.0* |
Fidelity Communications Equipment Portfolio | 0.6 | 0.6 |
Fidelity Computers Portfolio | 0.8 | 1.0 |
Fidelity Construction & Housing Portfolio | 0.3 | 0.3 |
Fidelity Consumer Discretionary Portfolio | 1.7 | 2.0 |
Fidelity Consumer Finance Portfolio | 0.1 | 0.0 |
Fidelity Consumer Staples Portfolio | 3.6 | 3.7 |
Fidelity Contrafund | 0.0 * | 0.4 |
Fidelity Defense & Aerospace Portfolio | 0.1 | 0.1 |
Fidelity Disciplined Equity Fund | 0.0 * | 0.0 * |
Fidelity Dividend Growth Fund | 1.7 | 2.7 |
Fidelity Electronics Portfolio | 0.0 * | 0.1 |
Fidelity Energy Portfolio | 2.4 | 2.3 |
Fidelity Energy Service Portfolio | 2.1 | 1.8 |
Fidelity Environmental & Alternative Energy Portfolio | 0.1 | 0.1 |
Fidelity Equity-Income Fund | 0.0 * | 0.1 |
Fidelity Equity-Income II Fund | 0.0 * | 0.0 * |
Fidelity Financial Services Portfolio | 1.3 | 1.5 |
Fidelity Fund | 0.0 * | 0.0 * |
Fidelity Global Commodity Stock Fund | 0.3 | 0.2 |
Fidelity Gold Portfolio | 0.9 | 1.1 |
Fidelity Growth Company Fund | 0.6 | 0.8 |
Fidelity Health Care Portfolio | 2.3 | 1.4 |
Fidelity Independence Fund | 0.0 * | 0.0 * |
Fidelity Industrial Equipment Portfolio | 1.5 | 1.3 |
Fidelity Industrials Portfolio | 1.8 | 1.8 |
Fidelity Insurance Portfolio | 1.9 | 1.8 |
Fidelity IT Services Portfolio | 0.4 | 0.3 |
Fidelity Large Cap Stock Fund | 1.4 | 1.8 |
|
| % of fund's
net assets | % of fund's net assets
6 months ago |
Fidelity Large Cap Value Fund | 0.0 * | 0.0 * |
Fidelity Leisure Portfolio | 0.5 | 0.8 |
Fidelity Leveraged Company Stock Fund | 0.1 | 0.1 |
Fidelity Magellan Fund | 0.0 * | 0.0 * |
Fidelity Materials Portfolio | 0.2 | 0.4 |
Fidelity Medical Delivery Portfolio | 0.6 | 0.7 |
Fidelity Medical Equipment & Systems Portfolio | 0.3 | 0.4 |
Fidelity Mega Cap Stock Fund | 0.9 | 1.3 |
Fidelity Mid Cap Value Fund | 0.0 * | 0.2 |
Fidelity Multimedia Portfolio | 0.7 | 0.6 |
Fidelity Natural Resources Portfolio | 0.0 * | 0.0 * |
Fidelity Pharmaceuticals Portfolio | 1.3 | 1.5 |
Fidelity Real Estate Investment Portfolio | 0.2 | 0.4 |
Fidelity Retailing Portfolio | 0.2 | 0.4 |
Fidelity Small Cap Growth Fund | 0.1 | 0.1 |
Fidelity Small Cap Value Fund | 0.0 * | 0.3 |
Fidelity Software & Computer Services Portfolio | 0.4 | 0.5 |
Fidelity Stock Selector All Cap Fund | 0.0 * | 0.0 * |
Fidelity Technology Portfolio | 3.8 | 4.3 |
Fidelity Telecom and Utilities Fund | 0.7 | 0.8 |
Fidelity Telecommunications Portfolio | 1.1 | 1.0 |
Fidelity Transportation Portfolio | 0.5 | 0.6 |
Fidelity Utilities Portfolio | 1.1 | 1.0 |
Fidelity Value Fund | 0.0 * | 0.1 |
Spartan 500 Index Fund Investor Class | 0.0 * | 0.0 * |
Spartan Total Market Index Fund Investor Class | 0.8 | 1.0 |
VIP Mid Cap Portfolio Investor Class | 0.1 | 0.2 |
| 42.6 | 46.4 |
International Equity Funds | | |
Fidelity Canada Fund | 0.5 | 0.6 |
Fidelity China Region Fund | 0.1 | 0.1 |
Fidelity Diversified International Fund | 0.3 | 0.8 |
Fidelity Emerging Asia Fund | 0.8 | 0.0 * |
Fidelity Emerging Markets Fund | 0.4 | 1.7 |
Fidelity International Capital Appreciation Fund | 0.4 | 0.5 |
Fidelity International Discovery Fund | 4.4 | 3.6 |
Fund Holdings as of June 30, 2011 |
| % of fund's
net assets | % of fund's net assets
6 months ago |
Fidelity International Real Estate Fund | 0.0 * | 0.1 |
Fidelity International Small Cap Fund | 0.5 | 0.7 |
Fidelity International Small Cap Opportunities Fund | 1.1 | 1.3 |
Fidelity International Value Fund | 1.0 | 0.0 * |
Fidelity Japan Fund | 0.6 | 0.8 |
Fidelity Japan Smaller Companies Fund | 0.4 | 0.3 |
Fidelity Nordic Fund | 1.5 | 2.3 |
Fidelity Overseas Fund | 0.0 * | 0.0 * |
Fidelity Pacific Basin Fund | 1.1 | 1.2 |
Spartan International Index Fund Investor Class | 4.0 | 5.0 |
| 17.1 | 19.0 |
Fixed-Income Funds | | |
Fidelity Floating Rate High Income Fund | 2.5 | 1.6 |
Fidelity Focused High Income Fund | 1.0 | 1.0 |
Fidelity High Income Fund | 2.1 | 1.7 |
Fidelity New Markets Income Fund | 0.5 | 0.9 |
Fidelity Real Estate Income Fund | 0.6 | 0.7 |
Spartan U.S. Bond Index Fund Investor Class | 30.3 | 27.5 |
| 37.0 | 33.4 |
Money Market Funds | | |
Fidelity Institutional Prime Money Market Portfolio Class I | 3.3 | 1.2 |
Net Other Assets (Liabilities)* | 0.0 | 0.0 |
| 100.0 | 100.0 |
* Amount represents less than 0.1%
Asset Allocation (% of fund's net assets) |
As of June 30, 2011 |
| Domestic Equity Funds | 42.6% | |
| International Equity Funds | 17.1% | |
| Fixed Income Funds | 37.0% | |
| Money Market Funds | 3.3% | |

As of December 31, 2010 |
| Domestic Equity Funds | 46.4% | |
| International Equity Funds | 19.0% | |
| Fixed Income Funds | 33.4% | |
| Money Market Funds | 1.2% | |

Semiannual Report
VIP FundsManager 60% Portfolio
Investments June 30, 2011 (Unaudited)
Showing Percentage of Net Assets
Equity Funds - 59.7% |
| Shares | | Value |
Domestic Equity Funds - 42.6% |
Fidelity 130/30 Large Cap Fund (a) | 7,135 | | $ 55,651 |
Fidelity Air Transportation Portfolio | 123,763 | | 4,940,617 |
Fidelity Automotive Portfolio | 265,752 | | 11,799,388 |
Fidelity Banking Portfolio (a) | 2,956,676 | | 51,830,534 |
Fidelity Biotechnology Portfolio (a) | 12,393 | | 1,071,392 |
Fidelity Blue Chip Growth Fund | 72,650 | | 3,502,443 |
Fidelity Brokerage & Investment Management Portfolio | 112,577 | | 5,488,118 |
Fidelity Chemicals Portfolio | 277,247 | | 29,737,461 |
Fidelity Commodity Strategy Fund (a) | 1,011 | | 11,624 |
Fidelity Communications Equipment Portfolio (a) | 744,537 | | 20,467,329 |
Fidelity Computers Portfolio (a) | 457,960 | | 27,221,142 |
Fidelity Construction & Housing Portfolio | 251,633 | | 9,036,126 |
Fidelity Consumer Discretionary Portfolio | 2,382,406 | | 58,511,900 |
Fidelity Consumer Finance Portfolio | 409,604 | | 4,984,882 |
Fidelity Consumer Staples Portfolio | 1,732,748 | | 125,121,759 |
Fidelity Contrafund | 8,975 | | 633,710 |
Fidelity Defense & Aerospace Portfolio | 28,156 | | 2,328,486 |
Fidelity Disciplined Equity Fund | 4,464 | | 106,657 |
Fidelity Dividend Growth Fund | 1,931,382 | | 57,168,919 |
Fidelity Electronics Portfolio | 26,467 | | 1,329,419 |
Fidelity Energy Portfolio | 1,426,228 | | 82,350,385 |
Fidelity Energy Service Portfolio (a) | 867,431 | | 71,632,459 |
Fidelity Environmental & Alternative Energy Portfolio | 88,070 | | 1,705,914 |
Fidelity Equity-Income Fund | 8,547 | | 395,299 |
Fidelity Equity-Income II Fund | 4,873 | | 93,031 |
Fidelity Financial Services Portfolio | 762,569 | | 44,473,038 |
Fidelity Fund | 1,832 | | 62,930 |
Fidelity Global Commodity Stock Fund | 651,431 | | 11,211,131 |
Fidelity Gold Portfolio | 646,320 | | 30,241,303 |
Fidelity Growth Company Fund | 240,312 | | 22,019,802 |
Fidelity Health Care Portfolio | 547,993 | | 78,686,357 |
Fidelity Independence Fund (a) | 2,122 | | 54,521 |
Fidelity Industrial Equipment Portfolio | 1,486,584 | | 52,654,806 |
Fidelity Industrials Portfolio | 2,457,359 | | 61,163,663 |
Fidelity Insurance Portfolio | 1,377,797 | | 65,776,014 |
Fidelity IT Services Portfolio | 540,362 | | 12,239,209 |
Fidelity Large Cap Stock Fund | 2,715,898 | | 49,728,091 |
Fidelity Large Cap Value Fund | 27,567 | | 306,820 |
Fidelity Leisure Portfolio | 160,522 | | 15,570,596 |
Fidelity Leveraged Company Stock Fund | 57,376 | | 1,725,865 |
Fidelity Magellan Fund | 2,866 | | 208,939 |
Fidelity Materials Portfolio | 108,348 | | 7,758,828 |
Fidelity Medical Delivery Portfolio (a) | 351,513 | | 20,981,834 |
Fidelity Medical Equipment & Systems Portfolio | 335,744 | | 10,408,068 |
Fidelity Mega Cap Stock Fund | 3,002,240 | | 31,313,361 |
Fidelity Mid Cap Value Fund | 5,547 | | 93,685 |
Fidelity Multimedia Portfolio | 498,319 | | 23,879,452 |
Fidelity Natural Resources Portfolio | 32,386 | | 1,209,952 |
|
| Shares | | Value |
Fidelity Pharmaceuticals Portfolio | 3,324,654 | | $ 46,046,452 |
Fidelity Real Estate Investment Portfolio | 290,053 | | 8,196,896 |
Fidelity Retailing Portfolio | 146,026 | | 7,929,232 |
Fidelity Small Cap Growth Fund | 137,422 | | 2,348,547 |
Fidelity Small Cap Value Fund | 23,325 | | 373,660 |
Fidelity Software & Computer Services Portfolio | 162,821 | | 14,186,564 |
Fidelity Stock Selector All Cap Fund | 4,389 | | 118,554 |
Fidelity Technology Portfolio (a) | 1,318,450 | | 129,801,362 |
Fidelity Telecom and Utilities Fund | 1,356,764 | | 23,661,959 |
Fidelity Telecommunications Portfolio | 735,296 | | 37,088,335 |
Fidelity Transportation Portfolio | 284,835 | | 16,221,372 |
Fidelity Utilities Portfolio | 688,278 | | 36,258,470 |
Fidelity Value Fund | 4,035 | | 291,111 |
Spartan 500 Index Fund Investor Class | 2,208 | | 103,686 |
Spartan Total Market Index Fund Investor Class | 677,998 | | 26,177,510 |
VIP Mid Cap Portfolio Investor Class | 140,092 | | 4,607,616 |
TOTAL DOMESTIC EQUITY FUNDS | | 1,466,704,236 |
International Equity Funds - 17.1% |
Fidelity Canada Fund | 274,712 | | 16,422,261 |
Fidelity China Region Fund | 113,353 | | 3,615,955 |
Fidelity Diversified International Fund | 290,221 | | 9,037,492 |
Fidelity Emerging Asia Fund | 863,748 | | 27,121,697 |
Fidelity Emerging Markets Fund | 476,183 | | 12,518,840 |
Fidelity International Capital Appreciation Fund | 1,012,811 | | 13,551,411 |
Fidelity International Discovery Fund | 4,465,307 | | 151,239,965 |
Fidelity International Real Estate Fund | 154,774 | | 1,444,037 |
Fidelity International Small Cap Fund | 811,688 | | 18,165,587 |
Fidelity International Small Cap Opportunities Fund | 3,341,315 | | 36,119,620 |
Fidelity International Value Fund | 4,196,647 | | 35,797,400 |
Fidelity Japan Fund | 1,801,391 | | 18,896,587 |
Fidelity Japan Smaller Companies Fund | 1,561,293 | | 14,332,667 |
Fidelity Nordic Fund | 1,480,736 | | 52,625,342 |
Fidelity Overseas Fund | 1,143 | | 38,900 |
Fidelity Pacific Basin Fund | 1,440,896 | | 37,823,513 |
Spartan International Index Fund Investor Class | 3,755,564 | | 138,805,635 |
TOTAL INTERNATIONAL EQUITY FUNDS | | 587,556,909 |
TOTAL EQUITY FUNDS (Cost $1,654,251,504) | 2,054,261,145 |
Fixed-Income Funds - 37.0% |
| | | |
Fidelity Floating Rate High Income Fund | 8,912,701 | | 87,433,592 |
Fidelity Focused High Income Fund | 3,745,933 | | 34,462,582 |
Fidelity High Income Fund | 7,807,299 | | 70,656,057 |
Fidelity New Markets Income Fund | 1,162,545 | | 18,507,713 |
Fixed-Income Funds - continued |
| Shares | | Value |
Fidelity Real Estate Income Fund | 1,959,221 | | $ 21,022,443 |
Spartan U.S. Bond Index Fund Investor Class | 91,001,508 | | 1,041,967,265 |
TOTAL FIXED-INCOME FUNDS (Cost $1,242,402,878) | 1,274,049,652 |
Money Market Funds - 3.3% |
| | | |
Fidelity Institutional Prime Money Market Portfolio Class I
(Cost $113,156,117) | 113,156,117 | | 113,156,117 |
TOTAL INVESTMENT PORTFOLIO - 100.0% (Cost $3,009,810,499) | 3,441,466,914 |
NET OTHER ASSETS (LIABILITIES) - 0.0% | (556,798) |
NET ASSETS - 100% | $ 3,440,910,116 |
Legend |
(a) Non-income producing |
Other Information |
All investments are categorized as Level 1 under the Fair Value Hierarchy. The inputs or methodology used for valuing securities may not be an indication of the risk associated with investing in those securities. For more information on valuation inputs, please refer to the Security Valuation section in the accompanying Notes to Financial Statements. |
Income Tax Information |
At December 31, 2010, the Fund had a capital loss carryforward of approximately $80,163,922 of which $27,333,665 and $52,830,257 will expire in fiscal 2016 and 2017, respectively. Capital loss carryforwards are only available to offset future capital gains of the Fund to the extent provided by regulations and may be limited. |
See accompanying notes which are an integral part of the financial statements.
Semiannual Report
VIP FundsManager 60% Portfolio
Statement of Assets and Liabilities
| June 30, 2011 (Unaudited) |
| | |
Assets | | |
Investment in securities, at value (cost $3,009,810,499) - See accompanying schedule | | $ 3,441,466,914 |
Receivable for fund shares sold | | 5,728,696 |
Total assets | | 3,447,195,610 |
| | |
Liabilities | | |
Payable to custodian bank | $ 5 | |
Payable for investments purchased | 5,633,970 | |
Payable for fund shares redeemed | 94,725 | |
Accrued management fee | 554,734 | |
Distribution and service plan fees payable | 2,060 | |
Total liabilities | | 6,285,494 |
| | |
Net Assets | | $ 3,440,910,116 |
Net Assets consist of: | | |
Paid in capital | | $ 3,056,334,062 |
Undistributed net investment income | | 15,655,204 |
Accumulated undistributed net realized gain (loss) on investments | | (62,735,565) |
Net unrealized appreciation (depreciation) on investments | | 431,656,415 |
Net Assets | | $ 3,440,910,116 |
Statement of Assets and Liabilities - continued
| June 30, 2011 (Unaudited) |
| | |
Service Class:
Net Asset Value, offering price and redemption price per share ($63,237 ÷ 6,167 shares) | | $ 10.25 |
| | |
Service Class 2:
Net Asset Value, offering price and redemption price per share ($16,200,348 ÷ 1,581,521 shares) | | $ 10.24 |
| | |
Investor Class:
Net Asset Value, offering price and redemption price per share ($3,424,646,531 ÷ 334,047,277 shares) | | $ 10.25 |
See accompanying notes which are an integral part of the financial statements.
Semiannual Report
VIP FundsManager 60% Portfolio
Financial Statements - continued
Statement of Operations
Six months ended June 30, 2011 (Unaudited) |
| | |
Investment Income | | |
Income distributions from underlying funds | | $ 18,663,916 |
| | |
Expenses | | |
Management fee | $ 3,750,819 | |
Distribution and service plan fees | 9,117 | |
Independent trustees' compensation | 5,059 | |
Total expenses before reductions | 3,764,995 | |
Expense reductions | (756,283) | 3,008,712 |
Net investment income (loss) | | 15,655,204 |
Realized and Unrealized Gain (Loss) Realized gain (loss) on sale of underlying fund shares | 10,667,916 | |
Capital gain distributions from underlying funds | 8,633,348 | |
Total net realized gain (loss) | | 19,301,264 |
Change in net unrealized appreciation (depreciation) on underlying funds | | 67,869,243 |
Net gain (loss) | | 87,170,507 |
Net increase (decrease) in net assets resulting from operations | | $ 102,825,711 |
Statement of Changes in Net Assets
| Six months ended June 30, 2011 (Unaudited) | Year ended
December 31, 2010 |
Increase (Decrease) in Net Assets | | |
Operations | | |
Net investment income (loss) | $ 15,655,204 | $ 30,798,284 |
Net realized gain (loss) | 19,301,264 | 20,810,598 |
Change in net unrealized appreciation (depreciation) | 67,869,243 | 211,909,440 |
Net increase (decrease) in net assets resulting from operations | 102,825,711 | 263,518,322 |
Distributions to shareholders from net investment income | - | (30,781,925) |
Distributions to shareholders from net realized gain | - | (5,386,863) |
Total distributions | - | (36,168,788) |
Share transactions - net increase (decrease) | 753,878,102 | 1,196,958,465 |
Total increase (decrease) in net assets | 856,703,813 | 1,424,307,999 |
| | |
Net Assets | | |
Beginning of period | 2,584,206,303 | 1,159,898,304 |
End of period (including undistributed net investment income of $15,655,204 and undistributed net investment income of $0, respectively) | $ 3,440,910,116 | $ 2,584,206,303 |
See accompanying notes which are an integral part of the financial statements.
Semiannual Report
Financial Highlights - Service Class
| Six months ended June 30, 2011 | Years ended December 31, |
| (Unaudited) | 2010 | 2009 | 2008 | 2007 G |
Selected Per-Share Data | | | | | |
Net asset value, beginning of period | $ 9.88 | $ 8.83 | $ 7.32 | $ 10.29 | $ 10.00 |
Income from Investment Operations | | | | | |
Net investment income (loss) E | .05 | .16 | .15 | .25 | .18 |
Net realized and unrealized gain (loss) | .32 | 1.03 | 1.51 | (3.01) | .23 |
Total from investment operations | .37 | 1.19 | 1.66 | (2.76) | .41 |
Distributions from net investment income | - | (.12) | (.13) | (.13) | (.06) |
Distributions from net realized gain | - | (.02) | (.01) | (.08) | (.06) |
Total distributions | - | (.14) | (.15) J | (.21) I | (.12) |
Net asset value, end of period | $ 10.25 | $ 9.88 | $ 8.83 | $ 7.32 | $ 10.29 |
Total Return B,C,D | 3.74% | 13.49% | 22.61% | (26.93)% | 4.07% |
Ratios to Average Net Assets F,H | | | | | |
Expenses before reductions | .35% A | .35% | .35% | .35% | .35% A |
Expenses net of fee waivers, if any | .20% A | .20% | .20% | .20% | .20% A |
Expenses net of all reductions | .20% A | .20% | .20% | .20% | .20% A |
Net investment income (loss) | 1.04% A | 1.77% | 1.89% | 2.75% | 4.76% A |
Supplemental Data | | | | | |
Net assets, end of period (000 omitted) | $ 63 | $ 60 | $ 52 | $ 65 | $ 104 |
Portfolio turnover rate | 9% A | 10% | 38% | 74% | 60% A |
A Annualized
B Total returns for periods of less than one year are not annualized.
C Total returns do not reflect charges attributable to your insurance company's separate account. Inclusion of these charges would reduce the total returns shown.
D Total returns would have been lower if certain expenses had not been reduced during the applicable periods shown.
E Calculated based on average shares outstanding during the period.
F Amounts do not include the activity of the underlying funds.
G For the period August 22, 2007 (commencement of operations) to December 31, 2007.
H Expense ratios reflect operating expenses of the class. Expenses before reductions do not reflect amounts reimbursed by the investment adviser or reductions from expense offset arrangements and do not represent the amount paid by the class during periods when reimbursements or reductions occur. Expenses net of fee waivers reflect expenses after reimbursement by the investment adviser but prior to reductions from expense offset arrangements. Expenses net of all reductions represent the net expenses paid by the class but do not include expenses of the investment companies in which the Fund invests.
I Total distributions of $.21 per share is comprised of distributions from net investment income of $.133 and distributions from net realized gain of $.080 per share.
J Total distributions of $.15 per share is comprised of distributions from net investment income of $.134 and distributions from net realized gain of $.012 per share.
Financial Highlights - Service Class 2
| Six months ended June 30, 2011 | Years ended December 31, |
| (Unaudited) | 2010 | 2009 | 2008 | 2007 G |
Selected Per-Share Data | | | | | |
Net asset value, beginning of period | $ 9.88 | $ 8.83 | $ 7.33 | $ 10.29 | $ 10.00 |
Income from Investment Operations | | | | | |
Net investment income (loss) E | .04 | .15 | .14 | .23 | .17 |
Net realized and unrealized gain (loss) | .32 | 1.03 | 1.50 | (2.99) | .23 |
Total from investment operations | .36 | 1.18 | 1.64 | (2.76) | .40 |
Distributions from net investment income | - | (.11) | (.12) | (.12) | (.05) |
Distributions from net realized gain | - | (.02) | (.01) | (.08) | (.06) |
Total distributions | - | (.13) | (.14) J | (.20) I | (.11) |
Net asset value, end of period | $ 10.24 | $ 9.88 | $ 8.83 | $ 7.33 | $ 10.29 |
Total Return B,C,D | 3.64% | 13.35% | 22.31% | (26.97)% | 4.01% |
Ratios to Average Net Assets F,H | | | | | |
Expenses before reductions | .50% A | .50% | .50% | .50% | .50% A |
Expenses net of fee waivers, if any | .35% A | .35% | .35% | .35% | .35% A |
Expenses net of all reductions | .35% A | .35% | .35% | .35% | .35% A |
Net investment income (loss) | .89% A | 1.62% | 1.74% | 2.59% | 4.61% A |
Supplemental Data | | | | | |
Net assets, end of period (000 omitted) | $ 16,200 | $ 125 | $ 83 | $ 76 | $ 104 |
Portfolio turnover rate | 9% A | 10% | 38% | 74% | 60% A |
A Annualized
B Total returns for periods of less than one year are not annualized.
C Total returns do not reflect charges attributable to your insurance company's separate account. Inclusion of these charges would reduce the total returns shown.
D Total returns would have been lower if certain expenses had not been reduced during the applicable periods shown.
E Calculated based on average shares outstanding during the period.
F Amounts do not include the activity of the underlying funds.
G For the period August 22, 2007 (commencement of operations) to December 31, 2007.
H Expense ratios reflect operating expenses of the class. Expenses before reductions do not reflect amounts reimbursed by the investment adviser or reductions from expense offset arrangements and do not represent the amount paid by the class during periods when reimbursements or reductions occur. Expenses net of fee waivers reflect expenses after reimbursement by the investment adviser but prior to reductions from expense offset arrangements. Expenses net of all reductions represent the net expenses paid by the class but do not include expenses of the investment companies in which the Fund invests.
I Total distributions of $.20 per share is comprised of distributions from net investment income of $.119 and distributions from net realized gain of $.080 per share.
J Total distributions of $.14 per share is comprised of distributions from net investment income of $.124 and distributions from net realized gain of $.012 per share.
See accompanying notes which are an integral part of the financial statements.
Semiannual Report
Financial Highlights - Investor Class
| Six months ended June 30, 2011 | Years ended December 31, |
| (Unaudited) | 2010 | 2009 | 2008 | 2007 G |
Selected Per-Share Data | | | | | |
Net asset value, beginning of period | $ 9.88 | $ 8.82 | $ 7.32 | $ 10.29 | $ 10.00 |
Income from Investment Operations | | | | | |
Net investment income (loss) E | .05 | .16 | .15 | .23 | .17 |
Net realized and unrealized gain (loss) | .32 | 1.04 | 1.50 | (2.99) | .24 |
Total from investment operations | .37 | 1.20 | 1.65 | (2.76) | .41 |
Distributions from net investment income | - | (.12) | (.13) | (.13) | (.06) |
Distributions from net realized gain | - | (.02) | (.01) | (.08) | (.06) |
Total distributions | - | (.14) | (.15) J | (.21) I | (.12) |
Net asset value, end of period | $ 10.25 | $ 9.88 | $ 8.82 | $ 7.32 | $ 10.29 |
Total Return B,C,D | 3.74% | 13.62% | 22.48% | (26.93)% | 4.07% |
Ratios to Average Net Assets F,H | | | | | |
Expenses before reductions | .25% A | .25% | .25% | .25% | .25% A |
Expenses net of fee waivers, if any | .20% A | .20% | .20% | .20% | .20% A |
Expenses net of all reductions | .20% A | .20% | .20% | .20% | .20% A |
Net investment income (loss) | 1.04% A | 1.77% | 1.89% | 2.75% | 4.76% A |
Supplemental Data | | | | | |
Net assets, end of period (000 omitted) | $ 3,424,647 | $ 2,584,021 | $ 1,159,764 | $ 593,277 | $ 113,806 |
Portfolio turnover rate | 9% A | 10% | 38% | 74% | 60% A |
A Annualized
B Total returns for periods of less than one year are not annualized.
C Total returns do not reflect charges attributable to your insurance company's separate account. Inclusion of these charges would reduce the total returns shown.
D Total returns would have been lower if certain expenses had not been reduced during the applicable periods shown.
E Calculated based on average shares outstanding during the period.
F Amounts do not include the activity of the underlying funds.
G For the period August 22, 2007 (commencement of operations) to December 31, 2007.
H Expense ratios reflect operating expenses of the class. Expenses before reductions do not reflect amounts reimbursed by the investment adviser or reductions from expense offset arrangements and do not represent the amount paid by the class during periods when reimbursements or reductions occur. Expenses net of fee waivers reflect expenses after reimbursement by the investment adviser but prior to reductions from expense offset arrangements. Expenses net of all reductions represent the net expenses paid by the class but do not include expenses of the investment companies in which the Fund invests.
I Total distributions of $.21 per share is comprised of distributions from net investment income of $.133 and distributions from net realized gain of $.080 per share.
J Total distributions of $.15 per share is comprised of distributions from net investment income of $.134 and distributions from net realized gain of $.012 per share.
See accompanying notes which are an integral part of the financial statements.
Semiannual Report
VIP FundsManager 70% Portfolio
Investment Changes (Unaudited)
Fund Holdings as of June 30, 2011 |
| % of fund's
net assets | % of fund's net assets
6 months ago |
Domestic Equity Funds | | |
Fidelity 130/30 Large Cap Fund | 0.0 * | 0.0 * |
Fidelity Air Transportation Portfolio | 0.2 | 0.2 |
Fidelity Automotive Portfolio | 0.2 | 0.1 |
Fidelity Banking Portfolio | 1.1 | 1.2 |
Fidelity Biotechnology Portfolio | 0.6 | 0.5 |
Fidelity Blue Chip Growth Fund | 0.4 | 0.4 |
Fidelity Brokerage & Investment Management Portfolio | 0.4 | 0.5 |
Fidelity Chemicals Portfolio | 0.7 | 0.4 |
Fidelity Commodity Strategy Fund | 0.0 * | 0.0 * |
Fidelity Communications Equipment Portfolio | 0.2 | 0.2 |
Fidelity Computers Portfolio | 1.2 | 1.4 |
Fidelity Construction & Housing Portfolio | 0.5 | 0.5 |
Fidelity Consumer Discretionary Portfolio | 1.4 | 1.4 |
Fidelity Consumer Finance Portfolio | 0.0 * | 0.0 |
Fidelity Consumer Staples Portfolio | 4.2 | 4.2 |
Fidelity Contrafund | 0.0 * | 0.1 |
Fidelity Defense & Aerospace Portfolio | 0.1 | 0.1 |
Fidelity Dividend Growth Fund | 1.1 | 1.2 |
Fidelity Electronics Portfolio | 0.2 | 0.2 |
Fidelity Energy Portfolio | 2.6 | 3.0 |
Fidelity Energy Service Portfolio | 2.6 | 2.0 |
Fidelity Environmental & Alternative Energy Portfolio | 0.2 | 0.2 |
Fidelity Equity-Income Fund | 0.2 | 0.2 |
Fidelity Equity-Income II Fund | 0.0 * | 0.0 * |
Fidelity Financial Services Portfolio | 1.8 | 2.0 |
Fidelity Fund | 0.0 * | 0.0 * |
Fidelity Global Commodity Stock Fund | 0.1 | 0.0 * |
Fidelity Gold Portfolio | 0.9 | 1.1 |
Fidelity Growth Company Fund | 0.9 | 0.9 |
Fidelity Health Care Portfolio | 1.1 | 0.8 |
Fidelity Independence Fund | 0.0 * | 0.0 * |
Fidelity Industrial Equipment Portfolio | 1.0 | 0.9 |
Fidelity Industrials Portfolio | 2.4 | 2.5 |
Fidelity Insurance Portfolio | 1.5 | 1.5 |
Fidelity IT Services Portfolio | 0.3 | 0.4 |
Fidelity Large Cap Stock Fund | 0.4 | 1.3 |
Fidelity Large Cap Value Fund | 0.0 * | 0.2 |
Fund Holdings as of June 30, 2011 |
| % of fund's
net assets | % of fund's net assets
6 months ago |
Fidelity Leisure Portfolio | 0.0 * | 1.0 |
Fidelity Leveraged Company Stock Fund | 0.0 * | 0.0 * |
Fidelity Magellan Fund | 0.0 * | 0.0 * |
Fidelity Materials Portfolio | 0.1 | 0.3 |
Fidelity Medical Delivery Portfolio | 1.3 | 1.2 |
Fidelity Medical Equipment & Systems Portfolio | 0.2 | 0.2 |
Fidelity Mega Cap Stock Fund | 0.3 | 0.3 |
Fidelity Mid Cap Value Fund | 0.0 * | 0.1 |
Fidelity Mid-Cap Stock Fund | 0.0 * | 0.0 * |
Fidelity Multimedia Portfolio | 1.0 | 0.9 |
Fidelity Nasdaq Composite Index Fund | 0.3 | 0.3 |
Fidelity Natural Resources Portfolio | 0.1 | 0.1 |
Fidelity Pharmaceuticals Portfolio | 1.8 | 1.7 |
Fidelity Real Estate Investment Portfolio | 0.9 | 1.0 |
Fidelity Retailing Portfolio | 0.5 | 0.5 |
Fidelity Small Cap Growth Fund | 0.7 | 0.9 |
Fidelity Small Cap Stock Fund | 0.0 * | 0.0 * |
Fidelity Small Cap Value Fund | 0.0 * | 0.2 |
Fidelity Software & Computer Services Portfolio | 0.9 | 0.9 |
Fidelity Technology Portfolio | 4.1 | 4.2 |
Fidelity Telecom and Utilities Fund | 1.2 | 1.2 |
Fidelity Telecommunications Portfolio | 1.1 | 1.0 |
Fidelity Transportation Portfolio | 0.5 | 0.6 |
Fidelity Utilities Portfolio | 0.8 | 0.7 |
Fidelity Value Discovery Fund | 0.0 * | 0.0 * |
Fidelity Value Fund | 0.1 | 0.3 |
Spartan 500 Index Fund Investor Class | 1.3 | 1.4 |
Spartan Extended Market Index Fund Investor Class | 2.4 | 2.5 |
Spartan Total Market Index Fund Investor Class | 2.0 | 2.1 |
VIP Mid Cap Portfolio Investor Class | 0.6 | 0.7 |
| 50.7 | 53.9 |
International Equity Funds | | |
Fidelity Canada Fund | 0.7 | 0.8 |
Fidelity China Region Fund | 0.2 | 0.2 |
Fidelity Diversified International Fund | 1.1 | 2.2 |
Fidelity Emerging Asia Fund | 0.8 | 0.0 * |
Fidelity Emerging Markets Fund | 0.5 | 1.8 |
Fund Holdings as of June 30, 2011 |
| % of fund's
net assets | % of fund's net assets
6 months ago |
Fidelity International Capital Appreciation Fund | 0.9 | 0.9 |
Fidelity International Discovery Fund | 2.0 | 1.6 |
Fidelity International Real Estate Fund | 0.0 * | 0.0 * |
Fidelity International Small Cap Fund | 0.3 | 0.4 |
Fidelity International Small Cap Opportunities Fund | 0.5 | 0.6 |
Fidelity International Value Fund | 0.8 | 0.3 |
Fidelity Japan Fund | 0.2 | 0.3 |
Fidelity Japan Smaller Companies Fund | 0.4 | 0.0 * |
Fidelity Nordic Fund | 1.2 | 1.7 |
Fidelity Overseas Fund | 0.0 * | 0.0 * |
Fidelity Pacific Basin Fund | 1.1 | 0.3 |
Spartan International Index Fund Investor Class | 10.2 | 10.7 |
| 20.9 | 21.8 |
Fixed-Income Funds | | |
Fidelity Floating Rate High Income Fund | 2.2 | 1.0 |
Fidelity Focused High Income Fund | 0.9 | 0.8 |
Fidelity High Income Fund | 2.1 | 1.5 |
Fidelity New Markets Income Fund | 0.6 | 0.6 |
Fidelity Real Estate Income Fund | 0.3 | 0.4 |
Spartan U.S. Bond Index Fund Investor Class | 20.4 | 19.6 |
| 26.5 | 23.9 |
Money Market Funds | | |
Fidelity Institutional Prime Money Market Portfolio Class I | 1.9 | 0.4 |
Net Other Assets (Liabilities)* | 0.0 | 0.0 |
| 100.0 | 100.0 |
* Amount represents less than 0.1%
Asset Allocation (% of fund's net assets) |
As of June 30, 2011 |
| Domestic Equity Funds | 50.7% | |
| International Equity Funds | 20.9% | |
| Fixed Income Funds | 26.5% | |
| Money Market Funds | 1.9% | |

As of December 31, 2010 |
| Domestic Equity Funds | 53.9% | |
| International Equity Funds | 21.8% | |
| Fixed Income Funds | 23.9% | |
| Money Market Funds | 0.4% | |

Semiannual Report
VIP FundsManager 70% Portfolio
Investments June 30, 2011 (Unaudited)
Showing Percentage of Net Assets
Equity Funds - 71.6% |
| Shares | | Value |
Domestic Equity Funds - 50.7% |
Fidelity 130/30 Large Cap Fund (a) | 10,694 | | $ 83,409 |
Fidelity Air Transportation Portfolio | 23,586 | | 941,573 |
Fidelity Automotive Portfolio | 20,960 | | 930,620 |
Fidelity Banking Portfolio (a) | 386,831 | | 6,781,147 |
Fidelity Biotechnology Portfolio (a) | 38,655 | | 3,341,712 |
Fidelity Blue Chip Growth Fund | 47,967 | | 2,312,504 |
Fidelity Brokerage & Investment Management Portfolio | 54,551 | | 2,659,347 |
Fidelity Chemicals Portfolio | 41,931 | | 4,497,522 |
Fidelity Commodity Strategy Fund (a) | 958 | | 11,017 |
Fidelity Communications Equipment Portfolio (a) | 52,067 | | 1,431,334 |
Fidelity Computers Portfolio (a) | 120,874 | | 7,184,760 |
Fidelity Construction & Housing Portfolio | 76,617 | | 2,751,317 |
Fidelity Consumer Discretionary Portfolio | 335,059 | | 8,229,041 |
Fidelity Consumer Finance Portfolio | 16,958 | | 206,374 |
Fidelity Consumer Staples Portfolio | 354,195 | | 25,576,407 |
Fidelity Contrafund | 1,024 | | 72,322 |
Fidelity Defense & Aerospace Portfolio | 3,926 | | 324,694 |
Fidelity Dividend Growth Fund | 222,059 | | 6,572,933 |
Fidelity Electronics Portfolio | 19,795 | | 994,305 |
Fidelity Energy Portfolio | 270,836 | | 15,638,046 |
Fidelity Energy Service Portfolio (a) | 191,690 | | 15,829,772 |
Fidelity Environmental & Alternative Energy Portfolio | 65,014 | | 1,259,325 |
Fidelity Equity-Income Fund | 22,093 | | 1,021,802 |
Fidelity Equity-Income II Fund | 505 | | 9,638 |
Fidelity Financial Services Portfolio | 183,097 | | 10,678,213 |
Fidelity Fund | 5,353 | | 183,864 |
Fidelity Global Commodity Stock Fund | 19,856 | | 341,726 |
Fidelity Gold Portfolio | 117,889 | | 5,516,027 |
Fidelity Growth Company Fund | 56,598 | | 5,186,072 |
Fidelity Health Care Portfolio | 46,321 | | 6,651,256 |
Fidelity Independence Fund (a) | 559 | | 14,372 |
Fidelity Industrial Equipment Portfolio | 167,030 | | 5,916,204 |
Fidelity Industrials Portfolio | 582,212 | | 14,491,256 |
Fidelity Insurance Portfolio | 190,202 | | 9,080,250 |
Fidelity IT Services Portfolio | 90,795 | | 2,056,516 |
Fidelity Large Cap Stock Fund | 118,761 | | 2,174,506 |
Fidelity Large Cap Value Fund | 6,285 | | 69,953 |
Fidelity Leisure Portfolio | 1,421 | | 137,794 |
Fidelity Leveraged Company Stock Fund | 953 | | 28,664 |
Fidelity Magellan Fund | 895 | | 65,263 |
Fidelity Materials Portfolio | 12,289 | | 879,982 |
Fidelity Medical Delivery Portfolio (a) | 131,901 | | 7,873,170 |
Fidelity Medical Equipment & Systems Portfolio | 32,042 | | 993,305 |
Fidelity Mega Cap Stock Fund | 185,294 | | 1,932,611 |
Fidelity Mid Cap Value Fund | 4,380 | | 73,974 |
Fidelity Mid-Cap Stock Fund | 6,290 | | 184,060 |
Fidelity Multimedia Portfolio | 126,224 | | 6,048,632 |
|
| Shares | | Value |
Fidelity Nasdaq Composite Index Fund | 44,023 | | $ 1,624,015 |
Fidelity Natural Resources Portfolio | 7,777 | | 290,544 |
Fidelity Pharmaceuticals Portfolio | 769,244 | | 10,654,035 |
Fidelity Real Estate Investment Portfolio | 195,945 | | 5,537,395 |
Fidelity Retailing Portfolio | 59,147 | | 3,211,705 |
Fidelity Small Cap Growth Fund | 244,716 | | 4,182,204 |
Fidelity Small Cap Stock Fund | 8,026 | | 163,416 |
Fidelity Small Cap Value Fund | 10,537 | | 168,803 |
Fidelity Software & Computer Services Portfolio | 62,463 | | 5,442,396 |
Fidelity Technology Portfolio (a) | 249,765 | | 24,589,407 |
Fidelity Telecom and Utilities Fund | 406,051 | | 7,081,533 |
Fidelity Telecommunications Portfolio | 130,081 | | 6,561,265 |
Fidelity Transportation Portfolio | 58,032 | | 3,304,931 |
Fidelity Utilities Portfolio | 94,015 | | 4,952,719 |
Fidelity Value Discovery Fund | 1,606 | | 24,827 |
Fidelity Value Fund | 7,986 | | 576,088 |
Spartan 500 Index Fund Investor Class | 169,630 | | 7,965,835 |
Spartan Extended Market Index Fund Investor Class | 358,944 | | 14,494,151 |
Spartan Total Market Index Fund Investor Class | 317,721 | | 12,267,220 |
VIP Mid Cap Portfolio Investor Class | 116,481 | | 3,831,071 |
TOTAL DOMESTIC EQUITY FUNDS | | 306,162,151 |
International Equity Funds - 20.9% |
Fidelity Canada Fund | 72,190 | | 4,315,502 |
Fidelity China Region Fund | 35,909 | | 1,145,512 |
Fidelity Diversified International Fund | 218,061 | | 6,790,419 |
Fidelity Emerging Asia Fund | 142,841 | | 4,485,222 |
Fidelity Emerging Markets Fund | 121,515 | | 3,194,632 |
Fidelity International Capital Appreciation Fund | 398,253 | | 5,328,631 |
Fidelity International Discovery Fund | 351,157 | | 11,893,696 |
Fidelity International Real Estate Fund | 20,502 | | 191,282 |
Fidelity International Small Cap Fund | 83,417 | | 1,866,876 |
Fidelity International Small Cap Opportunities Fund | 283,607 | | 3,065,792 |
Fidelity International Value Fund | 553,913 | | 4,724,880 |
Fidelity Japan Fund | 128,085 | | 1,343,615 |
Fidelity Japan Smaller Companies Fund | 277,857 | | 2,550,727 |
Fidelity Nordic Fund | 201,995 | | 7,178,919 |
Fidelity Overseas Fund | 829 | | 28,216 |
Fidelity Pacific Basin Fund | 239,101 | | 6,276,403 |
Spartan International Index Fund Investor Class | 1,661,764 | | 61,418,786 |
TOTAL INTERNATIONAL EQUITY FUNDS | | 125,799,110 |
TOTAL EQUITY FUNDS (Cost $333,132,003) | 431,961,261 |
Fixed-Income Funds - 26.5% |
| Shares | | Value |
Fidelity Floating Rate High Income Fund | 1,327,121 | | $ 13,019,061 |
Fidelity Focused High Income Fund | 564,316 | | 5,191,705 |
Fidelity High Income Fund | 1,417,703 | | 12,830,216 |
Fidelity New Markets Income Fund | 221,876 | | 3,532,266 |
Fidelity Real Estate Income Fund | 199,691 | | 2,142,684 |
Spartan U.S. Bond Index Fund Investor Class | 10,783,606 | | 123,472,286 |
TOTAL FIXED-INCOME FUNDS (Cost $152,573,325) | 160,188,218 |
Money Market Funds - 1.9% |
| | | |
Fidelity Institutional Prime Money Market Portfolio Class I
(Cost $11,599,661) | 11,599,661 | 11,599,661 |
TOTAL INVESTMENT PORTFOLIO - 100.0% (Cost $497,304,989) | 603,749,140 |
NET OTHER ASSETS (LIABILITIES) - 0.0% | (99,036) |
NET ASSETS - 100% | $ 603,650,104 |
Legend |
(a) Non-income producing |
Other Information |
All investments are categorized as Level 1 under the Fair Value Hierarchy. The inputs or methodology used for valuing securities may not be an indication of the risk associated with investing in those securities. For more information on valuation inputs, please refer to the Security Valuation section in the accompanying Notes to Financial Statements. |
Income Tax Information |
At December 31, 2010, the Fund had a capital loss carryforward of approximately $134,264,039 of which $51,658,945 and $82,605,094 will expire in fiscal 2016 and 2017, respectively. Capital loss carryforwards are only available to offset future capital gains of the Fund to the extent provided by regulations and may be limited. |
See accompanying notes which are an integral part of the financial statements.
Semiannual Report
VIP FundsManager 70% Portfolio
Statement of Assets and Liabilities
| June 30, 2011 (Unaudited) |
| | |
Assets | | |
Investment in securities, at value (cost $497,304,989) - See accompanying schedule | | $ 603,749,140 |
Receivable for investments sold | | 12 |
Receivable for fund shares sold | | 552,942 |
Total assets | | 604,302,094 |
| | |
Liabilities | | |
Payable to custodian bank | $ 3 | |
Payable for investments purchased | 500,260 | |
Payable for fund shares redeemed | 52,695 | |
Accrued management fee | 98,602 | |
Distribution and service plan fees payable | 430 | |
Total liabilities | | 651,990 |
| | |
Net Assets | | $ 603,650,104 |
Net Assets consist of: | | |
Paid in capital | | $ 624,055,523 |
Undistributed net investment income | | 2,327,262 |
Accumulated undistributed net realized gain (loss) on investments | | (129,176,832) |
Net unrealized appreciation (depreciation) on investments | | 106,444,151 |
Net Assets | | $ 603,650,104 |
Statement of Assets and Liabilities - continued
| June 30, 2011 (Unaudited) |
| | |
| | |
Service Class:
Net Asset Value, offering price and redemption price per share ($70,273 ÷ 7,088 shares) | | $ 9.91 |
| | |
Service Class 2:
Net Asset Value, offering price and redemption price per share ($3,582,273 ÷ 362,253 shares) | | $ 9.89 |
| | |
Investor Class:
Net Asset Value, offering price and redemption price per share ($599,997,558 ÷ 60,533,532 shares) | | $ 9.91 |
See accompanying notes which are an integral part of the financial statements.
Semiannual Report
Statement of Operations
Six months ended June 30, 2011 (Unaudited) |
| | |
Investment Income | | |
Income distributions from underlying funds | | $ 2,908,613 |
| | |
Expenses | | |
Management fee | $ 722,732 | |
Distribution and service plan fees | 4,069 | |
Independent trustees' compensation | 1,012 | |
Total expenses before reductions | 727,813 | |
Expense reductions | (146,462) | 581,351 |
Net investment income (loss) | | 2,327,262 |
Realized and Unrealized Gain (Loss) Realized gain (loss) on sale of underlying fund shares | 3,516,226 | |
Capital gain distributions from underlying funds | 2,083,063 | |
Total net realized gain (loss) | | 5,599,289 |
Change in net unrealized appreciation (depreciation) on underlying funds | | 17,148,078 |
Net gain (loss) | | 22,747,367 |
Net increase (decrease) in net assets resulting from operations | | $ 25,074,629 |
Statement of Changes in Net Assets
| Six months ended June 30, 2011 (Unaudited) | Year ended
December 31, 2010 |
Increase (Decrease) in Net Assets | | |
Operations | | |
Net investment income (loss) | $ 2,327,262 | $ 7,119,509 |
Net realized gain (loss) | 5,599,289 | 3,973,021 |
Change in net unrealized appreciation (depreciation) | 17,148,078 | 54,824,547 |
Net increase (decrease) in net assets resulting from operations | 25,074,629 | 65,917,077 |
Distributions to shareholders from net investment income | - | (7,108,246) |
Distributions to shareholders from net realized gain | - | (1,063,881) |
Total distributions | - | (8,172,127) |
Share transactions - net increase (decrease) | 39,005,146 | 34,612,388 |
Total increase (decrease) in net assets | 64,079,775 | 92,357,338 |
| | |
Net Assets | | |
Beginning of period | 539,570,329 | 447,212,991 |
End of period (including undistributed net investment income of $2,327,262 and undistributed net investment income of $0, respectively) | $ 603,650,104 | $ 539,570,329 |
See accompanying notes which are an integral part of the financial statements.
Semiannual Report
Financial Highlights - Service Class
| Six months ended June 30, 2011 | Years ended December 31, |
| (Unaudited) | 2010 | 2009 | 2008 | 2007 | 2006 G |
Selected Per-Share Data | | | | | | |
Net asset value, beginning of period | $ 9.48 | $ 8.42 | $ 6.87 | $ 10.65 | $ 10.64 | $ 10.00 |
Income from Investment Operations | | | | | | |
Net investment income (loss) E | .04 | .13 | .13 | .18 | .24 | .21 |
Net realized and unrealized gain (loss) | .39 | 1.08 | 1.55 | (3.53) | .58 | .65 |
Total from investment operations | .43 | 1.21 | 1.68 | (3.35) | .82 | .86 |
Distributions from net investment income | - | (.13) | (.12) | (.18) | (.18) | (.11) |
Distributions from net realized gain | - | (.02) | (.01) | (.25) | (.63) | (.11) |
Total distributions | - | (.15) | (.13) | (.43) I | (.81) | (.22) |
Net asset value, end of period | $ 9.91 | $ 9.48 | $ 8.42 | $ 6.87 | $ 10.65 | $ 10.64 |
Total Return B,C,D | 4.54% | 14.32% | 24.44% | (32.03)% | 7.80% | 8.56% |
Ratios to Average Net Assets F,H | | | | | | |
Expenses before reductions | .35% A | .35% | .35% | .35% | .35% | .35% A |
Expenses net of fee waivers, if any | .20% A | .20% | .20% | .20% | .20% | .20% A |
Expenses net of all reductions | .20% A | .20% | .20% | .20% | .20% | .20% A |
Net investment income (loss) | .80% A | 1.49% | 1.73% | 2.01% | 2.14% | 2.87% A |
Supplemental Data | | | | | | |
Net assets, end of period (000 omitted) | $ 70 | $ 67 | $ 68 | $ 68 | $ 117 | $ 109 |
Portfolio turnover rate | 15% A | 22% | 55% | 84% | 105% | 106% A |
A Annualized
B Total returns for periods of less than one year are not annualized.
C Total returns do not reflect charges attributable to your insurance company's separate account. Inclusion of these charges would reduce the total returns shown.
D Total returns would have been lower if certain expenses had not been reduced during the applicable periods shown.
E Calculated based on average shares outstanding during the period.
F Amounts do not include the activity of the underlying funds.
G For the period April 13, 2006 (commencement of operations) to December 31, 2006.
H Expense ratios reflect operating expenses of the class. Expenses before reductions do not reflect amounts reimbursed by the investment adviser or reductions from expense offset arrangements and do not represent the amount paid by the class during periods when reimbursements or reductions occur. Expenses net of fee waivers reflect expenses after reimbursement by the investment adviser but prior to reductions from expense offset arrangements. Expenses net of all reductions represent the net expenses paid by the class but do not include expenses of the investment companies in which the Fund invests.
I Total distributions of $.43 per share is comprised of distributions from net investment income of $.184 and distributions from net realized gain of $.245 per share.
Financial Highlights - Service Class 2
| Six months ended June 30, 2011 | Years ended December 31, |
| (Unaudited) | 2010 | 2009 | 2008 | 2007 | 2006 G |
Selected Per-Share Data | | | | | | |
Net asset value, beginning of period | $ 9.46 | $ 8.41 | $ 6.86 | $ 10.65 | $ 10.64 | $ 10.00 |
Income from Investment Operations | | | | | | |
Net investment income (loss) E | .03 | .12 | .12 | .16 | .22 | .20 |
Net realized and unrealized gain (loss) | .40 | 1.07 | 1.55 | (3.53) | .59 | .65 |
Total from investment operations | .43 | 1.19 | 1.67 | (3.37) | .81 | .85 |
Distributions from net investment income | - | (.12) | (.11) | (.18) | (.17) | (.10) |
Distributions from net realized gain | - | (.02) | (.01) | (.25) | (.63) | (.11) |
Total distributions | - | (.14) | (.12) | (.42) I | (.80) | (.21) |
Net asset value, end of period | $ 9.89 | $ 9.46 | $ 8.41 | $ 6.86 | $ 10.65 | $ 10.64 |
Total Return B,C,D | 4.55% | 14.09% | 24.38% | (32.18)% | 7.63% | 8.45% |
Ratios to Average Net Assets F,H | | | | | | |
Expenses before reductions | .50% A | .50% | .50% | .50% | .50% | .50% A |
Expenses net of fee waivers, if any | .35% A | .35% | .35% | .35% | .35% | .35% A |
Expenses net of all reductions | .35% A | .35% | .35% | .35% | .35% | .35% A |
Net investment income (loss) | .65% A | 1.34% | 1.58% | 1.86% | 1.99% | 2.72% A |
Supplemental Data | | | | | | |
Net assets, end of period (000 omitted) | $ 3,582 | $ 2,586 | $ 1,464 | $ 223 | $ 117 | $ 108 |
Portfolio turnover rate | 15% A | 22% | 55% | 84% | 105% | 106% A |
A Annualized
B Total returns for periods of less than one year are not annualized.
C Total returns do not reflect charges attributable to your insurance company's separate account. Inclusion of these charges would reduce the total returns shown.
D Total returns would have been lower if certain expenses had not been reduced during the applicable periods shown.
E Calculated based on average shares outstanding during the period.
F Amounts do not include the activity of the underlying funds.
G For the period April 13, 2006 (commencement of operations) to December 31, 2006.
H Expense ratios reflect operating expenses of the class. Expenses before reductions do not reflect amounts reimbursed by the investment adviser or reductions from expense offset arrangements and do not represent the amount paid by the class during periods when reimbursements or reductions occur. Expenses net of fee waivers reflect expenses after reimbursement by the investment adviser but prior to reductions from expense offset arrangements. Expenses net of all reductions represent the net expenses paid by the class but do not include expenses of the investment companies in which the Fund invests.
I Total distributions of $.42 per share is comprised of distributions from net investment income of $.178 and distributions from net realized gain of $.245 per share.
See accompanying notes which are an integral part of the financial statements.
Semiannual Report
Financial Highlights - Investor Class
| Six months ended June 30, 2011 | Years ended December 31, |
| (Unaudited) | 2010 | 2009 | 2008 | 2007 | 2006 G |
Selected Per-Share Data | | | | | | |
Net asset value, beginning of period | $ 9.48 | $ 8.42 | $ 6.87 | $ 10.65 | $ 10.64 | $ 10.00 |
Income from Investment Operations | | | | | | |
Net investment income (loss) E | .04 | .13 | .13 | .18 | .24 | .21 |
Net realized and unrealized gain (loss) | .39 | 1.08 | 1.55 | (3.53) | .58 | .65 |
Total from investment operations | .43 | 1.21 | 1.68 | (3.35) | .82 | .86 |
Distributions from net investment income | - | (.13) | (.12) | (.18) | (.18) | (.11) |
Distributions from net realized gain | - | (.02) | (.01) | (.25) | (.63) | (.11) |
Total distributions | - | (.15) | (.13) | (.43) I | (.81) | (.22) |
Net asset value, end of period | $ 9.91 | $ 9.48 | $ 8.42 | $ 6.87 | $ 10.65 | $ 10.64 |
Total Return B,C,D | 4.54% | 14.32% | 24.44% | (32.03)% | 7.80% | 8.56% |
Ratios to Average Net Assets F,H | | | | | | |
Expenses before reductions | .25% A | .25% | .25% | .25% | .25% | .25% A |
Expenses net of fee waivers, if any | .20% A | .20% | .20% | .20% | .20% | .20% A |
Expenses net of all reductions | .20% A | .20% | .20% | .20% | .20% | .20% A |
Net investment income (loss) | .80% A | 1.49% | 1.73% | 2.01% | 2.14% | 2.86% A |
Supplemental Data | | | | | | |
Net assets, end of period (000 omitted) | $ 599,998 | $ 536,918 | $ 445,681 | $ 321,938 | $ 444,467 | $ 177,978 |
Portfolio turnover rate | 15% A | 22% | 55% | 84% | 105% | 106% A |
A Annualized
B Total returns for periods of less than one year are not annualized.
C Total returns do not reflect charges attributable to your insurance company's separate account. Inclusion of these charges would reduce the total returns shown.
D Total returns would have been lower if certain expenses had not been reduced during the applicable periods shown.
E Calculated based on average shares outstanding during the period.
F Amounts do not include the activity of the underlying funds.
G For the period April 13, 2006 (commencement of operations) to December 31, 2006.
H Expense ratios reflect operating expenses of the class. Expenses before reductions do not reflect amounts reimbursed by the investment adviser or reductions from expense offset arrangements and do not represent the amount paid by the class during periods when reimbursements or reductions occur. Expenses net of fee waivers reflect expenses after reimbursement by the investment adviser but prior to reductions from expense offset arrangements. Expenses net of all reductions represent the net expenses paid by the class but do not include expenses of the investment companies in which the Fund invests.
I Total distributions of $.43 per share is comprised of distributions from net investment income of $.184 and distributions from net realized gain of $.245 per share.
See accompanying notes which are an integral part of the financial statements.
Semiannual Report
VIP FundsManager 85% Portfolio
Investment Changes (Unaudited)
Fund Holdings as of June 30, 2011 |
| % of fund's
net assets | % of fund's net assets
6 months ago |
Domestic Equity Funds | | |
Fidelity 130/30 Large Cap Fund | 0.0 * | 0.0 * |
Fidelity Air Transportation Portfolio | 0.3 | 0.4 |
Fidelity Automotive Portfolio | 0.9 | 0.3 |
Fidelity Banking Portfolio | 2.7 | 1.8 |
Fidelity Biotechnology Portfolio | 0.1 | 0.1 |
Fidelity Blue Chip Growth Fund | 0.3 | 0.3 |
Fidelity Brokerage & Investment Management Portfolio | 0.4 | 0.5 |
Fidelity Chemicals Portfolio | 1.4 | 0.7 |
Fidelity Commodity Strategy Fund | 0.0 * | 0.0 * |
Fidelity Communications Equipment Portfolio | 0.4 | 0.3 |
Fidelity Computers Portfolio | 1.6 | 2.1 |
Fidelity Construction & Housing Portfolio | 0.5 | 0.6 |
Fidelity Consumer Discretionary Portfolio | 2.2 | 2.4 |
Fidelity Consumer Finance Portfolio | 0.0 * | 0.0 |
Fidelity Consumer Staples Portfolio | 5.6 | 5.5 |
Fidelity Contrafund | 0.0 * | 0.2 |
Fidelity Defense & Aerospace Portfolio | 0.1 | 0.1 |
Fidelity Dividend Growth Fund | 0.0 * | 0.0 * |
Fidelity Electronics Portfolio | 0.3 | 0.4 |
Fidelity Energy Portfolio | 3.5 | 3.0 |
Fidelity Energy Service Portfolio | 3.3 | 3.5 |
Fidelity Environmental & Alternative Energy Portfolio | 0.3 | 0.3 |
Fidelity Equity-Income Fund | 0.0 * | 0.0 * |
Fidelity Equity-Income II Fund | 0.0 * | 0.0 * |
Fidelity Financial Services Portfolio | 1.7 | 2.1 |
Fidelity Global Commodity Stock Fund | 0.8 | 0.8 |
Fidelity Gold Portfolio | 1.0 | 1.3 |
Fidelity Growth Company Fund | 0.8 | 1.1 |
Fidelity Health Care Portfolio | 3.1 | 1.5 |
Fidelity Independence Fund | 0.0 * | 0.0 * |
Fidelity Industrial Equipment Portfolio | 1.1 | 0.8 |
Fidelity Industrials Portfolio | 3.3 | 3.6 |
Fidelity Insurance Portfolio | 3.2 | 3.0 |
Fidelity IT Services Portfolio | 0.8 | 0.8 |
Fidelity Large Cap Stock Fund | 0.2 | 0.5 |
Fidelity Large Cap Value Fund | 0.0 * | 0.1 |
Fidelity Leisure Portfolio | 0.1 | 1.4 |
|
| % of fund's
net assets | % of fund's net assets
6 months ago |
Fidelity Leveraged Company Stock Fund | 0.0 * | 0.0 * |
Fidelity Magellan Fund | 0.0 * | 0.0 * |
Fidelity Materials Portfolio | 0.2 | 0.6 |
Fidelity Medical Delivery Portfolio | 1.6 | 1.5 |
Fidelity Medical Equipment & Systems Portfolio | 0.1 | 0.1 |
Fidelity Mega Cap Stock Fund | 0.2 | 0.0 |
Fidelity Mid Cap Value Fund | 0.3 | 0.3 |
Fidelity Mid-Cap Stock Fund | 0.0 * | 0.0 * |
Fidelity Multimedia Portfolio | 1.3 | 0.8 |
Fidelity Nasdaq Composite Index Fund | 0.0 * | 0.2 |
Fidelity Natural Resources Portfolio | 0.1 | 0.1 |
Fidelity Pharmaceuticals Portfolio | 2.7 | 2.7 |
Fidelity Real Estate Investment Portfolio | 0.3 | 0.3 |
Fidelity Retailing Portfolio | 0.7 | 1.0 |
Fidelity Small Cap Growth Fund | 0.5 | 0.5 |
Fidelity Small Cap Stock Fund | 0.0 * | 0.0 * |
Fidelity Small Cap Value Fund | 0.7 | 0.8 |
Fidelity Software & Computer Services Portfolio | 0.3 | 0.3 |
Fidelity Technology Portfolio | 6.1 | 6.4 |
Fidelity Telecom and Utilities Fund | 1.8 | 1.7 |
Fidelity Telecommunications Portfolio | 1.5 | 1.6 |
Fidelity Transportation Portfolio | 0.7 | 1.2 |
Fidelity Utilities Portfolio | 0.9 | 0.7 |
Fidelity Value Discovery Fund | 0.0 * | 0.0 * |
Spartan 500 Index Fund Investor Class | 1.3 | 2.1 |
Spartan Extended Market Index Fund Investor Class | 0.0 * | 0.0 * |
Spartan Total Market Index Fund Investor Class | 1.0 | 1.0 |
VIP Mid Cap Portfolio Investor Class | 0.3 | 0.4 |
| 62.6 | 63.8 |
International Equity Funds | | |
Fidelity Canada Fund | 0.9 | 1.0 |
Fidelity China Region Fund | 0.1 | 0.1 |
Fidelity Diversified International Fund | 0.8 | 2.6 |
Fidelity Emerging Asia Fund | 1.1 | 0.0 * |
Fidelity Emerging Markets Fund | 0.6 | 2.5 |
Fidelity International Capital Appreciation Fund | 1.1 | 1.3 |
Fund Holdings as of June 30, 2011 |
| % of fund's
net assets | % of fund's net assets
6 months ago |
Fidelity International Discovery Fund | 2.8 | 1.0 |
Fidelity International Real Estate Fund | 0.0 * | 0.4 |
Fidelity International Small Cap Fund | 0.3 | 0.3 |
Fidelity International Small Cap Opportunities Fund | 0.8 | 1.1 |
Fidelity International Value Fund | 1.3 | 0.0 * |
Fidelity Japan Fund | 0.3 | 0.4 |
Fidelity Japan Smaller Companies Fund | 1.4 | 0.7 |
Fidelity Nordic Fund | 1.0 | 3.4 |
Fidelity Overseas Fund | 0.0 * | 0.0 * |
Fidelity Pacific Basin Fund | 2.5 | 0.8 |
Spartan International Index Fund Investor Class | 9.3 | 9.9 |
| 24.3 | 25.5 |
Fixed-Income Funds | | |
Fidelity Floating Rate High Income Fund | 0.5 | 0.6 |
Fidelity Focused High Income Fund | 0.4 | 0.2 |
Fidelity High Income Fund | 2.7 | 1.1 |
Fidelity New Markets Income Fund | 0.2 | 1.0 |
Fidelity Real Estate Income Fund | 0.1 | 0.1 |
Spartan U.S. Bond Index Fund Investor Class | 9.1 | 7.5 |
| 13.0 | 10.5 |
Money Market Funds | | |
Fidelity Institutional Prime Money Market Portfolio Class I | 0.1 | 0.2 |
Net Other Assets (Liabilities)* | 0.0 | 0.0 |
| 100.0 | 100.0 |
* Amount represents less than 0.1%
Asset Allocation (% of fund's net assets) |
As of June 30, 2011 |
| Domestic Equity Funds | 62.6% | |
| International Equity Funds | 24.3% | |
| Fixed Income Funds | 13.0% | |
| Money Market Funds | 0.1% | |

As of December 31, 2010 |
| Domestic Equity Funds | 63.8% | |
| International Equity Funds | 25.5% | |
| Fixed Income Funds | 10.5% | |
| Money Market Funds | 0.2% | |

Semiannual Report
VIP FundsManager 85% Portfolio
Investments June 30, 2011 (Unaudited)
Showing Percentage of Net Assets
Equity Funds - 86.9% |
| Shares | | Value |
Domestic Equity Funds - 62.6% |
Fidelity 130/30 Large Cap Fund (a) | 6,351 | | $ 49,535 |
Fidelity Air Transportation Portfolio | 17,916 | | 715,209 |
Fidelity Automotive Portfolio | 54,910 | | 2,437,982 |
Fidelity Banking Portfolio (a) | 397,718 | | 6,972,002 |
Fidelity Biotechnology Portfolio (a) | 1,803 | | 155,891 |
Fidelity Blue Chip Growth Fund | 15,659 | | 754,898 |
Fidelity Brokerage & Investment Management Portfolio | 21,900 | | 1,067,621 |
Fidelity Chemicals Portfolio | 32,606 | | 3,497,339 |
Fidelity Commodity Strategy Fund (a) | 958 | | 11,017 |
Fidelity Communications Equipment Portfolio (a) | 36,081 | | 991,876 |
Fidelity Computers Portfolio (a) | 67,337 | | 4,002,513 |
Fidelity Construction & Housing Portfolio | 37,865 | | 1,359,716 |
Fidelity Consumer Discretionary Portfolio | 231,283 | | 5,680,316 |
Fidelity Consumer Finance Portfolio | 8,994 | | 109,457 |
Fidelity Consumer Staples Portfolio | 202,223 | | 14,602,537 |
Fidelity Contrafund | 890 | | 62,849 |
Fidelity Defense & Aerospace Portfolio | 4,339 | | 358,822 |
Fidelity Dividend Growth Fund | 2,795 | | 82,735 |
Fidelity Electronics Portfolio | 17,635 | | 885,812 |
Fidelity Energy Portfolio | 154,910 | | 8,944,478 |
Fidelity Energy Service Portfolio (a) | 104,782 | | 8,652,883 |
Fidelity Environmental & Alternative Energy Portfolio | 32,773 | | 634,815 |
Fidelity Equity-Income Fund | 980 | | 45,322 |
Fidelity Equity-Income II Fund | 1,205 | | 23,007 |
Fidelity Financial Services Portfolio | 74,160 | | 4,325,004 |
Fidelity Global Commodity Stock Fund | 124,393 | | 2,140,795 |
Fidelity Gold Portfolio | 56,991 | | 2,666,601 |
Fidelity Growth Company Fund | 22,638 | | 2,074,279 |
Fidelity Health Care Portfolio | 56,749 | | 8,148,653 |
Fidelity Independence Fund (a) | 420 | | 10,790 |
Fidelity Industrial Equipment Portfolio | 81,225 | | 2,876,999 |
Fidelity Industrials Portfolio | 341,844 | | 8,508,486 |
Fidelity Insurance Portfolio | 172,376 | | 8,229,224 |
Fidelity IT Services Portfolio | 88,651 | | 2,007,949 |
Fidelity Large Cap Stock Fund | 32,349 | | 592,305 |
Fidelity Large Cap Value Fund | 9,081 | | 101,071 |
Fidelity Leisure Portfolio | 1,601 | | 155,301 |
Fidelity Leveraged Company Stock Fund | 3,068 | | 92,300 |
Fidelity Magellan Fund | 852 | | 62,129 |
Fidelity Materials Portfolio | 6,696 | | 479,503 |
Fidelity Medical Delivery Portfolio (a) | 68,485 | | 4,087,875 |
Fidelity Medical Equipment & Systems Portfolio | 8,135 | | 252,197 |
Fidelity Mega Cap Stock Fund | 36,085 | | 376,366 |
Fidelity Mid Cap Value Fund | 40,474 | | 683,609 |
Fidelity Mid-Cap Stock Fund | 2,550 | | 74,608 |
Fidelity Multimedia Portfolio | 69,828 | | 3,346,182 |
Fidelity Nasdaq Composite Index Fund | 885 | | 32,656 |
Fidelity Natural Resources Portfolio | 8,549 | | 319,396 |
Fidelity Pharmaceuticals Portfolio | 499,577 | | 6,919,147 |
|
| Shares | | Value |
Fidelity Real Estate Investment Portfolio | 24,004 | | $ 678,365 |
Fidelity Retailing Portfolio | 31,208 | | 1,694,580 |
Fidelity Small Cap Growth Fund | 70,400 | | 1,203,139 |
Fidelity Small Cap Stock Fund | 3,373 | | 68,674 |
Fidelity Small Cap Value Fund | 115,793 | | 1,854,997 |
Fidelity Software & Computer Services Portfolio | 8,174 | | 712,163 |
Fidelity Technology Portfolio (a) | 160,093 | | 15,761,147 |
Fidelity Telecom and Utilities Fund | 273,528 | | 4,770,327 |
Fidelity Telecommunications Portfolio | 78,762 | | 3,972,750 |
Fidelity Transportation Portfolio | 29,350 | | 1,671,474 |
Fidelity Utilities Portfolio | 45,879 | | 2,416,912 |
Fidelity Value Discovery Fund | 582 | | 9,001 |
Spartan 500 Index Fund Investor Class | 69,648 | | 3,270,681 |
Spartan Extended Market Index Fund Investor Class | 186 | | 7,495 |
Spartan Total Market Index Fund Investor Class | 64,082 | | 2,474,210 |
VIP Mid Cap Portfolio Investor Class | 26,971 | | 887,079 |
TOTAL DOMESTIC EQUITY FUNDS | | 162,115,051 |
International Equity Funds - 24.3% |
Fidelity Canada Fund | 38,580 | | 2,306,311 |
Fidelity China Region Fund | 4,967 | | 158,445 |
Fidelity Diversified International Fund | 66,230 | | 2,062,404 |
Fidelity Emerging Asia Fund | 92,255 | | 2,896,816 |
Fidelity Emerging Markets Fund | 60,782 | | 1,597,960 |
Fidelity International Capital Appreciation Fund | 221,152 | | 2,959,019 |
Fidelity International Discovery Fund | 215,070 | | 7,284,435 |
Fidelity International Real Estate Fund | 13,844 | | 129,160 |
Fidelity International Small Cap Fund | 35,211 | | 788,028 |
Fidelity International Small Cap Opportunities Fund | 179,788 | | 1,943,505 |
Fidelity International Value Fund | 397,985 | | 3,394,816 |
Fidelity Japan Fund | 81,595 | | 855,932 |
Fidelity Japan Smaller Companies Fund | 391,655 | | 3,595,391 |
Fidelity Nordic Fund | 74,814 | | 2,658,885 |
Fidelity Overseas Fund | 326 | | 11,104 |
Fidelity Pacific Basin Fund | 242,717 | | 6,371,312 |
Spartan International Index Fund Investor Class | 650,317 | | 24,035,732 |
TOTAL INTERNATIONAL EQUITY FUNDS | | 63,049,255 |
TOTAL EQUITY FUNDS (Cost $177,501,010) | 225,164,306 |
Fixed-Income Funds - 13.0% |
| | | |
Fidelity Floating Rate High Income Fund | 128,320 | | 1,258,823 |
Fidelity Focused High Income Fund | 100,834 | | 927,672 |
Fidelity High Income Fund | 784,935 | | 7,103,661 |
Fidelity New Markets Income Fund | 34,551 | | 550,048 |
Fixed-Income Funds - continued |
| Shares | | Value |
Fidelity Real Estate Income Fund | 27,261 | | $ 292,510 |
Spartan U.S. Bond Index Fund Investor Class | 2,067,085 | | 23,668,129 |
TOTAL FIXED-INCOME FUNDS (Cost $32,291,957) | 33,800,843 |
Money Market Funds - 0.1% |
| | | |
Fidelity Institutional Prime Money Market Portfolio Class I
(Cost $262,921) | 262,921 | | 262,921 |
TOTAL INVESTMENT PORTFOLIO - 100.0% (Cost $210,055,888) | 259,228,070 |
NET OTHER ASSETS (LIABILITIES) - 0.0% | (42,576) |
NET ASSETS - 100% | $ 259,185,494 |
Legend |
(a) Non-income producing |
Other Information |
All investments are categorized as Level 1 under the Fair Value Hierarchy. The inputs or methodology used for valuing securities may not be an indication of the risk associated with investing in those securities. For more information on valuation inputs, please refer to the Security Valuation section in the accompanying Notes to Financial Statements. |
Income Tax Information |
At December 31, 2010, the Fund had a capital loss carryforward of approximately $63,847,958 of which $19,300,049 and $44,547,909 will expire in fiscal 2016 and 2017, respectively. Capital loss carryforwards are only available to offset future capital gains of the Fund to the extent provided by regulations and may be limited. |
See accompanying notes which are an integral part of the financial statements.
Semiannual Report
VIP FundsManager 85% Portfolio
Statement of Assets and Liabilities
| June 30, 2011 (Unaudited) |
| | |
Assets | | |
Investment in securities, at value (cost $210,055,888) - See accompanying schedule | | $ 259,228,070 |
Cash | | 9 |
Receivable for investments sold | | 111,017 |
Receivable for fund shares sold | | 1,585 |
Total assets | | 259,340,681 |
| | |
Liabilities | | |
Payable for investments purchased | $ 1,395 | |
Payable for fund shares redeemed | 111,207 | |
Accrued management fee | 42,141 | |
Distribution and service plan fees payable | 444 | |
Total liabilities | | 155,187 |
| | |
Net Assets | | $ 259,185,494 |
Net Assets consist of: | | |
Paid in capital | | $ 269,294,286 |
Undistributed net investment income | | 503,924 |
Accumulated undistributed net realized gain (loss) on investments | | (59,784,898) |
Net unrealized appreciation (depreciation) on investments | | 49,172,182 |
Net Assets | | $ 259,185,494 |
Statement of Assets and Liabilities - continued
| June 30, 2011 (Unaudited) |
| | |
Service Class:
Net Asset Value, offering price and redemption price per share ($120,155 ÷ 12,527 shares) | | $ 9.59 |
| | |
Service Class 2:
Net Asset Value, offering price and redemption price per share ($3,676,586 ÷ 384,480 shares) | | $ 9.56 |
| | |
Investor Class:
Net Asset Value, offering price and redemption price per share ($255,388,753 ÷ 26,609,465 shares) | | $ 9.60 |
See accompanying notes which are an integral part of the financial statements.
Semiannual Report
VIP FundsManager 85% Portfolio
Financial Statements - continued
Statement of Operations
Six months ended June 30, 2011 (Unaudited) |
| | |
Investment Income | | |
Income distributions from underlying funds | | $ 756,739 |
| | |
Expenses | | |
Management fee | $ 312,479 | |
Distribution and service plan fees | 4,247 | |
Independent trustees' compensation | 435 | |
Total expenses before reductions | 317,161 | |
Expense reductions | (64,346) | 252,815 |
Net investment income (loss) | | 503,924 |
Realized and Unrealized Gain (Loss) Realized gain (loss) on sale of underlying fund shares | 3,256,311 | |
Capital gain distributions from underlying funds | 1,037,688 | |
Total net realized gain (loss) | | 4,293,999 |
Change in net unrealized appreciation (depreciation) on underlying funds | | 5,302,239 |
Net gain (loss) | | 9,596,238 |
Net increase (decrease) in net assets resulting from operations | | $ 10,100,162 |
Statement of Changes in Net Assets
| Six months ended June 30, 2011 (Unaudited) | Year ended December 31, 2010 |
Increase (Decrease) in Net Assets | | |
Operations | | |
Net investment income (loss) | $ 503,924 | $ 2,331,238 |
Net realized gain (loss) | 4,293,999 | 5,356,074 |
Change in net unrealized appreciation (depreciation) | 5,302,239 | 21,545,551 |
Net increase (decrease) in net assets resulting from operations | 10,100,162 | 29,232,863 |
Distributions to shareholders from net investment income | - | (2,346,549) |
Distributions to shareholders from net realized gain | - | (529,855) |
Total distributions | - | (2,876,404) |
Share transactions - net increase (decrease) | 21,368,263 | 19,899,359 |
Total increase (decrease) in net assets | 31,468,425 | 46,255,818 |
| | |
Net Assets | | |
Beginning of period | 227,717,069 | 181,461,251 |
End of period (including undistributed net investment income of $503,924 and undistributed net investment income of $0, respectively) | $ 259,185,494 | $ 227,717,069 |
See accompanying notes which are an integral part of the financial statements.
Semiannual Report
Financial Highlights - Service Class
| Six months ended June 30, 2011 | Years ended December 31, |
| (Unaudited) | 2010 | 2009 | 2008 | 2007 | 2006 G |
Selected Per-Share Data | | | | | | |
Net asset value, beginning of period | $ 9.19 | $ 8.02 | $ 6.32 | $ 10.76 | $ 10.72 | $ 10.00 |
Income from Investment Operations | | | | | | |
Net investment income (loss) E | .02 | .10 | .11 | .13 | .17 | .17 |
Net realized and unrealized gain (loss) | .38 | 1.19 | 1.70 | (4.14) | .74 | .74 |
Total from investment operations | .40 | 1.29 | 1.81 | (4.01) | .91 | .91 |
Distributions from net investment income | - | (.10) | (.10) | (.13) | (.13) | (.08) |
Distributions from net realized gain | - | (.02) | (.01) | (.30) | (.74) | (.11) |
Total distributions | - | (.12) | (.11) | (.43) I | (.87) | (.19) |
Net asset value, end of period | $ 9.59 | $ 9.19 | $ 8.02 | $ 6.32 | $ 10.76 | $ 10.72 |
Total Return B,C,D | 4.35% | 16.07% | 28.56% | (38.14)% | 8.52% | 9.09% |
Ratios to Average Net Assets F,H | | | | | | |
Expenses before reductions | .35% A | .35% | .35% | .35% | .35% | .35% A |
Expenses net of fee waivers, if any | .20% A | .20% | .20% | .20% | .20% | .20% A |
Expenses net of all reductions | .20% A | .20% | .20% | .20% | .20% | .20% A |
Net investment income (loss) | .40% A | 1.20% | 1.53% | 1.52% | 1.48% | 2.33% A |
Supplemental Data | | | | | | |
Net assets, end of period (000 omitted) | $ 120 | $ 108 | $ 112 | $ 62 | $ 118 | $ 109 |
Portfolio turnover rate | 29% A | 38% | 66% | 92% | 104% | 111% A |
A Annualized
B Total returns for periods of less than one year are not annualized.
C Total returns do not reflect charges attributable to your insurance company's separate account. Inclusion of these charges would reduce the total returns shown.
D Total returns would have been lower if certain expenses had not been reduced during the applicable periods shown.
E Calculated based on average shares outstanding during the period.
F Amounts do not include the activity of the underlying funds.
G For the period April 13, 2006 (commencement of operations) to December 31, 2006.
H Expense ratios reflect operating expenses of the class. Expenses before reductions do not reflect amounts reimbursed by the investment adviser or reductions from expense offset arrangements and do not represent the amount paid by the class during periods when reimbursements or reductions occur. Expenses net of fee waivers reflect expenses after reimbursement by the investment adviser but prior to reductions from expense offset arrangements. Expenses net of all reductions represent the net expenses paid by the class but do not include expenses of the investment companies in which the Fund invests.
I Total distributions of $.43 per share is comprised of distributions from net investment income of $.126 and distributions from net realized gain of $.300 per share.
Financial Highlights - Service Class 2
| Six months ended June 30, 2011 | Years ended December 31, |
| (Unaudited) | 2010 | 2009 | 2008 | 2007 | 2006 G |
Selected Per-Share Data | | | | | | |
Net asset value, beginning of period | $ 9.17 | $ 8.00 | $ 6.32 | $ 10.76 | $ 10.72 | $ 10.00 |
Income from Investment Operations | | | | | | |
Net investment income (loss) E | .01 | .09 | .10 | .11 | .15 | .16 |
Net realized and unrealized gain (loss) | .38 | 1.19 | 1.68 | (4.13) | .74 | .74 |
Total from investment operations | .39 | 1.28 | 1.78 | (4.02) | .89 | .90 |
Distributions from net investment income | - | (.09) | (.09) | (.12) | (.11) | (.07) |
Distributions from net realized gain | - | (.02) | (.01) | (.30) | (.74) | (.11) |
Total distributions | - | (.11) | (.10) | (.42) I | (.85) | (.18) |
Net asset value, end of period | $ 9.56 | $ 9.17 | $ 8.00 | $ 6.32 | $ 10.76 | $ 10.72 |
Total Return B,C,D | 4.25% | 16.00% | 28.17% | (38.19)% | 8.36% | 8.99% |
Ratios to Average Net Assets F,H | | | | | | |
Expenses before reductions | .50% A | .50% | .50% | .50% | .50% | .50% A |
Expenses net of fee waivers, if any | .35% A | .35% | .35% | .35% | .35% | .35% A |
Expenses net of all reductions | .35% A | .35% | .35% | .35% | .35% | .35% A |
Net investment income (loss) | .25% A | 1.05% | 1.38% | 1.37% | 1.33% | 2.17% A |
Supplemental Data | | | | | | |
Net assets, end of period (000 omitted) | $ 3,677 | $ 2,384 | $ 886 | $ 254 | $ 118 | $ 109 |
Portfolio turnover rate | 29% A | 38% | 66% | 92% | 104% | 111% A |
A Annualized
B Total returns for periods of less than one year are not annualized.
C Total returns do not reflect charges attributable to your insurance company's separate account. Inclusion of these charges would reduce the total returns shown.
D Total returns would have been lower if certain expenses had not been reduced during the applicable periods shown.
E Calculated based on average shares outstanding during the period.
F Amounts do not include the activity of the underlying funds.
G For the period April 13, 2006 (commencement of operations) to December 31, 2006.
H Expense ratios reflect operating expenses of the class. Expenses before reductions do not reflect amounts reimbursed by the investment adviser or reductions from expense offset arrangements and do not represent the amount paid by the class during periods when reimbursements or reductions occur. Expenses net of fee waivers reflect expenses after reimbursement by the investment adviser but prior to reductions from expense offset arrangements. Expenses net of all reductions represent the net expenses paid by the class but do not include expenses of the investment companies in which the Fund invests.
I Total distributions of $.42 per share is comprised of distributions from net investment income of $.121 and distributions from net realized gain of $.300 per share.
See accompanying notes which are an integral part of the financial statements.
Semiannual Report
Financial Highlights - Investor Class
| Six months ended June 30, 2011 | Years ended December 31, |
| (Unaudited) | 2010 | 2009 | 2008 | 2007 | 2006 G |
Selected Per-Share Data | | | | | | |
Net asset value, beginning of period | $ 9.20 | $ 8.02 | $ 6.32 | $ 10.77 | $ 10.72 | $ 10.00 |
Income from Investment Operations | | | | | | |
Net investment income (loss) E | .02 | .10 | .11 | .13 | .17 | .17 |
Net realized and unrealized gain (loss) | .38 | 1.20 | 1.70 | (4.15) | .75 | .74 |
Total from investment operations | .40 | 1.30 | 1.81 | (4.02) | .92 | .91 |
Distributions from net investment income | - | (.10) | (.10) | (.13) | (.13) | (.08) |
Distributions from net realized gain | - | (.02) | (.01) | (.30) | (.74) | (.11) |
Total distributions | - | (.12) | (.11) | (.43) I | (.87) | (.19) |
Net asset value, end of period | $ 9.60 | $ 9.20 | $ 8.02 | $ 6.32 | $ 10.77 | $ 10.72 |
Total Return B,C,D | 4.35% | 16.20% | 28.56% | (38.20)% | 8.63% | 9.09% |
Ratios to Average Net Assets F,H | | | | | | |
Expenses before reductions | .25% A | .25% | .25% | .25% | .25% | .25% A |
Expenses net of fee waivers, if any | .20% A | .20% | .20% | .20% | .20% | .20% A |
Expenses net of all reductions | .20% A | .20% | .20% | .20% | .20% | .20% A |
Net investment income (loss) | .40% A | 1.20% | 1.53% | 1.52% | 1.48% | 2.32% A |
Supplemental Data | | | | | | |
Net assets, end of period (000 omitted) | $ 255,389 | $ 225,225 | $ 180,463 | $ 120,650 | $ 176,456 | $ 72,095 |
Portfolio turnover rate | 29% A | 38% | 66% | 92% | 104% | 111% A |
A Annualized
B Total returns for periods of less than one year are not annualized.
C Total returns do not reflect charges attributable to your insurance company's separate account. Inclusion of these charges would reduce the total returns shown.
D Total returns would have been lower if certain expenses had not been reduced during the applicable periods shown.
E Calculated based on average shares outstanding during the period.
F Amounts do not include the activity of the underlying funds.
G For the period April 13, 2006 (commencement of operations) to December 31, 2006.
H Expense ratios reflect operating expenses of the class. Expenses before reductions do not reflect amounts reimbursed by the investment adviser or reductions from expense offset arrangements and do not represent the amount paid by the class during periods when reimbursements or reductions occur. Expenses net of fee waivers reflect expenses after reimbursement by the investment adviser but prior to reductions from expense offset arrangements. Expenses net of all reductions represent the net expenses paid by the class but do not include expenses of the investment companies in which the Fund invests.
I Total distributions of $.43 per share is comprised of distributions from net investment income of $.126 and distributions from net realized gain of $.300 per share.
See accompanying notes which are an integral part of the financial statements.
Semiannual Report
Notes to Financial Statements
For the period ended June 30, 2011 (Unaudited)
1. Organization.
VIP FundsManager 20% Portfolio, VIP FundsManager 50% Portfolio, VIP FundsManager 60% Portfolio, VIP FundsManager 70% Portfolio and VIP FundsManager 85% Portfolio(the Funds) are funds of Variable Insurance Products Fund V. Variable Insurance Products Fund V (the Trust) (referred to in this report as Fidelity Variable Insurance Products) is registered under the Investment Company Act of 1940, as amended (the 1940 Act), as an open-end management investment company organized as a Massachusetts business trust. Each Fund is authorized to issue an unlimited number of shares. The Funds invest primarily in a combination of other Fidelity equity, fixed income, and short-term funds (the Underlying Funds) managed by Fidelity Management & Research Company (FMR). Shares of each Fund may only be purchased by insurance companies for the purpose of funding variable annuity or variable life insurance contracts. Each Fund offers three classes of shares: Investor Class shares, Service Class shares and Service Class 2 shares. All classes have equal rights and voting privileges, except for matters affecting a single class. Investment income, realized and unrealized capital gains and losses, the common expenses of the Fund, and certain fund-level expense reductions, if any, are allocated on a pro-rata basis to each class based on the relative net assets of each class to the total net assets of the Fund. Each class differs with respect to distribution and service plan fees incurred. Certain expense reductions may also differ by class.
2. Significant Accounting Policies.
The financial statements have been prepared in conformity with accounting principles generally accepted in the United States of America (GAAP), which require management to make certain estimates and assumptions at the date of the financial statements. Actual results could differ from those estimates. Subsequent events, if any, through the date that the financial statements were issued have been evaluated in the preparation of the financial statements. The following summarizes the significant accounting policies of the Funds:
Security Valuation. Investments are valued as of 4:00 p.m. Eastern time on the last calendar day of the period. Each Fund categorizes the inputs to valuation techniques used to value their investments into a disclosure hierarchy consisting of three levels as shown below:
Level 1 - quoted prices in active markets for identical investments
Level 2 - other significant observable inputs (including quoted prices for similar investments, interest rates, prepayment speeds, etc.)
Level 3 - unobservable inputs (including the Fund's own assumptions based on the best information available)
Valuation techniques used to value each Fund's investments by major category are as follows. Investments in the Underlying Funds are valued at their closing net asset value (NAV) each business day and are categorized as Level 1 in the hierarchy.
Investment Transactions and Income. For financial reporting purposes, the Funds' investment holdings and NAV include trades executed through the end of the last business day of the period. The NAV per share for processing shareholder transactions is calculated as of the close of business of the New York Stock Exchange (NYSE), normally 4:00 p.m. Eastern time and includes trades executed through the end of the prior business day. Gains and losses on securities sold are determined on the basis of identified cost. Income and capital gain distributions from the Underlying Funds, if any, are recorded on the ex-dividend date.
Expenses. Expenses directly attributable to a fund are charged to that fund. Expenses attributable to more than one fund are allocated among the respective funds on the basis of relative net assets or other appropriate methods. Expenses included in the accompanying financial statements reflect the expenses of the Fund and do not include any expenses associated with the Underlying Funds. Expense estimates are accrued in the period to which they relate and adjustments are made when actual amounts are known.
Income Tax Information and Distributions to Shareholders. Each year, each Fund intends to qualify as a regulated investment company, including distributing substantially all of its taxable income and realized gains under Subchapter M of the Internal Revenue Code and filing its U.S. federal tax return. As a result, no provision for income taxes is required. A fund's federal tax return is subject to examination by the Internal Revenue Service (IRS) for a period of three years.
Distributions are declared and recorded on the ex-dividend date. Income dividends and capital gain distributions are declared separately for each class. Income and capital gain distributions are determined in accordance with income tax regulations, which may differ from GAAP.
Capital accounts within the financial statements are adjusted for permanent book-tax differences. These adjustments have no impact on net assets or the results of operations. Temporary book-tax differences will reverse in a subsequent period.
Book-tax differences are primarily due to the short-term gain distributions from the Underlying Funds, capital loss carryforwards, and losses deferred due to wash sales and excise tax regulations.
Semiannual Report
2. Significant Accounting Policies - continued
Income Tax Information and Distributions to Shareholders - continued
The federal tax cost of investment securities and unrealized appreciation (depreciation) as of period end were as follows for each Fund:
| Tax cost | Gross unrealized
appreciation | Gross unrealized
depreciation | Net unrealized appreciation (depreciation) on securities and other investments |
VIP FundsManager 20% Portfolio | $ 447,668,523 | $ 29,358,219 | $ (998,063) | $ 28,360,156 |
VIP FundsManager 50% Portfolio | 658,434,785 | 106,183,400 | (2,683,027) | 103,500,373 |
VIP FundsManager 60% Portfolio | 3,011,623,424 | 445,574,861 | (15,731,371) | 429,843,490 |
VIP FundsManager 70% Portfolio | 497,770,858 | 109,336,690 | (3,358,408) | 105,978,282 |
VIP FundsManager 85% Portfolio | 210,291,581 | 51,054,006 | (2,117,517) | 48,936,489 |
Under the recently enacted Regulated Investment Company Modernization Act of 2010 (the Act), The Funds will be permitted to carry forward capital losses incurred in taxable years beginning after December 22, 2010 for an unlimited period. However, any losses incurred during those future taxable years will be required to be utilized prior to any losses incurred in pre-enactment taxable years, which generally expire after eight years from when they are incurred. Additionally, post-enactment capital losses that are carried forward will retain their character as either short-term or long-term capital losses rather than being considered all short-term as under previous law. The Funds' first fiscal year end subject to the Act will be December 31, 2011.
3. Purchases and Sales of Investments.
Purchases and redemptions of the Underlying Fund shares are noted in the table below.
| Purchases ($) | Redemptions ($) |
VIP FundsManager 20% Portfolio | 108,587,256 | 30,353,877 |
VIP FundsManager 50% Portfolio | 119,743,963 | 49,764,765 |
VIP FundsManager 60% Portfolio | 921,678,358 | 143,368,848 |
VIP FundsManager 70% Portfolio | 88,217,471 | 44,791,590 |
VIP FundsManager 85% Portfolio | 59,720,307 | 36,805,147 |
4. Fees and Other Transactions with Affiliates.
Management Fee. Strategic Advisers, Inc. (Strategic Advisers), an affiliate of FMR, provides the funds with investment management related services. For these services each fund pays a monthly management fee to Strategic Advisers. The management fee is based on an annual rate of ..25% of each fund's average net assets. The management fee is reduced by an amount equal to the fees and expenses paid by the fund to the independent Trustees.
Strategic Advisers has contractually agreed to waive 0.05% of its management fee, thereby limiting each fund's management fee to an annual rate of 0.20% of average net assets, until April 30, 2012.
Other Transactions. Strategic Advisers has entered into an administration agreement with FMR under which FMR provides management and administrative services (other than investment advisory services) necessary for the operation of each Fund. Pursuant to this agreement, FMR pays all expenses of each Fund, excluding the distribution and service fees, the compensation of the independent Trustees and certain other expenses such as interest expense. FMR also contracts with other Fidelity companies to perform the services necessary for the operation of each Fund.
Distribution and Service Plan Fees. In accordance with Rule 12b-1 of the 1940 Act, the Funds have adopted separate 12b-1 Plans for each Service Class of shares. Each Service Class pays Fidelity Distributors Corporation (FDC), an affiliate of FMR, a service fee. For the period, the service fee is based on an annual rate of .10% of Service Class' average net assets and .25% of Service Class 2's average net assets.
For the period, total fees, all of which were reallowed to insurance companies for the distribution of shares and providing shareholder support services were as follows:
| Service
Class | Service
Class 2 | Total |
VIP FundsManager 20% Portfolio | $ 34 | $ 1,008 | $ 1,042 |
VIP FundsManager 50% Portfolio | 32 | 3,956 | 3,988 |
VIP FundsManager 60% Portfolio | 31 | 9,086 | 9,117 |
VIP FundsManager 70% Portfolio | 35 | 4,034 | 4,069 |
VIP FundsManager 85% Portfolio | 58 | 4,189 | 4,247 |
Semiannual Report
Notes to Financial Statements (Unaudited) - continued
5. Expense Reductions.
Strategic Advisers contractually agreed to limit each funds' management fee to an annual rate of 0.20% of each funds' average net assets until April 30, 2012. For the period, each fund's management fees were reduced by the following amounts:
| Management Fee Waiver |
| |
VIP FundsManager 20% Portfolio | $ 108,279 |
VIP FundsManager 50% Portfolio | 181,944 |
VIP FundsManager 60% Portfolio | 752,509 |
VIP FundsManager 70% Portfolio | 144,807 |
VIP FundsManager 85% Portfolio | 62,607 |
In addition, FMR has contractually agreed to reimburse 0.10% of class-level expenses for each fund's Service class and Service Class 2. During the period, this reimbursement reduced each fund's Service class and Service class 2's expenses by the following amounts:
| Reimbursement |
VIP FundsManager 20% Portfolio | |
Service Class | $ 34 |
Service Class 2 | 408 |
VIP FundsManager 50% Portfolio | |
Service Class | 32 |
Service Class 2 | 1,630 |
VIP FundsManager 60% Portfolio | |
Service Class | 31 |
Service Class 2 | 3,743 |
VIP FundsManager 70% Portfolio | |
Service Class | 35 |
Service Class 2 | 1,620 |
VIP FundsManager 85% Portfolio | |
Service Class | 58 |
Service Class | 1,681 |
6. Distributions to Shareholders.
Distributions to shareholders of each class were as follows:
| Six months ended
June 30, 2011 | Year ended
December 31, 2010 |
VIP FundsManager 20% Portfolio | | |
From net investment income | | |
Service Class | $ - | $ 1,048 |
Service Class 2 | - | 8,152 |
Investor Class | - | 6,075,567 |
Total | $ - | $ 6,084,767 |
From net realized gain | | |
Service Class | $ - | $ 81 |
Service Class 2 | - | 684 |
Investor Class | - | 470,133 |
Total | $ - | $ 470,898 |
Semiannual Report
6. Distributions to Shareholders - continued
| Six months ended
June 30, 2011 | Year ended
December 31, 2010 |
VIP FundsManager 50% Portfolio | | |
From net investment income | | |
Service Class | $ - | $ 939 |
Service Class 2 | - | 14,288 |
Investor Class | - | 10,252,106 |
Total | $ - | $ 10,267,333 |
From net realized gain | | |
Service Class | $ - | $ 109 |
Service Class 2 | - | 1,824 |
Investor Class | - | 1,190,567 |
Total | $ - | $ 1,192,500 |
VIP FundsManager 60% Portfolio | | |
From net investment income | | |
Service Class | $ - | $ 721 |
Service Class 2 | - | 1,352 |
Investor Class | - | 30,779,852 |
Total | $ - | $ 30,781,925 |
From net realized gain | | |
Service Class | $ - | $ 126 |
Service Class 2 | - | 263 |
Investor Class | - | 5,386,474 |
Total | $ - | $ 5,386,863 |
VIP FundsManager 70% Portfolio | | |
From net investment income | | |
Service Class | $ - | $ 879 |
Service Class 2 | - | 31,248 |
Investor Class | - | 7,076,119 |
Total | $ - | $ 7,108,246 |
From net realized gain | | |
Service Class | $ - | $ 131 |
Service Class 2 | - | 5,118 |
Investor Class | - | 1,058,632 |
Total | $ - | $ 1,063,881 |
VIP FundsManager 85% Portfolio | | |
From net investment income | | |
Service Class | $ - | $ 1,117 |
Service Class 2 | - | 22,357 |
Investor Class | - | 2,323,075 |
Total | $ - | $ 2,346,549 |
From net realized gain | | |
Service Class | $ - | $ 265 |
Service Class 2 | - | 4,938 |
Investor Class | - | 524,652 |
Total | $ - | $ 529,855 |
Semiannual Report
Notes to Financial Statements (Unaudited) - continued
7. Share Transactions.
Transactions for each class of shares were as follows:
| Shares | Dollars |
| Six months ended June 30, 2011 | Year ended December 31, 2010 | Six months ended June 30, 2011 | Year ended December 31, 2010 |
VIP FundsManager 20% Portfolio | | | | |
Service Class | | | | |
Shares sold | 75 | 659 | $ 808 | $ 6,790 |
Reinvestment of distributions | - | 106 | - | 1,129 |
Shares redeemed | (147) | (511) | (1,577) | (5,283) |
Net increase (decrease) | (72) | 254 | $ (769) | $ 2,636 |
Service Class 2 | | | | |
Shares sold | 57,250 | 41,662 | $ 616,354 | $ 429,404 |
Reinvestment of distributions | - | 834 | - | 8,836 |
Shares redeemed | (15,024) | (31,113) | (162,375) | (317,711) |
Net increase (decrease) | 42,226 | 11,383 | $ 453,979 | $ 120,529 |
Investor Class | | | | |
Shares sold | 7,875,419 | 11,323,659 | $ 85,036,532 | $ 117,452,842 |
Reinvestment of distributions | - | 616,937 | - | 6,545,700 |
Shares redeemed | (1,057,798) | (2,038,861) | (11,414,027) | (21,152,505) |
Net increase (decrease) | 6,817,621 | 9,901,735 | $ 73,622,505 | $ 102,846,037 |
VIP FundsManager 50% Portfolio | | | | |
Service Class | | | | |
Shares sold | 107 | 5,522 | $ 1,104 | $ 51,566 |
Reinvestment of distributions | - | 105 | - | 1,048 |
Shares redeemed | (63) | (5,815) | (649) | (55,467) |
Net increase (decrease) | 44 | (188) | $ 455 | $ (2,853) |
Service Class 2 | | | | |
Shares sold | 651,319 | 75,310 | $ 6,728,332 | $ 705,935 |
Reinvestment of distributions | - | 1,613 | - | 16,112 |
Shares redeemed | (18,604) | (34,407) | (190,919) | (330,903) |
Net increase (decrease) | 632,715 | 42,516 | $ 6,537,413 | $ 391,144 |
Investor Class | | | | |
Shares sold | 7,445,996 | 13,058,689 | $ 76,508,656 | $ 124,486,934 |
Reinvestment of distributions | - | 1,143,124 | - | 11,442,673 |
Shares redeemed | (1,902,237) | (4,274,874) | (19,541,232) | (40,101,396) |
Net increase (decrease) | 5,543,759 | 9,926,939 | $ 56,967,424 | $ 95,828,211 |
VIP FundsManager 60% Portfolio | | | | |
Service Class | | | | |
Shares sold | 152 | 248 | $ 1,540 | $ 2,278 |
Reinvestment of distributions | - | 86 | - | 847 |
Shares redeemed | (81) | (90) | (826) | (820) |
Net increase (decrease) | 71 | 244 | $ 714 | $ 2,305 |
Service Class 2 | | | | |
Shares sold | 2,004,890 | 6,329 | $ 20,414,868 | $ 58,369 |
Reinvestment of distributions | - | 164 | - | 1,615 |
Shares redeemed | (436,063) | (3,203) | (4,435,866) | (30,616) |
Net increase (decrease) | 1,568,827 | 3,290 | $ 15,979,002 | $ 29,368 |
Investor Class | | | | |
Shares sold | 76,016,961 | 132,846,745 | $ 773,122,209 | $ 1,219,167,948 |
Reinvestment of distributions | - | 3,664,268 | - | 36,166,326 |
Shares redeemed | (3,463,018) | (6,444,533) | (35,223,823) | (58,407,482) |
Net increase (decrease) | 72,553,943 | 130,066,480 | $ 737,898,386 | $ 1,196,926,792 |
Semiannual Report
7. Share Transactions - continued
| Shares | Dollars |
| Six months ended June 30, 2011 | Year ended December 31, 2010 | Six months ended June 30, 2011 | Year ended December 31, 2010 |
VIP FundsManager 70% Portfolio | | | | |
Service Class | | | | |
Shares sold | 106 | 105 | $ 1,038 | $ 916 |
Reinvestment of distributions | - | 107 | - | 1,010 |
Shares redeemed | (43) | (1,257) | (425) | (10,260) |
Net increase (decrease) | 63 | (1,045) | $ 613 | $ (8,334) |
Service Class 2 | | | | |
Shares sold | 97,449 | 117,792 | $ 942,839 | $ 1,007,136 |
Reinvestment of distributions | - | 3,844 | - | 36,366 |
Shares redeemed | (8,393) | (22,656) | (82,693) | (200,352) |
Net increase (decrease) | 89,056 | 98,980 | $ 860,146 | $ 843,150 |
Investor Class | | | | |
Shares sold | 5,625,843 | 8,149,816 | $ 55,178,889 | $ 71,824,236 |
Reinvestment of distributions | - | 859,002 | - | 8,134,751 |
Shares redeemed | (1,734,838) | (5,325,112) | (17,034,502) | (46,181,415) |
Net increase (decrease) | 3,891,005 | 3,683,706 | $ 38,144,387 | $ 33,777,572 |
VIP FundsManager 85% Portfolio | | | | |
Service Class | | | | |
Shares sold | 1,054 | 1,159 | $ 9,977 | $ 9,612 |
Reinvestment of distributions | - | 152 | - | 1,382 |
Shares redeemed | (310) | (3,505) | (2,961) | (28,420) |
Net increase (decrease) | 744 | (2,194) | $ 7,016 | $ (17,426) |
Service Class 2 | | | | |
Shares sold | 138,268 | 201,721 | $ 1,289,771 | $ 1,678,857 |
Reinvestment of distributions | - | 2,991 | - | 27,295 |
Shares redeemed | (13,724) | (55,498) | (131,925) | (443,818) |
Net increase (decrease) | 124,544 | 149,214 | $ 1,157,846 | $ 1,262,334 |
Investor Class | | | | |
Shares sold | 3,345,591 | 6,173,674 | $ 31,813,909 | $ 52,921,384 |
Reinvestment of distributions | - | 312,144 | - | 2,847,727 |
Shares redeemed | (1,220,059) | (4,493,396) | (11,610,508) | (37,114,660) |
Net increase (decrease) | 2,125,532 | 1,992,422 | $ 20,203,401 | $ 18,654,451 |
8. Other.
The Funds' organizational documents provide former and current trustees and officers with a limited indemnification against liabilities arising in connection with the performance of their duties to the Funds. In the normal course of business, the Funds may also enter into contracts that provide general indemnifications. The Funds' maximum exposure under these arrangements is unknown as this would be dependent on future claims that may be made against the Funds. The risk of material loss from such claims is considered remote.
The Funds do not invest in the Underlying Funds for the purpose of exercising management or control; however, investments by the Funds within their principal investment strategies may represent a significant portion of the Underlying Fund's net assets. At the end of the period, the following VIP FundsManager Portfolios were each the owners of record of 10% or more of the total outstanding shares of the Underlying Funds.
Fund | VIP FundsManager 60% Portfolio |
| |
Fidelity Insurance Portfolio | 27% |
Fidelity Consumer Discretionary Portfolio | 26% |
Fidelity International Value Fund | 17% |
Fidelity Industrial Equipment Portfolio | 16% |
Fidelity Banking Portfolio | 13% |
Fidelity Financial Services Portfolio | 12% |
Fidelity Industrials Portfolio | 11% |
Fidelity Multimedia Portfolio | 11% |
Fidelity Nordic Fund | 11% |
Fidelity Construction and Housing Portfolio | 10% |
Semiannual Report
Notes to Financial Statements (Unaudited) - continued
8. Other - continued
The Funds, in aggregate, were the owners of record of more than 20% of the total outstanding shares of the following Underlying Funds.
Fund | % of shares held |
| |
Fidelity Insurance Portfolio | 39% |
Fidelity Consumer Discretionary Portfolio | 37% |
Fidelity International Value Fund | 24% |
Fidelity Industrial Equipment Portfolio | 21% |
In addition, at the end of the period, FMR or its affiliates were the owners of record of more than 10% of the outstanding shares of the following Funds:
| Affiliated % |
VIP FundsManager 20% Portfolio | 99% |
VIP FundsManager 50% Portfolio | 99% |
VIP FundsManager 60% Portfolio | 41% |
VIP FundsManager 70% Portfolio | 99% |
VIP FundsManager 85% Portfolio | 99% |
In addition, at the end of the period, certain otherwise unaffiliated shareholders were owners of record of more than 10% of the outstanding shares of VIP FundsManager 60% Portfolio:
MetLife Investors USA
Insurance Company | 55% |
Semiannual Report
Investment Adviser
Strategic Advisers, Inc.
Boston, MA
General Distributor
Fidelity Distributors Corporation
Boston, MA
Transfer and Service Agents
Fidelity Investments Institutional Operations Company, Inc.
Boston, MA
Fidelity Service Company, Inc.
Boston, MA
Custodian
The Bank of New York Mellon
New York, NY
VIPFM-SANN-0811
1.833444.105
Fidelity® Variable Insurance Products:
Investment Grade Bond Portfolio
Semiannual Report
June 30, 2011
(2_fidelity_logos) (Registered_Trademark)
Contents
Shareholder Expense Example | <Click Here> | An example of shareholder expenses. |
Investment Changes | <Click Here> | A summary of major shifts in the fund's investments over the past six months. |
Investments | <Click Here> | A complete list of the fund's investments with their market values. |
Financial Statements | <Click Here> | Statements of assets and liabilities, operations, and changes in net assets, as well as financial highlights. |
Notes | <Click Here> | Notes to the financial statements. |
Fidelity® VIP Investment Grade Central Fund Financial Statements | <Click Here> | Complete list of investments and financial statements for Fidelity® VIP Investment Grade Central Fund. |
To view a fund's proxy voting guidelines and proxy voting record for the 12-month period ended June 30, visit http://www.fidelity.com/proxyvotingresults or visit the Securities and Exchange Commission's (SEC) web site at http://www.sec.gov. You may also call 1-877-208-0098 to request a free copy of the proxy voting guidelines.
Fidelity Variable Insurance Products are separate account options which are purchased through a variable insurance contract.
Standard & Poor's, S&P and S&P 500 are registered service marks of The McGraw-Hill Companies, Inc. and have been licensed for use by Fidelity Distributors Corporation.
Other third party marks appearing herein are the property of their respective owners.
All other marks appearing herein are registered or unregistered trademarks or service marks of FMR LLC or an affiliated company.
This report and the financial statements contained herein are submitted for the general information of the shareholders of the fund. This report is not authorized for distribution to prospective investors in the fund unless preceded or accompanied by an effective prospectus.
A fund files its complete schedule of portfolio holdings with the SEC for the first and third quarters of each fiscal year on Form N-Q. Forms N-Q are available on the SEC's web site at http://www.sec.gov. A fund's Forms N-Q may be reviewed and copied at the SEC's Public Reference Room in Washington, DC. Information regarding the operation of the SEC's Public Reference Room may be obtained by calling 1-800-SEC-0330. For a complete list of a fund's portfolio holdings, view the most recent holdings listing, semiannual report, or annual report on Fidelity's web site at http://www.fidelity.com, http://www.advisor.fidelity.com, or http://www.401k.com, as applicable.
NOT FDIC INSURED • MAY LOSE VALUE • NO BANK GUARANTEE
Neither the fund nor Fidelity Distributors Corporation is a bank.
Semiannual Report
As a shareholder of the Fund, you incur two types of costs: (1) transaction costs, and (2) ongoing costs, including management fees, distribution and/or service (12b-1) fees and other Fund expenses. This Example is intended to help you understand your ongoing costs (in dollars) of investing in the Fund and to compare these costs with the ongoing costs of investing in other mutual funds.
The Example is based on an investment of $1,000 invested at the beginning of the period and held for the entire period (January 1, 2011 to June 30, 2011).
Actual Expenses
The first line of the accompanying table for each class of the Fund provides information about actual account values and actual expenses. You may use the information in this line, together with the amount you invested, to estimate the expenses that you paid over the period. Simply divide your account value by $1,000.00 (for example, an $8,600 account value divided by $1,000.00 = 8.6), then multiply the result by the number in the first line for a class of the Fund under the heading entitled "Expenses Paid During Period" to estimate the expenses you paid on your account during this period. The estimate of expenses does not include any fees or other expenses of any variable annuity or variable life insurance product. If they were, the estimate of expenses you paid during the period would be higher, and your ending account value would be lower. In addition, the Fund, as a shareholder in the underlying Fidelity Central Funds, will indirectly bear its pro-rata share of the fees and expenses incurred by the underlying Fidelity Central Funds. These fees and expenses are not included in the Fund's annualized expense ratio used to calculate the expense estimate in the table below.
Hypothetical Example for Comparison Purposes
The second line of the accompanying table for each class of the Fund provides information about hypothetical account values and hypothetical expenses based on a Class' actual expense ratio and an assumed rate of return of 5% per year before expenses, which is not the Class' actual return. The hypothetical account values and expenses may not be used to estimate the actual ending account balance or expenses you paid for the period. You may use this information to compare the ongoing costs of investing in the Fund and other funds. To do so, compare this 5% hypothetical example with the 5% hypothetical examples that appear in the shareholder reports of the other funds. The estimate of expenses does not include any fees or other expenses of any variable annuity or variable life insurance product. If they were, the estimate of expenses you paid during the period would be higher, and your ending account value would be lower. In addition, the Fund, as a shareholder in the underlying Fidelity Central Funds, will indirectly bear its pro-rata share of the fees and expenses incurred by the underlying Fidelity Central Funds. These fees and expenses are not included in the Fund's annualized expense ratio used to calculate the expense estimate in the table below.
Please note that the expenses shown in the table are meant to highlight your ongoing costs only and do not reflect any transaction costs. Therefore, the second line of the table is useful in comparing ongoing costs only, and will not help you determine the relative total costs of owning different funds.
| Annualized Expense Ratio | Beginning
Account Value
January 1, 2011 | Ending
Account Value
June 30, 2011 | Expenses Paid
During Period*
January 1, 2011
to June 30, 2011 |
Initial Class | .43% | | | |
Actual | | $ 1,000.00 | $ 1,030.90 | $ 2.17 |
HypotheticalA | | $ 1,000.00 | $ 1,022.66 | $ 2.16 |
Service Class | .53% | | | |
Actual | | $ 1,000.00 | $ 1,030.40 | $ 2.67 |
HypotheticalA | | $ 1,000.00 | $ 1,022.17 | $ 2.66 |
Service Class 2 | .68% | | | |
Actual | | $ 1,000.00 | $ 1,029.10 | $ 3.42 |
HypotheticalA | | $ 1,000.00 | $ 1,021.42 | $ 3.41 |
Investor Class | .46% | | | |
Actual | | $ 1,000.00 | $ 1,031.00 | $ 2.32 |
HypotheticalA | | $ 1,000.00 | $ 1,022.51 | $ 2.31 |
A 5% return per year before expenses
* Expenses are equal to each Class' annualized expense ratio, multiplied by the average account value over the period, multiplied by 181/365 (to reflect the one-half year period). The fees and expenses of the underlying Fidelity Central Funds in which the Fund invests are not included in the Fund's annualized expense ratio.
Semiannual Report
Investment Changes (Unaudited)
Quality Diversification (% of fund's net assets) |
As of June 30, 2011 | As of December 31, 2010 |
| U.S. Government and
U.S. Government Agency
Obligations 63.3% | | | U.S. Government and
U.S. Government Agency
Obligations†† 69.8% | |
 | AAA 7.7% | | | AAA 7.8% | |
 | AA 2.5% | | | AA 2.2% | |
 | A 7.9% | | | A 7.6% | |
 | BBB 12.5% | | | BBB 13.2% | |
 | BB and Below 6.2% | | | BB and Below 5.8% | |
 | Not Rated † 0.0% | | | Not Rated 0.1% | |
 | Short-Term Investments
and Net Other Assets *** (0.1)% | | | Short-Term Investments
and Net Other Assets *** (6.5)% | |

We have used ratings from Moody's Investors Service, Inc. Where Moody's® ratings are not available, we have used S&P® ratings. All ratings are as of the date indicated and do not reflect subsequent changes. Securities rated BB or below were rated investment grade at the time of acquisition. The information in the above table is based on the combined investments of the Fund and its pro-rata share of the investments of Fidelity's fixed-income central funds. |
Weighted Average Maturity as of June 30, 2011 |
| | 6 months ago |
Years | 6.1 | 6.1 |
This is a weighted average of all the maturities of the securities held in a fund. Weighted Average Maturity (WAM) can be used as a measure of sensitivity to interest rate changes and markets changes. Generally, the longer the maturity, the greater the sensitivity to such changes. WAM is based on the dollar-weighted average length of time until principal payments must be paid. Depending on the types of securities held in a fund, certain maturity shortening devices (e.g., demand features, interest rate resets, and call options) may be taken into account when calculating the WAM. |
Duration as of June 30, 2011 |
| | 6 months ago |
Years | 4.8 | 4.5 |
Duration estimates how much a bond fund's price will change with a change in comparable interest rates. If rates rise 1%, for example, a fund with a 5-year duration is likely to lose about 5% of its value. Other factors also can influence a bond fund's performance and share price. Accordingly, a bond fund's actual performance may differ from this example. Duration takes into account any call or put option embedded in the bonds. |
Asset Allocation (% of fund's net assets) |
As of June 30, 2011 * | As of December 31, 2010 ** |
| Corporate Bonds 25.3% | | | Corporate Bonds 24.7% | |
| U.S. Government and
U.S. Government Agency
Obligations 63.3% | | | U.S. Government and
U.S. Government Agency
Obligations†† 69.8% | |
| Asset-Backed Securities 2.6% | | | Asset-Backed Securities 2.6% | |
| CMOs and Other
Mortgage Related Securities 8.4% | | | CMOs and Other
Mortgage Related Securities 8.9% | |
| Municipal Bonds 0.3% | | | Municipal Bonds 0.3% | |
| Other Investments 0.2% | | | Other Investments 0.2% | |
| Short-Term Investments
and Net Other Assets *** (0.1)% | | | Short-Term Investments
and Net Other Assets *** (6.5)% | |
* Foreign investments | 3.2% | | ** Foreign investments | 3.3% | |
* Futures and Swaps | 2.1% | | ** Futures and Swaps | 2.4% | |
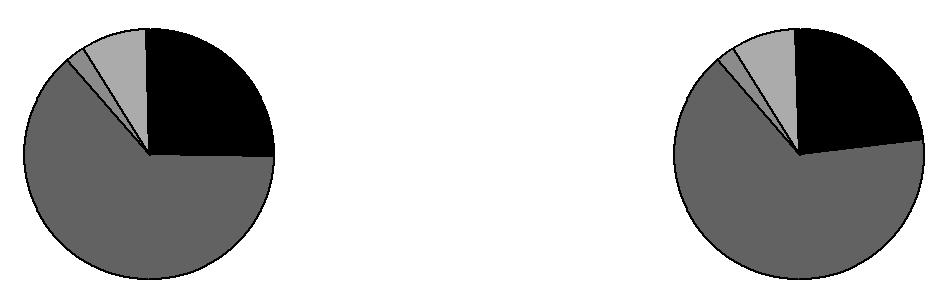
*** Short-Term Investments and Net Other Assets are not included in the pie chart.
† Amount represents less than 0.1%.
†† Includes FDIC Guaranteed Corporate Securities
The information in the above table is based on the combined investments of the Fund and its pro-rata share of the investments of Fidelity's fixed-income central funds. A holdings listing for the Fund, which presents direct holdings as well as the pro-rata share of any securities and other investments held indirectly through its investment in underlying non-money market Fidelity Central Funds is available at advisor.fidelity.com. Fidelity VIP Investment Grade Central Fund's holdings and financial statements are included at the end of this report.
Semiannual Report
Investments June 30, 2011 (Unaudited)
Showing Percentage of Net Assets
Fixed-Income Central Funds - 98.0% |
| Shares | | Value |
INVESTMENT GRADE FIXED-INCOME FUNDS - 96.0% |
Fidelity VIP Investment Grade Central Fund (e) | 26,337,750 | | $ 2,805,497,110 |
HIGH YIELD FIXED-INCOME FUNDS - 2.0% |
Fidelity Specialized High Income Central Fund (c) | 573,104 | | 58,158,582 |
TOTAL FIXED-INCOME CENTRAL FUNDS (Cost $2,764,010,752) | 2,863,655,692 |
Nonconvertible Bonds - 0.1% |
| Principal Amount | | |
CONSUMER STAPLES - 0.1% |
Beverages - 0.1% |
FBG Finance Ltd. 5.125% 6/15/15 (a) (Cost $1,475,417) | | $ 1,750,000 | | 1,902,315 |
Asset-Backed Securities - 0.1% |
|
Advanta Business Card Master Trust Series 2007-D1 Class D, 1.5858% 1/22/13 (a)(b) | | 1,800,000 | | 27,000 |
AmeriCredit Prime Automobile Receivables Trust Series 2007-1 Class E, 6.96% 3/8/16 (a) | | 968,234 | | 986,045 |
Ford Credit Auto Owner Trust: | | | | |
Series 2006-C Class D, 6.89% 5/15/13 (a) | | 725,000 | | 729,703 |
Series 2007-A Class D, 7.05% 12/15/13 (a) | | 425,000 | | 435,983 |
National Collegiate Student Loan Trust: | | | | |
Series 2004-2 Class AIO, 9.75% 10/27/14 (d) | | 1,830,000 | | 189,405 |
Series 2006-2 Class AIO, 6% 8/25/11 (d) | | 1,650,477 | | 16,505 |
Series 2006-3 Class AIO, 7.1% 1/25/12 (d) | | 9,526,589 | | 261,981 |
Series 2006-4 Class AIO, 6.35% 2/27/12 (d) | | 7,800,000 | | 256,285 |
Series 2007-1 Class AIO, 7.27% 4/25/12 (d) | | 9,280,000 | | 473,280 |
Series 2007-2 Class AIO, 6.7% 7/25/12 (d) | | 6,820,000 | | 425,335 |
Specialty Underwriting & Residential Finance Trust Series 2006-AB2 Class N1, 5.75% 6/25/37 (a) | | 180,261 | | 0 |
TOTAL ASSET-BACKED SECURITIES (Cost $3,817,997) | 3,801,522 |
Collateralized Mortgage Obligations - 0.8% |
| Principal Amount | | Value |
Private Sponsor - 0.8% |
CWALT, Inc.: | | | | |
floater Series 2005-56: | | | | |
Class 1A1, 0.9158% 11/25/35 (b) | | $ 10,047,765 | | $ 6,068,981 |
Class 2A3, 1.795% 11/25/35 (b) | | 2,383,879 | | 1,427,112 |
Series 2005-56: | | | | |
Class 4A1, 0.4958% 11/25/35 (b) | | 1,865,234 | | 1,112,738 |
Class 5A1, 0.5058% 11/25/35 (b) | | 3,026,427 | | 1,675,186 |
Luminent Mortgage Trust: | | | | |
floater Series 2006-1 Class A1, 0.4258% 4/25/36 (b) | | 5,009,337 | | 2,806,663 |
Series 2006-5 Class A1A, 0.3758% 7/25/36 (b) | | 3,852,518 | | 2,077,863 |
MASTR Adjustable Rate Mortgages Trust Series 2007-3 Class 22A2, 0.3958% 5/25/47 (b) | | 625,203 | | 422,921 |
Merrill Lynch Alternative Note Asset Trust floater Series 2007-OAR1 Class A1, 0.3558% 2/25/37 (b) | | 1,739,382 | | 1,165,858 |
Residential Accredit Loans, Inc. floater Series 2005-QO5 Class A1, 1.295% 1/25/46 (b) | | 4,124,480 | | 2,365,476 |
Structured Asset Mortgage Investments, Inc. floater Series 2006-AR6 Class 2A1, 0.3758% 7/25/46 (b) | | 7,966,007 | | 4,614,412 |
Wells Fargo Mortgage Backed Securities Trust Series 2005-AR2 Class 1A2, 2.7374% 3/25/35 (b) | | 1,001,850 | | 393,833 |
TOTAL COLLATERALIZED MORTGAGE OBLIGATIONS (Cost $26,143,163) | 24,131,043 |
Cash Equivalents - 1.1% |
| Maturity Amount | | |
Investments in repurchase agreements in a joint trading account at 0.06%, dated 6/30/11 due 7/1/11 (Collateralized by U.S. Government Obligations) #
(Cost $31,073,000) | $ 31,073,048 | | 31,073,000 |
TOTAL INVESTMENT PORTFOLIO - 100.1% (Cost $2,826,520,329) | 2,924,563,572 |
NET OTHER ASSETS (LIABILITIES) - (0.1)% | (4,224,714) |
NET ASSETS - 100% | $ 2,920,338,858 |
Legend |
(a) Security exempt from registration under Rule 144A of the Securities Act of 1933. These securities may be resold in transactions exempt from registration, normally to qualified institutional buyers. At the end of the period, the value of these securities amounted to $4,081,046 or 0.1% of net assets. |
(b) Coupon rates for floating and adjustable rate securities reflect the rates in effect at period end. |
(c) Affiliated fund that is available only to investment companies and other accounts managed by Fidelity Investments. A complete unaudited schedule of portfolio holdings for each Fidelity Central Fund is filed with the SEC for the first and third quarters of each fiscal year on Form N-Q and is available upon request or at the SEC's web site at www.sec.gov. An unaudited holdings listing for the Fund, which presents direct holdings as well as the pro rata share of securities and other investments held indirectly through its investment in underlying non-money market Fidelity Central Funds, is available at advisor.fidelity.com. In addition, each Fidelity Central Fund's financial statements are available on the SEC's web site or upon request. |
(d) Security represents right to receive monthly interest payments on an underlying pool of mortgages or assets. Principal shown is the outstanding par amount of the pool held as of the end of the period. |
(e) Affiliated central fund that is available only to investment companies and other accounts managed by Fidelity Investments. Fidelity VIP Investment Grade Central Fund's investments and financial statements are included at the end of this report as an attachment. |
# Additional information on each counterparty to the repurchase agreement is as follows: |
Repurchase Agreement / Counterparty | Value |
$31,073,000 due 7/01/11 at 0.06% |
BNP Paribas Securities Corp. | $ 5,017,258 |
Barclays Capital, Inc. | 969,455 |
Mizuho Securities USA, Inc. | 15,051,772 |
UBS Securities LLC | 10,034,515 |
| $ 31,073,000 |
Affiliated Central Funds |
Information regarding fiscal year to date income earned by the Fund from investments in Fidelity Central Funds is as follows: |
Fund | Income earned |
Fidelity Specialized High Income Central Fund | $ 1,907,061 |
Fidelity VIP Investment Grade Central Fund | 47,382,910 |
Total | $ 49,289,971 |
Additional information regarding the Fund's fiscal year to date purchases and sales, including the ownership percentage, of the non Money Market Central Funds is as follows: |
Fund | Value,
beginning of period | Purchases | Sales
Proceeds | Value,
end of
period | % ownership, end of
period |
Fidelity Specialized High Income Central Fund | $ 55,590,665 | $ 1,907,061 | $ - | $ 58,158,582 | 13.0% |
Fidelity VIP Investment Grade Central Fund | 2,820,191,876 | 55,649,086 | 105,015,881 | 2,805,497,110 | 74.1% |
Total | $ 2,875,782,541 | $ 57,556,147 | $ 105,015,881 | $ 2,863,655,692 | |
Other Information |
The following is a summary of the inputs used, as of June 30, 2011, involving the Fund's assets and liabilities carried at fair value. The inputs or methodology used for valuing securities may not be an indication of the risk associated with investing in those securities. For more information on valuation inputs, and their aggregation into the levels used in the tables below, please refer to the Security Valuation section in the accompanying Notes to Financial Statements. |
Valuation Inputs at Reporting Date: |
Description | Total | Level 1 | Level 2 | Level 3 |
Investments in Securities: | | | | |
Corporate Bonds | $ 1,902,315 | $ - | $ 1,902,315 | $ - |
Asset-Backed Securities | 3,801,522 | - | 3,774,522 | 27,000 |
Collateralized Mortgage Obligations | 24,131,043 | - | 24,131,043 | - |
Fixed-Income Funds | 2,863,655,692 | 2,863,655,692 | - | - |
Cash Equivalents | 31,073,000 | - | 31,073,000 | - |
Total Investments in Securities: | $ 2,924,563,572 | $ 2,863,655,692 | $ 60,880,880 | $ 27,000 |
The following is a reconciliation of Investments in Securities for which Level 3 inputs were used in determining value: |
Investments in Securities: | |
Beginning Balance | $ 507,609 |
Total Realized Gain (Loss) | (1,728,293) |
Total Unrealized Gain (Loss) | 1,751,745 |
Cost of Purchases | - |
Proceeds of Sales | - |
Amortization/Accretion | (14,452) |
Transfers in to Level 3 | - |
Transfers out of Level 3 | (489,609) |
Ending Balance | $ 27,000 |
The change in unrealized gain (loss) for the period attributable to Level 3 securities held at June 30, 2011 | $ 1,751,745 |
The information used in the above reconciliation represents fiscal year to date activity for any Investments in Securities identified as using Level 3 inputs at either the beginning or the end of the current fiscal period. Transfers in or out of Level 3 represent the beginning value of any Security or Instrument where a change in the pricing level occurred from the beginning to the end of the period. The cost of purchases and the proceeds of sales may include securities received or delivered through corporate actions or exchanges. Realized and unrealized gains (losses) disclosed in the reconciliation are included in Net Gain (Loss) on the Fund's Statement of Operations. |
See accompanying notes which are an integral part of the financial statements.
Semiannual Report
Statement of Assets and Liabilities
| June 30, 2011 (Unaudited) |
| | |
Assets | | |
Investment in securities, at value (including repurchase agreements of $31,073,000) - See accompanying schedule: Unaffiliated issuers (cost $62,509,577) | $ 60,907,880 | |
Fidelity Central Funds (cost $2,764,010,752) | 2,863,655,692 | |
Total Investments (cost $2,826,520,329) | | $ 2,924,563,572 |
Cash | | 945 |
Receivable for fund shares sold | | 1,794,244 |
Interest receivable | | 60,318 |
Total assets | | 2,926,419,079 |
| | |
Liabilities | | |
Payable for fund shares redeemed | 4,723,134 | |
Accrued management fee | 768,422 | |
Distribution and service plan fees payable | 240,727 | |
Other affiliated payables | 254,761 | |
Other payables and accrued expenses | 93,177 | |
Total liabilities | | 6,080,221 |
| | |
Net Assets | | $ 2,920,338,858 |
Net Assets consist of: | | |
Paid in capital | | $ 2,769,669,500 |
Undistributed net investment income | | 43,808,075 |
Accumulated undistributed net realized gain (loss) on investments | | 8,818,040 |
Net unrealized appreciation (depreciation) on investments | | 98,043,243 |
Net Assets | | $ 2,920,338,858 |
Statement of Assets and Liabilities - continued
| June 30, 2011 (Unaudited) |
| | |
Initial Class:
Net Asset Value, offering price and redemption price per share ($1,073,297,450 ÷ 82,537,698 shares) | | $ 13.00 |
| | |
Service Class:
Net Asset Value, offering price and redemption price per share ($275,584,127 ÷ 21,376,138 shares) | | $ 12.89 |
| | |
Service Class 2:
Net Asset Value, offering price and redemption price per share ($1,038,332,688 ÷ 81,480,244 shares) | | $ 12.74 |
| | |
Investor Class:
Net Asset Value, offering price and redemption price per share ($533,124,593 ÷ 41,117,268 shares) | | $ 12.97 |
See accompanying notes which are an integral part of the financial statements.
Semiannual Report
Statement of Operations
Six months ended June 30, 2011 (Unaudited) |
| | |
Investment Income | | |
Interest | | $ 2,753,780 |
Income from Fidelity Central Funds | | 49,289,971 |
Total income | | 52,043,751 |
| | |
Expenses | | |
Management fee | $ 4,564,839 | |
Transfer agent fees | 1,147,760 | |
Distribution and service plan fees | 1,425,074 | |
Accounting fees and expenses | 465,160 | |
Custodian fees and expenses | 3,616 | |
Independent trustees' compensation | 5,323 | |
Registration fees | 8,071 | |
Audit | 24,189 | |
Legal | 3,095 | |
Interest | 1,810 | |
Miscellaneous | 18,473 | |
Total expenses before reductions | 7,667,410 | |
Expense reductions | (16,097) | 7,651,313 |
Net investment income (loss) | | 44,392,438 |
Realized and Unrealized Gain (Loss) Net realized gain (loss) on: | | |
Investment securities: | | |
Unaffiliated issuers | (1,730,914) | |
Fidelity Central Funds | 625,917 | |
Capital gain distributions from Fidelity Central Funds | 8,274,610 | |
Total net realized gain (loss) | | 7,169,613 |
Change in net unrealized appreciation (depreciation) on investment securities | | 34,418,415 |
Net gain (loss) | | 41,588,028 |
Net increase (decrease) in net assets resulting from operations | | $ 85,980,466 |
Statement of Changes in Net Assets
| Six months ended June 30, 2011 (Unaudited) | Year ended December 31, 2010 |
Increase (Decrease) in Net Assets | | |
Operations | | |
Net investment income (loss) | $ 44,392,438 | $ 102,126,066 |
Net realized gain (loss) | 7,169,613 | 110,462,115 |
Change in net unrealized appreciation (depreciation) | 34,418,415 | 20,788,788 |
Net increase (decrease) in net assets resulting from operations | 85,980,466 | 233,376,969 |
Distributions to shareholders from net investment income | (1,140,099) | (102,934,619) |
Distributions to shareholders from net realized gain | (48,796,244) | (32,318,250) |
Total distributions | (49,936,343) | (135,252,869) |
Share transactions - net increase (decrease) | (59,628,240) | (261,188,374) |
Total increase (decrease) in net assets | (23,584,117) | (163,064,274) |
| | |
Net Assets | | |
Beginning of period | 2,943,922,975 | 3,106,987,249 |
End of period (including undistributed net investment income of $43,808,075 and undistributed net investment income of $555,736, respectively) | $ 2,920,338,858 | $ 2,943,922,975 |
See accompanying notes which are an integral part of the financial statements.
Semiannual Report
Financial Highlights - Initial Class
| Six months ended June 30, 2011 | Years ended December 31, |
| (Unaudited) | 2010 | 2009 | 2008 | 2007 | 2006 |
Selected Per-Share Data | | | | | | |
Net asset value, beginning of period | $ 12.83 | $ 12.48 | $ 11.84 | $ 12.76 | $ 12.76 | $ 12.76 |
Income from Investment Operations | | | | | | |
Net investment income (loss) E | .203 | .443 | .510 | .592 | .610 | .591 |
Net realized and unrealized gain (loss) | .186 | .528 | 1.266 | (.987) | (.076) | (.060) |
Total from investment operations | .389 | .971 | 1.776 | (.395) | .534 | .531 |
Distributions from net investment income | (.005) | (.476) | (1.087) | (.515) | (.534) | (.501) |
Distributions from net realized gain | (.214) | (.145) | (.049) | (.010) | - | (.030) |
Total distributions | (.219) | (.621) | (1.136) | (.525) | (.534) | (.531) |
Net asset value, end of period | $ 13.00 | $ 12.83 | $ 12.48 | $ 11.84 | $ 12.76 | $ 12.76 |
Total Return B,C,D | 3.09% | 7.80% | 15.72% | (3.25)% | 4.35% | 4.35% |
Ratios to Average Net Assets F,H | | | | | | |
Expenses before reductions | .43% A | .43% | .45% | .43% | .43% | .44% |
Expenses net of fee waivers, if any | .43% A | .42% | .45% | .43% | .43% | .44% |
Expenses net of all reductions | .43% A | .42% | .45% | .43% | .43% | .44% |
Net investment income (loss) | 3.19% A | 3.38% | 4.19% | 4.84% | 4.88% | 4.75% |
Supplemental Data | | | | | | |
Net assets, end of period (000 omitted) | $ 1,073,297 | $ 1,110,373 | $ 1,083,773 | $ 936,912 | $ 1,134,915 | $ 1,184,942 |
Portfolio turnover rate G | 4% A | 8% | 3% | 14% | 2% | 34% |
A Annualized
B Total returns for periods of less than one year are not annualized.
C Total returns do not reflect charges attributable to your insurance company's separate account. Inclusion of these charges would reduce the total returns shown.
D Total returns would have been lower if certain expenses had not been reduced during the applicable periods shown.
E Calculated based on average shares outstanding during the period.
F Fees and expenses of any underlying Fidelity Central Funds are not included in the Fund's expense ratio. The Fund indirectly bears its proportionate share of the expenses of any underlying Fidelity Central Funds.
G Amount does not include the portfolio activity of any underlying Fidelity Central Funds.
H Expense ratios reflect operating expenses of the class. Expenses before reductions do not reflect amounts reimbursed by the investment adviser or reductions from expense offset arrangements and do not represent the amount paid by the class during periods when reimbursements or reductions occur. Expenses net of fee waivers reflect expenses after reimbursement by the investment adviser but prior to reductions from expense offset arrangements. Expenses net of all reductions represent the net expenses paid by the class.
Financial Highlights - Service Class
| Six months ended June 30, 2011 | Years ended December 31, |
| (Unaudited) | 2010 | 2009 | 2008 | 2007 | 2006 |
Selected Per-Share Data | | | | | | |
Net asset value, beginning of period | $ 12.73 | $ 12.39 | $ 11.75 | $ 12.68 | $ 12.68 | $ 12.68 |
Income from Investment Operations | | | | | | |
Net investment income (loss) E | .195 | .427 | .495 | .572 | .593 | .575 |
Net realized and unrealized gain (loss) | .184 | .521 | 1.262 | (.986) | (.069) | (.053) |
Total from investment operations | .379 | .948 | 1.757 | (.414) | .524 | .522 |
Distributions from net investment income | (.005) | (.463) | (1.068) | (.506) | (.524) | (.492) |
Distributions from net realized gain | (.214) | (.145) | (.049) | (.010) | - | (.030) |
Total distributions | (.219) | (.608) | (1.117) | (.516) | (.524) | (.522) |
Net asset value, end of period | $ 12.89 | $ 12.73 | $ 12.39 | $ 11.75 | $ 12.68 | $ 12.68 |
Total Return B,C,D | 3.04% | 7.68% | 15.67% | (3.42)% | 4.29% | 4.30% |
Ratios to Average Net Assets F,H | | | | | | |
Expenses before reductions | .53% A | .53% | .54% | .53% | .53% | .54% |
Expenses net of fee waivers, if any | .53% A | .52% | .54% | .53% | .53% | .54% |
Expenses net of all reductions | .53% A | .52% | .54% | .53% | .53% | .54% |
Net investment income (loss) | 3.09% A | 3.28% | 4.09% | 4.75% | 4.78% | 4.65% |
Supplemental Data | | | | | | |
Net assets, end of period (000 omitted) | $ 275,584 | $ 283,962 | $ 259,246 | $ 202,501 | $ 147,990 | $ 99,633 |
Portfolio turnover rate G | 4% A | 8% | 3% | 14% | 2% | 34% |
A Annualized
B Total returns for periods of less than one year are not annualized.
C Total returns do not reflect charges attributable to your insurance company's separate account. Inclusion of these charges would reduce the total returns shown.
D Total returns would have been lower if certain expenses had not been reduced during the applicable periods shown.
E Calculated based on average shares outstanding during the period.
F Fees and expenses of any underlying Fidelity Central Funds are not included in the Fund's expense ratio. The Fund indirectly bears its proportionate share of the expenses of any underlying Fidelity Central Funds.
G Amount does not include the portfolio activity of any underlying Fidelity Central Funds.
H Expense ratios reflect operating expenses of the class. Expenses before reductions do not reflect amounts reimbursed by the investment adviser or reductions from expense offset arrangements and do not represent the amount paid by the class during periods when reimbursements or reductions occur. Expenses net of fee waivers reflect expenses after reimbursement by the investment adviser but prior to reductions from expense offset arrangements. Expenses net of all reductions represent the net expenses paid by the class.
See accompanying notes which are an integral part of the financial statements.
Semiannual Report
Financial Highlights - Service Class 2
| Six months ended June 30, 2011 | Years ended December 31, |
| (Unaudited) | 2010 | 2009 | 2008 | 2007 | 2006 |
Selected Per-Share Data | | | | | | |
Net asset value, beginning of period | $ 12.60 | $ 12.26 | $ 11.62 | $ 12.55 | $ 12.56 | $ 12.57 |
Income from Investment Operations | | | | | | |
Net investment income (loss) E | .184 | .402 | .473 | .551 | .568 | .551 |
Net realized and unrealized gain (loss) | .175 | .520 | 1.244 | (.975) | (.064) | (.053) |
Total from investment operations | .359 | .922 | 1.717 | (.424) | .504 | .498 |
Distributions from net investment income | (.005) | (.437) | (1.028) | (.496) | (.514) | (.478) |
Distributions from net realized gain | (.214) | (.145) | (.049) | (.010) | - | (.030) |
Total distributions | (.219) | (.582) | (1.077) | (.506) | (.514) | (.508) |
Net asset value, end of period | $ 12.74 | $ 12.60 | $ 12.26 | $ 11.62 | $ 12.55 | $ 12.56 |
Total Return B,C,D | 2.91% | 7.55% | 15.47% | (3.54)% | 4.17% | 4.14% |
Ratios to Average Net Assets F,H | | | | | | |
Expenses before reductions | .68% A | .68% | .69% | .67% | .68% | .69% |
Expenses net of fee waivers, if any | .68% A | .67% | .69% | .67% | .68% | .69% |
Expenses net of all reductions | .68% A | .67% | .69% | .67% | .68% | .69% |
Net investment income (loss) | 2.94% A | 3.13% | 3.94% | 4.60% | 4.63% | 4.50% |
Supplemental Data | | | | | | |
Net assets, end of period (000 omitted) | $ 1,038,333 | $ 1,011,652 | $ 1,240,935 | $ 930,150 | $ 1,018,017 | $ 497,504 |
Portfolio turnover rate G | 4% A | 8% | 3% | 14% | 2% | 34% |
A Annualized
B Total returns for periods of less than one year are not annualized.
C Total returns do not reflect charges attributable to your insurance company's separate account. Inclusion of these charges would reduce the total returns shown.
D Total returns would have been lower if certain expenses had not been reduced during the applicable periods shown.
E Calculated based on average shares outstanding during the period.
F Fees and expenses of any underlying Fidelity Central Funds are not included in the Fund's expense ratio. The Fund indirectly bears its proportionate share of the expenses of any underlying Fidelity Central Funds.
G Amount does not include the portfolio activity of any underlying Fidelity Central Funds.
H Expense ratios reflect operating expenses of the class. Expenses before reductions do not reflect amounts reimbursed by the investment adviser or reductions from expense offset arrangements and do not represent the amount paid by the class during periods when reimbursements or reductions occur. Expenses net of fee waivers reflect expenses after reimbursement by the investment adviser but prior to reductions from expense offset arrangements. Expenses net of all reductions represent the net expenses paid by the class.
Financial Highlights - Investor Class
| Six months ended June 30, 2011 | Years ended December 31, |
| (Unaudited) | 2010 | 2009 | 2008 | 2007 | 2006 |
Selected Per-Share Data | | | | | | |
Net asset value, beginning of period | $ 12.80 | $ 12.45 | $ 11.81 | $ 12.73 | $ 12.74 | $ 12.75 |
Income from Investment Operations | | | | | | |
Net investment income (loss) E | .201 | .438 | .511 | .586 | .603 | .583 |
Net realized and unrealized gain (loss) | .188 | .529 | 1.263 | (.983) | (.079) | (.055) |
Total from investment operations | .389 | .967 | 1.774 | (.397) | .524 | .528 |
Distributions from net investment income | (.005) | (.472) | (1.085) | (.513) | (.534) | (.508) |
Distributions from net realized gain | (.214) | (.145) | (.049) | (.010) | - | (.030) |
Total distributions | (.219) | (.617) | (1.134) | (.523) | (.534) | (.538) |
Net asset value, end of period | $ 12.97 | $ 12.80 | $ 12.45 | $ 11.81 | $ 12.73 | $ 12.74 |
Total Return B,C,D | 3.10% | 7.79% | 15.75% | (3.28)% | 4.28% | 4.33% |
Ratios to Average Net Assets F,H | | | | | | |
Expenses before reductions | .46% A | .46% | .48% | .46% | .46% | .48% |
Expenses net of fee waivers, if any | .46% A | .45% | .45% | .45% | .46% | .48% |
Expenses net of all reductions | .46% A | .45% | .45% | .45% | .46% | .48% |
Net investment income (loss) | 3.16% A | 3.35% | 4.18% | 4.82% | 4.84% | 4.72% |
Supplemental Data | | | | | | |
Net assets, end of period (000 omitted) | $ 533,125 | $ 537,936 | $ 523,032 | $ 306,413 | $ 284,223 | $ 168,456 |
Portfolio turnover rate G | 4% A | 8% | 3% | 14% | 2% | 34% |
A Annualized
B Total returns for periods of less than one year are not annualized.
C Total returns do not reflect charges attributable to your insurance company's separate account. Inclusion of these charges would reduce the total returns shown.
D Total returns would have been lower if certain expenses had not been reduced during the applicable periods shown.
E Calculated based on average shares outstanding during the period.
F Fees and expenses of any underlying Fidelity Central Funds are not included in the Fund's expense ratio. The Fund indirectly bears its proportionate share of the expenses of any underlying Fidelity Central Funds.
G Amount does not include the portfolio activity of any underlying Fidelity Central Funds.
H Expense ratios reflect operating expenses of the class. Expenses before reductions do not reflect amounts reimbursed by the investment adviser or reductions from expense offset arrangements and do not represent the amount paid by the class during periods when reimbursements or reductions occur. Expenses net of fee waivers reflect expenses after reimbursement by the investment adviser but prior to reductions from expense offset arrangements. Expenses net of all reductions represent the net expenses paid by the class.
See accompanying notes which are an integral part of the financial statements.
Semiannual Report
Notes to Financial Statements
For the period ended June 30, 2011 (Unaudited)
1. Organization.
VIP Investment Grade Bond Portfolio (the Fund) is a fund of Variable Insurance Products Fund V (the Trust) and is authorized to issue an unlimited number of shares. The Trust is registered under the Investment Company Act of 1940, as amended (the 1940 Act), as an open-end management investment company organized as a Massachusetts business trust. Shares of the Fund may only be purchased by insurance companies for the purpose of funding variable annuity or variable life insurance contracts. The Fund offers the following classes of shares: Initial Class shares, Service Class shares, Service Class 2 shares and Investor Class shares. All classes have equal rights and voting privileges, except for matters affecting a single class. Investment income, realized and unrealized capital gains and losses, the common expenses of the Fund, and certain fund-level expense reductions, if any, are allocated on a pro-rata basis to each class based on the relative net assets of each class to the total net assets of the Fund. Each class differs with respect to transfer agent and distribution and service plan fees incurred. Certain expense reductions may also differ by class.
2. Investments in Fidelity Central Funds.
The Fund invests in Fidelity Central Funds, which are open-end investment companies available only to other investment companies and accounts managed by Fidelity Management & Research Company (FMR) and its affiliates. The Fund's Schedule of Investments lists each of the Fidelity Central Funds held as of period end, if any, as an investment of the Fund, but does not include the underlying holdings of each Fidelity Central Fund. As an Investing Fund, the Fund indirectly bears its proportionate share of the expenses of the underlying Fidelity Central Funds.
Based on their investment objective, each Fidelity Central Fund may invest or participate in various investment vehicles or strategies that are similar to those of the Fund. These strategies are consistent with the investment objectives of the Fund and may involve certain economic risks which may cause a decline in value of each of the Fidelity Central Funds and thus a decline in the value of the Fund. The Money Market Central Funds seek preservation of capital and current income and are managed by Fidelity Investments Money Management, Inc. (FIMM), an affiliate of FMR. The following summarizes the Fund's investment in each Fidelity Central Fund.
Fidelity Central Fund | Investment Manager | Investment Objective | Investment Practices |
Fidelity® Specialized High Income Central Fund | FMR Co., Inc. (FMRC) | Seeks a high level of current income by normally investing in income-producing debt securities, with an emphasis on lower-quality debt securities. | Loans & Direct Debt Instruments Repurchase Agreements Restricted Securities |
VIP Investment Grade Central Fund | FIMM | Seeks a high level of current income by normally investing in investment-grade debt securities and repurchase agreements. | Delayed Delivery & When Issued Securities Repurchase Agreements Restricted Securities Swap Agreements |
A complete unaudited list of holdings for each Fidelity Central Fund is available upon request or at the Securities and Exchange Commission (the SEC) web site at www.sec.gov. In addition, the financial statements of the Fidelity Central Funds, are available on the SEC web site or upon request.
3. Significant Accounting Policies.
The financial statements have been prepared in conformity with accounting principles generally accepted in the United States of America (GAAP), which require management to make certain estimates and assumptions at the date of the financial statements. Actual results could differ from those estimates. Subsequent events, if any, through the date that the financial statements were issued have been evaluated in the preparation of the financial statements. The following summarizes the significant accounting policies of the Fund:
Security Valuation. Investments are valued as of 4:00 p.m. Eastern time on the last calendar day of the period. The Fund uses independent pricing services approved by the Board of Trustees to value its investments. When current market prices or quotations are not readily available or reliable, valuations may be determined in good faith in accordance with procedures adopted by the Board of Trustees. Factors used in determining value may include market or security specific events, changes in interest rates and credit quality. The frequency with which these procedures are used cannot be predicted and they may be utilized to a significant extent. The value used for net asset value (NAV) calculation under these procedures may differ from published prices for the same securities.
The Fund categorizes the inputs to valuation techniques used to value its investments into a disclosure hierarchy consisting of three levels as shown below:
Level 1 - quoted prices in active markets for identical investments
Level 2 - other significant observable inputs (including quoted prices for similar investments, interest rates, prepayment speeds, etc.)
Level 3 - unobservable inputs (including the Fund's own assumptions based on the best information available)
Semiannual Report
3. Significant Accounting Policies - continued
Security Valuation - continued
Changes in valuation techniques may result in transfers in or out of an assigned level within the disclosure hierarchy. The aggregate value of investments by input level, as of June 30, 2011 for the Fund's investments, as well as a roll forward of Level 3 securities, is included at the end of the Fund's Schedule of Investments. Valuation techniques used to value the Fund's investments by major category are as follows:
Debt securities, including restricted securities, are valued based on evaluated prices received from independent pricing services or from dealers who make markets in such securities. For corporate bonds, pricing services utilize matrix pricing which considers yield or price of bonds of comparable quality, coupon, maturity and type as well as dealer supplied prices and are generally categorized as Level 2 in the hierarchy. For asset backed securities and collateralized mortgage obligations, pricing services utilize matrix pricing which considers prepayment speed assumptions, attributes of the collateral, yield or price of bonds of comparable quality, coupon, maturity and type as well as dealer supplied prices and, accordingly, such securities are generally categorized as Level 2 in the hierarchy. Short-term securities with remaining maturities of sixty days or less may be valued at amortized cost, which approximates fair value, and are categorized as Level 2 in the hierarchy.
When independent prices are unavailable or unreliable, debt securities may be valued utilizing pricing matrices which consider similar factors that would be used by independent pricing services. These are generally categorized as Level 2 in the hierarchy but may be Level 3 depending on the circumstances.
Investments in open-end mutual funds, including the Fidelity Central Funds, are valued at their closing net asset value each business day and are categorized as Level 1 in the hierarchy.
Investment Transactions and Income. For financial reporting purposes, the Fund's investment holdings and NAV include trades executed through the end of the last business day of the period. The NAV per share for processing shareholder transactions is calculated as of the close of business of the New York Stock Exchange (NYSE), normally 4:00 p.m. Eastern time and includes trades executed through the end of the prior business day. Gains and losses on securities sold are determined on the basis of identified cost and may include proceeds received from litigation. Dividend income is recorded on the ex-dividend date, except for certain dividends from foreign securities where the ex-dividend date may have passed, which are recorded as soon as the Fund is informed of the ex-dividend date. Non-cash dividends included in dividend income, if any, are recorded at the fair market value of the securities received. Interest income is accrued as earned. Interest income includes coupon interest and amortization of premium and accretion of discount on debt securities.
Expenses. Expenses directly attributable to a fund are charged to that fund. Expenses attributable to more than one fund are allocated among the respective funds on the basis of relative net assets or other appropriate methods. Expense estimates are accrued in the period to which they relate and adjustments are made when actual amounts are known.
Income Tax Information and Distributions to Shareholders. Each year, the Fund intends to qualify as a regulated investment company, including distributing substantially all of its taxable income and realized gains under Subchapter M of the Internal Revenue Code and filing its U.S. federal tax return. As a result, no provision for income taxes is required. A fund's federal tax return is subject to examination by the Internal Revenue Service (IRS) for a period of three years.
Distributions are declared and recorded on the ex-dividend date. Income dividends and capital gain distributions are declared separately for each class. Income and capital gain distributions are determined in accordance with income tax regulations, which may differ from GAAP.
Capital accounts within the financial statements are adjusted for permanent book-tax differences. These adjustments have no impact on net assets or the results of operations. Temporary book-tax differences will reverse in a subsequent period.
Book-tax differences are primarily due to the short-term gain distributions from the Fidelity Central Funds, in-kind transactions, market discount, partnerships (including allocations from Fidelity Central Funds), deferred trustees compensation, capital loss carryforwards and losses deferred due to wash sales.
The federal tax cost of investment securities and unrealized appreciation (depreciation) as of period end were as follows:
Gross unrealized appreciation | $ 156,103,159 |
Gross unrealized depreciation | (3,196,305) |
Net unrealized appreciation (depreciation) on securities and other investments | $ 152,906,854 |
| |
Tax cost | $ 2,771,656,718 |
Semiannual Report
Notes to Financial Statements (Unaudited) - continued
3. Significant Accounting Policies - continued
Income Tax Information and Distributions to Shareholders - continued
Under the recently enacted Regulated Investment Company Modernization Act of 2010 (the Act), the Fund will be permitted to carry forward capital losses incurred in taxable years beginning after December 22, 2010 for an unlimited period. However, any losses incurred during those future taxable years will be required to be utilized prior to any losses incurred in pre-enactment taxable years, which generally expire after eight years from when they are incurred. Additionally, post-enactment capital losses that are carried forward will retain their character as either short-term or long-term capital losses rather than being considered all short-term as under previous law. The Fund's first fiscal year end subject to the Act will be December 31, 2011.
New Accounting Pronouncement. In May 2011, the Financial Accounting Standards Board issued Accounting Standard Update No. 2011-04, Fair Value Measurement (Topic 820) - Amendments to Achieve Common Fair Value Measurement and Disclosure Requirements in U.S. GAAP and IFRSs. The update changes the wording used to describe the requirements in GAAP for measuring fair value and for disclosing information about fair value measurements. The update is effective during interim and annual periods beginning after December 15, 2011. Management is currently evaluating the impact of the update's adoption on the Fund's financial statement disclosures.
4. Operating Policies.
Repurchase Agreements. FMR has received an Exemptive Order from the Securities and Exchange Commission (the SEC) which permits the Fund and other affiliated entities of FMR to transfer uninvested cash balances into joint trading accounts which are then invested in repurchase agreements. The Fund may also invest directly with institutions in repurchase agreements. Repurchase agreements are collateralized by government or non-government securities. Upon settlement date, collateral is held in segregated accounts with custodian banks and may be obtained in the event of a default of the counterparty. The Fund monitors, on a daily basis, the value of the collateral to ensure it is at least equal to the principal amount of the repurchase agreement (including accrued interest). In the event of a default by the counterparty, realization of the collateral proceeds could be delayed, during which time the value of the collateral may decline.
Restricted Securities. The Fund may invest in securities that are subject to legal or contractual restrictions on resale. These securities generally may be resold in transactions exempt from registration or to the public if the securities are registered. Disposal of these securities may involve time-consuming negotiations and expense, and prompt sale at an acceptable price may be difficult. Information regarding restricted securities is included at the end of the Fund's Schedule of Investments.
5. Purchases and Sales of Investments.
Purchases and sales of securities (including the Fixed-Income Central Funds), other than short-term securities, aggregated $57,550,487 and $107,895,882, respectively.
6. Fees and Other Transactions with Affiliates.
Management Fee. FMR and its affiliates provide the Fund with investment management related services for which the Fund pays a monthly management fee. The management fee is the sum of an individual fund fee rate that is based on an annual rate of .20% of the Fund's average net assets and a group fee rate that averaged .11% during the period. The group fee rate is based upon the average net assets of all the mutual funds advised by FMR. The group fee rate decreases as assets under management increase and increases as assets under management decrease. For the period, the total annualized management fee rate was .32% of the Fund's average net assets.
Distribution and Service Plan Fees. In accordance with Rule 12b-1 of the 1940 Act, the Fund has adopted separate 12b-1 Plans for each Service Class of shares. Each Service Class pays Fidelity Distributors Corporation (FDC), an affiliate of FMR, a service fee. For the period, the service fee is based on an annual rate of .10% of Service Class' average net assets and .25% of Service Class 2's average net assets.
For the period, total fees, all of which were re-allowed to insurance companies for the distribution of shares and providing shareholder support services were as follows:
Service Class | $ 138,275 |
Service Class 2 | 1,286,799 |
| $ 1,425,074 |
Semiannual Report
6. Fees and Other Transactions with Affiliates - continued
Transfer Agent Fees. Fidelity Investments Institutional Operations Company, Inc. (FIIOC), an affiliate of FMR, is the Fund's transfer, dividend disbursing, and shareholder servicing agent. FIIOC receives an asset-based fee with respect to each class. Each class (with the exception of Investor Class) pays a transfer agent fee, excluding out of pocket expenses, equal to an annual rate of .07% of average net assets. Investor Class pays a monthly asset-based transfer agent fee of .10% of average net assets. In addition, FIIOC receives an asset-based fee of .0045% of average net assets for typesetting, printing and mailing of shareholder reports, except proxy statements. For the period, transfer agent fees for each class, including printing and out of pocket expenses, were as follows:
Initial Class | $ 401,792 |
Service Class | 99,526 |
Service Class 2 | 367,654 |
Investor Class | 278,788 |
| $ 1,147,760 |
Accounting Fees. Fidelity Service Company, Inc.(FSC),an affiliate of FMR, maintains the Fund's accounting records. The fee is based on the level of average net assets for the month.
Interfund Lending Program. Pursuant to an Exemptive Order issued by the SEC, the Fund, along with other registered investment companies having management contracts with FMR, may participate in an interfund lending program. This program provides an alternative credit facility allowing the funds to borrow from, or lend money to, other participating affiliated funds. At period end, there were no interfund loans outstanding. The Fund's activity in this program during the period for which loans were outstanding was as follows:
Borrower or Lender | Average Daily
Loan Balance | Weighted Average Interest Rate | Interest
Expense |
Borrower | $ 40,723,000 | .40% | $ 1,810 |
7. Committed Line of Credit.
The Fund participates with other funds managed by FMR or an affiliate in a $4.0 billion credit facility (the "line of credit") to be utilized for temporary or emergency purposes to fund shareholder redemptions or for other short-term liquidity purposes. The Fund has agreed to pay commitment fees on its pro-rata portion of the line of credit, which amounted to $5,165 and is reflected in Miscellaneous expenses on the Statement of Operations. During the period, there were no borrowings on this line of credit.
8. Expense Reductions.
FMR voluntarily agreed to reimburse each class to the extent annual operating expenses exceeded certain levels of average net assets as noted in the table below. Some expenses, for example interest expense, including commitment fees, are excluded from this reimbursement.
The following classes were in reimbursement during the period:
| Expense
Limitations * | Reimbursement
from adviser |
Investor Class | 0.45% | $ 16,097 |
* Effective May 1, 2011 the expense limitations were eliminated.
Semiannual Report
Notes to Financial Statements (Unaudited) - continued
9. Distributions to Shareholders.
Distributions to shareholders of each class were as follows:
| Six months ended
June 30, 2011 | Year ended
December 31, 2010 |
From net investment income | | |
Initial Class | $ 425,657 | $ 39,652,079 |
Service Class | 108,721 | 9,934,693 |
Service Class 2 | 403,787 | 33,971,385 |
Investor Class | 201,934 | 19,376,462 |
Total | $ 1,140,099 | $ 102,934,619 |
From net realized gain | | |
Initial Class | $ 18,218,099 | $ 12,070,578 |
Service Class | 4,653,265 | 3,112,885 |
Service Class 2 | 17,282,087 | 11,186,239 |
Investor Class | 8,642,793 | 5,948,548 |
Total | $ 48,796,244 | $ 32,318,250 |
10. Share Transactions.
Transactions for each class of shares were as follows:
| Shares | Dollars |
| Six months ended June 30, 2011 | Year ended
December 31, 2010 | Six months ended June 30, 2011 | Year ended
December 31, 2010 |
Initial Class | | | | |
Shares sold | 6,776,101 | 14,591,614 | $ 87,044,820 | $ 191,644,371 |
Reinvestment of distributions | 1,484,375 | 4,047,794 | 18,643,756 | 51,722,657 |
Shares redeemed | (12,239,782) | (18,940,310) | (156,238,821) | (248,258,905) |
Net increase (decrease) | (3,979,306) | (300,902) | $ (50,550,245) | $ (4,891,877) |
Service Class | | | | |
Shares sold | 1,003,017 | 4,596,946 | $ 12,830,402 | $ 59,682,718 |
Reinvestment of distributions | 382,182 | 1,029,933 | 4,761,986 | 13,047,578 |
Shares redeemed | (2,312,109) | (4,250,312) | (29,430,821) | (55,672,659) |
Net increase (decrease) | (926,910) | 1,376,567 | $ (11,838,433) | $ 17,057,637 |
Service Class 2 | | | | |
Shares sold | 7,271,028 | 15,013,576 | $ 91,745,761 | $ 192,078,938 |
Reinvestment of distributions | 1,435,542 | 3,601,813 | 17,685,874 | 45,157,624 |
Shares redeemed | (7,535,929) | (39,548,465) | (95,064,613) | (509,866,109) |
Net increase (decrease) | 1,170,641 | (20,933,076) | $ 14,367,022 | $ (272,629,547) |
Investor Class | | | | |
Shares sold | 3,252,371 | 8,642,451 | $ 41,797,256 | $ 113,090,085 |
Reinvestment of distributions | 706,448 | 1,988,124 | 8,844,727 | 25,325,010 |
Shares redeemed | (4,870,610) | (10,609,871) | (62,248,567) | (139,139,682) |
Net increase (decrease) | (911,791) | 20,704 | $ (11,606,584) | $ (724,587) |
11. Other.
The Fund's organizational documents provide former and current trustees and officers with a limited indemnification against liabilities arising in connection with the performance of their duties to the Fund. In the normal course of business, the Fund may also enter into contracts that provide general indemnifications. The Fund's maximum exposure under these arrangements is unknown as this would be dependent on future claims that may be made against the Fund. The risk of material loss from such claims is considered remote.
At the end of the period, FMR or its affiliates were the owners of record of 27% of the total outstanding shares of the Fund and one otherwise unaffiliated shareholder was the owner of record of 22% of the total outstanding shares of the Fund.
Semiannual Report
The following are the financial statements for the Fidelity VIP Investment
Grade Central Fund as of June 30, 2011 which is a direct investment of
VIP Investment Grade Bond Portfolio.
Not Part of Financial Report
Shareholder Expense Example
As a shareholder of the Fund, you incur two types of costs: (1) transaction costs, and (2) ongoing costs, including other Fund expenses. This Example is intended to help you understand your ongoing costs (in dollars) of investing in the Fund and to compare these costs with the ongoing costs of investing in other mutual funds.
The Example is based on an investment of $1,000 invested at the beginning of the period and held for the entire period (January 1, 2011 to June 30, 2011).
Actual Expenses
The first line of the accompanying table provides information about actual account values and actual expenses. You may use the information in this line, together with the amount you invested, to estimate the expenses that you paid over the period. Simply divide your account value by $1,000.00 (for example, an $8,600 account value divided by $1,000.00 = 8.6), then multiply the result by the number in the first line under the heading entitled "Expenses Paid During Period" to estimate the expenses you paid on your account during this period.
Hypothetical Example for Comparison Purposes
The second line of the accompanying table provides information about hypothetical account values and hypothetical expenses based on the Fund's actual expense ratio and an assumed rate of return of 5% per year before expenses, which is not the Fund's actual return. The hypothetical account values and expenses may not be used to estimate the actual ending account balance or expenses you paid for the period. You may use this information to compare the ongoing costs of investing in the Fund and other funds. To do so, compare this 5% hypothetical example with the 5% hypothetical examples that appear in the shareholder reports of the other funds.
Please note that the expenses shown in the table are meant to highlight your ongoing costs only and do not reflect any transaction costs. Therefore, the second line of the table is useful in comparing ongoing costs only, and will not help you determine the relative total costs of owning different funds.
| Annualized Expense Ratio | Beginning
Account Value
January 1, 2011 | Ending
Account Value
June 30, 2011 | Expenses Paid
During Period*
January 1, 2011
to June 30, 2011 |
Actual | .0027% | $ 1,000.00 | $ 1,033.10 | $ .01 |
Hypothetical (5% return per year before expenses) | | $ 1,000.00 | $ 1,024.78 | $ .01 |
* Expenses are equal to the Fund's annualized expense ratio, multiplied by the average account value over the period, multiplied by 181/365 (to reflect the one-half year period).
Not Part of Financial Report
Investment Changes (Unaudited)
Quality Diversification (% of fund's net assets) |
As of June 30, 2011 | As of December 31, 2010 |
| U.S. Government
and U.S. Government
Agency Obligations 65.8% | | | U.S. Government
and U.S. Government
Agency Obligations † 72.9% | |
 | AAA 7.9% | | | AAA 8.2% | |
| AA 2.7% | | | AA 2.3% | |
| A 8.3% | | | A 7.9% | |
 | BBB 13.1% | | | BBB 13.5% | |
 | BB and Below 3.4% | | | BB and Below 3.2% | |
| Not Rated†† 0.0% | | | Not Rated 0.1% | |
 | Short-Term
Investments and
Net Other Assets*** (1.2)% | | | Short-Term
Investments and
Net Other Assets*** (8.1)% | |

We have used ratings from Moody's Investors Service, Inc. Where Moody's® ratings are not available, we have used S&P® ratings. All ratings are as of the date indicated and do not reflect subsequent changes. Securities rated BB or below were rated investment grade at the time of acquisition. |
Weighted Average Maturity as of June 30, 2011 |
| | 6 months ago |
Years | 6.2 | 6.2 |
This is a weighted average of all the maturities of the securities held in a fund. Weighted Average Maturity (WAM) can be used as a measure of sensitivity to interest rate changes and markets changes. Generally, the longer the maturity, the greater the sensitivity to such changes. WAM is based on the dollar-weighted average length of time until principal payments must be paid. Depending on the types of securities held in a fund, certain maturity shortening devices (e.g., demand features, interest rate resets, and call options) may be taken into account when calculating the WAM. |
Duration as of June 30, 2011 |
| | 6 months ago |
Years | 5.0 | 4.7 |
Duration estimates how much a bond fund's price will change with a change in comparable interest rates. If rates rise 1%, for example, a fund with a 5-year duration is likely to lose about 5% of its value. Other factors also can influence a bond fund's performance and share price. Accordingly, a bond fund's actual performance may differ from this example. Duration takes into account any call or put option embedded in the bonds. |
Asset Allocation (% of fund's net assets) |
As of June 30, 2011* | As of December 31, 2010** |
| Corporate Bonds 24.3% | | | Corporate Bonds 23.9% | |
| U.S. Government
and U.S. Government
Agency Obligations 65.8% | | | U.S. Government
and U.S. Government
Agency Obligations † 72.9% | |
| Asset-Backed Securities 2.6% | | | Asset-Backed Securities 2.6% | |
| CMOs and Other
Mortgage Related
Securities 8.0% | | | CMOs and Other
Mortgage Related
Securities 8.2% | |
 | Municipal Bonds 0.4% | | | Municipal Bonds 0.3% | |
 | Other Investments 0.1% | | | Other Investments 0.2% | |
 | Short-Term
Investments and
Net Other Assets*** (1.2)% | | | Short-Term
Investments and
Net Other Assets*** (8.1)% | |
* Foreign investments 3.3% | | ** Foreign investments 3.2% | |
* Futures and Swaps 2.2% | | ** Futures and Swaps 2.4% | |

*** Short-Term Investments and Net Other Assets are not included in the pie chart.
† Includes FDIC Guaranteed Corporate Securities
†† Amount represents less than 0.1%
Not Part of Financial Report
Investments June 30, 2011
Showing Percentage of Net Assets
Nonconvertible Bonds - 24.3% |
| Principal Amount | | Value |
CONSUMER DISCRETIONARY - 2.0% |
Household Durables - 0.2% |
Fortune Brands, Inc.: | | | | |
5.375% 1/15/16 | | $ 2,600,000 | | $ 2,816,037 |
5.875% 1/15/36 | | 5,675,000 | | 5,385,149 |
| | 8,201,186 |
Media - 1.8% |
AOL Time Warner, Inc. 7.625% 4/15/31 | | 1,625,000 | | 1,949,639 |
Comcast Corp.: | | | | |
4.95% 6/15/16 | | 2,975,000 | | 3,264,194 |
5.7% 5/15/18 | | 2,400,000 | | 2,676,442 |
6.4% 3/1/40 | | 2,884,000 | | 3,086,526 |
6.45% 3/15/37 | | 1,410,000 | | 1,508,073 |
COX Communications, Inc. 4.625% 6/1/13 | | 3,475,000 | | 3,689,213 |
Discovery Communications LLC: | | | | |
3.7% 6/1/15 | | 2,648,000 | | 2,785,090 |
6.35% 6/1/40 | | 2,421,000 | | 2,571,434 |
NBC Universal, Inc.: | | | | |
3.65% 4/30/15 (c) | | 1,200,000 | | 1,259,402 |
5.15% 4/30/20 (c) | | 3,234,000 | | 3,412,611 |
6.4% 4/30/40 (c) | | 3,340,000 | | 3,589,648 |
News America Holdings, Inc. 7.75% 12/1/45 | | 1,905,000 | | 2,276,233 |
News America, Inc.: | | | | |
6.15% 3/1/37 | | 1,745,000 | | 1,767,650 |
6.2% 12/15/34 | | 5,840,000 | | 5,964,205 |
Time Warner Cable, Inc.: | | | | |
5.85% 5/1/17 | | 2,467,000 | | 2,772,750 |
6.2% 7/1/13 | | 7,000,000 | | 7,676,914 |
6.75% 7/1/18 | | 4,425,000 | | 5,129,022 |
Time Warner, Inc.: | | | | |
5.875% 11/15/16 | | 5,514,000 | | 6,299,519 |
6.5% 11/15/36 | | 2,337,000 | | 2,491,520 |
Viacom, Inc.: | | | | |
3.5% 4/1/17 | | 1,312,000 | | 1,333,948 |
6.75% 10/5/37 | | 935,000 | | 1,029,765 |
| | 66,533,798 |
TOTAL CONSUMER DISCRETIONARY | | 74,734,984 |
CONSUMER STAPLES - 1.1% |
Beverages - 0.1% |
Diageo Capital PLC 5.2% 1/30/13 | | 1,705,000 | | 1,818,098 |
FBG Finance Ltd. 5.125% 6/15/15 (c) | | 2,185,000 | | 2,375,176 |
| | 4,193,274 |
|
| Principal Amount | | Value |
Food & Staples Retailing - 0.1% |
CVS Caremark Corp.: | | | | |
4.125% 5/15/21 | | $ 3,890,000 | | $ 3,787,674 |
6.302% 6/1/37 (j) | | 924,000 | | 899,745 |
| | 4,687,419 |
Food Products - 0.5% |
General Mills, Inc. 5.2% 3/17/15 | | 3,528,000 | | 3,927,493 |
Kraft Foods, Inc.: | | | | |
5.375% 2/10/20 | | 4,086,000 | | 4,464,020 |
6.125% 2/1/18 | | 3,684,000 | | 4,236,106 |
6.5% 8/11/17 | | 3,514,000 | | 4,128,623 |
| | 16,756,242 |
Tobacco - 0.4% |
Altria Group, Inc. 9.7% 11/10/18 | | 4,450,000 | | 5,844,906 |
Philip Morris International, Inc.: | | | | |
4.875% 5/16/13 | | 2,904,000 | | 3,114,650 |
5.65% 5/16/18 | | 2,751,000 | | 3,091,667 |
Reynolds American, Inc. 7.25% 6/15/37 | | 2,962,000 | | 3,192,053 |
| | 15,243,276 |
TOTAL CONSUMER STAPLES | | 40,880,211 |
ENERGY - 3.0% |
Energy Equipment & Services - 0.2% |
DCP Midstream LLC 5.35% 3/15/20 (c) | | 3,724,000 | | 3,944,718 |
El Paso Pipeline Partners Operating Co. LLC 4.1% 11/15/15 | | 3,902,000 | | 4,055,286 |
| | 8,000,004 |
Oil, Gas & Consumable Fuels - 2.8% |
Anadarko Petroleum Corp. 6.375% 9/15/17 | | 6,869,000 | | 7,869,669 |
Canadian Natural Resources Ltd. 5.7% 5/15/17 | | 5,685,000 | | 6,465,175 |
ConocoPhillips 5.75% 2/1/19 | | 3,900,000 | | 4,482,621 |
Devon Financing Corp. U.L.C. 6.875% 9/30/11 | | 3,000,000 | | 3,045,099 |
Duke Capital LLC 6.25% 2/15/13 | | 855,000 | | 920,971 |
Duke Energy Field Services 6.45% 11/3/36 (c) | | 2,477,000 | | 2,598,029 |
El Paso Natural Gas Co. 5.95% 4/15/17 | | 3,330,000 | | 3,766,426 |
EnCana Holdings Finance Corp. 5.8% 5/1/14 | | 320,000 | | 355,577 |
Kaneb Pipe Line Operations Participation LP 7.75% 2/15/12 | | 4,200,000 | | 4,344,904 |
Marathon Petroleum Corp. 5.125% 3/1/21 (c) | | 2,187,000 | | 2,246,806 |
Motiva Enterprises LLC: | | | | |
5.75% 1/15/20 (c) | | 1,496,000 | | 1,657,653 |
6.85% 1/15/40 (c) | | 5,616,000 | | 6,477,865 |
Nakilat, Inc. 6.067% 12/31/33 (c) | | 1,808,000 | | 1,862,240 |
Nonconvertible Bonds - continued |
| Principal Amount | | Value |
ENERGY - continued |
Oil, Gas & Consumable Fuels - continued |
Nexen, Inc.: | | | | |
5.875% 3/10/35 | | $ 5,405,000 | | $ 5,118,049 |
6.4% 5/15/37 | | 2,125,000 | | 2,119,719 |
NGPL PipeCo LLC 6.514% 12/15/12 (c) | | 2,360,000 | | 2,481,417 |
Pemex Project Funding Master Trust 0.8529% 12/3/12 (c)(j) | | 410,000 | | 408,975 |
Petro-Canada: | | | | |
6.05% 5/15/18 | | 1,480,000 | | 1,674,826 |
6.8% 5/15/38 | | 3,485,000 | | 3,930,829 |
Petrobras International Finance Co. Ltd.: | | | | |
3.875% 1/27/16 | | 3,612,000 | | 3,676,485 |
5.75% 1/20/20 | | 5,289,000 | | 5,642,067 |
6.875% 1/20/40 | | 2,427,000 | | 2,621,160 |
7.875% 3/15/19 | | 4,277,000 | | 5,153,143 |
Plains All American Pipeline LP/PAA Finance Corp.: | | | | |
3.95% 9/15/15 | | 2,158,000 | | 2,262,590 |
5% 2/1/21 | | 1,191,000 | | 1,210,243 |
6.125% 1/15/17 | | 1,250,000 | | 1,398,039 |
Ras Laffan Liquefied Natural Gas Co. Ltd. III: | | | | |
4.5% 9/30/12 (c) | | 2,009,000 | | 2,089,360 |
5.5% 9/30/14 (c) | | 2,808,000 | | 3,071,390 |
5.832% 9/30/16 (c) | | 1,996,188 | | 2,175,844 |
6.332% 9/30/27 (c) | | 2,415,000 | | 2,541,449 |
6.75% 9/30/19 (c) | | 1,838,000 | | 2,132,080 |
Spectra Energy Partners, LP: | | | | |
2.95% 6/15/16 | | 668,000 | | 665,613 |
4.6% 6/15/21 | | 873,000 | | 861,524 |
Suncor Energy, Inc. 6.1% 6/1/18 | | 4,665,000 | | 5,302,715 |
Transcontinental Gas Pipe Line Corp. 6.4% 4/15/16 | | 615,000 | | 712,446 |
Western Gas Partners LP 5.375% 6/1/21 | | 3,820,000 | | 3,933,645 |
| | 107,276,643 |
TOTAL ENERGY | | 115,276,647 |
FINANCIALS - 12.5% |
Capital Markets - 2.0% |
Bear Stearns Companies, Inc. 5.3% 10/30/15 | | 4,375,000 | | 4,792,751 |
BlackRock, Inc. 4.25% 5/24/21 | | 1,183,000 | | 1,162,619 |
Goldman Sachs Group, Inc.: | | | | |
3.7% 8/1/15 | | 5,186,000 | | 5,278,555 |
5.625% 1/15/17 | | 3,000,000 | | 3,174,255 |
5.95% 1/18/18 | | 755,000 | | 813,396 |
6.15% 4/1/18 | | 5,954,000 | | 6,476,761 |
|
| Principal Amount | | Value |
6.25% 2/1/41 | | $ 670,000 | | $ 675,475 |
6.75% 10/1/37 | | 3,421,000 | | 3,420,942 |
Janus Capital Group, Inc. 5.875% 9/15/11 (b) | | 2,071,000 | | 2,083,940 |
JPMorgan Chase Capital XX 6.55% 9/29/36 | | 3,090,000 | | 3,097,589 |
JPMorgan Chase Capital XXV 6.8% 10/1/37 | | 6,975,000 | | 6,899,133 |
Lazard Group LLC: | | | | |
6.85% 6/15/17 | | 3,241,000 | | 3,572,376 |
7.125% 5/15/15 | | 5,585,000 | | 6,281,958 |
Merrill Lynch & Co., Inc.: | | | | |
5.45% 2/5/13 | | 1,820,000 | | 1,921,010 |
6.4% 8/28/17 | | 1,989,000 | | 2,169,933 |
6.875% 4/25/18 | | 1,676,000 | | 1,853,441 |
Morgan Stanley: | | | | |
4% 7/24/15 | | 3,743,000 | | 3,807,660 |
4.75% 4/1/14 | | 2,554,000 | | 2,661,503 |
5.95% 12/28/17 | | 2,100,000 | | 2,256,261 |
6% 5/13/14 | | 2,392,000 | | 2,604,419 |
6.625% 4/1/18 | | 10,165,000 | | 11,192,173 |
| | 76,196,150 |
Commercial Banks - 2.4% |
Bank of America NA 5.3% 3/15/17 | | 6,480,000 | | 6,675,644 |
Credit Suisse (Guernsey) Ltd. 5.86% (d)(j) | | 4,785,000 | | 4,572,068 |
Credit Suisse New York Branch 6% 2/15/18 | | 6,110,000 | | 6,589,831 |
DBS Bank Ltd. (Singapore) 0.4808% 5/16/17 (c)(j) | | 280,110 | | 275,908 |
Discover Bank: | | | | |
7% 4/15/20 | | 1,891,000 | | 2,099,061 |
8.7% 11/18/19 | | 6,339,000 | | 7,642,875 |
Export-Import Bank of Korea 5.5% 10/17/12 | | 6,570,000 | | 6,884,309 |
Fifth Third Bancorp: | | | | |
4.5% 6/1/18 | | 1,179,000 | | 1,170,878 |
8.25% 3/1/38 | | 4,319,000 | | 5,164,073 |
Fifth Third Bank 4.75% 2/1/15 | | 487,000 | | 512,462 |
Fifth Third Capital Trust IV 6.5% 4/15/67 (j) | | 1,585,000 | | 1,557,263 |
HBOS PLC 6.75% 5/21/18 (c) | | 2,600,000 | | 2,500,862 |
Huntington Bancshares, Inc. 7% 12/15/20 | | 1,004,000 | | 1,131,297 |
KeyBank NA: | | | | |
5.45% 3/3/16 | | 1,618,000 | | 1,754,582 |
5.8% 7/1/14 | | 2,049,000 | | 2,245,774 |
6.95% 2/1/28 | | 800,000 | | 882,803 |
KeyCorp. 5.1% 3/24/21 | | 1,855,000 | | 1,888,010 |
Korea Development Bank 5.3% 1/17/13 | | 3,805,000 | | 4,005,622 |
Manufacturers & Traders Trust Co. 1.8045% 4/1/13 (j) | | 269,000 | | 268,493 |
Nonconvertible Bonds - continued |
| Principal Amount | | Value |
FINANCIALS - continued |
Commercial Banks - continued |
Marshall & Ilsley Bank: | | | | |
4.85% 6/16/15 | | $ 1,796,000 | | $ 1,892,833 |
5% 1/17/17 | | 2,918,000 | | 3,155,913 |
5.25% 9/4/12 | | 1,200,000 | | 1,244,213 |
Regions Bank: | | | | |
6.45% 6/26/37 | | 3,952,000 | | 3,698,637 |
7.5% 5/15/18 | | 2,383,000 | | 2,466,405 |
Regions Financial Corp.: | | | | |
5.75% 6/15/15 | | 814,000 | | 801,790 |
7.75% 11/10/14 | | 2,367,000 | | 2,507,029 |
SouthTrust Corp. 5.8% 6/15/14 | | 1,440,000 | | 1,580,721 |
SunTrust Banks, Inc. 3.6% 4/15/16 | | 3,163,000 | | 3,192,157 |
Wachovia Bank NA 4.875% 2/1/15 | | 4,405,000 | | 4,727,719 |
Wachovia Corp. 4.875% 2/15/14 | | 785,000 | | 834,825 |
Wells Fargo & Co.: | | | | |
3.625% 4/15/15 | | 2,350,000 | | 2,455,736 |
3.676% 6/15/16 | | 1,714,000 | | 1,759,987 |
3.75% 10/1/14 | | 3,750,000 | | 3,950,828 |
| | 92,090,608 |
Consumer Finance - 0.7% |
Capital One Financial Corp. 5.7% 9/15/11 | | 1,991,000 | | 2,010,990 |
General Electric Capital Corp.: | | | | |
2.25% 11/9/15 | | 2,597,000 | | 2,551,685 |
2.95% 5/9/16 | | 774,000 | | 777,879 |
3.5% 6/29/15 | | 799,000 | | 829,769 |
5.625% 9/15/17 | | 2,420,000 | | 2,670,187 |
5.625% 5/1/18 | | 9,700,000 | | 10,603,623 |
5.875% 1/14/38 | | 3,600,000 | | 3,641,645 |
6.375% 11/15/67 (j) | | 4,000,000 | | 4,100,000 |
| | 27,185,778 |
Diversified Financial Services - 2.3% |
Bank of America Corp. 5.75% 12/1/17 | | 12,290,000 | | 13,059,969 |
BP Capital Markets PLC: | | | | |
3.125% 10/1/15 | | 3,694,000 | | 3,790,960 |
4.742% 3/11/21 | | 3,000,000 | | 3,092,649 |
Capital One Capital V 10.25% 8/15/39 | | 1,378,000 | | 1,460,680 |
Citigroup, Inc.: | | | | |
3.953% 6/15/16 | | 3,838,000 | | 3,927,061 |
4.75% 5/19/15 | | 10,152,000 | | 10,732,197 |
5.5% 4/11/13 | | 1,390,000 | | 1,475,479 |
6.125% 5/15/18 | | 6,240,000 | | 6,868,187 |
6.5% 8/19/13 | | 8,073,000 | | 8,778,104 |
JPMorgan Chase & Co.: | | | | |
3.15% 7/5/16 | | 4,200,000 | | 4,223,562 |
4.625% 5/10/21 | | 10,000,000 | | 9,912,110 |
|
| Principal Amount | | Value |
6.3% 4/23/19 | | $ 3,920,000 | | $ 4,415,888 |
Prime Property Funding, Inc.: | | | | |
5.125% 6/1/15 (c) | | 3,844,000 | | 4,015,923 |
5.35% 4/15/12 (c) | | 1,700,000 | | 1,739,471 |
5.5% 1/15/14 (c) | | 2,405,000 | | 2,583,220 |
TECO Finance, Inc.: | | | | |
4% 3/15/16 | | 1,075,000 | | 1,125,139 |
5.15% 3/15/20 | | 1,545,000 | | 1,637,349 |
ZFS Finance USA Trust II 6.45% 12/15/65 (c)(j) | | 3,716,000 | | 3,771,740 |
ZFS Finance USA Trust IV 5.875% 5/9/62 (c)(j) | | 500,000 | | 504,730 |
ZFS Finance USA Trust V 6.5% 5/9/67 (c)(j) | | 1,016,000 | | 1,010,920 |
| | 88,125,338 |
Insurance - 1.9% |
Allstate Corp. 6.2% 5/16/14 | | 2,709,000 | | 3,064,946 |
Aon Corp.: | | | | |
3.125% 5/27/16 | | 1,851,000 | | 1,844,057 |
3.5% 9/30/15 | | 1,538,000 | | 1,580,155 |
5% 9/30/20 | | 1,792,000 | | 1,836,223 |
6.25% 9/30/40 | | 1,150,000 | | 1,197,571 |
Axis Capital Holdings Ltd. 5.75% 12/1/14 | | 420,000 | | 453,679 |
Liberty Mutual Group, Inc. 5% 6/1/21 (c) | | 3,810,000 | | 3,605,296 |
Lincoln National Corp. 7% 5/17/66 (j) | | 4,799,000 | | 4,807,638 |
Massachusetts Mutual Life Insurance Co. 8.875% 6/1/39 (c) | | 1,455,000 | | 2,015,808 |
MetLife, Inc.: | | | | |
2.375% 2/6/14 | | 2,161,000 | | 2,201,495 |
4.75% 2/8/21 | | 1,477,000 | | 1,504,638 |
5.875% 2/6/41 | | 1,140,000 | | 1,145,681 |
6.75% 6/1/16 | | 3,234,000 | | 3,762,474 |
Metropolitan Life Global Funding I 5.125% 6/10/14 (c) | | 2,884,000 | | 3,149,994 |
New York Life Global Funding 4.65% 5/9/13 (c) | | 6,045,000 | | 6,465,762 |
New York Life Insurance Co. 6.75% 11/15/39 (c) | | 1,348,000 | | 1,535,538 |
Northwestern Mutual Life Insurance Co. 6.063% 3/30/40 (c) | | 2,060,000 | | 2,171,205 |
Pacific Life Global Funding 5.15% 4/15/13 (c) | | 3,690,000 | | 3,928,625 |
Pacific Life Insurance Co. 9.25% 6/15/39 (c) | | 2,297,000 | | 2,993,471 |
Pacific LifeCorp 6% 2/10/20 (c) | | 2,514,000 | | 2,694,176 |
Prudential Financial, Inc.: | | | | |
7.375% 6/15/19 | | 1,250,000 | | 1,481,558 |
8.875% 6/15/38 (j) | | 4,682,000 | | 5,466,235 |
Symetra Financial Corp. 6.125% 4/1/16 (c) | | 6,355,000 | | 6,688,701 |
Nonconvertible Bonds - continued |
| Principal Amount | | Value |
FINANCIALS - continued |
Insurance - continued |
The Chubb Corp. 5.75% 5/15/18 | | $ 1,895,000 | | $ 2,138,473 |
Unum Group 5.625% 9/15/20 | | 2,099,000 | | 2,196,610 |
| | 69,930,009 |
Real Estate Investment Trusts - 0.7% |
AvalonBay Communities, Inc. 5.5% 1/15/12 | | 508,000 | | 520,810 |
Camden Property Trust 5.375% 12/15/13 | | 2,985,000 | | 3,252,465 |
Developers Diversified Realty Corp.: | | | | |
4.75% 4/15/18 | | 1,654,000 | | 1,629,599 |
5.375% 10/15/12 | | 1,764,000 | | 1,815,615 |
7.5% 4/1/17 | | 1,944,000 | | 2,200,313 |
Duke Realty LP 4.625% 5/15/13 | | 1,047,000 | | 1,098,142 |
Equity One, Inc.: | | | | |
5.375% 10/15/15 | | 455,000 | | 479,788 |
6% 9/15/17 | | 2,405,000 | | 2,555,988 |
Federal Realty Investment Trust: | | | | |
5.4% 12/1/13 | | 1,401,000 | | 1,507,182 |
5.9% 4/1/20 | | 1,046,000 | | 1,145,365 |
HRPT Properties Trust: | | | | |
5.75% 11/1/15 | | 1,155,000 | | 1,231,642 |
6.25% 6/15/17 | | 4,455,000 | | 4,854,306 |
UDR, Inc. 5.5% 4/1/14 | | 3,685,000 | | 3,945,898 |
United Dominion Realty Trust, Inc. 5.25% 1/15/15 | | 904,000 | | 967,932 |
| | 27,205,045 |
Real Estate Management & Development - 2.2% |
AMB Property LP 5.9% 8/15/13 | | 2,575,000 | | 2,762,130 |
BioMed Realty LP: | | | | |
3.85% 4/15/16 | | 3,700,000 | | 3,727,417 |
6.125% 4/15/20 | | 1,392,000 | | 1,479,954 |
Brandywine Operating Partnership LP: | | | | |
5.7% 5/1/17 | | 5,000,000 | | 5,357,205 |
5.75% 4/1/12 | | 1,376,000 | | 1,421,780 |
Colonial Properties Trust 5.5% 10/1/15 | | 6,290,000 | | 6,590,303 |
Digital Realty Trust LP: | | | | |
4.5% 7/15/15 | | 1,829,000 | | 1,902,815 |
5.25% 3/15/21 | | 1,953,000 | | 1,941,552 |
Duke Realty LP: | | | | |
5.4% 8/15/14 | | 2,242,000 | | 2,418,777 |
5.5% 3/1/16 | | 1,270,000 | | 1,371,319 |
5.625% 8/15/11 | | 3,781,000 | | 3,798,888 |
5.95% 2/15/17 | | 928,000 | | 1,017,376 |
6.25% 5/15/13 | | 2,913,000 | | 3,138,484 |
6.5% 1/15/18 | | 2,445,000 | | 2,717,791 |
ERP Operating LP: | | | | |
4.75% 7/15/20 | | 2,827,000 | | 2,864,907 |
|
| Principal Amount | | Value |
5.375% 8/1/16 | | $ 1,066,000 | | $ 1,169,079 |
5.5% 10/1/12 | | 3,560,000 | | 3,745,893 |
5.75% 6/15/17 | | 5,343,000 | | 5,920,140 |
Liberty Property LP: | | | | |
4.75% 10/1/20 | | 4,185,000 | | 4,195,914 |
5.5% 12/15/16 | | 2,290,000 | | 2,494,021 |
6.625% 10/1/17 | | 2,673,000 | | 3,063,763 |
Post Apartment Homes LP 6.3% 6/1/13 | | 2,679,000 | | 2,870,211 |
Reckson Operating Partnership LP 6% 3/31/16 | | 3,099,000 | | 3,318,701 |
Regency Centers LP: | | | | |
5.875% 6/15/17 | | 1,827,000 | | 2,024,026 |
6.75% 1/15/12 | | 2,035,000 | | 2,095,741 |
Simon Property Group LP: | | | | |
4.2% 2/1/15 | | 1,523,000 | | 1,619,552 |
5.1% 6/15/15 | | 2,220,000 | | 2,449,828 |
Tanger Properties LP: | | | | |
6.125% 6/1/20 | | 3,576,000 | | 3,952,095 |
6.15% 11/15/15 | | 349,000 | | 389,383 |
| | 81,819,045 |
Thrifts & Mortgage Finance - 0.3% |
Bank of America Corp.: | | | | |
5.875% 1/5/21 | | 3,450,000 | | 3,618,319 |
6.5% 8/1/16 | | 3,000,000 | | 3,344,157 |
First Niagara Financial Group, Inc. 6.75% 3/19/20 | | 3,095,000 | | 3,409,545 |
| | 10,372,021 |
TOTAL FINANCIALS | | 472,923,994 |
HEALTH CARE - 0.3% |
Health Care Providers & Services - 0.3% |
Express Scripts, Inc.: | | | | |
3.125% 5/15/16 | | 3,450,000 | | 3,469,551 |
5.25% 6/15/12 | | 3,016,000 | | 3,137,774 |
6.25% 6/15/14 | | 1,108,000 | | 1,247,371 |
Medco Health Solutions, Inc. 4.125% 9/15/20 | | 2,723,000 | | 2,623,417 |
| | 10,478,113 |
INDUSTRIALS - 0.5% |
Airlines - 0.3% |
Continental Airlines, Inc.: | | | | |
6.648% 3/15/19 | | 1,356,055 | | 1,428,876 |
6.795% 2/2/20 | | 2,152,868 | | 2,128,540 |
Northwest Airlines, Inc. pass-thru trust certificates 7.027% 11/1/19 | | 2,824,378 | | 2,880,865 |
Nonconvertible Bonds - continued |
| Principal Amount | | Value |
INDUSTRIALS - continued |
Airlines - continued |
U.S. Airways pass-thru trust certificates: | | | | |
6.85% 7/30/19 | | $ 1,111,974 | | $ 1,067,495 |
8.36% 1/20/19 | | 4,348,022 | | 4,521,943 |
| | 12,027,719 |
Industrial Conglomerates - 0.2% |
General Electric Co. 5.25% 12/6/17 | | 7,130,000 | | 7,894,015 |
TOTAL INDUSTRIALS | | 19,921,734 |
MATERIALS - 0.6% |
Chemicals - 0.3% |
Dow Chemical Co.: | | | | |
4.85% 8/15/12 | | 3,520,000 | | 3,676,084 |
7.6% 5/15/14 | | 7,213,000 | | 8,362,045 |
| | 12,038,129 |
Metals & Mining - 0.3% |
Anglo American Capital PLC 9.375% 4/8/14 (c) | | 2,675,000 | | 3,197,131 |
ArcelorMittal SA 3.75% 3/1/16 | | 996,000 | | 1,006,660 |
United States Steel Corp. 6.65% 6/1/37 | | 1,771,000 | | 1,554,053 |
Vale Overseas Ltd. 6.25% 1/23/17 | | 3,115,000 | | 3,521,993 |
| | 9,279,837 |
TOTAL MATERIALS | | 21,317,966 |
TELECOMMUNICATION SERVICES - 1.6% |
Diversified Telecommunication Services - 1.1% |
AT&T, Inc.: | | | | |
6.3% 1/15/38 | | 364,000 | | 385,468 |
6.8% 5/15/36 | | 10,939,000 | | 12,230,294 |
CenturyLink, Inc.: | | | | |
6.15% 9/15/19 | | 1,562,000 | | 1,570,102 |
6.45% 6/15/21 | | 5,761,000 | | 5,691,442 |
7.6% 9/15/39 | | 2,898,000 | | 2,787,528 |
Sprint Capital Corp. 6.875% 11/15/28 | | 3,000,000 | | 2,850,000 |
Telecom Italia Capital SA: | | | | |
4.95% 9/30/14 | | 2,000,000 | | 2,084,652 |
5.25% 10/1/15 | | 192,000 | | 199,525 |
6.999% 6/4/18 | | 3,792,000 | | 4,145,183 |
Telefonica Emisiones SAU: | | | | |
5.462% 2/16/21 | | 2,456,000 | | 2,491,607 |
5.855% 2/4/13 | | 1,438,000 | | 1,524,691 |
Verizon Communications, Inc.: | | | | |
6.1% 4/15/18 | | 2,190,000 | | 2,508,352 |
6.25% 4/1/37 | | 1,380,000 | | 1,464,441 |
|
| Principal Amount | | Value |
6.9% 4/15/38 | | $ 2,420,000 | | $ 2,776,108 |
Verizon New York, Inc. 6.875% 4/1/12 | | 1,095,000 | | 1,143,666 |
| | 43,853,059 |
Wireless Telecommunication Services - 0.5% |
AT&T Wireless Services, Inc. 8.125% 5/1/12 | | 1,130,000 | | 1,198,070 |
DIRECTV Holdings LLC/DIRECTV Financing, Inc.: | | | | |
4.75% 10/1/14 | | 3,759,000 | | 4,113,320 |
5.875% 10/1/19 | | 4,711,000 | | 5,221,724 |
6.35% 3/15/40 | | 1,471,000 | | 1,547,364 |
Sprint Nextel Corp. 6% 12/1/16 | | 2,260,000 | | 2,257,175 |
Vodafone Group PLC 5% 12/16/13 | | 2,775,000 | | 3,018,773 |
| | 17,356,426 |
TOTAL TELECOMMUNICATION SERVICES | | 61,209,485 |
UTILITIES - 2.7% |
Electric Utilities - 1.4% |
Alabama Power Co. 3.375% 10/1/20 | | 2,167,000 | | 2,092,947 |
Ameren Illinois Co. 6.125% 11/15/17 | | 1,465,000 | | 1,672,763 |
AmerenUE 6.4% 6/15/17 | | 3,819,000 | | 4,424,369 |
Commonwealth Edison Co. 1.625% 1/15/14 | | 4,011,000 | | 4,038,187 |
Duquesne Light Holdings, Inc.: | | | | |
5.9% 12/1/21 (c) | | 2,580,000 | | 2,556,734 |
6.4% 9/15/20 (c) | | 5,907,000 | | 6,106,409 |
Edison International 3.75% 9/15/17 | | 2,401,000 | | 2,410,398 |
EDP Finance BV: | | | | |
4.9% 10/1/19 (c) | | 1,100,000 | | 941,842 |
6% 2/2/18 (c) | | 1,864,000 | | 1,723,859 |
FirstEnergy Corp. 7.375% 11/15/31 | | 4,457,000 | | 5,074,887 |
FirstEnergy Solutions Corp.: | | | | |
4.8% 2/15/15 | | 990,000 | | 1,061,772 |
6.05% 8/15/21 | | 3,013,000 | | 3,239,912 |
LG&E and KU Energy LLC: | | | | |
2.125% 11/15/15 (c) | | 2,670,000 | | 2,604,225 |
3.75% 11/15/20 (c) | | 525,000 | | 494,521 |
Nevada Power Co. 6.5% 5/15/18 | | 3,165,000 | | 3,691,675 |
Pennsylvania Electric Co. 6.05% 9/1/17 | | 2,905,000 | | 3,255,692 |
Pepco Holdings, Inc. 2.7% 10/1/15 | | 2,535,000 | | 2,547,269 |
Progress Energy, Inc.: | | | | |
4.4% 1/15/21 | | 4,274,000 | | 4,318,069 |
5.625% 1/15/16 | | 2,000,000 | | 2,254,138 |
| | 54,509,668 |
Nonconvertible Bonds - continued |
| Principal Amount | | Value |
UTILITIES - continued |
Gas Utilities - 0.0% |
Southern Natural Gas Co. / Southern Natural Issuing Corp. 4.4% 6/15/21 (c) | | $ 1,182,000 | | $ 1,161,704 |
Independent Power Producers & Energy Traders - 0.3% |
Exelon Generation Co. LLC 6.2% 10/1/17 | | 6,685,000 | | 7,537,070 |
PPL Energy Supply LLC: | | | | |
6.2% 5/15/16 | | 1,229,000 | | 1,377,294 |
6.5% 5/1/18 | | 2,640,000 | | 2,977,115 |
| | 11,891,479 |
Multi-Utilities - 1.0% |
Consolidated Edison Co. of New York, Inc. 5.7% 6/15/40 | | 1,395,000 | | 1,472,996 |
Dominion Resources, Inc.: | | | | |
6.25% 6/30/12 | | 1,938,000 | | 2,039,175 |
6.3% 9/30/66 (j) | | 9,626,000 | | 9,397,383 |
MidAmerican Energy Holdings, Co.: | | | | |
5.875% 10/1/12 | | 2,880,000 | | 3,053,693 |
6.5% 9/15/37 | | 1,334,000 | | 1,503,960 |
National Grid PLC 6.3% 8/1/16 | | 4,181,000 | | 4,800,281 |
NiSource Finance Corp.: | | | | |
5.4% 7/15/14 | | 3,885,000 | | 4,269,374 |
5.45% 9/15/20 | | 613,000 | | 645,221 |
5.95% 6/15/41 | | 3,834,000 | | 3,755,576 |
6.25% 12/15/40 | | 837,000 | | 857,629 |
6.4% 3/15/18 | | 2,760,000 | | 3,125,085 |
Wisconsin Energy Corp. 6.25% 5/15/67 (j) | | 1,426,000 | | 1,434,913 |
| | 36,355,286 |
TOTAL UTILITIES | | 103,918,137 |
TOTAL NONCONVERTIBLE BONDS (Cost $856,866,677) | 920,661,271 |
U.S. Government and Government Agency Obligations - 29.4% |
|
U.S. Government Agency Obligations - 1.6% |
Fannie Mae: | | | | |
0.375% 12/28/12 | | 5,510,000 | | 5,510,446 |
0.5% 8/9/13 | | 12,915,000 | | 12,895,834 |
0.75% 2/26/13 | | 1,716,000 | | 1,724,590 |
1.125% 6/27/14 | | 382,000 | | 384,008 |
1.75% 2/22/13 | | 20,000,000 | | 20,413,740 |
2.5% 5/15/14 | | 1,167,000 | | 1,217,877 |
2.75% 3/13/14 | | 1,840,000 | | 1,935,073 |
5% 2/16/12 | | 2,860,000 | | 2,943,569 |
|
| Principal Amount | | Value |
Freddie Mac: | | | | |
0.75% 3/28/13 | | $ 942,000 | | $ 946,672 |
1% 7/30/14 | | 2,084,000 | | 2,080,849 |
1% 8/27/14 | | 1,511,000 | | 1,509,005 |
1.125% 7/27/12 | | 600,000 | | 604,819 |
1.75% 6/15/12 | | 4,185,000 | | 4,242,644 |
2.125% 3/23/12 | | 204,000 | | 206,693 |
Tennessee Valley Authority 5.375% 4/1/56 | | 2,375,000 | | 2,549,969 |
U.S. Department of Housing and Urban Development Government guaranteed participation certificates Series 1996-A, 7.63% 8/1/14 | | 250,000 | | 250,496 |
TOTAL U.S. GOVERNMENT AGENCY OBLIGATIONS | | 59,416,284 |
U.S. Treasury Inflation Protected Obligations - 3.9% |
U.S. Treasury Inflation-Indexed Bonds: | | | | |
2.125% 2/15/41 | | 2,679,922 | | 2,917,128 |
2.125% 2/15/40 (g) | | 27,194,488 | | 29,606,861 |
2.5% 1/15/29 | | 8,378,480 | | 9,746,707 |
U.S. Treasury Inflation-Indexed Notes: | | | | |
1.125% 1/15/21 | | 39,661,907 | | 41,232,393 |
1.375% 1/15/20 | | 59,836,442 | | 64,235,506 |
TOTAL U.S. TREASURY INFLATION
PROTECTED OBLIGATIONS | | 147,738,595 |
U.S. Treasury Obligations - 23.9% |
U.S. Treasury Bonds: | | | | |
4.375% 5/15/41 | | 70,329,000 | | 70,229,836 |
4.75% 2/15/41 | | 47,758,000 | | 50,765,274 |
U.S. Treasury Notes: | | | | |
1.5% 6/30/16 | | 95,588,000 | | 94,363,518 |
2.25% 1/31/15 | | 42,293,000 | | 43,984,720 |
2.375% 8/31/14 | | 115,000,000 | | 120,291,840 |
2.375% 9/30/14 | | 60,000,000 | | 62,775,000 |
2.5% 4/30/15 | | 40,000,000 | | 41,934,360 |
2.625% 7/31/14 (g) | | 265,000,000 | | 279,243,729 |
3.125% 5/15/21 | | 132,019,000 | | 131,545,052 |
3.625% 2/15/21 | | 11,497,000 | | 11,978,437 |
TOTAL U.S. TREASURY OBLIGATIONS | | 907,111,766 |
TOTAL U.S. GOVERNMENT AND GOVERNMENT AGENCY OBLIGATIONS (Cost $1,085,132,013) | 1,114,266,645 |
U.S. Government Agency - Mortgage Securities - 36.1% |
| Principal Amount | | Value |
Fannie Mae - 23.3% |
1.795% 9/1/33 (j) | | $ 724,913 | | $ 746,360 |
1.813% 5/1/34 (j) | | 1,332,161 | | 1,367,841 |
2.053% 10/1/33 (j) | | 50,191 | | 52,442 |
2.065% 7/1/35 (j) | | 46,536 | | 48,574 |
2.175% 3/1/35 (j) | | 19,809 | | 20,789 |
2.291% 10/1/33 (j) | | 1,079,619 | | 1,120,076 |
2.457% 3/1/35 (j) | | 64,738 | | 67,800 |
2.504% 8/1/36 (j) | | 1,915,382 | | 2,016,260 |
2.534% 7/1/34 (j) | | 58,694 | | 60,868 |
2.538% 7/1/35 (j) | | 127,499 | | 133,399 |
2.549% 2/1/36 (j) | | 1,357,279 | | 1,422,865 |
2.553% 10/1/33 (j) | | 95,570 | | 100,334 |
2.584% 6/1/36 (j) | | 110,584 | | 115,406 |
2.605% 11/1/36 (j) | | 1,422,498 | | 1,491,363 |
2.652% 5/1/36 (j) | | 477,889 | | 502,482 |
2.7% 12/1/35 (j) | | 552,653 | | 580,204 |
2.714% 5/1/35 (j) | | 241,541 | | 254,820 |
2.884% 9/1/36 (j) | | 1,205,940 | | 1,274,742 |
3.481% 7/1/37 (j) | | 243,872 | | 256,200 |
3.5% 9/1/25 to 3/1/41 | | 69,989,249 | | 69,026,101 |
3.5% 7/1/41 (e)(f) | | 32,000,000 | | 30,560,730 |
3.691% 5/1/40 (j) | | 1,898,908 | | 1,990,194 |
3.697% 5/1/40 (j) | | 2,260,653 | | 2,369,954 |
3.789% 6/1/40 (j) | | 1,976,491 | | 2,073,431 |
3.972% 11/1/39 (j) | | 1,692,728 | | 1,783,285 |
4% 2/1/35 to 6/1/41 | | 109,151,009 | | 109,214,631 |
4% 7/1/41 (e) | | 25,000,000 | | 24,970,895 |
4.5% 6/1/24 to 5/1/41 | | 159,267,799 | | 165,192,120 |
4.5% 7/1/26 (e) | | 8,800,000 | | 9,325,327 |
4.5% 7/1/41 (e) | | 18,000,000 | | 18,605,297 |
5% 2/1/18 to 3/1/41 (f) | | 143,349,564 | | 152,901,694 |
5% 7/1/26 (e)(f) | | 700,000 | | 750,964 |
5% 7/1/41 (e)(f) | | 11,800,000 | | 12,527,030 |
5% 7/1/41 (e)(f) | | 6,700,000 | | 7,112,805 |
5.5% 11/1/17 to 3/1/39 (f) | | 96,129,299 | | 104,441,077 |
6% 6/1/14 to 9/1/39 | | 123,744,964 | | 136,086,837 |
6% 7/1/41 (e) | | 10,500,000 | | 11,534,776 |
6.5% 6/1/13 to 2/1/36 | | 5,674,755 | | 6,241,557 |
7% 3/1/15 to 8/1/32 | | 1,831,347 | | 2,075,239 |
7.5% 7/1/16 to 11/1/31 | | 1,524,800 | | 1,731,307 |
8% 1/1/30 to 5/1/30 | | 47,777 | | 54,876 |
8.5% 3/1/25 to 6/1/25 | | 849 | | 982 |
TOTAL FANNIE MAE | | 882,203,934 |
|
| Principal Amount | | Value |
Freddie Mac - 5.1% |
2.155% 4/1/35 (j) | | $ 884,066 | | $ 930,194 |
2.357% 3/1/36 (j) | | 185,180 | | 191,264 |
2.499% 1/1/35 (j) | | 245,048 | | 256,815 |
2.92% 11/1/35 (j) | | 440,766 | | 466,160 |
2.942% 3/1/33 (j) | | 18,152 | | 19,167 |
3.281% 10/1/35 (j) | | 160,212 | | 170,826 |
3.801% 4/1/40 (j) | | 1,866,041 | | 1,955,352 |
4% 7/1/41 (e) | | 1,000,000 | | 997,898 |
4.5% 7/1/25 to 4/1/41 | | 48,015,811 | | 49,711,099 |
4.5% 7/1/41 (e) | | 12,900,000 | | 13,313,640 |
5% 1/1/38 to 9/1/40 | | 29,843,595 | | 31,747,161 |
5.5% 1/1/38 to 1/1/40 | | 68,305,472 | | 73,775,107 |
5.5% 7/1/41 (e)(f) | | 8,000,000 | | 8,637,308 |
5.5% 7/1/41 (e)(f) | | 4,500,000 | | 4,858,486 |
6% 4/1/32 to 8/1/37 | | 6,572,436 | | 7,248,931 |
7.5% 5/1/17 to 11/1/31 | | 151,074 | | 172,446 |
8% 7/1/17 to 5/1/27 | | 25,665 | | 29,157 |
8.5% 3/1/20 to 1/1/28 | | 133,525 | | 152,882 |
TOTAL FREDDIE MAC | | 194,633,893 |
Ginnie Mae - 7.7% |
3.5% 7/1/41 (e) | | 13,800,000 | | 13,381,688 |
4% 1/15/25 to 10/20/25 | | 21,629,236 | | 22,786,252 |
4% 7/1/41 (e) | | 8,500,000 | | 8,650,807 |
4.5% 3/15/39 to 4/20/41 | | 43,851,733 | | 46,315,870 |
4.5% 7/1/41 (e)(f) | | 19,000,000 | | 20,033,767 |
4.5% 7/1/41 (e)(f) | | 7,000,000 | | 7,380,862 |
4.5% 7/1/41 (e)(f) | | 14,000,000 | | 14,761,723 |
4.5% 7/1/41 (e)(f) | | 3,000,000 | | 3,163,226 |
4.5% 7/1/41 (e)(f) | | 14,000,000 | | 14,761,723 |
4.5% 7/1/41 (e)(f) | | 6,000,000 | | 6,326,453 |
4.5% 7/1/41 (e) | | 10,000,000 | | 10,544,088 |
4.5% 7/1/41 (e)(f) | | 7,000,000 | | 7,380,862 |
4.5% 7/1/41 (e) | | 20,000,000 | | 21,022,552 |
4.5% 7/1/41 (e) | | 3,000,000 | | 3,153,383 |
4.5% 7/1/41 (e) | | 10,000,000 | | 10,511,276 |
5% 3/15/38 to 11/15/40 | | 21,440,546 | | 23,319,317 |
5% 7/1/41 (e) | | 16,000,000 | | 17,334,302 |
5% 7/1/41 (e) | | 8,500,000 | | 9,208,848 |
5% 7/1/41 (e) | | 17,000,000 | | 18,417,696 |
6% 3/15/29 to 11/15/34 | | 6,560,645 | | 7,340,849 |
6.5% 10/15/34 to 11/15/35 | | 406,878 | | 462,785 |
7% 1/15/28 to 7/15/32 | | 2,988,890 | | 3,427,678 |
7.5% 4/15/22 to 10/15/28 | | 765,598 | | 876,987 |
U.S. Government Agency - Mortgage Securities - continued |
| Principal Amount | | Value |
Ginnie Mae - continued |
8% 2/15/17 to 9/15/30 | | $ 93,901 | | $ 107,614 |
8.5% 12/15/16 to 3/15/30 | | 12,395 | | 14,009 |
TOTAL GINNIE MAE | | 290,684,617 |
TOTAL U.S. GOVERNMENT AGENCY - MORTGAGE SECURITIES (Cost $1,356,239,723) | 1,367,522,444 |
Asset-Backed Securities - 2.6% |
|
Accredited Mortgage Loan Trust Series 2005-1 Class M1, 0.6558% 4/25/35 (j) | | 548,349 | | 387,936 |
ACE Securities Corp. Home Equity Loan Trust: | | | | |
Series 2004-HE1 Class M1, 0.9358% 3/25/34 (j) | | 5,177 | | 5,148 |
Series 2005-HE2 Class M2, 0.6358% 4/25/35 (j) | | 52,254 | | 50,400 |
Advanta Business Card Master Trust Series 2006-C1 Class C1, 0.6758% 10/20/14 (j) | | 169,000 | | 1,690 |
Airspeed Ltd. Series 2007-1A Class C1, 2.6871% 6/15/32 (c)(j) | | 2,669,096 | | 1,254,475 |
Ally Auto Receivables Trust: | | | | |
Series 2009-A: | | | | |
Class A3, 2.33% 6/17/13 (c) | | 1,486,365 | | 1,500,038 |
Class A4, 3% 10/15/15 (c) | | 1,600,000 | | 1,650,823 |
Series 2010-5 Class A4, 1.75% 3/15/16 | | 1,430,000 | | 1,433,357 |
Series 2011-1 Class A4, 2.23% 3/15/16 | | 6,420,000 | | 6,525,285 |
Ally Master Owner Trust: | | | | |
Series 2010-3 Class A, 2.88% 4/15/15 (c) | | 3,400,000 | | 3,497,557 |
Series 2011-1 Class A2, 2.15% 1/15/16 | | 3,150,000 | | 3,191,195 |
Series 2011-3 Class A2, 1.81% 5/15/16 | | 2,760,000 | | 2,766,119 |
AmeriCredit Automobile Receivables Trust: | | | | |
Series 2008-AF Class A3, 5.68% 12/12/12 (FSA Insured) | | 101,707 | | 101,720 |
Series 2011-1 Class A3, 1.39% 9/8/15 | | 2,660,000 | | 2,670,129 |
Ameriquest Mortgage Securities, Inc. pass-thru certificates: | | | | |
Series 2003-10 Class M1, 0.8858% 12/25/33 (j) | | 31,599 | | 25,539 |
Series 2004-R2 Class M3, 0.7358% 4/25/34 (j) | | 47,022 | | 13,521 |
|
| Principal Amount | | Value |
Series 2004-R8 Class M9, 2.9358% 9/25/34 (j) | | $ 127,968 | | $ 824 |
Series 2005-R2 Class M1, 0.6358% 4/25/35 (j) | | 727,000 | | 630,612 |
Argent Securities, Inc. pass-thru certificates: | | | | |
Series 2003-W7 Class A2, 0.974% 3/25/34 (j) | | 16,878 | | 12,693 |
Series 2004-W11 Class M2, 0.8858% 11/25/34 (j) | | 198,000 | | 171,667 |
Series 2004-W7 Class M1, 0.7358% 5/25/34 (j) | | 209,000 | | 160,619 |
Series 2006-W4 Class A2C, 0.3458% 5/25/36 (j) | | 482,747 | | 139,029 |
Asset Backed Securities Corp. Home Equity Loan Trust Series 2004-HE2 Class M1, 1.0108% 4/25/34 (j) | | 940,000 | | 759,925 |
Bank of America Auto Trust Series 2009-1A Class A4, 3.52% 6/15/16 (c) | | 3,100,000 | | 3,190,992 |
BMW Vehicle Lease Trust Series 2010-1 Class A3, 0.82% 4/15/13 | | 5,050,000 | | 5,057,250 |
Brazos Higher Education Authority, Inc. Series 2006-2 Class A9, 0.2565% 12/25/24 (j) | | 514,931 | | 453,783 |
C-BASS Trust Series 2006-CB7 Class A2, 0.2458% 10/25/36 (j) | | 9,894 | | 9,845 |
CarMax Auto Owner Trust Series 2007-2 Class C, 5.61% 11/15/13 | | 4,260,000 | | 4,278,714 |
Carmax Auto Owner Trust Series 2011-1 Class A3, 1.29% 9/15/15 | | 2,760,000 | | 2,773,821 |
Carrington Mortgage Loan Trust: | | | | |
Series 2006-FRE1 Class M1, 0.4858% 7/25/36 (j) | | 402,000 | | 22,385 |
Series 2007-RFC1 Class A3, 0.3258% 12/25/36 (j) | | 635,000 | | 194,252 |
Chrysler Financial Auto Securitization Trust Series 2010-A Class A3, 0.91% 8/8/13 | | 6,300,000 | | 6,308,792 |
Citibank Credit Card Issuance Trust Series 2009-A5 Class A5, 2.25% 12/23/14 | | 12,500,000 | | 12,797,618 |
Countrywide Home Loans, Inc.: | | | | |
Series 2003-BC1 Class B1, 5.4626% 3/25/32 (MGIC Investment Corp. Insured) (j) | | 40,946 | | 16,076 |
Series 2004-3 Class M4, 1.1558% 4/25/34 (j) | | 56,336 | | 27,714 |
Series 2004-4 Class M2, 0.9808% 6/25/34 (j) | | 207,174 | | 117,574 |
Series 2005-3 Class MV1, 0.6058% 8/25/35 (j) | | 234,899 | | 226,486 |
Series 2005-AB1 Class A2, 0.3958% 8/25/35 (j) | | 22,552 | | 22,305 |
Asset-Backed Securities - continued |
| Principal Amount | | Value |
Fannie Mae subordinate REMIC pass-thru certificates Series 2004-T5 Class AB3, 0.6598% 5/28/35 (j) | | $ 13,702 | | $ 9,962 |
Fieldstone Mortgage Investment Corp.: | | | | |
Series 2004-3 Class M5, 2.3608% 8/25/34 (j) | | 102,000 | | 59,388 |
Series 2006-3 Class 2A3, 0.3458% 11/25/36 (j) | | 1,585,000 | | 538,044 |
First Franklin Mortgage Loan Trust Series 2004-FF2 Class M3, 1.0108% 3/25/34 (j) | | 5,606 | | 2,236 |
Ford Credit Auto Lease Trust Series 2010-B Class A3, 0.91% 7/15/13 (c) | | 5,190,000 | | 5,194,100 |
Ford Credit Auto Owner Trust: | | | | |
Series 2009-D: | | | | |
Class A3, 2.17% 10/15/13 | | 1,364,451 | | 1,376,592 |
Class A4, 2.98% 8/15/14 | | 1,800,000 | | 1,858,196 |
Series 2010-B Class A3, 0.98% 10/15/14 | | 3,550,000 | | 3,564,498 |
Ford Credit Floorplan Master Owner Trust Series 2010-5 Class A1, 1.5% 9/15/15 | | 3,580,000 | | 3,594,098 |
Fremont Home Loan Trust Series 2005-A: | | | | |
Class M3, 0.6758% 1/25/35 (j) | | 334,000 | | 142,788 |
Class M4, 0.8658% 1/25/35 (j) | | 128,000 | | 34,636 |
GCO Education Loan Funding Master Trust II Series 2007-1A Class C1L, 0.6368% 2/25/47 (c)(j) | | 829,000 | | 489,110 |
GE Business Loan Trust Series 2003-1 Class A, 0.6171% 4/15/31 (c)(j) | | 84,248 | | 78,519 |
GSAMP Trust: | | | | |
Series 2004-AR1: | | | | |
Class B4, 5% 6/25/34 (c)(j) | | 145,811 | | 39,983 |
Class M1, 0.8358% 6/25/34 (j) | | 772,000 | | 524,687 |
Series 2007-HE1 Class M1, 0.4358% 3/25/47 (j) | | 289,000 | | 16,525 |
Guggenheim Structured Real Estate Funding Ltd. Series 2006-3 Class C, 0.7358% 9/25/46 (c)(j) | | 538,000 | | 107,600 |
Home Equity Asset Trust: | | | | |
Series 2003-3 Class M1, 1.4758% 8/25/33 (j) | | 259,194 | | 213,659 |
Series 2003-5 Class A2, 0.8858% 12/25/33 (j) | | 11,595 | | 8,440 |
Series 2005-5 Class 2A2, 0.4358% 11/25/35 (j) | | 21,909 | | 21,511 |
Series 2006-1 Class 2A3, 0.4108% 4/25/36 (j) | | 280,229 | | 275,111 |
HSBC Home Equity Loan Trust Series 2006-2 Class M2, 0.4758% 3/20/36 (j) | | 238,218 | | 202,665 |
|
| Principal Amount | | Value |
HSI Asset Securitization Corp. Trust Series 2007-HE1 Class 2A3, 0.3758% 1/25/37 (j) | | $ 436,000 | | $ 155,980 |
Hyundai Auto Receivables Trust Series 2009-A Class A3, 2.03% 8/15/13 | | 1,631,442 | | 1,643,314 |
JPMorgan Mortgage Acquisition Trust Series 2007-CH1: | | | | |
Class AV4, 0.3158% 11/25/36 (j) | | 438,000 | | 355,551 |
Class MV1, 0.4158% 11/25/36 (j) | | 356,000 | | 234,907 |
Keycorp Student Loan Trust Series 1999-A Class A2, 0.5765% 12/27/29 (j) | | 234,881 | | 201,997 |
Long Beach Mortgage Loan Trust Series 2004-2 Class M2, 1.2658% 6/25/34 (j) | | 31,756 | | 22,408 |
MASTR Asset Backed Securities Trust: | | | | |
Series 2006-AM3 Class M1, 0.4458% 10/25/36 (j) | | 158,000 | | 9,042 |
Series 2007-HE1 Class M1, 0.4858% 5/25/37 (j) | | 249,000 | | 12,918 |
Merrill Lynch Mortgage Investors Trust: | | | | |
Series 2003-OPT1 Class M1, 1.1608% 7/25/34 (j) | | 32,638 | | 22,494 |
Series 2006-FM1 Class A2B, 0.2958% 4/25/37 (j) | | 557,402 | | 416,978 |
Series 2006-OPT1 Class A1A, 0.4458% 6/25/35 (j) | | 536,316 | | 391,281 |
Morgan Stanley ABS Capital I Trust: | | | | |
Series 2004-HE6 Class A2, 0.5258% 8/25/34 (j) | | 20,187 | | 15,472 |
Series 2004-NC8 Class M6, 1.4358% 9/25/34 (j) | | 105,683 | | 45,272 |
Series 2005-NC1 Class M1, 0.6258% 1/25/35 (j) | | 141,000 | | 97,009 |
National Collegiate Student Loan Trust Series 2006-4 Class A1, 0.2158% 3/25/25 (j) | | 17,032 | | 17,009 |
New Century Home Equity Loan Trust: | | | | |
Series 2005-4 Class M2, 0.6958% 9/25/35 (j) | | 503,000 | | 285,054 |
Series 2005-D Class M2, 0.6558% 2/25/36 (j) | | 105,000 | | 31,397 |
Nissan Auto Receivables Owner Trust Series 2010-A Class A4, 1.31% 9/15/16 | | 2,140,000 | | 2,145,990 |
Ocala Funding LLC Series 2006-1A Class A, 1.5858% 3/20/11 (a)(c)(j) | | 414,000 | | 0 |
Park Place Securities, Inc.: | | | | |
Series 2004-WCW1: | | | | |
Class M3, 1.4358% 9/25/34 (j) | | 188,000 | | 116,826 |
Asset-Backed Securities - continued |
| Principal Amount | | Value |
Park Place Securities, Inc.: - continued | | | | |
Series 2004-WCW1: | | | | |
Class M4, 1.6358% 9/25/34 (j) | | $ 241,000 | | $ 66,970 |
Series 2005-WCH1: | | | | |
Class M2, 0.7058% 1/25/36 (j) | | 1,972,000 | | 1,854,769 |
Class M3, 0.7458% 1/25/36 (j) | | 168,000 | | 116,019 |
Class M4, 1.0158% 1/25/36 (j) | | 520,000 | | 339,840 |
Series 2005-WHQ2 Class M7, 1.4358% 5/25/35 (j) | | 1,251,000 | | 10,266 |
Residential Asset Securities Corp. Series 2007-KS2 Class AI1, 0.2558% 2/25/37 (j) | | 44,977 | | 44,776 |
Salomon Brothers Mortgage Securities VII, Inc. Series 2003-HE1 Class A, 0.9858% 4/25/33 (j) | | 1,796 | | 1,535 |
Saxon Asset Securities Trust Series 2004-1 Class M1, 0.9808% 3/25/35 (j) | | 517,272 | | 414,322 |
Sierra Receivables Funding Co. Series 2007-1A Class A2, 0.3458% 3/20/19 (FGIC Insured) (c)(j) | | 191,987 | | 183,054 |
SLM Private Credit Student Loan Trust Series 2004-A Class C, 1.197% 6/15/33 (j) | | 448,000 | | 178,713 |
Structured Asset Investment Loan Trust Series 2004-8 Class M5, 1.3358% 9/25/34 (j) | | 24,496 | | 10,736 |
Terwin Mortgage Trust Series 2003-4HE Class A1, 1.0458% 9/25/34 (j) | | 10,148 | | 7,577 |
Volkswagen Auto Lease Trust Series 2010-A Class A3, 0.99% 11/20/13 | | 5,630,000 | | 5,642,666 |
WaMu Master Note Trust Series 2006-C2A Class C2, 0.6871% 8/15/15 (c)(j) | | 2,465,000 | | 2,463,389 |
Whinstone Capital Management Ltd. Series 1A Class B3, 2.0738% 10/25/44 (c)(j) | | 630,180 | | 390,712 |
TOTAL ASSET-BACKED SECURITIES (Cost $101,190,725) | 98,746,499 |
Collateralized Mortgage Obligations - 1.7% |
|
Private Sponsor - 1.4% |
Banc of America Commercial Mortgage Trust Series 2007-2: | | | | |
Class B, 5.6578% 4/10/49 (j) | | 485,000 | | 215,839 |
Class C, 5.6578% 4/10/49 (j) | | 1,290,000 | | 516,944 |
Class D, 5.6578% 4/10/49 (j) | | 650,000 | | 228,601 |
|
| Principal Amount | | Value |
Banc of America Mortgage Securities, Inc.: | | | | |
Series 2004-B Class 1A1, 2.7465% 3/25/34 (j) | | $ 20,048 | | $ 17,256 |
Series 2005-E Class 2A7, 2.8654% 6/25/35 (j) | | 2,680,000 | | 2,087,688 |
Bear Stearns ALT-A Trust floater Series 2005-1 Class A1, 0.7458% 1/25/35 (j) | | 732,316 | | 581,178 |
Chase Mortgage Finance Trust: | | | | |
Series 2007-A1 Class 1A5, 2.9295% 2/25/37 (j) | | 379,889 | | 364,458 |
Series 2007-A2 Class 2A1, 3.0617% 7/25/37 (j) | | 208,941 | | 196,802 |
Citigroup Commercial Mortgage Trust Series 2008-C7 Class A2B, 6.091% 12/10/49 (j) | | 7,310,000 | | 7,628,768 |
Citigroup Mortgage Loan Trust Series 2004-UST1 Class A4, 2.3725% 8/25/34 (j) | | 2,198,074 | | 2,191,128 |
Credit Suisse First Boston Mortgage Securities Corp. floater Series 2007-AR7 Class 2A1, 2.8964% 11/25/34 (j) | | 725,316 | | 658,464 |
Fosse Master Issuer PLC floater Series 2006-1A: | | | | |
Class B2, 0.4355% 10/18/54 (c)(j) | | 338,932 | | 338,782 |
Class C2, 0.7455% 10/18/54 (c)(j) | | 113,426 | | 113,018 |
Class M2, 0.5255% 10/18/54 (c)(j) | | 194,877 | | 194,761 |
Gracechurch Mortgage Financing PLC floater Series 2006-1 Class D2, 0.73% 11/20/56 (c)(j) | | 863,000 | | 854,382 |
Granite Master Issuer PLC floater: | | | | |
Series 2006-1A Class C2, 1.3858% 12/20/54 (c)(j) | | 2,117,000 | | 1,217,275 |
Series 2006-2 Class C1, 0.6558% 12/20/54 (j) | | 1,885,000 | | 1,083,875 |
Series 2006-3 Class C2, 0.6858% 12/20/54 (j) | | 396,000 | | 227,700 |
Series 2006-4: | | | | |
Class B1, 0.2758% 12/20/54 (j) | | 1,059,000 | | 878,970 |
Class C1, 0.5658% 12/20/54 (j) | | 647,000 | | 372,025 |
Class M1, 0.3558% 12/20/54 (j) | | 279,000 | | 202,833 |
Series 2007-1: | | | | |
Class 1C1, 0.7858% 12/20/54 (j) | | 654,000 | | 376,050 |
Class 1M1, 0.4858% 12/20/54 (j) | | 425,000 | | 308,975 |
Class 2C1, 1.1458% 12/20/54 (j) | | 298,000 | | 171,350 |
Class 2M1, 0.6858% 12/20/54 (j) | | 546,000 | | 396,942 |
Collateralized Mortgage Obligations - continued |
| Principal Amount | | Value |
Private Sponsor - continued |
Granite Master Issuer PLC floater: - continued | | | | |
Series 2007-2 Class 2C1, 0.6153% 12/17/54 (j) | | $ 757,000 | | $ 435,275 |
Granite Mortgages PLC floater Series 2003-3 Class 1C, 2.724% 1/20/44 (j) | | 151,584 | | 107,056 |
GSR Mortgage Loan Trust Series 2007-AR2 Class 2A1, 2.7426% 4/25/35 (j) | | 1,031,329 | | 857,117 |
Harborview Mortgage Loan Trust floater Series 2005-2 Class 2A1A, 0.4058% 5/19/35 (j) | | 125,979 | | 80,140 |
JPMorgan Chase Commercial Mortgage Securities Trust Series 2007-CB18 Class A3, 5.447% 6/12/47 (j) | | 6,230,000 | | 6,543,648 |
JPMorgan Mortgage Trust: | | | | |
Series 2004-A5 Class 2A1, 2.6022% 12/25/34 (j) | | 698,286 | | 637,135 |
Series 2006-A2 Class 5A1, 2.9693% 11/25/33 (j) | | 831,000 | | 775,394 |
Series 2007-A1 Class 1A1, 3.0062% 7/25/35 (j) | | 2,041,241 | | 1,886,110 |
MASTR Adjustable Rate Mortgages Trust Series 2007-3 Class 22A2, 0.3958% 5/25/47 (j) | | 326,929 | | 221,152 |
Merrill Lynch Alternative Note Asset Trust floater Series 2007-OAR1 Class A1, 0.3558% 2/25/37 (j) | | 490,304 | | 328,637 |
Merrill Lynch Floating Trust floater Series 2006-1: | | | | |
Class C, 0.377% 6/15/22 (c)(j) | | 449,000 | | 423,183 |
Class D, 0.387% 6/15/22 (c)(j) | | 173,000 | | 162,188 |
Class E, 0.397% 6/15/22 (c)(j) | | 276,000 | | 255,990 |
Class F, 0.427% 6/15/22 (c)(j) | | 498,000 | | 456,915 |
Class G, 0.497% 6/15/22 (c)(j) | | 103,000 | | 92,443 |
Class H, 0.517% 6/15/22 (c)(j) | | 207,000 | | 182,160 |
Class J, 0.557% 6/15/22 (c)(j) | | 242,000 | | 210,540 |
Merrill Lynch-CFC Commercial Mortgage Trust Series 2006-3 Class ASB, 5.382% 7/12/46 (j) | | 4,570,000 | | 4,803,749 |
Opteum Mortgage Acceptance Corp. floater Series 2005-3 Class APT, 0.4758% 7/25/35 (j) | | 754,482 | | 596,723 |
Option One Mortgage Loan Trust floater Series 2007-CP1 Class M1, 0.4858% 3/25/37 (j) | | 861,000 | | 56,479 |
Provident Funding Mortgage Loan Trust Series 2005-2 Class 3A, 2.7961% 10/25/35 (j) | | 1,469,441 | | 1,223,324 |
RESI Finance LP/RESI Finance DE Corp. floater Series 2003-B Class B5, 2.5396% 7/10/35 (c)(j) | | 268,565 | | 210,823 |
|
| Principal Amount | | Value |
Residential Asset Mortgage Products, Inc. sequential payer Series 2003-SL1 Class A31, 7.125% 4/25/31 | | $ 51,977 | | $ 55,185 |
Residential Funding Securities Corp. floater Series 2003-RP2 Class A1, 0.6358% 6/25/33 (c)(j) | | 77,304 | | 71,274 |
Sequoia Mortgage Trust floater Series 2004-6 Class A3B, 0.8997% 7/20/34 (j) | | 13,275 | | 9,531 |
TBW Mortgage-Backed pass-thru certificates floater Series 2006-4 Class A3, 0.3948% 9/25/36 (j) | | 1,153,000 | | 854,152 |
Wells Fargo Mortgage Backed Securities Trust: | | | | |
Series 2004-H Class A1, 3.498% 6/25/34 (j) | | 597,750 | | 573,971 |
Series 2005-AR10 Class 2A2, 2.795% 6/25/35 (j) | | 2,549,562 | | 2,475,605 |
Series 2005-AR12: | | | | |
Class 2A5, 2.7732% 7/25/35 (j) | | 3,520,255 | | 3,220,868 |
Class 2A6, 2.7732% 7/25/35 (j) | | 3,298,220 | | 3,003,792 |
Series 2005-AR3 Class 2A1, 2.8609% 3/25/35 (j) | | 682,751 | | 609,634 |
TOTAL PRIVATE SPONSOR | | 52,844,257 |
U.S. Government Agency - 0.3% |
Fannie Mae planned amortization class: | | | | |
Series 1999-54 Class PH, 6.5% 11/18/29 | | 1,601,632 | | 1,774,181 |
Series 1999-57 Class PH, 6.5% 12/25/29 | | 1,155,504 | | 1,302,701 |
Fannie Mae subordinate REMIC pass-thru certificates: | | | | |
planned amortization class: | | | | |
Series 2002-9 Class PC, 6% 3/25/17 | | 166,460 | | 180,541 |
Series 2004-81 Class KD, 4.5% 7/25/18 | | 2,625,000 | | 2,741,617 |
sequential payer Series 2004-86 Class KC, 4.5% 5/25/19 | | 325,427 | | 340,767 |
Freddie Mac Multi-class participation certificates guaranteed planned amortization class Series 2500 Class TE, 5.5% 9/15/17 | | 4,056,827 | | 4,378,959 |
Ginnie Mae guaranteed REMIC pass-thru certificates Series 2007-35 Class SC, 39.0867% 6/16/37 (j)(l) | | 136,396 | | 247,146 |
TOTAL U.S. GOVERNMENT AGENCY | | 10,965,912 |
TOTAL COLLATERALIZED MORTGAGE OBLIGATIONS (Cost $64,369,629) | 63,810,169 |
Commercial Mortgage Securities - 6.6% |
| Principal Amount | | Value |
Asset Securitization Corp. Series 1997-D5: | | | | |
Class A2, 6.8313% 2/14/43 (j) | | $ 1,435,000 | | $ 1,503,311 |
Class A3, 6.8813% 2/14/43 (j) | | 1,545,000 | | 1,643,448 |
Banc of America Commercial Mortgage Trust: | | | | |
sequential payer: | | | | |
Series 2006-2 Class AAB, 5.7159% 5/10/45 (j) | | 2,097,405 | | 2,236,626 |
Series 2006-5: | | | | |
Class A2, 5.317% 9/10/47 | | 8,121,350 | | 8,234,973 |
Class A3, 5.39% 9/10/47 | | 1,985,000 | | 2,053,649 |
Series 2007-3 Class A3, 5.6243% 6/10/49 (j) | | 6,100,000 | | 6,439,912 |
Banc of America Commercial Mortgage, Inc.: | | | | |
sequential payer: | | | | |
Series 2005-1 Class A3, 4.877% 11/10/42 | | 864,494 | | 866,925 |
Series 2007-1 Class A2, 5.381% 1/15/49 | | 1,517,709 | | 1,529,174 |
Series 2001-3 Class H, 6.562% 4/11/37 (c) | | 4,889,139 | | 4,905,589 |
Banc of America Large Loan, Inc. floater: | | | | |
Series 2005-MIB1: | | | | |
Class F, 0.6571% 3/15/22 (c)(j) | | 217,000 | | 211,033 |
Class G, 0.7171% 3/15/22 (c)(j) | | 141,000 | | 131,483 |
Series 2006-BIX1: | | | | |
Class F, 0.4971% 10/15/19 (c)(j) | | 558,000 | | 523,125 |
Class G, 0.5171% 10/15/19 (c)(j) | | 380,000 | | 342,950 |
Bayview Commercial Asset Trust: | | | | |
floater: | | | | |
Series 2004-1: | | | | |
Class A, 0.5458% 4/25/34 (c)(j) | | 478,948 | | 418,475 |
Class B, 2.0858% 4/25/34 (c)(j) | | 37,639 | | 22,323 |
Class M1, 0.7458% 4/25/34 (c)(j) | | 30,669 | | 23,316 |
Class M2, 1.3858% 4/25/34 (c)(j) | | 27,482 | | 19,881 |
Series 2004-2: | | | | |
Class A, 0.6158% 8/25/34 (c)(j) | | 380,090 | | 325,787 |
Class M1, 0.7658% 8/25/34 (c)(j) | | 61,387 | | 43,016 |
Series 2004-3: | | | | |
Class A1, 0.5558% 1/25/35 (c)(j) | | 763,472 | | 663,282 |
Class A2, 0.6058% 1/25/35 (c)(j) | | 99,380 | | 85,958 |
|
| Principal Amount | | Value |
Class M1, 0.6858% 1/25/35 (c)(j) | | $ 101,718 | | $ 72,177 |
Class M2, 1.1858% 1/25/35 (c)(j) | | 65,766 | | 44,835 |
Series 2005-2A: | | | | |
Class A1, 0.4958% 8/25/35 (c)(j) | | 414,399 | | 345,783 |
Class M1, 0.6158% 8/25/35 (c)(j) | | 30,726 | | 19,982 |
Class M2, 0.6658% 8/25/35 (c)(j) | | 50,536 | | 30,063 |
Class M3, 0.6858% 8/25/35 (c)(j) | | 27,896 | | 15,947 |
Series 2005-3A: | | | | |
Class A1, 0.5058% 11/25/35 (c)(j) | | 228,313 | | 188,246 |
Class A2, 0.5858% 11/25/35 (c)(j) | | 147,939 | | 122,525 |
Series 2005-4A: | | | | |
Class A2, 0.5758% 1/25/36 (c)(j) | | 827,979 | | 690,805 |
Class M1, 0.6358% 1/25/36 (c)(j) | | 173,242 | | 115,653 |
Class M2, 0.6558% 1/25/36 (c)(j) | | 52,263 | | 31,882 |
Class M3, 0.6858% 1/25/36 (c)(j) | | 75,975 | | 43,838 |
Series 2006-1 Class A2, 0.5458% 4/25/36 (c)(j) | | 81,460 | | 67,143 |
Series 2006-2A: | | | | |
Class A1, 0.4158% 7/25/36 (c)(j) | | 813,949 | | 647,232 |
Class A2, 0.4658% 7/25/36 (c)(j) | | 73,471 | | 57,320 |
Class M1, 0.4958% 7/25/36 (c)(j) | | 77,144 | | 49,700 |
Class M2, 0.5158% 7/25/36 (c)(j) | | 54,578 | | 32,712 |
Class M6, 0.7258% 7/25/36 (c)(j) | | 55,628 | | 22,904 |
Series 2006-3A: | | | | |
Class M5, 0.6658% 10/25/36 (c)(j) | | 66,881 | | 16,051 |
Class M6, 0.7458% 10/25/36 (c)(j) | | 130,607 | | 24,162 |
Series 2006-4A: | | | | |
Class A1, 0.4158% 12/25/36 (c)(j) | | 482,528 | | 376,372 |
Class A2, 0.4558% 12/25/36 (c)(j) | | 1,075,402 | | 795,798 |
Class M1, 0.4758% 12/25/36 (c)(j) | | 77,928 | | 33,759 |
Series 2007-1: | | | | |
Class A2, 0.4558% 3/25/37 (c)(j) | | 204,700 | | 136,126 |
Class B3, 3.5358% 3/25/37 (c)(j) | | 95,419 | | 5,248 |
Commercial Mortgage Securities - continued |
| Principal Amount | | Value |
Bayview Commercial Asset Trust: - continued | | | | |
floater: | | | | |
Series 2007-2A: | | | | |
Class A1, 0.4558% 7/25/37 (c)(j) | | $ 191,399 | | $ 141,748 |
Class A2, 0.5058% 7/25/37 (c)(j) | | 179,149 | | 108,458 |
Class B1, 1.7858% 7/25/37 (c)(j) | | 168,431 | | 14,654 |
Class B2, 2.4358% 7/25/37 (c)(j) | | 145,463 | | 8,626 |
Class B3, 3.5358% 7/25/37 (c)(j) | | 164,603 | | 6,796 |
Class M2, 0.5958% 7/25/37 (c)(j) | | 99,527 | | 24,557 |
Class M3, 0.6758% 7/25/37 (c)(j) | | 99,527 | | 19,231 |
Class M4, 0.8358% 7/25/37 (c)(j) | | 210,539 | | 33,379 |
Class M5, 0.9358% 7/25/37 (c)(j) | | 187,571 | | 26,070 |
Class M6, 1.1858% 7/25/37 (c)(j) | | 233,507 | | 26,678 |
Series 2007-3: | | | | |
Class A2, 0.4758% 7/25/37 (c)(j) | | 297,587 | | 202,147 |
Class B1, 1.1358% 7/25/37 (c)(j) | | 137,540 | | 18,534 |
Class B2, 1.7858% 7/25/37 (c)(j) | | 480,765 | | 48,022 |
Class B3, 4.1858% 7/25/37 (c)(j) | | 168,475 | | 8,451 |
Class M1, 0.4958% 7/25/37 (c)(j) | | 121,910 | | 46,035 |
Class M2, 0.5258% 7/25/37 (c)(j) | | 128,162 | | 40,195 |
Class M3, 0.5558% 7/25/37 (c)(j) | | 280,082 | | 73,179 |
Class M4, 0.6858% 7/25/37 (c)(j) | | 442,629 | | 101,819 |
Class M5, 0.7858% 7/25/37 (c)(j) | | 165,673 | | 33,187 |
Class M6, 0.9858% 7/25/37 (c)(j) | | 125,036 | | 21,211 |
Series 2007-4A: | | | | |
Class B1, 2.7358% 9/25/37 (c)(j) | | 237,336 | | 7,120 |
Class B2, 3.6358% 9/25/37 (c)(j) | | 1,159,673 | | 34,790 |
Class M4, 1.7858% 9/25/37 (c)(j) | | 764,386 | | 61,151 |
Class M5, 1.9358% 9/25/37 (c)(j) | | 764,386 | | 53,507 |
Class M6, 2.1358% 9/25/37 (c)(j) | | 764,386 | | 38,219 |
Series 2004-1 Class IO, 1.25% 4/25/34 (c)(k) | | 1,372,593 | | 55,178 |
|
| Principal Amount | | Value |
Bear Stearns Commercial Mortgage Securities Trust: | | | | |
floater: | | | | |
Series 2006-BBA7: | | | | |
Class G, 0.6271% 3/15/19 (c)(j) | | $ 284,000 | | $ 282,459 |
Class H, 0.8371% 3/15/19 (c)(j) | | 191,000 | | 179,523 |
Class J, 1.0371% 3/15/19 (c)(j) | | 143,000 | | 117,624 |
Series 2007-BBA8: | | | | |
Class D, 0.4371% 3/15/22 (c)(j) | | 147,000 | | 135,166 |
Class E, 0.4871% 3/15/22 (c)(j) | | 763,000 | | 694,643 |
Class F, 0.5371% 3/15/22 (c)(j) | | 468,000 | | 417,160 |
Class G, 0.5871% 3/15/22 (c)(j) | | 120,000 | | 103,541 |
Class H, 0.7371% 3/15/22 (c)(j) | | 147,000 | | 123,695 |
Class J, 0.8871% 3/15/22 (c)(j) | | 147,000 | | 114,323 |
Series 2006-PW13 Class A3, 5.518% 9/11/41 | | 2,010,000 | | 2,095,049 |
Series 2007-PW16: | | | | |
Class B, 5.716% 6/11/40 (c)(j) | | 1,405,000 | | 775,527 |
Class C, 5.716% 6/11/40 (c)(j) | | 1,170,000 | | 534,625 |
Class D, 5.716% 6/11/40 (c)(j) | | 1,170,000 | | 490,112 |
C-BASS Trust floater Series 2006-SC1 Class A, 0.4558% 5/25/36 (c)(j) | | 288,572 | | 216,779 |
Citigroup Commercial Mortgage Trust: | | | | |
floater Series 2006-FL2: | | | | |
Class G, 0.5196% 8/15/21 (c)(j) | | 156,000 | | 151,244 |
Class H, 0.5596% 8/15/21 (c)(j) | | 125,000 | | 115,000 |
sequential payer Series 2006-C5 Class A4, 5.431% 10/15/49 | | 3,810,000 | | 4,135,257 |
Series 2007-C6 Class A1, 5.622% 12/10/49 (j) | | 3,773,976 | | 3,769,587 |
Series 2007-FL3A Class A2, 0.3271% 4/15/22 (c)(j) | | 2,595,000 | | 2,471,709 |
Citigroup/Deutsche Bank Commercial Mortgage Trust: | | | | |
sequential payer Series 2007-CD4 Class A4, 5.322% 12/11/49 | | 2,960,000 | | 3,140,686 |
Series 2007-CD4 Class A3, 5.293% 12/11/49 | | 6,065,000 | | 6,255,008 |
Commercial Mortgage Securities - continued |
| Principal Amount | | Value |
COMM pass-thru certificates: | | | | |
floater: | | | | |
Series 2005-F10A: | | | | |
Class D, 0.4971% 4/15/17 (c)(j) | | $ 335,000 | | $ 301,500 |
Class E, 0.5571% 4/15/17 (c)(j) | | 107,000 | | 94,695 |
Class F, 0.5971% 4/15/17 (c)(j) | | 60,000 | | 50,700 |
Class G, 0.7371% 4/15/17 (c)(j) | | 60,000 | | 49,800 |
Class H, 0.8071% 4/15/17 (c)(j) | | 60,000 | | 45,600 |
Class J, 1.0371% 4/15/17 (c)(j) | | 46,000 | | 28,520 |
Series 2005-FL11: | | | | |
Class F, 0.6371% 11/15/17 (c)(j) | | 65,513 | | 59,617 |
Class G, 0.6871% 11/15/17 (c)(j) | | 45,227 | | 40,026 |
sequential payer Series 2006-CN2A: | | | | |
Class A2FX, 5.449% 2/5/19 (c) | | 2,775,000 | | 2,775,000 |
Class AJFX, 5.478% 2/5/19 (c) | | 2,110,000 | | 2,127,124 |
Credit Suisse Commercial Mortgage Trust: | | | | |
sequential payer: | | | | |
Series 2007-C2 Class A2, 5.448% 1/15/49 (j) | | 3,858,258 | | 3,900,088 |
Series 2007-C3 Class A4, 5.7159% 6/15/39 (j) | | 3,750,000 | | 3,967,926 |
Series 2006-C4 Class AAB, 5.439% 9/15/39 | | 5,350,000 | | 5,567,008 |
Series 2007-C5 Class A4, 5.695% 9/15/40 (j) | | 2,750,000 | | 2,915,133 |
Credit Suisse First Boston Mortgage Securities Corp.: | | | | |
sequential payer Series 2004-C1: | | | | |
Class A3, 4.321% 1/15/37 | | 524,915 | | 530,237 |
Class A4, 4.75% 1/15/37 | | 3,035,000 | | 3,203,615 |
Series 1997-C2 Class D, 7.27% 1/17/35 | | 11,705 | | 11,715 |
Series 2001-CKN5 Class AX, 1.9052% 9/15/34 (c)(j)(k) | | 10,239,215 | | 6,200 |
Series 2002-CP3 Class G, 6.639% 7/15/35 (c) | | 250,000 | | 248,932 |
Series 2006-C1 Class A3, 5.5396% 2/15/39 (j) | | 2,756,218 | | 2,908,003 |
Credit Suisse Mortgage Capital Certificates floater Series 2007-TFL1: | | | | |
Class B, 0.3371% 2/15/22 (c)(j) | | 3,470,000 | | 3,157,700 |
Class C: | | | | |
0.3571% 2/15/22 (c)(j) | | 657,000 | | 591,300 |
0.4571% 2/15/22 (c)(j) | | 234,000 | | 201,240 |
Class F, 0.5071% 2/15/22 (c)(j) | | 469,000 | | 393,960 |
|
| Principal Amount | | Value |
GE Capital Commercial Mortgage Corp. sequential payer Series 2007-C1 Class A4, 5.543% 12/10/49 | | $ 4,470,000 | | $ 4,771,103 |
Greenwich Capital Commercial Funding Corp.: | | | | |
floater Series 2006-FL4 Class B, 0.3802% 11/5/21 (c)(j) | | 3,490,000 | | 3,217,976 |
sequential payer Series 2007-GG11 Class A2, 5.597% 12/10/49 | | 13,805,000 | | 14,408,983 |
Series 2006-GG7 Class A3, 5.881% 7/10/38 (j) | | 3,460,000 | | 3,650,606 |
GS Mortgage Securities Corp. II: | | | | |
floater: | | | | |
Series 2006-FL8A: | | | | |
Class E, 0.5602% 6/6/20 (c)(j) | | 1,821,615 | | 1,669,737 |
Class F, 0.6302% 6/6/20 (c)(j) | | 294,000 | | 263,240 |
Series 2007-EOP: | | | | |
Class C, 2.1455% 3/6/20 (c)(j) | | 1,335,000 | | 1,318,521 |
Class D, 2.3636% 3/6/20 (c)(j) | | 400,000 | | 395,157 |
Class E, 2.6688% 3/6/20 (c)(j) | | 670,000 | | 662,441 |
Class F, 2.8433% 3/6/20 (c)(j) | | 335,000 | | 330,629 |
Class G, 3.0177% 3/6/20 (c)(j) | | 165,000 | | 162,942 |
Class H, 3.5846% 3/6/20 (c)(j) | | 275,000 | | 272,758 |
Class J, 4.4568% 3/6/20 (c)(j) | | 395,000 | | 393,620 |
GS Mortgage Securities Corp. II: | | | | |
sequential payer Series 2004-GG2 Class A4, 4.964% 8/10/38 | | 2,725,000 | | 2,745,046 |
Series 2006-GG6 Class A2, 5.506% 4/10/38 | | 1,867,493 | | 1,867,004 |
GS Mortgage Securities Trust sequential payer Series 2007-GG10: | | | | |
Class A2, 5.778% 8/10/45 | | 4,881,941 | | 5,009,006 |
Class A4, 5.8074% 8/10/45 (j) | | 2,280,000 | | 2,447,809 |
JP Morgan Chase Commercial Mortgage Securities Trust: | | | | |
sequential payer Series 2006-CB14 Class A3B, 5.4796% 12/12/44 (j) | | 4,625,000 | | 4,739,960 |
Series 2005-LDP3 Class A3, 4.959% 8/15/42 | | 3,938,746 | | 4,071,794 |
Commercial Mortgage Securities - continued |
| Principal Amount | | Value |
JPMorgan Chase Commercial Mortgage Securities Trust: | | | | |
floater Series 2006-FLA2: | | | | |
Class E, 0.4671% 11/15/18 (c)(j) | | $ 89,312 | | $ 81,274 |
Class F, 0.5171% 11/15/18 (c)(j) | | 133,968 | | 119,231 |
Class G, 0.5471% 11/15/18 (c)(j) | | 116,714 | | 100,374 |
Class H, 0.6871% 11/15/18 (c)(j) | | 89,332 | | 73,252 |
sequential payer: | | | | |
Series 2006-LDP9 Class A2, 5.134% 5/15/47 (j) | | 4,707,682 | | 4,824,779 |
Series 2007-LDPX Class A3, 5.42% 1/15/49 | | 3,796,000 | | 4,070,070 |
Series 2007-CB19: | | | | |
Class B, 5.7416% 2/12/49 (j) | | 755,000 | | 386,585 |
Class C, 5.7416% 2/12/49 (j) | | 1,971,000 | | 915,957 |
Class D, 5.7416% 2/12/49 (j) | | 2,075,000 | | 825,030 |
Series 2007-LDP10: | | | | |
Class BS, 5.437% 1/15/49 (j) | | 1,725,000 | | 639,526 |
Class CS, 5.466% 1/15/49 (j) | | 745,000 | | 275,758 |
Class ES, 5.5411% 1/15/49 (c)(j) | | 4,663,000 | | 620,107 |
LB Commercial Conduit Mortgage Trust sequential payer Series 2007-C3 Class A4, 5.9608% 7/15/44 (j) | | 3,733,000 | | 4,057,219 |
LB-UBS Commercial Mortgage Trust: | | | | |
sequential payer: | | | | |
Series 2005-C3 Class A2, 4.553% 7/15/30 | | 732,358 | | 733,189 |
Series 2006-C1 Class A2, 5.084% 2/15/31 | | 451,987 | | 454,722 |
Series 2006-C6 Class A2, 5.262% 9/15/39 (j) | | 1,485,013 | | 1,487,624 |
Series 2006-C7 Class A1, 5.279% 11/15/38 | | 59,812 | | 59,969 |
Series 2007-C1: | | | | |
Class A1, 5.391% 2/15/40 (j) | | 172,053 | | 173,079 |
Class A3, 5.398% 2/15/40 | | 5,000,000 | | 5,175,875 |
Class A4, 5.424% 2/15/40 | | 8,620,000 | | 9,290,355 |
Series 2007-C2 Class A3, 5.43% 2/15/40 | | 1,165,000 | | 1,241,641 |
Series 2001-C3 Class B, 6.512% 6/15/36 | | 1,810,000 | | 1,811,760 |
Lehman Brothers Floating Rate Commercial Mortgage Trust floater Series 2006-LLFA: | | | | |
Class F, 0.5271% 9/15/21 (c)(j) | | 402,971 | | 346,555 |
Class G, 0.5471% 9/15/21 (c)(j) | | 795,609 | | 652,400 |
Class H, 0.5871% 9/15/21 (c)(j) | | 204,773 | | 163,819 |
|
| Principal Amount | | Value |
Merrill Lynch Mortgage Trust: | | | | |
sequential payer: | | | | |
Series 2004-KEY2 Class A2, 4.166% 8/12/39 | | $ 99,483 | | $ 100,063 |
Series 2005-MCP1 Class A2, 4.556% 6/12/43 | | 499,788 | | 505,129 |
Series 2007-C1 Class A4, 5.8262% 6/12/50 (j) | | 3,796,000 | | 4,140,717 |
Merrill Lynch-CFC Commercial Mortgage Trust: | | | | |
sequential payer: | | | | |
Series 2007-5 Class A3, 5.364% 8/12/48 | | 4,298,000 | | 4,429,649 |
Series 2007-6 Class A4, 5.485% 3/12/51 (j) | | 3,875,000 | | 4,115,725 |
Series 2007-9 Class A4, 5.7% 9/12/49 | | 5,500,000 | | 5,922,826 |
Series 2007-7 Class B, 5.7436% 6/12/50 (j) | | 770,000 | | 215,215 |
Morgan Stanley Capital I Trust: | | | | |
floater: | | | | |
Series 2006-XLF Class C, 1.387% 7/15/19 (c)(j) | | 113,478 | | 62,413 |
Series 2007-XCLA Class A1, 0.387% 7/17/17 (c)(j) | | 376,461 | | 353,873 |
Series 2007-XLFA: | | | | |
Class D, 0.377% 10/15/20 (c)(j) | | 235,000 | | 209,580 |
Class E, 0.437% 10/15/20 (c)(j) | | 294,000 | | 259,892 |
Class F, 0.487% 10/15/20 (c)(j) | | 176,000 | | 146,051 |
Class G, 0.527% 10/15/20 (c)(j) | | 218,000 | | 169,820 |
Class H, 0.617% 10/15/20 (c)(j) | | 137,000 | | 98,632 |
Class J, 0.767% 10/15/20 (c)(j) | | 157,000 | | 82,504 |
Class NHRO, 1.077% 10/15/20 (c)(j) | | 87,956 | | 72,124 |
sequential payer: | | | | |
Series 2007-HQ11 Class A31, 5.439% 2/12/44 (j) | | 4,785,000 | | 5,024,058 |
Series 2007-IQ13 Class A1, 5.05% 3/15/44 | | 649,230 | | 653,172 |
Series 2005-IQ9 Class X2, 1.0897% 7/15/56 (c)(j)(k) | | 17,246,513 | | 101,166 |
Series 2007-HQ12 Class A2, 5.5934% 4/12/49 (j) | | 4,552,251 | | 4,620,760 |
Series 2007-IQ14 Class B, 5.7248% 4/15/49 (j) | | 2,175,000 | | 1,109,250 |
Providence Place Group Ltd. Partnership Series 2000-C1 Class A2, 7.75% 7/20/28 (c) | | 3,115,229 | | 3,536,720 |
Commercial Mortgage Securities - continued |
| Principal Amount | | Value |
Wachovia Bank Commercial Mortgage Trust: | | | | |
floater: | | | | |
Series 2005-WL5A Class K, 1.3871% 1/15/18 (c)(j) | | $ 449,000 | | $ 430,928 |
Series 2006-WL7A: | | | | |
Class E, 0.4653% 9/15/21 (c)(j) | | 491,000 | | 423,771 |
Class F, 0.5253% 8/11/18 (c)(j) | | 661,000 | | 563,386 |
Class G, 0.5453% 8/11/18 (c)(j) | | 626,000 | | 504,290 |
Class J, 0.7853% 8/11/18 (c)(j) | | 139,000 | | 92,111 |
Series 2007-WHL8: | | | | |
Class AP2, 0.9871% 6/15/20 (c)(j) | | 53,945 | | 47,472 |
Class F, 0.6671% 6/15/20 (c)(j) | | 1,046,000 | | 774,040 |
sequential payer: | | | | |
Series 2003-C7 Class A1, 4.241% 10/15/35 (c) | | 455,048 | | 457,540 |
Series 2007-C30: | | | | |
Class A3, 5.246% 12/15/43 | | 5,940,000 | | 6,080,783 |
Class A4, 5.305% 12/15/43 | | 3,240,000 | | 3,316,486 |
Class A5, 5.342% 12/15/43 | | 3,796,000 | | 3,996,814 |
Series 2007-C32 Class A2, 5.7381% 6/15/49 (j) | | 1,147,398 | | 1,186,265 |
Series 2006-C23 Class A5, 5.416% 1/15/45 (j) | | 3,010,000 | | 3,299,257 |
Series 2007-C30 Class E, 5.553% 12/15/43 (j) | | 6,257,000 | | 1,854,315 |
Series 2007-C31 Class C, 5.6934% 4/15/47 (j) | | 2,455,000 | | 1,165,077 |
TOTAL COMMERCIAL MORTGAGE SECURITIES (Cost $256,172,633) | 248,058,153 |
Municipal Securities - 0.4% |
|
Beaver County Indl. Dev. Auth. Poll. Cont. Rev. Bonds (FirstEnergy Nuclear Generation Corp. Proj.) Series 2005 A, 3.375%, tender 7/1/15 (j) | | 1,200,000 | | 1,196,232 |
California Gen. Oblig.: | | | | |
7.5% 4/1/34 | | 2,400,000 | | 2,714,400 |
7.55% 4/1/39 | | 2,560,000 | | 2,929,562 |
Illinois Gen. Oblig.: | | | | |
Series 2010, 4.421% 1/1/15 | | 2,850,000 | | 2,914,752 |
5.665% 3/1/18 | | 1,885,000 | | 1,955,348 |
5.877% 3/1/19 | | 1,755,000 | | 1,803,912 |
TOTAL MUNICIPAL SECURITIES (Cost $12,672,301) | 13,514,206 |
Foreign Government and Government Agency Obligations - 0.1% |
| Principal Amount | | Value |
United Mexican States: | | | | |
5.875% 1/15/14 | | $ 1,665,000 | | $ 1,844,820 |
6.05% 1/11/40 | | 2,660,000 | | 2,830,240 |
TOTAL FOREIGN GOVERNMENT AND GOVERNMENT AGENCY OBLIGATIONS (Cost $4,339,789) | 4,675,060 |
Supranational Obligations - 0.0% |
|
Corporacion Andina de Fomento 5.2% 5/21/13
(Cost $348,544) | | 350,000 | | 374,500 |
Cash Equivalents - 8.4% |
| Maturity
Amount | | Value |
Investments in repurchase agreements in a joint trading account at 0.06%, dated 6/30/11 due 7/1/11 (Collateralized by U.S. Government Obligations) #
(Cost $317,121,000) | $ 317,121,486 | | 317,121,000 |
TOTAL INVESTMENT PORTFOLIO - 109.6% (Cost $4,054,453,033) | | 4,148,749,947 |
NET OTHER ASSETS (LIABILITIES) - (9.6)% | | (362,250,526) |
NET ASSETS - 100% | $ 3,786,499,421 |
Swap Agreements |
| Expiration Date | | Notional Amount | | |
Credit Default Swaps |
Receive monthly a fixed rate of .15% multiplied by the notional amount and pay to Credit Suisse First Boston upon each credit event of one of the issues of ABX AA 07-01 Index, par value of the proportional notional amount (Rating-C) (Upfront Premium Received/(Paid) $360,000) (i) | Sept. 2037 | | 1,862,745 | | (1,742,202) |
Swap Agreements - continued |
| Expiration Date | | Notional Amount | | Value |
Credit Default Swaps - continued |
Receive monthly a fixed rate of .15% multiplied by the notional amount and pay to Credit Suisse First Boston upon each credit event of one of the issues of ABX AA 07-01 Index, par value of the proportional notional amount (Rating-C) (Upfront Premium Received/(Paid) $598,000) (i) | Sept. 2037 | | $ 1,614,379 | | $ (1,509,908) |
Receive monthly a fixed rate of .15% multiplied by the notional amount and pay to JPMorgan Chase, Inc. upon each credit event of one of the issues of ABX AA 07-01 Index, par value of the proportional notional amount (Rating-C) (Upfront Premium Received/(Paid) $348,750) (i) | Sept. 2037 | | 931,372 | | (871,101) |
Receive monthly a fixed rate of .15% multiplied by the notional amount and pay to JPMorgan Chase, Inc. upon each credit event of one of the issues of ABX AA 07-01 Index, par value of the proportional notional amount (Rating-C) (Upfront Premium Received/(Paid) $701,375) (i) | Sept. 2037 | | 1,924,836 | | (1,800,275) |
Receive monthly a fixed rate of .15% multiplied by the notional amount and pay to UBS upon each credit event of one of the issues of ABX AA 07-1 Index, par value of the proportional notional amount (Rating-C) (Upfront Payment (Made)/Received $572,000) (i) | Sept. 2037 | | 2,732,025 | | (2,555,229) |
|
| Expiration Date | | Notional Amount | | Value |
Receive monthly a fixed rate of .15% multiplied by the notional amount and pay to UBS upon each credit event of one of the issues of ABX AA 07-1 Index, par value of the proportional notional amount (Rating-C) (Upfront Premium Received/(Paid) $214,000) (i) | Sept. 2037 | | $ 993,464 | | $ (929,174) |
Receive monthly a fixed rate of .15% multiplied by the notional amount and pay to UBS upon each credit event of one of the issues of ABX AA 07-1 Index, par value of the proportional notional amount (Rating-C) (Upfront Premium Received/(Paid) $1,023,500) (i) | Sept. 2037 | | 2,856,208 | | (2,671,375) |
Receive monthly notional amount multiplied by .82% and pay UBS upon credit event of Morgan Stanley ABS Capital I, Inc., par value of the notional amount of Morgan Stanley ABS Capital I, Inc. Series 2004-NC6 Class M3, 5.6413% 7/25/34 (Rating-Ca) (h) | August 2034 | | 87,253 | | (48,438) |
Swap Agreements - continued |
| Expiration Date | | Notional Amount | | Value |
Credit Default Swaps - continued |
Receive monthly notional amount multiplied by 2.4% and pay Deutsche Bank upon credit event of Fremont Home Loan Trust, par value of the notional amount of Fremont Home Loan Trust Series 2004-A Class B3, 7.2288% 1/25/34 (Rating-C) (h) | Feb. 2034 | | $ 4,841 | | $ (4,564) |
Receive monthly notional amount multiplied by 2.5% and pay Bank of America upon credit event of Ameriquest Mortgage Securities, Inc., par value of the notional amount of Ameriquest Mortgage Securities, Inc. Series 2004-R11 Class M9, 6.102% 11/25/34 (Rating-C) (h) | Dec. 2034 | | 245,904 | | (239,735) |
Receive monthly notional amount multiplied by 2.5% and pay Bank of America upon credit event of Ameriquest Mortgage Securities, Inc., par value of the notional amount of Ameriquest Mortgage Securities, Inc. Series 2004-R8 Class M9, 8.07% 9/25/34 (Rating-C) (h) | Oct. 2034 | | 127,968 | | (127,147) |
Receive monthly notional amount multiplied by 2.5% and pay Credit Suisse First Boston upon credit event of Ameriquest Mortgage Securities, Inc., par value of the notional amount of Ameriquest Mortgage Securities, Inc. Series 2004-R11 Class M9, 8.03% 11/25/34 (Rating-C) (h) | Dec. 2034 | | 427,179 | | (416,463) |
|
| Expiration Date | | Notional Amount | | Value |
Receive monthly notional amount multiplied by 3.35% and pay Morgan Stanley, Inc. upon credit event of Morgan Stanley ABS Capital I, Inc., par value of the notional amount of Morgan Stanley ABS Capital I, Inc. Series 2004-HE7, Class B3, 9.01% 8/25/34 (Rating-C) (h) | Sept. 2034 | | 85,742 | | (64,734) |
TOTAL CREDIT DEFAULT SWAPS | | $ 13,893,916 | | $ (12,980,345) |
Swap Agreements - continued |
| Expiration Date | | Notional Amount | | Value |
Interest Rate Swaps |
Receive semi-annually a fixed rate equal to 1.2857% and pay quarterly a floating rate based on 3-month LIBOR with JPMorgan Chase, Inc. | June 2012 | | $ 80,966,000 | | $ 743,300 |
| | $ 94,859,916 | | $ (12,237,045) |
Legend |
(a) Non-income producing - Security is in default. |
(b) Security initially issued at one coupon which converts to a higher coupon at a specified date. The rate shown is the rate at period end. |
(c) Security exempt from registration under Rule 144A of the Securities Act of 1933. These securities may be resold in transactions exempt from registration, normally to qualified institutional buyers. At the end of the period, the value of these securities amounted to $188,659,172 or 5.0% of net assets. |
(d) Security is perpetual in nature with no stated maturity date. |
(e) Security or a portion of the security purchased on a delayed delivery or when-issued basis. |
(f) A portion of the security is subject to a forward commitment to sell. |
(g) Security or a portion of the security has been segregated as collateral for open swap agreements. At the period end, the value of securities pledged amounted to $13,711,235. |
(h) Represents a credit default swap contract in which the Fund has sold protection on the underlying reference entity. The value of each credit default swap and the credit rating can be measures of the current payment/performance risk. For the underlying reference entity, ratings disclosed are from Moody's Investors Service, Inc. Where Moody's ratings are not available, S&P ratings are disclosed and are indicated as such. All ratings are as of the report date and do not reflect subsequent changes. Where a credit rating is not disclosed, the value is used as the measure of the payment/performance risk. |
(i) Represents a credit default swap based on a tradable index of home equity asset-backed debt securities. The value of each credit default swap and the credit rating can be measures of the current payment/performance risk. In addition, the swap represents a contract in which the Fund has sold protection on the index of underlying securities. Ratings represent a weighted average of the ratings of all securities included in the index. Ratings used in the weighted average are from Moody's Investors Service, Inc., or S&P where Moody's ratings are not available. All ratings are as of the report date and do not reflect subsequent changes. |
(j) Coupon rates for floating and adjustable rate securities reflect the rates in effect at period end. |
(k) Security represents right to receive monthly interest payments on an underlying pool of mortgages or assets. Principal shown is the outstanding par amount of the pool held as of the end of the period. |
(l) Coupon is inversely indexed to a floating interest rate multiplied by a specified factor. The price may be considerably more volatile than the price of a comparable fixed rate security. |
# Additional information on each counterparty to the repurchase agreement is as follows: |
Repurchase Agreement / Counterparty | Value |
$317,121,000 due 7/01/11 at 0.06% |
BNP Paribas Securities Corp. | $ 51,204,510 |
Barclays Capital, Inc. | 9,893,940 |
Mizuho Securities USA, Inc. | 153,613,530 |
UBS Securities LLC | 102,409,020 |
| $ 317,121,000 |
Other Information |
The following is a summary of the inputs used, as of June 30, 2011, involving the Fund's assets and liabilities carried at fair value. The inputs or methodology used for valuing securities may not be an indication of the risk associated with investing in those securities. For more information on valuation inputs, and their aggregation into the levels used in the tables below, please refer to the Security Valuation section in the accompanying Notes to Financial Statements. |
Valuation Inputs at Reporting Date: |
Description | Total | Level 1 | Level 2 | Level 3 |
Investments in Securities: | | | | |
Corporate Bonds | $ 920,661,271 | $ - | $ 920,661,271 | $ - |
U.S. Government and Government Agency Obligations | 1,114,266,645 | - | 1,114,266,645 | - |
U.S. Government Agency - Mortgage Securities | 1,367,522,444 | - | 1,367,522,444 | - |
Asset-Backed Securities | 98,746,499 | - | 93,251,780 | 5,494,719 |
Collateralized Mortgage Obligations | 63,810,169 | - | 62,792,306 | 1,017,863 |
Commercial Mortgage Securities | 248,058,153 | - | 234,092,585 | 13,965,568 |
Municipal Securities | 13,514,206 | - | 13,514,206 | - |
Foreign Government and Government Agency Obligations | 4,675,060 | - | 4,675,060 | - |
Supranational Obligations | 374,500 | - | 374,500 | - |
Cash Equivalents | 317,121,000 | - | 317,121,000 | - |
Total Investments in Securities: | $ 4,148,749,947 | $ - | $ 4,128,271,797 | $ 20,478,150 |
Derivative Instruments: | | | | |
Assets | | | | |
Swap Agreements | $ 743,300 | $ - | $ 743,300 | $ - |
Liabilities | | | | |
Swap Agreements | $ (12,980,345) | $ - | $ (12,079,265) | $ (901,080) |
Total Derivative Instruments: | $ (12,237,045) | $ - | $ (11,335,965) | $ (901,080) |
Other Financial Instruments: | | | | |
Forward Commitments | $ 423,606 | $ - | $ 423,606 | $ - |
The following is a reconciliation of Investments in Securities and Derivative Instruments for which Level 3 inputs were used in determining value: |
Investments in Securities: | |
Beginning Balance | $ 14,900,634 |
Total Realized Gain (Loss) | 136,491 |
Total Unrealized Gain (Loss) | 3,815,920 |
Cost of Purchases | 188,238 |
Proceeds of Sales | (1,720,010) |
Amortization/Accretion | (345,031) |
Transfers in to Level 3 | 6,118,180 |
Transfers out of Level 3 | (2,616,272) |
Ending Balance | $ 20,478,150 |
The change in unrealized gain (loss) for the period attributable to Level 3 securities held at June 30, 2011 | $ 3,713,039 |
Derivative Instruments: | |
Swap Agreements | |
Beginning Balance | $ (1,102,753) |
Total Unrealized Gain (Loss) | 201,673 |
Transfers in to Level 3 | - |
Transfers out of Level 3 | - |
Ending Balance | $ (901,080) |
Realized gain (loss) on Swap Agreements for the period | $ 13,339 |
The change in unrealized gain (loss) for the period attributable to Level 3 Swap Agreements held at June 30, 2011 | $ 4,849 |
The information used in the above reconciliation represents fiscal year to date activity for any Investments in Securities and Derivative Instruments identified as using Level 3 inputs at either the beginning or the end of the current fiscal period. Transfers in or out of Level 3 represent the beginning value of any Security or Instrument where a change in the pricing level occurred from the beginning to the end of the period. The cost of purchases and the proceeds of sales may include securities received or delivered through corporate actions or exchanges. Realized and unrealized gains (losses) disclosed in the reconciliation are included in Net Gain (Loss) on the Fund's Statement of Operations. |
Value of Derivative Instruments |
The following table is a summary of the Fund's value of derivative instruments by risk exposure as of June 30, 2011. For additional information on derivative instruments, please refer to the Derivative Instruments section in the accompanying Notes to Financial Statements. |
Risk Exposure /
Derivative Type | Value |
| Asset | Liability |
Credit Risk | | |
Swap Agreements | $ - | $ (12,980,345) |
Interest Rate Risk | | |
Swap Agreements | 743,300 | - |
Total Value of Derivatives (a) | $ 743,300 | $ (12,980,345) |
(a) Value is disclosed on the Statement of Assets and Liabilities in the Unrealized Appreciation and Unrealized Depreciation on Swap Agreements line-items. |
See accompanying notes which are an integral part of the financial statements.
Not Part of Financial Report
Financial Statements
Statement of Assets and Liabilities
| June 30, 2011 |
| | |
Assets | | |
Investment in securities, at value (including repurchase agreements of $317,121,000) - See accompanying schedule: Unaffiliated issuers (cost $4,054,453,033) | | $ 4,148,749,947 |
Commitment to sell securities on a delayed delivery basis | $ (154,319,050) | |
Receivable for securities sold on a delayed delivery basis | 154,742,656 | 423,606 |
Receivable for investments sold, regular delivery | | 87,950,072 |
Receivable for swap agreements | | 4,333 |
Interest receivable | | 25,313,103 |
Unrealized appreciation on swap agreements | | 743,300 |
Total assets | | 4,263,184,361 |
| | |
Liabilities | | |
Payable to custodian bank | $ 11,288 | |
Payable for investments purchased
Regular delivery | 102,432,141 | |
Delayed delivery | 331,184,225 | |
Payable for swap agreements | 170,830 | |
Payable for fund shares redeemed | 29,871,936 | |
Distributions payable | 10,424 | |
Unrealized depreciation on swap agreements | 12,980,345 | |
Other payables and accrued expenses | 23,751 | |
Total liabilities | | 476,684,940 |
| | |
Net Assets | | $ 3,786,499,421 |
Net Assets consist of: | | |
Paid in capital | | $ 3,672,538,802 |
Undistributed net investment income | | 13,752,206 |
Accumulated undistributed net realized gain (loss) on investments | | 16,829,647 |
Net unrealized appreciation (depreciation) on investments | | 83,378,766 |
Net Assets, for 35,546,158 shares outstanding | | $ 3,786,499,421 |
Net Asset Value, offering price and redemption price per share ($3,786,499,421 ÷ 35,546,158 shares) | | $ 106.52 |
Statement of Operations
| Six months ended June 30, 2011 |
| | |
Investment Income | | |
Dividends | | $ 72,440 |
Interest | | 69,262,352 |
Total income | | 69,334,792 |
| | |
Expenses | | |
Custodian fees and expenses | $ 50,440 | |
Independent trustees' compensation | 6,764 | |
Total expenses before reductions | 57,204 | |
Expense reductions | (6,887) | 50,317 |
Net investment income (loss) | | 69,284,475 |
Realized and Unrealized Gain (Loss) Net realized gain (loss) on: | | |
Investment securities: | | |
Unaffiliated issuers | 19,843,431 | |
Swap agreements | (1,248,110) | |
Total net realized gain (loss) | | 18,595,321 |
Change in net unrealized appreciation (depreciation) on: Investment securities | 30,960,224 | |
Swap agreements | 1,397,027 | |
Delayed delivery commitments | 2,358,661 | |
Total change in net unrealized appreciation (depreciation) | | 34,715,912 |
Net gain (loss) | | 53,311,233 |
Net increase (decrease) in net assets resulting from operations | | $ 122,595,708 |
See accompanying notes which are an integral part of the financial statements.
Not Part of Financial Report
Statement of Changes in Net Assets
| Six months ended June 30,
2011 | Year ended
December 31, 2010 |
Increase (Decrease) in Net Assets | | |
Operations | | |
Net investment income (loss) | $ 69,284,475 | $ 145,140,671 |
Net realized gain (loss) | 18,595,321 | 143,042,754 |
Change in net unrealized appreciation (depreciation) | 34,715,912 | 25,745,629 |
Net increase (decrease) in net assets resulting
from operations | 122,595,708 | 313,929,054 |
Distributions to shareholders from net investment income | (64,038,661) | (145,185,204) |
Distributions to shareholders from net realized gain | (11,120,962) | (132,021,770) |
Total distributions | (75,159,623) | (277,206,974) |
Share transactions
Proceeds from sales of shares | 40,700,499 | 72,938,886 |
Reinvestment of distributions | 75,159,623 | 277,206,974 |
Cost of shares redeemed | (134,887,817) | (586,003,407) |
Net increase (decrease) in net assets resulting from share transactions | (19,027,695) | (235,857,547) |
Total increase (decrease) in net assets | 28,408,390 | (199,135,467) |
| | |
Net Assets | | |
Beginning of period | 3,758,091,031 | 3,957,226,498 |
End of period (including undistributed net investment income of $13,752,206 and undistributed net investment income of $8,506,392, respectively) | $ 3,786,499,421 | $ 3,758,091,031 |
Other Information Shares | | |
Sold | 385,204 | 678,877 |
Issued in reinvestment of distributions | 711,656 | 2,605,878 |
Redeemed | (1,280,081) | (5,416,725) |
Net increase (decrease) | (183,221) | (2,131,970) |
Financial Highlights
| Six months ended
June 30, | Years ended December 31, |
| 2011 | 2010 | 2009 | 2008 | 2007 | 2006 H |
Selected Per-Share Data | | | | | | |
Net asset value, beginning of period | $ 105.18 | $ 104.52 | $ 94.78 | $ 102.50 | $ 103.02 | $ 100.00 |
Income from Investment Operations | | | | | | |
Net investment income (loss) D | 1.942 | 3.943 | 4.762 | 5.319 | 5.534 | 2.814 |
Net realized and unrealized gain (loss) | 1.608 | 4.424 | 9.818 | (7.583) | (.594) | 3.132 |
Total from investment operations | 3.550 | 8.367 | 14.580 | (2.264) | 4.940 | 5.946 |
Distributions from net investment income | (1.900) | (3.947) | (4.580) | (5.236) | (5.385) | (2.826) |
Distributions from net realized gain | (.310) | (3.760) | (.260) | (.220) | (.075) | (.100) |
Total distributions | (2.210) | (7.707) | (4.840) | (5.456) | (5.460) | (2.926) |
Net asset value, end of period | $ 106.52 | $ 105.18 | $ 104.52 | $ 94.78 | $ 102.50 | $ 103.02 |
Total Return B, C | 3.31% | 8.12% | 15.71% | (2.29)% | 4.94% | 5.95% |
Ratios to Average Net Assets E, I | | | | | | |
Expenses before reductions G | -% A | -% | -% | -% | -% | -% A |
Expenses net of fee waivers, if any G | -% A | -% | -% | -% | -% | -% A |
Expenses net of all reductions G | -% A | -% | -% | -% | -% | -% A |
Net investment income (loss) | 3.70% A | 3.65% | 4.75% | 5.35% | 5.42% | 5.23% A |
Supplemental Data | | | | | | |
Net assets, end of period (000 omitted) | $ 3,786,499 | $ 3,758,091 | $ 3,957,226 | $ 3,162,861 | $ 3,587,807 | $ 2,794,948 |
Portfolio turnover rate F | 342% A | 230% | 141% | 140% | 137% | 99% A |
A Annualized B Total returns for periods of less than one year are not annualized. C Total returns would have been lower if certain expenses had not been reduced during the applicable periods shown. D Calculated based on average shares outstanding during the period. E Fees and expenses of any underlying Fidelity Central Funds are not included in the Fund's expense ratio. The Fund indirectly bears its proportionate share of the expenses of any underlying Fidelity Central Funds. F Amount does not include the portfolio activity of any underlying Fidelity Central Funds.G Amount represents less than .01%.H For the period June 23, 2006 (commencement of operations) to December 31, 2006. I Expense ratios reflect operating expenses of the Fund. Expenses before reductions do not reflect amounts reimbursed by the investment adviser or reductions from expense offset arrangements and do not represent the amount paid by the Fund during periods when reimbursements or reductions occur. Expense ratios before reductions for start-up periods may not be representative of longer term operating periods. Expenses net of fee waivers reflect expenses after reimbursement by the investment adviser but prior to reductions from expense offset arrangements. Expenses net of all reductions represent the net expenses paid by the Fund. |
See accompanying notes which are an integral part of the financial statements.
Not Part of Financial Report
Notes to Financial Statements
For the period ended June 30, 2011
1. Organization.
Fidelity® VIP Investment Grade Central Fund (the Fund) is a fund of Fidelity Garrison Street Trust (the Trust) and is authorized to issue an unlimited number of shares. The Trust is registered under the Investment Company Act of 1940, as amended (the 1940 Act), as an open-end management investment company organized as a Massachusetts business trust. Shares of the Fund are only offered to other investment companies and accounts managed by Fidelity Management & Research Company (FMR), or its affiliates (the Investing Funds).
2. Significant Accounting Policies.
The financial statements have been prepared in conformity with accounting principles generally accepted in the United States of America (GAAP), which require management to make certain estimates and assumptions at the date of the financial statements. Actual results could differ from those estimates. Subsequent events, if any, through the date that the financial statements were issued have been evaluated in the preparation of the financial statements. The following summarizes the significant accounting policies of the Fund:
Security Valuation. Investments are valued as of 4:00 p.m. Eastern time on the last calendar day of the period. The Fund uses independent pricing services approved by the Board of Trustees to value its investments. When current market prices or quotations are not readily available or reliable, valuations may be determined in good faith in accordance with procedures adopted by the Board of Trustees. Factors used in determining value may include market or security specific events, changes in interest rates and credit quality. The frequency with which these procedures are used cannot be predicted and they may be utilized to a significant extent. The value used for net asset value (NAV) calculation under these procedures may differ from published prices for the same securities.
The Fund categorizes the inputs to valuation techniques used to value its investments into a disclosure hierarchy consisting of three levels as shown below:
Level 1 - quoted prices in active markets for identical investments
Level 2 - other significant observable inputs (including quoted prices for similar investments, interest rates, prepayment speeds, etc.)
Level 3 - unobservable inputs (including the Fund's own assumptions based on the best information available)
Changes in valuation techniques may result in transfers in or out of an assigned level within the disclosure hierarchy. The aggregate value of investments by input level, as of June 30, 2011 for the Fund's investments, as well as a roll forward of Level 3 securities, is included at the end of the Fund's Schedule of Investments. Valuation techniques used to value the Fund's investments by major category are as follows:
Debt securities, including restricted securities, are valued based on evaluated prices received from independent pricing services or from dealers who make markets in such securities. For corporate bonds, foreign government and government agency obligations, municipal securities, supranational obligations and U.S. government and government agency obligations, pricing services utilize matrix pricing which considers yield or price of bonds of comparable quality, coupon, maturity and type as well as dealer supplied prices and are generally categorized as Level 2 in the hierarchy. For asset backed securities, collateralized mortgage obligations, commercial mortgage securities and U.S. government agency mortgage securities, pricing services utilize matrix pricing which considers prepayment speed assumptions, attributes of the collateral, yield or price of bonds of comparable quality, coupon, maturity and type as well as dealer supplied prices and, accordingly, such securities are generally categorized as Level 2 in the hierarchy. Dealers which make markets in asset backed securities, collateralized mortgage obligations and commercial mortgage securities may also consider such factors as the structure of the issue, cash flow assumptions, the value of underlying assets as well as any guarantees. Short-term securities with remaining maturities of sixty days or less may be valued at amortized cost, which approximates fair value, and are categorized as Level 2 in the hierarchy.
Swaps are marked-to-market daily based on valuations from independent pricing services or dealer-supplied valuations and changes in value are recorded as unrealized appreciation (depreciation). Pricing services utilize matrix pricing which considers comparisons to interest rate curves, credit spread curves, default possibilities and recovery rates and, as a result, swaps are generally categorized as Level 2 in the hierarchy.
When independent prices are unavailable or unreliable, debt securities and swaps may be valued utilizing pricing matrices which consider similar factors that would be used by independent pricing services. These are generally categorized as Level 2 in the hierarchy but may be Level 3 depending on the circumstances.
Investment Transactions and Income. For financial reporting purposes, the Fund's investment holdings and NAV include trades executed through the end of the last business day of the period. The NAV per share for processing shareholder transactions is calculated as of the close of business of the New York Stock Exchange (NYSE), normally 4:00 p.m. Eastern time and includes trades executed through the end of the prior business day. Gains and losses on securities sold are determined on the basis of identified cost. Dividend income is recorded on the ex-dividend date. Interest income is accrued as earned. Interest income includes coupon interest and amortization of premium and accretion of discount on debt securities. The principal value on inflation-indexed securities is periodically adjusted to the rate of inflation and interest is accrued based on the principal value. The adjustments to
Not Part of Financial Report
2. Significant Accounting Policies - continued
Investment Transactions and Income - continued
principal due to inflation are reflected as increases or decreases to interest income even though principal is not received until maturity. Debt obligations may be placed on non-accrual status and related interest income may be reduced by ceasing current accruals and writing off interest receivables when the collection of all or a portion of interest has become doubtful based on consistently applied procedures. A debt obligation is removed from non-accrual status when the issuer resumes interest payments or when collectability of interest is reasonably assured.
Expenses. Expenses directly attributable to a fund are charged to that fund. Expenses attributable to more than one fund are allocated among the respective funds on the basis of relative net assets or other appropriate methods. Expense estimates are accrued in the period to which they relate and adjustments are made when actual amounts are known.
Income Tax Information and Distributions to Shareholders. Each year, the Fund intends to qualify as a regulated investment company, including distributing substantially all of its taxable income and realized gains under Subchapter M of the Internal Revenue Code and filing its U.S. federal tax return. As a result, no provision for income taxes is required. A fund's federal tax return is subject to examination by the Internal Revenue Service (IRS) for a period of three years.
Dividends are declared and recorded daily and paid monthly from net investment income. Distributions from realized gains, if any, are declared and recorded on the ex-dividend date. Income and capital gain distributions are determined in accordance with income tax regulations, which may differ from GAAP.
Capital accounts within the financial statements are adjusted for permanent book-tax differences. These adjustments have no impact on net assets or the results of operations. Temporary book-tax differences will reverse in a subsequent period.
Book-tax differences are primarily due to swap agreements, market discount, financial transactions and losses deferred due to wash sales.
The federal tax cost of investment securities and unrealized appreciation (depreciation) as of period end were as follows:
Gross unrealized appreciation | $ 139,889,498 |
Gross unrealized depreciation | (40,654,037) |
Net unrealized appreciation (depreciation) on securities and other investments | $ 99,235,461 |
| |
Tax cost | $ 4,049,514,486 |
Under the recently enacted Regulated Investment Company Modernization Act of 2010 (the Act), the Fund will be permitted to carry forward capital losses incurred in taxable years beginning after December 22, 2010 for an unlimited period. However, any losses incurred during those future taxable years will be required to be utilized prior to any losses incurred in pre-enactment taxable years, which generally expire after eight years from when they are incurred. Additionally, post-enactment capital losses that are carried forward will retain their character as either short-term or long-term capital losses rather than being considered all short-term as under previous law. The Fund's first fiscal year end subject to the Act will be December 31, 2011.
New Accounting Pronouncements. In May 2011, the Financial Accounting Standards Board (FASB) issued an update to Topic 860 - Transfers and Servicing. The update clarifies the assessment of effective control by removing the collateral provision requirement that the seller maintains at all times collateral sufficient to fund substantially all of the cost of purchasing replacement financial assets from others. This may result in a change in accounting treatment from purchases and sales to secured borrowings for certain mortgage dollar roll transactions, and therefore separate accounting of the income and expenses associated with the secured borrowings. This change would have no effect on the net assets or total return of the Fund. The update is effective for transactions entered into on or after December 15, 2011. Management is currently evaluating the potential impact of the update on the accounting for mortgage dollar roll transactions entered into by the Fund. Also in May 2011, the FASB issued Accounting Standard Update No. 2011-04, Fair Value Measurement (Topic 820) - Amendments to Achieve Common Fair Value Measurement and Disclosure Requirements in U.S. GAAP and IFRSs. The update changes the wording used to describe the requirements in GAAP for measuring fair value and for disclosing information about fair value measurements. The update is effective during interim and annual periods beginning after December 15, 2011. Management is currently evaluating the impact of the update's adoption on the Fund's financial statement disclosures.
3. Operating Policies.
Repurchase Agreements. FMR has received an Exemptive Order from the Securities and Exchange Commission (the SEC) which permits the Fund and other affiliated entities of FMR to transfer uninvested cash balances into joint trading accounts which are then invested in repurchase agreements. The Fund may also invest directly with institutions in repurchase agreements. Repurchase agreements are collateralized by government or non-government securities. Upon settlement date, collateral is held in segregated accounts with custodian banks and may be obtained in the event of a default of the counterparty. The Fund monitors, on a daily basis, the value of the collateral to ensure it is at least equal to the principal amount of the repurchase agreement (including accrued interest). In the event of a default by the counterparty, realization of the collateral proceeds could be delayed, during which time the value of the collateral may decline.
Not Part of Financial Report
Notes to Financial Statements - continued
3. Operating Policies - continued
Delayed Delivery Transactions and When-Issued Securities. The Fund may purchase or sell securities on a delayed delivery or when-issued basis. Payment and delivery may take place after the customary settlement period for that security. The price of the underlying securities and the date when the securities will be delivered and paid for are fixed at the time the transaction is negotiated. During the time a delayed delivery sell is outstanding, the contract is marked-to-market daily and equivalent deliverable securities are held for the transaction. The securities purchased on a delayed delivery or when-issued basis are identified as such in the Fund's Schedule of Investments. The Fund may receive compensation for interest forgone in the purchase of a delayed delivery or when-issued security. With respect to purchase commitments, the Fund identifies securities as segregated in its records with a value at least equal to the amount of the commitment. Losses may arise due to changes in the value of the underlying securities or if the counterparty does not perform under the contract's terms, or if the issuer does not issue the securities due to political, economic, or other factors.
Restricted Securities. The Fund may invest in securities that are subject to legal or contractual restrictions on resale. These securities generally may be resold in transactions exempt from registration or to the public if the securities are registered. Disposal of these securities may involve time-consuming negotiations and expense, and prompt sale at an acceptable price may be difficult. Information regarding restricted securities is included at the end of the Fund's Schedule of Investments.
4. Derivative Instruments.
Risk Exposures and the Use of Derivative Instruments. The Fund used derivative instruments (derivatives), including swap agreements, in order to meet its investment objectives. The strategy is to use derivatives to increase returns, to gain exposure to certain types of assets and to manage exposure to certain risks as defined below. The success of any strategy involving derivatives depends on analysis of numerous economic factors, and if the strategies for investment do not work as intended, the Fund may not achieve its objectives.
The Fund's use of derivatives increased or decreased its exposure to the following risks:
Credit Risk | Credit risk relates to the ability of the issuer of a financial instrument to make further principal or interest payments on an obligation or commitment that it has to the Fund. |
Interest Rate Risk | Interest rate risk relates to the fluctuations in the value of interest-bearing securities due to changes in the prevailing levels of market interest rates. |
The Fund is also exposed to additional risks from investing in derivatives, such as liquidity risk and counterparty credit risk. Liquidity risk is the risk that the Fund will be unable to sell the derivative in the open market in a timely manner. Counterparty credit risk is the risk that the counterparty will not be able to fulfill its obligation to the Fund. Derivative counterparty credit risk is managed through formal evaluation of the creditworthiness of all potential counterparties. On certain over-the-counter derivatives, the Fund attempts to reduce its exposure to counterparty credit risk by entering into an International Swaps and Derivatives Association (ISDA) Master Agreement on a bilateral basis with each of its counterparties. The ISDA Master Agreement gives the Fund the right to terminate all transactions traded under such agreement if there is a certain deterioration in the credit quality of the counterparty. The ISDA Master Agreement gives each party the right, upon an event of default by the other party or a termination of the agreement, to close out all transactions traded under such agreement and to net amounts owed under each transaction to one net payable by one party to the other. To mitigate counterparty credit risk, the Fund offsets certain payables and/or receivables with collateral. Collateral in the form of cash or securities, if required, is held in segregated accounts with the Fund's custodian bank in accordance with the collateral agreements entered into between the Fund, the swap counterparty and the Fund's custodian bank, and is identified in the Schedule of Investments. The Fund could experience delays and costs in gaining access to the collateral even though it is held by the Fund's custodian bank. The Fund's maximum risk of loss from counterparty credit risk is generally the aggregate unrealized appreciation and unpaid counterparty payments in excess of any collateral pledged by the counterparty to the Fund. Derivatives involve, to varying degrees, risk of loss in excess of the amounts recognized in the Statement of Assets and Liabilities.
Net Realized Gain (Loss) and Change in Net Unrealized Appreciation (Depreciation) on Derivatives. The table below, which reflects the impacts of derivatives on the financial performance of the Fund, summarizes the net realized gain (loss) and change in net unrealized appreciation (depreciation) for derivatives during the period.
Risk Exposure / Derivative Type | Net Realized
Gain (Loss) | Change in Net Unrealized Appreciation (Depreciation) |
Credit Risk | | |
Swap Agreements | $ (1,644,452) | $ 1,557,874 |
Interest Rate Risk | | |
Swap Agreements | 396,342 | (160,847) |
Totals (a) | $ (1,248,110) | $ 1,397,027 |
(a) A summary of the value of derivatives by risk exposure as of period end is included at the end of the Schedule of Investments and is representative of activity for the period.
Not Part of Financial Report
4. Derivative Instruments - continued
Swap Agreements. A swap agreement (swap) is a contract between two parties to exchange future cash flows at periodic intervals based on a notional principal amount.
Details of swaps open at period end are included in the Schedule of Investments under the caption "Swap Agreements." Swaps are marked-to-market daily and changes in value are recorded as unrealized appreciation or (depreciation) and reflected in the Statement of Assets and Liabilities. Any upfront premiums paid or received upon entering a swap to compensate for differences between stated terms of the agreement and prevailing market conditions (e.g. credit spreads, interest rates or other factors) are recorded as realized gain or (loss) ratably over the term of the swap. Payments are exchanged at specified intervals, accrued daily commencing with the effective date of the contract and recorded as realized gain or (loss). Realized gain or (loss) is also recorded in the event of an early termination of a swap. The net realized gain (loss) and change in net unrealized appreciation (depreciation) on swaps during the period is included in the Statement of Operations.
Risks of loss include credit risk and interest rate risk. In addition, there is the risk of failure by the counterparty to perform under the terms of the agreement and lack of liquidity in the market.
Interest Rate Swaps. Interest rate swaps are agreements between counterparties to exchange cash flows, one based on a fixed rate, and the other on a floating rate. The Fund entered into interest rate swaps to manage its exposure to interest rate changes. Changes in interest rates can have an effect on both the value of bond holdings as well as the amount of interest income earned. In general, the value of bonds can fall when interest rates rise and can rise when interest rates fall.
Credit Default Swaps. Credit default swaps enable the Fund to buy or sell protection on a debt security or a basket of securities against a defined credit event. Under the terms of a credit default swap the buyer of protection (buyer) receives credit protection in exchange for making periodic payments to the seller of protection (seller) based on a fixed percentage applied to a notional principal amount. In return for these payments, the seller acts as a guarantor of the creditworthiness of a reference obligation. The Fund enters into credit default swaps as a seller to gain credit exposure to an issuer and/or as a buyer to provide a measure of protection against defaults of an issuer. The issuer may be either a single issuer or a "basket" of issuers. Periodic payments are made over the life of the contract provided that no credit event occurs.
For credit default swaps on most corporate and sovereign issuers, credit events include bankruptcy, failure to pay, obligation acceleration or repudiation/moratorium. For credit default swaps on corporate or sovereign issuers, the obligation that may be put to the seller is not limited to the specific reference obligation described in the Schedule of Investments. For credit default swaps on asset-backed securities, a credit event may be triggered by events such as failure to pay principal, maturity extension, rating downgrade or write-down. For credit default swaps on asset-backed securities, the reference obligation described represents the security that may be put to the seller.
As a seller, if an underlying credit event occurs, the Fund will either pay the buyer an amount equal to the notional amount of the swap and take delivery of the reference obligation or underlying securities comprising an index or pay a net settlement amount of cash equal to the notional amount of the swap less the recovery value of the reference obligation or underlying securities comprising an index.
As a buyer, if an underlying credit event occurs, the Fund will either receive from the seller an amount equal to the notional amount of the swap and deliver the reference obligation or underlying securities comprising an index or receive a net settlement amount of cash equal to the notional amount of the swap less the recovery value of the reference obligation or underlying securities comprising an index.
Typically, the value of each credit default swap and credit rating disclosed for each reference obligation in the Schedule of Investments, where the Fund is the seller, can be used as measures of the current payment/performance risk of the swap. As the value of the swap changes as a positive or negative percentage of the total notional amount, the payment/performance risk may decrease or increase, respectively. In addition to these measures, FMR monitors a variety of factors including cash flow assumptions, market activity and market sentiment as part of its ongoing process of assessing payment/performance risk.
The notional amount of credit default swaps is included in the Schedule of Investments and approximates the maximum potential amount of future payments that the Fund could be required to make if the Fund is the seller and a credit event were to occur. The total notional amount of all credit default swaps open at period end where the Fund is the seller amounted to $13,893,916 representing 0.37% of net assets.
5. Purchases and Sales of Investments.
Purchases and sales of securities, other than short-term securities and U.S. government securities, aggregated $154,952,550 and $156,013,064, respectively.
Not Part of Financial Report
Notes to Financial Statements - continued
6. Fees and Other Transactions with Affiliates.
Management Fee and Expense Contract. Fidelity Investments Money Management, Inc. (FIMM), an affiliate of FMR, provides the Fund with investment management services. The Fund does not pay any fees for these services. Pursuant to the Fund's management contract with FIMM, FMR pays FIMM a portion of the management fees it receives from the Investing Funds. In addition, under an expense contract, FMR also pays all other expenses of the Fund, excluding custody fees, the compensation of the independent Trustees, and certain exceptions such as interest expense.
7. Expense Reductions.
FMR has voluntarily agreed to reimburse a portion of the Fund's operating expenses. For the period, the reimbursement reduced the expenses by $6,764.
In addition, through arrangements with the Fund's custodian, credits realized as a result of uninvested cash balances were used to reduce the Fund's expenses. During the period, these credits reduced the Fund's custody expenses by $123.
8. Other.
The Fund's organizational documents provide former and current trustees and officers with a limited indemnification against liabilities arising in connection with the performance of their duties to the Fund. In the normal course of business, the Fund may also enter into contracts that provide general indemnifications. The Fund's maximum exposure under these arrangements is unknown as this would be dependent on future claims that may be made against the Fund. The risk of material loss from such claims is considered remote.
At the end of the period, mutual funds managed by FMR or an FMR affiliate were the owners of record of all of the outstanding shares of the Fund according to the following schedule.
Fund | Ownership % |
VIP Asset Manager Portfolio | 13.1% |
VIP Asset Manager: Growth Portfolio | 1.0% |
VIP Balanced Portfolio | 11.8% |
VIP Investment Grade Bond Portfolio | 74.1% |
9. Credit Risk.
The Fund invests a portion of its assets in structured securities of issuers that hold mortgage securities, including securities backed by subprime mortgage loans. The value and related income of these securities is sensitive to changes in economic conditions, including delinquencies and/or defaults. Continuing shifts in the market's perception of credit quality on securities backed by subprime mortgage loans have resulted in increased volatility of market price and periods of illiquidity that have adversely impacted the valuation of certain issuers of the Fund.
Not Part of Financial Report
Report of Independent Registered Public Accounting Firm
To the Trustees of Fidelity Garrison Street Trust and Shareholders of Fidelity VIP Investment Grade Central Fund:
We have audited the accompanying statement of assets and liabilities of Fidelity VIP Investment Grade Central Fund (the Fund), a fund of Fidelity Garrison Street Trust, including the schedule of investments, as of June 30, 2011, and the related statement of operations for the six months then ended, the statement of changes in net assets for the six months ended June 30, 2011 and for the year ended December 31, 2010, and the financial highlights for the six months ended June 30, 2011 and for each of the five years in the period ended December 31, 2010. These financial statements and financial highlights are the responsibility of the Fund's management. Our responsibility is to express an opinion on these financial statements and financial highlights based on our audits.
We conducted our audits in accordance with the standards of the Public Company Accounting Oversight Board (United States). Those standards require that we plan and perform the audit to obtain reasonable assurance about whether the financial statements and financial highlights are free of material misstatement. The Fund is not required to have, nor were we engaged to perform, an audit of its internal control over financial reporting. Our audits included consideration of internal control over financial reporting as a basis for designing audit procedures that are appropriate in the circumstances, but not for the purpose of expressing an opinion on the effectiveness of the Fund's internal control over financial reporting. Accordingly, we express no such opinion. An audit also includes examining, on a test basis, evidence supporting the amounts and disclosures in the financial statements, assessing the accounting principles used and significant estimates made by management, as well as evaluating the overall financial statement presentation. Our procedures included confirmation of securities owned as of June 30, 2011, by correspondence with the custodians and brokers; where replies were not received from brokers, we performed other auditing procedures. We believe that our audits provide a reasonable basis for our opinion.
In our opinion, the financial statements and financial highlights referred to above present fairly, in all material respects, the financial position of Fidelity VIP Investment Grade Central Fund as of June 30, 2011, the results of its operations for the six months then ended, the changes in its net assets for the six months ended June 30, 2011 and for the year ended December 31, 2010, and the financial highlights for the six months ended June 30, 2011, and for each of the five years in the period ended December 31, 2010, in conformity with accounting principles generally accepted in the United States of America.
/s/ Deloitte & Touche LLP
DELOITTE & TOUCHE LLP
Boston, Massachusetts
August 15, 2011
Not Part of Financial Report
Investment Adviser
Fidelity Management & Research Company
Boston, MA
Investment Sub-Adviser
Fidelity Investments Money Management, Inc.
Fidelity Management & Research (U.K.) Inc.
Fidelity Management & Research (Hong Kong) Limited
Fidelity Management & Research (Japan) Inc.
General Distributor
Fidelity Distributors Corporation
Boston, MA
Transfer and Service Agents
Fidelity Investments Institutional Operations Co., Inc.
Boston, MA
Fidelity Service Company, Inc.
Boston, MA
Custodian
The Bank of New York Mellon
New York, NY
VIPIGB-SANN-0811
1.705629.113
Fidelity® Variable Insurance Products:
Investor Freedom® Funds -
Income, 2005, 2010, 2015, 2020, 2025, 2030
Semiannual Report
June 30, 2011
(2_fidelity_logos) (Registered_Trademark)
Contents
To view a fund's proxy voting guidelines and proxy voting record for the 12-month period ended June 30, visit http://www.fidelity.com/proxyvotingresults or visit the Securities and Exchange Commission's (SEC) web site at http://www.sec.gov. You may also call 1-877-208-0098 to request a free copy of the proxy voting guidelines.
Fidelity Variable Insurance Products are separate account options which are purchased through a variable insurance contract.
Standard & Poor's, S&P and S&P 500 are registered service marks of The McGraw-Hill Companies, Inc. and have been licensed for use by Fidelity Distributors Corporation.
Other third party marks appearing herein are the property of their respective owners.
All other marks appearing herein are registered or unregistered trademarks or service marks of FMR LLC or an affiliated company.
This report and the financial statements contained herein are submitted for the general information of the shareholders of the funds. This report is not authorized for distribution to prospective investors in the funds unless preceded or accompanied by an effective prospectus.
A fund files its complete schedule of portfolio holdings with the SEC for the first and third quarters of each fiscal year on Form N-Q. Forms N-Q are available on the SEC's web site at http://www.sec.gov. A fund's Forms N-Q may be reviewed and copied at the SEC's Public Reference Room in Washington, DC. Information regarding the operation of the SEC's Public Reference Room may be obtained by calling 1-800-SEC-0330. For a complete list of a fund's portfolio holdings, view the most recent holdings listing, semiannual report, or annual report on Fidelity's web site at http://www.fidelity.com, http://www.advisor.fidelity.com, or http://401k.com, as applicable.
NOT FDIC INSURED • MAY LOSE VALUE • NO BANK GUARANTEE
Neither the funds nor Fidelity Distributors Corporation is a bank.
Semiannual Report
As a shareholder of a Fund, you incur two types of costs: (1) transaction costs, and (2) ongoing costs, including other Fund expenses. This Example is intended to help you understand your ongoing costs (in dollars) of investing in the Funds and to compare these costs with the ongoing costs of investing in other mutual funds.
The Example is based on an investment of $1,000 invested at the beginning of the period and held for the entire period (January 1, 2011 to June 30, 2011).
Actual Expenses
The first line of the accompanying table for each fund provides information about actual account values and actual expenses. You may use the information in this line, together with the amount you invested, to estimate the expenses that you paid over the period. Simply divide your account value by $1,000.00 (for example, an $8,600 account value divided by $1,000.00 = 8.6), then multiply the result by the number in the first line for a fund under the heading entitled "Expenses Paid During Period" to estimate the expenses you paid on your account during this period. The estimate of expenses does not include any fees or other expenses of any variable annuity or variable life insurance product. If they were, the estimate of expenses you paid during the period would be higher, and your ending account value would be lower. In addition, each Fund, as a shareholder in underlying Fidelity Funds, will indirectly bear its pro-rata share of the fees and expenses incurred by the underlying Fidelity Funds. These fees and expenses are not included in each Fund's annualized expense ratio used to calculate the expense estimates in the table below.
Hypothetical Example for Comparison Purposes
The second line of the accompanying table for each fund provides information about hypothetical account values and hypothetical expenses based on a fund's actual expense ratio and an assumed rate of return of 5% per year before expenses, which is not the Fund's actual return. The hypothetical account values and expenses may not be used to estimate the actual ending account balance or expenses you paid for the period. You may use this information to compare the ongoing costs of investing in the Fund and other funds. To do so, compare this 5% hypothetical example with the 5% hypothetical examples that appear in the shareholder reports of the other funds. The estimate of expenses does not include any fees or other expenses of any variable annuity or variable life insurance product. If they were, the estimate of expenses you paid during the period would be higher, and your ending account value would be lower. In addition, each Fund, as a shareholder in underlying Fidelity Funds, will indirectly bear its pro-rata share of the fees and expenses incurred by the underlying Fidelity Funds. These fees and expenses are not included in each Fund's annualized expense ratio used to calculate the expense estimates in the table below.
Please note that the expenses shown in the table are meant to highlight your ongoing costs only and do not reflect any transaction costs. Therefore, the second line of the table is useful in comparing ongoing costs only, and will not help you determine the relative total costs of owning different funds.
| Annualized
Expense Ratio | Beginning
Account Value
January 1, 2011 | Ending
Account Value
June 30, 2011 | Expenses Paid
During Period*
January 1, 2011 to June 30, 2011 |
VIP Investor Freedom Income | .00% | | | |
Actual | | $ 1,000.00 | $ 1,024.20 | $ .00 |
HypotheticalA | | $ 1,000.00 | $ 1,024.79 | $ .00 |
VIP Investor Freedom 2005 | .00% | | | |
Actual | | $ 1,000.00 | $ 1,034.50 | $ .00 |
HypotheticalA | | $ 1,000.00 | $ 1,024.79 | $ .00 |
VIP Investor Freedom 2010 | .00% | | | |
Actual | | $ 1,000.00 | $ 1,039.80 | $ .00 |
HypotheticalA | | $ 1,000.00 | $ 1,024.79 | $ .00 |
VIP Investor Freedom 2015 | .00% | | | |
Actual | | $ 1,000.00 | $ 1,041.50 | $ .00 |
HypotheticalA | | $ 1,000.00 | $ 1,024.79 | $ .00 |
VIP Investor Freedom 2020 | .00% | | | |
Actual | | $ 1,000.00 | $ 1,046.00 | $ .00 |
HypotheticalA | | $ 1,000.00 | $ 1,024.79 | $ .00 |
VIP Investor Freedom 2025 | .00% | | | |
Actual | | $ 1,000.00 | $ 1,048.80 | $ .00 |
HypotheticalA | | $ 1,000.00 | $ 1,024.79 | $ .00 |
VIP Investor Freedom 2030 | .00% | | | |
Actual | | $ 1,000.00 | $ 1,049.90 | $ .00 |
HypotheticalA | | $ 1,000.00 | $ 1,024.79 | $ .00 |
A 5% return per year before expenses
* Expenses are equal to each Fund's annualized expense ratio, multiplied by the average account value over the period, multiplied by 181/365 (to reflect the one-half year period). The fees and expenses of the underlying Fidelity Funds in which the Fund invests are not included in the Fund's annualized expense ratio.
Semiannual Report
VIP Investor Freedom Income Portfolio
Investment Changes (Unaudited)
Fund Holdings as of June 30, 2011 |
| % of fund's
net assets | % of fund's net assets
6 months ago |
Domestic Equity Funds | | |
VIP Contrafund Portfolio Investor Class | 2.4 | 2.5 |
VIP Equity-Income Portfolio Investor Class | 2.8 | 2.9 |
VIP Growth & Income Portfolio Investor Class | 2.8 | 2.9 |
VIP Growth Portfolio Investor Class | 2.9 | 2.9 |
VIP Mid Cap Portfolio Investor Class | 1.0 | 1.0 |
VIP Value Portfolio Investor Class | 2.4 | 2.5 |
VIP Value Strategies Portfolio Investor Class | 1.0 | 1.1 |
| 15.3 | 15.8 |
Developed International Equity Funds | | |
VIP Overseas Portfolio Investor Class R | 4.5 | 4.6 |
Emerging Markets Equity Funds | | |
VIP Emerging Markets Portfolio Investor Class R | 0.8 | 0.8 |
High Yield Bond Funds | | |
VIP High Income Portfolio Investor Class | 5.0 | 5.0 |
Investment Grade Bond Funds | | |
VIP Investment Grade Bond Portfolio Investor Class | 34.6 | 34.2 |
Short-Term Funds | | |
VIP Money Market Portfolio Investor Class | 39.8 | 39.6 |
Net Other Assets (Liabilities)* | 0.0 | 0.0 |
| 100.0 | 100.0 |
* Amount represents less than 0.1% |
Asset Allocation (% of fund's net assets) |
Current |
| Domestic Equity Funds | 15.3% | |
| Developed International Equity Funds | 4.5% | |
| Emerging Markets Equity Funds | 0.8% | |
| High Yield Bond Funds | 5.0% | |
| Investment Grade Bond Funds | 34.6% | |
| Short-Term Funds | 39.8% | |

Six months ago |
| Domestic Equity Funds | 15.8% | |
| Developed International Equity Funds | 4.6% | |
| Emerging Markets Equity Funds | 0.8% | |
| High Yield Bond Funds | 5.0% | |
| Investment Grade Bond Funds | 34.2% | |
| Short-Term Funds | 39.6% | |

Expected |
| Domestic Equity Funds | 14.6% | |
| Developed International Equity Funds | 4.6% | |
| Emerging Markets Equity Funds | 0.8% | |
| High Yield Bond Funds | 5.0% | |
| Investment Grade Bond Funds | 35.0% | |
| Short-Term Funds | 40.0% | |

The six months ago allocation is based on the fund's holdings as of December 30, 2010. The current allocation is based on the fund's holdings as of June 30, 2011. The expected allocation represents the fund's anticipated allocation at December 30, 2011. |
Semiannual Report
VIP Investor Freedom Income Portfolio
Investments June 30, 2011 (Unaudited)
Showing Percentage of Net Assets
Domestic Equity Funds - 15.3% |
| Shares | | Value |
Domestic Equity Funds - 15.3% |
VIP Contrafund Portfolio Investor Class | 30,781 | | $ 770,149 |
VIP Equity-Income Portfolio Investor Class | 44,432 | | 897,083 |
VIP Growth & Income Portfolio Investor Class | 67,971 | | 895,175 |
VIP Growth Portfolio Investor Class | 22,764 | | 913,517 |
VIP Mid Cap Portfolio Investor Class | 9,496 | | 312,315 |
VIP Value Portfolio Investor Class | 66,381 | | 768,026 |
VIP Value Strategies Portfolio Investor Class | 31,257 | | 321,949 |
TOTAL DOMESTIC EQUITY FUNDS (Cost $4,897,907) | 4,878,214 |
International Equity Funds - 5.3% |
| | | |
Developed International Equity Funds - 4.5% |
VIP Overseas Portfolio Investor Class R | 82,734 | | 1,456,123 |
Emerging Markets Equity Funds - 0.8% |
VIP Emerging Markets Portfolio Investor Class R | 25,341 | | 249,604 |
TOTAL INTERNATIONAL EQUITY FUNDS (Cost $1,354,921) | 1,705,727 |
Bond Funds - 39.6% |
| | | |
High Yield Bond Funds - 5.0% |
VIP High Income Portfolio Investor Class | 274,401 | | 1,591,525 |
Investment Grade Bond Funds - 34.6% |
VIP Investment Grade Bond Portfolio Investor Class | 854,034 | | 11,068,277 |
TOTAL BOND FUNDS (Cost $12,333,639) | 12,659,802 |
Short-Term Funds - 39.8% |
| | | |
VIP Money Market Portfolio Investor Class
(Cost $12,693,751) | 12,693,751 | | 12,693,751 |
TOTAL INVESTMENT PORTFOLIO - 100.0% (Cost $31,280,218) | | 31,937,494 |
NET OTHER ASSETS (LIABILITIES) - 0.0% | | 47 |
NET ASSETS - 100% | $ 31,937,541 |
Other Information |
All investments are categorized as Level 1 under the Fair Value Hierarchy. The inputs or methodology used for valuing securities may not be an indication of the risk associated with investing in those securities. For more information on valuation inputs, please refer to the Security Valuation section in the accompanying Notes to Financial Statements. |
See accompanying notes which are an integral part of the financial statements.
Semiannual Report
VIP Investor Freedom Income Portfolio
Statement of Assets and Liabilities
| June 30, 2011 (Unaudited) |
Assets | | |
Investment in securities, at value (cost $31,280,218) - See accompanying schedule | | $ 31,937,494 |
Cash | | 46 |
Receivable for fund shares sold | | 75,792 |
Total assets | | 32,013,332 |
| | |
Liabilities | | |
Payable for investments purchased | $ 75,776 | |
Payable for fund shares redeemed | 15 | |
Total liabilities | | 75,791 |
| | |
Net Assets | | $ 31,937,541 |
Net Assets consist of: | | |
Paid in capital | | $ 31,115,421 |
Undistributed net investment income | | 14,693 |
Accumulated undistributed net realized gain (loss) on investments | | 150,151 |
Net unrealized appreciation (depreciation) on investments | | 657,276 |
Net Assets, for 3,000,710 shares outstanding | | $ 31,937,541 |
Net Asset Value, offering price and redemption price per share ($31,937,541 ÷ 3,000,710 shares) | | $ 10.64 |
Statement of Operations
Six months ended June 30, 2011 (Unaudited) |
Investment Income | | |
Income distributions from underlying funds | | $ 13,023 |
| | |
Expenses | | |
Independent trustees' compensation | $ 57 | |
Total expenses before reductions | 57 | |
Expense reductions | (57) | 0 |
Net investment income (loss) | | 13,023 |
Realized and Unrealized Gain (Loss) Realized gain (loss) on sale of underlying fund shares | 96,524 | |
Capital gain distributions from underlying funds | 193,727 | |
Total net realized gain (loss) | | 290,251 |
Change in net unrealized appreciation (depreciation) on underlying funds | | 450,634 |
Net gain (loss) | | 740,885 |
Net increase (decrease) in net assets resulting from operations | | $ 753,908 |
See accompanying notes which are an integral part of the financial statements.
Semiannual Report
Statement of Changes in Net Assets
| Six months ended June 30, 2011
(Unaudited) | Year ended
December 31,
2010 |
Increase (Decrease) in Net Assets | | |
Operations | | |
Net investment income (loss) | $ 13,023 | $ 593,418 |
Net realized gain (loss) | 290,251 | 318,126 |
Change in net unrealized appreciation (depreciation) | 450,634 | 1,270,766 |
Net increase (decrease) in net assets resulting from operations | 753,908 | 2,182,310 |
Distributions to shareholders from net investment income | - | (592,180) |
Distributions to shareholders from net realized gain | (37,708) | (299,615) |
Total distributions | (37,708) | (891,795) |
Share transactions
Proceeds from sales of shares | 3,740,893 | 8,914,880 |
Reinvestment of distributions | 37,708 | 891,795 |
Cost of shares redeemed | (5,023,883) | (4,004,799) |
Net increase (decrease) in net assets resulting from share transactions | (1,245,282) | 5,801,876 |
Total increase (decrease) in net assets | (529,082) | 7,092,391 |
| | |
Net Assets | | |
Beginning of period | 32,466,623 | 25,374,232 |
End of period (including undistributed net investment income of $14,693 and undistributed net investment income of $1,670, respectively) | $ 31,937,541 | $ 32,466,623 |
Other Information Shares | | |
Sold | 353,776 | 872,042 |
Issued in reinvestment of distributions | 3,591 | 86,021 |
Redeemed | (477,295) | (387,078) |
Net increase (decrease) | (119,928) | 570,985 |
Financial Highlights
| Six months ended June 30, 2011 | Years ended December 31, |
| (Unaudited) | 2010 | 2009 | 2008 | 2007 | 2006 |
Selected Per-Share Data | | | | | | |
Net asset value, beginning of period | $ 10.40 | $ 9.95 | $ 9.10 | $ 10.79 | $ 10.78 | $ 10.14 |
Income from Investment Operations | | | | | | |
Net investment income (loss) E | - I | .21 | .40 | .34 | .42 | .35 |
Net realized and unrealized gain (loss) | .25 | .54 | .94 | (1.47) | .22 | .34 |
Total from investment operations | .25 | .75 | 1.34 | (1.13) | .64 | .69 |
Distributions from net investment income | - | (.20) | (.33) | (.37) | (.58) | (.05) |
Distributions from net realized gain | (.01) | (.10) | (.16) | (.19) | (.06) | - |
Total distributions | (.01) | (.30) | (.49) | (.56) | (.63) J | (.05) |
Net asset value, end of period | $ 10.64 | $ 10.40 | $ 9.95 | $ 9.10 | $ 10.79 | $ 10.78 |
Total Return B, C, D | 2.42% | 7.50% | 14.85% | (10.55)% | 6.08% | 6.83% |
Ratios to Average Net Assets F, H | | | | | | |
Expenses before reductions G | .00% A | .00% | .00% | .00% | .00% | .00% |
Expenses net of fee waivers, if any | .00% A | .00% | .00% | .00% | .00% | .00% |
Expenses net of all reductions | .00% A | .00% | .00% | .00% | .00% | .00% |
Net investment income (loss) | .08% A | 2.00% | 4.12% | 3.33% | 3.90% | 3.39% |
Supplemental Data | | | | | | |
Net assets, end of period (000 omitted) | $ 31,938 | $ 32,467 | $ 25,374 | $ 17,272 | $ 20,090 | $ 11,177 |
Portfolio turnover rate | 28% A | 24% | 30% | 53% | 38% | 40% |
A Annualized
B Total returns for periods of less than one year are not annualized.
C Total returns do not reflect charges attributable to your insurance company's separate account. Inclusion of these charges would reduce the total returns shown.
D Total returns would have been lower if certain expenses had not been reduced during the applicable periods shown.
E Calculated based on average shares outstanding during the period.
F Amounts do not include the activity of the underlying funds.
G Amount represents less than .01%.
H Expense ratios reflect operating expenses of the Fund. Expenses before reductions do not reflect amounts reimbursed by the investment adviser or reductions from expense offset arrangements and do not represent the amount paid by the Fund during periods when reimbursements or reductions occur. Expenses net of fee waivers reflect expenses after reimbursement by the investment adviser but prior to reductions from expense offset arrangements. Expenses net of all reductions represent the net expenses paid by the Fund but do not include expenses of the investment companies in which the Fund invests.
I Amount represents less than $.01 per share.
J Total distributions of $.63 per share is comprised of distributions from net investment income of $.575 and distributions from net realized gain of $.055 per share.
See accompanying notes which are an integral part of the financial statements.
Semiannual Report
VIP Investor Freedom 2005 Portfolio
Investment Changes (Unaudited)
Fund Holdings as of June 30, 2011 |
| % of fund's
net assets | % of fund's net assets
6 months ago |
Domestic Equity Funds | | |
VIP Contrafund Portfolio Investor Class | 4.8 | 5.2 |
VIP Equity-Income Portfolio Investor Class | 5.6 | 6.1 |
VIP Growth & Income Portfolio Investor Class | 5.6 | 6.0 |
VIP Growth Portfolio Investor Class | 5.7 | 6.0 |
VIP Mid Cap Portfolio Investor Class | 2.0 | 2.1 |
VIP Value Portfolio Investor Class | 4.8 | 5.2 |
VIP Value Strategies Portfolio Investor Class | 2.0 | 2.2 |
| 30.5 | 32.8 |
Developed International Equity Funds | | |
VIP Overseas Portfolio Investor Class R | 9.2 | 9.7 |
Emerging Markets Equity Funds | | |
VIP Emerging Markets Portfolio Investor Class R | 1.6 | 1.6 |
High Yield Bond Funds | | |
VIP High Income Portfolio Investor Class | 5.0 | 4.9 |
Investment Grade Bond Funds | | |
VIP Investment Grade Bond Portfolio Investor Class | 30.6 | 30.2 |
Short-Term Funds | | |
VIP Money Market Portfolio Investor Class | 23.1 | 20.8 |
Net Other Assets (Liabilities)* | 0.0 | 0.0 |
| 100.0 | 100.0 |
* Amount represents less than 0.1% |
Asset Allocation (% of fund's net assets) |
Current |
| Domestic Equity Funds | 30.5% | |
| Developed International Equity Funds | 9.2% | |
 | Emerging Markets Equity Funds | 1.6% | |
 | High Yield Bond Funds | 5.0% | |
| Investment Grade Bond Funds | 30.6% | |
| Short-Term Funds | 23.1% | |

Six months ago |
| Domestic Equity Funds | 32.8% | |
| Developed International Equity Funds | 9.7% | |
| Emerging Markets Equity Funds | 1.6% | |
| High Yield Bond Funds | 4.9% | |
| Investment Grade Bond Funds | 30.2% | |
| Short-Term Funds | 20.8% | |

Expected |
| Domestic Equity Funds | 28.4% | |
| Developed International Equity Funds | 8.8% | |
| Emerging Markets Equity Funds | 1.6% | |
| High Yield Bond Funds | 5.0% | |
| Investment Grade Bond Funds | 30.1% | |
| Short-Term Funds | 26.1% | |

The fund invests according to an asset allocation strategy that becomes increasingly conservative over time. The six months ago allocation is based on the fund's holdings as of December 30, 2010. The current allocation is based on the fund's holdings as of June 30, 2011. The expected allocation represents the fund's anticipated allocation at December 31, 2011. |
Semiannual Report
VIP Investor Freedom 2005 Portfolio
Investments June 30, 2011 (Unaudited)
Showing Percentage of Net Assets
Domestic Equity Funds - 30.5% |
| Shares | | Value |
Domestic Equity Funds - 30.5% |
VIP Contrafund Portfolio Investor Class | 21,672 | | $ 542,231 |
VIP Equity-Income Portfolio Investor Class | 31,377 | | 633,510 |
VIP Growth & Income Portfolio Investor Class | 47,973 | | 631,800 |
VIP Growth Portfolio Investor Class | 16,061 | | 644,517 |
VIP Mid Cap Portfolio Investor Class | 6,696 | | 220,239 |
VIP Value Portfolio Investor Class | 46,749 | | 540,886 |
VIP Value Strategies Portfolio Investor Class | 22,054 | | 227,154 |
TOTAL DOMESTIC EQUITY FUNDS (Cost $3,770,252) | 3,440,337 |
International Equity Funds - 10.8% |
| | | |
Developed International Equity Funds - 9.2% |
VIP Overseas Portfolio Investor Class R | 59,310 | | 1,043,865 |
Emerging Markets Equity Funds - 1.6% |
VIP Emerging Markets Portfolio Investor Class R | 18,188 | | 179,155 |
TOTAL INTERNATIONAL EQUITY FUNDS (Cost $1,285,338) | 1,223,020 |
Bond Funds - 35.6% |
| | | |
High Yield Bond Funds - 5.0% |
VIP High Income Portfolio Investor Class | 97,318 | | 564,445 |
Investment Grade Bond Funds - 30.6% |
VIP Investment Grade Bond Portfolio Investor Class | 266,109 | | 3,448,769 |
TOTAL BOND FUNDS (Cost $3,901,113) | 4,013,214 |
Short-Term Funds - 23.1% |
| | | |
VIP Money Market Portfolio Investor Class
(Cost $2,610,978) | 2,610,978 | | 2,610,978 |
TOTAL INVESTMENT PORTFOLIO - 100.0% (Cost $11,567,681) | | 11,287,549 |
NET OTHER ASSETS (LIABILITIES) - 0.0% | | 1 |
NET ASSETS - 100% | $ 11,287,550 |
Other Information |
All investments are categorized as Level 1 under the Fair Value Hierarchy. The inputs or methodology used for valuing securities may not be an indication of the risk associated with investing in those securities. For more information on valuation inputs, please refer to the Security Valuation section in the accompanying Notes to Financial Statements. |
See accompanying notes which are an integral part of the financial statements.
Semiannual Report
VIP Investor Freedom 2005 Portfolio
Statement of Assets and Liabilities
| June 30, 2011 (Unaudited) |
Assets | | |
Investment in securities, at value (cost $11,567,681) - See accompanying schedule | | $ 11,287,549 |
Receivable for investments sold | | 76 |
Total assets | | 11,287,625 |
| | |
Liabilities | | |
Payable to custodian bank | $ 2 | |
Payable for fund shares redeemed | 73 | |
Total liabilities | | 75 |
| | |
Net Assets | | $ 11,287,550 |
Net Assets consist of: | | |
Paid in capital | | $ 11,566,498 |
Undistributed net investment income | | 3,350 |
Accumulated undistributed net realized gain (loss) on investments | | (2,166) |
Net unrealized appreciation (depreciation) on investments | | (280,132) |
Net Assets, for 1,109,845 shares outstanding | | $ 11,287,550 |
Net Asset Value, offering price and redemption price per share ($11,287,550 ÷ 1,109,845 shares) | | $ 10.17 |
Statement of Operations
Six months ended June 30, 2011 (Unaudited) |
Investment Income | | |
Income distributions from underlying funds | | $ 3,109 |
| | |
Expenses | | |
Independent trustees' compensation | $ 19 | |
Total expenses before reductions | 19 | |
Expense reductions | (19) | 0 |
Net investment income (loss) | | 3,109 |
Realized and Unrealized Gain (Loss) Realized gain (loss) on sale of underlying fund shares | 34,247 | |
Capital gain distributions from underlying funds | 57,667 | |
Total net realized gain (loss) | | 91,914 |
Change in net unrealized appreciation (depreciation) on underlying funds | | 242,363 |
Net gain (loss) | | 334,277 |
Net increase (decrease) in net assets resulting from operations | | $ 337,386 |
See accompanying notes which are an integral part of the financial statements.
Semiannual Report
Statement of Changes in Net Assets
| Six months ended
June 30, 2011
(Unaudited) | Year ended
December 31,
2010 |
Increase (Decrease) in Net Assets | | |
Operations | | |
Net investment income (loss) | $ 3,109 | $ 188,164 |
Net realized gain (loss) | 91,914 | 238,461 |
Change in net unrealized appreciation (depreciation) | 242,363 | 601,701 |
Net increase (decrease) in net assets resulting from operations | 337,386 | 1,028,326 |
Distributions to shareholders from net investment income | - | (188,220) |
Distributions to shareholders from net realized gain | (21,416) | (227,534) |
Total distributions | (21,416) | (415,754) |
Share transactions
Proceeds from sales of shares | 3,292,590 | 4,550,953 |
Reinvestment of distributions | 21,416 | 415,754 |
Cost of shares redeemed | (2,780,185) | (4,539,322) |
Net increase (decrease) in net assets resulting from share transactions | 533,821 | 427,385 |
Total increase (decrease) in net assets | 849,791 | 1,039,957 |
| | |
Net Assets | | |
Beginning of period | 10,437,759 | 9,397,802 |
End of period (including undistributed net investment income of $3,350 and undistributed net investment income of $241, respectively) | $ 11,287,550 | $ 10,437,759 |
Other Information Shares | | |
Sold | 324,471 | 476,271 |
Issued in reinvestment of distributions | 2,133 | 42,428 |
Redeemed | (276,876) | (478,599) |
Net increase (decrease) | 49,728 | 40,100 |
Financial Highlights
| Six months ended June 30, 2011 | Years ended December 31, |
| (Unaudited) | 2010 | 2009 | 2008 | 2007 | 2006 |
Selected Per-Share Data | | | | | | |
Net asset value, beginning of period | $ 9.85 | $ 9.21 | $ 7.91 | $ 11.53 | $ 11.17 | $ 10.24 |
Income from Investment Operations | | | | | | |
Net investment income (loss) E | - J | .18 | .35 | .32 | .35 | .26 |
Net realized and unrealized gain (loss) | .34 | .87 | 1.41 | (3.00) | .59 | .73 |
Total from investment operations | .34 | 1.05 | 1.76 | (2.68) | .94 | .99 |
Distributions from net investment income | - | (.19) | (.33) | (.30) | (.46) | (.06) |
Distributions from net realized gain | (.02) | (.22) | (.14) | (.64) | (.12) | - |
Total distributions | (.02) | (.41) | (.46) I | (.94) | (.58) | (.06) |
Net asset value, end of period | $ 10.17 | $ 9.85 | $ 9.21 | $ 7.91 | $ 11.53 | $ 11.17 |
Total Return B, C, D | 3.45% | 11.41% | 22.71% | (23.91)% | 8.55% | 9.72% |
Ratios to Average Net Assets F, H | | | | | | |
Expenses before reductions G | .00% A | .00% | .00% | .00% | .00% | .00% |
Expenses net of fee waivers, if any | .00% A | .00% | .00% | .00% | .00% | .00% |
Expenses net of all reductions | .00% A | .00% | .00% | .00% | .00% | .00% |
Net investment income (loss) | .06% A | 1.90% | 4.12% | 3.19% | 3.02% | 2.47% |
Supplemental Data | | | | | | |
Net assets, end of period (000 omitted) | $ 11,288 | $ 10,438 | $ 9,398 | $ 7,038 | $ 8,568 | $ 4,851 |
Portfolio turnover rate | 58% A | 63% | 47% | 40% | 53% | 55% |
A Annualized
B Total returns for periods of less than one year are not annualized.
C Total returns do not reflect charges attributable to your insurance company's separate account. Inclusion of these charges would reduce the total returns shown.
D Total returns would have been lower if certain expenses had not been reduced during the applicable periods shown.
E Calculated based on average shares outstanding during the period.
F Amounts do not include the activity of the underlying funds.
G Amount represents less than .01%.
H Expense ratios reflect operating expenses of the Fund. Expenses before reductions do not reflect amounts reimbursed by the investment adviser or reductions from expense offset arrangements and do not represent the amount paid by the Fund during periods when reimbursements or reductions occur. Expenses net of fee waivers reflect expenses after reimbursement by the investment adviser but prior to reductions from expense offset arrangements. Expenses net of all reductions represent the net expenses paid by the Fund but do not include expenses of the investment companies in which the Fund invests.
I Total distributions of $.46 per share is comprised of distributions from net investment income of $.325 and distributions from net realized gain of $.135 per share.
J Amount represents less than $.01 per share.
See accompanying notes which are an integral part of the financial statements.
Semiannual Report
VIP Investor Freedom 2010 Portfolio
Investment Changes (Unaudited)
Fund Holdings as of June 30, 2011 |
| % of fund's
net assets | % of fund's net assets
6 months ago |
Domestic Equity Funds | | |
VIP Contrafund Portfolio Investor Class | 5.8 | 6.0 |
VIP Equity-Income Portfolio Investor Class | 6.7 | 7.1 |
VIP Growth & Income Portfolio Investor Class | 6.7 | 7.0 |
VIP Growth Portfolio Investor Class | 6.9 | 7.0 |
VIP Mid Cap Portfolio Investor Class | 2.4 | 2.4 |
VIP Value Portfolio Investor Class | 5.8 | 6.1 |
VIP Value Strategies Portfolio Investor Class | 2.4 | 2.6 |
| 36.7 | 38.2 |
Developed International Equity Funds | | |
VIP Overseas Portfolio Investor Class R | 11.2 | 11.3 |
Emerging Markets Equity Funds | | |
VIP Emerging Markets Portfolio Investor Class R | 1.9 | 1.9 |
High Yield Bond Funds | | |
VIP High Income Portfolio Investor Class | 5.0 | 4.9 |
Investment Grade Bond Funds | | |
VIP Investment Grade Bond Portfolio Investor Class | 34.5 | 33.5 |
Short-Term Funds | | |
VIP Money Market Portfolio Investor Class | 10.7 | 10.2 |
Net Other Assets (Liabilities)* | 0.0 | 0.0 |
| 100.0 | 100.0 |
* Amount represents less than 0.1% |
Asset Allocation (% of fund's net assets) |
Current |
| Domestic Equity Funds | 36.7% | |
| Developed International Equity Funds | 11.2% | |
| Emerging Markets Equity Funds | 1.9% | |
| High Yield Bond Funds | 5.0% | |
| Investment Grade Bond Funds | 34.5% | |
| Short-Term Funds | 10.7% | |

Six months ago |
| Domestic Equity Funds | 38.2% | |
| Developed International Equity Funds | 11.3% | |
| Emerging Markets Equity Funds | 1.9% | |
| High Yield Bond Funds | 4.9% | |
| Investment Grade Bond Funds | 33.5% | |
| Short-Term Funds | 10.2% | |

Expected |
| Domestic Equity Funds | 36.0% | |
| Developed International Equity Funds | 11.1% | |
| Emerging Markets Equity Funds | 2.0% | |
| High Yield Bond Funds | 5.0% | |
| Investment Grade Bond Funds | 34.6% | |
| Short-Term Funds | 11.3% | |

The fund invests according to an asset allocation strategy that becomes increasingly conservative over time. The six months ago allocation is based on the fund's holdings as of December 30, 2010. The current allocation is based on the fund's holdings as of June 30, 2011. The expected allocation represents the fund's anticipated allocation at December 31, 2011. |
Semiannual Report
VIP Investor Freedom 2010 Portfolio
Investments June 30, 2011 (Unaudited)
Showing Percentage of Net Assets
Domestic Equity Funds - 36.7% |
| Shares | | Value |
Domestic Equity Funds - 36.7% |
VIP Contrafund Portfolio Investor Class | 130,726 | | $ 3,270,754 |
VIP Equity-Income Portfolio Investor Class | 188,786 | | 3,811,587 |
VIP Growth & Income Portfolio Investor Class | 288,795 | | 3,803,428 |
VIP Growth Portfolio Investor Class | 96,704 | | 3,880,729 |
VIP Mid Cap Portfolio Investor Class | 40,414 | | 1,329,212 |
VIP Value Portfolio Investor Class | 281,870 | | 3,261,232 |
VIP Value Strategies Portfolio Investor Class | 133,097 | | 1,370,899 |
TOTAL DOMESTIC EQUITY FUNDS (Cost $23,496,519) | 20,727,841 |
International Equity Funds - 13.1% |
| | | |
Developed International Equity Funds - 11.2% |
VIP Overseas Portfolio Investor Class R | 357,929 | | 6,299,556 |
Emerging Markets Equity Funds - 1.9% |
VIP Emerging Markets Portfolio Investor Class R | 109,799 | | 1,081,518 |
TOTAL INTERNATIONAL EQUITY FUNDS (Cost $8,342,905) | 7,381,074 |
Bond Funds - 39.5% |
| | | |
High Yield Bond Funds - 5.0% |
VIP High Income Portfolio Investor Class | 486,228 | | 2,820,122 |
Investment Grade Bond Funds - 34.5% |
VIP Investment Grade Bond Portfolio Investor Class | 1,504,453 | | 19,497,708 |
TOTAL BOND FUNDS (Cost $21,985,198) | 22,317,830 |
Short-Term Funds - 10.7% |
| Shares | | Value |
VIP Money Market Portfolio Investor Class
(Cost $6,048,612) | 6,048,612 | | $ 6,048,612 |
TOTAL INVESTMENT PORTFOLIO - 100.0% (Cost $59,873,234) | | 56,475,357 |
NET OTHER ASSETS (LIABILITIES) - 0.0% | | 7 |
NET ASSETS - 100% | $ 56,475,364 |
Other Information |
All investments are categorized as Level 1 under the Fair Value Hierarchy. The inputs or methodology used for valuing securities may not be an indication of the risk associated with investing in those securities. For more information on valuation inputs, please refer to the Security Valuation section in the accompanying Notes to Financial Statements. |
Income Tax Information |
At December 31, 2010, the Fund had a capital loss carryforward of approximately $148,328 all of which will expire in fiscal 2017. Capital loss carryforwards are only available to offset future capital gains of the Fund to the extent provided by regulations and may be limited. |
See accompanying notes which are an integral part of the financial statements.
Semiannual Report
VIP Investor Freedom 2010 Portfolio
Statement of Assets and Liabilities
| June 30, 2011 (Unaudited) |
Assets | | |
Investment in securities, at value (cost $59,873,234) - See accompanying schedule | | $ 56,475,357 |
Cash | | 6 |
Receivable for fund shares sold | | 250,028 |
Total assets | | 56,725,391 |
| | |
Liabilities | | |
Payable for investments purchased | $ 249,991 | |
Payable for fund shares redeemed | 36 | |
Total liabilities | | 250,027 |
| | |
Net Assets | | $ 56,475,364 |
Net Assets consist of: | | |
Paid in capital | | $ 59,951,419 |
Undistributed net investment income | | 13,163 |
Accumulated undistributed net realized gain (loss) on investments | | (91,341) |
Net unrealized appreciation (depreciation) on investments | | (3,397,877) |
Net Assets, for 5,397,119 shares outstanding | | $ 56,475,364 |
Net Asset Value, offering price and redemption price per share ($56,475,364 ÷ 5,397,119 shares) | | $ 10.46 |
Statement of Operations
Six months ended June 30, 2011 (Unaudited) |
Investment Income | | |
Income distributions from underlying funds | | $ 13,163 |
| | |
Expenses | | |
Independent trustees' compensation | $ 100 | |
Total expenses before reductions | 100 | |
Expense reductions | (100) | 0 |
Net investment income (loss) | | 13,163 |
Realized and Unrealized Gain (Loss) Realized gain (loss) on sale of underlying fund shares | 74,180 | |
Capital gain distributions from underlying funds | 336,556 | |
Total net realized gain (loss) | | 410,736 |
Change in net unrealized appreciation (depreciation) on underlying funds | | 1,769,563 |
Net gain (loss) | | 2,180,299 |
Net increase (decrease) in net assets resulting from operations | | $ 2,193,462 |
See accompanying notes which are an integral part of the financial statements.
Semiannual Report
Financial Statements - continued
Statement of Changes in Net Assets
| Six months ended
June 30, 2011
(Unaudited) | Year ended
December 31,
2010 |
Increase (Decrease) in Net Assets | | |
Operations | | |
Net investment income (loss) | $ 13,163 | $ 1,107,059 |
Net realized gain (loss) | 410,736 | 353,427 |
Change in net unrealized appreciation (depreciation) | 1,769,563 | 4,638,516 |
Net increase (decrease) in net assets resulting from operations | 2,193,462 | 6,099,002 |
Distributions to shareholders from net investment income | - | (1,116,128) |
Distributions to shareholders from net realized gain | - | (236,914) |
Total distributions | - | (1,353,042) |
Share transactions
Proceeds from sales of shares | 3,586,703 | 8,523,280 |
Reinvestment of distributions | - | 1,353,042 |
Cost of shares redeemed | (3,896,215) | (7,702,235) |
Net increase (decrease) in net assets resulting from share transactions | (309,512) | 2,174,087 |
Total increase (decrease) in net assets | 1,883,950 | 6,920,047 |
| | |
Net Assets | | |
Beginning of period | 54,591,414 | 47,671,367 |
End of period (including undistributed net investment income of $13,163 and undistributed net investment income of $0, respectively) | $ 56,475,364 | $ 54,591,414 |
Other Information Shares | | |
Sold | 346,251 | 893,058 |
Issued in reinvestment of distributions | - | 134,631 |
Redeemed | (375,822) | (814,379) |
Net increase (decrease) | (29,571) | 213,310 |
Financial Highlights
| Six months ended June 30, 2011 | Years ended December 31, |
| (Unaudited) | 2010 | 2009 | 2008 | 2007 | 2006 |
Selected Per-Share Data | | | | | | |
Net asset value, beginning of period | $ 10.06 | $ 9.14 | $ 7.77 | $ 11.56 | $ 11.19 | $ 10.26 |
Income from Investment Operations | | | | | | |
Net investment income (loss) E | - I | .21 | .35 | .30 | .33 | .24 |
Net realized and unrealized gain (loss) | .40 | .97 | 1.49 | (3.12) | .62 | .73 |
Total from investment operations | .40 | 1.18 | 1.84 | (2.82) | .95 | .97 |
Distributions from net investment income | - | (.21) | (.35) | (.33) | (.44) | (.04) |
Distributions from net realized gain | - | (.05) | (.12) | (.64) | (.14) | - |
Total distributions | - | (.26) | (.47) | (.97) | (.58) | (.04) |
Net asset value, end of period | $ 10.46 | $ 10.06 | $ 9.14 | $ 7.77 | $ 11.56 | $ 11.19 |
Total Return B, C, D | 3.98% | 12.88% | 24.09% | (24.99)% | 8.63% | 9.49% |
Ratios to Average Net Assets F, H | | | | | | |
Expenses before reductions G | .00% A | .00% | .00% | .00% | .00% | .00% |
Expenses net of fee waivers, if any | .00% A | .00% | .00% | .00% | .00% | .00% |
Expenses net of all reductions | .00% A | .00% | .00% | .00% | .00% | .00% |
Net investment income (loss) | .05% A | 2.20% | 4.18% | 3.01% | 2.90% | 2.29% |
Supplemental Data | | | | | | |
Net assets, end of period (000 omitted) | $ 56,475 | $ 54,591 | $ 47,671 | $ 41,205 | $ 57,197 | $ 31,460 |
Portfolio turnover rate | 19% A | 31% | 28% | 40% | 14% | 29% |
A Annualized
B Total returns for periods of less than one year are not annualized.
C Total returns do not reflect charges attributable to your insurance company's separate account. Inclusion of these charges would reduce the total returns shown.
D Total returns would have been lower if certain expenses had not been reduced during the applicable periods shown.
E Calculated based on average shares outstanding during the period.
F Amounts do not include the activity of the underlying funds.
G Amount represents less than .01%.
H Expense ratios reflect operating expenses of the Fund. Expenses before reductions do not reflect amounts reimbursed by the investment adviser or reductions from expense offset arrangements and do not represent the amount paid by the Fund during periods when reimbursements or reductions occur. Expenses net of fee waivers reflect expenses after reimbursement by the investment adviser but prior to reductions from expense offset arrangements. Expenses net of all reductions represent the net expenses paid by the Fund but do not include expenses of the investment companies in which the Fund invests.
I Amount represents less than $.01 per share.
See accompanying notes which are an integral part of the financial statements.
Semiannual Report
VIP Investor Freedom 2015 Portfolio
Investment Changes (Unaudited)
Fund Holdings as of June 30, 2011 |
| % of fund's
net assets | % of fund's net assets
6 months ago |
Domestic Equity Funds | | |
VIP Contrafund Portfolio Investor Class | 6.0 | 6.2 |
VIP Equity-Income Portfolio Investor Class | 6.9 | 7.3 |
VIP Growth & Income Portfolio Investor Class | 6.9 | 7.2 |
VIP Growth Portfolio Investor Class | 7.1 | 7.2 |
VIP Mid Cap Portfolio Investor Class | 2.4 | 2.5 |
VIP Value Portfolio Investor Class | 5.9 | 6.2 |
VIP Value Strategies Portfolio Investor Class | 2.5 | 2.6 |
| 37.7 | 39.2 |
Developed International Equity Funds | | |
VIP Overseas Portfolio Investor Class R | 11.4 | 11.7 |
Emerging Markets Equity Funds | | |
VIP Emerging Markets Portfolio Investor Class R | 2.0 | 1.9 |
High Yield Bond Funds | | |
VIP High Income Portfolio Investor Class | 5.0 | 5.0 |
Investment Grade Bond Funds | | |
VIP Investment Grade Bond Portfolio Investor Class | 34.4 | 33.1 |
Short-Term Funds | | |
VIP Money Market Portfolio Investor Class | 9.5 | 9.1 |
Net Other Assets (Liabilities)* | 0.0 | 0.0 |
| 100.0 | 100.0 |
* Amount represents less than 0.1% |
Asset Allocation (% of fund's net assets) |
Current |
| Domestic Equity Funds | 37.7% | |
| Developed International Equity Funds | 11.4% | |
| Emerging Markets Equity Funds | 2.0% | |
| High Yield Bond Funds | 5.0% | |
| Investment Grade Bond Funds | 34.4% | |
| Short-Term Funds | 9.5% | |

Six months ago |
| Domestic Equity Funds | 39.2% | |
| Developed International Equity Funds | 11.7% | |
| Emerging Markets Equity Funds | 1.9% | |
| High Yield Bond Funds | 5.0% | |
| Investment Grade Bond Funds | 33.1% | |
| Short-Term Funds | 9.1% | |

Expected |
| Domestic Equity Funds | 37.0% | |
| Developed International Equity Funds | 11.5% | |
| Emerging Markets Equity Funds | 2.0% | |
| High Yield Bond Funds | 5.0% | |
| Investment Grade Bond Funds | 34.7% | |
| Short-Term Funds | 9.8% | |

The fund invests according to an asset allocation strategy that becomes increasingly conservative over time. The six months ago allocation is based on the fund's holdings as of December 30, 2010. The current allocation is based on the fund's holdings as of June 30, 2011. The expected allocation represents the fund's anticipated allocation at December 31, 2011. |
Semiannual Report
VIP Investor Freedom 2015 Portfolio
Investments June 30, 2011 (Unaudited)
Showing Percentage of Net Assets
Domestic Equity Funds - 37.7% |
| Shares | | Value |
Domestic Equity Funds - 37.7% |
VIP Contrafund Portfolio Investor Class | 172,196 | | $ 4,308,356 |
VIP Equity-Income Portfolio Investor Class | 248,833 | | 5,023,946 |
VIP Growth & Income Portfolio Investor Class | 380,689 | | 5,013,670 |
VIP Growth Portfolio Investor Class | 127,468 | | 5,115,286 |
VIP Mid Cap Portfolio Investor Class | 53,266 | | 1,751,928 |
VIP Value Portfolio Investor Class | 371,134 | | 4,294,017 |
VIP Value Strategies Portfolio Investor Class | 175,374 | | 1,806,348 |
TOTAL DOMESTIC EQUITY FUNDS (Cost $29,934,341) | 27,313,551 |
International Equity Funds - 13.4% |
| | | |
Developed International Equity Funds - 11.4% |
VIP Overseas Portfolio Investor Class R | 472,159 | | 8,310,000 |
Emerging Markets Equity Funds - 2.0% |
VIP Emerging Markets Portfolio Investor Class R | 144,804 | | 1,426,316 |
TOTAL INTERNATIONAL EQUITY FUNDS (Cost $10,513,103) | 9,736,316 |
Bond Funds - 39.4% |
| | | |
High Yield Bond Funds - 5.0% |
VIP High Income Portfolio Investor Class | 630,258 | | 3,655,494 |
Investment Grade Bond Funds - 34.4% |
VIP Investment Grade Bond Portfolio Investor Class | 1,923,028 | | 24,922,449 |
TOTAL BOND FUNDS (Cost $28,015,555) | 28,577,943 |
Short-Term Funds - 9.5% |
| | | |
VIP Money Market Portfolio Investor Class
(Cost $6,910,059) | 6,910,059 | | 6,910,059 |
TOTAL INVESTMENT PORTFOLIO - 100.0% (Cost $75,373,058) | | 72,537,869 |
NET OTHER ASSETS (LIABILITIES) - 0.0% | | (1) |
NET ASSETS - 100% | $ 72,537,868 |
Other Information |
All investments are categorized as Level 1 under the Fair Value Hierarchy. The inputs or methodology used for valuing securities may not be an indication of the risk associated with investing in those securities. For more information on valuation inputs, please refer to the Security Valuation section in the accompanying Notes to Financial Statements. |
See accompanying notes which are an integral part of the financial statements.
Semiannual Report
VIP Investor Freedom 2015 Portfolio
Statement of Assets and Liabilities
| June 30, 2011 (Unaudited) |
Assets | | |
Investment in securities, at value (cost $75,373,058) - See accompanying schedule | | $ 72,537,869 |
Receivable for fund shares sold | | 386,883 |
Total assets | | 72,924,752 |
| | |
Liabilities | | |
Payable to custodian bank | $ 1 | |
Payable for investments purchased | 386,843 | |
Payable for fund shares redeemed | 40 | |
Total liabilities | | 386,884 |
| | |
Net Assets | | $ 72,537,868 |
Net Assets consist of: | | |
Paid in capital | | $ 74,977,481 |
Undistributed net investment income | | 15,744 |
Accumulated undistributed net realized gain (loss) on investments | | 379,832 |
Net unrealized appreciation (depreciation) on investments | | (2,835,189) |
Net Assets, for 7,059,388 shares outstanding | | $ 72,537,868 |
Net Asset Value, offering price and redemption price per share ($72,537,868 ÷ 7,059,388 shares) | | $ 10.28 |
Statement of Operations
Six months ended June 30, 2011 (Unaudited) |
Investment Income | | |
Income distributions from underlying funds | | $ 15,744 |
| | |
Expenses | | |
Independent trustees' compensation | $ 127 | |
Total expenses before reductions | 127 | |
Expense reductions | (127) | 0 |
Net investment income (loss) | | 15,744 |
Realized and Unrealized Gain (Loss) Realized gain (loss) on sale of underlying fund shares | 362,151 | |
Capital gain distributions from underlying funds | 405,796 | |
Total net realized gain (loss) | | 767,947 |
Change in net unrealized appreciation (depreciation) on underlying funds | | 2,135,734 |
Net gain (loss) | | 2,903,681 |
Net increase (decrease) in net assets resulting from operations | | $ 2,919,425 |
See accompanying notes which are an integral part of the financial statements.
Semiannual Report
Statement of Changes in Net Assets
| Six months ended
June 30, 2011
(Unaudited) | Year ended
December 31,
2010 |
Increase (Decrease) in Net Assets | | |
Operations | | |
Net investment income (loss) | $ 15,744 | $ 1,402,241 |
Net realized gain (loss) | 767,947 | 1,066,132 |
Change in net unrealized appreciation (depreciation) | 2,135,734 | 5,241,793 |
Net increase (decrease) in net assets resulting from operations | 2,919,425 | 7,710,166 |
Distributions to shareholders from net investment income | - | (1,456,211) |
Distributions to shareholders from net realized gain | - | (1,381,049) |
Total distributions | - | (2,837,260) |
Share transactions
Proceeds from sales of shares | 11,669,311 | 11,454,850 |
Reinvestment of distributions | - | 2,837,260 |
Cost of shares redeemed | (11,310,288) | (9,938,186) |
Net increase (decrease) in net assets resulting from share transactions | 359,023 | 4,353,924 |
Total increase (decrease) in net assets | 3,278,448 | 9,226,830 |
| | |
Net Assets | | |
Beginning of period | 69,259,420 | 60,032,590 |
End of period (including undistributed net investment income of $15,744 and undistributed net investment income of $0, respectively) | $ 72,537,868 | $ 69,259,420 |
Other Information Shares | | |
Sold | 1,149,505 | 1,201,923 |
Issued in reinvestment of distributions | - | 292,477 |
Redeemed | (1,106,430) | (1,065,623) |
Net increase (decrease) | 43,075 | 428,777 |
Financial Highlights
| Six months ended June 30, 2011 | Years ended December 31, |
| (Unaudited) | 2010 | 2009 | 2008 | 2007 | 2006 |
Selected Per-Share Data | | | | | | |
Net asset value, beginning of period | $ 9.87 | $ 9.11 | $ 7.69 | $ 11.86 | $ 11.40 | $ 10.32 |
Income from Investment Operations | | | | | | |
Net investment income (loss) E | - I | .21 | .34 | .30 | .33 | .20 |
Net realized and unrealized gain (loss) | .41 | .97 | 1.58 | (3.41) | .71 | .92 |
Total from investment operations | .41 | 1.18 | 1.92 | (3.11) | 1.04 | 1.12 |
Distributions from net investment income | - | (.22) | (.34) | (.30) | (.42) | (.04) |
Distributions from net realized gain | - | (.20) | (.16) | (.76) | (.16) | - |
Total distributions | - | (.42) | (.50) | (1.06) | (.58) | (.04) |
Net asset value, end of period | $ 10.28 | $ 9.87 | $ 9.11 | $ 7.69 | $ 11.86 | $ 11.40 |
Total Return B, C, D | 4.15% | 13.06% | 25.25% | (27.11)% | 9.26% | 10.89% |
Ratios to Average Net Assets F, H | | | | | | |
Expenses before reductions G | .00% A | .00% | .00% | .00% | .00% | .00% |
Expenses net of fee waivers, if any | .00% A | .00% | .00% | .00% | .00% | .00% |
Expenses net of all reductions | .00% A | .00% | .00% | .00% | .00% | .00% |
Net investment income (loss) | .04% A | 2.24% | 4.08% | 2.98% | 2.83% | 1.83% |
Supplemental Data | | | | | | |
Net assets, end of period (000 omitted) | $ 72,538 | $ 69,259 | $ 60,033 | $ 48,087 | $ 61,370 | $ 39,838 |
Portfolio turnover rate | 35% A | 31% | 22% | 29% | 14% | 15% |
A Annualized
B Total returns for periods of less than one year are not annualized.
C Total returns do not reflect charges attributable to your insurance company's separate account. Inclusion of these charges would reduce the total returns shown.
D Total returns would have been lower if certain expenses had not been reduced during the applicable periods shown.
E Calculated based on average shares outstanding during the period.
F Amounts do not include the activity of the underlying funds.
G Amount represents less than .01%.
H Expense ratios reflect operating expenses of the Fund. Expenses before reductions do not reflect amounts reimbursed by the investment adviser or reductions from expense offset arrangements and do not represent the amount paid by the Fund during periods when reimbursements or reductions occur. Expenses net of fee waivers reflect expenses after reimbursement by the investment adviser but prior to reductions from expense offset arrangements. Expenses net of all reductions represent the net expenses paid by the Fund but do not include expenses of the investment companies in which the Fund invests.
I Amount represents less than $.01 per share.
See accompanying notes which are an integral part of the financial statements.
Semiannual Report
VIP Investor Freedom 2020 Portfolio
Investment Changes (Unaudited)
Fund Holdings as of June 30, 2011 |
| % of fund's
net assets | % of fund's net assets
6 months ago |
Domestic Equity Funds | | |
VIP Contrafund Portfolio Investor Class | 7.0 | 7.3 |
VIP Equity-Income Portfolio Investor Class | 8.1 | 8.6 |
VIP Growth & Income Portfolio Investor Class | 8.1 | 8.5 |
VIP Growth Portfolio Investor Class | 8.3 | 8.6 |
VIP Mid Cap Portfolio Investor Class | 2.8 | 3.0 |
VIP Value Portfolio Investor Class | 6.9 | 7.3 |
VIP Value Strategies Portfolio Investor Class | 2.9 | 3.1 |
| 44.1 | 46.4 |
Developed International Equity Funds | | |
VIP Overseas Portfolio Investor Class R | 13.5 | 13.8 |
Emerging Markets Equity Funds | | |
VIP Emerging Markets Portfolio Investor Class R | 2.3 | 2.3 |
High Yield Bond Funds | | |
VIP High Income Portfolio Investor Class | 6.5 | 6.5 |
Investment Grade Bond Funds | | |
VIP Investment Grade Bond Portfolio Investor Class | 29.5 | 27.6 |
Short-Term Funds | | |
VIP Money Market Portfolio Investor Class | 4.1 | 3.4 |
Net Other Assets (Liabilities)* | 0.0 | 0.0 |
| 100.0 | 100.0 |
* Amount represents less than 0.1% |
Asset Allocation (% of fund's net assets) |
Current |
| Domestic Equity Funds | 44.1% | |
| Developed International Equity Funds | 13.5% | |
| Emerging Markets Equity Funds | 2.3% | |
| High Yield Bond Funds | 6.5% | |
| Investment Grade Bond Funds | 29.5% | |
| Short-Term Funds | 4.1% | |

Six months ago |
| Domestic Equity Funds | 46.4% | |
| Developed International Equity Funds | 13.8% | |
| Emerging Markets Equity Funds | 2.3% | |
| High Yield Bond Funds | 6.5% | |
| Investment Grade Bond Funds | 27.6% | |
| Short-Term Funds | 3.4% | |

Expected |
| Domestic Equity Funds | 42.3% | |
| Developed International Equity Funds | 13.1% | |
| Emerging Markets Equity Funds | 2.3% | |
| High Yield Bond Funds | 6.2% | |
| Investment Grade Bond Funds | 30.9% | |
| Short-Term Funds | 5.2% | |

The fund invests according to an asset allocation strategy that becomes increasingly conservative over time. The six months ago allocation is based on the fund's holdings as of December 30, 2010. The current allocation is based on the fund's holdings as of June 30, 2011. The expected allocation represents the fund's anticipated allocation at December 30, 2011. |
Semiannual Report
VIP Investor Freedom 2020 Portfolio
Investments June 30, 2011 (Unaudited)
Showing Percentage of Net Assets
Domestic Equity Funds - 44.1% |
| Shares | | Value |
Domestic Equity Funds - 44.1% |
VIP Contrafund Portfolio Investor Class | 303,478 | | $ 7,593,010 |
VIP Equity-Income Portfolio Investor Class | 438,120 | | 8,845,635 |
VIP Growth & Income Portfolio Investor Class | 670,249 | | 8,827,186 |
VIP Growth Portfolio Investor Class | 224,400 | | 9,005,172 |
VIP Mid Cap Portfolio Investor Class | 93,954 | | 3,090,140 |
VIP Value Portfolio Investor Class | 654,474 | | 7,572,266 |
VIP Value Strategies Portfolio Investor Class | 309,136 | | 3,184,100 |
TOTAL DOMESTIC EQUITY FUNDS (Cost $52,152,727) | 48,117,509 |
International Equity Funds - 15.8% |
| | | |
Developed International Equity Funds - 13.5% |
VIP Overseas Portfolio Investor Class R | 835,098 | | 14,697,727 |
Emerging Markets Equity Funds - 2.3% |
VIP Emerging Markets Portfolio Investor Class R | 256,624 | | 2,527,747 |
TOTAL INTERNATIONAL EQUITY FUNDS (Cost $18,276,154) | 17,225,474 |
Bond Funds - 36.0% |
| | | |
High Yield Bond Funds - 6.5% |
VIP High Income Portfolio Investor Class | 1,223,356 | | 7,095,467 |
Investment Grade Bond Funds - 29.5% |
VIP Investment Grade Bond Portfolio Investor Class | 2,484,099 | | 32,193,926 |
TOTAL BOND FUNDS (Cost $38,799,657) | 39,289,393 |
Short-Term Funds - 4.1% |
| | | |
VIP Money Market Portfolio Investor Class
(Cost $4,539,500) | 4,539,500 | | 4,539,500 |
TOTAL INVESTMENT PORTFOLIO - 100.0% (Cost $113,768,038) | | 109,171,876 |
NET OTHER ASSETS (LIABILITIES) - 0.0% | | 29 |
NET ASSETS - 100% | $ 109,171,905 |
Other Information |
All investments are categorized as Level 1 under the Fair Value Hierarchy. The inputs or methodology used for valuing securities may not be an indication of the risk associated with investing in those securities. For more information on valuation inputs, please refer to the Security Valuation section in the accompanying Notes to Financial Statements. |
See accompanying notes which are an integral part of the financial statements.
Semiannual Report
VIP Investor Freedom 2020 Portfolio
Statement of Assets and Liabilities
| June 30, 2011 (Unaudited) |
Assets | | |
Investment in securities, at value (cost $113,768,038) - See accompanying schedule | | $ 109,171,876 |
Cash | | 31 |
Receivable for fund shares sold | | 233,359 |
Total assets | | 109,405,266 |
| | |
Liabilities | | |
Payable for investments purchased | $ 233,287 | |
Payable for fund shares redeemed | 74 | |
Total liabilities | | 233,361 |
| | |
Net Assets | | $ 109,171,905 |
Net Assets consist of: | | |
Paid in capital | | $ 113,599,348 |
Undistributed net investment income | | 19,027 |
Accumulated undistributed net realized gain (loss) on investments | | 149,692 |
Net unrealized appreciation (depreciation) on investments | | (4,596,162) |
Net Assets, for 10,791,650 shares outstanding | | $ 109,171,905 |
Net Asset Value, offering price and redemption price per share ($109,171,905 ÷ 10,791,650 shares) | | $ 10.12 |
Statement of Operations
Six months ended June 30, 2011 (Unaudited) |
Investment Income | | |
Income distributions from underlying funds | | $ 19,027 |
| | |
Expenses | | |
Independent trustees' compensation | $ 180 | |
Total expenses before reductions | 180 | |
Expense reductions | (180) | 0 |
Net investment income (loss) | | 19,027 |
Realized and Unrealized Gain (Loss) Realized gain (loss) on sale of underlying fund shares | 290,509 | |
Capital gain distributions from underlying funds | 512,252 | |
Total net realized gain (loss) | | 802,761 |
Change in net unrealized appreciation (depreciation) on underlying funds | | 3,640,937 |
Net gain (loss) | | 4,443,698 |
Net increase (decrease) in net assets resulting from operations | | $ 4,462,725 |
See accompanying notes which are an integral part of the financial statements.
Semiannual Report
Statement of Changes in Net Assets
| Six months ended June 30, 2011
(Unaudited) | Year ended
December 31,
2010 |
Increase (Decrease) in Net Assets | | |
Operations | | |
Net investment income (loss) | $ 19,027 | $ 1,960,564 |
Net realized gain (loss) | 802,761 | 1,206,205 |
Change in net unrealized appreciation (depreciation) | 3,640,937 | 8,652,787 |
Net increase (decrease) in net assets resulting from operations | 4,462,725 | 11,819,556 |
Distributions to shareholders from net investment income | - | (1,970,982) |
Distributions to shareholders from net realized gain | (50,411) | (1,414,267) |
Total distributions | (50,411) | (3,385,249) |
Share transactions
Proceeds from sales of shares | 11,733,669 | 17,485,465 |
Reinvestment of distributions | 50,411 | 3,385,249 |
Cost of shares redeemed | (3,567,284) | (13,240,020) |
Net increase (decrease) in net assets resulting from share transactions | 8,216,796 | 7,630,694 |
Total increase (decrease) in net assets | 12,629,110 | 16,065,001 |
| | |
Net Assets | | |
Beginning of period | 96,542,795 | 80,477,794 |
End of period (including undistributed net investment income of $19,027 and undistributed net investment income of $0, respectively) | $ 109,171,905 | $ 96,542,795 |
Other Information Shares | | |
Sold | 1,171,811 | 1,894,263 |
Issued in reinvestment of distributions | 5,046 | 354,490 |
Redeemed | (355,505) | (1,457,338) |
Net increase (decrease) | 821,352 | 791,415 |
Financial Highlights
| Six months ended June 30, 2011 | Years ended December 31, |
| (Unaudited) | 2010 | 2009 | 2008 | 2007 | 2006 |
Selected Per-Share Data | | | | | | |
Net asset value, beginning of period | $ 9.68 | $ 8.77 | $ 7.12 | $ 12.09 | $ 11.53 | $ 10.36 |
Income from Investment Operations | | | | | | |
Net investment income (loss) E | - I | .21 | .30 | .27 | .31 | .22 |
Net realized and unrealized gain (loss) | .45 | 1.05 | 1.72 | (4.06) | .84 | 1.00 |
Total from investment operations | .45 | 1.26 | 2.02 | (3.79) | 1.15 | 1.22 |
Distributions from net investment income | - | (.20) | (.28) | (.27) | (.40) | (.05) |
Distributions from net realized gain | (.01) | (.15) | (.09) | (.91) | (.19) | - |
Total distributions | (.01) | (.35) | (.37) | (1.18) | (.59) | (.05) |
Net asset value, end of period | $ 10.12 | $ 9.68 | $ 8.77 | $ 7.12 | $ 12.09 | $ 11.53 |
Total Return B, C, D | 4.60% | 14.46% | 28.75% | (32.63)% | 10.20% | 11.82% |
Ratios to Average Net Assets F, H | | | | | | |
Expenses before reductions G | .00% A | .00% | .00% | .00% | .00% | .00% |
Expenses net of fee waivers, if any | .00% A | .00% | .00% | .00% | .00% | .00% |
Expenses net of all reductions | .00% A | .00% | .00% | .00% | .00% | .00% |
Net investment income (loss) | .04% A | 2.28% | 3.82% | 2.77% | 2.59% | 2.04% |
Supplemental Data | | | | | | |
Net assets, end of period (000 omitted) | $ 109,172 | $ 96,543 | $ 80,478 | $ 59,123 | $ 76,369 | $ 47,329 |
Portfolio turnover rate | 13% A | 31% | 20% | 26% | 12% | 15% |
A Annualized
B Total returns for periods of less than one year are not annualized.
C Total returns do not reflect charges attributable to your insurance company's separate account. Inclusion of these charges would reduce the total returns shown.
D Total returns would have been lower if certain expenses had not been reduced during the applicable periods shown.
E Calculated based on average shares outstanding during the period.
F Amounts do not include the activity of the underlying funds.
G Amount represents less than .01%.
H Expense ratios reflect operating expenses of the Fund. Expenses before reductions do not reflect amounts reimbursed by the investment adviser or reductions from expense offset arrangements and do not represent the amount paid by the Fund during periods when reimbursements or reductions occur. Expenses net of fee waivers reflect expenses after reimbursement by the investment adviser but prior to reductions from expense offset arrangements. Expenses net of all reductions represent the net expenses paid by the Fund but do not include expenses of the investment companies in which the Fund invests.
I Amount represents less than $.01 per share.
See accompanying notes which are an integral part of the financial statements.
Semiannual Report
VIP Investor Freedom 2025 Portfolio
Investment Changes (Unaudited)
Fund Holdings as of June 30, 2011 |
| % of fund's
net assets | % of fund's net assets
6 months ago |
Domestic Equity Funds | | |
VIP Contrafund Portfolio Investor Class | 8.1 | 8.3 |
VIP Equity-Income Portfolio Investor Class | 9.4 | 9.8 |
VIP Growth & Income Portfolio Investor Class | 9.4 | 9.7 |
VIP Growth Portfolio Investor Class | 9.6 | 9.7 |
VIP Mid Cap Portfolio Investor Class | 3.3 | 3.4 |
VIP Value Portfolio Investor Class | 8.0 | 8.4 |
VIP Value Strategies Portfolio Investor Class | 3.4 | 3.5 |
| 51.2 | 52.8 |
Developed International Equity Funds | | |
VIP Overseas Portfolio Investor Class R | 15.7 | 15.7 |
Emerging Markets Equity Funds | | |
VIP Emerging Markets Portfolio Investor Class R | 2.7 | 2.6 |
High Yield Bond Funds | | |
VIP High Income Portfolio Investor Class | 7.5 | 7.2 |
Investment Grade Bond Funds | | |
VIP Investment Grade Bond Portfolio Investor Class | 22.8 | 21.6 |
Short-Term Funds | | |
VIP Money Market Portfolio Investor Class | 0.1 | 0.1 |
Net Other Assets (Liabilities)* | 0.0 | 0.0 |
| 100.0 | 100.0 |
* Amount represents less than 0.1% |
Asset Allocation (% of fund's net assets) |
Current |
| Domestic Equity Funds | 51.2% | |
| Developed International Equity Funds | 15.7% | |
| Emerging Markets Equity Funds | 2.7% | |
| High Yield Bond Funds | 7.5% | |
| Investment Grade Bond Funds | 22.8% | |
| Short-Term Funds | 0.1% | |

Six months ago |
| Domestic Equity Funds | 52.8% | |
| Developed International Equity Funds | 15.7% | |
| Emerging Markets Equity Funds | 2.6% | |
| High Yield Bond Funds | 7.2% | |
| Investment Grade Bond Funds | 21.6% | |
 | Short-Term Funds | 0.1% | |

Expected |
| Domestic Equity Funds | 50.2% | |
| Developed International Equity Funds | 15.6% | |
| Emerging Markets Equity Funds | 2.7% | |
| High Yield Bond Funds | 7.5% | |
| Investment Grade Bond Funds | 23.7% | |
| Short-Term Funds | 0.3% | |

The fund invests according to an asset allocation strategy that becomes increasingly conservative over time. The six months ago allocation is based on the fund's holdings as of December 30, 2010. The current allocation is based on the fund's holdings as of June 30, 2011. The expected allocation represents the fund's anticipated allocation at December 31, 2011. |
Semiannual Report
VIP Investor Freedom 2025 Portfolio
Investments June 30, 2011 (Unaudited)
Showing Percentage of Net Assets
Domestic Equity Funds - 51.2% |
| Shares | | Value |
Domestic Equity Funds - 51.2% |
VIP Contrafund Portfolio Investor Class | 174,349 | | $ 4,362,200 |
VIP Equity-Income Portfolio Investor Class | 251,926 | | 5,086,392 |
VIP Growth & Income Portfolio Investor Class | 385,394 | | 5,075,637 |
VIP Growth Portfolio Investor Class | 129,043 | | 5,178,512 |
VIP Mid Cap Portfolio Investor Class | 54,070 | | 1,778,369 |
VIP Value Portfolio Investor Class | 376,077 | | 4,351,211 |
VIP Value Strategies Portfolio Investor Class | 177,940 | | 1,832,777 |
TOTAL DOMESTIC EQUITY FUNDS (Cost $27,283,817) | 27,665,098 |
International Equity Funds - 18.4% |
| | | |
Developed International Equity Funds - 15.7% |
VIP Overseas Portfolio Investor Class R | 481,205 | | 8,469,209 |
Emerging Markets Equity Funds - 2.7% |
VIP Emerging Markets Portfolio Investor Class R | 148,392 | | 1,461,663 |
TOTAL INTERNATIONAL EQUITY FUNDS (Cost $9,857,842) | 9,930,872 |
Bond Funds - 30.3% |
| | | |
High Yield Bond Funds - 7.5% |
VIP High Income Portfolio Investor Class | 699,601 | | 4,057,687 |
Investment Grade Bond Funds - 22.8% |
VIP Investment Grade Bond Portfolio Investor Class | 951,724 | | 12,334,338 |
TOTAL BOND FUNDS (Cost $16,126,806) | 16,392,025 |
Short-Term Funds - 0.1% |
| | | |
VIP Money Market Portfolio Investor Class
(Cost $81,066) | 81,066 | | 81,066 |
TOTAL INVESTMENT PORTFOLIO - 100.0% (Cost $53,349,531) | | 54,069,061 |
NET OTHER ASSETS (LIABILITIES) - 0.0% | | 2 |
NET ASSETS - 100% | $ 54,069,063 |
Other Information |
All investments are categorized as Level 1 under the Fair Value Hierarchy. The inputs or methodology used for valuing securities may not be an indication of the risk associated with investing in those securities. For more information on valuation inputs, please refer to the Security Valuation section in the accompanying Notes to Financial Statements. |
See accompanying notes which are an integral part of the financial statements.
Semiannual Report
VIP Investor Freedom 2025 Portfolio
Statement of Assets and Liabilities
| June 30, 2011 (Unaudited) |
| | |
Assets | | |
Investment in securities, at value (cost $53,349,531) - See accompanying schedule | | $ 54,069,061 |
Receivable for fund shares sold | | 201,471 |
Total assets | | 54,270,532 |
| | |
Liabilities | | |
Payable for investments purchased | $ 201,469 | |
Total liabilities | | 201,469 |
| | |
Net Assets | | $ 54,069,063 |
Net Assets consist of: | | |
Paid in capital | | $ 53,440,336 |
Undistributed net investment income | | 7,098 |
Accumulated undistributed net realized gain (loss) on investments | | (97,901) |
Net unrealized appreciation (depreciation) on investments | | 719,530 |
Net Assets, for 5,246,389 shares outstanding | | $ 54,069,063 |
Net Asset Value, offering price and redemption price per share ($54,069,063 ÷ 5,246,389 shares) | | $ 10.31 |
Statement of Operations
Six months ended June 30, 2011 (Unaudited) |
| | |
Investment Income | | |
Income distributions from underlying funds | | $ 7,098 |
| | |
Expenses | | |
Independent trustees' compensation | $ 86 | |
Total expenses before reductions | 86 | |
Expense reductions | (86) | 0 |
Net investment income (loss) | | 7,098 |
Realized and Unrealized Gain (Loss) Realized gain (loss) on sale of underlying fund shares | 54,588 | |
Capital gain distributions from underlying funds | 194,706 | |
Total net realized gain (loss) | | 249,294 |
Change in net unrealized appreciation (depreciation) on underlying funds | | 1,972,851 |
Net gain (loss) | | 2,222,145 |
Net increase (decrease) in net assets resulting from operations | | $ 2,229,243 |
See accompanying notes which are an integral part of the financial statements.
Semiannual Report
Financial Statements - continued
Statement of Changes in Net Assets
| Six months ended June 30, 2011
(Unaudited) | Year ended
December 31, 2010 |
Increase (Decrease) in Net Assets | | |
Operations | | |
Net investment income (loss) | $ 7,098 | $ 857,991 |
Net realized gain (loss) | 249,294 | 245,582 |
Change in net unrealized appreciation (depreciation) | 1,972,851 | 4,556,758 |
Net increase (decrease) in net assets resulting from operations | 2,229,243 | 5,660,331 |
Distributions to shareholders from net investment income | - | (856,138) |
Distributions to shareholders from net realized gain | - | (339,965) |
Total distributions | - | (1,196,103) |
Share transactions
Proceeds from sales of shares | 9,320,050 | 11,403,282 |
Reinvestment of distributions | - | 1,196,103 |
Cost of shares redeemed | (2,009,756) | (5,515,442) |
Net increase (decrease) in net assets resulting from share transactions | 7,310,294 | 7,083,943 |
Total increase (decrease) in net assets | 9,539,537 | 11,548,171 |
| | |
Net Assets | | |
Beginning of period | 44,529,526 | 32,981,355 |
End of period (including undistributed net investment income of $7,098 and undistributed net investment income of $0, respectively) | $ 54,069,063 | $ 44,529,526 |
Other Information Shares | | |
Sold | 913,627 | 1,241,922 |
Issued in reinvestment of distributions | - | 123,024 |
Redeemed | (197,293) | (613,270) |
Net increase (decrease) | 716,334 | 751,676 |
Financial Highlights
| Six months ended June 30, 2011 | Years ended December 31, |
| (Unaudited) | 2010 | 2009 | 2008 | 2007 | 2006 |
Selected Per-Share Data | | | | | | |
Net asset value, beginning of period | $ 9.83 | $ 8.73 | $ 7.04 | $ 12.21 | $ 11.62 | $ 10.39 |
Income from Investment Operations | | | | | | |
Net investment income (loss) E | - I | .21 | .28 | .27 | .32 | .21 |
Net realized and unrealized gain (loss) | .48 | 1.17 | 1.79 | (4.29) | .86 | 1.06 |
Total from investment operations | .48 | 1.38 | 2.07 | (4.02) | 1.18 | 1.27 |
Distributions from net investment income | - | (.20) | (.25) | (.26) | (.38) | (.04) |
Distributions from net realized gain | - | (.08) | (.13) | (.89) | (.21) | - |
Total distributions | - | (.28) | (.38) | (1.15) | (.59) | (.04) |
Net asset value, end of period | $ 10.31 | $ 9.83 | $ 8.73 | $ 7.04 | $ 12.21 | $ 11.62 |
Total Return B,C,D | 4.88% | 15.80% | 29.95% | (34.22)% | 10.39% | 12.26% |
Ratios to Average Net Assets F,H | | | | | | |
Expenses before reductions G | .00% A | .00% | .00% | .00% | .00% | .00% |
Expenses net of fee waivers, if any | .00% A | .00% | .00% | .00% | .00% | .00% |
Expenses net of all reductions | .00% A | .00% | .00% | .00% | .00% | .00% |
Net investment income (loss) | .03% A | 2.28% | 3.65% | 2.77% | 2.62% | 1.95% |
Supplemental Data | | | | | | |
Net assets, end of period (000 omitted) | $ 54,069 | $ 44,530 | $ 32,981 | $ 21,454 | $ 28,587 | $ 14,630 |
Portfolio turnover rate | 12% A | 29% | 18% | 30% | 10% | 18% |
A Annualized
B Total returns for periods of less than one year are not annualized.
C Total returns do not reflect charges attributable to your insurance company's separate account. Inclusion of these charges would reduce the total returns shown.
D Total returns would have been lower if certain expenses had not been reduced during the applicable periods shown.
E Calculated based on average shares outstanding during the period.
F Amounts do not include the activity of the underlying funds.
G Amount represents less than .01%.
H Expense ratios reflect operating expenses of the Fund. Expenses before reductions do not reflect amounts reimbursed by the investment adviser or reductions from expense offset arrangements and do not represent the amount paid by the Fund during periods when reimbursements or reductions occur. Expenses net of fee waivers reflect expenses after reimbursement by the investment adviser but prior to reductions from expense offset arrangements. Expenses net of all reductions represent the net expenses paid by the Fund but do not include expenses of the investment companies in which the Fund invests.
I Amount represents less than $.01 per share.
See accompanying notes which are an integral part of the financial statements.
Semiannual Report
VIP Investor Freedom 2030 Portfolio
Investment Changes (Unaudited)
Fund Holdings as of June 30, 2011 |
| % of fund's
net assets | % of fund's net assets
6 months ago |
Domestic Equity Funds | | |
VIP Contrafund Portfolio Investor Class | 8.5 | 8.9 |
VIP Equity-Income Portfolio Investor Class | 10.0 | 10.4 |
VIP Growth & Income Portfolio Investor Class | 9.9 | 10.3 |
VIP Growth Portfolio Investor Class | 10.1 | 10.3 |
VIP Mid Cap Portfolio Investor Class | 3.5 | 3.6 |
VIP Value Portfolio Investor Class | 8.5 | 8.9 |
VIP Value Strategies Portfolio Investor Class | 3.6 | 3.8 |
| 54.1 | 56.2 |
Developed International Equity Funds | | |
VIP Overseas Portfolio Investor Class R | 16.6 | 16.7 |
Emerging Markets Equity Funds | | |
VIP Emerging Markets Portfolio Investor Class R | 2.9 | 2.8 |
High Yield Bond Funds | | |
VIP High Income Portfolio Investor Class | 7.5 | 7.2 |
Investment Grade Bond Funds | | |
VIP Investment Grade Bond Portfolio Investor Class | 18.9 | 17.1 |
Net Other Assets (Liabilities)* | 0.0 | 0.0 |
| 100.0 | 100.0 |
* Amount represents less than 0.1% |
Asset Allocation (% of fund's net assets) |
Current |
| Domestic Equity Funds | 54.1% | |
| Developed International Equity Funds | 16.6% | |
| Emerging Markets Equity Funds | 2.9% | |
| High Yield Bond Funds | 7.5% | |
| Investment Grade Bond Funds | 18.9% | |

Six months ago |
| Domestic Equity Funds | 56.2% | |
| Developed International Equity Funds | 16.7% | |
| Emerging Markets Equity Funds | 2.8% | |
| High Yield Bond Funds | 7.2% | |
| Investment Grade Bond Funds | 17.1% | |

Expected |
| Domestic Equity Funds | 52.6% | |
| Developed International Equity Funds | 16.3% | |
| Emerging Markets Equity Funds | 2.9% | |
| High Yield Bond Funds | 7.5% | |
| Investment Grade Bond Funds | 20.7% | |

The fund invests according to an asset allocation strategy that becomes increasingly conservative over time. The six months ago allocation is based on the fund's holdings as of December 30, 2010. The current allocation is based on the fund's holdings as of June 30, 2011. The expected allocation represents the fund's anticipated allocation at December 30, 2011. |
Semiannual Report
VIP Investor Freedom 2030 Portfolio
Investments June 30, 2011 (Unaudited)
Showing Percentage of Net Assets
Domestic Equity Funds - 54.1% |
| Shares | | Value |
Domestic Equity Funds - 54.1% |
VIP Contrafund Portfolio Investor Class | 183,454 | | $ 4,590,014 |
VIP Equity-Income Portfolio Investor Class | 265,187 | | 5,354,121 |
VIP Growth & Income Portfolio Investor Class | 405,695 | | 5,343,003 |
VIP Growth Portfolio Investor Class | 135,832 | | 5,450,945 |
VIP Mid Cap Portfolio Investor Class | 56,859 | | 1,870,088 |
VIP Value Portfolio Investor Class | 395,662 | | 4,577,812 |
VIP Value Strategies Portfolio Investor Class | 187,105 | | 1,927,181 |
TOTAL DOMESTIC EQUITY FUNDS (Cost $30,712,594) | 29,113,164 |
International Equity Funds - 19.5% |
| | | |
Developed International Equity Funds - 16.6% |
VIP Overseas Portfolio Investor
Class R | 506,901 | | 8,921,462 |
Emerging Markets Equity Funds - 2.9% |
VIP Emerging Markets Portfolio Investor Class R | 156,140 | | 1,537,981 |
TOTAL INTERNATIONAL EQUITY FUNDS (Cost $10,901,463) | 10,459,443 |
Bond Funds - 26.4% |
| | | |
High Yield Bond Funds - 7.5% |
VIP High Income Portfolio Investor Class | 697,544 | | 4,045,753 |
Investment Grade Bond Funds - 18.9% |
VIP Investment Grade Bond Portfolio Investor Class | 784,419 | | 10,166,076 |
TOTAL BOND FUNDS (Cost $14,117,627) | 14,211,829 |
TOTAL INVESTMENT PORTFOLIO - 100.0% (Cost $55,731,684) | | 53,784,436 |
NET OTHER ASSETS (LIABILITIES) - 0.0% | | (1) |
NET ASSETS - 100% | $ 53,784,435 |
Other Information |
All investments are categorized as Level 1 under the Fair Value Hierarchy. The inputs or methodology used for valuing securities may not be an indication of the risk associated with investing in those securities. For more information on valuation inputs, please refer to the Security Valuation section in the accompanying Notes to Financial Statements. |
See accompanying notes which are an integral part of the financial statements.
Semiannual Report
VIP Investor Freedom 2030 Portfolio
Statement of Assets and Liabilities
| June 30, 2011 (Unaudited) |
| | |
Assets | | |
Investment in securities, at value (cost $55,731,684) - See accompanying schedule | | $ 53,784,436 |
Receivable for investments sold | | 5,762 |
Total assets | | 53,790,198 |
| | |
Liabilities | | |
Payable to custodian bank | $ 2 | |
Payable for fund shares redeemed | 5,761 | |
Total liabilities | | 5,763 |
| | |
Net Assets | | $ 53,784,435 |
Net Assets consist of: | | |
Paid in capital | | $ 55,847,432 |
Undistributed net investment income | | 6,506 |
Accumulated undistributed net realized gain (loss) on investments | | (122,255) |
Net unrealized appreciation (depreciation) on investments | | (1,947,248) |
Net Assets, for 5,445,635 shares outstanding | | $ 53,784,435 |
Net Asset Value, offering price and redemption price per share ($53,784,435 ÷ 5,445,635 shares) | | $ 9.88 |
Statement of Operations
Six months ended June 30, 2011 (Unaudited) |
| | |
Investment Income | | |
Income distributions from underlying funds | | $ 6,506 |
| | |
Expenses | | |
Independent trustees' compensation | $ 87 | |
Total expenses before reductions | 87 | |
Expense reductions | (87) | 0 |
Net investment income (loss) | | 6,506 |
Realized and Unrealized Gain (Loss) Realized gain (loss) on sale of underlying fund shares | 49,234 | |
Capital gain distributions from underlying funds | 167,478 | |
Total net realized gain (loss) | | 216,712 |
Change in net unrealized appreciation (depreciation) on underlying funds | | 2,124,675 |
Net gain (loss) | | 2,341,387 |
Net increase (decrease) in net assets resulting from operations | | $ 2,347,893 |
See accompanying notes which are an integral part of the financial statements.
Semiannual Report
Financial Statements - continued
Statement of Changes in Net Assets
| Six months ended June 30, 2011
(Unaudited) | Year ended
December 31, 2010 |
Increase (Decrease) in Net Assets | | |
Operations | | |
Net investment income (loss) | $ 6,506 | $ 843,098 |
Net realized gain (loss) | 216,712 | 364,306 |
Change in net unrealized appreciation (depreciation) | 2,124,675 | 4,779,150 |
Net increase (decrease) in net assets resulting from operations | 2,347,893 | 5,986,554 |
Distributions to shareholders from net investment income | - | (850,947) |
Distributions to shareholders from net realized gain | - | (588,834) |
Total distributions | - | (1,439,781) |
Share transactions
Proceeds from sales of shares | 7,349,121 | 9,717,483 |
Reinvestment of distributions | - | 1,439,781 |
Cost of shares redeemed | (1,982,468) | (4,193,863) |
Net increase (decrease) in net assets resulting from share transactions | 5,366,653 | 6,963,401 |
Total increase (decrease) in net assets | 7,714,546 | 11,510,174 |
| | |
Net Assets | | |
Beginning of period | 46,069,889 | 34,559,715 |
End of period (including undistributed net investment income of $6,506 and undistributed net investment income of $0, respectively) | $ 53,784,435 | $ 46,069,889 |
Other Information Shares | | |
Sold | 754,569 | 1,100,150 |
Issued in reinvestment of distributions | - | 157,171 |
Redeemed | (205,273) | (485,488) |
Net increase (decrease) | 549,296 | 771,833 |
Financial Highlights
| Six months ended June 30, 2011 | Years ended December 31, |
| (Unaudited) | 2010 | 2009 | 2008 | 2007 | 2006 |
Selected Per-Share Data | | | | | | |
Net asset value, beginning of period | $ 9.41 | $ 8.38 | $ 6.66 | $ 12.48 | $ 11.72 | $ 10.42 |
Income from Investment Operations | | | | | | |
Net investment income (loss) E | - I | .19 | .21 | .23 | .30 | .20 |
Net realized and unrealized gain (loss) | .47 | 1.15 | 1.85 | (4.78) | .99 | 1.16 |
Total from investment operations | .47 | 1.34 | 2.06 | (4.55) | 1.29 | 1.36 |
Distributions from net investment income | - | (.18) | (.20) | (.29) | (.29) | (.06) |
Distributions from net realized gain | - | (.13) | (.14) | (.98) | (.24) | - |
Total distributions | - | (.31) | (.34) | (1.27) | (.53) | (.06) |
Net asset value, end of period | $ 9.88 | $ 9.41 | $ 8.38 | $ 6.66 | $ 12.48 | $ 11.72 |
Total Return B,C,D | 4.99% | 16.12% | 31.57% | (38.13)% | 11.28% | 13.12% |
Ratios to Average Net Assets F,H | | | | | | |
Expenses before reductions G | .00% A | .00% | .00% | .00% | .00% | .00% |
Expenses net of fee waivers, if any | .00% A | .00% | .00% | .00% | .00% | .00% |
Expenses net of all reductions | .00% A | .00% | .00% | .00% | .00% | .00% |
Net investment income (loss) | .03% A | 2.20% | 2.86% | 2.38% | 2.41% | 1.84% |
Supplemental Data | | | | | | |
Net assets, end of period (000 omitted) | $ 53,784 | $ 46,070 | $ 34,560 | $ 24,786 | $ 31,355 | $ 14,728 |
Portfolio turnover rate | 13% A | 26% | 21% | 19% | 12% | 36% |
A Annualized
B Total returns for periods of less than one year are not annualized.
C Total returns do not reflect charges attributable to your insurance company's separate account. Inclusion of these charges would reduce the total returns shown.
D Total returns would have been lower if certain expenses had not been reduced during the applicable periods shown.
E Calculated based on average shares outstanding during the period.
F Amounts do not include the activity of the underlying funds.
G Amount represents less than .01%.
H Expense ratios reflect operating expenses of the Fund. Expenses before reductions do not reflect amounts reimbursed by the investment adviser or reductions from expense offset arrangements and do not represent the amount paid by the Fund during periods when reimbursements or reductions occur. Expenses net of fee waivers reflect expenses after reimbursement by the investment adviser but prior to reductions from expense offset arrangements. Expenses net of all reductions represent the net expenses paid by the Fund but do not include expenses of the investment companies in which the Fund invests.
I Amount represents less than $.01 per share.
See accompanying notes which are an integral part of the financial statements.
Semiannual Report
Notes to Financial Statements
For the period ended June 30, 2011 (Unaudited)
1. Organization.
VIP Investor Freedom Income Portfolio, VIP Investor Freedom 2005 Portfolio, VIP Investor Freedom 2010 Portfolio, VIP Investor Freedom 2015 Portfolio, VIP Investor Freedom 2020 Portfolio, VIP Investor Freedom 2025 Portfolio and VIP Investor Freedom 2030 Portfolio (the Funds) are funds of Variable Insurance Products Fund V. The Variable Insurance Products Fund V (the Trust) (referred to in this report as Fidelity Variable Insurance Products) is registered under the Investment Company Act of 1940, as amended (the 1940 Act), as an open-end management investment company organized as a Massachusetts business trust. Each Fund is authorized to issue an unlimited number of shares. The Funds invest primarily in a combination of other VIP equity, bond, and short-term funds (the Underlying Funds) managed by Fidelity Management & Research Company (FMR). Shares of each Fund may only be purchased by insurance companies for the purpose of funding variable annuity or variable life insurance contracts.
2. Significant Accounting Policies.
The financial statements have been prepared in conformity with accounting principles generally accepted in the United States of America (GAAP), which require management to make certain estimates and assumptions at the date of the financial statements. Actual results could differ from those estimates. Subsequent events, if any, through the date that the financial statements were issued have been evaluated in the preparation of the financial statements. The following summarizes the significant accounting policies of the Funds:
Security Valuation. Investments are valued as of 4:00 p.m. Eastern time on the last calendar day of the period. Each Fund categorizes the inputs to valuation techniques used to value their investments into a disclosure hierarchy consisting of three levels as shown below:
Level 1 - quoted prices in active markets for identical investments
Level 2 - other significant observable inputs (including quoted prices for similar investments, interest rates, prepayment speeds, etc.)
Level 3 - unobservable inputs (including the Fund's own assumptions based on the best information available)
Valuation techniques used to value each Fund's investments by major category are as follows. Investments in the Underlying Funds are valued at their closing net asset value (NAV) each business day and are categorized as Level 1 in the hierarchy.
Investment Transactions and Income. For financial reporting purposes, the Funds' investment holdings and NAV include trades executed through the end of the last business day of the period. The NAV per share for processing shareholder transactions is calculated as of the close of business of the New York Stock Exchange (NYSE), normally 4:00 p.m. Eastern time and includes trades executed through the end of the prior business day. Gains and losses on securities sold are determined on the basis of identified cost. Income and capital gain distributions from the Underlying Funds, if any, are recorded on the ex-dividend date.
Expenses. Expenses directly attributable to a fund are charged to that fund. Expenses attributable to more than one fund are allocated among the respective funds on the basis of relative net assets or other appropriate methods. Expenses included in the accompanying financial statements reflect the expenses of the Fund and do not include any expenses associated with the Underlying Funds. Expense estimates are accrued in the period to which they relate and adjustments are made when actual amounts are known.
Income Tax Information and Distributions to Shareholders. Each year, each Fund intends to qualify as a regulated investment company, including distributing substantially all of its taxable income and realized gains under Subchapter M of the Internal Revenue Code and filing its U.S. federal tax return. As a result, no provision for income taxes is required. A fund's federal tax return is subject to examination by the Internal Revenue Service (IRS) for a period of three years.
Distributions are declared and recorded on the ex-dividend date. Income and capital gain distributions are determined in accordance with income tax regulations, which may differ from GAAP.
Capital accounts within the financial statements are adjusted for permanent book-tax differences. These adjustments have no impact on net assets or the results of operations. Temporary book-tax differences will reverse in a subsequent period.
Book-tax differences are primarily due to short-term gain distributions from the Underlying Funds, capital loss carryforwards and losses deferred due to wash sales and excise tax regulations.
Semiannual Report
2. Significant Accounting Policies - continued
Income Tax Information and Distributions to Shareholders - continued
The federal tax cost of investment securities and unrealized appreciation (depreciation) as of period end were as follows for each Fund:
| Tax cost | Gross unrealized
appreciation | Gross unrealized
depreciation | Net unrealized
appreciation
(depreciation) on
securities and other investments |
VIP Investor Freedom Income | $ 31,403,381 | $ 1,257,948 | $ (723,835) | $ 534,113 |
VIP Investor Freedom 2005 | 11,655,321 | 341,681 | (709,453) | (367,772) |
VIP Investor Freedom 2010 | 60,177,957 | 1,356,818 | (5,059,418) | (3,702,600) |
VIP Investor Freedom 2015 | 75,740,990 | 2,280,329 | (5,483,450) | (3,203,121) |
VIP Investor Freedom 2020 | 114,349,321 | 3,800,433 | (8,977,878) | (5,177,445) |
VIP Investor Freedom 2025 | 53,676,862 | 4,034,157 | (3,641,958) | 392,199 |
VIP Investor Freedom 2030 | 56,073,662 | 2,649,340 | (4,938,566) | (2,289,226) |
Under the recently enacted Regulated Investment Company Modernization Act of 2010 (the Act), The Funds will be permitted to carry forward capital losses incurred in taxable years beginning after December 22, 2010 for an unlimited period. However, any losses incurred during those future taxable years will be required to be utilized prior to any losses incurred in pre-enactment taxable years, which generally expire after eight years from when they are incurred. Additionally, post-enactment capital losses that are carried forward will retain their character as either short-term or long-term capital losses rather than being considered all short-term as under previous law. The Funds' first fiscal year end subject to the Act will be December 31, 2011.
3. Purchases and Sales of Investments.
Purchases and redemptions of the Underlying Fund shares are noted in the table below.
| Purchases ($) | Redemptions ($) |
VIP Investor Freedom Income | 4,432,230 | 5,508,471 |
VIP Investor Freedom 2005 | 3,755,911 | 3,182,730 |
VIP Investor Freedom 2010 | 5,434,967 | 5,394,720 |
VIP Investor Freedom 2015 | 13,531,399 | 12,750,836 |
VIP Investor Freedom 2020 | 15,354,778 | 6,657,114 |
VIP Investor Freedom 2025 | 10,612,476 | 3,100,377 |
VIP Investor Freedom 2030 | 8,934,682 | 3,394,045 |
4. Fees and Other Transactions with Affiliates.
Management Fee. Strategic Advisers, Inc. (Strategic Advisers), an affiliate of FMR, provides the Funds with investment management related services. The Funds do not pay any fees for these services.
Other Transactions. Strategic Advisers, Inc. has entered into an administration agreement with FMR under which FMR provides management and administrative services (other than investment advisory services) necessary for the operation of each Fund. Pursuant to this agreement, FMR pays all expenses of each Fund, excluding the compensation of the independent Trustees and certain other expenses such as interest expense. FMR also contracts with other Fidelity companies to perform the services necessary for the operation of each Fund. The Funds do not pay any fees for these services.
5. Expense Reductions.
FMR voluntarily agreed to reimburse Funds to the extent annual operating expenses exceeded certain levels of average net assets as noted in the table below. Some expenses, for example interest expense, are excluded from this reimbursement.
The following Funds were in reimbursement during the period:
| Expense
Limitations | Reimbursement
from adviser |
VIP Investor Freedom Income | 0% | $ 57 |
VIP Investor Freedom 2005 | 0% | 19 |
VIP Investor Freedom 2010 | 0% | 100 |
VIP Investor Freedom 2015 | 0% | 127 |
VIP Investor Freedom 2020 | 0% | 180 |
VIP Investor Freedom 2025 | 0% | 86 |
VIP Investor Freedom 2030 | 0% | 87 |
Semiannual Report
Notes to Financial Statements (Unaudited) - continued
6. Other.
The Funds' organizational documents provide former and current trustees and officers with a limited indemnification against liabilities arising in connection with the performance of their duties to the Funds. In the normal course of business, the Funds may also enter into contracts that provide general indemnifications. The Funds' maximum exposure under these arrangements is unknown as this would be dependent on future claims that may be made against the Funds. The risk of material loss from such claims is considered remote.
The Funds do not invest in the Underlying Funds for the purpose of exercising management or control; however, investments by the Funds within their principal investment strategies may represent a significant portion of the Underlying Fund's net assets. At the end of the period, FMR or its affiliates were owners of record of all of the outstanding shares of the Funds.
Semiannual Report
Investment Adviser
Strategic Advisers, Inc.
Boston, MA
General Distributor
Fidelity Distributors Corporation
Boston, MA
Transfer and Service Agents
Fidelity Investments Institutional Operations Company, Inc.
Boston, MA
Fidelity Service Company, Inc.
Boston, MA
Custodian
The Bank of New York Mellon
New York, NY
VIPIFF-SANN-0811
1.833440.105
Fidelity® Variable Insurance Products:
Strategic Income Portfolio
Semiannual Report
June 30, 2011
(2_fidelity_logos) (Registered_Trademark)
Contents
Shareholder Expense Example | <Click Here> | An example of shareholder expenses. |
Investment Changes | <Click Here> | A summary of major shifts in the fund's investments over the past six months. |
Investments | <Click Here> | A complete list of the fund's investments with their market values. |
Financial Statements | <Click Here> | Statements of assets and liabilities, operations, and changes in net assets, as well as financial highlights. |
Notes | <Click Here> | Notes to the financial statements. |
To view a fund's proxy voting guidelines and proxy voting record for the 12-month period ended June 30, visit http://www.fidelity.com/proxyvotingresults or visit the Securities and Exchange Commission's (SEC) web site at http://www.sec.gov. You may also call 1-877-208-0098 to request a free copy of the proxy voting guidelines.
Fidelity Variable Insurance Products are separate account options which are purchased through a variable insurance contract.
Standard & Poor's, S&P and S&P 500 are registered service marks of The McGraw-Hill Companies, Inc. and have been licensed for use by Fidelity Distributors Corporation.
Other third party marks appearing herein are the property of their respective owners.
All other marks appearing herein are registered or unregistered trademarks or service marks of FMR LLC or an affiliated company.
This report and the financial statements contained herein are submitted for the general information of the shareholders of the fund. This report is not authorized for distribution to prospective investors in the fund unless preceded or accompanied by an effective prospectus.
A fund files its complete schedule of portfolio holdings with the SEC for the first and third quarters of each fiscal year on Form N-Q. Forms N-Q are available on the SEC's web site at http://www.sec.gov. A fund's Forms N-Q may be reviewed and copied at the SEC's Public Reference Room in Washington, DC. Information regarding the operation of the SEC's Public Reference Room may be obtained by calling 1-800-SEC-0330. For a complete list of a fund's portfolio holdings, view the most recent holdings listing, semiannual report, or annual report on Fidelity's web site at http://www.fidelity.com, http://www.advisor.fidelity.com, or http://www.401k.com, as applicable.
NOT FDIC INSURED • MAY LOSE VALUE • NO BANK GUARANTEE
Neither the fund nor Fidelity Distributors Corporation is a bank.
Semiannual Report
As a shareholder of the Fund, you incur two types of costs: (1) transaction costs, and (2) ongoing costs, including management fees, distribution and/or service (12b-1) fees and other Fund expenses. This Example is intended to help you understand your ongoing costs (in dollars) of investing in the Fund and to compare these costs with the ongoing costs of investing in other mutual funds.
The Example is based on an investment of $1,000 invested at the beginning of the period and held for the entire period (January 1, 2011 to June 30, 2011).
Actual Expenses
The first line of the accompanying table for each class of the Fund provides information about actual account values and actual expenses. You may use the information in this line, together with the amount you invested, to estimate the expenses that you paid over the period. Simply divide your account value by $1,000.00 (for example, an $8,600 account value divided by $1,000.00 = 8.6), then multiply the result by the number in the first line for a class of the Fund under the heading entitled "Expenses Paid During Period" to estimate the expenses you paid on your account during this period. The estimate of expenses does not include any fees or other expenses of any variable annuity or variable life insurance product. If they were, the estimate of expenses you paid during the period would be higher, and your ending account value would be lower. In addition, the Fund, as a shareholder in the underlying Fidelity Central Funds, will indirectly bear its pro-rata share of the fees and expenses incurred by the underlying Fidelity Central Funds. These fees and expenses are not included in the Fund's annualized expense ratio used to calculate the expense estimate in the table below.
Hypothetical Example for Comparison Purposes
The second line of the accompanying table for each class of the Fund provides information about hypothetical account values and hypothetical expenses based on a Class' actual expense ratio and an assumed rate of return of 5% per year before expenses, which is not the Class' actual return. The hypothetical account values and expenses may not be used to estimate the actual ending account balance or expenses you paid for the period. You may use this information to compare the ongoing costs of investing in the Fund and other funds. To do so, compare this 5% hypothetical example with the 5% hypothetical examples that appear in the shareholder reports of the other funds. The estimate of expenses does not include any fees or other expenses of any variable annuity or variable life insurance product. If they were, the estimate of expenses you paid during the period would be higher, and your ending account value would be lower. In addition, the Fund, as a shareholder in the underlying Fidelity Central Funds, will indirectly bear its pro-rata share of the fees and expenses incurred by the underlying Fidelity Central Funds. These fees and expenses are not included in the Fund's annualized expense ratio used to calculate the expense estimate in the table below.
Please note that the expenses shown in the table are meant to highlight your ongoing costs only and do not reflect any transaction costs. Therefore, the second line of the table is useful in comparing ongoing costs only, and will not help you determine the relative total costs of owning different funds.
| Annualized
Expense Ratio | Beginning
Account Value
January 1, 2011 | Ending
Account Value
June 30, 2011 | Expenses Paid
During Period*
January 1, 2011
to June 30, 2011 |
Initial Class | .70% | | | |
Actual | | $ 1,000.00 | $ 1,042.40 | $ 3.54 |
HypotheticalA | | $ 1,000.00 | $ 1,021.32 | $ 3.51 |
Service Class | .80% | | | |
Actual | | $ 1,000.00 | $ 1,041.60 | $ 4.05 |
HypotheticalA | | $ 1,000.00 | $ 1,020.83 | $ 4.01 |
Service Class 2 | .95% | | | |
Actual | | $ 1,000.00 | $ 1,041.60 | $ 4.81 |
HypotheticalA | | $ 1,000.00 | $ 1,020.08 | $ 4.76 |
Investor Class | .73% | | | |
Actual | | $ 1,000.00 | $ 1,041.60 | $ 3.70 |
HypotheticalA | | $ 1,000.00 | $ 1,021.17 | $ 3.66 |
A 5% return per year before expenses
* Expenses are equal to each Class' annualized expense ratio, multiplied by the average account value over the period, multiplied by 181/365 (to reflect the one-half year period). The fees and expenses of the underlying Fidelity Central Funds in which the Fund invests are not included in the Fund's annualized expense ratio.
Semiannual Report
Investment Changes (Unaudited)
The information in the following tables is based on the combined investments of the Fund and its pro-rata share of its investments in each non-money market Fidelity Central Fund.
Top Five Holdings as of June 30, 2011 |
(by issuer, excluding cash equivalents) | % of fund's
net assets | % of fund's net assets
6 months ago |
U.S. Treasury Obligations | 17.6 | 17.3 |
Japan Government | 2.5 | 2.4 |
Canadian Government | 2.3 | 2.2 |
Italian Republic | 2.2 | 1.9 |
Sprint Capital Corp. | 1.9 | 1.9 |
| 26.5 | |
Top Five Market Sectors as of June 30, 2011 |
| % of fund's
net assets | % of fund's net assets
6 months ago |
Financials | 8.5 | 7.3 |
Telecommunication Services | 7.0 | 8.4 |
Energy | 6.1 | 5.8 |
Consumer Discretionary | 5.1 | 8.6 |
Industrials | 4.4 | 4.8 |
Quality Diversification (% of fund's net assets) |
As of June 30, 2011 | As of December 31, 2010 |
| U.S. Government and
U.S. Government
Agency Obligations† 24.9% | | | U.S. Government and
U.S. Government
Agency Obligations† 25.8% | |
| AAA,AA,A 12.9% | | | AAA,AA,A 14.0% | |
 | BBB 4.3% | | | BBB 3.7% | |
| BB 13.1% | | | BB 15.4% | |
 | B 26.0% | | | B 26.2% | |
| CCC,CC,C 4.8% | | | CCC,CC,C 6.7% | |
 | D 0.0% | | | D 0.0% | |
| Not Rated 3.7% | | | Not Rated 2.5% | |
| Equities 1.2% | | | Equities 1.2% | |
| Short-Term
Investments and
Net Other Assets 9.1% | | | Short-Term
Investments and
Net Other Assets 4.5% | |

We have used ratings from Moody's Investors Service, Inc. Where Moody's® ratings are not available, we have used S&P® ratings. All ratings are as of the date indicated and do not reflect subsequent changes. |
Asset Allocation (% of fund's net assets) |
As of June 30, 2011* | As of December 31, 2010** |
| Preferred Securities 0.0% | | | Preferred Securities 0.2% | |
| Corporate Bonds 37.5% | | | Corporate Bonds 38.5% | |
| U.S. Government and
U.S. Government
Agency Obligations† 24.9% | | | U.S. Government and
U.S. Government
Agency Obligations† 25.8% | |
| Foreign Government & Government Agency Obligations 21.3% | | | Foreign Government & Government Agency Obligations 22.5% | |
| Floating Rate Loans 5.9% | | | Floating Rate Loans 7.2% | |
| Stocks 1.2% | | | Stocks 1.2% | |
| Other Investments 0.1% | | | Other Investments 0.1% | |
| Short-Term
Investments and
Net Other Assets 9.1% | | | Short-Term
Investments and
Net Other Assets 4.5% | |
* Foreign investments | 33.4% | | ** Foreign investments | 34.3% | |
* Futures and Swaps | 0.8% | | ** Futures and Swaps | (0.4)% | |
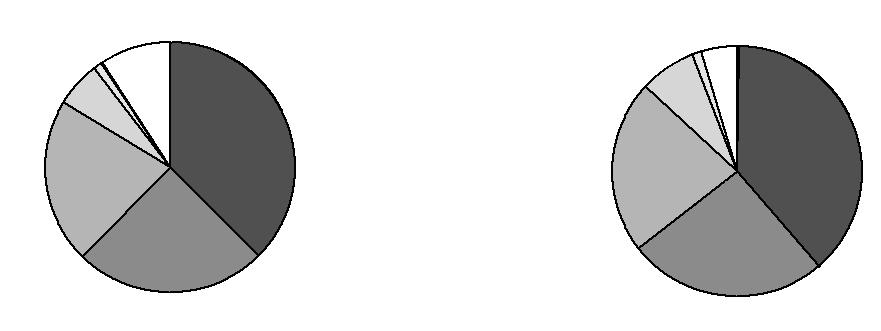
† Includes FDIC Guaranteed Corporate Securities and NCUA Guaranteed Notes.
An unaudited holdings listing for the Fund, which presents direct holdings as well as the pro-rata share of any securities and other investments held indirectly through its
investment in underlying non-money market Fidelity Central Funds, is available at advisor.fidelity.com.
Semiannual Report
Investments June 30, 2011 (Unaudited)
Showing Percentage of Net Assets
Corporate Bonds - 37.3% |
| Principal Amount (d) | | Value |
Convertible Bonds - 1.1% |
CONSUMER DISCRETIONARY - 0.2% |
Auto Components - 0.2% |
TRW Automotive, Inc. 3.5% 12/1/15 (f) | | $ 921,000 | | $ 1,950,587 |
ENERGY - 0.4% |
Energy Equipment & Services - 0.0% |
Cal Dive International, Inc. 3.25% 12/15/25 | | 170,000 | | 170,204 |
Oil, Gas & Consumable Fuels - 0.4% |
Alpha Natural Resources, Inc. 2.375% 4/15/15 | | 1,360,000 | | 1,586,440 |
Chesapeake Energy Corp.: | | | | |
2.5% 5/15/37 | | 1,910,000 | | 2,010,275 |
2.5% 5/15/37 | | 370,000 | | 390,535 |
| | 3,987,250 |
TOTAL ENERGY | | 4,157,454 |
HEALTH CARE - 0.2% |
Health Care Equipment & Supplies - 0.2% |
Kinetic Concepts, Inc. 3.25% 4/15/15 (f) | | 1,200,000 | | 1,537,680 |
TELECOMMUNICATION SERVICES - 0.3% |
Wireless Telecommunication Services - 0.3% |
NII Holdings, Inc. 3.125% 6/15/12 | | 2,610,000 | | 2,614,894 |
TOTAL CONVERTIBLE BONDS | | 10,260,615 |
Nonconvertible Bonds - 36.2% |
CONSUMER DISCRETIONARY - 3.4% |
Auto Components - 0.8% |
Affinia Group, Inc.: | | | | |
9% 11/30/14 | | 360,000 | | 361,800 |
10.75% 8/15/16 (f) | | 149,000 | | 166,135 |
Cooper Standard Auto, Inc. 8.5% 5/1/18 | | 145,000 | | 152,613 |
Dana Holding Corp.: | | | | |
6.5% 2/15/19 | | 205,000 | | 206,025 |
6.75% 2/15/21 | | 1,230,000 | | 1,236,150 |
Delphi Corp.: | | | | |
5.875% 5/15/19 (f) | | 450,000 | | 445,500 |
6.125% 5/15/21 (f) | | 415,000 | | 411,888 |
Exide Technologies 8.625% 2/1/18 (f) | | 1,190,000 | | 1,237,600 |
International Automotive Components Group SA 9.125% 6/1/18 (f) | | 495,000 | | 506,138 |
Lear Corp.: | | | | |
7.875% 3/15/18 | | 110,000 | | 118,250 |
8.125% 3/15/20 | | 125,000 | | 135,313 |
|
| Principal Amount (d) | | Value |
RSC Equipment Rental, Inc. 10% 7/15/17 (f) | | $ 180,000 | | $ 201,600 |
Stoneridge, Inc. 9.5% 10/15/17 (f) | | 200,000 | | 216,000 |
Tenneco, Inc.: | | | | |
6.875% 12/15/20 | | 545,000 | | 554,538 |
7.75% 8/15/18 | | 125,000 | | 130,938 |
The Goodyear Tire & Rubber Co. 10.5% 5/15/16 | | 198,000 | | 221,760 |
Tower Automotive Holdings USA LLC / TA Holdings Finance, Inc. 10.625% 9/1/17 (f) | | 414,000 | | 447,120 |
| | 6,749,368 |
Automobiles - 0.0% |
Automotores Gildemeister SA 8.25% 5/24/21 (f) | | 210,000 | | 214,463 |
General Motors Corp.: | | | | |
6.75% 5/1/28 (c) | | 692,000 | | 11,833 |
7.125% 7/15/13 (c) | | 140,000 | | 2,394 |
7.2% 1/15/11 (c) | | 350,000 | | 5,985 |
7.4% 9/1/25 (c) | | 45,000 | | 770 |
7.7% 4/15/16 (c) | | 531,000 | | 9,080 |
8.25% 7/15/23 (c) | | 415,000 | | 7,097 |
8.375% 7/15/33 (c) | | 605,000 | | 10,346 |
| | 261,968 |
Distributors - 0.2% |
Ferrellgas LP/Ferrellgas Finance Corp. 6.5% 5/1/21 (f) | | 1,300,000 | | 1,230,060 |
Diversified Consumer Services - 0.0% |
Mac-Gray Corp. 7.625% 8/15/15 | | 40,000 | | 40,800 |
Hotels, Restaurants & Leisure - 0.7% |
DineEquity, Inc. 9.5% 10/30/18 (f) | | 205,000 | | 222,425 |
Dunkin Finance Corp. 9.625% 12/1/18 (f) | | 126,000 | | 126,945 |
GWR Operating Partnership LLP/Great Wolf Finance Corp. 10.875% 4/1/17 | | 355,000 | | 379,850 |
Landry's Restaurants, Inc.: | | | | |
11.625% 12/1/15 | | 110,000 | | 118,800 |
11.625% 12/1/15 (f) | | 85,000 | | 91,800 |
MCE Finance Ltd. 10.25% 5/15/18 | | 620,000 | | 694,400 |
MGM Mirage, Inc.: | | | | |
10% 11/1/16 (f) | | 475,000 | | 505,875 |
10.375% 5/15/14 | | 100,000 | | 113,000 |
Mohegan Tribal Gaming Authority 6.875% 2/15/15 | | 125,000 | | 83,750 |
NAI Entertainment Holdings LLC/NAI Entertainment Finance Corp. 8.25% 12/15/17 (f) | | 240,000 | | 258,000 |
NCL Corp. Ltd. 9.5% 11/15/18 (f) | | 125,000 | | 133,750 |
Palace Entertainment Holdings LLC/Corp. 8.875% 4/15/17 (f) | | 100,000 | | 99,750 |
Roadhouse Financing, Inc. 10.75% 10/15/17 (f) | | 345,000 | | 357,075 |
Corporate Bonds - continued |
| Principal Amount (d) | | Value |
Nonconvertible Bonds - continued |
CONSUMER DISCRETIONARY - continued |
Hotels, Restaurants & Leisure - continued |
Seven Seas Cruises S de RL LLC 9.125% 5/15/19 (f) | | $ 60,000 | | $ 61,950 |
Shingle Springs Tribal Gaming Authority 9.375% 6/15/15 (f) | | 100,000 | | 70,000 |
Station Casinos, Inc.: | | | | |
6% 4/1/12 (c) | | 610,000 | | 61 |
6.5% 2/1/14 (c) | | 811,000 | | 0 |
6.625% 3/15/18 (c) | | 830,000 | | 0 |
6.875% 3/1/16 (c) | | 865,000 | | 0 |
7.75% 8/15/16 (c) | | 920,000 | | 92 |
Sugarhouse HSP Gaming Prop Mezz LP/Sugarhouse HSP Gaming Finance Corp. 8.625% 4/15/16 (f) | | 50,000 | | 51,500 |
Universal City Development Partners Ltd./UCDP Finance, Inc. 8.875% 11/15/15 | | 1,180,000 | | 1,312,750 |
Virgin River Casino Corp./RBG LLC/B&BB, Inc.: | | | | |
9% 1/15/12 (c) | | 30,000 | | 14,438 |
12.75% 1/15/13 (c) | | 230,000 | | 288 |
Waterford Gaming LLC/Waterford Gaming Finance Corp. 8.625% 9/15/14 (f) | | 57,663 | | 31,426 |
Wynn Las Vegas LLC/Wynn Las Vegas Capital Corp. 7.75% 8/15/20 | | 1,495,000 | | 1,620,206 |
| | 6,348,131 |
Household Durables - 0.2% |
Jarden Corp. 6.125% 11/15/22 | | 280,000 | | 278,600 |
K. Hovnanian Enterprises, Inc. 11.875% 10/15/15 | | 150,000 | | 114,000 |
Reliance Intermediate Holdings LP 9.5% 12/15/19 (f) | | 485,000 | | 528,650 |
Reynolds Group Issuer, Inc./Reynolds Group Issuer LLC/Reynolds Group Issuer SA: | | | | |
7.125% 4/15/19 (f) | | 245,000 | | 241,938 |
9% 4/15/19 (f) | | 745,000 | | 728,238 |
Sealy Mattress Co. 10.875% 4/15/16 (f) | | 97,000 | | 107,670 |
| | 1,999,096 |
Leisure Equipment & Products - 0.1% |
Cedar Fair LP/Magnum Management Corp. 9.125% 8/1/18 | | 645,000 | | 694,149 |
|
| Principal Amount (d) | | Value |
Eastman Kodak Co. 10.625% 3/15/19 (f) | | $ 305,000 | | $ 298,138 |
Easton-Bell Sports, Inc. 9.75% 12/1/16 | | 120,000 | | 132,144 |
| | 1,124,431 |
Media - 1.0% |
Bresnan Broadband Holdings LLC 8% 12/15/18 (f) | | 195,000 | | 202,313 |
Cequel Communications Holdings I LLC/Cequel Capital Corp. 8.625% 11/15/17 (f) | | 770,000 | | 800,800 |
Charter Communications Holdings II LLC/Charter Communications Holdings II Capital Corp. 13.5% 11/30/16 | | 400,112 | | 471,132 |
Checkout Holding Corp. 0% 11/15/15 (f) | | 285,000 | | 183,113 |
Clear Channel Communications, Inc. 11% 8/1/16 pay-in-kind (l) | | 325,075 | | 282,003 |
DISH DBS Corp. 6.75% 6/1/21 (f) | | 860,000 | | 882,575 |
EchoStar Communications Corp. 7.125% 2/1/16 | | 1,500,000 | | 1,582,500 |
Globo Comunicacoes e Participacoes SA 6.25% (e)(f)(g) | | 1,200,000 | | 1,266,000 |
Gray Television, Inc. 10.5% 6/29/15 | | 160,000 | | 165,600 |
Houghton Mifflin Harcourt Publishing Co. 10.5% 6/1/19 (f) | | 465,000 | | 460,350 |
Liberty Media Corp.: | | | | |
8.25% 2/1/30 | | 1,295,000 | | 1,249,675 |
8.5% 7/15/29 | | 230,000 | | 221,950 |
MDC Partners, Inc. 11% 11/1/16 | | 65,000 | | 72,881 |
MediMedia USA, Inc. 11.375% 11/15/14 (f) | | 50,000 | | 43,000 |
Net Servicos de Comunicacao SA 7.5% 1/27/20 | | 185,000 | | 211,363 |
ONO Finance II PLC 10.875% 7/15/19 (f) | | 150,000 | | 159,750 |
Satmex Escrow SA de CV 9.5% 5/15/17 (f) | | 115,000 | | 117,300 |
Sheridan Group, Inc. 12.5% 4/15/14 (f) | | 280,000 | | 266,700 |
Sinclair Television Group, Inc. 8.375% 10/15/18 | | 300,000 | | 313,500 |
Videotron Ltd. 6.875% 1/15/14 | | 125,000 | | 126,413 |
| | 9,078,918 |
Specialty Retail - 0.2% |
Asbury Automotive Group, Inc. 8.375% 11/15/20 (f) | | 125,000 | | 127,813 |
Claire's Escrow Corp. 8.875% 3/15/19 (f) | | 155,000 | | 145,700 |
Michaels Stores, Inc. 7.75% 11/1/18 (f) | | 940,000 | | 940,000 |
Sonic Automotive, Inc. 9% 3/15/18 | | 760,000 | | 799,900 |
| | 2,013,413 |
Corporate Bonds - continued |
| Principal Amount (d) | | Value |
Nonconvertible Bonds - continued |
CONSUMER DISCRETIONARY - continued |
Textiles, Apparel & Luxury Goods - 0.2% |
Hanesbrands, Inc. 6.375% 12/15/20 | | $ 640,000 | | $ 617,600 |
Levi Strauss & Co.: | | | | |
7.625% 5/15/20 | | 775,000 | | 763,375 |
8.875% 4/1/16 | | 170,000 | | 176,800 |
Liz Claiborne, Inc. 10.5% 4/15/19 (f) | | 370,000 | | 379,250 |
Polymer Group, Inc. 7.75% 2/1/19 (f) | | 135,000 | | 136,350 |
| | 2,073,375 |
TOTAL CONSUMER DISCRETIONARY | | 30,919,560 |
CONSUMER STAPLES - 0.7% |
Beverages - 0.1% |
Cerveceria Nacional Dominicana C por A: | | | | |
8% 3/27/14 (Reg. S) | | 100,000 | | 103,250 |
16% 3/27/12 (f) | | 220,000 | | 192,940 |
| | 296,190 |
Food & Staples Retailing - 0.2% |
BFF International Ltd. 7.25% 1/28/20 (f) | | 300,000 | | 318,000 |
Bi-Lo LLC/Bi-Lo Finance Corp. 9.25% 2/15/19 (f) | | 405,000 | | 409,050 |
Rite Aid Corp.: | | | | |
8% 8/15/20 | | 625,000 | | 675,000 |
9.5% 6/15/17 | | 65,000 | | 59,800 |
9.75% 6/12/16 | | 310,000 | | 344,875 |
10.25% 10/15/19 | | 160,000 | | 178,400 |
| | 1,985,125 |
Food Products - 0.3% |
Bumble Bee Acquisition Corp. 9% 12/15/17 (f) | | 325,000 | | 328,250 |
Darling International, Inc. 8.5% 12/15/18 (f) | | 100,000 | | 109,370 |
Dean Foods Co. 9.75% 12/15/18 (f) | | 635,000 | | 677,863 |
Gruma SAB de CV 7.75% (Reg. S) (g) | | 425,000 | | 425,000 |
Harbinger Group, Inc. 10.625% 11/15/15 | | 230,000 | | 237,475 |
Hines Nurseries, Inc. 10.25% 10/1/11 (c) | | 120,000 | | 1,200 |
JBS USA LLC/JBS USA Finance, Inc. 11.625% 5/1/14 | | 330,000 | | 376,200 |
MHP SA 10.25% 4/29/15 (f) | | 190,000 | | 202,825 |
|
| Principal Amount (d) | | Value |
Michael Foods Group, Inc. 9.75% 7/15/18 (f) | | $ 155,000 | | $ 166,625 |
Smithfield Foods, Inc. 10% 7/15/14 | | 380,000 | | 439,850 |
| | 2,964,658 |
Personal Products - 0.1% |
Elizabeth Arden, Inc. 7.375% 3/15/21 | | 135,000 | | 140,738 |
NBTY, Inc. 9% 10/1/18 (f) | | 425,000 | | 448,375 |
Revlon Consumer Products Corp. 9.75% 11/15/15 | | 300,000 | | 324,000 |
| | 913,113 |
TOTAL CONSUMER STAPLES | | 6,159,086 |
ENERGY - 5.6% |
Energy Equipment & Services - 0.2% |
Complete Production Services, Inc. 8% 12/15/16 | | 130,000 | | 134,225 |
Forbes Energy Services Ltd. 9% 6/15/19 (f) | | 350,000 | | 343,000 |
Frac Tech Services LLLC/Frac Tech Finance, Inc. 7.125% 11/15/18 (f) | | 190,000 | | 194,275 |
Helix Energy Solutions Group, Inc. 9.5% 1/15/16 (f) | | 240,000 | | 252,000 |
Oil States International, Inc. 6.5% 6/1/19 (f) | | 360,000 | | 363,600 |
Pioneer Drilling Co. 9.875% 3/15/18 | | 275,000 | | 294,938 |
Pride International, Inc. 6.875% 8/15/20 | | 260,000 | | 302,372 |
Trinidad Drilling Ltd. 7.875% 1/15/19 (f) | | 140,000 | | 145,600 |
| | 2,030,010 |
Oil, Gas & Consumable Fuels - 5.4% |
Afren PLC 11.5% 2/1/16 (f) | | 400,000 | | 437,000 |
Alpha Natural Resources, Inc.: | | | | |
6% 6/1/19 | | 730,000 | | 735,475 |
6.25% 6/1/21 | | 420,000 | | 422,100 |
Arch Coal, Inc. 7.25% 10/1/20 | | 140,000 | | 142,100 |
ATP Oil & Gas Corp. 11.875% 5/1/15 | | 2,620,000 | | 2,646,200 |
Berry Petroleum Co.: | | | | |
8.25% 11/1/16 | | 150,000 | | 156,000 |
10.25% 6/1/14 | | 145,000 | | 165,300 |
Brigham Exploration Co. 6.875% 6/1/19 (f) | | 380,000 | | 376,694 |
Calumet Specialty Products Partners LP/Calumet Finance Corp. 9.375% 5/1/19 (f) | | 150,000 | | 153,750 |
Carrizo Oil & Gas, Inc. 8.625% 10/15/18 | | 845,000 | | 874,575 |
Corporate Bonds - continued |
| Principal Amount (d) | | Value |
Nonconvertible Bonds - continued |
ENERGY - continued |
Oil, Gas & Consumable Fuels - continued |
Chaparral Energy, Inc. 9.875% 10/1/20 | | $ 155,000 | | $ 166,625 |
Chesapeake Energy Corp. 6.875% 11/15/20 | | 4,085,000 | | 4,314,781 |
Chesapeake Midstream Partners LP/CHKM Finance Corp. 5.875% 4/15/21 (f) | | 220,000 | | 215,600 |
Clayton Williams Energy, Inc. 7.75% 4/1/19 (f) | | 460,000 | | 450,800 |
Concho Resources, Inc.: | | | | |
6.5% 1/15/22 | | 575,000 | | 571,435 |
7% 1/15/21 | | 250,000 | | 254,050 |
8.625% 10/1/17 | | 155,000 | | 166,625 |
CONSOL Energy, Inc.: | | | | |
8% 4/1/17 | | 525,000 | | 564,375 |
8.25% 4/1/20 | | 540,000 | | 585,900 |
Continental Resources, Inc.: | | | | |
7.125% 4/1/21 | | 215,000 | | 225,750 |
8.25% 10/1/19 | | 65,000 | | 70,525 |
Crestwood Midstream Partners LP / Finance Corp. 7.75% 4/1/19 (f) | | 200,000 | | 198,500 |
Crosstex Energy L.P./Crosstex Energy Finance Corp. 8.875% 2/15/18 | | 390,000 | | 415,350 |
Denbury Resources, Inc.: | | | | |
8.25% 2/15/20 | | 308,000 | | 335,720 |
9.75% 3/1/16 | | 105,000 | | 116,676 |
Drummond Co., Inc.: | | | | |
7.375% 2/15/16 | | 460,000 | | 464,600 |
9% 10/15/14 (f) | | 710,000 | | 747,275 |
DTEK Finance BV 9.5% 4/28/15 (f) | | 230,000 | | 243,800 |
Eagle Rock Energy Partners LP / Eagle Rock Energy Finance Corp. 8.375% 6/1/19 (f) | | 480,000 | | 480,000 |
Energy Partners Ltd. 8.25% 2/15/18 (f) | | 585,000 | | 555,750 |
Energy Transfer Equity LP 7.5% 10/15/20 | | 860,000 | | 911,600 |
Energy XXI Gulf Coast, Inc. 9.25% 12/15/17 (f) | | 1,110,000 | | 1,182,150 |
EXCO Resources, Inc. 7.5% 9/15/18 | | 1,300,000 | | 1,261,000 |
Goodrich Petroleum Corp. 8.875% 3/15/19 (f) | | 305,000 | | 305,000 |
International Coal Group, Inc. 9.125% 4/1/18 | | 300,000 | | 377,250 |
KazMunaiGaz Finance Sub BV: | | | | |
6.375% 4/9/21 (f) | | 320,000 | | 337,600 |
7% 5/5/20 (f) | | 260,000 | | 286,000 |
8.375% 7/2/13 (f) | | 265,000 | | 289,513 |
9.125% 7/2/18 (f) | | 330,000 | | 405,900 |
11.75% 1/23/15 (f) | | 380,000 | | 471,694 |
|
| Principal Amount (d) | | Value |
LINN Energy LLC/LINN Energy Finance Corp.: | | | | |
7.75% 2/1/21 (f) | | $ 1,640,000 | | $ 1,681,000 |
8.625% 4/15/20 | | 1,190,000 | | 1,291,150 |
Markwest Energy Partners LP/Markwest Energy Finance Corp. 6.75% 11/1/20 | | 160,000 | | 163,200 |
Naftogaz of Ukraine NJSC 9.5% 9/30/14 | | 255,000 | | 278,588 |
Newfield Exploration Co. 6.875% 2/1/20 | | 1,025,000 | | 1,086,500 |
Northern Tier Energy LLC/Northern Tier Finance Corp. 10.5% 12/1/17 (f) | | 400,000 | | 441,000 |
OGX Petroleo e Gas Participacoes SA 8.5% 6/1/18 (f) | | 2,110,000 | | 2,139,013 |
Pacific Rubiales Energy Corp. 8.75% 11/10/16 | | 400,000 | | 451,000 |
Pan American Energy LLC 7.875% 5/7/21 (f) | | 170,000 | | 181,475 |
Peabody Energy Corp. 7.875% 11/1/26 | | 300,000 | | 336,750 |
Pemex Project Funding Master Trust 6.625% 6/15/35 | | 640,000 | | 668,000 |
Petrobras International Finance Co. Ltd.: | | | | |
6.875% 1/20/40 | | 310,000 | | 334,800 |
8.375% 12/10/18 | | 315,000 | | 388,238 |
Petrohawk Energy Corp. 7.875% 6/1/15 | | 1,615,000 | | 1,691,713 |
Petroleos de Venezuela SA: | | | | |
4.9% 10/28/14 | | 1,400,000 | | 1,074,500 |
5.25% 4/12/17 | | 865,000 | | 542,788 |
5.375% 4/12/27 | | 2,330,000 | | 1,165,000 |
5.5% 4/12/37 | | 1,145,000 | | 561,050 |
Petroleos de Venezuela SA 144A: | | | | |
8.5% 11/2/17 (f) | | 1,955,000 | | 1,441,813 |
12.75% 2/17/22 (f) | | 1,640,000 | | 1,340,700 |
Petroleos Mexicanos: | | | | |
5.5% 1/21/21 | | 265,000 | | 278,250 |
6% 3/5/20 | | 245,000 | | 268,275 |
6.625% (f)(g) | | 840,000 | | 846,300 |
8% 5/3/19 | | 280,000 | | 347,200 |
Petroleum Co. of Trinidad & Tobago Ltd. (Reg. S) 6% 5/8/22 | | 366,667 | | 372,167 |
Petroleum Development Corp. 12% 2/15/18 | | 265,000 | | 294,150 |
Pioneer Natural Resources Co. 7.5% 1/15/20 | | 640,000 | | 724,800 |
Plains Exploration & Production Co. 10% 3/1/16 | | 645,000 | | 725,625 |
PT Adaro Indonesia 7.625% 10/22/19 (f) | | 430,000 | | 477,300 |
PT Pertamina Persero: | | | | |
5.25% 5/23/21 (f) | | 295,000 | | 297,950 |
6.5% 5/27/41 (f) | | 215,000 | | 213,388 |
Quicksilver Resources, Inc. 11.75% 1/1/16 | | 335,000 | | 382,738 |
Corporate Bonds - continued |
| Principal Amount (d) | | Value |
Nonconvertible Bonds - continued |
ENERGY - continued |
Oil, Gas & Consumable Fuels - continued |
Regency Energy Partners LP/Regency Energy Finance Corp. 6.875% 12/1/18 | | $ 550,000 | | $ 563,750 |
Rosetta Resources, Inc. 9.5% 4/15/18 | | 290,000 | | 320,450 |
Southern Star Central Corp. 6.75% 3/1/16 | | 90,000 | | 90,450 |
Southwestern Energy Co. 7.5% 2/1/18 | | 150,000 | | 170,625 |
Targa Resources Partners LP/Targa Resources Partners Finance Corp.: | | | | |
6.875% 2/1/21 (f) | | 240,000 | | 237,600 |
11.25% 7/15/17 | | 290,000 | | 332,050 |
Teekay Corp. 8.5% 1/15/20 | | 295,000 | | 304,204 |
Tennessee Gas Pipeline Co.: | | | | |
7% 10/15/28 | | 20,000 | | 23,026 |
7.625% 4/1/37 | | 50,000 | | 60,284 |
8.375% 6/15/32 | | 40,000 | | 50,571 |
TNK-BP Finance SA 7.5% 7/18/16 | | 180,000 | | 202,275 |
Venoco, Inc.: | | | | |
8.875% 2/15/19 (f) | | 620,000 | | 616,156 |
11.5% 10/1/17 | | 410,000 | | 444,850 |
YPF SA 10% 11/2/28 | | 195,000 | | 225,225 |
| | 49,208,975 |
TOTAL ENERGY | | 51,238,985 |
FINANCIALS - 7.7% |
Capital Markets - 0.1% |
Equinox Holdings, Inc. 9.5% 2/1/16 (f) | | 460,000 | | 483,000 |
HSBC Bank PLC 5.75% 6/27/17 (e) | GBP | 100,000 | | 164,270 |
Lloyds TSB Bank PLC 6.5% 9/17/40 | GBP | 125,000 | | 183,504 |
Penson Worldwide, Inc. 12.5% 5/15/17 (f) | | 290,000 | | 274,050 |
| | 1,104,824 |
Commercial Banks - 2.5% |
African Export-Import Bank 8.75% 11/13/14 | | 520,000 | | 586,300 |
Akbank T.A.S. 5.125% 7/22/15 (f) | | 360,000 | | 356,400 |
Banco Bradesco SA 5.9% 1/16/21 (f) | | 170,000 | | 171,700 |
Banco de Credito del Peru: | | | | |
4.75% 3/16/16 (f) | | 500,000 | | 493,750 |
5.375% 9/16/20 (f) | | 370,000 | | 350,575 |
|
| Principal Amount (d) | | Value |
Banco Nacional de Desenvolvimento Economico e Social 5.5% 7/12/20 (f) | | $ 300,000 | | $ 318,000 |
Banco Votorantim SA 5.25% 2/11/16 (f) | | 400,000 | | 406,000 |
BanColombia SA: | | | | |
4.25% 1/12/16 (f) | | 175,000 | | 175,875 |
5.95% 6/3/21 (f) | | 210,000 | | 212,415 |
BBVA Paraguay SA 9.75% 2/11/16 (f) | | 450,000 | | 490,500 |
CIT Group, Inc.: | | | | |
7% 5/1/14 | | 103,009 | | 104,039 |
7% 5/1/15 | | 712 | | 715 |
7% 5/4/15 (f) | | 184,000 | | 184,460 |
7% 5/1/16 | | 853 | | 851 |
7% 5/2/16 (f) | | 1,087,000 | | 1,082,924 |
7% 5/1/17 | | 992 | | 990 |
7% 5/2/17 (f) | | 3,980,000 | | 3,970,050 |
Commonwealth Bank of Australia 4.25% 4/6/18 | EUR | 500,000 | | 727,749 |
Development Bank of Kazakhstan JSC 5.5% 12/20/15 (f) | | 200,000 | | 207,000 |
Development Bank of Philippines: | | | | |
5.5% 3/25/21 | | 200,000 | | 198,000 |
8.375% (g)(l) | | 620,000 | | 688,200 |
DnB NOR Bank ASA 4.375% 2/24/21 | EUR | 400,000 | | 574,904 |
Eastern and Southern African Trade and Development Bank 6.875% 1/9/16 (Reg. S) | | 400,000 | | 390,000 |
European Investment Bank: | | | | |
2.875% 7/15/16 | EUR | 900,000 | | 1,306,124 |
4.125% 12/7/17 | GBP | 800,000 | | 1,358,577 |
EXIM of Ukraine 7.65% 9/7/11 (Issued by Credit Suisse International for EXIM of Ukraine) | | 1,950,000 | | 1,957,410 |
Export-Import Bank of India 0.6953% 6/7/12 (l) | JPY | 10,000,000 | | 122,478 |
Export-Import Bank of Korea 5.1% 10/29/13 (f) | INR | 15,600,000 | | 336,433 |
HSBK (Europe) BV: | | | | |
7.25% 5/3/17 (f) | | 535,000 | | 545,700 |
9.25% 10/16/13 (f) | | 455,000 | | 494,813 |
International Bank for Reconstruction & Development 8.2% 12/12/12 | NGN | 40,000,000 | | 263,003 |
Itau Unibanco Holding SA 6.2% 12/21/21 (f) | | 220,000 | | 223,850 |
Korea Development Bank 4% 9/9/16 | | 200,000 | | 204,680 |
National Westminster Bank PLC 6.5% 9/7/21 | GBP | 150,000 | | 223,867 |
Nordea Bank Finland PLC 2.25% 11/16/15 | EUR | 450,000 | | 631,377 |
RSHB Capital SA: | | | | |
6% 6/3/21 (f) | | 200,000 | | 201,500 |
Corporate Bonds - continued |
| Principal Amount (d) | | Value |
Nonconvertible Bonds - continued |
FINANCIALS - continued |
Commercial Banks - continued |
RSHB Capital SA: - continued | | | | |
9% 6/11/14 (f) | | $ 115,000 | | $ 131,261 |
Standard Bank PLC 8.75% 2/9/16 (Issued by Standard Bank PLC for PrivatBank) (l) | | 215,000 | | 183,825 |
The State Export-Import Bank of Ukraine JSC 5.7928% 2/9/16 (Issued by Credit Suisse First Boston International for The State Export-Import Bank of Ukraine JSC) (e) | | 500,000 | | 450,000 |
Trade & Development Bank of Mongolia LLC 8.5% 10/25/13 (Reg. S) | | 200,000 | | 205,500 |
Turkiye Garanti Bankasi AS: | | | | |
2.774% 4/20/16 (f)(l) | | 200,000 | | 198,500 |
6.25% 4/20/21 (f) | | 400,000 | | 388,500 |
Turkiye Is Bankasi AS 5.1% 2/1/16 (f) | | 500,000 | | 493,750 |
US Bank NA 4.375% 2/28/17 (l) | EUR | 100,000 | | 142,025 |
Vimpel Communications 8.25% 5/23/16 (Reg. S) (Issued by UBS Luxembourg SA for Vimpel Communications) | | 790,000 | | 864,063 |
Wells Fargo & Co. 7.98% (g)(l) | | 135,000 | | 146,138 |
| | 22,764,771 |
Consumer Finance - 2.1% |
Ally Financial, Inc.: | | | | |
3.4658% 2/11/14 (l) | | 1,530,000 | | 1,507,050 |
7.5% 9/15/20 | | 1,605,000 | | 1,686,053 |
8% 3/15/20 | | 3,940,000 | | 4,196,100 |
Ford Motor Credit Co. LLC: | | | | |
6.625% 8/15/17 | | 810,000 | | 866,700 |
12% 5/15/15 | | 1,620,000 | | 2,016,900 |
General Motors Acceptance Corp.: | | | | |
6.75% 12/1/14 | | 915,000 | | 947,025 |
8% 11/1/31 | | 490,000 | | 523,309 |
GMAC LLC: | | | | |
6.75% 12/1/14 | | 280,000 | | 292,600 |
8% 11/1/31 | | 6,758,000 | | 7,281,745 |
| | 19,317,482 |
Diversified Financial Services - 2.6% |
Aquarius Investments Luxemburg 8.25% 2/18/16 | | 400,000 | | 428,120 |
Bank of America Corp.: | | | | |
8% (g)(l) | | 350,000 | | 363,125 |
8.125% (g)(l) | | 480,000 | | 499,200 |
Bank of Georgia JSC 9% 2/8/12 (Issued by BG Finance BV for Bank of Georgia JSC) | | 220,000 | | 226,050 |
BP Capital Markets PLC 3.83% 10/6/17 | EUR | 250,000 | | 363,564 |
|
| Principal Amount (d) | | Value |
Bumble Bee Holdco SCA 9.625% 3/15/18 pay-in-kind (f)(l) | | $ 370,000 | | $ 342,250 |
CCO Holdings LLC/CCO Holdings Capital Corp.: | | | | |
6.5% 4/30/21 | | 935,000 | | 922,144 |
7.875% 4/30/18 | | 235,000 | | 248,513 |
8.125% 4/30/20 | | 565,000 | | 610,200 |
CDW LLC/CDW Finance Corp. 8% 12/15/18 (f) | | 470,000 | | 493,500 |
City of Buenos Aires 12.5% 4/6/15 (f) | | 1,060,000 | | 1,199,390 |
CM-CIC Covered Bonds 4.375% 3/17/21 | EUR | 100,000 | | 147,865 |
Dignity Finance PLC: | | | | |
6.31% 12/31/23 (Reg. S) | GBP | 19,081 | | 35,020 |
8.151% 12/31/30 | GBP | 30,000 | | 59,322 |
European Community: | | | | |
3.25% 4/4/18 | EUR | 1,400,000 | | 2,039,669 |
3.375% 5/10/19 | EUR | 700,000 | | 1,025,941 |
Fibria Overseas Finance Ltd. 6.75% 3/3/21 (f) | | 180,000 | | 188,325 |
FireKeepers Development Authority 13.875% 5/1/15 (f) | | 100,000 | | 115,500 |
General Motors Financial Co., Inc. 6.75% 6/1/18 (f) | | 575,000 | | 580,750 |
Hilcorp Energy I LP/Hilcorp Finance Co. 7.625% 4/15/21 (f) | | 360,000 | | 376,200 |
Icahn Enterprises LP/Icahn Enterprises Finance Corp.: | | | | |
7.75% 1/15/16 | | 1,785,000 | | 1,831,856 |
8% 1/15/18 | | 2,353,000 | | 2,388,295 |
Imperial Tobacco Finance 4.5% 7/5/18 | EUR | 250,000 | | 362,956 |
Indo Energy Finance BV 7% 5/7/18 (f) | | 200,000 | | 206,000 |
Landrys Holdings, Inc. 11.5% 6/1/14 (f) | | 270,000 | | 270,000 |
LBI Escrow Corp. 8% 11/1/17 (f) | | 521,000 | | 577,008 |
NCO Group, Inc. 11.875% 11/15/14 | | 120,000 | | 101,400 |
Offshore Group Investment Ltd.: | | | | |
11.5% 8/1/15 | | 710,000 | | 773,900 |
11.5% 8/1/15 (f) | | 160,000 | | 174,400 |
Rearden G Holdings Eins GmbH 7.875% 3/30/20 (f) | | 345,000 | | 374,325 |
Reynolds Group Issuer, Inc./Reynolds Group Issuer LLC/Reynolds Group Issuer (Luxembourg) SA: | | | | |
6.875% 2/15/21 (f) | | 335,000 | | 324,950 |
8.25% 2/15/21 (f) | | 1,410,000 | | 1,307,775 |
SB Capital SA 5.4% 3/24/17 (Reg. S) | | 185,000 | | 192,169 |
Spencer Spirit Holdings, Inc./Spencer Gifts LLC/Spirit Halloween Superstores 11% 5/1/17 (f) | | 225,000 | | 229,500 |
Corporate Bonds - continued |
| Principal Amount (d) | | Value |
Nonconvertible Bonds - continued |
FINANCIALS - continued |
Diversified Financial Services - continued |
T2 Capital Finance Co. SA 6.95% 2/6/17 (Reg. S) (e) | | $ 300,000 | | $ 303,750 |
TMK Capital SA: | | | | |
7.75% 1/27/18 | | 200,000 | | 207,250 |
10% 7/29/11 | | 400,000 | | 401,760 |
Transportation Union LLC/Transportation Union Financing Corp. 11.375% 6/15/18 | | 350,000 | | 387,170 |
Unitymedia Hessen GmbH & Co. KG / Unitymedia NRW GmbH 8.125% 12/1/17 (f) | | 560,000 | | 596,400 |
UPCB Finance III Ltd. 6.625% 7/1/20 (f) | | 345,000 | | 340,688 |
Vnesheconombank Via VEB Finance Ltd. 6.8% 11/22/25 (f) | | 200,000 | | 202,750 |
WaMu Covered Bond Program 3.875% 9/27/11 | EUR | 50,000 | | 72,820 |
Wind Acquisition Holdings Finance SA 12.25% 7/15/17 pay-in-kind (f)(l) | | 1,221,985 | | 1,396,941 |
Zhaikmunai Finance BV 10.5% 10/19/15 (f) | | 575,000 | | 614,531 |
| | 23,903,242 |
Insurance - 0.0% |
CNO Financial Group, Inc. 9% 1/15/18 (f) | | 255,000 | | 265,200 |
Real Estate Investment Trusts - 0.3% |
MPT Operating Partnership LP/MPT Finance Corp. 6.875% 5/1/21 (f) | | 725,000 | | 705,063 |
Omega Healthcare Investors, Inc.: | | | | |
6.75% 10/15/22 (f) | | 725,000 | | 717,750 |
7.5% 2/15/20 | | 385,000 | | 404,250 |
Senior Housing Properties Trust 8.625% 1/15/12 | | 280,000 | | 289,208 |
| | 2,116,271 |
Real Estate Management & Development - 0.1% |
CB Richard Ellis Services, Inc. 6.625% 10/15/20 | | 480,000 | | 492,000 |
Realogy Corp.: | | | | |
7.875% 2/15/19 (f) | | 475,000 | | 465,500 |
12% 4/15/17 | | 139,213 | | 136,429 |
Toys 'R' Us Property Co. II LLC 8.5% 12/1/17 | | 65,000 | | 67,925 |
| | 1,161,854 |
TOTAL FINANCIALS | | 70,633,644 |
|
| Principal Amount (d) | | Value |
HEALTH CARE - 2.8% |
Health Care Providers & Services - 2.0% |
Apria Healthcare Group, Inc. 11.25% 11/1/14 | | $ 505,000 | | $ 518,888 |
CRC Health Group, Inc. 10.75% 2/1/16 | | 90,000 | | 90,783 |
DaVita, Inc.: | | | | |
6.375% 11/1/18 | | 385,000 | | 385,963 |
6.625% 11/1/20 | | 1,375,000 | | 1,388,750 |
Gentiva Health Services, Inc. 11.5% 9/1/18 | | 475,000 | | 501,125 |
Hanger Orthopedic Group, Inc. 7.125% 11/15/18 | | 1,230,000 | | 1,260,750 |
HCA Holdings, Inc. 7.75% 5/15/21 (f) | | 6,160,000 | | 6,329,400 |
HCA, Inc.: | | | | |
6.5% 2/15/16 | | 275,000 | | 279,813 |
7.25% 9/15/20 | | 1,935,000 | | 2,070,450 |
9.25% 11/15/16 | | 1,215,000 | | 1,289,419 |
HealthSouth Corp. 8.125% 2/15/20 | | 575,000 | | 618,125 |
IASIS Healthcare LLC/IASIS Capital Corp. 8.375% 5/15/19 (f) | | 1,210,000 | | 1,200,925 |
InVentiv Health, Inc. 10% 8/15/18 (f) | | 75,000 | | 72,375 |
Kindred Escrow Corp. 8.25% 6/1/19 (f) | | 190,000 | | 190,000 |
LifePoint Hospitals, Inc. 6.625% 10/1/20 | | 345,000 | | 350,175 |
ResCare, Inc. 10.75% 1/15/19 | | 240,000 | | 253,800 |
Rotech Healthcare, Inc.: | | | | |
10.5% 3/15/18 (f) | | 220,000 | | 212,300 |
10.75% 10/15/15 | | 345,000 | | 381,225 |
Sabra Health Care LP/Sabra Capital Corp. 8.125% 11/1/18 | | 105,000 | | 104,738 |
Skilled Healthcare Group, Inc. 11% 1/15/14 | | 78,000 | | 80,145 |
UHS Escrow Corp. 7% 10/1/18 | | 85,000 | | 87,763 |
United Surgical Partners International, Inc. 8.875% 5/1/17 | | 55,000 | | 57,613 |
Vanguard Health Holding Co. II LLC / Vanguard Holding Co. II, Inc. 7.75% 2/1/19 | | 375,000 | | 382,500 |
Vanguard Health Systems, Inc. 0% 2/1/16 | | 615,000 | | 404,363 |
| | 18,511,388 |
Health Care Technology - 0.0% |
ConvaTec Healthcare ESA 10.5% 12/15/18 (f) | | 425,000 | | 439,875 |
Pharmaceuticals - 0.8% |
Elan Finance PLC/Elan Finance Corp. 8.75% 10/15/16 | | 435,000 | | 457,838 |
Giant Funding Corp. 8.25% 2/1/18 (f) | | 430,000 | | 448,275 |
Corporate Bonds - continued |
| Principal Amount (d) | | Value |
Nonconvertible Bonds - continued |
HEALTH CARE - continued |
Pharmaceuticals - continued |
Leiner Health Products, Inc. 11% 6/1/12 (c) | | $ 90,000 | | $ 4,500 |
Mylan, Inc.: | | | | |
6% 11/15/18 (f) | | 950,000 | | 964,250 |
7.625% 7/15/17 (f) | | 315,000 | | 340,200 |
7.875% 7/15/20 (f) | | 570,000 | | 621,300 |
Valeant Pharmaceuticals International: | | | | |
6.75% 8/15/21 (f) | | 2,800,000 | | 2,632,000 |
6.875% 12/1/18 (f) | | 1,365,000 | | 1,334,288 |
7% 10/1/20 (f) | | 200,000 | | 193,000 |
| | 6,995,651 |
TOTAL HEALTH CARE | | 25,946,914 |
INDUSTRIALS - 3.4% |
Aerospace & Defense - 0.1% |
ADS Tactical, Inc. 11% 4/1/18 (f) | | 145,000 | | 153,149 |
Alion Science & Technology Corp.: | | | | |
10.25% 2/1/15 | | 50,000 | | 41,313 |
12% 11/1/14 pay-in-kind | | 117,566 | | 120,113 |
DigitalGlobe, Inc. 10.5% 5/1/14 | | 185,000 | | 205,350 |
GeoEye, Inc. 9.625% 10/1/15 | | 75,000 | | 84,750 |
Hexcel Corp. 6.75% 2/1/15 | | 34,000 | | 34,595 |
Huntington Ingalls Industries, Inc.: | | | | |
6.875% 3/15/18 (f) | | 150,000 | | 152,625 |
7.125% 3/15/21 (f) | | 150,000 | | 154,500 |
| | 946,395 |
Air Freight & Logistics - 0.0% |
Air Medical Group Holdings, Inc. 9.25% 11/1/18 (f) | | 285,000 | | 301,388 |
Airlines - 0.8% |
Air Canada 9.25% 8/1/15 (f) | | 595,000 | | 612,850 |
American Airlines, Inc. equipment trust certificate 13% 8/1/16 | | 286,186 | | 327,683 |
American Airlines, Inc. pass-thru trust certificates 10.375% 7/2/19 | | 396,708 | | 456,214 |
Continental Airlines, Inc.: | | | | |
pass-thru trust certificates 6.903% 4/19/22 | | 48,652 | | 48,531 |
3.3779% 6/2/13 (l) | | 2,532,916 | | 2,431,599 |
Continental Airlines, Inc. 7.25% 11/10/19 | | 371,248 | | 400,019 |
Delta Air Lines, Inc. 9.5% 9/15/14 (f) | | 103,000 | | 109,695 |
|
| Principal Amount (d) | | Value |
Delta Air Lines, Inc. pass-thru trust certificates: | | | | |
6.821% 8/10/22 | | $ 576,899 | | $ 599,975 |
8.021% 8/10/22 | | 256,486 | | 260,641 |
Northwest Airlines Corp. 10% 2/1/09 (c) | | 105,000 | | 0 |
Northwest Airlines, Inc.: | | | | |
7.875% 3/15/08 (c) | | 90,000 | | 0 |
8.875% 6/1/06 (c) | | 80,000 | | 0 |
Northwest Airlines, Inc. pass-thru trust certificates: | | | | |
7.027% 11/1/19 | | 123,286 | | 125,752 |
8.028% 11/1/17 | | 45,647 | | 45,647 |
United Air Lines, Inc.: | | | | |
9.875% 8/1/13 (f) | | 154,000 | | 161,700 |
12% 11/1/13 (f) | | 270,000 | | 286,875 |
United Air Lines, Inc. pass-thru trust certificates 9.75% 1/15/17 | | 613,696 | | 696,545 |
US Airways 2011-1 Class A Pass Through Trust 7.125% 10/22/23 | | 490,000 | | 490,000 |
| | 7,053,726 |
Building Products - 0.0% |
Building Materials Corp. of America 6.75% 5/1/21 (f) | | 425,000 | | 427,125 |
Commercial Services & Supplies - 0.9% |
ACCO Brands Corp. 10.625% 3/15/15 | | 45,000 | | 49,950 |
American Reprographics Co. 10.5% 12/15/16 | | 395,000 | | 387,100 |
B-Corp Merger Sub, Inc. 8.25% 6/1/19 (f) | | 270,000 | | 267,300 |
Casella Waste Systems, Inc.: | | | | |
7.75% 2/15/19 (f) | | 100,000 | | 100,250 |
11% 7/15/14 | | 105,000 | | 116,550 |
Cenveo Corp. 10.5% 8/15/16 (f) | | 175,000 | | 171,938 |
Covanta Holding Corp. 7.25% 12/1/20 | | 430,000 | | 449,522 |
Garda World Security Corp. 9.75% 3/15/17 (f) | | 185,000 | | 195,638 |
International Lease Finance Corp.: | | | | |
5.75% 5/15/16 | | 465,000 | | 458,723 |
6.25% 5/15/19 | | 765,000 | | 747,788 |
6.75% 9/1/16 (f) | | 380,000 | | 403,750 |
7.125% 9/1/18 (f) | | 760,000 | | 811,300 |
8.25% 12/15/20 | | 720,000 | | 784,800 |
8.625% 9/15/15 | | 655,000 | | 710,675 |
8.75% 3/15/17 | | 980,000 | | 1,068,200 |
The Geo Group, Inc. 7.75% 10/15/17 | | 220,000 | | 231,550 |
United Rentals North America, Inc. 8.375% 9/15/20 | | 605,000 | | 601,975 |
WP Rocket Merger Sub, Inc. 10.125% 7/15/19 (f) | | 320,000 | | 323,200 |
| | 7,880,209 |
Corporate Bonds - continued |
| Principal Amount (d) | | Value |
Nonconvertible Bonds - continued |
INDUSTRIALS - continued |
Construction & Engineering - 0.0% |
Odebrecht Finance Ltd.: | | | | |
6% 4/5/23 (f) | | $ 200,000 | | $ 199,000 |
7% 4/21/20 (f) | | 105,000 | | 115,369 |
| | 314,369 |
Electrical Equipment - 0.1% |
General Cable Corp. 7.125% 4/1/17 | | 40,000 | | 40,900 |
Sensata Technologies BV 6.5% 5/15/19 (f) | | 485,000 | | 485,000 |
| | 525,900 |
Industrial Conglomerates - 0.1% |
Sequa Corp.: | | | | |
11.75% 12/1/15 (f) | | 705,000 | | 747,300 |
13.5% 12/1/15 pay-in-kind (f) | | 280,685 | | 303,140 |
| | 1,050,440 |
Machinery - 0.2% |
Accuride Corp. 9.5% 8/1/18 | | 55,000 | | 58,850 |
ArvinMeritor, Inc. 10.625% 3/15/18 | | 170,000 | | 188,700 |
Chart Industries, Inc. 9.125% 10/15/15 | | 60,000 | | 62,400 |
Navistar International Corp. 8.25% 11/1/21 | | 710,000 | | 763,250 |
Terex Corp. 10.875% 6/1/16 | | 330,000 | | 374,550 |
Xerium Technologies, Inc. 8.875% 6/15/18 (f) | | 360,000 | | 349,200 |
| | 1,796,950 |
Marine - 0.2% |
Navios Maritime Acquisition Corp./Navios Acquisition Finance US, Inc. 8.625% 11/1/17 | | 220,000 | | 214,786 |
Navios Maritime Holdings, Inc.: | | | | |
8.125% 2/15/19 (f) | | 385,000 | | 383,075 |
8.875% 11/1/17 | | 875,000 | | 923,125 |
Navios South American Logisitcs, Inc./Navios Logistics Finance U.S., Inc. 9.25% 4/15/19 (f) | | 120,000 | | 123,000 |
SCF Capital Ltd. 5.375% 10/27/17 (f) | | 200,000 | | 200,000 |
Ultrapetrol (Bahamas) Ltd. 9% 11/24/14 | | 95,000 | | 94,050 |
| | 1,938,036 |
Professional Services - 0.1% |
CDRT Merger Sub, Inc. 8.125% 6/1/19 (f) | | 580,000 | | 578,550 |
|
| Principal Amount (d) | | Value |
Road & Rail - 0.8% |
Avis Budget Car Rental LLC/Avis Budget Finance, Inc.: | | | | |
8.25% 1/15/19 | | $ 870,000 | | $ 883,050 |
9.625% 3/15/18 | | 200,000 | | 214,500 |
Georgian Railway Ltd. 9.875% 7/22/15 | | 200,000 | | 222,250 |
Hertz Corp. 6.75% 4/15/19 (f) | | 465,000 | | 458,025 |
Kansas City Southern de Mexico SA de CV: | | | | |
6.125% 6/15/21 (f) | | 310,000 | | 309,225 |
6.625% 12/15/20 (f) | | 175,000 | | 180,688 |
8% 2/1/18 | | 2,500,000 | | 2,706,250 |
12.5% 4/1/16 | | 855,000 | | 1,017,450 |
Swift Services Holdings, Inc. 10% 11/15/18 | | 800,000 | | 846,000 |
Western Express, Inc. 12.5% 4/15/15 (f) | | 485,000 | | 459,538 |
| | 7,296,976 |
Trading Companies & Distributors - 0.1% |
Aircastle Ltd. 9.75% 8/1/18 | | 755,000 | | 834,275 |
Transportation Infrastructure - 0.0% |
Aeropuertos Argentina 2000 SA 10.75% 12/1/20 (f) | | 260,680 | | 281,209 |
TOTAL INDUSTRIALS | | 31,225,548 |
INFORMATION TECHNOLOGY - 1.7% |
Communications Equipment - 0.6% |
Avaya, Inc.: | | | | |
9.75% 11/1/15 | | 555,000 | | 564,713 |
10.125% 11/1/15 pay-in-kind (l) | | 370,000 | | 378,325 |
Brocade Communications Systems, Inc.: | | | | |
6.625% 1/15/18 | | 90,000 | | 94,725 |
6.875% 1/15/20 | | 170,000 | | 183,379 |
Hughes Network System LLC/HNS Finance Corp. 9.5% 4/15/14 | | 320,000 | | 328,000 |
Lucent Technologies, Inc.: | | | | |
6.45% 3/15/29 | | 3,620,000 | | 3,258,000 |
6.5% 1/15/28 | | 430,000 | | 385,925 |
ViaSat, Inc. 8.875% 9/15/16 | | 105,000 | | 111,300 |
| | 5,304,367 |
Computers & Peripherals - 0.2% |
Seagate HDD Cayman: | | | | |
7% 11/1/21 (f) | | 580,000 | | 575,650 |
7.75% 12/15/18 (f) | | 795,000 | | 824,813 |
| | 1,400,463 |
Electronic Equipment & Components - 0.2% |
Atkore International, Inc. 9.875% 1/1/18 (f) | | 190,000 | | 199,975 |
Corporate Bonds - continued |
| Principal Amount (d) | | Value |
Nonconvertible Bonds - continued |
INFORMATION TECHNOLOGY - continued |
Electronic Equipment & Components - continued |
Reddy Ice Corp.: | | | | |
11.25% 3/15/15 | | $ 1,875,000 | | $ 1,907,813 |
13.25% 11/1/15 | | 130,000 | | 120,250 |
| | 2,228,038 |
Internet Software & Services - 0.1% |
Equinix, Inc. 8.125% 3/1/18 | | 665,000 | | 724,850 |
IT Services - 0.2% |
Ceridian Corp. 11.25% 11/15/15 | | 275,000 | | 276,375 |
Fidelity National Information Services, Inc.: | | | | |
7.625% 7/15/17 | | 240,000 | | 254,400 |
7.875% 7/15/20 | | 320,000 | | 340,000 |
SunGard Data Systems, Inc. 7.375% 11/15/18 | | 385,000 | | 383,537 |
Telcordia Technologies, Inc. 11% 5/1/18 (f) | | 580,000 | | 732,250 |
Unisys Corp.: | | | | |
12.5% 1/15/16 | | 210,000 | | 229,950 |
12.75% 10/15/14 (f) | | 17,000 | | 19,890 |
| | 2,236,402 |
Semiconductors & Semiconductor Equipment - 0.4% |
Advanced Micro Devices, Inc.: | | | | |
7.75% 8/1/20 | | 135,000 | | 138,038 |
8.125% 12/15/17 | | 270,000 | | 280,800 |
Freescale Semiconductor, Inc. 10.75% 8/1/20 (f) | | 295,000 | | 328,925 |
NXP BV/NXP Funding LLC 9.75% 8/1/18 (f) | | 2,420,000 | | 2,701,446 |
Spansion LLC 11.25% 1/15/16 (c)(f) | | 255,000 | | 55,039 |
STATS ChipPAC Ltd. 7.5% 8/12/15 (f) | | 200,000 | | 215,000 |
Viasystems, Inc. 12% 1/15/15 (f) | | 310,000 | | 340,225 |
| | 4,059,473 |
Software - 0.0% |
Open Solutions, Inc. 9.75% 2/1/15 (f) | | 50,000 | | 30,000 |
TOTAL INFORMATION TECHNOLOGY | | 15,983,593 |
MATERIALS - 2.6% |
Chemicals - 0.5% |
Braskem Finance Ltd.: | | | | |
5.75% 4/15/21 (f) | | 200,000 | | 201,000 |
7% 5/7/20 (f) | | 180,000 | | 195,975 |
Celanese US Holdings LLC 5.875% 6/15/21 | | 235,000 | | 236,763 |
Ferro Corp. 7.875% 8/15/18 | | 360,000 | | 374,400 |
Georgia Gulf Corp. 9% 1/15/17 (f) | | 860,000 | | 924,500 |
|
| Principal Amount (d) | | Value |
Ineos Finance PLC 9% 5/15/15 (f) | | $ 215,000 | | $ 227,363 |
Inergy LP/Inergy Finance Corp. 6.875% 8/1/21 (f) | | 520,000 | | 525,200 |
Nalco Co. 6.625% 1/15/19 (f) | | 555,000 | | 568,875 |
NOVA Chemicals Corp.: | | | | |
3.542% 11/15/13 (l) | | 105,000 | | 104,213 |
6.5% 1/15/12 | | 375,000 | | 380,625 |
OMNOVA Solutions, Inc. 7.875% 11/1/18 (f) | | 95,000 | | 90,725 |
OXEA Finance & CY S.C.A. 9.5% 7/15/17 (f) | | 294,000 | | 304,290 |
PolyOne Corp. 7.375% 9/15/20 | | 155,000 | | 161,588 |
Solutia, Inc.: | | | | |
7.875% 3/15/20 | | 175,000 | | 190,750 |
8.75% 11/1/17 | | 85,000 | | 92,225 |
Sterling Chemicals, Inc. 10.25% 4/1/15 | | 90,000 | | 95,400 |
TPC Group LLC 8.25% 10/1/17 (f) | | 190,000 | | 197,125 |
| | 4,871,017 |
Containers & Packaging - 0.8% |
ARD Finance SA 11.125% 6/1/18 pay-in-kind (f) | | 410,000 | | 421,275 |
Ardagh Packaging Finance PLC: | | | | |
7.375% 10/15/17 (f) | | 200,000 | | 207,000 |
9.125% 10/15/20 (f) | | 560,000 | | 588,000 |
Ball Corp. 5.75% 5/15/21 | | 3,000,000 | | 3,015,000 |
Berry Plastics Corp.: | | | | |
8.25% 11/15/15 | | 385,000 | | 406,175 |
9.75% 1/15/21 | | 440,000 | | 427,900 |
Berry Plastics Holding Corp. 4.122% 9/15/14 (l) | | 45,000 | | 42,300 |
BWAY Holding Co. 10% 6/15/18 | | 205,000 | | 224,475 |
BWAY Parent Co., Inc. 10.875% 11/1/15 pay-in-kind (f)(l) | | 205,897 | | 202,352 |
Crown Americas LLC/Crown Americas Capital Corp. III 6.25% 2/1/21 (f) | | 460,000 | | 465,750 |
Crown Cork & Seal, Inc.: | | | | |
7.375% 12/15/26 | | 1,210,000 | | 1,185,800 |
7.5% 12/15/96 | | 160,000 | | 124,800 |
| | 7,310,827 |
Metals & Mining - 1.0% |
Aleris International, Inc.: | | | | |
6% 6/1/20 (f) | | 1,759 | | 1,759 |
9% 12/15/14 pay-in-kind (c)(l) | | 150,000 | | 750 |
Alrosa Finance SA: | | | | |
(Reg. S) 8.875% 11/17/14 | | 200,000 | | 228,500 |
7.75% 11/3/20 (f) | | 200,000 | | 217,250 |
Aperam: | | | | |
7.375% 4/1/16 (f) | | 150,000 | | 151,500 |
7.75% 4/1/18 (f) | | 150,000 | | 151,500 |
Boart Longyear Management Pty Ltd. 7% 4/1/21 (f) | | 190,000 | | 194,275 |
Calcipar SA 6.875% 5/1/18 (f) | | 200,000 | | 201,500 |
Corporate Bonds - continued |
| Principal Amount (d) | | Value |
Nonconvertible Bonds - continued |
MATERIALS - continued |
Metals & Mining - continued |
CSN Islands XII Corp. 7% (Reg. S) (g) | | $ 720,000 | | $ 707,400 |
Edgen Murray Corp. 12.25% 1/15/15 | | 675,000 | | 680,063 |
Evraz Group SA: | | | | |
8.25% 11/10/15 (f) | | 170,000 | | 189,125 |
9.5% 4/24/18 (Reg. S) | | 285,000 | | 327,750 |
Ferrexpo Finance PLC 7.875% 4/7/16 (f) | | 285,000 | | 292,838 |
FMG Resources (August 2006) Pty Ltd.: | | | | |
6.375% 2/1/16 (f) | | 635,000 | | 636,588 |
6.875% 2/1/18 (f) | | 635,000 | | 647,700 |
7% 11/1/15 (f) | | 790,000 | | 809,750 |
McJunkin Red Man Corp. 9.5% 12/15/16 (f) | | 740,000 | | 760,350 |
Metinvest BV 10.25% 5/20/15 (f) | | 160,000 | | 174,208 |
Midwest Vanadium Pty Ltd. 11.5% 2/15/18 (f) | | 380,000 | | 381,900 |
Mirabela Nickel Ltd. 8.75% 4/15/18 (f) | | 100,000 | | 98,500 |
Rain CII Carbon LLC/CII Carbon Corp. 8% 12/1/18 (f) | | 300,000 | | 310,500 |
RathGibson, Inc. 11.25% 2/15/14 (c) | | 298,709 | | 30 |
Severstal Columbus LLC 10.25% 2/15/18 | | 555,000 | | 611,888 |
Southern Copper Corp. 6.75% 4/16/40 | | 495,000 | | 480,249 |
Vedanta Resources PLC: | | | | |
6.75% 6/7/16 (f) | | 530,000 | | 530,000 |
8.25% 6/7/21 (f) | | 200,000 | | 202,000 |
Votorantim Cimentos SA 7.25% 4/5/41 (f) | | 200,000 | | 198,000 |
| | 9,185,873 |
Paper & Forest Products - 0.3% |
ABI Escrow Corp. 10.25% 10/15/18 (f) | | 1,264,000 | | 1,368,280 |
Clearwater Paper Corp. 7.125% 11/1/18 | | 105,000 | | 105,788 |
Georgia-Pacific LLC 5.4% 11/1/20 (f) | | 560,000 | | 581,000 |
Glatfelter 7.125% 5/1/16 | | 40,000 | | 41,300 |
NewPage Corp.: | | | | |
6.5233% 5/1/12 (l) | | 90,000 | | 23,400 |
11.375% 12/31/14 | | 345,000 | | 321,713 |
|
| Principal Amount (d) | | Value |
Sino-Forest Corp. 6.25% 10/21/17 (f) | | $ 200,000 | | $ 92,000 |
Solo Cup Co. 8.5% 2/15/14 | | 135,000 | | 122,850 |
| | 2,656,331 |
TOTAL MATERIALS | | 24,024,048 |
TELECOMMUNICATION SERVICES - 6.1% |
Diversified Telecommunication Services - 3.7% |
Alestra SA de RL de CV 11.75% 8/11/14 | | 550,000 | | 629,750 |
Citizens Communications Co.: | | | | |
7.125% 3/15/19 | | 225,000 | | 230,625 |
7.875% 1/15/27 | | 280,000 | | 271,600 |
9% 8/15/31 | | 220,000 | | 225,500 |
Clearwire Communications LLC/Clearwire Finance, Inc. 12% 12/1/15 (f) | | 1,225,000 | | 1,319,938 |
Frontier Communications Corp.: | | | | |
8.25% 4/15/17 | | 1,350,000 | | 1,464,750 |
8.5% 4/15/20 | | 1,785,000 | | 1,941,188 |
8.75% 4/15/22 | | 1,170,000 | | 1,259,154 |
Global Crossing Ltd. 12% 9/15/15 | | 1,920,000 | | 2,236,800 |
Indosat Palapa Co. BV 7.375% 7/29/20 (f) | | 145,000 | | 160,588 |
Sprint Capital Corp.: | | | | |
6.875% 11/15/28 | | 6,157,000 | | 5,849,150 |
6.9% 5/1/19 | | 1,190,000 | | 1,225,700 |
8.75% 3/15/32 | | 10,385,000 | | 11,241,763 |
Telemar Norte Leste SA 5.5% 10/23/20 (f) | | 140,000 | | 138,082 |
U.S. West Communications: | | | | |
6.875% 9/15/33 | | 200,000 | | 192,750 |
7.25% 9/15/25 | | 35,000 | | 36,225 |
7.25% 10/15/35 | | 70,000 | | 69,475 |
7.5% 6/15/23 | | 30,000 | | 30,000 |
Wind Acquisition Finance SA: | | | | |
7.25% 2/15/18 (f) | | 415,000 | | 431,600 |
11.75% 7/15/17 (f) | | 4,515,000 | | 5,124,525 |
| | 34,079,163 |
Wireless Telecommunication Services - 2.4% |
Clearwire Escrow Corp. 12% 12/1/15 (f) | | 335,000 | | 358,450 |
Cricket Communications, Inc. 7.75% 10/15/20 (f) | | 2,185,000 | | 2,119,450 |
Digicel Group Ltd.: | | | | |
8.25% 9/1/17 (f) | | 210,000 | | 217,623 |
8.875% 1/15/15 (f) | | 1,875,000 | | 1,912,500 |
9.125% 1/15/15 pay-in-kind (f)(l) | | 917,000 | | 937,633 |
10.5% 4/15/18 (f) | | 2,495,000 | | 2,778,931 |
12% 4/1/14 (f) | | 1,145,000 | | 1,328,200 |
Intelsat Jackson Holdings SA: | | | | |
7.25% 4/1/19 (f) | | 1,000,000 | | 997,500 |
Corporate Bonds - continued |
| Principal Amount (d) | | Value |
Nonconvertible Bonds - continued |
TELECOMMUNICATION SERVICES - continued |
Wireless Telecommunication Services - continued |
Intelsat Jackson Holdings SA: - continued | | | | |
7.5% 4/1/21 (f) | | $ 1,885,000 | | $ 1,885,000 |
8.5% 11/1/19 | | 325,000 | | 345,313 |
9.5% 6/15/16 | | 1,215,000 | | 1,275,750 |
MTS International Funding Ltd. 8.625% 6/22/20 (f) | | 410,000 | | 466,908 |
NII Capital Corp.: | | | | |
7.625% 4/1/21 | | 905,000 | | 943,463 |
10% 8/15/16 | | 765,000 | | 887,400 |
Pakistan Mobile Communications Ltd. 8.625% 11/13/13 (f) | | 950,000 | | 931,000 |
Telemovil Finance Co. Ltd. 8% 10/1/17 (f) | | 630,000 | | 664,650 |
VimpelCom Holdings BV: | | | | |
4.2465% 6/29/14 (f)(l) | | 200,000 | | 200,000 |
7.5043% 3/1/22 (f) | | 2,575,000 | | 2,575,000 |
VIP Finance Ireland Ltd.: | | | | |
6.493% 2/2/16 (f) | | 350,000 | | 359,205 |
7.748% 2/2/21 (f) | | 1,385,000 | | 1,423,088 |
| | 22,607,064 |
TOTAL TELECOMMUNICATION SERVICES | | 56,686,227 |
UTILITIES - 2.2% |
Electric Utilities - 0.4% |
Aguila 3 SA 7.875% 1/31/18 (f) | | 250,000 | | 256,250 |
Empresa Distribuidora y Comercializadora Norte SA 9.75% 10/25/22 (f) | | 150,000 | | 151,500 |
Intergen NV 9% 6/30/17 (f) | | 1,255,000 | | 1,327,163 |
Majapahit Holding BV: | | | | |
7.75% 10/17/16 (Reg. S) | | 425,000 | | 494,063 |
7.75% 1/20/20 (f) | | 265,000 | | 310,050 |
8% 8/7/19 (f) | | 265,000 | | 313,363 |
National Power Corp. 6.875% 11/2/16 (f) | | 200,000 | | 229,000 |
Texas Competitive Electric Holdings Co. LLC/Texas Competitive Electric Holdings Finance, Inc. 11.5% 10/1/20 (f) | | 435,000 | | 430,650 |
| | 3,512,039 |
Gas Utilities - 0.2% |
Intergas Finance BV 6.375% 5/14/17 (Reg. S) | | 155,000 | | 166,625 |
Southern Natural Gas Co.: | | | | |
7.35% 2/15/31 | | 175,000 | | 203,813 |
8% 3/1/32 | | 350,000 | | 438,559 |
|
| Principal Amount (d) | | Value |
Star Gas Partners LP/Star Gas Finance Co. 8.875% 12/1/17 | | $ 210,000 | | $ 218,400 |
Transportadora de Gas del Sur SA 7.875% 5/14/17 (f) | | 695,000 | | 674,150 |
| | 1,701,547 |
Independent Power Producers & Energy Traders - 1.6% |
Calpine Corp. 7.875% 1/15/23 (f) | | 2,345,000 | | 2,415,350 |
Energy Future Holdings Corp. 10% 1/15/20 | | 2,720,000 | | 2,876,400 |
Energy Future Intermediate Holding Co. LLC/Energy Future Intermediate Holding Finance, Inc.: | | | | |
10% 12/1/20 | | 3,827,000 | | 4,075,755 |
11% 10/1/21 (f) | | 2,486,000 | | 2,473,570 |
NRG Energy, Inc.: | | | | |
7.625% 5/15/19 (f) | | 655,000 | | 648,450 |
7.875% 5/15/21 (f) | | 655,000 | | 650,088 |
Power Sector Assets and Liabilities Management Corp.: | | | | |
7.25% 5/27/19 (f) | | 235,000 | | 278,475 |
7.39% 12/2/24 (f) | | 280,000 | | 331,800 |
TXU Corp.: | | | | |
6.5% 11/15/24 | | 1,070,000 | | 535,000 |
6.55% 11/15/34 | | 1,625,000 | | 796,250 |
| | 15,081,138 |
Water Utilities - 0.0% |
Companhia de Saneamento Basico do Estado de Sao Paulo (SABESP) 6.25% 12/16/20 (f) | | 200,000 | | 205,000 |
South East Water Ltd. Class 2A, 5.5834% 3/29/29 | GBP | 165,000 | | 262,372 |
| | 467,372 |
TOTAL UTILITIES | | 20,762,096 |
TOTAL NONCONVERTIBLE BONDS | | 333,579,701 |
TOTAL CORPORATE BONDS (Cost $327,073,728) | 343,840,316 |
U.S. Government and Government Agency Obligations - 20.6% |
|
U.S. Government Agency Obligations - 0.9% |
Fannie Mae: | | | | |
0.375% 12/28/12 | | 930,000 | | 930,075 |
0.5% 8/9/13 | | 368,000 | | 367,454 |
1.125% 6/27/14 | | 225,000 | | 226,183 |
Federal Home Loan Bank: | | | | |
0.875% 8/22/12 | | 495,000 | | 497,961 |
0.875% 12/27/13 | | 50,000 | | 50,182 |
1.875% 6/21/13 | | 2,240,000 | | 2,299,705 |
U.S. Government and Government Agency Obligations - continued |
| Principal Amount (d) | | Value |
U.S. Government Agency Obligations - continued |
Freddie Mac: | | | | |
0.375% 11/30/12 | | $ 227,000 | | $ 226,933 |
1% 7/30/14 | | 790,000 | | 788,806 |
1% 8/27/14 | | 408,000 | | 407,461 |
Israeli State (guaranteed by U.S. Government through Agency for International Development) 5.5% 9/18/23 | | 769,000 | | 886,124 |
Tennessee Valley Authority: | | | | |
5.25% 9/15/39 | | 400,000 | | 423,588 |
5.375% 4/1/56 | | 1,200,000 | | 1,288,405 |
TOTAL U.S. GOVERNMENT AGENCY OBLIGATIONS | | 8,392,877 |
U.S. Treasury Inflation Protected Obligations - 0.1% |
U.S. Treasury Inflation-Indexed Bonds 2.125% 2/15/41 | | 1,228,041 | | 1,336,738 |
U.S. Treasury Obligations - 17.5% |
U.S. Treasury Bonds: | | | | |
3.875% 8/15/40 | | 2,942,000 | | 2,693,769 |
4.375% 2/15/38 | | 675,000 | | 679,219 |
4.375% 5/15/41 | | 11,068,000 | | 11,052,394 |
4.75% 2/15/37 | | 450,000 | | 481,360 |
4.75% 2/15/41 | | 4,325,000 | | 4,597,341 |
5.25% 2/15/29 | | 3,325,000 | | 3,835,700 |
6.25% 8/15/23 (k) | | 5,561,000 | | 7,050,303 |
7.5% 11/15/16 | | 655,000 | | 844,541 |
7.5% 11/15/24 | | 780,000 | | 1,097,850 |
7.875% 2/15/21 | | 200,000 | | 280,312 |
8% 11/15/21 | | 870,000 | | 1,237,846 |
U.S. Treasury Notes: | | | | |
0.375% 6/30/13 | | 24,893,000 | | 24,846,387 |
0.5% 5/31/13 | | 4,333,000 | | 4,336,722 |
0.75% 6/15/14 | | 13,220,000 | | 13,200,382 |
1% 5/15/14 | | 6,720,000 | | 6,762,538 |
1.25% 10/31/15 | | 3,260,000 | | 3,230,712 |
1.375% 2/15/13 | | 297,000 | | 301,699 |
1.5% 6/30/16 | | 4,742,000 | | 4,681,255 |
1.75% 7/31/15 | | 4,750,000 | | 4,827,948 |
1.875% 8/31/17 | | 3,300,000 | | 3,231,680 |
1.875% 9/30/17 | | 1,900,000 | | 1,856,359 |
2.125% 5/31/15 | | 1,958,000 | | 2,023,319 |
2.375% 8/31/14 | | 12,800,000 | | 13,389,005 |
2.375% 9/30/14 | | 942,000 | | 985,568 |
2.375% 10/31/14 | | 4,724,000 | | 4,939,532 |
|
| Principal Amount (d) | | Value |
2.375% 6/30/18 | | $ 15,744,000 | | $ 15,616,080 |
2.5% 4/30/15 | | 3,089,000 | | 3,238,381 |
2.625% 7/31/14 | | 5,363,000 | | 5,651,261 |
2.75% 11/30/16 | | 1,500,000 | | 1,562,813 |
3% 2/28/17 | | 1,500,000 | | 1,577,226 |
3.125% 10/31/16 | | 1,340,000 | | 1,423,332 |
3.125% 1/31/17 | | 1,636,000 | | 1,733,265 |
3.125% 5/15/19 | | 1,232,000 | | 1,270,884 |
3.125% 5/15/21 | | 1,831,000 | | 1,824,427 |
3.625% 8/15/19 | | 1,109,000 | | 1,180,739 |
3.625% 2/15/21 | | 235,000 | | 244,841 |
4.25% 11/15/17 | | 1,975,000 | | 2,212,154 |
4.5% 5/15/17 | | 1,172,000 | | 1,329,029 |
TOTAL U.S. TREASURY OBLIGATIONS | | 161,328,173 |
Other Government Related - 2.1% |
Bank of America Corp.: | | | | |
2.1% 4/30/12 (FDIC Guaranteed) (h) | | 200,000 | | 203,135 |
3.125% 6/15/12 (FDIC Guaranteed) (h) | | 9,000 | | 9,246 |
Citibank NA 1.875% 5/7/12 (FDIC Guaranteed) (h) | | 1,350,000 | | 1,368,899 |
Citigroup Funding, Inc.: | | | | |
1.875% 10/22/12 (FDIC Guaranteed) (h) | | 4,000,000 | | 4,077,268 |
1.875% 11/15/12 (FDIC Guaranteed) (h) | | 525,000 | | 534,615 |
2% 3/30/12 (FDIC Guaranteed) (h) | | 250,000 | | 253,521 |
2.125% 7/12/12 (FDIC Guaranteed) (h) | | 172,000 | | 175,336 |
General Electric Capital Corp.: | | | | |
2% 9/28/12 (FDIC Guaranteed) (h) | | 1,693,000 | | 1,724,231 |
2.125% 12/21/12 (FDIC Guaranteed) (h) | | 1,000,000 | | 1,023,688 |
2.625% 12/28/12 (FDIC Guaranteed) (h) | | 384,000 | | 395,551 |
3% 12/9/11 (FDIC Guaranteed) (h) | | 310,000 | | 313,793 |
GMAC, Inc. 1.75% 10/30/12 (FDIC Guaranteed) (h) | | 1,360,000 | | 1,382,911 |
Goldman Sachs Group, Inc. 3.25% 6/15/12 (FDIC Guaranteed) (h) | | 9,000 | | 9,253 |
JPMorgan Chase & Co.: | | | | |
2.2% 6/15/12 (FDIC Guaranteed) (h) | | 530,000 | | 539,652 |
3.125% 12/1/11 (FDIC Guaranteed) (h) | | 50,000 | | 50,613 |
U.S. Government and Government Agency Obligations - continued |
| Principal Amount (d) | | Value |
Other Government Related - continued |
National Credit Union Administration Guaranteed Notes: | | | | |
Series 2010-A1 Class A, 0.5539% 12/7/20 (NCUA Guaranteed) (l) | | $ 442,916 | | $ 444,147 |
Series 2011-R1 Class 1A, 0.6398% 1/8/20 (NCUA Guaranteed) (l) | | 665,013 | | 666,026 |
Series 2011-R4 Class 1A, 0.5895% 3/6/20 (NCUA Guaranteed) (l) | | 485,053 | | 485,394 |
National Credit Union Administration Guaranteed Notes Master Trust: | | | | |
1.4% 6/12/15 (NCUA Guaranteed) | | 330,000 | | 330,465 |
2.35% 6/12/17 (NCUA Guaranteed) | | 2,930,000 | | 2,896,913 |
3.45% 6/12/21 (NCUA Guaranteed) | | 2,400,000 | | 2,362,561 |
TOTAL OTHER GOVERNMENT RELATED | | 19,247,218 |
TOTAL U.S. GOVERNMENT AND GOVERNMENT AGENCY OBLIGATIONS (Cost $189,211,979) | 190,305,006 |
U.S. Government Agency - Mortgage Securities - 1.8% |
|
Fannie Mae - 0.9% |
2.05% 9/1/33 (l) | | 43,559 | | 45,135 |
2.05% 11/1/35 (l) | | 42,006 | | 43,845 |
2.297% 11/1/33 (l) | | 7,533 | | 7,818 |
2.479% 10/1/35 (l) | | 5,711 | | 5,899 |
2.509% 2/1/36 (l) | | 9,118 | | 9,569 |
2.526% 6/1/47 (l) | | 11,676 | | 12,219 |
2.534% 1/1/35 (l) | | 25,475 | | 26,496 |
2.538% 7/1/35 (l) | | 43,824 | | 45,851 |
2.545% 3/1/33 (l) | | 12,660 | | 13,199 |
2.584% 6/1/36 (l) | | 3,529 | | 3,683 |
2.587% 5/1/35 (l) | | 70,639 | | 74,155 |
2.593% 2/1/37 (l) | | 49,219 | | 51,523 |
2.605% 11/1/36 (l) | | 6,275 | | 6,579 |
2.632% 4/1/36 (l) | | 37,257 | | 39,120 |
2.837% 9/1/36 (l) | | 11,911 | | 12,469 |
3.117% 8/1/35 (l) | | 63,374 | | 67,314 |
3.346% 1/1/40 (l) | | 1,402,386 | | 1,463,968 |
3.5% 2/1/41 (j) | | 4,999,998 | | 4,783,315 |
3.691% 5/1/40 (l) | | 253,982 | | 266,192 |
3.697% 5/1/40 (l) | | 302,366 | | 316,985 |
3.789% 6/1/40 (l) | | 264,359 | | 277,325 |
3.838% 5/1/36 (l) | | 6,838 | | 7,185 |
3.972% 11/1/39 (l) | | 226,405 | | 238,517 |
4% 9/1/13 | | 9,473 | | 9,871 |
5.5% 10/1/20 to 4/1/21 | | 772,328 | | 838,754 |
|
| Principal Amount (d) | | Value |
5.963% 3/1/37 (l) | | $ 7,954 | | $ 8,618 |
6% 6/1/16 to 10/1/16 | | 11,452 | | 12,391 |
6.5% 4/1/12 to 7/1/26 | | 37,822 | | 41,603 |
TOTAL FANNIE MAE | | 8,729,598 |
Freddie Mac - 0.4% |
1.945% 3/1/35 (l) | | 14,017 | | 14,464 |
2.046% 5/1/37 (l) | | 8,471 | | 8,820 |
2.075% 3/1/37 (l) | | 3,115 | | 3,211 |
2.244% 1/1/36 (l) | | 6,340 | | 6,554 |
2.328% 6/1/33 (l) | | 27,029 | | 28,112 |
2.415% 7/1/36 (l) | | 360,396 | | 375,931 |
2.474% 12/1/33 (l) | | 57,641 | | 60,332 |
2.487% 10/1/35 (l) | | 29,232 | | 30,556 |
2.508% 12/1/36 (l) | | 89,995 | | 93,973 |
2.51% 5/1/37 (l) | | 84,348 | | 88,745 |
2.51% 5/1/37 (l) | | 47,306 | | 49,558 |
2.54% 6/1/37 (l) | | 26,624 | | 28,040 |
2.557% 4/1/37 (l) | | 10,178 | | 10,664 |
2.615% 9/1/35 (l) | | 4,929 | | 5,169 |
2.635% 7/1/35 (l) | | 28,488 | | 29,641 |
2.694% 5/1/37 (l) | | 7,247 | | 7,602 |
2.715% 10/1/36 (l) | | 34,644 | | 36,201 |
2.772% 1/1/35 (l) | | 73,213 | | 76,753 |
3.021% 7/1/35 (l) | | 18,216 | | 19,289 |
3.162% 1/1/37 (l) | | 27,605 | | 28,858 |
3.281% 10/1/35 (l) | | 4,577 | | 4,881 |
3.416% 4/1/35 (l) | | 63,179 | | 66,779 |
3.801% 4/1/40 (l) | | 249,583 | | 261,529 |
4.5% 8/1/33 | | 20,140 | | 21,021 |
5.138% 4/1/35 (l) | | 2,594 | | 2,766 |
5.5% 2/1/19 to 11/1/21 | | 2,009,625 | | 2,177,106 |
5.847% 6/1/37 (l) | | 3,339 | | 3,527 |
5.931% 6/1/37 (l) | | 6,110 | | 6,402 |
6.147% 7/1/36 (l) | | 11,151 | | 11,771 |
6.383% 8/1/37 (l) | | 15,300 | | 16,314 |
6.473% 2/1/37 (l) | | 5,443 | | 5,635 |
6.5% 12/1/14 to 3/1/22 | | 163,381 | | 178,459 |
7.22% 4/1/37 (l) | | 478 | | 510 |
TOTAL FREDDIE MAC | | 3,759,173 |
Ginnie Mae - 0.5% |
3.5% 7/1/41 (i) | | 1,000,000 | | 969,688 |
4% 9/15/25 | | 92,742 | | 97,873 |
4.751% 12/20/60 (q) | | 505,439 | | 541,272 |
5.492% 4/20/60 (q) | | 739,829 | | 812,806 |
5.5% 2/20/60 (q) | | 1,579,215 | | 1,727,556 |
TOTAL GINNIE MAE | | 4,149,195 |
TOTAL U.S. GOVERNMENT AGENCY - MORTGAGE SECURITIES (Cost $16,451,603) | 16,637,966 |
Collateralized Mortgage Obligations - 2.5% |
| Principal Amount (d) | | Value |
Private Sponsor - 0.0% |
Fosse Master Issuer PLC Series 2011-1X Class A4, 2.583% 10/18/54 (l) | EUR | 200,000 | | $ 290,052 |
Granite Mortgages PLC 1.145% 3/20/44 (l) | GBP | 25,157 | | 38,689 |
TOTAL PRIVATE SPONSOR | | 328,741 |
U.S. Government Agency - 2.5% |
Fannie Mae: | | | | |
planned amortization class Series 2010-118 Class PB, 4.5% 10/25/40 | | $ 300,000 | | 306,239 |
sequential payer: | | | | |
Series 2007-113 Class DB, 4.5% 12/25/22 | | 440,000 | | 478,638 |
Series 2009-14 Class EB, 4.5% 3/25/24 | | 340,000 | | 368,680 |
Series 2010-97 Class CX, 4.5% 9/25/25 | | 500,000 | | 522,885 |
Series 2010-109 Class IM, 5.5% 9/25/40 (n) | | 1,004,051 | | 193,449 |
Series 2010-97 Class CI, 4.5% 8/25/25 (n) | | 623,480 | | 72,700 |
Fannie Mae subordinate REMIC pass-thru certificates: | | | | |
floater: | | | | |
Series 2008-76 Class EF, 0.6858% 9/25/23 (l) | | 177,968 | | 178,185 |
Series 2010-86 Class FE, 0.6358% 8/25/25 (l) | | 272,906 | | 273,804 |
planned amortization class: | | | | |
Series 2002-9 Class PC, 6% 3/25/17 | | 4,676 | | 5,071 |
Series 2003-113 Class PE, 4% 11/25/18 | | 80,000 | | 85,028 |
Series 2003-70 Class BJ, 5% 7/25/33 | | 45,000 | | 47,882 |
Series 2004-80 Class LD, 4% 1/25/19 | | 93,416 | | 97,370 |
Series 2004-81 Class KD, 4.5% 7/25/18 | | 195,000 | | 203,663 |
Series 2005-52 Class PB, 6.5% 12/25/34 | | 58,107 | | 62,391 |
sequential payer: | | | | |
Series 2002-57 Class BD, 5.5% 9/25/17 | | 18,068 | | 19,713 |
Series 2004-95 Class AN, 5.5% 1/25/25 | | 59,501 | | 63,966 |
Series 2005-117, Class JN, 4.5% 1/25/36 | | 40,000 | | 40,938 |
Series 2005-47 Class HK, 4.5% 6/25/20 | | 340,000 | | 368,922 |
Series 2006-72 Class CY, 6% 8/25/26 | | 145,000 | | 163,276 |
|
| Principal Amount (d) | | Value |
Series 2008-27 Class KB, 4.5% 4/25/23 | | $ 190,000 | | $ 206,678 |
Series 2009-85 Class IB, 4.5% 8/25/24 (n) | | 156,845 | | 18,825 |
Series 2009-93 Class IC, 4.5% 9/25/24 (n) | | 306,116 | | 35,616 |
Series 2010-139 Class NI, 4.5% 2/25/40 (n) | | 506,826 | | 96,851 |
Federal HMLC Multi-class participation certificates guaranteed floater Series 3835, 0.5371% 5/15/38 (l) | | 1,440,102 | | 1,439,953 |
Freddie Mac planned amortization class: | | | | |
Series 2101 Class PD, 6% 11/15/28 | | 10,764 | | 11,925 |
Series 2115 Class PE, 6% 1/15/14 | | 1,951 | | 2,038 |
Freddie Mac Multi-class participation certificates guaranteed: | | | | |
floater: | | | | |
Series 2630 Class FL, 0.6871% 6/15/18 (l) | | 3,435 | | 3,471 |
Series 3346 Class FA, 0.4171% 2/15/19 (l) | | 847,783 | | 848,630 |
planned amortization class: | | | | |
Series 2376 Class JE, 5.5% 11/15/16 | | 19,444 | | 20,906 |
Series 2381 Class OG, 5.5% 11/15/16 | | 12,678 | | 13,589 |
Series 2425 Class JH, 6% 3/15/17 | | 24,093 | | 26,251 |
Series 2628 Class OE, 4.5% 6/15/18 | | 95,000 | | 102,072 |
Series 2672, Class MG, 5% 9/15/23 | | 310,000 | | 339,157 |
Series 2695 Class DG, 4% 10/15/18 | | 220,000 | | 232,458 |
Series 2831 Class PB, 5% 7/15/19 | | 200,000 | | 217,897 |
Series 2866 Class XE, 4% 12/15/18 | | 237,654 | | 248,362 |
Series 2996 Class MK, 5.5% 6/15/35 | | 22,937 | | 25,413 |
Series 3147 Class PF, 0.4871% 4/15/36 (l) | | 384,995 | | 383,091 |
sequential payer: | | | | |
Series 2303 Class ZV, 6% 4/15/31 | | 29,195 | | 32,461 |
Series 2570 Class CU, 4.5% 7/15/17 | | 3,079 | | 3,155 |
Series 2572 Class HK, 4% 2/15/17 | | 1,599 | | 1,596 |
Series 2645, Class BY, 4.5% 7/15/18 | | 210,000 | | 228,457 |
Series 2668 Class AZ, 4% 9/15/18 | | 272,544 | | 283,867 |
Collateralized Mortgage Obligations - continued |
| Principal Amount (d) | | Value |
U.S. Government Agency - continued |
Freddie Mac Multi-class participation certificates guaranteed: - continued | | | | |
sequential payer: - continued | | | | |
Series 2860 Class CP, 4% 10/15/17 | | $ 658 | | $ 657 |
Series 2887 Class EB, 4.5% 11/15/19 | | 420,000 | | 456,704 |
Series 2930 Class KT, 4.5% 2/15/20 | | 290,000 | | 315,131 |
Series 2987 Class HE, 4.5% 6/15/20 | | 380,000 | | 411,814 |
Series 3277 Class B, 4% 2/15/22 | | 300,000 | | 318,047 |
Series 3372 Class BD, 4.5% 10/15/22 | | 790,000 | | 858,682 |
Series 3578, Class B, 4.5% 9/15/24 | | 340,000 | | 366,226 |
Series 2715 Class NG, 4.5% 12/15/18 | | 1,000,000 | | 1,085,448 |
Series 2863 Class DB, 4% 9/15/14 | | 4,688 | | 4,738 |
Ginnie Mae guaranteed REMIC pass-thru certificates: | | | | |
floater: | | | | |
Series 2010-H17 Class FA, 0.5158% 7/20/60 (l)(q) | | 456,687 | | 451,435 |
Series 2010-H18 Class AF, 0.543% 9/20/60 (l)(q) | | 483,430 | | 478,296 |
Series 2010-H19 Class FG, 0.4858% 8/20/60 (l)(q) | | 600,516 | | 591,208 |
Series 2010-H27 Series FA, 0.5903% 12/20/60 (l)(q) | | 225,086 | | 222,318 |
Series 2011-H03 Class FA, 0.6858% 1/20/61 (l)(q) | | 787,588 | | 783,650 |
Series 2011-H05 Class FA, 0.6858% 12/20/60 (l)(q) | | 402,194 | | 400,183 |
Series 2011-H07 Class FA, 0.6858% 2/20/61 (l)(q) | | 699,600 | | 697,417 |
Series 2011-H12 Class FA, 0.6758% 2/20/61 (l)(q) | | 814,845 | | 811,789 |
Series 2011-H13 Class FA, 0.6858% 4/20/61 (l)(q) | | 350,038 | | 350,038 |
Series 2011-H14: | | | | |
Class FB, 0.7% 5/20/61 (l)(q) | | 400,000 | | 400,000 |
Class FC, 0.7% 5/20/61 (l)(q) | | 420,000 | | 420,000 |
planned amortization Series 2011-61 Class OP, 5/20/40 (o) | | 494,523 | | 411,186 |
sequential payer Series 2011-69 Class GX, 4.5% 5/16/40 | | 470,000 | | 480,778 |
Series 2004-79 Class FA, 0.4858% 1/20/31 (l) | | 88,764 | | 88,810 |
Series 2010-42 Class OP, 4/20/40 (o) | | 1,158,561 | | 926,511 |
|
| Principal Amount (d) | | Value |
Series 2011-71: | | | | |
Class ZB, 5.5% 8/20/34 | | $ 930,397 | | $ 1,029,493 |
Class ZC, 5.5% 7/16/34 | | 1,060,703 | | 1,169,033 |
Government National Mortgage Association PSC planned amortization Series 2011-79, 6/20/40 (o) | | 900,000 | | 681,165 |
TOTAL U.S. GOVERNMENT AGENCY | | 22,586,276 |
TOTAL COLLATERALIZED MORTGAGE OBLIGATIONS (Cost $22,749,922) | 22,915,017 |
Commercial Mortgage Securities - 0.0% |
|
London & Regional Debt Securitisation No. 1 PLC Class A, 1.0294% 10/15/14 (l) | GBP | 50,000 | | 74,558 |
REC Plantation Place Ltd. Series 5 Class A, 1.0494% 7/25/16 (Reg. S) (l) | GBP | 48,251 | | 72,763 |
TOTAL COMMERCIAL MORTGAGE SECURITIES (Cost $159,547) | 147,321 |
Foreign Government and Government Agency Obligations - 21.3% |
|
Arab Republic of Egypt: | | | | |
5.75% 4/29/20 (f) | | 160,000 | | 160,560 |
6.875% 4/30/40 (f) | | 255,000 | | 245,438 |
Argentine Republic: | | | | |
discount (with partial capitalization through 12/31/13) 8.28% 12/31/33 | | 829,885 | | 732,374 |
0.4677% 8/3/12 (l) | | 3,785,000 | | 3,705,209 |
2.5% 12/31/38 (e) | | 880,000 | | 382,800 |
7% 9/12/13 | | 2,270,000 | | 2,304,996 |
7% 10/3/15 | | 2,150,000 | | 2,080,125 |
Aruba Government 6.4% 9/6/15 (f) | | 100,000 | | 105,100 |
Austrian Republic: | | | | |
3.65% 4/20/22 | EUR | 500,000 | | 730,226 |
4% 9/15/16 (f) | EUR | 2,500,000 | | 3,828,248 |
Bahamian Republic 6.95% 11/20/29 (f) | | 240,000 | | 259,200 |
Bahrain Kingdom 5.5% 3/31/20 | | 240,000 | | 234,600 |
Barbados Government 7.25% 12/15/21 (f) | | 215,000 | | 225,750 |
Belarus Republic: | | | | |
8.75% 8/3/15 (Reg. S) | | 790,000 | | 711,000 |
8.95% 1/26/18 | | 400,000 | | 352,000 |
Bermuda Government 5.603% 7/20/20 (f) | | 185,000 | | 204,888 |
Brazilian Federative Republic: | | | | |
5.625% 1/7/41 | | 575,000 | | 589,950 |
Foreign Government and Government Agency Obligations - continued |
| Principal Amount (d) | | Value |
Brazilian Federative Republic: - continued | | | | |
6% 1/17/17 | | $ 390,000 | | $ 455,910 |
7.125% 1/20/37 | | 435,000 | | 536,138 |
8.25% 1/20/34 | | 140,000 | | 192,150 |
8.75% 2/4/25 | | 235,000 | | 333,700 |
10.125% 5/15/27 | | 305,000 | | 477,325 |
12.25% 3/6/30 | | 300,000 | | 549,000 |
Bulgarian Republic 8.25% 1/15/15 (Reg. S) | | 145,000 | | 169,288 |
Canadian Government: | | | | |
1% 9/1/11 | CAD | 13,950,000 | | 14,465,531 |
2% 6/1/16 | CAD | 1,165,000 | | 1,189,559 |
3.5% 6/1/20 | CAD | 2,700,000 | | 2,904,040 |
5% 6/1/37 | CAD | 1,900,000 | | 2,440,369 |
Colombian Republic: | | | | |
7.375% 1/27/17 | | 285,000 | | 349,125 |
7.375% 9/18/37 | | 505,000 | | 636,300 |
10.375% 1/28/33 | | 415,000 | | 655,700 |
11.75% 2/25/20 | | 245,000 | | 378,525 |
Congo Republic 3% 6/30/29 (e) | | 508,250 | | 330,363 |
Croatia Republic: | | | | |
6.375% 3/24/21 (f) | | 500,000 | | 518,125 |
6.625% 7/14/20 (f) | | 620,000 | | 656,425 |
6.75% 11/5/19 (f) | | 355,000 | | 382,587 |
Democratic Socialist Republic of Sri Lanka: | | | | |
6.25% 10/4/20 (f) | | 430,000 | | 433,225 |
7.4% 1/22/15 (f) | | 515,000 | | 561,350 |
8.25% 10/24/12 (f) | | 255,000 | | 271,894 |
Dominican Republic: | | | | |
1.2156% 8/30/24 (l) | | 495,000 | | 436,838 |
7.5% 5/6/21 (f) | | 315,000 | | 327,600 |
9.04% 1/23/18 (f) | | 216,409 | | 242,920 |
9.5% 9/27/11 (Reg. S) | | 197,612 | | 201,071 |
Dutch Government: | | | | |
2.5% 1/15/17 | EUR | 1,800,000 | | 2,571,437 |
3.25% 7/15/21 | EUR | 1,000,000 | | 1,438,843 |
El Salvador Republic: | | | | |
7.375% 12/1/19 (f) | | 180,000 | | 198,000 |
7.625% 2/1/41 (f) | | 175,000 | | 179,375 |
7.65% 6/15/35 (Reg. S) | | 240,000 | | 248,400 |
7.75% 1/24/23 (Reg. S) | | 225,000 | | 254,250 |
8.25% 4/10/32 (Reg. S) | | 90,000 | | 100,575 |
Finnish Government 3.375% 4/15/20 | EUR | 1,200,000 | | 1,757,381 |
French Republic: | | | | |
OAT 4.5% 4/25/41 | EUR | 1,350,000 | | 2,052,844 |
3.25% 10/25/21 | EUR | 4,450,000 | | 6,306,042 |
4% 4/25/55 | EUR | 500,000 | | 691,909 |
Gabonese Republic 8.2% 12/12/17 (f) | | 330,000 | | 386,925 |
|
| Principal Amount (d) | | Value |
Georgia Republic 6.875% 4/12/21 (f) | | $ 430,000 | | $ 440,750 |
German Federal Republic: | | | | |
1.25% 9/16/11 | EUR | 8,120,000 | | 11,696,356 |
3.25% 7/4/21 | EUR | 1,750,000 | | 2,585,867 |
Ghana Republic: | | | | |
8.5% 10/4/17 (f) | | 235,000 | | 264,963 |
14.25% 7/29/13 | GHS | 280,000 | | 188,758 |
14.99% 3/11/13 | GHS | 1,270,000 | | 865,154 |
15.65% 6/3/13 | GHS | 175,000 | | 120,966 |
Hungarian Republic: | | | | |
6.25% 1/29/20 | | 320,000 | | 337,600 |
6.375% 3/29/21 | | 775,000 | | 817,625 |
7.625% 3/29/41 | | 382,000 | | 412,560 |
Indonesian Republic: | | | | |
4.875% 5/5/21 (f) | | 200,000 | | 205,500 |
5.875% 3/13/20 (f) | | 530,000 | | 589,625 |
6.625% 2/17/37 (f) | | 425,000 | | 472,813 |
6.875% 1/17/18 (f) | | 300,000 | | 351,390 |
7.5% 1/15/16 (f) | | 175,000 | | 207,603 |
7.75% 1/17/38 (f) | | 610,000 | | 764,025 |
8.5% 10/12/35 (Reg. S) | | 400,000 | | 540,000 |
11.625% 3/4/19 (f) | | 575,000 | | 849,563 |
Islamic Republic of Pakistan 7.125% 3/31/16 (f) | | 1,025,000 | | 886,625 |
Israeli State 5.5% 12/4/23 | | 1,500,000 | | 1,733,178 |
Italian Republic: | | | | |
3% 4/1/14 | EUR | 3,200,000 | | 4,574,455 |
3.75% 4/15/16 | EUR | 4,075,000 | | 5,788,924 |
4.75% 9/1/21 | EUR | 5,150,000 | | 7,423,484 |
5% 9/1/40 | EUR | 1,990,000 | | 2,637,431 |
Japan Government: | | | | |
0.2% 7/15/12 | JPY | 40,000,000 | | 496,961 |
0.3% 12/15/11 | JPY | 518,000,000 | | 6,435,789 |
1.1% 6/20/20 | JPY | 553,500,000 | | 6,941,609 |
1.8% 6/20/18 | JPY | 240,000,000 | | 3,204,141 |
1.9% 9/20/30 | JPY | 290,000,000 | | 3,615,339 |
2% 9/20/40 | JPY | 41,000,000 | | 505,467 |
Jordanian Kingdom 3.875% 11/12/15 | | 200,000 | | 190,500 |
Lebanese Republic 4% 12/31/17 | | 945,750 | | 911,514 |
Lithuanian Republic: | | | | |
5.125% 9/14/17 (f) | | 140,000 | | 143,850 |
6.125% 3/9/21 (f) | | 185,000 | | 196,331 |
6.75% 1/15/15 (f) | | 330,000 | | 363,413 |
7.375% 2/11/20 (f) | | 400,000 | | 461,000 |
Peruvian Republic: | | | | |
3% 3/7/27 (e) | | 135,000 | | 117,450 |
5.625% 11/18/50 | | 480,000 | | 452,400 |
7.35% 7/21/25 | | 320,000 | | 389,600 |
Foreign Government and Government Agency Obligations - continued |
| Principal Amount (d) | | Value |
Peruvian Republic: - continued | | | | |
8.75% 11/21/33 | | $ 635,000 | | $ 865,188 |
Philippine Republic: | | | | |
5.5% 3/30/26 | | 200,000 | | 205,000 |
6.375% 1/15/32 | | 170,000 | | 186,371 |
6.375% 10/23/34 | | 235,000 | | 257,631 |
6.5% 1/20/20 | | 250,000 | | 291,250 |
9.5% 2/2/30 | | 200,000 | | 290,500 |
10.625% 3/16/25 | | 305,000 | | 465,125 |
Polish Government: | | | | |
3.875% 7/16/15 | | 185,000 | | 191,013 |
4% 3/23/21 | EUR | 850,000 | | 1,144,983 |
Provincia de Cordoba 12.375% 8/17/17 (f) | | 415,000 | | 433,675 |
Provincia de Neuquen Argentina 7.875% 4/26/21 (f) | | 200,000 | | 204,500 |
Republic of Iceland 4.875% 6/16/16 (f) | | 210,000 | | 210,788 |
Republic of Iraq 5.8% 1/15/28 (Reg. S) | | 1,250,000 | | 1,125,000 |
Republic of Nigeria 6.75% 1/28/21 (f) | | 355,000 | | 372,750 |
Republic of Senegal 8.75% 5/13/21 (f) | | 235,000 | | 241,756 |
Republic of Serbia 6.75% 11/1/24 (f) | | 2,286,000 | | 2,286,000 |
Russian Federation: | | | | |
3.625% 4/29/15 (f) | | 600,000 | | 615,000 |
5% 4/29/20 (f) | | 900,000 | | 928,170 |
7.5% 3/31/30 (Reg. S) | | 5,458,150 | | 6,432,430 |
11% 7/24/18 (Reg. S) | | 110,000 | | 157,025 |
12.75% 6/24/28 (Reg. S) | | 710,000 | | 1,256,700 |
Spanish Kingdom 5.5% 4/30/21 | EUR | 500,000 | | 728,790 |
Turkish Republic: | | | | |
5.625% 3/30/21 | | 365,000 | | 381,973 |
6% 1/14/41 | | 200,000 | | 194,800 |
6.75% 4/3/18 | | 630,000 | | 716,310 |
6.75% 5/30/40 | | 555,000 | | 599,400 |
6.875% 3/17/36 | | 1,065,000 | | 1,171,500 |
7% 9/26/16 | | 590,000 | | 675,845 |
7.25% 3/15/15 | | 380,000 | | 433,390 |
7.25% 3/5/38 | | 650,000 | | 747,175 |
7.375% 2/5/25 | | 1,150,000 | | 1,362,175 |
7.5% 7/14/17 | | 575,000 | | 675,913 |
7.5% 11/7/19 | | 475,000 | | 563,825 |
11.875% 1/15/30 | | 420,000 | | 714,000 |
UK Treasury Index-Linked GILT: | | | | |
2% 1/22/16 | GBP | 1,600,000 | | 2,560,265 |
3.75% 9/7/20 | GBP | 3,225,000 | | 5,324,866 |
4.25% 12/7/40 | GBP | 3,740,000 | | 5,965,472 |
5% 3/7/12 | GBP | 2,650,000 | | 4,380,009 |
|
| Principal Amount (d) | | Value |
Ukraine Financing of Infrastructure Projects State Enterprise 8.375% 11/3/17 (f) | | $ 380,000 | | $ 396,150 |
Ukraine Government: | | | | |
6.25% 6/17/16 (f) | | 405,000 | | 404,595 |
6.385% 6/26/12 (f) | | 445,000 | | 456,125 |
6.75% 11/14/17 (f) | | 485,000 | | 487,425 |
6.875% 9/23/15 (f) | | 390,000 | | 403,065 |
7.65% 6/11/13 (f) | | 360,000 | | 378,180 |
7.75% 9/23/20 (f) | | 340,000 | | 352,410 |
7.95% 2/23/21 (f) | | 400,000 | | 416,600 |
United Arab Emirates 7.75% 10/5/20 (Reg. S) | | 190,000 | | 201,638 |
United Mexican States: | | | | |
5.125% 1/15/20 | | 560,000 | | 604,800 |
5.625% 1/15/17 | | 720,000 | | 819,000 |
5.75% 10/12/10 | | 446,000 | | 415,672 |
5.95% 3/19/19 | | 398,000 | | 456,705 |
6.05% 1/11/40 | | 1,298,000 | | 1,381,072 |
6.75% 9/27/34 | | 560,000 | | 651,000 |
7.5% 4/8/33 | | 235,000 | | 296,100 |
8.3% 8/15/31 | | 250,000 | | 342,500 |
Uruguay Republic: | | | | |
6.875% 9/28/25 | | 140,000 | | 170,450 |
7.875% 1/15/33 pay-in-kind | | 325,000 | | 410,313 |
8% 11/18/22 | | 553,878 | | 716,718 |
Venezuelan Republic: | | | | |
oil recovery rights 4/15/20 (p) | | 646 | | 17,604 |
6% 12/9/20 | | 465,000 | | 287,835 |
7% 3/31/38 | | 460,000 | | 263,350 |
8.5% 10/8/14 | | 445,000 | | 402,725 |
9% 5/7/23 (Reg. S) | | 1,835,000 | | 1,319,365 |
9.25% 9/15/27 | | 1,250,000 | | 937,500 |
9.25% 5/7/28 (Reg. S) | | 785,000 | | 547,930 |
9.375% 1/13/34 | | 665,000 | | 468,160 |
10.75% 9/19/13 | | 475,000 | | 469,063 |
12.75% 8/23/22 | | 1,710,000 | | 1,530,450 |
13.625% 8/15/18 | | 946,000 | | 941,270 |
Vietnamese Socialist Republic: | | | | |
1.274% 3/12/16 (l) | | 265,217 | | 251,956 |
4% 3/12/28 (e) | | 1,150,000 | | 971,750 |
6.75% 1/29/20 (f) | | 290,000 | | 301,600 |
6.875% 1/15/16 (f) | | 530,000 | | 564,450 |
TOTAL FOREIGN GOVERNMENT AND GOVERNMENT AGENCY OBLIGATIONS (Cost $190,057,510) | 196,706,171 |
Supranational Obligations - 0.0% |
|
Eurasian Development Bank 7.375% 9/29/14 (f)
(Cost $221,094) | | 220,000 | | 242,000 |
Common Stocks - 0.7% |
| Shares | | Value |
CONSUMER DISCRETIONARY - 0.2% |
Auto Components - 0.0% |
Remy International, Inc. (a) | 6,195 | | $ 161,070 |
| | |
Automobiles - 0.1% |
General Motors Co.: | | | |
warrants 7/10/16 (a) | 9,739 | | 208,415 |
warrants 7/10/19 (a) | 9,739 | | 155,142 |
| | 363,557 |
Media - 0.1% |
Haights Cross Communications, Inc. (a) | 107 | | 793 |
Haights Cross Communications, Inc. warrants 3/11/13 (a) | 148 | | 50 |
HMH Holdings, Inc. (a)(s) | 170,789 | | 811,248 |
HMH Holdings, Inc. warrants 3/9/17 (a)(s) | 40,350 | | 20,175 |
RDA Holding Co. warrants 2/19/14 (a)(s) | 510 | | 1,383 |
| | 833,649 |
TOTAL CONSUMER DISCRETIONARY | | 1,358,276 |
FINANCIALS - 0.0% |
Diversified Financial Services - 0.0% |
New Penhall Holding Co.: | | | |
Class A (a) | 321 | | 36,113 |
Class B (a) | 107 | | 12,038 |
| | 48,151 |
INDUSTRIALS - 0.1% |
Aerospace & Defense - 0.0% |
Alion Science & Technology Corp. warrants 3/15/17 (a) | 115 | | 575 |
Airlines - 0.0% |
Delta Air Lines, Inc. (a) | 1,123 | | 10,298 |
Building Products - 0.1% |
Nortek, Inc. (a) | 16,991 | | 611,506 |
Nortek, Inc. warrants 12/7/14 (a) | 524 | | 4,192 |
| | 615,698 |
Marine - 0.0% |
US Shipping Partners Corp. (a) | 644 | | 0 |
US Shipping Partners Corp. warrants 12/31/29 (a) | 6,028 | | 0 |
| | | 0 |
Transportation Infrastructure - 0.0% |
DeepOcean Group Holding A/S (f) | 31,896 | | 506,698 |
TOTAL INDUSTRIALS | | 1,133,269 |
|
| Shares | | Value |
INFORMATION TECHNOLOGY - 0.0% |
Semiconductors & Semiconductor Equipment - 0.0% |
MagnaChip Semiconductor Corp. (s) | 2,668 | | $ 27,662 |
MATERIALS - 0.4% |
Chemicals - 0.4% |
Celanese Corp. Class A | 378 | | 20,151 |
Chemtura Corp. (a) | 7,820 | | 142,324 |
Georgia Gulf Corp. (a) | 21,226 | | 512,396 |
LyondellBasell Industries NV Class A | 70,459 | | 2,714,081 |
Tronox, Inc. (a) | 2,436 | | 341,040 |
Tronox, Inc. | 448 | | 56,448 |
| | 3,786,440 |
Containers & Packaging - 0.0% |
Rock-Tenn Co. Class A | 303 | | 20,101 |
Metals & Mining - 0.0% |
Aleris International, Inc. (s) | 2,037 | | 109,998 |
Rathgibson Acquisition Co. LLC Class A (a)(s) | 14,800 | | 177,748 |
| | 287,746 |
TOTAL MATERIALS | | 4,094,287 |
UTILITIES - 0.0% |
Electric Utilities - 0.0% |
Portland General Electric Co. | 140 | | 3,539 |
TOTAL COMMON STOCKS (Cost $6,572,090) | 6,665,184 |
Preferred Stocks - 0.5% |
| | | |
Convertible Preferred Stocks - 0.2% |
CONSUMER DISCRETIONARY - 0.2% |
Automobiles - 0.2% |
General Motors Co. 4.75% | 26,900 | | 1,311,106 |
Media - 0.0% |
Interpublic Group of Companies, Inc. 5.25% | 300 | | 331,659 |
TOTAL CONSUMER DISCRETIONARY | | 1,642,765 |
FINANCIALS - 0.0% |
Real Estate Investment Trusts - 0.0% |
Health Care REIT, Inc. Series I, 6.50% | 2,900 | | 152,975 |
TOTAL CONVERTIBLE PREFERRED STOCKS | | 1,795,740 |
Preferred Stocks - continued |
| Shares | | Value |
Nonconvertible Preferred Stocks - 0.3% |
FINANCIALS - 0.3% |
Diversified Financial Services - 0.3% |
GMAC Capital Trust I Series 2, 8.125% | 53,768 | | $ 1,376,461 |
GMAC LLC 7.00% (f) | 1,572 | | 1,461,960 |
| | 2,838,421 |
TOTAL PREFERRED STOCKS (Cost $4,003,061) | 4,634,161 |
Floating Rate Loans - 4.2% |
| Principal Amount (d) | | |
CONSUMER DISCRETIONARY - 0.5% |
Auto Components - 0.0% |
Remy International, Inc. Tranche B, term loan 6.25% 12/17/16 (l) | | $ 24,875 | | 24,999 |
Diversified Consumer Services - 0.0% |
ServiceMaster Co.: | | | | |
term loan 2.7129% 7/24/14 (l) | | 396,248 | | 384,855 |
Tranche DD, term loan 2.7% 7/24/14 (l) | | 40,814 | | 39,640 |
Thomson Learning Tranche B, term loan 2.44% 7/5/14 (l) | | 52 | | 47 |
| | 424,542 |
Leisure Equipment & Products - 0.1% |
SRAM LLC: | | | | |
2nd LN, term loan 9.25% 12/7/18 (l) | | 135,000 | | 135,000 |
Tranche B 1LN, term loan 5.75% 6/7/18 (l) | | 420,000 | | 419,475 |
| | 554,475 |
Media - 0.2% |
Charter Communications Operating LLC Tranche B 1LN, term loan 2.19% 3/6/14 (l) | | 24,863 | | 24,863 |
Univision Communications, Inc. term loan 4.4412% 3/31/17 (l) | | 1,667,035 | | 1,583,683 |
| | 1,608,546 |
Specialty Retail - 0.2% |
Burlington Coat Factory Warehouse Corp. Tranche B, term loan 6.25% 2/23/17 (l) | | 758,100 | | 754,310 |
Michaels Stores, Inc.: | | | | |
Tranche B1, term loan 2.5462% 10/31/13 (l) | | 532,677 | | 522,023 |
Tranche B2, term loan 4.7962% 7/31/16 (l) | | 708,568 | | 704,140 |
| | 1,980,473 |
|
| Principal Amount (d) | | Value |
Textiles, Apparel & Luxury Goods - 0.0% |
Levi Strauss & Co. term loan 2.4358% 4/4/14 (l) | | $ 100,000 | | $ 96,000 |
TOTAL CONSUMER DISCRETIONARY | | 4,689,035 |
CONSUMER STAPLES - 0.2% |
Food & Staples Retailing - 0.1% |
The Great Atlantic & Pacific Tea Co. Tranche 2 LN, term loan 8.75% 6/14/12 (l) | | 210,000 | | 211,575 |
U.S. Foodservice term loan 5.75% 3/31/17 (l) | | 748,125 | | 721,941 |
| | 933,516 |
Personal Products - 0.1% |
Revlon Consumer Products Corp. term loan 4.75% 11/19/17 (l) | | 440,000 | | 440,000 |
Tobacco - 0.0% |
Reynolds Consumer Products Holdings, Inc. Tranche E, term loan 4.25% 2/9/18 (l) | | 214,463 | | 213,122 |
TOTAL CONSUMER STAPLES | | 1,586,638 |
ENERGY - 0.1% |
Oil, Gas & Consumable Fuels - 0.1% |
Frac Tech Holdings LLC Tranche B, term loan 6.25% 5/6/16 (l) | | 1,020,971 | | 1,018,418 |
FINANCIALS - 0.3% |
Diversified Financial Services - 0.1% |
Goodman Global Group, Inc. Tranche 1 LN, term loan 5.75% 10/28/16 (l) | | 352,338 | | 353,218 |
IASIS Healthcare LLC Tranche B, term loan 5% 5/3/18 (l) | | 179,550 | | 178,886 |
| | 532,104 |
Real Estate Management & Development - 0.2% |
Realogy Corp.: | | | | |
Credit-Linked Deposit 3.2103% 10/10/13 (l) | | 33,763 | | 31,568 |
Credit-Linked Deposit 4.4603% 10/10/16 (l) | | 56,875 | | 51,045 |
term loan 4.5183% 10/10/16 (l) | | 607,982 | | 545,664 |
Tranche B, term loan 3.2683% 10/10/13 (l) | | 294,112 | | 274,995 |
Tranche DD, term loan 3.2683% 10/10/13 (l) | | 1,038,663 | | 971,150 |
| | 1,874,422 |
TOTAL FINANCIALS | | 2,406,526 |
HEALTH CARE - 0.4% |
Health Care Providers & Services - 0.4% |
DaVita, Inc. Tranche A, term loan 2.95% 10/20/15 (l) | | 214,500 | | 212,891 |
Floating Rate Loans - continued |
| Principal Amount (d) | | Value |
HEALTH CARE - continued |
Health Care Providers & Services - continued |
Emergency Medical Services Corp. Tranche B, term loan 5.2519% 5/25/18 (l) | | $ 533,663 | | $ 531,661 |
Quintiles Transnational Corp. Tranche B, term loan 5% 6/8/18 (l) | | 2,905,000 | | 2,886,844 |
Sunquest Information Systems, Inc. Tranche 1 LN, term loan 6.25% 12/16/16 (l) | | 220,000 | | 218,900 |
| | 3,850,296 |
INDUSTRIALS - 0.7% |
Aerospace & Defense - 0.0% |
TransDigm, Inc. Tranche B, term loan 4% 2/14/17 (l) | | 149,250 | | 149,437 |
Airlines - 0.2% |
Northwest Airlines Corp. Tranche A, term loan 2.06% 12/31/18 (l) | | 757,004 | | 692,658 |
United Air Lines, Inc. Tranche B, term loan 2.2319% 2/1/14 (l) | | 777,469 | | 740,539 |
US Airways Group, Inc. term loan 2.6858% 3/23/14 (l) | | 862,915 | | 780,938 |
| | 2,214,135 |
Commercial Services & Supplies - 0.1% |
KAR Auction Services, Inc. Tranche B, term loan 5% 5/19/17 (l) | | 440,000 | | 442,200 |
Construction & Engineering - 0.2% |
Drumm Investors LLC Tranche B, term loan 5% 5/4/18 (l) | | 1,410,000 | | 1,378,275 |
Electrical Equipment - 0.0% |
Sensata Technologies BV Tranche B, term loan 4% 5/12/18 (l) | | 100,000 | | 99,875 |
Industrial Conglomerates - 0.2% |
Sequa Corp. term loan 3.5003% 12/3/14 (l) | | 929,534 | | 913,267 |
Tomkins PLC Tranche B, term loan 4.25% 9/21/16 (l) | | 829,527 | | 828,490 |
| | 1,741,757 |
Road & Rail - 0.0% |
Swift Transportation Co. LLC Tranche B, term loan 6% 12/21/16 (l) | | 231,122 | | 232,277 |
Transportation Infrastructure - 0.0% |
Trico Shipping AS: | | | | |
Tranche A, term loan 10% 5/13/14 (l) | | 88,104 | | 88,104 |
Tranche D, term loan 5/13/14 (r) | | 88,104 | | 88,104 |
| | 176,208 |
TOTAL INDUSTRIALS | | 6,434,164 |
|
| Principal Amount (d) | | Value |
INFORMATION TECHNOLOGY - 0.6% |
Communications Equipment - 0.0% |
CommScope, Inc. Tranche B, term loan 5% 1/14/18 (l) | | $ 84,788 | | $ 85,105 |
Electronic Equipment & Components - 0.1% |
Aeroflex, Inc. Tranche B, term loan 4.25% 5/9/18 (l) | | 265,000 | | 264,669 |
Flextronics International Ltd.: | | | | |
Tranche B A1, term loan 2.4358% 10/1/14 (l) | | 56,362 | | 55,649 |
Tranche B A2, term loan 2.4413% 10/1/14 (l) | | 134,355 | | 132,004 |
Tranche B A3, term loan 2.4404% 10/1/14 (l) | | 156,748 | | 154,005 |
Tranche B-A, term loan 2.4402% 10/1/14 (l) | | 196,140 | | 192,953 |
Tranche B-B, term loan 2.4404% 10/1/12 (l) | | 190,651 | | 189,697 |
| | 988,977 |
Semiconductors & Semiconductor Equipment - 0.4% |
Freescale Semiconductor, Inc. term loan 4.441% 12/1/16 (l) | | 2,369,293 | | 2,354,484 |
NXP BV term loan 4.5% 3/4/17 (l) | | 523,688 | | 525,651 |
Spansion, Inc. term loan 4.75% 2/9/15 (l) | | 513,585 | | 514,869 |
| | 3,395,004 |
Software - 0.1% |
Kronos, Inc.: | | | | |
Tranche 1LN, term loan 2.057% 6/11/14 (l) | | 717,892 | | 708,918 |
Tranche 2LN, term loan 6.057% 6/11/15 (l) | | 125,000 | | 123,750 |
| | 832,668 |
TOTAL INFORMATION TECHNOLOGY | | 5,301,754 |
MATERIALS - 0.3% |
Chemicals - 0.1% |
Momentive Performance Materials, Inc. Tranche B1, term loan 3.75% 5/15/15 (l) | | 1,408,040 | | 1,379,879 |
Construction Materials - 0.1% |
Fairmount Minerals Ltd. Tranche B, term loan 5.25% 3/15/17 (l) | | 702,150 | | 703,028 |
Containers & Packaging - 0.1% |
Berry Plastics Holding Corp. Tranche C, term loan 2.2607% 4/3/15 (l) | | 595,262 | | 559,546 |
Metals & Mining - 0.0% |
Walter Energy, Inc. Tranche B, term loan 4% 4/1/18 (l) | | 135,000 | | 135,169 |
Floating Rate Loans - continued |
| Principal Amount (d) | | Value |
MATERIALS - continued |
Paper & Forest Products - 0.0% |
White Birch Paper Co.: | | | | |
term loan 12% 9/30/11 (l) | | $ 19,555 | | $ 19,335 |
Tranche DD, term loan 6.7163% 9/30/11 (l)(r) | | 6,780 | | 6,704 |
| | 26,039 |
TOTAL MATERIALS | | 2,803,661 |
TELECOMMUNICATION SERVICES - 0.4% |
Wireless Telecommunication Services - 0.4% |
Asurion LLC term loan 9% 5/24/19 (l) | | 765,000 | | 766,913 |
Digicel International Finance Ltd. term loan 2.8125% 3/30/12 (l) | | 800,144 | | 799,144 |
Intelsat Jackson Holdings SA: | | | | |
term loan 3.2853% 2/1/14 (l) | | 905,000 | | 868,800 |
Tranche B, term loan 5.25% 4/2/18 (l) | | 1,535,000 | | 1,540,833 |
| | 3,975,690 |
UTILITIES - 0.7% |
Electric Utilities - 0.7% |
Texas Competitive Electric Holdings Co. LLC/Texas Competitive Electric Holdings Finance, Inc. Tranche B, term loan 4.7301% 10/10/17 (l) | | 7,724,235 | | 6,063,524 |
Independent Power Producers & Energy Traders - 0.0% |
The AES Corp. Tranche B, term loan 4.25% 5/27/18 (l) | | 189,525 | | 189,051 |
TOTAL UTILITIES | | 6,252,575 |
TOTAL FLOATING RATE LOANS (Cost $36,908,916) | 38,318,757 |
Sovereign Loan Participations - 0.1% |
|
Indonesian Republic loan participation: | | | | |
Citibank 1.25% 12/14/19 (l) | | 449,732 | | 426,684 |
Goldman Sachs
1.25% 12/14/19 (l) | | 648,519 | | 615,282 |
1.25% 12/14/19 (l) | | 161,309 | | 153,042 |
TOTAL SOVEREIGN LOAN PARTICIPATIONS (Cost $1,111,398) | 1,195,008 |
Fixed-Income Funds - 2.0% |
| Shares | | |
Fidelity Floating Rate Central Fund (m)
(Cost $14,543,183) | 180,363 | | 18,281,594 |
Other - 0.0% |
| Shares | | Value |
Other - 0.0% |
Idearc, Inc. Claim (a)
(Cost $1) | 108,228 | | $ 1 |
Money Market Funds - 7.6% |
| | | |
Fidelity Cash Central Fund, 0.11% (b)
(Cost $69,800,229) | 69,800,229 | | 69,800,229 |
TOTAL INVESTMENT PORTFOLIO - 98.6% (Cost $878,864,261) | | 909,688,731 |
NET OTHER ASSETS (LIABILITIES) - 1.4% | | 12,797,063 |
NET ASSETS - 100% | $ 922,485,794 |
Futures Contracts |
| Expiration Date | | Underlying Face Amount at Value | | Unrealized Appreciation/(Depreciation) |
Purchased |
Treasury Contracts |
35 CBOT 2 Year U.S. Treasury Notes Contracts | Sept. 2011 | | $ 7,677,031 | | $ 14,122 |
|
The face value of futures purchased as a percentage of net assets is 0.8% |
Currency Abbreviations |
CAD | - | Canadian dollar |
EUR | - | European Monetary Unit |
GBP | - | British pound |
GHS | - | Ghana Cedi |
INR | - | Indian rupee |
JPY | - | Japanese yen |
NGN | - | Nigerian naira |
Legend |
(a) Non-income producing |
(b) Affiliated fund that is available only to investment companies and other accounts managed by Fidelity Investments. The rate quoted is the annualized seven-day yield of the fund at period end. A complete unaudited listing of the fund's holdings as of its most recent quarter end is available upon request. In addition, each Fidelity Central Fund's financial statements are available on the SEC's website or upon request. |
(c) Non-income producing - Security is in default. |
(d) Principal amount is stated in United States dollars unless otherwise noted. |
(e) Security initially issued at one coupon which converts to a higher coupon at a specified date. The rate shown is the rate at period end. |
(f) Security exempt from registration under Rule 144A of the Securities Act of 1933. These securities may be resold in transactions exempt from registration, normally to qualified institutional buyers. At the end of the period, the value of these securities amounted to $172,239,755 or 18.7% of net assets. |
(g) Security is perpetual in nature with no stated maturity date. |
(h) Under the Temporary Liquidity Guarantee Program, the Federal Deposit Insurance Corporation guarantees principal and interest in the event of payment default or bankruptcy until the earlier of maturity date of the debt or until June 30, 2012. At the end of the period these securities amounted to $12,061,712 or 1.3% of net assets. |
(i) Security or a portion of the security purchased on a delayed delivery or when-issued basis. |
(j) A portion of the security is subject to a forward commitment to sell. |
(k) Security or a portion of the security was pledged to cover margin requirements for futures contracts. At the period end, the value of securities pledged amounted to $44,373. |
(l) Coupon rates for floating and adjustable rate securities reflect the rates in effect at period end. |
(m) Affiliated fund that is available only to investment companies and other accounts managed by Fidelity Investments. A complete unaudited schedule of portfolio holdings for each Fidelity Central Fund is filed with the SEC for the first and third quarters of each fiscal year on Form N-Q and is available upon request or at the SEC's web site at www.sec.gov. An unaudited holdings listing for the Fund, which presents direct holdings as well as the pro rata share of securities and other investments held indirectly through its investment in underlying non-money market Fidelity Central Funds, is available at advisor.fidelity.com. In addition, each Fidelity Central Fund's financial statements are available on the SEC's web site or upon request. |
(n) Security represents right to receive monthly interest payments on an underlying pool of mortgages or assets. Principal shown is the outstanding par amount of the pool held as of the end of the period. |
(o) Principal Only Strips represent the right to receive the monthly principal payments on an underlying pool of mortgage loans. |
(p) Quantity represents share amount. |
(q) Represents an investment in an underlying pool of reverse mortgages which typically do not require regular principal and interest payments as repayment is deferred until a maturity event. |
(r) Position or a portion of the position represents an unfunded loan commitment. At period end, the total principal amount and market value of unfunded commitments totaled $91,687 and $91,646, respectively. The coupon rate will be determined at time of settlement. |
(s) Restricted securities - Investment in securities not registered under the Securities Act of 1933 (excluding 144A issues). At the end of the period, the value of restricted securities (excluding 144A issues) amounted to $1,148,214 or 0.1% of net assets. |
Additional information on each restricted holding is as follows: |
Security | Acquisition Date | Acquisition Cost |
Aleris International, Inc. | 6/1/10 | $ 71,295 |
HMH Holdings, Inc. | 5/2/08 - 3/9/10 | $ 2,699,304 |
HMH Holdings, Inc. warrants 3/9/17 | 3/9/10 | $ 11,701 |
MagnaChip Semiconductor Corp. | 10/26/06 - 11/9/09 | $ 38,357 |
Rathgibson Acquisition Co. LLC Class A | 6/9/10 | $ 78,544 |
RDA Holding Co. warrants 2/19/14 | 2/27/07 | $ 160,000 |
Affiliated Central Funds |
Information regarding fiscal year to date income earned by the Fund from investments in Fidelity Central Funds is as follows: |
Fund | Income earned |
Fidelity Cash Central Fund | $ 38,685 |
Fidelity Floating Rate Central Fund | 464,625 |
Total | $ 503,310 |
Additional information regarding the Fund's fiscal year to date purchases and sales, including the ownership percentage, of the non Money Market Central Funds is as follows: |
Fund | Value, beginning of period | Purchases | Sales Proceeds | Value, end of period | % ownership, end of period |
Fidelity Floating Rate Central Fund | $ 23,496,730 | $ - | $ 5,603,685 | $ 18,281,594 | 0.6% |
Other Information |
The following is a summary of the inputs used, as of June 30, 2011, involving the Fund's assets and liabilities carried at fair value. The inputs or methodology used for valuing securities may not be an indication of the risk associated with investing in those securities. For more information on valuation inputs, and their aggregation into the levels used in the tables below, please refer to the Security Valuation section in the accompanying Notes to Financial Statements. |
Valuation Inputs at Reporting Date: |
Description | Total | Level 1 | Level 2 | Level 3 |
Investments in Securities: | | | | |
Equities: | | | | |
Consumer Discretionary | $ 3,001,041 | $ 1,835,733 | $ 1,142,907 | $ 22,401 |
Financials | 3,039,547 | 1,376,461 | 1,614,935 | 48,151 |
Industrials | 1,133,269 | 621,804 | - | 511,465 |
Information Technology | 27,662 | - | 27,662 | - |
Materials | 4,094,287 | 3,750,093 | 166,446 | 177,748 |
Utilities | 3,539 | 3,539 | - | - |
Corporate Bonds | 343,840,316 | - | 343,697,666 | 142,650 |
U.S. Government and Government Agency Obligations | 190,305,006 | - | 190,305,006 | - |
U.S. Government Agency - Mortgage Securities | 16,637,966 | - | 16,637,966 | - |
Collateralized Mortgage Obligations | 22,915,017 | - | 22,915,017 | - |
Commercial Mortgage Securities | 147,321 | - | 147,321 | - |
Foreign Government and Government Agency Obligations | 196,706,171 | - | 196,588,721 | 117,450 |
Supranational Obligations | 242,000 | - | 242,000 | - |
Floating Rate Loans | 38,318,757 | - | 38,318,757 | - |
Sovereign Loan Participations | 1,195,008 | - | 1,195,008 | - |
Fixed-Income Funds | 18,281,594 | 18,281,594 | - | - |
Other | 1 | - | - | 1 |
Money Market Funds | 69,800,229 | 69,800,229 | - | - |
Total Investments in Securities: | $ 909,688,731 | $ 95,669,453 | $ 812,999,412 | $ 1,019,866 |
Derivative Instruments: | | | | |
Assets | | | | |
Futures Contracts | $ 14,122 | $ 14,122 | $ - | $ - |
Other Financial Instruments: | | | | |
Forward Commitments | $ 289 | $ - | $ 289 | $ - |
The following is a reconciliation of Investments in Securities for which Level 3 inputs were used in determining value: |
Investments in Securities: | |
Beginning Balance | $ 665,619 |
Total Realized Gain (Loss) | (110,127) |
Total Unrealized Gain (Loss) | (124,890) |
Cost of Purchases | 676,566 |
Proceeds of Sales | (1,046,008) |
Amortization/Accretion | 482 |
Transfers in to Level 3 | 958,224 |
Transfers out of Level 3 | - |
Ending Balance | $ 1,019,866 |
The change in unrealized gain (loss) for the period attributable to Level 3 securities held at June 30, 2011 | $ (234,249) |
The information used in the above reconciliation represents fiscal year to date activity for any Investments in Securities identified as using Level 3 inputs at either the beginning or the end of the current fiscal period. Transfers in or out of Level 3 represent the beginning value of any Security or Instrument where a change in the pricing level occurred from the beginning to the end of the period. The cost of purchases and the proceeds of sales may include securities received or delivered through corporate actions or exchanges. Realized and unrealized gains (losses) disclosed in the reconciliation are included in Net Gain (Loss) on the Fund's Statement of Operations. |
Value of Derivative Instruments |
The following table is a summary of the Fund's value of derivative instruments by risk exposure as of June 30, 2011. For additional information on derivative instruments, please refer to the Derivative Instruments section in the accompanying Notes to Financial Statements. |
Risk Exposure /
Derivative Type | Value |
| Asset | Liability |
Interest Rate Risk | | |
Futures Contracts (a) | $ 14,122 | $ - |
Total Value of Derivatives | $ 14,122 | $ - |
(a) Reflects cumulative appreciation/(depreciation) on futures contracts as disclosed on the Schedule of Investments. Only the period end variation margin is separately disclosed on the Statement of Assets and Liabilities. |
Distribution of investments by country of issue, as a percentage of total net assets, is as follows: (Unaudited) |
United States of America | 66.6% |
United Kingdom | 2.8% |
Canada | 2.7% |
Japan | 2.5% |
Netherlands | 2.3% |
Italy | 2.2% |
Germany | 1.7% |
Bermuda | 1.6% |
Venezuela | 1.6% |
Luxembourg | 1.4% |
Argentina | 1.3% |
Mexico | 1.3% |
Turkey | 1.3% |
Russia | 1.1% |
Brazil | 1.0% |
France | 1.0% |
Others (Individually Less Than 1%) | 7.6% |
| 100.0% |
The information in the above table is based on the combined investments of the fund and its pro-rata share of its investments in each non-money market Fidelity Central Fund. |
See accompanying notes which are an integral part of the financial statements.
Semiannual Report
Statement of Assets and Liabilities
| June 30, 2011 (Unaudited) |
| | |
Assets | | |
Investment in securities, at value - See accompanying schedule: Unaffiliated issuers (cost $794,520,849) | $ 821,606,908 | |
Fidelity Central Funds (cost $84,343,412) | 88,081,823 | |
Total Investments (cost $878,864,261) | | $ 909,688,731 |
Commitment to sell securities on a delayed delivery basis | (955,023) | |
Receivable for securities sold on a delayed delivery basis | 955,312 | 289 |
Receivable for investments sold, regular delivery | | 36,657,940 |
Cash | | 3,182,478 |
Foreign currency held at value (cost $92) | | 96 |
Receivable for fund shares sold | | 967,103 |
Dividends receivable | | 22,428 |
Interest receivable | | 10,320,450 |
Distributions receivable from Fidelity Central Funds | | 79,588 |
Other receivables | | 195 |
Total assets | | 960,919,298 |
| | |
Liabilities | | |
Payable for investments purchased
Regular delivery | $ 36,608,627 | |
Delayed delivery | 971,535 | |
Payable for fund shares redeemed | 250,420 | |
Accrued management fee | 429,608 | |
Distribution and service plan fees payable | 2,864 | |
Payable for daily variation on futures contracts | 577 | |
Other affiliated payables | 98,840 | |
Other payables and accrued
expenses | 71,033 | |
Total liabilities | | 38,433,504 |
| | |
Net Assets | | $ 922,485,794 |
Net Assets consist of: | | |
Paid in capital | | $ 853,953,512 |
Undistributed net investment income | | 25,823,948 |
Accumulated undistributed net realized gain (loss) on investments and foreign currency transactions | | 11,842,407 |
Net unrealized appreciation (depreciation) on investments and assets and liabilities in foreign
currencies | | 30,865,927 |
Net Assets | | $ 922,485,794 |
Statement of Assets and Liabilities - continued
| June 30, 2011 (Unaudited) |
| | |
Initial Class:
Net Asset Value, offering price and redemption price per share ($160,681,770 ÷ 13,642,866 shares) | | $ 11.78 |
| | |
Service Class:
Net Asset Value, offering price and redemption price per share ($1,075,278 ÷ 91,441 shares) | | $ 11.76 |
| | |
Service Class 2:
Net Asset Value, offering price and redemption price per share ($14,041,393 ÷ 1,196,508 shares) | | $ 11.74 |
| | |
Investor Class:
Net Asset Value, offering price and redemption price per share ($746,687,353 ÷ 63,540,207 shares) | | $ 11.75 |
See accompanying notes which are an integral part of the financial statements.
Semiannual Report
Statement of Operations
Six months ended June 30, 2011 (Unaudited) |
| | |
Investment Income | | |
Dividends | | $ 80,272 |
Interest | | 21,802,462 |
Income from Fidelity Central Funds | | 503,310 |
Total income | | 22,386,044 |
| | |
Expenses | | |
Management fee | $ 2,398,719 | |
Transfer agent fees | 420,268 | |
Distribution and service plan fees | 13,851 | |
Accounting fees and expenses | 156,367 | |
Custodian fees and expenses | 39,841 | |
Independent trustees' compensation | 1,482 | |
Audit | 34,817 | |
Legal | 3,827 | |
Miscellaneous | 4,468 | |
Total expenses before reductions | 3,073,640 | |
Expense reductions | (728) | 3,072,912 |
Net investment income (loss) | | 19,313,132 |
Realized and Unrealized Gain (Loss) Net realized gain (loss) on: | | |
Investment securities: | | |
Unaffiliated issuers | 12,903,213 | |
Fidelity Central Funds | 79,432 | |
Foreign currency transactions | 13,296 | |
Futures contracts | 28,278 | |
Swap agreements | (11,622) | |
Total net realized gain (loss) | | 13,012,597 |
Change in net unrealized appreciation (depreciation) on: Investment securities | 1,757,407 | |
Assets and liabilities in foreign currencies | (3,103) | |
Futures contracts | 14,122 | |
Swap agreements | 8,272 | |
Delayed delivery commitments | (6,663) | |
Total change in net unrealized appreciation (depreciation) | | 1,770,035 |
Net gain (loss) | | 14,782,632 |
Net increase (decrease) in net assets resulting from operations | | $ 34,095,764 |
Statement of Changes in Net Assets
| Six months ended June 30, 2011
(Unaudited) | Year ended
December 31, 2010 |
Increase (Decrease) in Net Assets | | |
Operations | | |
Net investment income (loss) | $ 19,313,132 | $ 36,424,252 |
Net realized gain (loss) | 13,012,597 | 21,765,656 |
Change in net unrealized appreciation (depreciation) | 1,770,035 | 6,872,569 |
Net increase (decrease) in net assets resulting from operations | 34,095,764 | 65,062,477 |
Distributions to shareholders from net investment income | (352,195) | (33,691,781) |
Distributions to shareholders from net realized gain | (3,874,140) | (19,090,920) |
Total distributions | (4,226,335) | (52,782,701) |
Share transactions - net increase (decrease) | 100,251,681 | 133,480,969 |
Total increase (decrease) in net assets | 130,121,110 | 145,760,745 |
| | |
Net Assets | | |
Beginning of period | 792,364,684 | 646,603,939 |
End of period (including undistributed net investment income of $25,823,948 and undistributed net investment income of $6,863,011, respectively) | $ 922,485,794 | $ 792,364,684 |
See accompanying notes which are an integral part of the financial statements.
Semiannual Report
Financial Highlights - Initial Class
| Six months ended
June 30, 2011 | Years ended December 31, |
| (Unaudited) | 2010 | 2009 | 2008 | 2007 | 2006 |
Selected Per-Share Data | | | | | | |
Net asset value, beginning of period | $ 11.36 | $ 11.11 | $ 8.94 | $ 10.63 | $ 10.70 | $ 10.40 |
Income from Investment Operations | | | | | | |
Net investment income (loss)E | .266 | .588 | .619 | .583 | .600 | .579 |
Net realized and unrealized gain (loss) | .214 | .473 | 2.065 | (1.670) | (.007) | .239 |
Total from investment operations | .480 | 1.061 | 2.684 | (1.087) | .593 | .818 |
Distributions from net investment income | (.005) | (.517) | (.439) | (.548) | (.523) | (.493) |
Distributions from net realized gain | (.055) | (.294) | (.075) | (.055) | (.140) | (.025) |
Total distributions | (.060) | (.811) | (.514) | (.603) | (.663) | (.518) |
Net asset value, end of period | $ 11.78 | $ 11.36 | $ 11.11 | $ 8.94 | $ 10.63 | $ 10.70 |
Total ReturnB,C,D | 4.24% | 9.64% | 30.02% | (10.20)% | 5.59% | 7.87% |
Ratios to Average Net AssetsF,H | | | | | | |
Expenses before reductions | .70%A | .71% | .74% | .73% | .73% | .74% |
Expenses net of fee waivers, if any | .70%A | .70% | .74% | .73% | .73% | .74% |
Expenses net of all reductions | .70%A | .70% | .74% | .72% | .73% | .74% |
Net investment income (loss) | 4.61%A | 5.07% | 5.98% | 5.65% | 5.49% | 5.40% |
Supplemental Data | | | | | | |
Net assets, end of period (000 omitted) | $ 160,682 | $ 154,861 | $ 166,898 | $ 99,114 | $ 119,524 | $ 123,870 |
Portfolio turnover rateG | 273%A | 208% | 199% | 256% | 152% | 83% |
A Annualized
B Total returns for periods of less than one year are not annualized.
C Total returns do not reflect charges attributable to your insurance company's separate account. Inclusion of these charges would reduce the total returns shown.
D Total returns would have been lower if certain expenses had not been reduced during the applicable periods shown.
E Calculated based on average shares outstanding during the period.
F Fees and expenses of any underlying Fidelity Central Funds are not included in the Fund's expense ratio. The Fund indirectly bears its proportionate share of the expenses of any underlying Fidelity Central Funds.
G Amount does not include the portfolio activity of any underlying Fidelity Central Funds.
H Expense ratios reflect operating expenses of the class. Expenses before reductions do not reflect amounts reimbursed by the investment adviser or reductions from brokerage service arrangements or reductions from other expense offset arrangements and do not represent the amount paid by the class during periods when reimbursements or reductions occur. Expenses net of fee waivers reflect expenses after reimbursement by the investment adviser but prior to reductions from brokerage service arrangements or other expense offset arrangements. Expenses net of all reductions represent the net expenses paid by the class.
Financial Highlights - Service Class
| Six months ended
June 30, 2011 | Years ended December 31, |
| (Unaudited) | 2010 | 2009 | 2008 | 2007 | 2006 |
Selected Per-Share Data | | | | | | |
Net asset value, beginning of period | $ 11.35 | $ 11.10 | $ 8.92 | $ 10.61 | $ 10.68 | $ 10.38 |
Income from Investment Operations | | | | | | |
Net investment income (loss)E | .260 | .574 | .594 | .574 | .588 | .567 |
Net realized and unrealized gain (loss) | .210 | .469 | 2.083 | (1.676) | (.005) | .241 |
Total from investment operations | .470 | 1.043 | 2.677 | (1.102) | .583 | .808 |
Distributions from net investment income | (.005) | (.499) | (.422) | (.533) | (.513) | (.483) |
Distributions from net realized gain | (.055) | (.294) | (.075) | (.055) | (.140) | (.025) |
Total distributions | (.060) | (.793) | (.497) | (.588) | (.653) | (.508) |
Net asset value, end of period | $ 11.76 | $ 11.35 | $ 11.10 | $ 8.92 | $ 10.61 | $ 10.68 |
Total ReturnB,C,D | 4.16% | 9.48% | 30.01% | (10.37)% | 5.51% | 7.78% |
Ratios to Average Net AssetsF,H | | | | | | |
Expenses before reductions | .80%A | .81% | .84% | .82% | .83% | .84% |
Expenses net of fee waivers, if any | .80%A | .81% | .84% | .82% | .83% | .84% |
Expenses net of all reductions | .80%A | .81% | .84% | .82% | .82% | .84% |
Net investment income (loss) | 4.51%A | 4.96% | 5.88% | 5.55% | 5.39% | 5.30% |
Supplemental Data | | | | | | |
Net assets, end of period (000 omitted) | $ 1,075 | $ 1,199 | $ 1,898 | $ 2,644 | $ 4,445 | $ 4,211 |
Portfolio turnover rateG | 273%A | 208% | 199% | 256% | 152% | 83% |
A Annualized
B Total returns for periods of less than one year are not annualized.
C Total returns do not reflect charges attributable to your insurance company's separate account. Inclusion of these charges would reduce the total returns shown.
D Total returns would have been lower if certain expenses had not been reduced during the applicable periods shown.
E Calculated based on average shares outstanding during the period.
F Fees and expenses of any underlying Fidelity Central Funds are not included in the Fund's expense ratio. The Fund indirectly bears its proportionate share of the expenses of any underlying Fidelity Central Funds.
G Amount does not include the portfolio activity of any underlying Fidelity Central Funds.
H Expense ratios reflect operating expenses of the class. Expenses before reductions do not reflect amounts reimbursed by the investment adviser or reductions from brokerage service arrangements or reductions from other expense offset arrangements and do not represent the amount paid by the class during periods when reimbursements or reductions occur. Expenses net of fee waivers reflect expenses after reimbursement by the investment adviser but prior to reductions from brokerage service arrangements or other expense offset arrangements. Expenses net of all reductions represent the net expenses paid by the class.
See accompanying notes which are an integral part of the financial statements.
Semiannual Report
Financial Highlights - Service Class 2
| Six months ended
June 30, 2011 | Years ended December 31, |
| (Unaudited) | 2010 | 2009 | 2008 | 2007 | 2006 |
Selected Per-Share Data | | | | | | |
Net asset value, beginning of period | $ 11.33 | $ 11.11 | $ 8.92 | $ 10.61 | $ 10.67 | $ 10.38 |
Income from Investment Operations | | | | | | |
Net investment income (loss)E | .250 | .560 | .578 | .558 | .571 | .551 |
Net realized and unrealized gain (loss) | .220 | .457 | 2.087 | (1.680) | .005 | .232 |
Total from investment operations | .470 | 1.017 | 2.665 | (1.122) | .576 | .783 |
Distributions from net investment income | (.005) | (.503) | (.400) | (.513) | (.496) | (.468) |
Distributions from net realized gain | (.055) | (.294) | (.075) | (.055) | (.140) | (.025) |
Total distributions | (.060) | (.797) | (.475) | (.568) | (.636) | (.493) |
Net asset value, end of period | $ 11.74 | $ 11.33 | $ 11.11 | $ 8.92 | $ 10.61 | $ 10.67 |
Total ReturnB,C,D | 4.16% | 9.23% | 29.88% | (10.56)% | 5.45% | 7.54% |
Ratios to Average Net AssetsF,H | | | | | | |
Expenses before reductions | .95%A | .97% | .99% | .98% | .98% | .99% |
Expenses net of fee waivers, if any | .95%A | .96% | .99% | .98% | .98% | .99% |
Expenses net of all reductions | .95%A | .96% | .99% | .97% | .97% | .99% |
Net investment income (loss) | 4.36%A | 4.81% | 5.72% | 5.40% | 5.24% | 5.15% |
Supplemental Data | | | | | | |
Net assets, end of period (000 omitted) | $ 14,041 | $ 7,599 | $ 1,918 | $ 2,625 | $ 4,418 | $ 4,192 |
Portfolio turnover rateG | 273%A | 208% | 199% | 256% | 152% | 83% |
A Annualized
B Total returns for periods of less than one year are not annualized.
C Total returns do not reflect charges attributable to your insurance company's separate account. Inclusion of these charges would reduce the total returns shown.
D Total returns would have been lower if certain expenses had not been reduced during the applicable periods shown.
E Calculated based on average shares outstanding during the period.
F Fees and expenses of any underlying Fidelity Central Funds are not included in the Fund's expense ratio. The Fund indirectly bears its proportionate share of the expenses of any underlying Fidelity Central Funds.
G Amount does not include the portfolio activity of any underlying Fidelity Central Funds.
H Expense ratios reflect operating expenses of the class. Expenses before reductions do not reflect amounts reimbursed by the investment adviser or reductions from brokerage service arrangements or reductions from other expense offset arrangements and do not represent the amount paid by the class during periods when reimbursements or reductions occur. Expenses net of fee waivers reflect expenses after reimbursement by the investment adviser but prior to reductions from brokerage service arrangements or other expense offset arrangements. Expenses net of all reductions represent the net expenses paid by the class.
Financial Highlights - Investor Class
| Six months ended
June 30, 2011 | Years ended December 31, |
| (Unaudited) | 2010 | 2009 | 2008 | 2007 | 2006 |
Selected Per-Share Data | | | | | | |
Net asset value, beginning of period | $ 11.34 | $ 11.09 | $ 8.92 | $ 10.62 | $ 10.69 | $ 10.39 |
Income from Investment Operations | | | | | | |
Net investment income (loss)E | .263 | .584 | .617 | .577 | .591 | .570 |
Net realized and unrealized gain (loss) | .207 | .474 | 2.065 | (1.677) | (.003) | .246 |
Total from investment operations | .470 | 1.058 | 2.682 | (1.100) | .588 | .816 |
Distributions from net investment income | (.005) | (.514) | (.437) | (.545) | (.518) | (.491) |
Distributions from net realized gain | (.055) | (.294) | (.075) | (.055) | (.140) | (.025) |
Total distributions | (.060) | (.808) | (.512) | (.600) | (.658) | (.516) |
Net asset value, end of period | $ 11.75 | $ 11.34 | $ 11.09 | $ 8.92 | $ 10.62 | $ 10.69 |
Total ReturnB,C,D | 4.16% | 9.63% | 30.06% | (10.34)% | 5.55% | 7.85% |
Ratios to Average Net AssetsF,H | | | | | | |
Expenses before reductions | .73%A | .74% | .77% | .76% | .80% | .82% |
Expenses net of fee waivers, if any | .73%A | .74% | .77% | .76% | .80% | .82% |
Expenses net of all reductions | .73%A | .74% | .77% | .76% | .80% | .82% |
Net investment income (loss) | 4.58%A | 5.03% | 5.95% | 5.61% | 5.41% | 5.32% |
Supplemental Data | | | | | | |
Net assets, end of period (000 omitted) | $ 746,687 | $ 628,706 | $ 475,890 | $ 234,744 | $ 228,628 | $ 104,283 |
Portfolio turnover rateG | 273%A | 208% | 199% | 256% | 152% | 83% |
A Annualized
B Total returns for periods of less than one year are not annualized.
C Total returns do not reflect charges attributable to your insurance company's separate account. Inclusion of these charges would reduce the total returns shown.
D Total returns would have been lower if certain expenses had not been reduced during the applicable periods shown.
E Calculated based on average shares outstanding during the period.
F Fees and expenses of any underlying Fidelity Central Funds are not included in the Fund's expense ratio. The Fund indirectly bears its proportionate share of the expenses of any underlying Fidelity Central Funds.
G Amount does not include the portfolio activity of any underlying Fidelity Central Funds.
H Expense ratios reflect operating expenses of the class. Expenses before reductions do not reflect amounts reimbursed by the investment adviser or reductions from brokerage service arrangements or reductions from other expense offset arrangements and do not represent the amount paid by the class during periods when reimbursements or reductions occur. Expenses net of fee waivers reflect expenses after reimbursement by the investment adviser but prior to reductions from brokerage service arrangements or other expense offset arrangements. Expenses net of all reductions represent the net expenses paid by the class.
See accompanying notes which are an integral part of the financial statements.
Semiannual Report
Notes to Financial Statements
For the period ended June 30, 2011 (Unaudited)
1. Organization.
VIP Strategic Income Portfolio (the Fund) is a fund of Variable Insurance Products Fund V (the Trust) and is authorized to issue an unlimited number of shares. The Trust is registered under the Investment Company Act of 1940, as amended (the 1940 Act), as an open-end management investment company organized as a Massachusetts business trust. Shares of the Fund may only be purchased by insurance companies for the purpose of funding variable annuity or variable life insurance contracts. The Fund offers the following classes of shares: Initial Class shares, Service Class shares, Service Class 2 shares, and Investor Class shares. All classes have equal rights and voting privileges, except for matters affecting a single class. Investment income, realized and unrealized capital gains and losses, the common expenses of the Fund, and certain fund-level expense reductions, if any, are allocated on a pro-rata basis to each class based on the relative net assets of each class to the total net assets of the Fund. Each class differs with respect to transfer agent and distribution and service plan fees incurred. Certain expense reductions may also differ by class.
2. Investments in Fidelity Central Funds.
The Fund invests in Fidelity Central Funds, which are open-end investment companies available only to other investment companies and accounts managed by Fidelity Management & Research Company (FMR) and its affiliates. The Fund's Schedule of Investments lists each of the Fidelity Central Funds held as of period end, if any, as an investment of the Fund, but does not include the underlying holdings of each Fidelity Central Fund. As an Investing Fund, the Fund indirectly bears its proportionate share of the expenses of the underlying Fidelity Central Funds.
Based on their investment objective, each Fidelity Central Fund may invest or participate in various investment vehicles or strategies that are similar to those of the Fund. These strategies are consistent with the investment objectives of the Fund and may involve certain economic risks which may cause a decline in value of each of the Fidelity Central Funds and thus a decline in the value of the Fund. The Money Market Central Funds seek preservation of capital and current income and are managed by Fidelity Investments Money Management, Inc. (FIMM), an affiliate of FMR. The following summarizes the Fund's investment in each Fidelity Central Fund.
Fidelity Central Fund | Investment Manager | Investment Objective | Investment Practices |
Fidelity Floating Rate Central Fund | FMR Co., Inc. (FMRC) | Seeks a high level of income by normally investing in floating rate loans and other floating rate securities. | Loans & Direct Debt Instruments Repurchase Agreements Restricted Securities |
An unaudited holdings listing for the Fund, which presents direct holdings as well as the pro-rata share of any securities and other investments held indirectly through its investment in underlying non-money market Fidelity Central Funds, is available at advisor.fidelity.com. A complete unaudited list of holdings for each Fidelity Central Fund is available upon request or at the Securities and Exchange Commission (the SEC) web site at www.sec.gov. In addition, the financial statements of the Fidelity Central Funds which contain the significant accounting policies (including security valuation policies) of those funds, are available on the SEC web site or upon request.
3. Significant Accounting Policies.
The financial statements have been prepared in conformity with accounting principles generally accepted in the United States of America (GAAP), which require management to make certain estimates and assumptions at the date of the financial statements. Actual results could differ from those estimates. Subsequent events, if any, through the date that the financial statements were issued have been evaluated in the preparation of the financial statements. The following summarizes the significant accounting policies of the Fund:
Security Valuation. Investments are valued as of 4:00 p.m. Eastern time on the last calendar day of the period. The Fund uses independent pricing services approved by the Board of Trustees to value its investments. When current market prices or quotations are not readily available or reliable, valuations may be determined in good faith in accordance with procedures adopted by the Board of Trustees. Factors used in determining value may include market or security specific events, changes in interest rates and credit quality. The frequency with which these procedures are used cannot be predicted and they may be utilized to a significant extent. The value used for net asset value (NAV) calculation under these procedures may differ from published prices for the same securities.
The Fund categorizes the inputs to valuation techniques used to value its investments into a disclosure hierarchy consisting of three levels as shown below:
Level 1 - quoted prices in active markets for identical investments
Level 2 - other significant observable inputs (including quoted prices for similar investments, interest rates, prepayment speeds, etc.)
Level 3 - unobservable inputs (including the Fund's own assumptions based on the best information available)
Semiannual Report
3. Significant Accounting Policies - continued
Security Valuation - continued
Changes in valuation techniques may result in transfers in or out of an assigned level within the disclosure hierarchy. The aggregate value of investments by input level, as of June 30, 2011 for the Fund's investments, as well as a roll forward of Level 3 securities, is included at the end of the Fund's Schedule of Investments. Valuation techniques used to value the Fund's investments by major category are as follows:
Debt securities, including restricted securities, are valued based on evaluated prices received from independent pricing services or from dealers who make markets in such securities. For corporate bonds, floating rate loans, foreign government and government agency obligations, supranational obligations, U.S. government and government agency obligations and sovereign loan participations, pricing services utilize matrix pricing which considers yield or price of bonds of comparable quality, coupon, maturity and type as well as dealer supplied prices and are generally categorized as Level 2 in the hierarchy. For collateralized mortgage obligations, commercial mortgage securities and U.S. government agency mortgage securities, pricing services utilize matrix pricing which considers prepayment speed assumptions, attributes of the collateral, yield or price of bonds of comparable quality, coupon, maturity and type as well as dealer supplied prices and, accordingly, such securities are generally categorized as Level 2 in the hierarchy. The Fund invests a significant portion of its assets in below investment grade securities. The value of these securities can be more volatile due to changes in the credit quality of the issuer and is sensitive to changes in economic, market and regulatory conditions.
When independent prices are unavailable or unreliable, debt securities may be valued utilizing pricing matrices which consider similar factors that would be used by independent pricing services. These are generally categorized as Level 2 in the hierarchy but may be Level 3 depending on the circumstances.
Equity securities, including restricted securities, for which market quotations are readily available, are valued at the last reported sale price or official closing price as reported by an independent pricing service on the primary market or exchange on which they are traded and are categorized as Level 1 in the hierarchy. In the event there were no sales during the day or closing prices are not available, securities are valued at the last quoted bid price or may be valued using the last available price and are generally categorized as Level 2 in the hierarchy. For foreign equity securities, when significant market or security specific events arise, comparisons to the valuation of American Depositary Receipts (ADRs), futures contracts, Exchange-traded funds (ETFs) and certain indexes as well as quoted prices for similar securities are used and are categorized as Level 2 in the hierarchy in these circumstances. Utilizing these techniques may result in transfers between Level 1 and Level 2. For restricted securities and private placements where observable inputs are limited, assumptions about market activity and risk are used and are categorized as Level 3 in the hierarchy.
Futures contracts are valued at the settlement price established each day by the board of trade or exchange on which they are traded and are categorized as Level 1 in the hierarchy. Investments in open-end mutual funds, including the Fidelity Central Funds, are valued at their closing net asset value each business day and are categorized as Level 1 in the hierarchy.
Foreign Currency. The Fund may use foreign currency contracts to facilitate transactions in foreign-denominated securities. Gains and losses from these transactions may arise from changes in the value of the foreign currency or if the counterparties do not perform under the contracts' terms.
Foreign-denominated assets, including investment securities, and liabilities are translated into U.S. dollars at the exchange rate at period end. Purchases and sales of investment securities, income and dividends received and expenses denominated in foreign currencies are translated into U.S. dollars at the exchange rate in effect on the transaction date.
The effects of exchange rate fluctuations on investments are included with the net realized and unrealized gain (loss) on investment securities. Other foreign currency transactions resulting in realized and unrealized gain (loss) are disclosed separately.
Investment Transactions and Income. For financial reporting purposes, the Fund's investment holdings and NAV include trades executed through the end of the last business day of the period. The NAV per share for processing shareholder transactions is calculated as of the close of business of the New York Stock Exchange (NYSE), normally 4:00 p.m. Eastern time and includes trades executed through the end of the prior business day. Gains and losses on securities sold are determined on the basis of identified cost. Dividend income is recorded on the ex-dividend date, except for certain dividends from foreign securities where the ex-dividend date may have passed, which are recorded as soon as the Fund is informed of the ex-dividend date. Non-cash dividends included in dividend income, if any, are recorded at the fair market value of the securities received. Distributions received on securities that represent a return of capital or capital gain are recorded as a reduction of cost of investments and/or as a realized gain. The Fund estimates the components of distributions received that may be considered return of capital distributions or capital gain distributions. Interest income and distributions from the Fidelity Central Funds are accrued as earned. Interest income includes coupon interest and amortization of premium and accretion of discount on debt securities. The principal value on inflation-indexed securities is periodically adjusted to the rate of inflation and interest is accrued based on the principal value. The adjustments to principal due to inflation are reflected as increases or decreases to interest income even though principal is not received until maturity. Investment income is recorded net of foreign taxes withheld where recovery of such taxes is uncertain.
Semiannual Report
Notes to Financial Statements (Unaudited) - continued
3. Significant Accounting Policies - continued
Investment Transactions and Income - continued
Debt obligations may be placed on non-accrual status and related interest income may be reduced by ceasing current accruals and writing off interest receivables when the collection of all or a portion of interest has become doubtful based on consistently applied procedures. A debt obligation is removed from non-accrual status when the issuer resumes interest payments or when collectability of interest is reasonably assured.
Expenses. Expenses directly attributable to a fund are charged to that fund. Expenses attributable to more than one fund are allocated among the respective funds on the basis of relative net assets or other appropriate methods. Expense estimates are accrued in the period to which they relate and adjustments are made when actual amounts are known.
Income Tax Information and Distributions to Shareholders. Each year, the Fund intends to qualify as a regulated investment company, including distributing substantially all of its taxable income and realized gains under Subchapter M of the Internal Revenue Code and filing its U.S. federal tax return. As a result, no provision for income taxes is required. A fund's federal tax return is subject to examination by the Internal Revenue Service (IRS) for a period of three years. Foreign taxes are provided for based on the Fund's understanding of the tax rules and rates that exist in the foreign markets in which it invests.
Distributions are declared and recorded on the ex-dividend date. Income dividends and capital gain distributions are declared separately for each class. Income and capital gain distributions are determined in accordance with income tax regulations, which may differ from GAAP.
Capital accounts within the financial statements are adjusted for permanent book-tax differences. These adjustments have no impact on net assets or the results of operations. Temporary book-tax differences will reverse in a subsequent period.
Book-tax differences are primarily due to swap agreements, foreign currency transactions, defaulted bonds, market discount, partnerships (including allocations from Fidelity Central Funds) and losses deferred due to wash sales and excise tax regulations.
The federal tax cost of investment securities and unrealized appreciation (depreciation) as of period end were as follows:
Gross unrealized appreciation | $ 46,651,543 |
Gross unrealized depreciation | (11,921,818) |
Net unrealized appreciation (depreciation) on securities and other investments | $ 34,729,725 |
| |
Tax cost | $ 874,959,006 |
Under the recently enacted Regulated Investment Company Modernization Act of 2010 (the Act), the Fund will be permitted to carry forward capital losses incurred in taxable years beginning after December 22, 2010 for an unlimited period. However, any losses incurred during those future taxable years will be required to be utilized prior to any losses incurred in pre-enactment taxable years, which generally expire after eight years from when they are incurred. Additionally, post-enactment capital losses that are carried forward will retain their character as either short-term or long-term capital losses rather than being considered all short-term as under previous law. The Fund's first fiscal year end subject to the Act will be December 31, 2011.
New Accounting Pronouncements. In May 2011, the Financial Accounting Standards Board (FASB) issued an update to Topic 860 - Transfers and Servicing. The update clarifies the assessment of effective control by removing the collateral provision requirement that the seller maintains at all times collateral sufficient to fund substantially all of the cost of purchasing replacement financial assets from others. This may result in a change in accounting treatment from purchases and sales to secured borrowings for certain mortgage dollar roll transactions, and therefore separate accounting of the income and expenses associated with the secured borrowings. This change would have no effect on the net assets or total return of the Fund. The update is effective for transactions entered into on or after December 15, 2011. Management is currently evaluating the potential impact of the update on the accounting for mortgage dollar roll transactions entered into by the Fund. Also in May 2011, the FASB issued Accounting Standard Update No. 2011-04, Fair Value Measurement (Topic 820) - Amendments to Achieve Common Fair Value Measurement and Disclosure Requirements in U.S. GAAP and IFRSs. The update changes the wording used to describe the requirements in GAAP for measuring fair value and for disclosing information about fair value measurements. The update is effective during interim and annual periods beginning after December 15, 2011. Management is currently evaluating the impact of the update's adoption on the Fund's financial statement disclosures.
4. Operating Policies.
Delayed Delivery Transactions and When-Issued Securities. The Fund may purchase or sell securities on a delayed delivery or when-issued basis. Payment and delivery may take place after the customary settlement period for that security. The price of the underlying securities and the date when the securities will be delivered and paid for are fixed at the time the transaction is negotiated. During the time a delayed delivery sell is outstanding, the contract is marked-to-market daily and equivalent deliverable securities are held for the transaction. The securities purchased on a delayed
Semiannual Report
4. Operating Policies - continued
Delayed Delivery Transactions and When-Issued Securities - continued
delivery or when-issued basis are identified as such in the Fund's Schedule of Investments. The Fund may receive compensation for interest forgone in the purchase of a delayed delivery or when-issued security. With respect to purchase commitments, the Fund identifies securities as segregated in its records with a value at least equal to the amount of the commitment. Losses may arise due to changes in the value of the underlying securities or if the counterparty does not perform under the contract's terms, or if the issuer does not issue the securities due to political, economic, or other factors.
Restricted Securities. The Fund may invest in securities that are subject to legal or contractual restrictions on resale. These securities generally may be resold in transactions exempt from registration or to the public if the securities are registered. Disposal of these securities may involve time-consuming negotiations and expense, and prompt sale at an acceptable price may be difficult. Information regarding restricted securities is included at the end of the Fund's Schedule of Investments.
Loans and Other Direct Debt Instruments. The Fund may invest in loans and loan participations, trade claims or other receivables. These investments may include standby financing commitments, including revolving credit facilities, that obligate the Fund to supply additional cash to the borrower on demand. Loan participations involve a risk of insolvency of the lending bank or other financial intermediary. The Fund may be contractually obligated to receive approval from the agent bank and/or borrower prior to the sale of these investments.
5. Derivative Instruments.
Risk Exposures and the Use of Derivative Instruments. The Fund used derivative instruments (derivatives), including futures contracts and swap agreements, in order to meet its investment objectives. The strategy is to use derivatives to increase returns and to manage exposure to certain risks as defined below. The success of any strategy involving derivatives depends on analysis of numerous economic factors, and if the strategies for investment do not work as intended, the Fund may not achieve its objectives.
The Fund's use of derivatives increased or decreased its exposure to the following risk:
Interest Rate Risk | Interest rate risk relates to the fluctuations in the value of interest-bearing securities due to changes in the prevailing levels of market interest rates. |
The Fund is also exposed to additional risks from investing in derivatives, such as liquidity risk and counterparty credit risk. Liquidity risk is the risk that the Fund will be unable to sell the derivative in the open market in a timely manner. Counterparty credit risk is the risk that the counterparty will not be able to fulfill its obligation to the Fund. The Fund's maximum risk of loss from counterparty credit risk is generally the aggregate unrealized appreciation and unpaid counterparty payments in excess of any collateral pledged by the counterparty to the Fund. Counterparty risk related to exchange-traded futures contracts is minimal because of the protection provided by the exchange on which they trade. Derivatives involve, to varying degrees, risk of loss in excess of the amounts recognized in the Statement of Assets and Liabilities.
Net Realized Gain (Loss) and Change in Net Unrealized Appreciation (Depreciation) on Derivatives. The table below, which reflects the impacts of derivatives on the financial performance of the Fund, summarizes the net realized gain (loss) and change in net unrealized appreciation (depreciation) for derivatives during the period.
Risk Exposure / Derivative Type | Net Realized Gain (Loss) | Change in Net Unrealized Appreciation (Depreciation) |
Interest Rate Risk | | |
Futures Contracts | $ 28,278 | $ 14,122 |
Swap Agreements | (11,622) | 8,272 |
Totals (a) | $ 16,656 | $ 22,394 |
(a) A summary of the value of derivatives by risk exposure as of period end, if any, is included at the end of the Schedule of Investments and is representative of activity for the period.
Futures Contracts. A futures contract is an agreement between two parties to buy or sell a specified underlying instrument for a fixed price at a specified future date. The Fund used futures contracts to manage its exposure to the bond market.
Upon entering into a futures contract, a fund is required to deposit either cash or securities (initial margin) with a clearing broker in an amount equal to a certain percentage of the face value of the contract. Futures contracts are marked-to-market daily and subsequent payments (variation margin) are made or received by a fund depending on the daily fluctuations in the value of the futures contracts and are recorded as unrealized appreciation or (depreciation). Realized gain or (loss) is recorded upon the expiration or closing of a futures contract.
Semiannual Report
Notes to Financial Statements (Unaudited) - continued
5. Derivative Instruments - continued
Futures Contracts - continued
The underlying face amount at value of open futures contracts at period end is shown in the Schedule of Investments under the caption "Futures Contracts." This amount reflects each contract's exposure to the underlying instrument at period end and is representative of activity for the period. Securities deposited to meet initial margin requirements are identified in the Schedule of Investments. The receivable and/or payable for the variation margin are reflected in the Statement of Assets and Liabilities.
Certain risks arise upon entering into futures contracts, including the risk that an illiquid market limits the ability to close out a futures contract prior to settlement date.
Swap Agreements. A swap agreement (swap) is a contract between two parties to exchange future cash flows at periodic intervals based on a notional principal amount.
Details of swaps open at period end, if any, are included in the Schedule of Investments under the caption "Swap Agreements." Swaps are marked-to-market daily and changes in value are recorded as unrealized appreciation or (depreciation) and reflected in the Statement of Assets and Liabilities. Any upfront premiums paid or received upon entering a swap to compensate for differences between stated terms of the agreement and prevailing market conditions (e.g. credit spreads, interest rates or other factors) are recorded as realized gain or (loss) ratably over the term of the swap. Payments are exchanged at specified intervals, accrued daily commencing with the effective date of the contract and recorded as realized gain or (loss). Realized gain or (loss) is also recorded in the event of an early termination of a swap. The net realized gain (loss) and change in net unrealized appreciation (depreciation) on swaps during the period is included in the Statement of Operations.
Risks of loss include interest rate risk. In addition, there is the risk of failure by the counterparty to perform under the terms of the agreement and lack of liquidity in the market.
Interest Rate Swaps. Interest rate swaps are agreements between counterparties to exchange cash flows, one based on a fixed rate, and the other on a floating rate. The Fund entered into interest rate swaps to manage its exposure to interest rate changes. Changes in interest rates can have an effect on both the value of bond holdings as well as the amount of interest income earned. In general, the value of bonds can fall when interest rates rise and can rise when interest rates fall.
6. Purchases and Sales of Investments.
Purchases and sales of securities, (including the Fixed-Income Central Funds), other than short-term securities and U.S. government securities, aggregated $592,551,005 and $572,388,708, respectively.
7. Fees and Other Transactions with Affiliates.
Management Fee. FMR and its affiliates provide the Fund with investment management related services for which the Fund pays a monthly management fee. The management fee is the sum of an individual fund fee rate that is based on an annual rate of .45% of the Fund's average net assets and a group fee rate that averaged .11% during the period. The group fee rate is based upon the average net assets of all the mutual funds advised by FMR. The group fee rate decreases as assets under management increase and increases as assets under management decrease. For the period, the total annualized management fee rate was .57% of the Fund's average net assets.
Distribution and Service Plan Fees. In accordance with Rule 12b-1 of the 1940 Act, the Fund has adopted separate 12b-1 Plans for each Service Class of shares. Each Service Class pays Fidelity Distributors Corporation (FDC), an affiliate of FMR, a service fee. For the period, the service fee is based on an annual rate of .10% of Service Class' average net assets and .25% of Service Class 2's average net assets.
For the period, total fees, all of which were re-allowed to insurance companies for the distribution of shares and providing shareholder support services were as follows:
Service Class | $ 566 |
Service Class 2 | 13,285 |
| $ 13,851 |
Semiannual Report
7. Fees and Other Transactions with Affiliates - continued
Transfer Agent Fees. Fidelity Investments Institutional Operations Company, Inc. (FIIOC), an affiliate of FMR, is the Fund's transfer, dividend disbursing, and shareholder servicing agent. FIIOC receives an asset-based fee with respect to each class. Each class (with the exception of Investor Class) pays a transfer agent fee, excluding out of pocket expenses, equal to an annual rate of .07% of average net assets. Investor Class pays a monthly asset-based transfer agent fee of .10% of average net assets. In addition, FIIOC receives an asset-based fee of .0045% of average net assets for typesetting, printing and mailing of shareholder reports, except proxy statements. For the period, transfer agent fees for each class, including printing and out of pocket expenses, were as follows:
Initial Class | $ 56,186 |
Service Class | 423 |
Service Class 2 | 3,961 |
Investor Class | 359,698 |
| $ 420,268 |
Accounting Fees. Fidelity Service Company, Inc.(FSC), an affiliate of FMR, maintains the Fund's accounting records. The fee is based on the level of average net assets for the month.
Brokerage Commissions. The Fund placed a portion of its portfolio transactions with brokerage firms which are affiliates of the investment adviser. The commissions paid to these affiliated firms were $47 for the period.
8. Committed Line of Credit.
The Fund participates with other funds managed by FMR or an affiliate in a $4.0 billion credit facility (the "line of credit") to be utilized for temporary or emergency purposes to fund shareholder redemptions or for other short-term liquidity purposes. The Fund has agreed to pay commitment fees on its pro-rata portion of the line of credit, which amounted to $1,410 and is reflected in Miscellaneous expenses on the Statement of Operations. During the period, there were no borrowings on this line of credit.
9. Expense Reductions.
Many of the brokers with whom FMR places trades on behalf of the Fund provided services to the Fund in addition to trade execution. These services included payments of certain expenses on behalf of the Fund totaling $210 for the period. In addition, through arrangements with the Fund's custodian, credits realized as a result of uninvested cash balances were used to reduce the Fund's expenses. During the period, these credits reduced the Fund's custody expenses by $518.
10. Distributions to Shareholders.
Distributions to shareholders of each class were as follows:
| Six months ended
June 30,
2011 | Year ended
December 31,
2010 |
From net investment income | | |
Initial Class | $ 65,962 | $ 6,766,582 |
Service Class | 503 | 51,899 |
Service Class 2 | 3,894 | 304,388 |
Investor Class | 281,836 | 26,568,912 |
Total | $ 352,195 | $ 33,691,781 |
From net realized gain | | |
Initial Class | $ 725,581 | $ 3,891,605 |
Service Class | 5,531 | 32,045 |
Service Class 2 | 42,829 | 167,108 |
Investor Class | 3,100,199 | 15,000,162 |
Total | $ 3,874,140 | $ 19,090,920 |
Semiannual Report
Notes to Financial Statements (Unaudited) - continued
11. Share Transactions.
Transactions for each class of shares were as follows:
| Shares | Dollars |
| Six months ended June 30, 2011 | Year ended December 31, 2010 | Six months ended June 30, 2011 | Year ended December 31, 2010 |
Initial Class | | | | |
Shares sold | 1,222,147 | 1,592,340 | $ 14,303,794 | $ 18,469,325 |
Reinvestment of distributions | 69,251 | 947,149 | 791,543 | 10,658,187 |
Shares redeemed | (1,280,966) | (3,923,967) | (14,802,951) | (45,593,051) |
Net increase (decrease) | 10,432 | (1,384,478) | $ 292,386 | $ (16,465,539) |
Service Class | | | | |
Shares sold | - | - | $ - | $ - |
Reinvestment of distributions | 528 | 7,469 | 6,034 | 83,944 |
Shares redeemed | (14,757) | (72,817) | (171,273) | (841,352) |
Net increase (decrease) | (14,229) | (65,348) | $ (165,239) | $ (757,408) |
Service Class 2 | | | | |
Shares sold | 622,472 | 652,109 | $ 7,229,839 | $ 7,619,023 |
Reinvestment of distributions | 4,098 | 41,955 | 46,723 | 471,497 |
Shares redeemed | (100,596) | (196,258) | (1,175,035) | (2,309,986) |
Net increase (decrease) | 525,974 | 497,806 | $ 6,101,527 | $ 5,780,534 |
Investor Class | | | | |
Shares sold | 8,642,065 | 12,462,396 | $ 100,525,768 | $ 145,050,130 |
Reinvestment of distributions | 296,410 | 3,700,172 | 3,382,035 | 41,569,073 |
Shares redeemed | (857,684) | (3,601,394) | (9,884,796) | (41,695,821) |
Net increase (decrease) | 8,080,791 | 12,561,174 | $ 94,023,007 | $ 144,923,382 |
12. Other.
The Fund's organizational documents provide former and current trustees and officers with a limited indemnification against liabilities arising in connection with the performance of their duties to the Fund. In the normal course of business, the Fund may also enter into contracts that provide general indemnifications. The Fund's maximum exposure under these arrangements is unknown as this would be dependent on future claims that may be made against the Fund. The risk of material loss from such claims is considered remote.
At the end of the period, FMR or its affiliates were the owners of record of 98% of the total outstanding shares of the Fund.
13. Credit Risk.
The Fund's relatively large investment in countries with limited or developing capital markets may involve greater risks than investments in more developed markets and the prices of such investments may be volatile. The yields of emerging market debt obligations reflect, among other things, perceived credit risk. The consequences of political, social or economic changes in these markets may have disruptive effects on the market prices of the Fund's investments and the income they generate, as well as the Fund's ability to repatriate such amounts.
Semiannual Report
Investment Adviser
Fidelity Management & Research Company
Boston, MA
Investment Sub-Advisers
FMR Co., Inc.
Fidelity Investments Money Management, Inc.
FIL Investments (Japan) Limited
FIL Investment Advisors
FIL Investment Advisors (U.K.) Ltd.
Fidelity Management & Research (U.K.) Inc.
Fidelity Management & Research (Japan) Inc.
Fidelity Management & Research (Hong Kong) Limited
General Distributor
Fidelity Distributors Corporation
Boston, MA
Transfer and Service Agents
Fidelity Investments Institutional Operations Company, Inc.
Boston, MA
Fidelity Service Company, Inc.
Boston, MA
Custodian
State Street Bank and Trust Company
Quincy, MA
VIPSI-SANN-0811
1.803539.107
Item 2. Code of Ethics
Not applicable.
Item 3. Audit Committee Financial Expert
Not applicable.
Item 4. Principal Accountant Fees and Services
Not applicable.
Item 5. Audit Committee of Listed Registrants
Not applicable.
Item 6. Investments
(a) Not applicable.
(b) Not applicable
Item 7. Disclosure of Proxy Voting Policies and Procedures for Closed-End Management Investment Companies
Not applicable.
Item 8. Portfolio Managers of Closed-End Management Investment Companies
Not applicable.
Item 9. Purchase of Equity Securities by Closed-End Management Investment Company and Affiliated Purchasers
Not applicable.
Item 10. Submission of Matters to a Vote of Security Holders
There were no material changes to the procedures by which shareholders may recommend nominees to the Variable Insurance Products Fund V's Board of Trustees.
Item 11. Controls and Procedures
(a)(i) The President and Treasurer and the Chief Financial Officer have concluded that the disclosure controls and procedures (as defined in Rule 30a-3(c) under the Investment Company Act) for each Fund provide reasonable assurances that material information relating to such Fund is made known to them by the appropriate persons, based on their evaluation of these controls and procedures as of a date within 90 days of the filing date of this report.
(a)(ii) There was no change in a Fund's internal control over financial reporting (as defined in Rule 30a-3(d) under the Investment Company Act) that occurred during the second fiscal quarter of the period covered by this report that has materially affected, or is reasonably likely to materially affect, a Fund's internal control over financial reporting.
Item 12. Exhibits
(a) | (1) | Not applicable. |
(a) | (2) | Certification pursuant to Rule 30a-2(a) under the Investment Company Act of 1940 (17 CFR 270.30a-2(a)) is filed and attached hereto as Exhibit 99.CERT. |
(a) | (3) | Not applicable. |
(b) | | Certification pursuant to Rule 30a-2(b) under the Investment Company Act of 1940 (17 CFR 270.30a-2(b)) is furnished and attached hereto as Exhibit 99.906CERT. |
SIGNATURES
Pursuant to the requirements of the Securities Exchange Act of 1934 and the Investment Company Act of 1940, the registrant has duly caused this report to be signed on its behalf by the undersigned, thereunto duly authorized.
Variable Insurance Products Fund V
By: | /s/John R. Hebble |
| John R. Hebble |
| President and Treasurer |
| |
Date: | August 26, 2011 |
Pursuant to the requirements of the Securities Exchange Act of 1934 and the Investment Company Act of 1940, this report has been signed below by the following persons on behalf of the registrant and in the capacities and on the dates indicated.
By: | /s/John R. Hebble |
| John R. Hebble |
| President and Treasurer |
| |
Date: | August 26, 2011 |
By: | /s/Christine Reynolds |
| Christine Reynolds |
| Chief Financial Officer |
| |
Date: | August 26, 2011 |