UNITED STATES
SECURITIES AND EXCHANGE COMMISSION
Washington, D.C. 20549
FORM N-CSR
CERTIFIED SHAREHOLDER REPORT OF REGISTERED
MANAGEMENT INVESTMENT COMPANIES
Investment Company Act file number 811-05361
Variable Insurance Products Fund V
(Exact name of registrant as specified in charter)
245 Summer St., Boston, MA 02210
(Address of principal executive offices) (Zip code)
Marc Bryant, Secretary
245 Summer St.
Boston, Massachusetts 02210
(Name and address of agent for service)
Registrant's telephone number, including area code:
617-563-7000
| |
Date of fiscal year end: | December 31 |
|
|
Date of reporting period: | June 30, 2016 |
This report on Form N-CSR relates solely to the Registrant’s VIP Asset Manager Portfolio, VIP Asset Manager: Growth Portfolio, VIP Freedom 2005 Portfolio, VIP Freedom 2010 Portfolio, VIP Freedom 2015 Portfolio, VIP Freedom 2020 Portfolio, VIP Freedom 2025 Portfolio, VIP Freedom 2030 Portfolio, VIP Freedom 2035 Portfolio, VIP Freedom 2040 Portfolio, VIP Freedom 2045 Portfolio, VIP Freedom 2050 Portfolio, VIP Freedom Income Portfolio, VIP Freedom Lifetime Income I Portfolio, VIP Freedom Lifetime Income II Portfolio, VIP Freedom Lifetime Income III Portfolio, VIP FundsManager 20% Portfolio, VIP FundsManager 50% Portfolio, VIP FundsManager 60%, VIP FundsManager 70% Portfolio, VIP FundsManager 85% Portfolio, VIP Investment Grade Bond Portfolio, VIP Investor Freedom 2005 Portfolio, VIP Investor Freedom 2010 Portfolio, VIP Investor Freedom 2015 Portfolio, VIP Investor Freedom 2020 Portfolio, VIP Investor Freedom 2025 Portfolio, VIP Investor Freedom 2030 Portfolio, VIP Investor Freedom Income Portfolio, VIP Strategic Income Portfolio and VIP Target Volatility Portfolio series (each, a “Fund” and collectively, the “Funds”).
Item 1.
Reports to Stockholders
Fidelity® Variable Insurance Products: Asset Manager Portfolio
Semi-Annual Report June 30, 2016 |
 |
Contents
To view a fund's proxy voting guidelines and proxy voting record for the 12-month period ended June 30, visit http://www.fidelity.com/proxyvotingresults or visit the Securities and Exchange Commission's (SEC) web site at http://www.sec.gov.
You may also call 1-877-208-0098 to request a free copy of the proxy voting guidelines.
Fidelity® Variable Insurance Products are separate account options which are purchased through a variable insurance contract.
Standard & Poor's, S&P and S&P 500 are registered service marks of The McGraw-Hill Companies, Inc. and have been licensed for use by Fidelity Distributors Corporation.
Other third-party marks appearing herein are the property of their respective owners.
All other marks appearing herein are registered or unregistered trademarks or service marks of FMR LLC or an affiliated company. © 2016 FMR LLC. All rights reserved.
This report and the financial statements contained herein are submitted for the general information of the shareholders of the Fund. This report is not authorized for distribution to prospective investors in the Fund unless preceded or accompanied by an effective prospectus.
A fund files its complete schedule of portfolio holdings with the SEC for the first and third quarters of each fiscal year on Form N-Q. Forms N-Q are available on the SEC’s web site at http://www.sec.gov. A fund's Forms N-Q may be reviewed and copied at the SEC’s Public Reference Room in Washington, DC. Information regarding the operation of the SEC's Public Reference Room may be obtained by calling 1-800-SEC-0330.
For a complete list of a fund's portfolio holdings, view the most recent holdings listing, semiannual report, or annual report on Fidelity's web site at http://www.fidelity.com, http://www.institutional.fidelity.com, or http://www.401k.com, as applicable.
NOT FDIC INSURED •MAY LOSE VALUE •NO BANK GUARANTEE
Neither the Fund nor Fidelity Distributors Corporation is a bank.
Investment Summary (Unaudited)
The information in the following tables is based on the combined investments of the Fund and its pro-rata share of the investments of Fidelity's Central Funds, other than the Commodity Strategy and Money Market Central Funds.
Top Five Stocks as of June 30, 2016
| | % of fund's net assets | % of fund's net assets 6 months ago |
| Apple, Inc. | 1.2 | 1.4 |
| Gilead Sciences, Inc. | 0.9 | 1.0 |
| Celgene Corp. | 0.9 | 1.1 |
| AT&T, Inc. | 0.8 | 0.0 |
| Michael Kors Holdings Ltd. | 0.8 | 0.6 |
| | 4.6 | |
Top Five Bond Issuers as of June 30, 2016
| (with maturities greater than one year) | % of fund's net assets | % of fund's net assets 6 months ago |
| U.S. Treasury Obligations | 8.8 | 7.3 |
| Fannie Mae | 5.1 | 4.6 |
| Freddie Mac | 2.9 | 1.8 |
| Ginnie Mae | 1.3 | 1.2 |
| Citigroup, Inc. | 1.0 | 1.0 |
| | 19.1 | |
Top Five Market Sectors as of June 30, 2016
| | % of fund's net assets | % of fund's net assets 6 months ago |
| Financials | 15.6 | 16.6 |
| Health Care | 10.2 | 12.8 |
| Consumer Discretionary | 7.6 | 10.9 |
| Energy | 7.3 | 4.6 |
| Information Technology | 6.9 | 10.0 |
Asset Allocation (% of fund's net assets)
| As of June 30, 2016 * |
| | Stock Class and Equity Futures** | 47.2% |
| | Bond Class | 43.0% |
| | Short-Term Class | 9.8% |

* Foreign investments - 21.3%
** Includes investment in Fidelity® Commodity Strategy Central Fund of 1.1%
| As of December 31, 2015 * |
| | Stock Class and Equity Futures** | 49.0% |
| | Bonds | 43.2% |
| | Short-Term Class | 7.8% |

* Foreign investments - 24.1%
** Includes investment in Fidelity® Commodity Strategy Central Fund of 0.4%
Asset allocations in the pie charts reflect the categorization of assets as defined in the Fund's prospectus in effect as of the time periods indicated above. Financial Statement categorizations conform to accounting standards and will differ from the pie chart. Percentages are adjusted for the effect of future contracts and swap contracts, if applicable.
An unaudited holdings listing for the Fund, which presents direct holdings as well as the pro-rata share of any securities and other investments held indirectly through its investment in underlying Fidelity Central Funds, other than the Commodity Strategy and Money Market Central Funds, is available at institutional.fidelity.com.
Percentages in the above tables are adjusted for the effect of TBA Sale Commitments.
Percentages shown as 0.0% may reflect amounts less than 0.05%.
Investments June 30, 2016 (Unaudited)
Showing Percentage of Net Assets
| Common Stocks - 32.4% | | | |
| | | Shares | Value |
| CONSUMER DISCRETIONARY - 3.9% | | | |
| Automobiles - 0.3% | | | |
| General Motors Co. | | 130,200 | $3,684,660 |
| Household Durables - 0.6% | | | |
| D.R. Horton, Inc. | | 217,800 | 6,856,344 |
| Internet & Catalog Retail - 0.5% | | | |
| Amazon.com, Inc. (a) | | 3,400 | 2,433,108 |
| JD.com, Inc. sponsored ADR (a) | | 41,000 | 870,430 |
| Priceline Group, Inc. (a) | | 600 | 749,046 |
| Vipshop Holdings Ltd. ADR (a) | | 129,400 | 1,445,398 |
| | | | 5,497,982 |
| Media - 0.0% | | | |
| ITV PLC | | 287,200 | 688,612 |
| Specialty Retail - 1.3% | | | |
| Home Depot, Inc. | | 44,400 | 5,669,436 |
| John David Group PLC | | 22,600 | 348,434 |
| Lowe's Companies, Inc. | | 75,900 | 6,009,003 |
| TJX Companies, Inc. | | 45,400 | 3,506,242 |
| | | | 15,533,115 |
| Textiles, Apparel & Luxury Goods - 1.2% | | | |
| Michael Kors Holdings Ltd. (a) | | 186,563 | 9,231,137 |
| Pandora A/S | | 32,900 | 4,480,962 |
| | | | 13,712,099 |
|
| TOTAL CONSUMER DISCRETIONARY | | | 45,972,812 |
|
| CONSUMER STAPLES - 2.9% | | | |
| Beverages - 1.7% | | | |
| Constellation Brands, Inc. Class A (sub. vtg.) | | 31,000 | 5,127,400 |
| Dr. Pepper Snapple Group, Inc. | | 27,100 | 2,618,673 |
| Molson Coors Brewing Co. Class B | | 30,100 | 3,044,013 |
| Monster Beverage Corp. | | 46,800 | 7,521,228 |
| The Coca-Cola Co. | | 34,500 | 1,563,885 |
| | | | 19,875,199 |
| Food & Staples Retailing - 0.0% | | | |
| Costco Wholesale Corp. | | 5,000 | 785,200 |
| Food Products - 0.3% | | | |
| Mead Johnson Nutrition Co. Class A | | 34,300 | 3,112,725 |
| WH Group Ltd. | | 256,500 | 203,147 |
| | | | 3,315,872 |
| Tobacco - 0.9% | | | |
| Altria Group, Inc. | | 44,100 | 3,041,136 |
| Imperial Tobacco Group PLC | | 30,203 | 1,637,993 |
| Philip Morris International, Inc. | | 30,200 | 3,071,944 |
| Reynolds American, Inc. | | 45,400 | 2,448,422 |
| | | | 10,199,495 |
|
| TOTAL CONSUMER STAPLES | | | 34,175,766 |
|
| ENERGY - 3.3% | | | |
| Oil, Gas & Consumable Fuels - 3.3% | | | |
| Anadarko Petroleum Corp. | | 28,300 | 1,506,975 |
| Chevron Corp. | | 72,000 | 7,547,760 |
| Continental Resources, Inc. (a) | | 98,900 | 4,477,203 |
| Devon Energy Corp. | | 134,100 | 4,861,125 |
| Enterprise Products Partners LP | | 33,400 | 977,284 |
| Exxon Mobil Corp. | | 98,100 | 9,195,894 |
| SM Energy Co. | | 86,700 | 2,340,900 |
| Targa Resources Corp. | | 32,000 | 1,348,480 |
| Williams Partners LP | | 186,700 | 6,467,288 |
| | | | 38,722,909 |
| FINANCIALS - 1.7% | | | |
| Banks - 0.2% | | | |
| SunTrust Banks, Inc. | | 57,500 | 2,362,100 |
| Capital Markets - 0.4% | | | |
| The Blackstone Group LP | | 166,100 | 4,076,094 |
| Consumer Finance - 0.3% | | | |
| OneMain Holdings, Inc. (a) | | 172,800 | 3,943,296 |
| Diversified Financial Services - 0.4% | | | |
| Broadcom Ltd. | | 900 | 139,860 |
| MSCI, Inc. Class A | | 42,400 | 3,269,888 |
| S&P Global, Inc. | | 15,700 | 1,683,982 |
| | | | 5,093,730 |
| Insurance - 0.2% | | | |
| Marsh & McLennan Companies, Inc. | | 30,200 | 2,067,492 |
| Real Estate Investment Trusts - 0.2% | | | |
| American Tower Corp. | | 20,100 | 2,283,561 |
|
| TOTAL FINANCIALS | | | 19,826,273 |
|
| HEALTH CARE - 7.9% | | | |
| Biotechnology - 5.5% | | | |
| AbbVie, Inc. | | 19,800 | 1,225,818 |
| Acorda Therapeutics, Inc. (a) | | 70,900 | 1,808,305 |
| Actelion Ltd. | | 25,367 | 4,271,742 |
| Alexion Pharmaceuticals, Inc. (a) | | 71,900 | 8,395,044 |
| Alnylam Pharmaceuticals, Inc. (a) | | 16,400 | 910,036 |
| Amicus Therapeutics, Inc. (a) | | 110,800 | 604,968 |
| BioMarin Pharmaceutical, Inc. (a) | | 48,300 | 3,757,740 |
| Celgene Corp. (a) | | 109,900 | 10,839,437 |
| Clovis Oncology, Inc. (a)(b) | | 16,800 | 230,496 |
| Genmab A/S (a) | | 24,300 | 4,431,038 |
| Gilead Sciences, Inc. | | 132,700 | 11,069,834 |
| Intercept Pharmaceuticals, Inc. (a) | | 24,010 | 3,425,747 |
| Medivation, Inc. (a) | | 144,700 | 8,725,410 |
| Medy-Tox, Inc. | | 2,055 | 776,799 |
| Novavax, Inc. (a)(b) | | 250,500 | 1,821,135 |
| Shire PLC | | 4,900 | 302,832 |
| TESARO, Inc. (a) | | 20,000 | 1,681,000 |
| vTv Therapeutics, Inc. Class A (a) | | 32,500 | 188,500 |
| | | | 64,465,881 |
| Health Care Equipment & Supplies - 0.1% | | | |
| Nevro Corp. (a) | | 13,000 | 958,880 |
| Novocure Ltd. (a) | | 27,300 | 318,591 |
| | | | 1,277,471 |
| Pharmaceuticals - 2.3% | | | |
| Bristol-Myers Squibb Co. | | 72,100 | 5,302,955 |
| Collegium Pharmaceutical, Inc. (a) | | 32,300 | 382,755 |
| GlaxoSmithKline PLC | | 74,200 | 1,593,446 |
| Innocoll Holdings PLC (a) | | 86,800 | 478,268 |
| Jazz Pharmaceuticals PLC (a) | | 30,100 | 4,253,431 |
| Johnson & Johnson | | 41,700 | 5,058,210 |
| Ocular Therapeutix, Inc. (a)(b) | | 178,800 | 885,060 |
| Pacira Pharmaceuticals, Inc. (a) | | 40,400 | 1,362,692 |
| Relypsa, Inc. (a)(b) | | 76,300 | 1,411,550 |
| Supernus Pharmaceuticals, Inc. (a) | | 30,600 | 623,322 |
| Valeant Pharmaceuticals International, Inc. (Canada) (a) | | 259,500 | 5,226,329 |
| | | | 26,578,018 |
|
| TOTAL HEALTH CARE | | | 92,321,370 |
|
| INDUSTRIALS - 4.4% | | | |
| Aerospace & Defense - 1.6% | | | |
| General Dynamics Corp. | | 20,800 | 2,896,192 |
| Huntington Ingalls Industries, Inc. | | 21,000 | 3,528,630 |
| Lockheed Martin Corp. | | 14,800 | 3,672,916 |
| Northrop Grumman Corp. | | 32,600 | 7,246,328 |
| TransDigm Group, Inc. (a) | | 5,300 | 1,397,557 |
| | | | 18,741,623 |
| Airlines - 2.2% | | | |
| American Airlines Group, Inc. | | 240,600 | 6,811,386 |
| Delta Air Lines, Inc. | | 162,825 | 5,931,715 |
| Norwegian Air Shuttle A/S (a)(b) | | 12,800 | 443,497 |
| Southwest Airlines Co. | | 227,200 | 8,908,512 |
| United Continental Holdings, Inc. (a) | | 100,600 | 4,128,624 |
| | | | 26,223,734 |
| Industrial Conglomerates - 0.2% | | | |
| Danaher Corp. | | 25,800 | 2,605,800 |
| Machinery - 0.3% | | | |
| Caterpillar, Inc. | | 31,700 | 2,403,177 |
| Xylem, Inc. | | 31,200 | 1,393,080 |
| | | | 3,796,257 |
| Professional Services - 0.1% | | | |
| Robert Half International, Inc. | | 14,200 | 541,872 |
|
| TOTAL INDUSTRIALS | | | 51,909,286 |
|
| INFORMATION TECHNOLOGY - 5.5% | | | |
| Internet Software & Services - 1.6% | | | |
| 58.com, Inc. ADR (a) | | 4,700 | 215,683 |
| Akamai Technologies, Inc. (a) | | 7,100 | 397,103 |
| Alibaba Group Holding Ltd. sponsored ADR (a) | | 5,800 | 461,274 |
| Alphabet, Inc. Class A | | 7,700 | 5,417,181 |
| Facebook, Inc. Class A (a) | | 56,921 | 6,504,932 |
| Tencent Holdings Ltd. | | 263,000 | 6,033,134 |
| | | | 19,029,307 |
| IT Services - 1.5% | | | |
| FleetCor Technologies, Inc. (a) | | 22,000 | 3,148,860 |
| Global Payments, Inc. | | 50,900 | 3,633,242 |
| MasterCard, Inc. Class A | | 50,900 | 4,482,254 |
| Visa, Inc. Class A | | 89,900 | 6,667,883 |
| | | | 17,932,239 |
| Semiconductors & Semiconductor Equipment - 0.7% | | | |
| NXP Semiconductors NV (a) | | 95,600 | 7,489,304 |
| Skyworks Solutions, Inc. | | 11,300 | 715,064 |
| | | | 8,204,368 |
| Software - 0.5% | | | |
| Adobe Systems, Inc. (a) | | 64,500 | 6,178,455 |
| Technology Hardware, Storage & Peripherals - 1.2% | | | |
| Apple, Inc. | | 142,000 | 13,575,200 |
| Nimble Storage, Inc. (a) | | 4,800 | 38,208 |
| | | | 13,613,408 |
|
| TOTAL INFORMATION TECHNOLOGY | | | 64,957,777 |
|
| MATERIALS - 0.2% | | | |
| Chemicals - 0.2% | | | |
| LyondellBasell Industries NV Class A | | 37,700 | 2,805,634 |
| TELECOMMUNICATION SERVICES - 1.4% | | | |
| Diversified Telecommunication Services - 1.4% | | | |
| AT&T, Inc. | | 228,900 | 9,890,769 |
| Verizon Communications, Inc. | | 114,900 | 6,416,016 |
| | | | 16,306,785 |
| UTILITIES - 1.2% | | | |
| Electric Utilities - 0.9% | | | |
| American Electric Power Co., Inc. | | 27,100 | 1,899,439 |
| Duke Energy Corp. | | 29,500 | 2,530,805 |
| Edison International | | 32,600 | 2,532,042 |
| PG&E Corp. | | 31,900 | 2,039,048 |
| PPL Corp. | | 25,800 | 973,950 |
| | | | 9,975,284 |
| Independent Power and Renewable Electricity Producers - 0.2% | | | |
| Dynegy, Inc. (a) | | 119,600 | 2,061,904 |
| Multi-Utilities - 0.1% | | | |
| Consolidated Edison, Inc. | | 20,900 | 1,681,196 |
|
| TOTAL UTILITIES | | | 13,718,384 |
|
| TOTAL COMMON STOCKS | | | |
| (Cost $304,860,149) | | | 380,716,996 |
| | | Principal Amount | Value |
|
| U.S. Treasury Obligations - 0.0% | | | |
| U.S. Treasury Bills, yield at date of purchase 0.25% to 0.35% 8/25/16 to 9/29/16 (c) | | | |
| (Cost $219,878) | | 220,000 | 219,907 |
| | | Shares | Value |
|
| Fixed-Income Funds - 44.9% | | | |
| Fidelity Emerging Markets Debt Central Fund (d) | | 636,594 | $6,289,550 |
| Fidelity Floating Rate Central Fund (d) | | 122,738 | 12,316,732 |
| Fidelity High Income Central Fund 1 (d) | | 532,345 | 50,061,731 |
| Fidelity Inflation-Protected Bond Index Central Fund (d) | | 469,718 | 48,127,330 |
| Fidelity VIP Investment Grade Central Fund (d) | | 3,768,547 | 403,799,768 |
| iShares 20+ Year Treasury Bond ETF (b) | | 53,900 | 7,486,710 |
| TOTAL FIXED-INCOME FUNDS | | | |
| (Cost $506,398,764) | | | 528,081,821 |
|
| Money Market Funds - 9.0% | | | |
| Fidelity Cash Central Fund, 0.43% (e) | | 53,860,508 | 53,860,508 |
| Fidelity Money Market Central Fund, 0.72% (e) | | 46,443,064 | 46,443,064 |
| Fidelity Securities Lending Cash Central Fund, 0.46% (e)(f) | | 4,897,445 | 4,897,445 |
| TOTAL MONEY MARKET FUNDS | | | |
| (Cost $105,201,017) | | | 105,201,017 |
|
| Equity Funds - 14.3% | | | |
| Domestic Equity Funds - 3.4% | | | |
| Fidelity Commodity Strategy Central Fund (d) | | 1,933,484 | 12,838,332 |
| Fidelity Real Estate Equity Central Fund (d) | | 109,640 | 12,700,653 |
| iShares S&P 500 Index ETF | | 68,192 | 14,368,052 |
|
| TOTAL DOMESTIC EQUITY FUNDS | | | 39,907,037 |
|
| International Equity Funds - 10.9% | | | |
| Fidelity Emerging Markets Equity Central Fund (d) | | 108,106 | 20,026,568 |
| Fidelity International Equity Central Fund (d) | | 1,524,091 | 107,783,745 |
|
| TOTAL INTERNATIONAL EQUITY FUNDS | | | 127,810,313 |
|
| TOTAL EQUITY FUNDS | | | |
| (Cost $161,448,949) | | | 167,717,350 |
| TOTAL INVESTMENT PORTFOLIO - 100.6% | | | |
| (Cost $1,078,128,757) | | | 1,181,937,091 |
| NET OTHER ASSETS (LIABILITIES) - (0.6)% | | | (6,894,882) |
| NET ASSETS - 100% | | | $1,175,042,209 |
| Futures Contracts | | | |
| | Expiration Date | Underlying Face Amount at Value | Unrealized Appreciation/(Depreciation) |
| Purchased | | | |
| Equity Index Contracts | | | |
| 89 ICE E-mini MSCI Emerging Markets Index Contracts (United States) | Sept. 2016 | 3,714,415 | $(24,649) |
The face value of futures purchased as a percentage of Net Assets is 0.3%
For the period, the average monthly underlying face amount at value for futures contracts in the aggregate was $8,539,139.
Security Type Abbreviations
ETF – Exchange-Traded Fund
Legend
(a) Non-income producing
(b) Security or a portion of the security is on loan at period end.
(c) Security or a portion of the security was pledged to cover margin requirements for futures contracts. At period end, the value of securities pledged amounted to $219,907.
(d) Affiliated fund that is generally available only to investment companies and other accounts managed by Fidelity Investments. A complete unaudited schedule of portfolio holdings for each Fidelity Central Fund is filed with the SEC for the first and third quarters of each fiscal year on Form N-Q and is available upon request or at the SEC's website at www.sec.gov. An unaudited holdings listing for the Fund, which presents direct holdings as well as the pro-rata share of securities and other investments held indirectly through its investment in underlying non-money market Fidelity Central Funds, other than the Commodity Strategy Central Fund, is available at fidelity.com and/or institutional.fidelity.com, as applicable. In addition, each Fidelity Central Fund's financial statements are available on the SEC's website or upon request.
(e) Affiliated fund that is generally available only to investment companies and other accounts managed by Fidelity Investments. The rate quoted is the annualized seven-day yield of the fund at period end. A complete unaudited listing of the fund's holdings as of its most recent quarter end is available upon request. In addition, each Fidelity Central Fund's financial statements are available on the SEC's website or upon request.
(f) Investment made with cash collateral received from securities on loan.
Affiliated Central Funds
Information regarding fiscal year to date income earned by the Fund from investments in Fidelity Central Funds is as follows:
| Fund | Income earned |
| Fidelity Cash Central Fund | $133,848 |
| Fidelity Commodity Strategy Central Fund | 0 |
| Fidelity Emerging Markets Debt Central Fund | 193,752 |
| Fidelity Emerging Markets Equity Central Fund | 184,427 |
| Fidelity Floating Rate Central Fund | 317,834 |
| Fidelity High Income Central Fund 1 | 1,920,192 |
| Fidelity Inflation-Protected Bond Index Central Fund | 3,677 |
| Fidelity International Equity Central Fund | 1,207,963 |
| Fidelity Money Market Central Fund | 54,674 |
| Fidelity Real Estate Equity Central Fund | 128,910 |
| Fidelity Securities Lending Cash Central Fund | 46,953 |
| Fidelity VIP Investment Grade Central Fund | 6,269,397 |
| Total | $10,461,627 |
Additional information regarding the Fund's fiscal year to date purchases and sales, including the ownership percentage, of the non Money Market Central Funds is as follows:
| Fund | Value, beginning of period | Purchases | Sales Proceeds | Value, end of period | % ownership, end of period |
| Fidelity Commodity Strategy Central Fund | $4,417,018 | $12,650,789 | $6,210,237 | $12,838,332 | 2.7% |
| Fidelity Emerging Markets Debt Central Fund | 5,849,849 | 225,396 | 321,676 | 6,289,550 | 5.5% |
| Fidelity Emerging Markets Equity Central Fund | 17,266,161 | 2,910,838 | 1,498,432 | 20,026,568 | 5.3% |
| Fidelity Floating Rate Central Fund | 12,262,439 | 381,122 | 643,351 | 12,316,732 | 0.8% |
| Fidelity High Income Central Fund 1 | 58,949,570 | 2,219,813 | 13,317,084 | 50,061,731 | 5.2% |
| Fidelity Inflation-Protected Bond Index Central Fund | 35,375,063 | 12,895,877 | 2,212,290 | 48,127,330 | 5.0% |
| Fidelity International Equity Central Fund | 118,004,789 | 1,934,453 | 6,295,357 | 107,783,745 | 5.3% |
| Fidelity Real Estate Equity Central Fund | 14,123,909 | 192,924 | 2,965,982 | 12,700,653 | 5.1% |
| Fidelity VIP Investment Grade Central Fund | 435,975,868 | 24,155,296 | 69,459,106 | 403,799,768 | 8.5% |
| Total | $702,224,666 | $57,566,508 | $102,923,515 | $673,944,409 | |
Investment Valuation
The following is a summary of the inputs used, as of June 30, 2016, involving the Fund's assets and liabilities carried at fair value. The inputs or methodology used for valuing securities may not be an indication of the risk associated with investing in those securities. For more information on valuation inputs, and their aggregation into the levels used below, please refer to the Investment Valuation section in the accompanying Notes to Financial Statements.
| | Valuation Inputs at Reporting Date: |
| Description | Total | Level 1 | Level 2 | Level 3 |
| Investments in Securities: | | | | |
| Equities: | | | | |
| Consumer Discretionary | $45,972,812 | $40,454,804 | $5,518,008 | $-- |
| Consumer Staples | 34,175,766 | 32,334,626 | 1,841,140 | -- |
| Energy | 38,722,909 | 38,722,909 | -- | -- |
| Financials | 19,826,273 | 19,826,273 | -- | -- |
| Health Care | 92,321,370 | 80,945,513 | 11,375,857 | -- |
| Industrials | 51,909,286 | 51,465,789 | 443,497 | -- |
| Information Technology | 64,957,777 | 58,924,643 | 6,033,134 | -- |
| Materials | 2,805,634 | 2,805,634 | -- | -- |
| Telecommunication Services | 16,306,785 | 16,306,785 | -- | -- |
| Utilities | 13,718,384 | 13,718,384 | -- | -- |
| U.S. Government and Government Agency Obligations | 219,907 | -- | 219,907 | -- |
| Fixed-Income Funds | 528,081,821 | 528,081,821 | -- | -- |
| Money Market Funds | 105,201,017 | 105,201,017 | -- | -- |
| Equity Funds | 167,717,350 | 167,717,350 | -- | -- |
| Total Investments in Securities: | $1,181,937,091 | $1,156,505,548 | $25,431,543 | $-- |
| Derivative Instruments: | | | | |
| Liabilities | | | | |
| Futures Contracts | $(24,649) | $(24,649) | $-- | $-- |
| Total Liabilities | $(24,649) | $(24,649) | $-- | $-- |
| Total Derivative Instruments: | $(24,649) | $(24,649) | $-- | $-- |
Value of Derivative Instruments
The following table is a summary of the Fund's value of derivative instruments by primary risk exposure as of June 30, 2016. For additional information on derivative instruments, please refer to the Derivative Instruments section in the accompanying Notes to Financial Statements.
| Primary Risk Exposure / Derivative Type | Value |
| | Asset | Liability |
| Equity Risk | | |
| Futures Contracts(a) | $0 | $(24,649) |
| Total Equity Risk | 0 | (24,649) |
| Total Value of Derivatives | $0 | $(24,649) |
(a) Reflects gross cumulative appreciation (depreciation) on futures contracts as presented in the Schedule of Investments. In the Statement of Assets and Liabilities, the period end daily variation margin is included in receivable or payable for daily variation margin for derivative instruments, and the net cumulative appreciation (depreciation) is included in net unrealized appreciation (depreciation).
Other Information
The information in the following tables is based on the combined investments of the Fund and its pro-rata share of the investments of Fidelity's Central Funds, other than the Commodity Strategy and Money Market Central Funds. Percentages in the below tables are adjusted for the effect of TBA Sale Commitments.
The composition of credit quality ratings as a percentage of Total Net Assets is as follows (Unaudited):
| U.S. Government and U.S. Government Agency Obligations | 18.2% |
| AAA,AA,A | 4.7% |
| BBB | 11.0% |
| BB | 5.6% |
| B | 2.7% |
| CCC,CC,C | 1.1% |
| D | 0.0% |
| Not Rated | 0.1% |
| Equities | 47.1% |
| Short-Term Investments and Net Other Assets | 9.5% |
| | 100.0% |
We have used ratings from Moody's Investors Service, Inc. Where Moody's® ratings are not available, we have used S&P® ratings. All ratings are as of the date indicated and do not reflect subsequent changes.
Percentages shown as 0.0% may reflect amounts less than 0.05%.
Distribution of investments by country or territory of incorporation, as a percentage of Total Net Assets, is as follows (Unaudited):
| United States of America | 78.7% |
| United Kingdom | 3.2% |
| Netherlands | 1.9% |
| Canada | 1.6% |
| Japan | 1.4% |
| Cayman Islands | 1.1% |
| France | 1.1% |
| Germany | 1.1% |
| Mexico | 1.1% |
| Denmark | 1.0% |
| Others (Individually Less Than 1%) | 7.8% |
| | 100.0% |
See accompanying notes which are an integral part of the financial statements.
Financial Statements
Statement of Assets and Liabilities
| | | June 30, 2016 (Unaudited) |
| Assets | | |
Investment in securities, at value (including securities loaned of $4,803,732) — See accompanying schedule:
Unaffiliated issuers (cost $325,211,148) | $402,791,665 | |
| Fidelity Central Funds (cost $752,917,609) | 779,145,426 | |
| Total Investments (cost $1,078,128,757) | | $1,181,937,091 |
| Receivable for investments sold | | 3,961,424 |
| Receivable for fund shares sold | | 69,852 |
| Dividends receivable | | 192,704 |
| Distributions receivable from Fidelity Central Funds | | 27,595 |
| Receivable for daily variation margin for derivative instruments | | 40,050 |
| Other receivables | | 43,746 |
| Total assets | | 1,186,272,462 |
| Liabilities | | |
| Payable for investments purchased | $5,076,552 | |
| Payable for fund shares redeemed | 567,653 | |
| Accrued management fee | 490,270 | |
| Distribution and service plan fees payable | 5,267 | |
| Other affiliated payables | 120,598 | |
| Other payables and accrued expenses | 72,468 | |
| Collateral on securities loaned, at value | 4,897,445 | |
| Total liabilities | | 11,230,253 |
| Net Assets | | $1,175,042,209 |
| Net Assets consist of: | | |
| Paid in capital | | $1,064,620,924 |
| Undistributed net investment income | | 9,167,029 |
| Accumulated undistributed net realized gain (loss) on investments and foreign currency transactions | | (2,528,520) |
| Net unrealized appreciation (depreciation) on investments and assets and liabilities in foreign currencies | | 103,782,776 |
| Net Assets | | $1,175,042,209 |
| Initial Class: | | |
| Net Asset Value, offering price and redemption price per share ($956,964,168 ÷ 63,473,868 shares) | | $15.08 |
| Service Class: | | |
| Net Asset Value, offering price and redemption price per share ($5,415,535 ÷ 362,162 shares) | | $14.95 |
| Service Class 2: | | |
| Net Asset Value, offering price and redemption price per share ($22,967,426 ÷ 1,557,737 shares) | | $14.74 |
| Investor Class: | | |
| Net Asset Value, offering price and redemption price per share ($189,695,080 ÷ 12,655,217 shares) | | $14.99 |
See accompanying notes which are an integral part of the financial statements.
Statement of Operations
| | | Six months ended June 30, 2016 (Unaudited) |
| Investment Income | | |
| Dividends | | $2,475,435 |
| Interest | | 1,205 |
| Income from Fidelity Central Funds | | 10,461,627 |
| Total income | | 12,938,267 |
| Expenses | | |
| Management fee | $2,939,112 | |
| Transfer agent fees | 464,221 | |
| Distribution and service plan fees | 31,804 | |
| Accounting and security lending fees | 243,160 | |
| Custodian fees and expenses | 8,964 | |
| Independent trustees' fees and expenses | 2,739 | |
| Depreciation in deferred trustee compensation account | (91) | |
| Audit | 29,340 | |
| Legal | 1,994 | |
| Miscellaneous | 5,375 | |
| Total expenses before reductions | 3,726,618 | |
| Expense reductions | (11,084) | 3,715,534 |
| Net investment income (loss) | | 9,222,733 |
| Realized and Unrealized Gain (Loss) | | |
| Net realized gain (loss) on: | | |
| Investment securities: | | |
| Unaffiliated issuers | 10,587,840 | |
| Fidelity Central Funds | (3,788,230) | |
| Foreign currency transactions | 115,325 | |
| Futures contracts | 899,962 | |
| Capital gain distributions from Fidelity Central Funds | 4,076,338 | |
| Total net realized gain (loss) | | 11,891,235 |
Change in net unrealized appreciation (depreciation) on:
Investment securities | (22,133,368) | |
| Assets and liabilities in foreign currencies | (5,510) | |
| Futures contracts | (226,058) | |
| Total change in net unrealized appreciation (depreciation) | | (22,364,936) |
| Net gain (loss) | | (10,473,701) |
| Net increase (decrease) in net assets resulting from operations | | $(1,250,968) |
See accompanying notes which are an integral part of the financial statements.
Statement of Changes in Net Assets
| | Six months ended June 30, 2016 (Unaudited) | Year ended December 31, 2015 |
| Increase (Decrease) in Net Assets | | |
| Operations | | |
| Net investment income (loss) | $9,222,733 | $21,404,145 |
| Net realized gain (loss) | 11,891,235 | 30,934,190 |
| Change in net unrealized appreciation (depreciation) | (22,364,936) | (48,766,137) |
| Net increase (decrease) in net assets resulting from operations | (1,250,968) | 3,572,198 |
| Distributions to shareholders from net investment income | – | (20,099,593) |
| Distributions to shareholders from net realized gain | (48,752,896) | (90,567,976) |
| Total distributions | (48,752,896) | (110,667,569) |
| Share transactions - net increase (decrease) | (5,531,937) | 4,619,610 |
| Total increase (decrease) in net assets | (55,535,801) | (102,475,761) |
| Net Assets | | |
| Beginning of period | 1,230,578,010 | 1,333,053,771 |
| End of period | $1,175,042,209 | $1,230,578,010 |
| Other Information | | |
| Undistributed net investment income end of period | $9,167,029 | $– |
| Distributions in excess of net investment income end of period | $– | $(55,704) |
See accompanying notes which are an integral part of the financial statements.
Financial Highlights — VIP Asset Manager Portfolio Initial Class
| | Six months ended (Unaudited) June 30, | Years ended December 31, | | | | |
| | 2016 | 2015 | 2014 | 2013 | 2012 | 2011 |
| Selected Per–Share Data | | | | | | |
| Net asset value, beginning of period | $15.76 | $17.15 | $17.24 | $15.17 | $13.80 | $14.54 |
| Income from Investment Operations | | | | | | |
| Net investment income (loss)A | .12 | .27 | .27 | .23 | .23 | .28 |
| Net realized and unrealized gain (loss) | (.17) | (.22) | .72 | 2.15 | 1.49 | (.66) |
| Total from investment operations | (.05) | .05 | .99 | 2.38 | 1.72 | (.38) |
| Distributions from net investment income | – | (.26) | (.27) | (.26) | (.24) | (.29) |
| Distributions from net realized gain | (.63) | (1.17) | (.81) | (.04) | (.11) | (.07) |
| Total distributions | (.63) | (1.44)B | (1.08) | (.31)C | (.35) | (.36) |
| Net asset value, end of period | $15.08 | $15.76 | $17.15 | $17.24 | $15.17 | $13.80 |
| Total ReturnD,E,F | .01% | .14% | 5.83% | 15.71% | 12.48% | (2.56)% |
| Ratios to Average Net AssetsG,H | | | | | | |
| Expenses before reductions | .61%I | .62% | .61% | .62% | .63% | .63% |
| Expenses net of fee waivers, if any | .61%I | .62% | .61% | .62% | .63% | .63% |
| Expenses net of all reductions | .61%I | .61% | .61% | .61% | .62% | .62% |
| Net investment income (loss) | 1.58%I | 1.65% | 1.54% | 1.40% | 1.57% | 1.91% |
| Supplemental Data | | | | | | |
| Net assets, end of period (000 omitted) | $956,964 | $1,008,018 | $1,117,675 | $1,160,093 | $1,114,021 | $1,108,494 |
| Portfolio turnover rateJ | 51%I | 39% | 30% | 41% | 47% | 56% |
A Calculated based on average shares outstanding during the period.
B Total distributions of $1.44 per share is comprised of distributions from net investment income of $.263 and distributions from net realized gain of $1.174 per share.
C Total distributions of $.31 per share is comprised of distributions from net investment income of $.264 and distributions from net realized gain of $.041 per share.
D Total returns for periods of less than one year are not annualized.
E Total returns do not reflect charges attributable to your insurance company's separate account. Inclusion of these charges would reduce the total returns shown.
F Total returns would have been lower if certain expenses had not been reduced during the applicable periods shown.
G Fees and expenses of any underlying Fidelity Central Funds are not included in the Fund's expense ratio. The Fund indirectly bears its proportionate share of the expenses of any underlying Fidelity Central Funds. Based on their most recent shareholder report date, the expenses of any underlying non-money market Fidelity Central Funds ranged from less than .005% to .10%.
H Expense ratios reflect operating expenses of the class. Expenses before reductions do not reflect amounts reimbursed by the investment adviser or reductions from brokerage service arrangements or reductions from other expense offset arrangements and do not represent the amount paid by the class during periods when reimbursements or reductions occur. Expenses net of fee waivers reflect expenses after reimbursement by the investment adviser but prior to reductions from brokerage service arrangements or other expense offset arrangements. Expenses net of all reductions represent the net expenses paid by the class.
I Annualized
J Amount does not include the portfolio activity of any underlying Fidelity Central Funds.
See accompanying notes which are an integral part of the financial statements.
Financial Highlights — VIP Asset Manager Portfolio Service Class
| | Six months ended (Unaudited) June 30, | Years ended December 31, | | | | |
| | 2016 | 2015 | 2014 | 2013 | 2012 | 2011 |
| Selected Per–Share Data | | | | | | |
| Net asset value, beginning of period | $15.64 | $17.03 | $17.13 | $15.08 | $13.71 | $14.45 |
| Income from Investment Operations | | | | | | |
| Net investment income (loss)A | .11 | .25 | .25 | .21 | .21 | .26 |
| Net realized and unrealized gain (loss) | (.17) | (.22) | .71 | 2.13 | 1.49 | (.65) |
| Total from investment operations | (.06) | .03 | .96 | 2.34 | 1.70 | (.39) |
| Distributions from net investment income | – | (.24) | (.25) | (.24) | (.22) | (.28) |
| Distributions from net realized gain | (.63) | (1.17) | (.81) | (.04) | (.11) | (.07) |
| Total distributions | (.63) | (1.42)B | (1.06) | (.29)C | (.33) | (.35) |
| Net asset value, end of period | $14.95 | $15.64 | $17.03 | $17.13 | $15.08 | $13.71 |
| Total ReturnD,E,F | (.05)% | .03% | 5.69% | 15.53% | 12.43% | (2.69)% |
| Ratios to Average Net AssetsG,H | | | | | | |
| Expenses before reductions | .71%I | .72% | .73% | .74% | .74% | .75% |
| Expenses net of fee waivers, if any | .71%I | .72% | .73% | .73% | .74% | .74% |
| Expenses net of all reductions | .71%I | .72% | .73% | .73% | .73% | .74% |
| Net investment income (loss) | 1.48%I | 1.54% | 1.43% | 1.28% | 1.45% | 1.79% |
| Supplemental Data | | | | | | |
| Net assets, end of period (000 omitted) | $5,416 | $5,806 | $6,990 | $7,970 | $8,429 | $8,042 |
| Portfolio turnover rateJ | 51%I | 39% | 30% | 41% | 47% | 56% |
A Calculated based on average shares outstanding during the period.
B Total distributions of $1.42 per share is comprised of distributions from net investment income of $.244 and distributions from net realized gain of $1.174 per share.
C Total distributions of $.29 per share is comprised of distributions from net investment income of $.244 and distributions from net realized gain of $.041 per share.
D Total returns for periods of less than one year are not annualized.
E Total returns do not reflect charges attributable to your insurance company's separate account. Inclusion of these charges would reduce the total returns shown.
F Total returns would have been lower if certain expenses had not been reduced during the applicable periods shown.
G Fees and expenses of any underlying Fidelity Central Funds are not included in the Fund's expense ratio. The Fund indirectly bears its proportionate share of the expenses of any underlying Fidelity Central Funds. Based on their most recent shareholder report date, the expenses of any underlying non-money market Fidelity Central Funds ranged from less than .005% to .10%.
H Expense ratios reflect operating expenses of the class. Expenses before reductions do not reflect amounts reimbursed by the investment adviser or reductions from brokerage service arrangements or reductions from other expense offset arrangements and do not represent the amount paid by the class during periods when reimbursements or reductions occur. Expenses net of fee waivers reflect expenses after reimbursement by the investment adviser but prior to reductions from brokerage service arrangements or other expense offset arrangements. Expenses net of all reductions represent the net expenses paid by the class.
I Annualized
J Amount does not include the portfolio activity of any underlying Fidelity Central Funds.
See accompanying notes which are an integral part of the financial statements.
Financial Highlights — VIP Asset Manager Portfolio Service Class 2
| | Six months ended (Unaudited) June 30, | Years ended December 31, | | | | |
| | 2016 | 2015 | 2014 | 2013 | 2012 | 2011 |
| Selected Per–Share Data | | | | | | |
| Net asset value, beginning of period | $15.45 | $16.83 | $16.94 | $14.92 | $13.57 | $14.30 |
| Income from Investment Operations | | | | | | |
| Net investment income (loss)A | .10 | .23 | .22 | .18 | .19 | .24 |
| Net realized and unrealized gain (loss) | (.18) | (.21) | .70 | 2.10 | 1.47 | (.65) |
| Total from investment operations | (.08) | .02 | .92 | 2.28 | 1.66 | (.41) |
| Distributions from net investment income | – | (.22) | (.22) | (.22) | (.19) | (.25) |
| Distributions from net realized gain | (.63) | (1.17) | (.81) | (.04) | (.11) | (.07) |
| Total distributions | (.63) | (1.40)B | (1.03) | (.26) | (.31)C | (.32) |
| Net asset value, end of period | $14.74 | $15.45 | $16.83 | $16.94 | $14.92 | $13.57 |
| Total ReturnD,E,F | (.19)% | (.06)% | 5.54% | 15.34% | 12.24% | (2.82)% |
| Ratios to Average Net AssetsG,H | | | | | | |
| Expenses before reductions | .86%I | .87% | .88% | .88% | .89% | .90% |
| Expenses net of fee waivers, if any | .86%I | .87% | .88% | .88% | .89% | .89% |
| Expenses net of all reductions | .86%I | .87% | .87% | .88% | .88% | .89% |
| Net investment income (loss) | 1.34%I | 1.39% | 1.28% | 1.14% | 1.30% | 1.64% |
| Supplemental Data | | | | | | |
| Net assets, end of period (000 omitted) | $22,967 | $24,520 | $28,230 | $31,119 | $29,966 | $32,508 |
| Portfolio turnover rateJ | 51%I | 39% | 30% | 41% | 47% | 56% |
A Calculated based on average shares outstanding during the period.
B Total distributions of $1.40 per share is comprised of distributions from net investment income of $.221 and distributions from net realized gain of $1.174 per share.
C Total distributions of $.31 per share is comprised of distributions from net investment income of $.194 and distributions from net realized gain of $.113 per share.
D Total returns for periods of less than one year are not annualized.
E Total returns do not reflect charges attributable to your insurance company's separate account. Inclusion of these charges would reduce the total returns shown.
F Total returns would have been lower if certain expenses had not been reduced during the applicable periods shown.
G Fees and expenses of any underlying Fidelity Central Funds are not included in the Fund's expense ratio. The Fund indirectly bears its proportionate share of the expenses of any underlying Fidelity Central Funds. Based on their most recent shareholder report date, the expenses of any underlying non-money market Fidelity Central Funds ranged from less than .005% to .10%.
H Expense ratios reflect operating expenses of the class. Expenses before reductions do not reflect amounts reimbursed by the investment adviser or reductions from brokerage service arrangements or reductions from other expense offset arrangements and do not represent the amount paid by the class during periods when reimbursements or reductions occur. Expenses net of fee waivers reflect expenses after reimbursement by the investment adviser but prior to reductions from brokerage service arrangements or other expense offset arrangements. Expenses net of all reductions represent the net expenses paid by the class.
I Annualized
J Amount does not include the portfolio activity of any underlying Fidelity Central Funds.
See accompanying notes which are an integral part of the financial statements.
Financial Highlights — VIP Asset Manager Portfolio Investor Class
| | Six months ended (Unaudited) June 30, | Years ended December 31, | | | | |
| | 2016 | 2015 | 2014 | 2013 | 2012 | 2011 |
| Selected Per–Share Data | | | | | | |
| Net asset value, beginning of period | $15.68 | $17.07 | $17.17 | $15.11 | $13.74 | $14.49 |
| Income from Investment Operations | | | | | | |
| Net investment income (loss)A | .11 | .26 | .25 | .21 | .22 | .27 |
| Net realized and unrealized gain (loss) | (.17) | (.22) | .72 | 2.14 | 1.49 | (.67) |
| Total from investment operations | (.06) | .04 | .97 | 2.35 | 1.71 | (.40) |
| Distributions from net investment income | – | (.25) | (.26) | (.25) | (.22) | (.28) |
| Distributions from net realized gain | (.63) | (1.17) | (.81) | (.04) | (.11) | (.07) |
| Total distributions | (.63) | (1.43)B | (1.07) | (.29) | (.34)C | (.35) |
| Net asset value, end of period | $14.99 | $15.68 | $17.07 | $17.17 | $15.11 | $13.74 |
| Total ReturnD,E,F | (.05)% | .07% | 5.73% | 15.62% | 12.44% | (2.72)% |
| Ratios to Average Net AssetsG,H | | | | | | |
| Expenses before reductions | .70%I | .70% | .70% | .71% | .71% | .71% |
| Expenses net of fee waivers, if any | .69%I | .70% | .70% | .70% | .71% | .71% |
| Expenses net of all reductions | .69%I | .69% | .69% | .70% | .70% | .70% |
| Net investment income (loss) | 1.50%I | 1.57% | 1.46% | 1.31% | 1.48% | 1.82% |
| Supplemental Data | | | | | | |
| Net assets, end of period (000 omitted) | $189,695 | $192,234 | $180,160 | $138,902 | $111,985 | $103,290 |
| Portfolio turnover rateJ | 51%I | 39% | 30% | 41% | 47% | 56% |
A Calculated based on average shares outstanding during the period.
B Total distributions of $1.43 per share is comprised of distributions from net investment income of $.251 and distributions from net realized gain of $1.174 per share.
C Total distributions of $.34 per share is comprised of distributions from net investment income of $.223 and distributions from net realized gain of $.113 per share.
D Total returns for periods of less than one year are not annualized.
E Total returns do not reflect charges attributable to your insurance company's separate account. Inclusion of these charges would reduce the total returns shown.
F Total returns would have been lower if certain expenses had not been reduced during the applicable periods shown.
G Fees and expenses of any underlying Fidelity Central Funds are not included in the Fund's expense ratio. The Fund indirectly bears its proportionate share of the expenses of any underlying Fidelity Central Funds. Based on their most recent shareholder report date, the expenses of any underlying non-money market Fidelity Central Funds ranged from less than .005% to .10%.
H Expense ratios reflect operating expenses of the class. Expenses before reductions do not reflect amounts reimbursed by the investment adviser or reductions from brokerage service arrangements or reductions from other expense offset arrangements and do not represent the amount paid by the class during periods when reimbursements or reductions occur. Expenses net of fee waivers reflect expenses after reimbursement by the investment adviser but prior to reductions from brokerage service arrangements or other expense offset arrangements. Expenses net of all reductions represent the net expenses paid by the class.
I Annualized
J Amount does not include the portfolio activity of any underlying Fidelity Central Funds.
See accompanying notes which are an integral part of the financial statements.
Notes to Financial Statements (Unaudited)
For the period ended June 30, 2016
1. Organization.
VIP Asset Manager Portfolio (the Fund) is a fund of Variable Insurance Products Fund V (the Trust) and is authorized to issue an unlimited number of shares. The Trust is registered under the Investment Company Act of 1940, as amended (the 1940 Act), as an open-end management investment company organized as a Massachusetts business trust. Shares of the Fund may only be purchased by insurance companies for the purpose of funding variable annuity or variable life insurance contracts. The Fund offers the following classes of shares: Initial Class shares, Service Class shares, Service Class 2 shares and Investor Class shares. All classes have equal rights and voting privileges, except for matters affecting a single class.
2. Investments in Fidelity Central Funds.
The Fund invests in Fidelity Central Funds, which are open-end investment companies generally available only to other investment companies and accounts managed by the investment adviser and its affiliates. The Fund's Schedule of Investments lists each of the Fidelity Central Funds held as of period end, as an investment of the Fund, but does not include the underlying holdings of each Fidelity Central Fund. As an Investing Fund, the Fund indirectly bears its proportionate share of the expenses of the underlying Fidelity Central Funds.
Based on its investment objective, each Fidelity Central Fund may invest or participate in various investment vehicles or strategies that are similar to those of the Fund. These strategies are consistent with the investment objectives of the Fund and may involve certain economic risks which may cause a decline in value of each of the Fidelity Central Funds and thus a decline in the value of the Fund. The following summarizes the Fund's investment in each Fidelity Central Fund.
| Fidelity Central Fund | Investment Manager | Investment Objective | Investment Practices | Expense Ratio(a) |
| Fidelity Commodity Strategy Central Fund | Geode Capital Management, LLC (Geode) | Seeks to provide investment returns that correspond to the performance of the commodities market. | Investment in commodity-related investments through a wholly-owned subsidiary organized under the laws of the Cayman Islands
Futures
Swaps | .06% |
| Fidelity Emerging Markets Debt Central Fund | FMR Co., Inc. (FMRC) | Seeks high total return by normally investing in debt securities of issuers in emerging markets and other debt investments that are tied economically to emerging markets. | Foreign Securities
Loans & Direct Debt Instruments
Restricted Securities
| .01% |
| Fidelity Emerging Markets Equity Central Fund | FMRC | Seeks capital appreciation by investing primarily in equity securities of issuers in emerging markets. | Delayed Delivery & When Issued Securities
Foreign Securities
Futures
Restricted Securities | .10% |
| Fidelity International Equity Central Fund | FMRC | Seeks capital appreciation by investing primarily in non-U.S. based common stocks, including securities of issuers located in emerging markets. | Foreign Securities
Futures
| .01% |
| Fidelity Floating Rate Central Fund | FMRC | Seeks a high level of income by normally investing in floating rate loans and other floating rate securities. | Loans & Direct Debt Instruments
Restricted Securities | Less than .005% |
| Fidelity High Income Central Fund 1 | FMRC | Seeks a high level of income and may also seek capital appreciation by investing primarily in debt securities, preferred stocks, and convertible securities, with an emphasis on lower-quality debt securities. | Delayed Delivery & When Issued Securities
Loans & Direct Debt Instruments
Restricted Securities
| Less than .005% |
| Fidelity Inflation-Protected Bond Index Central Fund | Fidelity Investment Money Management, Inc. (FIMM) | Seeks to provide investment results that correspond to the performance of the inflation-protected United States Treasury market, and may invest in derivatives. | | Less than .005% |
| Fidelity VIP Investment Grade Central Fund | FIMM | Seeks a high level of current income by normally investing in investment-grade debt securities and repurchase agreements. | Delayed Delivery & When Issued Securities
Restricted Securities
Swaps | Less than .005% |
| Fidelity Real Estate Equity Central Fund | FMRC | Seeks above-average income and long-term capital growth by investing primarily in equity securities of issuers in the real estate industry. | | .01% |
| Fidelity Money Market Central Funds | FIMM | Each fund seeks to obtain a high level of current income consistent with the preservation of capital and liquidity | Short-term investments | Less than .005% |
(a) Expenses expressed as a percentage of average net assets and are as of each underlying Central Fund's most recent annual or semi-annual shareholder report.
An unaudited holdings listing for the Fund, which presents direct holdings as well as the pro-rata share of any securities and other investments held indirectly through its investment in underlying non-money market Fidelity Central Funds, is available at institutional.fidelity.com. A complete unaudited list of holdings for each Fidelity Central Fund is available upon request or at the Securities and Exchange Commission (the SEC) website at www.sec.gov. In addition, the financial statements of the Fidelity Central Funds which contain the significant accounting policies (including investment valuation policies) of those funds are available on the SEC website or upon request.
3. Significant Accounting Policies.
The financial statements have been prepared in conformity with accounting principles generally accepted in the United States of America (GAAP), which require management to make certain estimates and assumptions at the date of the financial statements. Actual results could differ from those estimates. Subsequent events, if any, through the date that the financial statements were issued have been evaluated in the preparation of the financial statements. The following summarizes the significant accounting policies of the Fund:
Investment Valuation. Investments are valued as of 4:00 p.m. Eastern time on the last calendar day of the period. The Board of Trustees (the Board) has delegated the day to day responsibility for the valuation of the Fund's investments to the Fidelity Management & Research Company (FMR) Fair Value Committee (the Committee). In accordance with valuation policies and procedures approved by the Board, the Fund attempts to obtain prices from one or more third party pricing vendors or brokers to value its investments. When current market prices, quotations or currency exchange rates are not readily available or reliable, investments will be fair valued in good faith by the Committee, in accordance with procedures adopted by the Board. Factors used in determining fair value vary by investment type and may include market or investment specific events, changes in interest rates and credit quality. The frequency with which these procedures are used cannot be predicted and they may be utilized to a significant extent. The Committee oversees the Fund's valuation policies and procedures and reports to the Board on the Committee's activities and fair value determinations. The Board monitors the appropriateness of the procedures used in valuing the Fund's investments and ratifies the fair value determinations of the Committee.
The Fund categorizes the inputs to valuation techniques used to value its investments into a disclosure hierarchy consisting of three levels as shown below:
- Level 1 – quoted prices in active markets for identical investments
- Level 2 – other significant observable inputs (including quoted prices for similar investments, interest rates, prepayment speeds, etc.)
- Level 3 – unobservable inputs (including the Fund's own assumptions based on the best information available)
Valuation techniques used to value the Fund's investments by major category are as follows:
Equity securities, including restricted securities, for which market quotations are readily available, are valued at the last reported sale price or official closing price as reported by a third party pricing vendor on the primary market or exchange on which they are traded and are categorized as Level 1 in the hierarchy. In the event there were no sales during the day or closing prices are not available, securities are valued at the last quoted bid price or may be valued using the last available price and are generally categorized as Level 2 in the hierarchy. For foreign equity securities, when market or security specific events arise, comparisons to the valuation of American Depositary Receipts (ADRs), futures contracts, Exchange-Traded Funds (ETFs) and certain indexes as well as quoted prices for similar securities may be used and would be categorized as Level 2 in the hierarchy. Utilizing these techniques may result in transfers between Level 1 and Level 2. For equity securities, including restricted securities, where observable inputs are limited, assumptions about market activity and risk are used and these securities may be categorized as Level 3 in the hierarchy.
Debt securities, including restricted securities, are valued based on evaluated prices received from third party pricing vendors or from brokers who make markets in such securities. U.S. government and government agency obligations are valued by pricing vendors who utilize matrix pricing which considers yield or price of bonds of comparable quality, coupon, maturity and type or by broker-supplied prices. When independent prices are unavailable or unreliable, debt securities may be valued utilizing pricing methodologies which consider similar factors that would be used by third party pricing vendors. Debt securities are generally categorized as Level 2 in the hierarchy but may be Level 3 depending on the circumstances. ETFs are valued at their last sale price or official closing price as reported by a third party pricing vendor on the primary market or exchange on which they are traded and are categorized as Level 1 in the hierarchy. In the event there were no sales during the day but the exchange reports a closing bid level, ETFs are valued at the closing bid and would be categorized as Level 1 in the hierarchy. In the event there was no closing bid, ETFs may be valued by another method that the Board believes reflects fair value in accordance with the Board's fair value pricing policies and may be categorized as Level 2 in the hierarchy.
Futures contracts are valued at the settlement price established each day by the board of trade or exchange on which they are traded and are categorized as Level 1 in the hierarchy. Investments in open-end mutual funds, including the Fidelity Central Funds, are valued at their closing net asset value (NAV) each business day and are categorized as Level 1 in the hierarchy.
Changes in valuation techniques may result in transfers in or out of an assigned level within the disclosure hierarchy. The aggregate value of investments by input level as of June 30, 2016 is included at the end of the Fund's Schedule of Investments.
Foreign Currency. The Fund may use foreign currency contracts to facilitate transactions in foreign-denominated securities. Gains and losses from these transactions may arise from changes in the value of the foreign currency or if the counterparties do not perform under the contracts' terms.
Foreign-denominated assets, including investment securities, and liabilities are translated into U.S. dollars at the exchange rates at period end. Purchases and sales of investment securities, income and dividends received and expenses denominated in foreign currencies are translated into U.S. dollars at the exchange rate in effect on the transaction date.
The effects of exchange rate fluctuations on investments are included with the net realized and unrealized gain (loss) on investment securities. Other foreign currency transactions resulting in realized and unrealized gain (loss) are disclosed separately.
Investment Transactions and Income. For financial reporting purposes, the Fund's investment holdings and NAV include trades executed through the end of the last business day of the period. The NAV per share for processing shareholder transactions is calculated as of the close of business of the New York Stock Exchange (NYSE), normally 4:00 p.m. Eastern time and includes trades executed through the end of the prior business day. Gains and losses on securities sold are determined on the basis of identified cost and may include proceeds received from litigation. Dividend income is recorded on the ex-dividend date, except for certain dividends from foreign securities where the ex-dividend date may have passed, which are recorded as soon as the Fund is informed of the ex-dividend date. Non-cash dividends included in dividend income, if any, are recorded at the fair market value of the securities received. Income and capital gain distributions from Fidelity Central Funds, if any, are recorded on the ex-dividend date. Distributions received on securities that represent a return of capital or capital gain are recorded as a reduction of cost of investments and/or as a realized gain. Subsequent to ex-dividend date the Fund determines the components of these distributions, based upon receipt of tax filings or other correspondence relating to the underlying investment. Interest income is accrued as earned and includes coupon interest and amortization of premium and accretion of discount on debt securities as applicable. Investment income is recorded net of foreign taxes withheld where recovery of such taxes is uncertain.
Class Allocations and Expenses. Investment income, realized and unrealized capital gains and losses, common expenses of the Fund, and certain fund-level expense reductions, if any, are allocated daily on a pro-rata basis to each class based on the relative net assets of each class to the total net assets of the Fund. Each class differs with respect to transfer agent and distribution and service plan fees incurred. Certain expense reductions may also differ by class. For the reporting period, the allocated portion of income and expenses to each class as a percent of its average net assets may vary due to the timing of recording these transactions in relation to fluctuating net assets of the classes. Expenses directly attributable to a fund are charged to that fund. Expenses attributable to more than one fund are allocated among the respective funds on the basis of relative net assets or other appropriate methods. Expense estimates are accrued in the period to which they relate and adjustments are made when actual amounts are known. Expenses included in the accompanying financial statements reflect the expenses of the Fund and do not include any expenses of the Fidelity Central Funds. Although not included in the Fund's expenses, the Fund indirectly bears its proportionate share of the Fidelity Central Funds' expenses through the impact of these expenses on each Fidelity Central Fund's NAV.
Deferred Trustee Compensation. Under a Deferred Compensation Plan (the Plan), independent Trustees may elect to defer receipt of a portion of their annual compensation. Deferred amounts are invested in a cross-section of Fidelity funds, are marked-to-market and remain in the Fund until distributed in accordance with the Plan. The investment of deferred amounts and the offsetting payable to the Trustees are included in the accompanying Statement of Assets and Liabilities.
Income Tax Information and Distributions to Shareholders. Each year, the Fund intends to qualify as a regulated investment company under Subchapter M of the Internal Revenue Code, including distributing substantially all of its taxable income and realized gains. As a result, no provision for U.S. Federal income taxes is required. The Fund files a U.S. federal tax return, in addition to state and local tax returns as required. The Fund's federal income tax returns are subject to examination by the Internal Revenue Service (IRS) for a period of three fiscal years after they are filed. State and local tax returns may be subject to examination for an additional fiscal year depending on the jurisdiction. Foreign taxes are provided for based on the Fund's understanding of the tax rules and rates that exist in the foreign markets in which it invests.
Distributions are declared and recorded on the ex-dividend date. Income dividends and capital gain distributions are declared separately for each class. Income and capital gain distributions are determined in accordance with income tax regulations, which may differ from GAAP.
Capital accounts within the financial statements are adjusted for permanent book-tax differences. These adjustments have no impact on net assets or the results of operations. Capital accounts are not adjusted for temporary book-tax differences which will reverse in a subsequent period.
Book-tax differences are primarily due to the short-term gain distributions from the Fidelity Central Funds, futures contracts, foreign currency transactions, market discount, partnerships (including allocations from Fidelity Central Funds), deferred trustees compensation and losses deferred due to wash sales and excise tax regulations.
The federal tax cost of investment securities and unrealized appreciation (depreciation) as of period end were as follows:
| Gross unrealized appreciation | $140,119,821 |
| Gross unrealized depreciation | (31,683,475) |
| Net unrealized appreciation (depreciation) on securities | $108,436,346 |
| Tax cost | $1,073,500,745 |
4. Derivative Instruments.
Risk Exposures and the Use of Derivative Instruments. The Fund's investment objective allows the Fund to enter into various types of derivative contracts, including futures contracts. Derivatives are investments whose value is primarily derived from underlying assets, indices or reference rates and may be transacted on an exchange or over-the-counter (OTC). Derivatives may involve a future commitment to buy or sell a specified asset based on specified terms, to exchange future cash flows at periodic intervals based on a notional principal amount, or for one party to make one or more payments upon the occurrence of specified events in exchange for periodic payments from the other party.
The Fund used derivatives to increase returns and to manage exposure to certain risks as defined below. The success of any strategy involving derivatives depends on analysis of numerous economic factors, and if the strategies for investment do not work as intended, the Fund may not achieve its objectives.
The Fund's use of derivatives increased or decreased its exposure to the following risk:
| Equity Risk | Equity risk relates to the fluctuations in the value of financial instruments as a result of changes in market prices (other than those arising from interest rate risk or foreign exchange risk), whether caused by factors specific to an individual investment, its issuer, or all factors affecting all instruments traded in a market or market segment.
|
The Fund is also exposed to additional risks from investing in derivatives, such as liquidity risk and counterparty credit risk. Liquidity risk is the risk that the Fund will be unable to close out the derivative in the open market in a timely manner. Counterparty credit risk is the risk that the counterparty will not be able to fulfill its obligation to the Fund. Counterparty credit risk related to exchange-traded futures contracts may be mitigated by the protection provided by the exchange on which they trade.
Investing in derivatives may involve greater risks than investing in the underlying assets directly and, to varying degrees, may involve risk of loss in excess of any initial investment and collateral received and amounts recognized in the Statement of Assets and Liabilities. In addition, there may be the risk that the change in value of the derivative contract does not correspond to the change in value of the underlying instrument.
Futures Contracts. A futures contract is an agreement between two parties to buy or sell a specified underlying instrument for a fixed price at a specified future date. The Fund used futures contracts to manage its exposure to the stock market.
Upon entering into a futures contract, a fund is required to deposit either cash or securities (initial margin) with a clearing broker in an amount equal to a certain percentage of the face value of the contract. Futures contracts are marked-to-market daily and subsequent daily payments (variation margin) are made or received by a fund depending on the daily fluctuations in the value of the futures contracts and are recorded as unrealized appreciation or (depreciation). This receivable and/or payable, if any, is included in daily variation margin for derivative instruments in the Statement of Assets and Liabilities. Realized gain or (loss) is recorded upon the expiration or closing of a futures contract.
Any open futures contracts at period end are presented in the Schedule of Investments under the caption "Futures Contracts". The underlying face amount at value reflects each contract's exposure to the underlying instrument or index at period end. Securities deposited to meet initial margin requirements are identified in the Schedule of Investments.
During the period the Fund recognized net realized gain (loss) of $899,962 and a change in net unrealized appreciation (depreciation) of $(226,058) related to its investment in futures contracts. These amounts are included in the Statement of Operations.
5. Purchases and Sales of Investments.
Purchases and sales of securities (including the Equity and Fixed-Income Central Funds), other than short-term securities, aggregated $278,566,263 and $336,042,316, respectively.
6. Fees and Other Transactions with Affiliates.
Management Fee. Fidelity Management & Research Company (the investment adviser) and its affiliates provide the Fund with investment management related services for which the Fund pays a monthly management fee. The management fee is the sum of an individual fund fee rate that is based on an annual rate of .25% of the Fund's average net assets and an annualized group fee rate that averaged .25% during the period. The group fee rate is based upon the average net assets of all the mutual funds advised by the investment adviser, including any mutual funds previously advised by the investment adviser that are currently advised by Fidelity SelectCo, LLC, an affiliate of the investment adviser. The group fee rate decreases as assets under management increase and increases as assets under management decrease. For the reporting period, the total annualized management fee rate was .50% of the Fund's average net assets.
The investment adviser pays a portion of the management fees received from the Fund to the Fidelity Central Funds' investment advisers, who are also affiliates, for managing the assets of the Fidelity Central Funds.
Distribution and Service Plan Fees. In accordance with Rule 12b-1 of the 1940 Act, the Fund has adopted separate 12b-1 Plans for each Service Class of shares. Each Service Class pays Fidelity Distributors Corporation (FDC), an affiliate of the investment adviser, a service fee. For the period, the service fee is based on an annual rate of .10% of Service Class' average net assets and .25% of Service Class 2's average net assets.
For the period, total fees, all of which were re-allowed to insurance companies for the distribution of shares and providing shareholder support services, were as follows:
| Service Class | $2,726 |
| Service Class 2 | 29,078 |
| | $31,804 |
Transfer Agent Fees. Fidelity Investments Institutional Operations Company, Inc. (FIIOC), an affiliate of the investment adviser, is the Fund's transfer, dividend disbursing, and shareholder servicing agent. FIIOC receives an asset-based fee with respect to each class. Each class (with the exception of Investor Class) pays a fee for transfer agent services, typesetting and printing and mailing of shareholder reports, excluding mailing of proxy statements, equal to an annual rate of .07% ( .15% for Investor Class) of class-level average net assets. For the period, transfer agent fees for each class were as follows:
| Initial Class | $317,113 |
| Service Class | 1,799 |
| Service Class 2 | 7,677 |
| Investor Class | 137,632 |
| | $464,221 |
Accounting and Security Lending Fees. Fidelity Service Company, Inc. (FSC), an affiliate of the investment adviser, maintains the Fund's accounting records. The accounting fee is based on the level of average net assets for each month. Under a separate contract, FSC administers the security lending program. The security lending fee is based on the number and duration of lending transactions.
Brokerage Commissions. The Fund placed a portion of its portfolio transactions with brokerage firms which are affiliates of the investment adviser. Brokerage commissions are included in net realized gain (loss) and change in net unrealized appreciation (depreciation) in the Statement of Operations. The commissions paid to these affiliated firms were $4,468 for the period.
Interfund Trades. The Fund may purchase from or sell securities to other Fidelity Funds under procedures adopted by the Board. The procedures have been designed to ensure these interfund trades are executed in accordance with Rule 17a-7 of the 1940 Act. Interfund trades are included within the respective purchases and sales amounts shown in the Purchases and Sales of Investments note.
7. Committed Line of Credit.
The Fund participates with other funds managed by the investment adviser or an affiliate in a $4.25 billion credit facility (the "line of credit") to be utilized for temporary or emergency purposes to fund shareholder redemptions or for other short-term liquidity purposes. The Fund has agreed to pay commitment fees on its pro-rata portion of the line of credit, which amounted to $1,071 and is reflected in Miscellaneous expenses on the Statement of Operations. During the period, the Fund did not borrow on this line of credit.
8. Security Lending.
The Fund lends portfolio securities through a lending agent from time to time in order to earn additional income. For equity securities, a lending agent is used and may loan securities to certain qualified borrowers, including Fidelity Capital Markets (FCM), a broker-dealer affiliated with the Fund. On the settlement date of the loan, the Fund receives collateral (in the form of U.S. Treasury obligations, letters of credit and/or cash) against the loaned securities and maintains collateral in an amount not less than 100% of the market value of the loaned securities during the period of the loan. The market value of the loaned securities is determined at the close of business of the Fund and any additional required collateral is delivered to the Fund on the next business day. The Fund or borrower may terminate the loan at any time, and if the borrower defaults on its obligation to return the securities loaned because of insolvency or other reasons, the Fund may apply collateral received from the borrower against the obligation. The Fund may experience delays and costs in recovering the securities loaned. Any cash collateral received is invested in the Fidelity Securities Lending Cash Central Fund. The value of loaned securities and cash collateral at period end are disclosed on the Fund's Statement of Assets and Liabilities. At period end, there were no security loans outstanding with FCM. Security lending income represents the income earned on investing cash collateral, less rebates paid to borrowers, and any lending agent fees associated with the loan, plus any premium payments received for lending certain types of securities. Security lending income is presented in the Statement of Operations as a component of income from Fidelity Central Funds. Total security lending income during the period amounted to $46,953, including $2 from securities loaned to FCM.
9. Expense Reductions.
Commissions paid to certain brokers with whom the investment adviser, or its affiliates, places trades on behalf of the Fund include an amount in addition to trade execution, which may be rebated back to the Fund to offset certain expenses. This amount totaled $6,495 for the period. Through arrangements with the Fund's custodian, credits realized as a result of certain uninvested cash balances were used to reduce the Fund's expenses. During the period, these credits reduced the Fund's custody expenses by $161.
In addition, during the period the investment adviser reimbursed and/or waived a portion of fund-level operating expenses in the amount of $4,428.
10. Distributions to Shareholders.
Distributions to shareholders of each class were as follows:
| | Six months ended
June 30, 2016 | Year ended December 31, 2015 |
| From net investment income | | |
| Initial Class | $– | $16,635,429 |
| Service Class | – | 89,574 |
| Service Class 2 | – | 362,301 |
| Investor Class | – | 3,012,289 |
| Total | $– | $20,099,593 |
| From net realized gain | | |
| Initial Class | $39,818,517 | $75,551,716 |
| Service Class | 227,396 | 460,907 |
| Service Class 2 | 985,419 | 1,958,727 |
| Investor Class | 7,721,564 | 12,596,626 |
| Total | $48,752,896 | $90,567,976 |
11. Share Transactions.
Transactions for each class of shares were as follows:
| | Shares | Shares | Dollars | Dollars |
| | Six months ended
June 30, 2016 | Year ended December 31, 2015 | Six months ended
June 30, 2016 | Year ended December 31, 2015 |
| Initial Class | | | | |
| Shares sold | 722,013 | 1,672,902 | $10,715,051 | $27,640,893 |
| Reinvestment of distributions | 2,854,374 | 5,676,691 | 39,818,517 | 92,187,145 |
| Shares redeemed | (4,065,509) | (8,565,186) | (60,717,784) | (141,192,707) |
| Net increase (decrease) | (489,122) | (1,215,593) | $(10,184,216) | $(21,364,669) |
| Service Class | | | | |
| Shares sold | 33,131 | 45,400 | $490,748 | $750,309 |
| Reinvestment of distributions | 16,430 | 34,136 | 227,396 | 550,481 |
| Shares redeemed | (58,557) | (118,820) | (866,208) | (1,951,896) |
| Net increase (decrease) | (8,996) | (39,284) | $(148,064) | $(651,106) |
| Service Class 2 | | | | |
| Shares sold | 83,642 | 160,158 | $1,223,667 | $2,610,339 |
| Reinvestment of distributions | 72,139 | 145,682 | 985,419 | 2,321,028 |
| Shares redeemed | (185,543) | (395,476) | (2,718,561) | (6,360,083) |
| Net increase (decrease) | (29,762) | (89,636) | $(509,475) | $(1,428,716) |
| Investor Class | | | | |
| Shares sold | 545,462 | 1,787,640 | $8,099,470 | $29,509,426 |
| Reinvestment of distributions | 556,309 | 967,074 | 7,721,564 | 15,608,915 |
| Shares redeemed | (707,560) | (1,049,116) | (10,511,216) | (17,054,240) |
| Net increase (decrease) | 394,211 | 1,705,598 | $5,309,818 | $28,064,101 |
12. Other.
The Fund's organizational documents provide former and current trustees and officers with a limited indemnification against liabilities arising in connection with the performance of their duties to the Fund. In the normal course of business, the Fund may also enter into contracts that provide general indemnifications. The Fund's maximum exposure under these arrangements is unknown as this would be dependent on future claims that may be made against the Fund. The risk of material loss from such claims is considered remote.
At the end of the period, the investment adviser or its affiliates were the owners of record of 37% of the total outstanding shares of the Fund and two otherwise unaffiliated shareholders were the owners of record of 28% of the total outstanding shares of the Fund.
Shareholder Expense Example
As a shareholder of the Fund, you incur two types of costs: (1) transaction costs and (2) ongoing costs, including management fees, distribution and/or service (12b-1) fees and other Fund expenses. This Example is intended to help you understand your ongoing costs (in dollars) of investing in the Fund and to compare these costs with the ongoing costs of investing in other mutual funds.
The Example is based on an investment of $1,000 invested at the beginning of the period and held for the entire period (January 1, 2016 to June 30, 2016).
Actual Expenses
The first line of the accompanying table for each class of the Fund provides information about actual account values and actual expenses. You may use the information in this line, together with the amount you invested, to estimate the expenses that you paid over the period. Simply divide your account value by $1,000.00 (for example, an $8,600 account value divided by $1,000.00 = 8.6), then multiply the result by the number in the first line for a class of the Fund under the heading entitled "Expenses Paid During Period" to estimate the expenses you paid on your account during this period. The estimate of expenses does not include any fees or other expenses of any variable annuity or variable life insurance product. If they were, the estimate of expenses you paid during the period would be higher, and your ending account value would be lower. In addition, the Fund, as a shareholder in the underlying Fidelity Central Funds, will indirectly bear its pro-rata share of the fees and expenses incurred by the underlying Fidelity Central Funds. These fees and expenses are not included in the Fund's annualized expense ratio used to calculate the expense estimate in the table below.
Hypothetical Example for Comparison Purposes
The second line of the accompanying table for each class of the Fund provides information about hypothetical account values and hypothetical expenses based on a Class' actual expense ratio and an assumed rate of return of 5% per year before expenses, which is not the Class' actual return. The hypothetical account values and expenses may not be used to estimate the actual ending account balance or expenses you paid for the period. You may use this information to compare the ongoing costs of investing in the Fund and other funds. To do so, compare this 5% hypothetical example with the 5% hypothetical examples that appear in the shareholder reports of the other funds. The estimate of expenses does not include any fees or other expenses of any variable annuity or variable life insurance product. If they were, the estimate of expenses you paid during the period would be higher, and your ending account value would be lower. In addition, the Fund, as a shareholder in the underlying Fidelity Central Funds, will indirectly bear its pro-rata share of the fees and expenses incurred by the underlying Fidelity Central Funds. These fees and expenses are not included in the Fund's annualized expense ratio used to calculate the expense estimate in the table below.
Please note that the expenses shown in the table are meant to highlight your ongoing costs only and do not reflect any transaction costs. Therefore, the second line of the table is useful in comparing ongoing costs only, and will not help you determine the relative total costs of owning different funds.
| | Annualized Expense Ratio-A | Beginning
Account Value
January 1, 2016 | Ending
Account Value
June 30, 2016 | Expenses Paid
During Period-B
January 1, 2016
to June 30, 2016 |
| Initial Class | .61% | | | |
| Actual | | $1,000.00 | $1,000.10 | $3.03 |
| Hypothetical-C | | $1,000.00 | $1,021.83 | $3.07 |
| Service Class | .71% | | | |
| Actual | | $1,000.00 | $999.50 | $3.53 |
| Hypothetical-C | | $1,000.00 | $1,021.33 | $3.57 |
| Service Class 2 | .86% | | | |
| Actual | | $1,000.00 | $998.10 | $4.27 |
| Hypothetical-C | | $1,000.00 | $1,020.59 | $4.32 |
| Investor Class | .69% | | | |
| Actual | | $1,000.00 | $999.50 | $3.43 |
| Hypothetical-C | | $1,000.00 | $1,021.43 | $3.47 |
A Annualized expense ratio reflects expenses net of applicable fee waivers.
B Expenses are equal to each Class' annualized expense ratio, multiplied by the average account value over the period, multiplied by 182/366 (to reflect the one-half year period). The fees and expenses of the underlying Fidelity Central Funds in which the Fund invests are not included in each Class' annualized expense ratio. In addition to the expenses noted above, the Fund also indirectly bears its proportional share of the expenses of the underlying Fidelity Central Funds. Annualized expenses of the underlying non-money market Fidelity Central Funds as of their most recent fiscal half year ranged from less than .005% to .10%.
C 5% return per year before expenses

VIPAM-SANN-0816
1.705701.118
Fidelity® Variable Insurance Products: Strategic Income Portfolio
Semi-Annual Report June 30, 2016 |
|
Contents
To view a fund's proxy voting guidelines and proxy voting record for the 12-month period ended June 30, visit http://www.fidelity.com/proxyvotingresults or visit the Securities and Exchange Commission's (SEC) web site at http://www.sec.gov.
You may also call 1-877-208-0098 to request a free copy of the proxy voting guidelines.
Fidelity® Variable Insurance Products are separate account options which are purchased through a variable insurance contract.
Standard & Poor's, S&P and S&P 500 are registered service marks of The McGraw-Hill Companies, Inc. and have been licensed for use by Fidelity Distributors Corporation.
Other third-party marks appearing herein are the property of their respective owners.
All other marks appearing herein are registered or unregistered trademarks or service marks of FMR LLC or an affiliated company. © 2016 FMR LLC. All rights reserved.
This report and the financial statements contained herein are submitted for the general information of the shareholders of the Fund. This report is not authorized for distribution to prospective investors in the Fund unless preceded or accompanied by an effective prospectus.
A fund files its complete schedule of portfolio holdings with the SEC for the first and third quarters of each fiscal year on Form N-Q. Forms N-Q are available on the SEC’s web site at http://www.sec.gov. A fund's Forms N-Q may be reviewed and copied at the SEC’s Public Reference Room in Washington, DC. Information regarding the operation of the SEC's Public Reference Room may be obtained by calling 1-800-SEC-0330.
For a complete list of a fund's portfolio holdings, view the most recent holdings listing, semiannual report, or annual report on Fidelity's web site at http://www.fidelity.com, http://www.institutional.fidelity.com, or http://www.401k.com, as applicable.
NOT FDIC INSURED •MAY LOSE VALUE •NO BANK GUARANTEE
Neither the Fund nor Fidelity Distributors Corporation is a bank.
Investment Summary (Unaudited)
The information in the following tables is based on the combined investments of the Fund and its pro-rata share of the investments of Fidelity's Fixed-Income Central Funds.
Top Five Holdings as of June 30, 2016
| (by issuer, excluding cash equivalents) | % of fund's net assets | % of fund's net assets 6 months ago |
| U.S. Treasury Obligations | 14.0 | 13.7 |
| Ginnie Mae guaranteed REMIC pass-thru certificates | 2.8 | 2.4 |
| Japan Government | 2.3 | 2.7 |
| T-Mobile U.S.A., Inc. | 1.9 | 1.8 |
| Ally Financial, Inc. | 1.7 | 1.4 |
| | 22.7 | |
Top Five Market Sectors as of June 30, 2016
| | % of fund's net assets | % of fund's net assets 6 months ago |
| Financials | 12.5 | 12.8 |
| Consumer Discretionary | 9.2 | 10.7 |
| Telecommunication Services | 7.2 | 5.9 |
| Energy | 6.9 | 5.9 |
| Materials | 5.2 | 4.0 |
Quality Diversification (% of fund's net assets)
| As of June 30, 2016 |
| | U.S. Government and U.S. Government Agency Obligations* | 20.3% |
| | AAA,AA,A | 7.5% |
| | BBB | 9.6% |
| | BB | 22.2% |
| | B | 20.4% |
| | CCC,CC,C | 6.3% |
| | Not Rated | 3.6% |
| | Equities | 4.1% |
| | Short-Term Investments and Net Other Assets | 6.0% |

* Includes NCUA Guaranteed Notes
| As of December 31, 2015 |
| | U.S. Government and U.S. Government Agency Obligations* | 20.3% |
| | AAA,AA,A | 8.0% |
| | BBB | 11.4% |
| | BB | 21.3% |
| | B | 17.8% |
| | CCC,CC,C | 6.1% |
| | Not Rated | 4.8% |
| | Equities | 4.6% |
| | Short-Term Investments and Net Other Assets | 5.7% |
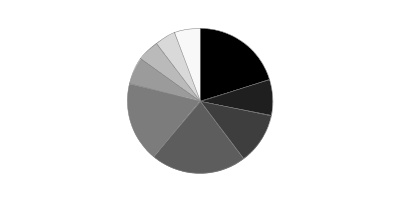
* Includes NCUA Guaranteed Notes
We have used ratings from Moody's Investors Service, Inc. Where Moody's® ratings are not available, we have used S&P® ratings. All ratings are as of the date indicated and do not reflect subsequent changes.
Asset Allocation (% of fund's net assets)
| As of June 30, 2016*,** |
| | Preferred Securities | 2.8% |
| | Corporate Bonds | 44.3% |
| | U.S. Government and U.S. Government Agency Obligations*** | 20.3% |
| | Foreign Government & Government Agency Obligations | 15.5% |
| | Bank Loan Obligations | 6.8% |
| | Stocks | 4.1% |
| | Other Investments | 0.2% |
| | Short-Term Investments and Net Other Assets (Liabilities) | 6.0% |
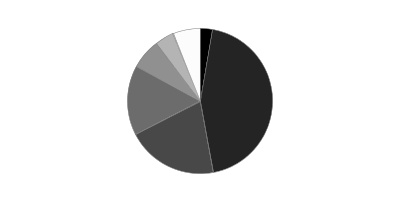
* Foreign investments - 34.9%
** Futures and Swaps - 0.6%
*** Includes NCUA Guaranteed Notes
| As of December 31, 2015*,** |
| | Preferred Securities | 3.1% |
| | Corporate Bonds | 43.3% |
| | U.S. Government and U.S. Government Agency Obligations*** | 20.3% |
| | Foreign Government & Government Agency Obligations | 15.6% |
| | Bank Loan Obligations | 7.3% |
| | Stocks | 4.6% |
| | Other Investments | 0.1% |
| | Short-Term Investments and Net Other Assets (Liabilities) | 5.7% |

* Foreign investments - 35.7%
** Futures and Swaps - 0.6%
*** Includes NCUA Guaranteed Notes
An unaudited holdings listing for the Fund, which presents direct holdings as well as the pro-rata share of any securities and other investments held indirectly through its investment in underlying non-money market Fidelity Central Funds, is available at fidelity.com and/or institutional.fidelity.com, as applicable.
Percentages in the above tables are adjusted for the effect of TBA Sale Commitments.
Investments June 30, 2016 (Unaudited)
Showing Percentage of Net Assets
| Corporate Bonds - 44.1% | | | |
| | | Principal Amount(a) | Value |
| Convertible Bonds - 0.0% | | | |
| CONSUMER DISCRETIONARY - 0.0% | | | |
| Auto Components - 0.0% | | | |
| Exide Technologies 7% 4/30/25 pay-in-kind | | $522,368 | $235,066 |
| Nonconvertible Bonds - 44.1% | | | |
| CONSUMER DISCRETIONARY - 6.0% | | | |
| Auto Components - 0.4% | | | |
| Dana Holding Corp.: | | | |
| 5.375% 9/15/21 | | 380,000 | 389,690 |
| 6% 9/15/23 | | 380,000 | 385,700 |
| Exide Technologies 11% 4/30/20 pay-in-kind | | 501,743 | 393,548 |
| International Automotive Components Group SA 9.125% 6/1/18 (b) | | 495,000 | 495,000 |
| Lear Corp. 4.75% 1/15/23 | | 665,000 | 683,288 |
| Metalsa SA de CV 4.9% 4/24/23 (b) | | 475,000 | 461,938 |
| Schaeffler Holding Finance BV: | | | |
| 6.25% 11/15/19 pay-in-kind (b)(c) | | 375,000 | 390,000 |
| 6.75% 11/15/22 pay-in-kind (b)(c) | | 294,874 | 322,518 |
| Tenedora Nemak SA de CV 5.5% 2/28/23 (b) | | 1,040,000 | 1,076,400 |
| Tenneco, Inc. 5% 7/15/26 | | 450,000 | 456,467 |
| Tupy Overseas SA 6.625% 7/17/24 (b) | | 400,000 | 383,000 |
| | | | 5,437,549 |
| Automobiles - 0.0% | | | |
| General Motors Financial Co., Inc. 4.25% 5/15/23 | | 270,000 | 277,705 |
| Distributors - 0.0% | | | |
| American Builders & Contractors Supply Co., Inc. 5.625% 4/15/21 (b) | | 160,000 | 165,200 |
| LKQ Corp. 4.75% 5/15/23 | | 115,000 | 112,988 |
| | | | 278,188 |
| Diversified Consumer Services - 0.2% | | | |
| Laureate Education, Inc. 10% 9/1/19 (b) | | 2,490,000 | 2,178,750 |
| Hotels, Restaurants & Leisure - 1.0% | | | |
| 24 Hour Holdings III LLC 8% 6/1/22 (b) | | 220,000 | 166,650 |
| Caesars Growth Properties Holdings LLC/Caesars Growth Properties Finance, Inc. 9.375% 5/1/22 | | 3,605,000 | 3,352,650 |
| Choice Hotels International, Inc. 5.75% 7/1/22 | | 145,000 | 155,426 |
| FelCor Lodging LP: | | | |
| 5.625% 3/1/23 | | 440,000 | 440,000 |
| 6% 6/1/25 | | 1,145,000 | 1,153,588 |
| KFC Holding Co./Pizza Hut Holding LLC: | | | |
| 5% 6/1/24 (b) | | 475,000 | 483,313 |
| 5.25% 6/1/26 (b) | | 475,000 | 486,875 |
| Landry's Acquisition Co. 9.375% 5/1/20 (b) | | 95,000 | 99,750 |
| LTF Merger Sub, Inc. 8.5% 6/15/23 (b) | | 380,000 | 359,100 |
| MGP Escrow Issuer LLC/MGP Escrow Co.-Issuer, Inc. 5.625% 5/1/24 (b) | | 365,000 | 385,988 |
| Mohegan Tribal Gaming Authority 11% 9/15/18 pay-in-kind (b)(c) | | 45,000 | 45,113 |
| Paris Las Vegas Holding LLC/Harrah's Las Vegas LLC/Flamingo Las Vegas Holdings, Inc.: | | | |
| 8% 10/1/20 | | 1,415,000 | 1,418,538 |
| 11% 10/1/21 | | 2,374,000 | 2,332,455 |
| Playa Resorts Holding BV 8% 8/15/20 (b) | | 1,640,000 | 1,648,200 |
| RHP Hotel Properties LP/RHP Finance Corp. 5% 4/15/21 | | 460,000 | 469,200 |
| Waterford Gaming LLC/Waterford Gaming Finance Corp. 8.625% 3/31/15 (b)(d) | | 24,461 | 0 |
| | | | 12,996,846 |
| Household Durables - 0.9% | | | |
| Brookfield Residential Properties, Inc./Brookfield Residential U.S. Corp. 6.125% 7/1/22 (b) | | 335,000 | 316,575 |
| Brookfield Residential Properties, Inc. 6.5% 12/15/20 (b) | | 740,000 | 738,150 |
| Calatlantic Group, Inc. 8.375% 5/15/18 | | 220,000 | 241,175 |
| D.R. Horton, Inc.: | | | |
| 4.375% 9/15/22 | | 565,000 | 581,950 |
| 4.75% 2/15/23 | | 465,000 | 481,856 |
| 5.75% 8/15/23 | | 255,000 | 283,050 |
| Reynolds Group Issuer, Inc./Reynolds Group Issuer LLC/Reynolds Group Issuer (Luxembourg) SA: | | | |
| 5.75% 10/15/20 | | 2,555,000 | 2,638,038 |
| 6.875% 2/15/21 | | 565,000 | 581,950 |
| 7% 7/15/24 (b) | | 360,000 | 370,620 |
| 8.25% 2/15/21 (c) | | 625,000 | 653,825 |
| 9.875% 8/15/19 | | 26,000 | 26,845 |
| Springs Industries, Inc. 6.25% 6/1/21 | | 160,000 | 161,600 |
| Taylor Morrison Communities, Inc./Monarch Communities, Inc. 5.875% 4/15/23 (b) | | 435,000 | 437,175 |
| Toll Brothers Finance Corp.: | | | |
| 4.375% 4/15/23 | | 1,106,000 | 1,089,410 |
| 5.875% 2/15/22 | | 565,000 | 607,940 |
| TRI Pointe Homes, Inc.: | | | |
| 4.375% 6/15/19 | | 320,000 | 321,600 |
| 5.875% 6/15/24 | | 780,000 | 792,675 |
| William Lyon Homes, Inc. 8.5% 11/15/20 | | 250,000 | 256,875 |
| | | | 10,581,309 |
| Internet & Catalog Retail - 0.3% | | | |
| Netflix, Inc.: | | | |
| 5.375% 2/1/21 (b) | | 420,000 | 446,036 |
| 5.75% 3/1/24 | | 612,000 | 638,010 |
| 5.875% 2/15/25 | | 1,395,000 | 1,463,006 |
| Priceline Group, Inc. 1.8% 3/3/27 | EUR | 850,000 | 895,943 |
| Zayo Group LLC/Zayo Capital, Inc. 6% 4/1/23 | | 580,000 | 588,700 |
| | | | 4,031,695 |
| Media - 2.9% | | | |
| Altice SA: | | | |
| 7.625% 2/15/25 (b) | | 1,585,000 | 1,547,356 |
| 7.75% 5/15/22 (b) | | 3,275,000 | 3,307,750 |
| Altice U.S. Finance SA: | | | |
| 5.375% 7/15/23 (b) | | 1,000,000 | 992,500 |
| 5.5% 5/15/26 (b) | | 615,000 | 615,000 |
| AMC Entertainment, Inc. 5.75% 6/15/25 | | 870,000 | 865,650 |
| AMC Networks, Inc. 4.75% 12/15/22 | | 320,000 | 317,600 |
| British Sky Broadcasting Group PLC: | | | |
| 1.5% 9/15/21 (Reg. S) | EUR | 350,000 | 400,242 |
| 1.875% 11/24/23 (Reg. S) | EUR | 600,000 | 691,403 |
| Cablevision SA 6.5% 6/15/21 (b) | | 230,000 | 234,600 |
| CBS Outdoor Americas Capital LLC/CBS Outdoor Americas Capital Corp.: | | | |
| 5.25% 2/15/22 | | 115,000 | 116,725 |
| 5.625% 2/15/24 | | 1,625,000 | 1,673,750 |
| CCO Holdings LLC/CCO Holdings Capital Corp.: | | | |
| 5.125% 2/15/23 | | 1,565,000 | 1,589,273 |
| 5.125% 5/1/23 (b) | | 720,000 | 724,050 |
| 5.375% 5/1/25 (b) | | 720,000 | 730,800 |
| 5.5% 5/1/26 (b) | | 950,000 | 964,250 |
| 5.75% 9/1/23 | | 500,000 | 517,500 |
| 5.75% 1/15/24 | | 555,000 | 584,082 |
| 5.75% 2/15/26 (b) | | 1,030,000 | 1,060,900 |
| Cengage Learning, Inc. 9.5% 6/15/24 (b) | | 1,090,000 | 1,109,075 |
| Cequel Communications Holdings I LLC/Cequel Capital Corp. 5.125% 12/15/21 (b) | | 1,490,000 | 1,419,225 |
| Cinemark U.S.A., Inc.: | | | |
| 4.875% 6/1/23 | | 525,000 | 519,750 |
| 5.125% 12/15/22 | | 155,000 | 157,713 |
| Clear Channel Communications, Inc. 14% 2/1/21 pay-in-kind (c) | | 577,694 | 201,744 |
| Columbus International, Inc. 7.375% 3/30/21 (b) | | 400,000 | 422,400 |
| Gannett Co., Inc.: | | | |
| 4.875% 9/15/21 (b) | | 410,000 | 420,250 |
| 5.5% 9/15/24 (b) | | 410,000 | 422,300 |
| Globo Comunicacao e Participacoes SA: | | | |
| 4.843% 6/8/25 (b) | | 790,000 | 762,350 |
| 4.875% 4/11/22 (b) | | 250,000 | 250,938 |
| 5.307% 5/11/22 (Reg. S) (e) | | 200,000 | 202,000 |
| Grupo Televisa SA de CV: | | | |
| 4.625% 1/30/26 | | 200,000 | 215,918 |
| 6.125% 1/31/46 | | 205,000 | 226,375 |
| 6.625% 3/18/25 | | 315,000 | 386,086 |
| Liberty Media Corp.: | | | |
| 8.25% 2/1/30 | | 1,845,000 | 1,914,188 |
| 8.5% 7/15/29 | | 545,000 | 574,975 |
| McGraw-Hill Global Education Holdings LLC/McGraw-Hill Global Education Finance 7.875% 5/15/24 (b) | | 1,010,000 | 1,045,350 |
| MHGE Parent LLC/MHGE Parent Finance, Inc. 8.5% 8/1/19 pay-in-kind (b)(c) | | 1,140,000 | 1,151,400 |
| Myriad International Holding BV 5.5% 7/21/25 (b) | | 600,000 | 624,000 |
| Nielsen Finance LLC/Nielsen Finance Co. 5% 4/15/22 (b) | | 295,000 | 300,900 |
| Quebecor Media, Inc. 5.75% 1/15/23 | | 790,000 | 801,850 |
| RCN Telecom Services LLC/RCN Capital Corp. 8.5% 8/15/20 (b) | | 315,000 | 322,875 |
| Sirius XM Radio, Inc.: | | | |
| 4.25% 5/15/20 (b) | | 650,000 | 657,132 |
| 4.625% 5/15/23 (b) | | 260,000 | 252,221 |
| 5.25% 8/15/22 (b) | | 750,000 | 789,375 |
| 5.375% 4/15/25 (b) | | 620,000 | 617,288 |
| 5.375% 7/15/26 (b) | | 620,000 | 615,350 |
| SKY PLC 2.5% 9/15/26 (Reg. S) | EUR | 217,000 | 256,406 |
| TV Azteca SA de CV: | | | |
| 7.5% 5/25/18 (Reg. S) | | 1,000,000 | 667,500 |
| 7.625% 9/18/20 (Reg S.) | | 300,000 | 187,500 |
| Unitymedia Hessen GmbH & Co. KG/Unitymedia NRW GmbH 5.5% 1/15/23 (b) | | 575,000 | 577,875 |
| VTR Finance BV 6.875% 1/15/24 (b) | | 1,030,000 | 1,026,889 |
| Wave Holdco LLC/Wave Holdco Corp. 9% 7/15/19 pay-in-kind (b)(c) | | 125,400 | 120,854 |
| WMG Acquisition Corp. 5.625% 4/15/22 (b) | | 115,000 | 117,013 |
| | | | 36,270,496 |
| Specialty Retail - 0.2% | | | |
| CST Brands, Inc. 5% 5/1/23 | | 140,000 | 142,100 |
| L Brands, Inc.: | | | |
| 5.625% 2/15/22 | | 685,000 | 737,060 |
| 5.625% 10/15/23 | | 520,000 | 560,300 |
| 6.875% 11/1/35 | | 670,000 | 678,375 |
| Penske Automotive Group, Inc. 5.5% 5/15/26 | | 460,000 | 437,000 |
| Sonic Automotive, Inc. 5% 5/15/23 | | 85,000 | 83,300 |
| | | | 2,638,135 |
| Textiles, Apparel & Luxury Goods - 0.1% | | | |
| Hanesbrands, Inc.: | | | |
| 4.625% 5/15/24 (b) | | 310,000 | 310,775 |
| 4.875% 5/15/26 (b) | | 310,000 | 311,116 |
| | | | 621,891 |
| TOTAL CONSUMER DISCRETIONARY | | | 75,312,564 |
| CONSUMER STAPLES - 2.0% | | | |
| Beverages - 0.1% | | | |
| Anheuser-Busch InBev SA NV 1.5% 3/17/25 (Reg. S) | EUR | 600,000 | 701,538 |
| Constellation Brands, Inc. 4.75% 11/15/24 | | 560,000 | 589,400 |
| | | | 1,290,938 |
| Food & Staples Retailing - 0.6% | | | |
| Albertsons Companies LLC/Safeway, Inc./New Albertson's, Inc./Albertson's LLC 6.625% 6/15/24 (b) | | 805,000 | 831,163 |
| Albertsons, Inc.: | | | |
| 7.45% 8/1/29 | | 385,000 | 373,450 |
| 8% 5/1/31 | | 656,000 | 649,440 |
| 8.7% 5/1/30 | | 95,000 | 95,000 |
| Arcor SAIC 6% 7/6/23 (b) | | 300,000 | 301,500 |
| BI-LO LLC/BI-LO Finance Corp.: | | | |
| 8.625% 9/15/18 pay-in-kind (b)(c) | | 790,000 | 521,400 |
| 9.25% 2/15/19 (b) | | 1,160,000 | 1,009,200 |
| ESAL GmbH 6.25% 2/5/23 (b) | | 1,705,000 | 1,683,688 |
| Hearthside Group Holdings LLC/Hearthside Finance, Inc. 6.5% 5/1/22 (b) | | 155,000 | 131,363 |
| Minerva Luxembourg SA 7.75% 1/31/23 (Reg. S) | | 690,000 | 708,630 |
| Shearers Foods LLC/Chip Finance Corp. 9% 11/1/19 (b) | | 152,000 | 160,360 |
| Tops Holding LLC/Tops Markets II Corp. 8% 6/15/22 (b) | | 580,000 | 510,400 |
| | | | 6,975,594 |
| Food Products - 0.9% | | | |
| B&G Foods, Inc. 4.625% 6/1/21 | | 565,000 | 565,000 |
| Barry Callebaut Services NV 5.5% 6/15/23 (b) | | 435,000 | 468,191 |
| Gruma S.A.B. de CV 4.875% 12/1/24 (b) | | 275,000 | 297,000 |
| H.J. Heinz Co. 2.25% 5/25/28 (Reg. S) | EUR | 1,400,000 | 1,635,175 |
| JBS Investments GmbH 7.25% 4/3/24 (b) | | 2,205,000 | 2,271,150 |
| JBS U.S.A. LLC/JBS U.S.A. Finance, Inc.: | | | |
| 5.75% 6/15/25 (b) | | 1,030,000 | 968,200 |
| 5.875% 7/15/24 (b) | | 1,812,000 | 1,755,375 |
| 7.25% 6/1/21 (b) | | 350,000 | 362,250 |
| 8.25% 2/1/20 (b) | | 330,000 | 341,550 |
| MHP SA 8.25% 4/2/20 (b) | | 400,000 | 378,000 |
| Mondelez International, Inc. 2.375% 3/6/35 | EUR | 200,000 | 226,534 |
| Pilgrim's Pride Corp. 5.75% 3/15/25 (b) | | 720,000 | 718,200 |
| Post Holdings, Inc.: | | | |
| 6% 12/15/22 (b) | | 290,000 | 297,250 |
| 7.375% 2/15/22 | | 370,000 | 388,963 |
| 7.75% 3/15/24 (b) | | 465,000 | 510,919 |
| 8% 7/15/25 (b) | | 230,000 | 255,013 |
| TreeHouse Foods, Inc. 4.875% 3/15/22 | | 200,000 | 204,000 |
| | | | 11,642,770 |
| Household Products - 0.2% | | | |
| Edgewell Personal Care Co. 5.5% 6/15/25 (b) | | 375,000 | 373,125 |
| Spectrum Brands Holdings, Inc.: | | | |
| 5.75% 7/15/25 | | 600,000 | 624,750 |
| 6.375% 11/15/20 | | 850,000 | 887,188 |
| 6.625% 11/15/22 | | 175,000 | 185,719 |
| | | | 2,070,782 |
| Personal Products - 0.2% | | | |
| Prestige Brands, Inc. 5.375% 12/15/21 (b) | | 725,000 | 735,875 |
| Revlon Consumer Products Corp. 5.75% 2/15/21 | | 1,979,000 | 1,909,735 |
| | | | 2,645,610 |
| TOTAL CONSUMER STAPLES | | | 24,625,694 |
| ENERGY - 6.5% | | | |
| Energy Equipment & Services - 0.4% | | | |
| Compressco Partners LP/Compressco Finance, Inc. 7.25% 8/15/22 | | 395,000 | 323,900 |
| Ensco PLC 5.2% 3/15/25 | | 25,000 | 17,375 |
| Exterran Partners LP/EXLP Finance Corp. 6% 10/1/22 | | 385,000 | 340,725 |
| Forbes Energy Services Ltd. 9% 6/15/19 | | 350,000 | 150,500 |
| Forum Energy Technologies, Inc. 6.25% 10/1/21 | | 715,000 | 663,163 |
| Gulfmark Offshore, Inc. 6.375% 3/15/22 | | 20,000 | 8,250 |
| Hornbeck Offshore Services, Inc. 5.875% 4/1/20 | | 415,000 | 262,488 |
| MPLX LP 5.5% 2/15/23 (b) | | 350,000 | 355,599 |
| Southern Gas Corridor CJSC 6.875% 3/24/26 (b) | | 445,000 | 479,488 |
| State Oil Co. of Azerbaijan Republic 4.75% 3/13/23 (Reg. S) | | 200,000 | 191,311 |
| Summit Midstream Holdings LLC 7.5% 7/1/21 | | 220,000 | 207,625 |
| Trinidad Drilling Ltd. 7.875% 1/15/19 (b) | | 140,000 | 124,600 |
| Unit Corp. 6.625% 5/15/21 | | 120,000 | 92,700 |
| Weatherford International Ltd.: | | | |
| 7.75% 6/15/21 | | 620,000 | 603,725 |
| 8.25% 6/15/23 | | 930,000 | 883,500 |
| | | | 4,704,949 |
| Oil, Gas & Consumable Fuels - 6.1% | | | |
| Access Midstream Partners LP/ACMP Finance Corp.: | | | |
| 4.875% 5/15/23 | | 735,000 | 710,418 |
| 4.875% 3/15/24 | | 315,000 | 302,125 |
| Afren PLC: | | | |
| 6.625% 12/9/20 (b)(d) | | 487,918 | 488 |
| 10.25% 4/8/19 (Reg. S) (d) | | 780,669 | 781 |
| American Energy-Permian Basin LLC/AEPB Finance Corp. 13% 11/30/20 (b) | | 940,000 | 1,071,600 |
| Antero Resources Corp.: | | | |
| 5.125% 12/1/22 | | 45,000 | 43,200 |
| 5.625% 6/1/23 (Reg. S) | | 560,000 | 543,200 |
| Antero Resources Finance Corp. 5.375% 11/1/21 | | 295,000 | 288,363 |
| Carrizo Oil & Gas, Inc.: | | | |
| 6.25% 4/15/23 | | 380,000 | 365,750 |
| 7.5% 9/15/20 | | 245,000 | 248,063 |
| Chaparral Energy, Inc. 9.875% 10/1/20 (d) | | 135,000 | 79,650 |
| Cheniere Corpus Christi Holdings LLC 7% 6/30/24 (b) | | 710,000 | 729,085 |
| Chesapeake Energy Corp. 8% 12/15/22 (b) | | 2,040,000 | 1,728,900 |
| Citgo Holding, Inc. 10.75% 2/15/20 (b) | | 972,000 | 976,860 |
| Crestwood Midstream Partners LP/Crestwood Midstream Finance Corp.: | | | |
| 6% 12/15/20 | | 695,000 | 656,775 |
| 6.125% 3/1/22 | | 963,000 | 890,775 |
| 6.25% 4/1/23 (b) | | 1,975,000 | 1,817,000 |
| CVR Refining LLC/Coffeyville Finance, Inc. 6.5% 11/1/22 | | 1,070,000 | 920,200 |
| Denbury Resources, Inc.: | | | |
| 4.625% 7/15/23 | | 595,000 | 383,775 |
| 5.5% 5/1/22 | | 800,000 | 540,000 |
| 6.375% 8/15/21 | | 485,000 | 334,650 |
| Eagle Rock Energy Partners LP/Eagle Rock Energy Finance Corp. 8.375% 6/1/19 | | 480,000 | 103,200 |
| EDC Finance Ltd. 4.875% 4/17/20 (b) | | 1,200,000 | 1,209,000 |
| Endeavor Energy Resources LP/EER Finance, Inc. 7% 8/15/21 (b) | | 530,000 | 520,725 |
| Energy Transfer Equity LP 5.5% 6/1/27 | | 860,000 | 808,400 |
| EnLink Midstream Partners LP: | | | |
| 4.15% 6/1/25 | | 465,000 | 428,748 |
| 4.4% 4/1/24 | | 460,000 | 431,686 |
| EP Energy LLC/Everest Acquisition Finance, Inc.: | | | |
| 7.75% 9/1/22 | | 60,000 | 36,600 |
| 9.375% 5/1/20 | | 515,000 | 364,363 |
| EV Energy Partners LP/EV Energy Finance Corp. 8% 4/15/19 | | 482,500 | 289,500 |
| Genesis Energy LP/Genesis Energy Finance Corp. 5.75% 2/15/21 | | 250,000 | 236,250 |
| Georgian Oil & Gas Corp. 6.75% 4/26/21 (b) | | 600,000 | 619,620 |
| Global Partners LP/GLP Finance Corp.: | | | |
| 6.25% 7/15/22 | | 130,000 | 108,225 |
| 7% 6/15/23 | | 580,000 | 484,300 |
| Goodrich Petroleum Corp. 8.875% 3/15/18 (d) | | 128,000 | 6,080 |
| Hiland Partners LP/Finance Corp. 7.25% 10/1/20 (b) | | 395,000 | 409,813 |
| Hilcorp Energy I LP/Hilcorp Finance Co.: | | | |
| 5% 12/1/24 (b) | | 510,000 | 475,524 |
| 5.75% 10/1/25 (b) | | 580,000 | 553,900 |
| 7.625% 4/15/21 (b) | | 380,000 | 390,450 |
| Holly Energy Partners LP/Holly Finance Corp. 6.5% 3/1/20 | | 485,000 | 487,425 |
| Indo Energy Finance BV 7% 5/7/18 (b) | | 200,000 | 158,000 |
| Jupiter Resources, Inc. 8.5% 10/1/22 (b) | | 1,295,000 | 929,163 |
| Kosmos Energy Ltd.: | | | |
| 7.875% 8/1/21 (b) | | 290,000 | 279,850 |
| 7.875% 8/1/21 (b) | | 400,000 | 386,000 |
| Laredo Petroleum, Inc. 7.375% 5/1/22 (Reg. S) | | 600,000 | 601,500 |
| MPLX LP 4.875% 12/1/24 (b) | | 2,370,000 | 2,308,762 |
| Newfield Exploration Co.: | | | |
| 5.375% 1/1/26 | | 475,000 | 461,938 |
| 5.625% 7/1/24 | | 75,000 | 75,000 |
| Northern Tier Energy LLC/Northern Tier Finance Corp. 7.125% 11/15/20 | | 235,000 | 239,113 |
| Nostrum Oil & Gas Finance BV 6.375% 2/14/19 (b) | | 1,140,000 | 999,119 |
| Pacific Exploration and Production Corp. 12% 12/22/17 | | 461,000 | 405,680 |
| Pacific Rubiales Energy Corp. 7.25% 12/12/21 (b)(d) | | 2,605,000 | 481,925 |
| Pan American Energy LLC 7.875% 5/7/21 (b) | | 1,095,000 | 1,119,638 |
| PBF Holding Co. LLC/PBF Finance Corp.: | | | |
| 7% 11/15/23 (b) | | 1,095,000 | 1,058,044 |
| 8.25% 2/15/20 | | 930,000 | 964,875 |
| PBF Logistics LP/PBF Logistics Finance, Inc. 6.875% 5/15/23 | | 435,000 | 426,300 |
| Pemex Project Funding Master Trust: | | | |
| 6.625% 6/15/35 | | 1,615,000 | 1,665,065 |
| 8.625% 12/1/23 (c) | | 250,000 | 294,375 |
| PetroBakken Energy Ltd. 8.625% 2/1/20 (b) | | 1,225,000 | 85,750 |
| Petrobras Global Finance BV: | | | |
| 2.7684% 1/15/19 (c) | | 1,810,000 | 1,635,335 |
| 3% 1/15/19 | | 1,730,000 | 1,602,845 |
| 6.25% 3/17/24 | | 570,000 | 505,875 |
| 8.375% 5/23/21 | | 905,000 | 933,960 |
| Petrobras International Finance Co. Ltd.: | | | |
| 5.75% 1/20/20 | | 2,135,000 | 2,062,624 |
| 5.875% 3/1/18 | | 930,000 | 948,600 |
| 6.875% 1/20/40 | | 1,210,000 | 982,641 |
| Petroleos de Venezuela SA: | | | |
| 5.375% 4/12/27 | | 930,000 | 324,291 |
| 5.5% 4/12/37 | | 285,000 | 97,613 |
| 6% 5/16/24 (b) | | 825,000 | 285,656 |
| 6% 11/15/26 (b) | | 700,000 | 244,090 |
| 8.5% 11/2/17 (b) | | 5,013,333 | 3,506,962 |
| 9.75% 5/17/35 (b) | | 1,115,000 | 445,944 |
| 12.75% 2/17/22 (b) | | 930,000 | 471,510 |
| Petroleos Mexicanos: | | | |
| 3.5% 1/30/23 | | 495,000 | 466,092 |
| 4.875% 1/18/24 | | 570,000 | 577,866 |
| 5.5% 2/4/19 (b) | | 435,000 | 457,185 |
| 5.5% 1/21/21 | | 345,000 | 365,321 |
| 5.5% 6/27/44 | | 970,000 | 876,444 |
| 6.375% 2/4/21 (b) | | 310,000 | 337,063 |
| 6.375% 1/23/45 | | 665,000 | 668,325 |
| 6.5% 6/2/41 | | 1,700,000 | 1,721,250 |
| 6.625% (b)(f) | | 2,065,000 | 2,039,188 |
| Plains Exploration & Production Co. 6.75% 2/1/22 | | 900,000 | 882,282 |
| PT Pertamina Persero: | | | |
| 4.875% 5/3/22 (b) | | 375,000 | 394,503 |
| 5.25% 5/23/21 (b) | | 295,000 | 315,870 |
| 5.625% 5/20/43 (b) | | 200,000 | 193,739 |
| 6% 5/3/42 (b) | | 175,000 | 176,924 |
| 6.5% 5/27/41 (b) | | 915,000 | 969,992 |
| QEP Resources, Inc. 5.25% 5/1/23 | | 610,000 | 561,200 |
| Range Resources Corp. 5% 3/15/23 | | 960,000 | 900,000 |
| Rice Energy, Inc.: | | | |
| 6.25% 5/1/22 | | 1,005,000 | 997,463 |
| 7.25% 5/1/23 | | 510,000 | 517,650 |
| RSP Permian, Inc. 6.625% 10/1/22 | | 230,000 | 236,900 |
| Sabine Pass Liquefaction LLC 5.875% 6/30/26 (b) | | 925,000 | 928,469 |
| SemGroup Corp. 7.5% 6/15/21 | | 440,000 | 424,600 |
| SM Energy Co. 5.625% 6/1/25 | | 280,000 | 240,800 |
| Southern Star Central Corp. 5.125% 7/15/22 (b) | | 320,000 | 312,000 |
| Southwestern Energy Co. 4.1% 3/15/22 | | 910,000 | 812,175 |
| Sunoco LP/Sunoco Finance Corp.: | | | |
| 6.25% 4/15/21 (b) | | 875,000 | 872,813 |
| 6.375% 4/1/23 (b) | | 405,000 | 401,963 |
| Teekay Corp.: | | | |
| 8.5% 1/15/20 | | 295,000 | 247,063 |
| 8.5% 1/15/20 (b) | | 585,000 | 489,938 |
| Teine Energy Ltd. 6.875% 9/30/22 (b) | | 590,000 | 578,200 |
| Tennessee Gas Pipeline Co. 7.625% 4/1/37 | | 50,000 | 58,971 |
| Tesoro Logistics LP/Tesoro Logistics Finance Corp.: | | | |
| 6.125% 10/15/21 | | 155,000 | 160,425 |
| 6.375% 5/1/24 | | 245,000 | 256,638 |
| Transportadora de Gas del Sur SA: | | | |
| 7.875% 5/14/17 (Reg. S) | | 38,750 | 39,041 |
| 9.625% 5/14/20 (b) | | 1,413,395 | 1,498,198 |
| Western Refining Logistics LP/WNRL Finance Co. 7.5% 2/15/23 | | 675,000 | 664,875 |
| Western Refining, Inc. 6.25% 4/1/21 | | 1,440,000 | 1,310,400 |
| WPX Energy, Inc. 6% 1/15/22 | | 690,000 | 641,700 |
| YPF SA: | | | |
| 8.5% 3/23/21 (b) | | 1,415,000 | 1,510,513 |
| 8.75% 4/4/24 (b) | | 1,560,000 | 1,677,000 |
| Zhaikmunai International BV 7.125% 11/13/19 (b) | | 1,575,000 | 1,382,378 |
| | | | 75,746,927 |
| TOTAL ENERGY | | | 80,451,876 |
| FINANCIALS - 9.5% | | | |
| Banks - 3.3% | | | |
| ABN AMRO Bank NV 7.125% 7/6/22 | EUR | 600,000 | 835,999 |
| Allied Irish Banks PLC 2.75% 4/16/19 (Reg. S) | EUR | 1,000,000 | 1,169,696 |
| Banco de Bogota SA 6.25% 5/12/26 (b) | | 270,000 | 274,725 |
| Banco de Galicia y Buenos Aires SA 16% 1/1/19 (Reg. S) | | 303,549 | 305,825 |
| Banco de Reservas de La Republica Dominicana 7% 2/1/23 (b) | | 360,000 | 356,400 |
| Banco Hipotecario SA 9.75% 11/30/20 (b) | | 895,000 | 970,851 |
| Banco Nacional de Desenvolvimento Economico e Social: | | | |
| 4% 4/14/19 (b) | | 200,000 | 197,400 |
| 6.369% 6/16/18 (b) | | 475,000 | 495,615 |
| Bank of Ireland 1.25% 4/9/20 | EUR | 319,000 | 361,260 |
| Banque Centrale de Tunisie 5.75% 1/30/25 (b) | | 260,000 | 234,650 |
| BBVA Bancomer SA 7.25% 4/22/20 (b) | | 375,000 | 413,438 |
| Biz Finance PLC 9.625% 4/27/22 (Reg. S) | | 175,000 | 170,100 |
| BPCE SA 2.75% 11/30/27 (Reg. S) (c) | EUR | 1,100,000 | 1,232,578 |
| CIT Group, Inc.: | | | |
| 5% 8/15/22 | | 845,000 | 859,788 |
| 5.375% 5/15/20 | | 1,055,000 | 1,099,838 |
| 5.5% 2/15/19 (b) | | 2,355,000 | 2,463,919 |
| Citigroup, Inc. 2.125% 9/10/26 (Reg. S) | EUR | 650,000 | 765,505 |
| Export Credit Bank of Turkey 5.875% 4/24/19 (b) | | 450,000 | 477,023 |
| Georgia Bank Joint Stock Co.: | | | |
| 7.75% 7/5/17 (b) | | 690,000 | 716,565 |
| 7.75% 7/5/17 (Reg. S) | | 200,000 | 207,700 |
| GTB Finance BV 6% 11/8/18 (b) | | 1,520,000 | 1,489,752 |
| HSBC Bank PLC 5% 3/20/23 (c) | GBP | 900,000 | 1,232,021 |
| HSBC Holdings PLC: | | | |
| 1.5% 3/15/22 (Reg. S) | EUR | 450,000 | 511,962 |
| 3.125% 6/7/28 | EUR | 400,000 | 449,795 |
| HSBK BV 7.25% 5/3/17 (b) | | 1,100,000 | 1,133,000 |
| Industrial Senior Trust 5.5% 11/1/22 (b) | | 100,000 | 98,000 |
| ING Bank NV: | | | |
| 6.125% 5/29/23 (c) | EUR | 1,400,000 | 1,691,669 |
| 6.875% 5/29/23 (c) | GBP | 1,750,000 | 2,496,596 |
| International Bank of Azerbaijan OJSC 5.625% 6/11/19 (Reg. S) | | 400,000 | 391,128 |
| Intesa Sanpaolo SpA 1.125% 3/4/22 | EUR | 650,000 | 717,644 |
| Itau Unibanco Holding SA: | | | |
| 5.125% 5/13/23 (Reg. S) | | 680,000 | 676,532 |
| 5.5% 8/6/22 (b) | | 490,000 | 499,702 |
| 6.2% 12/21/21 (Reg. S) | | 425,000 | 448,800 |
| JPMorgan Chase & Co. 1.5% 10/29/26 Reg. S | EUR | 650,000 | 740,025 |
| KBC Groep NV 1.875% 3/11/27 (Reg. S) (c) | EUR | 1,300,000 | 1,400,361 |
| Lloyds Bank PLC 6.5% 3/24/20 | EUR | 500,000 | 639,083 |
| Nacional Financiera SNC 3.375% 11/5/20 (b) | | 440,000 | 448,360 |
| National Westminster Bank PLC 6.5% 9/7/21 | GBP | 970,000 | 1,435,216 |
| OJSC Russian Agricultural Bank 7.75% 5/29/18 (Issued by RSHB Capital SA for OJSC Russian Agricultural Bank) (b) | | 360,000 | 388,054 |
| Rabobank Nederland 6.875% 3/19/20 (Reg. S) | EUR | 1,900,000 | 2,462,032 |
| Royal Bank of Scotland Group PLC 1.625% 6/25/19 (Reg. S) | EUR | 1,000,000 | 1,122,145 |
| Royal Bank of Scotland PLC 6.934% 4/9/18 | EUR | 550,000 | 659,193 |
| RSHB Capital SA 5.298% 12/27/17 (b) | | 440,000 | 452,382 |
| SB Capital SA 5.5% 2/26/24 (b)(c) | | 585,000 | 577,103 |
| Turkiye Halk Bankasi A/S 4.75% 6/4/19 (b) | | 460,000 | 466,707 |
| Turkiye Vakiflar Bankasi TAO 6.875% 2/3/25 (Reg. S) (c) | | 600,000 | 607,950 |
| UniCredit SpA: | | | |
| 2% 3/4/23 (Reg. S) | EUR | 1,100,000 | 1,239,702 |
| 6.95% 10/31/22 (Reg. S) | EUR | 600,000 | 747,776 |
| Zenith Bank PLC 6.25% 4/22/19 (b) | | 1,880,000 | 1,772,276 |
| | | | 40,603,841 |
| Capital Markets - 0.4% | | | |
| Credit Suisse Group AG 5.75% 9/18/25 (Reg. S) (c) | EUR | 1,600,000 | 1,873,453 |
| Goldman Sachs Group, Inc. 3% 2/12/31 (Reg. S) | EUR | 1,411,000 | 1,715,192 |
| Morgan Stanley 1.75% 3/11/24 | EUR | 1,250,000 | 1,427,369 |
| UBS Group Funding Ltd. 2.125% 3/4/24 (Reg. S) | EUR | 500,000 | 582,913 |
| | | | 5,598,927 |
| Consumer Finance - 2.9% | | | |
| AerCap Ireland Capital Ltd./AerCap Global Aviation Trust: | | | |
| 4.25% 7/1/20 | | 580,000 | 590,150 |
| 4.5% 5/15/21 | | 995,000 | 1,018,134 |
| 4.625% 7/1/22 | | 1,170,000 | 1,198,174 |
| 5% 10/1/21 | | 300,000 | 312,000 |
| Ally Financial, Inc.: | | | |
| 4.125% 2/13/22 | | 1,160,000 | 1,151,300 |
| 4.625% 3/30/25 | | 1,915,000 | 1,883,881 |
| 5.125% 9/30/24 | | 2,750,000 | 2,801,563 |
| 8% 11/1/31 | | 12,673,000 | 14,668,998 |
| Credito Real S.A.B. de CV 7.5% 3/13/19 (b) | | 400,000 | 412,000 |
| FCA Capital Ireland PLC 1.375% 4/17/20 (Reg. S) | EUR | 1,600,000 | 1,795,576 |
| Ford Credit Europe PLC 1.134% 2/10/22 (Reg. S) | EUR | 1,000,000 | 1,113,339 |
| General Motors Acceptance Corp. 8% 11/1/31 | | 823,000 | 964,968 |
| Navient Corp.: | | | |
| 5% 10/26/20 | | 395,000 | 370,313 |
| 5.875% 10/25/24 | | 2,100,000 | 1,795,500 |
| SLM Corp.: | | | |
| 5.5% 1/25/23 | | 2,410,000 | 2,114,775 |
| 7.25% 1/25/22 | | 2,840,000 | 2,705,100 |
| 8% 3/25/20 | | 725,000 | 740,863 |
| | | | 35,636,634 |
| Diversified Financial Services - 1.1% | | | |
| Cimpor Financial Operations BV 5.75% 7/17/24 (b) | | 570,000 | 420,375 |
| Icahn Enterprises LP/Icahn Enterprises Finance Corp.: | | | |
| 5.875% 2/1/22 | | 3,505,000 | 3,303,918 |
| 6% 8/1/20 | | 2,980,000 | 2,942,750 |
| MSCI, Inc.: | | | |
| 5.25% 11/15/24 (b) | | 345,000 | 352,763 |
| 5.75% 8/15/25 (b) | | 365,000 | 378,688 |
| Nationwide Building Society 4.125% 3/20/23 (Reg. S) (c) | EUR | 1,700,000 | 1,938,937 |
| RegionalCare Hospital Partners Holdings, Inc. 8.25% 5/1/23 (b) | | 530,000 | 543,250 |
| Solera LLC/Solera Finance, Inc. 10.5% 3/1/24 (b) | | 1,590,000 | 1,671,488 |
| Springleaf Financial Corp.: | | | |
| 7.75% 10/1/21 | | 90,000 | 86,625 |
| 8.25% 12/15/20 | | 460,000 | 461,150 |
| TMK Capital SA: | | | |
| 6.75% 4/3/20 (Reg. S) | | 200,000 | 203,852 |
| 7.75% 1/27/18 | | 230,000 | 239,085 |
| Wendel SA 2.75% 10/2/24 (Reg. S) | EUR | 800,000 | 937,339 |
| | | | 13,480,220 |
| Insurance - 0.5% | | | |
| Alliant Holdings Co.-Issuer, Inc./Wayne Merger Sub LLC 8.25% 8/1/23 (b) | | 1,440,000 | 1,422,000 |
| Assicurazioni Generali SpA 7.75% 12/12/42 (c) | EUR | 800,000 | 1,026,714 |
| Aviva PLC 3.375% 12/4/45 (Reg. S) (c) | EUR | 650,000 | 663,998 |
| Direct Line Insurance Group PLC 9.25% 4/27/42 (c) | GBP | 800,000 | 1,264,624 |
| Hockey Merger Sub 2, Inc. 7.875% 10/1/21 (b) | | 1,135,000 | 1,089,600 |
| HUB International Ltd. 9.25% 2/15/21 (b) | | 300,000 | 313,500 |
| SCOR SE 3% 6/8/46 (Reg. S) (c) | EUR | 600,000 | 644,210 |
| | | | 6,424,646 |
| Real Estate Investment Trusts - 0.6% | | | |
| Crown Castle International Corp. 5.25% 1/15/23 | | 1,530,000 | 1,716,752 |
| CTR Partnership LP/CareTrust Capital Corp. 5.875% 6/1/21 | | 85,000 | 85,000 |
| Hammerson PLC 1.75% 3/15/23 Reg. S | EUR | 150,000 | 167,197 |
| MPT Operating Partnership LP/MPT Finance Corp. 6.375% 2/15/22 | | 475,000 | 492,813 |
| Omega Healthcare Investors, Inc. 5.875% 3/15/24 | | 1,385,000 | 1,450,796 |
| Prologis LP 3% 6/2/26 | EUR | 300,000 | 377,188 |
| The GEO Group, Inc.: | | | |
| 5.125% 4/1/23 | | 200,000 | 195,000 |
| 5.875% 10/15/24 | | 3,000,000 | 3,037,500 |
| 6% 4/15/26 | | 235,000 | 237,350 |
| | | | 7,759,596 |
| Real Estate Management & Development - 0.4% | | | |
| CBRE Group, Inc.: | | | |
| 5% 3/15/23 | | 1,075,000 | 1,112,923 |
| 5.25% 3/15/25 | | 665,000 | 692,501 |
| Grand City Properties SA 1.5% 4/17/25 (Reg. S) | EUR | 500,000 | 548,801 |
| Howard Hughes Corp. 6.875% 10/1/21 (b) | | 1,210,000 | 1,219,075 |
| Inversiones y Representaciones SA 11.5% 7/20/20 (Reg. S) | | 85,000 | 94,775 |
| IRSA Propiedades Comerciales SA 8.75% 3/23/23 (b) | | 300,000 | 319,125 |
| Taylor Morrison Communities, Inc./Monarch Communities, Inc. 5.25% 4/15/21 (b) | | 785,000 | 783,038 |
| | | | 4,770,238 |
| Thrifts & Mortgage Finance - 0.3% | | | |
| Prime Securities Services Borrower LLC/Prime Finance, Inc. 9.25% 5/15/23 (b) | | 3,350,000 | 3,551,000 |
| TOTAL FINANCIALS | | | 117,825,102 |
| HEALTH CARE - 2.0% | | | |
| Biotechnology - 0.0% | | | |
| AMAG Pharmaceuticals, Inc. 7.875% 9/1/23 (b) | | 305,000 | 272,975 |
| Health Care Equipment & Supplies - 0.1% | | | |
| Alere, Inc. 6.375% 7/1/23 (b) | | 260,000 | 271,050 |
| Hill-Rom Holdings, Inc. 5.75% 9/1/23 (b) | | 290,000 | 296,525 |
| Hologic, Inc. 5.25% 7/15/22 (b) | | 630,000 | 658,350 |
| | | | 1,225,925 |
| Health Care Providers & Services - 1.6% | | | |
| AmSurg Corp. 5.625% 7/15/22 | | 520,000 | 534,300 |
| Hanger, Inc. 7.125% 11/15/18 | | 1,230,000 | 1,205,400 |
| HCA Holdings, Inc.: | | | |
| 4.75% 5/1/23 | | 630,000 | 645,750 |
| 5.25% 6/15/26 | | 750,000 | 778,594 |
| 5.375% 2/1/25 | | 1,155,000 | 1,183,875 |
| 5.875% 3/15/22 | | 1,915,000 | 2,082,563 |
| 5.875% 5/1/23 | | 2,145,000 | 2,284,425 |
| 5.875% 2/15/26 | | 1,495,000 | 1,551,063 |
| 6.5% 2/15/20 | | 2,410,000 | 2,666,063 |
| 7.5% 2/15/22 | | 1,175,000 | 1,335,975 |
| HealthSouth Corp.: | | | |
| 5.125% 3/15/23 | | 330,000 | 323,400 |
| 5.75% 11/1/24 | | 1,135,000 | 1,139,540 |
| InVentiv Health, Inc. 10% 8/15/18 | | 75,000 | 75,000 |
| Jaguar Holding Co. II/Pharmaceutical Product Development LLC 6.375% 8/1/23 (b) | | 570,000 | 582,825 |
| MPH Acquisition Holdings LLC 7.125% 6/1/24 (b) | | 335,000 | 351,750 |
| Quintiles Transnational Corp. 4.875% 5/15/23 (b) | | 445,000 | 451,675 |
| Quorum Health Corp. 11.625% 4/15/23 (b) | | 415,000 | 417,075 |
| Sabra Health Care LP/Sabra Capital Corp. 5.375% 6/1/23 | | 260,000 | 257,400 |
| Surgery Center Holdings, Inc. 8.875% 4/15/21 (b) | | 610,000 | 626,775 |
| Tenet Healthcare Corp. 6.875% 11/15/31 | | 1,210,000 | 975,563 |
| Vizient, Inc. 10.375% 3/1/24 (b) | | 660,000 | 707,850 |
| | | | 20,176,861 |
| Life Sciences Tools & Services - 0.0% | | | |
| Eurofins Scientific SA 3.375% 1/30/23 (Reg. S) | EUR | 450,000 | 504,708 |
| Pharmaceuticals - 0.3% | | | |
| JLL/Delta Dutch Pledgeco BV 8.75% 5/1/20 pay-in-kind (b)(c) | | 1,200,000 | 1,200,000 |
| Valeant Pharmaceuticals International, Inc.: | | | |
| 5.875% 5/15/23 (b) | | 2,165,000 | 1,748,238 |
| 6.75% 8/15/21 (b) | | 265,000 | 225,913 |
| | | | 3,174,151 |
| TOTAL HEALTH CARE | | | 25,354,620 |
| INDUSTRIALS - 3.0% | | | |
| Aerospace & Defense - 0.3% | | | |
| GenCorp, Inc. 7.125% 3/15/21 | | 140,000 | 147,700 |
| Huntington Ingalls Industries, Inc. 5% 11/15/25 (b) | | 550,000 | 581,625 |
| KLX, Inc. 5.875% 12/1/22 (b) | | 1,455,000 | 1,425,900 |
| TransDigm, Inc. 6.375% 6/15/26 (b) | | 590,000 | 588,525 |
| Triumph Group, Inc. 4.875% 4/1/21 | | 520,000 | 488,800 |
| | | | 3,232,550 |
| Airlines - 0.2% | | | |
| Air Canada 5.375% 11/15/22 (b) | | 149,468 | 150,216 |
| Allegiant Travel Co. 5.5% 7/15/19 | | 160,000 | 163,600 |
| Continental Airlines, Inc.: | | | |
| pass-thru trust certificates 6.903% 4/19/22 | | 30,015 | 31,553 |
| 6.125% 4/29/18 | | 180,000 | 189,450 |
| Delta Air Lines, Inc. pass-thru trust certificates: | | | |
| 6.821% 8/10/22 | | 504,542 | 586,278 |
| 8.021% 8/10/22 | | 150,655 | 172,500 |
| Hawaiian Airlines pass-thru certificates Series 2013-1 Class B, 4.95% 1/15/22 | | 233,749 | 225,567 |
| Northwest Airlines, Inc. pass-thru trust certificates 8.028% 11/1/17 | | 28,166 | 30,155 |
| U.S. Airways pass-thru certificates: | | | |
| Series 2011-1 Class A, 7.125% 4/22/25 | | 355,210 | 420,924 |
| Series 2012-2 Class B, 6.75% 12/3/22 | | 165,289 | 176,446 |
| Series 2013-1 Class B, 5.375% 5/15/23 | | 222,131 | 227,962 |
| | | | 2,374,651 |
| Building Products - 0.0% | | | |
| Shea Homes Ltd. Partnership/Corp.: | | | |
| 5.875% 4/1/23 (b) | | 185,000 | 183,150 |
| 6.125% 4/1/25 (b) | | 185,000 | 184,075 |
| | | | 367,225 |
| Commercial Services & Supplies - 0.6% | | | |
| ADT Corp. 6.25% 10/15/21 | | 1,560,000 | 1,657,500 |
| APX Group, Inc.: | | | |
| 7.875% 12/1/22 (b) | | 620,000 | 624,650 |
| 8.75% 12/1/20 | | 986,000 | 904,655 |
| Cenveo Corp. 6% 8/1/19 (b) | | 315,000 | 261,450 |
| Clean Harbors, Inc.: | | | |
| 5.125% 6/1/21 | | 320,000 | 327,398 |
| 5.25% 8/1/20 | | 1,050,000 | 1,074,938 |
| Covanta Holding Corp.: | | | |
| 5.875% 3/1/24 | | 1,870,000 | 1,823,250 |
| 7.25% 12/1/20 | | 430,000 | 442,900 |
| Garda World Security Corp.: | | | |
| 7.25% 11/15/21 (b) | | 225,000 | 181,688 |
| 7.25% 11/15/21 (b) | | 125,000 | 100,938 |
| TMS International Corp. 7.625% 10/15/21 (b) | | 110,000 | 76,450 |
| | | | 7,475,817 |
| Construction & Engineering - 0.1% | | | |
| AECOM Technology Corp.: | | | |
| 5.75% 10/15/22 | | 280,000 | 285,600 |
| 5.875% 10/15/24 | | 240,000 | 246,000 |
| Cementos Progreso Trust 7.125% 11/6/23 (b) | | 240,000 | 254,400 |
| Odebrecht Finance Ltd. 4.375% 4/25/25 (b) | | 475,000 | 205,200 |
| | | | 991,200 |
| Electrical Equipment - 0.1% | | | |
| Sensata Technologies BV: | | | |
| 4.875% 10/15/23 (b) | | 265,000 | 265,000 |
| 5% 10/1/25 (b) | | 575,000 | 577,524 |
| | | | 842,524 |
| Industrial Conglomerates - 0.0% | | | |
| Alfa SA de CV 5.25% 3/25/24 (b) | | 200,000 | 213,500 |
| Turk Sise ve Cam Fabrikalari A/S 4.25% 5/9/20 (Reg. S) | | 200,000 | 200,516 |
| | | | 414,016 |
| Machinery - 0.0% | | | |
| Schaeffler Finance BV 4.75% 5/15/21 (b) | | 520,000 | 531,050 |
| Marine - 0.0% | | | |
| Navios Maritime Acquisition Corp./Navios Acquisition Finance U.S., Inc. 8.125% 11/15/21 (b) | | 150,000 | 117,750 |
| Navios South American Logistics, Inc./Navios Logistics Finance U.S., Inc. 7.25% 5/1/22 (b) | | 490,000 | 345,450 |
| Ultrapetrol (Bahamas) Ltd. 8.875% 6/15/21 (d) | | 60,000 | 12,000 |
| | | | 475,200 |
| Professional Services - 0.1% | | | |
| Bureau Veritas SA 3.125% 1/21/21 (Reg. S) | EUR | 600,000 | 720,528 |
| Road & Rail - 0.0% | | | |
| JSC Georgian Railway 7.75% 7/11/22 (b) | | 200,000 | 220,500 |
| Lima Metro Line 2 Finance Ltd. 5.875% 7/5/34 (b) | | 250,000 | 262,125 |
| | | | 482,625 |
| Trading Companies & Distributors - 1.5% | | | |
| Aircastle Ltd.: | | | |
| 5% 4/1/23 | | 345,000 | 350,589 |
| 5.5% 2/15/22 | | 555,000 | 577,200 |
| 6.25% 12/1/19 | | 610,000 | 661,850 |
| 7.625% 4/15/20 | | 380,000 | 427,975 |
| Ashtead Capital, Inc. 5.625% 10/1/24 (b) | | 550,000 | 552,750 |
| International Lease Finance Corp.: | | | |
| 3.875% 4/15/18 | | 750,000 | 763,740 |
| 4.625% 4/15/21 | | 700,000 | 721,000 |
| 5.875% 4/1/19 | | 3,945,000 | 4,206,356 |
| 5.875% 8/15/22 | | 1,090,000 | 1,179,925 |
| 6.25% 5/15/19 | | 2,550,000 | 2,731,688 |
| 8.25% 12/15/20 | | 2,870,000 | 3,393,258 |
| 8.625% 1/15/22 | | 2,290,000 | 2,788,075 |
| NES Rentals Holdings, Inc. 7.875% 5/1/18 (b) | | 160,000 | 152,000 |
| | | | 18,506,406 |
| Transportation Infrastructure - 0.1% | | | |
| Aeropuertos Argentina 2000 SA: | | | |
| 10.75% 12/1/20 (b) | | 538,020 | 586,442 |
| 10.75% 12/1/20 (Reg. S) | | 37,800 | 41,202 |
| Autoridad del Canal de Panama 4.95% 7/29/35 (b) | | 260,000 | 279,244 |
| Global Ports Finance PLC 6.872% 1/25/22 (b) | | 490,000 | 505,925 |
| | | | 1,412,813 |
| TOTAL INDUSTRIALS | | | 37,826,605 |
| INFORMATION TECHNOLOGY - 2.3% | | | |
| Communications Equipment - 0.6% | | | |
| Banglalink Digital Communications Ltd.: | | | |
| 8.625% 5/6/19 (b) | | 1,075,000 | 1,128,750 |
| 8.625% 5/6/19 (Reg. S) | | 200,000 | 210,000 |
| Brocade Communications Systems, Inc. 4.625% 1/15/23 | | 350,000 | 337,313 |
| Lucent Technologies, Inc.: | | | |
| 6.45% 3/15/29 | | 4,279,000 | 4,460,858 |
| 6.5% 1/15/28 | | 560,000 | 575,400 |
| | | | 6,712,321 |
| Electronic Equipment & Components - 0.1% | | | |
| Flextronics International Ltd.: | | | |
| 4.625% 2/15/20 | | 500,000 | 517,500 |
| 5% 2/15/23 | | 260,000 | 269,750 |
| Micron Technology, Inc. 7.5% 9/15/23 (b) | | 565,000 | 600,313 |
| | | | 1,387,563 |
| Internet Software & Services - 0.2% | | | |
| CyrusOne LP/CyrusOne Finance Corp. 6.375% 11/15/22 | | 370,000 | 384,800 |
| j2 Global, Inc. 8% 8/1/20 | | 350,000 | 364,000 |
| VeriSign, Inc.: | | | |
| 4.625% 5/1/23 | | 465,000 | 470,813 |
| 5.25% 4/1/25 | | 565,000 | 579,125 |
| | | | 1,798,738 |
| IT Services - 0.1% | | | |
| CDW LLC/CDW Finance Corp. 5% 9/1/23 | | 565,000 | 568,949 |
| Ceridian HCM Holding, Inc. 11% 3/15/21 (b) | | 250,000 | 248,750 |
| Everi Payments, Inc. 10% 1/15/22 | | 575,000 | 480,125 |
| | | | 1,297,824 |
| Semiconductors & Semiconductor Equipment - 1.0% | | | |
| Entegris, Inc. 6% 4/1/22 (b) | | 155,000 | 158,681 |
| Micron Technology, Inc.: | | | |
| 5.25% 8/1/23 (b) | | 230,000 | 196,075 |
| 5.25% 1/15/24 (b) | | 490,000 | 415,275 |
| 5.5% 2/1/25 | | 1,605,000 | 1,364,250 |
| 5.625% 1/15/26 (b) | | 1,930,000 | 1,606,725 |
| 5.875% 2/15/22 | | 345,000 | 324,300 |
| Microsemi Corp. 9.125% 4/15/23 (b) | | 235,000 | 258,500 |
| NXP BV/NXP Funding LLC: | | | |
| 4.125% 6/1/21 (b) | | 465,000 | 471,975 |
| 4.625% 6/15/22 (b) | | 400,000 | 406,000 |
| 4.625% 6/1/23 (b) | | 465,000 | 473,138 |
| 5.75% 2/15/21 (b) | | 525,000 | 544,688 |
| 5.75% 3/15/23 (b) | | 2,415,000 | 2,523,675 |
| Qorvo, Inc.: | | | |
| 6.75% 12/1/23 (b) | | 440,000 | 457,600 |
| 7% 12/1/25 (b) | | 2,856,000 | 3,013,080 |
| Sensata Technologies UK Financing Co. PLC 6.25% 2/15/26 (b) | | 585,000 | 605,475 |
| | | | 12,819,437 |
| Software - 0.3% | | | |
| Activision Blizzard, Inc. 6.125% 9/15/23 (b) | | 770,000 | 837,375 |
| BMC Software Finance, Inc. 8.125% 7/15/21 (b) | | 465,000 | 348,750 |
| Ensemble S Merger Sub, Inc. 9% 9/30/23 (b) | | 970,000 | 957,875 |
| Infor Software Parent LLC/Infor Software Parent, Inc. 7.125% 5/1/21 pay-in-kind (b)(c) | | 210,000 | 185,850 |
| Nuance Communications, Inc. 5.375% 8/15/20 (b) | | 250,000 | 254,375 |
| Open Text Corp. 5.875% 6/1/26 (b) | | 465,000 | 467,906 |
| Parametric Technology Corp. 6% 5/15/24 | | 190,000 | 196,650 |
| SS&C Technologies Holdings, Inc. 5.875% 7/15/23 | | 455,000 | 465,238 |
| | | | 3,714,019 |
| Technology Hardware, Storage & Peripherals - 0.0% | | | |
| Diebold, Inc. 8.5% 4/15/24 (b) | | 485,000 | 481,363 |
| TOTAL INFORMATION TECHNOLOGY | | | 28,211,265 |
| MATERIALS - 4.5% | | | |
| Chemicals - 1.3% | | | |
| Albemarle Corp. U.S. 1.875% 12/8/21 (Reg. S) | EUR | 2,050,000 | 2,347,475 |
| Braskem Finance Ltd.: | | | |
| 5.375% 5/2/22 (b) | | 600,000 | 591,000 |
| 5.75% 4/15/21 (b) | | 400,000 | 401,000 |
| 6.45% 2/3/24 | | 400,000 | 404,040 |
| Chemtura Corp. 5.75% 7/15/21 | | 255,000 | 257,550 |
| Covestro AG 1.75% 9/25/24 (Reg. S) | EUR | 100,000 | 117,959 |
| CVR Partners LP 9.25% 6/15/23 (b) | | 620,000 | 630,850 |
| Kraton Polymers LLC/Kraton Polymers Capital Corp. 10.5% 4/15/23 (b) | | 390,000 | 415,350 |
| Mexichem S.A.B. de CV 4.875% 9/19/22 (b) | | 275,000 | 290,813 |
| Momentive Performance Materials, Inc.: | | | |
| 3.88% 10/24/21 | | 3,580,000 | 2,841,625 |
| 4.69% 4/24/22 | | 1,515,000 | 1,045,350 |
| 10% 10/15/20 (d) | | 1,515,000 | 0 |
| MPM Escrow LLC/MPM Finance Escrow Corp. 8.875% 10/15/20 (d) | | 3,580,000 | 0 |
| Nufarm Australia Ltd. 6.375% 10/15/19 (b) | | 210,000 | 212,100 |
| OCP SA 5.625% 4/25/24 (b) | | 200,000 | 212,000 |
| Platform Specialty Products Corp.: | | | |
| 6.5% 2/1/22 (b) | | 555,000 | 485,625 |
| 10.375% 5/1/21 (b) | | 175,000 | 176,313 |
| PolyOne Corp. 5.25% 3/15/23 | | 235,000 | 236,763 |
| Solvay SA 2.75% 12/2/27 (Reg. S) | EUR | 600,000 | 751,211 |
| TPC Group, Inc. 8.75% 12/15/20 (b) | | 765,000 | 598,613 |
| U.S. Coatings Acquisition, Inc./Flash Dutch 2 BV 7.375% 5/1/21 (b) | | 255,000 | 268,706 |
| W. R. Grace & Co.-Conn.: | | | |
| 5.125% 10/1/21 (b) | | 1,647,000 | 1,692,293 |
| 5.625% 10/1/24 (b) | | 1,870,000 | 1,916,750 |
| | | | 15,893,386 |
| Construction Materials - 0.2% | | | |
| CEMEX Finance LLC: | | | |
| 6% 4/1/24 (b) | | 200,000 | 194,000 |
| 9.375% 10/12/22 (b) | | 500,000 | 550,000 |
| CEMEX S.A.B. de CV 7.75% 4/16/26 (b) | | 265,000 | 278,012 |
| HeidelbergCement Finance AG 2.25% 6/3/24 (Reg. S) | EUR | 775,000 | 862,430 |
| Prince Mineral Holding Corp. 11.5% 12/15/19 (b) | | 175,000 | 152,250 |
| U.S. Concrete, Inc. 6.375% 6/1/24 (b) | | 300,000 | 300,000 |
| Union Andina de Cementos SAA 5.875% 10/30/21 (b) | | 300,000 | 304,050 |
| | | | 2,640,742 |
| Containers & Packaging - 0.8% | | | |
| Ardagh Finance Holdings SA 8.625% 6/15/19 pay-in-kind (b)(c) | | 3,384,964 | 3,406,649 |
| Ardagh Packaging Finance PLC/Ardagh MP Holdings U.S.A., Inc.: | | | |
| 4.625% 5/15/23 (b) | | 615,000 | 605,775 |
| 6% 6/30/21 (b) | | 350,000 | 347,375 |
| 6.25% 1/31/19 (b) | | 285,000 | 289,631 |
| 6.75% 1/31/21 (b) | | 605,000 | 608,781 |
| 7% 11/15/20 (b) | | 55,588 | 54,476 |
| 7.25% 5/15/24 (b) | | 1,100,000 | 1,122,688 |
| Beverage Packaging Holdings II SA (Luxembourg) 5.625% 12/15/16 (b) | | 625,000 | 626,563 |
| Consolidated Container Co. LLC/Consolidated Container Capital, Inc. 10.125% 7/15/20 (b) | | 210,000 | 190,575 |
| Crown Cork & Seal, Inc.: | | | |
| 7.375% 12/15/26 | | 1,210,000 | 1,331,000 |
| 7.5% 12/15/96 | | 160,000 | 163,400 |
| Sealed Air Corp. 5.25% 4/1/23 (b) | | 270,000 | 279,450 |
| Silgan Holdings, Inc. 5% 4/1/20 | | 960,000 | 982,800 |
| | | | 10,009,163 |
| Metals & Mining - 2.0% | | | |
| Aleris International, Inc. 6% 6/1/20 (b) | | 1,759 | 1,759 |
| Alrosa Finance SA 7.75% 11/3/20 (b) | | 200,000 | 227,808 |
| Bluescope Steel Ltd./Bluescope Steel Finance 6.5% 5/15/21 (b) | | 190,000 | 196,726 |
| Compania Minera Ares SAC 7.75% 1/23/21 (b) | | 600,000 | 623,250 |
| EVRAZ Group SA: | | | |
| 6.5% 4/22/20 (b) | | 480,000 | 490,200 |
| 8.25% 1/28/21 (Reg. S) | | 400,000 | 433,000 |
| 9.5% 4/24/18 (Reg. S) | | 825,000 | 895,950 |
| Evraz, Inc. NA Canada 7.5% 11/15/19 (b) | | 1,345,000 | 1,311,375 |
| Ferrexpo Finance PLC: | | | |
| 10.375% 4/7/19 (b) | | 150,000 | 123,750 |
| 10.375% 4/7/19 (b) | | 968,000 | 798,600 |
| First Quantum Minerals Ltd.: | | | |
| 6.75% 2/15/20 (b) | | 811,000 | 677,185 |
| 7% 2/15/21 (b) | | 270,000 | 217,013 |
| 7.25% 5/15/22 (b) | | 615,000 | 475,088 |
| FMG Resources (August 2006) Pty Ltd. 9.75% 3/1/22 (b) | | 465,000 | 513,244 |
| Freeport-McMoRan, Inc.: | | | |
| 3.55% 3/1/22 | | 310,000 | 272,800 |
| 3.875% 3/15/23 | | 930,000 | 813,750 |
| 5.4% 11/14/34 | | 155,000 | 123,225 |
| 5.45% 3/15/43 | | 1,195,000 | 958,988 |
| Gerdau Trade, Inc. 5.75% 1/30/21 (b) | | 200,000 | 190,600 |
| Gold Fields Orogen Holding BVI Ltd. 4.875% 10/7/20 (b) | | 1,725,000 | 1,699,125 |
| GTL Trade Finance, Inc. 5.893% 4/29/24 (b) | | 600,000 | 529,020 |
| JMC Steel Group, Inc. 9.875% 6/15/23 (b) | | 405,000 | 409,050 |
| Joseph T Ryerson & Son, Inc. 11% 5/15/22 (b) | | 350,000 | 362,250 |
| Lundin Mining Corp.: | | | |
| 7.5% 11/1/20 (b) | | 210,000 | 214,200 |
| 7.875% 11/1/22 (b) | | 30,000 | 30,675 |
| Metalloinvest Finance Ltd. 5.625% 4/17/20 (b) | | 695,000 | 723,648 |
| Metinvest BV: | | | |
| 8.75% 2/14/18 (Reg. S) | | 209,807 | 134,318 |
| 10.5% 11/28/17 (b) | | 1,485,366 | 950,932 |
| 10.5% 11/28/17 (Reg. S) | | 321,553 | 205,858 |
| Mirabela Nickel Ltd. 1% 9/10/44 (b) | | 1,278 | 0 |
| New Gold, Inc. 7% 4/15/20 (b) | | 150,000 | 153,000 |
| Nord Gold NV 6.375% 5/7/18 (b) | | 320,000 | 334,592 |
| Polyus Gold International Ltd.: | | | |
| 5.625% 4/29/20 (b) | | 1,000,000 | 1,049,500 |
| 5.625% 4/29/20 (Reg. S) | | 200,000 | 209,900 |
| Samarco Mineracao SA 5.75% 10/24/23 (b) | | 290,000 | 111,650 |
| Southern Copper Corp. 7.5% 7/27/35 | | 725,000 | 800,835 |
| Teck Resources Ltd.: | | | |
| 5.2% 3/1/42 | | 150,000 | 98,250 |
| 5.4% 2/1/43 | | 395,000 | 260,700 |
| 8% 6/1/21 (b) | | 1,110,000 | 1,143,300 |
| 8.5% 6/1/24 (b) | | 2,355,000 | 2,443,313 |
| United States Steel Corp. 8.375% 7/1/21 (b) | | 1,325,000 | 1,391,250 |
| Vale Overseas Ltd.: | | | |
| 4.375% 1/11/22 | | 740,000 | 693,528 |
| 4.625% 9/15/20 | | 380,000 | 369,075 |
| 5.875% 6/10/21 | | 300,000 | 300,375 |
| 6.875% 11/21/36 | | 280,000 | 254,800 |
| Vedanta Resources PLC 6% 1/31/19 (b) | | 875,000 | 747,031 |
| | | | 24,964,486 |
| Paper & Forest Products - 0.2% | | | |
| Boise Cascade Co. 6.375% 11/1/20 | | 145,000 | 147,900 |
| Mercer International, Inc.: | | | |
| 7% 12/1/19 | | 395,000 | 398,950 |
| 7.75% 12/1/22 | | 1,380,000 | 1,380,000 |
| NewPage Corp.: | | | |
| 0% 5/1/12 (c)(d) | | 90,000 | 0 |
| 11.375% 12/31/14 (d) | | 318,200 | 0 |
| Sino-Forest Corp. 6.25% 10/21/17 (b)(d) | | 565,000 | 0 |
| | | | 1,926,850 |
| TOTAL MATERIALS | | | 55,434,627 |
| TELECOMMUNICATION SERVICES - 6.7% | | | |
| Diversified Telecommunication Services - 2.7% | | | |
| Altice Financing SA: | | | |
| 6.5% 1/15/22 (b) | | 1,435,000 | 1,449,350 |
| 6.625% 2/15/23 (b) | | 1,080,000 | 1,060,420 |
| 7.5% 5/15/26 (b) | | 1,170,000 | 1,146,600 |
| Altice Finco SA: | | | |
| 8.125% 1/15/24 (b) | | 3,320,000 | 3,212,100 |
| 9.875% 12/15/20 (b) | | 655,000 | 698,803 |
| Citizens Communications Co.: | | | |
| 7.875% 1/15/27 | | 280,000 | 232,400 |
| 9% 8/15/31 | | 220,000 | 193,463 |
| FairPoint Communications, Inc. 8.75% 8/15/19 (b) | | 335,000 | 329,975 |
| Frontier Communications Corp. 11% 9/15/25 | | 1,215,000 | 1,257,525 |
| GCI, Inc. 6.875% 4/15/25 | | 560,000 | 566,653 |
| GTH Finance BV: | | | |
| 6.25% 4/26/20 (b) | | 600,000 | 621,768 |
| 7.25% 4/26/23 (b) | | 900,000 | 936,000 |
| Level 3 Communications, Inc. 5.75% 12/1/22 | | 595,000 | 602,438 |
| Level 3 Financing, Inc.: | | | |
| 5.125% 5/1/23 | | 575,000 | 569,969 |
| 5.375% 5/1/25 | | 575,000 | 570,688 |
| Lynx I Corp. 5.375% 4/15/21 (b) | | 301,500 | 306,776 |
| Lynx II Corp. 6.375% 4/15/23 (b) | | 200,000 | 200,000 |
| Numericable Group SA: | | | |
| 6% 5/15/22 (b) | | 6,120,000 | 5,951,700 |
| 6.25% 5/15/24 (b) | | 6,405,000 | 6,124,781 |
| 7.375% 5/1/26 (b) | | 2,405,000 | 2,377,944 |
| Qtel International Finance Ltd. 5% 10/19/25 (b) | | 275,000 | 307,450 |
| Sable International Finance Ltd. 6.875% 8/1/22 (b) | | 2,030,000 | 2,038,770 |
| Sprint Capital Corp.: | | | |
| 6.875% 11/15/28 | | 562,000 | 441,170 |
| 8.75% 3/15/32 | | 456,000 | 389,880 |
| Telefonica Celular del Paraguay SA 6.75% 12/13/22 (b) | | 400,000 | 402,000 |
| U.S. West Communications: | | | |
| 6.875% 9/15/33 | | 170,000 | 167,637 |
| 7.25% 9/15/25 | | 35,000 | 37,335 |
| 7.25% 10/15/35 | | 70,000 | 70,586 |
| UPCB Finance IV Ltd. 5.375% 1/15/25 (b) | | 615,000 | 608,850 |
| Virgin Media Finance PLC 4.875% 2/15/22 | | 565,000 | 473,188 |
| | | | 33,346,219 |
| Wireless Telecommunication Services - 4.0% | | | |
| America Movil S.A.B. de CV 6.45% 12/5/22 | MXN | 11,000,000 | 576,397 |
| Comcel Trust 6.875% 2/6/24 (b) | | 250,000 | 243,750 |
| Digicel Group Ltd.: | | | |
| 6.75% 3/1/23 (b) | | 385,000 | 327,250 |
| 7% 2/15/20 (b) | | 1,200,000 | 1,110,000 |
| 7.125% 4/1/22 (b) | | 3,265,000 | 2,428,344 |
| 8.25% 9/30/20 (b) | | 1,710,000 | 1,427,850 |
| Intelsat Jackson Holdings SA: | | | |
| 5.5% 8/1/23 | | 2,040,000 | 1,295,400 |
| 7.25% 10/15/20 | | 3,485,000 | 2,483,063 |
| 7.5% 4/1/21 | | 585,000 | 403,650 |
| 8% 2/15/24 (b) | | 1,515,000 | 1,492,275 |
| Millicom International Cellular SA: | | | |
| 4.75% 5/22/20 (b) | | 555,000 | 557,775 |
| 6% 3/15/25 (b) | | 1,145,000 | 1,116,375 |
| 6.625% 10/15/21 (b) | | 1,165,000 | 1,196,106 |
| MTS International Funding Ltd. 8.625% 6/22/20 (b) | | 415,000 | 486,592 |
| Neptune Finco Corp.: | | | |
| 6.625% 10/15/25 (b) | | 1,125,000 | 1,181,250 |
| 10.125% 1/15/23 (b) | | 1,160,000 | 1,299,200 |
| 10.875% 10/15/25 (b) | | 2,800,000 | 3,200,736 |
| Sprint Communications, Inc. 6% 11/15/22 | | 1,410,000 | 1,109,529 |
| Sprint Corp.: | | | |
| 7.125% 6/15/24 | | 2,940,000 | 2,344,650 |
| 7.625% 2/15/25 | | 1,655,000 | 1,309,519 |
| 7.875% 9/15/23 | | 1,505,000 | 1,230,338 |
| T-Mobile U.S.A., Inc.: | | | |
| 6% 3/1/23 | | 955,000 | 988,425 |
| 6% 4/15/24 | | 920,000 | 952,200 |
| 6.125% 1/15/22 | | 1,875,000 | 1,966,406 |
| 6.25% 4/1/21 | | 1,750,000 | 1,825,460 |
| 6.375% 3/1/25 | | 6,800,000 | 7,106,000 |
| 6.5% 1/15/24 | | 3,483,000 | 3,665,858 |
| 6.542% 4/28/20 | | 780,000 | 804,375 |
| 6.625% 4/1/23 | | 2,341,000 | 2,480,009 |
| 6.633% 4/28/21 | | 860,000 | 898,700 |
| 6.731% 4/28/22 | | 565,000 | 594,126 |
| 6.836% 4/28/23 | | 665,000 | 702,406 |
| TBG Global Pte. Ltd. 4.625% 4/3/18 (Reg. S) | | 220,000 | 223,300 |
| Vimpel Communications OJSC 7.748% 2/2/21 (Issued by VIP Finance Ireland Ltd. for Vimpel Communications) (b) | | 935,000 | 1,033,775 |
| | | | 50,061,089 |
| TOTAL TELECOMMUNICATION SERVICES | | | 83,407,308 |
| UTILITIES - 1.6% | | | |
| Electric Utilities - 0.1% | | | |
| Hrvatska Elektroprivreda 5.875% 10/23/22 (b) | | 200,000 | 210,092 |
| Israel Electric Corp. Ltd. 7.75% 12/15/27 (Reg. S) | | 250,000 | 306,250 |
| Lamar Funding Ltd. 3.958% 5/7/25 (b) | | 250,000 | 233,300 |
| RJS Power Holdings LLC 4.625% 7/15/19 (b) | | 535,000 | 470,800 |
| | | | 1,220,442 |
| Gas Utilities - 0.1% | | | |
| Southern Natural Gas Co.: | | | |
| 7.35% 2/15/31 | | 175,000 | 183,987 |
| 8% 3/1/32 | | 335,000 | 371,436 |
| | | | 555,423 |
| Independent Power and Renewable Electricity Producers - 1.4% | | | |
| Dynegy, Inc.: | | | |
| 7.375% 11/1/22 | | 1,910,000 | 1,843,150 |
| 7.625% 11/1/24 | | 2,165,000 | 2,078,400 |
| Energy Future Holdings Corp.: | | | |
| 10.875% 11/1/17 (d) | | 1,125,000 | 731,250 |
| 11.25% 11/1/17 pay-in-kind (c)(d) | | 896,100 | 582,465 |
| Energy Future Intermediate Holding Co. LLC/Energy Future Intermediate Holding Finance, Inc.: | | | |
| 11% 10/1/21 (d) | | 2,670,672 | 3,071,273 |
| 12.25% 3/1/22 (b)(d) | | 4,149,619 | 4,865,428 |
| Listrindo Capital BV 6.95% 2/21/19 (Reg. S) | | 600,000 | 620,280 |
| PPL Energy Supply LLC 6.5% 6/1/25 | | 460,000 | 381,800 |
| TerraForm Power Operating LLC: | | �� | |
| 5.875% 2/1/23 (b) | | 350,000 | 333,130 |
| 6.125% 6/15/25 (b) | | 180,000 | 170,100 |
| TXU Corp.: | | | |
| 5.55% 11/15/14 (d) | | 186,000 | 93,000 |
| 6.5% 11/15/24 (d) | | 3,225,000 | 1,612,500 |
| 6.55% 11/15/34 (d) | | 2,775,000 | 1,387,500 |
| | | | 17,770,276 |
| TOTAL UTILITIES | | | 19,546,141 |
|
| TOTAL NONCONVERTIBLE BONDS | | | 547,995,802 |
|
| TOTAL CORPORATE BONDS | | | |
| (Cost $552,816,152) | | | 548,230,868 |
|
| U.S. Government and Government Agency Obligations - 14.7% | | | |
| U.S. Government Agency Obligations - 0.4% | | | |
| Federal Home Loan Bank 1% 6/21/17 | | 880,000 | 883,342 |
| Tennessee Valley Authority: | | | |
| 1.75% 10/15/18 | | $1,672,000 | $1,706,669 |
| 4.25% 9/15/65 | | 1,270,000 | 1,491,865 |
| 5.25% 9/15/39 | | 126,000 | 172,787 |
| 5.375% 4/1/56 | | 414,000 | 576,203 |
|
| TOTAL U.S. GOVERNMENT AGENCY OBLIGATIONS | | | 4,830,866 |
|
| U.S. Treasury Obligations - 14.0% | | | |
| U.S. Treasury Bonds: | | | |
| 2.5% 2/15/46 | | 1,800,000 | 1,876,009 |
| 2.5% 5/15/46 | | 900,000 | 938,918 |
| 2.875% 8/15/45 | | 6,730,000 | 7,559,156 |
| 3% 11/15/44 | | 582,000 | 669,732 |
| 3% 11/15/45 | | 100,000 | 115,082 |
| 3.625% 2/15/44 | | 9,514,000 | 12,275,657 |
| 4.25% 5/15/39 | | 2,488,000 | 3,479,020 |
| 4.375% 2/15/38 | | 675,000 | 962,587 |
| 4.75% 2/15/37 | | 450,000 | 669,375 |
| 5.25% 2/15/29 | | 2,206,000 | 3,119,853 |
| 5.375% 2/15/31 (g) | | 1,869,000 | 2,772,546 |
| 6.25% 8/15/23 (h) | | 2,249,000 | 3,015,241 |
| 7.875% 2/15/21 | | 200,000 | 262,359 |
| U.S. Treasury Notes: | | | |
| 0.625% 8/31/17 | | 3,000,000 | 3,002,931 |
| 0.625% 6/30/18 | | 3,000,000 | 3,001,407 |
| 0.75% 4/15/18 | | 1,331,000 | 1,334,691 |
| 0.875% 11/30/17 | | 2,190,000 | 2,199,240 |
| 0.875% 1/31/18 | | 950,000 | 954,454 |
| 0.875% 5/31/18 | | 400,000 | 402,203 |
| 0.875% 6/15/19 | | 11,990,000 | 12,049,482 |
| 0.875% 7/31/19 | | 4,926,000 | 4,946,783 |
| 1% 5/31/18 | | 520,000 | 524,062 |
| 1.125% 6/15/18 | | 3,500,000 | 3,535,410 |
| 1.125% 1/15/19 | | 1,591,000 | 1,609,085 |
| 1.25% 11/30/18 | | 2,200,000 | 2,231,453 |
| 1.25% 3/31/21 | | 15,556,000 | 15,740,121 |
| 1.375% 7/31/18 | | 361,000 | 366,669 |
| 1.375% 9/30/18 | | 1,503,000 | 1,527,953 |
| 1.375% 2/28/19 | | 4,070,000 | 4,144,245 |
| 1.375% 3/31/20 | | 1,837,000 | 1,871,945 |
| 1.375% 4/30/20 | | 8,913,000 | 9,082,552 |
| 1.375% 6/30/23 | | 5,203,000 | 5,230,638 |
| 1.5% 12/31/18 | | 416,000 | 424,612 |
| 1.5% 1/31/19 | | 1,468,000 | 1,498,794 |
| 1.5% 1/31/22 | | 3,727,000 | 3,803,579 |
| 1.5% 2/28/23 | | 357,000 | 362,355 |
| 1.625% 4/30/19 | | 4,433,000 | 4,546,941 |
| 1.625% 6/30/19 | | 5,374,000 | 5,517,797 |
| 1.625% 7/31/20 | | 1,500,000 | 1,542,774 |
| 1.625% 2/15/26 | | 2,745,000 | 2,777,597 |
| 1.625% 5/15/26 | | 1,000,000 | 1,012,812 |
| 1.75% 9/30/19 | | 5,394,000 | 5,562,983 |
| 1.75% 12/31/20 | | 2,634,000 | 2,725,057 |
| 1.875% 8/31/17 | | 1,300,000 | 1,320,008 |
| 1.875% 9/30/17 | | 1,900,000 | 1,931,246 |
| 1.875% 10/31/17 | | 554,000 | 563,544 |
| 2% 11/30/22 | | 6,634,000 | 6,944,451 |
| 2% 8/15/25 | | 2,424,000 | 2,535,354 |
| 2.125% 6/30/21 | | 1,500,000 | 1,580,333 |
| 2.25% 7/31/21 | | 10,479,000 | 11,106,514 |
| 2.25% 11/15/25 | | 1,250,000 | 1,334,326 |
| 2.375% 7/31/17 | | 141,000 | 143,776 |
| 2.375% 8/15/24 | | 3,069,000 | 3,304,690 |
| 3.5% 2/15/18 | | 1,501,000 | 1,571,594 |
|
| TOTAL U.S. TREASURY OBLIGATIONS | | | 173,581,996 |
|
| Other Government Related - 0.3% | | | |
| National Credit Union Administration Guaranteed Notes: | | | |
| Series 2010-A1 Class A, 0.7879% 12/7/20 (NCUA Guaranteed) (c) | | 140,251 | 139,931 |
| Series 2011-R1 Class 1A, 0.8902% 1/8/20 (NCUA Guaranteed) (c) | | 312,614 | 313,176 |
| Series 2011-R4 Class 1A, 0.8159% 3/6/20 (NCUA Guaranteed) (c) | | 89,163 | 89,194 |
| National Credit Union Administration Guaranteed Notes Master Trust 3.45% 6/12/21 (NCUA Guaranteed) | | 3,400,000 | 3,745,461 |
|
| TOTAL OTHER GOVERNMENT RELATED | | | 4,287,762 |
|
| TOTAL U.S. GOVERNMENT AND GOVERNMENT AGENCY OBLIGATIONS | | | |
| (Cost $173,713,902) | | | 182,700,624 |
|
| U.S. Government Agency - Mortgage Securities - 1.5% | | | |
| Fannie Mae - 1.1% | | | |
| 2.115% 10/1/35 (c) | | 1,119 | 1,162 |
| 2.247% 11/1/35 (c) | | 16,813 | 17,422 |
| 2.29% 11/1/33 (c) | | 2,438 | 2,533 |
| 2.302% 6/1/36 (c) | | 2,455 | 2,572 |
| 2.315% 1/1/35 (c) | | 10,534 | 10,976 |
| 2.315% 9/1/36 (c) | | 4,330 | 4,536 |
| 2.367% 9/1/33 (c) | | 21,092 | 21,829 |
| 2.54% 6/1/42 (c) | | 29,274 | 30,505 |
| 2.55% 3/1/33 (c) | | 4,970 | 5,196 |
| 2.596% 11/1/36 (c) | | 2,735 | 2,880 |
| 2.598% 6/1/47 (c) | | 5,720 | 6,036 |
| 2.628% 7/1/35 (c) | | 15,948 | 16,769 |
| 2.667% 2/1/37 (c) | | 22,922 | 24,165 |
| 2.689% 2/1/42 (c) | | 212,520 | 222,042 |
| 2.69% 3/1/37 (c) | | 1,538 | 1,613 |
| 2.715% 2/1/36 (c) | | 635 | 666 |
| 2.754% 1/1/42 (c) | | 171,599 | 179,025 |
| 2.856% 5/1/36 (c) | | 1,754 | 1,866 |
| 2.951% 11/1/40 (c) | | 19,443 | 20,440 |
| 2.97% 8/1/35 (c) | | 22,160 | 23,189 |
| 2.98% 9/1/41 (c) | | 23,255 | 24,299 |
| 2.991% 10/1/41 (c) | | 8,966 | 9,389 |
| 3% 7/1/31 (i) | | 700,000 | 733,835 |
| 3% 7/1/31 (i) | | 700,000 | 733,835 |
| 3.009% 4/1/36 (c) | | 11,751 | 12,452 |
| 3.219% 7/1/41 (c) | | 30,465 | 31,989 |
| 3.352% 10/1/41 (c) | | 17,757 | 18,697 |
| 3.5% 7/1/46 (i) | | 2,500,000 | 2,637,081 |
| 3.5% 7/1/46 (i) | | 2,200,000 | 2,320,632 |
| 3.557% 7/1/41 (c) | | 37,483 | 39,515 |
| 4% 5/1/29 | | 3,225,416 | 3,465,054 |
| 4.5% 7/1/33 to 4/1/39 | | 1,727,058 | 1,904,602 |
| 5% 7/1/35 | | 530,559 | 593,223 |
| 5.5% 10/1/20 to 1/1/29 | | 268,595 | 294,356 |
| 6% 10/1/16 | | 60 | 60 |
| 6.5% 11/1/16 to 8/1/36 | | 406,660 | 474,947 |
|
| TOTAL FANNIE MAE | | | 13,889,388 |
|
| Freddie Mac - 0.2% | | | |
| 2.15% 1/1/36 (c) | | 4,845 | 5,017 |
| 2.2% 3/1/37 (c) | | 1,021 | 1,058 |
| 2.218% 2/1/37 (c) | | 2,751 | 2,861 |
| 2.285% 8/1/37 (c) | | 4,364 | 4,560 |
| 2.32% 3/1/35 (c) | | 3,899 | 4,019 |
| 2.35% 7/1/35 (c) | | 8,367 | 8,763 |
| 2.351% 10/1/42 (c) | | 166,795 | 176,561 |
| 2.38% 1/1/37 (c) | | 12,936 | 13,466 |
| 2.457% 6/1/33 (c) | | 12,034 | 12,618 |
| 2.54% 7/1/36 (c) | | 253,419 | 265,691 |
| 2.54% 6/1/37 (c) | | 14,673 | 15,500 |
| 2.55% 6/1/37 (c) | | 1,711 | 1,782 |
| 2.582% 5/1/37 (c) | | 2,966 | 3,097 |
| 2.668% 4/1/37 (c) | | 2,893 | 3,052 |
| 2.686% 5/1/37 (c) | | 3,827 | 4,056 |
| 2.696% 10/1/35 (c) | | 6,992 | 7,331 |
| 2.732% 10/1/36 (c) | | 16,880 | 17,684 |
| 2.752% 6/1/37 (c) | | 2,843 | 2,991 |
| 2.795% 7/1/36 (c) | | 4,190 | 4,459 |
| 2.798% 7/1/35 (c) | | 8,601 | 9,162 |
| 2.832% 5/1/37 (c) | | 42,431 | 44,755 |
| 2.845% 4/1/37 (c) | | 475 | 503 |
| 2.885% 5/1/37 (c) | | 18,507 | 19,491 |
| 2.977% 10/1/41 (c) | | 152,702 | 160,303 |
| 2.99% 9/1/35 (c) | | 3,373 | 3,551 |
| 3% 2/1/31 | | 700,000 | 737,491 |
| 3.068% 9/1/41 (c) | | 197,528 | 207,138 |
| 3.205% 9/1/41 (c) | | 25,016 | 26,270 |
| 3.212% 4/1/41 (c) | | 22,145 | 23,178 |
| 3.29% 6/1/41 (c) | | 25,042 | 26,318 |
| 3.433% 5/1/41 (c) | | 16,988 | 17,834 |
| 3.569% 10/1/35 (c) | | 1,970 | 2,099 |
| 3.634% 6/1/41 (c) | | 33,630 | 35,354 |
| 3.704% 5/1/41 (c) | | 27,851 | 29,294 |
| 6% 1/1/24 | | 103,665 | 114,493 |
| 6.5% 1/1/17 to 3/1/22 | | 19,814 | 21,577 |
|
| TOTAL FREDDIE MAC | | | 2,033,377 |
|
| Ginnie Mae - 0.2% | | | |
| 4.3% 8/20/61 (j) | | 302,699 | 314,221 |
| 4.649% 2/20/62 (j) | | 200,568 | 212,509 |
| 4.682% 2/20/62 (j) | | 271,197 | 286,580 |
| 4.684% 1/20/62 (j) | | 1,231,874 | 1,301,726 |
| 5.47% 8/20/59 (j) | | 59,545 | 60,671 |
| 5.5% 11/15/35 | | 171,710 | 198,258 |
| 5.612% 4/20/58 (j) | | 4,072 | 4,119 |
| 6% 6/15/36 | | 323,780 | 378,565 |
|
| TOTAL GINNIE MAE | | | 2,756,649 |
|
| TOTAL U.S. GOVERNMENT AGENCY - MORTGAGE SECURITIES | | | |
| (Cost $18,496,468) | | | 18,679,414 |
|
| Collateralized Mortgage Obligations - 3.5% | | | |
| U.S. Government Agency - 3.5% | | | |
| Fannie Mae: | | | |
| floater Series 2010-15 Class FJ, 1.3833% 6/25/36 (c) | | $363,208 | $368,104 |
| planned amortization class: | | | |
| Series 2002-9 Class PC, 6% 3/25/17 | | 107 | 108 |
| Series 2003-70 Class BJ, 5% 7/25/33 | | 18,854 | 21,034 |
| Series 2005-19 Class PA, 5.5% 7/25/34 | | 110,159 | 117,955 |
| Series 2005-27 Class NE, 5.5% 5/25/34 | | 87,322 | 89,162 |
| Series 2005-64 Class PX, 5.5% 6/25/35 | | 112,975 | 124,491 |
| Series 2005-68 Class CZ, 5.5% 8/25/35 | | 412,367 | 468,582 |
| Series 2010-118 Class PB, 4.5% 10/25/40 | | 300,000 | 331,104 |
| sequential payer: | | | |
| Series 2002-57 Class BD, 5.5% 9/25/17 | | 900 | 915 |
| Series 2003-117 Class MD, 5% 12/25/23 | | 80,826 | 87,997 |
| Series 2004-52 Class KZ, 5.5% 7/25/34 | | 865,418 | 981,215 |
| Series 2004-91 Class Z, 5% 12/25/34 | | 325,952 | 363,882 |
| Series 2005-117 Class JN, 4.5% 1/25/36 | | 40,000 | 43,266 |
| Series 2005-14 Class ZB, 5% 3/25/35 | | 128,738 | 143,731 |
| Series 2006-72 Class CY, 6% 8/25/26 | | 59,996 | 66,248 |
| Series 2009-59 Class HB, 5% 8/25/39 | | 178,856 | 199,607 |
| Series 2010-88 Class NA, 4% 8/25/28 | | 301,572 | 303,464 |
| Series 2010-97 Class CX, 4.5% 9/25/25 | | 550,000 | 618,207 |
| Series 2009-85 Class IB, 4.5% 8/25/24 (k) | | 17,139 | 1,125 |
| Series 2009-93 Class IC, 4.5% 9/25/24 (k) | | 26,140 | 1,643 |
| Series 2010-139 Class NI, 4.5% 2/25/40 (k) | | 193,289 | 24,256 |
| Series 2010-39 Class FG, 1.3733% 3/25/36 (c) | | 228,032 | 232,509 |
| Series 2010-97 Class CI, 4.5% 8/25/25 (k) | | 58,242 | 3,325 |
| Series 2011-67 Class AI, 4% 7/25/26 (k) | | 57,857 | 5,905 |
| Series 2012-27 Class EZ, 4.25% 3/25/42 | | 499,231 | 547,857 |
| Series 2016-26 Class CG, 3% 5/25/46 | | 1,149,924 | 1,200,989 |
| Freddie Mac: | | | |
| floater: | | | |
| Series 2630 Class FL, 0.9421% 6/15/18 (c) | | 248 | 249 |
| Series 2711 Class FC, 1.3421% 2/15/33 (c) | | 129,667 | 131,343 |
| floater planned amortization class Series 2770 Class FH, 0.8421% 3/15/34 (c) | | 153,706 | 154,056 |
| planned amortization class: | | | |
| Series 2101 Class PD, 6% 11/15/28 | | 2,742 | 3,000 |
| Series 2376 Class JE, 5.5% 11/15/16 | | 320 | 322 |
| Series 2381 Class OG, 5.5% 11/15/16 | | 53 | 53 |
| Series 2425 Class JH, 6% 3/15/17 | | 711 | 720 |
| Series 2996 Class MK, 5.5% 6/15/35 | | 5,858 | 6,613 |
| Series 3415 Class PC, 5% 12/15/37 | | 56,538 | 62,074 |
| Series 3763 Class QA, 4% 4/15/34 | | 110,924 | 113,153 |
| Series 3840 Class VA, 4.5% 9/15/27 | | 243,582 | 259,495 |
| planned amortization class sequential payer Series 2005-2963 Class VB, 5% 11/15/34 | | 73,316 | 73,797 |
| sequential payer: | | | |
| Series 2004-2802 Class ZG, 5.5% 5/15/34 | | 655,448 | 750,814 |
| Series 2303 Class ZV, 6% 4/15/31 | | 6,506 | 7,163 |
| Series 2877 Class ZD, 5% 10/15/34 | | 393,752 | 439,462 |
| Series 3745 Class KV, 4.5% 12/15/26 | | 416,955 | 460,491 |
| Series 3806 Class L, 3.5% 2/15/26 | | 453,000 | 500,744 |
| Series 3843 Class PZ, 5% 4/15/41 | | 145,017 | 181,906 |
| Freddie Mac Multi-family Structured pass-thru certificates sequential payer: | | | |
| Series 4335 Class AL, 4.25% 3/15/40 | | 468,206 | 499,707 |
| Series 4341 Class ML, 3.5% 11/15/31 | | 644,489 | 685,947 |
| Ginnie Mae guaranteed REMIC pass-thru certificates: | | | |
| floater: | | | |
| Series 2007-59 Class FC, 0.9481% 7/20/37 (c) | | 76,488 | 76,803 |
| Series 2008-2 Class FD, 0.9281% 1/20/38 (c) | | 18,918 | 18,991 |
| Series 2008-73 Class FA, 1.3081% 8/20/38 (c) | | 122,516 | 124,589 |
| Series 2008-83 Class FB, 1.3481% 9/20/38 (c) | | 113,938 | 115,959 |
| Series 2009-108 Class CF, 1.0423% 11/16/39 (c) | | 89,639 | 90,288 |
| Series 2009-116 Class KF, 0.9723% 12/16/39 (c) | | 70,712 | 71,065 |
| Series 2010-H17 Class FA, 0.7797% 7/20/60 (c)(j) | | 432,576 | 427,292 |
| Series 2010-H18 Class AF, 0.7358% 9/20/60 (c)(j) | | 531,927 | 524,914 |
| Series 2010-H19 Class FG, 0.7358% 8/20/60 (c)(j) | | 577,241 | 569,769 |
| Series 2010-H27 Series FA, 0.8158% 12/20/60 (c)(j) | | 238,390 | 235,894 |
| Series 2011-H05 Class FA, 0.9358% 12/20/60 (c)(j) | | 332,166 | 330,464 |
| Series 2011-H07 Class FA, 0.9358% 2/20/61 (c)(j) | | 564,998 | 562,268 |
| Series 2011-H12 Class FA, 0.9258% 2/20/61 (c)(j) | | 803,438 | 799,226 |
| Series 2011-H13 Class FA, 0.9358% 4/20/61 (c)(j) | | 291,146 | 289,686 |
| Series 2011-H14: | | | |
| Class FB, 0.9358% 5/20/61 (c)(j) | | 350,296 | 348,323 |
| Class FC, 0.9358% 5/20/61 (c)(j) | | 306,349 | 304,716 |
| Series 2011-H17 Class FA, 0.9658% 6/20/61 (c)(j) | | 404,557 | 403,015 |
| Series 2011-H21 Class FA, 1.0358% 10/20/61 (c)(j) | | 449,987 | 449,287 |
| Series 2012-H01 Class FA, 1.1358% 11/20/61 (c)(j) | | 390,343 | 391,138 |
| Series 2012-H03 Class FA, 1.1358% 1/20/62 (c)(j) | | 246,997 | 247,501 |
| Series 2012-H06 Class FA, 1.0658% 1/20/62 (c)(j) | | 383,992 | 383,790 |
| Series 2012-H07 Class FA, 1.0658% 3/20/62 (c)(j) | | 228,942 | 228,813 |
| Series 2013-H19 Class FD, 1.0358% 8/20/63 (c)(j) | | 200,290 | 199,947 |
| Series 2014-H11 Class BA, 0.9358% 6/20/64 (c)(j) | | 1,769,160 | 1,759,103 |
| Series 2015-H13 Class FL, 0.7158% 5/20/63 (c)(j) | | 1,899,407 | 1,892,388 |
| Series 2015-H19 Class FA, 0.6358% 4/20/63 (c)(j) | | 1,795,988 | 1,787,281 |
| floater sequential payer Series 2011-150 Class D, 3% 4/20/37 | | 2,107 | 2,117 |
| planned amortization class: | | | |
| Series 2010-31 Class BP, 5% 3/20/40 | | 620,000 | 729,584 |
| Series 2010-59 Class PB, 4.5% 7/20/39 | | 821,024 | 870,488 |
| Series 2011-136 Class WI, 4.5% 5/20/40 (k) | | 137,790 | 12,018 |
| sequential payer: | | | |
| Series 2011-69 Class GX, 4.5% 5/16/40 | | 470,000 | 530,552 |
| Series 2013-H06 Class HA, 1.65% 1/20/63 (j) | | 309,844 | 311,136 |
| Series 2013-H26 Class HA, 3.5% 9/20/63 (j) | | 1,320,424 | 1,384,132 |
| Series 2014-H12 Class KA, 2.75% 5/20/64 (j) | | 385,802 | 400,429 |
| Series 2010-H15 Class TP, 5.15% 8/20/60 (j) | | 982,613 | 1,041,656 |
| Series 2010-H17 Class XP, 5.2994% 7/20/60 (c)(j) | | 1,298,692 | 1,370,184 |
| Series 2010-H18 Class PL, 5.01% 9/20/60 (c)(j) | | 984,754 | 1,042,273 |
| Series 2011-71 Class ZB, 5.5% 8/20/34 | | 690,604 | 791,868 |
| Series 2012-64 Class KB, 10.8402% 5/20/41 (c) | | 26,249 | 34,410 |
| Series 2013-124: | | | |
| Class ES, 8.0693% 4/20/39 (c)(l) | | 529,267 | 580,134 |
| Class ST, 8.2026% 8/20/39 (c)(l) | | 1,004,740 | 1,122,494 |
| Series 2015-H17 Class HA, 2.5% 5/20/65 (j) | | 1,305,034 | 1,332,676 |
| Series 2015-H21: | | | |
| Class HA, 2.5% 6/20/63 (j) | | 2,934,464 | 2,987,869 |
| Class JA, 2.5% 6/20/65 (j) | | 370,725 | 377,700 |
| Series 2015-H30 Class HA, 1.75% 9/20/62 (c)(j) | | 2,729,313 | 2,737,037 |
| Series 2016-H13 Class FB, 1.19% 5/20/66 (c)(j) | | 1,423,000 | 1,421,332 |
| Series 2090-118 Class XZ, 5% 12/20/39 | | 726,126 | 892,184 |
| TOTAL COLLATERALIZED MORTGAGE OBLIGATIONS | | | |
| (Cost $43,019,436) | | | 43,282,573 |
|
| Commercial Mortgage Securities - 0.8% | | | |
| Freddie Mac: | | | |
| pass-thru certificates sequential payer Series K011 Class A2, 4.084% 11/25/20 | | 260,000 | 288,080 |
| sequential payer: | | | |
| Series K006 Class A2, 4.251% 1/25/20 | | 1,042,000 | 1,142,817 |
| Series K027 Class A2, 2.637% 1/25/23 | | 377,000 | 397,915 |
| Series K029 Class A2, 3.32% 2/25/23 (c) | | 198,000 | 217,217 |
| Series K034 Class A1, 2.669% 2/25/23 | | 993,816 | 1,029,252 |
| Series K037 Class A2, 3.49% 1/25/24 | | 611,000 | 678,858 |
| Series K039 Class A2, 3.303% 7/25/24 | | 2,013,000 | 2,214,815 |
| Series K042 Class A2, 2.67% 12/25/24 | | 1,700,000 | 1,787,627 |
| Series K501 Class A2, 1.655% 11/25/16 | | 305,632 | 305,725 |
| Freddie Mac Multi-family Structured pass-thru certificates: | | | |
| sequential payer Series K038 Class A2, 3.389% 3/25/24 | | 350,000 | 387,037 |
| Series K044 Class A2, 2.811% 1/25/25 | | 1,600,000 | 1,698,685 |
| TOTAL COMMERCIAL MORTGAGE SECURITIES | | | |
| (Cost $9,768,292) | | | 10,148,028 |
|
| Foreign Government and Government Agency Obligations - 15.5% | | | |
| Argentine Republic: | | | |
| 6.25% 4/22/19 (b) | | 1,580,000 | 1,647,150 |
| 6.875% 4/22/21 (b) | | 2,435,000 | 2,596,928 |
| 7% 4/17/17 | | 5,815,000 | 5,965,059 |
| 7.5% 4/22/26 (b) | | 870,000 | 940,470 |
| 8.75% 5/7/24 | | 305,000 | 349,496 |
| Australian Commonwealth: | | | |
| 1.75% 11/21/20 | AUD | 6,600,000 | 4,957,243 |
| 3.75% 4/21/37 (Reg. S) | AUD | 1,200,000 | 1,064,701 |
| 5.5% 1/21/18 | AUD | 1,850,000 | 1,462,090 |
| Azerbaijan Republic 4.75% 3/18/24 (b) | | 250,000 | 252,825 |
| Belarus Republic 8.95% 1/26/18 | | 1,790,000 | 1,856,230 |
| Brazilian Federative Republic: | | | |
| 4.25% 1/7/25 | | 630,000 | 618,975 |
| 5.625% 1/7/41 | | 915,000 | 887,550 |
| 6% 4/7/26 | | 395,000 | 428,575 |
| 7.125% 1/20/37 | | 1,685,000 | 1,895,625 |
| 8.25% 1/20/34 | | 2,250,000 | 2,733,750 |
| Buenos Aires Province: | | | |
| 5.75% 6/15/19 (b) | | 300,000 | 303,750 |
| 9.375% 9/14/18 (b) | | 410,000 | 442,800 |
| 10.875% 1/26/21 (b) | | 100,000 | 112,750 |
| 10.875% 1/26/21 (Reg. S) | | 2,405,000 | 2,711,638 |
| Buoni del Tesoro Poliennali: | | | |
| 2.7% 3/1/47 (b) | EUR | 800,000 | 949,176 |
| 4.5% 3/1/24 | EUR | 11,975,000 | 16,714,152 |
| Canadian Government 1.5% 2/1/17 | CAD | 9,050,000 | 7,044,563 |
| Central Bank of Nigeria warrants 11/15/20 (m) | | 750 | 57,658 |
| City of Buenos Aires 8.95% 2/19/21 (b) | | 695,000 | 774,925 |
| Colombian Republic: | | | |
| 4.375% 3/21/23 | COP | 3,427,000,000 | 1,000,666 |
| 5% 6/15/45 | | 200,000 | 207,500 |
| 5.625% 2/26/44 | | 200,000 | 221,500 |
| 7.375% 9/18/37 | | 365,000 | 474,044 |
| 10.375% 1/28/33 | | 905,000 | 1,357,500 |
| Congo Republic 4% 6/30/29 (e) | | 1,676,180 | 1,207,185 |
| Costa Rican Republic 7% 4/4/44 (b) | | 670,000 | 666,650 |
| Croatia Republic: | | | |
| 5.5% 4/4/23 (b) | | 175,000 | 185,430 |
| 6% 1/26/24 (b) | | 200,000 | 218,060 |
| 6.375% 3/24/21 (b) | | 500,000 | 545,475 |
| 6.625% 7/14/20 (b) | | 170,000 | 185,470 |
| 6.75% 11/5/19(b) | | 155,000 | 168,756 |
| Danish Kingdom 1.75% 11/15/25 | DKK | 9,600,000 | 1,641,879 |
| Democratic Socialist Republic of Sri Lanka: | | | |
| 6.25% 10/4/20 (b) | | 330,000 | 336,642 |
| 6.25% 7/27/21 (b) | | 210,000 | 211,213 |
| Dominican Republic: | | | |
| 1.5% 8/30/24 (c) | | 1,820,000 | 1,774,500 |
| 6.85% 1/27/45 (b) | | 690,000 | 714,150 |
| 6.875% 1/29/26 (b) | | 660,000 | 728,310 |
| 7.45% 4/30/44 (b) | | 830,000 | 913,000 |
| 7.5% 5/6/21 (b) | | 515,000 | 572,165 |
| Dutch Government 0.5% 7/15/26(Reg. S) (b) | EUR | 150,000 | 172,070 |
| French Government: | | | |
| OAT: | | | |
| 1.75% 5/25/23 | EUR | 50,000 | 62,684 |
| 3.25% 5/25/45 | EUR | 2,300,000 | 3,988,909 |
| 0.5% 5/25/26 | EUR | 350,000 | 397,036 |
| Georgia Republic 6.875% 4/12/21 (b) | | 210,000 | 231,025 |
| Guatemalan Republic 4.5% 5/3/26 (b) | | 200,000 | 203,500 |
| Hong Kong Government SAR 1.32% 12/23/19 | HKD | 2,700,000 | 357,018 |
| Hungarian Republic: | | | |
| 5.375% 3/25/24 | | 268,000 | 299,356 |
| 5.75% 11/22/23 | | 427,000 | 486,097 |
| 7.625% 3/29/41 | | 334,000 | 484,300 |
| Indonesian Republic: | | | |
| 3.375% 4/15/23 (b) | | 280,000 | 281,520 |
| 4.75% 1/8/26 (b) | | 295,000 | 321,217 |
| 5.25% 1/17/42 (b) | | 270,000 | 286,373 |
| 5.375% 10/17/23 | | 200,000 | 225,061 |
| 5.95% 1/8/46 (b) | | 290,000 | 341,716 |
| 6.625% 2/17/37 (b) | | 525,000 | 646,868 |
| 6.75% 1/15/44 (b) | | 205,000 | 260,503 |
| 7.75% 1/17/38 (b) | | 1,070,000 | 1,452,007 |
| 8.375% 3/15/24 | IDR | 6,209,000,000 | 495,545 |
| 8.5% 10/12/35 (Reg. S) | | 900,000 | 1,284,302 |
| Irish Republic: | | | |
| 1% 5/15/26(Reg. S) | EUR | 2,600,000 | 3,007,440 |
| 2% 2/18/45 (Reg.S) | EUR | 350,000 | 453,084 |
| Islamic Republic of Pakistan: | | | |
| 7.25% 4/15/19 (b) | | 965,000 | 1,013,476 |
| 8.25% 4/15/24 (b) | | 200,000 | 210,347 |
| Israeli State (guaranteed by U.S. Government through Agency for International Development): | | | |
| 5.5% 9/18/23 | | 4,140,000 | 5,235,415 |
| 5.5% 12/4/23 | | 1,628,000 | 2,050,276 |
| Ivory Coast 5.75% 12/31/32 | | 1,225,000 | 1,140,671 |
| Japan Government: | | | |
| 0.1% 8/15/17 | JPY | 190,000,000 | 1,848,211 |
| 0.1% 12/20/20 | JPY | 656,700,000 | 6,478,878 |
| 0.9% 3/20/22 | JPY | 100,000,000 | 1,037,050 |
| 0.9% 6/20/22 | JPY | 874,050,000 | 9,091,855 |
| 1.9% 9/20/30 | JPY | 825,000,000 | 10,297,308 |
| Jordanian Kingdom: | | | |
| 2.503% 10/30/20 | | 2,924,000 | 3,096,794 |
| 3% 6/30/25 | | 1,179,000 | 1,286,111 |
| Kazakhstan Republic: | | | |
| 5.125% 7/21/25 (b) | | 205,000 | 224,500 |
| 6.5% 7/21/45 (b) | | 285,000 | 331,210 |
| Kingdom of Norway 3.75% 5/25/21 | NOK | 4,800,000 | 658,946 |
| Lebanese Republic: | | | |
| 4% 12/31/17 | | 676,500 | 667,232 |
| 5.45% 11/28/19 | | 255,000 | 251,099 |
| 6.375% 3/9/20 | | 150,000 | 152,025 |
| New Zealand Government 6% 5/15/21 | NZD | 1,000,000 | 844,051 |
| Ontario Province 2.4% 6/2/26 | CAD | 3,600,000 | 2,893,849 |
| Panamanian Republic: | | | |
| 6.7% 1/26/36 | | 140,000 | 185,850 |
| 8.875% 9/30/27 | | 75,000 | 110,250 |
| 9.375% 4/1/29 | | 140,000 | 213,500 |
| Perusahaan Penerbit SBSN 4.55% 3/29/26 (b) | | 300,000 | 313,500 |
| Peruvian Republic 4% 3/7/27 (e) | | 570,000 | 570,000 |
| Philippine Republic: | | | |
| 7.75% 1/14/31 | | 305,000 | 473,367 |
| 9.5% 2/2/30 | | 300,000 | 513,162 |
| Provincia de Cordoba: | | | |
| 7.125% 6/10/21 (b) | | 750,000 | 751,875 |
| 12.375% 8/17/17 (b) | | 515,000 | 554,913 |
| Republic of Angola 7% 8/16/19 (Issued by Northern Lights III BV for Republic of Angola) (Reg. S) | | 629,688 | 634,410 |
| Republic of Armenia: | | | |
| 6% 9/30/20 (b) | | 920,000 | 925,722 |
| 7.15% 3/26/25 (b) | | 400,000 | 406,000 |
| Republic of Iceland 5.875% 5/11/22 (b) | | 240,000 | 280,138 |
| Republic of Iraq 5.8% 1/15/28 (Reg. S) | | 1,750,000 | 1,332,275 |
| Republic of Nigeria 5.125% 7/12/18 (b) | | 605,000 | 605,532 |
| Republic of Serbia: | | | |
| 6.75% 11/1/24 (b) | | 786,400 | 808,026 |
| 7.25% 9/28/21 (b) | | 600,000 | 686,838 |
| Republic of Singapore 3.25% 9/1/20 | SGD | 3,400,000 | 2,720,283 |
| Russian Federation: | | | |
| 4.5% 4/4/22 (b) | | 200,000 | 213,730 |
| 4.875% 9/16/23 (b) | | 600,000 | 654,444 |
| 5% 4/29/20 (b) | | 300,000 | 323,676 |
| 5.625% 4/4/42 (b) | | 400,000 | 452,352 |
| 5.875% 9/16/43 (b) | | 800,000 | 934,720 |
| 12.75% 6/24/28 (Reg. S) | | 2,615,000 | 4,578,112 |
| South African Republic 5.875% 5/30/22 | | 100,000 | 111,300 |
| Spanish Kingdom: | | | |
| 0.75% 7/30/21 | EUR | 4,200,000 | 4,774,351 |
| 2.75% 10/31/24 (Reg. S) | EUR | 3,150,000 | 3,969,378 |
| Sweden Kingdom 3.5% 6/1/22 | SEK | 18,500,000 | 2,674,030 |
| Switzerland Confederation 4.25% 6/5/17 | CHF | 3,050,000 | 3,276,456 |
| Turkish Republic: | | | |
| 5.125% 3/25/22 | | 385,000 | 411,656 |
| 5.625% 3/30/21 | | 490,000 | 534,100 |
| 6.25% 9/26/22 | | 275,000 | 310,973 |
| 6.75% 4/3/18 | | 205,000 | 220,478 |
| 6.75% 5/30/40 | | 495,000 | 603,453 |
| 6.875% 3/17/36 | | 505,000 | 615,635 |
| 7% 3/11/19 | | 345,000 | 381,769 |
| 7% 6/5/20 | | 250,000 | 283,543 |
| 7.25% 3/5/38 | | 345,000 | 440,289 |
| 7.375% 2/5/25 | | 400,000 | 493,548 |
| 7.5% 11/7/19 | | 795,000 | 907,962 |
| 8% 2/14/34 | | 300,000 | 403,902 |
| 9.4% 7/8/20 | TRY | 1,435,000 | 508,598 |
| 11.875% 1/15/30 | | 555,000 | 968,475 |
| Turkiye Ihracat Kredi Bankasi A/S 5.375% 2/8/21 (b) | | 265,000 | 276,930 |
| Ukraine Government: | | | |
| 0% 5/31/40 (b)(c) | | 304,000 | 98,481 |
| 7.75% 9/1/20 (b) | | 368,000 | 359,794 |
| 7.75% 9/1/21 (b) | | 328,000 | 319,046 |
| 7.75% 9/1/22 (b) | | 226,000 | 218,486 |
| 7.75% 9/1/23 (b) | | 105,000 | 101,084 |
| 7.75% 9/1/24(b) | | 105,000 | 100,511 |
| 7.75% 9/1/25 (b) | | 105,000 | 100,034 |
| 7.75% 9/1/27 (b) | | 150,000 | 141,780 |
| United Kingdom, Great Britain and Northern Ireland 1% 9/7/17 | GBP | 4,500,000 | 6,045,948 |
| United Kingdom, Great Britain and Northern Ireland Treasury Indexed-Linked GILT 2.5% 7/22/65 (Reg. S) | GBP | 1,500,000 | 2,670,007 |
| United Mexican States: | | | |
| 4% 10/2/23 | | 488,000 | 525,356 |
| 4.6% 1/23/46 | | 300,000 | 316,500 |
| 4.75% 3/8/44 | | 204,000 | 219,810 |
| 5.55% 1/21/45 | | 265,000 | 317,338 |
| 6.05% 1/11/40 | | 217,000 | 272,878 |
| 6.5% 6/10/21 | MXN | 8,615,000 | 492,428 |
| Uruguay Republic 7.875% 1/15/33 pay-in-kind | | 440,000 | 598,950 |
| Venezuelan Republic: | | | |
| oil recovery rights 4/15/20 (m) | | 10,236 | 10,236 |
| 9.25% 9/15/27 | | 1,145,000 | 552,463 |
| 11.95% 8/5/31 (Reg. S) | | 750,000 | 352,500 |
| 12.75% 8/23/22 | | 440,000 | 222,200 |
| Vietnamese Socialist Republic: | | | |
| 1.75% 3/13/28 (c) | | 75,000 | 65,063 |
| 4% 3/12/28 (e) | | 2,009,583 | 1,976,928 |
| 4.8% 11/19/24 (b) | | 200,000 | 205,802 |
| 6.75% 1/29/20 (b) | | 400,000 | 443,363 |
| TOTAL FOREIGN GOVERNMENT AND GOVERNMENT AGENCY OBLIGATIONS | | | |
| (Cost $182,806,595) | | | 192,781,596 |
|
| Supranational Obligations - 0.1% | | | |
European Investment Bank 1.125% 9/15/36 (Reg. S)
(Cost $1,130,759) | EUR | 1,000,000 | 1,176,557 |
| | | Shares | Value |
|
| Common Stocks - 4.0% | | | |
| CONSUMER DISCRETIONARY - 1.2% | | | |
| Auto Components - 0.3% | | | |
| Chassix Holdings, Inc. | | 33,750 | 1,106,325 |
| Chassix Holdings, Inc. warrants (n) | | 1,921 | 16,348 |
| Delphi Automotive PLC | | 13,500 | 845,100 |
| Exide Technologies (n) | | 7,052 | 0 |
| Exide Technologies (n) | | 2,115 | 0 |
| Lear Corp. | | 9,700 | 987,072 |
| Tenneco, Inc. (n) | | 14,900 | 694,489 |
| | | | 3,649,334 |
| Automobiles - 0.0% | | | |
| General Motors Co. | | 328 | 9,282 |
| Diversified Consumer Services - 0.0% | | | |
| Houghton Mifflin Harcourt Co. warrants 6/22/19 (n)(o) | | 2,218 | 8,295 |
| Hotels, Restaurants & Leisure - 0.1% | | | |
| Extended Stay America, Inc. unit | | 86,800 | 1,297,660 |
| Household Durables - 0.3% | | | |
| CalAtlantic Group, Inc. | | 19,740 | 724,655 |
| Harman International Industries, Inc. | | 14,700 | 1,055,754 |
| Lennar Corp. Class A | | 26,700 | 1,230,870 |
| Newell Brands, Inc. | | 10,516 | 510,762 |
| Taylor Morrison Home Corp. (n) | | 39,500 | 586,180 |
| | | | 4,108,221 |
| Internet & Catalog Retail - 0.1% | | | |
| Expedia, Inc. | | 5,000 | 531,500 |
| Media - 0.3% | | | |
| AMC Networks, Inc. Class A (n) | | 17,000 | 1,027,140 |
| Naspers Ltd. Class N | | 9,500 | 1,450,603 |
| Sinclair Broadcast Group, Inc. Class A | | 50,200 | 1,498,972 |
| | | | 3,976,715 |
| Textiles, Apparel & Luxury Goods - 0.1% | | | |
| Deckers Outdoor Corp. (n) | | 8,500 | 488,920 |
| Michael Kors Holdings Ltd. (n) | | 10,000 | 494,800 |
| | | | 983,720 |
|
| TOTAL CONSUMER DISCRETIONARY | | | 14,564,727 |
|
| CONSUMER STAPLES - 0.1% | | | |
| Food & Staples Retailing - 0.1% | | | |
| CVS Health Corp. | | 7,300 | 698,902 |
| Ovation Acquisition I LLC (o) | | 158,313 | 1,583 |
| | | | 700,485 |
| Food Products - 0.0% | | | |
| Reddy Ice Holdings, Inc. (n) | | 5,683 | 2,302 |
|
| TOTAL CONSUMER STAPLES | | | 702,787 |
|
| ENERGY - 0.0% | | | |
| Energy Equipment & Services - 0.0% | | | |
| Hornbeck Offshore Services, Inc. (n) | | 14,400 | 120,096 |
| Oil, Gas & Consumable Fuels - 0.0% | | | |
| Crestwood Equity Partners LP | | 7,975 | 160,776 |
| Pacific Exploration and Production Corp. warrants (n) | | 11,525 | 36,880 |
| | | | 197,656 |
|
| TOTAL ENERGY | | | 317,752 |
|
| FINANCIALS - 0.2% | | | |
| Capital Markets - 0.0% | | | |
| Penson Worldwide, Inc. Class A (n) | | 314,563 | 3 |
| The Blackstone Group LP | | 24,700 | 606,138 |
| | | | 606,141 |
| Consumer Finance - 0.1% | | | |
| OneMain Holdings, Inc. (n) | | 27,700 | 632,114 |
| Diversified Financial Services - 0.1% | | | |
| Broadcom Ltd. | | 8,500 | 1,320,900 |
| Real Estate Investment Trusts - 0.0% | | | |
| MGM Growth Properties LLC | | 19,200 | 512,256 |
|
| TOTAL FINANCIALS | | | 3,071,411 |
|
| HEALTH CARE - 0.7% | | | |
| Biotechnology - 0.3% | | | |
| Biogen, Inc. (n) | | 4,800 | 1,160,736 |
| Celgene Corp. (n) | | 12,500 | 1,232,875 |
| Gilead Sciences, Inc. | | 15,500 | 1,293,010 |
| | | | 3,686,621 |
| Health Care Providers & Services - 0.2% | | | |
| AmSurg Corp. (n) | | 9,700 | 752,138 |
| HCA Holdings, Inc. (n) | | 27,100 | 2,086,971 |
| Rotech Healthcare, Inc. (n) | | 6,069 | 10,864 |
| | | | 2,849,973 |
| Pharmaceuticals - 0.2% | | | |
| Allergan PLC (n) | | 7,600 | 1,756,284 |
|
| TOTAL HEALTH CARE | | | 8,292,878 |
|
| INDUSTRIALS - 0.4% | | | |
| Airlines - 0.1% | | | |
| Air Canada (n) | | 106,500 | 732,834 |
| Delta Air Lines, Inc. | | 10,800 | 393,444 |
| | | | 1,126,278 |
| Commercial Services & Supplies - 0.0% | | | |
| WP Rocket Holdings, Inc. (n)(o) | | 894,972 | 53,698 |
| Marine - 0.0% | | | |
| U.S. Shipping Partners Corp. (n) | | 644 | 0 |
| U.S. Shipping Partners Corp. warrants 12/31/29 (n) | | 6,028 | 0 |
| | | | 0 |
| Road & Rail - 0.0% | | | |
| Avis Budget Group, Inc. (n) | | 19,900 | 641,377 |
| Trading Companies & Distributors - 0.3% | | | |
| Air Lease Corp. Class A | | 15,600 | 417,768 |
| HD Supply Holdings, Inc. (n) | | 37,300 | 1,298,786 |
| Penhall Acquisition Co.: | | | |
| Class A (n) | | 321 | 25,442 |
| Class B (n) | | 107 | 8,481 |
| United Rentals, Inc. (n) | | 25,100 | 1,684,210 |
| | | | 3,434,687 |
| Transportation Infrastructure - 0.0% | | | |
| DeepOcean Group Holding BV (b)(n) | | 31,897 | 210,262 |
|
| TOTAL INDUSTRIALS | | | 5,466,302 |
|
| INFORMATION TECHNOLOGY - 1.2% | | | |
| Electronic Equipment & Components - 0.1% | | | |
| CDW Corp. | | 28,100 | 1,126,248 |
| Internet Software & Services - 0.5% | | | |
| Alibaba Group Holding Ltd. sponsored ADR (n) | | 32,900 | 2,616,537 |
| Alphabet, Inc. Class A | | 2,600 | 1,829,178 |
| Baidu.com, Inc. sponsored ADR (n) | | 3,400 | 561,510 |
| Facebook, Inc. Class A (n) | | 10,400 | 1,188,512 |
| | | | 6,195,737 |
| IT Services - 0.1% | | | |
| MasterCard, Inc. Class A | | 8,900 | 783,734 |
| PayPal Holdings, Inc. (n) | | 19,200 | 700,992 |
| | | | 1,484,726 |
| Semiconductors & Semiconductor Equipment - 0.4% | | | |
| Cypress Semiconductor Corp. | | 309 | 3,260 |
| MagnaChip Semiconductor Corp. (n) | | 2,669 | 15,107 |
| NXP Semiconductors NV (n) | | 16,117 | 1,262,606 |
| Qorvo, Inc. (n) | | 32,495 | 1,795,674 |
| Skyworks Solutions, Inc. | | 23,700 | 1,499,736 |
| | | | 4,576,383 |
| Software - 0.0% | | | |
| Electronic Arts, Inc. (n) | | 10,000 | 757,600 |
| Technology Hardware, Storage & Peripherals - 0.1% | | | |
| Apple, Inc. | | 10,300 | 984,680 |
|
| TOTAL INFORMATION TECHNOLOGY | | | 15,125,374 |
|
| MATERIALS - 0.1% | | | |
| Chemicals - 0.0% | | | |
| LyondellBasell Industries NV Class A | | 5,700 | 424,194 |
| Metals & Mining - 0.1% | | | |
| Aleris Corp. (n)(o) | | 2,037 | 22,020 |
| Freeport-McMoRan, Inc. | | 50,800 | 565,912 |
| Mirabela Nickel Ltd. (n) | | 217,900 | 13,488 |
| | | | 601,420 |
|
| TOTAL MATERIALS | | | 1,025,614 |
|
| TELECOMMUNICATION SERVICES - 0.1% | | | |
| Wireless Telecommunication Services - 0.1% | | | |
| T-Mobile U.S., Inc. (n) | | 34,700 | 1,501,469 |
| UTILITIES - 0.0% | | | |
| Electric Utilities - 0.0% | | | |
| Portland General Electric Co. | | 140 | 6,177 |
| TOTAL COMMON STOCKS | | | |
| (Cost $56,271,462) | | | 50,074,491 |
|
| Preferred Stocks - 0.1% | | | |
| Convertible Preferred Stocks - 0.1% | | | |
| CONSUMER STAPLES - 0.0% | | | |
| Food Products - 0.0% | | | |
| Reddy Ice Holdings, Inc. 7.00% pay-in-kind (n) | | 2,286 | 18,988 |
| HEALTH CARE - 0.1% | | | |
| Pharmaceuticals - 0.1% | | | |
| Allergan PLC 5.50% | | 1,500 | 1,250,430 |
|
| TOTAL CONVERTIBLE PREFERRED STOCKS | | | 1,269,418 |
|
| Nonconvertible Preferred Stocks - 0.0% | | | |
| FINANCIALS - 0.0% | | | |
| Capital Markets - 0.0% | | | |
| Goldman Sachs Group, Inc. Series K 6.375% | | 8,471 | 236,341 |
| TOTAL PREFERRED STOCKS | | | |
| (Cost $1,728,092) | | | 1,505,759 |
| | | Principal Amount(a) | Value |
|
| Bank Loan Obligations - 1.3% | | | |
| CONSUMER DISCRETIONARY - 0.2% | | | |
| Auto Components - 0.0% | | | |
| Chassix, Inc. term loan 12% 7/29/19 | | 422,618 | 416,279 |
| Diversified Consumer Services - 0.1% | | | |
| KC Mergersub, Inc.: | | | |
| Tranche 1LN, term loan 6% 8/13/22 (c) | | 655,050 | 647,406 |
| Tranche L 2LN, term loan 10.25% 8/13/23 (c) | | 245,000 | 235,200 |
| | | | 882,606 |
| Hotels, Restaurants & Leisure - 0.1% | | | |
| Caesars Growth Properties Holdings, LLC Tranche 1LN, term loan 6.25% 5/8/21 (c) | | 1,298,470 | 1,216,238 |
| TGI Friday's, Inc. Tranche B 1LN, term loan 5.25% 7/15/20 (c) | | 46,574 | 46,302 |
| | | | 1,262,540 |
|
| TOTAL CONSUMER DISCRETIONARY | | | 2,561,425 |
|
| CONSUMER STAPLES - 0.1% | | | |
| Food & Staples Retailing - 0.0% | | | |
| Focus Brands, Inc. Tranche 2LN, term loan 10.25% 8/21/18 (c) | | 285,000 | 284,288 |
| Personal Products - 0.1% | | | |
| Revlon Consumer Products Corp. term loan 4% 8/19/19 (c) | | 790,311 | 790,809 |
|
| TOTAL CONSUMER STAPLES | | | 1,075,097 |
|
| ENERGY - 0.1% | | | |
| Energy Equipment & Services - 0.1% | | | |
| Seadrill Operating LP Tranche B, term loan 4% 2/21/21 (c) | | 1,238,018 | 549,680 |
| Oil, Gas & Consumable Fuels - 0.0% | | | |
| Alon U.S.A. Partners LP term loan 9.25% 11/26/18 (c) | | 324,348 | 321,105 |
| TPF II Power, LLC Tranche B, term loan 5.5% 10/2/21 (c) | | 214,434 | 213,452 |
| | | | 534,557 |
|
| TOTAL ENERGY | | | 1,084,237 |
|
| FINANCIALS - 0.1% | | | |
| Consumer Finance - 0.1% | | | |
| Sears Roebuck Acceptance Corp. Tranche B, term loan 8.5% 7/20/20 (c) | | 610,000 | 607,206 |
| HEALTH CARE - 0.1% | | | |
| Health Care Providers & Services - 0.1% | | | |
| Emergency Medical Services Corp. Tranche B, term loan 4.25% 5/25/18 (c) | | 1,045,971 | 1,044,852 |
| INFORMATION TECHNOLOGY - 0.2% | | | |
| Software - 0.2% | | | |
| BMC Software Finance, Inc. Tranche B, term loan 5% 9/10/20 (c) | | 2,032,976 | 1,798,330 |
| Sophia L.P. Tranche B, term loan 4.75% 9/30/22 (c) | | 1,156,263 | 1,140,364 |
| | | | 2,938,694 |
| MATERIALS - 0.0% | | | |
| Metals & Mining - 0.0% | | | |
| Essar Steel Algoma, Inc. Tranche B, term loan 0% 8/16/19 (d) | | 267,300 | 62,816 |
| MRC Global, Inc. Tranche B, term loan 5% 11/9/19 (c) | | 223,530 | 214,588 |
| | | | 277,404 |
| TELECOMMUNICATION SERVICES - 0.1% | | | |
| Diversified Telecommunication Services - 0.1% | | | |
| Integra Telecom Holdings, Inc. Tranche B 1LN, term loan 5.25% 8/14/20 (c) | | 572,750 | 555,928 |
| Wireless Telecommunication Services - 0.0% | | | |
| Digicel International Finance Ltd.: | | | |
| Tranche D 1LN, term loan 4.1875% 3/31/17 (c) | | 114,954 | 109,781 |
| Tranche D 2LN, term loan 4.1309% 3/31/19 (c) | | 230,046 | 219,694 |
| | | | 329,475 |
|
| TOTAL TELECOMMUNICATION SERVICES | | | 885,403 |
|
| UTILITIES - 0.4% | | | |
| Electric Utilities - 0.0% | | | |
| Essential Power LLC Tranche B, term loan 4.75% 8/8/19 (c) | | 301,441 | 296,919 |
| Independent Power and Renewable Electricity Producers - 0.4% | | | |
| Energy Future Holdings Corp. Tranche 1LN, term loan 4.25% 12/19/16 (c) | | 4,797,004 | 4,785,012 |
|
| TOTAL UTILITIES | | | 5,081,931 |
|
| TOTAL BANK LOAN OBLIGATIONS | | | |
| (Cost $15,804,794) | | | 15,556,249 |
|
| Sovereign Loan Participations - 0.1% | | | |
| Indonesian Republic loan participation: | | | |
| Citibank 1.6875% 12/14/19 (c) | | 183,386 | 179,718 |
| Goldman Sachs 1.6875% 12/14/19 (c) | | 330,069 | 323,468 |
| Mizuho 1.6875% 12/14/19 (c) | | 246,811 | 241,875 |
| TOTAL SOVEREIGN LOAN PARTICIPATIONS | | | |
| (Cost $722,016) | | | 745,061 |
| | | Shares | Value |
|
| Fixed-Income Funds - 5.9% | | | |
| Fidelity Floating Rate Central Fund (p) | | | |
| (Cost $76,143,932) | | 733,393 | 73,595,988 |
| | | Principal Amount(a) | Value |
|
| Preferred Securities - 2.8% | | | |
| CONSUMER DISCRETIONARY - 0.1% | | | |
| Media - 0.1% | | | |
| NBCUniversal Enterprise, Inc. 5.25% (b)(f) | | 770,000 | 795,381 |
| CONSUMER STAPLES - 0.1% | | | |
| Food Products - 0.1% | | | |
| Cosan Overseas Ltd. 8.25% (f) | | 1,185,000 | 1,134,968 |
| FINANCIALS - 2.5% | | | |
| Banks - 2.1% | | | |
| Banco Do Brasil SA 9% (b)(c)(f) | | 800,000 | 622,557 |
| Bank of America Corp.: | | | |
| 5.125% (c)(f) | | 1,345,000 | 1,270,299 |
| 5.2% (c)(f) | | 2,762,000 | 2,608,052 |
| 6.25% (c)(f) | | 910,000 | 942,433 |
| Barclays Bank PLC 7.625% 11/21/22 | | 895,000 | 970,847 |
| Citigroup, Inc.: | | | |
| 5.8% (c)(f) | | 1,130,000 | 1,100,233 |
| 5.9% (c)(f) | | 1,455,000 | 1,465,485 |
| 5.95% (c)(f) | | 2,675,000 | 2,710,135 |
| 6.25% (c)(f) | | 920,000 | 955,784 |
| 6.3% (c)(f) | | 270,000 | 270,795 |
| Intesa Sanpaolo SpA 8.375% (c)(f) | EUR | 250,000 | 330,119 |
| JPMorgan Chase & Co.: | | | |
| 5% (c)(f) | | 1,615,000 | 1,584,719 |
| 5.3% (c)(f) | | 865,000 | 869,356 |
| 6% (c)(f) | | 2,580,000 | 2,699,042 |
| 6.125% (c)(f) | | 725,000 | 758,804 |
| 6.75% (c)(f) | | 400,000 | 451,701 |
| Wells Fargo & Co.: | | | |
| 5.875% (c)(f) | | 2,600,000 | 2,778,928 |
| 5.9% (c)(f) | | 3,065,000 | 3,161,024 |
| | | | 25,550,313 |
| Capital Markets - 0.3% | | | |
| Bank of Scotland 7.281% (c)(f) | GBP | 350,000 | 518,976 |
| Goldman Sachs Group, Inc.: | | | |
| 5.375% (c)(f) | | 1,310,000 | 1,305,437 |
| 5.7% (c)(f) | | 1,701,000 | 1,711,341 |
| | | | 3,535,754 |
| Diversified Financial Services - 0.0% | | | |
| Magnesita Finance Ltd. 8.625% (b)(f) | | 400,000 | 309,246 |
| Insurance - 0.1% | | | |
| Credit Agricole Assurances SA 4.25% (Reg. S) (c)(f) | EUR | 300,000 | 319,721 |
| Elm BV (SWISS REIN CO) 2.6% (Reg. S) (c)(f) | EUR | 400,000 | 414,681 |
| Society of Lloyd's 7.421% (c)(f) | GBP | 400,000 | 539,373 |
| | | | 1,273,775 |
|
| TOTAL FINANCIALS | | | 30,669,088 |
|
| INDUSTRIALS - 0.1% | | | |
| Construction & Engineering - 0.1% | | | |
| Odebrecht Finance Ltd.: | | | |
| 7.5% (b)(f) | | 2,950,000 | 1,440,971 |
| 7.5% (Reg. S) (f) | | 100,000 | 48,846 |
| | | | 1,489,817 |
| MATERIALS - 0.0% | | | |
| Metals & Mining - 0.0% | | | |
| CSN Islands XII Corp. 7% (Reg. S) (f) | | 1,120,000 | 449,704 |
| TOTAL PREFERRED SECURITIES | | | |
| (Cost $36,294,232) | | | 34,538,958 |
| | | Shares | Value |
|
| Money Market Funds - 5.6% | | | |
| Fidelity Cash Central Fund, 0.43% (q) | | | |
| (Cost $69,694,496) | | 69,694,496 | 69,694,496 |
| TOTAL INVESTMENT PORTFOLIO - 100.0% | | | |
| (Cost $1,238,410,628) | | | 1,242,710,662 |
| NET OTHER ASSETS (LIABILITIES) - 0.0% | | | 491,595 |
| NET ASSETS - 100% | | | $1,243,202,257 |
| TBA Sale Commitments | | |
| | Principal Amount | Value |
| Fannie Mae | | |
| 3% 7/1/31 | $(700,000) | $(733,835) |
| 3% 7/1/31 | (700,000) | (733,834) |
| TOTAL TBA SALE COMMITMENTS | | |
| (Proceeds $1,468,250) | | $(1,467,669) |
| Futures Contracts | | | |
| | Expiration Date | Underlying Face Amount at Value | Unrealized Appreciation/(Depreciation) |
| Purchased | | | |
| Treasury Contracts | | | |
| 16 CBOT 2-Year U.S. Treasury Note Contracts (United States) | Sept. 2016 | 3,509,250 | $23,969 |
| 25 CBOT Ultra Long Term U.S. Treasury Bond Contracts (United States) | Sept. 2016 | 4,659,375 | 316,708 |
| TOTAL FUTURES CONTRACTS | | | $340,677 |
The face value of futures purchased as a percentage of Net Assets is 0.7%
Swaps
| Clearinghouse/Counterparty(1) | Expiration Date | Notional Amount | Payment Received | Payment Paid | Value | Upfront Premium Received/(Paid)(2) | Unrealized Appreciation/(Depreciation) |
| Interest Rate Swaps | | | | | | | |
| CME | Sep. 2026 | $200,000 | 2.25% | 3-month LIBOR | $3,705 | $0 | $3,705 |
| LCH | Sep. 2046 | 830,000 | 3-month LIBOR | 2.75% | (46,686) | 0 | (46,686) |
|
| TOTAL INTEREST RATE SWAPS | | | | | $(42,981) | $0 | $(42,981) |
|
(1) Swaps with CME Group (CME) and LCH Clearnet Group (LCH) are centrally cleared over-the-counter (OTC) swaps.
(2) Any premiums for centrally cleared over-the-counter (OTC) swaps are recorded periodically throughout the term of the swap to variation margin and included in unrealized appreciation (depreciation).
Currency Abbreviations
AUD – Australian dollar
CAD – Canadian dollar
CHF – Swiss franc
COP – Colombian peso
DKK – Danish krone
EUR – European Monetary Unit
GBP – British pound
HKD – Hong Kong dollar
IDR – Indonesian rupiah
JPY – Japanese yen
MXN – Mexican peso
NOK – Norwegian krone
NZD – New Zealand dollar
SEK – Swedish krona
SGD – Singapore dollar
TRY – Turkish Lira
Legend
(a) Amount is stated in United States dollars unless otherwise noted.
(b) Security exempt from registration under Rule 144A of the Securities Act of 1933. These securities may be resold in transactions exempt from registration, normally to qualified institutional buyers. At the end of the period, the value of these securities amounted to $268,799,085 or 21.6% of net assets.
(c) Coupon rates for floating and adjustable rate securities reflect the rates in effect at period end.
(d) Non-income producing - Security is in default.
(e) Security initially issued at one coupon which converts to a higher coupon at a specified date. The rate shown is the rate at period end.
(f) Security is perpetual in nature with no stated maturity date.
(g) Security or a portion of the security was pledged to cover margin requirements for centrally cleared OTC swaps. At period end, the value of securities pledged amounted to $164,662.
(h) Security or a portion of the security was pledged to cover margin requirements for futures contracts. At period end, the value of securities pledged amounted to $168,929.
(i) Security or a portion of the security purchased on a delayed delivery or when-issued basis.
(j) Represents an investment in an underlying pool of reverse mortgages which typically do not require regular principal and interest payments as repayment is deferred until a maturity event.
(k) Security represents right to receive monthly interest payments on an underlying pool of mortgages or assets. Principal shown is the outstanding par amount of the pool as of the end of the period.
(l) Coupon is inversely indexed to a floating interest rate multiplied by a specified factor. The price may be considerably more volatile than the price of a comparable fixed rate security.
(m) Quantity represents share amount.
(n) Non-income producing
(o) Restricted securities - Investment in securities not registered under the Securities Act of 1933 (excluding 144A issues). At the end of the period, the value of restricted securities (excluding 144A issues) amounted to $85,596 or 0.0% of net assets.
(p) Affiliated fund that is generally available only to investment companies and other accounts managed by Fidelity Investments. A complete unaudited schedule of portfolio holdings for each Fidelity Central Fund is filed with the SEC for the first and third quarters of each fiscal year on Form N-Q and is available upon request or at the SEC's website at www.sec.gov. An unaudited holdings listing for the Fund, which presents direct holdings as well as the pro-rata share of securities and other investments held indirectly through its investment in underlying non-money market Fidelity Central Funds, is available at fidelity.com and/or institutional.fidelity.com, as applicable. In addition, each Fidelity Central Fund's financial statements are available on the SEC's website or upon request.
(q) Affiliated fund that is generally available only to investment companies and other accounts managed by Fidelity Investments. The rate quoted is the annualized seven-day yield of the fund at period end. A complete unaudited listing of the fund's holdings as of its most recent quarter end is available upon request. In addition, each Fidelity Central Fund's financial statements are available on the SEC's website or upon request.
Additional information on each restricted holding is as follows:
| Security | Acquisition Date | Acquisition Cost |
| Aleris Corp. | 6/1/10 | $71,295 |
| Houghton Mifflin Harcourt Co. warrants 6/22/19 | 6/22/12 | $4,281 |
| Ovation Acquisition I LLC | 12/23/15 | $1,583 |
| WP Rocket Holdings, Inc. | 6/24/11 - 2/2/15 | $466,147 |
Affiliated Central Funds
Information regarding fiscal year to date income earned by the Fund from investments in Fidelity Central Funds is as follows:
| Fund | Income earned |
| Fidelity Cash Central Fund | $136,524 |
| Fidelity Floating Rate Central Fund | 1,871,604 |
| Fidelity Securities Lending Cash Central Fund | 678 |
| Total | $2,008,806 |
Additional information regarding the Fund's fiscal year to date purchases and sales, including the ownership percentage, of the non Money Market Central Funds is as follows:
| Fund | Value, beginning of period | Purchases | Sales Proceeds | Value, end of period | % ownership, end of period |
| Fidelity Floating Rate Central Fund | $70,696,113 | $1,002,078 | $-- | $73,595,988 | 5.0% |
| Total | $70,696,113 | $1,002,078 | $-- | $73,595,988 | |
Investment Valuation
The following is a summary of the inputs used, as of June 30, 2016, involving the Fund's assets and liabilities carried at fair value. The inputs or methodology used for valuing securities may not be an indication of the risk associated with investing in those securities. For more information on valuation inputs, and their aggregation into the levels used below, please refer to the Investment Valuation section in the accompanying Notes to Financial Statements.
| | Valuation Inputs at Reporting Date: |
| Description | Total | Level 1 | Level 2 | Level 3 |
| Investments in Securities: | | | | |
| Equities: | | | | |
| Consumer Discretionary | $14,564,727 | $11,983,156 | $1,458,898 | $1,122,673 |
| Consumer Staples | 721,775 | 698,902 | -- | 22,873 |
| Energy | 317,752 | 280,872 | -- | 36,880 |
| Financials | 3,307,752 | 3,307,749 | -- | 3 |
| Health Care | 9,543,308 | 9,532,444 | -- | 10,864 |
| Industrials | 5,466,302 | 5,168,419 | -- | 297,883 |
| Information Technology | 15,125,374 | 15,125,374 | -- | -- |
| Materials | 1,025,614 | 990,106 | -- | 35,508 |
| Telecommunication Services | 1,501,469 | 1,501,469 | -- | -- |
| Utilities | 6,177 | 6,177 | -- | -- |
| Corporate Bonds | 548,230,868 | -- | 547,423,313 | 807,555 |
| U.S. Government and Government Agency Obligations | 182,700,624 | -- | 182,700,624 | -- |
| U.S. Government Agency - Mortgage Securities | 18,679,414 | -- | 18,679,414 | -- |
| Collateralized Mortgage Obligations | 43,282,573 | -- | 43,282,573 | -- |
| Commercial Mortgage Securities | 10,148,028 | -- | 10,148,028 | -- |
| Foreign Government and Government Agency Obligations | 192,781,596 | -- | 192,201,360 | 580,236 |
| Supranational Obligations | 1,176,557 | -- | 1,176,557 | -- |
| Bank Loan Obligations | 15,556,249 | -- | 14,810,495 | 745,754 |
| Sovereign Loan Participations | 745,061 | -- | -- | 745,061 |
| Fixed-Income Funds | 73,595,988 | 73,595,988 | -- | -- |
| Preferred Securities | 34,538,958 | -- | 34,538,958 | -- |
| Money Market Funds | 69,694,496 | 69,694,496 | -- | -- |
| Total Investments in Securities: | $1,242,710,662 | $191,885,152 | $1,046,420,220 | $4,405,290 |
| Derivative Instruments: | | | | |
| Assets | | | | |
| Futures Contracts | $340,677 | $340,677 | $-- | $-- |
| Swaps | 3,705 | -- | 3,705 | -- |
| Total Assets | $344,382 | $340,677 | $3,705 | $-- |
| Liabilities | | | | |
| Swaps | $(46,686) | $-- | $(46,686) | $-- |
| Total Liabilities | $(46,686) | $-- | $(46,686) | $-- |
| Total Derivative Instruments: | $297,696 | $340,677 | $(42,981) | $-- |
| Other Financial Instruments: | | | | |
| TBA Sale Commitments | $(1,467,669) | $-- | $(1,467,669) | $-- |
| Total Other Financial Instruments: | $(1,467,669) | $-- | $(1,467,669) | $-- |
Value of Derivative Instruments
The following table is a summary of the Fund's value of derivative instruments by primary risk exposure as of June 30, 2016. For additional information on derivative instruments, please refer to the Derivative Instruments section in the accompanying Notes to Financial Statements.
| Primary Risk Exposure / Derivative Type | Value |
| | Asset | Liability |
| Interest Rate Risk | | |
| Futures Contracts(a) | $340,677 | $0 |
| Swaps(b) | 3,705 | (46,686) |
| Total Interest Rate Risk | $344,382 | $(46,686) |
(a) Reflects gross cumulative appreciation (depreciation) on futures contracts as presented in the Schedule of Investments. In the Statement of Assets and Liabilities, the period end daily variation margin is included in receivable or payable for daily variation margin for derivative instruments, and the net cumulative appreciation (depreciation) is included in net unrealized appreciation (depreciation).
(b) For centrally cleared over-the-counter (OTC) swaps, reflects gross cumulative appreciation (depreciation) as presented in the Schedule of Investments. In the Statement of Assets and Liabilities, the period end daily variation margin for centrally cleared OTC swaps is included in receivable or payable for daily variation margin for derivative instruments, and the net cumulative appreciation (depreciation) for centrally cleared OTC swaps is included in net unrealized appreciation (depreciation).
Other Information
Distribution of investments by country or territory of incorporation, as a percentage of Total Net Assets, is as follows (Unaudited):
| United States of America | 65.1% |
| Luxembourg | 3.0% |
| Netherlands | 2.9% |
| United Kingdom | 2.5% |
| Japan | 2.3% |
| Canada | 2.1% |
| Argentina | 2.0% |
| Italy | 1.9% |
| Ireland | 1.9% |
| France | 1.8% |
| Mexico | 1.1% |
| Others (Individually Less Than 1%) | 13.4% |
| | 100.0% |
The information in the above tables is based on the combined investments of the fund and its pro-rata share of the investments of Fidelity's Fixed-Income Central Funds
See accompanying notes which are an integral part of the financial statements.
Financial Statements
Statement of Assets and Liabilities
| | | June 30, 2016 (Unaudited) |
| Assets | | |
Investment in securities, at value — See accompanying schedule:
Unaffiliated issuers (cost $1,092,572,200) | $1,099,420,178 | |
| Fidelity Central Funds (cost $145,838,428) | 143,290,484 | |
| Total Investments (cost $1,238,410,628) | | $1,242,710,662 |
| Cash | | 908,901 |
| Receivable for investments sold | | 12,089,884 |
| Receivable for TBA sale commitments | | 1,468,250 |
| Receivable for fund shares sold | | 1,103,940 |
| Dividends receivable | | 30,911 |
| Interest receivable | | 12,546,324 |
| Distributions receivable from Fidelity Central Funds | | 328,503 |
| Other receivables | | 22,137 |
| Total assets | | 1,271,209,512 |
| Liabilities | | |
| Payable for investments purchased | | |
| Regular delivery | $18,907,393 | |
| Delayed delivery | 6,405,359 | |
| TBA sale commitments, at value | 1,467,669 | |
| Payable for fund shares redeemed | 406,646 | |
| Accrued management fee | 577,464 | |
| Distribution and service plan fees payable | 44,964 | |
| Payable for daily variation margin for derivative instruments | 13,259 | |
| Other affiliated payables | 132,124 | |
| Other payables and accrued expenses | 52,377 | |
| Total liabilities | | 28,007,255 |
| Net Assets | | $1,243,202,257 |
| Net Assets consist of: | | |
| Paid in capital | | $1,224,564,512 |
| Undistributed net investment income | | 25,426,941 |
| Accumulated undistributed net realized gain (loss) on investments and foreign currency transactions | | (11,393,843) |
| Net unrealized appreciation (depreciation) on investments and assets and liabilities in foreign currencies | | 4,604,647 |
| Net Assets | | $1,243,202,257 |
| Initial Class: | | |
| Net Asset Value, offering price and redemption price per share ($92,862,322 ÷ 8,261,288 shares) | | $11.24 |
| Service Class: | | |
| Net Asset Value, offering price and redemption price per share ($621,157 ÷ 55,337 shares) | | $11.22 |
| Service Class 2: | | |
| Net Asset Value, offering price and redemption price per share ($217,179,624 ÷ 19,489,745 shares) | | $11.14 |
| Investor Class: | | |
| Net Asset Value, offering price and redemption price per share ($932,539,154 ÷ 83,225,003 shares) | | $11.21 |
See accompanying notes which are an integral part of the financial statements.
Statement of Operations
| | | Six months ended June 30, 2016 (Unaudited) |
| Investment Income | | |
| Dividends | | $1,395,204 |
| Interest | | 23,844,330 |
| Income from Fidelity Central Funds | | 2,008,806 |
| Total income | | 27,248,340 |
| Expenses | | |
| Management fee | $3,356,699 | |
| Transfer agent fees | 560,703 | |
| Distribution and service plan fees | 251,935 | |
| Accounting and security lending fees | 208,655 | |
| Custodian fees and expenses | 33,935 | |
| Independent trustees' fees and expenses | 2,700 | |
| Registration fees | 2 | |
| Audit | 45,963 | |
| Legal | 12,244 | |
| Miscellaneous | 16,757 | |
| Total expenses before reductions | 4,489,593 | |
| Expense reductions | (3,436) | 4,486,157 |
| Net investment income (loss) | | 22,762,183 |
| Realized and Unrealized Gain (Loss) | | |
| Net realized gain (loss) on: | | |
| Investment securities: | | |
| Unaffiliated issuers | (3,649,283) | |
| Foreign currency transactions | (14,590) | |
| Futures contracts | 367,006 | |
| Swaps | (152,150) | |
| Total net realized gain (loss) | | (3,449,017) |
Change in net unrealized appreciation (depreciation) on:
Investment securities | 50,172,674 | |
| Assets and liabilities in foreign currencies | 41,363 | |
| Futures contracts | 311,013 | |
| Delayed delivery commitments | 581 | |
| Swaps | (57,044) | |
| Total change in net unrealized appreciation (depreciation) | | 50,468,587 |
| Net gain (loss) | | 47,019,570 |
| Net increase (decrease) in net assets resulting from operations | | $69,781,753 |
See accompanying notes which are an integral part of the financial statements.
Statement of Changes in Net Assets
| | Six months ended June 30, 2016 (Unaudited) | Year ended December 31, 2015 |
| Increase (Decrease) in Net Assets | | |
| Operations | | |
| Net investment income (loss) | $22,762,183 | $45,197,000 |
| Net realized gain (loss) | (3,449,017) | (16,716,265) |
| Change in net unrealized appreciation (depreciation) | 50,468,587 | (49,819,973) |
| Net increase (decrease) in net assets resulting from operations | 69,781,753 | (21,339,238) |
| Distributions to shareholders from net investment income | – | (32,938,370) |
| Distributions to shareholders from tax return of capital | – | (3,700,630) |
| Total distributions | – | (36,639,000) |
| Share transactions - net increase (decrease) | (12,237,548) | 15,137,477 |
| Total increase (decrease) in net assets | 57,544,205 | (42,840,761) |
| Net Assets | | |
| Beginning of period | 1,185,658,052 | 1,228,498,813 |
| End of period | $1,243,202,257 | $1,185,658,052 |
| Other Information | | |
| Undistributed net investment income end of period | $25,426,941 | $2,664,758 |
See accompanying notes which are an integral part of the financial statements.
Financial Highlights — VIP Strategic Income Portfolio Initial Class
| | Six months ended (Unaudited) June 30, | Years ended December 31, | | | | |
| | 2016 | 2015 | 2014 | 2013 | 2012 | 2011 |
| Selected Per–Share Data | | | | | | |
| Net asset value, beginning of period | $10.60 | $11.12 | $11.20 | $11.76 | $11.15 | $11.36 |
| Income from Investment Operations | | | | | | |
| Net investment income (loss)A | .210 | .413 | .413 | .437 | .465 | .511 |
| Net realized and unrealized gain (loss) | .430 | (.593) | (.010) | (.403) | .704 | .013 |
| Total from investment operations | .640 | (.180) | .403 | .034 | 1.169 | .524 |
| Distributions from net investment income | – | (.306) | (.350) | (.483) | (.425) | (.486) |
| Distributions from net realized gain | – | – | (.133) | (.111) | (.134) | (.248) |
| Tax return of capital | – | (.034) | – | – | – | – |
| Total distributions | – | (.340) | (.483) | (.594) | (.559) | (.734) |
| Net asset value, end of period | $11.24 | $10.60 | $11.12 | $11.20 | $11.76 | $11.15 |
| Total ReturnB,C,D | 6.04% | (1.63)% | 3.60% | .29% | 10.50% | 4.66% |
| Ratios to Average Net AssetsE,F | | | | | | |
| Expenses before reductions | .69%G | .69% | .68% | .68% | .69% | .69% |
| Expenses net of fee waivers, if any | .69%G | .69% | .68% | .68% | .69% | .69% |
| Expenses net of all reductions | .69%G | .69% | .68% | .68% | .69% | .69% |
| Net investment income (loss) | 3.89%G | 3.69% | 3.56% | 3.74% | 3.97% | 4.38% |
| Supplemental Data | | | | | | |
| Net assets, end of period (000 omitted) | $92,862 | $91,714 | $107,847 | $119,063 | $164,166 | $164,168 |
| Portfolio turnover rateH | 85%G | 92% | 119% | 141% | 129% | 224% |
A Calculated based on average shares outstanding during the period.
B Total returns for periods of less than one year are not annualized.
C Total returns do not reflect charges attributable to your insurance company's separate account. Inclusion of these charges would reduce the total returns shown.
D Total returns would have been lower if certain expenses had not been reduced during the applicable periods shown.
E Fees and expenses of any underlying Fidelity Central Funds are not included in the Fund's expense ratio. The Fund indirectly bears its proportionate share of the expenses of any underlying Fidelity Central Funds. Based on their most recent shareholder report date, the expenses of any underlying non-money market Fidelity Central Funds were less than .005 %.
F Expense ratios reflect operating expenses of the class. Expenses before reductions do not reflect amounts reimbursed by the investment adviser or reductions from brokerage service arrangements or reductions from other expense offset arrangements and do not represent the amount paid by the class during periods when reimbursements or reductions occur. Expenses net of fee waivers reflect expenses after reimbursement by the investment adviser but prior to reductions from brokerage service arrangements or other expense offset arrangements. Expenses net of all reductions represent the net expenses paid by the class.
G Annualized
H Amount does not include the portfolio activity of any underlying Fidelity Central Funds.
See accompanying notes which are an integral part of the financial statements.
Financial Highlights — VIP Strategic Income Portfolio Service Class
| | Six months ended (Unaudited) June 30, | Years ended December 31, | | | | |
| | 2016 | 2015 | 2014 | 2013 | 2012 | 2011 |
| Selected Per–Share Data | | | | | | |
| Net asset value, beginning of period | $10.59 | $11.11 | $11.19 | $11.75 | $11.14 | $11.35 |
| Income from Investment Operations | | | | | | |
| Net investment income (loss)A | .205 | .401 | .401 | .425 | .453 | .499 |
| Net realized and unrealized gain (loss) | .425 | (.592) | (.009) | (.403) | .704 | .009 |
| Total from investment operations | .630 | (.191) | .392 | .022 | 1.157 | .508 |
| Distributions from net investment income | – | (.295) | (.339) | (.471) | (.413) | (.470) |
| Distributions from net realized gain | – | – | (.133) | (.111) | (.134) | (.248) |
| Tax return of capital | – | (.034) | – | – | – | – |
| Total distributions | – | (.329) | (.472) | (.582) | (.547) | (.718) |
| Net asset value, end of period | $11.22 | $10.59 | $11.11 | $11.19 | $11.75 | $11.14 |
| Total ReturnB,C,D | 5.95% | (1.73)% | 3.51% | .19% | 10.40% | 4.52% |
| Ratios to Average Net AssetsE,F | | | | | | |
| Expenses before reductions | .79%G | .79% | .78% | .78% | .78% | .80% |
| Expenses net of fee waivers, if any | .79%G | .79% | .78% | .78% | .78% | .80% |
| Expenses net of all reductions | .79%G | .79% | .78% | .78% | .78% | .80% |
| Net investment income (loss) | 3.79%G | 3.59% | 3.46% | 3.64% | 3.87% | 4.28% |
| Supplemental Data | | | | | | |
| Net assets, end of period (000 omitted) | $621 | $753 | $831 | $837 | $975 | $883 |
| Portfolio turnover rateH | 85%G | 92% | 119% | 141% | 129% | 224% |
A Calculated based on average shares outstanding during the period.
B Total returns for periods of less than one year are not annualized.
C Total returns do not reflect charges attributable to your insurance company's separate account. Inclusion of these charges would reduce the total returns shown.
D Total returns would have been lower if certain expenses had not been reduced during the applicable periods shown.
E Fees and expenses of any underlying Fidelity Central Funds are not included in the Fund's expense ratio. The Fund indirectly bears its proportionate share of the expenses of any underlying Fidelity Central Funds. Based on their most recent shareholder report date, the expenses of any underlying non-money market Fidelity Central Funds were less than .005%.
F Expense ratios reflect operating expenses of the class. Expenses before reductions do not reflect amounts reimbursed by the investment adviser or reductions from brokerage service arrangements or reductions from other expense offset arrangements and do not represent the amount paid by the class during periods when reimbursements or reductions occur. Expenses net of fee waivers reflect expenses after reimbursement by the investment adviser but prior to reductions from brokerage service arrangements or other expense offset arrangements. Expenses net of all reductions represent the net expenses paid by the class.
G Annualized
H Amount does not include the portfolio activity of any underlying Fidelity Central Funds.
See accompanying notes which are an integral part of the financial statements.
Financial Highlights — VIP Strategic Income Portfolio Service Class 2
| | Six months ended (Unaudited) June 30, | Years ended December 31, | | | | |
| | 2016 | 2015 | 2014 | 2013 | 2012 | 2011 |
| Selected Per–Share Data | | | | | | |
| Net asset value, beginning of period | $10.52 | $11.05 | $11.14 | $11.71 | $11.11 | $11.33 |
| Income from Investment Operations | | | | | | |
| Net investment income (loss)A | .195 | .380 | .380 | .404 | .434 | .478 |
| Net realized and unrealized gain (loss) | .425 | (.593) | (.005) | (.400) | .701 | .021 |
| Total from investment operations | .620 | (.213) | .375 | .004 | 1.135 | .499 |
| Distributions from net investment income | – | (.283) | (.332) | (.463) | (.401) | (.471) |
| Distributions from net realized gain | – | – | (.133) | (.111) | (.134) | (.248) |
| Tax return of capital | – | (.034) | – | – | – | – |
| Total distributions | – | (.317) | (.465) | (.574) | (.535) | (.719) |
| Net asset value, end of period | $11.14 | $10.52 | $11.05 | $11.14 | $11.71 | $11.11 |
| Total ReturnB,C,D | 5.89% | (1.94)% | 3.37% | .03% | 10.23% | 4.45% |
| Ratios to Average Net AssetsE,F | | | | | | |
| Expenses before reductions | .94%G | .94% | .93% | .93% | .94% | .95% |
| Expenses net of fee waivers, if any | .94%G | .94% | .93% | .93% | .94% | .94% |
| Expenses net of all reductions | .94%G | .94% | .93% | .93% | .94% | .94% |
| Net investment income (loss) | 3.64%G | 3.44% | 3.31% | 3.49% | 3.72% | 4.13% |
| Supplemental Data | | | | | | |
| Net assets, end of period (000 omitted) | $217,180 | $185,925 | $137,892 | $68,196 | $41,502 | $25,652 |
| Portfolio turnover rateH | 85%G | 92% | 119% | 141% | 129% | 224% |
A Calculated based on average shares outstanding during the period.
B Total returns for periods of less than one year are not annualized.
C Total returns do not reflect charges attributable to your insurance company's separate account. Inclusion of these charges would reduce the total returns shown.
D Total returns would have been lower if certain expenses had not been reduced during the applicable periods shown.
E Fees and expenses of any underlying Fidelity Central Funds are not included in the Fund's expense ratio. The Fund indirectly bears its proportionate share of the expenses of any underlying Fidelity Central Funds. Based on their most recent shareholder report date, the expenses of any underlying non-money market Fidelity Central Funds were less than.005%.
F Expense ratios reflect operating expenses of the class. Expenses before reductions do not reflect amounts reimbursed by the investment adviser or reductions from brokerage service arrangements or reductions from other expense offset arrangements and do not represent the amount paid by the class during periods when reimbursements or reductions occur. Expenses net of fee waivers reflect expenses after reimbursement by the investment adviser but prior to reductions from brokerage service arrangements or other expense offset arrangements. Expenses net of all reductions represent the net expenses paid by the class.
G Annualized
H Amount does not include the portfolio activity of any underlying Fidelity Central Funds.
See accompanying notes which are an integral part of the financial statements.
Financial Highlights — VIP Strategic Income Portfolio Investor Class
| | Six months ended (Unaudited) June 30, | Years ended December 31, | | | | |
| | 2016 | 2015 | 2014 | 2013 | 2012 | 2011 |
| Selected Per–Share Data | | | | | | |
| Net asset value, beginning of period | $10.57 | $11.09 | $11.17 | $11.73 | $11.12 | $11.34 |
| Income from Investment Operations | | | | | | |
| Net investment income (loss)A | .207 | .408 | .408 | .432 | .461 | .506 |
| Net realized and unrealized gain (loss) | .433 | (.591) | (.008) | (.401) | .705 | .005 |
| Total from investment operations | .640 | (.183) | .400 | .031 | 1.166 | .511 |
| Distributions from net investment income | – | (.303) | (.347) | (.480) | (.422) | (.483) |
| Distributions from net realized gain | – | – | (.133) | (.111) | (.134) | (.248) |
| Tax return of capital | – | (.034) | – | – | – | – |
| Total distributions | – | (.337) | (.480) | (.591) | (.556) | (.731) |
| Net asset value, end of period | $11.21 | $10.57 | $11.09 | $11.17 | $11.73 | $11.12 |
| Total ReturnB,C,D | 6.05% | (1.66)% | 3.58% | .27% | 10.50% | 4.55% |
| Ratios to Average Net AssetsE,F | | | | | | |
| Expenses before reductions | .72%G | .72% | .71% | .72% | .72% | .73% |
| Expenses net of fee waivers, if any | .72%G | .72% | .71% | .71% | .72% | .73% |
| Expenses net of all reductions | .72%G | .72% | .71% | .71% | .72% | .73% |
| Net investment income (loss) | 3.86%G | 3.65% | 3.52% | 3.70% | 3.94% | 4.35% |
| Supplemental Data | | | | | | |
| Net assets, end of period (000 omitted) | $932,539 | $907,266 | $981,928 | $939,177 | $1,085,039 | $817,192 |
| Portfolio turnover rateH | 85%G | 92% | 119% | 141% | 129% | 224% |
A Calculated based on average shares outstanding during the period.
B Total returns for periods of less than one year are not annualized.
C Total returns do not reflect charges attributable to your insurance company's separate account. Inclusion of these charges would reduce the total returns shown.
D Total returns would have been lower if certain expenses had not been reduced during the applicable periods shown.
E Fees and expenses of any underlying Fidelity Central Funds are not included in the Fund's expense ratio. The Fund indirectly bears its proportionate share of the expenses of any underlying Fidelity Central Funds. Based on their most recent shareholder report date, the expenses of any underlying non-money market Fidelity Central Funds were less than .005%.
F Expense ratios reflect operating expenses of the class. Expenses before reductions do not reflect amounts reimbursed by the investment adviser or reductions from brokerage service arrangements or reductions from other expense offset arrangements and do not represent the amount paid by the class during periods when reimbursements or reductions occur. Expenses net of fee waivers reflect expenses after reimbursement by the investment adviser but prior to reductions from brokerage service arrangements or other expense offset arrangements. Expenses net of all reductions represent the net expenses paid by the class.
G Annualized
H Amount does not include the portfolio activity of any underlying Fidelity Central Funds.
See accompanying notes which are an integral part of the financial statements.
Notes to Financial Statements (Unaudited)
For the period ended June 30, 2016
1. Organization.
VIP Strategic Income Portfolio (the Fund) is a fund of Variable Insurance Products Fund V (the Trust) and is authorized to issue an unlimited number of shares. The Trust is registered under the Investment Company Act of 1940, as amended (the 1940 Act), as an open-end management investment company organized as a Massachusetts business trust. Shares of the Fund may only be purchased by insurance companies for the purpose of funding variable annuity or variable life insurance contracts. The Fund offers the following classes of shares: Initial Class shares, Service Class shares, Service Class 2 shares and Investor Class shares. All classes have equal rights and voting privileges, except for matters affecting a single class.
2. Investments in Fidelity Central Funds.
The Fund invests in Fidelity Central Funds, which are open-end investment companies generally available only to other investment companies and accounts managed by the investment adviser and its affiliates. The Fund's Schedule of Investments lists each of the Fidelity Central Funds held as of period end, if any, as an investment of the Fund, but does not include the underlying holdings of each Fidelity Central Fund. As an Investing Fund, the Fund indirectly bears its proportionate share of the expenses of the underlying Fidelity Central Funds.
Based on its investment objective, each Fidelity Central Fund may invest or participate in various investment vehicles or strategies that are similar to those of the Fund. These strategies are consistent with the investment objectives of the Fund and may involve certain economic risks which may cause a decline in value of each of the Fidelity Central Funds and thus a decline in the value of the Fund.The Money Market Central Funds seek preservation of capital and current income and are managed by Fidelity Investments Money Management, Inc. (FIMM), an affiliate of the investment adviser. Annualized expenses of the Money Market Central Funds as of their most recent shareholder report date are less than .005%.The following summarizes the Fund's investment in each non-money market Fidelity Central Fund.
| Fidelity Central Fund | Investment Manager | Investment Objective | Investment Practices | Expense Ratio(a) |
| Fidelity Floating Rate Central Fund | FMR Co., Inc. (FMRC) | Seeks a high level of income by normally investing in floating rate loans and other floating rate securities. | Loans & Direct Debt Instruments
Restricted Securities | Less than .005% |
(a) Expenses expressed as a percentage of average net assets and are as of each underlying Central Fund's most recent annual or semi-annual shareholder report.
An unaudited holdings listing for the Fund, which presents direct holdings as well as the pro-rata share of any securities and other investments held indirectly through its investment in underlying non-money market Fidelity Central Funds, is available at institutional.fidelity.com. A complete unaudited list of holdings for each Fidelity Central Fund is available upon request or at the Securities and Exchange Commission (the SEC) website at www.sec.gov. In addition, the financial statements of the Fidelity Central Funds which contain the significant accounting policies (including investment valuation policies) of those funds are available on the SEC website or upon request.
3. Significant Accounting Policies.
The financial statements have been prepared in conformity with accounting principles generally accepted in the United States of America (GAAP), which require management to make certain estimates and assumptions at the date of the financial statements. Actual results could differ from those estimates. Subsequent events, if any, through the date that the financial statements were issued have been evaluated in the preparation of the financial statements. The following summarizes the significant accounting policies of the Fund:
Investment Valuation. Investments are valued as of 4:00 p.m. Eastern time on the last calendar day of the period. The Board of Trustees (the Board) has delegated the day to day responsibility for the valuation of the Fund's investments to the Fidelity Management & Research Company (FMR) Fair Value Committee (the Committee). In accordance with valuation policies and procedures approved by the Board, each Fund attempts to obtain prices from one or more third party pricing vendors or brokers to value its investments. When current market prices, quotations or currency exchange rates are not readily available or reliable, investments will be fair valued in good faith by the Committee, in accordance with procedures adopted by the Board. Factors used in determining fair value vary by investment type and may include market or investment specific events, changes in interest rates and credit quality. The frequency with which these procedures are used cannot be predicted and they may be utilized to a significant extent. The Committee oversees the Fund's valuation policies and procedures and reports to the Board on the Committee's activities and fair value determinations. The Board monitors the appropriateness of the procedures used in valuing the Fund's investments and ratifies the fair value determinations of the Committee.
The Fund categorizes the inputs to valuation techniques used to value its investments into a disclosure hierarchy consisting of three levels as shown below:
- Level 1 – quoted prices in active markets for identical investments
- Level 2 – other significant observable inputs (including quoted prices for similar investments, interest rates, prepayment speeds, etc.)
- Level 3 – unobservable inputs (including the Fund's own assumptions based on the best information available)
Valuation techniques used to value the Fund's investments by major category are as follows:
Debt securities, including restricted securities, are valued based on evaluated prices received from third party pricing vendors or from brokers who make markets in such securities. Corporate bonds, bank loan obligations, foreign government and government agency obligations, preferred securities, supranational obligations, U.S. government and government agency obligations and sovereign loan participations are valued by pricing vendors who utilize matrix pricing which considers yield or price of bonds of comparable quality, coupon, maturity and type or by broker-supplied prices. Collateralized mortgage obligations, commercial mortgage securities and U.S. government agency mortgage securities are valued by pricing vendors who utilize matrix pricing which considers prepayment speed assumptions, attributes of the collateral, yield or price of bonds of comparable quality, coupon, maturity and type or by broker-supplied prices. Swaps are marked-to-market daily based on valuations from third party pricing vendors, registered derivatives clearing organizations (clearinghouses) or broker-supplied valuations. These pricing sources may utilize inputs such as interest rate curves, credit spread curves, default possibilities and recovery rates. When independent prices are unavailable or unreliable, debt securities and swaps may be valued utilizing pricing methodologies which consider similar factors that would be used by third party pricing vendors. For foreign debt securities, when significant market or security specific events arise, valuations may be determined in good faith in accordance with procedures adopted by the Board. Debt securities and swaps are generally categorized as Level 2 in the hierarchy but may be Level 3 depending on the circumstances. The Fund invests a significant portion of its assets in below investment grade securities. The value of these securities can be more volatile due to changes in the credit quality of the issuer and is sensitive to changes in economic, market and regulatory conditions.
Equity securities, including restricted securities, for which market quotations are readily available, are valued at the last reported sale price or official closing price as reported by a third party pricing vendor on the primary market or exchange on which they are traded and are categorized as Level 1 in the hierarchy. In the event there were no sales during the day or closing prices are not available, securities are valued at the last quoted bid price or may be valued using the last available price and are generally categorized as Level 2 in the hierarchy. For foreign equity securities, when market or security specific events arise, comparisons to the valuation of American Depositary Receipts (ADRs), futures contracts, Exchange-Traded Funds (ETFs) and certain indexes as well as quoted prices for similar securities may be used and would be categorized as Level 2 in the hierarchy. Utilizing these techniques may result in transfers between Level 1 and Level 2. For equity securities, including restricted securities, where observable inputs are limited, assumptions about market activity and risk are used and these securities may be categorized as Level 3 in the hierarchy.
Futures contracts are valued at the settlement price established each day by the board of trade or exchange on which they are traded and are categorized as Level 1 in the hierarchy. Investments in open-end mutual funds, including the Fidelity Central Funds, are valued at their closing net asset value (NAV) each business day and are categorized as Level 1 in the hierarchy.
Changes in valuation techniques may result in transfers in or out of an assigned level within the disclosure hierarchy. The aggregate value of investments by input level as of June 30, 2016, is included at the end of the Fund's Schedule of Investments.
Foreign Currency. The Fund may use foreign currency contracts to facilitate transactions in foreign-denominated securities. Gains and losses from these transactions may arise from changes in the value of the foreign currency or if the counterparties do not perform under the contracts' terms.
Foreign-denominated assets, including investment securities, and liabilities are translated into U.S. dollars at the exchange rates at period end. Purchases and sales of investment securities, income and dividends received and expenses denominated in foreign currencies are translated into U.S. dollars at the exchange rate in effect on the transaction date.
The effects of exchange rate fluctuations on investments are included with the net realized and unrealized gain (loss) on investment securities. Other foreign currency transactions resulting in realized and unrealized gain (loss) are disclosed separately.
Investment Transactions and Income. For financial reporting purposes, the Fund's investment holdings and NAV include trades executed through the end of the last business day of the period. The NAV per share for processing shareholder transactions is calculated as of the close of business of the New York Stock Exchange (NYSE), normally 4:00 p.m. Eastern time and includes trades executed through the end of the prior business day. Gains and losses on securities sold are determined on the basis of identified cost and may include proceeds received from litigation. Dividend income is recorded on the ex-dividend date, except for certain dividends from foreign securities where the ex-dividend date may have passed, which are recorded as soon as the Fund is informed of the ex-dividend date. Non-cash dividends included in dividend income, if any, are recorded at the fair market value of the securities received. Income and capital gain distributions from Fidelity Central Funds, if any, are recorded on the ex-dividend date. Distributions received on securities that represent a return of capital or capital gain are recorded as a reduction of cost of investments and/or as a realized gain. Subsequent to ex-dividend date the Fund determines the components of these distributions, based upon receipt of tax filings or other correspondence relating to the underlying investment. Interest income is accrued as earned and includes coupon interest and amortization of premium and accretion of discount on debt securities as applicable. The principal amount on inflation-indexed securities is periodically adjusted to the rate of inflation and interest is accrued based on the principal amount. The adjustments to principal due to inflation are reflected as increases or decreases to Interest in the accompanying Statement of Operations. Investment income is recorded net of foreign taxes withheld where recovery of such taxes is uncertain. Debt obligations may be placed on non-accrual status and related interest income may be reduced by ceasing current accruals and writing off interest receivables when the collection of all or a portion of interest has become doubtful based on consistently applied procedures. A debt obligation is removed from non-accrual status when the issuer resumes interest payments or when collectability of interest is reasonably assured.
Class Allocations and Expenses. Investment income, realized and unrealized capital gains and losses, common expenses of the Fund, and certain fund-level expense reductions, if any, are allocated daily on a pro-rata basis to each class based on the relative net assets of each class to the total net assets of the Fund. Each class differs with respect to transfer agent and distribution and service plan fees incurred. Certain expense reductions may also differ by class. For the reporting period, the allocated portion of income and expenses to each class as a percent of its average net assets may vary due to the timing of recording these transactions in relation to fluctuating net assets of the classes. Expenses directly attributable to a fund are charged to that fund. Expenses attributable to more than one fund are allocated among the respective funds on the basis of relative net assets or other appropriate methods. Expense estimates are accrued in the period to which they relate and adjustments are made when actual amounts are known.
Income Tax Information and Distributions to Shareholders. Each year, the Fund intends to qualify as a regulated investment company under Subchapter M of the Internal Revenue Code, including distributing substantially all of its taxable income and realized gains. As a result, no provision for U.S. Federal income taxes is required. The Fund files a U.S. federal tax return, in addition to state and local tax returns as required. The Fund's federal income tax returns are subject to examination by the Internal Revenue Service (IRS) for a period of three fiscal years after they are filed. State and local tax returns may be subject to examination for an additional fiscal year depending on the jurisdiction. Foreign taxes are provided for based on the Fund's understanding of the tax rules and rates that exist in the foreign markets in which it invests.
Distributions are declared and recorded on the ex-dividend date. Income dividends and capital gain distributions are declared separately for each class. Income and capital gain distributions are determined in accordance with income tax regulations, which may differ from GAAP.
Capital accounts within the financial statements are adjusted for permanent book-tax differences. These adjustments have no impact on net assets or the results of operations. Capital accounts are not adjusted for temporary book-tax differences which will reverse in a subsequent period.
Book-tax differences are primarily due to futures contracts, swaps, foreign currency transactions, defaulted bonds, market discount, tax return of capital distributions, partnerships (including allocations from Fidelity Central Funds), capital loss carryforwards, equity-debt classifications, contingent interest and losses deferred due to wash sales and excise tax regulations.
For the period ended December 31, 2015, the Fund's distributions exceeded the aggregate amount of taxable income and net realized gains resulting in a return of capital for tax purposes. This was due to reductions in taxable income available for distribution after certain distributions had been made.
The federal tax cost of investment securities and unrealized appreciation (depreciation) as of period end were as follows:
| Gross unrealized appreciation | $49,205,489 |
| Gross unrealized depreciation | (41,394,490) |
| Net unrealized appreciation (depreciation) on securities | $7,810,999 |
| Tax cost | $1,234,899,663 |
Capital loss carryforwards are only available to offset future capital gains of the Fund to the extent provided by regulations and may be limited. Under the Regulated Investment Company Modernization Act of 2010 (the Act), the Fund is permitted to carry forward capital losses incurred in taxable years beginning after December 22, 2010 for an unlimited period and such capital losses are required to be used prior to any losses that expire. The capital loss carryforward information presented below, including any applicable limitation, is estimated as of prior fiscal period end and is subject to adjustment.
| No expiration | |
| Short-term | $(4,523,387) |
The Fund elected to defer to its next fiscal year approximately $1,233,309 of capital losses recognized during the period November 1, 2015 to December 31, 2015. The Fund elected to defer to its next fiscal year approximately $727,406 of ordinary losses recognized during the period November 1, 2015 to December 31, 2015.
Delayed Delivery Transactions and When-Issued Securities. During the period, the Fund transacted in securities on a delayed delivery or when-issued basis. Payment and delivery may take place after the customary settlement period for that security. The price of the underlying securities and the date when the securities will be delivered and paid for are fixed at the time the transaction is negotiated. The securities purchased on a delayed delivery or when-issued basis are identified as such in the Fund's Schedule of Investments. The Fund may receive compensation for interest forgone in the purchase of a delayed delivery or when-issued security. With respect to purchase commitments, the Fund identifies securities as segregated in its records with a value at least equal to the amount of the commitment. Losses may arise due to changes in the value of the underlying securities or if the counterparty does not perform under the contract's terms, or if the issuer does not issue the securities due to political, economic, or other factors.
To-Be-Announced (TBA) Securities and Mortgage Dollar Rolls. During the period, the Fund transacted in TBA securities that involved buying or selling mortgage-backed securities (MBS) on a forward commitment basis. A TBA transaction typically does not designate the actual security to be delivered and only includes an approximate principal amount; however delivered securities must meet specified terms defined by industry guidelines, including issuer, rate and current principal amount outstanding on underlying mortgage pools. The Fund may enter into a TBA transaction with the intent to take possession of or deliver the underlying MBS, or the Fund may elect to extend the settlement by entering into either a mortgage or reverse mortgage dollar roll. Mortgage dollar rolls are transactions where a fund sells TBA securities and simultaneously agrees to repurchase MBS on a later date at a lower price and with the same counterparty. Reverse mortgage dollar rolls involve the purchase and simultaneous agreement to sell TBA securities on a later date at a lower price. Transactions in mortgage dollar rolls and reverse mortgage dollar rolls are accounted for as purchases and sales and may result in an increase to the Fund's portfolio turnover rate.
Purchases and sales of TBA securities involve risks similar to those discussed above for delayed delivery and when-issued securities. Also, if the counterparty in a mortgage dollar roll or a reverse mortgage dollar roll transaction files for bankruptcy or becomes insolvent, the Fund's right to repurchase or sell securities may be limited. Additionally, when a fund sells TBA securities without already owning or having the right to obtain the deliverable securities (an uncovered forward commitment to sell), it incurs a risk of loss because it could have to purchase the securities at a price that is higher than the price at which it sold them. A fund may be unable to purchase the deliverable securities if the corresponding market is illiquid.
TBA securities subject to a forward commitment to sell at period end are included at the end of the Fund's Schedule of Investments under the caption "TBA Sale Commitments." The proceeds and value of these commitments are reflected in the Fund's Statement of Assets and Liabilities as Receivable for TBA sale commitments and TBA sale commitments, at value, respectively.
Restricted Securities. The Fund may invest in securities that are subject to legal or contractual restrictions on resale. These securities generally may be resold in transactions exempt from registration or to the public if the securities are registered. Disposal of these securities may involve time-consuming negotiations and expense, and prompt sale at an acceptable price may be difficult. Information regarding restricted securities is included at the end of the Fund's Schedule of Investments.
Loans and Other Direct Debt Instruments. The Fund invests in direct debt instruments which are interests in amounts owed to lenders by corporate or other borrowers. These instruments may be in the form of loans, trade claims or other receivables and may include standby financing commitments such as revolving credit facilities that obligate the Fund to supply additional cash to the borrower on demand. Loans may be acquired through assignment or participation. The Fund did not have any unfunded loan commitments, which are contractual obligations for future funding, at period end.
4. Derivative Instruments.
Risk Exposures and the Use of Derivative Instruments. The Fund's investment objective allows the Fund to enter into various types of derivative contracts, including futures contracts and swaps. Derivatives are investments whose value is primarily derived from underlying assets, indices or reference rates and may be transacted on an exchange or over-the-counter (OTC). Derivatives may involve a future commitment to buy or sell a specified asset based on specified terms, to exchange future cash flows at periodic intervals based on a notional principal amount, or for one party to make one or more payments upon the occurrence of specified events in exchange for periodic payments from the other party.
The Fund used derivatives to increase returns, to gain exposure to certain types of assets and to manage exposure to certain risks as defined below. The success of any strategy involving derivatives depends on analysis of numerous economic factors, and if the strategies for investment do not work as intended, the Fund may not achieve its objectives.
The Fund's use of derivatives increased or decreased its exposure to the following risk:
| Interest Rate Risk | Interest rate risk relates to the fluctuations in the value of interest-bearing securities due to changes in the prevailing levels of market interest rates. |
The Fund is also exposed to additional risks from investing in derivatives, such as liquidity risk and counterparty credit risk. Liquidity risk is the risk that the Fund will be unable to close out the derivative in the open market in a timely manner. Counterparty credit risk is the risk that the counterparty will not be able to fulfill its obligation to the Fund. Counterparty credit risk related to exchange-traded futures contracts may be mitigated by the protection provided by the exchange on which they trade. Counterparty credit risk related to centrally cleared OTC swaps may be mitigated by the protection provided by the clearinghouse.
Investing in derivatives may involve greater risks than investing in the underlying assets directly and, to varying degrees, may involve risk of loss in excess of any initial investment and collateral received and amounts recognized in the Statement of Assets and Liabilities. In addition, there may be the risk that the change in value of the derivative contract does not correspond to the change in value of the underlying instrument.
Net Realized Gain (Loss) and Change in Net Unrealized Appreciation (Depreciation) on Derivatives. The table below, which reflects the impacts of derivatives on the financial performance of the Fund, summarizes the net realized gain (loss) and change in net unrealized appreciation (depreciation) for derivatives during the period as presented in the Statement of Operations.
| Primary Risk Exposure / Derivative Type | Net Realized Gain (Loss) | Change in Net Unrealized Appreciation (Depreciation) |
| Interest Rate Risk | | |
| Futures Contracts | $367,006 | $311,013 |
| Swaps | (152,150) | (57,044) |
| Totals | $214,856 | $253,969 |
A summary of the value of derivatives by primary risk exposure as of period end is included at the end of the Schedule of Investments.
Futures Contracts. A futures contract is an agreement between two parties to buy or sell a specified underlying instrument for a fixed price at a specified future date. The Fund used futures contracts to manage its exposure to the bond market and fluctuations in interest rates.
Upon entering into a futures contract, a fund is required to deposit either cash or securities (initial margin) with a clearing broker in an amount equal to a certain percentage of the face value of the contract. Futures contracts are marked-to-market daily and subsequent daily payments (variation margin) are made or received by a fund depending on the daily fluctuations in the value of the futures contracts and are recorded as unrealized appreciation or (depreciation). This receivable and/or payable, if any, is included in daily variation margin for derivative instruments in the Statement of Assets and Liabilities. Realized gain or (loss) is recorded upon the expiration or closing of a futures contract. The net realized gain (loss) and change in net unrealized appreciation (depreciation) on futures contracts during the period is included in the Statement of Operations.
Any open futures contracts at period end are presented in the Schedule of Investments under the caption "Futures Contracts". The underlying face amount at value reflects each contract's exposure to the underlying instrument or index at period end and is representative of volume of activity during the period. Securities deposited to meet initial margin requirements are identified in the Schedule of Investments.
Swaps. A swap is a contract between two parties to exchange future cash flows at periodic intervals based on a notional principal amount. A centrally cleared OTC swap is a transaction executed between a fund and a dealer counterparty, then cleared by a futures commission merchant (FCM) through a clearinghouse. Once cleared, the clearinghouse serves as a central counterparty, with whom a fund exchanges cash flows for the life of the transaction, similar to transactions in futures contracts.
Centrally cleared OTC swaps require a fund to deposit either cash or securities (initial margin) with the FCM, at the instruction of and for the benefit of the clearinghouse. Securities deposited to meet initial margin requirements are identified in the Schedule of Investments. Centrally cleared OTC swaps are marked-to-market daily and subsequent payments (variation margin) are made or received depending on the daily fluctuations in the value of the swaps and are recorded as unrealized appreciation or (depreciation). These daily payments, if any, are included in receivable or payable for daily variation margin for derivative instruments in the Statement of Assets and Liabilities. Any premiums for centrally cleared OTC swaps are recorded periodically throughout the term of the swap to variation margin and included in unrealized appreciation (depreciation) in the Statement of Assets and Liabilities. Any premiums are recognized as realized gain (loss) upon termination or maturity of the swap.
Payments are exchanged at specified intervals, accrued daily commencing with the effective date of the contract and recorded as realized gain or (loss). Some swaps may be terminated prior to the effective date and realize a gain or loss upon termination. The net realized gain (loss) and change in net unrealized appreciation (depreciation) on swaps during the period is included in the Statement of Operations.
Any open swaps at period end are included in the Schedule of Investments under the caption "Swaps" and are representative of volume of activity during the period.
Interest Rate Swaps. Interest rate swaps are agreements between counterparties to exchange cash flows, one based on a fixed rate, and the other on a floating rate. The Fund entered into interest rate swaps to manage its exposure to interest rate changes. Changes in interest rates can have an effect on both the value of bond holdings as well as the amount of interest income earned. In general, the value of bonds can fall when interest rates rise and can rise when interest rates fall.
5. Purchases and Sales of Investments.
Purchases and sales of securities (including the Fixed-Income Central Funds), other than short-term securities and U.S. government securities, aggregated $332,816,592 and $332,949,516, respectively.
6. Fees and Other Transactions with Affiliates.
Management Fee. Fidelity Management & Research Company (the investment adviser) and its affiliates provide the Fund with investment management related services for which the Fund pays a monthly management fee. The management fee is the sum of an individual fund fee rate that is based on an annual rate of .45% of the Fund's average net assets and an annualized group fee rate that averaged .11% during the period. The group fee rate is based upon the average net assets of all the mutual funds advised by the investment adviser, including any mutual funds previously advised by the investment adviser that are currently advised by Fidelity SelectCo, LLC, an affiliate of the investment adviser. The group fee rate decreases as assets under management increase and increases as assets under management decrease. For the reporting period, the total annualized management fee rate was .56% of the Fund's average net assets.
Distribution and Service Plan Fees. In accordance with Rule 12b-1 of the 1940 Act, the Fund has adopted separate 12b-1 Plans for each Service Class of shares. Each Service Class pays Fidelity Distributors Corporation (FDC), an affiliate of the investment adviser, a service fee. For the period, the service fee is based on an annual rate of .10% of Service Class' average net assets and .25% of Service Class 2's average net assets.
For the period, total fees, all of which were re-allowed to insurance companies for the distribution of shares and providing shareholder support services, were as follows:
| Service Class | $346 |
| Service Class 2 | 251,589 |
| | $251,935 |
Transfer Agent Fees. Fidelity Investments Institutional Operations Company, Inc. (FIIOC), an affiliate of the investment adviser, is the Fund's transfer, dividend disbursing, and shareholder servicing agent. FIIOC receives an asset-based fee with respect to each class. Each class (with the exception of Investor Class) pays a fee for transfer agent services, typesetting and printing and mailing of shareholder reports, excluding mailing of proxy statements, equal to an annual rate of .07% (.10% for Investor Class) of class-level average net assets. For the period, transfer agent fees for each class were as follows:
| Initial Class | $30,892 |
| Service Class | 235 |
| Service Class 2 | 68,432 |
| Investor Class | 461,144 |
| | $560,703 |
Accounting and Security Lending Fees. Fidelity Service Company, Inc. (FSC), an affiliate of the investment adviser, maintains the Fund's accounting records. The accounting fee is based on the level of average net assets for each month. Under a separate contract, FSC administers the security lending program. The security lending fee is based on the number and duration of lending transactions.
Brokerage Commissions. The Fund placed a portion of its portfolio transactions with brokerage firms which are affiliates of the investment adviser. Brokerage commissions are included in net realized gain (loss) and change in net unrealized appreciation (depreciation) in the Statement of Operations. The commissions paid to these affiliated firms were $457 for the period.
Interfund Trades. The Fund may purchase from or sell securities to other Fidelity Funds under procedures adopted by the Board. The procedures have been designed to ensure these interfund trades are executed in accordance with Rule 17a-7 of the 1940 Act. Interfund trades are included within the respective purchases and sales amounts shown in the Purchases and Sales of Investments note.
7. Committed Line of Credit.
The Fund participates with other funds managed by the investment adviser or an affiliate in a $4.25 billion credit facility (the "line of credit") to be utilized for temporary or emergency purposes to fund shareholder redemptions or for other short-term liquidity purposes. The Fund has agreed to pay commitment fees on its pro-rata portion of the line of credit, which amounted to $1,064 and is reflected in Miscellaneous expenses on the Statement of Operations. During the period, the Fund did not borrow on this line of credit.
8. Security Lending.
The Fund lends portfolio securities through a lending agent from time to time in order to earn additional income. For equity securities, a lending agent is used and may loan securities to certain qualified borrowers, including Fidelity Capital Markets (FCM), a broker-dealer affiliated with the Fund. On the settlement date of the loan, the Fund receives collateral (in the form of U.S. Treasury obligations, letters of credit and/or cash) against the loaned securities and maintains collateral in an amount not less than 100% of the market value of the loaned securities during the period of the loan. The market value of the loaned securities is determined at the close of business of the Fund and any additional required collateral is delivered to the Fund on the next business day. The Fund or borrower may terminate the loan at any time, and if the borrower defaults on its obligation to return the securities loaned because of insolvency or other reasons, the Fund may apply collateral received from the borrower against the obligation. The Fund may experience delays and costs in recovering the securities loaned. Any cash collateral received is invested in the Fidelity Securities Lending Cash Central Fund. At period end, there were no security loans outstanding. Security lending income represents the income earned on investing cash collateral, less rebates paid to borrowers and any lending agent fees associated with the loan, plus any premium payments received for lending certain types of securities. Security lending income is presented in the Statement of Operations as a component of income from Fidelity Central Funds. Total security lending income during the period amounted to $678. During the period, there were no securities loaned to FCM.
9. Expense Reductions.
Commissions paid to certain brokers with whom the investment adviser, or its affiliates, places trades on behalf of the Fund include an amount in addition to trade execution, which may be rebated back to the Fund to offset certain expenses. This amount totaled $999 for the period.
In addition, during the period the investment adviser reimbursed and/or waived a portion of fund-level operating expenses in the amount of $2,437.
10. Distributions to Shareholders.
Distributions to shareholders of each class were as follows:
| | Six months ended
June 30, 2016 | Year ended December 31, 2015 |
| From net investment income | | |
| Initial Class | $– | $2,608,355 |
| Service Class | – | 20,999 |
| Service Class 2 | – | 4,841,746 |
| Investor Class | – | 25,467,270 |
| Total | $– | $32,938,370 |
| Tax Return of Capital | | |
| Initial Class | $– | $287,413 |
| Service Class | – | 2,400 |
| Service Class 2 | – | 576,830 |
| Investor Class | – | 2,833,987 |
| Total | $– | $3,700,630 |
11. Share Transactions.
Transactions for each class of shares were as follows:
| | Shares | Shares | Dollars | Dollars |
| | Six months ended
June 30, 2016 | Year ended December 31, 2015 | Six months ended
June 30, 2016 | Year ended December 31, 2015 |
| Initial Class | | | | |
| Shares sold | 265,808 | 438,630 | $2,927,745 | $4,928,200 |
| Reinvestment of distributions | – | 272,415 | – | 2,895,768 |
| Shares redeemed | (656,646) | (1,754,032) | (7,080,309) | (19,582,348) |
| Net increase (decrease) | (390,838) | (1,042,987) | $(4,152,564) | $(11,758,380) |
| Service Class | | | | |
| Reinvestment of distributions | – | 2,203 | $– | $23,399 |
| Shares redeemed | (15,768) | (5,901) | (171,423) | (64,952) |
| Net increase (decrease) | (15,768) | (3,698) | $(171,423) | $(41,553) |
| Service Class 2 | | | | |
| Shares sold | 4,930,705 | 7,779,897 | $52,956,546 | $86,550,696 |
| Reinvestment of distributions | – | 513,609 | – | 5,418,575 |
| Shares redeemed | (3,112,873) | (3,102,820) | (33,444,442) | (34,258,336) |
| Net increase (decrease) | 1,817,832 | 5,190,686 | $19,512,104 | $57,710,935 |
| Investor Class | | | | |
| Shares sold | 1,725,341 | 3,943,346 | $18,807,741 | $44,206,013 |
| Reinvestment of distributions | – | 2,669,930 | – | 28,301,258 |
| Shares redeemed | (4,349,601) | (9,288,284) | (46,233,406) | (103,280,796) |
| Net increase (decrease) | (2,624,260) | (2,675,008) | $(27,425,665) | $(30,773,525) |
12. Other.
The Fund's organizational documents provide former and current trustees and officers with a limited indemnification against liabilities arising in connection with the performance of their duties to the Fund. In the normal course of business, the Fund may also enter into contracts that provide general indemnifications. The Fund's maximum exposure under these arrangements is unknown as this would be dependent on future claims that may be made against the Fund. The risk of material loss from such claims is considered remote.
At the period end, the investment adviser or its affiliates were the owners of record of 82% of the total outstanding shares of the Fund.
13. Credit Risk.
The Fund's relatively large investment in countries with limited or developing capital markets may involve greater risks than investments in more developed markets and the prices of such investments may be volatile. The yields of emerging market debt obligations reflect, among other things, perceived credit risk. The consequences of political, social or economic changes in these markets may have disruptive effects on the market prices of the Fund's investments and the income they generate, as well as the Fund's ability to repatriate such amounts.
14. Litigation.
The Fund, and other entities managed by FMR or its affiliates, became aware in March 2015 that they were named as defendants in a lawsuit originally filed in the United States Bankruptcy Court for the Southern District of New York in 2009. The lawsuit was brought by creditors of Motors Liquidation Company (f/k/a General Motors), which went through Chapter 11 bankruptcy proceedings in 2009, and is captioned Official Committee of Unsecured Creditors of Motors Liquidation Company v. JPMorgan Chase Bank, N.A., et al., Adversary No. 09-00504 (REG). The plaintiffs are seeking an order that the Fund and other defendants return proceeds received in 2009 in full payment of the principal and interest on General Motors secured debt. The plaintiffs contend that the Fund and the other defendants were not secured creditors at the time of the 2009 payments and, thus, were not entitled to payment in full. In January 2015, the Court of Appeals ruled that JPMorgan, as administrative agent for all of the debtholders, released the security interest on certain collateral securing the debt prior to the 2009 payments. The parties to the dispute have commenced discovery on the value of remaining, unreleased collateral. At this time, Management cannot determine the amount of loss that may be realized, but expects the amount to be less than the $1,208,199 received in 2009. The Fund was not previously aware that it had been named as a defendant in this case because, in 2009, the Bankruptcy Court allowed the plaintiffs to refrain from serving any of the defendants other than JPMorgan with notice of the filing of the lawsuit. The Fund will explore all available options for minimizing any loss to the Fund. The Fund will also incur legal costs in defending the case.
Shareholder Expense Example
As a shareholder of the Fund, you incur two types of costs: (1) transaction costs and (2) ongoing costs, including management fees, distribution and/or service (12b-1) fees and other Fund expenses. This Example is intended to help you understand your ongoing costs (in dollars) of investing in the Fund and to compare these costs with the ongoing costs of investing in other mutual funds.
The Example is based on an investment of $1,000 invested at the beginning of the period and held for the entire period (January 1, 2016 to June 30, 2016).
Actual Expenses
The first line of the accompanying table for each class of the Fund provides information about actual account values and actual expenses. You may use the information in this line, together with the amount you invested, to estimate the expenses that you paid over the period. Simply divide your account value by $1,000.00 (for example, an $8,600 account value divided by $1,000.00 = 8.6), then multiply the result by the number in the first line for a class of the Fund under the heading entitled "Expenses Paid During Period" to estimate the expenses you paid on your account during this period. The estimate of expenses does not include any fees or other expenses of any variable annuity or variable life insurance product. If they were, the estimate of expenses you paid during the period would be higher, and your ending account value would be lower. In addition, the Fund, as a shareholder in the underlying Fidelity Central Funds, will indirectly bear its pro-rata share of the fees and expenses incurred by the underlying Fidelity Central Funds. These fees and expenses are not included in the Fund's annualized expense ratio used to calculate the expense estimate in the table below.
Hypothetical Example for Comparison Purposes
The second line of the accompanying table for each class of the Fund provides information about hypothetical account values and hypothetical expenses based on a Class' actual expense ratio and an assumed rate of return of 5% per year before expenses, which is not the Class' actual return. The hypothetical account values and expenses may not be used to estimate the actual ending account balance or expenses you paid for the period. You may use this information to compare the ongoing costs of investing in the Fund and other funds. To do so, compare this 5% hypothetical example with the 5% hypothetical examples that appear in the shareholder reports of the other funds. The estimate of expenses does not include any fees or other expenses of any variable annuity or variable life insurance product. If they were, the estimate of expenses you paid during the period would be higher, and your ending account value would be lower. In addition, the Fund, as a shareholder in the underlying Fidelity Central Funds, will indirectly bear its pro-rata share of the fees and expenses incurred by the underlying Fidelity Central Funds. These fees and expenses are not included in the Fund's annualized expense ratio used to calculate the expense estimate in the table below.
Please note that the expenses shown in the table are meant to highlight your ongoing costs only and do not reflect any transaction costs. Therefore, the second line of the table is useful in comparing ongoing costs only, and will not help you determine the relative total costs of owning different funds.
| | Annualized Expense Ratio-A | Beginning
Account Value
January 1, 2016 | Ending
Account Value
June 30, 2016 | Expenses Paid
During Period-B
January 1, 2016
to June 30, 2016 |
| Initial Class | .69% | | | |
| Actual | | $1,000.00 | $1,060.40 | $3.53 |
| Hypothetical-C | | $1,000.00 | $1,021.43 | $3.47 |
| Service Class | .79% | | | |
| Actual | | $1,000.00 | $1,059.50 | $4.05 |
| Hypothetical-C | | $1,000.00 | $1,020.93 | $3.97 |
| Service Class 2 | .94% | | | |
| Actual | | $1,000.00 | $1,058.90 | $4.81 |
| Hypothetical-C | | $1,000.00 | $1,020.19 | $4.72 |
| Investor Class | .72% | | | |
| Actual | | $1,000.00 | $1,060.50 | $3.69 |
| Hypothetical-C | | $1,000.00 | $1,021.28 | $3.62 |
A Annualized expense ratio reflects expenses net of applicable fee waivers.
B Expenses are equal to each Class' annualized expense ratio, multiplied by the average account value over the period, multiplied by 182/366 (to reflect the one-half year period). The fees and expenses of the underlying Fidelity Central Funds in which the Fund invests are not included in each Class' annualized expense ratio. In addition to the expenses noted above, the Fund also indirectly bears its proportional share of the expenses of the underlying Fidelity Central Funds. Annualized expenses of the underlying non-money market Fidelity Central Funds as of their most recent fiscal half year were less than .005%.
C 5% return per year before expenses
VIPSI-SANN-0816
1.803539.112
Fidelity® Variable Insurance Products:
Investor Freedom Funds - Income, 2005, 2010, 2015, 2020, 2025, 2030
Semi-Annual Report June 30, 2016 |
|
Contents
To view a fund's proxy voting guidelines and proxy voting record for the 12-month period ended June 30, visit http://www.fidelity.com/proxyvotingresults or visit the Securities and Exchange Commission's (SEC) web site at http://www.sec.gov.
You may also call 1-877-208-0098 to request a free copy of the proxy voting guidelines.
Fidelity® Variable Insurance Products are separate account options which are purchased through a variable insurance contract.
Standard & Poor's, S&P and S&P 500 are registered service marks of The McGraw-Hill Companies, Inc. and have been licensed for use by Fidelity Distributors Corporation.
Other third-party marks appearing herein are the property of their respective owners.
All other marks appearing herein are registered or unregistered trademarks or service marks of FMR LLC or an affiliated company. © 2016 FMR LLC. All rights reserved.
This report and the financial statements contained herein are submitted for the general information of the shareholders of the Funds. This report is not authorized for distribution to prospective investors in the Funds unless preceded or accompanied by an effective prospectus.
A fund files its complete schedule of portfolio holdings with the SEC for the first and third quarters of each fiscal year on Form N-Q. Forms N-Q are available on the SEC’s web site at http://www.sec.gov. A fund's Forms N-Q may be reviewed and copied at the SEC’s Public Reference Room in Washington, DC. Information regarding the operation of the SEC's Public Reference Room may be obtained by calling 1-800-SEC-0330.
For a complete list of a fund's portfolio holdings, view the most recent holdings listing, semiannual report, or annual report on Fidelity's web site at http://www.fidelity.com, http://www.institutional.fidelity.com, or http://www.401k.com, as applicable.
NOT FDIC INSURED •MAY LOSE VALUE •NO BANK GUARANTEE
Neither the Funds nor Fidelity Distributors Corporation is a bank.
VIP Investor Freedom Income Portfolio℠
Investment Summary (Unaudited)
The information in the following tables is based on the direct investments of the Fund.
Top Holdings as of June 30, 2016
| | % of fund's net assets | % of fund's net assets 6 months ago |
| VIP Investment Grade Bond Portfolio Investor Class | 40.6 | 42.3 |
| VIP Government Money Market Portfolio Investor Class 0.19% | 29.6 | 28.5 |
| VIP Overseas Portfolio Investor Class | 4.7 | 3.8 |
| VIP Emerging Markets Portfolio Investor Class | 4.6 | 3.6 |
| VIP High Income Portfolio Investor Class | 3.8 | 3.7 |
| VIP Growth & Income Portfolio Investor Class | 3.5 | 3.8 |
| VIP Equity-Income Portfolio Investor Class | 3.1 | 3.3 |
| VIP Growth Portfolio Investor Class | 3.0 | 3.3 |
| VIP Contrafund Portfolio Investor Class | 2.9 | 3.2 |
| VIP Value Portfolio Investor Class | 2.2 | 2.4 |
| | 98.0 | 97.9 |
Asset Allocation (% of fund's net assets)
| Period end |
| | Domestic Equity Funds | 16.7% |
| | International Equity Funds | 9.3% |
| | Bond Funds | 44.4% |
| | Short-Term Funds | 29.6% |

| Six months ago |
| | Domestic Equity Funds | 18.1% |
| | International Equity Funds | 7.4% |
| | Bond Funds | 46.0% |
| | Short-Term Funds | 28.5% |

VIP Investor Freedom Income Portfolio℠
Investments June 30, 2016 (Unaudited)
Showing Percentage of Net Assets
| Domestic Equity Funds - 16.7% | | | |
| | | Shares | Value |
| VIP Contrafund Portfolio Investor Class (a) | | 62,404 | $1,935,776 |
| VIP Equity-Income Portfolio Investor Class (a) | | 102,284 | 2,049,774 |
| VIP Growth & Income Portfolio Investor Class (a) | | 130,184 | 2,319,886 |
| VIP Growth Portfolio Investor Class (a) | | 34,640 | 1,969,266 |
| VIP Mid Cap Portfolio Investor Class (a) | | 18,427 | 564,225 |
| VIP Value Portfolio Investor Class (a) | | 109,390 | 1,483,334 |
| VIP Value Strategies Portfolio Investor Class (a) | | 50,068 | 725,990 |
| TOTAL DOMESTIC EQUITY FUNDS | | | |
| (Cost $9,789,191) | | | 11,048,251 |
|
| International Equity Funds - 9.3% | | | |
| VIP Emerging Markets Portfolio Investor Class(a) | | 352,290 | 3,033,220 |
| VIP Overseas Portfolio Investor Class (a) | | 176,710 | 3,136,600 |
| TOTAL INTERNATIONAL EQUITY FUNDS | | | |
| (Cost $5,739,613) | | | 6,169,820 |
|
| Bond Funds - 44.4% | | | |
| VIP High Income Portfolio Investor Class (a) | | 480,613 | 2,528,022 |
| VIP Investment Grade Bond Portfolio Investor Class (a) | | 2,065,688 | 26,936,576 |
| TOTAL BOND FUNDS | | | |
| (Cost $28,721,778) | | | 29,464,598 |
|
| Short-Term Funds - 29.6% | | | |
| VIP Government Money Market Portfolio Investor Class 0.19% (a)(b) | | | |
| (Cost $19,597,431) | | 19,597,431 | 19,597,431 |
| TOTAL INVESTMENT PORTFOLIO - 100.0% | | | |
| (Cost $63,848,013) | | | 66,280,100 |
| NET OTHER ASSETS (LIABILITIES) - 0.0% | | | 2 |
| NET ASSETS - 100% | | | $66,280,102 |
Legend
(a) Affiliated Fund
(b) The rate quoted is the annualized seven-day yield of the fund at period end.
Affiliated Underlying Funds
Information regarding the Fund's fiscal year to date purchases and sales of the affiliated Underlying Funds and income earned by the Fund from investments in affiliated Underlying Funds is as follows:
| Affiliate | Value, beginning of period | Purchases | Sales Proceeds | Dividend Income | Value, end of period |
| VIP Contrafund Portfolio Investor Class | $2,033,060 | $365,475 | $313,830 | $- | $1,935,776 |
| VIP Emerging Markets Portfolio Investor Class | 2,293,387 | 738,367 | 204,589 | - | 3,033,220 |
| VIP Equity-Income Portfolio Investor Class | 2,139,495 | 298,790 | 367,971 | - | 2,049,774 |
| VIP Government Money Market Portfolio Investor Class 0.19% | 18,211,442 | 3,602,903 | 2,216,915 | 13,296 | 19,597,431 |
| VIP Growth & Income Portfolio Investor Class | 2,411,847 | 417,846 | 396,569 | - | 2,319,886 |
| VIP Growth Portfolio Investor Class | 2,111,509 | 392,035 | 270,610 | - | 1,969,266 |
| VIP High Income Portfolio Investor Class | 2,382,126 | 234,962 | 251,319 | - | 2,528,022 |
| VIP Investment Grade Bond Portfolio Investor Class | 27,110,106 | 2,056,785 | 3,753,280 | 14,869 | 26,936,576 |
| VIP Mid Cap Portfolio Investor Class | 579,782 | 108,525 | 95,496 | - | 564,225 |
| VIP Overseas Portfolio Investor Class | 2,465,902 | 1,322,308 | 496,799 | - | 3,136,600 |
| VIP Value Portfolio Investor Class | 1,547,097 | 166,983 | 258,382 | - | 1,483,334 |
| VIP Value Strategies Portfolio Investor Class | 745,650 | 105,170 | 130,096 | - | 725,990 |
| Total | $64,031,403 | $9,810,149 | $8,755,856 | $28,165 | $66,280,100 |
Investment Valuation
All investments are categorized as Level 1 under the Fair Value Hierarchy. The inputs or methodology used for valuing securities may not be an indication of the risk associated with investing in those securities. For more information on valuation inputs please refer to the Investment Valuation section in the accompanying Notes to Financial Statements.
See accompanying notes which are an integral part of the financial statements.
VIP Investor Freedom Income Portfolio℠
Financial Statements
Statement of Assets and Liabilities
| | | June 30, 2016 (Unaudited) |
| Assets | | |
| Investment in securities, at value (cost $63,848,013) — See accompanying schedule | | $66,280,100 |
| Receivable for fund shares sold | | 9,632 |
| Total assets | | 66,289,732 |
| Liabilities | | |
| Payable for investments purchased | $9,610 | |
| Payable for fund shares redeemed | 20 | |
| Total liabilities | | 9,630 |
| Net Assets | | $66,280,102 |
| Net Assets consist of: | | |
| Paid in capital | | $63,617,448 |
| Undistributed net investment income | | 26,236 |
| Accumulated undistributed net realized gain (loss) on investments | | 204,331 |
| Net unrealized appreciation (depreciation) on investments | | 2,432,087 |
| Net Assets, for 6,002,220 shares outstanding | | $66,280,102 |
| Net Asset Value, offering price and redemption price per share ($66,280,102 ÷ 6,002,220 shares) | | $11.04 |
See accompanying notes which are an integral part of the financial statements.
Statement of Operations
| | | Six months ended June 30, 2016 (Unaudited) |
| Investment Income | | |
| Income distributions from underlying funds | | $28,165 |
| Expenses | | |
| Independent trustees' fees and expenses | $146 | |
| Total expenses before reductions | 146 | |
| Expense reductions | (146) | – |
| Net investment income (loss) | | 28,165 |
| Realized and Unrealized Gain (Loss) | | |
| Realized gain (loss) on sale of underlying fund shares | (172,704) | |
| Capital gain distributions from underlying funds | 698,822 | |
| Total net realized gain (loss) | | 526,118 |
| Change in net unrealized appreciation (depreciation) on underlying funds | | 1,367,106 |
| Net gain (loss) | | 1,893,224 |
| Net increase (decrease) in net assets resulting from operations | | $1,921,389 |
See accompanying notes which are an integral part of the financial statements.
Statement of Changes in Net Assets
| | Six months ended June 30, 2016 (Unaudited) | Year ended December 31, 2015 |
| Increase (Decrease) in Net Assets | | |
| Operations | | |
| Net investment income (loss) | $28,165 | $1,126,889 |
| Net realized gain (loss) | 526,118 | 739,854 |
| Change in net unrealized appreciation (depreciation) | 1,367,106 | (2,183,270) |
| Net increase (decrease) in net assets resulting from operations | 1,921,389 | (316,527) |
| Distributions to shareholders from net investment income | (5,857) | (1,122,664) |
| Distributions to shareholders from net realized gain | (773,125) | (87,017) |
| Total distributions | (778,982) | (1,209,681) |
| Share transactions | | |
| Proceeds from sales of shares | 5,179,810 | 16,249,289 |
| Reinvestment of distributions | 778,982 | 1,209,681 |
| Cost of shares redeemed | (4,852,502) | (18,022,221) |
| Net increase (decrease) in net assets resulting from share transactions | 1,106,290 | (563,251) |
| Total increase (decrease) in net assets | 2,248,697 | (2,089,459) |
| Net Assets | | |
| Beginning of period | 64,031,405 | 66,120,864 |
| End of period | $66,280,102 | $64,031,405 |
| Other Information | | |
| Undistributed net investment income end of period | $26,236 | $3,928 |
| Shares | | |
| Sold | 478,628 | 1,445,091 |
| Issued in reinvestment of distributions | 74,974 | 111,049 |
| Redeemed | (448,686) | (1,609,852) |
| Net increase (decrease) | 104,916 | (53,712) |
See accompanying notes which are an integral part of the financial statements.
Financial Highlights — VIP Investor Freedom Income Portfolio
| | Six months ended (Unaudited) June 30, | Years ended December 31, | | | | |
| | 2016 | 2015 | 2014 | 2013 | 2012 | 2011 |
| Selected Per–Share Data | | | | | | |
| Net asset value, beginning of period | $10.86 | $11.11 | $10.97 | $10.65 | $10.30 | $10.40 |
| Income from Investment Operations | | | | | | |
| Net investment income (loss)A | –B | .19 | .17 | .19 | .17 | .18 |
| Net realized and unrealized gain (loss) | .31 | (.23) | .25 | .39 | .50 | (.02) |
| Total from investment operations | .31 | (.04) | .42 | .58 | .67 | .16 |
| Distributions from net investment income | –B | (.19) | (.17) | (.17) | (.16) | (.19) |
| Distributions from net realized gain | (.13) | (.01) | (.10) | (.09) | (.16) | (.07) |
| Total distributions | (.13) | (.21)C | (.28)D | (.26) | (.32) | (.26) |
| Net asset value, end of period | $11.04 | $10.86 | $11.11 | $10.97 | $10.65 | $10.30 |
| Total ReturnE,F,G | 2.96% | (.37)% | 3.80% | 5.43% | 6.54% | 1.54% |
| Ratios to Average Net AssetsH,I | | | | | | |
| Expenses before reductionsJ | -%K | -% | -% | -% | -% | -% |
| Expenses net of fee waivers, if any | -%K | -% | -% | -% | -% | -% |
| Expenses net of all reductions | -%K | -% | -% | -% | -% | -% |
| Net investment income (loss) | .09%K | 1.68% | 1.57% | 1.77% | 1.63% | 1.74% |
| Supplemental Data | | | | | | |
| Net assets, end of period (000 omitted) | $66,280 | $64,031 | $66,121 | $60,214 | $38,545 | $30,547 |
| Portfolio turnover rateH | 27%K | 33% | 26% | 33% | 15% | 28% |
A Calculated based on average shares outstanding during the period.
B Amount represents less than $.005 per share.
C Total distributions of $.21 per share is comprised of distributions from net investment income of $.194 and distributions from net realized gain of $.015 per share.
D Total distributions of $.28 per share is comprised of distributions from net investment income of $.170 and distributions from net realized gain of $.105 per share.
E Total returns for periods of less than one year are not annualized.
F Total returns do not reflect charges attributable to your insurance company's separate account. Inclusion of these charges would reduce the total returns shown.
G Total returns would have been lower if certain expenses had not been reduced during the applicable periods shown.
H Amounts do not include the activity of the Underlying Funds.
I Expense ratios reflect operating expenses of the Fund. Expenses before reductions do not reflect amounts reimbursed by the investment adviser or reductions from expense offset arrangements and do not represent the amount paid by the Fund during periods when reimbursements or reductions occur. Expenses net of fee waivers reflect expenses after reimbursement by the investment adviser but prior to reductions from expense offset arrangements. Expenses net of all reductions represent the net expenses paid by the Fund but do not include expenses of the underlying funds in which the Fund invests.
J Amount represents less than .005%.
K Annualized
See accompanying notes which are an integral part of the financial statements.
VIP Investor Freedom 2005 Portfolio℠
Investment Summary (Unaudited)
The information in the following tables is based on the direct investments of the Fund.
Top Holdings as of June 30, 2016
| | % of fund's net assets | % of fund's net assets 6 months ago |
| VIP Investment Grade Bond Portfolio Investor Class | 36.2 | 37.4 |
| VIP Government Money Market Portfolio Investor Class 0.19% | 21.4 | 20.0 |
| VIP Overseas Portfolio Investor Class | 7.5 | 7.1 |
| VIP Emerging Markets Portfolio Investor Class | 5.7 | 4.6 |
| VIP Growth & Income Portfolio Investor Class | 5.3 | 5.7 |
| VIP Equity-Income Portfolio Investor Class | 4.7 | 5.0 |
| VIP Growth Portfolio Investor Class | 4.5 | 5.0 |
| VIP Contrafund Portfolio Investor Class | 4.5 | 4.8 |
| VIP High Income Portfolio Investor Class | 3.8 | 3.7 |
| VIP Value Portfolio Investor Class | 3.4 | 3.6 |
| | 97.0 | 96.9 |
Asset Allocation (% of fund's net assets)
| Period end |
| | Domestic Equity Funds | 25.4% |
| | International Equity Funds | 13.2% |
| | Bond Funds | 40.0% |
| | Short-Term Funds | 21.4% |

| Six months ago |
| | Domestic Equity Funds | 27.2% |
| | International Equity Funds | 11.7% |
| | Bond Funds | 41.1% |
| | Short-Term Funds | 20.0% |

VIP Investor Freedom 2005 Portfolio℠
Investments June 30, 2016 (Unaudited)
Showing Percentage of Net Assets
| Domestic Equity Funds - 25.4% | | | |
| | | Shares | Value |
| VIP Contrafund Portfolio Investor Class (a) | | 29,193 | $905,564 |
| VIP Equity-Income Portfolio Investor Class (a) | | 47,840 | 958,712 |
| VIP Growth & Income Portfolio Investor Class (a) | | 60,865 | 1,084,615 |
| VIP Growth Portfolio Investor Class (a) | | 16,204 | 921,195 |
| VIP Mid Cap Portfolio Investor Class (a) | | 8,689 | 266,052 |
| VIP Value Portfolio Investor Class (a) | | 51,221 | 694,560 |
| VIP Value Strategies Portfolio Investor Class (a) | | 23,461 | 340,189 |
| TOTAL DOMESTIC EQUITY FUNDS | | | |
| (Cost $4,720,240) | | | 5,170,887 |
|
| International Equity Funds - 13.2% | | | |
| VIP Emerging Markets Portfolio Investor Class(a) | | 133,705 | 1,151,197 |
| VIP Overseas Portfolio Investor Class (a) | | 85,950 | 1,525,611 |
| TOTAL INTERNATIONAL EQUITY FUNDS | | | |
| (Cost $2,680,188) | | | 2,676,808 |
|
| Bond Funds - 40.0% | | | |
| VIP High Income Portfolio Investor Class (a) | | 148,028 | 778,629 |
| VIP Investment Grade Bond Portfolio Investor Class (a) | | 565,764 | 7,377,566 |
| TOTAL BOND FUNDS | | | |
| (Cost $7,952,640) | | | 8,156,195 |
|
| Short-Term Funds - 21.4% | | | |
| VIP Government Money Market Portfolio Investor Class 0.19% (a)(b) | | | |
| (Cost $4,366,805) | | 4,366,805 | 4,366,805 |
| TOTAL INVESTMENT PORTFOLIO - 100.0% | | | |
| (Cost $19,719,873) | | | 20,370,695 |
| NET OTHER ASSETS (LIABILITIES) - 0.0% | | | 3 |
| NET ASSETS - 100% | | | $20,370,698 |
Legend
(a) Affiliated Fund
(b) The rate quoted is the annualized seven-day yield of the fund at period end.
Affiliated Underlying Funds
Information regarding the Fund's fiscal year to date purchases and sales of the affiliated Underlying Funds and income earned by the Fund from investments in affiliated Underlying Funds is as follows:
| Affiliate | Value, beginning of period | Purchases | Sales Proceeds | Dividend Income | Value, end of period |
| VIP Contrafund Portfolio Investor Class | $974,344 | $145,618 | $138,173 | $- | $905,564 |
| VIP Emerging Markets Portfolio Investor Class | 942,609 | 217,778 | 81,906 | - | 1,151,197 |
| VIP Equity-Income Portfolio Investor Class | 1,028,129 | 109,808 | 165,499 | - | 958,712 |
| VIP Government Money Market Portfolio Investor Class 0.19% | 4,075,046 | 839,517 | 547,757 | 2,928 | 4,366,805 |
| VIP Growth & Income Portfolio Investor Class | 1,159,012 | 161,768 | 175,958 | - | 1,084,615 |
| VIP Growth Portfolio Investor Class | 1,014,430 | 153,310 | 115,829 | - | 921,195 |
| VIP High Income Portfolio Investor Class | 760,864 | 41,919 | 72,286 | - | 778,629 |
| VIP Investment Grade Bond Portfolio Investor Class | 7,639,773 | 346,766 | 1,024,730 | 4,076 | 7,377,566 |
| VIP Mid Cap Portfolio Investor Class | 278,550 | 42,781 | 40,023 | - | 266,052 |
| VIP Overseas Portfolio Investor Class | 1,433,700 | 416,501 | 228,596 | - | 1,525,611 |
| VIP Value Portfolio Investor Class | 743,491 | 55,022 | 113,324 | - | 694,560 |
| VIP Value Strategies Portfolio Investor Class | 358,379 | 38,126 | 56,640 | - | 340,189 |
| Total | $20,408,327 | $2,568,914 | $2,760,721 | $7,004 | $20,370,695 |
Investment Valuation
All investments are categorized as Level 1 under the Fair Value Hierarchy. The inputs or methodology used for valuing securities may not be an indication of the risk associated with investing in those securities. For more information on valuation inputs please refer to the Investment Valuation section in the accompanying Notes to Financial Statements.
See accompanying notes which are an integral part of the financial statements.
VIP Investor Freedom 2005 Portfolio℠
Financial Statements
Statement of Assets and Liabilities
| | | June 30, 2016 (Unaudited) |
| Assets | | |
| Investment in securities, at value (cost $19,719,873) — See accompanying schedule | | $20,370,695 |
| Receivable for investments sold | | 121 |
| Total assets | | 20,370,816 |
| Liabilities | | |
| Payable for fund shares redeemed | $118 | |
| Total liabilities | | 118 |
| Net Assets | | $20,370,698 |
| Net Assets consist of: | | |
| Paid in capital | | $19,591,431 |
| Undistributed net investment income | | 7,004 |
| Accumulated undistributed net realized gain (loss) on investments | | 121,441 |
| Net unrealized appreciation (depreciation) on investments | | 650,822 |
| Net Assets, for 1,869,804 shares outstanding | | $20,370,698 |
| Net Asset Value, offering price and redemption price per share ($20,370,698 ÷ 1,869,804 shares) | | $10.89 |
See accompanying notes which are an integral part of the financial statements.
Statement of Operations
| | | Six months ended June 30, 2016 (Unaudited) |
| Investment Income | | |
| Income distributions from underlying funds | | $7,004 |
| Expenses | | |
| Independent trustees' fees and expenses | $45 | |
| Total expenses before reductions | 45 | |
| Expense reductions | (45) | – |
| Net investment income (loss) | | 7,004 |
| Realized and Unrealized Gain (Loss) | | |
| Realized gain (loss) on sale of underlying fund shares | (113,918) | |
| Capital gain distributions from underlying funds | 332,854 | |
| Total net realized gain (loss) | | 218,936 |
| Change in net unrealized appreciation (depreciation) on underlying funds | | 268,091 |
| Net gain (loss) | | 487,027 |
| Net increase (decrease) in net assets resulting from operations | | $494,031 |
See accompanying notes which are an integral part of the financial statements.
Statement of Changes in Net Assets
| | Six months ended June 30, 2016 (Unaudited) | Year ended December 31, 2015 |
| Increase (Decrease) in Net Assets | | |
| Operations | | |
| Net investment income (loss) | $7,004 | $372,236 |
| Net realized gain (loss) | 218,936 | 408,969 |
| Change in net unrealized appreciation (depreciation) | 268,091 | (849,358) |
| Net increase (decrease) in net assets resulting from operations | 494,031 | (68,153) |
| Distributions to shareholders from net investment income | – | (374,953) |
| Distributions to shareholders from net realized gain | (306,856) | (46,350) |
| Total distributions | (306,856) | (421,303) |
| Share transactions | | |
| Proceeds from sales of shares | 924,624 | 3,074,118 |
| Reinvestment of distributions | 306,856 | 421,303 |
| Cost of shares redeemed | (1,456,286) | (5,034,163) |
| Net increase (decrease) in net assets resulting from share transactions | (224,806) | (1,538,742) |
| Total increase (decrease) in net assets | (37,631) | (2,028,198) |
| Net Assets | | |
| Beginning of period | 20,408,329 | 22,436,527 |
| End of period | $20,370,698 | $20,408,329 |
| Other Information | | |
| Undistributed net investment income end of period | $7,004 | $– |
| Shares | | |
| Sold | 87,016 | 274,716 |
| Issued in reinvestment of distributions | 30,352 | 38,848 |
| Redeemed | (139,843) | (452,381) |
| Net increase (decrease) | (22,475) | (138,817) |
See accompanying notes which are an integral part of the financial statements.
Financial Highlights — VIP Investor Freedom 2005 Portfolio
| | Six months ended (Unaudited) June 30, | Years ended December 31, | | | | |
| | 2016 | 2015 | 2014 | 2013 | 2012 | 2011 |
| Selected Per–Share Data | | | | | | |
| Net asset value, beginning of period | $10.79 | $11.05 | $10.90 | $10.20 | $9.60 | $9.85 |
| Income from Investment Operations | | | | | | |
| Net investment income (loss)A | –B | .19 | .19 | .18 | .19 | .17 |
| Net realized and unrealized gain (loss) | .27 | (.22) | .27 | .81 | .73 | (.17) |
| Total from investment operations | .27 | (.03) | .46 | .99 | .92 | –B |
| Distributions from net investment income | – | (.20) | (.18) | (.17) | (.16) | (.19) |
| Distributions from net realized gain | (.17) | (.03) | (.14) | (.12) | (.16) | (.07) |
| Total distributions | (.17) | (.23) | (.31)C | (.29) | (.32) | (.25)D |
| Net asset value, end of period | $10.89 | $10.79 | $11.05 | $10.90 | $10.20 | $9.60 |
| Total ReturnE,F,G | 2.58% | (.31)% | 4.25% | 9.73% | 9.61% | .02% |
| Ratios to Average Net AssetsH,I | | | | | | |
| Expenses before reductionsJ | -%K | -% | -% | -% | -% | -% |
| Expenses net of fee waivers, if any | -%K | -% | -% | -% | -% | -% |
| Expenses net of all reductions | -%K | -% | -% | -% | -% | -% |
| Net investment income (loss) | .07%K | 1.70% | 1.71% | 1.68% | 1.87% | 1.72% |
| Supplemental Data | | | | | | |
| Net assets, end of period (000 omitted) | $20,371 | $20,408 | $22,437 | $18,912 | $14,096 | $9,777 |
| Portfolio turnover rateH | 26%K | 25% | 30% | 46% | 33% | 45% |
A Calculated based on average shares outstanding during the period.
B Amount represents less than $.005 per share.
C Total distributions of $.31 per share is comprised of distributions from net investment income of $.175 and distributions from net realized gain of $.135 per share.
D Total distributions of $.25 per share is comprised of distributions from net investment income of $.185 and distributions from net realized gain of $.067 per share.
E Total returns for periods of less than one year are not annualized.
F Total returns do not reflect charges attributable to your insurance company's separate account. Inclusion of these charges would reduce the total returns shown.
G Total returns would have been lower if certain expenses had not been reduced during the applicable periods shown.
H Amounts do not include the activity of the Underlying Funds.
I Expense ratios reflect operating expenses of the Fund. Expenses before reductions do not reflect amounts reimbursed by the investment adviser or reductions from expense offset arrangements and do not represent the amount paid by the Fund during periods when reimbursements or reductions occur. Expenses net of fee waivers reflect expenses after reimbursement by the investment adviser but prior to reductions from expense offset arrangements. Expenses net of all reductions represent the net expenses paid by the Fund but do not include expenses of the underlying funds in which the Fund invests.
J Amount represents less than .005%.
K Annualized
See accompanying notes which are an integral part of the financial statements.
VIP Investor Freedom 2010 Portfolio℠
Investment Summary (Unaudited)
The information in the following tables is based on the direct investments of the Fund.
Top Holdings as of June 30, 2016
| | % of fund's net assets | % of fund's net assets 6 months ago |
| VIP Investment Grade Bond Portfolio Investor Class | 32.8 | 33.7 |
| VIP Government Money Market Portfolio Investor Class 0.19% | 15.8 | 14.6 |
| VIP Overseas Portfolio Investor Class | 9.5 | 9.2 |
| VIP Growth & Income Portfolio Investor Class | 6.6 | 7.0 |
| VIP Emerging Markets Portfolio Investor Class | 6.5 | 5.4 |
| VIP Equity-Income Portfolio Investor Class | 5.9 | 6.2 |
| VIP Growth Portfolio Investor Class | 5.6 | 6.1 |
| VIP Contrafund Portfolio Investor Class | 5.5 | 5.8 |
| VIP Value Portfolio Investor Class | 4.3 | 4.5 |
| VIP High Income Portfolio Investor Class | 3.8 | 3.7 |
| | 96.3 | 96.2 |
Asset Allocation (% of fund's net assets)
| Period end |
| | Domestic Equity Funds | 31.6% |
| | International Equity Funds | 16.0% |
| | Bond Funds | 36.6% |
| | Short-Term Funds | 15.8% |

| Six months ago |
| | Domestic Equity Funds | 33.4% |
| | International Equity Funds | 14.6% |
| | Bond Funds | 37.4% |
| | Short-Term Funds | 14.6% |

VIP Investor Freedom 2010 Portfolio℠
Investments June 30, 2016 (Unaudited)
Showing Percentage of Net Assets
| Domestic Equity Funds - 31.6% | | | |
| | | Shares | Value |
| VIP Contrafund Portfolio Investor Class (a) | | 106,323 | $3,298,144 |
| VIP Equity-Income Portfolio Investor Class (a) | | 174,244 | 3,491,858 |
| VIP Growth & Income Portfolio Investor Class (a) | | 221,690 | 3,950,517 |
| VIP Growth Portfolio Investor Class (a) | | 59,020 | 3,355,288 |
| VIP Mid Cap Portfolio Investor Class (a) | | 31,586 | 967,164 |
| VIP Value Portfolio Investor Class (a) | | 186,491 | 2,528,814 |
| VIP Value Strategies Portfolio Investor Class (a) | | 85,098 | 1,233,917 |
| TOTAL DOMESTIC EQUITY FUNDS | | | |
| (Cost $17,205,113) | | | 18,825,702 |
|
| International Equity Funds - 16.0% | | | |
| VIP Emerging Markets Portfolio Investor Class(a) | | 449,624 | 3,871,260 |
| VIP Overseas Portfolio Investor Class (a) | | 317,780 | 5,640,600 |
| TOTAL INTERNATIONAL EQUITY FUNDS | | | |
| (Cost $9,963,144) | | | 9,511,860 |
|
| Bond Funds - 36.6% | | | |
| VIP High Income Portfolio Investor Class (a) | | 433,535 | 2,280,396 |
| VIP Investment Grade Bond Portfolio Investor Class (a) | | 1,495,384 | 19,499,805 |
| TOTAL BOND FUNDS | | | |
| (Cost $21,253,320) | | | 21,780,201 |
|
| Short-Term Funds - 15.8% | | | |
| VIP Government Money Market Portfolio Investor Class 0.19% (a)(b) | | | |
| (Cost $9,441,821) | | 9,441,821 | 9,441,821 |
| TOTAL INVESTMENT PORTFOLIO - 100.0% | | | |
| (Cost $57,863,398) | | | 59,559,584 |
| NET OTHER ASSETS (LIABILITIES) - 0.0% | | | 8 |
| NET ASSETS - 100% | | | $59,559,592 |
Legend
(a) Affiliated Fund
(b) The rate quoted is the annualized seven-day yield of the fund at period end.
Affiliated Underlying Funds
Information regarding the Fund's fiscal year to date purchases and sales of the affiliated Underlying Funds and income earned by the Fund from investments in affiliated Underlying Funds is as follows:
| Affiliate | Value, beginning of period | Purchases | Sales Proceeds | Dividend Income | Value, end of period |
| VIP Contrafund Portfolio Investor Class | $3,486,556 | $499,168 | $430,267 | $- | $3,298,144 |
| VIP Emerging Markets Portfolio Investor Class | 3,218,047 | 646,052 | 244,881 | - | 3,871,260 |
| VIP Equity-Income Portfolio Investor Class | 3,679,100 | 372,704 | 520,150 | - | 3,491,858 |
| VIP Government Money Market Portfolio Investor Class 0.19% | 8,651,848 | 2,023,863 | 1,233,891 | 6,327 | 9,441,821 |
| VIP Growth & Income Portfolio Investor Class | 4,148,377 | 552,077 | 552,765 | - | 3,950,517 |
| VIP Growth Portfolio Investor Class | 3,628,546 | 534,804 | 353,179 | - | 3,355,288 |
| VIP High Income Portfolio Investor Class | 2,221,215 | 114,064 | 200,949 | - | 2,280,396 |
| VIP Investment Grade Bond Portfolio Investor Class | 20,039,100 | 858,553 | 2,504,891 | 10,879 | 19,499,805 |
| VIP Mid Cap Portfolio Investor Class | 997,137 | 146,404 | 126,448 | - | 967,164 |
| VIP Overseas Portfolio Investor Class | 5,455,076 | 1,249,938 | 711,599 | - | 5,640,600 |
| VIP Value Portfolio Investor Class | 2,661,176 | 180,179 | 358,030 | - | 2,528,814 |
| VIP Value Strategies Portfolio Investor Class | 1,283,156 | 127,800 | 185,016 | - | 1,233,917 |
| Total | $59,469,334 | $7,305,606 | $7,422,066 | $17,206 | $59,559,584 |
Investment Valuation
All investments are categorized as Level 1 under the Fair Value Hierarchy. The inputs or methodology used for valuing securities may not be an indication of the risk associated with investing in those securities. For more information on valuation inputs please refer to the Investment Valuation section in the accompanying Notes to Financial Statements.
See accompanying notes which are an integral part of the financial statements.
VIP Investor Freedom 2010 Portfolio℠
Financial Statements
Statement of Assets and Liabilities
| | | June 30, 2016 (Unaudited) |
| Assets | | |
| Investment in securities, at value (cost $57,863,398) — See accompanying schedule | | $59,559,584 |
| Cash | | 7 |
| Receivable for investments sold | | 1,386 |
| Total assets | | 59,560,977 |
| Liabilities | | |
| Payable for fund shares redeemed | $1,385 | |
| Total liabilities | | 1,385 |
| Net Assets | | $59,559,592 |
| Net Assets consist of: | | |
| Paid in capital | | $57,353,193 |
| Undistributed net investment income | | 15,222 |
| Accumulated undistributed net realized gain (loss) on investments | | 494,991 |
| Net unrealized appreciation (depreciation) on investments | | 1,696,186 |
| Net Assets, for 5,161,904 shares outstanding | | $59,559,592 |
| Net Asset Value, offering price and redemption price per share ($59,559,592 ÷ 5,161,904 shares) | | $11.54 |
See accompanying notes which are an integral part of the financial statements.
Statement of Operations
| | | Six months ended June 30, 2016 (Unaudited) |
| Investment Income | | |
| Income distributions from underlying funds | | $17,206 |
| Expenses | | |
| Independent trustees' fees and expenses | $133 | |
| Total expenses before reductions | 133 | |
| Expense reductions | (133) | – |
| Net investment income (loss) | | 17,206 |
| Realized and Unrealized Gain (Loss) | | |
| Realized gain (loss) on sale of underlying fund shares | (361,281) | |
| Capital gain distributions from underlying funds | 1,190,428 | |
| Total net realized gain (loss) | | 829,147 |
| Change in net unrealized appreciation (depreciation) on underlying funds | | 567,989 |
| Net gain (loss) | | 1,397,136 |
| Net increase (decrease) in net assets resulting from operations | | $1,414,342 |
See accompanying notes which are an integral part of the financial statements.
Statement of Changes in Net Assets
| | Six months ended June 30, 2016 (Unaudited) | Year ended December 31, 2015 |
| Increase (Decrease) in Net Assets | | |
| Operations | | |
| Net investment income (loss) | $17,206 | $1,083,070 |
| Net realized gain (loss) | 829,147 | 1,218,781 |
| Change in net unrealized appreciation (depreciation) | 567,989 | (2,511,202) |
| Net increase (decrease) in net assets resulting from operations | 1,414,342 | (209,351) |
| Distributions to shareholders from net investment income | (5,200) | (1,080,478) |
| Distributions to shareholders from net realized gain | (1,091,976) | (142,181) |
| Total distributions | (1,097,176) | (1,222,659) |
| Share transactions | | |
| Proceeds from sales of shares | 2,600,603 | 5,286,344 |
| Reinvestment of distributions | 1,097,176 | 1,222,659 |
| Cost of shares redeemed | (3,924,694) | (7,947,083) |
| Net increase (decrease) in net assets resulting from share transactions | (226,915) | (1,438,080) |
| Total increase (decrease) in net assets | 90,251 | (2,870,090) |
| Net Assets | | |
| Beginning of period | 59,469,341 | 62,339,431 |
| End of period | $59,559,592 | $59,469,341 |
| Other Information | | |
| Undistributed net investment income end of period | $15,222 | $3,216 |
| Shares | | |
| Sold | 230,211 | 441,693 |
| Issued in reinvestment of distributions | 103,410 | 105,736 |
| Redeemed | (348,339) | (668,798) |
| Net increase (decrease) | (14,718) | (121,369) |
See accompanying notes which are an integral part of the financial statements.
Financial Highlights — VIP Investor Freedom 2010 Portfolio
| | Six months ended (Unaudited) June 30, | Years ended December 31, | | | | |
| | 2016 | 2015 | 2014 | 2013 | 2012 | 2011 |
| Selected Per–Share Data | | | | | | |
| Net asset value, beginning of period | $11.49 | $11.77 | $11.64 | $10.57 | $9.77 | $10.06 |
| Income from Investment Operations | | | | | | |
| Net investment income (loss)A | –B | .21 | .20 | .20 | .20 | .21 |
| Net realized and unrealized gain (loss) | .26 | (.25) | .33 | 1.21 | .95 | (.24) |
| Total from investment operations | .26 | (.04) | .53 | 1.41 | 1.15 | (.03) |
| Distributions from net investment income | –B | (.21) | (.19) | (.20) | (.20) | (.21) |
| Distributions from net realized gain | (.21) | (.03) | (.20) | (.14) | (.15) | (.04) |
| Total distributions | (.21) | (.24) | (.40)C | (.34) | (.35) | (.26)D |
| Net asset value, end of period | $11.54 | $11.49 | $11.77 | $11.64 | $10.57 | $9.77 |
| Total ReturnE,F,G | 2.43% | (.34)% | 4.56% | 13.41% | 11.82% | (.35)% |
| Ratios to Average Net AssetsH,I | | | | | | |
| Expenses before reductionsJ | -%K | -% | -% | -% | -% | -% |
| Expenses net of fee waivers, if any | -%K | -% | -% | -% | -% | -% |
| Expenses net of all reductions | -%K | -% | -% | -% | -% | -% |
| Net investment income (loss) | .06%K | 1.76% | 1.66% | 1.76% | 1.88% | 2.02% |
| Supplemental Data | | | | | | |
| Net assets, end of period (000 omitted) | $59,560 | $59,469 | $62,339 | $62,571 | $54,659 | $51,167 |
| Portfolio turnover rateH | 25%K | 21% | 27% | 23% | 21% | 24% |
A Calculated based on average shares outstanding during the period.
B Amount represents less than $.005 per share.
C Total distributions of $.40 per share is comprised of distributions from net investment income of $.192 and distributions from net realized gain of $.204 per share.
D Total distributions of $.26 per share is comprised of distributions from net investment income of $.214 and distributions from net realized gain of $.041 per share.
E Total returns for periods of less than one year are not annualized.
F Total returns do not reflect charges attributable to your insurance company's separate account. Inclusion of these charges would reduce the total returns shown.
G Total returns would have been lower if certain expenses had not been reduced during the applicable periods shown.
H Amounts do not include the activity of the Underlying Funds.
I Expense ratios reflect operating expenses of the Fund. Expenses before reductions do not reflect amounts reimbursed by the investment adviser or reductions from expense offset arrangements and do not represent the amount paid by the Fund during periods when reimbursements or reductions occur. Expenses net of fee waivers reflect expenses after reimbursement by the investment adviser but prior to reductions from expense offset arrangements. Expenses net of all reductions represent the net expenses paid by the Fund but do not include expenses of the underlying funds in which the Fund invests.
J Amount represents less than .005%.
K Annualized
See accompanying notes which are an integral part of the financial statements.
VIP Investor Freedom 2015 Portfolio℠
Investment Summary (Unaudited)
The information in the following tables is based on the direct investments of the Fund.
Top Holdings as of June 30, 2016
| | % of fund's net assets | % of fund's net assets 6 months ago |
| VIP Investment Grade Bond Portfolio Investor Class | 29.2 | 30.3 |
| VIP Overseas Portfolio Investor Class | 11.5 | 11.2 |
| VIP Government Money Market Portfolio Investor Class 0.19% | 10.6 | 9.4 |
| VIP Growth & Income Portfolio Investor Class | 7.9 | 8.2 |
| VIP Emerging Markets Portfolio Investor Class | 7.1 | 6.0 |
| VIP Equity-Income Portfolio Investor Class | 7.0 | 7.3 |
| VIP Growth Portfolio Investor Class | 6.8 | 7.2 |
| VIP Contrafund Portfolio Investor Class | 6.6 | 6.9 |
| VIP Value Portfolio Investor Class | 5.1 | 5.3 |
| VIP High Income Portfolio Investor Class | 3.8 | 3.7 |
| | 95.6 | 95.5 |
Asset Allocation (% of fund's net assets)
| Period end |
| | Domestic Equity Funds | 37.8% |
| | International Equity Funds | 18.6% |
| | Bond Funds | 33.0% |
| | Short-Term Funds | 10.6% |

| Six months ago |
| | Domestic Equity Funds | 39.4% |
| | International Equity Funds | 17.2% |
| | Bond Funds | 34.0% |
| | Short-Term Funds | 9.4% |
VIP Investor Freedom 2015 Portfolio℠
Investments June 30, 2016 (Unaudited)
Showing Percentage of Net Assets
| Domestic Equity Funds - 37.8% | | | |
| | | Shares | Value |
| VIP Contrafund Portfolio Investor Class (a) | | 203,945 | $6,326,367 |
| VIP Equity-Income Portfolio Investor Class (a) | | 334,243 | 6,698,238 |
| VIP Growth & Income Portfolio Investor Class (a) | | 425,389 | 7,580,433 |
| VIP Growth Portfolio Investor Class (a) | | 113,213 | 6,436,162 |
| VIP Mid Cap Portfolio Investor Class (a) | | 60,316 | 1,846,874 |
| VIP Value Portfolio Investor Class (a) | | 357,556 | 4,848,453 |
| VIP Value Strategies Portfolio Investor Class (a) | | 162,831 | 2,361,056 |
| TOTAL DOMESTIC EQUITY FUNDS | | | |
| (Cost $32,260,893) | | | 36,097,583 |
|
| International Equity Funds - 18.6% | | | |
| VIP Emerging Markets Portfolio Investor Class(a) | | 789,963 | 6,801,578 |
| VIP Overseas Portfolio Investor Class (a) | | 617,113 | 10,953,764 |
| TOTAL INTERNATIONAL EQUITY FUNDS | | | |
| (Cost $17,979,436) | | | 17,755,342 |
|
| Bond Funds - 33.0% | | | |
| VIP High Income Portfolio Investor Class (a) | | 696,827 | 3,665,307 |
| VIP Investment Grade Bond Portfolio Investor Class (a) | | 2,139,546 | 27,899,676 |
| TOTAL BOND FUNDS | | | |
| (Cost $30,868,816) | | | 31,564,983 |
|
| Short-Term Funds - 10.6% | | | |
| VIP Government Money Market Portfolio Investor Class 0.19% (a)(b) | | | |
| (Cost $10,169,723) | | 10,169,723 | 10,169,723 |
| TOTAL INVESTMENT PORTFOLIO - 100.0% | | | |
| (Cost $91,278,868) | | | 95,587,631 |
| NET OTHER ASSETS (LIABILITIES) - 0.0% | | | (6) |
| NET ASSETS - 100% | | | $95,587,625 |
Legend
(a) Affiliated Fund
(b) The rate quoted is the annualized seven-day yield of the fund at period end.
Affiliated Underlying Funds
Information regarding the Fund's fiscal year to date purchases and sales of the affiliated Underlying Funds and income earned by the Fund from investments in affiliated Underlying Funds is as follows:
| Affiliate | Value, beginning of period | Purchases | Sales Proceeds | Dividend Income | Value, end of period |
| VIP Contrafund Portfolio Investor Class | $6,613,348 | $947,396 | $755,191 | $- | $6,326,367 |
| VIP Emerging Markets Portfolio Investor Class | 5,703,549 | 1,086,145 | 420,843 | - | 6,801,578 |
| VIP Equity-Income Portfolio Investor Class | 6,978,262 | 722,866 | 932,369 | - | 6,698,238 |
| VIP Government Money Market Portfolio Investor Class 0.19% | 9,032,226 | 2,703,743 | 1,566,246 | 6,612 | 10,169,723 |
| VIP Growth & Income Portfolio Investor Class | 7,867,933 | 1,051,373 | 971,142 | - | 7,580,433 |
| VIP Growth Portfolio Investor Class | 6,883,498 | 1,027,849 | 627,237 | - | 6,436,162 |
| VIP High Income Portfolio Investor Class | 3,581,208 | 218,900 | 367,336 | - | 3,665,307 |
| VIP Investment Grade Bond Portfolio Investor Class | 28,979,120 | 1,384,391 | 4,039,198 | 15,217 | 27,899,676 |
| VIP Mid Cap Portfolio Investor Class | 1,891,221 | 278,677 | 229,584 | - | 1,846,874 |
| VIP Overseas Portfolio Investor Class | 10,750,051 | 2,134,515 | 1,235,204 | - | 10,953,764 |
| VIP Value Portfolio Investor Class | 5,047,197 | 350,604 | 631,572 | - | 4,848,453 |
| VIP Value Strategies Portfolio Investor Class | 2,433,435 | 246,826 | 333,040 | - | 2,361,056 |
| Total | $95,761,048 | $12,153,285 | $12,108,962 | $21,829 | $95,587,631 |
Investment Valuation
All investments are categorized as Level 1 under the Fair Value Hierarchy. The inputs or methodology used for valuing securities may not be an indication of the risk associated with investing in those securities. For more information on valuation inputs please refer to the Investment Valuation section in the accompanying Notes to Financial Statements.
See accompanying notes which are an integral part of the financial statements.
VIP Investor Freedom 2015 Portfolio℠
Financial Statements
Statement of Assets and Liabilities
| | | June 30, 2016 (Unaudited) |
| Assets | | |
| Investment in securities, at value (cost $91,278,868) — See accompanying schedule | | $95,587,631 |
| Receivable for investments sold | | 1,614 |
| Total assets | | 95,589,245 |
| Liabilities | | |
| Payable for fund shares redeemed | $1,620 | |
| Total liabilities | | 1,620 |
| Net Assets | | $95,587,625 |
| Net Assets consist of: | | |
| Paid in capital | | $90,044,716 |
| Undistributed net investment income | | 20,145 |
| Accumulated undistributed net realized gain (loss) on investments | | 1,214,001 |
| Net unrealized appreciation (depreciation) on investments | | 4,308,763 |
| Net Assets, for 8,482,770 shares outstanding | | $95,587,625 |
| Net Asset Value, offering price and redemption price per share ($95,587,625 ÷ 8,482,770 shares) | | $11.27 |
See accompanying notes which are an integral part of the financial statements.
Statement of Operations
| | | Six months ended June 30, 2016 (Unaudited) |
| Investment Income | | |
| Income distributions from underlying funds | | $21,829 |
| Expenses | | |
| Independent trustees' fees and expenses | $212 | |
| Total expenses before reductions | 212 | |
| Expense reductions | (212) | – |
| Net investment income (loss) | | 21,829 |
| Realized and Unrealized Gain (Loss) | | |
| Realized gain (loss) on sale of underlying fund shares | (404,566) | |
| Capital gain distributions from underlying funds | 2,200,941 | |
| Total net realized gain (loss) | | 1,796,375 |
| Change in net unrealized appreciation (depreciation) on underlying funds | | 186,823 |
| Net gain (loss) | | 1,983,198 |
| Net increase (decrease) in net assets resulting from operations | | $2,005,027 |
See accompanying notes which are an integral part of the financial statements.
Statement of Changes in Net Assets
| | Six months ended June 30, 2016 (Unaudited) | Year ended December 31, 2015 |
| Increase (Decrease) in Net Assets | | |
| Operations | | |
| Net investment income (loss) | $21,829 | $1,784,279 |
| Net realized gain (loss) | 1,796,375 | 2,670,590 |
| Change in net unrealized appreciation (depreciation) | 186,823 | (4,770,564) |
| Net increase (decrease) in net assets resulting from operations | 2,005,027 | (315,695) |
| Distributions to shareholders from net investment income | (8,294) | (1,779,697) |
| Distributions to shareholders from net realized gain | (2,413,429) | (306,141) |
| Total distributions | (2,421,723) | (2,085,838) |
| Share transactions | | |
| Proceeds from sales of shares | 4,520,286 | 9,844,723 |
| Reinvestment of distributions | 2,421,723 | 2,085,838 |
| Cost of shares redeemed | (6,698,733) | (15,507,818) |
| Net increase (decrease) in net assets resulting from share transactions | 243,276 | (3,577,257) |
| Total increase (decrease) in net assets | (173,420) | (5,978,790) |
| Net Assets | | |
| Beginning of period | 95,761,045 | 101,739,835 |
| End of period | $95,587,625 | $95,761,045 |
| Other Information | | |
| Undistributed net investment income end of period | $20,145 | $6,610 |
| Shares | | |
| Sold | 411,090 | 831,807 |
| Issued in reinvestment of distributions | 235,576 | 182,435 |
| Redeemed | (608,155) | (1,320,033) |
| Net increase (decrease) | 38,511 | (305,791) |
See accompanying notes which are an integral part of the financial statements.
Financial Highlights — VIP Investor Freedom 2015 Portfolio
| | Six months ended (Unaudited) June 30, | Years ended December 31, | | | | |
| | 2016 | 2015 | 2014 | 2013 | 2012 | 2011 |
| Selected Per–Share Data | | | | | | |
| Net asset value, beginning of period | $11.34 | $11.63 | $11.48 | $10.34 | $9.55 | $9.87 |
| Income from Investment Operations | | | | | | |
| Net investment income (loss)A | –B | .21 | .19 | .20 | .21 | .21 |
| Net realized and unrealized gain (loss) | .22 | (.25) | .34 | 1.27 | .94 | (.24) |
| Total from investment operations | .22 | (.04) | .53 | 1.47 | 1.15 | (.03) |
| Distributions from net investment income | –B | (.22) | (.19) | (.20) | (.20) | (.21) |
| Distributions from net realized gain | (.29) | (.04) | (.19) | (.13) | (.16) | (.08) |
| Total distributions | (.29) | (.25)C | (.38) | (.33) | (.36) | (.29) |
| Net asset value, end of period | $11.27 | $11.34 | $11.63 | $11.48 | $10.34 | $9.55 |
| Total ReturnD,E,F | 2.21% | (.34)% | 4.65% | 14.35% | 12.10% | (.33)% |
| Ratios to Average Net AssetsG,H | | | | | | |
| Expenses before reductionsI | -%J | -% | -% | -% | -% | -% |
| Expenses net of fee waivers, if any | -%J | -% | -% | -% | -% | -% |
| Expenses net of all reductions | -%J | -% | -% | -% | -% | -% |
| Net investment income (loss) | .05%J | 1.77% | 1.67% | 1.86% | 2.02% | 2.07% |
| Supplemental Data | | | | | | |
| Net assets, end of period (000 omitted) | $95,588 | $95,761 | $101,740 | $97,221 | $79,002 | $67,804 |
| Portfolio turnover rateG | 26%J | 21% | 20% | 21% | 18% | 30% |
A Calculated based on average shares outstanding during the period.
B Amount represents less than $.005 per share.
C Total distributions of $.25 per share is comprised of distributions from net investment income of $.215 and distributions from net realized gain of $.037 per share.
D Total returns for periods of less than one year are not annualized.
E Total returns do not reflect charges attributable to your insurance company's separate account. Inclusion of these charges would reduce the total returns shown.
F Total returns would have been lower if certain expenses had not been reduced during the applicable periods shown.
G Amounts do not include the activity of the Underlying Funds.
H Expense ratios reflect operating expenses of the Fund. Expenses before reductions do not reflect amounts reimbursed by the investment adviser or reductions from expense offset arrangements and do not represent the amount paid by the Fund during periods when reimbursements or reductions occur. Expenses net of fee waivers reflect expenses after reimbursement by the investment adviser but prior to reductions from expense offset arrangements. Expenses net of all reductions represent the net expenses paid by the Fund but do not include expenses of the underlying funds in which the Fund invests.
I Amount represents less than .005%.
J Annualized
See accompanying notes which are an integral part of the financial statements.
VIP Investor Freedom 2020 Portfolio℠
Investment Summary (Unaudited)
The information in the following tables is based on the direct investments of the Fund.
Top Holdings as of June 30, 2016
| | % of fund's net assets | % of fund's net assets 6 months ago |
| VIP Investment Grade Bond Portfolio Investor Class | 26.8 | 27.1 |
| VIP Overseas Portfolio Investor Class | 13.0 | 12.6 |
| VIP Growth & Income Portfolio Investor Class | 8.8 | 9.1 |
| VIP Equity-Income Portfolio Investor Class | 7.8 | 8.1 |
| VIP Emerging Markets Portfolio Investor Class | 7.5 | 6.4 |
| VIP Growth Portfolio Investor Class | 7.5 | 8.0 |
| VIP Contrafund Portfolio Investor Class | 7.3 | 7.7 |
| VIP Government Money Market Portfolio Investor Class 0.19% | 7.0 | 6.5 |
| VIP Value Portfolio Investor Class | 5.6 | 5.8 |
| VIP High Income Portfolio Investor Class | 3.8 | 3.7 |
| | 95.1 | 95.0 |
Asset Allocation (% of fund's net assets)
| Period end |
| | Domestic Equity Funds | 41.9% |
| | International Equity Funds | 20.5% |
| | Bond Funds | 30.6% |
| | Short-Term Funds | 7.0% |

| Six months ago |
| | Domestic Equity Funds | 43.7% |
| | International Equity Funds | 19.0% |
| | Bond Funds | 30.8% |
| | Short-Term Funds | 6.5% |

VIP Investor Freedom 2020 Portfolio℠
Investments June 30, 2016 (Unaudited)
Showing Percentage of Net Assets
| Domestic Equity Funds - 41.9% | | | |
| | | Shares | Value |
| VIP Contrafund Portfolio Investor Class (a) | | 430,790 | $13,363,093 |
| VIP Equity-Income Portfolio Investor Class (a) | | 706,095 | 14,150,149 |
| VIP Growth & Income Portfolio Investor Class (a) | | 898,697 | 16,014,777 |
| VIP Growth Portfolio Investor Class (a) | | 239,129 | 13,594,512 |
| VIP Mid Cap Portfolio Investor Class (a) | | 127,184 | 3,894,367 |
| VIP Value Portfolio Investor Class (a) | | 755,121 | 10,239,439 |
| VIP Value Strategies Portfolio Investor Class (a) | | 345,302 | 5,006,883 |
| TOTAL DOMESTIC EQUITY FUNDS | | | |
| (Cost $69,426,289) | | | 76,263,220 |
|
| International Equity Funds - 20.5% | | | |
| VIP Emerging Markets Portfolio Investor Class(a) | | 1,599,000 | 13,767,392 |
| VIP Overseas Portfolio Investor Class (a) | | 1,331,569 | 23,635,358 |
| TOTAL INTERNATIONAL EQUITY FUNDS | | | |
| (Cost $38,147,660) | | | 37,402,750 |
|
| Bond Funds - 30.6% | | | |
| VIP High Income Portfolio Investor Class (a) | | 1,329,918 | 6,995,368 |
| VIP Investment Grade Bond Portfolio Investor Class (a) | | 3,746,208 | 48,850,555 |
| TOTAL BOND FUNDS | | | |
| (Cost $54,942,577) | | | 55,845,923 |
|
| Short-Term Funds - 7.0% | | | |
| VIP Government Money Market Portfolio Investor Class 0.19% (a)(b) | | | |
| (Cost $12,690,441) | | 12,690,441 | 12,690,441 |
| TOTAL INVESTMENT PORTFOLIO - 100.0% | | | |
| (Cost $175,206,967) | | | 182,202,334 |
| NET OTHER ASSETS (LIABILITIES) - 0.0% | | | (4) |
| NET ASSETS - 100% | | | $182,202,330 |
Legend
(a) Affiliated Fund
(b) The rate quoted is the annualized seven-day yield of the fund at period end.
Affiliated Underlying Funds
Information regarding the Fund's fiscal year to date purchases and sales of the affiliated Underlying Funds and income earned by the Fund from investments in affiliated Underlying Funds is as follows:
| Affiliate | Value, beginning of period | Purchases | Sales Proceeds | Dividend Income | Value, end of period |
| VIP Contrafund Portfolio Investor Class | $14,348,330 | $1,847,171 | $1,778,457 | $- | $13,363,093 |
| VIP Emerging Markets Portfolio Investor Class | 11,930,150 | 2,009,691 | 1,047,315 | - | 13,767,392 |
| VIP Equity-Income Portfolio Investor Class | 15,140,056 | 1,405,762 | 2,230,355 | - | 14,150,149 |
| VIP Government Money Market Portfolio Investor Class 0.19% | 12,111,836 | 3,164,603 | 2,585,998 | 8,598 | 12,690,441 |
| VIP Growth & Income Portfolio Investor Class | 17,071,374 | 2,029,742 | 2,276,277 | - | 16,014,777 |
| VIP Growth Portfolio Investor Class | 14,933,171 | 2,061,877 | 1,545,685 | - | 13,594,512 |
| VIP High Income Portfolio Investor Class | 7,016,283 | 376,901 | 846,455 | - | 6,995,368 |
| VIP Investment Grade Bond Portfolio Investor Class | 50,874,469 | 2,533,101 | 7,315,785 | 26,790 | 48,850,555 |
| VIP Mid Cap Portfolio Investor Class | 4,103,630 | 543,484 | 547,426 | - | 3,894,367 |
| VIP Overseas Portfolio Investor Class | 23,676,893 | 4,282,239 | 2,782,927 | - | 23,635,358 |
| VIP Value Portfolio Investor Class | 10,951,556 | 596,826 | 1,485,697 | - | 10,239,439 |
| VIP Value Strategies Portfolio Investor Class | 5,280,581 | 455,307 | 756,932 | - | 5,006,883 |
| Total | $187,438,329 | $21,306,704 | $25,199,309 | $35,388 | $182,202,334 |
Investment Valuation
All investments are categorized as Level 1 under the Fair Value Hierarchy. The inputs or methodology used for valuing securities may not be an indication of the risk associated with investing in those securities. For more information on valuation inputs please refer to the Investment Valuation section in the accompanying Notes to Financial Statements.
See accompanying notes which are an integral part of the financial statements.
VIP Investor Freedom 2020 Portfolio℠
Financial Statements
Statement of Assets and Liabilities
| | | June 30, 2016 (Unaudited) |
| Assets | | |
| Investment in securities, at value (cost $175,206,967) — See accompanying schedule | | $182,202,334 |
| Receivable for investments sold | | 1,130 |
| Total assets | | 182,203,464 |
| Liabilities | | |
| Payable for fund shares redeemed | $1,134 | |
| Total liabilities | | 1,134 |
| Net Assets | | $182,202,330 |
| Net Assets consist of: | | |
| Paid in capital | | $172,808,224 |
| Undistributed net investment income | | 21,314 |
| Accumulated undistributed net realized gain (loss) on investments | | 2,377,425 |
| Net unrealized appreciation (depreciation) on investments | | 6,995,367 |
| Net Assets, for 16,199,818 shares outstanding | | $182,202,330 |
| Net Asset Value, offering price and redemption price per share ($182,202,330 ÷ 16,199,818 shares) | | $11.25 |
See accompanying notes which are an integral part of the financial statements.
Statement of Operations
| | | Six months ended June 30, 2016 (Unaudited) |
| Investment Income | | |
| Income distributions from underlying funds | | $35,388 |
| Expenses | | |
| Independent trustees' fees and expenses | $413 | |
| Total expenses before reductions | 413 | |
| Expense reductions | (413) | – |
| Net investment income (loss) | | 35,388 |
| Realized and Unrealized Gain (Loss) | | |
| Realized gain (loss) on sale of underlying fund shares | (1,492,097) | |
| Capital gain distributions from underlying funds | 4,800,104 | |
| Total net realized gain (loss) | | 3,308,007 |
| Change in net unrealized appreciation (depreciation) on underlying funds | | 148,705 |
| Net gain (loss) | | 3,456,712 |
| Net increase (decrease) in net assets resulting from operations | | $3,492,100 |
See accompanying notes which are an integral part of the financial statements.
Statement of Changes in Net Assets
| | Six months ended June 30, 2016 (Unaudited) | Year ended December 31, 2015 |
| Increase (Decrease) in Net Assets | | |
| Operations | | |
| Net investment income (loss) | $35,388 | $3,471,033 |
| Net realized gain (loss) | 3,308,007 | 5,368,400 |
| Change in net unrealized appreciation (depreciation) | 148,705 | (9,614,929) |
| Net increase (decrease) in net assets resulting from operations | 3,492,100 | (775,496) |
| Distributions to shareholders from net investment income | (16,380) | (3,468,810) |
| Distributions to shareholders from net realized gain | (4,750,108) | (599,888) |
| Total distributions | (4,766,488) | (4,068,698) |
| Share transactions | | |
| Proceeds from sales of shares | 6,689,038 | 16,584,508 |
| Reinvestment of distributions | 4,766,488 | 4,068,698 |
| Cost of shares redeemed | (15,417,133) | (20,135,166) |
| Net increase (decrease) in net assets resulting from share transactions | (3,961,607) | 518,040 |
| Total increase (decrease) in net assets | (5,235,995) | (4,326,154) |
| Net Assets | | |
| Beginning of period | 187,438,325 | 191,764,479 |
| End of period | $182,202,330 | $187,438,325 |
| Other Information | | |
| Undistributed net investment income end of period | $21,314 | $2,306 |
| Shares | | |
| Sold | 608,527 | 1,395,722 |
| Issued in reinvestment of distributions | 467,303 | 355,554 |
| Redeemed | (1,400,318) | (1,713,983) |
| Net increase (decrease) | (324,488) | 37,293 |
See accompanying notes which are an integral part of the financial statements.
Financial Highlights — VIP Investor Freedom 2020 Portfolio
| | Six months ended (Unaudited) June 30, | Years ended December 31, | | | | |
| | 2016 | 2015 | 2014 | 2013 | 2012 | 2011 |
| Selected Per–Share Data | | | | | | |
| Net asset value, beginning of period | $11.34 | $11.63 | $11.47 | $10.20 | $9.31 | $9.68 |
| Income from Investment Operations | | | | | | |
| Net investment income (loss)A | –B | .21 | .20 | .20 | .21 | .21 |
| Net realized and unrealized gain (loss) | .20 | (.25) | .34 | 1.42 | 1.02 | (.32) |
| Total from investment operations | .20 | (.04) | .54 | 1.62 | 1.23 | (.11) |
| Distributions from net investment income | –B | (.21) | (.19) | (.20) | (.21) | (.21) |
| Distributions from net realized gain | (.29) | (.04) | (.19) | (.15) | (.14) | (.05) |
| Total distributions | (.29) | (.25) | (.38) | (.35) | (.34)C | (.26) |
| Net asset value, end of period | $11.25 | $11.34 | $11.63 | $11.47 | $10.20 | $9.31 |
| Total ReturnD,E,F | 2.04% | (.35)% | 4.75% | 15.96% | 13.30% | (1.11)% |
| Ratios to Average Net AssetsG,H | | | | | | |
| Expenses before reductionsI | -%J | -% | -% | -% | -% | -% |
| Expenses net of fee waivers, if any | -%J | -% | -% | -% | -% | -% |
| Expenses net of all reductions | -%J | -% | -% | -% | -% | -% |
| Net investment income (loss) | .04%J | 1.79% | 1.74% | 1.87% | 2.13% | 2.20% |
| Supplemental Data | | | | | | |
| Net assets, end of period (000 omitted) | $182,202 | $187,438 | $191,764 | $161,093 | $123,726 | $102,875 |
| Portfolio turnover rateG | 23%J | 17% | 13% | 22% | 18% | 16% |
A Calculated based on average shares outstanding during the period.
B Amount represents less than $.005 per share.
C Total distributions of $.34 per share is comprised of distributions from net investment income of $.205 and distributions from net realized gain of $.137 per share.
D Total returns for periods of less than one year are not annualized.
E Total returns do not reflect charges attributable to your insurance company's separate account. Inclusion of these charges would reduce the total returns shown.
F Total returns would have been lower if certain expenses had not been reduced during the applicable periods shown.
G Amounts do not include the activity of the Underlying Funds.
H Expense ratios reflect operating expenses of the Fund. Expenses before reductions do not reflect amounts reimbursed by the investment adviser or reductions from expense offset arrangements and do not represent the amount paid by the Fund during periods when reimbursements or reductions occur. Expenses net of fee waivers reflect expenses after reimbursement by the investment adviser but prior to reductions from expense offset arrangements. Expenses net of all reductions represent the net expenses paid by the Fund but do not include expenses of the underlying funds in which the Fund invests.
I Amount represents less than .005%.
J Annualized
See accompanying notes which are an integral part of the financial statements.
VIP Investor Freedom 2025 Portfolio℠
Investment Summary (Unaudited)
The information in the following tables is based on the direct investments of the Fund.
Top Holdings as of June 30, 2016
| | % of fund's net assets | % of fund's net assets 6 months ago |
| VIP Investment Grade Bond Portfolio Investor Class | 22.0 | 23.0 |
| VIP Overseas Portfolio Investor Class | 14.4 | 14.4 |
| VIP Growth & Income Portfolio Investor Class | 9.8 | 10.2 |
| VIP Equity-Income Portfolio Investor Class | 8.6 | 9.0 |
| VIP Growth Portfolio Investor Class | 8.3 | 8.9 |
| VIP Contrafund Portfolio Investor Class | 8.2 | 8.6 |
| VIP Emerging Markets Portfolio Investor Class | 8.0 | 6.8 |
| VIP Value Portfolio Investor Class | 6.3 | 6.5 |
| VIP Government Money Market Portfolio Investor Class 0.19% | 5.2 | 3.3 |
| VIP High Income Portfolio Investor Class | 3.8 | 3.7 |
| | 94.6 | 94.4 |
Asset Allocation (% of fund's net assets)
| Period end |
| | Domestic Equity Funds | 46.6% |
| | International Equity Funds | 22.4% |
| | Bond Funds | 25.8% |
| | Short-Term Funds | 5.2% |

| Six months ago |
| | Domestic Equity Funds | 48.8% |
| | International Equity Funds | 21.2% |
| | Bond Funds | 26.7% |
| | Short-Term Funds | 3.3% |

VIP Investor Freedom 2025 Portfolio℠
Investments June 30, 2016 (Unaudited)
Showing Percentage of Net Assets
| Domestic Equity Funds - 46.6% | | | |
| | | Shares | Value |
| VIP Contrafund Portfolio Investor Class (a) | | 408,636 | $12,675,892 |
| VIP Equity-Income Portfolio Investor Class (a) | | 669,630 | 13,419,394 |
| VIP Growth & Income Portfolio Investor Class (a) | | 852,028 | 15,183,135 |
| VIP Growth Portfolio Investor Class (a) | | 226,832 | 12,895,391 |
| VIP Mid Cap Portfolio Investor Class (a) | | 121,463 | 3,719,194 |
| VIP Value Portfolio Investor Class (a) | | 716,867 | 9,720,711 |
| VIP Value Strategies Portfolio Investor Class (a) | | 326,728 | 4,737,555 |
| TOTAL DOMESTIC EQUITY FUNDS | | | |
| (Cost $64,608,394) | | | 72,351,272 |
|
| International Equity Funds - 22.4% | | | |
| VIP Emerging Markets Portfolio Investor Class(a) | | 1,448,994 | 12,475,840 |
| VIP Overseas Portfolio Investor Class (a) | | 1,262,025 | 22,400,941 |
| TOTAL INTERNATIONAL EQUITY FUNDS | | | |
| (Cost $34,808,419) | | | 34,876,781 |
|
| Bond Funds - 25.8% | | | |
| VIP High Income Portfolio Investor Class (a) | | 1,135,401 | 5,972,211 |
| VIP Investment Grade Bond Portfolio Investor Class (a) | | 2,616,707 | 34,121,861 |
| TOTAL BOND FUNDS | | | |
| (Cost $39,721,027) | | | 40,094,072 |
|
| Short-Term Funds - 5.2% | | | |
| VIP Government Money Market Portfolio Investor Class 0.19% (a)(b) | | | |
| (Cost $8,021,536) | | 8,021,536 | 8,021,536 |
| TOTAL INVESTMENT PORTFOLIO - 100.0% | | | |
| (Cost $147,159,376) | | | 155,343,661 |
| NET OTHER ASSETS (LIABILITIES) - 0.0% | | | 1 |
| NET ASSETS - 100% | | | $155,343,662 |
Legend
(a) Affiliated Fund
(b) The rate quoted is the annualized seven-day yield of the fund at period end.
Affiliated Underlying Funds
Information regarding the Fund's fiscal year to date purchases and sales of the affiliated Underlying Funds and income earned by the Fund from investments in affiliated Underlying Funds is as follows:
| Affiliate | Value, beginning of period | Purchases | Sales Proceeds | Dividend Income | Value, end of period |
| VIP Contrafund Portfolio Investor Class | $13,352,251 | $1,698,373 | $1,426,342 | $- | $12,675,892 |
| VIP Emerging Markets Portfolio Investor Class | 10,688,200 | 1,744,990 | 721,938 | - | 12,475,840 |
| VIP Equity-Income Portfolio Investor Class | 14,093,525 | 1,414,818 | 1,942,863 | - | 13,419,394 |
| VIP Government Money Market Portfolio Investor Class 0.19% | 5,152,241 | 4,031,864 | 1,162,568 | 4,392 | 8,021,536 |
| VIP Growth & Income Portfolio Investor Class | 15,890,106 | 1,871,012 | 1,846,434 | - | 15,183,135 |
| VIP Growth Portfolio Investor Class | 13,904,121 | 1,917,849 | 1,252,035 | - | 12,895,391 |
| VIP High Income Portfolio Investor Class | 5,853,178 | 398,211 | 653,158 | - | 5,972,211 |
| VIP Investment Grade Bond Portfolio Investor Class | 35,851,441 | 3,341,436 | 7,000,422 | 18,466 | 34,121,861 |
| VIP Mid Cap Portfolio Investor Class | 3,819,714 | 500,919 | 415,463 | - | 3,719,194 |
| VIP Overseas Portfolio Investor Class | 22,505,080 | 3,564,751 | 2,206,687 | - | 22,400,941 |
| VIP Value Portfolio Investor Class | 10,193,783 | 565,159 | 1,193,878 | - | 9,720,711 |
| VIP Value Strategies Portfolio Investor Class | 4,914,472 | 426,218 | 627,902 | - | 4,737,555 |
| Total | $156,218,112 | $21,475,600 | $20,449,690 | $22,858 | $155,343,661 |
Investment Valuation
All investments are categorized as Level 1 under the Fair Value Hierarchy. The inputs or methodology used for valuing securities may not be an indication of the risk associated with investing in those securities. For more information on valuation inputs please refer to the Investment Valuation section in the accompanying Notes to Financial Statements.
See accompanying notes which are an integral part of the financial statements.
VIP Investor Freedom 2025 Portfolio℠
Financial Statements
Statement of Assets and Liabilities
| | | June 30, 2016 (Unaudited) |
| Assets | | |
| Investment in securities, at value (cost $147,159,376) — See accompanying schedule | | $155,343,661 |
| Receivable for fund shares sold | | 75,373 |
| Total assets | | 155,419,034 |
| Liabilities | | |
| Payable for investments purchased | $75,310 | |
| Payable for fund shares redeemed | 62 | |
| Total liabilities | | 75,372 |
| Net Assets | | $155,343,662 |
| Net Assets consist of: | | |
| Paid in capital | | $144,841,300 |
| Undistributed net investment income | | 22,858 |
| Accumulated undistributed net realized gain (loss) on investments | | 2,295,219 |
| Net unrealized appreciation (depreciation) on investments | | 8,184,285 |
| Net Assets, for 13,141,400 shares outstanding | | $155,343,662 |
| Net Asset Value, offering price and redemption price per share ($155,343,662 ÷ 13,141,400 shares) | | $11.82 |
See accompanying notes which are an integral part of the financial statements.
Statement of Operations
| | | Six months ended June 30, 2016 (Unaudited) |
| Investment Income | | |
| Income distributions from underlying funds | | $22,858 |
| Expenses | | |
| Independent trustees' fees and expenses | $341 | |
| Total expenses before reductions | 341 | |
| Expense reductions | (341) | – |
| Net investment income (loss) | | 22,858 |
| Realized and Unrealized Gain (Loss) | | |
| Realized gain (loss) on sale of underlying fund shares | (858,220) | |
| Capital gain distributions from underlying funds | 4,322,136 | |
| Total net realized gain (loss) | | 3,463,916 |
| Change in net unrealized appreciation (depreciation) on underlying funds | | (1,042,143) |
| Net gain (loss) | | 2,421,773 |
| Net increase (decrease) in net assets resulting from operations | | $2,444,631 |
See accompanying notes which are an integral part of the financial statements.
Statement of Changes in Net Assets
| | Six months ended June 30, 2016 (Unaudited) | Year ended December 31, 2015 |
| Increase (Decrease) in Net Assets | | |
| Operations | | |
| Net investment income (loss) | $22,858 | $2,898,255 |
| Net realized gain (loss) | 3,463,916 | 4,691,568 |
| Change in net unrealized appreciation (depreciation) | (1,042,143) | (8,756,815) |
| Net increase (decrease) in net assets resulting from operations | 2,444,631 | (1,166,992) |
| Distributions to shareholders from net investment income | – | (2,895,777) |
| Distributions to shareholders from net realized gain | (4,746,712) | (552,053) |
| Total distributions | (4,746,712) | (3,447,830) |
| Share transactions | | |
| Proceeds from sales of shares | 6,993,581 | 34,295,736 |
| Reinvestment of distributions | 4,746,712 | 3,447,830 |
| Cost of shares redeemed | (10,312,663) | (16,817,984) |
| Net increase (decrease) in net assets resulting from share transactions | 1,427,630 | 20,925,582 |
| Total increase (decrease) in net assets | (874,451) | 16,310,760 |
| Net Assets | | |
| Beginning of period | 156,218,113 | 139,907,353 |
| End of period | $155,343,662 | $156,218,113 |
| Other Information | | |
| Undistributed net investment income end of period | $22,858 | $– |
| Shares | | |
| Sold | 607,989 | 2,718,882 |
| Issued in reinvestment of distributions | 445,283 | 283,671 |
| Redeemed | (890,033) | (1,356,599) |
| Net increase (decrease) | 163,239 | 1,645,954 |
See accompanying notes which are an integral part of the financial statements.
Financial Highlights — VIP Investor Freedom 2025 Portfolio
| | Six months ended (Unaudited) June 30, | Years ended December 31, | | | | |
| | 2016 | 2015 | 2014 | 2013 | 2012 | 2011 |
| Selected Per–Share Data | | | | | | |
| Net asset value, beginning of period | $12.04 | $12.35 | $12.16 | $10.45 | $9.36 | $9.83 |
| Income from Investment Operations | | | | | | |
| Net investment income (loss)A | –B | .24 | .21 | .24 | .24 | .22 |
| Net realized and unrealized gain (loss) | .16 | (.28) | .40 | 1.83 | 1.16 | (.44) |
| Total from investment operations | .16 | (.04) | .61 | 2.07 | 1.40 | (.22) |
| Distributions from net investment income | – | (.23) | (.20) | (.21) | (.21) | (.21) |
| Distributions from net realized gain | (.38) | (.04) | (.22) | (.15) | (.10) | (.04) |
| Total distributions | (.38) | (.27) | (.42) | (.36) | (.31) | (.25) |
| Net asset value, end of period | $11.82 | $12.04 | $12.35 | $12.16 | $10.45 | $9.36 |
| Total ReturnC,D,E | 1.64% | (.32)% | 5.04% | 19.95% | 15.05% | (2.28)% |
| Ratios to Average Net AssetsF,G | | | | | | |
| Expenses before reductionsH | -%I | -% | -% | -% | -% | -% |
| Expenses net of fee waivers, if any | -%I | -% | -% | -% | -% | -% |
| Expenses net of all reductions | -%I | -% | -% | -% | -% | -% |
| Net investment income (loss) | .03%I | 1.89% | 1.71% | 2.09% | 2.33% | 2.26% |
| Supplemental Data | | | | | | |
| Net assets, end of period (000 omitted) | $155,344 | $156,218 | $139,907 | $114,407 | $72,387 | $52,278 |
| Portfolio turnover rateF | 27%I | 16% | 13% | 15% | 13% | 15% |
A Calculated based on average shares outstanding during the period.
B Amount represents less than $.005 per share.
C Total returns for periods of less than one year are not annualized.
D Total returns do not reflect charges attributable to your insurance company's separate account. Inclusion of these charges would reduce the total returns shown.
E Total returns would have been lower if certain expenses had not been reduced during the applicable periods shown.
F Amounts do not include the activity of the Underlying Funds.
G Expense ratios reflect operating expenses of the Fund. Expenses before reductions do not reflect amounts reimbursed by the investment adviser or reductions from expense offset arrangements and do not represent the amount paid by the Fund during periods when reimbursements or reductions occur. Expenses net of fee waivers reflect expenses after reimbursement by the investment adviser but prior to reductions from expense offset arrangements. Expenses net of all reductions represent the net expenses paid by the Fund but do not include expenses of the underlying funds in which the Fund invests.
H Amount represents less than .005%.
I Annualized
See accompanying notes which are an integral part of the financial statements.
VIP Investor Freedom 2030 Portfolio℠
Investment Summary (Unaudited)
The information in the following tables is based on the direct investments of the Fund.
Top Holdings as of June 30, 2016
| | % of fund's net assets | % of fund's net assets 6 months ago |
| VIP Overseas Portfolio Investor Class | 17.9 | 17.8 |
| VIP Growth & Income Portfolio Investor Class | 11.9 | 12.3 |
| VIP Investment Grade Bond Portfolio Investor Class | 11.6 | 10.5 |
| VIP Equity-Income Portfolio Investor Class | 10.6 | 10.9 |
| VIP Growth Portfolio Investor Class | 10.1 | 10.7 |
| VIP Contrafund Portfolio Investor Class | 10.0 | 10.3 |
| VIP Emerging Markets Portfolio Investor Class | 9.1 | 7.8 |
| VIP Value Portfolio Investor Class | 7.6 | 7.9 |
| VIP High Income Portfolio Investor Class | 3.8 | 3.8 |
| VIP Value Strategies Portfolio Investor Class | 3.7 | 3.8 |
| | 96.3 | 95.8 |
Asset Allocation (% of fund's net assets)
| Period end |
| | Domestic Equity Funds | 56.8% |
| | International Equity Funds | 27.0% |
| | Bond Funds | 15.4% |
| | Short-Term Funds | 0.8% |

| Six months ago |
| | Domestic Equity Funds | 58.8% |
| | International Equity Funds | 25.6% |
| | Bond Funds | 14.3% |
| | Short-Term Funds | 1.3% |

VIP Investor Freedom 2030 Portfolio℠
Investments June 30, 2016 (Unaudited)
Showing Percentage of Net Assets
| Domestic Equity Funds - 56.8% | | | |
| | | Shares | Value |
| VIP Contrafund Portfolio Investor Class (a) | | 467,068 | $14,488,448 |
| VIP Equity-Income Portfolio Investor Class (a) | | 765,475 | 15,340,118 |
| VIP Growth & Income Portfolio Investor Class (a) | | 974,211 | 17,360,435 |
| VIP Growth Portfolio Investor Class (a) | | 259,282 | 14,740,181 |
| VIP Mid Cap Portfolio Investor Class (a) | | 138,083 | 4,228,116 |
| VIP Value Portfolio Investor Class (a) | | 818,800 | 11,102,934 |
| VIP Value Strategies Portfolio Investor Class (a) | | 373,429 | 5,414,723 |
| TOTAL DOMESTIC EQUITY FUNDS | | | |
| (Cost $77,537,522) | | | 82,674,955 |
|
| International Equity Funds - 27.0% | | | |
| VIP Emerging Markets Portfolio Investor Class(a) | | 1,538,370 | 13,245,363 |
| VIP Overseas Portfolio Investor Class (a) | | 1,463,288 | 25,973,365 |
| TOTAL INTERNATIONAL EQUITY FUNDS | | | |
| (Cost $40,156,157) | | | 39,218,728 |
|
| Bond Funds - 15.4% | | | |
| VIP High Income Portfolio Investor Class (a) | | 1,067,309 | 5,614,043 |
| VIP Investment Grade Bond Portfolio Investor Class (a) | | 1,290,888 | 16,833,178 |
| TOTAL BOND FUNDS | | | |
| (Cost $22,464,325) | | | 22,447,221 |
|
| Short-Term Funds - 0.8% | | | |
| VIP Government Money Market Portfolio Investor Class 0.19% (a)(b) | | | |
| (Cost $1,171,131) | | 1,171,131 | 1,171,131 |
| TOTAL INVESTMENT PORTFOLIO - 100.0% | | | |
| (Cost $141,329,135) | | | 145,512,035 |
| NET OTHER ASSETS (LIABILITIES) - 0.0% | | | (1) |
| NET ASSETS - 100% | | | $145,512,034 |
Legend
(a) Affiliated Fund
(b) The rate quoted is the annualized seven-day yield of the fund at period end.
Affiliated Underlying Funds
Information regarding the Fund's fiscal year to date purchases and sales of the affiliated Underlying Funds and income earned by the Fund from investments in affiliated Underlying Funds is as follows:
| Affiliate | Value, beginning of period | Purchases | Sales Proceeds | Dividend Income | Value, end of period |
| VIP Contrafund Portfolio Investor Class | $14,914,752 | $1,767,051 | $1,115,389 | $- | $14,488,448 |
| VIP Emerging Markets Portfolio Investor Class | 11,286,309 | 1,675,719 | 528,744 | - | 13,245,363 |
| VIP Equity-Income Portfolio Investor Class | 15,737,798 | 1,555,321 | 1,798,611 | - | 15,340,118 |
| VIP Government Money Market Portfolio Investor Class 0.19% | 1,915,331 | 159,609 | 903,809 | 856 | 1,171,131 |
| VIP Growth & Income Portfolio Investor Class | 17,749,313 | 1,883,284 | 1,440,917 | - | 17,360,435 |
| VIP Growth Portfolio Investor Class | 15,518,771 | 2,354,340 | 1,228,536 | - | 14,740,181 |
| VIP High Income Portfolio Investor Class | 5,430,752 | 404,672 | 571,532 | - | 5,614,043 |
| VIP Investment Grade Bond Portfolio Investor Class | 15,207,568 | 2,373,255 | 1,636,341 | 8,107 | 16,833,178 |
| VIP Mid Cap Portfolio Investor Class | 4,266,706 | 509,920 | 337,199 | - | 4,228,116 |
| VIP Overseas Portfolio Investor Class | 25,788,371 | 3,463,033 | 1,560,051 | - | 25,973,365 |
| VIP Value Portfolio Investor Class | 11,386,176 | 485,063 | 947,749 | - | 11,102,934 |
| VIP Value Strategies Portfolio Investor Class | 5,490,080 | 406,359 | 509,245 | - | 5,414,723 |
| Total | $144,691,927 | $17,037,626 | $12,578,123 | $8,963 | $145,512,035 |
Investment Valuation
All investments are categorized as Level 1 under the Fair Value Hierarchy. The inputs or methodology used for valuing securities may not be an indication of the risk associated with investing in those securities. For more information on valuation inputs please refer to the Investment Valuation section in the accompanying Notes to Financial Statements.
See accompanying notes which are an integral part of the financial statements.
VIP Investor Freedom 2030 Portfolio℠
Financial Statements
Statement of Assets and Liabilities
| | | June 30, 2016 (Unaudited) |
| Assets | | |
| Investment in securities, at value (cost $141,329,135) — See accompanying schedule | | $145,512,035 |
| Receivable for fund shares sold | | 21,649 |
| Total assets | | 145,533,684 |
| Liabilities | | |
| Payable for investments purchased | $21,650 | |
| Total liabilities | | 21,650 |
| Net Assets | | $145,512,034 |
| Net Assets consist of: | | |
| Paid in capital | | $138,093,095 |
| Undistributed net investment income | | 12,258 |
| Accumulated undistributed net realized gain (loss) on investments | | 3,223,781 |
| Net unrealized appreciation (depreciation) on investments | | 4,182,900 |
| Net Assets, for 12,865,899 shares outstanding | | $145,512,034 |
| Net Asset Value, offering price and redemption price per share ($145,512,034 ÷ 12,865,899 shares) | | $11.31 |
See accompanying notes which are an integral part of the financial statements.
Statement of Operations
| | | Six months ended June 30, 2016 (Unaudited) |
| Investment Income | | |
| Income distributions from underlying funds | | $8,963 |
| Expenses | | |
| Independent trustees' fees and expenses | $320 | |
| Total expenses before reductions | 320 | |
| Expense reductions | (320) | – |
| Net investment income (loss) | | 8,963 |
| Realized and Unrealized Gain (Loss) | | |
| Realized gain (loss) on sale of underlying fund shares | (872,475) | |
| Capital gain distributions from underlying funds | 4,913,487 | |
| Total net realized gain (loss) | | 4,041,012 |
| Change in net unrealized appreciation (depreciation) on underlying funds | | (2,766,923) |
| Net gain (loss) | | 1,274,089 |
| Net increase (decrease) in net assets resulting from operations | | $1,283,052 |
See accompanying notes which are an integral part of the financial statements.
Statement of Changes in Net Assets
| | Six months ended June 30, 2016 (Unaudited) | Year ended December 31, 2015 |
| Increase (Decrease) in Net Assets | | |
| Operations | | |
| Net investment income (loss) | $8,963 | $2,451,454 |
| Net realized gain (loss) | 4,041,012 | 5,611,740 |
| Change in net unrealized appreciation (depreciation) | (2,766,923) | (8,818,365) |
| Net increase (decrease) in net assets resulting from operations | 1,283,052 | (755,171) |
| Distributions to shareholders from net investment income | – | (2,448,159) |
| Distributions to shareholders from net realized gain | (5,260,123) | (636,185) |
| Total distributions | (5,260,123) | (3,084,344) |
| Share transactions | | |
| Proceeds from sales of shares | 6,064,645 | 23,531,499 |
| Reinvestment of distributions | 5,260,123 | 3,084,344 |
| Cost of shares redeemed | (6,527,590) | (9,509,608) |
| Net increase (decrease) in net assets resulting from share transactions | 4,797,178 | 17,106,235 |
| Total increase (decrease) in net assets | 820,107 | 13,266,720 |
| Net Assets | | |
| Beginning of period | 144,691,927 | 131,425,207 |
| End of period | $145,512,034 | $144,691,927 |
| Other Information | | |
| Undistributed net investment income end of period | $12,258 | $3,295 |
| Shares | | |
| Sold | 548,159 | 1,925,216 |
| Issued in reinvestment of distributions | 521,320 | 260,745 |
| Redeemed | (588,679) | (779,308) |
| Net increase (decrease) | 480,800 | 1,406,653 |
See accompanying notes which are an integral part of the financial statements.
Financial Highlights — VIP Investor Freedom 2030 Portfolio
| | Six months ended (Unaudited) June 30, | Years ended December 31, | | | | |
| | 2016 | 2015 | 2014 | 2013 | 2012 | 2011 |
| Selected Per–Share Data | | | | | | |
| Net asset value, beginning of period | $11.68 | $11.97 | $11.81 | $10.00 | $8.92 | $9.41 |
| Income from Investment Operations | | | | | | |
| Net investment income (loss)A | –B | .21 | .19 | .21 | .22 | .20 |
| Net realized and unrealized gain (loss) | .06 | (.24) | .38 | 1.95 | 1.16 | (.46) |
| Total from investment operations | .06 | (.03) | .57 | 2.16 | 1.38 | (.26) |
| Distributions from net investment income | – | (.20) | (.18) | (.19) | (.21) | (.20) |
| Distributions from net realized gain | (.43) | (.05) | (.22) | (.16) | (.09) | (.03) |
| Total distributions | (.43) | (.26)C | (.41)D | (.35) | (.30) | (.23) |
| Net asset value, end of period | $11.31 | $11.68 | $11.97 | $11.81 | $10.00 | $8.92 |
| Total ReturnE,F,G | .92% | (.32)% | 4.83% | 21.72% | 15.50% | (2.78)% |
| Ratios to Average Net AssetsH,I | | | | | | |
| Expenses before reductionsJ | -%K | -% | -% | -% | -% | -% |
| Expenses net of fee waivers, if any | -%K | -% | -% | -% | -% | -% |
| Expenses net of all reductions | -%K | -% | -% | -% | -% | -% |
| Net investment income (loss) | .01%K | 1.73% | 1.58% | 1.94% | 2.28% | 2.16% |
| Supplemental Data | | | | | | |
| Net assets, end of period (000 omitted) | $145,512 | $144,692 | $131,425 | $111,157 | $67,610 | $51,478 |
| Portfolio turnover rateH | 18%K | 12% | 13% | 27% | 14% | 14% |
A Calculated based on average shares outstanding during the period.
B Amount represents less than $.005 per share.
C Total distributions of $.26 per share is comprised of distributions from net investment income of $.202 and distributions from net realized gain of $.053 per share.
D Total distributions of $.41 per share is comprised of distributions from net investment income of $.182 and distributions from net realized gain of $.224 per share.
E Total returns for periods of less than one year are not annualized.
F Total returns do not reflect charges attributable to your insurance company's separate account. Inclusion of these charges would reduce the total returns shown.
G Total returns would have been lower if certain expenses had not been reduced during the applicable periods shown.
H Amounts do not include the activity of the Underlying Funds.
I Expense ratios reflect operating expenses of the Fund. Expenses before reductions do not reflect amounts reimbursed by the investment adviser or reductions from expense offset arrangements and do not represent the amount paid by the Fund during periods when reimbursements or reductions occur. Expenses net of fee waivers reflect expenses after reimbursement by the investment adviser but prior to reductions from expense offset arrangements. Expenses net of all reductions represent the net expenses paid by the Fund but do not include expenses of the underlying funds in which the Fund invests.
J Amount represents less than .005%.
K Annualized
See accompanying notes which are an integral part of the financial statements.
Notes to Financial Statements (Unaudited)
For the period ended June 30, 2016
1. Organization.
VIP Investor Freedom Income Portfolio, VIP Investor Freedom 2005 Portfolio, VIP Investor Freedom 2010 Portfolio, VIP Investor Freedom 2015 Portfolio, VIP Investor Freedom 2020 Portfolio, VIP Investor Freedom 2025 Portfolio and VIP Investor Freedom 2030 Portfolio (the Funds) are funds of Variable Insurance Products Fund V (the Trust). The Trust is registered under the Investment Company Act of 1940, as amended (the 1940 Act), as an open-end management investment company organized as a Massachusetts business trust. Each Fund is authorized to issue an unlimited number of shares. The Funds invest primarily in a combination of other VIP equity, bond, and short-term funds (the Underlying Funds) managed by Fidelity Management & Research Company (FMR). Shares of each Fund may only be purchased by insurance companies for the purpose of funding variable annuity or variable life insurance contracts.
2. Significant Accounting Policies.
The financial statements have been prepared in conformity with accounting principles generally accepted in the United States of America (GAAP), which require management to make certain estimates and assumptions at the date of the financial statements. Actual results could differ from those estimates. Subsequent events, if any, through the date that the financial statements were issued have been evaluated in the preparation of the financial statements. The following summarizes the significant accounting policies of the Funds:
Investment Valuation. Investments are valued as of 4:00 p.m. Eastern time on the last calendar day of the period. Each Fund categorizes the inputs to valuation techniques used to value its investments into a disclosure hierarchy consisting of three levels as shown below:
- Level 1 – quoted prices in active markets for identical investments
- Level 2 – other significant observable inputs (including quoted prices for similar investments, interest rates, prepayment speeds, etc.)
- Level 3 – unobservable inputs (including the Fund's own assumptions based on the best information available)
Valuation techniques used to value each Fund's investments by major category are as follows. Investments in the Underlying Funds are valued at their closing net asset value (NAV) each business day and are categorized as Level 1 in the hierarchy.
Investment Transactions and Income. For financial reporting purposes, the Funds' investment holdings and NAV include trades executed through the end of the last business day of the period. The NAV per share for processing shareholder transactions is calculated as of the close of business of the New York Stock Exchange (NYSE), normally 4:00 p.m. Eastern time and includes trades executed through the end of the prior business day. Gains and losses on securities sold are determined on the basis of identified cost. Income and capital gain distributions from the Underlying Funds, if any, are recorded on the ex-dividend date.
Expenses. Expenses directly attributable to a fund are charged to that fund. Expenses attributable to more than one fund are allocated among the respective funds on the basis of relative net assets or other appropriate methods. Expenses included in the accompanying financial statements reflect the expenses of the Fund and do not include any expenses associated with the Underlying Funds. Although not included in each Fund's expenses, each Fund indirectly bears its proportionate share of the Underlying Funds' expenses through the impact of these expenses on each Underlying Fund's NAV. Expense estimates are accrued in the period to which they relate and adjustments are made when actual amounts are known.
Income Tax Information and Distributions to Shareholders. Each year, each Fund intends to qualify as a regulated investment company under Subchapter M of the Internal Revenue Code, including distributing substantially all of its taxable income and realized gains. As a result, no provision for U.S. Federal income taxes is required. Each Fund files a U.S. federal tax return, in addition to state and local tax returns as required. Each Fund's federal income tax returns are subject to examination by the Internal Revenue Service (IRS) for a period of three fiscal years after they are filed. State and local tax returns may be subject to examination for an additional fiscal year depending on the jurisdiction.
Distributions are declared and recorded on the ex-dividend date. Income and capital gain distributions are determined in accordance with income tax regulations, which may differ from GAAP.
Capital accounts within the financial statements are adjusted for permanent book-tax differences. These adjustments have no impact on net assets or the results of operations. Capital accounts are not adjusted for temporary book-tax differences which will reverse in a subsequent period.
Book-tax differences are primarily due to short-term gain distributions from the Underlying Funds, capital loss carryforwards and losses deferred due to wash sales.
The federal tax cost of investment securities and unrealized appreciation (depreciation) as of period end were as follows for each Fund:
| | Tax cost | Gross unrealized appreciation | Gross unrealized depreciation | Net unrealized appreciation (depreciation) on securities |
| VIP Investor Freedom Income | $64,105,917 | $2,910,092 | $(735,909) | $2,174,183 |
| VIP Investor Freedom 2005 | 19,806,093 | 996,548 | (431,946) | 564,602 |
| VIP Investor Freedom 2010 | 58,119,258 | 3,358,050 | (1,917,724) | 1,440,326 |
| VIP Investor Freedom 2015 | 91,762,580 | 6,679,555 | (2,854,504) | 3,825,051 |
| VIP Investor Freedom 2020 | 176,011,955 | 12,476,899 | (6,286,520) | 6,190,379 |
| VIP Investor Freedom 2025 | 148,113,289 | 12,376,374 | (5,146,002) | 7,230,372 |
| VIP Investor Freedom 2030 | 142,183,121 | 10,312,187 | (6,983,273) | 3,328,914 |
3. Purchases and Redemptions of Underlying Fund Shares.
Purchases and redemptions of the Underlying Fund shares, are noted in the table below.
| | Purchases ($) | Redemptions ($) |
| VIP Investor Freedom Income | 9,810,149 | 8,755,856 |
| VIP Investor Freedom 2005 | 2,568,914 | 2,760,721 |
| VIP Investor Freedom 2010 | 7,305,606 | 7,422,066 |
| VIP Investor Freedom 2015 | 12,153,285 | 12,108,962 |
| VIP Investor Freedom 2020 | 21,306,704 | 25,199,309 |
| VIP Investor Freedom 2025 | 21,475,600 | 20,449,690 |
| VIP Investor Freedom 2030 | 17,037,626 | 12,578,123 |
4. Fees and Other Transactions with Affiliates.
Management Fee. FMR Co., Inc. (the investment adviser), an affiliate of FMR, provides the Funds with investment management related services. The Funds do not pay any fees for these services.
Other Transactions. The investment adviser has entered into an administration agreement with FMR under which FMR provides management and administrative services (other than investment advisory services) necessary for the operation of each Fund. Pursuant to this agreement, FMR pays all expenses of each Fund, excluding compensation of the independent Trustees and certain other expenses such as interest expense. FMR also contracts with other Fidelity companies to perform the services necessary for the operation of each Fund. The Funds do not pay any fees for these services.
5. Expense Reductions.
FMR voluntarily agreed to reimburse each Fund to the extent annual operating expenses exceeded certain levels of average net assets as noted in the table below. Some expenses, for example interest expense, are excluded from this reimbursement.
The following Funds were in reimbursement during the period:
| | Expense Limitations | Reimbursement |
| VIP Investor Freedom Income | -% | $146 |
| VIP Investor Freedom 2005 | -% | $45 |
| VIP Investor Freedom 2010 | -% | $133 |
| VIP Investor Freedom 2015 | -% | $212 |
| VIP Investor Freedom 2020 | -% | $413 |
| VIP Investor Freedom 2025 | -% | $341 |
| VIP Investor Freedom 2030 | -% | $320 |
6. Other.
The Funds' organizational documents provide former and current trustees and officers with a limited indemnification against liabilities arising in connection with the performance of their duties to the Funds. In the normal course of business, the Funds may also enter into contracts that provide general indemnifications. The Funds' maximum exposure under these arrangements is unknown as this would be dependent on future claims that may be made against the Funds. The risk of material loss from such claims is considered remote.
At the end of the period, the investment adviser or its affiliates were the owners of record of all of the outstanding shares of the Funds.
Shareholder Expense Example
As a shareholder of a Fund, you incur two types of costs: (1) transaction costs, and (2) ongoing costs, including other Fund expenses. This Example is intended to help you understand your ongoing costs (in dollars) of investing in the Funds and to compare these costs with the ongoing costs of investing in other mutual funds.
The Example is based on an investment of $1,000 invested at the beginning of the period and held for the entire period (January 1, 2016 to June 30, 2016).
Actual Expenses
The first line of the accompanying table for each fund provides information about actual account values and actual expenses. You may use the information in this line, together with the amount you invested, to estimate the expenses that you paid over the period. Simply divide your account value by $1,000.00 (for example, an $8,600 account value divided by $1,000.00 = 8.6), then multiply the result by the number in the first line for a fund under the heading entitled "Expenses Paid During Period" to estimate the expenses you paid on your account during this period. The estimate of expenses does not include any fees or other expenses of any variable annuity or variable life insurance product. If they were, the estimate of expenses you paid during the period would be higher, and your ending account value would be lower. In addition, each Fund, as a shareholder in underlying Fidelity Funds, will indirectly bear its pro-rata share of the fees and expenses incurred by the underlying Fidelity Funds. These fees and expenses are not included in each Fund's annualized expense ratio used to calculate the expense estimates in the table below.
Hypothetical Example for Comparison Purposes
The second line of the accompanying table for each fund provides information about hypothetical account values and hypothetical expenses based on a fund's actual expense ratio and an assumed rate of return of 5% per year before expenses, which is not the Fund's actual return. The hypothetical account values and expenses may not be used to estimate the actual ending account balance or expenses you paid for the period. You may use this information to compare the ongoing costs of investing in the Fund and other funds. To do so, compare this 5% hypothetical example with the 5% hypothetical examples that appear in the shareholder reports of the other funds. The estimate of expenses does not include any fees or other expenses of any variable annuity or variable life insurance product. If they were, the estimate of expenses you paid during the period would be higher, and your ending account value would be lower. In addition, each Fund, as a shareholder in underlying Fidelity Funds, will indirectly bear its pro-rata share of the fees and expenses incurred by the underlying Fidelity Funds. These fees and expenses are not included in each Fund's annualized expense ratio used to calculate the expense estimates in the table below.
Please note that the expenses shown in the table are meant to highlight your ongoing costs only and do not reflect any transaction costs. Therefore, the second line of the table is useful in comparing ongoing costs only, and will not help you determine the relative total costs of owning different funds.
| | Annualized Expense Ratio-A | Beginning
Account Value
January 1, 2016 | Ending
Account Value
June 30, 2016 | Expenses Paid
During Period-B
January 1, 2016
to June 30, 2016 |
| VIP Investor Freedom Income | - % | | | |
| Actual | | $1,000.00 | $1,029.60 | $- |
| Hypothetical-C | | $1,000.00 | $1,024.86 | $- |
| VIP Investor Freedom 2005 | - % | | | |
| Actual | | $1,000.00 | $1,025.80 | $- |
| Hypothetical-C | | $1,000.00 | $1,024.86 | $- |
| VIP Investor Freedom 2010 | - % | | | |
| Actual | | $1,000.00 | $1,024.30 | $- |
| Hypothetical-C | | $1,000.00 | $1,024.86 | $- |
| VIP Investor Freedom 2015 | - % | | | |
| Actual | | $1,000.00 | $1,022.10 | $- |
| Hypothetical-C | | $1,000.00 | $1,024.86 | $- |
| VIP Investor Freedom 2020 | - % | | | |
| Actual | | $1,000.00 | $1,020.40 | $- |
| Hypothetical-C | | $1,000.00 | $1,024.86 | $- |
| VIP Investor Freedom 2025 | - % | | | |
| Actual | | $1,000.00 | $1,016.40 | $- |
| Hypothetical-C | | $1,000.00 | $1,024.86 | $- |
| VIP Investor Freedom 2030 | - % | | | |
| Actual | | $1,000.00 | $1,009.20 | $- |
| Hypothetical-C | | $1,000.00 | $1,024.86 | $- |
A Annualized expense ratio reflects expenses net of applicable fee waivers.
B Expenses are equal to each Fund's annualized expense ratio, multiplied by the average account value over the period, multiplied by 182/366 (to reflect the one-half year period). The fees and expenses of the underlying Fidelity Funds in which each Fund invests are not included in each Fund's annualized expense ratio.
C 5% return per year before expenses
VIPIFF-SANN-0816
1.833440.110
Fidelity® Variable Insurance Products:
Freedom Lifetime Income Funds - Portfolios I, II & III
Semi-Annual Report June 30, 2016 |
|
Contents
To view a fund's proxy voting guidelines and proxy voting record for the 12-month period ended June 30, visit http://www.fidelity.com/proxyvotingresults or visit the Securities and Exchange Commission's (SEC) web site at http://www.sec.gov.
You may also call 1-877-208-0098 to request a free copy of the proxy voting guidelines.
Fidelity® Variable Insurance Products are separate account options which are purchased through a variable insurance contract.
Standard & Poor's, S&P and S&P 500 are registered service marks of The McGraw-Hill Companies, Inc. and have been licensed for use by Fidelity Distributors Corporation.
Other third-party marks appearing herein are the property of their respective owners.
All other marks appearing herein are registered or unregistered trademarks or service marks of FMR LLC or an affiliated company. © 2016 FMR LLC. All rights reserved.
This report and the financial statements contained herein are submitted for the general information of the shareholders of the Funds. This report is not authorized for distribution to prospective investors in the Funds unless preceded or accompanied by an effective prospectus.
A fund files its complete schedule of portfolio holdings with the SEC for the first and third quarters of each fiscal year on Form N-Q. Forms N-Q are available on the SEC’s web site at http://www.sec.gov. A fund's Forms N-Q may be reviewed and copied at the SEC’s Public Reference Room in Washington, DC. Information regarding the operation of the SEC's Public Reference Room may be obtained by calling 1-800-SEC-0330.
For a complete list of a fund's portfolio holdings, view the most recent holdings listing, semiannual report, or annual report on Fidelity's web site at http://www.fidelity.com, http://www.institutional.fidelity.com, or http://www.401k.com, as applicable.
NOT FDIC INSURED •MAY LOSE VALUE •NO BANK GUARANTEE
Neither the Funds nor Fidelity Distributors Corporation is a bank.
VIP Freedom Lifetime Income® I Portfolio
Investment Summary (Unaudited)
The information in the following tables is based on the direct investments of the Fund.
Top Holdings as of June 30, 2016
| | % of fund's net assets | % of fund's net assets 6 months ago |
| VIP Investment Grade Bond Portfolio Investor Class | 56.7 | 54.8 |
| VIP Government Money Market Portfolio Investor Class 0.19% | 14.9 | 15.2 |
| VIP High Income Portfolio Investor Class | 5.0 | 4.9 |
| VIP Overseas Portfolio Investor Class | 4.8 | 5.4 |
| VIP Growth & Income Portfolio Investor Class | 3.6 | 3.8 |
| VIP Equity-Income Portfolio Investor Class | 3.2 | 3.4 |
| VIP Growth Portfolio Investor Class | 3.1 | 3.4 |
| VIP Contrafund Portfolio Investor Class | 3.1 | 3.2 |
| VIP Value Portfolio Investor Class | 2.3 | 2.4 |
| VIP Emerging Markets Portfolio Investor Class | 1.3 | 1.4 |
| | 98.0 | 97.9 |
Asset Allocation (% of fund's net assets)
| Period end |
| | Domestic Equity Funds | 17.3% |
| | Developed International Equity Funds | 4.8% |
| | Emerging Markets Equity Funds | 1.3% |
| | High Yield Bond Funds | 5.0% |
| | Investment Grade Bond Funds | 56.7% |
| | Short-Term Funds | 14.9% |
| Six months ago |
| | Domestic Equity Funds | 18.3% |
| | Developed International Equity Funds | 5.4% |
| | Emerging Markets Equity Funds | 1.4% |
| | High Yield Bond Funds | 4.9% |
| | Investment Grade Bond Funds | 54.8% |
| | Short-Term Funds | 15.2% |
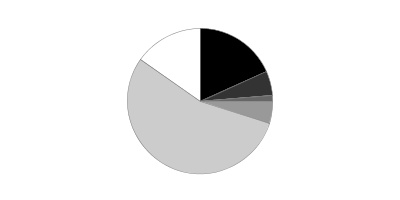
VIP Freedom Lifetime Income® I Portfolio
Investments June 30, 2016 (Unaudited)
Showing Percentage of Net Assets
| Domestic Equity Funds - 17.3% | | | |
| | | Shares | Value |
| Domestic Equity Funds - 17.3% | | | |
| VIP Contrafund Portfolio Investor Class (a) | | 13,956 | $432,930 |
| VIP Equity-Income Portfolio Investor Class (a) | | 22,785 | 456,606 |
| VIP Growth & Income Portfolio Investor Class (a) | | 28,778 | 512,817 |
| VIP Growth Portfolio Investor Class (a) | | 7,824 | 444,820 |
| VIP Mid Cap Portfolio Investor Class (a) | | 4,079 | 124,897 |
| VIP Value Portfolio Investor Class (a) | | 24,153 | 327,512 |
| VIP Value Strategies Portfolio Investor Class (a) | | 10,970 | 159,060 |
| TOTAL DOMESTIC EQUITY FUNDS | | | |
| (Cost $2,203,389) | | | 2,458,642 |
| | | | |
|
| International Equity Funds - 6.1% | | | |
| Developed International Equity Funds - 4.8% | | | |
| VIP Overseas Portfolio Investor Class (a) | | 38,451 | 682,503 |
| Emerging Markets Equity Funds - 1.3% | | | |
| VIP Emerging Markets Portfolio Investor Class(a) | | 21,679 | 186,657 |
| TOTAL INTERNATIONAL EQUITY FUNDS | | | |
| (Cost $917,762) | | | 869,160 |
|
| Bond Funds - 61.7% | | | |
| High Yield Bond Funds - 5.0% | | | |
| VIP High Income Portfolio Investor Class (a) | | 135,296 | 711,657 |
| Investment Grade Bond Funds - 56.7% | | | |
| VIP Investment Grade Bond Portfolio Investor Class (a) | | 617,331 | 8,049,994 |
| TOTAL BOND FUNDS | | | |
| (Cost $8,648,473) | | | 8,761,651 |
|
| Short-Term Funds - 14.9% | | | |
| VIP Government Money Market Portfolio Investor Class 0.19% (a)(b) | | | |
| (Cost $2,115,526) | | 2,115,526 | 2,115,526 |
| TOTAL INVESTMENT PORTFOLIO - 100.0% | | | |
| (Cost $13,885,150) | | | 14,204,979 |
| NET OTHER ASSETS (LIABILITIES) - 0.0% | | | 0 |
| NET ASSETS - 100% | | | $14,204,979 |
Legend
(a) Affiliated Fund
(b) The rate quoted is the annualized seven-day yield of the fund at period end.
Affiliated Underlying Funds
Information regarding the Fund's fiscal year to date purchases and sales of the affiliated Underlying Funds and income earned by the Fund from investments in affiliated Underlying Funds is as follows:
| Affiliate | Value, beginning of period | Purchases | Sales Proceeds | Dividend Income | Value, end of period |
| VIP Contrafund Portfolio Investor Class | $439,232 | $80,203 | $55,061 | $-- | $432,930 |
| VIP Emerging Markets Portfolio Investor Class | 182,251 | 20,060 | 27,825 | -- | 186,657 |
| VIP Equity-Income Portfolio Investor Class | 463,448 | 64,581 | 67,890 | -- | 456,606 |
| VIP Government Money Market Portfolio Investor Class 0.19% | 2,066,985 | 193,950 | 145,408 | 1,482 | 2,115,526 |
| VIP Growth & Income Portfolio Investor Class | 520,601 | 92,471 | 77,039 | -- | 512,817 |
| VIP Growth Portfolio Investor Class | 457,143 | 78,012 | 33,727 | -- | 444,820 |
| VIP High Income Portfolio Investor Class | 668,352 | 42,842 | 45,633 | -- | 711,657 |
| VIP Investment Grade Bond Portfolio Investor Class | 7,475,949 | 591,089 | 455,400 | 4,134 | 8,049,994 |
| VIP Mid Cap Portfolio Investor Class | 125,620 | 24,633 | 19,468 | -- | 124,897 |
| VIP Overseas Portfolio Investor Class | 740,146 | 63,774 | 74,184 | -- | 682,503 |
| VIP Value Portfolio Investor Class | 334,079 | 37,688 | 51,528 | -- | 327,512 |
| VIP Value Strategies Portfolio Investor Class | 161,638 | 23,775 | 28,290 | -- | 159,060 |
| Total | $13,635,444 | $1,313,078 | $1,081,453 | $5,616 | $14,204,979 |
Investment Valuation
All investments are categorized as Level 1 under the Fair Value Hierarchy. The inputs or methodology used for valuing securities may not be an indication of the risk associated with investing in those securities. For more information on valuation inputs please refer to the Investment Valuation section in the accompanying Notes to Financial Statements.
See accompanying notes which are an integral part of the financial statements.
VIP Freedom Lifetime Income® I Portfolio
Financial Statements
Statement of Assets and Liabilities
| | | June 30, 2016 (Unaudited) |
| Assets | | |
| Investment in securities, at value (cost $13,885,150) — See accompanying schedule | | $14,204,979 |
| Receivable for investments sold | | 233 |
| Total assets | | 14,205,212 |
| Liabilities | | |
| Payable for fund shares redeemed | $233 | |
| Total liabilities | | 233 |
| Net Assets | | $14,204,979 |
| Net Assets consist of: | | |
| Paid in capital | | $13,816,465 |
| Undistributed net investment income | | 4,931 |
| Accumulated undistributed net realized gain (loss) on investments | | 63,754 |
| Net unrealized appreciation (depreciation) on investments | | 319,829 |
| Net Assets, for 1,311,412 shares outstanding | | $14,204,979 |
| Net Asset Value, offering price and redemption price per share ($14,204,979 ÷ 1,311,412 shares) | | $10.83 |
See accompanying notes which are an integral part of the financial statements.
Statement of Operations
| | | Six months ended June 30, 2016 (Unaudited) |
| Investment Income | | |
| Income distributions from underlying funds | | $5,616 |
| Expenses | | |
| Independent trustees' fees and expenses | $31 | |
| Total expenses before reductions | 31 | |
| Expense reductions | (31) | – |
| Net investment income (loss) | | 5,616 |
| Realized and Unrealized Gain (Loss) | | |
| Realized gain (loss) on sale of underlying fund shares | (45,797) | |
| Capital gain distributions from underlying funds | 155,019 | |
| Total net realized gain (loss) | | 109,222 |
| Change in net unrealized appreciation (depreciation) on underlying funds | | 383,704 |
| Net gain (loss) | | 492,926 |
| Net increase (decrease) in net assets resulting from operations | | $498,542 |
See accompanying notes which are an integral part of the financial statements.
Statement of Changes in Net Assets
| | Six months ended June 30, 2016 (Unaudited) | Year ended December 31, 2015 |
| Increase (Decrease) in Net Assets | | |
| Operations | | |
| Net investment income (loss) | $5,616 | $293,442 |
| Net realized gain (loss) | 109,222 | 272,161 |
| Change in net unrealized appreciation (depreciation) | 383,704 | (602,334) |
| Net increase (decrease) in net assets resulting from operations | 498,542 | (36,731) |
| Distributions to shareholders from net investment income | (1,267) | (293,803) |
| Distributions to shareholders from net realized gain | (242,054) | (113,181) |
| Total distributions | (243,321) | (406,984) |
| Share transactions | | |
| Proceeds from sales of shares | 620,725 | 562,289 |
| Reinvestment of distributions | 243,321 | 406,984 |
| Cost of shares redeemed | (549,732) | (1,553,484) |
| Net increase (decrease) in net assets resulting from share transactions | 314,314 | (584,211) |
| Total increase (decrease) in net assets | 569,535 | (1,027,926) |
| Net Assets | | |
| Beginning of period | 13,635,444 | 14,663,370 |
| End of period | $14,204,979 | $13,635,444 |
| Other Information | | |
| Undistributed net investment income end of period | $4,931 | $582 |
| Shares | | |
| Sold | 59,316 | 50,508 |
| Issued in reinvestment of distributions | 24,020 | 37,852 |
| Redeemed | (51,959) | (140,207) |
| Net increase (decrease) | 31,377 | (51,847) |
See accompanying notes which are an integral part of the financial statements.
Financial Highlights — VIP Freedom Lifetime Income I Portfolio
| | Six months ended (Unaudited) June 30, | Years ended December 31, | | | | |
| | 2016 | 2015 | 2014 | 2013 | 2012 | 2011 |
| Selected Per–Share Data | | | | | | |
| Net asset value, beginning of period | $10.65 | $11.01 | $10.95 | $10.26 | $9.65 | $9.88 |
| Income from Investment Operations | | | | | | |
| Net investment income (loss)A | –B | .23 | .21 | .19 | .20 | .22 |
| Net realized and unrealized gain (loss) | .37 | (.27) | .29 | .83 | .80 | (.17) |
| Total from investment operations | .37 | (.04) | .50 | 1.02 | 1.00 | .05 |
| Distributions from net investment income | –B | (.24) | (.20) | (.20) | (.20) | (.21) |
| Distributions from net realized gain | (.19) | (.09) | (.25) | (.13) | (.19) | (.06) |
| Total distributions | (.19) | (.32)C | (.44)D | (.33) | (.39) | (.28)E |
| Net asset value, end of period | $10.83 | $10.65 | $11.01 | $10.95 | $10.26 | $9.65 |
| Total ReturnF,G,H | 3.62% | (.35)% | 4.68% | 9.96% | 10.42% | .48% |
| Ratios to Average Net AssetsI,J | | | | | | |
| Expenses before reductionsK | -%L | -% | -% | -% | -% | -% |
| Expenses net of fee waivers, if any | -%L | -% | -% | -% | -% | -% |
| Expenses net of all reductions | -%L | -% | -% | -% | -% | -% |
| Net investment income (loss) | .08%L | 2.05% | 1.89% | 1.81% | 1.97% | 2.25% |
| Supplemental Data | | | | | | |
| Net assets, end of period (000 omitted) | $14,205 | $13,635 | $14,663 | $12,991 | $12,037 | $10,747 |
| Portfolio turnover rateI | 16%L | 12% | 12% | 22% | 19% | 17% |
A Calculated based on average shares outstanding during the period.
B Amount represents less than $.005 per share.
C Total distributions of $.32 per share is comprised of distributions from net investment income of $.235 and distributions from net realized gain of $.088 per share.
D Total distributions of $.44 per share is comprised of distributions from net investment income of $.196 and distributions from net realized gain of $.248 per share.
E Total distributions of $.28 per share is comprised of distributions from net investment income of $.214 and distributions from net realized gain of $.064 per share.
F Total returns for periods of less than one year are not annualized.
G Total returns do not reflect charges attributable to your insurance company's separate account. Inclusion of these charges would reduce the total returns shown.
H Total returns would have been lower if certain expenses had not been reduced during the applicable periods shown.
I Amounts do not include the activity of the Underlying Funds.
J Expense ratios reflect operating expenses of the Fund. Expenses before reductions do not reflect amounts reimbursed by the investment adviser or reductions from expense offset arrangements and do not represent the amount paid by the Fund during periods when reimbursements or reductions occur. Expenses net of fee waivers reflect expenses after reimbursement by the investment adviser but prior to reductions from expense offset arrangements. Expenses net of all reductions represent the net expenses paid by the Fund but do not include expenses of the underlying funds in which the Fund invests.
K Amount represents less than .005%.
L Annualized
See accompanying notes which are an integral part of the financial statements.
VIP Freedom Lifetime Income® II Portfolio
Investment Summary (Unaudited)
The information in the following tables is based on the direct investments of the Fund.
Top Holdings as of June 30, 2016
| | % of fund's net assets | % of fund's net assets 6 months ago |
| VIP Investment Grade Bond Portfolio Investor Class | 40.1 | 39.9 |
| VIP Government Money Market Portfolio Investor Class 0.19% | 10.5 | 10.4 |
| VIP Overseas Portfolio Investor Class | 9.1 | 9.7 |
| VIP Growth & Income Portfolio Investor Class | 6.8 | 6.8 |
| VIP Equity-Income Portfolio Investor Class | 6.1 | 6.1 |
| VIP Growth Portfolio Investor Class | 5.9 | 6.0 |
| VIP Contrafund Portfolio Investor Class | 5.8 | 5.7 |
| VIP High Income Portfolio Investor Class | 5.0 | 4.9 |
| VIP Value Portfolio Investor Class | 4.4 | 4.4 |
| VIP Emerging Markets Portfolio Investor Class | 2.5 | 2.4 |
| | 96.2 | 96.3 |
Asset Allocation (% of fund's net assets)
| Period end |
| | Domestic Equity Funds | 32.8% |
| | Developed International Equity Funds | 9.1% |
| | Emerging Markets Equity Funds | 2.5% |
| | High Yield Bond Funds | 5.0% |
| | Investment Grade Bond Funds | 40.1% |
| | Short-Term Funds | 10.5% |

| Six months ago |
| | Domestic Equity Funds | 32.7% |
| | Developed International Equity Funds | 9.7% |
| | Emerging Markets Equity Funds | 2.4% |
| | High Yield Bond Funds | 4.9% |
| | Investment Grade Bond Funds | 39.9% |
| | Short-Term Funds | 10.4% |
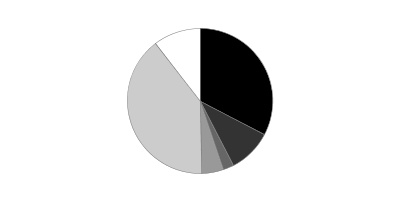
VIP Freedom Lifetime Income® II Portfolio
Investments June 30, 2016 (Unaudited)
Showing Percentage of Net Assets
| Domestic Equity Funds - 32.8% | | | |
| | | Shares | Value |
| Domestic Equity Funds - 32.8% | | | |
| VIP Contrafund Portfolio Investor Class (a) | | 58,096 | $1,802,140 |
| VIP Equity-Income Portfolio Investor Class (a) | | 94,853 | 1,900,858 |
| VIP Growth & Income Portfolio Investor Class (a) | | 119,829 | 2,135,362 |
| VIP Growth Portfolio Investor Class (a) | | 32,564 | 1,851,275 |
| VIP Mid Cap Portfolio Investor Class (a) | | 16,980 | 519,932 |
| VIP Value Portfolio Investor Class (a) | | 100,570 | 1,363,729 |
| VIP Value Strategies Portfolio Investor Class (a) | | 45,680 | 662,364 |
| TOTAL DOMESTIC EQUITY FUNDS | | | |
| (Cost $9,692,589) | | | 10,235,660 |
|
| International Equity Funds - 11.6% | | | |
| Developed International Equity Funds - 9.1% | | | |
| VIP Overseas Portfolio Investor Class (a) | | 160,179 | 2,843,180 |
| Emerging Markets Equity Funds - 2.5% | | | |
| VIP Emerging Markets Portfolio Investor Class(a) | | 90,249 | 777,048 |
| TOTAL INTERNATIONAL EQUITY FUNDS | | | |
| (Cost $3,888,600) | | | 3,620,228 |
|
| Bond Funds - 45.1% | | | |
| High Yield Bond Funds - 5.0% | | | |
| VIP High Income Portfolio Investor Class (a) | | 298,654 | 1,570,922 |
| Investment Grade Bond Funds - 40.1% | | | |
| VIP Investment Grade Bond Portfolio Investor Class (a) | | 959,198 | 12,507,940 |
| TOTAL BOND FUNDS | | | |
| (Cost $13,911,760) | | | 14,078,862 |
|
| Short-Term Funds - 10.5% | | | |
| VIP Government Money Market Portfolio Investor Class 0.19% (a)(b) | | | |
| (Cost $3,269,537) | | 3,269,537 | 3,269,537 |
| TOTAL INVESTMENT PORTFOLIO - 100.0% | | | |
| (Cost $30,762,486) | | | 31,204,287 |
| NET OTHER ASSETS (LIABILITIES) - 0.0% | | | 3 |
| NET ASSETS - 100% | | | $31,204,290 |
Legend
(a) Affiliated Fund
(b) The rate quoted is the annualized seven-day yield of the fund at period end.
Affiliated Underlying Funds
Information regarding the Fund's fiscal year to date purchases and sales of the affiliated Underlying Funds and income earned by the Fund from investments in affiliated Underlying Funds is as follows:
| Affiliate | Value, beginning of period | Purchases | Sales Proceeds | Dividend Income | Value, end of period |
| VIP Contrafund Portfolio Investor Class | $1,741,532 | $316,221 | $129,340 | $-- | $1,802,140 |
| VIP Emerging Markets Portfolio Investor Class | 722,744 | 81,242 | 75,102 | -- | 777,048 |
| VIP Equity-Income Portfolio Investor Class | 1,836,484 | 254,609 | 175,332 | -- | 1,900,858 |
| VIP Government Money Market Portfolio Investor Class 0.19% | 3,155,418 | 367,912 | 253,793 | 2,242 | 3,269,537 |
| VIP Growth & Income Portfolio Investor Class | 2,072,499 | 356,539 | 198,797 | -- | 2,135,362 |
| VIP Growth Portfolio Investor Class | 1,811,176 | 335,161 | 69,225 | -- | 1,851,275 |
| VIP High Income Portfolio Investor Class | 1,491,216 | 75,232 | 93,771 | -- | 1,570,922 |
| VIP Investment Grade Bond Portfolio Investor Class | 12,114,868 | 777,903 | 1,064,295 | 6,507 | 12,507,940 |
| VIP Mid Cap Portfolio Investor Class | 497,802 | 97,329 | 51,238 | -- | 519,932 |
| VIP Overseas Portfolio Investor Class | 2,933,427 | 258,302 | 154,712 | -- | 2,843,180 |
| VIP Value Portfolio Investor Class | 1,329,719 | 142,536 | 135,541 | -- | 1,363,729 |
| VIP Value Strategies Portfolio Investor Class | 640,635 | 93,559 | 78,530 | -- | 662,364 |
| Total | $30,347,520 | $3,156,545 | $2,479,676 | $8,749 | $31,204,287 |
Investment Valuation
All investments are categorized as Level 1 under the Fair Value Hierarchy. The inputs or methodology used for valuing securities may not be an indication of the risk associated with investing in those securities. For more information on valuation inputs please refer to the Investment Valuation section in the accompanying Notes to Financial Statements.
See accompanying notes which are an integral part of the financial statements.
VIP Freedom Lifetime Income® II Portfolio
Financial Statements
Statement of Assets and Liabilities
| | | June 30, 2016 (Unaudited) |
| Assets | | |
| Investment in securities, at value (cost $30,762,486) — See accompanying schedule | | $31,204,287 |
| Cash | | 2 |
| Receivable for investments sold | | 511 |
| Total assets | | 31,204,800 |
| Liabilities | | |
| Payable for fund shares redeemed | $510 | |
| Total liabilities | | 510 |
| Net Assets | | $31,204,290 |
| Net Assets consist of: | | |
| Paid in capital | | $30,494,067 |
| Undistributed net investment income | | 9,075 |
| Accumulated undistributed net realized gain (loss) on investments | | 259,347 |
| Net unrealized appreciation (depreciation) on investments | | 441,801 |
| Net Assets, for 2,698,737 shares outstanding | | $31,204,290 |
| Net Asset Value, offering price and redemption price per share ($31,204,290 ÷ 2,698,737 shares) | | $11.56 |
See accompanying notes which are an integral part of the financial statements.
Statement of Operations
| | | Six months ended June 30, 2016 (Unaudited) |
| Investment Income | | |
| Income distributions from underlying funds | | $8,749 |
| Expenses | | |
| Independent trustees' fees and expenses | $68 | |
| Total expenses before reductions | 68 | |
| Expense reductions | (68) | – |
| Net investment income (loss) | | 8,749 |
| Realized and Unrealized Gain (Loss) | | |
| Realized gain (loss) on sale of underlying fund shares | (138,896) | |
| Capital gain distributions from underlying funds | 609,719 | |
| Total net realized gain (loss) | | 470,823 |
| Change in net unrealized appreciation (depreciation) on underlying funds | | 318,789 |
| Net gain (loss) | | 789,612 |
| Net increase (decrease) in net assets resulting from operations | | $798,361 |
See accompanying notes which are an integral part of the financial statements.
Statement of Changes in Net Assets
| | Six months ended June 30, 2016 (Unaudited) | Year ended December 31, 2015 |
| Increase (Decrease) in Net Assets | | |
| Operations | | |
| Net investment income (loss) | $8,749 | $616,196 |
| Net realized gain (loss) | 470,823 | 597,435 |
| Change in net unrealized appreciation (depreciation) | 318,789 | (1,300,487) |
| Net increase (decrease) in net assets resulting from operations | 798,361 | (86,856) |
| Distributions to shareholders from net investment income | – | (615,872) |
| Distributions to shareholders from net realized gain | (507,834) | (67,280) |
| Total distributions | (507,834) | (683,152) |
| Share transactions | | |
| Proceeds from sales of shares | 1,256,929 | 3,498,442 |
| Reinvestment of distributions | 507,834 | 683,152 |
| Cost of shares redeemed | (1,198,522) | (2,595,069) |
| Net increase (decrease) in net assets resulting from share transactions | 566,241 | 1,586,525 |
| Total increase (decrease) in net assets | 856,768 | 816,517 |
| Net Assets | | |
| Beginning of period | 30,347,522 | 29,531,005 |
| End of period | $31,204,290 | $30,347,522 |
| Other Information | | |
| Undistributed net investment income end of period | $9,075 | $326 |
| Shares | | |
| Sold | 110,288 | 293,574 |
| Issued in reinvestment of distributions | 47,684 | 59,250 |
| Redeemed | (106,049) | (217,466) |
| Net increase (decrease) | 51,923 | 135,358 |
See accompanying notes which are an integral part of the financial statements.
Financial Highlights — VIP Freedom Lifetime Income II Portfolio
| | Six months ended (Unaudited) June 30, | Years ended December 31, | | | | |
| | 2016 | 2015 | 2014 | 2013 | 2012 | 2011 |
| Selected Per–Share Data | | | | | | |
| Net asset value, beginning of period | $11.47 | $11.76 | $11.43 | $10.36 | $9.55 | $9.79 |
| Income from Investment Operations | | | | | | |
| Net investment income (loss)A | –B | .24 | .23 | .20 | .21 | .23 |
| Net realized and unrealized gain (loss) | .28 | (.27) | .35 | 1.12 | .90 | (.21) |
| Total from investment operations | .28 | (.03) | .58 | 1.32 | 1.11 | .02 |
| Distributions from net investment income | – | (.24) | (.21) | (.21) | (.21) | (.22) |
| Distributions from net realized gain | (.19) | (.03) | (.04) | (.05) | (.09) | (.04) |
| Total distributions | (.19) | (.26)C | (.25) | (.25)D | (.30) | (.26) |
| Net asset value, end of period | $11.56 | $11.47 | $11.76 | $11.43 | $10.36 | $9.55 |
| Total ReturnE,F,G | 2.61% | (.23)% | 5.06% | 12.76% | 11.60% | .25% |
| Ratios to Average Net AssetsH,I | | | | | | |
| Expenses before reductionsJ | -%K | -% | -% | -% | -% | -% |
| Expenses net of fee waivers, if any | -%K | -% | -% | -% | -% | -% |
| Expenses net of all reductions | -%K | -% | -% | -% | -% | -% |
| Net investment income (loss) | .06%K | 2.06% | 1.97% | 1.86% | 2.06% | 2.33% |
| Supplemental Data | | | | | | |
| Net assets, end of period (000 omitted) | $31,204 | $30,348 | $29,531 | $23,071 | $19,722 | $16,594 |
| Portfolio turnover rateH | 16%K | 14% | 9% | 13% | 25% | 12% |
A Calculated based on average shares outstanding during the period.
B Amount represents less than $.005 per share.
C Total distributions of $.26 per share is comprised of distributions from net investment income of $.238 and distributions from net realized gain of $.026 per share.
D Total distributions of $.25 per share is comprised of distributions from net investment income of $.206 and distributions from net realized gain of $.045 per share.
E Total returns for periods of less than one year are not annualized.
F Total returns do not reflect charges attributable to your insurance company's separate account. Inclusion of these charges would reduce the total returns shown.
G Total returns would have been lower if certain expenses had not been reduced during the applicable periods shown.
H Amounts do not include the activity of the Underlying Funds.
I Expense ratios reflect operating expenses of the Fund. Expenses before reductions do not reflect amounts reimbursed by the investment adviser or reductions from expense offset arrangements and do not represent the amount paid by the Fund during periods when reimbursements or reductions occur. Expenses net of fee waivers reflect expenses after reimbursement by the investment adviser but prior to reductions from expense offset arrangements. Expenses net of all reductions represent the net expenses paid by the Fund but do not include expenses of the underlying funds in which the Fund invests.
J Amount represents less than .005%.
K Annualized
See accompanying notes which are an integral part of the financial statements.
VIP Freedom Lifetime Income® III Portfolio
Investment Summary (Unaudited)
The information in the following tables is based on the direct investments of the Fund.
Top Holdings as of June 30, 2016
| | % of fund's net assets | % of fund's net assets 6 months ago |
| VIP Investment Grade Bond Portfolio Investor Class | 27.5 | 26.4 |
| VIP Overseas Portfolio Investor Class | 13.0 | 14.0 |
| VIP Growth & Income Portfolio Investor Class | 9.8 | 9.9 |
| VIP Equity-Income Portfolio Investor Class | 8.7 | 8.8 |
| VIP Growth Portfolio Investor Class | 8.5 | 8.7 |
| VIP Contrafund Portfolio Investor Class | 8.3 | 8.3 |
| VIP High Income Portfolio Investor Class | 7.3 | 7.2 |
| VIP Value Portfolio Investor Class | 6.3 | 6.4 |
| VIP Emerging Markets Portfolio Investor Class | 3.6 | 3.5 |
| VIP Value Strategies Portfolio Investor Class | 3.0 | 3.1 |
| | 96.0 | 96.3 |
Asset Allocation (% of fund's net assets)
| Period end |
| | Domestic Equity Funds | 47.0% |
| | Developed International Equity Funds | 13.0% |
| | Emerging Markets Equity Funds | 3.6% |
| | High Yield Bond Funds | 7.3% |
| | Investment Grade Bond Funds | 27.5% |
| | Short-Term Funds | 1.6% |
| Six months ago |
| | Domestic Equity Funds | 47.6% |
| | Developed International Equity Funds | 14.0% |
| | Emerging Markets Equity Funds | 3.5% |
| | High Yield Bond Funds | 7.2% |
| | Investment Grade Bond Funds | 26.4% |
| | Short-Term Funds | 1.3% |

VIP Freedom Lifetime Income® III Portfolio
Investments June 30, 2016 (Unaudited)
Showing Percentage of Net Assets
| Domestic Equity Funds - 47.0% | | | |
| | | Shares | Value |
| Domestic Equity Funds - 47.0% | | | |
| VIP Contrafund Portfolio Investor Class (a) | | 64,169 | $1,990,522 |
| VIP Equity-Income Portfolio Investor Class (a) | | 104,765 | 2,099,490 |
| VIP Growth & Income Portfolio Investor Class (a) | | 132,339 | 2,358,276 |
| VIP Growth Portfolio Investor Class (a) | | 35,947 | 2,043,594 |
| VIP Mid Cap Portfolio Investor Class (a) | | 18,752 | 574,195 |
| VIP Value Portfolio Investor Class (a) | | 111,075 | 1,506,180 |
| VIP Value Strategies Portfolio Investor Class (a) | | 50,451 | 731,534 |
| TOTAL DOMESTIC EQUITY FUNDS | | | |
| (Cost $11,010,364) | | | 11,303,791 |
|
| International Equity Funds - 16.6% | | | |
| Developed International Equity Funds - 13.0% | | | |
| VIP Overseas Portfolio Investor Class (a) | | 176,859 | 3,139,247 |
| Emerging Markets Equity Funds - 3.6% | | | |
| VIP Emerging Markets Portfolio Investor Class(a) | | 99,711 | 858,513 |
| TOTAL INTERNATIONAL EQUITY FUNDS | | | |
| (Cost $4,204,840) | | | 3,997,760 |
|
| Bond Funds - 34.8% | | | |
| High Yield Bond Funds - 7.3% | | | |
| VIP High Income Portfolio Investor Class (a) | | 332,961 | 1,751,376 |
| Investment Grade Bond Funds - 27.5% | | | |
| VIP Investment Grade Bond Portfolio Investor Class (a) | | 506,831 | 6,609,071 |
| TOTAL BOND FUNDS | | | |
| (Cost $8,326,748) | | | 8,360,447 |
|
| Short-Term Funds - 1.6% | | | |
| VIP Government Money Market Portfolio Investor Class 0.19% (a)(b) | | | |
| (Cost $395,472) | | 395,472 | 395,472 |
| TOTAL INVESTMENT PORTFOLIO - 100.0% | | | |
| (Cost $23,937,424) | | | 24,057,470 |
| NET OTHER ASSETS (LIABILITIES) - 0.0% | | | 1 |
| NET ASSETS - 100% | | | $24,057,471 |
Legend
(a) Affiliated Fund
(b) The rate quoted is the annualized seven-day yield of the fund at period end.
Affiliated Underlying Funds
Information regarding the Fund's fiscal year to date purchases and sales of the affiliated Underlying Funds and income earned by the Fund from investments in affiliated Underlying Funds is as follows:
| Affiliate | Value, beginning of period | Purchases | Sales Proceeds | Dividend Income | Value, end of period |
| VIP Contrafund Portfolio Investor Class | $1,766,556 | $445,877 | $104,017 | $-- | $1,990,522 |
| VIP Emerging Markets Portfolio Investor Class | 734,136 | 135,129 | 65,872 | -- | 858,513 |
| VIP Equity-Income Portfolio Investor Class | 1,864,411 | 388,992 | 150,217 | -- | 2,099,490 |
| VIP Government Money Market Portfolio Investor Class 0.19% | 279,914 | 125,509 | 9,944 | 247 | 395,472 |
| VIP Growth & Income Portfolio Investor Class | 2,102,822 | 512,149 | 170,909 | -- | 2,358,276 |
| VIP Growth Portfolio Investor Class | 1,837,663 | 479,444 | 53,562 | -- | 2,043,594 |
| VIP High Income Portfolio Investor Class | 1,520,831 | 244,948 | 124,122 | -- | 1,751,376 |
| VIP Investment Grade Bond Portfolio Investor Class | 5,590,216 | 1,167,729 | 492,855 | 3,033 | 6,609,071 |
| VIP Mid Cap Portfolio Investor Class | 505,543 | 134,933 | 44,769 | -- | 574,195 |
| VIP Overseas Portfolio Investor Class | 2,977,503 | 471,487 | 113,889 | -- | 3,139,247 |
| VIP Value Portfolio Investor Class | 1,349,315 | 241,868 | 118,399 | -- | 1,506,180 |
| VIP Value Strategies Portfolio Investor Class | 650,916 | 141,860 | 71,567 | -- | 731,534 |
| Total | $21,179,826 | $4,489,925 | $1,520,122 | $3,280 | $24,057,470 |
Investment Valuation
All investments are categorized as Level 1 under the Fair Value Hierarchy. The inputs or methodology used for valuing securities may not be an indication of the risk associated with investing in those securities. For more information on valuation inputs please refer to the Investment Valuation section in the accompanying Notes to Financial Statements.
See accompanying notes which are an integral part of the financial statements.
VIP Freedom Lifetime Income® III Portfolio
Financial Statements
Statement of Assets and Liabilities
| | | June 30, 2016 (Unaudited) |
| Assets | | |
| Investment in securities, at value (cost $23,937,424) — See accompanying schedule | | $24,057,470 |
| Cash | | 1 |
| Receivable for investments sold | | 393 |
| Total assets | | 24,057,864 |
| Liabilities | | |
| Payable for fund shares redeemed | $393 | |
| Total liabilities | | 393 |
| Net Assets | | $24,057,471 |
| Net Assets consist of: | | |
| Paid in capital | | $23,568,905 |
| Undistributed net investment income | | 3,280 |
| Accumulated undistributed net realized gain (loss) on investments | | 365,240 |
| Net unrealized appreciation (depreciation) on investments | | 120,046 |
| Net Assets, for 2,099,669 shares outstanding | | $24,057,471 |
| Net Asset Value, offering price and redemption price per share ($24,057,471 ÷ 2,099,669 shares) | | $11.46 |
See accompanying notes which are an integral part of the financial statements.
Statement of Operations
| | | Six months ended June 30, 2016 (Unaudited) |
| Investment Income | | |
| Income distributions from underlying funds | | $3,280 |
| Expenses | | |
| Independent trustees' fees and expenses | $49 | |
| Total expenses before reductions | 49 | |
| Expense reductions | (49) | – |
| Net investment income (loss) | | 3,280 |
| Realized and Unrealized Gain (Loss) | | |
| Realized gain (loss) on sale of underlying fund shares | (96,747) | |
| Capital gain distributions from underlying funds | 609,569 | |
| Total net realized gain (loss) | | 512,822 |
| Change in net unrealized appreciation (depreciation) on underlying funds | | 4,582 |
| Net gain (loss) | | 517,404 |
| Net increase (decrease) in net assets resulting from operations | | $520,684 |
See accompanying notes which are an integral part of the financial statements.
Statement of Changes in Net Assets
| | Six months ended June 30, 2016 (Unaudited) | Year ended December 31, 2015 |
| Increase (Decrease) in Net Assets | | |
| Operations | | |
| Net investment income (loss) | $3,280 | $432,308 |
| Net realized gain (loss) | 512,822 | 634,303 |
| Change in net unrealized appreciation (depreciation) | 4,582 | (1,097,228) |
| Net increase (decrease) in net assets resulting from operations | 520,684 | (30,617) |
| Distributions to shareholders from net investment income | – | (433,328) |
| Distributions to shareholders from net realized gain | (601,352) | (80,775) |
| Total distributions | (601,352) | (514,103) |
| Share transactions | | |
| Proceeds from sales of shares | 3,003,577 | 5,690,316 |
| Reinvestment of distributions | 601,352 | 514,103 |
| Cost of shares redeemed | (646,616) | (1,516,869) |
| Net increase (decrease) in net assets resulting from share transactions | 2,958,313 | 4,687,550 |
| Total increase (decrease) in net assets | 2,877,645 | 4,142,830 |
| Net Assets | | |
| Beginning of period | 21,179,826 | 17,036,996 |
| End of period | $24,057,471 | $21,179,826 |
| Other Information | | |
| Undistributed net investment income end of period | $3,280 | $– |
| Shares | | |
| Sold | 271,852 | 478,113 |
| Issued in reinvestment of distributions | 58,102 | 43,907 |
| Redeemed | (57,266) | (125,385) |
| Net increase (decrease) | 272,688 | 396,635 |
See accompanying notes which are an integral part of the financial statements.
Financial Highlights — VIP Freedom Lifetime Income III Portfolio
| | Six months ended (Unaudited) June 30, | Years ended December 31, | | | | |
| | 2016 | 2015 | 2014 | 2013 | 2012 | 2011 |
| Selected Per–Share Data | | | | | | |
| Net asset value, beginning of period | $11.59 | $11.91 | $11.74 | $9.99 | $8.92 | $9.37 |
| Income from Investment Operations | | | | | | |
| Net investment income (loss)A | –B | .27 | .25 | .23 | .23 | .20 |
| Net realized and unrealized gain (loss) | .20 | (.30) | .37 | 1.81 | 1.12 | (.42) |
| Total from investment operations | .20 | (.03) | .62 | 2.04 | 1.35 | (.22) |
| Distributions from net investment income | – | (.24) | (.22) | (.20) | (.22) | (.20) |
| Distributions from net realized gain | (.33) | (.05) | (.23) | (.09) | (.07) | (.03) |
| Total distributions | (.33) | (.29) | (.45) | (.29) | (.28)C | (.23) |
| Net asset value, end of period | $11.46 | $11.59 | $11.91 | $11.74 | $9.99 | $8.92 |
| Total ReturnD,E,F | 1.98% | (.27)% | 5.30% | 20.43% | 15.20% | (2.36)% |
| Ratios to Average Net AssetsG,H | | | | | | |
| Expenses before reductionsI | -%J | -% | -% | -% | -% | -% |
| Expenses net of fee waivers, if any | -%J | -% | -% | -% | -% | -% |
| Expenses net of all reductions | -%J | -% | -% | -% | -% | -% |
| Net investment income (loss) | .03%J | 2.23% | 2.07% | 2.07% | 2.34% | 2.13% |
| Supplemental Data | | | | | | |
| Net assets, end of period (000 omitted) | $24,057 | $21,180 | $17,037 | $12,661 | $8,319 | $6,824 |
| Portfolio turnover rateG | 14%J | 12% | 18% | 19% | 20% | 16% |
A Calculated based on average shares outstanding during the period.
B Amount represents less than $.005 per share.
C Total distributions of $.28 per share is comprised of distributions from net investment income of $.218 and distributions from net realized gain of $.065 per share.
D Total returns for periods of less than one year are not annualized.
E Total returns do not reflect charges attributable to your insurance company's separate account. Inclusion of these charges would reduce the total returns shown.
F Total returns would have been lower if certain expenses had not been reduced during the applicable periods shown.
G Amounts do not include the activity of the Underlying Funds.
H Expense ratios reflect operating expenses of the Fund. Expenses before reductions do not reflect amounts reimbursed by the investment adviser or reductions from expense offset arrangements and do not represent the amount paid by the Fund during periods when reimbursements or reductions occur. Expenses net of fee waivers reflect expenses after reimbursement by the investment adviser but prior to reductions from expense offset arrangements. Expenses net of all reductions represent the net expenses paid by the Fund but do not include expenses of the underlying funds in which the Fund invests.
I Amount represents less than .005%.
J Annualized
See accompanying notes which are an integral part of the financial statements.
Notes to Financial Statements (Unaudited)
For the period ended June 30, 2016
1. Organization.
VIP Freedom Lifetime Income I Portfolio, VIP Freedom Lifetime Income II Portfolio, and VIP Freedom Lifetime Income III Portfolio (the Funds) are funds of Variable Insurance Products Fund V (the Trust). The Trust is registered under the Investment Company Act of 1940, as amended (the 1940 Act), as an open-end management investment company organized as a Massachusetts business trust. Each Fund is authorized to issue an unlimited number of shares. The Funds invest primarily in a combination of other VIP equity, bond, and short-term funds (the Underlying Funds) managed by Fidelity Management & Research Company (FMR). Shares of each Fund may only be purchased by insurance companies for the purpose of funding variable annuity or variable life insurance contracts.
2. Significant Accounting Policies.
The financial statements have been prepared in conformity with accounting principles generally accepted in the United States of America (GAAP), which require management to make certain estimates and assumptions at the date of the financial statements. Actual results could differ from those estimates. Subsequent events, if any, through the date that the financial statements were issued have been evaluated in the preparation of the financial statements. The following summarizes the significant accounting policies of the Funds:
Investment Valuation. Investments are valued as of 4:00 p.m. Eastern time on the last calendar day of the period. Each Fund categorizes the inputs to valuation techniques used to value its investments into a disclosure hierarchy consisting of three levels as shown below:
- Level 1 – quoted prices in active markets for identical investments
- Level 2 – other significant observable inputs (including quoted prices for similar investments, interest rates, prepayment speeds, etc.)
- Level 3 – unobservable inputs (including the Fund's own assumptions based on the best information available)
Valuation techniques used to value each Fund's investments by major category are as follows. Investments in the Underlying Fund are valued at their closing net asset value (NAV) each business day and are categorized as Level 1 in the hierarchy.
Investment Transactions and Income. For financial reporting purposes, the Funds' investment holdings and NAV include trades executed through the end of the last business day of the period. The NAV per share for processing shareholder transactions is calculated as of the close of business of the New York Stock Exchange (NYSE), normally 4:00 p.m. Eastern time and includes trades executed through the end of the prior business day. Gains and losses on securities sold are determined on the basis of identified cost. Income and capital gain distributions from the Underlying Funds, if any, are recorded on the ex-dividend date.
Expenses. Expenses directly attributable to a fund are charged to that fund. Expenses attributable to more than one fund are allocated among the respective funds on the basis of relative net assets or other appropriate methods. Expenses included in the accompanying financial statements reflect the expenses of each Fund and do not include any expenses associated with the Underlying Funds. Although not included in each Fund's expenses, each Fund indirectly bears its proportionate share of the Underlying Funds' expenses through the impact of these expenses on each Underlying Fund's NAV. Expense estimates are accrued in the period to which they relate and adjustments are made when actual amounts are known.
Income Tax Information and Distributions to Shareholders. Each year, each Fund intends to qualify as a regulated investment company under Subchapter M of the Internal Revenue Code, including distributing substantially all of its taxable income and realized gains. As a result, no provision for U.S. Federal income taxes is required. Each Fund files a U.S. federal tax return, in addition to state and local tax returns as required. Each Fund's federal income tax returns are subject to examination by the Internal Revenue Service (IRS) for a period of three fiscal years after they are filed. State and local tax returns may be subject to examination for an additional fiscal year depending on the jurisdiction.
Distributions are declared and recorded on the ex-dividend date. Income and capital gain distributions are determined in accordance with income tax regulations, which may differ from GAAP.
Capital accounts within the financial statements are adjusted for permanent book-tax differences. These adjustments have no impact on net assets or the results of operations. Capital accounts are not adjusted for temporary book-tax differences which will reverse in a subsequent period.
Book-tax differences are primarily due to short-term gain distributions from the Underlying Funds, capital loss carryforwards and losses deferred due to wash sales.
The federal tax cost of investment securities and unrealized appreciation (depreciation) as of period end were as follows for each Fund:
| | Tax cost | Gross unrealized appreciation | Gross unrealized depreciation | Net unrealized appreciation (depreciation) on securities |
| VIP Freedom Lifetime Income I | $13,932,917 | $590,484 | $(318,422) | $272,062 |
| VIP Freedom Lifetime Income II | 30,953,407 | 1,438,572 | (1,187,692) | 250,880 |
| VIP Freedom Lifetime Income III | 24,173,108 | 1,133,392 | (1,249,030) | (115,638) |
3. Purchases and Redemptions of Underlying Fund Shares.
Purchases and redemptions of the Underlying Fund shares are noted in the table below.
| | Purchases ($) | Redemptions ($) |
| VIP Freedom Lifetime Income I | 1,313,078 | 1,081,453 |
| VIP Freedom Lifetime Income II | 3,156,545 | 2,479,676 |
| VIP Freedom Lifetime Income III | 4,489,925 | 1,520,122 |
4. Fees and Other Transactions with Affiliates.
Management Fee. FMR Co., Inc. (the investment adviser), an affiliate of FMR, provides the Funds with investment management related services. The Funds do not pay any fees for these services.
Other Transactions. The investment adviser has entered into an administration agreement with FMR under which FMR provides management and administrative services (other than investment advisory services) necessary for the operation of each Fund. Pursuant to this agreement, FMR pays all expenses of each Fund, excluding, compensation of the independent Trustees and certain other expenses such as interest expense. FMR also contracts with other Fidelity companies to perform the services necessary for the operation of each Fund. The Funds do not pay any fees for these services.
5. Expense Reductions.
FMR voluntarily agreed to reimburse each Fund to the extent annual operating expenses exceeded certain levels of average net assets as noted in the table below. Some expenses, for example interest expense, are excluded from this reimbursement.
The following Funds were in reimbursement during the period:
| | Expense Limitations | Reimbursement |
| VIP Freedom Lifetime Income I | -% | $31 |
| VIP Freedom Lifetime Income II | -% | $68 |
| VIP Freedom Lifetime Income III | -% | $49 |
6. Other.
The Funds' organizational documents provide former and current trustees and officers with a limited indemnification against liabilities arising in connection with the performance of their duties to the Funds. In the normal course of business, the Funds may also enter into contracts that provide general indemnifications. The Funds' maximum exposure under these arrangements is unknown as this would be dependent on future claims that may be made against the Funds. The risk of material loss from such claims is considered remote.
At the end of the period, the investment adviser or its affiliates were the owners of record of all of the outstanding shares of the Funds.
Shareholder Expense Example
As a shareholder of the Fund, you incur two types of costs: (1) transaction costs, and (2) ongoing costs, including other Fund expenses. This Example is intended to help you understand your ongoing costs (in dollars) of investing in the Fund and to compare these costs with the ongoing costs of investing in other mutual funds.
The Example is based on an investment of $1,000 invested at the beginning of the period and held for the entire period (January 1, 2016 to June 30, 2016).
Actual Expenses
The first line of the accompanying table for each fund provides information about actual account values and actual expenses. You may use the information in this line, together with the amount you invested, to estimate the expenses that you paid over the period. Simply divide your account value by $1,000.00 (for example, an $8,600 account value divided by $1,000.00 = 8.6), then multiply the result by the number in the first line for a fund under the heading entitled "Expenses Paid During Period" to estimate the expenses you paid on your account during this period. The estimate of expenses does not include any fees or other expenses of any variable annuity or variable life insurance product. If they were, the estimate of expenses you paid during the period would be higher, and your ending account value would be lower. In addition, each Fund, as a shareholder in underlying Fidelity Funds, will indirectly bear its pro-rata share of the fees and expenses incurred by the underlying Fidelity Funds. These fees and expenses are not included in each Fund's annualized expense ratio used to calculate the expense estimates in the table below.
Hypothetical Example for Comparison Purposes
The second line of the accompanying table for each fund provides information about hypothetical account values and hypothetical expenses based on a fund's actual expense ratio and an assumed rate of return of 5% per year before expenses, which is not the Fund's actual return. The hypothetical account values and expenses may not be used to estimate the actual ending account balance or expenses you paid for the period. You may use this information to compare the ongoing costs of investing in the Fund and other funds. To do so, compare this 5% hypothetical example with the 5% hypothetical examples that appear in the shareholder reports of the other funds. The estimate of expenses does not include any fees or other expenses of any variable annuity or variable life insurance product. If they were, the estimate of expenses you paid during the period would be higher, and your ending account value would be lower. In addition, each Fund, as a shareholder in underlying Fidelity Funds, will indirectly bear its pro-rata share of the fees and expenses incurred by the underlying Fidelity Funds. These fees and expenses are not included in each Fund's annualized expense ratio used to calculate the expense estimates in the table below.
Please note that the expenses shown in the table are meant to highlight your ongoing costs only and do not reflect any transaction costs. Therefore, the second line of the table is useful in comparing ongoing costs only, and will not help you determine the relative total costs of owning different funds.
| | Annualized Expense Ratio-A | Beginning
Account Value
January 1, 2016 | Ending
Account Value
June 30, 2016 | Expenses Paid
During Period-B
January 1, 2016
to June 30, 2016 |
| VIP Freedom Lifetime Income I | - % | | | |
| Actual | | $1,000.00 | $1,036.20 | $- |
| Hypothetical-C | | $1,000.00 | $1,024.86 | $- |
| VIP Freedom Lifetime Income II | - % | | | |
| Actual | | $1,000.00 | $1,026.10 | $- |
| Hypothetical-C | | $1,000.00 | $1,024.86 | $- |
| VIP Freedom Lifetime Income III | - % | | | |
| Actual | | $1,000.00 | $1,019.80 | $- |
| Hypothetical-C | | $1,000.00 | $1,024.86 | $- |
A Annualized expense ratio reflects expenses net of applicable fee waivers.
B Expenses are equal to each Fund's annualized expense ratio, multiplied by the average account value over the period, multiplied by 182/366 (to reflect the one-half year period). The fees and expenses of the underlying Fidelity Funds in which each Fund invests are not included in each Fund's annualized expense ratio.
C 5% return per year before expenses
VIPFLI-SANN-0816
1.816202.110
Fidelity® Variable Insurance Products: Target Volatility Portfolio
Semi-Annual Report June 30, 2016 |
|
Contents
To view a fund's proxy voting guidelines and proxy voting record for the 12-month period ended June 30, visit http://www.fidelity.com/proxyvotingresults or visit the Securities and Exchange Commission's (SEC) web site at http://www.sec.gov.
You may also call 1-877-208-0098 to request a free copy of the proxy voting guidelines.
Fidelity® Variable Insurance Products are separate account options which are purchased through a variable insurance contract.
Standard & Poor's, S&P and S&P 500 are registered service marks of The McGraw-Hill Companies, Inc. and have been licensed for use by Fidelity Distributors Corporation.
Other third-party marks appearing herein are the property of their respective owners.
All other marks appearing herein are registered or unregistered trademarks or service marks of FMR LLC or an affiliated company. © 2016 FMR LLC. All rights reserved.
This report and the financial statements contained herein are submitted for the general information of the shareholders of the Fund. This report is not authorized for distribution to prospective investors in the Fund unless preceded or accompanied by an effective prospectus.
A fund files its complete schedule of portfolio holdings with the SEC for the first and third quarters of each fiscal year on Form N-Q. Forms N-Q are available on the SEC’s web site at http://www.sec.gov. A fund's Forms N-Q may be reviewed and copied at the SEC’s Public Reference Room in Washington, DC. Information regarding the operation of the SEC's Public Reference Room may be obtained by calling 1-800-SEC-0330.
For a complete list of a fund's portfolio holdings, view the most recent holdings listing, semiannual report, or annual report on Fidelity's web site at http://www.fidelity.com, http://www.institutional.fidelity.com, or http://www.401k.com, as applicable.
NOT FDIC INSURED •MAY LOSE VALUE •NO BANK GUARANTEE
Neither the Fund nor Fidelity Distributors Corporation is a bank.
Investment Summary (Unaudited)
The information in the following tables is based on the direct investments of the Fund.
Top Holdings as of June 30, 2016
| | % of fund's net assets | % of fund's net assets 6 months ago |
| Fidelity U.S. Bond Index Fund Institutional Class | 12.6 | 0.0 |
| Fidelity Total Bond Fund | 11.5 | 17.9 |
| Fidelity Overseas Fund | 7.3 | 10.0 |
| Fidelity Technology Portfolio | 4.3 | 4.6 |
| Fidelity Consumer Staples Portfolio | 3.4 | 2.9 |
| Fidelity Inflation-Protected Bond Fund | 2.8 | 2.7 |
| Fidelity Consumer Discretionary Portfolio | 2.7 | 2.3 |
| Fidelity Medical Equipment and Systems Portfolio | 2.5 | 1.3 |
| Fidelity Floating Rate High Income Fund | 2.4 | 0.0 |
| Fidelity International Small Cap Opportunities Fund | 2.3 | 2.1 |
| | 51.8 | |
Asset Allocation (% of fund's investments)
| As of June 30, 2016* |
| | Domestic Equity Funds | 41.9% |
| | International Equity Funds | 16.5% |
| | Fixed-Income Funds | 35.9% |
| | Net Other Assets (Liabilities) | 5.7% |
* Futures - 0.0%
| As of December 31, 2015* |
| | Domestic Equity Funds | 44.5% |
| | International Equity Funds | 19.1% |
| | Fixed-Income Funds | 33.0% |
| | Short-Term Investments | 0.1% |
| | Net Other Assets (Liabilities) | 3.3% |

* Futures - 2.0%
Percentages shown as 0.0% may reflect amounts less than 0.05%.
Investments June 30, 2016 (Unaudited)
Showing Percentage of Net Assets
| Equity Funds - 58.4% | | | |
| | | Shares | Value |
| Domestic Equity Funds - 41.9% | | | |
| Energy Select Sector SPDR ETF | | 5,176 | $353,210 |
| Fidelity Banking Portfolio (a) | | 114,429 | 2,700,535 |
| Fidelity Blue Chip Growth Fund (a) | | 8,297 | 540,800 |
| Fidelity Blue Chip Value Fund (a) | | 95,670 | 1,490,539 |
| Fidelity Chemicals Portfolio (a) | | 15,706 | 2,179,036 |
| Fidelity Construction and Housing Portfolio (a) | | 18,306 | 1,093,024 |
| Fidelity Consumer Discretionary Portfolio (a) | | 182,216 | 6,211,749 |
| Fidelity Consumer Staples Portfolio (a) | | 79,669 | 7,854,526 |
| Fidelity Contrafund (a) | | 441 | 42,803 |
| Fidelity Defense and Aerospace Portfolio (a) | | 21,651 | 2,580,162 |
| Fidelity Electronics Portfolio (a) | | 26,984 | 2,042,659 |
| Fidelity Energy Portfolio (a) | | 96,019 | 3,919,502 |
| Fidelity Equity Dividend Income Fund (a) | | 206,305 | 5,355,670 |
| Fidelity Financial Services Portfolio (a) | | 1,578 | 129,012 |
| Fidelity Global Commodity Stock Fund (a) | | 10,502 | 107,438 |
| Fidelity Health Care Portfolio (a) | | 3,747 | 721,572 |
| Fidelity Health Care Services Portfolio (a) | | 27,180 | 2,340,747 |
| Fidelity Industrial Equipment Portfolio (a) | | 30,450 | 1,164,413 |
| Fidelity Industrials Portfolio (a) | | 140,961 | 4,283,819 |
| Fidelity Insurance Portfolio (a) | | 43,206 | 2,945,781 |
| Fidelity IT Services Portfolio (a) | | 19,263 | 754,148 |
| Fidelity Low-Priced Stock Fund (a) | | 22,294 | 1,068,331 |
| Fidelity Materials Portfolio (a) | | 2,950 | 206,378 |
| Fidelity Medical Equipment and Systems Portfolio (a) | | 142,195 | 5,687,809 |
| Fidelity Mid Cap Value Fund (a) | | 10 | 224 |
| Fidelity OTC Portfolio (a) | | 7,064 | 550,068 |
| Fidelity Real Estate Investment Portfolio (a) | | 40,296 | 1,831,868 |
| Fidelity Retailing Portfolio (a) | | 21,570 | 2,269,587 |
| Fidelity Series Commodity Strategy Fund(a)(b) | | 20,105 | 110,979 |
| Fidelity Small Cap Stock Fund (a) | | 26,786 | 462,053 |
| Fidelity Software and IT Services Portfolio (a) | | 35,957 | 4,347,548 |
| Fidelity Stock Selector Large Cap Value Fund (a) | | 175,481 | 3,018,270 |
| Fidelity Technology Portfolio (a) | | 84,103 | 9,839,202 |
| Fidelity Telecom and Utilities Fund (a) | | 9,243 | 242,167 |
| Fidelity Telecommunications Portfolio (a) | | 55,429 | 3,912,751 |
| Fidelity Utilities Portfolio (a) | | 28,921 | 2,248,859 |
| Fidelity Value Discovery Fund (a) | | 18,588 | 433,291 |
| iShares Dow Jones U.S. Technology Sector Index ETF | | 1,683 | 177,186 |
| KBW Regional Banking ETF | | 114,989 | 4,409,828 |
| PowerShares DB Commodity Index Tracking ETF (b) | | 44,698 | 686,114 |
| Vanguard Health Care ETF | | 2,575 | 336,012 |
| Vanguard Industrials ETF | | 7,223 | 767,588 |
| Vanguard Materials ETF | | 4,437 | 454,482 |
| Vanguard Telecommunication Services ETF | | 6,022 | 592,565 |
| Vanguard Utilities ETF | | 1,380 | 158,010 |
| Vanguard Value ETF | | 36,348 | 3,089,217 |
|
| TOTAL DOMESTIC EQUITY FUNDS | | | 95,711,532 |
|
| International Equity Funds - 16.5% | | | |
| Fidelity Emerging Markets Fund (a) | | 451 | 10,440 |
| Fidelity Europe Fund (a) | | 24,887 | 841,935 |
| Fidelity International Capital Appreciation Fund (a) | | 97,725 | 1,649,606 |
| Fidelity International Discovery Fund (a) | | 13,299 | 491,395 |
| Fidelity International Small Cap Fund (a) | | 117,385 | 2,669,335 |
| Fidelity International Small Cap Opportunities Fund (a) | | 372,424 | 5,396,417 |
| Fidelity Japan Smaller Companies Fund (a) | | 135,559 | 2,003,558 |
| Fidelity Nordic Fund (a) | | 30,691 | 1,417,315 |
| Fidelity Overseas Fund (a) | | 422,237 | 16,686,812 |
| iShares MSCI EAFE Index ETF | | 39,778 | 2,220,010 |
| Vanguard Emerging Markets ETF | | 58,589 | 2,063,505 |
| WisdomTree Europe Hedged Equity ETF | | 36,650 | 1,851,925 |
| WisdomTree Japan Hedged Equity ETF | | 11,344 | 439,920 |
|
| TOTAL INTERNATIONAL EQUITY FUNDS | | | 37,742,173 |
|
| TOTAL EQUITY FUNDS | | | |
| (Cost $133,246,964) | | | 133,453,705 |
|
| Fixed-Income Funds - 35.9% | | | |
| Fidelity Corporate Bond Fund (a) | | 245,512 | 2,828,296 |
| Fidelity Floating Rate High Income Fund (a) | | 588,693 | 5,504,283 |
| Fidelity High Income Fund (a) | | 28,595 | 237,907 |
| Fidelity Inflation-Protected Bond Fund (a) | | 516,153 | 6,364,167 |
| Fidelity Inflation-Protected Bond Index Fund Institutional Class (a) | | 290,756 | 2,898,839 |
| Fidelity Long-Term Treasury Bond Index Fund Premium Class (a) | | 328,852 | 4,788,092 |
| Fidelity New Markets Income Fund (a) | | 33,182 | 524,275 |
| Fidelity Real Estate Income Fund (a) | | 40,496 | 484,734 |
| Fidelity Total Bond Fund (a) | | 2,435,080 | 26,152,758 |
| Fidelity U.S. Bond Index Fund Institutional Class (a) | | 2,414,305 | 28,875,087 |
| iShares JPMorgan USD Emerging Markets Bond ETF | | 4,199 | 483,515 |
| SPDR Lehman High Yield Bond ETF | | 84,639 | 3,021,612 |
| TOTAL FIXED-INCOME FUNDS | | | |
| (Cost $80,617,228) | | | 82,163,565 |
| | | Principal Amount | Value |
|
| U.S. Treasury Obligations - 0.0% | | | |
| U.S. Treasury Bills, yield at date of purchase 0.28% 9/15/16 (c) | | | |
| (Cost $9,994) | | 10,000 | 9,995 |
| TOTAL INVESTMENT PORTFOLIO - 94.3% | | | |
| (Cost $213,874,186) | | | 215,627,265 |
| NET OTHER ASSETS (LIABILITIES) - 5.7% | | | 13,027,278 |
| NET ASSETS - 100% | | | $228,654,543 |
| Futures Contracts | | | |
| | Expiration Date | Underlying Face Amount at Value | Unrealized Appreciation/(Depreciation) |
| Purchased | | | |
| Equity Index Contracts | | | |
| 1 CME E-mini S&P 500 Index Contracts (United States) | Sept. 2016 | 104,510 | $(950) |
The face value of futures purchased as a percentage of Net Assets is 0%
Security Type Abbreviations
ETF – Exchange-Traded Fund
Legend
(a) Affiliated Fund
(b) Non-income producing
(c) Security or a portion of the security was pledged to cover margin requirements for futures contracts. At period end, the value of securities pledged amounted to $9,995.
Affiliated Underlying Funds
Information regarding the Fund's fiscal year to date purchases and sales of the affiliated Underlying Funds and income earned by the Fund from investments in affiliated Underlying Funds is as follows:
| Affiliate | Value, beginning of period | Purchases | Sales Proceeds | Dividend Income | Value, end of period |
| Fidelity Air Transportation Portfolio | $68,092 | $-- | $68,660 | $-- | $-- |
| Fidelity Banking Portfolio | 2,784,888 | 374,316 | 201,431 | -- | 2,700,535 |
| Fidelity Blue Chip Growth Fund | 8,899,173 | 57,922 | 7,568,339 | -- | 540,800 |
| Fidelity Blue Chip Value Fund | 5,817,657 | 99,199 | 4,359,617 | -- | 1,490,539 |
| Fidelity Chemicals Portfolio | 1,236,411 | 1,343,188 | 505,836 | -- | 2,179,036 |
| Fidelity Construction and Housing Portfolio | 864,046 | 438,042 | 199,157 | -- | 1,093,024 |
| Fidelity Consumer Discretionary Portfolio | 4,893,218 | 1,385,920 | 85,172 | 6,149 | 6,211,749 |
| Fidelity Consumer Staples Portfolio | 6,189,852 | 2,573,159 | 1,484,126 | 11,380 | 7,854,526 |
| Fidelity Contrafund | 4,986,532 | 2,077,347 | 6,885,868 | 668 | 42,803 |
| Fidelity Corporate Bond Fund | 10,849,255 | 116,501 | 8,208,813 | 79,753 | 2,828,296 |
| Fidelity Defense and Aerospace Portfolio | 2,777,934 | 63,608 | 350,000 | 5,375 | 2,580,162 |
| Fidelity Diversified International Fund | 669,702 | -- | 618,464 | -- | -- |
| Fidelity Electronics Portfolio | 477,825 | 1,562,381 | -- | 612 | 2,042,659 |
| Fidelity Emerging Asia Fund | 434,189 | -- | 393,967 | -- | -- |
| Fidelity Emerging Markets Fund | -- | 10,137 | -- | -- | 10,440 |
| Fidelity Energy Portfolio | 3,053,811 | 600,265 | 268,755 | 3,649 | 3,919,502 |
| Fidelity Energy Service Portfolio | 42,788 | -- | 39,076 | -- | -- |
| Fidelity Equity Dividend Income Fund | -- | 5,043,511 | -- | 12,529 | 5,355,670 |
| Fidelity Europe Fund | 5,179,160 | -- | 3,867,738 | -- | 841,935 |
| Fidelity Financial Services Portfolio | 1,356,675 | -- | 1,066,227 | -- | 129,012 |
| Fidelity Floating Rate High Income Fund | -- | 5,505,145 | -- | 27,450 | 5,504,283 |
| Fidelity Global Commodity Stock Fund | -- | 101,503 | -- | -- | 107,438 |
| Fidelity Health Care Portfolio | 2,181,221 | 925,352 | 2,062,336 | -- | 721,572 |
| Fidelity Health Care Services Portfolio | 2,241,999 | 50,250 | -- | -- | 2,340,747 |
| Fidelity High Income Fund | 220,912 | 6,516 | -- | 6,516 | 237,907 |
| Fidelity Industrial Equipment Portfolio | 534,971 | 589,606 | -- | -- | 1,164,413 |
| Fidelity Industrials Portfolio | 4,078,221 | 1,262,730 | 1,120,657 | -- | 4,283,819 |
| Fidelity Inflation-Protected Bond Fund | 5,728,383 | 968,775 | 688,096 | 5,385 | 6,364,167 |
| Fidelity Inflation-Protected Bond Index Fund Institutional Class | -- | 99 | 1,591,559 | 90 | 2,898,839 |
| Fidelity Inflation-Protected Bond Index Fund Investor Class | 6,379,763 | 14,303 | 2,254,978 | 20 | -- |
| Fidelity Insurance Portfolio | 2,242,763 | 672,276 | -- | 5,484 | 2,945,781 |
| Fidelity International Capital Appreciation Fund | -- | 1,629,483 | -- | -- | 1,649,606 |
| Fidelity International Discovery Fund | 447,051 | 500,331 | 420,651 | -- | 491,395 |
| Fidelity International Index Fund Investor Class | 826,554 | 516 | 750,109 | 516 | -- |
| Fidelity International Small Cap Fund | 1,001,835 | 1,584,543 | -- | -- | 2,669,335 |
| Fidelity International Small Cap Opportunities Fund | 4,451,820 | 1,101,155 | -- | -- | 5,396,417 |
| Fidelity IT Services Portfolio | 987,894 | 864,861 | 1,140,730 | -- | 754,148 |
| Fidelity Japan Fund | 1,492,678 | -- | 1,342,865 | -- | -- |
| Fidelity Japan Smaller Companies Fund | 1,420,678 | 438,747 | -- | -- | 2,003,558 |
| Fidelity Long-Term Treasury Bond Index Fund Investor Class | 4,201,487 | 483,416 | 505,849 | 55,394 | -- |
| Fidelity Long-Term Treasury Bond Index Fund Premium Class | -- | 25,247 | 12,334 | 3,203 | 4,788,092 |
| Fidelity Low-Priced Stock Fund | 2,808,217 | 647,783 | 2,321,658 | -- | 1,068,331 |
| Fidelity Materials Portfolio | 600,264 | 201,826 | 535,163 | -- | 206,378 |
| Fidelity Medical Equipment and Systems Portfolio | 2,802,374 | 2,257,039 | -- | -- | 5,687,809 |
| Fidelity Mega Cap Stock Fund | 5,131 | -- | 4,872 | -- | -- |
| Fidelity Mid Cap Value Fund | 1,979,419 | -- | 1,863,414 | -- | 224 |
| Fidelity New Markets Income Fund | 559,927 | 37,443 | 111,422 | 14,204 | 524,275 |
| Fidelity Nordic Fund | -- | 1,409,783 | -- | -- | 1,417,315 |
| Fidelity OTC Portfolio | -- | 567,381 | -- | -- | 550,068 |
| Fidelity Overseas Fund | 21,196,546 | 1,715,867 | 5,341,311 | -- | 16,686,812 |
| Fidelity Pharmaceuticals Portfolio | 1,885,975 | 24,234 | 1,699,930 | -- | -- |
| Fidelity Real Estate Income Fund | 448,668 | 6,724 | -- | 6,724 | 484,734 |
| Fidelity Real Estate Investment Portfolio | 996,749 | 655,423 | 14,226 | 7,592 | 1,831,868 |
| Fidelity Retailing Portfolio | 1,828,033 | 438,194 | -- | 152 | 2,269,587 |
| Fidelity Series Commodity Strategy Fund | -- | 101,503 | -- | -- | 110,979 |
| Fidelity Small Cap Stock Fund | 1,023,296 | 10,704 | 496,990 | -- | 462,053 |
| Fidelity Software and IT Services Portfolio | 2,126,558 | 2,262,918 | 37,160 | 1,094 | 4,347,548 |
| Fidelity Stock Selector Large Cap Value Fund | 2,627,784 | 439,325 | 224,495 | -- | 3,018,270 |
| Fidelity Technology Portfolio | 9,784,564 | 1,004,275 | 768,198 | -- | 9,839,202 |
| Fidelity Telecom and Utilities Fund | -- | 202,984 | -- | 1,213 | 242,167 |
| Fidelity Telecommunications Portfolio | 2,372,730 | 1,023,068 | 15,546 | 6,323 | 3,912,751 |
| Fidelity Total Bond Fund | 37,772,328 | 3,901,794 | 17,127,357 | 544,526 | 26,152,758 |
| Fidelity U.S. Bond Index Fund Institutional Class | -- | 6,113,401 | 67,838 | 18,620 | 28,875,087 |
| Fidelity U.S. Bond Index Fund Investor Class | -- | 35,024,470 | 12,443,960 | 80,899 | -- |
| Fidelity Utilities Portfolio | 465,956 | 1,864,504 | 420,895 | 1,470 | 2,248,859 |
| Fidelity Value Discovery Fund | 905,832 | 346,400 | 834,023 | -- | 433,291 |
| Total | $191,209,789 | $92,727,393 | $92,389,868 | $906,990 | $194,512,571 |
Investment Valuation
The following is a summary of the inputs used, as of June 30, 2016, involving the Fund's assets and liabilities carried at fair value. The inputs or methodology used for valuing securities may not be an indication of the risk associated with investing in those securities. For more information on valuation inputs, and their aggregation into the levels used below, please refer to the Investment Valuation section in the accompanying Notes to Financial Statements.
| | Valuation Inputs at Reporting Date: |
| Description | Total | Level 1 | Level 2 | Level 3 |
| Investments in Securities: | | | | |
| Equity Funds | $133,453,705 | $133,453,705 | $-- | $-- |
| Fixed-Income Funds | 82,163,565 | 82,163,565 | -- | -- |
| Other Short-Term Investments | 9,995 | -- | 9,995 | -- |
| Total Investments in Securities: | $215,627,265 | $215,617,270 | $9,995 | $-- |
| Derivative Instruments: | | | | |
| Liabilities | | | | |
| Futures Contracts | $(950) | $(950) | $-- | $-- |
| Total Liabilities | $(950) | $(950) | $-- | $-- |
| Total Derivative Instruments: | $(950) | $(950) | $-- | $-- |
Value of Derivative Instruments
The following table is a summary of the Fund's value of derivative instruments by primary risk exposure as of June 30, 2016. For additional information on derivative instruments, please refer to the Derivative Instruments section in the accompanying Notes to Financial Statements.
| Primary Risk Exposure / Derivative Type | Value |
| | Asset | Liability |
| Equity Risk | | |
| Futures Contracts(a) | $0 | $(950) |
| Total Equity Risk | 0 | (950) |
| Total Value of Derivatives | $0 | $(950) |
(a) Reflects gross cumulative appreciation (depreciation) on futures contracts as presented in the Schedule of Investments. In the Statement of Assets and Liabilities, the period end daily variation margin is included in receivable or payable for daily variation margin for derivative instruments, and the net cumulative appreciation (depreciation) is included in net unrealized appreciation (depreciation).
See accompanying notes which are an integral part of the financial statements.
Financial Statements
Statement of Assets and Liabilities
| | | June 30, 2016 (Unaudited) |
| Assets | | |
Investment in securities, at value — See accompanying schedule:
Unaffiliated issuers (cost $21,934,925) | $21,114,694 | |
| Affiliated issuers (cost $191,939,261) | 194,512,571 | |
| Total Investments (cost $213,874,186) | | $215,627,265 |
| Cash | | 14,222,856 |
| Receivable for investments sold | | 540,342 |
| Receivable for fund shares sold | | 128,945 |
| Dividends receivable | | 17,560 |
| Receivable for daily variation margin for derivative instruments | | 1,170 |
| Other receivables | | 1,956 |
| Total assets | | 230,540,094 |
| Liabilities | | |
| Payable for investments purchased | $1,213,085 | |
| Payable for fund shares redeemed | 594,605 | |
| Accrued management fee | 47,304 | |
| Distribution and service plan fees payable | 28,162 | |
| Other affiliated payables | 2,395 | |
| Total liabilities | | 1,885,551 |
| Net Assets | | $228,654,543 |
| Net Assets consist of: | | |
| Paid in capital | | $232,418,938 |
| Undistributed net investment income | | 751,372 |
| Accumulated undistributed net realized gain (loss) on investments | | (6,267,896) |
| Net unrealized appreciation (depreciation) on investments | | 1,752,129 |
| Net Assets | | $228,654,543 |
| Service Class: | | |
| Net Asset Value, offering price and redemption price per share ($1,686,722 ÷ 153,350 shares) | | $11.00 |
| Service Class 2: | | |
| Net Asset Value, offering price and redemption price per share ($226,967,821 ÷ 20,691,586 shares) | | $10.97 |
See accompanying notes which are an integral part of the financial statements.
Statement of Operations
| | | Six months ended June 30, 2016 (Unaudited) |
| Investment Income | | |
| Dividends from underlying Funds: | | |
| Unaffiliated issuers | | $258,963 |
| Affiliated issuers | | 906,990 |
| Interest | | 27,998 |
| Total income | | 1,193,951 |
| Expenses | | |
| Management fee | $323,112 | |
| Transfer agent fees | 12,893 | |
| Distribution and service plan fees | 268,256 | |
| Independent trustees' fees and expenses | 481 | |
| Miscellaneous | 239 | |
| Total expenses before reductions | 604,981 | |
| Expense reductions | (162,388) | 442,593 |
| Net investment income (loss) | | 751,358 |
| Realized and Unrealized Gain (Loss) | | |
| Net realized gain (loss) on: | | |
| Investment securities: | | |
| Unaffiliated issuers | (338,003) | |
| Affiliated issuers | (5,242,851) | |
| Futures contracts | (142,651) | |
| Realized gain distributions from underlying funds: | | |
| Affiliated issuers | 274,723 | |
| Total net realized gain (loss) | | (5,448,782) |
Change in net unrealized appreciation (depreciation) on:
Investment securities | 8,431,375 | |
| Futures contracts | (84,235) | |
| Total change in net unrealized appreciation (depreciation) | | 8,347,140 |
| Net gain (loss) | | 2,898,358 |
| Net increase (decrease) in net assets resulting from operations | | $3,649,716 |
See accompanying notes which are an integral part of the financial statements.
Statement of Changes in Net Assets
| | Six months ended June 30, 2016 (Unaudited) | Year ended December 31, 2015 |
| Increase (Decrease) in Net Assets | | |
| Operations | | |
| Net investment income (loss) | $751,358 | $2,169,680 |
| Net realized gain (loss) | (5,448,782) | 924,698 |
| Change in net unrealized appreciation (depreciation) | 8,347,140 | (7,615,048) |
| Net increase (decrease) in net assets resulting from operations | 3,649,716 | (4,520,670) |
| Distributions to shareholders from net investment income | – | (2,188,957) |
| Distributions to shareholders from net realized gain | (749,792) | (2,870,478) |
| Total distributions | (749,792) | (5,059,435) |
| Share transactions - net increase (decrease) | 14,504,100 | 86,531,305 |
| Total increase (decrease) in net assets | 17,404,024 | 76,951,200 |
| Net Assets | | |
| Beginning of period | 211,250,519 | 134,299,319 |
| End of period | $228,654,543 | $211,250,519 |
| Other Information | | |
| Undistributed net investment income end of period | $751,372 | $14 |
See accompanying notes which are an integral part of the financial statements.
Financial Highlights — VIP Target Volatility Portfolio Service Class
| | Six months ended (Unaudited) June 30, | Years ended December 31, | | |
| | 2016 | 2015 | 2014 | 2013 A |
| Selected Per–Share Data | | | | |
| Net asset value, beginning of period | $10.87 | $11.34 | $11.19 | $10.00 |
| Income from Investment Operations | | | | |
| Net investment income (loss)B | .05 | .16 | .17 | .19 |
| Net realized and unrealized gain (loss) | .12 | (.29) | .49 | 1.26 |
| Total from investment operations | .17 | (.13) | .66 | 1.45 |
| Distributions from net investment income | – | (.13) | (.13) | (.07) |
| Distributions from net realized gain | (.04) | (.21) | (.38) | (.18) |
| Total distributions | (.04) | (.34) | (.51) | (.26)C |
| Net asset value, end of period | $11.00 | $10.87 | $11.34 | $11.19 |
| Total ReturnD,E,F | 1.58% | (1.22)% | 5.94% | 14.46% |
| Ratios to Average Net AssetsG | | | | |
| Expenses before reductions | .41%H | .42% | .41% | .42%H |
| Expenses net of fee waivers, if any | .26%H | .27% | .26% | .26%H |
| Expenses net of all reductions | .26%H | .26% | .26% | .26%H |
| Net investment income (loss) | .85%H | 1.39% | 1.49% | 1.98%H |
| Supplemental Data | | | | |
| Net assets, end of period (000 omitted) | $1,687 | $2,143 | $2,880 | $2,802 |
| Portfolio turnover rateI | 96%H | 119% | 80% | 91%H |
A For the period February 13, 2013 (commencement of operations) to December 31, 2013.
B Calculated based on average shares outstanding during the period.
C Total distributions of $.26 per share is comprised of distributions from net investment income of $.072 and distributions from net realized gain of $.183 per share.
D Total returns for periods of less than one year are not annualized.
E Total returns do not reflect charges attributable to your insurance company's separate account. Inclusion of these charges would reduce the total returns shown.
F Total returns would have been lower if certain expenses had not been reduced during the applicable periods shown.
G Expense ratios reflect operating expenses of the class. Expenses before reductions do not reflect amounts reimbursed by the investment adviser or reductions from brokerage service arrangements or reductions from other expense offset arrangements and do not represent the amount paid by the class during periods when reimbursements or reductions occur. Expense ratios before reductions for start-up periods may not be representative of longer-term operating periods. Expenses net of fee waivers reflect expenses after reimbursement by the investment adviser but prior to reductions from brokerage service arrangements or other expense offset arrangements. Expenses net of all reductions represent the net expenses paid by the class.
H Annualized
I Amount does not include the portfolio activity of any Underlying Funds.
See accompanying notes which are an integral part of the financial statements.
Financial Highlights — VIP Target Volatility Portfolio Service Class 2
| | Six months ended (Unaudited) June 30, | Years ended December 31, | | |
| | 2016 | 2015 | 2014 | 2013 A |
| Selected Per–Share Data | | | | |
| Net asset value, beginning of period | $10.85 | $11.32 | $11.18 | $10.00 |
| Income from Investment Operations | | | | |
| Net investment income (loss)B | .04 | .14 | .15 | .17 |
| Net realized and unrealized gain (loss) | .12 | (.28) | .49 | 1.26 |
| Total from investment operations | .16 | (.14) | .64 | 1.43 |
| Distributions from net investment income | – | (.11) | (.12) | (.07) |
| Distributions from net realized gain | (.04) | (.21) | (.38) | (.18) |
| Total distributions | (.04) | (.33)C | (.50) | (.25) |
| Net asset value, end of period | $10.97 | $10.85 | $11.32 | $11.18 |
| Total ReturnD,E,F | 1.49% | (1.34)% | 5.74% | 14.32% |
| Ratios to Average Net AssetsG | | | | |
| Expenses before reductions | .56%H | .57% | .56% | .56%H |
| Expenses net of fee waivers, if any | .41%H | .42% | .41% | .41%H |
| Expenses net of all reductions | .41%H | .41% | .41% | .40%H |
| Net investment income (loss) | .70%H | 1.24% | 1.34% | 1.83%H |
| Supplemental Data | | | | |
| Net assets, end of period (000 omitted) | $226,968 | $209,108 | $131,419 | $60,451 |
| Portfolio turnover rateI | 96%H | 119% | 80% | 91%H |
A For the period February 13, 2013 (commencement of operations) to December 31, 2013.
B Calculated based on average shares outstanding during the period.
C Total distributions of $.33 per share is comprised of distributions from net investment income of $.114 and distributions from net realized gain of $.212 per share.
D Total returns for periods of less than one year are not annualized.
E Total returns do not reflect charges attributable to your insurance company's separate account. Inclusion of these charges would reduce the total returns shown.
F Total returns would have been lower if certain expenses had not been reduced during the applicable periods shown.
G Expense ratios reflect operating expenses of the class. Expenses before reductions do not reflect amounts reimbursed by the investment adviser or reductions from brokerage service arrangements or reductions from other expense offset arrangements and do not represent the amount paid by the class during periods when reimbursements or reductions occur. Expense ratios before reductions for start-up periods may not be representative of longer-term operating periods. Expenses net of fee waivers reflect expenses after reimbursement by the investment adviser but prior to reductions from brokerage service arrangements or other expense offset arrangements. Expenses net of all reductions represent the net expenses paid by the class.
H Annualized
I Amount does not include the portfolio activity of any Underlying Funds.
See accompanying notes which are an integral part of the financial statements.
Notes to Financial Statements (Unaudited)
For the period ended June 30, 2016
1. Organization.
VIP Target Volatility Portfolio (the Fund) is a fund of Variable Insurance Products Fund V (the Trust) and is authorized to issue an unlimited number of shares. The Trust is registered under the Investment Company Act of 1940, as amended (the 1940 Act), as an open-end management investment company organized as a Massachusetts business trust. Shares of the Fund may only be purchased by insurance companies for the purpose of funding variable annuity or variable life insurance contracts. The Fund offers the following classes of shares: Service Class shares and Service Class 2 shares. All classes have equal rights and voting privileges, except for matters affecting a single class.
During the period, certain underlying investments of the Fund incurred name changes. These changes may involve one or more of the following, as applicable: replacing "Spartan" with "Fidelity," or renaming the "Fidelity Advantage Class" to the "Premium Class." The names of the underlying investments are those in effect at period end.
2. Significant Accounting Policies.
The financial statements have been prepared in conformity with accounting principles generally accepted in the United States of America (GAAP), which require management to make certain estimates and assumptions at the date of the financial statements. Actual results could differ from those estimates. Subsequent events, if any, through the date that the financial statements were issued have been evaluated in the preparation of the financial statements. The Fund's Schedule of Investments lists each of the Underlying Funds as an investment of the Fund but does not include the underlying holdings of each Underlying Fund. The following summarizes the significant accounting policies of the Fund:
Investment Valuation. Investments are valued as of 4:00 p.m. Eastern time on the last calendar day of the period. The Fund uses a third party pricing vendor approved by the Board of Trustees (the Board) to value its investments. The Board of Trustees (the Board) has delegated the day to day responsibility for the valuation of the Fund's investments to the Fidelity Management & Research Company (FMR) Fair Value Committee (the Committee). In accordance with valuation policies and procedures approved by the Board, the Fund attempts to obtain prices from one or more third party pricing vendors or brokers to value its investments. When current market prices, quotations or currency exchange rates are not readily available or reliable, investments will be fair valued in good faith by the Committee, in accordance with procedures adopted by the Board. Factors used in determining fair value vary by investment type and may include market or investment specific events, changes in interest rates and credit quality. The frequency with which these procedures are used cannot be predicted and they may be utilized to a significant extent. The Committee oversees the Fund's valuation policies and procedures and reports to the Board on the Committee's activities and fair value determinations. The Board monitors the appropriateness of the procedures used in valuing the Fund's investments and ratifies the fair value determinations of the Committee. The Fund categorizes the inputs to valuation techniques used to value its investments into a disclosure hierarchy consisting of three levels as shown below:
- Level 1 – quoted prices in active markets for identical investments
- Level 2 – other significant observable inputs (including quoted prices for similar investments, interest rates, prepayment speeds, etc.)
- Level 3 – unobservable inputs (including the Fund's own assumptions based on the best information available)
Valuation techniques used to value the Fund's investments by major category are as follows. Investments in open-end mutual funds are valued at their closing net asset value (NAV) each business day and are categorized as Level 1 in the hierarchy. If an unaffiliated open-end mutual fund's NAV is unavailable, shares of that fund may be valued by another method that the Board believes reflects fair value in accordance with the Board's fair value pricing policies and is categorized as Level 2 in the hierarchy. Debt securities, including restricted securities, are valued based on evaluated prices received from third party pricing vendors or from brokers who make markets in such securities. U.S. government and government agency obligations are valued by pricing vendors who utilize matrix pricing which considers yield or price of bonds of comparable quality, coupon, maturity and type or by broker-supplied prices. When independent prices are unavailable or unreliable, debt securities may be valued utilizing pricing methodologies which consider similar factors that would be used by third party pricing vendors. Debt securities are generally categorized as Level 2 in the hierarchy but may be Level 3 depending on the circumstances. Exchange-Traded Funds (ETFs) are valued at their last sale price or official closing price as reported by a third party pricing vendor on the primary market or exchange on which they are traded and are categorized as Level 1 in the hierarchy. In the event there were no sales during the day but the exchange reports a closing bid level, ETFs are valued at the closing bid and would be categorized as Level 1 in the hierarchy. In the event there was no closing bid, ETFs may be valued by another method that the Board believes reflects fair value in accordance with the Board's fair value pricing policies and may be categorized as Level 2 in the hierarchy.
Futures contracts are valued at the settlement price established each day by the board of trade or exchange on which they are traded and are categorized as Level 1 in the hierarchy.
Changes in valuation techniques may result in transfers in or out of an assigned level within the disclosure hierarchy. The aggregate value of investments by input level, as of June 30, 2016, is included at the end of the Fund's Schedule of Investments.
Investment Transactions and Income. For financial reporting purposes, the Fund's investment holdings and NAV include trades executed through the end of the last business day of the period. The NAV per share for processing shareholder transactions is calculated as of the close of business of the New York Stock Exchange (NYSE), normally 4:00 p.m. Eastern time and includes trades executed through the end of the prior business day. Gains and losses on securities sold are determined on the basis of identified cost. Income and capital gain distributions from the Underlying Funds, if any, are recorded on the ex-dividend date. Interest income is accrued as earned. Interest income includes coupon interest and amortization of premium and accretion of discount on debt securities as applicable.
Class Allocations and Expenses. Investment income, realized and unrealized capital gains and losses, common expenses of the Fund, and certain fund-level expense reductions, if any, are allocated daily on a pro-rata basis to each class based on the relative net assets of each class to the total net assets of the Fund. Each class differs with respect to transfer agent and distribution and service plan fees incurred. Certain expense reductions may also differ by class. For the reporting period, the allocated portion of income and expenses to each class as a percent of its average net assets may vary due to the timing of recording these transactions in relation to fluctuating net assets of the classes. Expenses directly attributable to a fund are charged to that fund. Expenses attributable to more than one fund are allocated among the respective funds on the basis of relative net assets or other appropriate methods. Expenses included in the accompanying financial statements reflect the expenses of the Fund and do not include any expenses associated with the Underlying Funds. Although not included in the Fund's expenses, the Fund indirectly bears its proportionate share of the Underlying Funds' expenses through the impact of these expenses on each Underlying Fund's NAV. Expense estimates are accrued in the period to which they relate and adjustments are made when actual amounts are known.
Income Tax Information and Distributions to Shareholders. Each year, the Fund intends to qualify as a regulated investment company under Subchapter M of the Internal Revenue Code, including distributing substantially all of its taxable income and realized gains. As a result, no provision for U.S. Federal income taxes is required. The Fund files a U.S. federal tax return, in addition to state and local tax returns as required. The Fund's federal income tax returns are subject to examination by the Internal Revenue Service (IRS) for a period of three fiscal years after they are filed. State and local tax returns may be subject to examination for an additional fiscal year depending on the jurisdiction.
Distributions are declared and recorded on the ex-dividend date. Income dividends and capital gain distributions are declared separately for each class. Income and capital gain distributions are determined in accordance with income tax regulations, which may differ from GAAP.
Capital accounts within the financial statements are adjusted for permanent book-tax differences. These adjustments have no impact on net assets or the results of operations. Capital accounts are not adjusted for temporary book-tax differences which will reverse in a subsequent period.
Book-tax differences are primarily due to short-term gain distributions from the Underlying Funds, futures contracts, market discount and losses deferred due to wash sales.
The federal tax cost of investment securities and unrealized appreciation (depreciation) as of period end were as follows:
| Gross unrealized appreciation | $6,075,299 |
| Gross unrealized depreciation | (4,826,386) |
| Net unrealized appreciation (depreciation) on securities | $1,248,913 |
| Tax Cost | $214,378,352 |
3. Derivative Instruments.
Risk Exposures and the Use of Derivative Instruments. The Fund's investment objective allows the Fund to enter into various types of derivative contracts, including futures contracts. Derivatives are investments whose value is primarily derived from underlying assets, indices or reference rates and may be transacted on an exchange or over-the-counter (OTC). Derivatives may involve a future commitment to buy or sell a specified asset based on specified terms, to exchange future cash flows at periodic intervals based on a notional principal amount, or for one party to make one or more payments upon the occurrence of specified events in exchange for periodic payments from the other party.
The Fund used derivatives to increase returns and to manage exposure to certain risks as defined below. The success of any strategy involving derivatives depends on analysis of numerous economic factors, and if the strategies for investment do not work as intended, the Fund may not achieve its objectives.
The Fund's use of derivatives increased or decreased its exposure to the following risk:
| Equity Risk | Equity risk relates to the fluctuations in the value of financial instruments as a result of changes in market prices (other than those arising from interest rate risk or foreign exchange risk), whether caused by factors specific to an individual investment, its issuer, or all factors affecting all instruments traded in a market or market segment.
|
The Fund is also exposed to additional risks from investing in derivatives, such as liquidity risk and counterparty credit risk. Liquidity risk is the risk that the Fund will be unable to close out the derivative in the open market in a timely manner. Counterparty credit risk is the risk that the counterparty will not be able to fulfill its obligation to the Fund. Counterparty credit risk related to exchange-traded futures contracts may be mitigated by the protection provided by the exchange on which they trade.
Investing in derivatives may involve greater risks than investing in the underlying assets directly and, to varying degrees, may involve risk of loss in excess of any initial investment and collateral received and amounts recognized in the Statement of Assets and Liabilities. In addition, there may be the risk that the change in value of the derivative contract does not correspond to the change in value of the underlying instrument.
Futures Contracts. A futures contract is an agreement between two parties to buy or sell a specified underlying instrument for a fixed price at a specified future date. The Fund used futures contracts to manage its exposure to the stock market.
Upon entering into a futures contract, a fund is required to deposit either cash or securities (initial margin) with a clearing broker in an amount equal to a certain percentage of the face value of the contract. Futures contracts are marked-to-market daily and subsequent daily payments (variation margin) are made or received by a fund depending on the daily fluctuations in the value of the futures contracts and are recorded as unrealized appreciation or (depreciation). This receivable and/or payable, if any, is included in daily variation margin for derivative instruments in the Statement of Assets and Liabilities. Realized gain or (loss) is recorded upon the expiration or closing of a futures contract.
Any open futures contracts at period end are presented in the Schedule of Investments under the caption "Futures Contracts". The underlying face amount at value reflects each contract's exposure to the underlying instrument or index at period end and is representative of volume of activity during the period. Securities deposited to meet initial margin requirements are identified in the Schedule of Investments.
During the period the Fund recognized net realized gain (loss) of $(142,651) and a change in net unrealized appreciation (depreciation) of $(84,235) related to its investment in futures contracts. These amounts are included in the Statement of Operations.
4. Purchases and Redemptions of Underlying Fund Shares.
Purchases and redemptions of the Underlying Fund shares, other than short-term securities and U.S. government obligations, aggregated $105,266,243 and $96,557,273, respectively.
5. Fees and Other Transactions with Affiliates.
Management Fee. FMR Co., Inc. (the investment adviser), an affiliate of FMR, provides the Fund with investment management related services. For these services the Fund pays a monthly management fee to the investment adviser. The management fee is computed at an annual rate of .30% of the Fund's average net assets.
During the period, the investment adviser waived a portion of its management fee as described in the Expense Reductions note.
Other Transactions. The investment adviser has entered into an administration agreement with FMR under which FMR provides management and administrative services (other than investment advisory services) necessary for the operation of the Fund. Pursuant to this agreement, FMR pays all expenses of the Fund, excluding distribution and service fees, transfer agent fees, compensation of the independent Trustees and certain other expenses such as interest expense. FMR also contracts with other Fidelity companies to perform the services necessary for the operation of the Fund.
Distribution and Service Plan Fees. In accordance with Rule 12b-1 of the 1940 Act, the Fund has adopted separate 12b-1 Plans for each Service Class of shares. Each Service Class pays Fidelity Distributors Corporation (FDC), an affiliate of the investment adviser, a service fee. For the period, the service fee is based on an annual rate of .10% of Service Class' average net assets and .25% of Service Class 2's average net assets.
For the period, total fees, all of which were re-allowed to insurance companies for the distribution of shares and providing shareholder support services, were as follows:
| Service Class | $939 |
| Service Class 2 | 267,317 |
| | $268,256 |
Transfer Agent Fees. Fidelity Investments Institutional Operations Company, Inc. (FIIOC), an affiliate of the investment adviser, is the Fund's transfer, dividend disbursing, and shareholder servicing agent. FIIOC receives an asset-based fee with respect to each class. Each class pays a fee for transfer agent services, typesetting, and printing and mailing of shareholder reports, excluding mailing of proxy statements, equal to an annual rate of .15% of class-level average net assets invested in Underlying Funds that are not managed by the investment adviser or its affiliates. For the period, transfer agent fees for each class were as follows:
| Service Class | $112 |
| Service Class 2 | 12,781 |
| | $12,893 |
6. Committed Line of Credit.
The Fund participates with other funds managed by the investment adviser or an affiliate in a $4.25 billion credit facility (the "line of credit") to be utilized for temporary or emergency purposes to fund shareholder redemptions or for other short-term liquidity purposes. The Fund has agreed to pay commitment fees on its pro-rata portion of the line of credit, which amounted to $20 and is reflected in Miscellaneous expenses on the Statement of Operations. During the period, the Fund did not borrow on this line of credit.
7. Expense Reductions.
The investment adviser contractually agreed to waive the Fund's management fee in an amount equal to .05% of the Funds' average net assets until April 30, 2017. During the period, the Fund's management fee was reduced by $53,933.
In addition, FMR has contractually agreed to reimburse .10% of class-level expenses for Service Class and Service Class 2. During the period, this reimbursement reduced the Fund's Service Class and Service Class 2's expenses by the following amounts:
| | Reimbursement
|
| Service Class | $939 |
| Service Class 2 | 107,221 |
In addition, through arrangements with the Fund's custodian, credits realized as a result of certain uninvested cash balances were used to reduce the Fund's expenses. During the period, these credits reduced the Fund's expenses by $295.
8. Distributions to Shareholders.
Distributions to shareholders of each class were as follows:
| | Six months ended
June 30, 2016 | Year ended December 31, 2015 |
| From net investment income | | |
| Service Class | $– | $25,024 |
| Service Class 2 | – | 2,163,933 |
| Total | $– | $2,188,957 |
| From net realized gain | | |
| Service Class | $7,099 | $49,362 |
| Service Class 2 | 742,693 | 2,821,116 |
| Total | $749,792 | $2,870,478 |
9. Share Transactions.
Transactions for each class of shares were as follows:
| | Shares | Shares | Dollars | Dollars |
| | Six months ended
June 30, 2016 | Year ended December 31, 2015 | Six months ended
June 30, 2016 | Year ended December 31, 2015 |
| Service Class | | | | |
| Shares sold | 38 | 124 | $400 | $1,394 |
| Reinvestment of distributions | 706 | 6,624 | 7,099 | 74,386 |
| Shares redeemed | (44,483) | (63,653) | (472,161) | (729,058) |
| Net increase (decrease) | (43,739) | (56,905) | $(464,662) | $(653,278) |
| Service Class 2 | | | | |
| Shares sold | 3,039,490 | 9,933,172 | $32,217,290 | $112,937,814 |
| Reinvestment of distributions | 73,973 | 447,494 | 742,693 | 4,985,049 |
| Shares redeemed | (1,694,008) | (2,716,121) | (17,991,221) | (30,738,280) |
| Net increase (decrease) | 1,419,455 | 7,664,545 | $14,968,762 | $87,184,583 |
10. Other.
The Fund's organizational documents provide former and current trustees and officers with a limited indemnification against liabilities arising in connection with the performance of their duties to the Fund. In the normal course of business, the Fund may also enter into contracts that provide general indemnifications. The Fund's maximum exposure under these arrangements is unknown as this would be dependent on future claims that may be made against the Fund. The risk of material loss from such claims is considered remote.
At the end of the period, one otherwise unaffiliated shareholder was the owner of record of 94% of the total outstanding shares of the Fund.
Shareholder Expense Example
As a shareholder of the Fund, you incur two types of costs: (1) transaction costs and (2) ongoing costs, including management fees, distribution and/or service (12b-1) fees and other Fund expenses. This Example is intended to help you understand your ongoing costs (in dollars) of investing in the Fund and to compare these costs with the ongoing costs of investing in other mutual funds.
The Example is based on an investment of $1,000 invested at the beginning of the period and held for the entire period (January 1, 2016 to June 30, 2016).
Actual Expenses
The first line of the accompanying table for each class of the Fund provides information about actual account values and actual expenses. You may use the information in this line, together with the amount you invested, to estimate the expenses that you paid over the period. Simply divide your account value by $1,000.00 (for example, an $8,600 account value divided by $1,000.00 = 8.6), then multiply the result by the number in the first line for a class of the Fund under the heading entitled "Expenses Paid During Period" to estimate the expenses you paid on your account during this period. The estimate of expenses does not include any fees or other expenses of any variable annuity or variable life insurance product. If they were, the estimate of expenses you paid during the period would be higher, and your ending account value would be lower. In addition, the Fund, as a shareholder in underlying mutual funds and exchange-traded funds (ETFs) (the Underlying Funds), will indirectly bear its pro-rata share of the fees and expenses incurred by the underlying Fidelity Funds. These fees and expenses are not included in the Fund's annualized expense ratio used to calculate the expense estimate in the table below.
Hypothetical Example for Comparison Purposes
The second line of the accompanying table for each class of the Fund provides information about hypothetical account values and hypothetical expenses based on a Class' actual expense ratio and an assumed rate of return of 5% per year before expenses, which is not the Class' actual return. The hypothetical account values and expenses may not be used to estimate the actual ending account balance or expenses you paid for the period. You may use this information to compare the ongoing costs of investing in the Fund and other funds. To do so, compare this 5% hypothetical example with the 5% hypothetical examples that appear in the shareholder reports of the other funds. The estimate of expenses does not include any fees or other expenses of any variable annuity or variable life insurance product. If they were, the estimate of expenses you paid during the period would be higher, and your ending account value would be lower. In addition, the Fund, as a shareholder in underlying mutual funds and exchange-traded funds (ETFs) (the Underlying Funds), will indirectly bear its pro-rata share of the fees and expenses incurred by the underlying Fidelity Funds. These fees and expenses are not included in the Fund's annualized expense ratio used to calculate the expense estimate in the table below.
Please note that the expenses shown in the table are meant to highlight your ongoing costs only and do not reflect any transaction costs. Therefore, the second line of the table is useful in comparing ongoing costs only, and will not help you determine the relative total costs of owning different funds.
| | Annualized Expense Ratio-A | Beginning
Account Value
January 1, 2016 | Ending
Account Value
June 30, 2016 | Expenses Paid
During Period-B
January 1, 2016
to June 30, 2016 |
| Service Class | .26% | | | |
| Actual | | $1,000.00 | $1,015.80 | $1.30 |
| Hypothetical-C | | $1,000.00 | $1,023.57 | $1.31 |
| Service Class 2 | .41% | | | |
| Actual | | $1,000.00 | $1,014.90 | $2.05 |
| Hypothetical-C | | $1,000.00 | $1,022.82 | $2.06 |
A Annualized expense ratio reflects expenses net of applicable fee waivers.
B Expenses are equal to each Class' annualized expense ratio, multiplied by the average account value over the period, multiplied by 182/366 (to reflect the one-half year period).
C 5% return per year before expenses
VIPTV-SANN-0816
1.955018.103
Fidelity® Variable Insurance Products: Asset Manager: Growth Portfolio
Semi-Annual Report June 30, 2016 |
|
Contents
To view a fund's proxy voting guidelines and proxy voting record for the 12-month period ended June 30, visit http://www.fidelity.com/proxyvotingresults or visit the Securities and Exchange Commission's (SEC) web site at http://www.sec.gov.
You may also call 1-877-208-0098 to request a free copy of the proxy voting guidelines.
Fidelity® Variable Insurance Products are separate account options which are purchased through a variable insurance contract.
Standard & Poor's, S&P and S&P 500 are registered service marks of The McGraw-Hill Companies, Inc. and have been licensed for use by Fidelity Distributors Corporation.
Other third-party marks appearing herein are the property of their respective owners.
All other marks appearing herein are registered or unregistered trademarks or service marks of FMR LLC or an affiliated company. © 2016 FMR LLC. All rights reserved.
This report and the financial statements contained herein are submitted for the general information of the shareholders of the Fund. This report is not authorized for distribution to prospective investors in the Fund unless preceded or accompanied by an effective prospectus.
A fund files its complete schedule of portfolio holdings with the SEC for the first and third quarters of each fiscal year on Form N-Q. Forms N-Q are available on the SEC’s web site at http://www.sec.gov. A fund's Forms N-Q may be reviewed and copied at the SEC’s Public Reference Room in Washington, DC. Information regarding the operation of the SEC's Public Reference Room may be obtained by calling 1-800-SEC-0330.
For a complete list of a fund's portfolio holdings, view the most recent holdings listing, semiannual report, or annual report on Fidelity's web site at http://www.fidelity.com, http://www.institutional.fidelity.com, or http://www.401k.com, as applicable.
NOT FDIC INSURED •MAY LOSE VALUE •NO BANK GUARANTEE
Neither the Fund nor Fidelity Distributors Corporation is a bank.
Investment Summary (Unaudited)
The information in the following tables is based on the combined investments of the Fund and its pro-rata share of the investments of Fidelity's Central Funds, other than the Commodity Strategy and Money Market Central Funds.
Top Ten Stocks as of June 30, 2016
| | % of fund's net assets | % of fund's net assets 6 months ago |
| Apple, Inc. | 1.6 | 1.9 |
| Gilead Sciences, Inc. | 1.3 | 1.4 |
| Celgene Corp. | 1.3 | 1.5 |
| AT&T, Inc. | 1.2 | 0.0 |
| Exxon Mobil Corp. | 1.1 | 0.0 |
| Michael Kors Holdings Ltd. | 1.1 | 0.8 |
| Southwest Airlines Co. | 1.1 | 1.0 |
| Medivation, Inc. | 1.1 | 1.0 |
| Alexion Pharmaceuticals, Inc. | 1.0 | 1.2 |
| NXP Semiconductors NV | 0.9 | 1.0 |
| | 11.7 | |
Market Sectors as of June 30, 2016
| (stocks only) | % of fund's net assets | % of fund's net assets 6 months ago |
| Health Care | 12.3 | 15.2 |
| Information Technology | 8.8 | 12.8 |
| Industrials | 8.2 | 7.4 |
| Consumer Discretionary | 7.5 | 11.9 |
| Financials | 7.4 | 8.3 |
| Consumer Staples | 5.9 | 3.2 |
| Energy | 5.7 | 1.9 |
| Telecommunication Services | 2.8 | 0.7 |
| Utilities | 2.2 | 0.7 |
| Materials | 1.4 | 1.3 |
Asset Allocation (% of fund's net assets)
| As of June 30, 2016 * |
| | Stock Class and Equity Futures** | 67.0% |
| | Bond Class | 27.2% |
| | Short-Term Class | 5.8% |

* Foreign investments - 26.1%
** Includes investment in Fidelity® Commodity Strategy Central Fund of 1.1%
| As of December 31, 2015 * |
| | Stock Class and Equity Futures** | 68.8% |
| | Bond Class | 26.5% |
| | Short-Term Class | 4.7% |

* Foreign investments - 29.1%
** Includes investment in Fidelity® Commodity Strategy Central Fund of 0.4%
Asset allocations in the pie charts reflect the categorization of assets as defined in the Fund's prospectus in effect as of the time periods indicated above. Financial Statement categorizations conform to accounting standards and will differ from the pie chart. Percentages are adjusted for the effect of future contracts and swap contracts, if applicable.
An unaudited holdings listing for the Fund, which presents direct holdings as well as the pro-rata share of any securities and other investments held indirectly through its investment in underlying Fidelity Central Funds, other than the Commodity Strategy and Money Market Central Funds, is available at institutional.fidelity.com.
Percentages in the above tables are adjusted for the effect of TBA Sale Commitments.
Percentages shown as 0.0% may reflect amounts less than 0.05%.
Investments June 30, 2016 (Unaudited)
Showing Percentage of Net Assets
| Common Stocks - 45.3% | | | |
| | | Shares | Value |
| CONSUMER DISCRETIONARY - 5.6% | | | |
| Automobiles - 0.4% | | | |
| General Motors Co. | | 32,000 | $905,600 |
| Household Durables - 0.9% | | | |
| D.R. Horton, Inc. | | 55,900 | 1,759,732 |
| Internet & Catalog Retail - 0.6% | | | |
| Amazon.com, Inc. (a) | | 900 | 644,058 |
| JD.com, Inc. sponsored ADR (a) | | 10,100 | 214,423 |
| Priceline Group, Inc. (a) | | 100 | 124,841 |
| Vipshop Holdings Ltd. ADR (a) | | 31,600 | 352,972 |
| | | | 1,336,294 |
| Media - 0.1% | | | |
| ITV PLC | | 76,600 | 183,662 |
| Specialty Retail - 2.0% | | | |
| Home Depot, Inc. | | 11,600 | 1,481,204 |
| John David Group PLC | | 5,600 | 86,338 |
| Lowe's Companies, Inc. | | 19,500 | 1,543,815 |
| TJX Companies, Inc. | | 11,700 | 903,591 |
| | | | 4,014,948 |
| Textiles, Apparel & Luxury Goods - 1.6% | | | |
| Michael Kors Holdings Ltd. (a) | | 45,559 | 2,254,259 |
| Pandora A/S | | 8,200 | 1,116,835 |
| | | | 3,371,094 |
|
| TOTAL CONSUMER DISCRETIONARY | | | 11,571,330 |
|
| CONSUMER STAPLES - 4.1% | | | |
| Beverages - 2.4% | | | |
| Constellation Brands, Inc. Class A (sub. vtg.) | | 7,600 | 1,257,040 |
| Dr. Pepper Snapple Group, Inc. | | 6,700 | 647,421 |
| Molson Coors Brewing Co. Class B | | 7,500 | 758,475 |
| Monster Beverage Corp. | | 11,300 | 1,816,023 |
| The Coca-Cola Co. | | 8,500 | 385,305 |
| | | | 4,864,264 |
| Food & Staples Retailing - 0.1% | | | |
| Costco Wholesale Corp. | | 1,200 | 188,448 |
| Food Products - 0.4% | | | |
| Mead Johnson Nutrition Co. Class A | | 8,500 | 771,375 |
| WH Group Ltd. | | 63,500 | 50,292 |
| | | | 821,667 |
| Tobacco - 1.2% | | | |
| Altria Group, Inc. | | 10,900 | 751,664 |
| Imperial Tobacco Group PLC | | 7,202 | 390,584 |
| Philip Morris International, Inc. | | 7,500 | 762,900 |
| Reynolds American, Inc. | | 11,200 | 604,016 |
| | | | 2,509,164 |
|
| TOTAL CONSUMER STAPLES | | | 8,383,543 |
|
| ENERGY - 4.6% | | | |
| Oil, Gas & Consumable Fuels - 4.6% | | | |
| Anadarko Petroleum Corp. | | 6,900 | 367,425 |
| Chevron Corp. | | 17,900 | 1,876,457 |
| Continental Resources, Inc. (a) | | 23,800 | 1,077,426 |
| Devon Energy Corp. | | 33,000 | 1,196,250 |
| Enterprise Products Partners LP | | 8,200 | 239,932 |
| Exxon Mobil Corp. | | 24,300 | 2,277,882 |
| SM Energy Co. | | 21,400 | 577,800 |
| Targa Resources Corp. | | 7,900 | 332,906 |
| Williams Partners LP | | 46,100 | 1,596,904 |
| | | | 9,542,982 |
| FINANCIALS - 2.4% | | | |
| Banks - 0.3% | | | |
| SunTrust Banks, Inc. | | 14,300 | 587,444 |
| Capital Markets - 0.5% | | | |
| The Blackstone Group LP | | 42,200 | 1,035,588 |
| Consumer Finance - 0.5% | | | |
| OneMain Holdings, Inc. (a) | | 42,800 | 976,696 |
| Diversified Financial Services - 0.6% | | | |
| Broadcom Ltd. | | 300 | 46,620 |
| MSCI, Inc. Class A | | 10,400 | 802,048 |
| S&P Global, Inc. | | 4,100 | 439,766 |
| | | | 1,288,434 |
| Insurance - 0.2% | | | |
| Marsh & McLennan Companies, Inc. | | 7,500 | 513,450 |
| Real Estate Investment Trusts - 0.3% | | | |
| American Tower Corp. | | 4,900 | 556,689 |
|
| TOTAL FINANCIALS | | | 4,958,301 |
|
| HEALTH CARE - 10.7% | | | |
| Biotechnology - 7.4% | | | |
| AbbVie, Inc. | | 4,800 | 297,168 |
| Acorda Therapeutics, Inc. (a) | | 15,300 | 390,227 |
| Actelion Ltd. | | 5,283 | 889,645 |
| Alexion Pharmaceuticals, Inc. (a) | | 17,600 | 2,054,976 |
| Alnylam Pharmaceuticals, Inc. (a) | | 3,600 | 199,764 |
| Amicus Therapeutics, Inc. (a) | | 28,000 | 152,880 |
| BioMarin Pharmaceutical, Inc. (a) | | 12,200 | 949,160 |
| Celgene Corp. (a) | | 26,600 | 2,623,558 |
| Clovis Oncology, Inc. (a) | | 3,600 | 49,392 |
| Genmab A/S (a) | | 5,200 | 948,206 |
| Gilead Sciences, Inc. | | 32,700 | 2,727,834 |
| Intercept Pharmaceuticals, Inc. (a) | | 4,630 | 660,608 |
| Medivation, Inc. (a) | | 35,700 | 2,152,710 |
| Medy-Tox, Inc. | | 470 | 177,662 |
| Novavax, Inc. (a)(b) | | 62,300 | 452,921 |
| Shire PLC | | 1,100 | 67,983 |
| TESARO, Inc. (a) | | 4,500 | 378,225 |
| vTv Therapeutics, Inc. Class A (a) | | 7,900 | 45,820 |
| | | | 15,218,739 |
| Health Care Equipment & Supplies - 0.2% | | | |
| Nevro Corp. (a) | | 3,200 | 236,032 |
| Novocure Ltd. (a) | | 6,700 | 78,189 |
| | | | 314,221 |
| Pharmaceuticals - 3.1% | | | |
| Bristol-Myers Squibb Co. | | 17,700 | 1,301,835 |
| Collegium Pharmaceutical, Inc. (a) | | 8,000 | 94,800 |
| GlaxoSmithKline PLC | | 18,300 | 392,993 |
| Innocoll Holdings PLC (a) | | 18,700 | 103,037 |
| Jazz Pharmaceuticals PLC (a) | | 6,800 | 960,908 |
| Johnson & Johnson | | 10,300 | 1,249,390 |
| Ocular Therapeutix, Inc. (a) | | 44,000 | 217,800 |
| Pacira Pharmaceuticals, Inc. (a) | | 10,400 | 350,792 |
| Relypsa, Inc. (a)(b) | | 17,700 | 327,450 |
| Supernus Pharmaceuticals, Inc. (a) | | 7,400 | 150,738 |
| Valeant Pharmaceuticals International, Inc. (Canada) (a) | | 64,100 | 1,290,974 |
| | | | 6,440,717 |
|
| TOTAL HEALTH CARE | | | 21,973,677 |
|
| INDUSTRIALS - 6.3% | | | |
| Aerospace & Defense - 2.3% | | | |
| General Dynamics Corp. | | 5,200 | 724,048 |
| Huntington Ingalls Industries, Inc. | | 5,500 | 924,165 |
| Lockheed Martin Corp. | | 3,600 | 893,412 |
| Northrop Grumman Corp. | | 8,100 | 1,800,468 |
| TransDigm Group, Inc. (a) | | 1,200 | 316,428 |
| | | | 4,658,521 |
| Airlines - 3.2% | | | |
| American Airlines Group, Inc. | | 60,100 | 1,701,431 |
| Delta Air Lines, Inc. | | 40,400 | 1,471,772 |
| Norwegian Air Shuttle A/S (a)(b) | | 3,200 | 110,874 |
| Southwest Airlines Co. | | 56,300 | 2,207,523 |
| United Continental Holdings, Inc. (a) | | 25,200 | 1,034,208 |
| | | | 6,525,808 |
| Industrial Conglomerates - 0.3% | | | |
| Danaher Corp. | | 6,300 | 636,300 |
| Machinery - 0.4% | | | |
| Caterpillar, Inc. | | 7,900 | 598,899 |
| Xylem, Inc. | | 7,600 | 339,340 |
| | | | 938,239 |
| Professional Services - 0.1% | | | |
| Robert Half International, Inc. | | 3,100 | 118,296 |
|
| TOTAL INDUSTRIALS | | | 12,877,164 |
|
| INFORMATION TECHNOLOGY - 7.7% | | | |
| Internet Software & Services - 2.3% | | | |
| 58.com, Inc. ADR (a) | | 900 | 41,301 |
| Akamai Technologies, Inc. (a) | | 1,400 | 78,302 |
| Alibaba Group Holding Ltd. sponsored ADR (a) | | 1,400 | 111,342 |
| Alphabet, Inc. Class A | | 2,000 | 1,407,060 |
| Facebook, Inc. Class A (a) | | 13,980 | 1,597,634 |
| Tencent Holdings Ltd. | | 65,600 | 1,504,843 |
| | | | 4,740,482 |
| IT Services - 2.1% | | | |
| FleetCor Technologies, Inc. (a) | | 4,300 | 615,459 |
| Global Payments, Inc. | | 12,500 | 892,250 |
| MasterCard, Inc. Class A | | 13,000 | 1,144,780 |
| Visa, Inc. Class A | | 21,400 | 1,587,238 |
| | | | 4,239,727 |
| Semiconductors & Semiconductor Equipment - 1.0% | | | |
| NXP Semiconductors NV (a) | | 24,000 | 1,880,160 |
| Skyworks Solutions, Inc. | | 2,700 | 170,856 |
| | | | 2,051,016 |
| Software - 0.7% | | | |
| Adobe Systems, Inc. (a) | | 16,000 | 1,532,640 |
| Technology Hardware, Storage & Peripherals - 1.6% | | | |
| Apple, Inc. | | 35,400 | 3,384,240 |
|
| TOTAL INFORMATION TECHNOLOGY | | | 15,948,105 |
|
| MATERIALS - 0.3% | | | |
| Chemicals - 0.3% | | | |
| LyondellBasell Industries NV Class A | | 9,100 | 677,222 |
| TELECOMMUNICATION SERVICES - 2.0% | | | |
| Diversified Telecommunication Services - 2.0% | | | |
| AT&T, Inc. | | 56,600 | 2,445,686 |
| Verizon Communications, Inc. | | 28,400 | 1,585,856 |
| | | | 4,031,542 |
| UTILITIES - 1.6% | | | |
| Electric Utilities - 1.2% | | | |
| American Electric Power Co., Inc. | | 6,700 | 469,603 |
| Duke Energy Corp. | | 7,300 | 626,267 |
| Edison International | | 8,100 | 629,127 |
| PG&E Corp. | | 7,900 | 504,968 |
| PPL Corp. | | 6,400 | 241,600 |
| | | | 2,471,565 |
| Independent Power and Renewable Electricity Producers - 0.2% | | | |
| Dynegy, Inc. (a) | | 27,300 | 470,652 |
| Multi-Utilities - 0.2% | | | |
| Consolidated Edison, Inc. | | 5,100 | 410,244 |
|
| TOTAL UTILITIES | | | 3,352,461 |
|
| TOTAL COMMON STOCKS | | | |
| (Cost $76,246,892) | | | 93,316,327 |
| | | Principal Amount | Value |
|
| U.S. Treasury Obligations - 0.0% | | | |
| U.S. Treasury Bills, yield at date of purchase 0.33% to 0.35% 8/25/16 to 9/1/16 (c) | | | |
| (Cost $29,984) | | 30,000 | 29,989 |
| | | Shares | Value |
|
| Fixed-Income Funds - 28.8% | | | |
| Fidelity Emerging Markets Debt Central Fund (d) | | 113,782 | $1,124,163 |
| Fidelity Floating Rate Central Fund (d) | | 22,380 | 2,245,837 |
| Fidelity High Income Central Fund 1 (d) | | 95,174 | 8,950,122 |
| Fidelity Inflation-Protected Bond Index Central Fund (d) | | 83,093 | 8,513,736 |
| Fidelity VIP Investment Grade Central Fund (d) | | 343,314 | 36,786,074 |
| iShares 20+ Year Treasury Bond ETF (b) | | 12,600 | 1,750,141 |
| TOTAL FIXED-INCOME FUNDS | | | |
| (Cost $57,104,733) | | | 59,370,073 |
|
| Money Market Funds - 6.3% | | | |
| Fidelity Cash Central Fund, 0.43% (e) | | 6,532,728 | 6,532,728 |
| Fidelity Money Market Central Fund, 0.72% (e) | | 3,797,992 | 3,797,992 |
| Fidelity Securities Lending Cash Central Fund, 0.46% (e)(f) | | 2,653,271 | 2,653,271 |
| TOTAL MONEY MARKET FUNDS | | | |
| (Cost $12,983,991) | | | 12,983,991 |
|
| Equity Funds - 21.2% | | | |
| Domestic Equity Funds - 5.0% | | | |
| Fidelity Commodity Strategy Central Fund (d) | | 340,173 | 2,258,747 |
| Fidelity Real Estate Equity Central Fund (d) | | 19,892 | 2,304,237 |
| iShares S&P 500 Index ETF | | 27,124 | 5,715,025 |
|
| TOTAL DOMESTIC EQUITY FUNDS | | | 10,278,009 |
|
| International Equity Funds - 16.2% | | | |
| Fidelity Emerging Markets Equity Central Fund (d) | | 29,321 | 5,431,635 |
| Fidelity International Equity Central Fund (d) | | 393,455 | 27,825,128 |
|
| TOTAL INTERNATIONAL EQUITY FUNDS | | | 33,256,763 |
|
| TOTAL EQUITY FUNDS | | | |
| (Cost $44,097,581) | | | 43,534,772 |
| TOTAL INVESTMENT PORTFOLIO - 101.6% | | | |
| (Cost $190,463,181) | | | 209,235,152 |
| NET OTHER ASSETS (LIABILITIES) - (1.6)% | | | (3,197,211) |
| NET ASSETS - 100% | | | $206,037,941 |
| Futures Contracts | | | |
| | Expiration Date | Underlying Face Amount at Value | Unrealized Appreciation/(Depreciation) |
| Purchased | | | |
| Equity Index Contracts | | | |
| 12 ICE E-mini MSCI Emerging Markets Index Contracts (United States) | Sept. 2016 | 500,820 | $(3,323) |
The face value of futures purchased as a percentage of Net Assets is 0.2%
Security Type Abbreviations
ETF – Exchange-Traded Fund
Legend
(a) Non-income producing
(b) Security or a portion of the security is on loan at period end.
(c) Security or a portion of the security was pledged to cover margin requirements for futures contracts. At period end, the value of securities pledged amounted to $29,989.
(d) Affiliated fund that is generally available only to investment companies and other accounts managed by Fidelity Investments. A complete unaudited schedule of portfolio holdings for each Fidelity Central Fund is filed with the SEC for the first and third quarters of each fiscal year on Form N-Q and is available upon request or at the SEC's website at www.sec.gov. An unaudited holdings listing for the Fund, which presents direct holdings as well as the pro-rata share of securities and other investments held indirectly through its investment in underlying non-money market Fidelity Central Funds, other than the Commodity Strategy Central Fund, is available at fidelity.com and/or institutional.fidelity.com, as applicable. In addition, each Fidelity Central Fund's financial statements are available on the SEC's website or upon request.
(e) Affiliated fund that is generally available only to investment companies and other accounts managed by Fidelity Investments. The rate quoted is the annualized seven-day yield of the fund at period end. A complete unaudited listing of the fund's holdings as of its most recent quarter end is available upon request. In addition, each Fidelity Central Fund's financial statements are available on the SEC's website or upon request.
(f) Investment made with cash collateral received from securities on loan.
Affiliated Central Funds
Information regarding fiscal year to date income earned by the Fund from investments in Fidelity Central Funds is as follows:
| Fund | Income earned |
| Fidelity Cash Central Fund | $13,648 |
| Fidelity Commodity Strategy Central Fund | 0 |
| Fidelity Emerging Markets Debt Central Fund | 34,583 |
| Fidelity Emerging Markets Equity Central Fund | 49,821 |
| Fidelity Floating Rate Central Fund | 57,845 |
| Fidelity High Income Central Fund 1 | 342,118 |
| Fidelity Inflation-Protected Bond Index Central Fund | 648 |
| Fidelity International Equity Central Fund | 310,951 |
| Fidelity Money Market Central Fund | 3,714 |
| Fidelity Real Estate Equity Central Fund | 23,352 |
| Fidelity Securities Lending Cash Central Fund | 17,791 |
| Fidelity VIP Investment Grade Central Fund | 569,441 |
| Total | $1,423,912 |
Additional information regarding the Fund's fiscal year to date purchases and sales, including the ownership percentage, of the non Money Market Central Funds is as follows:
| Fund | Value, beginning of period | Purchases | Sales Proceeds | Value, end of period | % ownership, end of period |
| Fidelity Commodity Strategy Central Fund | $814,239 | $2,648,211 | $2,444,052 | $2,258,747 | 0.5% |
| Fidelity Emerging Markets Debt Central Fund | 1,050,601 | 55,096 | 77,013 | 1,124,163 | 1.0% |
| Fidelity Emerging Markets Equity Central Fund | 5,218,391 | 313,464 | 428,739 | 5,431,635 | 1.4% |
| Fidelity Floating Rate Central Fund | 2,243,724 | 79,872 | 135,025 | 2,245,837 | 0.2% |
| Fidelity High Income Central Fund 1 | 10,566,557 | 444,989 | 2,453,542 | 8,950,122 | 0.9% |
| Fidelity Inflation-Protected Bond Index Central Fund | 6,360,635 | 2,291,110 | 506,542 | 8,513,736 | 0.9% |
| Fidelity International Equity Central Fund | 30,444,622 | 881,299 | 1,982,864 | 27,825,128 | 1.4% |
| Fidelity Real Estate Equity Central Fund | 2,555,834 | 43,252 | 539,883 | 2,304,237 | 0.9% |
| Fidelity VIP Investment Grade Central Fund | 40,366,961 | 3,082,024 | 7,845,478 | 36,786,074 | 0.8% |
| Total | $99,621,564 | $9,839,317 | $16,413,138 | $95,439,679 | |
Investment Valuation
The following is a summary of the inputs used, as of June 30, 2016, involving the Fund's assets and liabilities carried at fair value. The inputs or methodology used for valuing securities may not be an indication of the risk associated with investing in those securities. For more information on valuation inputs, and their aggregation into the levels used below, please refer to the Investment Valuation section in the accompanying Notes to Financial Statements.
| | Valuation Inputs at Reporting Date: |
| Description | Total | Level 1 | Level 2 | Level 3 |
| Investments in Securities: | | | | |
| Equities: | | | | |
| Consumer Discretionary | $11,571,330 | $10,184,495 | $1,386,835 | $-- |
| Consumer Staples | 8,383,543 | 7,942,667 | 440,876 | -- |
| Energy | 9,542,982 | 9,542,982 | -- | -- |
| Financials | 4,958,301 | 4,958,301 | -- | -- |
| Health Care | 21,973,677 | 19,497,188 | 2,476,489 | -- |
| Industrials | 12,877,164 | 12,766,290 | 110,874 | -- |
| Information Technology | 15,948,105 | 14,443,262 | 1,504,843 | -- |
| Materials | 677,222 | 677,222 | -- | -- |
| Telecommunication Services | 4,031,542 | 4,031,542 | -- | -- |
| Utilities | 3,352,461 | 3,352,461 | -- | -- |
| U.S. Government and Government Agency Obligations | 29,989 | -- | 29,989 | -- |
| Fixed-Income Funds | 59,370,073 | 59,370,073 | -- | -- |
| Money Market Funds | 12,983,991 | 12,983,991 | -- | -- |
| Equity Funds | 43,534,772 | 43,534,772 | -- | -- |
| Total Investments in Securities: | $209,235,152 | $203,285,246 | $5,949,906 | $-- |
| Derivative Instruments: | | | | |
| Liabilities | | | | |
| Futures Contracts | $(3,323) | $(3,323) | $-- | $-- |
| Total Liabilities | $(3,323) | $(3,323) | $-- | $-- |
| Total Derivative Instruments: | $(3,323) | $(3,323) | $-- | $-- |
Value of Derivative Instruments
The following table is a summary of the Fund's value of derivative instruments by primary risk exposure as of June 30, 2016. For additional information on derivative instruments, please refer to the Derivative Instruments section in the accompanying Notes to Financial Statements.
| Primary Risk Exposure / Derivative Type | Value |
| | Asset | Liability |
| Equity Risk | | |
| Futures Contracts(a) | $0 | $(3,323) |
| Total Equity Risk | 0 | (3,323) |
| Total Value of Derivatives | $0 | $(3,323) |
(a) Reflects gross cumulative appreciation (depreciation) on futures contracts as presented in the Schedule of Investments. In the Statement of Assets and Liabilities, the period end daily variation margin is included in receivable or payable for daily variation margin for derivative instruments, and the net cumulative appreciation (depreciation) is included in net unrealized appreciation (depreciation).
Other Information
The information in the following tables is based on the combined investments of the Fund and its pro-rata share of the investments of Fidelity's Central Funds, other than the Commodity Strategy and Money Market Central Funds. Percentages in the below tables are adjusted for the effect of TBA Sale Commitments.
The composition of credit quality ratings as a percentage of Total Net Assets is as follows (Unaudited):
| U.S. Government and U.S. Government Agency Obligations | 11.7% |
| AAA,AA,A | 2.3% |
| BBB | 5.7% |
| BB | 4.2% |
| B | 2.4% |
| CCC,CC,C | 1.1% |
| D | 0.0% |
| Not Rated | 0.1% |
| Equities | 67.0% |
| Short-Term Investments and Net Other Assets | 5.5% |
| | 100.0% |
We have used ratings from Moody's Investors Service, Inc. Where Moody's® ratings are not available, we have used S&P® ratings. All ratings are as of the date indicated and do not reflect subsequent changes.
Percentages shown as 0.0% may reflect amounts less than 0.05%.
Distribution of investments by country or territory of incorporation, as a percentage of Total Net Assets, is as follows (Unaudited):
| United States of America | 74.0% |
| United Kingdom | 3.8% |
| Canada | 1.9% |
| Netherlands | 1.8% |
| Cayman Islands | 1.7% |
| Japan | 1.6% |
| France | 1.5% |
| Denmark | 1.3% |
| Switzerland | 1.3% |
| Germany | 1.3% |
| British Virgin Islands | 1.1% |
| Others (Individually Less Than 1%) | 8.7% |
| | 100.0% |
See accompanying notes which are an integral part of the financial statements.
Financial Statements
Statement of Assets and Liabilities
| | | June 30, 2016 (Unaudited) |
| Assets | | |
Investment in securities, at value (including securities loaned of $2,606,086) — See accompanying schedule:
Unaffiliated issuers (cost $83,158,466) | $100,811,482 | |
| Fidelity Central Funds (cost $107,304,715) | 108,423,670 | |
| Total Investments (cost $190,463,181) | | $209,235,152 |
| Cash | | 7,952 |
| Receivable for investments sold | | 628,697 |
| Receivable for fund shares sold | | 41,885 |
| Dividends receivable | | 48,098 |
| Distributions receivable from Fidelity Central Funds | | 6,888 |
| Receivable for daily variation margin for derivative instruments | | 5,400 |
| Total assets | | 209,974,072 |
| Liabilities | | |
| Payable for investments purchased | $1,121,157 | |
| Payable for fund shares redeemed | 14,359 | |
| Accrued management fee | 94,689 | |
| Distribution and service plan fees payable | 940 | |
| Other affiliated payables | 26,742 | |
| Other payables and accrued expenses | 24,973 | |
| Collateral on securities loaned, at value | 2,653,271 | |
| Total liabilities | | 3,936,131 |
| Net Assets | | $206,037,941 |
| Net Assets consist of: | | |
| Paid in capital | | $185,525,368 |
| Undistributed net investment income | | 1,265,880 |
| Accumulated undistributed net realized gain (loss) on investments and foreign currency transactions | | 478,327 |
| Net unrealized appreciation (depreciation) on investments and assets and liabilities in foreign currencies | | 18,768,366 |
| Net Assets | | $206,037,941 |
| Initial Class: | | |
| Net Asset Value, offering price and redemption price per share ($100,032,888 ÷ 5,497,731 shares) | | $18.20 |
| Service Class: | | |
| Net Asset Value, offering price and redemption price per share ($2,600,076 ÷ 143,862 shares) | | $18.07 |
| Service Class 2: | | |
| Net Asset Value, offering price and redemption price per share ($3,425,845 ÷ 190,665 shares) | | $17.97 |
| Investor Class: | | |
| Net Asset Value, offering price and redemption price per share ($99,979,132 ÷ 5,523,400 shares) | | $18.10 |
See accompanying notes which are an integral part of the financial statements.
Statement of Operations
| | | Six months ended June 30, 2016 (Unaudited) |
| Investment Income | | |
| Dividends | | $616,000 |
| Interest | | 446 |
| Income from Fidelity Central Funds | | 1,423,912 |
| Total income | | 2,040,358 |
| Expenses | | |
| Management fee | $568,226 | |
| Transfer agent fees | 108,718 | |
| Distribution and service plan fees | 5,501 | |
| Accounting and security lending fees | 51,328 | |
| Custodian fees and expenses | 5,948 | |
| Independent trustees' fees and expenses | 480 | |
| Audit | 27,849 | |
| Legal | 1,573 | |
| Miscellaneous | 746 | |
| Total expenses before reductions | 770,369 | |
| Expense reductions | (1,892) | 768,477 |
| Net investment income (loss) | | 1,271,881 |
| Realized and Unrealized Gain (Loss) | | |
| Net realized gain (loss) on: | | |
| Investment securities: | | |
| Unaffiliated issuers | 1,600,431 | |
| Fidelity Central Funds | (1,129,739) | |
| Foreign currency transactions | 21,983 | |
| Futures contracts | 32,838 | |
| Capital gain distributions from Fidelity Central Funds | 370,691 | |
| Total net realized gain (loss) | | 896,204 |
Change in net unrealized appreciation (depreciation) on:
Investment securities | (7,197,351) | |
| Assets and liabilities in foreign currencies | (2,015) | |
| Futures contracts | (85,852) | |
| Total change in net unrealized appreciation (depreciation) | | (7,285,218) |
| Net gain (loss) | | (6,389,014) |
| Net increase (decrease) in net assets resulting from operations | | $(5,117,133) |
See accompanying notes which are an integral part of the financial statements.
Statement of Changes in Net Assets
| | Six months ended June 30, 2016 (Unaudited) | Year ended December 31, 2015 |
| Increase (Decrease) in Net Assets | | |
| Operations | | |
| Net investment income (loss) | $1,271,881 | $3,018,310 |
| Net realized gain (loss) | 896,204 | 2,623,575 |
| Change in net unrealized appreciation (depreciation) | (7,285,218) | (6,078,993) |
| Net increase (decrease) in net assets resulting from operations | (5,117,133) | (437,108) |
| Distributions to shareholders from net investment income | (57,763) | (2,709,407) |
| Distributions to shareholders from net realized gain | (3,049,866) | (139,825) |
| Total distributions | (3,107,629) | (2,849,232) |
| Share transactions - net increase (decrease) | (7,413,651) | 8,953,394 |
| Total increase (decrease) in net assets | (15,638,413) | 5,667,054 |
| Net Assets | | |
| Beginning of period | 221,676,354 | 216,009,300 |
| End of period | $206,037,941 | $221,676,354 |
| Other Information | | |
| Undistributed net investment income end of period | $1,265,880 | $51,762 |
See accompanying notes which are an integral part of the financial statements.
Financial Highlights — VIP Asset Manager: Growth Portfolio Initial Class
| | Six months ended (Unaudited) June 30, | Years ended December 31, | | | | |
| | 2016 | 2015 | 2014 | 2013 | 2012 | 2011 |
| Selected Per–Share Data | | | | | | |
| Net asset value, beginning of period | $18.90 | $19.15 | $18.30 | $15.14 | $13.35 | $14.52 |
| Income from Investment Operations | | | | | | |
| Net investment income (loss)A | .11 | .27 | .23 | .17 | .19 | .22 |
| Net realized and unrealized gain (loss) | (.54) | (.27) | .85 | 3.22 | 1.87 | (1.12) |
| Total from investment operations | (.43) | .00 | 1.08 | 3.39 | 2.06 | (.90) |
| Distributions from net investment income | (.01) | (.24) | (.21) | (.18) | (.21) | (.24) |
| Distributions from net realized gain | (.26) | (.01) | (.02) | (.05) | (.06) | (.03) |
| Total distributions | (.27) | (.25) | (.23) | (.23) | (.27) | (.27) |
| Net asset value, end of period | $18.20 | $18.90 | $19.15 | $18.30 | $15.14 | $13.35 |
| Total ReturnB,C,D | (2.15)% | .03% | 5.87% | 22.41% | 15.45% | (6.17)% |
| Ratios to Average Net AssetsE,F | | | | | | |
| Expenses before reductions | .70%G | .70% | .70% | .72% | .72% | .73% |
| Expenses net of fee waivers, if any | .70%G | .70% | .70% | .71% | .72% | .72% |
| Expenses net of all reductions | .70%G | .69% | .70% | .71% | .71% | .71% |
| Net investment income (loss) | 1.27%G | 1.37% | 1.19% | 1.05% | 1.29% | 1.49% |
| Supplemental Data | | | | | | |
| Net assets, end of period (000 omitted) | $100,033 | $108,324 | $122,484 | $127,423 | $116,252 | $113,899 |
| Portfolio turnover rateH | 61%G | 49% | 38% | 52% | 59% | 71% |
A Calculated based on average shares outstanding during the period.
B Total returns for periods of less than one year are not annualized.
C Total returns do not reflect charges attributable to your insurance company's separate account. Inclusion of these charges would reduce the total returns shown.
D Total returns would have been lower if certain expenses had not been reduced during the applicable periods shown.
E Fees and expenses of any underlying Fidelity Central Funds are not included in the Fund's expense ratio. The Fund indirectly bears its proportionate share of the expenses of any underlying Fidelity Central Funds. Based on their most recent shareholder report date, the expenses of any underlying non-money market Fidelity Central Funds ranged from less than .005% to .10%.
F Expense ratios reflect operating expenses of the class. Expenses before reductions do not reflect amounts reimbursed by the investment adviser or reductions from brokerage service arrangements or reductions from other expense offset arrangements and do not represent the amount paid by the class during periods when reimbursements or reductions occur. Expenses net of fee waivers reflect expenses after reimbursement by the investment adviser but prior to reductions from brokerage service arrangements or other expense offset arrangements. Expenses net of all reductions represent the net expenses paid by the class.
G Annualized
H Amount does not include the portfolio activity of any underlying Fidelity Central Funds.
See accompanying notes which are an integral part of the financial statements.
Financial Highlights — VIP Asset Manager: Growth Portfolio Service Class
| | Six months ended (Unaudited) June 30, | Years ended December 31, | | | | |
| | 2016 | 2015 | 2014 | 2013 | 2012 | 2011 |
| Selected Per–Share Data | | | | | | |
| Net asset value, beginning of period | $18.79 | $19.03 | $18.19 | $15.04 | $13.26 | $14.42 |
| Income from Investment Operations | | | | | | |
| Net investment income (loss)A | .10 | .25 | .21 | .16 | .17 | .20 |
| Net realized and unrealized gain (loss) | (.55) | (.26) | .84 | 3.19 | 1.86 | (1.11) |
| Total from investment operations | (.45) | (.01) | 1.05 | 3.35 | 2.03 | (.91) |
| Distributions from net investment income | (.01) | (.22) | (.19) | (.15) | (.20) | (.22) |
| Distributions from net realized gain | (.26) | (.01) | (.02) | (.05) | (.06) | (.03) |
| Total distributions | (.27) | (.23) | (.21) | (.20) | (.25)B | (.25) |
| Net asset value, end of period | $18.07 | $18.79 | $19.03 | $18.19 | $15.04 | $13.26 |
| Total ReturnC,D,E | (2.27)% | (.03)% | 5.75% | 22.34% | 15.34% | (6.26)% |
| Ratios to Average Net AssetsF,G | | | | | | |
| Expenses before reductions | .80%H | .80% | .80% | .82% | .82% | .83% |
| Expenses net of fee waivers, if any | .80%H | .80% | .80% | .82% | .82% | .82% |
| Expenses net of all reductions | .80%H | .79% | .80% | .81% | .81% | .81% |
| Net investment income (loss) | 1.17%H | 1.27% | 1.09% | .95% | 1.19% | 1.39% |
| Supplemental Data | | | | | | |
| Net assets, end of period (000 omitted) | $2,600 | $2,877 | $3,265 | $3,191 | $3,541 | $5,654 |
| Portfolio turnover rateI | 61%H | 49% | 38% | 52% | 59% | 71% |
A Calculated based on average shares outstanding during the period.
B Total distributions of $.25 per share is comprised of distributions from net investment income of $.195 and distributions from net realized gain of $.055 per share.
C Total returns for periods of less than one year are not annualized.
D Total returns do not reflect charges attributable to your insurance company's separate account. Inclusion of these charges would reduce the total returns shown.
E Total returns would have been lower if certain expenses had not been reduced during the applicable periods shown.
F Fees and expenses of any underlying Fidelity Central Funds are not included in the Fund's expense ratio. The Fund indirectly bears its proportionate share of the expenses of any underlying Fidelity Central Funds. Based on their most recent shareholder report date, the expenses of any underlying non-money market Fidelity Central Funds ranged from less than .005% to .10%.
G Expense ratios reflect operating expenses of the class. Expenses before reductions do not reflect amounts reimbursed by the investment adviser or reductions from brokerage service arrangements or reductions from other expense offset arrangements and do not represent the amount paid by the class during periods when reimbursements or reductions occur. Expenses net of fee waivers reflect expenses after reimbursement by the investment adviser but prior to reductions from brokerage service arrangements or other expense offset arrangements. Expenses net of all reductions represent the net expenses paid by the class.
H Annualized
I Amount does not include the portfolio activity of any underlying Fidelity Central Funds.
See accompanying notes which are an integral part of the financial statements.
Financial Highlights — VIP Asset Manager: Growth Portfolio Service Class 2
| | Six months ended (Unaudited) June 30, | Years ended December 31, | | | | |
| | 2016 | 2015 | 2014 | 2013 | 2012 | 2011 |
| Selected Per–Share Data | | | | | | |
| Net asset value, beginning of period | $18.70 | $18.94 | $18.10 | $14.97 | $13.21 | $14.36 |
| Income from Investment Operations | | | | | | |
| Net investment income (loss)A | .09 | .21 | .17 | .12 | .14 | .17 |
| Net realized and unrealized gain (loss) | (.55) | (.25) | .84 | 3.18 | 1.84 | (1.09) |
| Total from investment operations | (.46) | (.04) | 1.01 | 3.30 | 1.98 | (.92) |
| Distributions from net investment income | (.01) | (.19) | (.15) | (.12) | (.17) | (.20) |
| Distributions from net realized gain | (.26) | (.01) | (.02) | (.05) | (.06) | (.03) |
| Total distributions | (.27) | (.20) | (.17) | (.17) | (.22)B | (.23) |
| Net asset value, end of period | $17.97 | $18.70 | $18.94 | $18.10 | $14.97 | $13.21 |
| Total ReturnC,D,E | (2.33)% | (.18)% | 5.55% | 22.09% | 15.03% | (6.39)% |
| Ratios to Average Net AssetsF,G | | | | | | |
| Expenses before reductions | .95%H | .96% | 1.01% | 1.03% | 1.04% | 1.01% |
| Expenses net of fee waivers, if any | .95%H | .96% | 1.01% | 1.02% | 1.04% | 1.01% |
| Expenses net of all reductions | .95%H | .95% | 1.00% | 1.02% | 1.03% | 1.00% |
| Net investment income (loss) | 1.02%H | 1.11% | .88% | .74% | .97% | 1.20% |
| Supplemental Data | | | | | | |
| Net assets, end of period (000 omitted) | $3,426 | $3,533 | $3,573 | $3,626 | $3,621 | $3,260 |
| Portfolio turnover rateI | 61%H | 49% | 38% | 52% | 59% | 71% |
A Calculated based on average shares outstanding during the period.
B Total distributions of $.22 per share is comprised of distributions from net investment income of $.167 and distributions from net realized gain of $.055 per share.
C Total returns for periods of less than one year are not annualized.
D Total returns do not reflect charges attributable to your insurance company's separate account. Inclusion of these charges would reduce the total returns shown.
E Total returns would have been lower if certain expenses had not been reduced during the applicable periods shown.
F Fees and expenses of any underlying Fidelity Central Funds are not included in the Fund's expense ratio. The Fund indirectly bears its proportionate share of the expenses of any underlying Fidelity Central Funds. Based on their most recent shareholder report date, the expenses of any underlying non-money market Fidelity Central Funds ranged from less than .005% to .10%.
G Expense ratios reflect operating expenses of the class. Expenses before reductions do not reflect amounts reimbursed by the investment adviser or reductions from brokerage service arrangements or reductions from other expense offset arrangements and do not represent the amount paid by the class during periods when reimbursements or reductions occur. Expenses net of fee waivers reflect expenses after reimbursement by the investment adviser but prior to reductions from brokerage service arrangements or other expense offset arrangements. Expenses net of all reductions represent the net expenses paid by the class.
H Annualized
I Amount does not include the portfolio activity of any underlying Fidelity Central Funds.
See accompanying notes which are an integral part of the financial statements.
Financial Highlights — VIP Asset Manager: Growth Portfolio Investor Class
| | Six months ended (Unaudited) June 30, | Years ended December 31, | | | | |
| | 2016 | 2015 | 2014 | 2013 | 2012 | 2011 |
| Selected Per–Share Data | | | | | | |
| Net asset value, beginning of period | $18.82 | $19.06 | $18.22 | $15.08 | $13.30 | $14.46 |
| Income from Investment Operations | | | | | | |
| Net investment income (loss)A | .11 | .25 | .21 | .16 | .18 | .20 |
| Net realized and unrealized gain (loss) | (.56) | (.25) | .85 | 3.20 | 1.86 | (1.10) |
| Total from investment operations | (.45) | – | 1.06 | 3.36 | 2.04 | (.90) |
| Distributions from net investment income | (.01) | (.23) | (.20) | (.17) | (.20) | (.23) |
| Distributions from net realized gain | (.26) | (.01) | (.02) | (.05) | (.06) | (.03) |
| Total distributions | (.27) | (.24) | (.22) | (.22) | (.26) | (.26) |
| Net asset value, end of period | $18.10 | $18.82 | $19.06 | $18.22 | $15.08 | $13.30 |
| Total ReturnB,C,D | (2.26)% | .01% | 5.79% | 22.30% | 15.34% | (6.20)% |
| Ratios to Average Net AssetsE,F | | | | | | |
| Expenses before reductions | .78%G | .78% | .78% | .80% | .81% | .81% |
| Expenses net of fee waivers, if any | .78%G | .78% | .78% | .80% | .81% | .81% |
| Expenses net of all reductions | .78%G | .77% | .78% | .79% | .79% | .80% |
| Net investment income (loss) | 1.19%G | 1.29% | 1.11% | .97% | 1.21% | 1.41% |
| Supplemental Data | | | | | | |
| Net assets, end of period (000 omitted) | $99,979 | $106,942 | $86,687 | $58,295 | $37,574 | $36,235 |
| Portfolio turnover rateH | 61%G | 49% | 38% | 52% | 59% | 71% |
A Calculated based on average shares outstanding during the period.
B Total returns for periods of less than one year are not annualized.
C Total returns do not reflect charges attributable to your insurance company's separate account. Inclusion of these charges would reduce the total returns shown.
D Total returns would have been lower if certain expenses had not been reduced during the applicable periods shown.
E Fees and expenses of any underlying Fidelity Central Funds are not included in the Fund's expense ratio. The Fund indirectly bears its proportionate share of the expenses of any underlying Fidelity Central Funds. Based on their most recent shareholder report date, the expenses of any underlying non-money market Fidelity Central Funds ranged from less than .005% to .10%.
F Expense ratios reflect operating expenses of the class. Expenses before reductions do not reflect amounts reimbursed by the investment adviser or reductions from brokerage service arrangements or reductions from other expense offset arrangements and do not represent the amount paid by the class during periods when reimbursements or reductions occur. Expenses net of fee waivers reflect expenses after reimbursement by the investment adviser but prior to reductions from brokerage service arrangements or other expense offset arrangements. Expenses net of all reductions represent the net expenses paid by the class.
G Annualized
H Amount does not include the portfolio activity of any underlying Fidelity Central Funds.
See accompanying notes which are an integral part of the financial statements.
Notes to Financial Statements (Unaudited)
For the period ended June 30, 2016
1. Organization.
VIP Asset Manager: Growth Portfolio (the Fund) is a fund of Variable Insurance Products Fund V (the Trust) and is authorized to issue an unlimited number of shares. The Trust is registered under the Investment Company Act of 1940, as amended (the 1940 Act), as an open-end management investment company organized as a Massachusetts business trust. Shares of the Fund may only be purchased by insurance companies for the purpose of funding variable annuity or variable life insurance contracts. The Fund offers the following classes of shares: Initial Class shares, Service Class shares, Service Class 2 shares and Investor Class shares. All classes have equal rights and voting privileges, except for matters affecting a single class.
2. Investments in Fidelity Central Funds.
The Fund invests in Fidelity Central Funds, which are open-end investment companies generally available only to other investment companies and accounts managed by the investment adviser and its affiliates. The Fund's Schedule of Investments lists each of the Fidelity Central Funds held as of period end, as an investment of the Fund, but does not include the underlying holdings of each Fidelity Central Fund. As an Investing Fund, the Fund indirectly bears its proportionate share of the expenses of the underlying Fidelity Central Funds.
Based on its investment objective, each Fidelity Central Fund may invest or participate in various investment vehicles or strategies that are similar to those of the Fund. These strategies are consistent with the investment objectives of the Fund and may involve certain economic risks which may cause a decline in value of each of the Fidelity Central Funds and thus a decline in the value of the Fund. The following summarizes the Fund's investment in each Fidelity Central Fund.
| Fidelity Central Fund | Investment Manager | Investment Objective | Investment Practices | Expense Ratio(a) |
| Fidelity Commodity Strategy Central Fund | Geode Capital Management, LLC (Geode) | Seeks to provide investment returns that correspond to the performance of the commodities market. | Investment in commodity-related investments through a wholly-owned subsidiary organized under the laws of the Cayman Islands
Futures
Swaps | .06% |
| Fidelity Emerging Markets Debt Central Fund | FMR Co., Inc. (FMRC) | Seeks high total return by normally investing in debt securities of issuers in emerging markets and other debt investments that are tied economically to emerging markets. | Foreign Securities
Loans & Direct Debt Instruments
Restricted Securities
| .01% |
| Fidelity Emerging Markets Equity Central Fund | FMRC | Seeks capital appreciation by investing primarily in equity securities of issuers in emerging markets. | Delayed Delivery & When Issued Securities
Foreign Securities
Restricted Securities
Futures
| .10% |
| Fidelity International Equity Central Fund | FMRC | Seeks capital appreciation by investing primarily in non-U.S. based common stocks, including securities of issuers located in emerging markets. | Foreign Securities
Futures
| .01% |
| Fidelity Floating Rate Central Fund | FMRC | Seeks a high level of income by normally investing in floating rate loans and other floating rate securities. | Loans & Direct Debt Instruments
Restricted Securities | Less than .005% |
| Fidelity High Income Central Fund 1 | FMRC | Seeks a high level of income and may also seek capital appreciation by investing primarily in debt securities, preferred stocks, and convertible securities, with an emphasis on lower-quality debt securities. | Delayed Delivery & When Issued Securities
Loans & Direct Debt Instruments
Restricted Securities
| Less than .005% |
| Fidelity Inflation-Protected Bond Index Central Fund | Fidelity Investment Money Management, Inc. (FIMM) | Seeks to provide investment results that correspond to the performance of the inflation-protected United States Treasury market, and may invest in derivatives. | | Less than .005% |
| Fidelity VIP Investment Grade Central Fund | FIMM | Seeks a high level of current income by normally investing in investment-grade debt securities and repurchase agreements. | Delayed Delivery & When Issued Securities
Restricted Securities
Swaps | Less than .005% |
| Fidelity Real Estate Equity Central Fund | FMRC | Seeks above-average income and long-term capital growth by investing primarily in equity securities of issuers in the real estate industry. | | .01% |
| Fidelity Money Market Central Funds | FIMM | Each fund seeks to obtain a high level of current income consistent with the preservation of capital and liquidity. | Short-term Investments | Less than .005% |
(a) Expenses expressed as a percentage of average net assets and are as of each underlying Central Fund's most recent annual or semi-annual shareholder report.
An unaudited holdings listing for the Fund, which presents direct holdings as well as the pro-rata share of any securities and other investments held indirectly through its investment in underlying non-money market Fidelity Central Funds, is available at institutional.fidelity.com. A complete unaudited list of holdings for each Fidelity Central Fund is available upon request or at the Securities and Exchange Commission (the SEC) website at www.sec.gov. In addition, the financial statements of the Fidelity Central Funds which contain the significant accounting policies (including investment valuation policies) of those funds are available on the SEC website or upon request.
3. Significant Accounting Policies.
The financial statements have been prepared in conformity with accounting principles generally accepted in the United States of America (GAAP), which require management to make certain estimates and assumptions at the date of the financial statements. Actual results could differ from those estimates. Subsequent events, if any, through the date that the financial statements were issued have been evaluated in the preparation of the financial statements. The following summarizes the significant accounting policies of the Fund:
Investment Valuation. Investments are valued as of 4:00 p.m. Eastern time on the last calendar day of the period. The Board of Trustees (the Board) has delegated the day to day responsibility for the valuation of the Fund's investments to the Fidelity Management & Research Company (FMR) Fair Value Committee (the Committee). In accordance with valuation policies and procedures approved by the Board, the Fund attempts to obtain prices from one or more third party pricing vendors or brokers to value its investments. When current market prices, quotations or currency exchange rates are not readily available or reliable, investments will be fair valued in good faith by the Committee, in accordance with procedures adopted by the Board. Factors used in determining fair value vary by investment type and may include market or investment specific events, changes in interest rates and credit quality. The frequency with which these procedures are used cannot be predicted and they may be utilized to a significant extent. The Committee oversees the Fund's valuation policies and procedures and reports to the Board on the Committee's activities and fair value determinations. The Board monitors the appropriateness of the procedures used in valuing the Fund's investments and ratifies the fair value determinations of the Committee.
The Fund categorizes the inputs to valuation techniques used to value its investments into a disclosure hierarchy consisting of three levels as shown below:
- Level 1 – quoted prices in active markets for identical investments
- Level 2 – other significant observable inputs (including quoted prices for similar investments, interest rates, prepayment speeds, etc.)
- Level 3 – unobservable inputs (including the Fund's own assumptions based on the best information available)
Valuation techniques used to value the Fund's investments by major category are as follows:
Equity securities, including restricted securities, for which market quotations are readily available, are valued at the last reported sale price or official closing price as reported by a third party pricing vendor on the primary market or exchange on which they are traded and are categorized as Level 1 in the hierarchy. In the event there were no sales during the day or closing prices are not available, securities are valued at the last quoted bid price or may be valued using the last available price and are generally categorized as Level 2 in the hierarchy. For foreign equity securities, when market or security specific events arise, comparisons to the valuation of American Depositary Receipts (ADRs), futures contracts, Exchange-Traded Funds (ETFs) and certain indexes as well as quoted prices for similar securities may be used and would be categorized as Level 2 in the hierarchy. Utilizing these techniques may result in transfers between Level 1 and Level 2. For equity securities, including restricted securities, where observable inputs are limited, assumptions about market activity and risk are used and these securities may be categorized as Level 3 in the hierarchy.
Debt securities, including restricted securities, are valued based on evaluated prices received from third party pricing vendors or from brokers who make markets in such securities. U.S. government and government agency obligations are valued by pricing vendors who utilize matrix pricing which considers yield or price of bonds of comparable quality, coupon, maturity and type or by broker-supplied prices. When independent prices are unavailable or unreliable, debt securities may be valued utilizing pricing methodologies which consider similar factors that would be used by third party pricing vendors. Debt securities are generally categorized as Level 2 in the hierarchy but may be Level 3 depending on the circumstances. ETFs are valued at their last sale price or official closing price as reported by a third party pricing vendor on the primary market or exchange on which they are traded and are categorized as Level 1 in the hierarchy. In the event there were no sales during the day but the exchange reports a closing bid level, ETFs are valued at the closing bid and would be categorized as Level 1 in the hierarchy. In the event there was no closing bid, ETFs may be valued by another method that the Board believes reflects fair value in accordance with the Board's fair value pricing policies and may be categorized as Level 2 in the hierarchy.
Futures contracts are valued at the settlement price established each day by the board of trade or exchange on which they are traded and are categorized as Level 1 in the hierarchy. Investments in open-end mutual funds, including the Fidelity Central Funds, are valued at their closing net asset value (NAV) each business day and are categorized as Level 1 in the hierarchy.
Changes in valuation techniques may result in transfers in or out of an assigned level within the disclosure hierarchy. The aggregate value of investments by input level as of June 30, 2016, is included at the end of the Fund's Schedule of Investments.
Foreign Currency. The Fund may use foreign currency contracts to facilitate transactions in foreign-denominated securities. Gains and losses from these transactions may arise from changes in the value of the foreign currency or if the counterparties do not perform under the contracts' terms.
Foreign-denominated assets, including investment securities, and liabilities are translated into U.S. dollars at the exchange rates at period end. Purchases and sales of investment securities, income and dividends received and expenses denominated in foreign currencies are translated into U.S. dollars at the exchange rate in effect on the transaction date.
The effects of exchange rate fluctuations on investments are included with the net realized and unrealized gain (loss) on investment securities. Other foreign currency transactions resulting in realized and unrealized gain (loss) are disclosed separately.
Investment Transactions and Income. For financial reporting purposes, the Fund's investment holdings and NAV include trades executed through the end of the last business day of the period. The NAV per share for processing shareholder transactions is calculated as of the close of business of the New York Stock Exchange (NYSE), normally 4:00 p.m. Eastern time and includes trades executed through the end of the prior business day. Gains and losses on securities sold are determined on the basis of identified cost and may include proceeds received from litigation. Dividend income is recorded on the ex-dividend date, except for certain dividends from foreign securities where the ex-dividend date may have passed, which are recorded as soon as the Fund is informed of the ex-dividend date. Non-cash dividends included in dividend income, if any, are recorded at the fair market value of the securities received. Income and capital gain distributions from Fidelity Central Funds, if any, are recorded on the ex-dividend date. Distributions received on securities that represent a return of capital or capital gain are recorded as a reduction of cost of investments and/or as a realized gain. Subsequent to ex-dividend date the Fund determines the components of these distributions, based upon receipt of tax filings or other correspondence relating to the underlying investment. Interest income is accrued as earned and includes coupon interest and amortization of premium and accretion of discount on debt securities as applicable. Investment income is recorded net of foreign taxes withheld where recovery of such taxes is uncertain.
Class Allocations and Expenses. Investment income, realized and unrealized capital gains and losses, common expenses of the Fund, and certain fund-level expense reductions, if any, are allocated daily on a pro-rata basis to each class based on the relative net assets of each class to the total net assets of the Fund. Each class differs with respect to transfer agent and distribution and service plan fees incurred. Certain expense reductions may also differ by class. For the reporting period, the allocated portion of income and expenses to each class as a percent of its average net assets may vary due to the timing of recording these transactions in relation to fluctuating net assets of the classes. Expenses directly attributable to a fund are charged to that fund. Expenses attributable to more than one fund are allocated among the respective funds on the basis of relative net assets or other appropriate methods. Expense estimates are accrued in the period to which they relate and adjustments are made when actual amounts are known. Expenses included in the accompanying financial statements reflect the expenses of the Fund and do not include any expenses of the Fidelity Central Funds. Although not included in the Fund's expenses, the Fund indirectly bears its proportionate share of the Fidelity Central Funds' expenses through the impact of these expenses on each Fidelity Central Fund's NAV.
Income Tax Information and Distributions to Shareholders. Each year, the Fund intends to qualify as a regulated investment company under Subchapter M of the Internal Revenue Code, including distributing substantially all of its taxable income and realized gains. As a result, no provision for U.S. Federal income taxes is required. The Fund files a U.S. federal tax return, in addition to state and local tax returns as required. The Fund's federal income tax returns are subject to examination by the Internal Revenue Service (IRS) for a period of three fiscal years after they are filed. State and local tax returns may be subject to examination for an additional fiscal year depending on the jurisdiction. Foreign taxes are provided for based on the Fund's understanding of the tax rules and rates that exist in the foreign markets in which it invests.
Distributions are declared and recorded on the ex-dividend date. Income dividends and capital gain distributions are declared separately for each class. Income and capital gain distributions are determined in accordance with income tax regulations, which may differ from GAAP.
Capital accounts within the financial statements are adjusted for permanent book-tax differences. These adjustments have no impact on net assets or the results of operations. Capital accounts are not adjusted for temporary book-tax differences which will reverse in a subsequent period.
Book-tax differences are primarily due to short-term gain distributions from the Fidelity Central Funds, futures contracts, foreign currency transactions, market discount, partnerships (including allocations from Fidelity Central Funds), deferred trustees compensation, capital loss carryforwards and losses deferred due to wash sales.
The federal tax cost of investment securities and unrealized appreciation (depreciation) as of period end were as follows:
| Gross unrealized appreciation | $27,341,463 |
| Gross unrealized depreciation | (8,945,751) |
| Net unrealized appreciation (depreciation) on securities | $18,395,712 |
| Tax Cost | $190,839,440 |
4. Derivative Instruments.
Risk Exposures and the Use of Derivative Instruments. The Fund's investment objective allows the Fund to enter into various types of derivative contracts, including futures contracts. Derivatives are investments whose value is primarily derived from underlying assets, indices or reference rates and may be transacted on an exchange or over-the-counter (OTC). Derivatives may involve a future commitment to buy or sell a specified asset based on specified terms, to exchange future cash flows at periodic intervals based on a notional principal amount, or for one party to make one or more payments upon the occurrence of specified events in exchange for periodic payments from the other party.
The Fund used derivatives to increase returns and to manage exposure to certain risks as defined below. The success of any strategy involving derivatives depends on analysis of numerous economic factors, and if the strategies for investment do not work as intended, the Fund may not achieve its objectives.
The Fund's use of derivatives increased or decreased its exposure to the following risk:
| Equity Risk | Equity risk relates to the fluctuations in the value of financial instruments as a result of changes in market prices (other than those arising from interest rate risk or foreign exchange risk), whether caused by factors specific to an individual investment, its issuer, or all factors affecting all instruments traded in a market or market segment.
|
The Fund is also exposed to additional risks from investing in derivatives, such as liquidity risk and counterparty credit risk. Liquidity risk is the risk that the Fund will be unable to close out the derivative in the open market in a timely manner. Counterparty credit risk is the risk that the counterparty will not be able to fulfill its obligation to the Fund. Counterparty credit risk related to exchange-traded futures contracts may be mitigated by the protection provided by the exchange on which they trade.
Investing in derivatives may involve greater risks than investing in the underlying assets directly and, to varying degrees, may involve risk of loss in excess of any initial investment and collateral received and amounts recognized in the Statement of Assets and Liabilities. In addition, there may be the risk that the change in value of the derivative contract does not correspond to the change in value of the underlying instrument.
Futures Contracts. A futures contract is an agreement between two parties to buy or sell a specified underlying instrument for a fixed price at a specified future date. The Fund used futures contracts to manage its exposure to the stock market.
Upon entering into a futures contract, a fund is required to deposit either cash or securities (initial margin) with a clearing broker in an amount equal to a certain percentage of the face value of the contract. Futures contracts are marked-to-market daily and subsequent daily payments (variation margin) are made or received by a fund depending on the daily fluctuations in the value of the futures contracts and are recorded as unrealized appreciation or (depreciation). This receivable and/or payable, if any, is included in daily variation margin for derivative instruments in the Statement of Assets and Liabilities. Realized gain or (loss) is recorded upon the expiration or closing of a futures contract.
Any open futures contracts at period end are presented in the Schedule of Investments under the caption "Futures Contracts". The underlying face amount at value reflects each contract's exposure to the underlying instrument or index at period end and is representative of volume of activity during the period. Securities deposited to meet initial margin requirements are identified in the Schedule of Investments.
During the period the Fund recognized net realized gain (loss) of $32,838 and a change in net unrealized appreciation (depreciation) of $(85,852) related to its investment in futures contracts. These amounts are included in the Statement of Operations.
5. Purchases and Sales of Investments.
Purchases and sales of securities (including the Equity and Fixed-Income Central Funds), other than short-term securities, aggregated $60,737,675 and $68,553,750, respectively.
6. Fees and Other Transactions with Affiliates.
Management Fee. Fidelity Management & Research Company (the investment adviser) and its affiliates provide the Fund with investment management related services for which the Fund pays a monthly management fee. The management fee is the sum of an individual fund fee rate that is based on an annual rate of .30% of the Fund's average net assets and an annualized group fee rate that averaged .25% during the period. The group fee rate is based upon the average net assets of all the mutual funds advised by the investment adviser, including any mutual funds previously advised by the investment adviser that are currently advised by Fidelity SelectCo, LLC, an affiliate of the investment adviser. The group fee rate decreases as assets under management increase and increases as assets under management decrease. For the reporting period, the total annualized management fee rate was .55% of the Fund's average net assets.
The investment adviser pays a portion of the management fees received from the Fund to the Fidelity Central Funds' investment advisers, who are also affiliates, for managing the assets of the Fidelity Central Funds.
Distribution and Service Plan Fees. In accordance with Rule 12b-1 of the 1940 Act, the Fund has adopted separate 12b-1 Plans for each Service Class of shares. Each Service Class pays Fidelity Distributors Corporation (FDC), an affiliate of the investment adviser, a service fee. For the period, the service fee is based on an annual rate of .10% of Service Class' average net assets and .25% of Service Class 2's average net assets.
For the period, total fees, all of which were re-allowed to insurance companies for the distribution of shares and providing shareholder support services, were as follows:
| Service Class | $1,318 |
| Service Class 2 | 4,183 |
| | $5,501 |
Transfer Agent Fees. Fidelity Investments Institutional Operations Company, Inc. (FIIOC), an affiliate of the investment adviser, is the Fund's transfer, dividend disbursing, and shareholder servicing agent. FIIOC receives an asset-based fee with respect to each class. Each class (with the exception of Investor Class) pays a fee for transfer agent services, typesetting, and printing and mailing of shareholder reports, excluding mailing of proxy statements, equal to an annual rate of .07%(.15% for Investor Class) of class-level average net assets. For the period, transfer agent fees for each class were as follows:
| Initial Class | $33,304 |
| Service Class | 870 |
| Service Class 2 | 1,104 |
| Investor Class | 73,440 |
| | $108,718 |
Accounting and Security Lending Fees. Fidelity Service Company, Inc. (FSC), an affiliate of the investment adviser, maintains the Fund's accounting records. The accounting fee is based on the level of average net assets for each month. Under a separate contract, FSC administers the security lending program. The security lending fee is based on the number and duration of lending transactions.
Brokerage Commissions. The Fund placed a portion of its portfolio transactions with brokerage firms which are affiliates of the investment adviser. Brokerage commissions are included in net realized gain (loss) and change in net unrealized appreciation (depreciation) in the Statement of Operations. The commissions paid to these affiliated firms were $1,093 for the period.
Interfund Trades. The Fund may purchase from or sell securities to other Fidelity Funds under procedures adopted by the Board. The procedures have been designed to ensure these interfund trades are executed in accordance with Rule 17a-7 of the 1940 Act. Interfund trades are included within the respective purchases and sales amounts shown in the Purchases and Sales of Investments note.
7. Committed Line of Credit.
The Fund participates with other funds managed by the investment adviser or an affiliate in a $4.25 billion credit facility (the "line of credit") to be utilized for temporary or emergency purposes to fund shareholder redemptions or for other short-term liquidity purposes. The Fund has agreed to pay commitment fees on its pro-rata portion of the line of credit, which amounted to $190 and is reflected in Miscellaneous expenses on the Statement of Operations. During the period, the Fund did not borrow on this line of credit.
8. Security Lending.
The Fund lends portfolio securities through a lending agent from time to time in order to earn additional income. For equity securities, a lending agent is used and may loan securities to certain qualified borrowers, including Fidelity Capital Markets (FCM), a broker-dealer affiliated with the Fund. On the settlement date of the loan, the Fund receives collateral (in the form of U.S. Treasury obligations, letters of credit and/or cash) against the loaned securities and maintains collateral in an amount not less than 100% of the market value of the loaned securities during the period of the loan. The market value of the loaned securities is determined at the close of business of the Fund and any additional required collateral is delivered to the Fund on the next business day. The Fund or borrower may terminate the loan at any time, and if the borrower defaults on its obligation to return the securities loaned because of insolvency or other reasons, the Fund may apply collateral received from the borrower against the obligation. The Fund may experience delays and costs in recovering the securities loaned. Any cash collateral received is invested in the Fidelity Securities Lending Cash Central Fund. The value of loaned securities and cash collateral at period end are disclosed on the Fund's Statement of Assets and Liabilities. Security lending income represents the income earned on investing cash collateral, less rebates paid to borrowers and any lending agent fees associated with the loan, plus any premium payments received for lending certain types of securities. Security lending income is presented in the Statement of Operations as a component of income from Fidelity Central Funds. Total security lending income during the period amounted to $17,791. During the period, there were no securities loaned to FCM.
9. Expense Reductions.
Commissions paid to certain brokers with whom the investment adviser, or its affiliates, places trades on behalf of the Fund include an amount in addition to trade execution, which may be rebated back to the Fund to offset certain expenses. This amount totaled $1,083 for the period.
In addition, through arrangements with the Fund's custodian, credits realized as a result of certain uninvested cash balances were used to reduce the Fund's expenses. During the period, these credits reduced the Fund's custody expenses by $11.
In addition, during the period the investment adviser reimbursed and/or waived a portion of fund-level operating expenses in the amount of $798.
10. Distributions to Shareholders.
Distributions to shareholders of each class were as follows:
| | Six months ended
June 30, 2016 | Year ended December 31, 2015 |
| From net investment income | | |
| Initial Class | $28,297 | $1,364,340 |
| Service Class | 741 | 32,613 |
| Service Class 2 | 914 | 37,340 |
| Investor Class | 27,811 | 1,275,114 |
| Total | $57,763 | $2,709,407 |
| From net realized gain | | |
| Initial Class | $1,494,080 | $68,121 |
| Service Class | 39,101 | 1,783 |
| Service Class 2 | 48,258 | 2,358 |
| Investor Class | 1,468,427 | 67,563 |
| Total | $3,049,866 | $139,825 |
11. Share Transactions.
Transactions for each class of shares were as follows:
| | Shares | Shares | Dollars | Dollars |
| | Six months ended
June 30, 2016 | Year ended December 31, 2015 | Six months ended
June 30, 2016 | Year ended December 31, 2015 |
| Initial Class | | | | |
| Shares sold | 41,330 | 157,200 | $741,002 | $3,129,085 |
| Reinvestment of distributions | 91,434 | 76,835 | 1,522,377 | 1,432,461 |
| Shares redeemed | (364,943) | (901,132) | (6,553,296) | (17,745,220) |
| Net increase (decrease) | (232,179) | (667,097) | $(4,289,917) | $(13,183,674) |
| Service Class | | | | |
| Shares sold | 1,748 | 13,010 | $30,766 | $247,977 |
| Reinvestment of distributions | 2,407 | 1,857 | 39,842 | 34,396 |
| Shares redeemed | (13,431) | (33,327) | (239,663) | (645,177) |
| Net increase (decrease) | (9,276) | (18,460) | $(169,055) | $(362,804) |
| Service Class 2 | | | | |
| Shares sold | 23,976 | 37,238 | $418,965 | $719,311 |
| Reinvestment of distributions | 2,987 | 2,155 | 49,172 | 39,698 |
| Shares redeemed | (25,279) | (39,082) | (445,270) | (752,402) |
| Net increase (decrease) | 1,684 | 311 | $22,867 | $6,607 |
| Investor Class | | | | |
| Shares sold | 170,945 | 1,485,488 | $3,053,876 | $29,406,847 |
| Reinvestment of distributions | 90,298 | 72,380 | 1,496,238 | 1,342,677 |
| Shares redeemed | (421,456) | (422,349) | (7,527,660) | (8,256,259) |
| Net increase (decrease) | (160,213) | 1,135,519 | $(2,977,546) | $22,493,265 |
12. Other.
The Fund's organizational documents provide former and current trustees and officers with a limited indemnification against liabilities arising in connection with the performance of their duties to the Fund. In the normal course of business, the Fund may also enter into contracts that provide general indemnifications. The Fund's maximum exposure under these arrangements is unknown as this would be dependent on future claims that may be made against the Fund. The risk of material loss from such claims is considered remote.
At the end of the period, the investment adviser or its affiliates were the owners of record of 85% of the total outstanding shares of the Fund.
Shareholder Expense Example
As a shareholder of the Fund, you incur two types of costs: (1) transaction costs and (2) ongoing costs, including management fees, distribution and/or service (12b-1) fees and other Fund expenses. This Example is intended to help you understand your ongoing costs (in dollars) of investing in the Fund and to compare these costs with the ongoing costs of investing in other mutual funds.
The Example is based on an investment of $1,000 invested at the beginning of the period and held for the entire period (January 1, 2016 to June 30, 2016).
Actual Expenses
The first line of the accompanying table for each class of the Fund provides information about actual account values and actual expenses. You may use the information in this line, together with the amount you invested, to estimate the expenses that you paid over the period. Simply divide your account value by $1,000.00 (for example, an $8,600 account value divided by $1,000.00 = 8.6), then multiply the result by the number in the first line for a class of the Fund under the heading entitled "Expenses Paid During Period" to estimate the expenses you paid on your account during this period. The estimate of expenses does not include any fees or other expenses of any variable annuity or variable life insurance product. If they were, the estimate of expenses you paid during the period would be higher, and your ending account value would be lower. In addition, the Fund, as a shareholder in the underlying Fidelity Central Funds, will indirectly bear its pro-rata share of the fees and expenses incurred by the underlying Fidelity Central Funds. These fees and expenses are not included in the Fund's annualized expense ratio used to calculate the expense estimate in the table below.
Hypothetical Example for Comparison Purposes
The second line of the accompanying table for each class of the Fund provides information about hypothetical account values and hypothetical expenses based on a Class' actual expense ratio and an assumed rate of return of 5% per year before expenses, which is not the Class' actual return. The hypothetical account values and expenses may not be used to estimate the actual ending account balance or expenses you paid for the period. You may use this information to compare the ongoing costs of investing in the Fund and other funds. To do so, compare this 5% hypothetical example with the 5% hypothetical examples that appear in the shareholder reports of the other funds. The estimate of expenses does not include any fees or other expenses of any variable annuity or variable life insurance product. If they were, the estimate of expenses you paid during the period would be higher, and your ending account value would be lower. In addition, the Fund, as a shareholder in the underlying Fidelity Central Funds, will indirectly bear its pro-rata share of the fees and expenses incurred by the underlying Fidelity Central Funds. These fees and expenses are not included in the Fund's annualized expense ratio used to calculate the expense estimate in the table below.
Please note that the expenses shown in the table are meant to highlight your ongoing costs only and do not reflect any transaction costs. Therefore, the second line of the table is useful in comparing ongoing costs only, and will not help you determine the relative total costs of owning different funds.
| | Annualized Expense Ratio-A | Beginning
Account Value
January 1, 2016 | Ending
Account Value
June 30, 2016 | Expenses Paid
During Period-B
January 1, 2016
to June 30, 2016 |
| Initial Class | .70% | | | |
| Actual | | $1,000.00 | $978.50 | $3.44 |
| Hypothetical-C | | $1,000.00 | $1,021.38 | $3.52 |
| Service Class | .80% | | | |
| Actual | | $1,000.00 | $977.30 | $3.93 |
| Hypothetical-C | | $1,000.00 | $1,020.89 | $4.02 |
| Service Class 2 | .95% | | | |
| Actual | | $1,000.00 | $976.70 | $4.67 |
| Hypothetical-C | | $1,000.00 | $1,020.14 | $4.77 |
| Investor Class | .78% | | | |
| Actual | | $1,000.00 | $977.40 | $3.83 |
| Hypothetical-C | | $1,000.00 | $1,020.98 | $3.92 |
A Annualized expense ratio reflects expenses net of applicable fee waivers.
B Expenses are equal to each Class' annualized expense ratio, multiplied by the average account value over the period, multiplied by 182/366 (to reflect the one-half year period). The fees and expenses of the underlying Fidelity Central Funds in which the Fund invests are not included in each Class' annualized expense ratio. In addition to the expenses noted above, the Fund also indirectly bears its proportional share of the expenses of the underlying Fidelity Central Funds. Annualized expenses of the underlying non-money market Fidelity Central Funds as of their most recent fiscal half year ranged from less than .005% to .10%.
C 5% return per year before expenses
VIPAMG-SANN-0816
1.705700.118
Fidelity® Variable Insurance Products:
Freedom Funds - Income, 2005, 2010, 2015, 2020, 2025, 2030, 2035, 2040, 2045, 2050
Semi-Annual Report June 30, 2016 |
|
Contents
To view a fund's proxy voting guidelines and proxy voting record for the 12-month period ended June 30, visit http://www.fidelity.com/proxyvotingresults or visit the Securities and Exchange Commission's (SEC) web site at http://www.sec.gov.
You may also call 1-877-208-0098 to request a free copy of the proxy voting guidelines.
Fidelity® Variable Insurance Products are separate account options which are purchased through a variable insurance contract.
Standard & Poor's, S&P and S&P 500 are registered service marks of The McGraw-Hill Companies, Inc. and have been licensed for use by Fidelity Distributors Corporation.
Other third-party marks appearing herein are the property of their respective owners.
All other marks appearing herein are registered or unregistered trademarks or service marks of FMR LLC or an affiliated company. © 2016 FMR LLC. All rights reserved.
This report and the financial statements contained herein are submitted for the general information of the shareholders of the Funds. This report is not authorized for distribution to prospective investors in the Funds unless preceded or accompanied by an effective prospectus.
A fund files its complete schedule of portfolio holdings with the SEC for the first and third quarters of each fiscal year on Form N-Q. Forms N-Q are available on the SEC’s web site at http://www.sec.gov. A fund's Forms N-Q may be reviewed and copied at the SEC’s Public Reference Room in Washington, DC. Information regarding the operation of the SEC's Public Reference Room may be obtained by calling 1-800-SEC-0330.
For a complete list of a fund's portfolio holdings, view the most recent holdings listing, semiannual report, or annual report on Fidelity's web site at http://www.fidelity.com, http://www.institutional.fidelity.com, or http://www.401k.com, as applicable.
NOT FDIC INSURED •MAY LOSE VALUE •NO BANK GUARANTEE
Neither the Funds nor Fidelity Distributors Corporation is a bank.
VIP Freedom Income Portfolio℠
Investment Summary (Unaudited)
The information in the following tables is based on the direct investments of the Fund.
Top Holdings as of June 30, 2016
| | % of fund's net assets | % of fund's net assets 6 months ago |
| VIP Investment Grade Bond Portfolio Initial Class | 40.7 | 42.4 |
| VIP Government Money Market Portfolio Initial Class 0.21% | 29.5 | 28.4 |
| VIP Overseas Portfolio Initial Class | 4.7 | 3.8 |
| VIP Emerging Markets Portfolio Initial Class | 4.6 | 3.6 |
| VIP High Income Portfolio Initial Class | 3.8 | 3.7 |
| VIP Growth & Income Portfolio Initial Class | 3.5 | 3.8 |
| VIP Equity-Income Portfolio Initial Class | 3.1 | 3.3 |
| VIP Growth Portfolio Initial Class | 3.0 | 3.3 |
| VIP Contrafund Portfolio Initial Class | 2.9 | 3.2 |
| VIP Value Portfolio Initial Class | 2.2 | 2.4 |
| | 98.0 | |
Asset Allocation (% of fund's net assets)
| Period end |
| | Domestic Equity Funds | 16.7% |
| | International Equity Funds | 9.3% |
| | Bond Funds | 44.5% |
| | Short-Term Funds | 29.5% |
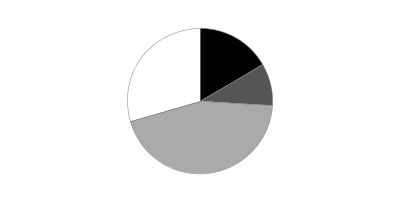
| Six months ago |
| | Domestic Equity Funds | 18.1% |
| | International Equity Funds | 7.4% |
| | Bond Funds | 46.1% |
| | Short-Term Funds | 28.4% |
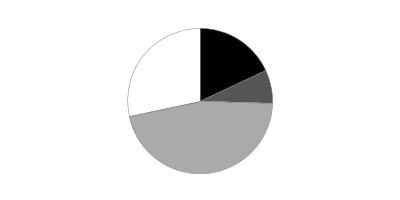
VIP Freedom Income Portfolio℠
Investments June 30, 2016 (Unaudited)
Showing Percentage of Net Assets
| Domestic Equity Funds - 16.7% | | | |
| | | Shares | Value |
| VIP Contrafund Portfolio Initial Class (a) | | 36,806 | $1,147,610 |
| VIP Equity-Income Portfolio Initial Class (a) | | 60,382 | 1,216,086 |
| VIP Growth & Income Portfolio Initial Class (a) | | 76,952 | 1,376,676 |
| VIP Growth Portfolio Initial Class (a) | | 20,469 | 1,167,980 |
| VIP Mid Cap Portfolio Initial Class (a) | | 10,861 | 334,311 |
| VIP Value Portfolio Initial Class (a) | | 64,776 | 880,307 |
| VIP Value Strategies Portfolio Initial Class (a) | | 29,512 | 430,289 |
| TOTAL DOMESTIC EQUITY FUNDS | | | |
| (Cost $6,014,939) | | | 6,553,259 |
|
| International Equity Funds - 9.3% | | | |
| VIP Emerging Markets Portfolio Initial Class (a) | | 208,087 | 1,799,954 |
| VIP Overseas Portfolio Initial Class (a) | | 104,493 | 1,862,058 |
| TOTAL INTERNATIONAL EQUITY FUNDS | | | |
| (Cost $3,445,642) | | | 3,662,012 |
|
| Bond Funds - 44.5% | | | |
| VIP High Income Portfolio Initial Class (a) | | 283,845 | 1,498,699 |
| VIP Investment Grade Bond Portfolio Initial Class (a) | | 1,220,683 | 15,978,733 |
| TOTAL BOND FUNDS | | | |
| (Cost $17,042,382) | | | 17,477,432 |
|
| Short-Term Funds - 29.5% | | | |
| VIP Government Money Market Portfolio Initial Class 0.21% (a)(b) | | | |
| (Cost $11,620,130) | | 11,620,130 | 11,620,130 |
| TOTAL INVESTMENT PORTFOLIO - 100.0% | | | |
| (Cost $38,123,093) | | | 39,312,833 |
| NET OTHER ASSETS (LIABILITIES) - 0.0% | | | (3,649) |
| NET ASSETS - 100% | | | $39,309,184 |
Legend
(a) Affiliated Fund
(b) The rate quoted is the annualized seven-day yield of the fund at period end.
Affiliated Underlying Funds
Information regarding the Fund's fiscal year to date purchases and sales of the affiliated Underlying Funds and income earned by the Fund from investments in affiliated Underlying Funds is as follows:
| Affiliate | Value, beginning of period | Purchases | Sales Proceeds | Dividend Income | Value, end of period |
| VIP Contrafund Portfolio Initial Class | $1,198,299 | $264,292 | $226,339 | $-- | $1,147,610 |
| VIP Emerging Markets Portfolio Initial Class | 1,352,923 | 499,162 | 173,597 | -- | 1,799,954 |
| VIP Equity-Income Portfolio Initial Class | 1,261,713 | 225,978 | 259,884 | -- | 1,216,086 |
| VIP Government Money Market Portfolio Initial Class 0.21% | 10,734,197 | 2,509,213 | 1,623,281 | 9,134 | 11,620,130 |
| VIP Growth & Income Portfolio Initial Class | 1,422,495 | 304,666 | 283,094 | -- | 1,376,676 |
| VIP Growth Portfolio Initial Class | 1,244,836 | 280,527 | 200,384 | -- | 1,167,980 |
| VIP High Income Portfolio Initial Class | 1,402,858 | 203,328 | 201,733 | -- | 1,498,699 |
| VIP Investment Grade Bond Portfolio Initial Class | 15,986,426 | 1,799,312 | 2,701,426 | 8,760 | 15,978,733 |
| VIP Mid Cap Portfolio Initial Class | 341,971 | 78,015 | 68,633 | -- | 334,311 |
| VIP Overseas Portfolio Initial Class | 1,454,171 | 851,306 | 352,001 | -- | 1,862,058 |
| VIP Value Portfolio Initial Class | 912,060 | 135,615 | 184,348 | -- | 880,307 |
| VIP Value Strategies Portfolio Initial Class | 440,077 | 79,907 | 92,659 | -- | 430,289 |
| Total | $37,752,026 | $7,231,321 | $6,367,379 | $17,894 | $39,312,833 |
Investment Valuation
All investments are categorized as Level 1 under the Fair Value Hierarchy. The inputs or methodology used for valuing securities may not be an indication of the risk associated with investing in those securities. For more information on valuation inputs please refer to the Investment Valuation section in the accompanying Notes to Financial Statements.
See accompanying notes which are an integral part of the financial statements.
VIP Freedom Income Portfolio℠
Financial Statements
Statement of Assets and Liabilities
| | | June 30, 2016 (Unaudited) |
| Assets | | |
| Investment in securities, at value (cost $38,123,093) — See accompanying schedule | | $39,312,833 |
| Receivable for fund shares sold | | 6,792 |
| Total assets | | 39,319,625 |
| Liabilities | | |
| Payable for investments purchased | $5,615 | |
| Payable for fund shares redeemed | 1,177 | |
| Distribution and service plan fees payable | 3,649 | |
| Total liabilities | | 10,441 |
| Net Assets | | $39,309,184 |
| Net Assets consist of: | | |
| Paid in capital | | $38,031,603 |
| Accumulated net investment loss | | (3,903) |
| Accumulated undistributed net realized gain (loss) on investments | | 91,744 |
| Net unrealized appreciation (depreciation) on investments | | 1,189,740 |
| Net Assets | | $39,309,184 |
| Initial Class: | | |
| Net Asset Value, offering price and redemption price per share ($15,316,157 ÷ 1,393,456 shares) | | $10.99 |
| Service Class: | | |
| Net Asset Value, offering price and redemption price per share ($9,679,931 ÷ 881,161 shares) | | $10.99 |
| Service Class 2: | | |
| Net Asset Value, offering price and redemption price per share ($14,313,096 ÷ 1,308,746 shares) | | $10.94 |
See accompanying notes which are an integral part of the financial statements.
Statement of Operations
| | | Six months ended June 30, 2016 (Unaudited) |
| Investment Income | | |
| Income distributions from underlying funds | | $17,894 |
| Expenses | | |
| Distribution and service plan fees | $21,797 | |
| Independent trustees' fees and expenses | 86 | |
| Total expenses before reductions | 21,883 | |
| Expense reductions | (86) | 21,797 |
| Net investment income (loss) | | (3,903) |
| Realized and Unrealized Gain (Loss) | | |
| Realized gain (loss) on sale of underlying fund shares | (128,375) | |
| Capital gain distributions from underlying funds | 413,932 | |
| Total net realized gain (loss) | | 285,557 |
| Change in net unrealized appreciation (depreciation) on underlying funds | | 825,233 |
| Net gain (loss) | | 1,110,790 |
| Net increase (decrease) in net assets resulting from operations | | $1,106,887 |
See accompanying notes which are an integral part of the financial statements.
Statement of Changes in Net Assets
| | Six months ended June 30, 2016 (Unaudited) | Year ended December 31, 2015 |
| Increase (Decrease) in Net Assets | | |
| Operations | | |
| Net investment income (loss) | $(3,903) | $626,019 |
| Net realized gain (loss) | 285,557 | 374,074 |
| Change in net unrealized appreciation (depreciation) | 825,233 | (1,291,995) |
| Net increase (decrease) in net assets resulting from operations | 1,106,887 | (291,902) |
| Distributions to shareholders from net investment income | – | (637,437) |
| Distributions to shareholders from net realized gain | (373,700) | (50,115) |
| Total distributions | (373,700) | (687,552) |
| Share transactions - net increase (decrease) | 827,560 | 6,289,229 |
| Total increase (decrease) in net assets | 1,560,747 | 5,309,775 |
| Net Assets | | |
| Beginning of period | 37,748,437 | 32,438,662 |
| End of period | $39,309,184 | $37,748,437 |
| Other Information | | |
| Accumulated net investment loss end of period | $(3,903) | $– |
See accompanying notes which are an integral part of the financial statements.
Financial Highlights — VIP Freedom Income Portfolio Initial Class
| | Six months ended (Unaudited) June 30, | Years ended December 31, | | | | |
| | 2016 | 2015 | 2014 | 2013 | 2012 | 2011 |
| Selected Per–Share Data | | | | | | |
| Net asset value, beginning of period | $10.78 | $11.03 | $10.89 | $10.57 | $10.21 | $10.27 |
| Income from Investment Operations | | | | | | |
| Net investment income (loss)A | .01 | .21 | .18 | .18 | .16 | .19 |
| Net realized and unrealized gain (loss) | .31 | (.25) | .23 | .40 | .50 | (.02) |
| Total from investment operations | .32 | (.04) | .41 | .58 | .66 | .17 |
| Distributions from net investment income | – | (.20) | (.17) | (.17) | (.16) | (.19) |
| Distributions from net realized gain | (.11) | (.02) | (.10) | (.10) | (.14) | (.04) |
| Total distributions | (.11) | (.21)B | (.27) | (.26)C | (.30) | (.23) |
| Net asset value, end of period | $10.99 | $10.78 | $11.03 | $10.89 | $10.57 | $10.21 |
| Total ReturnD,E,F | 3.00% | (.34)% | 3.78% | 5.55% | 6.52% | 1.63% |
| Ratios to Average Net AssetsG,H | | | | | | |
| Expenses before reductionsI | - %J | -% | -% | -% | -% | -% |
| Expenses net of fee waivers, if any | - %J | -% | -% | -% | -% | -% |
| Expenses net of all reductions | - %J | -% | -% | -% | -% | -% |
| Net investment income (loss) | .09%J | 1.85% | 1.62% | 1.67% | 1.55% | 1.85% |
| Supplemental Data | | | | | | |
| Net assets, end of period (000 omitted) | $15,316 | $14,548 | $17,386 | $16,980 | $14,184 | $10,938 |
| Portfolio turnover rateG | 33%J | 36% | 32% | 43% | 43% | 49% |
A Calculated based on average shares outstanding during the period.
B Total distributions of $.21 per share is comprised of distributions from net investment income of $.198 and distributions from net realized gain of $.015 per share.
C Total distributions of $.26 per share is comprised of distributions from net investment income of $.166 and distributions from net realized gain of $.097 per share.
D Total returns for periods of less than one year are not annualized.
E Total returns do not reflect charges attributable to your insurance company's separate account. Inclusion of these charges would reduce the total returns shown.
F Total returns would have been lower if certain expenses had not been reduced during the applicable periods shown.
G Amounts do not include the activity of the Underlying Funds.
H Expense ratios reflect operating expenses of the class. Expenses before reductions do not reflect amounts reimbursed by the investment adviser or reductions from expense offset arrangements and do not represent the amount paid by the class during periods when reimbursements or reductions occur. Expenses net of fee waivers reflect expenses after reimbursement by the investment adviser but prior to reductions from expense offset arrangements. Expenses net of all reductions represent the net expenses paid by the class but do not include expenses of the underlying funds in which the Fund invests.
I Amount represents less than .005%.
J Annualized
See accompanying notes which are an integral part of the financial statements.
Financial Highlights — VIP Freedom Income Portfolio Service Class
| | Six months ended (Unaudited) June 30, | Years ended December 31, | | | | |
| | 2016 | 2015 | 2014 | 2013 | 2012 | 2011 |
| Selected Per–Share Data | | | | | | |
| Net asset value, beginning of period | $10.78 | $11.03 | $10.89 | $10.58 | $10.22 | $10.28 |
| Income from Investment Operations | | | | | | |
| Net investment income (loss)A | –B | .19 | .17 | .17 | .15 | .18 |
| Net realized and unrealized gain (loss) | .32 | (.24) | .23 | .40 | .50 | (.02) |
| Total from investment operations | .32 | (.05) | .40 | .57 | .65 | .16 |
| Distributions from net investment income | – | (.19) | (.16) | (.16) | (.15) | (.18) |
| Distributions from net realized gain | (.11) | (.02) | (.10) | (.10) | (.14) | (.04) |
| Total distributions | (.11) | (.20)C | (.26) | (.26) | (.29) | (.22) |
| Net asset value, end of period | $10.99 | $10.78 | $11.03 | $10.89 | $10.58 | $10.22 |
| Total ReturnD,E,F | 3.00% | (.42)% | 3.69% | 5.38% | 6.42% | 1.56% |
| Ratios to Average Net AssetsG,H | | | | | | |
| Expenses before reductions | .10%I | .10% | .10% | .10% | .10% | .10% |
| Expenses net of fee waivers, if any | .10%I | .10% | .10% | .10% | .10% | .10% |
| Expenses net of all reductions | .10%I | .10% | .10% | .10% | .10% | .10% |
| Net investment income (loss) | (.01)%I | 1.75% | 1.52% | 1.57% | 1.45% | 1.75% |
| Supplemental Data | | | | | | |
| Net assets, end of period (000 omitted) | $9,680 | $9,825 | $6,193 | $4,529 | $2,467 | $2,505 |
| Portfolio turnover rateG | 33%I | 36% | 32% | 43% | 43% | 49% |
A Calculated based on average shares outstanding during the period.
B Amount represents less than $.005 per share.
C Total distributions of $.20 per share is comprised of distributions from net investment income of $.189 and distributions from net realized gain of $.015 per share.
D Total returns for periods of less than one year are not annualized.
E Total returns do not reflect charges attributable to your insurance company's separate account. Inclusion of these charges would reduce the total returns shown.
F Total returns would have been lower if certain expenses had not been reduced during the applicable periods shown.
G Amounts do not include the activity of the Underlying Funds.
H Expense ratios reflect operating expenses of the class. Expenses before reductions do not reflect amounts reimbursed by the investment adviser or reductions from expense offset arrangements and do not represent the amount paid by the class during periods when reimbursements or reductions occur. Expenses net of fee waivers reflect expenses after reimbursement by the investment adviser but prior to reductions from expense offset arrangements. Expenses net of all reductions represent the net expenses paid by the class but do not include expenses of the underlying funds in which the Fund invests.
I Annualized
See accompanying notes which are an integral part of the financial statements.
Financial Highlights — VIP Freedom Income Portfolio Service Class 2
| | Six months ended (Unaudited) June 30, | Years ended December 31, | | | | |
| | 2016 | 2015 | 2014 | 2013 | 2012 | 2011 |
| Selected Per–Share Data | | | | | | |
| Net asset value, beginning of period | $10.74 | $10.99 | $10.85 | $10.54 | $10.18 | $10.24 |
| Income from Investment Operations | | | | | | |
| Net investment income (loss)A | (.01) | .18 | .15 | .15 | .14 | .17 |
| Net realized and unrealized gain (loss) | .32 | (.24) | .23 | .40 | .49 | (.03) |
| Total from investment operations | .31 | (.06) | .38 | .55 | .63 | .14 |
| Distributions from net investment income | – | (.17) | (.14) | (.14) | (.13) | (.16) |
| Distributions from net realized gain | (.11) | (.02) | (.10) | (.10) | (.14) | (.04) |
| Total distributions | (.11) | (.19) | (.24) | (.24) | (.27) | (.20) |
| Net asset value, end of period | $10.94 | $10.74 | $10.99 | $10.85 | $10.54 | $10.18 |
| Total ReturnB,C,D | 2.92% | (.57)% | 3.54% | 5.21% | 6.26% | 1.39% |
| Ratios to Average Net AssetsE,F | | | | | | |
| Expenses before reductions | .25%G | .25% | .25% | .25% | .25% | .25% |
| Expenses net of fee waivers, if any | .25%G | .25% | .25% | .25% | .25% | .25% |
| Expenses net of all reductions | .25%G | .25% | .25% | .25% | .25% | .25% |
| Net investment income (loss) | (.16)%G | 1.60% | 1.37% | 1.42% | 1.30% | 1.60% |
| Supplemental Data | | | | | | |
| Net assets, end of period (000 omitted) | $14,313 | $13,375 | $8,860 | $7,500 | $6,495 | $7,731 |
| Portfolio turnover rateE | 33%G | 36% | 32% | 43% | 43% | 49% |
A Calculated based on average shares outstanding during the period.
B Total returns for periods of less than one year are not annualized.
C Total returns do not reflect charges attributable to your insurance company's separate account. Inclusion of these charges would reduce the total returns shown.
D Total returns would have been lower if certain expenses had not been reduced during the applicable periods shown.
E Amounts do not include the activity of the Underlying Funds.
F Expense ratios reflect operating expenses of the class. Expenses before reductions do not reflect amounts reimbursed by the investment adviser or reductions from expense offset arrangements and do not represent the amount paid by the class during periods when reimbursements or reductions occur. Expenses net of fee waivers reflect expenses after reimbursement by the investment adviser but prior to reductions from expense offset arrangements. Expenses net of all reductions represent the net expenses paid by the class but do not include expenses of the underlying funds in which the Fund invests.
G Annualized
See accompanying notes which are an integral part of the financial statements.
VIP Freedom 2005 Portfolio℠
Investment Summary (Unaudited)
The information in the following tables is based on the direct investments of the Fund.
Top Holdings as of June 30, 2016
| | % of fund's net assets | % of fund's net assets 6 months ago |
| VIP Investment Grade Bond Portfolio Initial Class | 36.3 | 37.4 |
| VIP Government Money Market Portfolio Initial Class 0.21% | 21.4 | 20.0 |
| VIP Overseas Portfolio Initial Class | 7.5 | 7.1 |
| VIP Emerging Markets Portfolio Initial Class | 5.6 | 4.6 |
| VIP Growth & Income Portfolio Initial Class | 5.3 | 5.7 |
| VIP Equity-Income Portfolio Initial Class | 4.7 | 5.0 |
| VIP Growth Portfolio Initial Class | 4.5 | 5.0 |
| VIP Contrafund Portfolio Initial Class | 4.5 | 4.8 |
| VIP High Income Portfolio Initial Class | 3.8 | 3.7 |
| VIP Value Portfolio Initial Class | 3.4 | 3.6 |
| | 97.0 | |
Asset Allocation (% of fund's net assets)
| Period end |
| | Domestic Equity Funds | 25.4% |
| | International Equity Funds | 13.1% |
| | Bond Funds | 40.1% |
| | Short-Term Funds | 21.4% |

| Six months ago |
| | Domestic Equity Funds | 27.2% |
| | International Equity Funds | 11.7% |
| | Bond Funds | 41.1% |
| | Short-Term Funds | 20.0% |

VIP Freedom 2005 Portfolio℠
Investments June 30, 2016 (Unaudited)
Showing Percentage of Net Assets
| Domestic Equity Funds - 25.4% | | | |
| | | Shares | Value |
| VIP Contrafund Portfolio Initial Class (a) | | 10,089 | $314,576 |
| VIP Equity-Income Portfolio Initial Class (a) | | 16,550 | 333,316 |
| VIP Growth & Income Portfolio Initial Class (a) | | 21,081 | 377,144 |
| VIP Growth Portfolio Initial Class (a) | | 5,610 | 320,129 |
| VIP Mid Cap Portfolio Initial Class (a) | | 3,000 | 92,348 |
| VIP Value Portfolio Initial Class (a) | | 17,771 | 241,506 |
| VIP Value Strategies Portfolio Initial Class (a) | | 8,109 | 118,223 |
| TOTAL DOMESTIC EQUITY FUNDS | | | |
| (Cost $1,569,054) | | | 1,797,242 |
|
| International Equity Funds - 13.1% | | | |
| VIP Emerging Markets Portfolio Initial Class (a) | | 46,300 | 400,493 |
| VIP Overseas Portfolio Initial Class (a) | | 29,779 | 530,660 |
| TOTAL INTERNATIONAL EQUITY FUNDS | | | |
| (Cost $940,303) | | | 931,153 |
|
| Bond Funds - 40.1% | | | |
| VIP High Income Portfolio Initial Class (a) | | 51,254 | 270,620 |
| VIP Investment Grade Bond Portfolio Initial Class (a) | | 196,050 | 2,566,300 |
| TOTAL BOND FUNDS | | | |
| (Cost $2,766,167) | | | 2,836,920 |
|
| Short-Term Funds - 21.4% | | | |
| VIP Government Money Market Portfolio Initial Class 0.21% (a)(b) | | | |
| (Cost $1,517,939) | | 1,517,939 | 1,517,939 |
| TOTAL INVESTMENT PORTFOLIO - 100.0% | | | |
| (Cost $6,793,463) | | | 7,083,254 |
| NET OTHER ASSETS (LIABILITIES) - 0.0% | | | (37) |
| NET ASSETS - 100% | | | $7,083,217 |
Legend
(a) Affiliated Fund
(b) The rate quoted is the annualized seven-day yield of the fund at period end.
Affiliated Underlying Funds
Information regarding the Fund's fiscal year to date purchases and sales of the affiliated Underlying Funds and income earned by the Fund from investments in affiliated Underlying Funds is as follows:
| Affiliate | Value, beginning of period | Purchases | Sales Proceeds | Dividend Income | Value, end of period |
| VIP Contrafund Portfolio Initial Class | $345,345 | $50,619 | $56,497 | $-- | $314,576 |
| VIP Emerging Markets Portfolio Initial Class | 334,048 | 74,893 | 34,470 | -- | 400,493 |
| VIP Equity-Income Portfolio Initial Class | 364,438 | 38,328 | 65,489 | -- | 333,316 |
| VIP Government Money Market Portfolio Initial Class 0.21% | 1,444,116 | 294,974 | 221,151 | 1,194 | 1,517,939 |
| VIP Growth & Income Portfolio Initial Class | 410,815 | 56,726 | 71,246 | -- | 377,144 |
| VIP Growth Portfolio Initial Class | 359,571 | 52,943 | 48,568 | -- | 320,129 |
| VIP High Income Portfolio Initial Class | 269,246 | 15,119 | 31,122 | -- | 270,620 |
| VIP Investment Grade Bond Portfolio Initial Class | 2,708,209 | 124,999 | 412,219 | 1,418 | 2,566,300 |
| VIP Mid Cap Portfolio Initial Class | 98,732 | 15,008 | 16,521 | -- | 92,348 |
| VIP Overseas Portfolio Initial Class | 508,345 | 144,002 | 89,827 | -- | 530,660 |
| VIP Value Portfolio Initial Class | 263,408 | 19,970 | 46,136 | -- | 241,506 |
| VIP Value Strategies Portfolio Initial Class | 127,061 | 13,594 | 23,075 | -- | 118,223 |
| Total | $7,233,334 | $901,175 | $1,116,321 | $2,612 | $7,083,254 |
Investment Valuation
All investments are categorized as Level 1 under the Fair Value Hierarchy. The inputs or methodology used for valuing securities may not be an indication of the risk associated with investing in those securities. For more information on valuation inputs please refer to the Investment Valuation section in the accompanying Notes to Financial Statements.
See accompanying notes which are an integral part of the financial statements.
VIP Freedom 2005 Portfolio℠
Financial Statements
Statement of Assets and Liabilities
| | | June 30, 2016 (Unaudited) |
| Assets | | |
| Investment in securities, at value (cost $6,793,463) — See accompanying schedule | | $7,083,254 |
| Receivable for investments sold | | 3,916 |
| Receivable for fund shares sold | | 125 |
| Total assets | | 7,087,295 |
| Liabilities | | |
| Payable for fund shares redeemed | $4,031 | |
| Distribution and service plan fees payable | 47 | |
| Total liabilities | | 4,078 |
| Net Assets | | $7,083,217 |
| Net Assets consist of: | | |
| Paid in capital | | $6,774,002 |
| Undistributed net investment income | | 2,367 |
| Accumulated undistributed net realized gain (loss) on investments | | 17,057 |
| Net unrealized appreciation (depreciation) on investments | | 289,791 |
| Net Assets | | $7,083,217 |
| Initial Class: | | |
| Net Asset Value, offering price and redemption price per share ($6,610,579 ÷ 577,739 shares) | | $11.44 |
| Service Class: | | |
| Net Asset Value, offering price and redemption price per share ($410,179 ÷ 35,650 shares) | | $11.51 |
| Service Class 2: | | |
| Net Asset Value, offering price and redemption price per share ($62,459 ÷ 5,471 shares) | | $11.42 |
See accompanying notes which are an integral part of the financial statements.
Statement of Operations
| | | Six months ended June 30, 2016 (Unaudited) |
| Investment Income | | |
| Income distributions from underlying funds | | $2,612 |
| Expenses | | |
| Distribution and service plan fees | $245 | |
| Independent trustees' fees and expenses | 16 | |
| Total expenses before reductions | 261 | |
| Expense reductions | (16) | 245 |
| Net investment income (loss) | | 2,367 |
| Realized and Unrealized Gain (Loss) | | |
| Realized gain (loss) on sale of underlying fund shares | (31,932) | |
| Capital gain distributions from underlying funds | 113,139 | |
| Total net realized gain (loss) | | 81,207 |
| Change in net unrealized appreciation (depreciation) on underlying funds | | 96,998 |
| Net gain (loss) | | 178,205 |
| Net increase (decrease) in net assets resulting from operations | | $180,572 |
See accompanying notes which are an integral part of the financial statements.
Statement of Changes in Net Assets
| | Six months ended June 30, 2016 (Unaudited) | Year ended December 31, 2015 |
| Increase (Decrease) in Net Assets | | |
| Operations | | |
| Net investment income (loss) | $2,367 | $135,391 |
| Net realized gain (loss) | 81,207 | 140,405 |
| Change in net unrealized appreciation (depreciation) | 96,998 | (302,191) |
| Net increase (decrease) in net assets resulting from operations | 180,572 | (26,395) |
| Distributions to shareholders from net investment income | – | (135,627) |
| Distributions to shareholders from net realized gain | (88,842) | (15,795) |
| Total distributions | (88,842) | (151,422) |
| Share transactions - net increase (decrease) | (241,796) | (1,122,509) |
| Total increase (decrease) in net assets | (150,066) | (1,300,326) |
| Net Assets | | |
| Beginning of period | 7,233,283 | 8,533,609 |
| End of period | $7,083,217 | $7,233,283 |
| Other Information | | |
| Undistributed net investment income end of period | $2,367 | $– |
See accompanying notes which are an integral part of the financial statements.
Financial Highlights — VIP Freedom 2005 Portfolio Initial Class
| | Six months ended (Unaudited) June 30, | Years ended December 31, | | | | |
| | 2016 | 2015 | 2014 | 2013 | 2012 | 2011 |
| Selected Per–Share Data | | | | | | |
| Net asset value, beginning of period | $11.29 | $11.56 | $11.37 | $10.56 | $9.86 | $10.07 |
| Income from Investment Operations | | | | | | |
| Net investment income (loss)A | –B | .19 | .20 | .17 | .18 | .22 |
| Net realized and unrealized gain (loss) | .29 | (.22) | .29 | .86 | .76 | (.20) |
| Total from investment operations | .29 | (.03) | .49 | 1.03 | .94 | .02 |
| Distributions from net investment income | – | (.22) | (.19) | (.18) | (.17) | (.19) |
| Distributions from net realized gain | (.14) | (.03) | (.11) | (.04) | (.07) | (.04) |
| Total distributions | (.14) | (.24)C | (.30) | (.22) | (.24) | (.23) |
| Net asset value, end of period | $11.44 | $11.29 | $11.56 | $11.37 | $10.56 | $9.86 |
| Total ReturnD,E,F | 2.70% | (.25)% | 4.30% | 9.74% | 9.57% | .18% |
| Ratios to Average Net AssetsG,H | | | | | | |
| Expenses before reductionsI | - %J | -% | -% | -% | -% | -% |
| Expenses net of fee waivers, if any | - %J | -% | -% | -% | -% | -% |
| Expenses net of all reductions | - %J | -% | -% | -% | -% | -% |
| Net investment income (loss) | .07%J | 1.64% | 1.71% | 1.57% | 1.72% | 2.17% |
| Supplemental Data | | | | | | |
| Net assets, end of period (000 omitted) | $6,611 | $6,657 | $8,047 | $7,145 | $5,971 | $5,224 |
| Portfolio turnover rateG | 26%J | 23% | 21% | 54% | 30% | 54% |
A Calculated based on average shares outstanding during the period.
B Amount represents less than $.005 per share.
C Total distributions of $.24 per share is comprised of distributions from net investment income of $.217 and distributions from net realized gain of $.025 per share.
D Total returns for periods of less than one year are not annualized.
E Total returns do not reflect charges attributable to your insurance company's separate account. Inclusion of these charges would reduce the total returns shown.
F Total returns would have been lower if certain expenses had not been reduced during the applicable periods shown.
G Amounts do not include the activity of the Underlying Funds.
H Expense ratios reflect operating expenses of the class. Expenses before reductions do not reflect amounts reimbursed by the investment adviser or reductions from expense offset arrangements and do not represent the amount paid by the class during periods when reimbursements or reductions occur. Expenses net of fee waivers reflect expenses after reimbursement by the investment adviser but prior to reductions from expense offset arrangements. Expenses net of all reductions represent the net expenses paid by the class but do not include expenses of the underlying funds in which the Fund invests.
I Amount represents less than .005%.
J Annualized
See accompanying notes which are an integral part of the financial statements.
Financial Highlights — VIP Freedom 2005 Portfolio Service Class
| | Six months ended (Unaudited) June 30, | Years ended December 31, | | | | |
| | 2016 | 2015 | 2014 | 2013 | 2012 | 2011 |
| Selected Per–Share Data | | | | | | |
| Net asset value, beginning of period | $11.36 | $11.63 | $11.44 | $10.57 | $9.86 | $10.08 |
| Income from Investment Operations | | | | | | |
| Net investment income (loss)A | –B | .18 | .19 | .16 | .17 | .21 |
| Net realized and unrealized gain (loss) | .29 | (.22) | .29 | .85 | .77 | (.21) |
| Total from investment operations | .29 | (.04) | .48 | 1.01 | .94 | –B |
| Distributions from net investment income | – | (.21) | (.18) | (.11) | (.16) | (.18) |
| Distributions from net realized gain | (.14) | (.03) | (.11) | (.04) | (.07) | (.04) |
| Total distributions | (.14) | (.23)C | (.29) | (.14)D | (.23) | (.22) |
| Net asset value, end of period | $11.51 | $11.36 | $11.63 | $11.44 | $10.57 | $9.86 |
| Total ReturnE,F,G | 2.69% | (.35)% | 4.18% | 9.60% | 9.59% | (.04)% |
| Ratios to Average Net AssetsH,I | | | | | | |
| Expenses before reductions | .10%J | .10% | .10% | .10% | .10% | .10% |
| Expenses net of fee waivers, if any | .10%J | .10% | .10% | .10% | .10% | .10% |
| Expenses net of all reductions | .10%J | .10% | .10% | .10% | .10% | .10% |
| Net investment income (loss) | (.02)%J | 1.54% | 1.61% | 1.47% | 1.62% | 2.07% |
| Supplemental Data | | | | | | |
| Net assets, end of period (000 omitted) | $410 | $484 | $408 | $125 | $177 | $95 |
| Portfolio turnover rateH | 26%J | 23% | 21% | 54% | 30% | 54% |
A Calculated based on average shares outstanding during the period.
B Amount represents less than $.005 per share.
C Total distributions of $.23 per share is comprised of distributions from net investment income of $.206 and distributions from net realized gain of $.025 per share.
D Total distributions of $.14 per share is comprised of distributions from net investment income of $.107 and distributions from net realized gain of $.037 per share.
E Total returns for periods of less than one year are not annualized.
F Total returns do not reflect charges attributable to your insurance company's separate account. Inclusion of these charges would reduce the total returns shown.
G Total returns would have been lower if certain expenses had not been reduced during the applicable periods shown.
H Amounts do not include the activity of the Underlying Funds.
I Expense ratios reflect operating expenses of the class. Expenses before reductions do not reflect amounts reimbursed by the investment adviser or reductions from expense offset arrangements and do not represent the amount paid by the class during periods when reimbursements or reductions occur. Expenses net of fee waivers reflect expenses after reimbursement by the investment adviser but prior to reductions from expense offset arrangements. Expenses net of all reductions represent the net expenses paid by the class but do not include expenses of the underlying funds in which the Fund invests.
J Annualized
See accompanying notes which are an integral part of the financial statements.
Financial Highlights — VIP Freedom 2005 Portfolio Service Class 2
| | Six months ended (Unaudited) June 30, | Years ended December 31, | | | | |
| | 2016 | 2015 | 2014 | 2013 | 2012 | 2011 |
| Selected Per–Share Data | | | | | | |
| Net asset value, beginning of period | $11.28 | $11.55 | $11.36 | $10.55 | $9.85 | $10.08 |
| Income from Investment Operations | | | | | | |
| Net investment income (loss)A | (.01) | .16 | .17 | .15 | .15 | .19 |
| Net realized and unrealized gain (loss) | .29 | (.21) | .29 | .85 | .77 | (.20) |
| Total from investment operations | .28 | (.05) | .46 | 1.00 | .92 | (.01) |
| Distributions from net investment income | – | (.19) | (.16) | (.15) | (.15) | (.18) |
| Distributions from net realized gain | (.14) | (.03) | (.11) | (.04) | (.07) | (.04) |
| Total distributions | (.14) | (.22) | (.27) | (.19) | (.22) | (.22) |
| Net asset value, end of period | $11.42 | $11.28 | $11.55 | $11.36 | $10.55 | $9.85 |
| Total ReturnB,C,D | 2.62% | (.49)% | 4.04% | 9.46% | 9.35% | (.09)% |
| Ratios to Average Net AssetsE,F | | | | | | |
| Expenses before reductions | .25%G | .25% | .25% | .25% | .25% | .25% |
| Expenses net of fee waivers, if any | .25%G | .25% | .25% | .25% | .25% | .25% |
| Expenses net of all reductions | .25%G | .25% | .25% | .25% | .25% | .25% |
| Net investment income (loss) | (.18)%G | 1.39% | 1.46% | 1.31% | 1.48% | 1.92% |
| Supplemental Data | | | | | | |
| Net assets, end of period (000 omitted) | $62 | $92 | $79 | $102 | $251 | $226 |
| Portfolio turnover rateE | 26%G | 23% | 21% | 54% | 30% | 54% |
A Calculated based on average shares outstanding during the period.
B Total returns for periods of less than one year are not annualized.
C Total returns do not reflect charges attributable to your insurance company's separate account. Inclusion of these charges would reduce the total returns shown.
D Total returns would have been lower if certain expenses had not been reduced during the applicable periods shown.
E Amounts do not include the activity of the Underlying Funds.
F Expense ratios reflect operating expenses of the class. Expenses before reductions do not reflect amounts reimbursed by the investment adviser or reductions from expense offset arrangements and do not represent the amount paid by the class during periods when reimbursements or reductions occur. Expenses net of fee waivers reflect expenses after reimbursement by the investment adviser but prior to reductions from expense offset arrangements. Expenses net of all reductions represent the net expenses paid by the class but do not include expenses of the underlying funds in which the Fund invests.
G Annualized
See accompanying notes which are an integral part of the financial statements.
VIP Freedom 2010 Portfolio℠
Investment Summary (Unaudited)
The information in the following tables is based on the direct investments of the Fund.
Top Holdings as of June 30, 2016
| | % of fund's net assets | % of fund's net assets 6 months ago |
| VIP Investment Grade Bond Portfolio Initial Class | 32.8 | 33.7 |
| VIP Government Money Market Portfolio Initial Class 0.21% | 15.8 | 14.6 |
| VIP Overseas Portfolio Initial Class | 9.5 | 9.2 |
| VIP Growth & Income Portfolio Initial Class | 6.6 | 7.0 |
| VIP Emerging Markets Portfolio Initial Class | 6.5 | 5.4 |
| VIP Equity-Income Portfolio Initial Class | 5.9 | 6.2 |
| VIP Growth Portfolio Initial Class | 5.6 | 6.1 |
| VIP Contrafund Portfolio Initial Class | 5.5 | 5.8 |
| VIP Value Portfolio Initial Class | 4.3 | 4.5 |
| VIP High Income Portfolio Initial Class | 3.8 | 3.7 |
| | 96.3 | |
Asset Allocation (% of fund's net assets)
| Period end |
| | Domestic Equity Funds | 31.6% |
| | International Equity Funds | 16.0% |
| | Bond Funds | 36.6% |
| | Short-Term Funds | 15.8% |

| Six months ago |
| | Domestic Equity Funds | 33.4% |
| | International Equity Funds | 14.6% |
| | Bond Funds | 37.4% |
| | Short-Term Funds | 14.6% |

VIP Freedom 2010 Portfolio℠
Investments June 30, 2016 (Unaudited)
Showing Percentage of Net Assets
| Domestic Equity Funds - 31.6% | | | |
| | | Shares | Value |
| VIP Contrafund Portfolio Initial Class (a) | | 524,947 | $16,367,838 |
| VIP Equity-Income Portfolio Initial Class (a) | | 861,101 | 17,342,570 |
| VIP Growth & Income Portfolio Initial Class (a) | | 1,096,983 | 19,625,020 |
| VIP Growth Portfolio Initial Class (a) | | 291,930 | 16,657,531 |
| VIP Mid Cap Portfolio Initial Class (a) | | 155,862 | 4,797,445 |
| VIP Value Portfolio Initial Class (a) | | 924,460 | 12,563,410 |
| VIP Value Strategies Portfolio Initial Class (a) | | 420,246 | 6,127,182 |
| TOTAL DOMESTIC EQUITY FUNDS | | | |
| (Cost $76,667,263) | | | 93,480,996 |
|
| International Equity Funds - 16.0% | | | |
| VIP Emerging Markets Portfolio Initial Class (a) | | 2,224,154 | 19,238,931 |
| VIP Overseas Portfolio Initial Class (a) | | 1,573,537 | 28,040,420 |
| TOTAL INTERNATIONAL EQUITY FUNDS | | | |
| (Cost $45,243,748) | | | 47,279,351 |
|
| Bond Funds - 36.6% | | | |
| VIP High Income Portfolio Initial Class (a) | | 2,143,714 | 11,318,811 |
| VIP Investment Grade Bond Portfolio Initial Class (a) | | 7,399,152 | 96,854,901 |
| TOTAL BOND FUNDS | | | |
| (Cost $105,847,539) | | | 108,173,712 |
|
| Short-Term Funds - 15.8% | | | |
| VIP Government Money Market Portfolio Initial Class 0.21% (a)(b) | | | |
| (Cost $46,874,919) | | 46,874,919 | 46,874,919 |
| TOTAL INVESTMENT PORTFOLIO - 100.0% | | | |
| (Cost $274,633,469) | | | 295,808,978 |
| NET OTHER ASSETS (LIABILITIES) - 0.0% | | | (52,266) |
| NET ASSETS - 100% | | | $295,756,712 |
Legend
(a) Affiliated Fund
(b) The rate quoted is the annualized seven-day yield of the fund at period end.
Affiliated Underlying Funds
Information regarding the Fund's fiscal year to date purchases and sales of the affiliated Underlying Funds and income earned by the Fund from investments in affiliated Underlying Funds is as follows:
| Affiliate | Value, beginning of period | Purchases | Sales Proceeds | Dividend Income | Value, end of period |
| VIP Contrafund Portfolio Initial Class | $17,167,420 | $2,266,391 | $1,833,585 | $-- | $16,367,838 |
| VIP Emerging Markets Portfolio Initial Class | 15,839,466 | 2,999,701 | 862,541 | -- | 19,238,931 |
| VIP Equity-Income Portfolio Initial Class | 18,113,503 | 1,654,393 | 2,261,297 | -- | 17,342,570 |
| VIP Government Money Market Portfolio Initial Class 0.21% | 42,599,519 | 9,534,982 | 5,259,581 | 36,278 | 46,874,919 |
| VIP Growth & Income Portfolio Initial Class | 20,424,953 | 2,506,528 | 2,370,289 | -- | 19,625,020 |
| VIP Growth Portfolio Initial Class | 17,868,742 | 2,422,623 | 1,438,887 | -- | 16,657,531 |
| VIP High Income Portfolio Initial Class | 10,923,164 | 490,801 | 814,840 | -- | 11,318,811 |
| VIP Investment Grade Bond Portfolio Initial Class | 98,704,908 | 3,340,470 | 10,620,520 | 52,551 | 96,854,901 |
| VIP Mid Cap Portfolio Initial Class | 4,910,483 | 667,709 | 542,593 | -- | 4,797,445 |
| VIP Overseas Portfolio Initial Class | 26,869,493 | 5,868,131 | 2,995,396 | -- | 28,040,420 |
| VIP Value Portfolio Initial Class | 13,096,481 | 766,730 | 1,542,155 | -- | 12,563,410 |
| VIP Value Strategies Portfolio Initial Class | 6,319,924 | 569,110 | 806,451 | -- | 6,127,182 |
| Total | $292,838,056 | $33,087,569 | $31,348,135 | $88,829 | $295,808,978 |
Investment Valuation
All investments are categorized as Level 1 under the Fair Value Hierarchy. The inputs or methodology used for valuing securities may not be an indication of the risk associated with investing in those securities. For more information on valuation inputs please refer to the Investment Valuation section in the accompanying Notes to Financial Statements.
See accompanying notes which are an integral part of the financial statements.
VIP Freedom 2010 Portfolio℠
Financial Statements
Statement of Assets and Liabilities
| | | June 30, 2016 (Unaudited) |
| Assets | | |
| Investment in securities, at value (cost $274,633,469) — See accompanying schedule | | $295,808,978 |
| Cash | | 4 |
| Receivable for investments sold | | 160,993 |
| Receivable for fund shares sold | | 3,315 |
| Total assets | | 295,973,290 |
| Liabilities | | |
| Payable for fund shares redeemed | $164,305 | |
| Distribution and service plan fees payable | 52,273 | |
| Total liabilities | | 216,578 |
| Net Assets | | $295,756,712 |
| Net Assets consist of: | | |
| Paid in capital | | $271,700,134 |
| Accumulated net investment loss | | (215,741) |
| Accumulated undistributed net realized gain (loss) on investments | | 3,096,810 |
| Net unrealized appreciation (depreciation) on investments | | 21,175,509 |
| Net Assets | | $295,756,712 |
| Initial Class: | | |
| Net Asset Value, offering price and redemption price per share ($30,468,341 ÷ 2,506,395 shares) | | $12.16 |
| Service Class: | | |
| Net Asset Value, offering price and redemption price per share ($23,511,950 ÷ 1,937,268 shares) | | $12.14 |
| Service Class 2: | | |
| Net Asset Value, offering price and redemption price per share ($241,776,421 ÷ 20,029,382 shares) | | $12.07 |
See accompanying notes which are an integral part of the financial statements.
Statement of Operations
| | | Six months ended June 30, 2016 (Unaudited) |
| Investment Income | | |
| Income distributions from underlying funds | | $88,829 |
| Expenses | | |
| Distribution and service plan fees | $305,673 | |
| Independent trustees' fees and expenses | 654 | |
| Total expenses before reductions | 306,327 | |
| Expense reductions | (654) | 305,673 |
| Net investment income (loss) | | (216,844) |
| Realized and Unrealized Gain (Loss) | | |
| Realized gain (loss) on sale of underlying fund shares | (1,197,359) | |
| Capital gain distributions from underlying funds | 5,745,435 | |
| Total net realized gain (loss) | | 4,548,076 |
| Change in net unrealized appreciation (depreciation) on underlying funds | | 2,428,844 |
| Net gain (loss) | | 6,976,920 |
| Net increase (decrease) in net assets resulting from operations | | $6,760,076 |
See accompanying notes which are an integral part of the financial statements.
Statement of Changes in Net Assets
| | Six months ended June 30, 2016 (Unaudited) | Year ended December 31, 2015 |
| Increase (Decrease) in Net Assets | | |
| Operations | | |
| Net investment income (loss) | $(216,844) | $4,822,305 |
| Net realized gain (loss) | 4,548,076 | 6,948,444 |
| Change in net unrealized appreciation (depreciation) | 2,428,844 | (13,081,892) |
| Net increase (decrease) in net assets resulting from operations | 6,760,076 | (1,311,143) |
| Distributions to shareholders from net investment income | – | (4,856,161) |
| Distributions to shareholders from net realized gain | (6,512,119) | (854,192) |
| Total distributions | (6,512,119) | (5,710,353) |
| Share transactions - net increase (decrease) | 2,722,342 | 4,077,539 |
| Total increase (decrease) in net assets | 2,970,299 | (2,943,957) |
| Net Assets | | |
| Beginning of period | 292,786,413 | 295,730,370 |
| End of period | $295,756,712 | $292,786,413 |
| Other Information | | |
| Undistributed net investment income end of period | $– | $1,103 |
| Accumulated net investment loss end of period | $(215,741) | $– |
See accompanying notes which are an integral part of the financial statements.
Financial Highlights — VIP Freedom 2010 Portfolio Initial Class
| | Six months ended (Unaudited) June 30, | Years ended December 31, | | | | |
| | 2016 | 2015 | 2014 | 2013 | 2012 | 2011 |
| Selected Per–Share Data | | | | | | |
| Net asset value, beginning of period | $12.15 | $12.45 | $12.30 | $11.15 | $10.31 | $10.61 |
| Income from Investment Operations | | | | | | |
| Net investment income (loss)A | –B | .23 | .21 | .22 | .23 | .24 |
| Net realized and unrealized gain (loss) | .28 | (.26) | .34 | 1.27 | .98 | (.26) |
| Total from investment operations | .28 | (.03) | .55 | 1.49 | 1.21 | (.02) |
| Distributions from net investment income | – | (.23) | (.21) | (.21) | (.21) | (.23) |
| Distributions from net realized gain | (.27) | (.04) | (.20) | (.14) | (.16) | (.06) |
| Total distributions | (.27) | (.27) | (.40)C | (.34)D | (.37) | (.28)E |
| Net asset value, end of period | $12.16 | $12.15 | $12.45 | $12.30 | $11.15 | $10.31 |
| Total ReturnF,G,H | 2.52% | (.29)% | 4.53% | 13.49% | 11.78% | (.19)% |
| Ratios to Average Net AssetsI,J | | | | | | |
| Expenses before reductionsK | - %L | -% | -% | -% | -% | -% |
| Expenses net of fee waivers, if any | - %L | -% | -% | -% | -% | -% |
| Expenses net of all reductions | - %L | -% | -% | -% | -% | -% |
| Net investment income (loss) | .06%L | 1.84% | 1.67% | 1.83% | 2.07% | 2.27% |
| Supplemental Data | | | | | | |
| Net assets, end of period (000 omitted) | $30,468 | $31,048 | $43,381 | $44,430 | $27,416 | $22,338 |
| Portfolio turnover rateI | 22%L | 19% | 19% | 19% | 18% | 17% |
A Calculated based on average shares outstanding during the period.
B Amount represents less than $.005 per share.
C Total distributions of $.40 per share is comprised of distributions from net investment income of $.206 and distributions from net realized gain of $.196 per share.
D Total distributions of $.34 per share is comprised of distributions from net investment income of $.205 and distributions from net realized gain of $.139 per share.
E Total distributions of $.28 per share is comprised of distributions from net investment income of $.225 and distributions from net realized gain of $.055 per share.
F Total returns for periods of less than one year are not annualized.
G Total returns do not reflect charges attributable to your insurance company's separate account. Inclusion of these charges would reduce the total returns shown.
H Total returns would have been lower if certain expenses had not been reduced during the applicable periods shown.
I Amounts do not include the activity of the Underlying Funds.
J Expense ratios reflect operating expenses of the class. Expenses before reductions do not reflect amounts reimbursed by the investment adviser or reductions from expense offset arrangements and do not represent the amount paid by the class during periods when reimbursements or reductions occur. Expenses net of fee waivers reflect expenses after reimbursement by the investment adviser but prior to reductions from expense offset arrangements. Expenses net of all reductions represent the net expenses paid by the class but do not include expenses of the underlying funds in which the Fund invests.
K Amount represents less than .005%.
L Annualized
See accompanying notes which are an integral part of the financial statements.
Financial Highlights — VIP Freedom 2010 Portfolio Service Class
| | Six months ended (Unaudited) June 30, | Years ended December 31, | | | | |
| | 2016 | 2015 | 2014 | 2013 | 2012 | 2011 |
| Selected Per–Share Data | | | | | | |
| Net asset value, beginning of period | $12.14 | $12.43 | $12.29 | $11.14 | $10.30 | $10.60 |
| Income from Investment Operations | | | | | | |
| Net investment income (loss)A | –B | .22 | .20 | .20 | .22 | .23 |
| Net realized and unrealized gain (loss) | .27 | (.26) | .33 | 1.28 | .98 | (.26) |
| Total from investment operations | .27 | (.04) | .53 | 1.48 | 1.20 | (.03) |
| Distributions from net investment income | – | (.22) | (.19) | (.19) | (.20) | (.22) |
| Distributions from net realized gain | (.27) | (.04) | (.20) | (.14) | (.16) | (.06) |
| Total distributions | (.27) | (.25)C | (.39) | (.33) | (.36) | (.27)D |
| Net asset value, end of period | $12.14 | $12.14 | $12.43 | $12.29 | $11.14 | $10.30 |
| Total ReturnE,F,G | 2.44% | (.31)% | 4.35% | 13.39% | 11.69% | (.28)% |
| Ratios to Average Net AssetsH,I | | | | | | |
| Expenses before reductions | .10%J | .10% | .10% | .10% | .10% | .10% |
| Expenses net of fee waivers, if any | .10%J | .10% | .10% | .10% | .10% | .10% |
| Expenses net of all reductions | .10%J | .10% | .10% | .10% | .10% | .10% |
| Net investment income (loss) | (.04)%J | 1.74% | 1.57% | 1.73% | 1.97% | 2.17% |
| Supplemental Data | | | | | | |
| Net assets, end of period (000 omitted) | $23,512 | $23,770 | $28,049 | $27,143 | $23,896 | $20,927 |
| Portfolio turnover rateH | 22%J | 19% | 19% | 19% | 18% | 17% |
A Calculated based on average shares outstanding during the period.
B Amount represents less than $.005 per share.
C Total distributions of $.25 per share is comprised of distributions from net investment income of $.217 and distributions from net realized gain of $.036 per share.
D Total distributions of $.27 per share is comprised of distributions from net investment income of $.215 and distributions from net realized gain of $.055 per share.
E Total returns for periods of less than one year are not annualized.
F Total returns do not reflect charges attributable to your insurance company's separate account. Inclusion of these charges would reduce the total returns shown.
G Total returns would have been lower if certain expenses had not been reduced during the applicable periods shown.
H Amounts do not include the activity of the Underlying Funds.
I Expense ratios reflect operating expenses of the class. Expenses before reductions do not reflect amounts reimbursed by the investment adviser or reductions from expense offset arrangements and do not represent the amount paid by the class during periods when reimbursements or reductions occur. Expenses net of fee waivers reflect expenses after reimbursement by the investment adviser but prior to reductions from expense offset arrangements. Expenses net of all reductions represent the net expenses paid by the class but do not include expenses of the underlying funds in which the Fund invests.
J Annualized
See accompanying notes which are an integral part of the financial statements.
Financial Highlights — VIP Freedom 2010 Portfolio Service Class 2
| | Six months ended (Unaudited) June 30, | Years ended December 31, | | | | |
| | 2016 | 2015 | 2014 | 2013 | 2012 | 2011 |
| Selected Per–Share Data | | | | | | |
| Net asset value, beginning of period | $12.08 | $12.38 | $12.24 | $11.10 | $10.26 | $10.56 |
| Income from Investment Operations | | | | | | |
| Net investment income (loss)A | (.01) | .20 | .18 | .19 | .20 | .22 |
| Net realized and unrealized gain (loss) | .27 | (.26) | .33 | 1.27 | .98 | (.26) |
| Total from investment operations | .26 | (.06) | .51 | 1.46 | 1.18 | (.04) |
| Distributions from net investment income | – | (.20) | (.18) | (.18) | (.19) | (.20) |
| Distributions from net realized gain | (.27) | (.04) | (.20) | (.14) | (.16) | (.06) |
| Total distributions | (.27) | (.24) | (.37)B | (.32) | (.34)C | (.26) |
| Net asset value, end of period | $12.07 | $12.08 | $12.38 | $12.24 | $11.10 | $10.26 |
| Total ReturnD,E,F | 2.36% | (.53)% | 4.21% | 13.20% | 11.58% | (.43)% |
| Ratios to Average Net AssetsG,H | | | | | | |
| Expenses before reductions | .25%I | .25% | .25% | .25% | .25% | .25% |
| Expenses net of fee waivers, if any | .25%I | .25% | .25% | .25% | .25% | .25% |
| Expenses net of all reductions | .25%I | .25% | .25% | .25% | .25% | .25% |
| Net investment income (loss) | (.19)%I | 1.59% | 1.42% | 1.58% | 1.82% | 2.02% |
| Supplemental Data | | | | | | |
| Net assets, end of period (000 omitted) | $241,776 | $237,969 | $224,300 | $209,377 | $167,502 | $136,353 |
| Portfolio turnover rateG | 22%I | 19% | 19% | 19% | 18% | 17% |
A Calculated based on average shares outstanding during the period.
B Total distributions of $.37 per share is comprised of distributions from net investment income of $.175 and distributions from net realized gain of $.196 per share.
C Total distributions of $.34 per share is comprised of distributions from net investment income of $.186 and distributions from net realized gain of $.157 per share.
D Total returns for periods of less than one year are not annualized.
E Total returns do not reflect charges attributable to your insurance company's separate account. Inclusion of these charges would reduce the total returns shown.
F Total returns would have been lower if certain expenses had not been reduced during the applicable periods shown.
G Amounts do not include the activity of the Underlying Funds.
H Expense ratios reflect operating expenses of the class. Expenses before reductions do not reflect amounts reimbursed by the investment adviser or reductions from expense offset arrangements and do not represent the amount paid by the class during periods when reimbursements or reductions occur. Expenses net of fee waivers reflect expenses after reimbursement by the investment adviser but prior to reductions from expense offset arrangements. Expenses net of all reductions represent the net expenses paid by the class but do not include expenses of the underlying funds in which the Fund invests.
I Annualized
See accompanying notes which are an integral part of the financial statements.
VIP Freedom 2015 Portfolio℠
Investment Summary (Unaudited)
The information in the following tables is based on the direct investments of the Fund.
Top Holdings as of June 30, 2016
| | % of fund's net assets | % of fund's net assets 6 months ago |
| VIP Investment Grade Bond Portfolio Initial Class | 29.2 | 30.3 |
| VIP Overseas Portfolio Initial Class | 11.5 | 11.2 |
| VIP Government Money Market Portfolio Initial Class 0.21% | 10.6 | 9.4 |
| VIP Growth & Income Portfolio Initial Class | 8.0 | 8.2 |
| VIP Emerging Markets Portfolio Initial Class | 7.1 | 6.0 |
| VIP Equity-Income Portfolio Initial Class | 7.0 | 7.3 |
| VIP Growth Portfolio Initial Class | 6.7 | 7.2 |
| VIP Contrafund Portfolio Initial Class | 6.6 | 6.9 |
| VIP Value Portfolio Initial Class | 5.1 | 5.3 |
| VIP High Income Portfolio Initial Class | 3.8 | 3.7 |
| | 95.6 | |
Asset Allocation (% of fund's net assets)
| Period end |
| | Domestic Equity Funds | 37.8% |
| | International Equity Funds | 18.6% |
| | Bond Funds | 33.0% |
| | Short-Term Funds | 10.6% |

| Six months ago |
| | Domestic Equity Funds | 39.4% |
| | International Equity Funds | 17.2% |
| | Bond Funds | 34.0% |
| | Short-Term Funds | 9.4% |

VIP Freedom 2015 Portfolio℠
Investments June 30, 2016 (Unaudited)
Showing Percentage of Net Assets
| Domestic Equity Funds - 37.8% | | | |
| | | Shares | Value |
| VIP Contrafund Portfolio Initial Class (a) | | 218,805 | $6,822,355 |
| VIP Equity-Income Portfolio Initial Class (a) | | 358,944 | 7,229,130 |
| VIP Growth & Income Portfolio Initial Class (a) | | 457,368 | 8,182,317 |
| VIP Growth Portfolio Initial Class (a) | | 121,689 | 6,943,572 |
| VIP Mid Cap Portfolio Initial Class (a) | | 64,675 | 1,990,682 |
| VIP Value Portfolio Initial Class (a) | | 385,104 | 5,233,569 |
| VIP Value Strategies Portfolio Initial Class (a) | | 174,720 | 2,547,420 |
| TOTAL DOMESTIC EQUITY FUNDS | | | |
| (Cost $29,141,985) | | | 38,949,045 |
|
| International Equity Funds - 18.6% | | | |
| VIP Emerging Markets Portfolio Initial Class (a) | | 849,407 | 7,347,374 |
| VIP Overseas Portfolio Initial Class (a) | | 663,674 | 11,826,670 |
| TOTAL INTERNATIONAL EQUITY FUNDS | | | |
| (Cost $18,126,114) | | | 19,174,044 |
|
| Bond Funds - 33.0% | | | |
| VIP High Income Portfolio Initial Class (a) | | 748,881 | 3,954,092 |
| VIP Investment Grade Bond Portfolio Initial Class (a) | | 2,301,224 | 30,123,023 |
| TOTAL BOND FUNDS | | | |
| (Cost $32,779,469) | | | 34,077,115 |
|
| Short-Term Funds - 10.6% | | | |
| VIP Government Money Market Portfolio Initial Class 0.21% (a)(b) | | | |
| (Cost $10,972,027) | | 10,972,027 | 10,972,027 |
| TOTAL INVESTMENT PORTFOLIO - 100.0% | | | |
| (Cost $91,019,595) | | | 103,172,231 |
| NET OTHER ASSETS (LIABILITIES) - 0.0% | | | (12,600) |
| NET ASSETS - 100% | | | $103,159,631 |
Legend
(a) Affiliated Fund
(b) The rate quoted is the annualized seven-day yield of the fund at period end.
Affiliated Underlying Funds
Information regarding the Fund's fiscal year to date purchases and sales of the affiliated Underlying Funds and income earned by the Fund from investments in affiliated Underlying Funds is as follows:
| Affiliate | Value, beginning of period | Purchases | Sales Proceeds | Dividend Income | Value, end of period |
| VIP Contrafund Portfolio Initial Class | $7,557,166 | $1,119,414 | $1,287,540 | $-- | $6,822,355 |
| VIP Emerging Markets Portfolio Initial Class | 6,517,393 | 1,280,125 | 904,853 | -- | 7,347,374 |
| VIP Equity-Income Portfolio Initial Class | 7,973,999 | 870,965 | 1,510,994 | -- | 7,229,130 |
| VIP Government Money Market Portfolio Initial Class 0.21% | 10,316,981 | 3,042,402 | 2,387,353 | 8,407 | 10,972,027 |
| VIP Growth & Income Portfolio Initial Class | 8,992,564 | 1,251,093 | 1,617,711 | -- | 8,182,317 |
| VIP Growth Portfolio Initial Class | 7,864,375 | 1,211,981 | 1,152,284 | -- | 6,943,572 |
| VIP High Income Portfolio Initial Class | 4,087,254 | 287,006 | 666,473 | -- | 3,954,092 |
| VIP Investment Grade Bond Portfolio Initial Class | 33,114,714 | 1,780,811 | 6,483,662 | 17,164 | 30,123,023 |
| VIP Mid Cap Portfolio Initial Class | 2,162,001 | 329,758 | 387,745 | -- | 1,990,682 |
| VIP Overseas Portfolio Initial Class | 12,286,227 | 2,458,113 | 2,117,980 | -- | 11,826,670 |
| VIP Value Portfolio Initial Class | 5,765,964 | 438,605 | 1,051,593 | -- | 5,233,569 |
| VIP Value Strategies Portfolio Initial Class | 2,782,739 | 298,224 | 538,471 | -- | 2,547,420 |
| Total | $109,421,377 | $14,368,497 | $20,106,659 | $25,571 | $103,172,231 |
Investment Valuation
All investments are categorized as Level 1 under the Fair Value Hierarchy. The inputs or methodology used for valuing securities may not be an indication of the risk associated with investing in those securities. For more information on valuation inputs please refer to the Investment Valuation section in the accompanying Notes to Financial Statements.
See accompanying notes which are an integral part of the financial statements.
VIP Freedom 2015 Portfolio℠
Financial Statements
Statement of Assets and Liabilities
| | | June 30, 2016 (Unaudited) |
| Assets | | |
| Investment in securities, at value (cost $91,019,595) — See accompanying schedule | | $103,172,231 |
| Cash | | 9 |
| Receivable for investments sold | | 27,748 |
| Receivable for fund shares sold | | 17,950 |
| Total assets | | 103,217,938 |
| Liabilities | | |
| Payable for fund shares redeemed | $45,694 | |
| Distribution and service plan fees payable | 12,613 | |
| Total liabilities | | 58,307 |
| Net Assets | | $103,159,631 |
| Net Assets consist of: | | |
| Paid in capital | | $89,851,996 |
| Accumulated net investment loss | | (49,886) |
| Accumulated undistributed net realized gain (loss) on investments | | 1,204,885 |
| Net unrealized appreciation (depreciation) on investments | | 12,152,636 |
| Net Assets | | $103,159,631 |
| Initial Class: | | |
| Net Asset Value, offering price and redemption price per share ($34,057,685 ÷ 2,800,584 shares) | | $12.16 |
| Service Class: | | |
| Net Asset Value, offering price and redemption price per share ($14,386,582 ÷ 1,185,541 shares) | | $12.14 |
| Service Class 2: | | |
| Net Asset Value, offering price and redemption price per share ($54,715,364 ÷ 4,526,725 shares) | | $12.09 |
See accompanying notes which are an integral part of the financial statements.
Statement of Operations
| | | Six months ended June 30, 2016 (Unaudited) |
| Investment Income | | |
| Income distributions from underlying funds | | $25,571 |
| Expenses | | |
| Distribution and service plan fees | $75,457 | |
| Independent trustees' fees and expenses | 235 | |
| Total expenses before reductions | 75,692 | |
| Expense reductions | (235) | 75,457 |
| Net investment income (loss) | | (49,886) |
| Realized and Unrealized Gain (Loss) | | |
| Realized gain (loss) on sale of underlying fund shares | (687,682) | |
| Capital gain distributions from underlying funds | 2,485,056 | |
| Total net realized gain (loss) | | 1,797,374 |
| Change in net unrealized appreciation (depreciation) on underlying funds | | 176,693 |
| Net gain (loss) | | 1,974,067 |
| Net increase (decrease) in net assets resulting from operations | | $1,924,181 |
See accompanying notes which are an integral part of the financial statements.
Statement of Changes in Net Assets
| | Six months ended June 30, 2016 (Unaudited) | Year ended December 31, 2015 |
| Increase (Decrease) in Net Assets | | |
| Operations | | |
| Net investment income (loss) | $(49,886) | $1,892,992 |
| Net realized gain (loss) | 1,797,374 | 3,226,007 |
| Change in net unrealized appreciation (depreciation) | 176,693 | (5,457,901) |
| Net increase (decrease) in net assets resulting from operations | 1,924,181 | (338,902) |
| Distributions to shareholders from net investment income | – | (1,908,034) |
| Distributions to shareholders from net realized gain | (2,815,617) | (580,275) |
| Total distributions | (2,815,617) | (2,488,309) |
| Share transactions - net increase (decrease) | (5,357,030) | (6,382,025) |
| Total increase (decrease) in net assets | (6,248,466) | (9,209,236) |
| Net Assets | | |
| Beginning of period | 109,408,097 | 118,617,333 |
| End of period | $103,159,631 | $109,408,097 |
| Other Information | | |
| Accumulated net investment loss end of period | $(49,886) | $– |
See accompanying notes which are an integral part of the financial statements.
Financial Highlights — VIP Freedom 2015 Portfolio Initial Class
| | Six months ended | Years ended December 31, | | | | |
| | June 30, 2016 (Unaudited) | 2015 | 2014 | 2013 | 2012 | 2011 |
| Selected Per–Share Data | | | | | | |
| Net asset value, beginning of period | $12.24 | $12.58 | $12.43 | $11.22 | $10.38 | $10.70 |
| Income from Investment Operations | | | | | | |
| Net investment income (loss)A | –B | .23 | .21 | .21 | .22 | .23 |
| Net realized and unrealized gain (loss) | .24 | (.27) | .37 | 1.39 | 1.04 | (.27) |
| Total from investment operations | .24 | (.04) | .58 | 1.60 | 1.26 | (.04) |
| Distributions from net investment income | – | (.24) | (.21) | (.22) | (.23) | (.23) |
| Distributions from net realized gain | (.32) | (.07) | (.22) | (.18) | (.20) | (.06) |
| Total distributions | (.32) | (.30)C | (.43) | (.39)D | (.42)E | (.28)F |
| Net asset value, end of period | $12.16 | $12.24 | $12.58 | $12.43 | $11.22 | $10.38 |
| Total ReturnG,H,I | 2.24% | (.33)% | 4.70% | 14.41% | 12.23% | (.36)% |
| Ratios to Average Net AssetsJ,K | | | | | | |
| Expenses before reductionsL | - %M | -% | -% | -% | -% | -% |
| Expenses net of fee waivers, if any | - %M | -% | -% | -% | -% | -% |
| Expenses net of all reductions | - %M | -% | -% | -% | -% | -% |
| Net investment income (loss) | .05%M | 1.82% | 1.68% | 1.79% | 2.01% | 2.16% |
| Supplemental Data | | | | | | |
| Net assets, end of period (000 omitted) | $34,058 | $35,352 | $39,455 | $41,070 | $36,449 | $38,879 |
| Portfolio turnover rateJ | 28%M | 27% | 29% | 29% | 28% | 26% |
A Calculated based on average shares outstanding during the period.
B Amount represents less than $.005 per share.
C Total distributions of $.30 per share is comprised of distributions from net investment income of $.236 and distributions from net realized gain of $.065 per share.
D Total distributions of $.39 per share is comprised of distributions from net investment income of $.217 and distributions from net realized gain of $.175 per share.
E Total distributions of $.42 per share is comprised of distributions from net investment income of $.227 and distributions from net realized gain of $.195 per share.
F Total distributions of $.28 per share is comprised of distributions from net investment income of $.227 and distributions from net realized gain of $.055 per share.
G Total returns for periods of less than one year are not annualized.
H Total returns do not reflect charges attributable to your insurance company's separate account. Inclusion of these charges would reduce the total returns shown.
I Total returns would have been lower if certain expenses had not been reduced during the applicable periods shown.
J Amounts do not include the activity of the Underlying Funds.
K Expense ratios reflect operating expenses of the class. Expenses before reductions do not reflect amounts reimbursed by the investment adviser or reductions from expense offset arrangements and do not represent the amount paid by the class during periods when reimbursements or reductions occur. Expenses net of fee waivers reflect expenses after reimbursement by the investment adviser but prior to reductions from expense offset arrangements. Expenses net of all reductions represent the net expenses paid by the class but do not include expenses of the underlying funds in which the Fund invests.
L Amount represents less than .005%.
M Annualized
See accompanying notes which are an integral part of the financial statements.
Financial Highlights — VIP Freedom 2015 Portfolio Service Class
| | Six months ended | Years ended December 31, | | | | |
| | June 30, 2016 (Unaudited) | 2015 | 2014 | 2013 | 2012 | 2011 |
| Selected Per–Share Data | | | | | | |
| Net asset value, beginning of period | $12.22 | $12.56 | $12.41 | $11.21 | $10.37 | $10.69 |
| Income from Investment Operations | | | | | | |
| Net investment income (loss)A | –B | .22 | .20 | .20 | .21 | .22 |
| Net realized and unrealized gain (loss) | .24 | (.27) | .37 | 1.38 | 1.04 | (.26) |
| Total from investment operations | .24 | (.05) | .57 | 1.58 | 1.25 | (.04) |
| Distributions from net investment income | – | (.22) | (.20) | (.21) | (.22) | (.22) |
| Distributions from net realized gain | (.32) | (.07) | (.22) | (.18) | (.20) | (.06) |
| Total distributions | (.32) | (.29) | (.42) | (.38)C | (.41)D | (.28) |
| Net asset value, end of period | $12.14 | $12.22 | $12.56 | $12.41 | $11.21 | $10.37 |
| Total ReturnE,F,G | 2.24% | (.44)% | 4.63% | 14.24% | 12.13% | (.41)% |
| Ratios to Average Net AssetsH,I | | | | | | |
| Expenses before reductions | .10%J | .10% | .10% | .10% | .10% | .10% |
| Expenses net of fee waivers, if any | .10%J | .10% | .10% | .10% | .10% | .10% |
| Expenses net of all reductions | .10%J | .10% | .10% | .10% | .10% | .10% |
| Net investment income (loss) | (.05)%J | 1.72% | 1.58% | 1.69% | 1.91% | 2.06% |
| Supplemental Data | | | | | | |
| Net assets, end of period (000 omitted) | $14,387 | $16,378 | $15,842 | $10,762 | $6,600 | $7,743 |
| Portfolio turnover rateH | 28%J | 27% | 29% | 29% | 28% | 26% |
A Calculated based on average shares outstanding during the period.
B Amount represents less than $.005 per share.
C Total distributions of $.38 per share is comprised of distributions from net investment income of $.207 and distributions from net realized gain of $.175 per share.
D Total distributions of $.41 per share is comprised of distributions from net investment income of $.216 and distributions from net realized gain of $.195 per share.
E Total returns for periods of less than one year are not annualized.
F Total returns do not reflect charges attributable to your insurance company's separate account. Inclusion of these charges would reduce the total returns shown.
G Total returns would have been lower if certain expenses had not been reduced during the applicable periods shown.
H Amounts do not include the activity of the Underlying Funds.
I Expense ratios reflect operating expenses of the class. Expenses before reductions do not reflect amounts reimbursed by the investment adviser or reductions from expense offset arrangements and do not represent the amount paid by the class during periods when reimbursements or reductions occur. Expenses net of fee waivers reflect expenses after reimbursement by the investment adviser but prior to reductions from expense offset arrangements. Expenses net of all reductions represent the net expenses paid by the class but do not include expenses of the underlying funds in which the Fund invests.
J Annualized
See accompanying notes which are an integral part of the financial statements.
Financial Highlights — VIP Freedom 2015 Portfolio Service Class 2
| | Six months ended | Years ended December 31, | | | | |
| | June 30, 2016 (Unaudited) | 2015 | 2014 | 2013 | 2012 | 2011 |
| Selected Per–Share Data | | | | | | |
| Net asset value, beginning of period | $12.19 | $12.52 | $12.37 | $11.17 | $10.34 | $10.65 |
| Income from Investment Operations | | | | | | |
| Net investment income (loss)A | (.01) | .20 | .18 | .18 | .19 | .21 |
| Net realized and unrealized gain (loss) | .23 | (.26) | .37 | 1.38 | 1.03 | (.26) |
| Total from investment operations | .22 | (.06) | .55 | 1.56 | 1.22 | (.05) |
| Distributions from net investment income | – | (.20) | (.18) | (.19) | (.20) | (.20) |
| Distributions from net realized gain | (.32) | (.07) | (.22) | (.18) | (.20) | (.06) |
| Total distributions | (.32) | (.27) | (.40) | (.36)B | (.39)C | (.26) |
| Net asset value, end of period | $12.09 | $12.19 | $12.52 | $12.37 | $11.17 | $10.34 |
| Total ReturnD,E,F | 2.08% | (.51)% | 4.45% | 14.10% | 11.90% | (.52)% |
| Ratios to Average Net AssetsG,H | | | | | | |
| Expenses before reductions | .25%I | .25% | .25% | .25% | .25% | .25% |
| Expenses net of fee waivers, if any | .25%I | .25% | .25% | .25% | .25% | .25% |
| Expenses net of all reductions | .25%I | .25% | .25% | .25% | .25% | .25% |
| Net investment income (loss) | (.20)%I | 1.57% | 1.43% | 1.54% | 1.76% | 1.91% |
| Supplemental Data | | | | | | |
| Net assets, end of period (000 omitted) | $54,715 | $57,679 | $63,321 | $62,652 | $60,594 | $55,246 |
| Portfolio turnover rateG | 28%I | 27% | 29% | 29% | 28% | 26% |
A Calculated based on average shares outstanding during the period.
B Total distributions of $.36 per share is comprised of distributions from net investment income of $.186 and distributions from net realized gain of $.175 per share.
C Total distributions of $.39 per share is comprised of distributions from net investment income of $.199 and distributions from net realized gain of $.195 per share.
D Total returns for periods of less than one year are not annualized.
E Total returns do not reflect charges attributable to your insurance company's separate account. Inclusion of these charges would reduce the total returns shown.
F Total returns would have been lower if certain expenses had not been reduced during the applicable periods shown.
G Amounts do not include the activity of the Underlying Funds.
H Expense ratios reflect operating expenses of the class. Expenses before reductions do not reflect amounts reimbursed by the investment adviser or reductions from expense offset arrangements and do not represent the amount paid by the class during periods when reimbursements or reductions occur. Expenses net of fee waivers reflect expenses after reimbursement by the investment adviser but prior to reductions from expense offset arrangements. Expenses net of all reductions represent the net expenses paid by the class but do not include expenses of the underlying funds in which the Fund invests.
I Annualized
See accompanying notes which are an integral part of the financial statements.
VIP Freedom 2020 Portfolio℠
Investment Summary (Unaudited)
The information in the following tables is based on the direct investments of the Fund.
Top Holdings as of June 30, 2016
| | % of fund's net assets | % of fund's net assets 6 months ago |
| VIP Investment Grade Bond Portfolio Initial Class | 26.8 | 27.1 |
| VIP Overseas Portfolio Initial Class | 13.0 | 12.6 |
| VIP Growth & Income Portfolio Initial Class | 8.8 | 9.1 |
| VIP Equity-Income Portfolio Initial Class | 7.8 | 8.1 |
| VIP Emerging Markets Portfolio Initial Class | 7.5 | 6.4 |
| VIP Growth Portfolio Initial Class | 7.5 | 8.0 |
| VIP Contrafund Portfolio Initial Class | 7.3 | 7.7 |
| VIP Government Money Market Portfolio Initial Class 0.21% | 7.0 | 6.5 |
| VIP Value Portfolio Initial Class | 5.6 | 5.8 |
| VIP High Income Portfolio Initial Class | 3.9 | 3.7 |
| | 95.2 | |
Asset Allocation (% of fund's net assets)
| Period end |
| | Domestic Equity Funds | 41.8% |
| | International Equity Funds | 20.5% |
| | Bond Funds | 30.7% |
| | Short-Term Funds | 7.0% |

| Six months ago |
| | Domestic Equity Funds | 43.7% |
| | International Equity Funds | 19.0% |
| | Bond Funds | 30.8% |
| | Short-Term Funds | 6.5% |

VIP Freedom 2020 Portfolio℠
Investments June 30, 2016 (Unaudited)
Showing Percentage of Net Assets
| Domestic Equity Funds - 41.8% | | | |
| | | Shares | Value |
| VIP Contrafund Portfolio Initial Class (a) | | 1,697,171 | $52,917,789 |
| VIP Equity-Income Portfolio Initial Class (a) | | 2,784,403 | 56,077,872 |
| VIP Growth & Income Portfolio Initial Class (a) | | 3,548,113 | 63,475,738 |
| VIP Growth Portfolio Initial Class (a) | | 943,851 | 53,856,119 |
| VIP Mid Cap Portfolio Initial Class (a) | | 500,935 | 15,418,792 |
| VIP Value Portfolio Initial Class (a) | | 2,986,665 | 40,588,775 |
| VIP Value Strategies Portfolio Initial Class (a) | | 1,360,379 | 19,834,327 |
| TOTAL DOMESTIC EQUITY FUNDS | | | |
| (Cost $231,220,836) | | | 302,169,412 |
|
| International Equity Funds - 20.5% | | | |
| VIP Emerging Markets Portfolio Initial Class (a) | | 6,311,080 | 54,590,843 |
| VIP Overseas Portfolio Initial Class (a) | | 5,258,088 | 93,699,124 |
| TOTAL INTERNATIONAL EQUITY FUNDS | | | |
| (Cost $140,209,980) | | | 148,289,967 |
|
| Bond Funds - 30.7% | | | |
| VIP High Income Portfolio Initial Class (a) | | 5,247,105 | 27,704,713 |
| VIP Investment Grade Bond Portfolio Initial Class (a) | | 14,791,266 | 193,617,675 |
| TOTAL BOND FUNDS | | | |
| (Cost $218,410,577) | | | 221,322,388 |
|
| Short-Term Funds - 7.0% | | | |
| VIP Government Money Market Portfolio Initial Class 0.21% (a)(b) | | | |
| (Cost $50,281,394) | | 50,281,394 | 50,281,394 |
| TOTAL INVESTMENT PORTFOLIO - 100.0% | | | |
| (Cost $640,122,787) | | | 722,063,161 |
| NET OTHER ASSETS (LIABILITIES) - 0.0% | | | (120,546) |
| NET ASSETS - 100% | | | $721,942,615 |
Legend
(a) Affiliated Fund
(b) The rate quoted is the annualized seven-day yield of the fund at period end.
Affiliated Underlying Funds
Information regarding the Fund's fiscal year to date purchases and sales of the affiliated Underlying Funds and income earned by the Fund from investments in affiliated Underlying Funds is as follows:
| Affiliate | Value, beginning of period | Purchases | Sales Proceeds | Dividend Income | Value, end of period |
| VIP Contrafund Portfolio Initial Class | $55,968,120 | $6,498,690 | $5,485,229 | $-- | $52,917,789 |
| VIP Emerging Markets Portfolio Initial Class | 46,527,233 | 7,242,943 | 2,646,670 | -- | 54,590,843 |
| VIP Equity-Income Portfolio Initial Class | 59,053,501 | 4,808,894 | 7,207,163 | -- | 56,077,872 |
| VIP Government Money Market Portfolio Initial Class 0.21% | 47,243,314 | 11,761,375 | 8,723,295 | 39,179 | 50,281,394 |
| VIP Growth & Income Portfolio Initial Class | 66,589,000 | 7,110,733 | 7,112,830 | -- | 63,475,738 |
| VIP Growth Portfolio Initial Class | 58,254,565 | 7,298,968 | 4,515,775 | -- | 53,856,119 |
| VIP High Income Portfolio Initial Class | 27,331,359 | 1,219,509 | 2,592,220 | -- | 27,704,713 |
| VIP Investment Grade Bond Portfolio Initial Class | 198,513,537 | 7,566,382 | 23,201,352 | 103,579 | 193,617,675 |
| VIP Mid Cap Portfolio Initial Class | 16,008,525 | 1,919,934 | 1,717,400 | -- | 15,418,792 |
| VIP Overseas Portfolio Initial Class | 92,381,031 | 15,340,354 | 8,042,129 | -- | 93,699,124 |
| VIP Value Portfolio Initial Class | 42,695,610 | 1,835,567 | 4,677,092 | -- | 40,588,775 |
| VIP Value Strategies Portfolio Initial Class | 20,603,221 | 1,523,378 | 2,408,446 | -- | 19,834,327 |
| Total | $731,169,016 | $74,126,727 | $78,329,601 | $142,758 | $722,063,161 |
Investment Valuation
All investments are categorized as Level 1 under the Fair Value Hierarchy. The inputs or methodology used for valuing securities may not be an indication of the risk associated with investing in those securities. For more information on valuation inputs please refer to the Investment Valuation section in the accompanying Notes to Financial Statements.
See accompanying notes which are an integral part of the financial statements.
VIP Freedom 2020 Portfolio℠
Financial Statements
Statement of Assets and Liabilities
| | | June 30, 2016 (Unaudited) |
| Assets | | |
| Investment in securities, at value (cost $640,122,787) — See accompanying schedule | | $722,063,161 |
| Cash | | 1 |
| Receivable for investments sold | | 224,774 |
| Receivable for fund shares sold | | 72,482 |
| Total assets | | 722,360,418 |
| Liabilities | | |
| Payable for fund shares redeemed | $297,258 | |
| Distribution and service plan fees payable | 120,545 | |
| Total liabilities | | 417,803 |
| Net Assets | | $721,942,615 |
| Net Assets consist of: | | |
| Paid in capital | | $628,513,469 |
| Accumulated net investment loss | | (568,568) |
| Accumulated undistributed net realized gain (loss) on investments | | 12,057,340 |
| Net unrealized appreciation (depreciation) on investments | | 81,940,374 |
| Net Assets | | $721,942,615 |
| Initial Class: | | |
| Net Asset Value, offering price and redemption price per share ($85,772,688 ÷ 6,986,370 shares) | | $12.28 |
| Service Class: | | |
| Net Asset Value, offering price and redemption price per share ($97,527,119 ÷ 7,966,837 shares) | | $12.24 |
| Service Class 2: | | |
| Net Asset Value, offering price and redemption price per share ($538,642,808 ÷ 44,177,178 shares) | | $12.19 |
See accompanying notes which are an integral part of the financial statements.
Statement of Operations
| | | Six months ended June 30, 2016 (Unaudited) |
| Investment Income | | |
| Income distributions from underlying funds | | $142,758 |
| Expenses | | |
| Distribution and service plan fees | $711,326 | |
| Independent trustees' fees and expenses | 1,612 | |
| Total expenses before reductions | 712,938 | |
| Expense reductions | (1,612) | 711,326 |
| Net investment income (loss) | | (568,568) |
| Realized and Unrealized Gain (Loss) | | |
| Realized gain (loss) on sale of underlying fund shares | (3,616,422) | |
| Capital gain distributions from underlying funds | 18,579,061 | |
| Total net realized gain (loss) | | 14,962,639 |
| Change in net unrealized appreciation (depreciation) on underlying funds | | (1,286,566) |
| Net gain (loss) | | 13,676,073 |
| Net increase (decrease) in net assets resulting from operations | | $13,107,505 |
See accompanying notes which are an integral part of the financial statements.
Statement of Changes in Net Assets
| | Six months ended June 30, 2016 (Unaudited) | Year ended December 31, 2015 |
| Increase (Decrease) in Net Assets | | |
| Operations | | |
| Net investment income (loss) | $(568,568) | $12,395,889 |
| Net realized gain (loss) | 14,962,639 | 24,187,268 |
| Change in net unrealized appreciation (depreciation) | (1,286,566) | (39,900,486) |
| Net increase (decrease) in net assets resulting from operations | 13,107,505 | (3,317,329) |
| Distributions to shareholders from net investment income | – | (12,431,723) |
| Distributions to shareholders from net realized gain | (21,992,698) | (3,252,644) |
| Total distributions | (21,992,698) | (15,684,367) |
| Share transactions - net increase (decrease) | (218,360) | (11,659,744) |
| Total increase (decrease) in net assets | (9,103,553) | (30,661,440) |
| Net Assets | | |
| Beginning of period | 731,046,168 | 761,707,608 |
| End of period | $721,942,615 | $731,046,168 |
| Other Information | | |
| Accumulated net investment loss end of period | $(568,568) | $– |
See accompanying notes which are an integral part of the financial statements.
Financial Highlights — VIP Freedom 2020 Portfolio Initial Class
| | Six months ended | Years ended December 31, | | | | |
| | June 30, 2016 (Unaudited) | 2015 | 2014 | 2013 | 2012 | 2011 |
| Selected Per–Share Data | | | | | | |
| Net asset value, beginning of period | $12.44 | $12.77 | $12.61 | $11.21 | $10.21 | $10.59 |
| Income from Investment Operations | | | | | | |
| Net investment income (loss)A | –B | .24 | .22 | .22 | .24 | .26 |
| Net realized and unrealized gain (loss) | .22 | (.27) | .38 | 1.56 | 1.12 | (.37) |
| Total from investment operations | .22 | (.03) | .60 | 1.78 | 1.36 | (.11) |
| Distributions from net investment income | – | (.24) | (.22) | (.22) | (.23) | (.23) |
| Distributions from net realized gain | (.38) | (.06) | (.23) | (.16) | (.13) | (.04) |
| Total distributions | (.38) | (.30) | (.44)C | (.38) | (.36) | (.27) |
| Net asset value, end of period | $12.28 | $12.44 | $12.77 | $12.61 | $11.21 | $10.21 |
| Total ReturnD,E,F | 2.07% | (.27)% | 4.82% | 16.01% | 13.38% | (1.03)% |
| Ratios to Average Net AssetsG,H | | | | | | |
| Expenses before reductionsI | - %J | -% | -% | -% | -% | -% |
| Expenses net of fee waivers, if any | - %J | -% | -% | -% | -% | -% |
| Expenses net of all reductions | - %J | -% | -% | -% | -% | -% |
| Net investment income (loss) | .04%J | 1.84% | 1.70% | 1.84% | 2.16% | 2.47% |
| Supplemental Data | | | | | | |
| Net assets, end of period (000 omitted) | $85,773 | $87,496 | $101,533 | $91,328 | $58,113 | $47,731 |
| Portfolio turnover rateG | 21%J | 17% | 15% | 20% | 15% | 10% |
A Calculated based on average shares outstanding during the period.
B Amount represents less than $.005 per share.
C Total distributions of $.44 per share is comprised of distributions from net investment income of $.216 and distributions from net realized gain of $.227 per share.
D Total returns for periods of less than one year are not annualized.
E Total returns do not reflect charges attributable to your insurance company's separate account. Inclusion of these charges would reduce the total returns shown.
F Total returns would have been lower if certain expenses had not been reduced during the applicable periods shown.
G Amounts do not include the activity of the Underlying Funds.
H Expense ratios reflect operating expenses of the class. Expenses before reductions do not reflect amounts reimbursed by the investment adviser or reductions from expense offset arrangements and do not represent the amount paid by the class during periods when reimbursements or reductions occur. Expenses net of fee waivers reflect expenses after reimbursement by the investment adviser but prior to reductions from expense offset arrangements. Expenses net of all reductions represent the net expenses paid by the class but do not include expenses of the underlying funds in which the Fund invests.
I Amount represents less than .005%.
J Annualized
See accompanying notes which are an integral part of the financial statements.
Financial Highlights — VIP Freedom 2020 Portfolio Service Class
| | Six months ended | Years ended December 31, | | | | |
| | June 30, 2016 (Unaudited) | 2015 | 2014 | 2013 | 2012 | 2011 |
| Selected Per–Share Data | | | | | | |
| Net asset value, beginning of period | $12.41 | $12.74 | $12.59 | $11.19 | $10.20 | $10.58 |
| Income from Investment Operations | | | | | | |
| Net investment income (loss)A | –B | .23 | .20 | .21 | .23 | .25 |
| Net realized and unrealized gain (loss) | .21 | (.27) | .38 | 1.56 | 1.11 | (.37) |
| Total from investment operations | .21 | (.04) | .58 | 1.77 | 1.34 | (.12) |
| Distributions from net investment income | – | (.23) | (.21) | (.21) | (.22) | (.22) |
| Distributions from net realized gain | (.38) | (.06) | (.23) | (.16) | (.13) | (.04) |
| Total distributions | (.38) | (.29) | (.43)C | (.37) | (.35) | (.26) |
| Net asset value, end of period | $12.24 | $12.41 | $12.74 | $12.59 | $11.19 | $10.20 |
| Total ReturnD,E,F | 1.99% | (.37)% | 4.66% | 15.95% | 13.19% | (1.12)% |
| Ratios to Average Net AssetsG,H | | | | | | |
| Expenses before reductions | .10%I | .10% | .10% | .10% | .10% | .10% |
| Expenses net of fee waivers, if any | .10%I | .10% | .10% | .10% | .10% | .10% |
| Expenses net of all reductions | .10%I | .10% | .10% | .10% | .10% | .10% |
| Net investment income (loss) | (.06)%I | 1.74% | 1.60% | 1.74% | 2.06% | 2.37% |
| Supplemental Data | | | | | | |
| Net assets, end of period (000 omitted) | $97,527 | $94,022 | $76,679 | $65,867 | $45,779 | $36,818 |
| Portfolio turnover rateG | 21%I | 17% | 15% | 20% | 15% | 10% |
A Calculated based on average shares outstanding during the period.
B Amount represents less than $.005 per share.
C Total distributions of $.43 per share is comprised of distributions from net investment income of $.205 and distributions from net realized gain of $.227 per share.
D Total returns for periods of less than one year are not annualized.
E Total returns do not reflect charges attributable to your insurance company's separate account. Inclusion of these charges would reduce the total returns shown.
F Total returns would have been lower if certain expenses had not been reduced during the applicable periods shown.
G Amounts do not include the activity of the Underlying Funds.
H Expense ratios reflect operating expenses of the class. Expenses before reductions do not reflect amounts reimbursed by the investment adviser or reductions from expense offset arrangements and do not represent the amount paid by the class during periods when reimbursements or reductions occur. Expenses net of fee waivers reflect expenses after reimbursement by the investment adviser but prior to reductions from expense offset arrangements. Expenses net of all reductions represent the net expenses paid by the class but do not include expenses of the underlying funds in which the Fund invests.
I Annualized
See accompanying notes which are an integral part of the financial statements.
Financial Highlights — VIP Freedom 2020 Portfolio Service Class 2
| | Six months ended | Years ended December 31, | | | | |
| | June 30, 2016 (Unaudited) | 2015 | 2014 | 2013 | 2012 | 2011 |
| Selected Per–Share Data | | | | | | |
| Net asset value, beginning of period | $12.38 | $12.70 | $12.54 | $11.16 | $10.17 | $10.55 |
| Income from Investment Operations | | | | | | |
| Net investment income (loss)A | (.01) | .21 | .18 | .19 | .21 | .24 |
| Net realized and unrealized gain (loss) | .20 | (.27) | .39 | 1.54 | 1.11 | (.37) |
| Total from investment operations | .19 | (.06) | .57 | 1.73 | 1.32 | (.13) |
| Distributions from net investment income | – | (.21) | (.18) | (.19) | (.20) | (.21) |
| Distributions from net realized gain | (.38) | (.06) | (.23) | (.16) | (.13) | (.04) |
| Total distributions | (.38) | (.26)B | (.41) | (.35) | (.33) | (.25) |
| Net asset value, end of period | $12.19 | $12.38 | $12.70 | $12.54 | $11.16 | $10.17 |
| Total ReturnC,D,E | 1.83% | (.46)% | 4.60% | 15.63% | 13.07% | (1.24)% |
| Ratios to Average Net AssetsF,G | | | | | | |
| Expenses before reductions | .25%H | .25% | .25% | .25% | .25% | .25% |
| Expenses net of fee waivers, if any | .25%H | .25% | .25% | .25% | .25% | .25% |
| Expenses net of all reductions | .25%H | .25% | .25% | .25% | .25% | .25% |
| Net investment income (loss) | (.21)%H | 1.59% | 1.45% | 1.59% | 1.91% | 2.22% |
| Supplemental Data | | | | | | |
| Net assets, end of period (000 omitted) | $538,643 | $549,528 | $583,496 | $582,722 | $520,011 | $426,477 |
| Portfolio turnover rateF | 21%H | 17% | 15% | 20% | 15% | 10% |
A Calculated based on average shares outstanding during the period.
B Total distributions of $.26 per share is comprised of distributions from net investment income of $.208 and distributions from net realized gain of $.056 per share.
C Total returns for periods of less than one year are not annualized.
D Total returns do not reflect charges attributable to your insurance company's separate account. Inclusion of these charges would reduce the total returns shown.
E Total returns would have been lower if certain expenses had not been reduced during the applicable periods shown.
F Amounts do not include the activity of the Underlying Funds.
G Expense ratios reflect operating expenses of the class. Expenses before reductions do not reflect amounts reimbursed by the investment adviser or reductions from expense offset arrangements and do not represent the amount paid by the class during periods when reimbursements or reductions occur. Expenses net of fee waivers reflect expenses after reimbursement by the investment adviser but prior to reductions from expense offset arrangements. Expenses net of all reductions represent the net expenses paid by the class but do not include expenses of the underlying funds in which the Fund invests.
H Annualized
See accompanying notes which are an integral part of the financial statements.
VIP Freedom 2025 Portfolio℠
Investment Summary (Unaudited)
The information in the following tables is based on the direct investments of the Fund.
Top Holdings as of June 30, 2016
| | % of fund's net assets | % of fund's net assets 6 months ago |
| VIP Investment Grade Bond Portfolio Initial Class | 22.0 | 23.0 |
| VIP Overseas Portfolio Initial Class | 14.4 | 14.4 |
| VIP Growth & Income Portfolio Initial Class | 9.8 | 10.2 |
| VIP Equity-Income Portfolio Initial Class | 8.6 | 9.0 |
| VIP Growth Portfolio Initial Class | 8.3 | 8.9 |
| VIP Contrafund Portfolio Initial Class | 8.2 | 8.6 |
| VIP Emerging Markets Portfolio Initial Class | 8.1 | 6.8 |
| VIP Value Portfolio Initial Class | 6.3 | 6.5 |
| VIP Government Money Market Portfolio Initial Class 0.21% | 5.1 | 3.3 |
| VIP High Income Portfolio Initial Class | 3.8 | 3.7 |
| | 94.6 | |
Asset Allocation (% of fund's net assets)
| Period end |
| | Domestic Equity Funds | 46.6% |
| | International Equity Funds | 22.5% |
| | Bond Funds | 25.8% |
| | Short-Term Funds | 5.1% |
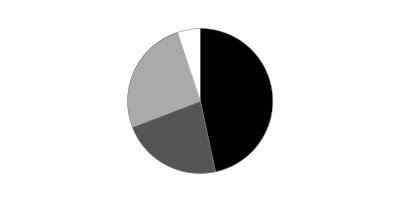
| Six months ago |
| | Domestic Equity Funds | 48.8% |
| | International Equity Funds | 21.2% |
| | Bond Funds | 26.7% |
| | Short-Term Funds | 3.3% |

VIP Freedom 2025 Portfolio℠
Investments June 30, 2016 (Unaudited)
Showing Percentage of Net Assets
| Domestic Equity Funds - 46.6% | | | |
| | | Shares | Value |
| VIP Contrafund Portfolio Initial Class (a) | | 329,742 | $10,281,340 |
| VIP Equity-Income Portfolio Initial Class (a) | | 540,847 | 10,892,653 |
| VIP Growth & Income Portfolio Initial Class (a) | | 689,010 | 12,326,384 |
| VIP Growth Portfolio Initial Class (a) | | 183,379 | 10,463,579 |
| VIP Mid Cap Portfolio Initial Class (a) | | 97,975 | 3,015,673 |
| VIP Value Portfolio Initial Class (a) | | 580,747 | 7,892,349 |
| VIP Value Strategies Portfolio Initial Class (a) | | 263,698 | 3,844,720 |
| TOTAL DOMESTIC EQUITY FUNDS | | | |
| (Cost $50,724,907) | | | 58,716,698 |
|
| International Equity Funds - 22.5% | | | |
| VIP Emerging Markets Portfolio Initial Class (a) | | 1,171,602 | 10,134,358 |
| VIP Overseas Portfolio Initial Class (a) | | 1,021,019 | 18,194,562 |
| TOTAL INTERNATIONAL EQUITY FUNDS | | | |
| (Cost $27,566,830) | | | 28,328,920 |
|
| Bond Funds - 25.8% | | | |
| VIP High Income Portfolio Initial Class (a) | | 917,513 | 4,844,468 |
| VIP Investment Grade Bond Portfolio Initial Class (a) | | 2,116,270 | 27,701,979 |
| TOTAL BOND FUNDS | | | |
| (Cost $32,235,622) | | | 32,546,447 |
|
| Short-Term Funds - 5.1% | | | |
| VIP Government Money Market Portfolio Initial Class 0.21% (a)(b) | | | |
| (Cost $6,512,287) | | 6,512,287 | 6,512,287 |
| TOTAL INVESTMENT PORTFOLIO - 100.0% | | | |
| (Cost $117,039,646) | | | 126,104,352 |
| NET OTHER ASSETS (LIABILITIES) - 0.0% | | | (15,302) |
| NET ASSETS - 100% | | | $126,089,050 |
Legend
(a) Affiliated Fund
(b) The rate quoted is the annualized seven-day yield of the fund at period end.
Affiliated Underlying Funds
Information regarding the Fund's fiscal year to date purchases and sales of the affiliated Underlying Funds and income earned by the Fund from investments in affiliated Underlying Funds is as follows:
| Affiliate | Value, beginning of period | Purchases | Sales Proceeds | Dividend Income | Value, end of period |
| VIP Contrafund Portfolio Initial Class | $9,757,612 | $2,129,395 | $934,104 | $-- | $10,281,340 |
| VIP Emerging Markets Portfolio Initial Class | 7,812,141 | 2,099,786 | 420,841 | -- | 10,134,358 |
| VIP Equity-Income Portfolio Initial Class | 10,299,890 | 1,974,132 | 1,326,271 | -- | 10,892,653 |
| VIP Government Money Market Portfolio Initial Class 0.21% | 3,765,099 | 3,555,105 | 807,917 | 4,015 | 6,512,287 |
| VIP Growth & Income Portfolio Initial Class | 11,614,475 | 2,430,286 | 1,214,603 | -- | 12,326,384 |
| VIP Growth Portfolio Initial Class | 10,159,178 | 2,336,343 | 807,335 | -- | 10,463,579 |
| VIP High Income Portfolio Initial Class | 4,272,157 | 707,811 | 429,756 | -- | 4,844,468 |
| VIP Investment Grade Bond Portfolio Initial Class | 26,202,534 | 4,863,635 | 4,867,717 | 13,888 | 27,701,979 |
| VIP Mid Cap Portfolio Initial Class | 2,792,118 | 623,713 | 271,788 | -- | 3,015,673 |
| VIP Overseas Portfolio Initial Class | 16,448,853 | 4,247,757 | 1,412,078 | -- | 18,194,562 |
| VIP Value Portfolio Initial Class | 7,446,789 | 1,083,560 | 791,100 | -- | 7,892,349 |
| VIP Value Strategies Portfolio Initial Class | 3,593,628 | 639,362 | 422,185 | -- | 3,844,720 |
| Total | $114,164,474 | $26,690,885 | $13,705,695 | $17,903 | $126,104,352 |
Investment Valuation
All investments are categorized as Level 1 under the Fair Value Hierarchy. The inputs or methodology used for valuing securities may not be an indication of the risk associated with investing in those securities. For more information on valuation inputs please refer to the Investment Valuation section in the accompanying Notes to Financial Statements.
See accompanying notes which are an integral part of the financial statements.
VIP Freedom 2025 Portfolio℠
Financial Statements
Statement of Assets and Liabilities
| | | June 30, 2016 (Unaudited) |
| Assets | | |
| Investment in securities, at value (cost $117,039,646) — See accompanying schedule | | $126,104,352 |
| Cash | | 1 |
| Receivable for investments sold | | 158,095 |
| Receivable for fund shares sold | | 32,790 |
| Total assets | | 126,295,238 |
| Liabilities | | |
| Payable for investments purchased | $9,899 | |
| Payable for fund shares redeemed | 180,987 | |
| Distribution and service plan fees payable | 15,302 | |
| Total liabilities | | 206,188 |
| Net Assets | | $126,089,050 |
| Net Assets consist of: | | |
| Paid in capital | | $114,983,734 |
| Accumulated net investment loss | | (67,752) |
| Accumulated undistributed net realized gain (loss) on investments | | 2,108,362 |
| Net unrealized appreciation (depreciation) on investments | | 9,064,706 |
| Net Assets | | $126,089,050 |
| Initial Class: | | |
| Net Asset Value, offering price and redemption price per share ($26,285,436 ÷ 2,086,033 shares) | | $12.60 |
| Service Class: | | |
| Net Asset Value, offering price and redemption price per share ($43,305,703 ÷ 3,445,465 shares) | | $12.57 |
| Service Class 2: | | |
| Net Asset Value, offering price and redemption price per share ($56,497,911 ÷ 4,518,224 shares) | | $12.50 |
See accompanying notes which are an integral part of the financial statements.
Statement of Operations
| | | Six months ended June 30, 2016 (Unaudited) |
| Investment Income | | |
| Income distributions from underlying funds | | $17,903 |
| Expenses | | |
| Distribution and service plan fees | $85,655 | |
| Independent trustees' fees and expenses | 260 | |
| Total expenses before reductions | 85,915 | |
| Expense reductions | (260) | 85,655 |
| Net investment income (loss) | | (67,752) |
| Realized and Unrealized Gain (Loss) | | |
| Realized gain (loss) on sale of underlying fund shares | (453,447) | |
| Capital gain distributions from underlying funds | 3,249,144 | |
| Total net realized gain (loss) | | 2,795,697 |
| Change in net unrealized appreciation (depreciation) on underlying funds | | (591,870) |
| Net gain (loss) | | 2,203,827 |
| Net increase (decrease) in net assets resulting from operations | | $2,136,075 |
See accompanying notes which are an integral part of the financial statements.
Statement of Changes in Net Assets
| | Six months ended June 30, 2016 (Unaudited) | Year ended December 31, 2015 |
| Increase (Decrease) in Net Assets | | |
| Operations | | |
| Net investment income (loss) | $(67,752) | $1,995,498 |
| Net realized gain (loss) | 2,795,697 | 3,896,247 |
| Change in net unrealized appreciation (depreciation) | (591,870) | (6,445,911) |
| Net increase (decrease) in net assets resulting from operations | 2,136,075 | (554,166) |
| Distributions to shareholders from net investment income | – | (1,997,317) |
| Distributions to shareholders from net realized gain | (3,520,684) | (616,161) |
| Total distributions | (3,520,684) | (2,613,478) |
| Share transactions - net increase (decrease) | 13,323,134 | 11,524,589 |
| Total increase (decrease) in net assets | 11,938,525 | 8,356,945 |
| Net Assets | | |
| Beginning of period | 114,150,525 | 105,793,580 |
| End of period | $126,089,050 | $114,150,525 |
| Other Information | | |
| Accumulated net investment loss end of period | $(67,752) | $– |
See accompanying notes which are an integral part of the financial statements.
Financial Highlights — VIP Freedom 2025 Portfolio Initial Class
| | Six months ended | Years ended December 31, | | | | |
| | June 30, 2016 (Unaudited) | 2015 | 2014 | 2013 | 2012 | 2011 |
| Selected Per–Share Data | | | | | | |
| Net asset value, beginning of period | $12.82 | $13.16 | $12.99 | $11.20 | $10.02 | $10.49 |
| Income from Investment Operations | | | | | | |
| Net investment income (loss)A | –B | .26 | .24 | .25 | .24 | .24 |
| Net realized and unrealized gain (loss) | .17 | (.28) | .41 | 1.97 | 1.27 | (.46) |
| Total from investment operations | .17 | (.02) | .65 | 2.22 | 1.51 | (.22) |
| Distributions from net investment income | – | (.25) | (.22) | (.23) | (.21) | (.22) |
| Distributions from net realized gain | (.39) | (.07) | (.26) | (.20) | (.12) | (.03) |
| Total distributions | (.39) | (.32) | (.48) | (.43) | (.33) | (.25) |
| Net asset value, end of period | $12.60 | $12.82 | $13.16 | $12.99 | $11.20 | $10.02 |
| Total ReturnC,D,E | 1.68% | (.18)% | 5.06% | 19.95% | 15.11% | (2.11)% |
| Ratios to Average Net AssetsF,G | | | | | | |
| Expenses before reductionsH | - %I | -% | -% | -% | -% | -% |
| Expenses net of fee waivers, if any | - %I | -% | -% | -% | -% | -% |
| Expenses net of all reductions | - %I | -% | -% | -% | -% | -% |
| Net investment income (loss) | .03%I | 1.91% | 1.78% | 2.03% | 2.17% | 2.25% |
| Supplemental Data | | | | | | |
| Net assets, end of period (000 omitted) | $26,285 | $25,152 | $26,137 | $24,548 | $17,792 | $15,537 |
| Portfolio turnover rateF | 23%I | 20% | 29% | 30% | 34% | 21% |
A Calculated based on average shares outstanding during the period.
B Amount represents less than $.005 per share.
C Total returns for periods of less than one year are not annualized.
D Total returns do not reflect charges attributable to your insurance company's separate account. Inclusion of these charges would reduce the total returns shown.
E Total returns would have been lower if certain expenses had not been reduced during the applicable periods shown.
F Amounts do not include the activity of the Underlying Funds.
G Expense ratios reflect operating expenses of the class. Expenses before reductions do not reflect amounts reimbursed by the investment adviser or reductions from expense offset arrangements and do not represent the amount paid by the class during periods when reimbursements or reductions occur. Expenses net of fee waivers reflect expenses after reimbursement by the investment adviser but prior to reductions from expense offset arrangements. Expenses net of all reductions represent the net expenses paid by the class but do not include expenses of the underlying funds in which the Fund invests.
H Amount represents less than .005%.
I Annualized
See accompanying notes which are an integral part of the financial statements.
Financial Highlights — VIP Freedom 2025 Portfolio Service Class
| | Six months ended | Years ended December 31, | | | | |
| | June 30, 2016 (Unaudited) | 2015 | 2014 | 2013 | 2012 | 2011 |
| Selected Per–Share Data | | | | | | |
| Net asset value, beginning of period | $12.79 | $13.14 | $12.97 | $11.18 | $10.01 | $10.49 |
| Income from Investment Operations | | | | | | |
| Net investment income (loss)A | –B | .24 | .22 | .23 | .22 | .23 |
| Net realized and unrealized gain (loss) | .17 | (.28) | .42 | 1.98 | 1.27 | (.47) |
| Total from investment operations | .17 | (.04) | .64 | 2.21 | 1.49 | (.24) |
| Distributions from net investment income | – | (.23) | (.21) | (.22) | (.20) | (.21) |
| Distributions from net realized gain | (.39) | (.07) | (.26) | (.20) | (.12) | (.03) |
| Total distributions | (.39) | (.31)C | (.47) | (.42) | (.32) | (.24) |
| Net asset value, end of period | $12.57 | $12.79 | $13.14 | $12.97 | $11.18 | $10.01 |
| Total ReturnD,E,F | 1.68% | (.36)% | 4.98% | 19.89% | 14.97% | (2.26)% |
| Ratios to Average Net AssetsG,H | | | | | | |
| Expenses before reductions | .10%I | .10% | .10% | .10% | .10% | .10% |
| Expenses net of fee waivers, if any | .10%I | .10% | .10% | .10% | .10% | .10% |
| Expenses net of all reductions | .10%I | .10% | .10% | .10% | .10% | .10% |
| Net investment income (loss) | (.07)%I | 1.81% | 1.68% | 1.93% | 2.07% | 2.16% |
| Supplemental Data | | | | | | |
| Net assets, end of period (000 omitted) | $43,306 | $36,677 | $30,291 | $21,780 | $16,558 | $7,149 |
| Portfolio turnover rateG | 23%I | 20% | 29% | 30% | 34% | 21% |
A Calculated based on average shares outstanding during the period.
B Amount represents less than $.005 per share.
C Total distributions of $.31 per share is comprised of distributions from net investment income of $.234 and distributions from net realized gain of $.072 per share.
D Total returns for periods of less than one year are not annualized.
E Total returns do not reflect charges attributable to your insurance company's separate account. Inclusion of these charges would reduce the total returns shown.
F Total returns would have been lower if certain expenses had not been reduced during the applicable periods shown.
G Amounts do not include the activity of the Underlying Funds.
H Expense ratios reflect operating expenses of the class. Expenses before reductions do not reflect amounts reimbursed by the investment adviser or reductions from expense offset arrangements and do not represent the amount paid by the class during periods when reimbursements or reductions occur. Expenses net of fee waivers reflect expenses after reimbursement by the investment adviser but prior to reductions from expense offset arrangements. Expenses net of all reductions represent the net expenses paid by the class but do not include expenses of the underlying funds in which the Fund invests.
I Annualized
See accompanying notes which are an integral part of the financial statements.
Financial Highlights — VIP Freedom 2025 Portfolio Service Class 2
| | Six months ended | Years ended December 31, | | | | |
| | June 30, 2016 (Unaudited) | 2015 | 2014 | 2013 | 2012 | 2011 |
| Selected Per–Share Data | | | | | | |
| Net asset value, beginning of period | $12.74 | $13.09 | $12.92 | $11.14 | $9.97 | $10.44 |
| Income from Investment Operations | | | | | | |
| Net investment income (loss)A | (.01) | .22 | .20 | .22 | .21 | .21 |
| Net realized and unrealized gain (loss) | .16 | (.28) | .42 | 1.96 | 1.26 | (.45) |
| Total from investment operations | .15 | (.06) | .62 | 2.18 | 1.47 | (.24) |
| Distributions from net investment income | – | (.22) | (.19) | (.20) | (.18) | (.19) |
| Distributions from net realized gain | (.39) | (.07) | (.26) | (.20) | (.12) | (.03) |
| Total distributions | (.39) | (.29) | (.45) | (.40) | (.30) | (.23)B |
| Net asset value, end of period | $12.50 | $12.74 | $13.09 | $12.92 | $11.14 | $9.97 |
| Total ReturnC,D,E | 1.53% | (.50)% | 4.85% | 19.71% | 14.80% | (2.35)% |
| Ratios to Average Net AssetsF,G | | | | | | |
| Expenses before reductions | .25%H | .25% | .25% | .25% | .25% | .25% |
| Expenses net of fee waivers, if any | .25%H | .25% | .25% | .25% | .25% | .25% |
| Expenses net of all reductions | .25%H | .25% | .25% | .25% | .25% | .25% |
| Net investment income (loss) | (.22)%H | 1.66% | 1.53% | 1.78% | 1.92% | 2.00% |
| Supplemental Data | | | | | | |
| Net assets, end of period (000 omitted) | $56,498 | $52,321 | $49,366 | $46,379 | $33,051 | $25,869 |
| Portfolio turnover rateF | 23%H | 20% | 29% | 30% | 34% | 21% |
A Calculated based on average shares outstanding during the period.
B Total distributions of $.23 per share is comprised of distributions from net investment income of $.192 and distributions from net realized gain of $.033 per share.
C Total returns for periods of less than one year are not annualized.
D Total returns do not reflect charges attributable to your insurance company's separate account. Inclusion of these charges would reduce the total returns shown.
E Total returns would have been lower if certain expenses had not been reduced during the applicable periods shown.
F Amounts do not include the activity of the Underlying Funds.
G Expense ratios reflect operating expenses of the class. Expenses before reductions do not reflect amounts reimbursed by the investment adviser or reductions from expense offset arrangements and do not represent the amount paid by the class during periods when reimbursements or reductions occur. Expenses net of fee waivers reflect expenses after reimbursement by the investment adviser but prior to reductions from expense offset arrangements. Expenses net of all reductions represent the net expenses paid by the class but do not include expenses of the underlying funds in which the Fund invests.
H Annualized
See accompanying notes which are an integral part of the financial statements.
VIP Freedom 2030 Portfolio℠
Investment Summary (Unaudited)
The information in the following tables is based on the direct investments of the Fund.
Top Holdings as of June 30, 2016
| | % of fund's net assets | % of fund's net assets 6 months ago |
| VIP Overseas Portfolio Initial Class | 17.9 | 17.8 |
| VIP Growth & Income Portfolio Initial Class | 11.9 | 12.3 |
| VIP Investment Grade Bond Portfolio Initial Class | 11.6 | 10.5 |
| VIP Equity-Income Portfolio Initial Class | 10.6 | 10.9 |
| VIP Growth Portfolio Initial Class | 10.1 | 10.7 |
| VIP Contrafund Portfolio Initial Class | 10.0 | 10.3 |
| VIP Emerging Markets Portfolio Initial Class | 9.1 | 7.8 |
| VIP Value Portfolio Initial Class | 7.6 | 7.9 |
| VIP High Income Portfolio Initial Class | 3.8 | 3.8 |
| VIP Value Strategies Portfolio Initial Class | 3.7 | 3.8 |
| | 96.3 | |
Asset Allocation (% of fund's net assets)
| Period end |
| | Domestic Equity Funds | 56.8% |
| | International Equity Funds | 27.0% |
| | Bond Funds | 15.4% |
| | Short-Term Funds | 0.8% |

| Six months ago |
| | Domestic Equity Funds | 58.8% |
| | International Equity Funds | 25.6% |
| | Bond Funds | 14.3% |
| | Short-Term Funds | 1.3% |

VIP Freedom 2030 Portfolio℠
Investments June 30, 2016 (Unaudited)
Showing Percentage of Net Assets
| Domestic Equity Funds - 56.8% | | | |
| | | Shares | Value |
| VIP Contrafund Portfolio Initial Class (a) | | 851,792 | $26,558,865 |
| VIP Equity-Income Portfolio Initial Class (a) | | 1,397,350 | 28,142,622 |
| VIP Growth & Income Portfolio Initial Class (a) | | 1,780,541 | 31,853,875 |
| VIP Growth Portfolio Initial Class (a) | | 473,719 | 27,030,392 |
| VIP Mid Cap Portfolio Initial Class (a) | | 251,771 | 7,749,520 |
| VIP Value Portfolio Initial Class (a) | | 1,499,226 | 20,374,486 |
| VIP Value Strategies Portfolio Initial Class (a) | | 681,149 | 9,931,146 |
| TOTAL DOMESTIC EQUITY FUNDS | | | |
| (Cost $131,266,773) | | | 151,640,906 |
|
| International Equity Funds - 27.0% | | | |
| VIP Emerging Markets Portfolio Initial Class (a) | | 2,810,950 | 24,314,718 |
| VIP Overseas Portfolio Initial Class (a) | | 2,675,015 | 47,668,759 |
| TOTAL INTERNATIONAL EQUITY FUNDS | | | |
| (Cost $70,453,666) | | | 71,983,477 |
|
| Bond Funds - 15.4% | | | |
| VIP High Income Portfolio Initial Class (a) | | 1,949,407 | 10,292,868 |
| VIP Investment Grade Bond Portfolio Initial Class (a) | | 2,359,501 | 30,885,867 |
| TOTAL BOND FUNDS | | | |
| (Cost $41,089,836) | | | 41,178,735 |
|
| Short-Term Funds - 0.8% | | | |
| VIP Government Money Market Portfolio Initial Class 0.21% (a)(b) | | | |
| (Cost $2,147,307) | | 2,147,307 | 2,147,307 |
| TOTAL INVESTMENT PORTFOLIO - 100.0% | | | |
| (Cost $244,957,582) | | | 266,950,425 |
| NET OTHER ASSETS (LIABILITIES) - 0.0% | | | (32,583) |
| NET ASSETS - 100% | | | $266,917,842 |
Legend
(a) Affiliated Fund
(b) The rate quoted is the annualized seven-day yield of the fund at period end.
Affiliated Underlying Funds
Information regarding the Fund's fiscal year to date purchases and sales of the affiliated Underlying Funds and income earned by the Fund from investments in affiliated Underlying Funds is as follows:
| Affiliate | Value, beginning of period | Purchases | Sales Proceeds | Dividend Income | Value, end of period |
| VIP Contrafund Portfolio Initial Class | $26,983,105 | $3,690,408 | $2,210,307 | $-- | $26,558,865 |
| VIP Emerging Markets Portfolio Initial Class | 20,408,441 | 3,475,218 | 1,086,958 | -- | 24,314,718 |
| VIP Equity-Income Portfolio Initial Class | 28,466,124 | 3,335,688 | 3,432,799 | -- | 28,142,622 |
| VIP Government Money Market Portfolio Initial Class 0.21% | 3,467,507 | 328,189 | 1,648,390 | 1,831 | 2,147,307 |
| VIP Growth & Income Portfolio Initial Class | 32,094,830 | 4,013,807 | 2,810,540 | -- | 31,853,875 |
| VIP Growth Portfolio Initial Class | 28,091,218 | 4,767,723 | 2,421,503 | -- | 27,030,392 |
| VIP High Income Portfolio Initial Class | 9,812,148 | 944,347 | 1,101,526 | -- | 10,292,868 |
| VIP Investment Grade Bond Portfolio Initial Class | 27,531,638 | 4,875,503 | 3,132,441 | 14,689 | 30,885,867 |
| VIP Mid Cap Portfolio Initial Class | 7,717,230 | 1,066,549 | 665,653 | -- | 7,749,520 |
| VIP Overseas Portfolio Initial Class | 46,685,271 | 7,093,046 | 3,057,730 | -- | 47,668,759 |
| VIP Value Portfolio Initial Class | 20,580,872 | 1,268,475 | 1,852,340 | -- | 20,374,486 |
| VIP Value Strategies Portfolio Initial Class | 9,929,818 | 923,684 | 991,261 | -- | 9,931,146 |
| Total | $261,768,202 | $35,782,637 | $24,411,448 | $16,520 | $266,950,425 |
Investment Valuation
All investments are categorized as Level 1 under the Fair Value Hierarchy. The inputs or methodology used for valuing securities may not be an indication of the risk associated with investing in those securities. For more information on valuation inputs please refer to the Investment Valuation section in the accompanying Notes to Financial Statements.
See accompanying notes which are an integral part of the financial statements.
VIP Freedom 2030 Portfolio℠
Financial Statements
Statement of Assets and Liabilities
| | | June 30, 2016 (Unaudited) |
| Assets | | |
| Investment in securities, at value (cost $244,957,582) — See accompanying schedule | | $266,950,425 |
| Cash | | 1 |
| Receivable for investments sold | | 141,699 |
| Receivable for fund shares sold | | 206,097 |
| Total assets | | 267,298,222 |
| Liabilities | | |
| Payable for investments purchased | $184,414 | |
| Payable for fund shares redeemed | 163,385 | |
| Distribution and service plan fees payable | 32,581 | |
| Total liabilities | | 380,380 |
| Net Assets | | $266,917,842 |
| Net Assets consist of: | | |
| Paid in capital | | $239,270,572 |
| Accumulated net investment loss | | (174,231) |
| Accumulated undistributed net realized gain (loss) on investments | | 5,828,658 |
| Net unrealized appreciation (depreciation) on investments | | 21,992,843 |
| Net Assets | | $266,917,842 |
| Initial Class: | | |
| Net Asset Value, offering price and redemption price per share ($72,038,223 ÷ 5,876,556 shares) | | $12.26 |
| Service Class: | | |
| Net Asset Value, offering price and redemption price per share ($64,968,239 ÷ 5,310,420 shares) | | $12.23 |
| Service Class 2: | | |
| Net Asset Value, offering price and redemption price per share ($129,911,380 ÷ 10,661,450 shares) | | $12.19 |
See accompanying notes which are an integral part of the financial statements.
Statement of Operations
| | | Six months ended June 30, 2016 (Unaudited) |
| Investment Income | | |
| Income distributions from underlying funds | | $16,520 |
| Expenses | | |
| Distribution and service plan fees | $190,751 | |
| Independent trustees' fees and expenses | 582 | |
| Total expenses before reductions | 191,333 | |
| Expense reductions | (582) | 190,751 |
| Net investment income (loss) | | (174,231) |
| Realized and Unrealized Gain (Loss) | | |
| Realized gain (loss) on sale of underlying fund shares | (1,029,311) | |
| Capital gain distributions from underlying funds | 8,865,394 | |
| Total net realized gain (loss) | | 7,836,083 |
| Change in net unrealized appreciation (depreciation) on underlying funds | | (5,159,657) |
| Net gain (loss) | | 2,676,426 |
| Net increase (decrease) in net assets resulting from operations | | $2,502,195 |
See accompanying notes which are an integral part of the financial statements.
Statement of Changes in Net Assets
| | Six months ended June 30, 2016 (Unaudited) | Year ended December 31, 2015 |
| Increase (Decrease) in Net Assets | | |
| Operations | | |
| Net investment income (loss) | $(174,231) | $4,258,626 |
| Net realized gain (loss) | 7,836,083 | 10,767,824 |
| Change in net unrealized appreciation (depreciation) | (5,159,657) | (16,539,898) |
| Net increase (decrease) in net assets resulting from operations | 2,502,195 | (1,513,448) |
| Distributions to shareholders from net investment income | – | (4,262,242) |
| Distributions to shareholders from net realized gain | (9,998,871) | (1,432,334) |
| Total distributions | (9,998,871) | (5,694,576) |
| Share transactions - net increase (decrease) | 12,679,633 | (8,052,132) |
| Total increase (decrease) in net assets | 5,182,957 | (15,260,156) |
| Net Assets | | |
| Beginning of period | 261,734,885 | 276,995,041 |
| End of period | $266,917,842 | $261,734,885 |
| Other Information | | |
| Accumulated net investment loss end of period | $(174,231) | $– |
See accompanying notes which are an integral part of the financial statements.
Financial Highlights — VIP Freedom 2030 Portfolio Initial Class
| | Six months ended | Years ended December 31, | | | | |
| | June 30, 2016 (Unaudited) | 2015 | 2014 | 2013 | 2012 | 2011 |
| Selected Per–Share Data | | | | | | |
| Net asset value, beginning of period | $12.68 | $13.01 | $12.84 | $10.88 | $9.70 | $10.21 |
| Income from Investment Operations | | | | | | |
| Net investment income (loss)A | –B | .22 | .22 | .22 | .25 | .23 |
| Net realized and unrealized gain (loss) | .06 | (.25) | .41 | 2.12 | 1.26 | (.49) |
| Total from investment operations | .06 | (.03) | .63 | 2.34 | 1.51 | (.26) |
| Distributions from net investment income | – | (.23) | (.21) | (.21) | (.23) | (.22) |
| Distributions from net realized gain | (.48) | (.07) | (.25) | (.17) | (.10) | (.03) |
| Total distributions | (.48) | (.30) | (.46) | (.38) | (.33) | (.25) |
| Net asset value, end of period | $12.26 | $12.68 | $13.01 | $12.84 | $10.88 | $9.70 |
| Total ReturnC,D,E | .95% | (.24)% | 4.96% | 21.66% | 15.58% | (2.60)% |
| Ratios to Average Net AssetsF,G | | | | | | |
| Expenses before reductionsH | - %I | -% | -% | -% | -% | -% |
| Expenses net of fee waivers, if any | - %I | -% | -% | -% | -% | -% |
| Expenses net of all reductions | - %I | -% | -% | -% | -% | -% |
| Net investment income (loss) | .01%I | 1.66% | 1.70% | 1.88% | 2.39% | 2.27% |
| Supplemental Data | | | | | | |
| Net assets, end of period (000 omitted) | $72,038 | $68,661 | $72,243 | $64,173 | $39,111 | $30,601 |
| Portfolio turnover rateF | 19%I | 26% | 18% | 30% | 17% | 16% |
A Calculated based on average shares outstanding during the period.
B Amount represents less than $.005 per share.
C Total returns for periods of less than one year are not annualized.
D Total returns do not reflect charges attributable to your insurance company's separate account. Inclusion of these charges would reduce the total returns shown.
E Total returns would have been lower if certain expenses had not been reduced during the applicable periods shown.
F Amounts do not include the activity of the Underlying Funds.
G Expense ratios reflect operating expenses of the class. Expenses before reductions do not reflect amounts reimbursed by the investment adviser or reductions from expense offset arrangements and do not represent the amount paid by the class during periods when reimbursements or reductions occur. Expenses net of fee waivers reflect expenses after reimbursement by the investment adviser but prior to reductions from expense offset arrangements. Expenses net of all reductions represent the net expenses paid by the class but do not include expenses of the underlying funds in which the Fund invests.
H Amount represents less than .005%.
I Annualized
See accompanying notes which are an integral part of the financial statements.
Financial Highlights — VIP Freedom 2030 Portfolio Service Class
| | Six months ended | Years ended December 31, | | | | |
| | June 30, 2016 (Unaudited) | 2015 | 2014 | 2013 | 2012 | 2011 |
| Selected Per–Share Data | | | | | | |
| Net asset value, beginning of period | $12.66 | $12.99 | $12.82 | $10.87 | $9.69 | $10.20 |
| Income from Investment Operations | | | | | | |
| Net investment income (loss)A | (.01) | .21 | .21 | .21 | .24 | .22 |
| Net realized and unrealized gain (loss) | .06 | (.25) | .41 | 2.11 | 1.26 | (.49) |
| Total from investment operations | .05 | (.04) | .62 | 2.32 | 1.50 | (.27) |
| Distributions from net investment income | – | (.22) | (.19) | (.20) | (.22) | (.21) |
| Distributions from net realized gain | (.48) | (.07) | (.25) | (.17) | (.10) | (.03) |
| Total distributions | (.48) | (.29) | (.45)B | (.37) | (.32) | (.24) |
| Net asset value, end of period | $12.23 | $12.66 | $12.99 | $12.82 | $10.87 | $9.69 |
| Total ReturnC,D,E | .87% | (.34)% | 4.86% | 21.50% | 15.48% | (2.70)% |
| Ratios to Average Net AssetsF,G | | | | | | |
| Expenses before reductions | .10%H | .10% | .10% | .10% | .10% | .10% |
| Expenses net of fee waivers, if any | .10%H | .10% | .10% | .10% | .10% | .10% |
| Expenses net of all reductions | .10%H | .10% | .10% | .10% | .10% | .10% |
| Net investment income (loss) | (.09)%H | 1.56% | 1.60% | 1.78% | 2.29% | 2.17% |
| Supplemental Data | | | | | | |
| Net assets, end of period (000 omitted) | $64,968 | $59,096 | $53,484 | $46,868 | $32,295 | $28,666 |
| Portfolio turnover rateF | 19%H | 26% | 18% | 30% | 17% | 16% |
A Calculated based on average shares outstanding during the period.
B Total distributions of $.45 per share is comprised of distributions from net investment income of $.194 and distributions from net realized gain of $.254 per share.
C Total returns for periods of less than one year are not annualized.
D Total returns do not reflect charges attributable to your insurance company's separate account. Inclusion of these charges would reduce the total returns shown.
E Total returns would have been lower if certain expenses had not been reduced during the applicable periods shown.
F Amounts do not include the activity of the Underlying Funds.
G Expense ratios reflect operating expenses of the class. Expenses before reductions do not reflect amounts reimbursed by the investment adviser or reductions from expense offset arrangements and do not represent the amount paid by the class during periods when reimbursements or reductions occur. Expenses net of fee waivers reflect expenses after reimbursement by the investment adviser but prior to reductions from expense offset arrangements. Expenses net of all reductions represent the net expenses paid by the class but do not include expenses of the underlying funds in which the Fund invests.
H Annualized
See accompanying notes which are an integral part of the financial statements.
Financial Highlights — VIP Freedom 2030 Portfolio Service Class 2
| | Six months ended | Years ended December 31, | | | | |
| | June 30, 2016 (Unaudited) | 2015 | 2014 | 2013 | 2012 | 2011 |
| Selected Per–Share Data | | | | | | |
| Net asset value, beginning of period | $12.62 | $12.95 | $12.78 | $10.83 | $9.67 | $10.18 |
| Income from Investment Operations | | | | | | |
| Net investment income (loss)A | (.01) | .19 | .19 | .19 | .23 | .21 |
| Net realized and unrealized gain (loss) | .06 | (.25) | .41 | 2.11 | 1.23 | (.50) |
| Total from investment operations | .05 | (.06) | .60 | 2.30 | 1.46 | (.29) |
| Distributions from net investment income | – | (.20) | (.18) | (.18) | (.21) | (.19) |
| Distributions from net realized gain | (.48) | (.07) | (.25) | (.17) | (.10) | (.03) |
| Total distributions | (.48) | (.27) | (.43) | (.35) | (.30)B | (.22) |
| Net asset value, end of period | $12.19 | $12.62 | $12.95 | $12.78 | $10.83 | $9.67 |
| Total ReturnC,D,E | .87% | (.53)% | 4.74% | 21.41% | 15.18% | (2.83)% |
| Ratios to Average Net AssetsF,G | | | | | | |
| Expenses before reductions | .25%H | .25% | .25% | .25% | .25% | .25% |
| Expenses net of fee waivers, if any | .25%H | .25% | .25% | .25% | .25% | .25% |
| Expenses net of all reductions | .25%H | .25% | .25% | .25% | .25% | .25% |
| Net investment income (loss) | (.24)%H | 1.41% | 1.45% | 1.63% | 2.14% | 2.02% |
| Supplemental Data | | | | | | |
| Net assets, end of period (000 omitted) | $129,911 | $133,978 | $151,268 | $131,930 | $94,419 | $59,671 |
| Portfolio turnover rateF | 19%H | 26% | 18% | 30% | 17% | 16% |
A Calculated based on average shares outstanding during the period.
B Total distributions of $.30 per share is comprised of distributions from net investment income of $.207 and distributions from net realized gain of $.096 per share.
C Total returns for periods of less than one year are not annualized.
D Total returns do not reflect charges attributable to your insurance company's separate account. Inclusion of these charges would reduce the total returns shown.
E Total returns would have been lower if certain expenses had not been reduced during the applicable periods shown.
F Amounts do not include the activity of the Underlying Funds.
G Expense ratios reflect operating expenses of the class. Expenses before reductions do not reflect amounts reimbursed by the investment adviser or reductions from expense offset arrangements and do not represent the amount paid by the class during periods when reimbursements or reductions occur. Expenses net of fee waivers reflect expenses after reimbursement by the investment adviser but prior to reductions from expense offset arrangements. Expenses net of all reductions represent the net expenses paid by the class but do not include expenses of the underlying funds in which the Fund invests.
H Annualized
See accompanying notes which are an integral part of the financial statements.
VIP Freedom 2035 Portfolio℠
Investment Summary (Unaudited)
The information in the following tables is based on the direct investments of the Fund.
Top Holdings as of June 30, 2016
| | % of fund's net assets | % of fund's net assets 6 months ago |
| VIP Overseas Portfolio Initial Class | 20.0 | 19.9 |
| VIP Growth & Income Portfolio Initial Class | 13.4 | 13.5 |
| VIP Equity-Income Portfolio Initial Class | 11.8 | 12.0 |
| VIP Growth Portfolio Initial Class | 11.3 | 11.8 |
| VIP Contrafund Portfolio Initial Class | 11.1 | 11.3 |
| VIP Emerging Markets Portfolio Initial Class | 9.8 | 8.3 |
| VIP Value Portfolio Initial Class | 8.5 | 8.7 |
| VIP Value Strategies Portfolio Initial Class | 4.2 | 4.2 |
| VIP High Income Portfolio Initial Class | 3.8 | 3.8 |
| VIP Mid Cap Portfolio Initial Class | 3.2 | 3.2 |
| | 97.1 | |
Asset Allocation (% of fund's net assets)
| Period end |
| | Domestic Equity Funds | 63.5% |
| | International Equity Funds | 29.8% |
| | Bond Funds | 5.9% |
| | Short-Term Funds | 0.8% |

| Six months ago |
| | Domestic Equity Funds | 64.7% |
| | International Equity Funds | 28.2% |
| | Bond Funds | 5.8% |
| | Short-Term Funds | 1.3% |

VIP Freedom 2035 Portfolio℠
Investments June 30, 2016 (Unaudited)
Showing Percentage of Net Assets
| Domestic Equity Funds - 63.5% | | | |
| | | Shares | Value |
| VIP Contrafund Portfolio Initial Class (a) | | 102,569 | $3,198,108 |
| VIP Equity-Income Portfolio Initial Class (a) | | 168,275 | 3,389,060 |
| VIP Growth & Income Portfolio Initial Class (a) | | 214,497 | 3,837,354 |
| VIP Growth Portfolio Initial Class (a) | | 57,048 | 3,255,160 |
| VIP Mid Cap Portfolio Initial Class (a) | | 30,124 | 927,203 |
| VIP Value Portfolio Initial Class (a) | | 180,393 | 2,451,543 |
| VIP Value Strategies Portfolio Initial Class (a) | | 81,933 | 1,194,589 |
| TOTAL DOMESTIC EQUITY FUNDS | | | |
| (Cost $18,915,811) | | | 18,253,017 |
|
| International Equity Funds - 29.8% | | | |
| VIP Emerging Markets Portfolio Initial Class (a) | | 323,937 | 2,802,057 |
| VIP Overseas Portfolio Initial Class (a) | | 323,394 | 5,762,878 |
| TOTAL INTERNATIONAL EQUITY FUNDS | | | |
| (Cost $8,922,091) | | | 8,564,935 |
|
| Bond Funds - 5.9% | | | |
| VIP High Income Portfolio Initial Class (a) | | 210,445 | 1,111,148 |
| VIP Investment Grade Bond Portfolio Initial Class (a) | | 45,486 | 595,408 |
| TOTAL BOND FUNDS | | | |
| (Cost $1,735,433) | | | 1,706,556 |
|
| Short-Term Funds - 0.8% | | | |
| VIP Government Money Market Portfolio Initial Class 0.21% (a)(b) | | | |
| (Cost $231,837) | | 231,837 | 231,837 |
| TOTAL INVESTMENT PORTFOLIO - 100.0% | | | |
| (Cost $29,805,172) | | | 28,756,345 |
| NET OTHER ASSETS (LIABILITIES) - 0.0% | | | (5,174) |
| NET ASSETS - 100% | | | $28,751,171 |
Legend
(a) Affiliated Fund
(b) The rate quoted is the annualized seven-day yield of the fund at period end.
Affiliated Underlying Funds
Information regarding the Fund's fiscal year to date purchases and sales of the affiliated Underlying Funds and income earned by the Fund from investments in affiliated Underlying Funds is as follows:
| Affiliate | Value, beginning of period | Purchases | Sales Proceeds | Dividend Income | Value, end of period |
| VIP Contrafund Portfolio Initial Class | $2,672,572 | $914,733 | $221,356 | $-- | $3,198,108 |
| VIP Emerging Markets Portfolio Initial Class | 1,961,877 | 780,307 | 117,454 | -- | 2,802,057 |
| VIP Equity-Income Portfolio Initial Class | 2,820,554 | 898,847 | 332,761 | -- | 3,389,060 |
| VIP Government Money Market Portfolio Initial Class 0.21% | 312,017 | 73,174 | 153,355 | 182 | 231,837 |
| VIP Growth & Income Portfolio Initial Class | 3,181,522 | 1,034,388 | 258,804 | -- | 3,837,354 |
| VIP Growth Portfolio Initial Class | 2,780,156 | 1,067,121 | 269,793 | -- | 3,255,160 |
| VIP High Income Portfolio Initial Class | 884,011 | 273,753 | 111,888 | -- | 1,111,148 |
| VIP Investment Grade Bond Portfolio Initial Class | 480,847 | 158,584 | 73,669 | 254 | 595,408 |
| VIP Mid Cap Portfolio Initial Class | 764,849 | 260,558 | 67,646 | -- | 927,203 |
| VIP Overseas Portfolio Initial Class | 4,680,687 | 1,684,117 | 286,289 | -- | 5,762,878 |
| VIP Value Portfolio Initial Class | 2,040,008 | 537,849 | 179,423 | -- | 2,451,543 |
| VIP Value Strategies Portfolio Initial Class | 984,905 | 290,418 | 96,055 | -- | 1,194,589 |
| Total | $23,564,005 | $7,973,849 | $2,168,493 | $436 | $28,756,345 |
Investment Valuation
All investments are categorized as Level 1 under the Fair Value Hierarchy. The inputs or methodology used for valuing securities may not be an indication of the risk associated with investing in those securities. For more information on valuation inputs please refer to the Investment Valuation section in the accompanying Notes to Financial Statements.
See accompanying notes which are an integral part of the financial statements.
VIP Freedom 2035 Portfolio℠
Financial Statements
Statement of Assets and Liabilities
| | | June 30, 2016 (Unaudited) |
| Assets | | |
| Investment in securities, at value (cost $29,805,172) — See accompanying schedule | | $28,756,345 |
| Cash | | 1 |
| Receivable for investments sold | | 24 |
| Receivable for fund shares sold | | 15,875 |
| Total assets | | 28,772,245 |
| Liabilities | | |
| Payable for investments purchased | $15,555 | |
| Payable for fund shares redeemed | 345 | |
| Distribution and service plan fees payable | 5,174 | |
| Total liabilities | | 21,074 |
| Net Assets | | $28,751,171 |
| Net Assets consist of: | | |
| Paid in capital | | $29,216,418 |
| Accumulated net investment loss | | (28,105) |
| Accumulated undistributed net realized gain (loss) on investments | | 611,685 |
| Net unrealized appreciation (depreciation) on investments | | (1,048,827) |
| Net Assets | | $28,751,171 |
| Initial Class: | | |
| Net Asset Value, offering price and redemption price per share ($2,314,096 ÷ 125,211 shares) | | $18.48 |
| Service Class: | | |
| Net Asset Value, offering price and redemption price per share ($2,377,773 ÷ 128,846 shares) | | $18.45 |
| Service Class 2: | | |
| Net Asset Value, offering price and redemption price per share ($24,059,302 ÷ 1,310,343 shares) | | $18.36 |
See accompanying notes which are an integral part of the financial statements.
Statement of Operations
| | | Six months ended June 30, 2016 (Unaudited) |
| Investment Income | | |
| Income distributions from underlying funds | | $436 |
| Expenses | | |
| Distribution and service plan fees | $27,641 | |
| Independent trustees' fees and expenses | 55 | |
| Total expenses before reductions | 27,696 | |
| Expense reductions | (55) | 27,641 |
| Net investment income (loss) | | (27,205) |
| Realized and Unrealized Gain (Loss) | | |
| Realized gain (loss) on sale of underlying fund shares | (124,242) | |
| Capital gain distributions from underlying funds | 893,103 | |
| Total net realized gain (loss) | | 768,861 |
| Change in net unrealized appreciation (depreciation) on underlying funds | | (488,788) |
| Net gain (loss) | | 280,073 |
| Net increase (decrease) in net assets resulting from operations | | $252,868 |
See accompanying notes which are an integral part of the financial statements.
Statement of Changes in Net Assets
| | Six months ended June 30, 2016 (Unaudited) | Year ended December 31, 2015 |
| Increase (Decrease) in Net Assets | | |
| Operations | | |
| Net investment income (loss) | $(27,205) | $339,744 |
| Net realized gain (loss) | 768,861 | 728,939 |
| Change in net unrealized appreciation (depreciation) | (488,788) | (1,301,660) |
| Net increase (decrease) in net assets resulting from operations | 252,868 | (232,977) |
| Distributions to shareholders from net investment income | (1,296) | (339,892) |
| Distributions to shareholders from net realized gain | (742,511) | (114,912) |
| Total distributions | (743,807) | (454,804) |
| Share transactions - net increase (decrease) | 5,682,353 | 9,034,191 |
| Total increase (decrease) in net assets | 5,191,414 | 8,346,410 |
| Net Assets | | |
| Beginning of period | 23,559,757 | 15,213,347 |
| End of period | $28,751,171 | $23,559,757 |
| Other Information | | |
| Undistributed net investment income end of period | $– | $396 |
| Accumulated net investment loss end of period | $(28,105) | $– |
See accompanying notes which are an integral part of the financial statements.
Financial Highlights — VIP Freedom 2035 Portfolio Initial Class
| | Six months ended | Years ended December 31, | | | | |
| | June 30, 2016 (Unaudited) | 2015 | 2014 | 2013 | 2012 | 2011 |
| Selected Per–Share Data | | | | | | |
| Net asset value, beginning of period | $19.05 | $19.52 | $19.16 | $15.76 | $13.82 | $14.74 |
| Income from Investment Operations | | | | | | |
| Net investment income (loss)A | –B | .39 | .39 | .66 | .49 | .27 |
| Net realized and unrealized gain (loss) | –B | (.44) | .55 | 3.24 | 1.83 | (.85) |
| Total from investment operations | –B | (.05) | .94 | 3.90 | 2.32 | (.58) |
| Distributions from net investment income | –B | (.32) | (.29) | (.29) | (.31) | (.28) |
| Distributions from net realized gain | (.57) | (.10) | (.29) | (.20) | (.07) | (.06) |
| Total distributions | (.57) | (.42) | (.58) | (.50)C | (.38) | (.34) |
| Net asset value, end of period | $18.48 | $19.05 | $19.52 | $19.16 | $15.76 | $13.82 |
| Total ReturnD,E,F | .41% | (.31)% | 4.93% | 24.84% | 16.82% | (3.99)% |
| Ratios to Average Net AssetsG,H | | | | | | |
| Expenses before reductionsI | - %J | -% | -% | -% | -% | -% |
| Expenses net of fee waivers, if any | - %J | -% | -% | -% | -% | -% |
| Expenses net of all reductions | - %J | -% | -% | -% | -% | -% |
| Net investment income (loss) | - %I,J | 1.98% | 2.02% | 3.72% | 3.20% | 1.82% |
| Supplemental Data | | | | | | |
| Net assets, end of period (000 omitted) | $2,314 | $1,545 | $539 | $1,054 | $128 | $97 |
| Portfolio turnover rateG | 17%J | 22% | 26% | 31% | 19% | 38% |
A Calculated based on average shares outstanding during the period.
B Amount represents less than $.005 per share.
C Total distributions of $.50 per share is comprised of distributions from net investment income of $.292 and distributions from net realized gain of $.204 per share.
D Total returns for periods of less than one year are not annualized.
E Total returns do not reflect charges attributable to your insurance company's separate account. Inclusion of these charges would reduce the total returns shown.
F Total returns would have been lower if certain expenses had not been reduced during the applicable periods shown.
G Amounts do not include the activity of the Underlying Funds.
H Expense ratios reflect operating expenses of the class. Expenses before reductions do not reflect amounts reimbursed by the investment adviser or reductions from expense offset arrangements and do not represent the amount paid by the class during periods when reimbursements or reductions occur. Expenses net of fee waivers reflect expenses after reimbursement by the investment adviser but prior to reductions from expense offset arrangements. Expenses net of all reductions represent the net expenses paid by the class but do not include expenses of the underlying funds in which the Fund invests.
I Amount represents less than .005%.
J Annualized
See accompanying notes which are an integral part of the financial statements.
Financial Highlights — VIP Freedom 2035 Portfolio Service Class
| | Six months ended | Years ended December 31, | | | | |
| | June 30, 2016 (Unaudited) | 2015 | 2014 | 2013 | 2012 | 2011 |
| Selected Per–Share Data | | | | | | |
| Net asset value, beginning of period | $19.04 | $19.51 | $19.15 | $15.76 | $13.82 | $14.74 |
| Income from Investment Operations | | | | | | |
| Net investment income (loss)A | (.01) | .37 | .38 | .64 | .47 | .25 |
| Net realized and unrealized gain (loss) | (.01)B | (.44) | .55 | 3.24 | 1.84 | (.85) |
| Total from investment operations | (.02) | (.07) | .93 | 3.88 | 2.31 | (.60) |
| Distributions from net investment income | –C | (.30) | (.28) | (.28) | (.30) | (.26) |
| Distributions from net realized gain | (.57) | (.10) | (.29) | (.20) | (.07) | (.06) |
| Total distributions | (.57) | (.40) | (.57) | (.49)D | (.37) | (.32) |
| Net asset value, end of period | $18.45 | $19.04 | $19.51 | $19.15 | $15.76 | $13.82 |
| Total ReturnE,F,G | .30% | (.40)% | 4.87% | 24.72% | 16.71% | (4.10)% |
| Ratios to Average Net AssetsH,I | | | | | | |
| Expenses before reductions | .10%J | .10% | .10% | .10% | .10% | .10% |
| Expenses net of fee waivers, if any | .10%J | .10% | .10% | .10% | .10% | .10% |
| Expenses net of all reductions | .10%J | .10% | .10% | .10% | .10% | .10% |
| Net investment income (loss) | (.10)%J | 1.88% | 1.92% | 3.62% | 3.10% | 1.72% |
| Supplemental Data | | | | | | |
| Net assets, end of period (000 omitted) | $2,378 | $2,010 | $1,639 | $289 | $105 | $90 |
| Portfolio turnover rateH | 17%J | 22% | 26% | 31% | 19% | 38% |
A Calculated based on average shares outstanding during the period.
B The amount shown for a share outstanding does not correspond with the aggregate net gain (loss) on investments for the period due to the timing of sales and repurchases of shares in relation to fluctuating market values of the investments of the Fund.
C Amount represents less than $.005 per share.
D Total distributions of $.49 per share is comprised of distributions from net investment income of $.283 and distributions from net realized gain of $.204 per share.
E Total returns for periods of less than one year are not annualized.
F Total returns do not reflect charges attributable to your insurance company's separate account. Inclusion of these charges would reduce the total returns shown.
G Total returns would have been lower if certain expenses had not been reduced during the applicable periods shown.
H Amounts do not include the activity of the Underlying Funds.
I Expense ratios reflect operating expenses of the class. Expenses before reductions do not reflect amounts reimbursed by the investment adviser or reductions from expense offset arrangements and do not represent the amount paid by the class during periods when reimbursements or reductions occur. Expenses net of fee waivers reflect expenses after reimbursement by the investment adviser but prior to reductions from expense offset arrangements. Expenses net of all reductions represent the net expenses paid by the class but do not include expenses of the underlying funds in which the Fund invests.
J Annualized
See accompanying notes which are an integral part of the financial statements.
Financial Highlights — VIP Freedom 2035 Portfolio Service Class 2
| | Six months ended | Years ended December 31, | | | | |
| | June 30, 2016 (Unaudited) | 2015 | 2014 | 2013 | 2012 | 2011 |
| Selected Per–Share Data | | | | | | |
| Net asset value, beginning of period | $18.96 | $19.43 | $19.09 | $15.73 | $13.80 | $14.72 |
| Income from Investment Operations | | | | | | |
| Net investment income (loss)A | (.02) | .34 | .34 | .62 | .45 | .23 |
| Net realized and unrealized gain (loss) | (.01)B | (.43) | .54 | 3.22 | 1.84 | (.85) |
| Total from investment operations | (.03) | (.09) | .88 | 3.84 | 2.29 | (.62) |
| Distributions from net investment income | –C | (.28) | (.26) | (.27) | (.29) | (.24) |
| Distributions from net realized gain | (.57) | (.10) | (.29) | (.20) | (.07) | (.06) |
| Total distributions | (.57) | (.38) | (.54)D | (.48)E | (.36) | (.30) |
| Net asset value, end of period | $18.36 | $18.96 | $19.43 | $19.09 | $15.73 | $13.80 |
| Total ReturnF,G,H | .25% | (.51)% | 4.65% | 24.50% | 16.61% | (4.25)% |
| Ratios to Average Net AssetsI,J | | | | | | |
| Expenses before reductions | .25%K | .25% | .25% | .25% | .25% | .25% |
| Expenses net of fee waivers, if any | .25%K | .25% | .25% | .25% | .25% | .25% |
| Expenses net of all reductions | .25%K | .25% | .25% | .25% | .25% | .25% |
| Net investment income (loss) | (.25)%K | 1.73% | 1.77% | 3.48% | 2.95% | 1.57% |
| Supplemental Data | | | | | | |
| Net assets, end of period (000 omitted) | $24,059 | $20,005 | $13,035 | $4,423 | $808 | $276 |
| Portfolio turnover rateI | 17%K | 22% | 26% | 31% | 19% | 38% |
A Calculated based on average shares outstanding during the period.
B The amount shown for a share outstanding does not correspond with the aggregate net gain (loss) on investments for the period due to the timing of sales and repurchases of shares in relation to fluctuating market values of the investments of the Fund.
C Amount represents less than $.005 per share.
D Total distributions of $.54 per share is comprised of distributions from net investment income of $.257 and distributions from net realized gain of $.287 per share.
E Total distributions of $.48 per share is comprised of distributions from net investment income of $.271 and distributions from net realized gain of $.204 per share.
F Total returns for periods of less than one year are not annualized.
G Total returns do not reflect charges attributable to your insurance company's separate account. Inclusion of these charges would reduce the total returns shown.
H Total returns would have been lower if certain expenses had not been reduced during the applicable periods shown.
I Amounts do not include the activity of the Underlying Funds.
J Expense ratios reflect operating expenses of the class. Expenses before reductions do not reflect amounts reimbursed by the investment adviser or reductions from expense offset arrangements and do not represent the amount paid by the class during periods when reimbursements or reductions occur. Expenses net of fee waivers reflect expenses after reimbursement by the investment adviser but prior to reductions from expense offset arrangements. Expenses net of all reductions represent the net expenses paid by the class but do not include expenses of the underlying funds in which the Fund invests.
K Annualized
See accompanying notes which are an integral part of the financial statements.
VIP Freedom 2040 Portfolio℠
Investment Summary (Unaudited)
The information in the following tables is based on the direct investments of the Fund.
Top Holdings as of June 30, 2016
| | % of fund's net assets | % of fund's net assets 6 months ago |
| VIP Overseas Portfolio Initial Class | 20.0 | 19.9 |
| VIP Growth & Income Portfolio Initial Class | 13.4 | 13.5 |
| VIP Equity-Income Portfolio Initial Class | 11.8 | 12.0 |
| VIP Growth Portfolio Initial Class | 11.3 | 11.8 |
| VIP Contrafund Portfolio Initial Class | 11.1 | 11.3 |
| VIP Emerging Markets Portfolio Initial Class | 9.8 | 8.3 |
| VIP Value Portfolio Initial Class | 8.5 | 8.7 |
| VIP Value Strategies Portfolio Initial Class | 4.2 | 4.2 |
| VIP High Income Portfolio Initial Class | 3.8 | 3.8 |
| VIP Mid Cap Portfolio Initial Class | 3.2 | 3.2 |
| | 97.1 | |
Asset Allocation (% of fund's net assets)
| Period end |
| | Domestic Equity Funds | 63.5% |
| | International Equity Funds | 29.8% |
| | Bond Funds | 5.9% |
| | Short-Term Funds | 0.8% |

| Six months ago |
| | Domestic Equity Funds | 64.7% |
| | International Equity Funds | 28.2% |
| | Bond Funds | 5.8% |
| | Short-Term Funds | 1.3% |

VIP Freedom 2040 Portfolio℠
Investments June 30, 2016 (Unaudited)
Showing Percentage of Net Assets
| Domestic Equity Funds - 63.5% | | | |
| | | Shares | Value |
| VIP Contrafund Portfolio Initial Class (a) | | 182,575 | $5,692,673 |
| VIP Equity-Income Portfolio Initial Class (a) | | 299,541 | 6,032,747 |
| VIP Growth & Income Portfolio Initial Class (a) | | 381,802 | 6,830,430 |
| VIP Growth Portfolio Initial Class (a) | | 101,546 | 5,794,239 |
| VIP Mid Cap Portfolio Initial Class (a) | | 53,616 | 1,650,294 |
| VIP Value Portfolio Initial Class (a) | | 321,079 | 4,363,469 |
| VIP Value Strategies Portfolio Initial Class (a) | | 145,801 | 2,125,776 |
| TOTAL DOMESTIC EQUITY FUNDS | | | |
| (Cost $32,606,163) | | | 32,489,628 |
|
| International Equity Funds - 29.8% | | | |
| VIP Emerging Markets Portfolio Initial Class (a) | | 576,536 | 4,987,033 |
| VIP Overseas Portfolio Initial Class (a) | | 575,488 | 10,255,190 |
| TOTAL INTERNATIONAL EQUITY FUNDS | | | |
| (Cost $15,678,935) | | | 15,242,223 |
|
| Bond Funds - 5.9% | | | |
| VIP High Income Portfolio Initial Class (a) | | 374,770 | 1,978,788 |
| VIP Investment Grade Bond Portfolio Initial Class (a) | | 81,011 | 1,060,435 |
| TOTAL BOND FUNDS | | | |
| (Cost $3,124,585) | | | 3,039,223 |
|
| Short-Term Funds - 0.8% | | | |
| VIP Government Money Market Portfolio Initial Class 0.21% (a)(b) | | | |
| (Cost $412,833) | | 412,833 | 412,833 |
| TOTAL INVESTMENT PORTFOLIO - 100.0% | | | |
| (Cost $51,822,516) | | | 51,183,907 |
| NET OTHER ASSETS (LIABILITIES) - 0.0% | | | (4,429) |
| NET ASSETS - 100% | | | $51,179,478 |
Legend
(a) Affiliated Fund
(b) The rate quoted is the annualized seven-day yield of the fund at period end.
Affiliated Underlying Funds
Information regarding the Fund's fiscal year to date purchases and sales of the affiliated Underlying Funds and income earned by the Fund from investments in affiliated Underlying Funds is as follows:
| Affiliate | Value, beginning of period | Purchases | Sales Proceeds | Dividend Income | Value, end of period |
| VIP Contrafund Portfolio Initial Class | $5,247,350 | $1,233,689 | $431,200 | $-- | $5,692,673 |
| VIP Emerging Markets Portfolio Initial Class | 3,848,130 | 1,089,286 | 259,926 | -- | 4,987,033 |
| VIP Equity-Income Portfolio Initial Class | 5,537,158 | 1,158,803 | 639,942 | -- | 6,032,747 |
| VIP Government Money Market Portfolio Initial Class 0.21% | 613,131 | 101,779 | 302,077 | 342 | 412,833 |
| VIP Growth & Income Portfolio Initial Class | 6,243,507 | 1,354,682 | 501,453 | -- | 6,830,430 |
| VIP Growth Portfolio Initial Class | 5,461,754 | 1,514,056 | 526,109 | -- | 5,794,239 |
| VIP High Income Portfolio Initial Class | 1,735,296 | 348,754 | 224,751 | -- | 1,978,788 |
| VIP Investment Grade Bond Portfolio Initial Class | 944,695 | 211,059 | 150,470 | 492 | 1,060,435 |
| VIP Mid Cap Portfolio Initial Class | 1,500,827 | 346,801 | 129,219 | -- | 1,650,294 |
| VIP Overseas Portfolio Initial Class | 9,194,682 | 2,306,404 | 623,902 | -- | 10,255,190 |
| VIP Value Portfolio Initial Class | 4,003,065 | 619,677 | 343,167 | -- | 4,363,469 |
| VIP Value Strategies Portfolio Initial Class | 1,931,763 | 367,485 | 192,456 | -- | 2,125,776 |
| Total | $46,261,358 | $10,652,475 | $4,324,672 | $834 | $51,183,907 |
Investment Valuation
All investments are categorized as Level 1 under the Fair Value Hierarchy. The inputs or methodology used for valuing securities may not be an indication of the risk associated with investing in those securities. For more information on valuation inputs please refer to the Investment Valuation section in the accompanying Notes to Financial Statements.
See accompanying notes which are an integral part of the financial statements.
VIP Freedom 2040 Portfolio℠
Financial Statements
Statement of Assets and Liabilities
| | | June 30, 2016 (Unaudited) |
| Assets | | |
| Investment in securities, at value (cost $51,822,516) — See accompanying schedule | | $51,183,907 |
| Receivable for investments sold | | 2,184 |
| Receivable for fund shares sold | | 26,951 |
| Total assets | | 51,213,042 |
| Liabilities | | |
| Payable for investments purchased | $1,954 | |
| Payable for fund shares redeemed | 27,183 | |
| Distribution and service plan fees payable | 4,427 | |
| Total liabilities | | 33,564 |
| Net Assets | | $51,179,478 |
| Net Assets consist of: | | |
| Paid in capital | | $50,589,886 |
| Accumulated net investment loss | | (24,227) |
| Accumulated undistributed net realized gain (loss) on investments | | 1,252,428 |
| Net unrealized appreciation (depreciation) on investments | | (638,609) |
| Net Assets | | $51,179,478 |
| Initial Class: | | |
| Net Asset Value, offering price and redemption price per share ($17,330,164 ÷ 988,828 shares) | | $17.53 |
| Service Class: | | |
| Net Asset Value, offering price and redemption price per share ($21,347,683 ÷ 1,220,159 shares) | | $17.50 |
| Service Class 2: | | |
| Net Asset Value, offering price and redemption price per share ($12,501,631 ÷ 717,312 shares) | | $17.43 |
See accompanying notes which are an integral part of the financial statements.
Statement of Operations
| | | Six months ended June 30, 2016 (Unaudited) |
| Investment Income | | |
| Income distributions from underlying funds | | $834 |
| Expenses | | |
| Distribution and service plan fees | $25,061 | |
| Independent trustees' fees and expenses | 106 | |
| Total expenses before reductions | 25,167 | |
| Expense reductions | (106) | 25,061 |
| Net investment income (loss) | | (24,227) |
| Realized and Unrealized Gain (Loss) | | |
| Realized gain (loss) on sale of underlying fund shares | (149,719) | |
| Capital gain distributions from underlying funds | 1,738,165 | |
| Total net realized gain (loss) | | 1,588,446 |
| Change in net unrealized appreciation (depreciation) on underlying funds | | (1,255,541) |
| Net gain (loss) | | 332,905 |
| Net increase (decrease) in net assets resulting from operations | | $308,678 |
See accompanying notes which are an integral part of the financial statements.
Statement of Changes in Net Assets
| | Six months ended June 30, 2016 (Unaudited) | Year ended December 31, 2015 |
| Increase (Decrease) in Net Assets | | |
| Operations | | |
| Net investment income (loss) | $(24,227) | $733,644 |
| Net realized gain (loss) | 1,588,446 | 1,761,186 |
| Change in net unrealized appreciation (depreciation) | (1,255,541) | (2,940,295) |
| Net increase (decrease) in net assets resulting from operations | 308,678 | (445,465) |
| Distributions to shareholders from net investment income | – | (734,120) |
| Distributions to shareholders from net realized gain | (1,693,083) | (287,093) |
| Total distributions | (1,693,083) | (1,021,213) |
| Share transactions - net increase (decrease) | 6,306,703 | 11,244,253 |
| Total increase (decrease) in net assets | 4,922,298 | 9,777,575 |
| Net Assets | | |
| Beginning of period | 46,257,180 | 36,479,605 |
| End of period | $51,179,478 | $46,257,180 |
| Other Information | | |
| Accumulated net investment loss end of period | $(24,227) | $– |
See accompanying notes which are an integral part of the financial statements.
Financial Highlights — VIP Freedom 2040 Portfolio Initial Class
| | Six months ended | Years ended December 31, | | | | |
| | June 30, 2016 (Unaudited) | 2015 | 2014 | 2013 | 2012 | 2011 |
| Selected Per–Share Data | | | | | | |
| Net asset value, beginning of period | $18.19 | $18.66 | $18.35 | $15.03 | $13.16 | $14.02 |
| Income from Investment Operations | | | | | | |
| Net investment income (loss)A | –B | .34 | .34 | .38 | .42 | .35 |
| Net realized and unrealized gain (loss) | (.01)C | (.38) | .56 | 3.41 | 1.81 | (.91) |
| Total from investment operations | (.01) | (.04) | .90 | 3.79 | 2.23 | (.56) |
| Distributions from net investment income | – | (.31) | (.28) | (.27) | (.29) | (.27) |
| Distributions from net realized gain | (.65) | (.12) | (.31) | (.19) | (.07) | (.02) |
| Total distributions | (.65) | (.43) | (.59) | (.47)D | (.36) | (.30)E |
| Net asset value, end of period | $17.53 | $18.19 | $18.66 | $18.35 | $15.03 | $13.16 |
| Total ReturnF,G,H | .42% | (.26)% | 4.91% | 25.29% | 16.95% | (4.02)% |
| Ratios to Average Net AssetsI,J | | | | | | |
| Expenses before reductionsK | - %L | -% | -% | -% | -% | -% |
| Expenses net of fee waivers, if any | - %L | -% | -% | -% | -% | -% |
| Expenses net of all reductions | - %L | -% | -% | -% | -% | -% |
| Net investment income (loss) | - %K,L | 1.80% | 1.82% | 2.26% | 2.91% | 2.50% |
| Supplemental Data | | | | | | |
| Net assets, end of period (000 omitted) | $17,330 | $15,388 | $15,234 | $10,262 | $3,369 | $1,559 |
| Portfolio turnover rateI | 18%L | 23% | 19% | 36% | 39% | 42% |
A Calculated based on average shares outstanding during the period.
B Amount represents less than $.005 per share.
C The amount shown for a share outstanding does not correspond with the aggregate net gain (loss) on investments for the period due to the timing of sales and repurchases of shares in relation to fluctuating market values of the investments of the Fund.
D Total distributions of $.47 per share is comprised of distributions from net investment income of $.272 and distributions from net realized gain of $.193 per share.
E Total distributions of $.30 per share is comprised of distributions from net investment income of .274 and distributions from net realized gain of $.022 per share.
F Total returns for periods of less than one year are not annualized.
G Total returns do not reflect charges attributable to your insurance company's separate account. Inclusion of these charges would reduce the total returns shown.
H Total returns would have been lower if certain expenses had not been reduced during the applicable periods shown.
I Amounts do not include the activity of the Underlying Funds.
J Expense ratios reflect operating expenses of the class. Expenses before reductions do not reflect amounts reimbursed by the investment adviser or reductions from expense offset arrangements and do not represent the amount paid by the class during periods when reimbursements or reductions occur. Expenses net of fee waivers reflect expenses after reimbursement by the investment adviser but prior to reductions from expense offset arrangements. Expenses net of all reductions represent the net expenses paid by the class but do not include expenses of the underlying funds in which the Fund invests.
K Amount represents less than .005%.
L Annualized
See accompanying notes which are an integral part of the financial statements.
Financial Highlights — VIP Freedom 2040 Portfolio Service Class
| | Six months ended | Years ended December 31, | | | | |
| | June 30, 2016 (Unaudited) | 2015 | 2014 | 2013 | 2012 | 2011 |
| Selected Per–Share Data | | | | | | |
| Net asset value, beginning of period | $18.17 | $18.64 | $18.33 | $15.02 | $13.15 | $14.02 |
| Income from Investment Operations | | | | | | |
| Net investment income (loss)A | (.01) | .32 | .32 | .36 | .41 | .33 |
| Net realized and unrealized gain (loss) | (.01)B | (.38) | .56 | 3.40 | 1.81 | (.91) |
| Total from investment operations | (.02) | (.06) | .88 | 3.76 | 2.22 | (.58) |
| Distributions from net investment income | – | (.29) | (.27) | (.26) | (.28) | (.26) |
| Distributions from net realized gain | (.65) | (.12) | (.31) | (.19) | (.07) | (.02) |
| Total distributions | (.65) | (.41) | (.57)C | (.45) | (.35) | (.29)D |
| Net asset value, end of period | $17.50 | $18.17 | $18.64 | $18.33 | $15.02 | $13.15 |
| Total ReturnE,F,G | .36% | (.35)% | 4.83% | 25.16% | 16.88% | (4.17)% |
| Ratios to Average Net AssetsH,I | | | | | | |
| Expenses before reductions | .10%J | .10% | .10% | .10% | .10% | .10% |
| Expenses net of fee waivers, if any | .10%J | .10% | .10% | .10% | .10% | .10% |
| Expenses net of all reductions | .10%J | .10% | .10% | .10% | .10% | .10% |
| Net investment income (loss) | (.10)%J | 1.70% | 1.72% | 2.16% | 2.81% | 2.41% |
| Supplemental Data | | | | | | |
| Net assets, end of period (000 omitted) | $21,348 | $18,401 | $12,905 | $9,076 | $4,600 | $1,058 |
| Portfolio turnover rateH | 18%J | 23% | 19% | 36% | 39% | 42% |
A Calculated based on average shares outstanding during the period.
B The amount shown for a share outstanding does not correspond with the aggregate net gain (loss) on investments for the period due to the timing of sales and repurchases of shares in relation to fluctuating market values of the investments of the Fund.
C Total distributions of $.57 per share is comprised of distributions from net investment income of $.266 and distributions from net realized gain of $.305 per share.
D Total distributions of $.29 per share is comprised of distributions from net investment income of $.264 and distributions from net realized gain of $.022 per share.
E Total returns for periods of less than one year are not annualized.
F Total returns do not reflect charges attributable to your insurance company's separate account. Inclusion of these charges would reduce the total returns shown.
G Total returns would have been lower if certain expenses had not been reduced during the applicable periods shown.
H Amounts do not include the activity of the Underlying Funds.
I Expense ratios reflect operating expenses of the class. Expenses before reductions do not reflect amounts reimbursed by the investment adviser or reductions from expense offset arrangements and do not represent the amount paid by the class during periods when reimbursements or reductions occur. Expenses net of fee waivers reflect expenses after reimbursement by the investment adviser but prior to reductions from expense offset arrangements. Expenses net of all reductions represent the net expenses paid by the class but do not include expenses of the underlying funds in which the Fund invests.
J Annualized
See accompanying notes which are an integral part of the financial statements.
Financial Highlights — VIP Freedom 2040 Portfolio Service Class 2
| | Six months ended | Years ended December 31, | | | | |
| | June 30, 2016 (Unaudited) | 2015 | 2014 | 2013 | 2012 | 2011 |
| Selected Per–Share Data | | | | | | |
| Net asset value, beginning of period | $18.12 | $18.59 | $18.29 | $15.00 | $13.15 | $14.02 |
| Income from Investment Operations | | | | | | |
| Net investment income (loss)A | (.02) | .29 | .29 | .34 | .39 | .32 |
| Net realized and unrealized gain (loss) | (.02)B | (.38) | .56 | 3.39 | 1.79 | (.92) |
| Total from investment operations | (.04) | (.09) | .85 | 3.73 | 2.18 | (.60) |
| Distributions from net investment income | – | (.27) | (.25) | (.25) | (.27) | (.24) |
| Distributions from net realized gain | (.65) | (.12) | (.31) | (.19) | (.07) | (.02) |
| Total distributions | (.65) | (.38)C | (.55)D | (.44) | (.33)E | (.27)F |
| Net asset value, end of period | $17.43 | $18.12 | $18.59 | $18.29 | $15.00 | $13.15 |
| Total ReturnG,H,I | .25% | (.49)% | 4.70% | 24.99% | 16.64% | (4.32)% |
| Ratios to Average Net AssetsJ,K | | | | | | |
| Expenses before reductions | .25%L | .25% | .25% | .25% | .25% | .25% |
| Expenses net of fee waivers, if any | .25%L | .25% | .25% | .25% | .25% | .25% |
| Expenses net of all reductions | .25%L | .25% | .25% | .25% | .25% | .25% |
| Net investment income (loss) | (.25)%L | 1.55% | 1.57% | 2.01% | 2.66% | 2.25% |
| Supplemental Data | | | | | | |
| Net assets, end of period (000 omitted) | $12,502 | $12,468 | $8,341 | $2,815 | $581 | $137 |
| Portfolio turnover rateJ | 18%L | 23% | 19% | 36% | 39% | 42% |
A Calculated based on average shares outstanding during the period.
B The amount shown for a share outstanding does not correspond with the aggregate net gain (loss) on investments for the period due to the timing of sales and repurchases of shares in relation to fluctuating market values of the investments of the Fund.
C Total distributions of $.38 per share is comprised of distributions from net investment income of $.268 and distributions from net realized gain of $.116 per share.
D Total distributions of $.55 per share is comprised of distributions from net investment income of $.249 and distributions from net realized gain of $.305 per share.
E Total distributions of $.33 per share is comprised of distributions from net investment income of $.265 and distributions from net realized gain of $.069 per share.
F Total distributions of $.27 per share is comprised of distributions from net investment income of $.243 and distributions from net realized gain of $.022 per share.
G Total returns for periods of less than one year are not annualized.
H Total returns do not reflect charges attributable to your insurance company's separate account. Inclusion of these charges would reduce the total returns shown.
I Total returns would have been lower if certain expenses had not been reduced during the applicable periods shown.
J Amounts do not include the activity of the Underlying Funds.
K Expense ratios reflect operating expenses of the class. Expenses before reductions do not reflect amounts reimbursed by the investment adviser or reductions from expense offset arrangements and do not represent the amount paid by the class during periods when reimbursements or reductions occur. Expenses net of fee waivers reflect expenses after reimbursement by the investment adviser but prior to reductions from expense offset arrangements. Expenses net of all reductions represent the net expenses paid by the class but do not include expenses of the underlying funds in which the Fund invests.
L Annualized
See accompanying notes which are an integral part of the financial statements.
VIP Freedom 2045 Portfolio℠
Investment Summary (Unaudited)
The information in the following tables is based on the direct investments of the Fund.
Top Holdings as of June 30, 2016
| | % of fund's net assets | % of fund's net assets 6 months ago |
| VIP Overseas Portfolio Initial Class | 20.0 | 19.9 |
| VIP Growth & Income Portfolio Initial Class | 13.4 | 13.5 |
| VIP Equity-Income Portfolio Initial Class | 11.8 | 12.0 |
| VIP Growth Portfolio Initial Class | 11.3 | 11.8 |
| VIP Contrafund Portfolio Initial Class | 11.1 | 11.4 |
| VIP Emerging Markets Portfolio Initial Class | 9.8 | 8.3 |
| VIP Value Portfolio Initial Class | 8.5 | 8.6 |
| VIP Value Strategies Portfolio Initial Class | 4.2 | 4.2 |
| VIP High Income Portfolio Initial Class | 3.8 | 3.8 |
| VIP Mid Cap Portfolio Initial Class | 3.2 | 3.2 |
| | 97.1 | |
Asset Allocation (% of fund's net assets)
| Period end |
| | Domestic Equity Funds | 63.5% |
| | International Equity Funds | 29.8% |
| | Bond Funds | 5.9% |
| | Short-Term Funds | 0.8% |

| Six months ago |
| | Domestic Equity Funds | 64.7% |
| | International Equity Funds | 28.2% |
| | Bond Funds | 5.8% |
| | Short-Term Funds | 1.3% |

VIP Freedom 2045 Portfolio℠
Investments June 30, 2016 (Unaudited)
Showing Percentage of Net Assets
| Domestic Equity Funds - 63.5% | | | |
| | | Shares | Value |
| VIP Contrafund Portfolio Initial Class (a) | | 52,042 | $1,622,663 |
| VIP Equity-Income Portfolio Initial Class (a) | | 85,374 | 1,719,435 |
| VIP Growth & Income Portfolio Initial Class (a) | | 108,828 | 1,946,930 |
| VIP Growth Portfolio Initial Class (a) | | 28,946 | 1,651,679 |
| VIP Mid Cap Portfolio Initial Class (a) | | 15,283 | 470,395 |
| VIP Value Portfolio Initial Class (a) | | 91,526 | 1,243,840 |
| VIP Value Strategies Portfolio Initial Class (a) | | 41,563 | 605,985 |
| TOTAL DOMESTIC EQUITY FUNDS | | | |
| (Cost $9,583,121) | | | 9,260,927 |
|
| International Equity Funds - 29.8% | | | |
| VIP Emerging Markets Portfolio Initial Class (a) | | 164,368 | 1,421,785 |
| VIP Overseas Portfolio Initial Class (a) | | 164,096 | 2,924,183 |
| TOTAL INTERNATIONAL EQUITY FUNDS | | | |
| (Cost $4,512,929) | | | 4,345,968 |
|
| Bond Funds - 5.9% | | | |
| VIP High Income Portfolio Initial Class (a) | | 106,774 | 563,765 |
| VIP Investment Grade Bond Portfolio Initial Class (a) | | 23,080 | 302,111 |
| TOTAL BOND FUNDS | | | |
| (Cost $880,842) | | | 865,876 |
|
| Short-Term Funds - 0.8% | | | |
| VIP Government Money Market Portfolio Initial Class 0.21% (a)(b) | | | |
| (Cost $117,640) | | 117,640 | 117,640 |
| TOTAL INVESTMENT PORTFOLIO - 100.0% | | | |
| (Cost $15,094,532) | | | 14,590,411 |
| NET OTHER ASSETS (LIABILITIES) - 0.0% | | | (2,854) |
| NET ASSETS - 100% | | | $14,587,557 |
Legend
(a) Affiliated Fund
(b) The rate quoted is the annualized seven-day yield of the fund at period end.
Affiliated Underlying Funds
Information regarding the Fund's fiscal year to date purchases and sales of the affiliated Underlying Funds and income earned by the Fund from investments in affiliated Underlying Funds is as follows:
| Affiliate | Value, beginning of period | Purchases | Sales Proceeds | Dividend Income | Value, end of period |
| VIP Contrafund Portfolio Initial Class | $1,395,911 | $436,522 | $114,260 | $-- | $1,622,663 |
| VIP Emerging Markets Portfolio Initial Class | 1,021,953 | 376,493 | 63,559 | -- | 1,421,785 |
| VIP Equity-Income Portfolio Initial Class | 1,467,471 | 423,918 | 168,463 | -- | 1,719,435 |
| VIP Government Money Market Portfolio Initial Class 0.21% | 163,036 | 36,166 | 81,562 | 95 | 117,640 |
| VIP Growth & Income Portfolio Initial Class | 1,659,610 | 485,474 | 127,327 | -- | 1,946,930 |
| VIP Growth Portfolio Initial Class | 1,451,452 | 523,323 | 146,518 | -- | 1,651,679 |
| VIP High Income Portfolio Initial Class | 460,721 | 131,798 | 61,382 | -- | 563,765 |
| VIP Investment Grade Bond Portfolio Initial Class | 251,131 | 75,902 | 40,016 | 134 | 302,111 |
| VIP Mid Cap Portfolio Initial Class | 398,334 | 123,354 | 33,014 | -- | 470,395 |
| VIP Overseas Portfolio Initial Class | 2,441,862 | 795,898 | 143,480 | -- | 2,924,183 |
| VIP Value Portfolio Initial Class | 1,062,071 | 248,318 | 90,056 | -- | 1,243,840 |
| VIP Value Strategies Portfolio Initial Class | 511,292 | 136,638 | 47,570 | -- | 605,985 |
| Total | $12,284,844 | $3,793,804 | $1,117,207 | $229 | $14,590,411 |
Investment Valuation
All investments are categorized as Level 1 under the Fair Value Hierarchy. The inputs or methodology used for valuing securities may not be an indication of the risk associated with investing in those securities. For more information on valuation inputs please refer to the Investment Valuation section in the accompanying Notes to Financial Statements.
See accompanying notes which are an integral part of the financial statements.
VIP Freedom 2045 Portfolio℠
Financial Statements
Statement of Assets and Liabilities
| | | June 30, 2016 (Unaudited) |
| Assets | | |
| Investment in securities, at value (cost $15,094,532) — See accompanying schedule | | $14,590,411 |
| Receivable for fund shares sold | | 20,217 |
| Total assets | | 14,610,628 |
| Liabilities | | |
| Payable for investments purchased | $20,053 | |
| Payable for fund shares redeemed | 170 | |
| Distribution and service plan fees payable | 2,848 | |
| Total liabilities | | 23,071 |
| Net Assets | | $14,587,557 |
| Net Assets consist of: | | |
| Paid in capital | | $14,814,712 |
| Accumulated net investment loss | | (15,130) |
| Accumulated undistributed net realized gain (loss) on investments | | 292,096 |
| Net unrealized appreciation (depreciation) on investments | | (504,121) |
| Net Assets | | $14,587,557 |
| Initial Class: | | |
| Net Asset Value, offering price and redemption price per share ($562,445 ÷ 32,212 shares) | | $17.46 |
| Service Class: | | |
| Net Asset Value, offering price and redemption price per share ($244,006 ÷ 13,989 shares) | | $17.44 |
| Service Class 2: | | |
| Net Asset Value, offering price and redemption price per share ($13,781,106 ÷ 793,731 shares) | | $17.36 |
See accompanying notes which are an integral part of the financial statements.
Statement of Operations
| | | Six months ended June 30, 2016 (Unaudited) |
| Investment Income | | |
| Income distributions from underlying funds | | $229 |
| Expenses | | |
| Distribution and service plan fees | $15,359 | |
| Independent trustees' fees and expenses | 29 | |
| Total expenses before reductions | 15,388 | |
| Expense reductions | (29) | 15,359 |
| Net investment income (loss) | | (15,130) |
| Realized and Unrealized Gain (Loss) | | |
| Realized gain (loss) on sale of underlying fund shares | (39,453) | |
| Capital gain distributions from underlying funds | 471,158 | |
| Total net realized gain (loss) | | 431,705 |
| Change in net unrealized appreciation (depreciation) on underlying funds | | (331,589) |
| Net gain (loss) | | 100,116 |
| Net increase (decrease) in net assets resulting from operations | | $84,986 |
See accompanying notes which are an integral part of the financial statements.
Statement of Changes in Net Assets
| | Six months ended June 30, 2016 (Unaudited) | Year ended December 31, 2015 |
| Increase (Decrease) in Net Assets | | |
| Operations | | |
| Net investment income (loss) | $(15,130) | $188,851 |
| Net realized gain (loss) | 431,705 | 332,067 |
| Change in net unrealized appreciation (depreciation) | (331,589) | (662,594) |
| Net increase (decrease) in net assets resulting from operations | 84,986 | (141,676) |
| Distributions to shareholders from net investment income | – | (190,223) |
| Distributions to shareholders from net realized gain | (400,032) | (65,189) |
| Total distributions | (400,032) | (255,412) |
| Share transactions - net increase (decrease) | 2,620,222 | 4,610,754 |
| Total increase (decrease) in net assets | 2,305,176 | 4,213,666 |
| Net Assets | | |
| Beginning of period | 12,282,381 | 8,068,715 |
| End of period | $14,587,557 | $12,282,381 |
| Other Information | | |
| Accumulated net investment loss end of period | $(15,130) | $– |
See accompanying notes which are an integral part of the financial statements.
Financial Highlights — VIP Freedom 2045 Portfolio Initial Class
| | Six months ended | Years ended December 31, | | | | |
| | June 30, 2016 (Unaudited) | 2015 | 2014 | 2013 | 2012 | 2011 |
| Selected Per–Share Data | | | | | | |
| Net asset value, beginning of period | $18.03 | $18.50 | $18.18 | $14.83 | $13.38 | $14.61 |
| Income from Investment Operations | | | | | | |
| Net investment income (loss)A | –B | .38 | .40 | .52 | .44 | .27 |
| Net realized and unrealized gain (loss) | –B | (.42) | .50 | 3.33 | 1.84 | (.89) |
| Total from investment operations | –B | (.04) | .90 | 3.85 | 2.28 | (.62) |
| Distributions from net investment income | – | (.33) | (.28) | (.29) | (.30) | (.28) |
| Distributions from net realized gain | (.57) | (.10) | (.30) | (.21) | (.53) | (.34) |
| Total distributions | (.57) | (.43) | (.58) | (.50) | (.83) | (.61)C |
| Net asset value, end of period | $17.46 | $18.03 | $18.50 | $18.18 | $14.83 | $13.38 |
| Total ReturnD,E,F | .38% | (.26)% | 4.95% | 26.07% | 17.33% | (4.41)% |
| Ratios to Average Net AssetsG,H | | | | | | |
| Expenses before reductionsI | - %J | -% | -% | -% | -% | -% |
| Expenses net of fee waivers, if any | - %J | -% | -% | -% | -% | -% |
| Expenses net of all reductions | - %J | -% | -% | -% | -% | -% |
| Net investment income (loss) | - %I,J | 2.01% | 2.14% | 3.13% | 3.07% | 1.88% |
| Supplemental Data | | | | | | |
| Net assets, end of period (000 omitted) | $562 | $542 | $342 | $272 | $136 | $95 |
| Portfolio turnover rateG | 17%J | 26% | 19% | 42% | 16% | 29% |
A Calculated based on average shares outstanding during the period.
B Amount represents less than $.005 per share.
C Total distributions of $.61 per share is comprised of distributions from net investment income of $.279 and distributions from net realized gain of $.335 per share.
D Total returns for periods of less than one year are not annualized.
E Total returns do not reflect charges attributable to your insurance company's separate account. Inclusion of these charges would reduce the total returns shown.
F Total returns would have been lower if certain expenses had not been reduced during the applicable periods shown.
G Amounts do not include the activity of the Underlying Funds.
H Expense ratios reflect operating expenses of the class. Expenses before reductions do not reflect amounts reimbursed by the investment adviser or reductions from expense offset arrangements and do not represent the amount paid by the class during periods when reimbursements or reductions occur. Expenses net of fee waivers reflect expenses after reimbursement by the investment adviser but prior to reductions from expense offset arrangements. Expenses net of all reductions represent the net expenses paid by the class but do not include expenses of the underlying funds in which the Fund invests.
I Amount represents less than .005%.
J Annualized
See accompanying notes which are an integral part of the financial statements.
Financial Highlights — VIP Freedom 2045 Portfolio Service Class
| | Six months ended | Years ended December 31, | | | | |
| | June 30, 2016 (Unaudited) | 2015 | 2014 | 2013 | 2012 | 2011 |
| Selected Per–Share Data | | | | | | |
| Net asset value, beginning of period | $18.02 | $18.49 | $18.18 | $14.83 | $13.38 | $14.61 |
| Income from Investment Operations | | | | | | |
| Net investment income (loss)A | (.01) | .36 | .38 | .51 | .43 | .26 |
| Net realized and unrealized gain (loss) | –B | (.42) | .49 | 3.33 | 1.83 | (.89) |
| Total from investment operations | (.01) | (.06) | .87 | 3.84 | 2.26 | (.63) |
| Distributions from net investment income | – | (.31) | (.27) | (.27) | (.29) | (.26) |
| Distributions from net realized gain | (.57) | (.10) | (.30) | (.21) | (.53) | (.34) |
| Total distributions | (.57) | (.41) | (.56)C | (.49)D | (.81)E | (.60) |
| Net asset value, end of period | $17.44 | $18.02 | $18.49 | $18.18 | $14.83 | $13.38 |
| Total ReturnF,G,H | .32% | (.37)% | 4.83% | 25.96% | 17.24% | (4.52)% |
| Ratios to Average Net AssetsI,J | | | | | | |
| Expenses before reductions | .10%K | .10% | .10% | .10% | .10% | .10% |
| Expenses net of fee waivers, if any | .10%K | .10% | .10% | .10% | .10% | .10% |
| Expenses net of all reductions | .10%K | .10% | .10% | .10% | .10% | .10% |
| Net investment income (loss) | (.10)%K | 1.91% | 2.04% | 3.03% | 2.97% | 1.78% |
| Supplemental Data | | | | | | |
| Net assets, end of period (000 omitted) | $244 | $343 | $364 | $169 | $134 | $90 |
| Portfolio turnover rateI | 17%K | 26% | 19% | 42% | 16% | 29% |
A Calculated based on average shares outstanding during the period.
B Amount represents less than $.005 per share.
C Total distributions of $.56 per share is comprised of distributions from net investment income of $.266 and distributions from net realized gain of $.298 per share.
D Total distributions of $.49 per share is comprised of distributions from net investment income of $.271 and distributions from net realized gain of $.214 per share.
E Total distributions of $.81 per share is comprised of distributions from net investment income of $.289 and distributions from net realized gain of $.525 per share.
F Total returns for periods of less than one year are not annualized.
G Total returns do not reflect charges attributable to your insurance company's separate account. Inclusion of these charges would reduce the total returns shown.
H Total returns would have been lower if certain expenses had not been reduced during the applicable periods shown.
I Amounts do not include the activity of the Underlying Funds.
J Expense ratios reflect operating expenses of the class. Expenses before reductions do not reflect amounts reimbursed by the investment adviser or reductions from expense offset arrangements and do not represent the amount paid by the class during periods when reimbursements or reductions occur. Expenses net of fee waivers reflect expenses after reimbursement by the investment adviser but prior to reductions from expense offset arrangements. Expenses net of all reductions represent the net expenses paid by the class but do not include expenses of the underlying funds in which the Fund invests.
K Annualized
See accompanying notes which are an integral part of the financial statements.
Financial Highlights — VIP Freedom 2045 Portfolio Service Class 2
| | Six months ended | Years ended December 31, | | | | |
| | June 30, 2016 (Unaudited) | 2015 | 2014 | 2013 | 2012 | 2011 |
| Selected Per–Share Data | | | | | | |
| Net asset value, beginning of period | $17.95 | $18.43 | $18.13 | $14.81 | $13.38 | $14.61 |
| Income from Investment Operations | | | | | | |
| Net investment income (loss)A | (.02) | .33 | .35 | .49 | .41 | .23 |
| Net realized and unrealized gain (loss) | –B | (.42) | .49 | 3.31 | 1.83 | (.88) |
| Total from investment operations | (.02) | (.09) | .84 | 3.80 | 2.24 | (.65) |
| Distributions from net investment income | – | (.29) | (.25) | (.27) | (.28) | (.25) |
| Distributions from net realized gain | (.57) | (.10) | (.30) | (.21) | (.53) | (.34) |
| Total distributions | (.57) | (.39) | (.54)C | (.48) | (.81) | (.58)D |
| Net asset value, end of period | $17.36 | $17.95 | $18.43 | $18.13 | $14.81 | $13.38 |
| Total ReturnE,F,G | .27% | (.53)% | 4.68% | 25.76% | 17.02% | (4.64)% |
| Ratios to Average Net AssetsH,I | | | | | | |
| Expenses before reductions | .25%J | .25% | .25% | .25% | .25% | .25% |
| Expenses net of fee waivers, if any | .25%J | .25% | .25% | .25% | .25% | .25% |
| Expenses net of all reductions | .25%J | .25% | .25% | .25% | .25% | .25% |
| Net investment income (loss) | (.25)%J | 1.76% | 1.89% | 2.88% | 2.82% | 1.63% |
| Supplemental Data | | | | | | |
| Net assets, end of period (000 omitted) | $13,781 | $11,398 | $7,363 | $2,493 | $486 | $143 |
| Portfolio turnover rateH | 17%J | 26% | 19% | 42% | 16% | 29% |
A Calculated based on average shares outstanding during the period.
B Amount represents less than $.005 per share.
C Total distributions of $.54 per share is comprised of distributions from net investment income of $.245 and distributions from net realized gain of $.298 per share.
D Total distributions of $.58 per share is comprised of distributions from net investment income of $.245 and distributions from net realized gain of $.335 per share.
E Total returns for periods of less than one year are not annualized.
F Total returns do not reflect charges attributable to your insurance company's separate account. Inclusion of these charges would reduce the total returns shown.
G Total returns would have been lower if certain expenses had not been reduced during the applicable periods shown.
H Amounts do not include the activity of the Underlying Funds.
I Expense ratios reflect operating expenses of the class. Expenses before reductions do not reflect amounts reimbursed by the investment adviser or reductions from expense offset arrangements and do not represent the amount paid by the class during periods when reimbursements or reductions occur. Expenses net of fee waivers reflect expenses after reimbursement by the investment adviser but prior to reductions from expense offset arrangements. Expenses net of all reductions represent the net expenses paid by the class but do not include expenses of the underlying funds in which the Fund invests.
J Annualized
See accompanying notes which are an integral part of the financial statements.
VIP Freedom 2050 Portfolio℠
Investment Summary (Unaudited)
The information in the following tables is based on the direct investments of the Fund.
Top Holdings as of June 30, 2016
| | % of fund's net assets | % of fund's net assets 6 months ago |
| VIP Overseas Portfolio Initial Class | 20.0 | 19.9 |
| VIP Growth & Income Portfolio Initial Class | 13.4 | 13.5 |
| VIP Equity-Income Portfolio Initial Class | 11.8 | 12.0 |
| VIP Growth Portfolio Initial Class | 11.3 | 11.8 |
| VIP Contrafund Portfolio Initial Class | 11.1 | 11.4 |
| VIP Emerging Markets Portfolio Initial Class | 9.8 | 8.3 |
| VIP Value Portfolio Initial Class | 8.5 | 8.6 |
| VIP Value Strategies Portfolio Initial Class | 4.2 | 4.2 |
| VIP High Income Portfolio Initial Class | 3.8 | 3.8 |
| VIP Mid Cap Portfolio Initial Class | 3.2 | 3.2 |
| | 97.1 | |
Asset Allocation (% of fund's net assets)
| Period end |
| | Domestic Equity Funds | 63.5% |
| | International Equity Funds | 29.8% |
| | Bond Funds | 5.9% |
| | Short-Term Funds | 0.8% |

| Six months ago |
| | Domestic Equity Funds | 64.7% |
| | International Equity Funds | 28.2% |
| | Bond Funds | 5.8% |
| | Short-Term Funds | 1.3% |

VIP Freedom 2050 Portfolio℠
Investments June 30, 2016 (Unaudited)
Showing Percentage of Net Assets
| Domestic Equity Funds - 63.5% | | | |
| | | Shares | Value |
| VIP Contrafund Portfolio Initial Class (a) | | 52,313 | $1,631,107 |
| VIP Equity-Income Portfolio Initial Class (a) | | 85,823 | 1,728,479 |
| VIP Growth & Income Portfolio Initial Class (a) | | 109,396 | 1,957,102 |
| VIP Growth Portfolio Initial Class (a) | | 29,096 | 1,660,235 |
| VIP Mid Cap Portfolio Initial Class (a) | | 15,362 | 472,852 |
| VIP Value Portfolio Initial Class (a) | | 92,002 | 1,250,301 |
| VIP Value Strategies Portfolio Initial Class (a) | | 41,781 | 609,163 |
| TOTAL DOMESTIC EQUITY FUNDS | | | |
| (Cost $9,474,618) | | | 9,309,239 |
|
| International Equity Funds - 29.8% | | | |
| VIP Emerging Markets Portfolio Initial Class (a) | | 165,224 | 1,429,186 |
| VIP Overseas Portfolio Initial Class (a) | | 164,930 | 2,939,058 |
| TOTAL INTERNATIONAL EQUITY FUNDS | | | |
| (Cost $4,511,164) | | | 4,368,244 |
|
| Bond Funds - 5.9% | | | |
| VIP High Income Portfolio Initial Class (a) | | 107,355 | 566,835 |
| VIP Investment Grade Bond Portfolio Initial Class (a) | | 23,206 | 303,760 |
| TOTAL BOND FUNDS | | | |
| (Cost $890,036) | | | 870,595 |
|
| Short-Term Funds - 0.8% | | | |
| VIP Government Money Market Portfolio Initial Class 0.21% (a)(b) | | | |
| (Cost $118,274) | | 118,274 | 118,274 |
| TOTAL INVESTMENT PORTFOLIO - 100.0% | | | |
| (Cost $14,994,092) | | | 14,666,352 |
| NET OTHER ASSETS (LIABILITIES) - 0.0% | | | (2,044) |
| NET ASSETS - 100% | | | $14,664,308 |
Legend
(a) Affiliated Fund
(b) The rate quoted is the annualized seven-day yield of the fund at period end.
Affiliated Underlying Funds
Information regarding the Fund's fiscal year to date purchases and sales of the affiliated Underlying Funds and income earned by the Fund from investments in affiliated Underlying Funds is as follows:
| Affiliate | Value, beginning of period | Purchases | Sales Proceeds | Dividend Income | Value, end of period |
| VIP Contrafund Portfolio Initial Class | $1,467,418 | $470,378 | $205,737 | $-- | $1,631,107 |
| VIP Emerging Markets Portfolio Initial Class | 1,075,159 | 393,526 | 124,133 | -- | 1,429,186 |
| VIP Equity-Income Portfolio Initial Class | 1,543,548 | 467,021 | 273,510 | -- | 1,728,479 |
| VIP Government Money Market Portfolio Initial Class 0.21% | 171,714 | 38,299 | 91,739 | 96 | 118,274 |
| VIP Growth & Income Portfolio Initial Class | 1,743,810 | 532,848 | 242,517 | -- | 1,957,102 |
| VIP Growth Portfolio Initial Class | 1,530,404 | 551,385 | 237,798 | -- | 1,660,235 |
| VIP High Income Portfolio Initial Class | 484,004 | 142,046 | 92,144 | -- | 566,835 |
| VIP Investment Grade Bond Portfolio Initial Class | 263,991 | 80,336 | 55,893 | 136 | 303,760 |
| VIP Mid Cap Portfolio Initial Class | 418,396 | 135,189 | 61,028 | -- | 472,852 |
| VIP Overseas Portfolio Initial Class | 2,569,351 | 841,533 | 291,730 | -- | 2,939,058 |
| VIP Value Portfolio Initial Class | 1,116,066 | 278,493 | 164,904 | -- | 1,250,301 |
| VIP Value Strategies Portfolio Initial Class | 536,774 | 151,343 | 83,235 | -- | 609,163 |
| Total | $12,920,635 | $4,082,397 | $1,924,368 | $232 | $14,666,352 |
Investment Valuation
All investments are categorized as Level 1 under the Fair Value Hierarchy. The inputs or methodology used for valuing securities may not be an indication of the risk associated with investing in those securities. For more information on valuation inputs please refer to the Investment Valuation section in the accompanying Notes to Financial Statements.
See accompanying notes which are an integral part of the financial statements.
VIP Freedom 2050 Portfolio℠
Financial Statements
Statement of Assets and Liabilities
| | | June 30, 2016 (Unaudited) |
| Assets | | |
| Investment in securities, at value (cost $14,994,092) — See accompanying schedule | | $14,666,352 |
| Cash | | 1 |
| Receivable for fund shares sold | | 11,617 |
| Total assets | | 14,677,970 |
| Liabilities | | |
| Payable for investments purchased | $7,885 | |
| Payable for fund shares redeemed | 3,732 | |
| Distribution and service plan fees payable | 2,045 | |
| Total liabilities | | 13,662 |
| Net Assets | | $14,664,308 |
| Net Assets consist of: | | |
| Paid in capital | | $14,821,021 |
| Accumulated net investment loss | | (11,475) |
| Accumulated undistributed net realized gain (loss) on investments | | 182,502 |
| Net unrealized appreciation (depreciation) on investments | | (327,740) |
| Net Assets | | $14,664,308 |
| Initial Class: | | |
| Net Asset Value, offering price and redemption price per share ($2,564,665 ÷ 162,540 shares) | | $15.78 |
| Service Class: | | |
| Net Asset Value, offering price and redemption price per share ($3,650,005 ÷ 231,793 shares) | | $15.75 |
| Service Class 2: | | |
| Net Asset Value, offering price and redemption price per share ($8,449,638 ÷ 538,331 shares) | | $15.70 |
See accompanying notes which are an integral part of the financial statements.
Statement of Operations
| | | Six months ended June 30, 2016 (Unaudited) |
| Investment Income | | |
| Income distributions from underlying funds | | $232 |
| Expenses | | |
| Distribution and service plan fees | $11,128 | |
| Independent trustees' fees and expenses | 29 | |
| Total expenses before reductions | 11,157 | |
| Expense reductions | (29) | 11,128 |
| Net investment income (loss) | | (10,896) |
| Realized and Unrealized Gain (Loss) | | |
| Realized gain (loss) on sale of underlying fund shares | (70,381) | |
| Capital gain distributions from underlying funds | 479,484 | |
| Total net realized gain (loss) | | 409,103 |
| Change in net unrealized appreciation (depreciation) on underlying funds | | (341,934) |
| Net gain (loss) | | 67,169 |
| Net increase (decrease) in net assets resulting from operations | | $56,273 |
See accompanying notes which are an integral part of the financial statements.
Statement of Changes in Net Assets
| | Six months ended June 30, 2016 (Unaudited) | Year ended December 31, 2015 |
| Increase (Decrease) in Net Assets | | |
| Operations | | |
| Net investment income (loss) | $(10,896) | $218,690 |
| Net realized gain (loss) | 409,103 | 347,035 |
| Change in net unrealized appreciation (depreciation) | (341,934) | (721,553) |
| Net increase (decrease) in net assets resulting from operations | 56,273 | (155,828) |
| Distributions to shareholders from net investment income | (20,609) | (200,903) |
| Distributions to shareholders from net realized gain | (473,200) | (80,362) |
| Total distributions | (493,809) | (281,265) |
| Share transactions - net increase (decrease) | 2,183,271 | 2,357,902 |
| Total increase (decrease) in net assets | 1,745,735 | 1,920,809 |
| Net Assets | | |
| Beginning of period | 12,918,573 | 10,997,764 |
| End of period | $14,664,308 | $12,918,573 |
| Other Information | | |
| Undistributed net investment income end of period | $– | $20,030 |
| Accumulated net investment loss end of period | $(11,475) | $– |
See accompanying notes which are an integral part of the financial statements.
Financial Highlights — VIP Freedom 2050 Portfolio Initial Class
| | Six months ended | Years ended December 31, | | | | |
| | June 30, 2016 (Unaudited) | 2015 | 2014 | 2013 | 2012 | 2011 |
| Selected Per–Share Data | | | | | | |
| Net asset value, beginning of period | $16.42 | $16.86 | $16.55 | $13.41 | $13.34 | $15.82 |
| Income from Investment Operations | | | | | | |
| Net investment income (loss)A | –B | .32 | .35 | .37 | .47 | .26 |
| Net realized and unrealized gain (loss) | (.02)C | (.36) | .47 | 3.16 | 1.72 | (1.03) |
| Total from investment operations | (.02) | (.04) | .82 | 3.53 | 2.19 | (.77) |
| Distributions from net investment income | (.03) | (.29) | (.25) | (.22) | (.28) | (.28) |
| Distributions from net realized gain | (.60) | (.11) | (.27) | (.18) | (1.84) | (1.43) |
| Total distributions | (.62)D | (.40) | (.51)E | (.39)F | (2.12) | (1.71) |
| Net asset value, end of period | $15.78 | $16.42 | $16.86 | $16.55 | $13.41 | $13.34 |
| Total ReturnG,H,I | .38% | (.29)% | 5.01% | 26.44% | 17.64% | (4.93)% |
| Ratios to Average Net AssetsJ,K | | | | | | |
| Expenses before reductionsL | - %M | -% | -% | -% | -% | -% |
| Expenses net of fee waivers, if any | - %M | -% | -% | -% | -% | -% |
| Expenses net of all reductions | - %M | -% | -% | -% | -% | -% |
| Net investment income (loss) | - %L,M | 1.89% | 2.06% | 2.42% | 3.57% | 1.67% |
| Supplemental Data | | | | | | |
| Net assets, end of period (000 omitted) | $2,565 | $2,266 | $1,684 | $880 | $441 | $253 |
| Portfolio turnover rateJ | 29%M | 37% | 22% | 59% | 24% | 92% |
A Calculated based on average shares outstanding during the period.
B Amount represents less than $.005 per share.
C The amount shown for a share outstanding does not correspond with the aggregate net gain (loss) on investments for the period due to the timing of sales and repurchases of shares in relation to fluctuating market values of the investments of the Fund.
D Total distributions of $.62 per share is comprised of distributions from net investment income of $.026 and distributions from net realized gain of $.597 per share.
E Total distributions of $.51 per share is comprised of distributions from net investment income of $.248 and distributions from net realized gain of $.266 per share.
F Total distributions of $.39 per share is comprised of distributions from net investment income of $.218 and distributions from net realized gain of $.175 per share.
G Total returns for periods of less than one year are not annualized.
H Total returns do not reflect charges attributable to your insurance company's separate account. Inclusion of these charges would reduce the total returns shown.
I Total returns would have been lower if certain expenses had not been reduced during the applicable periods shown.
J Amounts do not include the activity of the Underlying Funds.
K Expense ratios reflect operating expenses of the class. Expenses before reductions do not reflect amounts reimbursed by the investment adviser or reductions from expense offset arrangements and do not represent the amount paid by the class during periods when reimbursements or reductions occur. Expenses net of fee waivers reflect expenses after reimbursement by the investment adviser but prior to reductions from expense offset arrangements. Expenses net of all reductions represent the net expenses paid by the class but do not include expenses of the underlying funds in which the Fund invests.
L Amount represents less than .005%.
M Annualized
See accompanying notes which are an integral part of the financial statements.
Financial Highlights — VIP Freedom 2050 Portfolio Service Class
| | Six months ended | Years ended December 31, | | | | |
| | June 30, 2016 (Unaudited) | 2015 | 2014 | 2013 | 2012 | 2011 |
| Selected Per–Share Data | | | | | | |
| Net asset value, beginning of period | $16.39 | $16.83 | $16.54 | $13.41 | $13.34 | $15.82 |
| Income from Investment Operations | | | | | | |
| Net investment income (loss)A | (.01) | .31 | .33 | .35 | .46 | .25 |
| Net realized and unrealized gain (loss) | (.01)B | (.37) | .46 | 3.17 | 1.73 | (1.04) |
| Total from investment operations | (.02) | (.06) | .79 | 3.52 | 2.19 | (.79) |
| Distributions from net investment income | (.03) | (.27) | (.24) | (.21) | (.27) | (.26) |
| Distributions from net realized gain | (.60) | (.11) | (.27) | (.18) | (1.84) | (1.43) |
| Total distributions | (.62)C | (.38) | (.50)D | (.39) | (2.12)E | (1.69) |
| Net asset value, end of period | $15.75 | $16.39 | $16.83 | $16.54 | $13.41 | $13.34 |
| Total ReturnF,G,H | .38% | (.38)% | 4.81% | 26.32% | 17.59% | (5.06)% |
| Ratios to Average Net AssetsI,J | | | | | | |
| Expenses before reductions | .10%K | .10% | .10% | .10% | .10% | .10% |
| Expenses net of fee waivers, if any | .10%K | .10% | .10% | .10% | .10% | .10% |
| Expenses net of all reductions | .10%K | .10% | .10% | .10% | .10% | .10% |
| Net investment income (loss) | (.10)%K | 1.79% | 1.96% | 2.32% | 3.47% | 1.57% |
| Supplemental Data | | | | | | |
| Net assets, end of period (000 omitted) | $3,650 | $3,004 | $2,878 | $1,892 | $490 | $91 |
| Portfolio turnover rateI | 29%K | 37% | 22% | 59% | 24% | 92% |
A Calculated based on average shares outstanding during the period.
B The amount shown for a share outstanding does not correspond with the aggregate net gain (loss) on investments for the period due to the timing of sales and repurchases of shares in relation to fluctuating market values of the investments of the Fund.
C Total distributions of $.62 per share is comprised of distributions from net investment income of $.026 and distributions from net realized gain of $.597 per share.
D Total distributions of $.50 per share is comprised of distributions from net investment income of $.236 and distributions from net realized gain of $.266 per share.
E Total distributions of $2.12 per share is comprised of distributions from net investment income of $.272 and distributions from net realized gain of $1.843 per share.
F Total returns for periods of less than one year are not annualized.
G Total returns do not reflect charges attributable to your insurance company's separate account. Inclusion of these charges would reduce the total returns shown.
H Total returns would have been lower if certain expenses had not been reduced during the applicable periods shown.
I Amounts do not include the activity of the Underlying Funds.
J Expense ratios reflect operating expenses of the class. Expenses before reductions do not reflect amounts reimbursed by the investment adviser or reductions from expense offset arrangements and do not represent the amount paid by the class during periods when reimbursements or reductions occur. Expenses net of fee waivers reflect expenses after reimbursement by the investment adviser but prior to reductions from expense offset arrangements. Expenses net of all reductions represent the net expenses paid by the class but do not include expenses of the underlying funds in which the Fund invests.
K Annualized
See accompanying notes which are an integral part of the financial statements.
Financial Highlights — VIP Freedom 2050 Portfolio Service Class 2
| | Six months ended | Years ended December 31, | | | | |
| | June 30, 2016 (Unaudited) | 2015 | 2014 | 2013 | 2012 | 2011 |
| Selected Per–Share Data | | | | | | |
| Net asset value, beginning of period | $16.35 | $16.80 | $16.51 | $13.39 | $13.33 | $15.81 |
| Income from Investment Operations | | | | | | |
| Net investment income (loss)A | (.02) | .28 | .30 | .33 | .43 | .22 |
| Net realized and unrealized gain (loss) | (.01)B | (.37) | .47 | 3.16 | 1.73 | (1.02) |
| Total from investment operations | (.03) | (.09) | .77 | 3.49 | 2.16 | (.80) |
| Distributions from net investment income | (.03) | (.25) | (.22) | (.19) | (.26) | (.25) |
| Distributions from net realized gain | (.60) | (.11) | (.27) | (.18) | (1.84) | (1.43) |
| Total distributions | (.62)C | (.36) | (.48)D | (.37) | (2.10) | (1.68) |
| Net asset value, end of period | $15.70 | $16.35 | $16.80 | $16.51 | $13.39 | $13.33 |
| Total ReturnE,F,G | .32% | (.58)% | 4.71% | 26.13% | 17.38% | (5.16)% |
| Ratios to Average Net AssetsH,I | | | | | | |
| Expenses before reductions | .25%J | .25% | .25% | .25% | .25% | .25% |
| Expenses net of fee waivers, if any | .25%J | .25% | .25% | .25% | .25% | .25% |
| Expenses net of all reductions | .25%J | .25% | .25% | .25% | .25% | .25% |
| Net investment income (loss) | (.25)%J | 1.64% | 1.81% | 2.17% | 3.32% | 1.42% |
| Supplemental Data | | | | | | |
| Net assets, end of period (000 omitted) | $8,450 | $7,649 | $6,436 | $1,666 | $390 | $163 |
| Portfolio turnover rateH | 29%J | 37% | 22% | 59% | 24% | 92% |
A Calculated based on average shares outstanding during the period.
B The amount shown for a share outstanding does not correspond with the aggregate net gain (loss) on investments for the period due to the timing of sales and repurchases of shares in relation to fluctuating market values of the investments of the Fund.
C Total distributions of $.62 per share is comprised of distributions from net investment income of $.026 and distributions from net realized gain of $.597 per share.
D Total distributions of $.48 per share is comprised of distributions from net investment income of $.218 and distributions from net realized gain of $.266 per share.
E Total returns for periods of less than one year are not annualized.
F Total returns do not reflect charges attributable to your insurance company's separate account. Inclusion of these charges would reduce the total returns shown.
G Total returns would have been lower if certain expenses had not been reduced during the applicable periods shown.
H Amounts do not include the activity of the Underlying Funds.
I Expense ratios reflect operating expenses of the class. Expenses before reductions do not reflect amounts reimbursed by the investment adviser or reductions from expense offset arrangements and do not represent the amount paid by the class during periods when reimbursements or reductions occur. Expenses net of fee waivers reflect expenses after reimbursement by the investment adviser but prior to reductions from expense offset arrangements. Expenses net of all reductions represent the net expenses paid by the class but do not include expenses of the underlying funds in which the Fund invests.
J Annualized
See accompanying notes which are an integral part of the financial statements.
Notes to Financial Statements (Unaudited)
For the period ended June 30, 2016
1. Organization.
VIP Freedom Income Portfolio, VIP Freedom 2005 Portfolio, VIP Freedom 2010 Portfolio, VIP Freedom 2015 Portfolio, VIP Freedom 2020 Portfolio, VIP Freedom 2025 Portfolio, VIP Freedom 2030 Portfolio, VIP Freedom 2035 Portfolio, VIP Freedom 2040 Portfolio, VIP Freedom 2045 Portfolio and VIP Freedom 2050 Portfolio (the Funds) are funds of Variable Insurance Products Fund V (the Trust). The Trust is registered under the Investment Company Act of 1940, as amended (the 1940 Act), as an open-end management investment company organized as a Massachusetts business trust. Each Fund is authorized to issue an unlimited number of shares. The Funds invest primarily in a combination of other VIP equity, bond, and short-term funds (the Underlying Funds) managed by Fidelity Management & Research Company (FMR). Shares of each Fund may only be purchased by insurance companies for the purpose of funding variable annuity or variable life insurance contracts. Each Fund offers three classes of shares: Initial Class shares, Service Class shares and Service Class 2 shares. All classes have equal rights and voting privileges, except for matters affecting a single class.
2. Significant Accounting Policies.
The financial statements have been prepared in conformity with accounting principles generally accepted in the United States of America (GAAP), which require management to make certain estimates and assumptions at the date of the financial statements. Actual results could differ from those estimates. Subsequent events, if any, through the date that the financial statements were issued have been evaluated in the preparation of the financial statements. The following summarizes the significant accounting policies of the Funds:
Investment Valuation. Investments are valued as of 4:00 p.m. Eastern time on the last calendar day of the period. Each Fund categorizes the inputs to valuation techniques used to value its investments into a disclosure hierarchy consisting of three levels as shown below:
- Level 1 – quoted prices in active markets for identical investments
- Level 2 – other significant observable inputs (including quoted prices for similar investments, interest rates, prepayment speeds, etc.)
- Level 3 – unobservable inputs (including the Fund's own assumptions based on the best information available)
Valuation techniques used to value each Fund's investments by major category are as follows. Investments in the Underlying Funds are valued at their closing net asset value (NAV) each business day and are categorized as Level 1 in the hierarchy.
Investment Transactions and Income. For financial reporting purposes, the Funds' investment holdings and NAV include trades executed through the end of the last business day of the period. The NAV per share for processing shareholder transactions is calculated as of the close of business of the New York Stock Exchange (NYSE), normally 4:00 p.m. Eastern time and includes trades executed through the end of the prior business day. Gains and losses on securities sold are determined on the basis of identified cost. Income and capital gain distributions from the Underlying Funds, if any, are recorded on the ex-dividend date.
Class Allocations and Expenses. Investment income, realized and unrealized capital gains and losses, common expenses of each Fund, and certain fund-level expense reductions, if any, are allocated daily on a pro-rata basis to each class based on the relative net assets of each class to the total net assets of each Fund. Each class differs with respect to distribution and service plan fees incurred. Certain expense reductions may also differ by class. For the reporting period, the allocated portion of income and expenses to each class as a percent of its average net assets may vary due to the timing of recording these transactions in relation to fluctuating net assets of the classes. Expenses directly attributable to a fund are charged to that fund. Expenses attributable to more than one fund are allocated among the respective funds on the basis of relative net assets or other appropriate methods. Expenses included in the accompanying financial statements reflect the expenses of each Fund and do not include any expenses associated with the Underlying Funds. Although not included in each Fund's expenses, each Fund indirectly bears its proportionate share of the Underlying Funds' expenses through the impact of these expenses on each Underlying Fund's NAV. Expense estimates are accrued in the period to which they relate and adjustments are made when actual amounts are known.
Income Tax Information and Distributions to Shareholders. Each year, each Fund intends to qualify as a regulated investment company under Subchapter M of the Internal Revenue Code, including distributing substantially all of its taxable income and realized gains. As a result, no provision for U.S. Federal income taxes is required. Each Fund files a U.S. federal tax return, in addition to state and local tax returns as required. Each Fund's federal income tax returns are subject to examination by the Internal Revenue Service (IRS) for a period of three fiscal years after they are filed. State and local tax returns may be subject to examination for an additional fiscal year depending on the jurisdiction.
Distributions are declared and recorded on the ex-dividend date. Income dividends and capital gain distributions are declared separately for each class. Income and capital gain distributions are determined in accordance with income tax regulations, which may differ from GAAP.
Capital accounts within the financial statements are adjusted for permanent book-tax differences. These adjustments have no impact on net assets or the results of operations. Capital accounts are not adjusted for temporary book-tax differences which will reverse in a subsequent period.
Book-tax differences are primarily due to the short-term gain distributions from the Underlying Funds, capital loss carryforwards and losses deferred due to wash sales.
The federal tax cost of investment securities and unrealized appreciation (depreciation) as of period end were as follows for each Fund:
| | Tax cost | Gross unrealized appreciation | Gross unrealized depreciation | Net unrealized appreciation (depreciation) on securities |
| VIP Freedom Income | $38,295,885 | $1,537,347 | $(520,399) | $1,016,948 |
| VIP Freedom 2005 | 6,855,003 | 378,021 | (149,770) | 228,251 |
| VIP Freedom 2010 | 275,854,017 | 24,492,208 | (4,537,247) | 19,954,961 |
| VIP Freedom 2015 | 91,523,195 | 13,779,106 | (2,130,070) | 11,649,036 |
| VIP Freedom 2020 | 642,356,419 | 91,414,715 | (11,707,973) | 79,706,742 |
| VIP Freedom 2025 | 118,033,511 | 11,556,464 | (3,485,623) | 8,070,841 |
| VIP Freedom 2030 | 247,198,304 | 28,405,979 | (8,653,858) | 19,752,121 |
| VIP Freedom 2035 | 30,085,248 | 751,098 | (2,080,001) | (1,328,903) |
| VIP Freedom 2040 | 52,269,196 | 2,164,590 | (3,249,879) | (1,085,289) |
| VIP Freedom 2045 | 15,262,299 | 422,378 | (1,094,266) | (671,888) |
| VIP Freedom 2050 | 15,287,574 | 467,815 | (1,089,037) | (621,222) |
VIP Freedom 2040 elected to defer to its next fiscal year $709 of capital losses recognized during the period November 1, 2015 to December 31, 2015.
3. Purchases and Redemptions of Underlying Fund Shares.
Purchases and redemptions of the Underlying Fund shares, are noted in the table below.
| | Purchases ($) | Redemptions ($) |
| VIP Freedom Income | 7,231,321 | 6,367,379 |
| VIP Freedom 2005 | 901,175 | 1,116,321 |
| VIP Freedom 2010 | 33,087,569 | 31,348,135 |
| VIP Freedom 2015 | 14,368,497 | 20,106,659 |
| VIP Freedom 2020 | 74,126,727 | 78,329,601 |
| VIP Freedom 2025 | 26,690,885 | 13,705,695 |
| VIP Freedom 2030 | 35,782,637 | 24,411,448 |
| VIP Freedom 2035 | 7,973,849 | 2,168,493 |
| VIP Freedom 2040 | 10,652,475 | 4,324,672 |
| VIP Freedom 2045 | 3,793,804 | 1,117,207 |
| VIP Freedom 2050 | 4,082,397 | 1,924,368 |
4. Fees and Other Transactions with Affiliates.
Management Fee. FMR Co., Inc. (the investment adviser), an affiliate of FMR, provides the Funds with investment management related services. The Funds do not pay any fees for these services.
Other Transactions. The investment adviser has entered into an administration agreement with FMR under which FMR provides management and administrative services (other than investment advisory services) necessary for the operation of each Fund. Pursuant to this agreement, FMR pays all expenses of each Fund, excluding distribution and service fees, compensation of the independent Trustees and certain other expenses such as interest expense. FMR also contracts with other Fidelity companies to perform the services necessary for the operation of each Fund. The Funds do not pay any fees for these services.
Distribution and Service Plan Fees. In accordance with Rule 12b-1 of the 1940 Act, the Funds have adopted separate 12b-1 Plans for each Service Class of shares. Each Service Class pays Fidelity Distributors Corporation (FDC), an affiliate of the investment adviser, a service fee. For the period, the service fee is based on an annual rate of .10% of Service Class' average net assets and .25% of Service Class 2's average net assets.
For the period, total fees, all of which were reallowed to insurance companies for the distribution of shares and providing shareholder support services were as follows:
| | Service
Class | Service
Class 2 | Total |
| VIP Freedom Income | $4,681 | $17,116 | $21,797 |
| VIP Freedom 2005 | 169 | 76 | 245 |
| VIP Freedom 2010 | 11,592 | 294,081 | 305,673 |
| VIP Freedom 2015 | 7,030 | 68,427 | 75,457 |
| VIP Freedom 2020 | 46,907 | 664,419 | 711,326 |
| VIP Freedom 2025 | 19,284 | 66,371 | 85,655 |
| VIP Freedom 2030 | 30,360 | 160,391 | 190,751 |
| VIP Freedom 2035 | 1,084 | 26,557 | 27,641 |
| VIP Freedom 2040 | 9,872 | 15,189 | 25,061 |
| VIP Freedom 2045 | 139 | 15,220 | 15,359 |
| VIP Freedom 2050 | 1,575 | 9,553 | 11,128 |
5. Expense Reductions.
FMR voluntarily agreed to reimburse funds to the extent annual operating expenses exceeded certain levels of average net assets as noted in the table below. Some expenses, for example interest expense, are excluded from this reimbursement.
The following classes of each applicable Fund were in reimbursement during the period:
| | Expense
Limitations | Reimbursement |
| VIP Freedom Income | | |
| Initial Class | -% | $34 |
| Service Class | .10% | 21 |
| Service Class 2 | .25% | 31 |
| VIP Freedom 2005 | | |
| Initial Class | -% | $15 |
| Service Class | .10% | 1 |
| Service Class 2 | .25% | – |
| VIP Freedom 2010 | | |
| Initial Class | -% | $68 |
| Service Class | .10% | 53 |
| Service Class 2 | .25% | 533 |
| VIP Freedom 2015 | | |
| Initial Class | -% | $77 |
| Service Class | .10% | 32 |
| Service Class 2 | .25% | 126 |
| VIP Freedom 2020 | | |
| Initial Class | -% | $191 |
| Service Class | .10% | 213 |
| Service Class 2 | .25% | 1,208 |
| VIP Freedom 2025 | | |
| Initial Class | -% | $56 |
| Service Class | .10% | 86 |
| Service Class 2 | .25% | 118 |
| VIP Freedom 2030 | | |
| Initial Class | -% | $154 |
| Service Class | .10% | 138 |
| Service Class 2 | .25% | 290 |
| VIP Freedom 2035 | | |
| Initial Class | -% | $4 |
| Service Class | .10% | 5 |
| Service Class 2 | .25% | 46 |
| VIP Freedom 2040 | | |
| Initial Class | -% | $35 |
| Service Class | .10% | 44 |
| Service Class 2 | .25% | 27 |
| VIP Freedom 2045 | | |
| Initial Class | -% | $1 |
| Service Class | .10% | 1 |
| Service Class 2 | .25% | 27 |
| VIP Freedom 2050 | | |
| Initial Class | -% | $5 |
| Service Class | .10% | 7 |
| Service Class 2 | .25% | 17 |
6. Distributions to Shareholders.
Distributions to shareholders of each class were as follows:
| | Six months ended
June 30, 2016 | Year ended December 31, 2015 |
| VIP Freedom Income | | |
| From net investment income | | |
| Initial Class | $– | $262,328 |
| Service Class | – | 170,784 |
| Service Class 2 | – | 204,325 |
| Total | $– | $637,437 |
| From net realized gain | | |
| Initial Class | $143,680 | $19,906 |
| Service Class | 91,409 | 13,128 |
| Service Class 2 | 138,611 | 17,081 |
| Total | $373,700 | $50,115 |
| VIP Freedom 2005 | | |
| From net investment income | | |
| Initial Class | $– | $125,531 |
| Service Class | – | 8,573 |
| Service Class 2 | – | 1,523 |
| Total | $– | $135,627 |
| From net realized gain | | |
| Initial Class | $85,330 | $14,560 |
| Service Class | 2,801 | 1,035 |
| Service Class 2 | 711 | 200 |
| Total | $88,842 | $15,795 |
| VIP Freedom 2010 | | |
| From net investment income | | |
| Initial Class | $– | $577,376 |
| Service Class | – | 414,530 |
| Service Class 2 | – | 3,864,255 |
| Total | $– | $4,856,161 |
| From net realized gain | | |
| Initial Class | $682,844 | $93,377 |
| Service Class | 523,443 | 69,574 |
| Service Class 2 | 5,305,832 | 691,241 |
| Total | $6,512,119 | $854,192 |
| VIP Freedom 2015 | | |
| From net investment income | | |
| Initial Class | $– | $667,184 |
| Service Class | – | 291,636 |
| Service Class 2 | – | 949,214 |
| Total | $– | $1,908,034 |
| From net realized gain | | |
| Initial Class | $917,135 | $189,896 |
| Service Class | 414,981 | 83,523 |
| Service Class 2 | 1,483,501 | 306,856 |
| Total | $2,815,617 | $580,275 |
| VIP Freedom 2020 | | |
| From net investment income | | |
| Initial Class | $– | $1,662,333 |
| Service Class | – | 1,701,924 |
| Service Class 2 | – | 9,067,466 |
| Total | $– | $12,431,723 |
| From net realized gain | | |
| Initial Class | $2,581,891 | $393,448 |
| Service Class | 2,828,552 | 404,517 |
| Service Class 2 | 16,582,255 | 2,454,679 |
| Total | $21,992,698 | $3,252,644 |
| VIP Freedom 2025 | | |
| From net investment income | | |
| Initial Class | $– | $473,802 |
| Service Class | – | 661,964 |
| Service Class 2 | – | 861,551 |
| Total | $– | $1,997,317 |
| From net realized gain | | |
| Initial Class | $777,510 | $138,753 |
| Service Class | 1,110,543 | 194,650 |
| Service Class 2 | 1,632,631 | 282,758 |
| Total | $3,520,684 | $616,161 |
| VIP Freedom 2030 | | |
| From net investment income | | |
| Initial Class | $– | $1,233,440 |
| Service Class | – | 1,005,250 |
| Service Class 2 | – | 2,023,552 |
| Total | $– | $4,262,242 |
| From net realized gain | | |
| Initial Class | $2,616,609 | $373,156 |
| Service Class | 2,299,580 | 313,207 |
| Service Class 2 | 5,082,682 | 745,971 |
| Total | $9,998,871 | $1,432,334 |
| VIP Freedom 2035 | | |
| From net investment income | | |
| Initial Class | $76 | $25,177 |
| Service Class | 114 | 30,980 |
| Service Class 2 | 1,106 | 283,735 |
| Total | $1,296 | $339,892 |
| From net realized gain | | |
| Initial Class | $43,729 | $7,250 |
| Service Class | 65,238 | 10,046 |
| Service Class 2 | 633,544 | 97,616 |
| Total | $742,511 | $114,912 |
| VIP Freedom 2040 | | |
| From net investment income | | |
| Initial Class | $– | $257,127 |
| Service Class | – | 297,556 |
| Service Class 2 | – | 179,437 |
| Total | $– | $734,120 |
| From net realized gain | | |
| Initial Class | $554,072 | $95,975 |
| Service Class | 690,161 | 115,149 |
| Service Class 2 | 448,850 | 75,969 |
| Total | $1,693,083 | $287,093 |
| VIP Freedom 2045 | | |
| From net investment income | | |
| Initial Class | $– | $9,613 |
| Service Class | – | 5,729 |
| Service Class 2 | – | 174,881 |
| Total | $– | $190,223 |
| From net realized gain | | |
| Initial Class | $16,451 | $2,892 |
| Service Class | 9,817 | 1,923 |
| Service Class 2 | 373,764 | 60,374 |
| Total | $400,032 | $65,189 |
| VIP Freedom 2050 | | |
| From net investment income | | |
| Initial Class | $3,746 | $38,897 |
| Service Class | 4,689 | 49,301 |
| Service Class 2 | 12,174 | 112,705 |
| Total | $20,609 | $200,903 |
| From net realized gain | | |
| Initial Class | $86,004 | $14,034 |
| Service Class | 107,671 | 18,785 |
| Service Class 2 | 279,525 | 47,543 |
| Total | $473,200 | $80,362 |
7. Share Transactions.
Transactions for each class of shares were as follows:
| | Shares | Shares | Dollars | Dollars |
| | Six months ended June 30, 2016 | Year ended December 31, 2015 | Six months ended
June 30, 2016 | Year ended December 31, 2015 |
| VIP Freedom Income | | | | |
| Initial Class | | | | |
| Shares sold | 127,618 | 339,365 | $1,362,232 | $3,775,187 |
| Reinvestment of distributions | 13,896 | 26,086 | 143,680 | 282,234 |
| Shares redeemed | (97,552) | (592,382) | (1,048,198) | (6,571,758) |
| Net increase (decrease) | 43,962 | (226,931) | $457,714 | $(2,514,337) |
| Service Class | | | | |
| Shares sold | 96,357 | 534,312 | $1,035,645 | $5,937,119 |
| Reinvestment of distributions | 8,840 | 17,002 | 91,409 | 183,912 |
| Shares redeemed | (135,470) | (201,312) | (1,431,186) | (2,233,670) |
| Net increase (decrease) | (30,273) | 350,002 | $(304,132) | $3,887,361 |
| Service Class 2 | | | | |
| Shares sold | 261,922 | 757,309 | $2,804,113 | $8,438,417 |
| Reinvestment of distributions | 13,457 | 20,544 | 138,611 | 221,406 |
| Shares redeemed | (211,965) | (338,685) | (2,268,746) | (3,743,618) |
| Net increase (decrease) | 63,414 | 439,168 | $673,978 | $4,916,205 |
| VIP Freedom 2005 | | | | |
| Initial Class | | | | |
| Shares sold | 15,315 | 60,424 | $166,515 | $709,728 |
| Reinvestment of distributions | 8,035 | 12,337 | 85,330 | 140,091 |
| Shares redeemed | (35,077) | (179,193) | (389,890) | (2,077,063) |
| Net increase (decrease) | (11,727) | (106,432) | $(138,045) | $(1,227,244) |
| Service Class | | | | |
| Shares sold | 16,768 | 19,795 | $187,794 | $231,657 |
| Reinvestment of distributions | 262 | 841 | 2,801 | 9,608 |
| Shares redeemed | (23,981) | (13,086) | (264,968) | (152,657) |
| Net increase (decrease) | (6,951) | 7,550 | $(74,373) | $88,608 |
| Service Class 2 | | | | |
| Shares sold | 1,457 | 1,929 | $16,248 | $22,541 |
| Reinvestment of distributions | 67 | 152 | 711 | 1,723 |
| Shares redeemed | (4,247) | (707) | (46,337) | (8,137) |
| Net increase (decrease) | (2,723) | 1,374 | $(29,378) | $16,127 |
| VIP Freedom 2010 | | | | |
| Initial Class | | | | |
| Shares sold | 189,843 | 344,077 | $2,248,404 | $4,317,350 |
| Reinvestment of distributions | 61,077 | 54,791 | 682,844 | 670,753 |
| Shares redeemed | (299,275) | (1,328,939) | (3,551,050) | (16,779,464) |
| Net increase (decrease) | (48,355) | (930,071) | $(619,802) | $(11,791,361) |
| Service Class | | | | |
| Shares sold | 191,529 | 252,289 | $2,262,548 | $3,174,992 |
| Reinvestment of distributions | 46,862 | 39,582 | 523,443 | 484,104 |
| Shares redeemed | (259,123) | (589,582) | (3,081,800) | (7,419,736) |
| Net increase (decrease) | (20,732) | (297,711) | $(295,809) | $(3,760,640) |
| Service Class 2 | | | | |
| Shares sold | 692,444 | 2,422,231 | $8,167,887 | $30,376,391 |
| Reinvestment of distributions | 477,573 | 374,338 | 5,305,832 | 4,555,496 |
| Shares redeemed | (832,661) | (1,221,007) | (9,835,766) | (15,302,347) |
| Net increase (decrease) | 337,356 | 1,575,562 | $3,637,953 | $19,629,540 |
| VIP Freedom 2015 | | | | |
| Initial Class | | | | |
| Shares sold | 162,071 | 420,581 | $1,928,341 | $5,358,376 |
| Reinvestment of distributions | 82,699 | 69,232 | 917,135 | 857,080 |
| Shares redeemed | (331,600) | (739,545) | (3,921,192) | (9,437,771) |
| Net increase (decrease) | (86,830) | (249,732) | $(1,075,716) | $(3,222,315) |
| Service Class | | | | |
| Shares sold | 206,609 | 498,796 | $2,472,014 | $6,305,741 |
| Reinvestment of distributions | 37,487 | 30,361 | 414,981 | 375,159 |
| Shares redeemed | (398,368) | (450,970) | (4,629,493) | (5,724,379) |
| Net increase (decrease) | (154,272) | 78,187 | $(1,742,498) | $956,521 |
| Service Class 2 | | | | |
| Shares sold | 329,725 | 813,492 | $3,896,820 | $10,278,936 |
| Reinvestment of distributions | 134,375 | 101,931 | 1,483,501 | 1,256,070 |
| Shares redeemed | (670,551) | (1,240,391) | (7,919,137) | (15,651,237) |
| Net increase (decrease) | (206,451) | (324,968) | $(2,538,816) | $(4,116,231) |
| VIP Freedom 2020 | | | | |
| Initial Class | | | | |
| Shares sold | 585,683 | 1,368,062 | $7,013,703 | $17,708,590 |
| Reinvestment of distributions | 231,976 | 163,581 | 2,581,891 | 2,055,781 |
| Shares redeemed | (863,187) | (2,449,771) | (10,301,420) | (31,880,324) |
| Net increase (decrease) | (45,528) | (918,128) | $(705,826) | $(12,115,953) |
| Service Class | | | | |
| Shares sold | 1,020,105 | 2,570,538 | $12,166,832 | $33,320,721 |
| Reinvestment of distributions | 254,595 | 168,073 | 2,828,552 | 2,106,441 |
| Shares redeemed | (881,756) | (1,181,862) | (10,536,299) | (15,229,965) |
| Net increase (decrease) | 392,944 | 1,556,749 | $4,459,085 | $20,197,197 |
| Service Class 2 | | | | |
| Shares sold | 842,952 | 2,413,177 | $10,055,020 | $31,270,547 |
| Reinvestment of distributions | 1,497,945 | 921,983 | 16,582,255 | 11,522,145 |
| Shares redeemed | (2,569,694) | (4,868,275) | (30,608,894) | (62,533,680) |
| Net increase (decrease) | (228,797) | (1,533,115) | $(3,971,619) | $(19,740,988) |
| VIP Freedom 2025 | | | | |
| Initial Class | | | | |
| Shares sold | 244,441 | 375,179 | $2,989,868 | $4,976,692 |
| Reinvestment of distributions | 68,443 | 47,214 | 777,510 | 612,555 |
| Shares redeemed | (189,331) | (445,275) | (2,303,296) | (5,967,956) |
| Net increase (decrease) | 123,553 | (22,882) | $1,464,082 | $(378,709) |
| Service Class | | | | |
| Shares sold | 723,193 | 933,734 | $8,822,221 | $12,363,927 |
| Reinvestment of distributions | 98,018 | 66,146 | 1,110,543 | 856,614 |
| Shares redeemed | (243,054) | (437,815) | (2,986,911) | (5,813,665) |
| Net increase (decrease) | 578,157 | 562,065 | $6,945,853 | $7,406,876 |
| Service Class 2 | | | | |
| Shares sold | 679,119 | 1,318,158 | $8,308,374 | $17,477,251 |
| Reinvestment of distributions | 144,737 | 88,740 | 1,632,631 | 1,144,309 |
| Shares redeemed | (413,251) | (1,071,673) | (5,027,806) | (14,125,138) |
| Net increase (decrease) | 410,605 | 335,225 | $4,913,199 | $4,496,422 |
| VIP Freedom 2030 | | | | |
| Initial Class | | | | |
| Shares sold | 608,791 | 952,711 | $7,276,346 | $12,631,715 |
| Reinvestment of distributions | 239,397 | 125,011 | 2,616,609 | 1,606,596 |
| Shares redeemed | (387,228) | (1,214,789) | (4,645,543) | (16,182,194) |
| Net increase (decrease) | 460,960 | (137,067) | $5,247,412 | $(1,943,883) |
| Service Class | | | | |
| Shares sold | 738,263 | 1,316,268 | $8,831,000 | $17,520,725 |
| Reinvestment of distributions | 210,777 | 102,766 | 2,299,580 | 1,318,457 |
| Shares redeemed | (306,463) | (867,757) | (3,666,325) | (11,431,396) |
| Net increase (decrease) | 642,577 | 551,277 | $7,464,255 | $7,407,786 |
| Service Class 2 | | | | |
| Shares sold | 847,151 | 2,996,955 | $10,052,502 | $39,890,524 |
| Reinvestment of distributions | 467,158 | 216,259 | 5,082,682 | 2,769,523 |
| Shares redeemed | (1,268,398) | (4,280,826) | (15,167,218) | (56,176,082) |
| Net increase (decrease) | 45,911 | (1,067,612) | $(32,034) | $(13,516,035) |
| VIP Freedom 2035 | | | | |
| Initial Class | | | | |
| Shares sold | 53,847 | 69,244 | $933,523 | $1,355,411 |
| Reinvestment of distributions | 2,673 | 1,679 | 43,805 | 32,427 |
| Shares redeemed | (12,382) | (17,459) | (218,416) | (349,771) |
| Net increase (decrease) | 44,138 | 53,464 | $758,912 | $1,038,067 |
| Service Class | | | | |
| Shares sold | 27,402 | 43,090 | $489,773 | $845,029 |
| Reinvestment of distributions | 3,992 | 2,124 | 65,352 | 41,026 |
| Shares redeemed | (8,151) | (23,646) | (148,108) | (471,066) |
| Net increase (decrease) | 23,243 | 21,568 | $407,017 | $414,989 |
| Service Class 2 | | | | |
| Shares sold | 332,174 | 575,880 | $5,936,640 | $11,361,119 |
| Reinvestment of distributions | 38,936 | 19,826 | 634,650 | 381,351 |
| Shares redeemed | (116,002) | (211,248) | (2,054,866) | (4,161,335) |
| Net increase (decrease) | 255,108 | 384,458 | $4,516,424 | $7,581,135 |
| VIP Freedom 2040 | | | | |
| Initial Class | | | | |
| Shares sold | 160,045 | 210,577 | $2,744,133 | $4,032,196 |
| Reinvestment of distributions | 35,655 | 19,134 | 554,072 | 353,102 |
| Shares redeemed | (52,776) | (200,035) | (898,001) | (3,816,485) |
| Net increase (decrease) | 142,924 | 29,676 | $2,400,204 | $568,813 |
| Service Class | | | | |
| Shares sold | 269,143 | 535,036 | $4,583,591 | $10,162,149 |
| Reinvestment of distributions | 44,469 | 22,392 | 690,161 | 412,705 |
| Shares redeemed | (106,184) | (236,839) | (1,836,849) | (4,513,032) |
| Net increase (decrease) | 207,428 | 320,589 | $3,436,903 | $6,061,822 |
| Service Class 2 | | | | |
| Shares sold | 115,535 | 365,794 | $1,974,267 | $6,983,427 |
| Reinvestment of distributions | 29,014 | 13,903 | 448,850 | 255,406 |
| Shares redeemed | (115,467) | (140,107) | (1,953,521) | (2,625,215) |
| Net increase (decrease) | 29,082 | 239,590 | $469,596 | $4,613,618 |
| VIP Freedom 2045 | | | | |
| Initial Class | | | | |
| Shares sold | 7,610 | 17,269 | $128,708 | $324,086 |
| Reinvestment of distributions | 1,063 | 684 | 16,451 | 12,505 |
| Shares redeemed | (6,515) | (6,373) | (109,873) | (120,815) |
| Net increase (decrease) | 2,158 | 11,580 | $35,286 | $215,776 |
| Service Class | | | | |
| Shares sold | 1,639 | 9,629 | $28,166 | $179,791 |
| Reinvestment of distributions | 635 | 419 | 9,817 | 7,652 |
| Shares redeemed | (7,298) | (10,722) | (122,645) | (200,928) |
| Net increase (decrease) | (5,024) | (674) | $(84,662) | $(13,485) |
| Service Class 2 | | | | |
| Shares sold | 198,342 | 384,866 | $3,369,652 | $7,194,399 |
| Reinvestment of distributions | 24,255 | 12,916 | 373,764 | 235,255 |
| Shares redeemed | (63,771) | (162,324) | (1,073,818) | (3,021,191) |
| Net increase (decrease) | 158,826 | 235,458 | $2,669,598 | $4,408,463 |
| VIP Freedom 2050 | | | | |
| Initial Class | | | | |
| Shares sold | 44,023 | 58,084 | $682,381 | $994,708 |
| Reinvestment of distributions | 6,415 | 3,177 | 89,750 | 52,931 |
| Shares redeemed | (25,930) | (23,146) | (402,216) | (396,298) |
| Net increase (decrease) | 24,508 | 38,115 | $369,915 | $651,341 |
| Service Class | | | | |
| Shares sold | 75,280 | 66,182 | $1,165,357 | $1,125,460 |
| Reinvestment of distributions | 8,043 | 4,091 | 112,360 | 68,086 |
| Shares redeemed | (34,760) | (58,008) | (534,684) | (980,918) |
| Net increase (decrease) | 48,563 | 12,265 | $743,033 | $212,628 |
| Service Class 2 | | | | |
| Shares sold | 113,791 | 283,095 | $1,749,986 | $4,830,393 |
| Reinvestment of distributions | 20,940 | 9,649 | 291,699 | 160,248 |
| Shares redeemed | (64,088) | (208,192) | (971,362) | (3,496,708) |
| Net increase (decrease) | 70,643 | 84,552 | $1,070,323 | $1,493,933 |
8. Other.
The Funds' organizational documents provide former and current trustees and officers with a limited indemnification against liabilities arising in connection with the performance of their duties to the Funds. In the normal course of business, the Funds may also enter into contracts that provide general indemnifications. The Funds' maximum exposure under these arrangements is unknown as this would be dependent on future claims that may be made against the Funds. The risk of material loss from such claims is considered remote.
The Funds do not invest in the Underlying Funds for the purpose of exercising management or control; however, investments by the Funds within their principal investment strategies may represent a significant portion of the Underlying Fund's net assets. At the end of the period, the following Funds were the owners of record of 10% or more of the total outstanding shares of the Underlying Funds.
| Fund | VIP Freedom 2020 Portfolio Fund | VIP Freedom 2030 Portfolio Fund | |
| VIP Emerging Markets Portfolio | 24% | 11% | |
| VIP Value Portfolio | 12% | –% | |
The Funds, in aggregate, were the owners of record of more than 20% of the total outstanding shares of the following Underlying Funds.
| Fund | % of shares held |
| VIP Emerging Markets Portfolio | 57% |
| VIP Value Portfolio | 30% |
In addition, at the end of the period the investment adviser or its affiliates were owners of record of more than 10%, respectively, of the outstanding shares of the following Funds:
| | Affiliated % | Number of
Unaffiliated Shareholders | Unaffiliated Shareholders % |
| VIP Freedom Income | 32% | 3 | 39% |
| VIP Freedom 2005 | 92% | – | –% |
| VIP Freedom 2010 | –% | 1 | 84% |
| VIP Freedom 2015 | 27% | 3 | 44% |
| VIP Freedom 2020 | –% | 1 | 73% |
| VIP Freedom 2025 | 12% | 3 | 60% |
| VIP Freedom 2030 | –% | 2 | 52% |
| VIP Freedom 2035 | –% | 4 | 87% |
| VIP Freedom 2040 | –% | 3 | 76% |
| VIP Freedom 2045 | –% | 3 | 90% |
| VIP Freedom 2050 | –% | 4 | 93% |
Shareholder Expense Example
As a shareholder of a Fund, you incur two types of costs: (1) transaction costs and (2) ongoing costs, including distribution and/or service (12b-1) fees and other Fund expenses. This Example is intended to help you understand your ongoing costs (in dollars) of investing in the Funds and to compare these costs with the ongoing costs of investing in other mutual funds.
The Example is based on an investment of $1,000 invested at the beginning of the period and held for the entire period (January 1, 2016 to June 30, 2016).
Actual Expenses
The first line of the accompanying table for each class of each fund provides information about actual account values and actual expenses. You may use the information in this line, together with the amount you invested, to estimate the expenses that you paid over the period. Simply divide your account value by $1,000.00 (for example, an $8,600 account value divided by $1,000.00 = 8.6), then multiply the result by the number in the first line for a class of the fund under the heading entitled "Expenses Paid During Period" to estimate the expenses you paid on your account during this period. The estimate of expenses does not include any fees or other expenses of any variable annuity or variable life insurance product. If they were, the estimate of expenses you paid during the period would be higher, and your ending account value would be lower. In addition, each Fund, as a shareholder in underlying Fidelity Funds, will indirectly bear its pro-rata share of the fees and expenses incurred by the underlying Fidelity Funds. These fees and expenses are not included in each Fund's annualized expense ratio used to calculate the expense estimates in the table below.
Hypothetical Example for Comparison Purposes
The second line of the accompanying table for each class of each fund provides information about hypothetical account values and hypothetical expenses based on a Class' actual expense ratio and an assumed rate of return of 5% per year before expenses, which is not the Class' actual return. The hypothetical account values and expenses may not be used to estimate the actual ending account balance or expenses you paid for the period. You may use this information to compare the ongoing costs of investing in the Fund and other funds. To do so, compare this 5% hypothetical example with the 5% hypothetical examples that appear in the shareholder reports of the other funds. The estimate of expenses does not include any fees or other expenses of any variable annuity or variable life insurance product. If they were, the estimate of expenses you paid during the period would be higher, and your ending account value would be lower. In addition, each Fund, as a shareholder in underlying Fidelity Funds, will indirectly bear its pro-rata share of the fees and expenses incurred by the underlying Fidelity Funds. These fees and expenses are not included in each Fund's annualized expense ratio used to calculate the expense estimates in the table below.
Please note that the expenses shown in the table are meant to highlight your ongoing costs only and do not reflect any transaction costs. Therefore, the second line of the table is useful in comparing ongoing costs only, and will not help you determine the relative total costs of owning different funds.
| | Annualized Expense RatioA | Beginning
Account Value
January 1, 2016 | Ending
Account Value
June 30, 2016 | Expenses Paid
During Period-B
January 1, 2016
to June 30, 2016 |
| VIP Freedom Income | | | | |
| Initial Class | - % | | | |
| Actual | | $1,000.00 | $1,030.00 | $- |
| Hypothetical-C | | $1,000.00 | $1,024.86 | $- |
| Service Class | .10% | | | |
| Actual | | $1,000.00 | $1,030.00 | $.50 |
| Hypothetical-C | | $1,000.00 | $1,024.37 | $.50 |
| Service Class 2 | .25% | | | |
| Actual | | $1,000.00 | $1,029.20 | $1.26 |
| Hypothetical-C | | $1,000.00 | $1,023.62 | $1.26 |
| VIP Freedom 2005 | | | | |
| Initial Class | - % | | | |
| Actual | | $1,000.00 | $1,027.00 | $- |
| Hypothetical-C | | $1,000.00 | $1,024.86 | $- |
| Service Class | .10% | | | |
| Actual | | $1,000.00 | $1,026.90 | $.50 |
| Hypothetical-C | | $1,000.00 | $1,024.37 | $.50 |
| Service Class 2 | .25% | | | |
| Actual | | $1,000.00 | $1,026.20 | $1.26 |
| Hypothetical-C | | $1,000.00 | $1,023.62 | $1.26 |
| VIP Freedom 2010 | | | | |
| Initial Class | - % | | | |
| Actual | | $1,000.00 | $1,025.20 | $- |
| Hypothetical-C | | $1,000.00 | $1,024.86 | $- |
| Service Class | .10% | | | |
| Actual | | $1,000.00 | $1,024.40 | $.50 |
| Hypothetical-C | | $1,000.00 | $1,024.37 | $.50 |
| Service Class 2 | .25% | | | |
| Actual | | $1,000.00 | $1,023.60 | $1.26 |
| Hypothetical-C | | $1,000.00 | $1,023.62 | $1.26 |
| VIP Freedom 2015 | | | | |
| Initial Class | - % | | | |
| Actual | | $1,000.00 | $1,022.40 | $- |
| Hypothetical-C | | $1,000.00 | $1,024.86 | $- |
| Service Class | .10% | | | |
| Actual | | $1,000.00 | $1,022.40 | $.50 |
| Hypothetical-C | | $1,000.00 | $1,024.37 | $.50 |
| Service Class 2 | .25% | | | |
| Actual | | $1,000.00 | $1,020.80 | $1.26 |
| Hypothetical-C | | $1,000.00 | $1,023.62 | $1.26 |
| VIP Freedom 2020 | | | | |
| Initial Class | - % | | | |
| Actual | | $1,000.00 | $1,020.70 | $- |
| Hypothetical-C | | $1,000.00 | $1,024.86 | $- |
| Service Class | .10% | | | |
| Actual | | $1,000.00 | $1,019.90 | $.50 |
| Hypothetical-C | | $1,000.00 | $1,024.37 | $.50 |
| Service Class 2 | .25% | | | |
| Actual | | $1,000.00 | $1,018.30 | $1.25 |
| Hypothetical-C | | $1,000.00 | $1,023.62 | $1.26 |
| VIP Freedom 2025 | | | | |
| Initial Class | - % | | | |
| Actual | | $1,000.00 | $1,016.80 | $- |
| Hypothetical-C | | $1,000.00 | $1,024.86 | $- |
| Service Class | .10% | | | |
| Actual | | $1,000.00 | $1,016.80 | $.50 |
| Hypothetical-C | | $1,000.00 | $1,024.37 | $.50 |
| Service Class 2 | .25% | | | |
| Actual | | $1,000.00 | $1,015.30 | $1.25 |
| Hypothetical-C | | $1,000.00 | $1,023.62 | $1.26 |
| VIP Freedom 2030 | | | | |
| Initial Class | - % | | | |
| Actual | | $1,000.00 | $1,009.50 | $- |
| Hypothetical-C | | $1,000.00 | $1,024.86 | $- |
| Service Class | .10% | | | |
| Actual | | $1,000.00 | $1,008.70 | $.50 |
| Hypothetical-C | | $1,000.00 | $1,024.37 | $.50 |
| Service Class 2 | .25% | | | |
| Actual | | $1,000.00 | $1,008.70 | $1.25 |
| Hypothetical-C | | $1,000.00 | $1,023.62 | $1.26 |
| VIP Freedom 2035 | | | | |
| Initial Class | - % | | | |
| Actual | | $1,000.00 | $1,004.10 | $- |
| Hypothetical-C | | $1,000.00 | $1,024.86 | $- |
| Service Class | .10% | | | |
| Actual | | $1,000.00 | $1,003.00 | $.50 |
| Hypothetical-C | | $1,000.00 | $1,024.37 | $.50 |
| Service Class 2 | .25% | | | |
| Actual | | $1,000.00 | $1,002.50 | $1.24 |
| Hypothetical-C | | $1,000.00 | $1,023.62 | $1.26 |
| VIP Freedom 2040 | | | | |
| Initial Class | - % | | | |
| Actual | | $1,000.00 | $1,004.20 | $- |
| Hypothetical-C | | $1,000.00 | $1,024.86 | $- |
| Service Class | .10% | | | |
| Actual | | $1,000.00 | $1,003.60 | $.50 |
| Hypothetical-C | | $1,000.00 | $1,024.37 | $.50 |
| Service Class 2 | .25% | | | |
| Actual | | $1,000.00 | $1,002.50 | $1.24 |
| Hypothetical-C | | $1,000.00 | $1,023.62 | $1.26 |
| VIP Freedom 2045 | | | | |
| Initial Class | - % | | | |
| Actual | | $1,000.00 | $1,003.80 | $- |
| Hypothetical-C | | $1,000.00 | $1,024.86 | $- |
| Service Class | .10% | | | |
| Actual | | $1,000.00 | $1,003.20 | $.50 |
| Hypothetical-C | | $1,000.00 | $1,024.37 | $.50 |
| Service Class 2 | .25% | | | |
| Actual | | $1,000.00 | $1,002.70 | $1.24 |
| Hypothetical-C | | $1,000.00 | $1,023.62 | $1.26 |
| VIP Freedom 2050 | | | | |
| Initial Class | - % | | | |
| Actual | | $1,000.00 | $1,003.80 | $- |
| Hypothetical-C | | $1,000.00 | $1,024.86 | $- |
| Service Class | .10% | | | |
| Actual | | $1,000.00 | $1,003.80 | $.50 |
| Hypothetical-C | | $1,000.00 | $1,024.37 | $.50 |
| Service Class 2 | .25% | | | |
| Actual | | $1,000.00 | $1,003.20 | $1.25 |
| Hypothetical-C | | $1,000.00 | $1,023.62 | $1.26 |
| | | | | |
| | | | | |
| | | | | |
A Annualized expense ratio reflects expenses net of applicable fee waivers.
B Expenses are equal to each Class' annualized expense ratio, multiplied by the average account value over the period, multiplied by 182/ 366 (to reflect the one-half year period). The fees and expenses of the underlying Fidelity Funds in which each Fund invests are not included in each Class' annualized expense ratio.
C 5% return per year before expenses
VIPFF2K-SANN-0816
1.819548.112
Fidelity® Variable Insurance Products:
FundsManager - 20%, 50%, 60%, 70%, 85% Portfolio
Semi-Annual Report June 30, 2016 |
|
Contents
To view a fund's proxy voting guidelines and proxy voting record for the 12-month period ended June 30, visit http://www.fidelity.com/proxyvotingresults or visit the Securities and Exchange Commission's (SEC) web site at http://www.sec.gov.
You may also call 1-877-208-0098 to request a free copy of the proxy voting guidelines.
Fidelity® Variable Insurance Products are separate account options which are purchased through a variable insurance contract.
Standard & Poor's, S&P and S&P 500 are registered service marks of The McGraw-Hill Companies, Inc. and have been licensed for use by Fidelity Distributors Corporation.
Other third-party marks appearing herein are the property of their respective owners.
All other marks appearing herein are registered or unregistered trademarks or service marks of FMR LLC or an affiliated company. © 2016 FMR LLC. All rights reserved.
This report and the financial statements contained herein are submitted for the general information of the shareholders of the Funds. This report is not authorized for distribution to prospective investors in the Funds unless preceded or accompanied by an effective prospectus.
A fund files its complete schedule of portfolio holdings with the SEC for the first and third quarters of each fiscal year on Form N-Q. Forms N-Q are available on the SEC’s web site at http://www.sec.gov. A fund's Forms N-Q may be reviewed and copied at the SEC’s Public Reference Room in Washington, DC. Information regarding the operation of the SEC's Public Reference Room may be obtained by calling 1-800-SEC-0330.
For a complete list of a fund's portfolio holdings, view the most recent holdings listing, semiannual report, or annual report on Fidelity's web site at http://www.fidelity.com, http://www.institutional.fidelity.com, or http://www.401k.com, as applicable.
NOT FDIC INSURED •MAY LOSE VALUE •NO BANK GUARANTEE
Neither the Funds nor Fidelity Distributors Corporation is a bank.
VIP FundsManager® 20% Portfolio
Investment Summary (Unaudited)
The information in the following tables is based on the direct investments of the Fund.
Top Holdings as of June 30, 2016
| | % of fund's net assets | % of fund's net assets 6 months ago |
| Fidelity U.S. Bond Index Fund Institutional Premium Class | 43.5 | 42.9 |
| Fidelity Investments Money Market Treasury Portfolio Institutional Class 0.23% | 15.6 | 15.8 |
| Fidelity Investments Money Market Government Portfolio Institutional Class 0.30% | 13.1 | 11.8 |
| Fidelity Inflation-Protected Bond Index Fund Institutional Class | 2.1 | 1.5 |
| Fidelity Floating Rate High Income Fund | 2.0 | 0.5 |
| Fidelity Overseas Fund | 1.8 | 2.5 |
| Fidelity Technology Portfolio | 1.7 | 1.8 |
| Fidelity Consumer Staples Portfolio | 1.4 | 1.2 |
| Fidelity Long-Term Treasury Bond Index Fund Premium Class | 1.3 | 1.9 |
| Fidelity Medical Equipment and Systems Portfolio | 1.2 | 0.7 |
| | 83.7 | |
Asset Allocation (% of fund's net assets)
| As of June 30, 2016 |
| | Domestic Equity Funds | 15.4% |
| | International Equity Funds | 6.1% |
| | Fixed-Income Funds | 49.8% |
| | Money Market Funds | 28.7% |

| As of December 31, 2015 |
| | Domestic Equity Funds | 15.8% |
| | International Equity Funds | 8.8% |
| | Fixed-Income Funds | 47.8% |
| | Money Market Funds | 27.6% |
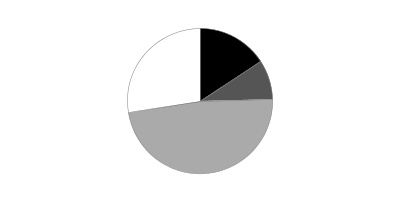
VIP FundsManager® 20% Portfolio
Investments June 30, 2016 (Unaudited)
Showing Percentage of Net Assets
| Equity Funds - 21.5% | | | |
| | | Shares | Value |
| Domestic Equity Funds - 15.4% | | | |
| Fidelity Banking Portfolio (a) | | 193,731 | $4,572,043 |
| Fidelity Blue Chip Growth Fund (a) | | 1,336 | 87,108 |
| Fidelity Chemicals Portfolio (a) | | 22,680 | 3,146,681 |
| Fidelity Construction and Housing Portfolio (a) | | 72,590 | 4,334,322 |
| Fidelity Consumer Discretionary Portfolio (a) | | 214,205 | 7,302,261 |
| Fidelity Consumer Staples Portfolio (a) | | 103,212 | 10,175,696 |
| Fidelity Defense and Aerospace Portfolio (a) | | 29,755 | 3,545,852 |
| Fidelity Dividend Growth Fund (a) | | 707 | 21,640 |
| Fidelity Electronics Portfolio (a) | | 51,262 | 3,880,568 |
| Fidelity Energy Portfolio (a) | | 158,618 | 6,474,802 |
| Fidelity Equity Dividend Income Fund (a) | | 66,034 | 1,714,247 |
| Fidelity Extended Market Index Fund Premium Class (a) | | 328 | 16,706 |
| Fidelity Financial Services Portfolio (a) | | 68,382 | 5,590,213 |
| Fidelity Global Commodity Stock Fund (a) | | 118,129 | 1,208,456 |
| Fidelity Gold Portfolio (a) | | 7,045 | 179,706 |
| Fidelity Health Care Portfolio (a) | | 8,755 | 1,686,002 |
| Fidelity Health Care Services Portfolio (a) | | 22,617 | 1,947,733 |
| Fidelity Industrial Equipment Portfolio (a) | | 60,368 | 2,308,484 |
| Fidelity Industrials Portfolio (a) | | 157,112 | 4,774,628 |
| Fidelity Insurance Portfolio (a) | | 82,040 | 5,593,517 |
| Fidelity IT Services Portfolio (a) | | 54,189 | 2,121,498 |
| Fidelity Low-Priced Stock Fund (a) | | 1,735 | 83,146 |
| Fidelity Materials Portfolio (a) | | 2,531 | 177,124 |
| Fidelity Medical Equipment and Systems Portfolio (a) | | 214,481 | 8,579,244 |
| Fidelity Natural Gas Portfolio (a) | | 155 | 3,861 |
| Fidelity OTC Portfolio (a) | | 1,575 | 122,676 |
| Fidelity Pharmaceuticals Portfolio (a) | | 25,759 | 489,172 |
| Fidelity Real Estate Investment Portfolio (a) | | 104,140 | 4,734,208 |
| Fidelity Retailing Portfolio (a) | | 24,584 | 2,586,743 |
| Fidelity Series Commodity Strategy Fund (a)(b) | | 300,912 | 1,661,034 |
| Fidelity Small Cap Stock Fund (a) | | 6,415 | 110,666 |
| Fidelity Software and IT Services Portfolio (a) | | 31,480 | 3,806,208 |
| Fidelity Technology Portfolio (a) | | 105,489 | 12,341,190 |
| Fidelity Telecom and Utilities Fund (a) | | 33,080 | 866,687 |
| Fidelity Telecommunications Portfolio (a) | | 77,976 | 5,504,360 |
| Fidelity Utilities Portfolio (a) | | 42,422 | 3,298,700 |
|
| TOTAL DOMESTIC EQUITY FUNDS | | | 115,047,182 |
|
| International Equity Funds - 6.1% | | | |
| Fidelity Diversified International Fund (a) | | 1,314 | 43,693 |
| Fidelity Emerging Asia Fund (a) | | 74,063 | 2,287,810 |
| Fidelity Emerging Markets Fund (a) | | 85,040 | 1,967,819 |
| Fidelity Europe Fund (a) | | 18,690 | 632,266 |
| Fidelity International Capital Appreciation Fund (a) | | 184,000 | 3,105,912 |
| Fidelity International Discovery Fund (a) | | 17,618 | 650,994 |
| Fidelity International Index Fund Premium Class (a) | | 178,209 | 6,183,846 |
| Fidelity International Real Estate Fund (a) | | 1,181 | 11,979 |
| Fidelity International Small Cap Fund (a) | | 179,411 | 4,079,806 |
| Fidelity International Small Cap Opportunities Fund (a) | | 403,044 | 5,840,107 |
| Fidelity Japan Smaller Companies Fund (a) | | 138,540 | 2,047,621 |
| Fidelity Nordic Fund (a) | | 65,372 | 3,018,879 |
| Fidelity Overseas Fund (a) | | 346,198 | 13,681,755 |
| Fidelity Pacific Basin Fund (a) | | 61,754 | 1,712,431 |
|
| TOTAL INTERNATIONAL EQUITY FUNDS | | | 45,264,918 |
|
| TOTAL EQUITY FUNDS | | | |
| (Cost $143,601,005) | | | 160,312,100 |
|
| Fixed-Income Funds - 49.8% | | | |
| Fidelity Floating Rate High Income Fund (a) | | 1,590,442 | 14,870,634 |
| Fidelity Focused High Income Fund (a) | | 39,128 | 322,412 |
| Fidelity High Income Fund (a) | | 42,639 | 354,756 |
| Fidelity Inflation-Protected Bond Index Fund Institutional Class (a) | | 1,586,645 | 15,818,849 |
| Fidelity Long-Term Treasury Bond Index Fund Premium Class (a) | | 678,793 | 9,883,225 |
| Fidelity New Markets Income Fund (a) | | 190,403 | 3,008,372 |
| Fidelity Real Estate Income Fund (a) | | 244,164 | 2,922,642 |
| Fidelity U.S. Bond Index Fund Institutional Premium Class (a) | | 27,125,166 | 324,416,992 |
| TOTAL FIXED-INCOME FUNDS | | | |
| (Cost $350,628,146) | | | 371,597,882 |
|
| Money Market Funds - 28.7% | | | |
| Fidelity Investments Money Market Government Portfolio Institutional Class 0.30% (a)(c) | | 98,060,120 | 98,060,120 |
| Fidelity Investments Money Market Treasury Portfolio Institutional Class 0.23% (a)(c) | | 116,411,338 | 116,411,338 |
| TOTAL MONEY MARKET FUNDS | | | |
| (Cost $214,471,458) | | | 214,471,458 |
| TOTAL INVESTMENT PORTFOLIO - 100.0% | | | |
| (Cost $708,700,609) | | | 746,381,440 |
| NET OTHER ASSETS (LIABILITIES) - 0.0% | | | 262,327 |
| NET ASSETS - 100% | | | $746,643,767 |
Legend
(a) Affiliated Fund
(b) Non-income producing
(c) The rate quoted is the annualized seven-day yield of the fund at period end.
Affiliated Underlying Funds
Information regarding the Fund's fiscal year to date purchases and sales of the affiliated Underlying Funds and income earned by the Fund from investments in affiliated Underlying Funds is as follows:
| Affiliate | Value, beginning of period | Purchases | Sales Proceeds | Dividend Income | Value, end of period |
| Fidelity Air Transportation Portfolio | $274,921 | $-- | $276,333 | $-- | $-- |
| Fidelity Banking Portfolio | 5,195,707 | 301,349 | 505,657 | -- | 4,572,043 |
| Fidelity Blue Chip Growth Fund | 812,111 | -- | 638,439 | -- | 87,108 |
| Fidelity Blue Chip Value Fund | 2,032,236 | 419,475 | 2,470,656 | -- | -- |
| Fidelity Brokerage and Investment Management Portfolio | 180,085 | -- | 152,777 | -- | -- |
| Fidelity Chemicals Portfolio | 1,940,637 | 1,286,408 | 234,025 | -- | 3,146,681 |
| Fidelity China Region Fund | 1,656,220 | -- | 1,452,854 | -- | -- |
| Fidelity Computers Portfolio | 1,814,151 | 1,674 | 1,766,609 | 1,633 | -- |
| Fidelity Construction and Housing Portfolio | 4,054,379 | 162,592 | -- | -- | 4,334,322 |
| Fidelity Consumer Discretionary Portfolio | 8,257,010 | 450,133 | 1,320,946 | 7,594 | 7,302,261 |
| Fidelity Consumer Staples Portfolio | 8,896,189 | 2,565,100 | 2,109,042 | 15,793 | 10,175,696 |
| Fidelity Contrafund | 4,905,226 | 1,641,708 | 6,173,710 | 251 | -- |
| Fidelity Defense and Aerospace Portfolio | 2,117,669 | 1,268,974 | -- | 7,387 | 3,545,852 |
| Fidelity Diversified International Fund | 11,563,792 | 44,551 | 10,681,640 | -- | 43,693 |
| Fidelity Dividend Growth Fund | 21,407 | -- | -- | -- | 21,640 |
| Fidelity Electronics Portfolio | 2,265,797 | 1,595,396 | -- | 1,616 | 3,880,568 |
| Fidelity Emerging Asia Fund | 4,173,569 | -- | 1,905,041 | -- | 2,287,810 |
| Fidelity Emerging Markets Fund | 1,074,715 | 778,783 | -- | -- | 1,967,819 |
| Fidelity Energy Portfolio | 4,793,372 | 1,601,740 | 624,801 | 5,084 | 6,474,802 |
| Fidelity Energy Service Portfolio | 835,917 | 183 | 878,475 | 183 | -- |
| Fidelity Equity Dividend Income Fund | -- | 2,011,784 | 522,547 | 10,226 | 1,714,247 |
| Fidelity Europe Fund | 4,462,814 | -- | 3,454,558 | -- | 632,266 |
| Fidelity Extended Market Index Fund Investor Class | 16,301 | -- | -- | 31 | -- |
| Fidelity Extended Market Index Fund Premium Class | -- | 149 | -- | -- | 16,706 |
| Fidelity Financial Services Portfolio | 8,028,171 | 83,990 | 2,096,515 | -- | 5,590,213 |
| Fidelity Floating Rate High Income Fund | 3,920,869 | 10,871,648 | -- | 125,287 | 14,870,634 |
| Fidelity Focused High Income Fund | 306,157 | 7,324 | -- | 7,324 | 322,412 |
| Fidelity Global Commodity Stock Fund | 34,871 | 1,139,859 | -- | -- | 1,208,456 |
| Fidelity Gold Portfolio | 94,034 | 1,630 | -- | -- | 179,706 |
| Fidelity Health Care Portfolio | 5,467,799 | 526,684 | 3,654,865 | -- | 1,686,002 |
| Fidelity Health Care Services Portfolio | $1,885,014 | $29,854 | $6,415 | $-- | $1,947,733 |
| Fidelity High Income Fund | 329,415 | 9,716 | -- | 9,716 | 354,756 |
| Fidelity Industrial Equipment Portfolio | 682,849 | 1,495,562 | -- | -- | 2,308,484 |
| Fidelity Industrials Portfolio | 6,750,268 | 807,157 | 2,789,520 | -- | 4,774,628 |
| Fidelity Inflation-Protected Bond Index Fund Institutional Class | -- | 26,783 | 45,410 | 470 | 15,818,849 |
| Fidelity Inflation-Protected Bond Index Fund Investor Class | 11,115,443 | 4,388,941 | 488,794 | 46 | -- |
| Fidelity Insurance Portfolio | 4,871,679 | 663,166 | -- | 11,149 | 5,593,517 |
| Fidelity International Capital Appreciation Fund | 355,942 | 3,079,520 | 330,870 | -- | 3,105,912 |
| Fidelity International Discovery Fund | 2,593,993 | 349,088 | 2,112,506 | -- | 650,994 |
| Fidelity International Index Fund Investor Class | 7,015,151 | 34,216 | 3,823,709 | 6,766 | -- |
| Fidelity International Index Fund Premium Class | -- | 3,180,000 | -- | -- | 6,183,846 |
| Fidelity International Real Estate Fund | 11,838 | -- | -- | -- | 11,979 |
| Fidelity International Small Cap Fund | 2,011,705 | 1,858,331 | -- | -- | 4,079,806 |
| Fidelity International Small Cap Opportunities Fund | 3,908,429 | 2,456,435 | 500,000 | -- | 5,840,107 |
| Fidelity Investments Money Market Government Portfolio Institutional Class 0.30% | -- | 129,614,953 | 31,554,831 | 117,472 | 98,060,120 |
| Fidelity Investments Money Market Portfolio Class I 0.42% | 116,279,132 | 31,359 | 116,310,491 | 42,186 | -- |
| Fidelity Investments Money Market Treasury Portfolio Institutional Class 0.23% | -- | 116,411,338 | -- | 100,846 | 116,411,338 |
| Fidelity Investments Prime Money Market Portfolio Class I 0.44% | 86,244,202 | 272,372 | 86,516,576 | 31,424 | -- |
| Fidelity IT Services Portfolio | 2,312,759 | 413,564 | 584,889 | -- | 2,121,498 |
| Fidelity Japan Fund | 2,271,246 | -- | 2,110,258 | -- | -- |
| Fidelity Japan Smaller Companies Fund | 3,538,339 | 819,979 | 2,500,000 | -- | 2,047,621 |
| Fidelity Large Cap Stock Fund | 98,163 | -- | 101,620 | -- | -- |
| Fidelity Long-Term Treasury Bond Index Fund Investor Class | 13,880,534 | 550,491 | 6,128,318 | 161,138 | -- |
| Fidelity Long-Term Treasury Bond Index Fund Premium Class | -- | 26,059 | 29,516 | 6,621 | 9,883,225 |
| Fidelity Low-Priced Stock Fund | 3,970,688 | 665,034 | 4,386,922 | -- | 83,146 |
| Fidelity Materials Portfolio | 430,944 | 180,712 | 381,514 | -- | 177,124 |
| Fidelity Medical Equipment and Systems Portfolio | 5,236,775 | 2,440,897 | 19,244 | -- | 8,579,244 |
| Fidelity Mid Cap Value Fund | 231,827 | -- | 220,005 | -- | -- |
| Fidelity Natural Gas Portfolio | 3,104 | 9 | -- | 5 | 3,861 |
| Fidelity New Markets Income Fund | 3,678,555 | 121,795 | 1,000,000 | 84,098 | 3,008,372 |
| Fidelity Nordic Fund | -- | 2,964,957 | -- | -- | 3,018,879 |
| Fidelity OTC Portfolio | 54,805 | 74,261 | -- | -- | 122,676 |
| Fidelity Overseas Fund | 18,642,686 | 925,296 | 5,324,565 | -- | 13,681,755 |
| Fidelity Pacific Basin Fund | 1,625,358 | -- | -- | -- | 1,712,431 |
| Fidelity Pharmaceuticals Portfolio | 1,892,123 | -- | 1,240,000 | -- | 489,172 |
| Fidelity Real Estate Income Fund | 2,565,568 | 187,515 | -- | 40,046 | 2,922,642 |
| Fidelity Real Estate Investment Portfolio | 3,203,294 | 1,267,119 | 251,087 | 20,152 | 4,734,208 |
| Fidelity Retailing Portfolio | 2,389,430 | 197,628 | -- | 182 | 2,586,743 |
| Fidelity Series Commodity Strategy Fund | 5,316 | 1,575,083 | -- | -- | 1,661,034 |
| Fidelity Small Cap Stock Fund | 108,883 | 2,564 | -- | -- | 110,666 |
| Fidelity Software and IT Services Portfolio | 1,904,420 | 1,886,477 | -- | 1,039 | 3,806,208 |
| Fidelity Stock Selector Large Cap Value Fund | 663,483 | 171,905 | 826,718 | -- | -- |
| Fidelity Technology Portfolio | 13,331,780 | 455,047 | 1,269,682 | -- | 12,341,190 |
| Fidelity Telecom and Utilities Fund | -- | 726,596 | -- | 4,343 | 866,687 |
| Fidelity Telecommunications Portfolio | 3,105,150 | 1,705,961 | 76,975 | 9,059 | 5,504,360 |
| Fidelity U.S. Bond Index Fund Institutional Premium Class | -- | 1,434,273 | 953,602 | 215,971 | 324,416,992 |
| Fidelity U.S. Bond Index Fund Investor Class | 315,178,807 | 28,328,329 | 32,202,554 | 3,486,080 | -- |
| Fidelity Utilities Portfolio | 973,785 | 2,360,495 | 539,331 | 2,467 | 3,298,700 |
| Fidelity Value Discovery Fund | -- | 812,518 | 881,040 | -- | -- |
| Total | $734,549,008 | $341,764,489 | $346,426,452 | $4,533,685 | $746,381,440 |
Investment Valuation
All investments are categorized as Level 1 under the Fair Value Hierarchy. The inputs or methodology used for valuing securities may not be an indication of the risk associated with investing in those securities. For more information on valuation inputs please refer to the Investment Valuation section in the accompanying Notes to Financial Statements.
See accompanying notes which are an integral part of the financial statements.
VIP FundsManager® 20% Portfolio
Financial Statements
Statement of Assets and Liabilities
| | | June 30, 2016 (Unaudited) |
| Assets | | |
| Investment in securities, at value (cost $708,700,609) — See accompanying schedule | | $746,381,440 |
| Cash | | 4 |
| Receivable for investments sold | | 13 |
| Receivable for fund shares sold | | 373,017 |
| Dividends receivable | | 397,276 |
| Total assets | | 747,151,750 |
| Liabilities | | |
| Payable for investments purchased | $383,721 | |
| Payable for fund shares redeemed | 31 | |
| Accrued management fee | 123,936 | |
| Distribution and service plan fees payable | 295 | |
| Total liabilities | | 507,983 |
| Net Assets | | $746,643,767 |
| Net Assets consist of: | | |
| Paid in capital | | $707,129,941 |
| Undistributed net investment income | | 3,748,000 |
| Accumulated undistributed net realized gain (loss) on investments | | (1,915,005) |
| Net unrealized appreciation (depreciation) on investments | | 37,680,831 |
| Net Assets | | $746,643,767 |
| Service Class: | | |
| Net Asset Value, offering price and redemption price per share ($60,756 ÷ 5,427 shares) | | $11.20 |
| Service Class 2: | | |
| Net Asset Value, offering price and redemption price per share ($2,422,148 ÷ 216,901 shares) | | $11.17 |
| Investor Class: | | |
| Net Asset Value, offering price and redemption price per share ($744,160,863 ÷ 66,508,901 shares) | | $11.19 |
See accompanying notes which are an integral part of the financial statements.
Statement of Operations
| | | Six months ended June 30, 2016 (Unaudited) |
| Investment Income | | |
| Income distributions from underlying funds | | $4,533,685 |
| Expenses | | |
| Management fee | $913,704 | |
| Distribution and service plan fees | 2,375 | |
| Independent trustees' fees and expenses | 1,659 | |
| Total expenses before reductions | 917,738 | |
| Expense reductions | (184,100) | 733,638 |
| Net investment income (loss) | | 3,800,047 |
| Realized and Unrealized Gain (Loss) | | |
| Realized gain (loss) on sale of underlying fund shares | (1,711,064) | |
| Capital gain distributions from underlying funds | 405,809 | |
| Total net realized gain (loss) | | (1,305,255) |
| Change in net unrealized appreciation (depreciation) on underlying funds | | 18,205,458 |
| Net gain (loss) | | 16,900,203 |
| Net increase (decrease) in net assets resulting from operations | | $20,700,250 |
See accompanying notes which are an integral part of the financial statements.
Statement of Changes in Net Assets
| | Six months ended June 30, 2016 (Unaudited) | Year ended December 31, 2015 |
| Increase (Decrease) in Net Assets | | |
| Operations | | |
| Net investment income (loss) | $3,800,047 | $8,791,053 |
| Net realized gain (loss) | (1,305,255) | 10,385,774 |
| Change in net unrealized appreciation (depreciation) | 18,205,458 | (19,017,635) |
| Net increase (decrease) in net assets resulting from operations | 20,700,250 | 159,192 |
| Distributions to shareholders from net investment income | (66,551) | (8,798,379) |
| Distributions to shareholders from net realized gain | (8,917,973) | (23,627,789) |
| Total distributions | (8,984,524) | (32,426,168) |
| Share transactions - net increase (decrease) | 501,337 | 4,615,665 |
| Total increase (decrease) in net assets | 12,217,063 | (27,651,311) |
| Net Assets | | |
| Beginning of period | 734,426,704 | 762,078,015 |
| End of period | $746,643,767 | $734,426,704 |
| Other Information | | |
| Undistributed net investment income end of period | $3,748,000 | $14,504 |
See accompanying notes which are an integral part of the financial statements.
Financial Highlights — VIP FundsManager 20% Portfolio Service Class
| | Six months ended (Unaudited) June 30, | Years ended December 31, | | | | |
| | 2016 | 2015 | 2014 | 2013 | 2012 | 2011 |
| Selected Per–Share Data | | | | | | |
| Net asset value, beginning of period | $11.02 | $11.51 | $11.33 | $11.10 | $10.68 | $10.63 |
| Income from Investment Operations | | | | | | |
| Net investment income (loss)A | .06 | .13 | .15 | .14 | .17 | .20 |
| Net realized and unrealized gain (loss) | .26 | (.13) | .32 | .47 | .44 | .05 |
| Total from investment operations | .32 | –B | .47 | .61 | .61 | .25 |
| Distributions from net investment income | –B | (.13) | (.15) | (.14) | (.16) | (.18) |
| Distributions from net realized gain | (.13) | (.36) | (.15) | (.24) | (.03) | (.02) |
| Total distributions | (.14)C | (.49) | (.29)D | (.38) | (.19) | (.20) |
| Net asset value, end of period | $11.20 | $11.02 | $11.51 | $11.33 | $11.10 | $10.68 |
| Total ReturnE,F,G | 2.92% | (.03)% | 4.21% | 5.53% | 5.68% | 2.30% |
| Ratios to Average Net AssetsH,I | | | | | | |
| Expenses before reductions | .35%J | .35% | .35% | .35% | .35% | .35% |
| Expenses net of fee waivers, if any | .20%J | .20% | .20% | .20% | .20% | .20% |
| Expenses net of all reductions | .20%J | .20% | .20% | .20% | .20% | .20% |
| Net investment income (loss) | 1.04%J | 1.16% | 1.31% | 1.23% | 1.51% | 1.84% |
| Supplemental Data | | | | | | |
| Net assets, end of period (000 omitted) | $61 | $62 | $68 | $72 | $71 | $64 |
| Portfolio turnover rateH | 93%J | 44% | 28% | 25% | 17% | 12% |
A Calculated based on average shares outstanding during the period.
B Amount represents less than $.005 per share.
C Total distributions of $.14 per share is comprised of distributions from net investment income of $.001 and distributions from net realized gain of $.134 per share.
D Total distributions of $.29 per share is comprised of distributions from net investment income of $.147 and distributions from net realized gain of $.147 per share.
E Total returns for periods of less than one year are not annualized.
F Total returns do not reflect charges attributable to your insurance company's separate account. Inclusion of these charges would reduce the total returns shown.
G Total returns would have been lower if certain expenses had not been reduced during the applicable periods shown.
H Amounts do not include the activity of the Underlying Funds.
I Expense ratios reflect operating expenses of the class. Expenses before reductions do not reflect amounts reimbursed by the investment adviser or reductions from expense offset arrangements and do not represent the amount paid by the class during periods when reimbursements or reductions occur. Expenses net of fee waivers reflect expenses after reimbursement by the investment adviser but prior to reductions from expense offset arrangements. Expenses net of all reductions represent the net expenses paid by the class but do not include expenses of the underlying funds in which the Fund invests.
J Annualized
See accompanying notes which are an integral part of the financial statements.
Financial Highlights — VIP FundsManager 20% Portfolio Service Class 2
| | Six months ended (Unaudited) June 30, | Years ended December 31, | | | | |
| | 2016 | 2015 | 2014 | 2013 | 2012 | 2011 |
| Selected Per–Share Data | | | | | | |
| Net asset value, beginning of period | $11.00 | $11.49 | $11.32 | $11.08 | $10.67 | $10.62 |
| Income from Investment Operations | | | | | | |
| Net investment income (loss)A | .05 | .11 | .13 | .12 | .15 | .18 |
| Net realized and unrealized gain (loss) | .26 | (.12) | .32 | .48 | .43 | .05 |
| Total from investment operations | .31 | (.01) | .45 | .60 | .58 | .23 |
| Distributions from net investment income | –B | (.12) | (.13) | (.12) | (.14) | (.16) |
| Distributions from net realized gain | (.13) | (.36) | (.15) | (.24) | (.03) | (.02) |
| Total distributions | (.14)C | (.48) | (.28) | (.36) | (.17) | (.18) |
| Net asset value, end of period | $11.17 | $11.00 | $11.49 | $11.32 | $11.08 | $10.67 |
| Total ReturnD,E,F | 2.83% | (.17)% | 3.98% | 5.46% | 5.43% | 2.20% |
| Ratios to Average Net AssetsG,H | | | | | | |
| Expenses before reductions | .50%I | .50% | .50% | .50% | .50% | .50% |
| Expenses net of fee waivers, if any | .35%I | .35% | .35% | .35% | .35% | .35% |
| Expenses net of all reductions | .35%I | .35% | .35% | .35% | .35% | .35% |
| Net investment income (loss) | .89%I | 1.01% | 1.16% | 1.08% | 1.36% | 1.69% |
| Supplemental Data | | | | | | |
| Net assets, end of period (000 omitted) | $2,422 | $1,454 | $1,426 | $1,197 | $1,274 | $1,373 |
| Portfolio turnover rateG | 93%I | 44% | 28% | 25% | 17% | 12% |
A Calculated based on average shares outstanding during the period.
B Amount represents less than $.005 per share.
C Total distributions of $.14 per share is comprised of distributions from net investment income of $.001 and distributions from net realized gain of $.134 per share.
D Total returns for periods of less than one year are not annualized.
E Total returns do not reflect charges attributable to your insurance company's separate account. Inclusion of these charges would reduce the total returns shown.
F Total returns would have been lower if certain expenses had not been reduced during the applicable periods shown.
G Amounts do not include the activity of the Underlying Funds.
H Expense ratios reflect operating expenses of the class. Expenses before reductions do not reflect amounts reimbursed by the investment adviser or reductions from expense offset arrangements and do not represent the amount paid by the class during periods when reimbursements or reductions occur. Expenses net of fee waivers reflect expenses after reimbursement by the investment adviser but prior to reductions from expense offset arrangements. Expenses net of all reductions represent the net expenses paid by the class but do not include expenses of the underlying funds in which the Fund invests.
I Annualized
See accompanying notes which are an integral part of the financial statements.
Financial Highlights — VIP FundsManager 20% Portfolio Investor Class
| | Six months ended (Unaudited) June 30, | Years ended December 31, | | | | |
| | 2016 | 2015 | 2014 | 2013 | 2012 | 2011 |
| Selected Per–Share Data | | | | | | |
| Net asset value, beginning of period | $11.01 | $11.50 | $11.33 | $11.09 | $10.68 | $10.63 |
| Income from Investment Operations | | | | | | |
| Net investment income (loss)A | .06 | .13 | .15 | .14 | .17 | .20 |
| Net realized and unrealized gain (loss) | .26 | (.13) | .31 | .48 | .43 | .05 |
| Total from investment operations | .32 | –B | .46 | .62 | .60 | .25 |
| Distributions from net investment income | –B | (.13) | (.15) | (.14) | (.16) | (.18) |
| Distributions from net realized gain | (.13) | (.36) | (.15) | (.24) | (.03) | (.02) |
| Total distributions | (.14)C | (.49) | (.29)D | (.38) | (.19) | (.20) |
| Net asset value, end of period | $11.19 | $11.01 | $11.50 | $11.33 | $11.09 | $10.68 |
| Total ReturnE,F,G | 2.92% | (.03)% | 4.12% | 5.62% | 5.58% | 2.31% |
| Ratios to Average Net AssetsH,I | | | | | | |
| Expenses before reductions | .25%J | .25% | .25% | .25% | .25% | .25% |
| Expenses net of fee waivers, if any | .20%J | .20% | .20% | .20% | .20% | .20% |
| Expenses net of all reductions | .20%J | .20% | .20% | .20% | .20% | .20% |
| Net investment income (loss) | 1.04%J | 1.16% | 1.31% | 1.23% | 1.51% | 1.84% |
| Supplemental Data | | | | | | |
| Net assets, end of period (000 omitted) | $744,161 | $732,911 | $760,583 | $694,546 | $650,963 | $533,568 |
| Portfolio turnover rateH | 93%J | 44% | 28% | 25% | 17% | 12% |
A Calculated based on average shares outstanding during the period.
B Amount represents less than $.005 per share.
C Total distributions of $.14 per share is comprised of distributions from net investment income of $.001 and distributions from net realized gain of $.134 per share.
D Total distributions of $.29 per share is comprised of distributions from net investment income of $.147 and distributions from net realized gain of $.147 per share.
E Total returns for periods of less than one year are not annualized.
F Total returns do not reflect charges attributable to your insurance company's separate account. Inclusion of these charges would reduce the total returns shown.
G Total returns would have been lower if certain expenses had not been reduced during the applicable periods shown.
H Amounts do not include the activity of the Underlying Funds.
I Expense ratios reflect operating expenses of the class. Expenses before reductions do not reflect amounts reimbursed by the investment adviser or reductions from expense offset arrangements and do not represent the amount paid by the class during periods when reimbursements or reductions occur. Expenses net of fee waivers reflect expenses after reimbursement by the investment adviser but prior to reductions from expense offset arrangements. Expenses net of all reductions represent the net expenses paid by the class but do not include expenses of the underlying funds in which the Fund invests.
J Annualized
See accompanying notes which are an integral part of the financial statements.
VIP FundsManager® 50% Portfolio
Investment Summary (Unaudited)
The information in the following tables is based on the direct investments of the Fund.
Top Holdings as of June 30, 2016
| | % of fund's net assets | % of fund's net assets 6 months ago |
| Fidelity U.S. Bond Index Fund Institutional Premium Class | 34.0 | 33.2 |
| Fidelity Investments Money Market Government Portfolio Institutional Class 0.30% | 9.0 | 7.5 |
| Fidelity Overseas Fund | 3.7 | 3.5 |
| Fidelity Technology Portfolio | 3.5 | 3.6 |
| Fidelity Consumer Staples Portfolio | 3.1 | 2.6 |
| Fidelity Consumer Discretionary Portfolio | 2.6 | 2.8 |
| Fidelity Diversified International Fund | 2.3 | 5.5 |
| Fidelity Inflation-Protected Bond Index Fund Institutional Premium Class | 2.1 | 1.7 |
| Fidelity Financial Services Portfolio | 2.1 | 2.4 |
| Fidelity Industrials Portfolio | 1.9 | 1.6 |
| | 64.3 | |
Asset Allocation (% of fund's net assets)
| As of June 30, 2016 |
| | Domestic Equity Funds | 36.4% |
| | International Equity Funds | 15.0% |
| | Fixed-Income Funds | 39.6% |
| | Money Market Funds | 9.0% |

| As of December 31, 2015 |
| | Domestic Equity Funds | 37.1% |
| | International Equity Funds | 17.8% |
| | Fixed-Income Funds | 37.6% |
| | Money Market Funds | 7.5% |

VIP FundsManager® 50% Portfolio
Investments June 30, 2016 (Unaudited)
Showing Percentage of Net Assets
| Equity Funds - 51.4% | | | |
| | | Shares | Value |
| Domestic Equity Funds - 36.4% | | | |
| Fidelity 500 Index Fund Premium Class (a) | | 3,122 | $231,506 |
| Fidelity Air Transportation Portfolio (a) | | 51,400 | 3,098,902 |
| Fidelity Banking Portfolio (a) | | 3,426,054 | 80,854,880 |
| Fidelity Blue Chip Growth Fund (a) | | 512,103 | 33,378,860 |
| Fidelity Blue Chip Value Fund (a) | | 2,859,782 | 44,555,404 |
| Fidelity Chemicals Portfolio (a) | | 423,960 | 58,820,236 |
| Fidelity Computers Portfolio (a) | | 111,346 | 7,429,000 |
| Fidelity Construction and Housing Portfolio (a) | | 707,005 | 42,215,293 |
| Fidelity Consumer Discretionary Portfolio (a) | | 4,800,371 | 163,644,637 |
| Fidelity Consumer Finance Portfolio (a) | | 191,976 | 2,165,491 |
| Fidelity Consumer Staples Portfolio (a) | | 2,001,351 | 197,313,212 |
| Fidelity Contrafund (a) | | 238,913 | 23,181,737 |
| Fidelity Defense and Aerospace Portfolio (a) | | 375,001 | 44,688,920 |
| Fidelity Dividend Growth Fund (a) | | 5,687 | 174,148 |
| Fidelity Electronics Portfolio (a) | | 690,793 | 52,293,042 |
| Fidelity Energy Portfolio (a) | | 2,690,903 | 109,842,648 |
| Fidelity Energy Service Portfolio (a) | | 92,923 | 4,149,026 |
| Fidelity Equity Dividend Income Fund (a) | | 828,796 | 21,515,534 |
| Fidelity Financial Services Portfolio (a) | | 1,596,168 | 130,486,763 |
| Fidelity Global Commodity Stock Fund (a) | | 822,115 | 8,410,232 |
| Fidelity Gold Portfolio (a) | | 5,944 | 151,628 |
| Fidelity Growth Company Fund (a) | | 1,514 | 196,600 |
| Fidelity Health Care Portfolio (a) | | 579,624 | 111,624,047 |
| Fidelity Health Care Services Portfolio (a) | | 292,527 | 25,192,407 |
| Fidelity Industrial Equipment Portfolio (a) | | 1,076,703 | 41,173,140 |
| Fidelity Industrials Portfolio (a) | | 3,927,732 | 119,363,770 |
| Fidelity Insurance Portfolio (a) | | 1,179,879 | 80,444,182 |
| Fidelity IT Services Portfolio (a) | | 758,304 | 29,687,591 |
| Fidelity Large Cap Stock Fund (a) | | 1,084,701 | 28,180,533 |
| Fidelity Low-Priced Stock Fund (a) | | 14,673 | 703,151 |
| Fidelity Magellan Fund (a) | | 151 | 13,150 |
| Fidelity Materials Portfolio (a) | | 72,856 | 5,097,750 |
| Fidelity Medical Equipment and Systems Portfolio (a) | | 1,698,383 | 67,935,324 |
| Fidelity Mid Cap Value Fund (a) | | 31,608 | 720,040 |
| Fidelity Nasdaq Composite Index Fund (a) | | 10,862 | 693,125 |
| Fidelity OTC Portfolio (a) | | 243,506 | 18,961,838 |
| Fidelity Pharmaceuticals Portfolio (a) | | 1,332,891 | 25,311,597 |
| Fidelity Real Estate Investment Portfolio (a) | | 1,020,289 | 46,382,353 |
| Fidelity Retailing Portfolio (a) | | 341,570 | 35,940,023 |
| Fidelity Series Commodity Strategy Fund (a)(b) | | 2,789,419 | 15,397,591 |
| Fidelity Small Cap Growth Fund (a) | | 5,648 | 106,070 |
| Fidelity Small Cap Stock Fund (a) | | 858,869 | 14,815,491 |
| Fidelity Small Cap Value Fund (a) | | 12,260 | 215,539 |
| Fidelity Software and IT Services Portfolio (a) | | 732,707 | 88,591,637 |
| Fidelity Stock Selector Large Cap Value Fund (a) | | 4,436,180 | 76,302,288 |
| Fidelity Technology Portfolio (a) | | 1,879,729 | 219,909,481 |
| Fidelity Telecom and Utilities Fund (a) | | 637,340 | 16,698,308 |
| Fidelity Telecommunications Portfolio (a) | | 1,577,816 | 111,378,012 |
| Fidelity Utilities Portfolio (a) | | 811,852 | 63,129,621 |
| Fidelity Value Discovery Fund (a) | | 1,230,849 | 28,691,097 |
|
| TOTAL DOMESTIC EQUITY FUNDS | | | 2,301,456,855 |
|
| International Equity Funds - 15.0% | | | |
| Fidelity Diversified International Fund (a) | | 4,321,096 | 143,719,667 |
| Fidelity Emerging Asia Fund (a) | | 1,103,840 | 34,097,602 |
| Fidelity Emerging Markets Fund (a) | | 337,148 | 7,801,609 |
| Fidelity Europe Fund (a) | | 2,270,222 | 76,801,616 |
| Fidelity International Capital Appreciation Fund (a) | | 1,715,849 | 28,963,533 |
| Fidelity International Discovery Fund (a) | | 2,077,198 | 76,752,484 |
| Fidelity International Index Fund Institutional Class (a) | | 3,402,581 | 118,069,556 |
| Fidelity International Real Estate Fund (a) | | 15,815 | 160,364 |
| Fidelity International Small Cap Fund (a) | | 1,808,156 | 41,117,472 |
| Fidelity International Small Cap Opportunities Fund (a) | | 5,183,386 | 75,107,270 |
| Fidelity Japan Fund (a) | | 1,233,367 | 14,430,394 |
| Fidelity Japan Smaller Companies Fund (a) | | 3,935,359 | 58,164,610 |
| Fidelity Nordic Fund (a) | | 669,015 | 30,895,095 |
| Fidelity Overseas Fund (a) | | 5,930,385 | 234,368,796 |
| Fidelity Pacific Basin Fund (a) | | 350,614 | 9,722,534 |
|
| TOTAL INTERNATIONAL EQUITY FUNDS | | | 950,172,602 |
|
| TOTAL EQUITY FUNDS | | | |
| (Cost $3,044,235,143) | | | 3,251,629,457 |
|
| Fixed-Income Funds - 39.6% | | | |
| Fidelity Floating Rate High Income Fund (a) | | 10,191,880 | 95,294,079 |
| Fidelity Focused High Income Fund (a) | | 61,299 | 505,101 |
| Fidelity High Income Fund (a) | | 614,512 | 5,112,738 |
| Fidelity Inflation-Protected Bond Index Fund Institutional Premium Class (a) | | 13,450,321 | 134,099,703 |
| Fidelity Long-Term Treasury Bond Index Fund Premium Class (a) | | 5,208,018 | 75,828,740 |
| Fidelity New Markets Income Fund (a) | | 1,487,222 | 23,498,106 |
| Fidelity Real Estate Income Fund (a) | | 1,585,539 | 18,978,898 |
| Fidelity U.S. Bond Index Fund Institutional Premium Class (a) | | 179,545,714 | 2,147,366,735 |
| TOTAL FIXED-INCOME FUNDS | | | |
| (Cost $2,414,202,962) | | | 2,500,684,100 |
|
| Money Market Funds - 9.0% | | | |
| Fidelity Investments Money Market Government Portfolio Institutional Class 0.30% (a)(c) | | | |
| (Cost $567,116,405) | | 567,116,405 | 567,116,405 |
| TOTAL INVESTMENT PORTFOLIO - 100.0% | | | |
| (Cost $6,025,554,510) | | | 6,319,429,962 |
| NET OTHER ASSETS (LIABILITIES) - 0.0% | | | 1,518,934 |
| NET ASSETS - 100% | | | $6,320,948,896 |
Legend
(a) Affiliated Fund
(b) Non-income producing
(c) The rate quoted is the annualized seven-day yield of the fund at period end.
Affiliated Underlying Funds
Information regarding the Fund's fiscal year to date purchases and sales of the affiliated Underlying Funds and income earned by the Fund from investments in affiliated Underlying Funds is as follows:
| Affiliate | Value, beginning of period | Purchases | Sales Proceeds | Dividend Income | Value, end of period |
| Fidelity 500 Index Fund Investor Class | $223,048 | $-- | $-- | $1,081 | $-- |
| Fidelity 500 Index Fund Premium Class | -- | 1,143 | -- | -- | 231,506 |
| Fidelity Air Transportation Portfolio | 9,262,502 | -- | 5,850,000 | -- | 3,098,902 |
| Fidelity Automotive Portfolio | 6,469,331 | -- | 5,178,285 | -- | -- |
| Fidelity Banking Portfolio | 85,594,035 | 4,214,408 | 2,103,785 | -- | 80,854,880 |
| Fidelity Blue Chip Growth Fund | 108,678,685 | 670,822 | 68,959,191 | -- | 33,378,860 |
| Fidelity Blue Chip Value Fund | 50,999,832 | 4,050,861 | 10,458,331 | -- | 44,555,404 |
| Fidelity Brokerage and Investment Management Portfolio | 14,411,464 | -- | 12,434,288 | -- | -- |
| Fidelity Chemicals Portfolio | 37,983,812 | 24,097,493 | 5,687,500 | -- | 58,820,236 |
| Fidelity China Region Fund | 11,950,996 | -- | 10,463,451 | -- | -- |
| Fidelity Computers Portfolio | 22,816,977 | 21,887 | 14,152,814 | 21,349 | 7,429,000 |
| Fidelity Construction and Housing Portfolio | 38,625,226 | 3,433,696 | 800,000 | -- | 42,215,293 |
| Fidelity Consumer Discretionary Portfolio | 169,442,046 | 6,505,389 | 11,500,416 | 165,836 | 163,644,637 |
| Fidelity Consumer Finance Portfolio | 3,103,656 | 67,549 | 800,000 | 5,941 | 2,165,491 |
| Fidelity Consumer Staples Portfolio | $160,136,675 | $51,087,214 | $29,841,580 | $301,169 | $197,313,212 |
| Fidelity Contrafund | 68,386,975 | 9,929,260 | 53,527,662 | 8,739 | 23,181,737 |
| Fidelity Defense and Aerospace Portfolio | 37,175,626 | 5,772,736 | -- | 93,099 | 44,688,920 |
| Fidelity Diversified International Fund | 338,225,463 | -- | 175,921,908 | -- | 143,719,667 |
| Fidelity Dividend Growth Fund | 172,271 | -- | -- | -- | 174,148 |
| Fidelity Electronics Portfolio | 27,604,565 | 24,420,637 | -- | 20,633 | 52,293,042 |
| Fidelity Emerging Asia Fund | 46,376,813 | -- | 12,939,638 | -- | 34,097,602 |
| Fidelity Emerging Markets Fund | 4,283,885 | 5,235,671 | 2,000,000 | -- | 7,801,609 |
| Fidelity Energy Portfolio | 83,220,015 | 16,896,759 | 4,091,086 | 94,161 | 109,842,648 |
| Fidelity Energy Service Portfolio | 11,903,027 | 2,322 | 8,600,000 | 2,322 | 4,149,026 |
| Fidelity Equity Dividend Income Fund | -- | 26,451,644 | 7,000,000 | 83,714 | 21,515,534 |
| Fidelity Europe Fund | 107,632,829 | -- | 24,271,444 | -- | 76,801,616 |
| Fidelity Financial Services Portfolio | 148,547,857 | 525,518 | 13,643,956 | -- | 130,486,763 |
| Fidelity Floating Rate High Income Fund | 32,122,729 | 62,445,243 | -- | 934,813 | 95,294,079 |
| Fidelity Focused High Income Fund | 466,598 | 24,838 | -- | 11,248 | 505,101 |
| Fidelity Global Commodity Stock Fund | 42,364 | 8,232,253 | -- | -- | 8,410,232 |
| Fidelity Gold Portfolio | 79,341 | 1,375 | -- | -- | 151,628 |
| Fidelity Growth Company Fund | 206,713 | 539 | -- | -- | 196,600 |
| Fidelity Health Care Portfolio | 157,801,720 | 11,610,440 | 42,879,210 | -- | 111,624,047 |
| Fidelity Health Care Services Portfolio | 22,374,105 | 2,689,901 | 464,639 | -- | 25,192,407 |
| Fidelity High Income Fund | 4,747,519 | 140,032 | -- | 140,032 | 5,112,738 |
| Fidelity Industrial Equipment Portfolio | 33,842,662 | 5,417,965 | -- | -- | 41,173,140 |
| Fidelity Industrials Portfolio | 100,736,644 | 31,823,307 | 16,216,545 | -- | 119,363,770 |
| Fidelity Inflation-Protected Bond Index Fund Institutional Premium Class | -- | 85,994 | 195,761 | -- | 134,099,703 |
| Fidelity Inflation-Protected Bond Index Fund Investor Class | 103,837,384 | 25,073,999 | 1,870,470 | 380 | -- |
| Fidelity Insurance Portfolio | 65,956,537 | 13,193,790 | -- | 164,717 | 80,444,182 |
| Fidelity International Capital Appreciation Fund | 1,316,862 | 28,237,260 | 1,224,103 | -- | 28,963,533 |
| Fidelity International Discovery Fund | 100,651,836 | 6,128,686 | 23,310,215 | -- | 76,752,484 |
| Fidelity International Index Fund Institutional Class | -- | 39,844,000 | -- | -- | 118,069,556 |
| Fidelity International Index Fund Investor Class | 82,634,239 | 281,770 | 3,150,000 | 111,924 | -- |
| Fidelity International Real Estate Fund | 158,466 | -- | -- | -- | 160,364 |
| Fidelity International Small Cap Fund | 15,438,298 | 24,445,569 | -- | -- | 41,117,472 |
| Fidelity International Small Cap Opportunities Fund | 49,732,063 | 26,389,620 | -- | -- | 75,107,270 |
| Fidelity International Value Fund | 4,294,764 | -- | 3,922,319 | -- | -- |
| Fidelity Investments Money Market Government Portfolio Institutional Class 0.30% | -- | 737,972,059 | 170,855,656 | 703,706 | 567,116,405 |
| Fidelity Investments Prime Money Market Portfolio Class I 0.44% | 463,644,497 | 126,588 | 463,771,084 | 167,608 | -- |
| Fidelity IT Services Portfolio | 36,922,810 | 6,464,841 | 13,475,186 | -- | 29,687,591 |
| Fidelity Japan Fund | 50,245,967 | -- | 33,721,626 | -- | 14,430,394 |
| Fidelity Japan Smaller Companies Fund | 39,529,567 | 14,546,835 | -- | -- | 58,164,610 |
| Fidelity Large Cap Stock Fund | 36,507,164 | 517,995 | 8,409,904 | 153,626 | 28,180,533 |
| Fidelity Leisure Portfolio | 789,702 | -- | 739,063 | -- | -- |
| Fidelity Long-Term Treasury Bond Index Fund Investor Class | 92,436,385 | 4,480,470 | 32,422,683 | 1,137,534 | -- |
| Fidelity Long-Term Treasury Bond Index Fund Premium Class | -- | 100,006 | 107,670 | 50,766 | 75,828,740 |
| Fidelity Low-Priced Stock Fund | 31,042,654 | 4,781,511 | 34,926,520 | -- | 703,151 |
| Fidelity Magellan Fund | 13,343 | 120 | -- | 16 | 13,150 |
| Fidelity Materials Portfolio | 5,717,244 | 5,137,780 | 5,034,781 | -- | 5,097,750 |
| Fidelity Medical Equipment and Systems Portfolio | 40,385,234 | 19,763,049 | 464,532 | -- | 67,935,324 |
| Fidelity Mega Cap Stock Fund | 38,159,112 | -- | 37,517,242 | -- | -- |
| Fidelity Mid Cap Value Fund | 36,114,586 | 1,900,000 | 36,027,792 | -- | 720,040 |
| Fidelity Nasdaq Composite Index Fund | 711,818 | 478 | -- | -- | 693,125 |
| Fidelity New Markets Income Fund | 20,190,757 | 2,550,368 | 1,000,000 | 600,324 | 23,498,106 |
| Fidelity Nordic Fund | 17,654,336 | 13,632,999 | -- | -- | 30,895,095 |
| Fidelity OTC Portfolio | 8,568,139 | 12,367,361 | 1,000,000 | -- | 18,961,838 |
| Fidelity Overseas Fund | 214,102,961 | 31,482,386 | 5,319,894 | -- | 234,368,796 |
| Fidelity Pacific Basin Fund | 9,228,168 | -- | -- | -- | 9,722,534 |
| Fidelity Pharmaceuticals Portfolio | 35,592,219 | -- | 7,360,000 | -- | 25,311,597 |
| Fidelity Real Estate Income Fund | $16,379,032 | $1,513,601 | $-- | $259,050 | $18,978,898 |
| Fidelity Real Estate Investment Portfolio | 31,435,595 | 10,810,995 | 893,367 | 195,480 | 46,382,353 |
| Fidelity Retailing Portfolio | 30,684,296 | 5,263,219 | -- | 2,333 | 35,940,023 |
| Fidelity Series Commodity Strategy Fund | 5,316 | 14,669,100 | -- | -- | 15,397,591 |
| Fidelity Small Cap Growth Fund | 105,618 | -- | -- | -- | 106,070 |
| Fidelity Small Cap Stock Fund | 14,380,585 | 526,644 | -- | -- | 14,815,491 |
| Fidelity Small Cap Value Fund | 205,240 | -- | -- | -- | 215,539 |
| Fidelity Software and IT Services Portfolio | 56,717,029 | 33,231,051 | 1,349,654 | 25,283 | 88,591,637 |
| Fidelity Stock Selector Large Cap Value Fund | 70,476,339 | 7,412,490 | 5,935,095 | -- | 76,302,288 |
| Fidelity Technology Portfolio | 217,741,598 | 10,021,594 | 5,526,098 | -- | 219,909,481 |
| Fidelity Telecom and Utilities Fund | -- | 14,303,537 | -- | 83,670 | 16,698,308 |
| Fidelity Telecommunications Portfolio | 59,301,007 | 36,116,395 | -- | 186,999 | 111,378,012 |
| Fidelity U.S. Bond Index Fund Institutional Premium Class | -- | 2,839,725 | 3,034,341 | 1,429,095 | 2,147,366,735 |
| Fidelity U.S. Bond Index Fund Investor Class | 2,032,935,669 | 165,676,110 | 134,196,864 | 23,013,485 | -- |
| Fidelity Utilities Portfolio | 14,461,606 | 45,469,683 | 6,295,259 | 46,042 | 63,129,621 |
| Fidelity Value Discovery Fund | 38,643,322 | 4,567,350 | 15,107,167 | -- | 28,691,097 |
| Total | $6,130,697,370 | $1,677,697,930 | $1,597,950,075 | $30,216,175 | $6,319,429,962 |
Investment Valuation
All investments are categorized as Level 1 under the Fair Value Hierarchy. The inputs or methodology used for valuing securities may not be an indication of the risk associated with investing in those securities. For more information on valuation inputs please refer to the Investment Valuation section in the accompanying Notes to Financial Statements.
See accompanying notes which are an integral part of the financial statements.
VIP FundsManager® 50% Portfolio
Financial Statements
Statement of Assets and Liabilities
| | | June 30, 2016 (Unaudited) |
| Assets | | |
| Investment in securities, at value (cost $6,025,554,510) — See accompanying schedule | | $6,319,429,962 |
| Receivable for investments sold | | 4,041,727 |
| Receivable for fund shares sold | | 1,344 |
| Dividends receivable | | 2,658,209 |
| Total assets | | 6,326,131,242 |
| Liabilities | | |
| Payable for investments purchased | $2,760,677 | |
| Payable for fund shares redeemed | 1,359,264 | |
| Accrued management fee | 1,051,075 | |
| Distribution and service plan fees payable | 11,330 | |
| Total liabilities | | 5,182,346 |
| Net Assets | | $6,320,948,896 |
| Net Assets consist of: | | |
| Paid in capital | | $6,061,575,207 |
| Undistributed net investment income | | 23,999,280 |
| Accumulated undistributed net realized gain (loss) on investments | | (58,501,043) |
| Net unrealized appreciation (depreciation) on investments | | 293,875,452 |
| Net Assets | | $6,320,948,896 |
| Service Class: | | |
| Net Asset Value, offering price and redemption price per share ($62,224 ÷ 5,202 shares) | | $11.96 |
| Service Class 2: | | |
| Net Asset Value, offering price and redemption price per share ($90,879,597 ÷ 7,625,956 shares) | | $11.92 |
| Investor Class: | | |
| Net Asset Value, offering price and redemption price per share ($6,230,007,075 ÷ 520,897,775 shares) | | $11.96 |
See accompanying notes which are an integral part of the financial statements.
Statement of Operations
| | | Six months ended June 30, 2016 (Unaudited) |
| Investment Income | | |
| Income distributions from underlying funds | | $30,216,175 |
| Expenses | | |
| Management fee | $7,679,187 | |
| Distribution and service plan fees | 106,602 | |
| Independent trustees' fees and expenses | 13,876 | |
| Total expenses before reductions | 7,799,665 | |
| Expense reductions | (1,582,770) | 6,216,895 |
| Net investment income (loss) | | 23,999,280 |
| Realized and Unrealized Gain (Loss) | | |
| Realized gain (loss) on sale of underlying fund shares | (60,713,086) | |
| Capital gain distributions from underlying funds | 6,964,949 | |
| Total net realized gain (loss) | | (53,748,137) |
| Change in net unrealized appreciation (depreciation) on underlying funds | | 169,697,817 |
| Net gain (loss) | | 115,949,680 |
| Net increase (decrease) in net assets resulting from operations | | $139,948,960 |
See accompanying notes which are an integral part of the financial statements.
Statement of Changes in Net Assets
| | Six months ended June 30, 2016 (Unaudited) | Year ended December 31, 2015 |
| Increase (Decrease) in Net Assets | | |
| Operations | | |
| Net investment income (loss) | $23,999,280 | $68,032,841 |
| Net realized gain (loss) | (53,748,137) | 90,122,692 |
| Change in net unrealized appreciation (depreciation) | 169,697,817 | (166,818,526) |
| Net increase (decrease) in net assets resulting from operations | 139,948,960 | (8,662,993) |
| Distributions to shareholders from net investment income | – | (69,982,049) |
| Distributions to shareholders from net realized gain | (71,969,152) | (180,001,166) |
| Total distributions | (71,969,152) | (249,983,215) |
| Share transactions - net increase (decrease) | 123,311,792 | 1,213,704,685 |
| Total increase (decrease) in net assets | 191,291,600 | 955,058,477 |
| Net Assets | | |
| Beginning of period | 6,129,657,296 | 5,174,598,819 |
| End of period | $6,320,948,896 | $6,129,657,296 |
| Other Information | | |
| Undistributed net investment income end of period | $23,999,280 | $– |
See accompanying notes which are an integral part of the financial statements.
Financial Highlights — VIP FundsManager 50% Portfolio Service Class
| | Six months ended (Unaudited) June 30, | Years ended December 31, | | | | |
| | 2016 | 2015 | 2014 | 2013 | 2012 | 2011 |
| Selected Per–Share Data | | | | | | |
| Net asset value, beginning of period | $11.85 | $12.39 | $12.01 | $10.62 | $9.78 | $10.02 |
| Income from Investment Operations | | | | | | |
| Net investment income (loss)A | .05 | .15 | .17 | .15 | .18 | .19 |
| Net realized and unrealized gain (loss) | .20 | (.13) | .45 | 1.42 | .82 | (.23) |
| Total from investment operations | .25 | .02 | .62 | 1.57 | 1.00 | (.04) |
| Distributions from net investment income | – | (.14) | (.14) | (.12) | (.13) | (.18) |
| Distributions from net realized gain | (.14) | (.42) | (.10) | (.07) | (.03) | (.02) |
| Total distributions | (.14) | (.56) | (.24) | (.18)B | (.16) | (.20) |
| Net asset value, end of period | $11.96 | $11.85 | $12.39 | $12.01 | $10.62 | $9.78 |
| Total ReturnC,D,E | 2.19% | .06% | 5.18% | 14.79% | 10.24% | (.42)% |
| Ratios to Average Net AssetsF,G | | | | | | |
| Expenses before reductions | .35%H | .35% | .35% | .35% | .35% | .35% |
| Expenses net of fee waivers, if any | .20%H | .20% | .20% | .20% | .20% | .20% |
| Expenses net of all reductions | .20%H | .20% | .20% | .20% | .20% | .20% |
| Net investment income (loss) | .78%H | 1.19% | 1.38% | 1.33% | 1.77% | 1.84% |
| Supplemental Data | | | | | | |
| Net assets, end of period (000 omitted) | $62 | $64 | $73 | $80 | $72 | $59 |
| Portfolio turnover rateF | 52%H | 24% | 25% | 15% | 15% | 14% |
A Calculated based on average shares outstanding during the period.
B Total distributions of $.18 per share is comprised of distributions from net investment income of $.115 and distributions from net realized gain of $.065 per share.
C Total returns for periods of less than one year are not annualized.
D Total returns do not reflect charges attributable to your insurance company's separate account. Inclusion of these charges would reduce the total returns shown.
E Total returns would have been lower if certain expenses had not been reduced during the applicable periods shown.
F Amounts do not include the activity of the Underlying Funds.
G Expense ratios reflect operating expenses of the class. Expenses before reductions do not reflect amounts reimbursed by the investment adviser or reductions from expense offset arrangements and do not represent the amount paid by the class during periods when reimbursements or reductions occur. Expenses net of fee waivers reflect expenses after reimbursement by the investment adviser but prior to reductions from expense offset arrangements. Expenses net of all reductions represent the net expenses paid by the class but do not include expenses of the underlying funds in which the Fund invests.
H Annualized
See accompanying notes which are an integral part of the financial statements.
Financial Highlights — VIP FundsManager 50% Portfolio Service Class 2
| | Six months ended (Unaudited) June 30, | Years ended December 31, | | | | |
| | 2016 | 2015 | 2014 | 2013 | 2012 | 2011 |
| Selected Per–Share Data | | | | | | |
| Net asset value, beginning of period | $11.82 | $12.35 | $11.98 | $10.59 | $9.75 | $10.01 |
| Income from Investment Operations | | | | | | |
| Net investment income (loss)A | .04 | .13 | .15 | .13 | .17 | .17 |
| Net realized and unrealized gain (loss) | .20 | (.12) | .44 | 1.42 | .82 | (.24) |
| Total from investment operations | .24 | .01 | .59 | 1.55 | .99 | (.07) |
| Distributions from net investment income | – | (.12) | (.12) | (.10) | (.12) | (.17) |
| Distributions from net realized gain | (.14) | (.42) | (.10) | (.07) | (.03) | (.02) |
| Total distributions | (.14) | (.54) | (.22) | (.16)B | (.15) | (.19) |
| Net asset value, end of period | $11.92 | $11.82 | $12.35 | $11.98 | $10.59 | $9.75 |
| Total ReturnC,D,E | 2.11% | (.02)% | 4.95% | 14.66% | 10.12% | (.68)% |
| Ratios to Average Net AssetsF,G | | | | | | |
| Expenses before reductions | .50%H | .50% | .50% | .50% | .50% | .50% |
| Expenses net of fee waivers, if any | .35%H | .35% | .35% | .35% | .35% | .35% |
| Expenses net of all reductions | .35%H | .35% | .35% | .35% | .35% | .35% |
| Net investment income (loss) | .63%H | 1.04% | 1.23% | 1.18% | 1.62% | 1.69% |
| Supplemental Data | | | | | | |
| Net assets, end of period (000 omitted) | $90,880 | $83,447 | $88,771 | $89,164 | $81,647 | $17,800 |
| Portfolio turnover rateF | 52%H | 24% | 25% | 15% | 15% | 14% |
A Calculated based on average shares outstanding during the period.
B Total distributions of $.16 per share is comprised of distributions from net investment income of $.097 and distributions from net realized gain of $.065 per share.
C Total returns for periods of less than one year are not annualized.
D Total returns do not reflect charges attributable to your insurance company's separate account. Inclusion of these charges would reduce the total returns shown.
E Total returns would have been lower if certain expenses had not been reduced during the applicable periods shown.
F Amounts do not include the activity of the Underlying Funds.
G Expense ratios reflect operating expenses of the class. Expenses before reductions do not reflect amounts reimbursed by the investment adviser or reductions from expense offset arrangements and do not represent the amount paid by the class during periods when reimbursements or reductions occur. Expenses net of fee waivers reflect expenses after reimbursement by the investment adviser but prior to reductions from expense offset arrangements. Expenses net of all reductions represent the net expenses paid by the class but do not include expenses of the underlying funds in which the Fund invests.
H Annualized
See accompanying notes which are an integral part of the financial statements.
Financial Highlights — VIP FundsManager 50% Portfolio Investor Class
| | Six months ended (Unaudited) June 30, | Years ended December 31, | | | | |
| | 2016 | 2015 | 2014 | 2013 | 2012 | 2011 |
| Selected Per–Share Data | | | | | | |
| Net asset value, beginning of period | $11.85 | $12.38 | $12.01 | $10.61 | $9.78 | $10.02 |
| Income from Investment Operations | | | | | | |
| Net investment income (loss)A | .05 | .15 | .17 | .15 | .18 | .19 |
| Net realized and unrealized gain (loss) | .20 | (.12) | .44 | 1.43 | .81 | (.23) |
| Total from investment operations | .25 | .03 | .61 | 1.58 | .99 | (.04) |
| Distributions from net investment income | – | (.14) | (.14) | (.12) | (.13) | (.18) |
| Distributions from net realized gain | (.14) | (.42) | (.10) | (.07) | (.03) | (.02) |
| Total distributions | (.14) | (.56) | (.24) | (.18)B | (.16) | (.20) |
| Net asset value, end of period | $11.96 | $11.85 | $12.38 | $12.01 | $10.61 | $9.78 |
| Total ReturnC,D,E | 2.19% | .14% | 5.10% | 14.90% | 10.13% | (.42)% |
| Ratios to Average Net AssetsF,G | | | | | | |
| Expenses before reductions | .25%H | .25% | .25% | .25% | .25% | .25% |
| Expenses net of fee waivers, if any | .20%H | .20% | .20% | .20% | .20% | .20% |
| Expenses net of all reductions | .20%H | .20% | .20% | .20% | .20% | .20% |
| Net investment income (loss) | .78%H | 1.19% | 1.38% | 1.33% | 1.77% | 1.84% |
| Supplemental Data | | | | | | |
| Net assets, end of period (000 omitted) | $6,230,007 | $6,046,146 | $5,085,755 | $3,319,291 | $1,347,437 | $747,577 |
| Portfolio turnover rateF | 52%H | 24% | 25% | 15% | 15% | 14% |
A Calculated based on average shares outstanding during the period.
B Total distributions of $.18 per share is comprised of distributions from net investment income of $.115 and distributions from net realized gain of $.065 per share.
C Total returns for periods of less than one year are not annualized.
D Total returns do not reflect charges attributable to your insurance company's separate account. Inclusion of these charges would reduce the total returns shown.
E Total returns would have been lower if certain expenses had not been reduced during the applicable periods shown.
F Amounts do not include the activity of the Underlying Funds.
G Expense ratios reflect operating expenses of the class. Expenses before reductions do not reflect amounts reimbursed by the investment adviser or reductions from expense offset arrangements and do not represent the amount paid by the class during periods when reimbursements or reductions occur. Expenses net of fee waivers reflect expenses after reimbursement by the investment adviser but prior to reductions from expense offset arrangements. Expenses net of all reductions represent the net expenses paid by the class but do not include expenses of the underlying funds in which the Fund invests.
H Annualized
See accompanying notes which are an integral part of the financial statements.
VIP FundsManager® 60% Portfolio
Investment Summary (Unaudited)
The information in the following tables is based on the direct investments of the Fund.
Top Holdings as of June 30, 2016
| | % of fund's net assets | % of fund's net assets 6 months ago |
| Fidelity U.S. Bond Index Fund Institutional Premium Class | 29.2 | 28.7 |
| Fidelity Overseas Fund | 5.4 | 4.9 |
| Fidelity Technology Portfolio | 5.2 | 5.2 |
| Fidelity Consumer Staples Portfolio | 4.0 | 3.4 |
| Fidelity Investments Money Market Government Portfolio Institutional Class 0.30% | 3.8 | 2.4 |
| Fidelity Diversified International Fund | 3.4 | 7.3 |
| Fidelity Consumer Discretionary Portfolio | 3.4 | 3.7 |
| Fidelity Financial Services Portfolio | 3.0 | 3.6 |
| Fidelity Health Care Portfolio | 2.7 | 3.5 |
| Fidelity Industrials Portfolio | 2.6 | 2.3 |
| | 62.7 | |
Asset Allocation (% of fund's net assets)
| As of June 30, 2016 |
| | Domestic Equity Funds | 43.4% |
| | International Equity Funds | 17.9% |
| | Fixed-Income Funds | 34.9% |
| | Money Market Funds | 3.8% |

| As of December 31, 2015 |
| | Domestic Equity Funds | 43.8% |
| | International Equity Funds | 20.8% |
| | Fixed-Income Funds | 33.0% |
| | Money Market Funds | 2.4% |

VIP FundsManager® 60% Portfolio
Investments June 30, 2016 (Unaudited)
Showing Percentage of Net Assets
| Equity Funds - 61.3% | | | |
| | | Shares | Value |
| Domestic Equity Funds - 43.4% | | | |
| Fidelity 500 Index Fund Premium Class (a) | | 2,465 | $182,770 |
| Fidelity Air Transportation Portfolio (a) | | 62,444 | 3,764,749 |
| Fidelity Banking Portfolio (a) | | 5,515,181 | 130,158,274 |
| Fidelity Blue Chip Value Fund (a) | | 2,284,972 | 35,599,868 |
| Fidelity Chemicals Portfolio (a) | | 523,619 | 72,646,911 |
| Fidelity Computers Portfolio (a) | | 136,684 | 9,119,555 |
| Fidelity Construction and Housing Portfolio (a) | | 1,127,659 | 67,332,503 |
| Fidelity Consumer Discretionary Portfolio (a) | | 6,740,513 | 229,784,073 |
| Fidelity Consumer Finance Portfolio (a) | | 173,398 | 1,955,925 |
| Fidelity Consumer Staples Portfolio (a) | | 2,750,169 | 271,139,193 |
| Fidelity Defense and Aerospace Portfolio (a) | | 422,586 | 50,359,524 |
| Fidelity Dividend Growth Fund (a) | | 2,670 | 81,763 |
| Fidelity Electronics Portfolio (a) | | 802,416 | 60,742,876 |
| Fidelity Energy Portfolio (a) | | 3,853,133 | 157,284,895 |
| Fidelity Energy Service Portfolio (a) | | 121,919 | 5,443,668 |
| Fidelity Equity Dividend Income Fund (a) | | 896,047 | 23,261,376 |
| Fidelity Financial Services Portfolio (a) | | 2,466,839 | 201,664,058 |
| Fidelity Global Commodity Stock Fund (a) | | 849,877 | 8,694,246 |
| Fidelity Gold Portfolio (a) | | 29,090 | 742,087 |
| Fidelity Health Care Portfolio (a) | | 955,623 | 184,033,914 |
| Fidelity Health Care Services Portfolio (a) | | 383,304 | 33,010,161 |
| Fidelity Industrial Equipment Portfolio (a) | | 1,353,432 | 51,755,245 |
| Fidelity Industrials Portfolio (a) | | 5,887,301 | 178,915,091 |
| Fidelity Insurance Portfolio (a) | | 1,281,436 | 87,368,325 |
| Fidelity IT Services Portfolio (a) | | 853,190 | 33,402,404 |
| Fidelity Large Cap Stock Fund (a) | | 267,031 | 6,937,472 |
| Fidelity Low-Priced Stock Fund (a) | | 23,154 | 1,109,561 |
| Fidelity Magellan Fund (a) | | 752 | 65,701 |
| Fidelity Materials Portfolio (a) | | 199,411 | 13,952,765 |
| Fidelity Medical Equipment and Systems Portfolio (a) | | 2,171,369 | 86,854,743 |
| Fidelity Natural Resources Portfolio (a) | | 93,229 | 2,545,160 |
| Fidelity OTC Portfolio (a) | | 113,579 | 8,844,408 |
| Fidelity Pharmaceuticals Portfolio (a) | | 1,445,582 | 27,451,594 |
| Fidelity Real Estate Investment Portfolio (a) | | 975,026 | 44,324,678 |
| Fidelity Retailing Portfolio (a) | | 524,148 | 55,150,834 |
| Fidelity Series Commodity Strategy Fund (a)(b) | | 3,057,037 | 16,874,843 |
| Fidelity Small Cap Growth Fund (a) | | 13,215 | 248,175 |
| Fidelity Small Cap Stock Fund (a) | | 987,096 | 17,027,409 |
| Fidelity Small Cap Value Fund (a) | | 17,333 | 304,717 |
| Fidelity Software and IT Services Portfolio (a) | | 983,524 | 118,917,890 |
| Fidelity Stock Selector All Cap Fund (a) | | 5,612 | 191,545 |
| Fidelity Stock Selector Large Cap Value Fund (a) | | 2,691,615 | 46,295,777 |
| Fidelity Technology Portfolio (a) | | 3,031,292 | 354,630,832 |
| Fidelity Telecom and Utilities Fund (a) | | 581,074 | 15,224,143 |
| Fidelity Telecommunications Portfolio (a) | | 2,097,223 | 148,042,992 |
| Fidelity Utilities Portfolio (a) | | 1,166,297 | 90,691,242 |
| Fidelity Value Discovery Fund (a) | | 291,033 | 6,783,982 |
|
| TOTAL DOMESTIC EQUITY FUNDS | | | 2,960,913,917 |
|
| International Equity Funds - 17.9% | | | |
| Fidelity Diversified International Fund (a) | | 7,009,725 | 233,143,444 |
| Fidelity Emerging Asia Fund (a) | | 649,207 | 20,054,009 |
| Fidelity Emerging Markets Fund (a) | | 52,925 | 1,224,691 |
| Fidelity Europe Fund (a) | | 1,547,213 | 52,342,213 |
| Fidelity International Capital Appreciation Fund (a) | | 2,079,570 | 35,103,148 |
| Fidelity International Discovery Fund (a) | | 2,798,852 | 103,417,586 |
| Fidelity International Index Fund Institutional Class (a) | | 3,752,641 | 130,216,655 |
| Fidelity International Real Estate Fund (a) | | 20,219 | 205,016 |
| Fidelity International Small Cap Fund (a) | | 2,228,890 | 50,684,956 |
| Fidelity International Small Cap Opportunities Fund (a) | | 5,905,035 | 85,563,960 |
| Fidelity Japan Fund (a) | | 1,118,557 | 13,087,115 |
| Fidelity Japan Smaller Companies Fund (a) | | 4,139,288 | 61,178,674 |
| Fidelity Nordic Fund (a) | | 741,108 | 34,224,372 |
| Fidelity Overseas Fund (a) | | 9,351,687 | 369,578,652 |
| Fidelity Pacific Basin Fund (a) | | 1,181,591 | 32,765,531 |
|
| TOTAL INTERNATIONAL EQUITY FUNDS | | | 1,222,790,022 |
|
| TOTAL EQUITY FUNDS | | | |
| (Cost $3,528,583,583) | | | 4,183,703,939 |
|
| Fixed-Income Funds - 34.9% | | | |
| Fidelity Floating Rate High Income Fund (a) | | 11,012,726 | 102,968,990 |
| Fidelity Focused High Income Fund (a) | | 100,871 | 831,173 |
| Fidelity High Income Fund (a) | | 933,092 | 7,763,323 |
| Fidelity Inflation-Protected Bond Index Fund Institutional Premium Class (a) | | 14,506,190 | 144,626,715 |
| Fidelity Long-Term Treasury Bond Index Fund Premium Class (a) | | 5,398,354 | 78,600,030 |
| Fidelity New Markets Income Fund (a) | | 1,644,372 | 25,981,074 |
| Fidelity Real Estate Income Fund (a) | | 2,014,057 | 24,108,262 |
| Fidelity U.S. Bond Index Fund Institutional Premium Class (a) | | 166,676,443 | 1,993,450,266 |
| TOTAL FIXED-INCOME FUNDS | | | |
| (Cost $2,271,259,542) | | | 2,378,329,833 |
|
| Money Market Funds - 3.8% | | | |
| Fidelity Investments Money Market Government Portfolio Institutional Class 0.30% (a)(c) | | | |
| (Cost $257,414,239) | | 257,414,239 | 257,414,239 |
| TOTAL INVESTMENT PORTFOLIO - 100.0% | | | |
| (Cost $6,057,257,364) | | | 6,819,448,011 |
| NET OTHER ASSETS (LIABILITIES) - 0.0% | | | 1,211,989 |
| NET ASSETS - 100% | | | $6,820,660,000 |
Legend
(a) Affiliated Fund
(b) Non-income producing
(c) The rate quoted is the annualized seven-day yield of the fund at period end.
Affiliated Underlying Funds
Information regarding the Fund's fiscal year to date purchases and sales of the affiliated Underlying Funds and income earned by the Fund from investments in affiliated Underlying Funds is as follows:
| Affiliate | Value, beginning of period | Purchases | Sales Proceeds | Dividend Income | Value, end of period |
| Fidelity 500 Index Fund Investor Class | $176,093 | $-- | $-- | $854 | $-- |
| Fidelity 500 Index Fund Premium Class | -- | 903 | -- | -- | 182,770 |
| Fidelity Air Transportation Portfolio | 13,725,321 | -- | 9,350,000 | -- | 3,764,749 |
| Fidelity Automotive Portfolio | 7,805,525 | -- | 6,352,292 | -- | -- |
| Fidelity Banking Portfolio | 149,055,336 | 2,165,640 | 9,340,884 | -- | 130,158,274 |
| Fidelity Blue Chip Growth Fund | 64,553,577 | 81,252 | 58,405,567 | -- | -- |
| Fidelity Blue Chip Value Fund | 37,254,283 | 6,540,691 | 8,231,283 | -- | 35,599,868 |
| Fidelity Brokerage and Investment Management Portfolio | 7,759,106 | -- | 6,572,086 | -- | -- |
| Fidelity Chemicals Portfolio | 58,369,909 | 21,856,109 | 10,281,405 | -- | 72,646,911 |
| Fidelity China Region Fund | 5,030,513 | -- | 4,412,414 | -- | -- |
| Fidelity Computers Portfolio | 26,302,858 | 24,409 | 15,966,520 | 23,792 | 9,119,555 |
| Fidelity Construction and Housing Portfolio | 61,113,323 | 6,157,722 | 1,500,000 | -- | 67,332,503 |
| Fidelity Consumer Discretionary Portfolio | 252,104,622 | 3,435,605 | 24,080,047 | 240,095 | 229,784,073 |
| Fidelity Consumer Finance Portfolio | 3,121,435 | 51,862 | 1,000,000 | 4,561 | 1,955,925 |
| Fidelity Consumer Staples Portfolio | $231,762,488 | $54,218,785 | $36,787,109 | $425,849 | $271,139,193 |
| Fidelity Contrafund | 79,144,355 | 7,432,280 | 84,619,888 | 9,882 | -- |
| Fidelity Defense and Aerospace Portfolio | 42,414,711 | 6,012,824 | -- | 104,911 | 50,359,524 |
| Fidelity Diversified International Fund | 500,256,086 | 19,480 | 240,669,576 | -- | 233,143,444 |
| Fidelity Dividend Growth Fund | 80,881 | -- | -- | -- | 81,763 |
| Fidelity Electronics Portfolio | 34,342,184 | 26,203,337 | -- | 24,957 | 60,742,876 |
| Fidelity Emerging Asia Fund | 45,751,359 | -- | 25,676,279 | -- | 20,054,009 |
| Fidelity Emerging Markets Fund | 778,337 | 382,979 | -- | -- | 1,224,691 |
| Fidelity Energy Portfolio | 128,919,047 | 12,196,511 | 4,594,953 | 142,736 | 157,284,895 |
| Fidelity Energy Service Portfolio | 13,352,567 | 2,928 | 9,100,000 | 2,928 | 5,443,668 |
| Fidelity Equity Dividend Income Fund | -- | 21,986,447 | 1,000,000 | 102,243 | 23,261,376 |
| Fidelity Europe Fund | 73,376,220 | 1,376,946 | 17,819,814 | -- | 52,342,213 |
| Fidelity Financial Services Portfolio | 248,213,518 | 1,036,032 | 38,469,161 | -- | 201,664,058 |
| Fidelity Floating Rate High Income Fund | 40,963,078 | 61,082,028 | -- | 1,093,335 | 102,968,990 |
| Fidelity Focused High Income Fund | 745,686 | 63,490 | -- | 18,149 | 831,173 |
| Fidelity Global Commodity Stock Fund | 126,363 | 8,377,734 | -- | -- | 8,694,246 |
| Fidelity Gold Portfolio | 386,492 | 9,552 | -- | -- | 742,087 |
| Fidelity Health Care Portfolio | 239,665,518 | 14,740,280 | 48,919,468 | -- | 184,033,914 |
| Fidelity Health Care Services Portfolio | 26,229,149 | 5,929,007 | -- | -- | 33,010,161 |
| Fidelity High Income Fund | 7,208,765 | 212,629 | -- | 212,629 | 7,763,323 |
| Fidelity Industrial Equipment Portfolio | 46,809,163 | 2,597,227 | -- | -- | 51,755,245 |
| Fidelity Industrials Portfolio | 155,793,541 | 41,032,505 | 22,861,676 | -- | 178,915,091 |
| Fidelity Inflation-Protected Bond Index Fund Institutional Premium Class | -- | 112,911 | 349,249 | -- | 144,626,715 |
| Fidelity Inflation-Protected Bond Index Fund Investor Class | 104,618,313 | 36,793,762 | 4,136,585 | 423 | -- |
| Fidelity Insurance Portfolio | 75,120,539 | 11,169,763 | -- | 56,878 | 87,368,325 |
| Fidelity International Capital Appreciation Fund | -- | 34,363,275 | -- | 178,444 | 35,103,148 |
| Fidelity International Discovery Fund | 130,921,373 | 12,005,878 | 30,541,945 | -- | 103,417,586 |
| Fidelity International Index Fund Institutional Class | -- | 42,890,000 | -- | -- | 130,216,655 |
| Fidelity International Index Fund Investor Class | 94,928,995 | 138,653 | 5,800,000 | 126,844 | -- |
| Fidelity International Real Estate Fund | 202,590 | -- | -- | -- | 205,016 |
| Fidelity International Small Cap Fund | 21,057,050 | 28,062,118 | -- | -- | 50,684,956 |
| Fidelity International Small Cap Opportunities Fund | 62,876,817 | 24,313,230 | -- | -- | 85,563,960 |
| Fidelity International Value Fund | 4,129,818 | -- | 3,738,558 | -- | -- |
| Fidelity Investments Money Market Government Portfolio Institutional Class 0.30% | -- | 431,479,965 | 174,065,722 | 381,019 | 257,414,239 |
| Fidelity Investments Prime Money Market Portfolio Class I 0.44% | 166,740,668 | 44,968 | 166,785,636 | -- | -- |
| Fidelity IT Services Portfolio | 46,481,797 | 5,582,400 | 18,429,159 | -- | 33,402,404 |
| Fidelity Japan Fund | 45,758,125 | -- | 30,647,289 | -- | 13,087,115 |
| Fidelity Japan Smaller Companies Fund | 43,595,638 | 13,192,590 | -- | -- | 61,178,674 |
| Fidelity Large Cap Stock Fund | 44,795,923 | 264,584 | 36,777,316 | 75,991 | 6,937,472 |
| Fidelity Leisure Portfolio | 6,364,294 | -- | 6,342,681 | -- | -- |
| Fidelity Long-Term Treasury Bond Index Fund Investor Class | 92,788,952 | 9,213,435 | 34,928,996 | 1,165,251 | -- |
| Fidelity Long-Term Treasury Bond Index Fund Premium Class | -- | 116,516 | 174,627 | 52,623 | 78,600,030 |
| Fidelity Low-Priced Stock Fund | 27,019,263 | 3,500,000 | 28,769,190 | -- | 1,109,561 |
| Fidelity Magellan Fund | 66,668 | 602 | -- | 82 | 65,701 |
| Fidelity Materials Portfolio | 7,218,422 | 13,534,549 | 6,422,566 | -- | 13,952,765 |
| Fidelity Medical Equipment and Systems Portfolio | 49,716,300 | 29,684,594 | 3,083,716 | -- | 86,854,743 |
| Fidelity Mega Cap Stock Fund | 20,272,043 | -- | 20,422,042 | -- | -- |
| Fidelity Mid Cap Value Fund | 12,066,946 | 1,443,000 | 12,828,612 | -- | -- |
| Fidelity Natural Resources Portfolio | -- | 2,208,268 | -- | 744 | 2,545,160 |
| Fidelity New Markets Income Fund | 23,453,410 | 2,173,983 | 1,600,000 | 677,140 | 25,981,074 |
| Fidelity Nordic Fund | 27,570,823 | 8,378,644 | 900,000 | -- | 34,224,372 |
| Fidelity OTC Portfolio | 12,672,706 | 10,320 | 2,729,988 | -- | 8,844,408 |
| Fidelity Overseas Fund | 340,043,852 | 51,050,628 | 10,665,217 | -- | 369,578,652 |
| Fidelity Pacific Basin Fund | 31,099,487 | -- | -- | -- | 32,765,531 |
| Fidelity Pharmaceuticals Portfolio | 65,170,232 | -- | 31,630,000 | -- | 27,451,594 |
| Fidelity Real Estate Income Fund | 22,314,496 | 334,432 | -- | 334,432 | 24,108,262 |
| Fidelity Real Estate Investment Portfolio | $30,622,375 | $10,782,955 | $1,951,991 | $189,097 | $44,324,678 |
| Fidelity Retailing Portfolio | 50,722,386 | 4,433,936 | -- | 3,857 | 55,150,834 |
| Fidelity Series Commodity Strategy Fund | 5,609 | 16,096,776 | -- | -- | 16,874,843 |
| Fidelity Small Cap Growth Fund | 247,118 | -- | -- | -- | 248,175 |
| Fidelity Small Cap Stock Fund | 16,712,482 | 431,976 | -- | -- | 17,027,409 |
| Fidelity Small Cap Value Fund | 290,157 | -- | -- | -- | 304,717 |
| Fidelity Software and IT Services Portfolio | 87,809,252 | 34,396,303 | 2,885,865 | 36,255 | 118,917,890 |
| Fidelity Stock Selector All Cap Fund | 188,234 | -- | -- | -- | 191,545 |
| Fidelity Stock Selector Large Cap Value Fund | 45,291,854 | 5,952,421 | 7,396,361 | -- | 46,295,777 |
| Fidelity Technology Portfolio | 359,374,491 | 12,102,876 | 12,433,344 | -- | 354,630,832 |
| Fidelity Telecom and Utilities Fund | -- | 13,126,284 | -- | 76,284 | 15,224,143 |
| Fidelity Telecommunications Portfolio | 80,289,885 | 49,725,753 | 3,152,584 | 250,697 | 148,042,992 |
| Fidelity U.S. Bond Index Fund Institutional Premium Class | -- | 2,923,396 | 4,540,301 | 1,326,755 | 1,993,450,266 |
| Fidelity U.S. Bond Index Fund Investor Class | 1,976,256,563 | 143,723,242 | 203,400,909 | 21,690,237 | -- |
| Fidelity Utilities Portfolio | 29,449,054 | 59,351,269 | 12,172,645 | 68,017 | 90,691,242 |
| Fidelity Value Discovery Fund | 18,519,807 | 13,810,391 | 26,415,706 | -- | 6,783,982 |
| Total | $6,877,536,216 | $1,434,147,840 | $1,592,129,222 | $29,097,991 | $6,819,448,011 |
Investment Valuation
All investments are categorized as Level 1 under the Fair Value Hierarchy. The inputs or methodology used for valuing securities may not be an indication of the risk associated with investing in those securities. For more information on valuation inputs please refer to the Investment Valuation section in the accompanying Notes to Financial Statements.
See accompanying notes which are an integral part of the financial statements.
VIP FundsManager® 60% Portfolio
Financial Statements
Statement of Assets and Liabilities
| | | June 30, 2016 (Unaudited) |
| Assets | | |
| Investment in securities, at value (cost $6,057,257,364) — See accompanying schedule | | $6,819,448,011 |
| Cash | | 5 |
| Receivable for investments sold | | 3,910,176 |
| Receivable for fund shares sold | | 12,482 |
| Dividends receivable | | 2,481,554 |
| Total assets | | 6,825,852,228 |
| Liabilities | | |
| Payable for investments purchased | $1,495,848 | |
| Payable for fund shares redeemed | 2,497,352 | |
| Accrued management fee | 1,136,278 | |
| Distribution and service plan fees payable | 62,750 | |
| Total liabilities | | 5,192,228 |
| Net Assets | | $6,820,660,000 |
| Net Assets consist of: | | |
| Paid in capital | | $6,053,218,191 |
| Undistributed net investment income | | 21,728,799 |
| Accumulated undistributed net realized gain (loss) on investments | | (16,477,637) |
| Net unrealized appreciation (depreciation) on investments | | 762,190,647 |
| Net Assets | | $6,820,660,000 |
| Service Class: | | |
| Net Asset Value, offering price and redemption price per share ($58,094 ÷ 5,331 shares) | | $10.90 |
| Service Class 2: | | |
| Net Asset Value, offering price and redemption price per share ($506,062,946 ÷ 46,573,901 shares) | | $10.87 |
| Investor Class: | | |
| Net Asset Value, offering price and redemption price per share ($6,314,538,960 ÷ 579,602,944 shares) | | $10.89 |
See accompanying notes which are an integral part of the financial statements.
Statement of Operations
| | | Six months ended June 30, 2016 (Unaudited) |
| Investment Income | | |
| Income distributions from underlying funds | | $29,097,991 |
| Expenses | | |
| Management fee | $8,369,612 | |
| Distribution and service plan fees | 607,834 | |
| Independent trustees' fees and expenses | 15,239 | |
| Total expenses before reductions | 8,992,685 | |
| Expense reductions | (1,921,588) | 7,071,097 |
| Net investment income (loss) | | 22,026,894 |
| Realized and Unrealized Gain (Loss) | | |
| Realized gain (loss) on sale of underlying fund shares | (19,821,168) | |
| Capital gain distributions from underlying funds | 8,528,280 | |
| Total net realized gain (loss) | | (11,292,888) |
| Change in net unrealized appreciation (depreciation) on underlying funds | | 119,709,047 |
| Net gain (loss) | | 108,416,159 |
| Net increase (decrease) in net assets resulting from operations | | $130,443,053 |
See accompanying notes which are an integral part of the financial statements.
Statement of Changes in Net Assets
| | Six months ended June 30, 2016 (Unaudited) | Year ended December 31, 2015 |
| Increase (Decrease) in Net Assets | | |
| Operations | | |
| Net investment income (loss) | $22,026,894 | $76,195,667 |
| Net realized gain (loss) | (11,292,888) | 242,022,818 |
| Change in net unrealized appreciation (depreciation) | 119,709,047 | (295,843,842) |
| Net increase (decrease) in net assets resulting from operations | 130,443,053 | 22,374,643 |
| Distributions to shareholders from net investment income | (619,212) | (75,874,550) |
| Distributions to shareholders from net realized gain | (215,485,991) | (467,815,616) |
| Total distributions | (216,105,203) | (543,690,166) |
| Share transactions - net increase (decrease) | 29,997,763 | 799,417,199 |
| Total increase (decrease) in net assets | (55,664,387) | 278,101,676 |
| Net Assets | | |
| Beginning of period | 6,876,324,387 | 6,598,222,711 |
| End of period | $6,820,660,000 | $6,876,324,387 |
| Other Information | | |
| Undistributed net investment income end of period | $21,728,799 | $321,117 |
See accompanying notes which are an integral part of the financial statements.
Financial Highlights — VIP FundsManager 60% Portfolio Service Class
| | Six months ended (Unaudited) June 30, | Years ended December 31, | | | | |
| | 2016 | 2015 | 2014 | 2013 | 2012 | 2011 |
| Selected Per–Share Data | | | | | | |
| Net asset value, beginning of period | $11.06 | $11.97 | $11.81 | $10.44 | $9.53 | $9.88 |
| Income from Investment Operations | | | | | | |
| Net investment income (loss)A | .04 | .13 | .15 | .13 | .15 | .18 |
| Net realized and unrealized gain (loss) | .15 | (.07) | .48 | 1.80 | .94 | (.37) |
| Total from investment operations | .19 | .06 | .63 | 1.93 | 1.09 | (.19) |
| Distributions from net investment income | –B | (.13) | (.15) | (.13) | (.15) | (.14) |
| Distributions from net realized gain | (.35) | (.84) | (.32) | (.43) | (.03) | (.02) |
| Total distributions | (.35) | (.97) | (.47) | (.56) | (.18) | (.16) |
| Net asset value, end of period | $10.90 | $11.06 | $11.97 | $11.81 | $10.44 | $9.53 |
| Total ReturnC,D,E | 2.01% | .41% | 5.40% | 18.62% | 11.48% | (1.92)% |
| Ratios to Average Net AssetsF,G | | | | | | |
| Expenses before reductions | .35%H | .35% | .35% | .35% | .35% | .35% |
| Expenses net of fee waivers, if any | .20%H | .20% | .20% | .20% | .20% | .20% |
| Expenses net of all reductions | .20%H | .20% | .20% | .20% | .20% | .20% |
| Net investment income (loss) | .67%H | 1.11% | 1.26% | 1.18% | 1.51% | 1.77% |
| Supplemental Data | | | | | | |
| Net assets, end of period (000 omitted) | $58 | $60 | $69 | $75 | $66 | $58 |
| Portfolio turnover rateF | 42%H | 30% | 36% | 21% | 19% | 9% |
A Calculated based on average shares outstanding during the period.
B Amount represents less than $.005 per share.
C Total returns for periods of less than one year are not annualized.
D Total returns do not reflect charges attributable to your insurance company's separate account. Inclusion of these charges would reduce the total returns shown.
E Total returns would have been lower if certain expenses had not been reduced during the applicable periods shown.
F Amounts do not include the activity of the Underlying Funds.
G Expense ratios reflect operating expenses of the class. Expenses before reductions do not reflect amounts reimbursed by the investment adviser or reductions from expense offset arrangements and do not represent the amount paid by the class during periods when reimbursements or reductions occur. Expenses net of fee waivers reflect expenses after reimbursement by the investment adviser but prior to reductions from expense offset arrangements. Expenses net of all reductions represent the net expenses paid by the class but do not include expenses of the underlying funds in which the Fund invests.
H Annualized
See accompanying notes which are an integral part of the financial statements.
Financial Highlights — VIP FundsManager 60% Portfolio Service Class 2
| | Six months ended (Unaudited) June 30, | Years ended December 31, | | | | |
| | 2016 | 2015 | 2014 | 2013 | 2012 | 2011 |
| Selected Per–Share Data | | | | | | |
| Net asset value, beginning of period | $11.04 | $11.95 | $11.79 | $10.43 | $9.52 | $9.88 |
| Income from Investment Operations | | | | | | |
| Net investment income (loss)A | .03 | .11 | .13 | .12 | .14 | .16 |
| Net realized and unrealized gain (loss) | .15 | (.07) | .48 | 1.78 | .94 | (.37) |
| Total from investment operations | .18 | .04 | .61 | 1.90 | 1.08 | (.21) |
| Distributions from net investment income | –B | (.11) | (.13) | (.12) | (.14) | (.13) |
| Distributions from net realized gain | (.35) | (.84) | (.32) | (.43) | (.03) | (.02) |
| Total distributions | (.35) | (.95) | (.45) | (.54)C | (.17) | (.15) |
| Net asset value, end of period | $10.87 | $11.04 | $11.95 | $11.79 | $10.43 | $9.52 |
| Total ReturnD,E,F | 1.92% | .27% | 5.26% | 18.39% | 11.35% | (2.08)% |
| Ratios to Average Net AssetsG,H | | | | | | |
| Expenses before reductions | .50%I | .50% | .50% | .50% | .50% | .50% |
| Expenses net of fee waivers, if any | .35%I | .35% | .35% | .35% | .35% | .35% |
| Expenses net of all reductions | .35%I | .35% | .35% | .35% | .35% | .35% |
| Net investment income (loss) | .52%I | .96% | 1.11% | 1.03% | 1.36% | 1.62% |
| Supplemental Data | | | | | | |
| Net assets, end of period (000 omitted) | $506,063 | $497,768 | $425,719 | $372,191 | $254,505 | $45,494 |
| Portfolio turnover rateG | 42%I | 30% | 36% | 21% | 19% | 9% |
A Calculated based on average shares outstanding during the period.
B Amount represents less than $.005 per share.
C Total distributions of $.54 per share is comprised of distributions from net investment income of $.119 and distributions from net realized gain of $.425 per share.
D Total returns for periods of less than one year are not annualized.
E Total returns do not reflect charges attributable to your insurance company's separate account. Inclusion of these charges would reduce the total returns shown.
F Total returns would have been lower if certain expenses had not been reduced during the applicable periods shown.
G Amounts do not include the activity of the Underlying Funds.
H Expense ratios reflect operating expenses of the class. Expenses before reductions do not reflect amounts reimbursed by the investment adviser or reductions from expense offset arrangements and do not represent the amount paid by the class during periods when reimbursements or reductions occur. Expenses net of fee waivers reflect expenses after reimbursement by the investment adviser but prior to reductions from expense offset arrangements. Expenses net of all reductions represent the net expenses paid by the class but do not include expenses of the underlying funds in which the Fund invests.
I Annualized
See accompanying notes which are an integral part of the financial statements.
Financial Highlights — VIP FundsManager 60% Portfolio Investor Class
| | Six months ended (Unaudited) June 30, | Years ended December 31, | | | | |
| | 2016 | 2015 | 2014 | 2013 | 2012 | 2011 |
| Selected Per–Share Data | | | | | | |
| Net asset value, beginning of period | $11.06 | $11.97 | $11.81 | $10.44 | $9.52 | $9.88 |
| Income from Investment Operations | | | | | | |
| Net investment income (loss)A | .04 | .13 | .15 | .13 | .15 | .17 |
| Net realized and unrealized gain (loss) | .14 | (.07) | .48 | 1.80 | .95 | (.37) |
| Total from investment operations | .18 | .06 | .63 | 1.93 | 1.10 | (.20) |
| Distributions from net investment income | –B | (.13) | (.15) | (.13) | (.15) | (.14) |
| Distributions from net realized gain | (.35) | (.84) | (.32) | (.43) | (.03) | (.02) |
| Total distributions | (.35) | (.97) | (.47) | (.56) | (.18) | (.16) |
| Net asset value, end of period | $10.89 | $11.06 | $11.97 | $11.81 | $10.44 | $9.52 |
| Total ReturnC,D,E | 1.92% | .41% | 5.40% | 18.62% | 11.60% | (2.02)% |
| Ratios to Average Net AssetsF,G | | | | | | |
| Expenses before reductions | .25%H | .25% | .25% | .25% | .25% | .25% |
| Expenses net of fee waivers, if any | .20%H | .20% | .20% | .20% | .20% | .20% |
| Expenses net of all reductions | .20%H | .20% | .20% | .20% | .20% | .20% |
| Net investment income (loss) | .67%H | 1.11% | 1.26% | 1.18% | 1.51% | 1.77% |
| Supplemental Data | | | | | | |
| Net assets, end of period (000 omitted) | $6,314,539 | $6,378,497 | $6,172,435 | $6,037,672 | $5,275,474 | $4,094,228 |
| Portfolio turnover rateF | 42%H | 30% | 36% | 21% | 19% | 9% |
A Calculated based on average shares outstanding during the period.
B Amount represents less than $.005 per share.
C Total returns for periods of less than one year are not annualized.
D Total returns do not reflect charges attributable to your insurance company's separate account. Inclusion of these charges would reduce the total returns shown.
E Total returns would have been lower if certain expenses had not been reduced during the applicable periods shown.
F Amounts do not include the activity of the Underlying Funds.
G Expense ratios reflect operating expenses of the class. Expenses before reductions do not reflect amounts reimbursed by the investment adviser or reductions from expense offset arrangements and do not represent the amount paid by the class during periods when reimbursements or reductions occur. Expenses net of fee waivers reflect expenses after reimbursement by the investment adviser but prior to reductions from expense offset arrangements. Expenses net of all reductions represent the net expenses paid by the class but do not include expenses of the underlying funds in which the Fund invests.
H Annualized
See accompanying notes which are an integral part of the financial statements.
VIP FundsManager® 70% Portfolio
Investment Summary (Unaudited)
The information in the following tables is based on the direct investments of the Fund.
Top Holdings as of June 30, 2016
| | % of fund's net assets | % of fund's net assets 6 months ago |
| Fidelity U.S. Bond Index Fund Institutional Premium Class | 19.6 | 18.8 |
| Fidelity Overseas Fund | 7.3 | 7.2 |
| Fidelity Technology Portfolio | 5.5 | 5.6 |
| Fidelity Consumer Staples Portfolio | 4.5 | 3.7 |
| Fidelity Investments Money Market Government Portfolio Institutional Class 0.30% | 3.3 | 2.4 |
| Fidelity Consumer Discretionary Portfolio | 3.3 | 3.7 |
| Fidelity Diversified International Fund | 3.0 | 6.7 |
| Fidelity Industrials Portfolio | 2.8 | 2.6 |
| Fidelity Health Care Portfolio | 2.7 | 3.5 |
| Fidelity Energy Portfolio | 2.6 | 2.0 |
| | 54.6 | |
Asset Allocation (% of fund's net assets)
| As of June 30, 2016 |
| | Domestic Equity Funds | 50.6% |
| | International Equity Funds | 20.8% |
| | Fixed-Income Funds | 25.3% |
| | Money Market Funds | 3.3% |

| As of December 31, 2015 |
| | Domestic Equity Funds | 50.7% |
| | International Equity Funds | 23.8% |
| | Fixed-Income Funds | 23.1% |
| | Money Market Funds | 2.4% |

VIP FundsManager® 70% Portfolio
Investments June 30, 2016 (Unaudited)
Showing Percentage of Net Assets
| Equity Funds - 71.4% | | | |
| | | Shares | Value |
| Domestic Equity Funds - 50.6% | | | |
| Fidelity 500 Index Fund Premium Class (a) | | 350 | $25,963 |
| Fidelity Air Transportation Portfolio (a) | | 7,019 | 423,202 |
| Fidelity Banking Portfolio (a) | | 1,020,550 | 24,084,980 |
| Fidelity Blue Chip Growth Fund (a) | | 76,904 | 5,012,620 |
| Fidelity Blue Chip Value Fund (a) | | 619,441 | 9,650,894 |
| Fidelity Chemicals Portfolio (a) | | 101,999 | 14,151,383 |
| Fidelity Computers Portfolio (a) | | 16,173 | 1,079,084 |
| Fidelity Construction and Housing Portfolio (a) | | 220,033 | 13,138,188 |
| Fidelity Consumer Discretionary Portfolio (a) | | 1,116,510 | 38,061,833 |
| Fidelity Consumer Staples Portfolio (a) | | 518,440 | 51,113,012 |
| Fidelity Contrafund (a) | | 57,232 | 5,553,263 |
| Fidelity Defense and Aerospace Portfolio (a) | | 78,429 | 9,346,381 |
| Fidelity Electronics Portfolio (a) | | 159,146 | 12,047,336 |
| Fidelity Energy Portfolio (a) | | 727,078 | 29,679,321 |
| Fidelity Energy Service Portfolio (a) | | 18,844 | 841,387 |
| Fidelity Equity Dividend Income Fund (a) | | 455,495 | 11,824,651 |
| Fidelity Financial Services Portfolio (a) | | 362,506 | 29,634,847 |
| Fidelity Global Commodity Stock Fund (a) | | 163,914 | 1,676,843 |
| Fidelity Gold Portfolio (a) | | 4,521 | 115,341 |
| Fidelity Health Care Portfolio (a) | | 159,197 | 30,658,239 |
| Fidelity Health Care Services Portfolio (a) | | 96,529 | 8,313,110 |
| Fidelity Industrial Equipment Portfolio (a) | | 309,197 | 11,823,692 |
| Fidelity Industrials Portfolio (a) | | 1,065,518 | 32,381,101 |
| Fidelity Insurance Portfolio (a) | | 310,601 | 21,176,756 |
| Fidelity IT Services Portfolio (a) | | 146,231 | 5,724,953 |
| Fidelity Large Cap Stock Fund (a) | | 68,111 | 1,769,522 |
| Fidelity Low-Priced Stock Fund (a) | | 34,786 | 1,666,946 |
| Fidelity Magellan Fund (a) | | 236 | 20,607 |
| Fidelity Materials Portfolio (a) | | 28,180 | 1,971,748 |
| Fidelity Medical Equipment and Systems Portfolio (a) | | 445,027 | 17,801,070 |
| Fidelity Nasdaq Composite Index Fund (a) | | 28,520 | 1,819,889 |
| Fidelity OTC Portfolio (a) | | 28,822 | 2,244,332 |
| Fidelity Pharmaceuticals Portfolio (a) | | 163,432 | 3,103,571 |
| Fidelity Real Estate Investment Portfolio (a) | | 170,418 | 7,747,181 |
| Fidelity Retailing Portfolio (a) | | 116,829 | 12,292,718 |
| Fidelity Series Commodity Strategy Fund (a)(b) | | 467,389 | 2,579,987 |
| Fidelity Small Cap Stock Fund (a) | | 258,231 | 4,454,486 |
| Fidelity Software and IT Services Portfolio (a) | | 193,376 | 23,381,073 |
| Fidelity Stock Selector Large Cap Value Fund (a) | | 811,642 | 13,960,235 |
| Fidelity Technology Portfolio (a) | | 536,253 | 62,736,190 |
| Fidelity Telecom and Utilities Fund (a) | | 97,113 | 2,544,348 |
| Fidelity Telecommunications Portfolio (a) | | 409,733 | 28,923,074 |
| Fidelity Utilities Portfolio (a) | | 221,591 | 17,230,927 |
| Fidelity Value Discovery Fund (a) | | 251,786 | 5,869,143 |
|
| TOTAL DOMESTIC EQUITY FUNDS | | | 579,655,427 |
|
| International Equity Funds - 20.8% | | | |
| Fidelity Diversified International Fund (a) | | 1,040,302 | 34,600,450 |
| Fidelity Emerging Asia Fund (a) | | 75,805 | 2,341,617 |
| Fidelity Emerging Markets Fund (a) | | 84,648 | 1,958,745 |
| Fidelity Europe Fund (a) | | 445,273 | 15,063,569 |
| Fidelity International Capital Appreciation Fund (a) | | 447,886 | 7,560,311 |
| Fidelity International Discovery Fund (a) | | 553,710 | 20,459,598 |
| Fidelity International Index Fund Institutional Class (a) | | 569,524 | 19,762,476 |
| Fidelity International Real Estate Fund (a) | | 1,644 | 16,669 |
| Fidelity International Small Cap Fund (a) | | 474,034 | 10,779,542 |
| Fidelity International Small Cap Opportunities Fund (a) | | 1,069,166 | 15,492,217 |
| Fidelity Japan Fund (a) | | 207,130 | 2,423,415 |
| Fidelity Japan Smaller Companies Fund (a) | | 823,273 | 12,167,979 |
| Fidelity Nordic Fund (a) | | 163,760 | 7,562,442 |
| Fidelity Overseas Fund (a) | | 2,117,610 | 83,687,953 |
| Fidelity Pacific Basin Fund (a) | | 176,311 | 4,889,093 |
|
| TOTAL INTERNATIONAL EQUITY FUNDS | | | 238,766,076 |
|
| TOTAL EQUITY FUNDS | | | |
| (Cost $734,218,925) | | | 818,421,503 |
|
| Fixed-Income Funds - 25.3% | | | |
| Fidelity Floating Rate High Income Fund (a) | | 1,940,438 | 18,143,097 |
| Fidelity Focused High Income Fund (a) | | 92,300 | 760,549 |
| Fidelity High Income Fund (a) | | 64,865 | 539,676 |
| Fidelity Inflation-Protected Bond Index Fund Institutional Class (a) | | 2,446,170 | 24,388,318 |
| Fidelity Long-Term Treasury Bond Index Fund Premium Class (a) | | 888,408 | 12,935,222 |
| Fidelity New Markets Income Fund (a) | | 270,188 | 4,268,972 |
| Fidelity Real Estate Income Fund (a) | | 325,717 | 3,898,833 |
| Fidelity U.S. Bond Index Fund Institutional Premium Class (a) | | 18,833,598 | 225,249,830 |
| TOTAL FIXED-INCOME FUNDS | | | |
| (Cost $273,990,294) | | | 290,184,497 |
|
| Money Market Funds - 3.3% | | | |
| Fidelity Investments Money Market Government Portfolio Institutional Class 0.30% (a)(c) | | | |
| (Cost $38,339,387) | | 38,339,387 | 38,339,387 |
| TOTAL INVESTMENT PORTFOLIO - 100.0% | | | |
| (Cost $1,046,548,606) | | | 1,146,945,387 |
| NET OTHER ASSETS (LIABILITIES) - 0.0% | | | 76,196 |
| NET ASSETS - 100% | | | $1,147,021,583 |
Legend
(a) Affiliated Fund
(b) Non-income producing
(c) The rate quoted is the annualized seven-day yield of the fund at period end.
Affiliated Underlying Funds
Information regarding the Fund's fiscal year to date purchases and sales of the affiliated Underlying Funds and income earned by the Fund from investments in affiliated Underlying Funds is as follows:
| Affiliate | Value, beginning of period | Purchases | Sales Proceeds | Dividend Income | Value, end of period |
| Fidelity 500 Index Fund Investor Class | $25,015 | $-- | $-- | $121 | $-- |
| Fidelity 500 Index Fund Premium Class | -- | 128 | -- | -- | 25,963 |
| Fidelity Air Transportation Portfolio | 1,752,055 | -- | 1,300,000 | -- | 423,202 |
| Fidelity Banking Portfolio | 30,443,354 | 1,065,607 | 4,862,244 | -- | 24,084,980 |
| Fidelity Blue Chip Growth Fund | 22,535,638 | 39,776 | 15,961,963 | -- | 5,012,620 |
| Fidelity Blue Chip Value Fund | 14,812,968 | 2,665,687 | 7,787,546 | -- | 9,650,894 |
| Fidelity Brokerage and Investment Management Portfolio | 1,069,066 | -- | 882,931 | -- | -- |
| Fidelity Chemicals Portfolio | 7,516,222 | 5,924,320 | -- | -- | 14,151,383 |
| Fidelity China Region Fund | 625,046 | -- | 551,636 | -- | -- |
| Fidelity Computers Portfolio | 4,211,545 | 3,520 | 2,904,975 | 3,433 | 1,079,084 |
| Fidelity Construction and Housing Portfolio | 12,904,758 | 2,262,504 | 2,000,000 | -- | 13,138,188 |
| Fidelity Consumer Discretionary Portfolio | 41,490,727 | 2,115,817 | 5,220,985 | 38,703 | 38,061,833 |
| Fidelity Consumer Staples Portfolio | 41,175,715 | 12,853,711 | 6,956,539 | 76,534 | 51,113,012 |
| Fidelity Contrafund | 18,148,209 | 2,070,467 | 14,256,163 | 2,161 | 5,553,263 |
| Fidelity Defense and Aerospace Portfolio | 7,241,652 | 2,218,946 | 500,000 | 19,471 | 9,346,381 |
| Fidelity Diversified International Fund | 74,489,316 | 98,805 | 35,562,177 | -- | 34,600,450 |
| Fidelity Dividend Growth Fund | 16,682 | -- | 16,946 | -- | -- |
| Fidelity Electronics Portfolio | 5,055,291 | 6,889,392 | -- | 4,209 | 12,047,336 |
| Fidelity Emerging Asia Fund | 6,362,876 | -- | 3,966,919 | -- | 2,341,617 |
| Fidelity Emerging Markets Fund | 1,503,073 | 346,357 | -- | -- | 1,958,745 |
| Fidelity Energy Portfolio | 21,952,494 | 5,301,424 | 1,100,196 | 24,138 | 29,679,321 |
| Fidelity Energy Service Portfolio | 2,443,375 | 536 | 1,800,000 | 1,522 | 841,387 |
| Fidelity Equity Dividend Income Fund | -- | 11,417,127 | -- | 18,803 | 11,824,651 |
| Fidelity Europe Fund | 23,979,545 | -- | 7,318,276 | -- | 15,063,569 |
| Fidelity Financial Services Portfolio | 36,171,417 | 1,178,619 | 6,274,025 | -- | 29,634,847 |
| Fidelity Floating Rate High Income Fund | 6,151,835 | 11,855,572 | -- | 176,863 | 18,143,097 |
| Fidelity Focused High Income Fund | 687,400 | 52,918 | -- | 16,705 | 760,549 |
| Fidelity Global Commodity Stock Fund | -- | 1,667,924 | -- | -- | 1,676,843 |
| Fidelity Gold Portfolio | 58,879 | 3,342 | -- | -- | 115,341 |
| Fidelity Health Care Portfolio | 39,143,901 | 3,131,952 | 7,979,285 | -- | 30,658,239 |
| Fidelity Health Care Services Portfolio | 7,487,609 | 663,887 | -- | -- | 8,313,110 |
| Fidelity High Income Fund | 501,125 | 14,781 | -- | 14,781 | 539,676 |
| Fidelity Industrial Equipment Portfolio | 7,308,805 | 4,026,725 | -- | -- | 11,823,692 |
| Fidelity Industrials Portfolio | 28,925,716 | 8,585,783 | 5,889,100 | -- | 32,381,101 |
| Fidelity Inflation-Protected Bond Index Fund Institutional Class | $-- | $17,403 | $29,988 | $723 | $24,388,318 |
| Fidelity Inflation-Protected Bond Index Fund Investor Class | 16,900,858 | 6,698,784 | 444,404 | 69 | -- |
| Fidelity Insurance Portfolio | 13,370,609 | 7,528,264 | -- | 41,404 | 21,176,756 |
| Fidelity International Capital Appreciation Fund | 493,228 | 7,334,362 | 458,485 | -- | 7,560,311 |
| Fidelity International Discovery Fund | 23,797,296 | 3,737,548 | 5,395,231 | -- | 20,459,598 |
| Fidelity International Index Fund Institutional Class | -- | 7,090,000 | -- | -- | 19,762,476 |
| Fidelity International Index Fund Investor Class | 13,813,833 | 25,622 | 900,000 | 17,895 | -- |
| Fidelity International Real Estate Fund | 16,472 | -- | -- | -- | 16,669 |
| Fidelity International Small Cap Fund | 5,315,824 | 5,103,414 | -- | -- | 10,779,542 |
| Fidelity International Small Cap Opportunities Fund | 10,761,880 | 4,905,287 | -- | -- | 15,492,217 |
| Fidelity Investments Money Market Government Portfolio Institutional Class 0.30% | -- | 73,389,830 | 35,050,444 | 63,110 | 38,339,387 |
| Fidelity Investments Prime Money Market Portfolio Class I 0.44% | 26,701,665 | 7,864 | 26,709,529 | 9,232 | -- |
| Fidelity IT Services Portfolio | 7,782,314 | 1,178,894 | 3,227,580 | -- | 5,724,953 |
| Fidelity Japan Fund | 9,315,436 | -- | 6,443,927 | -- | 2,423,415 |
| Fidelity Japan Smaller Companies Fund | 8,921,108 | 2,429,590 | -- | -- | 12,167,979 |
| Fidelity Large Cap Stock Fund | 6,243,589 | 29,476 | 4,388,962 | 9,647 | 1,769,522 |
| Fidelity Long-Term Treasury Bond Index Fund Investor Class | 15,935,008 | 1,251,697 | 6,179,204 | 197,010 | -- |
| Fidelity Long-Term Treasury Bond Index Fund Premium Class | -- | 18,598 | 14,994 | 8,655 | 12,935,222 |
| Fidelity Low-Priced Stock Fund | 10,499,657 | 901,694 | 9,699,433 | -- | 1,666,946 |
| Fidelity Magellan Fund | 20,911 | 189 | -- | 26 | 20,607 |
| Fidelity Materials Portfolio | 2,713,126 | 1,940,389 | 2,392,899 | -- | 1,971,748 |
| Fidelity Medical Equipment and Systems Portfolio | 11,667,533 | 4,262,515 | -- | -- | 17,801,070 |
| Fidelity Mega Cap Stock Fund | 2,976,491 | -- | 3,034,872 | -- | -- |
| Fidelity Mid Cap Value Fund | 10,343,099 | -- | 10,091,977 | -- | -- |
| Fidelity Nasdaq Composite Index Fund | 1,868,971 | 1,254 | -- | -- | 1,819,889 |
| Fidelity New Markets Income Fund | 3,909,162 | 446,804 | 399,767 | 110,318 | 4,268,972 |
| Fidelity Nordic Fund | -- | 7,452,243 | -- | -- | 7,562,442 |
| Fidelity OTC Portfolio | 431,553 | 2,329,029 | 372,675 | -- | 2,244,332 |
| Fidelity Overseas Fund | 79,650,717 | 7,756,895 | 1,005,411 | -- | 83,687,953 |
| Fidelity Pacific Basin Fund | 4,640,495 | -- | -- | -- | 4,889,093 |
| Fidelity Pharmaceuticals Portfolio | 7,221,097 | -- | 3,451,312 | -- | 3,103,571 |
| Fidelity Real Estate Income Fund | 3,608,742 | 54,085 | -- | 54,085 | 3,898,833 |
| Fidelity Real Estate Investment Portfolio | 4,981,409 | 2,085,008 | 122,776 | 32,386 | 7,747,181 |
| Fidelity Retailing Portfolio | 9,798,609 | 2,492,662 | -- | 745 | 12,292,718 |
| Fidelity Series Commodity Strategy Fund | 5,316 | 2,448,874 | -- | -- | 2,579,987 |
| Fidelity Small Cap Stock Fund | 4,337,477 | 144,191 | -- | -- | 4,454,486 |
| Fidelity Software and IT Services Portfolio | 15,506,370 | 7,939,102 | -- | 6,542 | 23,381,073 |
| Fidelity Stock Selector Large Cap Value Fund | 11,693,249 | 2,052,135 | 550,547 | -- | 13,960,235 |
| Fidelity Technology Portfolio | 62,477,056 | 3,850,238 | 2,720,548 | -- | 62,736,190 |
| Fidelity Telecom and Utilities Fund | -- | 2,179,123 | -- | 12,749 | 2,544,348 |
| Fidelity Telecommunications Portfolio | 15,023,040 | 10,077,822 | 251,145 | 47,662 | 28,923,074 |
| Fidelity U.S. Bond Index Fund Institutional Premium Class | -- | 2,027,609 | 252,855 | 149,716 | 225,249,830 |
| Fidelity U.S. Bond Index Fund Investor Class | 209,026,186 | 31,027,857 | 25,003,291 | 2,305,797 | -- |
| Fidelity Utilities Portfolio | 3,719,984 | 12,814,851 | 1,818,309 | 12,037 | 17,230,927 |
| Fidelity Value Discovery Fund | 7,308,562 | 2,799,923 | 4,527,534 | -- | 5,869,143 |
| Total | $1,108,989,241 | $314,286,752 | $288,030,005 | $3,477,252 | $1,146,945,387 |
Investment Valuation
All investments are categorized as Level 1 under the Fair Value Hierarchy. The inputs or methodology used for valuing securities may not be an indication of the risk associated with investing in those securities. For more information on valuation inputs please refer to the Investment Valuation section in the accompanying Notes to Financial Statements.
See accompanying notes which are an integral part of the financial statements.
VIP FundsManager® 70% Portfolio
Financial Statements
Statement of Assets and Liabilities
| | | June 30, 2016 (Unaudited) |
| Assets | | |
| Investment in securities, at value (cost $1,046,548,606) — See accompanying schedule | | $1,146,945,387 |
| Cash | | 1 |
| Receivable for investments sold | | 1,008,868 |
| Receivable for fund shares sold | | 142,291 |
| Dividends receivable | | 278,782 |
| Total assets | | 1,148,375,329 |
| Liabilities | | |
| Payable for investments purchased | $1,154,904 | |
| Payable for fund shares redeemed | 3,671 | |
| Accrued management fee | 190,807 | |
| Distribution and service plan fees payable | 4,364 | |
| Total liabilities | | 1,353,746 |
| Net Assets | | $1,147,021,583 |
| Net Assets consist of: | | |
| Paid in capital | | $1,057,701,586 |
| Undistributed net investment income | | 2,275,733 |
| Accumulated undistributed net realized gain (loss) on investments | | (13,352,517) |
| Net unrealized appreciation (depreciation) on investments | | 100,396,781 |
| Net Assets | | $1,147,021,583 |
| Service Class: | | |
| Net Asset Value, offering price and redemption price per share ($69,002 ÷ 5,890 shares) | | $11.72 |
| Service Class 2: | | |
| Net Asset Value, offering price and redemption price per share ($35,183,002 ÷ 3,014,497 shares) | | $11.67 |
| Investor Class: | | |
| Net Asset Value, offering price and redemption price per share ($1,111,769,579 ÷ 94,919,537 shares) | | $11.71 |
See accompanying notes which are an integral part of the financial statements.
Statement of Operations
| | | Six months ended June 30, 2016 (Unaudited) |
| Investment Income | | |
| Income distributions from underlying funds | | $3,477,252 |
| Expenses | | |
| Management fee | $1,367,960 | |
| Distribution and service plan fees | 25,475 | |
| Independent trustees' fees and expenses | 2,470 | |
| Total expenses before reductions | 1,395,905 | |
| Expense reductions | (284,800) | 1,111,105 |
| Net investment income (loss) | | 2,366,147 |
| Realized and Unrealized Gain (Loss) | | |
| Realized gain (loss) on sale of underlying fund shares | (13,934,006) | |
| Capital gain distributions from underlying funds | 1,632,639 | |
| Total net realized gain (loss) | | (12,301,367) |
| Change in net unrealized appreciation (depreciation) on underlying funds | | 25,633,403 |
| Net gain (loss) | | 13,332,036 |
| Net increase (decrease) in net assets resulting from operations | | $15,698,183 |
See accompanying notes which are an integral part of the financial statements.
Statement of Changes in Net Assets
| | Six months ended June 30, 2016 (Unaudited) | Year ended December 31, 2015 |
| Increase (Decrease) in Net Assets | | |
| Operations | | |
| Net investment income (loss) | $2,366,147 | $10,556,210 |
| Net realized gain (loss) | (12,301,367) | 47,061,761 |
| Change in net unrealized appreciation (depreciation) | 25,633,403 | (55,109,385) |
| Net increase (decrease) in net assets resulting from operations | 15,698,183 | 2,508,586 |
| Distributions to shareholders from net investment income | (183,545) | (10,502,574) |
| Distributions to shareholders from net realized gain | (42,123,810) | (24,652,156) |
| Total distributions | (42,307,355) | (35,154,730) |
| Share transactions - net increase (decrease) | 64,828,984 | 114,469,310 |
| Total increase (decrease) in net assets | 38,219,812 | 81,823,166 |
| Net Assets | | |
| Beginning of period | 1,108,801,771 | 1,026,978,605 |
| End of period | $1,147,021,583 | $1,108,801,771 |
| Other Information | | |
| Undistributed net investment income end of period | $2,275,733 | $93,131 |
See accompanying notes which are an integral part of the financial statements.
Financial Highlights — VIP FundsManager 70% Portfolio Service Class
| | Six months ended (Unaudited) June 30, | Years ended December 31, | | | | |
| | 2016 | 2015 | 2014 | 2013 | 2012 | 2011 |
| Selected Per–Share Data | | | | | | |
| Net asset value, beginning of period | $12.05 | $12.40 | $12.01 | $10.04 | $9.04 | $9.48 |
| Income from Investment Operations | | | | | | |
| Net investment income (loss)A | .02 | .12 | .15 | .13 | .15 | .15 |
| Net realized and unrealized gain (loss) | .11 | (.06) | .48 | 2.05 | 1.03 | (.41) |
| Total from investment operations | .13 | .06 | .63 | 2.18 | 1.18 | (.26) |
| Distributions from net investment income | –B | (.12) | (.14) | (.12) | (.15) | (.15) |
| Distributions from net realized gain | (.46) | (.29) | (.10) | (.09) | (.03) | (.02) |
| Total distributions | (.46) | (.41) | (.24) | (.21) | (.18) | (.18)C |
| Net asset value, end of period | $11.72 | $12.05 | $12.40 | $12.01 | $10.04 | $9.04 |
| Total ReturnD,E,F | 1.49% | .41% | 5.24% | 21.75% | 13.10% | (2.79)% |
| Ratios to Average Net AssetsG,H | | | | | | |
| Expenses before reductions | .35%I | .35% | .35% | .35% | .35% | .35% |
| Expenses net of fee waivers, if any | .20%I | .20% | .20% | .20% | .20% | .20% |
| Expenses net of all reductions | .20%I | .20% | .20% | .20% | .20% | .20% |
| Net investment income (loss) | .43%I | .97% | 1.23% | 1.19% | 1.57% | 1.60% |
| Supplemental Data | | | | | | |
| Net assets, end of period (000 omitted) | $69 | $72 | $78 | $91 | $77 | $63 |
| Portfolio turnover rateG | 52%I | 44% | 49% | 31% | 24% | 16% |
A Calculated based on average shares outstanding during the period.
B Amount represents less than $.005 per share.
C Total distributions of $.18 per share is comprised of distributions from net investment income of $.151 and distributions from net realized gain of $.024 per share.
D Total returns for periods of less than one year are not annualized.
E Total returns do not reflect charges attributable to your insurance company's separate account. Inclusion of these charges would reduce the total returns shown.
F Total returns would have been lower if certain expenses had not been reduced during the applicable periods shown.
G Amounts do not include the activity of the Underlying Funds.
H Expense ratios reflect operating expenses of the class. Expenses before reductions do not reflect amounts reimbursed by the investment adviser or reductions from expense offset arrangements and do not represent the amount paid by the class during periods when reimbursements or reductions occur. Expenses net of fee waivers reflect expenses after reimbursement by the investment adviser but prior to reductions from expense offset arrangements. Expenses net of all reductions represent the net expenses paid by the class but do not include expenses of the underlying funds in which the Fund invests.
I Annualized
See accompanying notes which are an integral part of the financial statements.
Financial Highlights — VIP FundsManager 70% Portfolio Service Class 2
| | Six months ended (Unaudited) June 30, | Years ended December 31, | | | | |
| | 2016 | 2015 | 2014 | 2013 | 2012 | 2011 |
| Selected Per–Share Data | | | | | | |
| Net asset value, beginning of period | $12.02 | $12.37 | $11.98 | $10.02 | $9.02 | $9.46 |
| Income from Investment Operations | | | | | | |
| Net investment income (loss)A | .02 | .10 | .13 | .12 | .14 | .14 |
| Net realized and unrealized gain (loss) | .09 | (.06) | .48 | 2.04 | 1.03 | (.42) |
| Total from investment operations | .11 | .04 | .61 | 2.16 | 1.17 | (.28) |
| Distributions from net investment income | –B | (.10) | (.13) | (.11) | (.14) | (.14) |
| Distributions from net realized gain | (.46) | (.29) | (.10) | (.09) | (.03) | (.02) |
| Total distributions | (.46) | (.39) | (.22)C | (.20) | (.17) | (.16) |
| Net asset value, end of period | $11.67 | $12.02 | $12.37 | $11.98 | $10.02 | $9.02 |
| Total ReturnD,E,F | 1.32% | .29% | 5.10% | 21.54% | 12.98% | (2.94)% |
| Ratios to Average Net AssetsG,H | | | | | | |
| Expenses before reductions | .50%I | .50% | .50% | .50% | .50% | .50% |
| Expenses net of fee waivers, if any | .35%I | .35% | .35% | .35% | .35% | .35% |
| Expenses net of all reductions | .35%I | .35% | .35% | .35% | .35% | .35% |
| Net investment income (loss) | .29%I | .82% | 1.08% | 1.04% | 1.42% | 1.45% |
| Supplemental Data | | | | | | |
| Net assets, end of period (000 omitted) | $35,183 | $12,028 | $7,610 | $6,752 | $5,035 | $3,675 |
| Portfolio turnover rateG | 52%I | 44% | 49% | 31% | 24% | 16% |
A Calculated based on average shares outstanding during the period.
B Amount represents less than $.005 per share.
C Total distributions of $.22 per share is comprised of distributions from net investment income of $.126 and distributions from net realized gain of $.097 per share.
D Total returns for periods of less than one year are not annualized.
E Total returns do not reflect charges attributable to your insurance company's separate account. Inclusion of these charges would reduce the total returns shown.
F Total returns would have been lower if certain expenses had not been reduced during the applicable periods shown.
G Amounts do not include the activity of the Underlying Funds.
H Expense ratios reflect operating expenses of the class. Expenses before reductions do not reflect amounts reimbursed by the investment adviser or reductions from expense offset arrangements and do not represent the amount paid by the class during periods when reimbursements or reductions occur. Expenses net of fee waivers reflect expenses after reimbursement by the investment adviser but prior to reductions from expense offset arrangements. Expenses net of all reductions represent the net expenses paid by the class but do not include expenses of the underlying funds in which the Fund invests.
I Annualized
See accompanying notes which are an integral part of the financial statements.
Financial Highlights — VIP FundsManager 70% Portfolio Investor Class
| | Six months ended (Unaudited) June 30, | Years ended December 31, | | | | |
| | 2016 | 2015 | 2014 | 2013 | 2012 | 2011 |
| Selected Per–Share Data | | | | | | |
| Net asset value, beginning of period | $12.05 | $12.39 | $12.01 | $10.04 | $9.03 | $9.48 |
| Income from Investment Operations | | | | | | |
| Net investment income (loss)A | .02 | .12 | .15 | .13 | .15 | .15 |
| Net realized and unrealized gain (loss) | .10 | (.05) | .47 | 2.05 | 1.04 | (.42) |
| Total from investment operations | .12 | .07 | .62 | 2.18 | 1.19 | (.27) |
| Distributions from net investment income | –B | (.12) | (.14) | (.12) | (.15) | (.15) |
| Distributions from net realized gain | (.46) | (.29) | (.10) | (.09) | (.03) | (.02) |
| Total distributions | (.46) | (.41) | (.24) | (.21) | (.18) | (.18)C |
| Net asset value, end of period | $11.71 | $12.05 | $12.39 | $12.01 | $10.04 | $9.03 |
| Total ReturnD,E,F | 1.40% | .49% | 5.15% | 21.75% | 13.22% | (2.90)% |
| Ratios to Average Net AssetsG,H | | | | | | |
| Expenses before reductions | .25%I | .25% | .25% | .25% | .25% | .25% |
| Expenses net of fee waivers, if any | .20%I | .20% | .20% | .20% | .20% | .20% |
| Expenses net of all reductions | .20%I | .20% | .20% | .20% | .20% | .20% |
| Net investment income (loss) | .43%I | .97% | 1.23% | 1.19% | 1.57% | 1.60% |
| Supplemental Data | | | | | | |
| Net assets, end of period (000 omitted) | $1,111,770 | $1,096,702 | $1,019,291 | $869,781 | $622,842 | $554,088 |
| Portfolio turnover rateG | 52%I | 44% | 49% | 31% | 24% | 16% |
A Calculated based on average shares outstanding during the period.
B Amount represents less than $.005 per share.
C Total distributions of $.18 per share is comprised of distributions from net investment income of $.151 and distributions from net realized gain of $.024 per share.
D Total returns for periods of less than one year are not annualized.
E Total returns do not reflect charges attributable to your insurance company's separate account. Inclusion of these charges would reduce the total returns shown.
F Total returns would have been lower if certain expenses had not been reduced during the applicable periods shown.
G Amounts do not include the activity of the Underlying Funds.
H Expense ratios reflect operating expenses of the class. Expenses before reductions do not reflect amounts reimbursed by the investment adviser or reductions from expense offset arrangements and do not represent the amount paid by the class during periods when reimbursements or reductions occur. Expenses net of fee waivers reflect expenses after reimbursement by the investment adviser but prior to reductions from expense offset arrangements. Expenses net of all reductions represent the net expenses paid by the class but do not include expenses of the underlying funds in which the Fund invests.
I Annualized
See accompanying notes which are an integral part of the financial statements.
VIP FundsManager® 85% Portfolio
Investment Summary (Unaudited)
The information in the following tables is based on the direct investments of the Fund.
Top Holdings as of June 30, 2016
| | % of fund's net assets | % of fund's net assets 6 months ago |
| Fidelity Overseas Fund | 10.2 | 9.9 |
| Fidelity Technology Portfolio | 7.8 | 7.8 |
| Fidelity U.S. Bond Index Fund Institutional Class | 6.5 | 5.0 |
| Fidelity Consumer Staples Portfolio | 5.5 | 4.7 |
| Fidelity Consumer Discretionary Portfolio | 5.0 | 5.4 |
| Fidelity Industrials Portfolio | 3.6 | 3.4 |
| Fidelity Financial Services Portfolio | 3.5 | 4.8 |
| Fidelity Health Care Portfolio | 3.2 | 4.3 |
| Fidelity Energy Portfolio | 3.2 | 2.6 |
| Fidelity Telecommunications Portfolio | 3.2 | 1.7 |
| | 51.7 | |
Asset Allocation (% of fund's net assets)
| As of June 30, 2016 |
| | Domestic Equity Funds | 61.5% |
| | International Equity Funds | 24.7% |
| | Fixed-Income Funds | 13.8% |

| As of December 31, 2015 |
| | Domestic Equity Funds | 61.6% |
| | International Equity Funds | 28.2% |
| | Fixed-Income Funds | 10.2% |

VIP FundsManager® 85% Portfolio
Investments June 30, 2016 (Unaudited)
Showing Percentage of Net Assets
| Equity Funds - 86.2% | | | |
| | | Shares | Value |
| Domestic Equity Funds - 61.5% | | | |
| Fidelity Banking Portfolio (a) | | 426,834 | $10,073,281 |
| Fidelity Blue Chip Value Fund (a) | | 64,742 | 1,008,680 |
| Fidelity Chemicals Portfolio (a) | | 48,967 | 6,793,655 |
| Fidelity Construction and Housing Portfolio (a) | | 88,989 | 5,313,549 |
| Fidelity Consumer Discretionary Portfolio (a) | | 602,663 | 20,544,777 |
| Fidelity Consumer Staples Portfolio (a) | | 229,712 | 22,647,331 |
| Fidelity Defense and Aerospace Portfolio (a) | | 30,241 | 3,603,763 |
| Fidelity Dividend Growth Fund (a) | | 289 | 8,851 |
| Fidelity Electronics Portfolio (a) | | 65,437 | 4,953,571 |
| Fidelity Energy Portfolio (a) | | 322,087 | 13,147,603 |
| Fidelity Energy Service Portfolio (a) | | 10,952 | 489,025 |
| Fidelity Equity Dividend Income Fund (a) | | 213,825 | 5,550,887 |
| Fidelity Financial Services Portfolio (a) | | 175,138 | 14,317,493 |
| Fidelity Global Commodity Stock Fund (a) | | 64,951 | 664,451 |
| Fidelity Gold Portfolio (a) | | 3,790 | 96,695 |
| Fidelity Health Care Portfolio (a) | | 68,618 | 13,214,442 |
| Fidelity Health Care Services Portfolio (a) | | 49,227 | 4,239,462 |
| Fidelity Industrial Equipment Portfolio (a) | | 160,116 | 6,122,848 |
| Fidelity Industrials Portfolio (a) | | 477,958 | 14,525,140 |
| Fidelity Insurance Portfolio (a) | | 151,624 | 10,337,749 |
| Fidelity IT Services Portfolio (a) | | 51,639 | 2,021,681 |
| Fidelity Low-Priced Stock Fund (a) | | 418 | 20,012 |
| Fidelity Magellan Fund (a) | | 163 | 14,215 |
| Fidelity Materials Portfolio (a) | | 10,211 | 714,473 |
| Fidelity Medical Equipment and Systems Portfolio (a) | | 243,985 | 9,759,408 |
| Fidelity OTC Portfolio (a) | | 5,988 | 466,248 |
| Fidelity Pharmaceuticals Portfolio (a) | | 28,643 | 543,935 |
| Fidelity Real Estate Investment Portfolio (a) | | 54,573 | 2,480,868 |
| Fidelity Retailing Portfolio (a) | | 35,723 | 3,758,776 |
| Fidelity Series Commodity Strategy Fund (a)(b) | | 165,211 | 911,966 |
| Fidelity Small Cap Stock Fund (a) | | 110,391 | 1,904,240 |
| Fidelity Software and IT Services Portfolio (a) | | 92,961 | 11,239,888 |
| Fidelity Stock Selector Large Cap Value Fund (a) | | 388,188 | 6,676,830 |
| Fidelity Technology Portfolio (a) | | 271,723 | 31,788,915 |
| Fidelity Telecom and Utilities Fund (a) | | 8,712 | 228,256 |
| Fidelity Telecommunications Portfolio (a) | | 182,549 | 12,886,165 |
| Fidelity Utilities Portfolio (a) | | 100,855 | 7,842,518 |
| Fidelity Value Discovery Fund (a) | | 8,117 | 189,211 |
|
| TOTAL DOMESTIC EQUITY FUNDS | | | 251,100,858 |
|
| International Equity Funds - 24.7% | | | |
| Fidelity Diversified International Fund (a) | | 327,491 | 10,892,339 |
| Fidelity Emerging Asia Fund (a) | | 42,538 | 1,313,991 |
| Fidelity Emerging Markets Fund (a) | | 47,574 | 1,100,857 |
| Fidelity Europe Fund (a) | | 165,316 | 5,592,648 |
| Fidelity International Capital Appreciation Fund (a) | | 215,454 | 3,636,871 |
| Fidelity International Discovery Fund (a) | | 284,888 | 10,526,629 |
| Fidelity International Index Fund Premium Class (a) | | 117,349 | 4,072,018 |
| Fidelity International Real Estate Fund (a) | | 1,498 | 15,191 |
| Fidelity International Small Cap Fund (a) | | 225,301 | 5,123,334 |
| Fidelity International Small Cap Opportunities Fund (a) | | 464,050 | 6,724,090 |
| Fidelity Japan Fund (a) | | 51,380 | 601,142 |
| Fidelity Japan Smaller Companies Fund (a) | | 400,457 | 5,918,761 |
| Fidelity Nordic Fund (a) | | 68,258 | 3,152,145 |
| Fidelity Overseas Fund (a) | | 1,049,697 | 41,484,019 |
| Fidelity Pacific Basin Fund (a) | | 29,698 | 823,536 |
|
| TOTAL INTERNATIONAL EQUITY FUNDS | | | 100,977,571 |
|
| TOTAL EQUITY FUNDS | | | |
| (Cost $320,503,623) | | | 352,078,429 |
|
| Fixed-Income Funds - 13.8% | | | |
| Fidelity Floating Rate High Income Fund (a) | | 882,817 | 8,254,341 |
| Fidelity Focused High Income Fund (a) | | 12,317 | 101,493 |
| Fidelity High Income Fund (a) | | 21,656 | 180,179 |
| Fidelity Inflation-Protected Bond Index Fund Institutional Class (a) | | 869,736 | 8,671,272 |
| Fidelity Long-Term Treasury Bond Index Fund Premium Class (a) | | 613,093 | 8,926,638 |
| Fidelity New Markets Income Fund (a) | | 118,036 | 1,864,973 |
| Fidelity Real Estate Income Fund (a) | | 136,505 | 1,633,969 |
| Fidelity U.S. Bond Index Fund Institutional Class (a) | | 2,226,641 | 26,630,626 |
| TOTAL FIXED-INCOME FUNDS | | | |
| (Cost $53,329,407) | | | 56,263,491 |
|
| Money Market Funds - 0.0% | | | |
| Fidelity Investments Money Market Government Portfolio Institutional Class 0.30% (a)(c) | | | |
| (Cost $6,300) | | 6,300 | 6,300 |
| TOTAL INVESTMENT PORTFOLIO - 100.0% | | | |
| (Cost $373,839,330) | | | 408,348,220 |
| NET OTHER ASSETS (LIABILITIES) - 0.0% | | | (33,130) |
| NET ASSETS - 100% | | | $408,315,090 |
Legend
(a) Affiliated Fund
(b) Non-income producing
(c) The rate quoted is the annualized seven-day yield of the fund at period end.
Affiliated Underlying Funds
Information regarding the Fund's fiscal year to date purchases and sales of the affiliated Underlying Funds and income earned by the Fund from investments in affiliated Underlying Funds is as follows:
| Affiliate | Value, beginning of period | Purchases | Sales Proceeds | Dividend Income | Value, end of period |
| Fidelity Air Transportation Portfolio | $449,765 | $-- | $453,953 | $-- | $-- |
| Fidelity Banking Portfolio | 12,776,813 | 1,285,086 | 2,815,601 | -- | 10,073,281 |
| Fidelity Blue Chip Growth Fund | 4,139,959 | 43,071 | 3,828,294 | -- | -- |
| Fidelity Blue Chip Value Fund | 5,393,876 | 638,490 | 5,104,711 | -- | 1,008,680 |
| Fidelity Brokerage and Investment Management Portfolio | 229,318 | -- | 194,545 | -- | -- |
| Fidelity Chemicals Portfolio | 3,545,242 | 3,298,147 | 441,345 | -- | 6,793,655 |
| Fidelity China Region Fund | 760,714 | -- | 667,209 | -- | -- |
| Fidelity Computers Portfolio | 1,534,138 | 1,370 | 1,453,644 | 1,336 | -- |
| Fidelity Construction and Housing Portfolio | 4,797,593 | 804,805 | 378,288 | -- | 5,313,549 |
| Fidelity Consumer Discretionary Portfolio | 22,042,447 | 916,997 | 2,293,660 | 21,590 | 20,544,777 |
| Fidelity Consumer Staples Portfolio | 19,418,724 | 5,724,108 | 4,301,490 | 34,828 | 22,647,331 |
| Fidelity Contrafund | 7,948,208 | 1,819,226 | 9,373,742 | 921 | -- |
| Fidelity Defense and Aerospace Portfolio | 4,132,524 | 52,184 | 700,000 | 7,507 | 3,603,763 |
| Fidelity Diversified International Fund | 32,797,891 | 207,481 | 20,028,676 | -- | 10,892,339 |
| Fidelity Dividend Growth Fund | 8,755 | -- | -- | -- | 8,851 |
| Fidelity Electronics Portfolio | 1,870,180 | 3,049,887 | -- | 1,650 | 4,953,571 |
| Fidelity Emerging Asia Fund | 2,833,826 | -- | 1,538,319 | -- | 1,313,991 |
| Fidelity Emerging Markets Fund | 257,020 | 784,822 | -- | -- | 1,100,857 |
| Fidelity Energy Portfolio | 10,815,474 | 1,441,491 | 836,189 | 11,930 | 13,147,603 |
| Fidelity Energy Service Portfolio | 865,797 | 99 | 380,287 | 99 | 489,025 |
| Fidelity Equity Dividend Income Fund | -- | 5,144,465 | -- | 25,494 | 5,550,887 |
| Fidelity Europe Fund | 10,091,642 | -- | 3,763,991 | -- | 5,592,648 |
| Fidelity Financial Services Portfolio | 19,445,527 | 670,895 | 4,925,564 | -- | 14,317,493 |
| Fidelity Floating Rate High Income Fund | 7,814 | 8,250,984 | -- | 41,348 | 8,254,341 |
| Fidelity Focused High Income Fund | 86,370 | 12,559 | -- | 2,129 | 101,493 |
| Fidelity Global Commodity Stock Fund | 16,779 | 640,655 | -- | -- | 664,451 |
| Fidelity Gold Portfolio | 49,305 | 2,887 | -- | -- | 96,695 |
| Fidelity Growth Company Fund | 35,734 | 93 | 33,185 | -- | -- |
| Fidelity Health Care Portfolio | 17,551,447 | 1,534,652 | 4,248,057 | -- | 13,214,442 |
| Fidelity Health Care Services Portfolio | 3,800,272 | 355,275 | -- | -- | 4,239,462 |
| Fidelity High Income Fund | 167,309 | 4,935 | -- | 4,935 | 180,179 |
| Fidelity Industrial Equipment Portfolio | 2,999,410 | 2,867,439 | -- | -- | 6,122,848 |
| Fidelity Industrials Portfolio | 14,005,735 | 2,920,823 | 2,746,723 | -- | 14,525,140 |
| Fidelity Inflation-Protected Bond Index Fund Institutional Class | -- | 14,958 | 962,788 | 282 | 8,671,272 |
| Fidelity Inflation-Protected Bond Index Fund Investor Class | 8,642,595 | 916,592 | 478,342 | 33 | -- |
| Fidelity Insurance Portfolio | 6,588,736 | 3,576,000 | -- | 20,155 | 10,337,749 |
| Fidelity International Capital Appreciation Fund | -- | 3,530,468 | -- | -- | 3,636,871 |
| Fidelity International Discovery Fund | 9,802,990 | 2,954,433 | 1,535,629 | -- | 10,526,629 |
| Fidelity International Index Fund Investor Class | 1,908,175 | -- | 240,000 | 2,300 | -- |
| Fidelity International Index Fund Premium Class | -- | 2,397,416 | -- | -- | 4,072,018 |
| Fidelity International Real Estate Fund | 15,012 | -- | -- | -- | 15,191 |
| Fidelity International Small Cap Fund | 2,049,941 | 2,805,527 | -- | -- | 5,123,334 |
| Fidelity International Small Cap Opportunities Fund | 4,852,571 | 1,903,980 | -- | -- | 6,724,090 |
| Fidelity Investments Money Market Government Portfolio Institutional Class 0.30% | -- | 19,841,269 | 19,834,969 | 9,681 | 6,300 |
| Fidelity Investments Prime Money Market Portfolio Class I 0.44% | 24,355 | 7 | 24,362 | 9 | -- |
| Fidelity IT Services Portfolio | 2,968,370 | 555,098 | 1,516,320 | -- | 2,021,681 |
| Fidelity Japan Fund | 4,487,992 | -- | 3,601,338 | -- | 601,142 |
| Fidelity Japan Smaller Companies Fund | 4,089,540 | 1,419,090 | -- | -- | 5,918,761 |
| Fidelity Large Cap Stock Fund | $1,817,995 | $-- | $1,790,621 | $-- | $-- |
| Fidelity Leisure Portfolio | 137,510 | -- | 138,573 | -- | -- |
| Fidelity Long-Term Treasury Bond Index Fund Investor Class | 9,042,749 | 475,541 | 3,344,001 | 119,244 | -- |
| Fidelity Long-Term Treasury Bond Index Fund Premium Class | -- | 1,628,642 | 42,497 | 5,699 | 8,926,638 |
| Fidelity Low-Priced Stock Fund | 2,686,768 | 1,087,326 | 3,727,761 | -- | 20,012 |
| Fidelity Magellan Fund | 14,424 | 130 | -- | 17 | 14,215 |
| Fidelity Materials Portfolio | 1,744,807 | 709,875 | 1,567,081 | -- | 714,473 |
| Fidelity Medical Equipment and Systems Portfolio | 5,011,560 | 3,654,687 | -- | -- | 9,759,408 |
| Fidelity Mega Cap Stock Fund | 421,394 | -- | 421,164 | -- | -- |
| Fidelity Mid Cap Value Fund | 3,746,332 | -- | 3,623,505 | -- | -- |
| Fidelity Nasdaq Composite Index Fund | 61,944 | 42 | 58,663 | -- | -- |
| Fidelity New Markets Income Fund | 2,018,742 | 111,815 | 400,000 | 50,680 | 1,864,973 |
| Fidelity Nordic Fund | -- | 3,106,795 | -- | -- | 3,152,145 |
| Fidelity OTC Portfolio | 641,427 | 6,886 | 134,930 | -- | 466,248 |
| Fidelity Overseas Fund | 40,619,533 | 4,215,502 | 1,971,433 | -- | 41,484,019 |
| Fidelity Pacific Basin Fund | 781,661 | -- | -- | -- | 823,536 |
| Fidelity Pharmaceuticals Portfolio | 5,060,594 | -- | 4,001,260 | -- | 543,935 |
| Fidelity Real Estate Income Fund | 1,512,394 | 22,667 | -- | 22,667 | 1,633,969 |
| Fidelity Real Estate Investment Portfolio | 1,633,071 | 799,253 | 213,995 | 10,591 | 2,480,868 |
| Fidelity Retailing Portfolio | 3,228,576 | 704,592 | 150,000 | 232 | 3,758,776 |
| Fidelity Series Commodity Strategy Fund | 5,316 | 861,509 | -- | -- | 911,966 |
| Fidelity Small Cap Stock Fund | 1,907,435 | 65,662 | 58,532 | -- | 1,904,240 |
| Fidelity Software and IT Services Portfolio | 7,990,086 | 3,359,183 | 53,065 | 3,266 | 11,239,888 |
| Fidelity Stock Selector Large Cap Value Fund | 6,806,289 | 2,616,512 | 3,187,527 | -- | 6,676,830 |
| Fidelity Technology Portfolio | 32,051,942 | 1,739,815 | 1,647,460 | -- | 31,788,915 |
| Fidelity Telecom and Utilities Fund | -- | 194,277 | -- | 1,144 | 228,256 |
| Fidelity Telecommunications Portfolio | 6,734,945 | 4,977,282 | 668,027 | 21,494 | 12,886,165 |
| Fidelity U.S. Bond Index Fund Institutional Class | -- | 1,497,406 | 85,570 | 17,531 | 26,630,626 |
| Fidelity U.S. Bond Index Fund Investor Class | 20,232,915 | 13,120,257 | 8,970,911 | 230,943 | -- |
| Fidelity Utilities Portfolio | 2,043,648 | 5,922,441 | 1,290,575 | 5,737 | 7,842,518 |
| Fidelity Value Discovery Fund | 1,231,582 | 516,261 | 1,627,165 | -- | 189,211 |
| Total | $409,491,524 | $133,782,122 | $137,875,537 | $675,472 | $408,348,220 |
Investment Valuation
All investments are categorized as Level 1 under the Fair Value Hierarchy. The inputs or methodology used for valuing securities may not be an indication of the risk associated with investing in those securities. For more information on valuation inputs please refer to the Investment Valuation section in the accompanying Notes to Financial Statements.
See accompanying notes which are an integral part of the financial statements.
VIP FundsManager® 85% Portfolio
Financial Statements
Statement of Assets and Liabilities
| | | June 30, 2016 (Unaudited) |
| Assets | | |
| Investment in securities, at value (cost $373,839,330) — See accompanying schedule | | $408,348,220 |
| Cash | | 7 |
| Receivable for investments sold | | 154,142 |
| Receivable for fund shares sold | | 2,297 |
| Dividends receivable | | 38,505 |
| Total assets | | 408,543,171 |
| Liabilities | | |
| Payable for investments purchased | $43,424 | |
| Payable for fund shares redeemed | 113,874 | |
| Accrued management fee | 68,139 | |
| Distribution and service plan fees payable | 2,644 | |
| Total liabilities | | 228,081 |
| Net Assets | | $408,315,090 |
| Net Assets consist of: | | |
| Paid in capital | | $379,885,009 |
| Undistributed net investment income | | 269,232 |
| Accumulated undistributed net realized gain (loss) on investments | | (6,348,041) |
| Net unrealized appreciation (depreciation) on investments | | 34,508,890 |
| Net Assets | | $408,315,090 |
| Service Class: | | |
| Net Asset Value, offering price and redemption price per share ($7,970 ÷ 697 shares) | | $11.43 |
| Service Class 2: | | |
| Net Asset Value, offering price and redemption price per share ($21,321,315 ÷ 1,873,476 shares) | | $11.38 |
| Investor Class: | | |
| Net Asset Value, offering price and redemption price per share ($386,985,805 ÷ 33,831,863 shares) | | $11.44 |
See accompanying notes which are an integral part of the financial statements.
Statement of Operations
| | | Six months ended June 30, 2016 (Unaudited) |
| Investment Income | | |
| Income distributions from underlying funds | | $675,472 |
| Expenses | | |
| Management fee | $493,906 | |
| Distribution and service plan fees | 17,649 | |
| Independent trustees' fees and expenses | 893 | |
| Total expenses before reductions | 512,448 | |
| Expense reductions | (106,208) | 406,240 |
| Net investment income (loss) | | 269,232 |
| Realized and Unrealized Gain (Loss) | | |
| Realized gain (loss) on sale of underlying fund shares | (6,573,403) | |
| Capital gain distributions from underlying funds | 745,489 | |
| Total net realized gain (loss) | | (5,827,914) |
| Change in net unrealized appreciation (depreciation) on underlying funds | | 9,523,504 |
| Net gain (loss) | | 3,695,590 |
| Net increase (decrease) in net assets resulting from operations | | $3,964,822 |
See accompanying notes which are an integral part of the financial statements.
Statement of Changes in Net Assets
| | Six months ended June 30, 2016 (Unaudited) | Year ended December 31, 2015 |
| Increase (Decrease) in Net Assets | | |
| Operations | | |
| Net investment income (loss) | $269,232 | $2,982,675 |
| Net realized gain (loss) | (5,827,914) | 20,491,617 |
| Change in net unrealized appreciation (depreciation) | 9,523,504 | (22,430,265) |
| Net increase (decrease) in net assets resulting from operations | 3,964,822 | 1,044,027 |
| Distributions to shareholders from net investment income | – | (5,527,890) |
| Distributions to shareholders from net realized gain | (17,172,166) | (15,161,464) |
| Total distributions | (17,172,166) | (20,689,354) |
| Share transactions - net increase (decrease) | 12,100,365 | 43,925,167 |
| Total increase (decrease) in net assets | (1,106,979) | 24,279,840 |
| Net Assets | | |
| Beginning of period | 409,422,069 | 385,142,229 |
| End of period | $408,315,090 | $409,422,069 |
| Other Information | | |
| Undistributed net investment income end of period | $269,232 | $– |
See accompanying notes which are an integral part of the financial statements.
Financial Highlights — VIP FundsManager 85% Portfolio Service Class
| | Six months ended (Unaudited) June 30, | Years ended December 31, | | | | |
| | 2016 | 2015 | 2014 | 2013 | 2012 | 2011 |
| Selected Per–Share Data | | | | | | |
| Net asset value, beginning of period | $11.87 | $12.46 | $12.07 | $9.62 | $8.57 | $9.19 |
| Income from Investment Operations | | | | | | |
| Net investment income (loss)A | .01 | .09 | .13 | .11 | .12 | .11 |
| Net realized and unrealized gain (loss) | .05 | (.03) | .51 | 2.57 | 1.09 | (.60) |
| Total from investment operations | .06 | .06 | .64 | 2.68 | 1.21 | (.49) |
| Distributions from net investment income | – | (.16)B | (.13) | (.10) | (.13) | (.11) |
| Distributions from net realized gain | (.50) | (.49)B | (.13) | (.13) | (.03) | (.02) |
| Total distributions | (.50) | (.65) | (.25)C | (.23) | (.16) | (.13) |
| Net asset value, end of period | $11.43 | $11.87 | $12.46 | $12.07 | $9.62 | $8.57 |
| Total ReturnD,E,F | 1.02% | .39% | 5.29% | 27.86% | 14.13% | (5.30)% |
| Ratios to Average Net AssetsG,H | | | | | | |
| Expenses before reductions | .35%I | .35% | .35% | .35% | .35% | .35% |
| Expenses net of fee waivers, if any | .20%I | .20% | .20% | .20% | .20% | .20% |
| Expenses net of all reductions | .20%I | .20% | .20% | .20% | .20% | .20% |
| Net investment income (loss) | .14%I | .74% | 1.04% | 1.00% | 1.25% | 1.23% |
| Supplemental Data | | | | | | |
| Net assets, end of period (000 omitted) | $8 | $8 | $8 | $242 | $149 | $183 |
| Portfolio turnover rateG | 67%I | 67% | 72% | 51% | 50% | 26% |
A Calculated based on average shares outstanding during the period.
B The amounts shown reflect certain reclassifications related to book to tax differences that were made in the year shown.
C Total distributions of $.25 per share is comprised of distributions from net investment income of $.125 and distributions from net realized gain of $.126 per share.
D Total returns for periods of less than one year are not annualized.
E Total returns do not reflect charges attributable to your insurance company's separate account. Inclusion of these charges would reduce the total returns shown.
F Total returns would have been lower if certain expenses had not been reduced during the applicable periods shown.
G Amounts do not include the activity of the Underlying Funds.
H Expense ratios reflect operating expenses of the class. Expenses before reductions do not reflect amounts reimbursed by the investment adviser or reductions from expense offset arrangements and do not represent the amount paid by the class during periods when reimbursements or reductions occur. Expenses net of fee waivers reflect expenses after reimbursement by the investment adviser but prior to reductions from expense offset arrangements. Expenses net of all reductions represent the net expenses paid by the class but do not include expenses of the underlying funds in which the Fund invests.
I Annualized
See accompanying notes which are an integral part of the financial statements.
Financial Highlights — VIP FundsManager 85% Portfolio Service Class 2
| | Six months ended (Unaudited) June 30, | Years ended December 31, | | | | |
| June 30, | 2016 | 2015 | 2014 | 2013 | 2012 | 2011 |
| Selected Per–Share Data | | | | | | |
| Net asset value, beginning of period | $11.83 | $12.41 | $12.03 | $9.60 | $8.55 | $9.17 |
| Income from Investment Operations | | | | | | |
| Net investment income (loss)A | –B | .07 | .11 | .09 | .10 | .10 |
| Net realized and unrealized gain (loss) | .05 | (.01) | .50 | 2.55 | 1.10 | (.60) |
| Total from investment operations | .05 | .06 | .61 | 2.64 | 1.20 | (.50) |
| Distributions from net investment income | – | (.15)C | (.11) | (.09) | (.11) | (.10) |
| Distributions from net realized gain | (.50) | (.49)C | (.13) | (.13) | (.03) | (.02) |
| Total distributions | (.50) | (.64) | (.23)D | (.21)E | (.15)F | (.12) |
| Net asset value, end of period | $11.38 | $11.83 | $12.41 | $12.03 | $9.60 | $8.55 |
| Total ReturnG,H,I | .93% | .35% | 5.08% | 27.54% | 14.01% | (5.44)% |
| Ratios to Average Net AssetsJ,K | | | | | | |
| Expenses before reductions | .50%L | .50% | .50% | .50% | .50% | .50% |
| Expenses net of fee waivers, if any | .35%L | .35% | .35% | .35% | .35% | .35% |
| Expenses net of all reductions | .35%L | .35% | .35% | .35% | .35% | .35% |
| Net investment income (loss) | (.01)%L | .59% | .89% | .85% | 1.10% | 1.08% |
| Supplemental Data | | | | | | |
| Net assets, end of period (000 omitted) | $21,321 | $10,346 | $8,207 | $6,862 | $4,812 | $3,574 |
| Portfolio turnover rateJ | 67%L | 67% | 72% | 51% | 50% | 26% |
A Calculated based on average shares outstanding during the period.
B Amount represents less than .005%.
C The amounts shown reflect certain reclassifications related to book to tax differences that were made in the year shown.
D Total distributions of $.23 per share is comprised of distributions from net investment income of $.107 and distributions from net realized gain of $.126 per share.
E Total distributions of $.21 per share is comprised of distributions from net investment income of $.085 and distributions from net realized gain of $.128 per share.
F Total distributions of $.15 per share is comprised of distributions from net investment income of $.113 and distributions from net realized gain of $.033 per share.
G Total returns for periods of less than one year are not annualized.
H Total returns do not reflect charges attributable to your insurance company's separate account. Inclusion of these charges would reduce the total returns shown.
I Total returns would have been lower if certain expenses had not been reduced during the applicable periods shown.
J Amounts do not include the activity of the Underlying Funds.
K Expense ratios reflect operating expenses of the class. Expenses before reductions do not reflect amounts reimbursed by the investment adviser or reductions from expense offset arrangements and do not represent the amount paid by the class during periods when reimbursements or reductions occur. Expenses net of fee waivers reflect expenses after reimbursement by the investment adviser but prior to reductions from expense offset arrangements. Expenses net of all reductions represent the net expenses paid by the class but do not include expenses of the underlying funds in which the Fund invests.
L Annualized
See accompanying notes which are an integral part of the financial statements.
Financial Highlights — VIP FundsManager 85% Portfolio Investor Class
| | Six months ended (Unaudited) June 30, | Years ended December 31, | | | | |
| | 2016 | 2015 | 2014 | 2013 | 2012 | 2011 |
| Selected Per–Share Data | | | | | | |
| Net asset value, beginning of period | $11.87 | $12.46 | $12.07 | $9.63 | $8.58 | $9.20 |
| Income from Investment Operations | | | | | | |
| Net investment income (loss)A | .01 | .09 | .13 | .11 | .12 | .11 |
| Net realized and unrealized gain (loss) | .06 | (.03) | .51 | 2.56 | 1.09 | (.60) |
| Total from investment operations | .07 | .06 | .64 | 2.67 | 1.21 | (.49) |
| Distributions from net investment income | – | (.16)B | (.13) | (.10) | (.13) | (.11) |
| Distributions from net realized gain | (.50) | (.49)B | (.13) | (.13) | (.03) | (.02) |
| Total distributions | (.50) | (.65) | (.25)C | (.23) | (.16) | (.13) |
| Net asset value, end of period | $11.44 | $11.87 | $12.46 | $12.07 | $9.63 | $8.58 |
| Total ReturnD,E,F | 1.10% | .39% | 5.29% | 27.73% | 14.11% | (5.29)% |
| Ratios to Average Net AssetsG,H | | | | | | |
| Expenses before reductions | .25%I | .25% | .25% | .25% | .25% | .25% |
| Expenses net of fee waivers, if any | .20%I | .20% | .20% | .20% | .20% | .20% |
| Expenses net of all reductions | .20%I | .20% | .20% | .20% | .20% | .20% |
| Net investment income (loss) | .14%I | .74% | 1.04% | 1.00% | 1.25% | 1.23% |
| Supplemental Data | | | | | | |
| Net assets, end of period (000 omitted) | $386,986 | $399,068 | $376,927 | $325,256 | $226,548 | $231,895 |
| Portfolio turnover rateG | 67%I | 67% | 72% | 51% | 50% | 26% |
A Calculated based on average shares outstanding during the period.
B The amounts shown reflect certain reclassifications related to book to tax differences that were made in the year shown.
C Total distributions of $.25 per share is comprised of distributions from net investment income of $.125 and distributions from net realized gain of $.126 per share.
D Total returns for periods of less than one year are not annualized.
E Total returns do not reflect charges attributable to your insurance company's separate account. Inclusion of these charges would reduce the total returns shown.
F Total returns would have been lower if certain expenses had not been reduced during the applicable periods shown.
G Amounts do not include the activity of the Underlying Funds.
H Expense ratios reflect operating expenses of the class. Expenses before reductions do not reflect amounts reimbursed by the investment adviser or reductions from expense offset arrangements and do not represent the amount paid by the class during periods when reimbursements or reductions occur. Expenses net of fee waivers reflect expenses after reimbursement by the investment adviser but prior to reductions from expense offset arrangements. Expenses net of all reductions represent the net expenses paid by the class but do not include expenses of the underlying funds in which the Fund invests.
I Annualized
See accompanying notes which are an integral part of the financial statements.
Notes to Financial Statements (Unaudited)
For the period ended June 30, 2016
1. Organization.
VIP FundsManager 20% Portfolio, VIP FundsManager 50% Portfolio, VIP FundsManager 60% Portfolio, VIP FundsManager 70% Portfolio, and VIP FundsManager 85% Portfolio (the Funds) are funds of Variable Insurance Products Fund V (the Trust). The Trust is registered under the Investment Company Act of 1940, as amended (the 1940 Act), as an open-end management investment company organized as a Massachusetts business trust. Each Fund is authorized to issue an unlimited number of shares. The Funds invest primarily in a combination of other Fidelity equity, fixed income, and short-term funds (the Underlying Funds) managed by Fidelity Management & Research Company (FMR). Shares of each Fund may only be purchased by insurance companies for the purpose of funding variable annuity or variable life insurance contracts. Each Fund offers three classes of shares: Service Class shares, Service Class 2 shares, and Investor Class shares. All classes have equal rights and voting privileges, except for matters affecting a single class.
During the period, certain Underlying Funds incurred name changes. These changes may involve one or more of the following, as applicable: replacing "Spartan" with "Fidelity," renaming the "Fidelity Advantage Institutional Class" to the "Institutional Premium Class," renaming the "Fidelity Advantage Class" to the "Premium Class," or renaming "Fidelity Institutional Money Market" to "Fidelity Investments Money Market." The names of the Underlying Funds are those in effect at period end.
2. Significant Accounting Policies.
The financial statements have been prepared in conformity with accounting principles generally accepted in the United States of America (GAAP), which require management to make certain estimates and assumptions at the date of the financial statements. Actual results could differ from those estimates. Subsequent events, if any, through the date that the financial statements were issued have been evaluated in the preparation of the financial statements. The following summarizes the significant accounting policies of the Funds:
Investment Valuation. Investments are valued as of 4:00 p.m. Eastern time on the last calendar day of the period. Each Fund categorizes the inputs to valuation techniques used to value its investments into a disclosure hierarchy consisting of three levels as shown below:
- Level 1 – quoted prices in active markets for identical investments
- Level 2 – other significant observable inputs (including quoted prices for similar investments, interest rates, prepayment speeds, etc.)
- Level 3 – unobservable inputs (including the Fund's own assumptions based on the best information available)
Valuation techniques used to value each Fund's investments by major category are as follows. Investments in the Underlying Funds are valued at their closing net asset value (NAV) each business day and are categorized as Level 1 in the hierarchy.
Investment Transactions and Income. For financial reporting purposes, the Funds' investment holdings and NAV include trades executed through the end of the last business day of the period. The NAV per share for processing shareholder transactions is calculated as of the close of business of the New York Stock Exchange (NYSE), normally 4:00 p.m. Eastern time and includes trades executed through the end of the prior business day. Gains and losses on securities sold are determined on the basis of identified cost. Income and capital gain distributions from the Underlying Funds, if any, are recorded on the ex-dividend date.
Class Allocations and Expenses. Investment income, realized and unrealized capital gains and losses, common expenses of each Fund, and certain fund-level expense reductions, if any, are allocated daily on a pro-rata basis to each class based on the relative net assets of each class to the total net assets of each Fund. Each class differs with respect to distribution and service plan fees incurred. Certain expense reductions may also differ by class. For the reporting period, the allocated portion of income and expenses to each class as a percent of its average net assets may vary due to the timing of recording these transactions in relation to fluctuating net assets of the classes. Expenses directly attributable to a fund are charged to that fund. Expenses attributable to more than one fund are allocated among the respective funds on the basis of relative net assets or other appropriate methods. Expenses included in the accompanying financial statements reflect the expenses of each Fund and do not include any expenses associated with the Underlying Funds. Although not included in each Fund's expenses, each Fund indirectly bears its proportionate share of the Underlying Funds' expenses through the impact of these expenses on each Underlying Fund's NAV. Expense estimates are accrued in the period to which they relate and adjustments are made when actual amounts are known.
Income Tax Information and Distributions to Shareholders. Each year, each Fund intends to qualify as a regulated investment company under Subchapter M of the Internal Revenue Code, including distributing substantially all of its taxable income and realized gains. As a result, no provision for U.S. Federal income taxes is required. Each Fund files a U.S. federal tax return, in addition to state and local tax returns as required. Each Fund's federal income tax returns are subject to examination by the Internal Revenue Service (IRS) for a period of three fiscal years after they are filed. State and local tax returns may be subject to examination for an additional fiscal year depending on the jurisdiction.
Distributions are declared and recorded on the ex-dividend date. Income dividends and capital gain distributions are declared separately for each class. Income and capital gain distributions are determined in accordance with income tax regulations, which may differ from GAAP.
Capital accounts within the financial statements are adjusted for permanent book-tax differences. These adjustments have no impact on net assets or the results of operations. Capital accounts are not adjusted for temporary book-tax differences which will reverse in a subsequent period.
Book-tax differences are primarily due to the short-term gain distributions from the Underlying Funds, capital loss carryforwards and losses deferred due to wash sales.
The federal tax cost of investment securities and unrealized appreciation (depreciation) as of period end were as follows for each Fund:
| | Tax cost | Gross unrealized appreciation | Gross unrealized depreciation | Net unrealized appreciation (depreciation) on securities |
| VIP FundsManager 20% Portfolio | $709,303,331 | $40,329,144 | $(3,251,035) | $37,078,109 |
| VIP FundsManager 50% Portfolio | 6,031,429,747 | 358,903,138 | (70,902,923) | 288,000,215 |
| VIP FundsManager 60% Portfolio | 6,063,388,202 | 824,449,944 | (68,390,135) | 756,059,809 |
| VIP FundsManager 70% Portfolio | 1,048,087,406 | 115,887,799 | (17,029,818) | 98,857,981 |
| VIP FundsManager 85% Portfolio | 374,381,343 | 41,262,820 | (7,295,943) | 33,966,877 |
3. Purchases and Redemptions of Underlying Fund Shares.
Purchases and redemptions of the Underlying Fund shares, are noted in the table below.
| | Purchases ($) | Redemptions ($) |
| VIP FundsManager 20% Portfolio | 341,764,489 | 346,426,452 |
| VIP FundsManager 50% Portfolio | 1,677,697,930 | 1,597,950,075 |
| VIP FundsManager 60% Portfolio | 1,434,147,840 | 1,592,129,222 |
| VIP FundsManager 70% Portfolio | 314,286,752 | 288,030,005 |
| VIP FundsManager 85% Portfolio | 133,782,122 | 137,875,537 |
4. Fees and Other Transactions with Affiliates.
Management Fee. FMR Co., Inc. (the investment adviser), an affiliate of FMR, provides the Funds with investment management related services. For these services each Fund pays a monthly management fee to the investment adviser. The management fee is based on an annual rate of .25% of each fund's average net assets. The management fee is reduced by an amount equal to the fees and expenses paid by the Funds to the independent Trustees.
The investment adviser has contractually agreed to waive 0.05% of its management fee, thereby limiting each Fund's management fee to an annual rate of 0.20% of average net assets, until April 30, 2017.
Other Transactions. The investment adviser has entered into an administration agreement with FMR under which FMR provides management and administrative services (other than investment advisory services) necessary for the operation of each Fund. Pursuant to this agreement, FMR pays all expenses of each Fund, excluding distribution and service fees, compensation of the independent Trustees and certain other expenses such as interest expense. FMR also contracts with other Fidelity companies to perform the services necessary for the operation of each Fund.
Distribution and Service Plan Fees. In accordance with Rule 12b-1 of the 1940 Act, the Funds have adopted separate 12b-1 Plans for each Service Class of shares. Each Service Class pays Fidelity Distributors Corporation (FDC), an affiliate of the investment adviser, a service fee. For the period, the service fee is based on an annual rate of .10% of Service Class' average net assets and .25% of Service Class 2's average net assets.
For the period, total fees, all of which were reallowed to insurance companies for the distribution of shares and providing shareholder support services were as follows:
| | Service
Class | Service
Class 2 | Total |
| VIP FundsManager 20% Portfolio | $30 | $2,345 | $2,375 |
| VIP FundsManager 50% Portfolio | 30 | 106,572 | 106,602 |
| VIP FundsManager 60% Portfolio | 28 | 607,806 | 607,834 |
| VIP FundsManager 70% Portfolio | 34 | 25,441 | 25,475 |
| VIP FundsManager 85% Portfolio | 4 | 17,645 | 17,649 |
5. Expense Reductions.
The investment adviser contractually agreed to limit each Funds' management fee to an annual rate of 0.20% of each Funds' average net assets until April 30, 2017. For the period, each Fund's management fees were reduced by the following amounts:
| | Management Fee Waiver |
| VIP FundsManager 20% Portfolio | $ 183,124 |
| VIP FundsManager 50% Portfolio | 1,540,003 |
| VIP FundsManager 60% Portfolio | 1,678,037 |
| VIP FundsManager 70% Portfolio | 274,398 |
| VIP FundsManager 85% Portfolio | 99,046 |
In addition, FMR has contractually agreed to reimburse 0.10% of class-level expenses for each Fund's Service Class and Service Class 2. During the period, this reimbursement reduced each Fund's Service Class and Service Class 2's expenses by the following amounts:
| | Reimbursement
|
| VIP FundsManager 20% Portfolio | |
| Service Class | $30 |
| Service Class 2 | 946 |
| VIP FundsManager 50% Portfolio | |
| Service Class | 30 |
| Service Class 2 | 42,737 |
| VIP FundsManager 60% Portfolio | |
| Service Class | 28 |
| Service Class 2 | 243,523 |
| VIP FundsManager 70% Portfolio | |
| Service Class | 34 |
| Service Class 2 | 10,368 |
| VIP FundsManager 85% Portfolio | |
| Service Class | 4 |
| Service Class 2 | 7,158 |
6. Distributions to Shareholders.
Distributions to shareholders of each class were as follows:
| | Six months ended
June 30, 2016 | Year ended December 31, 2015 |
| VIP FundsManager 20% Portfolio | | |
| From net investment income | | |
| Service Class | $5 | $756 |
| Service Class 2 | 150 | 15,426 |
| Investor Class | 66,396 | 8,782,197 |
| Total | $66,551 | $8,798,379 |
| From net realized gain | | |
| Service Class | $720 | $2,113 |
| Service Class 2 | 20,137 | 44,977 |
| Investor Class | 8,897,116 | 23,580,699 |
| Total | $8,917,973 | $23,627,789 |
| VIP FundsManager 50% Portfolio | | |
| From net investment income | | |
| Service Class | $– | $747 |
| Service Class 2 | – | 830,790 |
| Investor Class | – | 69,150,512 |
| Total | $– | $69,982,049 |
| From net realized gain | | |
| Service Class | $704 | $2,426 |
| Service Class 2 | 978,230 | 2,981,556 |
| Investor Class | 70,990,218 | 177,017,184 |
| Total | $71,969,152 | $180,001,166 |
| VIP FundsManager 60% Portfolio | | |
| From net investment income | | |
| Service Class | $5 | $677 |
| Service Class 2 | 44,524 | 4,850,081 |
| Investor Class | 574,683 | 71,023,792 |
| Total | $619,212 | $75,874,550 |
| From net realized gain | | |
| Service Class | $1,793 | $4,828 |
| Service Class 2 | 15,494,520 | 30,448,221 |
| Investor Class | 199,989,678 | 437,362,567 |
| Total | $215,485,991 | $467,815,616 |
| VIP FundsManager 70% Portfolio | | |
| From net investment income | | |
| Service Class | $11 | $690 |
| Service Class 2 | 2,113 | 99,217 |
| Investor Class | 181,421 | 10,402,667 |
| Total | $183,545 | $10,502,574 |
| From net realized gain | | |
| Service Class | $2,589 | $1,802 |
| Service Class 2 | 484,994 | 203,572 |
| Investor Class | 41,636,227 | 24,446,782 |
| Total | $42,123,810 | $24,652,156 |
| VIP FundsManager 85% Portfolio | | |
| From net investment income | | |
| Service Class | $– | $108 |
| Service Class 2 | – | 126,841 |
| Investor Class | – | 5,400,941 |
| Total | $– | $5,527,890 |
| From net realized gain | | |
| Service Class | $337 | $314 |
| Service Class 2 | 431,574 | 329,863 |
| Investor Class | 16,740,255 | 14,831,287 |
| Total | $17,172,166 | $15,161,464 |
7. Share Transactions.
Transactions for each class of shares were as follows:
| | Shares | Shares | Dollars | Dollars |
| | Six months ended June 30, 2016 | Year ended December 31, 2015 | Six months ended June 30, 2016 | Year ended December 31, 2015 |
| VIP FundsManager 20% Portfolio | | | | |
| Service Class | | | | |
| Shares sold | 140 | 282 | $1,533 | $3,201 |
| Reinvestment of distributions | 68 | 256 | 725 | 2,869 |
| Shares redeemed | (426) | (820) | (4,627) | (9,217) |
| Net increase (decrease) | (218) | (282) | $(2,369) | $(3,147) |
| Service Class 2 | | | | |
| Shares sold | 99,167 | 55,089 | $1,089,485 | $619,120 |
| Reinvestment of distributions | 1,901 | 5,394 | 20,287 | 60,403 |
| Shares redeemed | (16,330) | (52,490) | (180,786) | (595,169) |
| Net increase (decrease) | 84,738 | 7,993 | $928,986 | $84,354 |
| Investor Class | | | | |
| Shares sold | 2,876,838 | 4,314,478 | $31,562,945 | $48,892,189 |
| Reinvestment of distributions | 839,280 | 2,886,754 | 8,963,512 | 32,362,896 |
| Shares redeemed | (3,750,085) | (6,795,492) | (40,951,737) | (76,720,627) |
| Net increase (decrease) | (33,967) | 405,740 | $(425,280) | $4,534,458 |
| VIP FundsManager 50% Portfolio | | | | |
| Service Class | | | | |
| Shares sold | 95 | 30 | $1,121 | $376 |
| Reinvestment of distributions | 64 | 261 | 704 | 3,173 |
| Shares redeemed | (373) | (767) | (4,239) | (9,305) |
| Net increase (decrease) | (214) | (476) | $(2,414) | $(5,756) |
| Service Class 2 | | | | |
| Shares sold | 1,091,043 | 1,197,918 | $12,787,160 | $14,606,195 |
| Reinvestment of distributions | 88,769 | 314,646 | 978,230 | 3,812,346 |
| Shares redeemed | (614,749) | (1,639,641) | (7,155,068) | (19,955,650) |
| Net increase (decrease) | 565,063 | (127,077) | $6,610,322 | $(1,537,109) |
| Investor Class | | | | |
| Shares sold | 17,113,183 | 87,789,959 | $195,434,788 | $1,074,317,628 |
| Reinvestment of distributions | 6,424,454 | 20,301,767 | 70,990,218 | 246,167,696 |
| Shares redeemed | (12,799,981) | (8,600,399) | (149,721,122) | (105,237,774) |
| Net increase (decrease) | 10,737,656 | 99,491,327 | $116,703,884 | $1,215,247,550 |
| VIP FundsManager 60% Portfolio | | | | |
| Service Class | | | | |
| Shares sold | 65 | 92 | $693 | $1,058 |
| Reinvestment of distributions | 181 | 488 | 1,798 | 5,505 |
| Shares redeemed | (334) | (942) | (3,475) | (10,684) |
| Net increase (decrease) | (88) | (362) | $(984) | $(4,121) |
| Service Class 2 | | | | |
| Shares sold | 4,847,245 | 11,496,489 | $51,933,550 | $131,468,035 |
| Reinvestment of distributions | 1,564,858 | 3,139,200 | 15,539,044 | 35,298,302 |
| Shares redeemed | (4,923,940) | (5,178,599) | (52,569,542) | (58,979,106) |
| Net increase (decrease) | 1,488,163 | 9,457,090 | $14,903,052 | $107,787,231 |
| Investor Class | | | | |
| Shares sold | 7,157,344 | 54,600,995 | $75,026,886 | $628,143,142 |
| Reinvestment of distributions | 20,157,222 | 45,130,041 | 200,564,361 | 508,386,359 |
| Shares redeemed | (24,395,630) | (38,801,862) | (260,495,552) | (444,895,412) |
| Net increase (decrease) | 2,918,936 | 60,929,174 | $15,095,695 | $691,634,089 |
| VIP FundsManager 70% Portfolio | | | | |
| Service Class | | | | |
| Shares sold | 52 | 95 | $590 | $1,186 |
| Reinvestment of distributions | 245 | 202 | 2,600 | 2,492 |
| Shares redeemed | (365) | (608) | (4,096) | (7,499) |
| Net increase (decrease) | (68) | (311) | $(906) | $(3,821) |
| Service Class 2 | | | | |
| Shares sold | 2,193,760 | 433,265 | $25,478,973 | $5,385,934 |
| Reinvestment of distributions | 46,040 | 24,649 | 487,107 | 302,789 |
| Shares redeemed | (226,044) | (72,562) | (2,471,190) | (901,788) |
| Net increase (decrease) | 2,013,756 | 385,352 | $23,494,890 | $4,786,935 |
| Investor Class | | | | |
| Shares sold | 2,371,800 | 9,520,512 | $26,990,977 | $119,096,572 |
| Reinvestment of distributions | 3,941,343 | 2,825,692 | 41,817,648 | 34,849,407 |
| Shares redeemed | (2,396,609) | (3,585,245) | (27,473,625) | (44,259,783) |
| Net increase (decrease) | 3,916,534 | 8,760,959 | $41,335,000 | $109,686,196 |
| VIP FundsManager 85% Portfolio | | | | |
| Service Class | | | | |
| Shares sold | 63 | 152 | $705 | $1,870 |
| Reinvestment of distributions | 33 | 34 | 337 | 422 |
| Shares redeemed | (75) | (148) | (839) | (1,816) |
| Net increase (decrease) | 21 | 38 | $203 | $476 |
| Service Class 2 | | | | |
| Shares sold | 1,049,646 | 324,229 | $11,885,861 | $3,937,469 |
| Reinvestment of distributions | 42,604 | 37,474 | 431,574 | 456,704 |
| Shares redeemed | (93,593) | (148,025) | (1,027,870) | (1,816,406) |
| Net increase (decrease) | 998,657 | 213,678 | $11,289,565 | $2,577,767 |
| Investor Class | | | | |
| Shares sold | 1,030,009 | 4,116,729 | $11,405,659 | $50,957,543 |
| Reinvestment of distributions | 1,644,426 | 1,652,617 | 16,740,255 | 20,232,228 |
| Shares redeemed | (2,448,500) | (2,415,852) | (27,335,317) | (29,842,847) |
| Net increase (decrease) | 225,935 | 3,353,494 | $810,597 | $41,346,924 |
8. Other.
The Funds' organizational documents provide former and current trustees and officers with a limited indemnification against liabilities arising in connection with the performance of their duties to the Funds. In the normal course of business, the Funds may also enter into contracts that provide general indemnifications. The Funds' maximum exposure under these arrangements is unknown as this would be dependent on future claims that may be made against the Funds. The risk of material loss from such claims is considered remote.
The Funds do not invest in the Underlying Funds for the purpose of exercising management or control: however, investments by the Funds within their principal investment strategies may represent a significant portion of the Underlying Fund's net assets.
At the end of the period, the following Funds were each the owners of record of 10% or more of the total outstanding shares of the Underlying Funds.
| Fund | VIP FundsManager 50% Portfolio | VIP FundsManager 60% Portfolio |
| Fidelity Banking Portfolio | 14% | 22% |
| Fidelity Consumer Discretionary Portfolio | 15% | 21% |
| Fidelity Construction and Housing Portfolio | – | 13% |
| Fidelity Financial Service Portfolio | 12% | 19% |
| Fidelity Industrials Portfolio | 11% | 16% |
| Fidelity Industrial Equipment Portfolio | 21% | 27% |
| Fidelity Insurance Portfolio | 15% | 16% |
| Fidelity Japan Smaller Companies Fund | 10% | 11% |
| Fidelity Stock Selector Large Cap Value Fund | 10% | – |
| Fidelity Technology Portfolio | – | 12% |
| Fidelity Telecommunication Portfolio | 11% | 15% |
| Spartan Inflation-Protected Bond Index Fund | 18% | 19% |
The Funds, in aggregate, were the owners of record of more than 20% of the total outstanding shares of the following Underlying Funds.
| | % of shares held | |
| Fidelity Banking Portfolio | 43% | |
| Fidelity Construction and Housing Portfolio | 25% | |
| Fidelity Consumer Discretionary Portfolio | 41% | |
| Fidelity Financial Service Portfolio | 36% | |
| Fidelity Industrials Portfolio | 32% | |
| Fidelity Industrial Equipment Portfolio | 59% | |
| Fidelity Insurance Portfolio | 38% | |
| Fidelity Japan Smaller Companies Fund | 25% | |
| Fidelity Technology Portfolio | 23% | |
| Fidelity Telecommunication Portfolio | 31% | |
| Spartan Inflation-Protected Bond Index Fund | 44% | |
In addition, at the end of the period, the investment adviser or its affiliates and certain otherwise unaffiliated shareholders each were owners of record of more than 10% of the outstanding shares of the following funds:
| | Affiliated % | Number of Unaffiliated Shareholders | Unaffiliated Shareholders % |
| VIP FundsManager 20% Portfolio | 100% | – | – |
| VIP FundsManager 50% Portfolio | 22% | 1 | 72% |
| VIP FundsManager 60% Portfolio | 27% | 1 | 52% |
| VIP FundsManager 70% Portfolio | 97% | – | – |
| VIP FundsManager 85% Portfolio | 95% | – | – |
Shareholder Expense Example
As a shareholder of a Fund, you incur two types of costs: (1) transaction costs, and (2) ongoing costs, including distribution and/or service (12b-1) fees and other Fund expenses. This Example is intended to help you understand your ongoing costs (in dollars) of investing in the Funds and to compare these costs with the ongoing costs of investing in other mutual funds.
The Example is based on an investment of $1,000 invested at the beginning of the period and held for the entire period (January 1, 2016 to June 30, 2016).
Actual Expenses
The first line of the accompanying table for each class of each fund provides information about actual account values and actual expenses. You may use the information in this line, together with the amount you invested, to estimate the expenses that you paid over the period. Simply divide your account value by $1,000.00 (for example, an $8,600 account value divided by $1,000.00 = 8.6), then multiply the result by the number in the first line for a class of the fund under the heading entitled "Expenses Paid During Period" to estimate the expenses you paid on your account during this period. The estimate of expenses does not include any fees or other expenses of any variable annuity or variable life insurance product. If they were, the estimate of expenses you paid during the period would be higher, and your ending account value would be lower. In addition, each Fund, as a shareholder in underlying Fidelity Funds, will indirectly bear its pro-rata share of the fees and expenses incurred by the underlying Fidelity Funds. These fees and expenses are not included in each Fund's annualized expense ratio used to calculate the expense estimates in the table below.
Hypothetical Example for Comparison Purposes
The second line of the accompanying table for each class of each fund provides information about hypothetical account values and hypothetical expenses based on a Class' actual expense ratio and an assumed rate of return of 5% per year before expenses, which is not the Class' actual return. The hypothetical account values and expenses may not be used to estimate the actual ending account balance or expenses you paid for the period. You may use this information to compare the ongoing costs of investing in the Fund and other funds. To do so, compare this 5% hypothetical example with the 5% hypothetical examples that appear in the shareholder reports of the other funds. The estimate of expenses does not include any fees or other expenses of any variable annuity or variable life insurance product. If they were, the estimate of expenses you paid during the period would be higher, and your ending account value would be lower. In addition, each Fund, as a shareholder in underlying Fidelity Funds, will indirectly bear its pro-rata share of the fees and expenses incurred by the underlying Fidelity Funds. These fees and expenses are not included in each Fund's annualized expense ratio used to calculate the expense estimates in the table below.
Please note that the expenses shown in the table are meant to highlight your ongoing costs only and do not reflect any transaction costs. Therefore, the second line of the table is useful in comparing ongoing costs only, and will not help you determine the relative total costs of owning different funds.
| | Annualized Expense Ratio-A | Beginning
Account Value
January 1, 2016 | Ending
Account Value
June 30, 2016 | Expenses Paid
During Period-B
January 1, 2016
to June 30, 2016 |
| VIP FundsManager 20% Portfolio | | | | |
| Service Class | .20% | | | |
| Actual | | $1,000.00 | $1,029.20 | $1.01 |
| Hypothetical-C | | $1,000.00 | $1,023.87 | $1.01 |
| Service Class 2 | .35% | | | |
| Actual | | $1,000.00 | $1,028.30 | $1.77 |
| Hypothetical-C | | $1,000.00 | $1,023.12 | $1.76 |
| Investor Class | .20% | | | |
| Actual | | $1,000.00 | $1,029.20 | $1.01 |
| Hypothetical-C | | $1,000.00 | $1,023.87 | $1.01 |
| VIP FundsManager 50% Portfolio | | | | |
| Service Class | .20% | | | |
| Actual | | $1,000.00 | $1,021.90 | $1.01 |
| Hypothetical-C | | $1,000.00 | $1,023.87 | $1.01 |
| Service Class 2 | .35% | | | |
| Actual | | $1,000.00 | $1,021.10 | $1.76 |
| Hypothetical-C | | $1,000.00 | $1,023.12 | $1.76 |
| Investor Class | .20% | | | |
| Actual | | $1,000.00 | $1,021.90 | $1.01 |
| Hypothetical-C | | $1,000.00 | $1,023.87 | $1.01 |
| VIP FundsManager 60% Portfolio | | | | |
| Service Class | .20% | | | |
| Actual | | $1,000.00 | $1,020.10 | $1.00 |
| Hypothetical-C | | $1,000.00 | $1,023.87 | $1.01 |
| Service Class 2 | .35% | | | |
| Actual | | $1,000.00 | $1,019.20 | $1.76 |
| Hypothetical-C | | $1,000.00 | $1,023.12 | $1.76 |
| Investor Class | .20% | | | |
| Actual | | $1,000.00 | $1,019.20 | $1.00 |
| Hypothetical-C | | $1,000.00 | $1,023.87 | $1.01 |
| VIP FundsManager 70% Portfolio | | | | |
| Service Class | .20% | | | |
| Actual | | $1,000.00 | $1,014.90 | $1.00 |
| Hypothetical-C | | $1,000.00 | $1,023.87 | $1.01 |
| Service Class 2 | .35% | | | |
| Actual | | $1,000.00 | $1,013.20 | $1.75 |
| Hypothetical-C | | $1,000.00 | $1,023.12 | $1.76 |
| Investor Class | .20% | | | |
| Actual | | $1,000.00 | $1,014.00 | $1.00 |
| Hypothetical-C | | $1,000.00 | $1,023.87 | $1.01 |
| VIP FundsManager 85% Portfolio | | | | |
| Service Class | .20% | | | |
| Actual | | $1,000.00 | $1,010.20 | $1.00 |
| Hypothetical-C | | $1,000.00 | $1,023.87 | $1.01 |
| Service Class 2 | .35% | | | |
| Actual | | $1,000.00 | $1,009.30 | $1.75 |
| Hypothetical-C | | $1,000.00 | $1,023.12 | $1.76 |
| Investor Class | .20% | | | |
| Actual | | $1,000.00 | $1,011.00 | $1.00 |
| Hypothetical-C | | $1,000.00 | $1,023.87 | $1.01 |
| | | | | |
A Annualized expense ratio reflects expenses net of applicable fee waivers.
B Expenses are equal to each Class' annualized expense ratio, multiplied by the average account value over the period, multiplied by 182/ 366 (to reflect the one-half year period). The fees and expenses of the underlying Fidelity Funds in which each Fund invests are not included in each Class' annualized expense ratio.
C 5% return per year before expenses
VIPFM-SANN-0816
1.833444.110
Fidelity® Variable Insurance Products: Investment Grade Bond Portfolio
Semi-Annual Report June 30, 2016 |
|
To view a fund's proxy voting guidelines and proxy voting record for the 12-month period ended June 30, visit http://www.fidelity.com/proxyvotingresults or visit the Securities and Exchange Commission's (SEC) web site at http://www.sec.gov.
You may also call 1-877-208-0098 to request a free copy of the proxy voting guidelines.
Fidelity® Variable Insurance Products are separate account options which are purchased through a variable insurance contract.
Standard & Poor's, S&P and S&P 500 are registered service marks of The McGraw-Hill Companies, Inc. and have been licensed for use by Fidelity Distributors Corporation.
Other third-party marks appearing herein are the property of their respective owners.
All other marks appearing herein are registered or unregistered trademarks or service marks of FMR LLC or an affiliated company. © 2016 FMR LLC. All rights reserved.
This report and the financial statements contained herein are submitted for the general information of the shareholders of the Fund. This report is not authorized for distribution to prospective investors in the Fund unless preceded or accompanied by an effective prospectus.
A fund files its complete schedule of portfolio holdings with the SEC for the first and third quarters of each fiscal year on Form N-Q. Forms N-Q are available on the SEC’s web site at http://www.sec.gov. A fund's Forms N-Q may be reviewed and copied at the SEC’s Public Reference Room in Washington, DC. Information regarding the operation of the SEC's Public Reference Room may be obtained by calling 1-800-SEC-0330.
For a complete list of a fund's portfolio holdings, view the most recent holdings listing, semiannual report, or annual report on Fidelity's web site at http://www.fidelity.com, http://www.institutional.fidelity.com, or http://www.401k.com, as applicable.
NOT FDIC INSURED •MAY LOSE VALUE •NO BANK GUARANTEE
Neither the Fund nor Fidelity Distributors Corporation is a bank.
VIP Investment Grade Bond Portfolio
Investment Summary (Unaudited)
Quality Diversification (% of fund's net assets)
| As of June 30, 2016 |
| | U.S. Government and U.S. Government Agency Obligations | 40.1% |
| | AAA | 2.6% |
| | AA | 2.1% |
| | A | 7.6% |
| | BBB | 28.6% |
| | BB and Below | 15.7% |
| | Short-Term Investments and Net Other Assets | 3.3% |
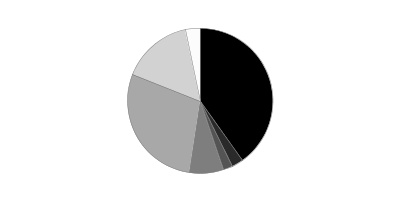
| As of December 31, 2015 |
| | U.S. Government and U.S. Government Agency Obligations | 32.1% |
| | AAA | 3.3% |
| | AA | 3.8% |
| | A | 10.9% |
| | BBB | 33.5% |
| | BB and Below | 14.0% |
| | Short-Term Investments and Net Other Assets | 2.4% |
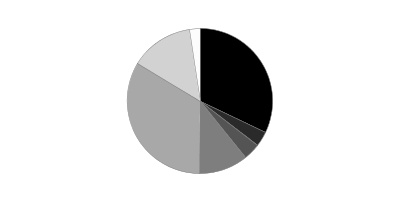
We have used ratings from Moody's Investors Service, Inc. Where Moody's® ratings are not available, we have used S&P® ratings. All ratings are as of the date indicated and do not reflect subsequent changes. Securities rated BB or below were rated investment grade at the time of acquisition. The information in the above tables is based on the combined investments of the Fund and its pro-rata share of investments of Fidelity's fixed-income central funds.
Asset Allocation (% of fund's net assets)
| As of June 30, 2016 *,** |
| | Corporate Bonds | 45.8% |
| | U.S. Government and U.S. Government Agency Obligations | 40.1% |
| | Asset-Backed Securities | 0.9% |
| | CMOs and Other Mortgage Related Securities | 4.6% |
| | Municipal Bonds | 2.9% |
| | Other Investments | 2.4% |
| | Short-Term Investments and Net Other Assets (Liabilities) | 3.3% |

* Futures and Swaps - 0.0%
** Foreign investments - 12.0%
| As of December 31, 2015 *,** |
| | Corporate Bonds | 51.3% |
| | U.S. Government and U.S. Government Agency Obligations | 32.1% |
| | Asset-Backed Securities | 0.9% |
| | CMOs and Other Mortgage Related Securities | 6.3% |
| | Municipal Bonds | 4.1% |
| | Other Investments | 2.9% |
| | Short-Term Investments and Net Other Assets (Liabilities) | 2.4% |

* Foreign investments - 14.5%
** Futures and Swaps - 0.0%
The information in the above table is based on the combined investments of the Fund and its pro rata share of the investments of Fidelity's fixed-income central funds. An unaudited holdings listing for the Fund, which presents direct holdings as well as the pro rata share of any securities and other investments held indirectly through its investment in underlying non-money market Fidelity Central Funds, is available at institutional.fidelity.com. Fidelity VIP Investment Grade Central Fund's holdings and financial statements are included at the end of this report.
Percentages in the above tables are adjusted for the effect of TBA Sale Commitments.
Percentages shown as 0.0% may reflect amounts less than 0.05%.
VIP Investment Grade Bond Portfolio
Investments June 30, 2016 (Unaudited)
Showing Percentage of Net Assets
| Nonconvertible Bonds - 0.3% | | | |
| | | Principal Amount | Value |
| ENERGY - 0.3% | | | |
| Oil, Gas & Consumable Fuels - 0.3% | | | |
| Chesapeake Energy Corp. 5.75% 3/15/23 | | $8,800,000 | $5,632,000 |
| Southwestern Energy Co.: | | | |
| 3.3% 1/23/18 | | 2,000,000 | 2,044,000 |
| 4.05% 1/23/20 | | 3,000,000 | 2,947,500 |
| The Williams Companies, Inc. 5.75% 6/24/44 | | 1,900,000 | 1,619,750 |
| | | | 12,243,250 |
| FINANCIALS - 0.0% | | | |
| Real Estate Investment Trusts - 0.0% | | | |
| CommonWealth REIT 5.875% 9/15/20 | | 546,000 | 606,308 |
| TOTAL NONCONVERTIBLE BONDS | | | |
| (Cost $14,200,012) | | | 12,849,558 |
|
| U.S. Government and Government Agency Obligations - 1.2% | | | |
| U.S. Treasury Inflation-Protected Obligations - 0.3% | | | |
| U.S. Treasury Inflation-Indexed Bonds 1% 2/15/46 | | 10,097,800 | 10,921,706 |
| U.S. Treasury Obligations - 0.9% | | | |
| U.S. Treasury Bonds: | | | |
| 2.5% 2/15/46 | | $22,000,000 | $22,928,994 |
| 3% 11/15/45 | | 9,573,000 | 11,016,800 |
|
| TOTAL U.S. TREASURY OBLIGATIONS | | | 33,945,794 |
|
| TOTAL U.S. GOVERNMENT AND GOVERNMENT AGENCY OBLIGATIONS | | | |
| (Cost $41,195,530) | | | 44,867,500 |
|
| Collateralized Mortgage Obligations - 0.0% | | | |
| Private Sponsor - 0.0% | | | |
| MASTR Adjustable Rate Mortgages Trust Series 2007-3 Class 22A2, 0.656% 5/25/47 (a) | | $203,272 | $188,010 |
| Merrill Lynch Alternative Note Asset Trust floater Series 2007-OAR1 Class A1, 0.6233% 2/25/37 (a) | | 667,620 | 606,527 |
| Wells Fargo Mortgage Backed Securities Trust Series 2005-AR2 Class 1A2, 2.8666% 3/25/35 (a) | | 466,075 | 428,811 |
| TOTAL PRIVATE SPONSOR | | | |
| (Cost $778,938) | | | 1,223,348 |
| | | Shares | Value |
|
| Fixed-Income Funds - 93.9% | | | |
| Fidelity Specialized High Income Central Fund (b) | | 2,568,388 | 256,402,195 |
| Fidelity VIP Investment Grade Central Fund (b)(c) | | 30,970,517 | 3,318,490,914 |
| TOTAL FIXED-INCOME FUNDS | | | |
| (Cost $3,475,826,580) | | | 3,574,893,109 |
|
| Money Market Funds - 4.5% | | | |
| Fidelity Cash Central Fund, 0.43%(d) | | | |
| (Cost $169,093,555) | | 169,093,555 | 169,093,555 |
| TOTAL INVESTMENT PORTFOLIO - 99.9% | | | |
| (Cost $3,701,094,615) | | | 3,802,927,070 |
| NET OTHER ASSETS (LIABILITIES) - 0.1% | | | 2,919,846 |
| NET ASSETS - 100% | | | $3,805,846,916 |
Legend
(a) Coupon rates for floating and adjustable rate securities reflect the rates in effect at period end.
(b) Affiliated fund that is generally available only to investment companies and other accounts managed by Fidelity Investments. A complete unaudited schedule of portfolio holdings for each Fidelity Central Fund is filed with the SEC for the first and third quarters of each fiscal year on Form N-Q and is available upon request or at the SEC's website at www.sec.gov. An unaudited holdings listing for the Fund, which presents direct holdings as well as the pro-rata share of securities and other investments held indirectly through its investment in underlying non-money market Fidelity Central Funds is available at fidelity.com and/or institutional.fidelity.com, as applicable. In addition, each Fidelity Central Fund's financial statements are available on the SEC's website or upon request.
(c) Affiliated central fund that is available only to investment companies and other accounts managed by Fidelity Investments. Fidelity VIP Investment Grade Central Fund's investments and financial statements are included at the end of this report as an attachment.
(d) Affiliated fund that is generally available only to investment companies and other accounts managed by Fidelity Investments. The rate quoted is the annualized seven-day yield of the fund at period end. A complete unaudited listing of the fund's holdings as of its most recent quarter end is available upon request. In addition, each Fidelity Central Fund's financial statements are available on the SEC's website or upon request.
Affiliated Central Funds
Information regarding fiscal year to date income earned by the Fund from investments in Fidelity Central Funds is as follows:
| Fund | Income earned |
| Fidelity Cash Central Fund | $100,689 |
| Fidelity Specialized High Income Central Fund | 7,442,304 |
| Fidelity VIP Investment Grade Central Fund | 49,984,426 |
| Total | $57,527,419 |
Additional information regarding the Fund's fiscal year to date purchases and sales, including the ownership percentage, of the non Money Market Central Funds is as follows:
| Fund | Value, beginning of period | Purchases | Sales Proceeds | Value, end of period | % ownership, end of period |
| Fidelity Specialized High Income Central Fund | $270,964,634 | $7,442,304 | $29,989,539 | $256,402,195 | 31.3% |
| Fidelity VIP Investment Grade Central Fund | 3,219,767,472 | 82,337,566 | 90,194,446 | 3,318,490,914 | 70.2% |
| Total | $3,490,732,106 | $89,779,870 | $120,183,985 | $3,574,893,109 | |
Investment Valuation
The following is a summary of the inputs used, as of June 30, 2016, involving the Fund's assets and liabilities carried at fair value. The inputs or methodology used for valuing securities may not be an indication of the risk associated with investing in those securities. For more information on valuation inputs, and their aggregation into the levels used below, please refer to the Investment Valuation section in the accompanying Notes to Financial Statements.
| | Valuation Inputs at Reporting Date: |
| Description | Total | Level 1 | Level 2 | Level 3 |
| Investments in Securities: | | | | |
| Corporate Bonds | $12,849,558 | $-- | $12,849,558 | $-- |
| U.S. Government and Government Agency Obligations | 44,867,500 | -- | 44,867,500 | -- |
| Collateralized Mortgage Obligations | 1,223,348 | -- | 1,223,348 | -- |
| Fixed-Income Funds | 3,574,893,109 | 3,574,893,109 | -- | -- |
| Money Market Funds | 169,093,555 | 169,093,555 | -- | -- |
| Total Investments in Securities: | $3,802,927,070 | $3,743,986,664 | $58,940,406 | $-- |
Other Information
Distribution of investments by country or territory of incorporation, as a percentage of Total Net Assets, is as follows (Unaudited):
| United States of America | 88.0% |
| United Kingdom | 2.5% |
| Mexico | 1.8% |
| Netherlands | 1.5% |
| Luxembourg | 1.3% |
| Others (Individually Less Than 1%) | 4.9% |
| | 100.0% |
The information in the above tables is based on the combined investments of the fund and its pro-rata share of the investments of Fidelity's Fixed-Income Central Funds.
See accompanying notes which are an integral part of the financial statements.
VIP Investment Grade Bond Portfolio
Financial Statements
Statement of Assets and Liabilities
| | | June 30, 2016 (Unaudited) |
| Assets | | |
Investment in securities, at value — See accompanying schedule:
Unaffiliated issuers (cost $56,174,480) | $58,940,406 | |
| Fidelity Central Funds (cost $3,644,920,135) | 3,743,986,664 | |
| Total Investments (cost $3,701,094,615) | | $3,802,927,070 |
| Receivable for fund shares sold | | 7,024,524 |
| Interest receivable | | 525,248 |
| Distributions receivable from Fidelity Central Funds | | 39,681 |
| Total assets | | 3,810,516,523 |
| Liabilities | | |
| Payable for fund shares redeemed | $3,046,141 | |
| Accrued management fee | 961,389 | |
| Transfer agent fee payable | 235,588 | |
| Distribution and service plan fees payable | 302,306 | |
| Other affiliated payables | 93,439 | |
| Other payables and accrued expenses | 30,744 | |
| Total liabilities | | 4,669,607 |
| Net Assets | | $3,805,846,916 |
| Net Assets consist of: | | |
| Paid in capital | | $3,636,497,284 |
| Undistributed net investment income | | 49,337,408 |
| Accumulated undistributed net realized gain (loss) on investments | | 18,179,769 |
| Net unrealized appreciation (depreciation) on investments | | 101,832,455 |
| Net Assets | | $3,805,846,916 |
| Initial Class: | | |
| Net Asset Value, offering price and redemption price per share ($1,075,298,009 ÷ 82,141,124 shares) | | $13.09 |
| Service Class: | | |
| Net Asset Value, offering price and redemption price per share ($531,733,763 ÷ 41,062,650 shares) | | $12.95 |
| Service Class 2: | | |
| Net Asset Value, offering price and redemption price per share ($1,296,756,783 ÷ 101,471,945 shares) | | $12.78 |
| Investor Class: | | |
| Net Asset Value, offering price and redemption price per share ($902,058,361 ÷ 69,167,452 shares) | | $13.04 |
See accompanying notes which are an integral part of the financial statements.
Statement of Operations
| | | Six months ended June 30, 2016 (Unaudited) |
| Investment Income | | |
| Interest | | $1,412,145 |
| Income from Fidelity Central Funds | | 57,527,419 |
| Total income | | 58,939,564 |
| Expenses | | |
| Management fee | $5,598,134 | |
| Transfer agent fees | 1,365,875 | |
| Distribution and service plan fees | 1,760,010 | |
| Accounting fees and expenses | 557,339 | |
| Custodian fees and expenses | 12,743 | |
| Independent trustees' fees and expenses | 8,148 | |
| Registration fees | 17,279 | |
| Audit | 25,389 | |
| Legal | 1,486 | |
| Miscellaneous | 14,944 | |
| Total expenses before reductions | 9,361,347 | |
| Expense reductions | (7,298) | 9,354,049 |
| Net investment income (loss) | | 49,585,515 |
| Realized and Unrealized Gain (Loss) | | |
| Net realized gain (loss) on: | | |
| Investment securities: | | |
| Unaffiliated issuers | 547,530 | |
| Fidelity Central Funds | (3,837,557) | |
| Capital gain distributions from Fidelity Central Funds | 32,353,140 | |
| Total net realized gain (loss) | | 29,063,113 |
| Change in net unrealized appreciation (depreciation) on investment securities | | 128,050,010 |
| Net gain (loss) | | 157,113,123 |
| Net increase (decrease) in net assets resulting from operations | | $206,698,638 |
See accompanying notes which are an integral part of the financial statements.
Statement of Changes in Net Assets
| | Six months ended June 30, 2016 (Unaudited) | Year ended December 31, 2015 |
| Increase (Decrease) in Net Assets | | |
| Operations | | |
| Net investment income (loss) | $49,585,515 | $93,312,897 |
| Net realized gain (loss) | 29,063,113 | (8,097,696) |
| Change in net unrealized appreciation (depreciation) | 128,050,010 | (114,860,697) |
| Net increase (decrease) in net assets resulting from operations | 206,698,638 | (29,645,496) |
| Distributions to shareholders from net investment income | (1,993,608) | (91,918,960) |
| Distributions to shareholders from net realized gain | (1,708,806) | (2,733,126) |
| Total distributions | (3,702,414) | (94,652,086) |
| Share transactions - net increase (decrease) | 50,248,374 | 320,862,768 |
| Total increase (decrease) in net assets | 253,244,598 | 196,565,186 |
| Net Assets | | |
| Beginning of period | 3,552,602,318 | 3,356,037,132 |
| End of period | $3,805,846,916 | $3,552,602,318 |
| Other Information | | |
| Undistributed net investment income end of period | $49,337,408 | $1,745,501 |
See accompanying notes which are an integral part of the financial statements.
Financial Highlights — VIP Investment Grade Bond Portfolio Initial Class
| | Six months ended (Unaudited) June 30, | Years ended December 31, | | | | |
| | 2016 | 2015 | 2014 | 2013 | 2012 | 2011 |
| Selected Per–Share Data | | | | | | |
| Net asset value, beginning of period | $12.37 | $12.79 | $12.36 | $13.06 | $12.97 | $12.83 |
| Income from Investment Operations | | | | | | |
| Net investment income (loss)A | .181 | .345 | .327 | .295 | .318 | .431 |
| Net realized and unrealized gain (loss) | .552 | (.419) | .392 | (.526) | .443 | .492 |
| Total from investment operations | .733 | (.074) | .719 | (.231) | .761 | .923 |
| Distributions from net investment income | (.007) | (.336) | (.284) | (.310) | (.315) | (.436) |
| Distributions from net realized gain | (.006) | (.010) | (.005) | (.159) | (.356) | (.347) |
| Total distributions | (.013) | (.346) | (.289) | (.469) | (.671) | (.783) |
| Net asset value, end of period | $13.09 | $12.37 | $12.79 | $12.36 | $13.06 | $12.97 |
| Total ReturnB,C,D | 5.93% | (.60)% | 5.83% | (1.78)% | 5.90% | 7.33% |
| Ratios to Average Net AssetsE,F | | | | | | |
| Expenses before reductions | .42%G | .42% | .42% | .42% | .42% | .43% |
| Expenses net of fee waivers, if any | .42%G | .42% | .42% | .42% | .42% | .42% |
| Expenses net of all reductions | .42%G | .42% | .42% | .42% | .42% | .42% |
| Net investment income (loss) | 2.87%G | 2.69% | 2.56% | 2.29% | 2.39% | 3.30% |
| Supplemental Data | | | | | | |
| Net assets, end of period (000 omitted) | $1,075,298 | $1,052,893 | $1,081,564 | $981,378 | $1,149,849 | $1,116,778 |
| Portfolio turnover rateH | 10%G | 9% | 7% | 4% | 2% | 5% |
A Calculated based on average shares outstanding during the period.
B Total returns for periods of less than one year are not annualized.
C Total returns do not reflect charges attributable to your insurance company's separate account. Inclusion of these charges would reduce the total returns shown.
D Total returns would have been lower if certain expenses had not been reduced during the applicable periods shown.
E Fees and expenses of any underlying Fidelity Central Funds are not included in the Fund's expense ratio. The Fund indirectly bears its proportionate share of the expenses of any underlying Fidelity Central Funds. Based on their most recent shareholder report date, the expenses of any underlying non-money market Fidelity Central Funds were less than .005%.
F Expense ratios reflect operating expenses of the class. Expenses before reductions do not reflect amounts reimbursed by the investment adviser or reductions from expense offset arrangements and do not represent the amount paid by the class during periods when reimbursements or reductions occur. Expenses net of fee waivers reflect expenses after reimbursement by the investment adviser but prior to reductions from expense offset arrangements. Expenses net of all reductions represent the net expenses paid by the class.
G Annualized
H Amount does not include the portfolio activity of any underlying Fidelity Central Funds.
See accompanying notes which are an integral part of the financial statements.
Financial Highlights — VIP Investment Grade Bond Portfolio Service Class
| | Six months ended (Unaudited) June 30, | Years ended December 31, | | | | |
| | 2016 | 2015 | 2014 | 2013 | 2012 | 2011 |
| Selected Per–Share Data | | | | | | |
| Net asset value, beginning of period | $12.24 | $12.66 | $12.24 | $12.94 | $12.86 | $12.73 |
| Income from Investment Operations | | | | | | |
| Net investment income (loss)A | .173 | .329 | .312 | .280 | .302 | .415 |
| Net realized and unrealized gain (loss) | .550 | (.416) | .391 | (.523) | .436 | .485 |
| Total from investment operations | .723 | (.087) | .703 | (.243) | .738 | .900 |
| Distributions from net investment income | (.007) | (.323) | (.278) | (.298) | (.302) | (.423) |
| Distributions from net realized gain | (.006) | (.010) | (.005) | (.159) | (.356) | (.347) |
| Total distributions | (.013) | (.333) | (.283) | (.457) | (.658) | (.770) |
| Net asset value, end of period | $12.95 | $12.24 | $12.66 | $12.24 | $12.94 | $12.86 |
| Total ReturnB,C,D | 5.91% | (.71)% | 5.75% | (1.89)% | 5.77% | 7.21% |
| Ratios to Average Net AssetsE,F | | | | | | |
| Expenses before reductions | .52%G | .52% | .52% | .52% | .52% | .52% |
| Expenses net of fee waivers, if any | .52%G | .52% | .52% | .52% | .52% | .52% |
| Expenses net of all reductions | .52%G | .52% | .52% | .52% | .52% | .52% |
| Net investment income (loss) | 2.77%G | 2.60% | 2.46% | 2.19% | 2.29% | 3.20% |
| Supplemental Data | | | | | | |
| Net assets, end of period (000 omitted) | $531,734 | $520,000 | $432,656 | $265,505 | $288,708 | $277,732 |
| Portfolio turnover rateH | 10%G | 9% | 7% | 4% | 2% | 5% |
A Calculated based on average shares outstanding during the period.
B Total returns for periods of less than one year are not annualized.
C Total returns do not reflect charges attributable to your insurance company's separate account. Inclusion of these charges would reduce the total returns shown.
D Total returns would have been lower if certain expenses had not been reduced during the applicable periods shown.
E Fees and expenses of any underlying Fidelity Central Funds are not included in the Fund's expense ratio. The Fund indirectly bears its proportionate share of the expenses of any underlying Fidelity Central Funds. Based on their most recent shareholder report date, the expenses of any underlying non-money market Fidelity Central Funds were less than .005%.
F Expense ratios reflect operating expenses of the class. Expenses before reductions do not reflect amounts reimbursed by the investment adviser or reductions from expense offset arrangements and do not represent the amount paid by the class during periods when reimbursements or reductions occur. Expenses net of fee waivers reflect expenses after reimbursement by the investment adviser but prior to reductions from expense offset arrangements. Expenses net of all reductions represent the net expenses paid by the class.
G Annualized
H Amount does not include the portfolio activity of any underlying Fidelity Central Funds.
See accompanying notes which are an integral part of the financial statements.
Financial Highlights — VIP Investment Grade Bond Portfolio Service Class 2
| | Six months ended (Unaudited) June 30, | Years ended December 31, | | | | |
| | 2016 | 2015 | 2014 | 2013 | 2012 | 2011 |
| Selected Per–Share Data | | | | | | |
| Net asset value, beginning of period | $12.09 | $12.51 | $12.10 | $12.79 | $12.72 | $12.60 |
| Income from Investment Operations | | | | | | |
| Net investment income (loss)A | .162 | .306 | .289 | .257 | .279 | .391 |
| Net realized and unrealized gain (loss) | .541 | (.410) | .379 | (.510) | .430 | .478 |
| Total from investment operations | .703 | (.104) | .668 | (.253) | .709 | .869 |
| Distributions from net investment income | (.007) | (.306) | (.253) | (.278) | (.283) | (.402) |
| Distributions from net realized gain | (.006) | (.010) | (.005) | (.159) | (.356) | (.347) |
| Total distributions | (.013) | (.316) | (.258) | (.437) | (.639) | (.749) |
| Net asset value, end of period | $12.78 | $12.09 | $12.51 | $12.10 | $12.79 | $12.72 |
| Total ReturnB,C,D | 5.82% | (.85)% | 5.53% | (1.99)% | 5.60% | 7.03% |
| Ratios to Average Net AssetsE,F | | | | | | |
| Expenses before reductions | .67%G | .67% | .67% | .67% | .67% | .67% |
| Expenses net of fee waivers, if any | .67%G | .67% | .67% | .67% | .67% | .67% |
| Expenses net of all reductions | .67%G | .67% | .67% | .67% | .67% | .67% |
| Net investment income (loss) | 2.62%G | 2.45% | 2.31% | 2.04% | 2.14% | 3.05% |
| Supplemental Data | | | | | | |
| Net assets, end of period (000 omitted) | $1,296,757 | $1,186,855 | $1,082,467 | $1,115,493 | $1,198,326 | $972,651 |
| Portfolio turnover rateH | 10%G | 9% | 7% | 4% | 2% | 5% |
A Calculated based on average shares outstanding during the period.
B Total returns for periods of less than one year are not annualized.
C Total returns do not reflect charges attributable to your insurance company's separate account. Inclusion of these charges would reduce the total returns shown.
D Total returns would have been lower if certain expenses had not been reduced during the applicable periods shown.
E Fees and expenses of any underlying Fidelity Central Funds are not included in the Fund's expense ratio. The Fund indirectly bears its proportionate share of the expenses of any underlying Fidelity Central Funds. Based on their most recent shareholder report date, the expenses of any underlying non-money market Fidelity Central Funds were less than .005%.
F Expense ratios reflect operating expenses of the class. Expenses before reductions do not reflect amounts reimbursed by the investment adviser or reductions from expense offset arrangements and do not represent the amount paid by the class during periods when reimbursements or reductions occur. Expenses net of fee waivers reflect expenses after reimbursement by the investment adviser but prior to reductions from expense offset arrangements. Expenses net of all reductions represent the net expenses paid by the class.
G Annualized
H Amount does not include the portfolio activity of any underlying Fidelity Central Funds.
See accompanying notes which are an integral part of the financial statements.
Financial Highlights — VIP Investment Grade Bond Portfolio Investor Class
| | Six months ended (Unaudited) June 30, | Years ended December 31, | | | | |
| | 2016 | 2015 | 2014 | 2013 | 2012 | 2011 |
| Selected Per–Share Data | | | | | | |
| Net asset value, beginning of period | $12.32 | $12.75 | $12.32 | $13.02 | $12.93 | $12.80 |
| Income from Investment Operations | | | | | | |
| Net investment income (loss)A | .178 | .340 | .322 | .290 | .313 | .426 |
| Net realized and unrealized gain (loss) | .555 | (.428) | .395 | (.526) | .444 | .484 |
| Total from investment operations | .733 | (.088) | .717 | (.236) | .757 | .910 |
| Distributions from net investment income | (.007) | (.332) | (.282) | (.305) | (.311) | (.433) |
| Distributions from net realized gain | (.006) | (.010) | (.005) | (.159) | (.356) | (.347) |
| Total distributions | (.013) | (.342) | (.287) | (.464) | (.667) | (.780) |
| Net asset value, end of period | $13.04 | $12.32 | $12.75 | $12.32 | $13.02 | $12.93 |
| Total ReturnB,C,D | 5.96% | (.71)% | 5.83% | (1.82)% | 5.89% | 7.25% |
| Ratios to Average Net AssetsE,F | | | | | | |
| Expenses before reductions | .45%G | .45% | .45% | .45% | .46% | .46% |
| Expenses net of fee waivers, if any | .45%G | .45% | .45% | .45% | .46% | .45% |
| Expenses net of all reductions | .45%G | .45% | .45% | .45% | .46% | .45% |
| Net investment income (loss) | 2.84%G | 2.66% | 2.53% | 2.26% | 2.36% | 3.27% |
| Supplemental Data | | | | | | |
| Net assets, end of period (000 omitted) | $902,058 | $792,855 | $759,351 | $582,454 | $744,227 | $612,611 |
| Portfolio turnover rateH | 10%G | 9% | 7% | 4% | 2% | 5% |
A Calculated based on average shares outstanding during the period.
B Total returns for periods of less than one year are not annualized.
C Total returns do not reflect charges attributable to your insurance company's separate account. Inclusion of these charges would reduce the total returns shown.
D Total returns would have been lower if certain expenses had not been reduced during the applicable periods shown.
E Fees and expenses of any underlying Fidelity Central Funds are not included in the Fund's expense ratio. The Fund indirectly bears its proportionate share of the expenses of any underlying Fidelity Central Funds. Based on their most recent shareholder report date, the expenses of any underlying non-money market Fidelity Central Funds were less than .005%.
F Expense ratios reflect operating expenses of the class. Expenses before reductions do not reflect amounts reimbursed by the investment adviser or reductions from expense offset arrangements and do not represent the amount paid by the class during periods when reimbursements or reductions occur. Expenses net of fee waivers reflect expenses after reimbursement by the investment adviser but prior to reductions from expense offset arrangements. Expenses net of all reductions represent the net expenses paid by the class.
G Annualized
H Amount does not include the portfolio activity of any underlying Fidelity Central Funds.
See accompanying notes which are an integral part of the financial statements.
Notes to Financial Statements (Unaudited)
For the period ended June 30, 2016
1. Organization.
VIP Investment Grade Bond Portfolio (the Fund) is a fund of Variable Insurance Products Fund V (the Trust) and is authorized to issue an unlimited number of shares. The Trust is registered under the Investment Company Act of 1940, as amended (the 1940 Act), as an open-end management investment company organized as a Massachusetts business trust. Shares of the Fund may only be purchased by insurance companies for the purpose of funding variable annuity or variable life insurance contracts. The Fund offers the following classes of shares: Initial Class shares, Service Class shares, Service Class 2 shares and Investor Class shares. All classes have equal rights and voting privileges, except for matters affecting a single class.
2. Investments in Fidelity Central Funds.
The Fund invests in Fidelity Central Funds, which are open-end investment companies generally available only to other investment companies and accounts managed by the investment adviser and its affiliates. The Fund's Schedule of Investments lists each of the Fidelity Central Funds held as of period end, if any, as an investment of the Fund, but does not include the underlying holdings of each Fidelity Central Fund. As an Investing Fund, the Fund indirectly bears its proportionate share of the expenses of the underlying Fidelity Central Funds.
Based on its investment objective, each Fidelity Central Fund may invest or participate in various investment vehicles or strategies that are similar to those of the Fund. These strategies are consistent with the investment objectives of the Fund and may involve certain economic risks which may cause a decline in value of each of the Fidelity Central Funds and thus a decline in the value of the Fund. The Money Market Central Funds seek preservation of capital and current income and are managed by Fidelity Investments Money Management, Inc. (FIMM), an affiliate of the investment adviser. Annualized expenses of the Money Market Central Funds as of their most recent shareholder report date are less than .005%. The following summarizes the Fund's investment in each non-money market Fidelity Central Fund.
| Fidelity Central Fund | Investment Manager | Investment Objective | Investment Practices | Expense Ratio(a) |
| Fidelity Specialized High Income Central Fund | FMR Co., Inc. (FMRC) | Seeks a high level of current income by normally investing in income-producing debt securities, with an emphasis on lower-quality debt securities. | Loans & Direct Debt Instruments
Restricted Securities
| Less than .005% |
| Fidelity VIP Investment Grade Central Fund | FIMM | Seeks a high level of current income by normally investing in investment-grade debt securities and repurchase agreements. | Delayed Delivery & When Issued Securities
Restricted Securities
Swaps | Less than .005% |
(a) Expenses expressed as a percentage of average net assets and are as of each underlying Central Fund's most recent annual or semi-annual shareholder report.
An unaudited holdings listing for each Fund, which presents direct holdings as well as the pro-rata share of any securities and other investments held indirectly through each Fund's investment in underlying non-money market Fidelity Central Funds, is available at institutional.fidelity.com. A complete unaudited list of holdings for each Fidelity Central Fund is available upon request or at the Securities and Exchange Commission (the SEC) website at www.sec.gov. In addition, the financial statements of the Fidelity Central Funds which contain the significant accounting policies (including investment valuation policies) of those funds are available on the SEC website or upon request.
3. Significant Accounting Policies.
The financial statements have been prepared in conformity with accounting principles generally accepted in the United States of America (GAAP), which require management to make certain estimates and assumptions at the date of the financial statements. Actual results could differ from those estimates. Subsequent events, if any, through the date that the financial statements were issued have been evaluated in the preparation of the financial statements. The following summarizes the significant accounting policies of the Fund:
Investment Valuation. Investments are valued as of 4:00 p.m. Eastern time on the last calendar day of the period. The Board of Trustees (the Board) has delegated the day to day responsibility for the valuation of the Fund's investments to the Fidelity Management & Research Company (FMR) Fair Value Committee (the Committee). In accordance with valuation policies and procedures approved by the Board, the Fund attempts to obtain prices from one or more third party pricing vendors or brokers to value its investments. When current market prices, quotations or currency exchange rates are not readily available or reliable, investments will be fair valued in good faith by the Committee, in accordance with procedures adopted by the Board. Factors used in determining fair value vary by investment type and may include market or investment specific events, changes in interest rates and credit quality. The frequency with which these procedures are used cannot be predicted and they may be utilized to a significant extent. The Committee oversees the Fund's valuation policies and procedures and reports to the Board on the Committee's activities and fair value determinations. The Board monitors the appropriateness of the procedures used in valuing the Fund's investments and ratifies the fair value determinations of the Committee.
The Fund categorizes the inputs to valuation techniques used to value its investments into a disclosure hierarchy consisting of three levels as shown below:
- Level 1 – quoted prices in active markets for identical investments
- Level 2 – other significant observable inputs (including quoted prices for similar investments, interest rates, prepayment speeds, etc.)
- Level 3 – unobservable inputs (including the Fund's own assumptions based on the best information available)
Valuation techniques used to value the Fund's investments by major category are as follows:
Debt securities, including restricted securities, are valued based on evaluated prices received from third party pricing vendors or from brokers who make markets in such securities. Corporate bonds and U.S. government and government agency obligations are valued by pricing vendors who utilize matrix pricing which considers yield or price of bonds of comparable quality, coupon, maturity and type or by broker-supplied prices. Collateralized mortgage obligations are valued by pricing vendors who utilize matrix pricing which considers prepayment speed assumptions, attributes of the collateral, yield or price of bonds of comparable quality, coupon, maturity and type or by broker-supplied prices. When independent prices are unavailable or unreliable, debt securities may be valued utilizing pricing methodologies which consider similar factors that would be used by third party pricing vendors. Debt securities are generally categorized as Level 2 in the hierarchy but may be Level 3 depending on the circumstances.
Investments in open-end mutual funds, including the Fidelity Central Funds, are valued at their closing net asset value (NAV) each business day and are categorized as Level 1 in the hierarchy.
Changes in valuation techniques may result in transfers in or out of an assigned level within the disclosure hierarchy. The aggregate value of investments by input level as of June 30, 2016 is included at the end of the Fund's Schedule of Investments.
Investment Transactions and Income. For financial reporting purposes, the Fund's investment holdings and NAV include trades executed through the end of the last business day of the period. The NAV per share for processing shareholder transactions is calculated as of the close of business of the New York Stock Exchange (NYSE), normally 4:00 p.m. Eastern time and includes trades executed through the end of the prior business day. Gains and losses on securities sold are determined on the basis of identified cost. Income and capital gain distributions from Fidelity Central Funds, if any, are recorded on the ex-dividend date. Interest income is accrued as earned and includes coupon interest and amortization of premium and accretion of discount on debt securities as applicable. The principal amount on inflation-indexed securities is periodically adjusted to the rate of inflation and interest is accrued based on the principal amount. The adjustments to principal due to inflation are reflected as increases or decreases to Interest in the accompanying Statement of Operations. Debt obligations may be placed on non-accrual status and related interest income may be reduced by ceasing current accruals and writing off interest receivables when the collection of all or a portion of interest has become doubtful based on consistently applied procedures. A debt obligation is removed from non-accrual status when the issuer resumes interest payments or when collectability of interest is reasonably assured.
Class Allocations and Expenses. Investment income, realized and unrealized capital gains and losses, common expenses of the Fund, and certain fund-level expense reductions, if any, are allocated daily on a pro-rata basis to each class based on the relative net assets of each class to the total net assets of the Fund. Each class differs with respect to transfer agent and distribution and service plan fees incurred. Certain expense reductions may also differ by class. For the reporting period, the allocated portion of income and expenses to each class as a percent of its average net assets may vary due to the timing of recording these transactions in relation to fluctuating net assets of the classes. Expenses directly attributable to a fund are charged to that fund. Expenses attributable to more than one fund are allocated among the respective funds on the basis of relative net assets or other appropriate methods. Expense estimates are accrued in the period to which they relate and adjustments are made when actual amounts are known.
Income Tax Information and Distributions to Shareholders. Each year, the Fund intends to qualify as a regulated investment company under Subchapter M of the Internal Revenue Code, including distributing substantially all of its taxable income and realized gains. As a result, no provision for U.S. Federal income taxes is required. The Fund files a U.S. federal tax return, in addition to state and local tax returns as required. The Fund's federal income tax returns are subject to examination by the Internal Revenue Service (IRS) for a period of three fiscal years after they are filed. State and local tax returns may be subject to examination for an additional fiscal year depending on the jurisdiction.
Distributions are declared and recorded on the ex-dividend date. Income dividends and capital gain distributions are declared separately for each class. Income and capital gain distributions are determined in accordance with income tax regulations, which may differ from GAAP.
Capital accounts within the financial statements are adjusted for permanent book-tax differences. These adjustments have no impact on net assets or the results of operations. Capital accounts are not adjusted for temporary book-tax differences which will reverse in a subsequent period.
Book-tax differences are primarily due to partnerships (including allocations from Fidelity Central Funds), market discount, short-term gain distributions from the Fidelity Central Funds, capital loss carryforwards, deferred trustees compensation and losses deferred due to wash sales.
The federal tax cost of investment securities and unrealized appreciation (depreciation) as of period end were as follows:
| Gross unrealized appreciation | $168,495,201 |
| Gross unrealized depreciation | (13,857,331) |
| Net unrealized appreciation (depreciation) on securities | $154,637,870 |
| Tax cost | $3,648,289,200 |
Capital loss carryforwards are only available to offset future capital gains of the Fund to the extent provided by regulations and may be limited. Under the Regulated Investment Company Modernization Act of 2010 (the Act), the Fund is permitted to carry forward capital losses incurred in taxable years beginning after December 22, 2010 for an unlimited period and such capital losses are required to be used prior to any losses that expire. The capital loss carryforward information presented below, including any applicable limitation, is estimated as of prior fiscal period end and is subject to adjustment.
| No expiration | |
| Short-term | $(7,828,852) |
| Long-term | (2,009,103) |
| Total capital loss carryforward | $(9,837,955) |
4. Purchases and Sales of Investments.
Purchases and sales of securities (including the Fixed-Income Central Funds), other than short-term securities and U.S. government securities, aggregated $94,474,620 and $129,407,159, respectively.
5. Fees and Other Transactions with Affiliates.
Management Fee. Fidelity Management & Research Company (the investment adviser) and its affiliates provide the Fund with investment management related services for which the Fund pays a monthly management fee. The management fee is the sum of an individual fund fee rate that is based on an annual rate of .20% of the Fund's average net assets and an annualized group fee rate that averaged .11% during the period. The group fee rate is based upon the average net assets of all the mutual funds advised by the investment adviser, including any mutual funds previously advised by the investment adviser that are currently advised by Fidelity SelectCo, LLC, an affiliate of the investment adviser. The group fee rate decreases as assets under management increase and increases as assets under management decrease. For the reporting period, the total annualized management fee rate was .31% of the Fund's average net assets.
Distribution and Service Plan Fees. In accordance with Rule 12b-1 of the 1940 Act, the Fund has adopted separate 12b-1 Plans for each Service Class of shares. Each Service Class pays Fidelity Distributors Corporation (FDC), an affiliate of the investment adviser, a service fee. For the period, the service fee is based on an annual rate of .10% of Service Class' average net assets and .25% of Service Class 2's average net assets.
For the period, total fees, all of which were re-allowed to insurance companies for the distribution of shares and providing shareholder support services, were as follows:
| Service Class | $259,686 |
| Service Class 2 | 1,500,324 |
| | $1,760,010 |
Transfer Agent Fees. Fidelity Investments Institutional Operations Company, Inc. (FIIOC), an affiliate of the investment adviser, is the Fund's transfer, dividend disbursing, and shareholder servicing agent. FIIOC receives an asset-based fee with respect to each class. Each class (with the exception of Investor Class) pays a fee for transfer agent services, typesetting, and printing and mailing of shareholder reports, excluding mailing of proxy statements, equal to an annual rate of .07% (.10% for Investor Class) of class-level average net assets. For the period, transfer agent fees for each class were as follows:
| Initial Class | $357,530 |
| Service Class | 176,587 |
| Service Class 2 | 408,088 |
| Investor Class | 423,670 |
| | $1,365,875 |
Accounting Fees. Fidelity Service Company, Inc. (FSC), an affiliate of the investment adviser, maintains the Fund's accounting records. The fee is based on the level of average net assets for each month.
Interfund Trades. The Fund may purchase from or sell securities to other Fidelity Funds under procedures adopted by the Board. The procedures have been designed to ensure these interfund trades are executed in accordance with Rule 17a-7 of the 1940 Act. Interfund trades are included within the respective purchases and sales amounts shown in the Purchases and Sales of Investments note.
6. Committed Line of Credit.
The Fund participates with other funds managed by the investment adviser or an affiliate in a $4.25 billion credit facility (the "line of credit") to be utilized for temporary or emergency purposes to fund shareholder redemptions or for other short-term liquidity purposes. The Fund has agreed to pay commitment fees on its pro-rata portion of the line of credit, which amounted to $3,198 and is reflected in Miscellaneous expenses on the Statement of Operations. During the period, the Fund did not borrow on this line of credit.
7. Expense Reductions.
Through arrangements with the Fund's custodian, credits realized as a result of certain uninvested cash balances were used to reduce the Fund's expenses. During the period, these credits reduced the Fund's custody expenses by $1.
In addition, during the period the investment adviser reimbursed and/or waived a portion of fund-level operating expenses in the amount of $7,297.
8. Distributions to Shareholders.
Distributions to shareholders of each class were as follows:
| | Six months ended
June 30, 2016 | Year ended December 31, 2015 |
| From net investment income | | |
| Initial Class | $580,203 | $27,917,082 |
| Service Class | 288,981 | 13,896,003 |
| Service Class 2 | 673,783 | 29,321,568 |
| Investor Class | 450,641 | 20,784,307 |
| Total | $1,993,608 | $91,918,960 |
| From net realized gain | | |
| Initial Class | $497,316 | $853,091 |
| Service Class | 247,698 | 402,324 |
| Service Class 2 | 577,528 | 868,374 |
| Investor Class | 386,264 | 609,337 |
| Total | $1,708,806 | $2,733,126 |
9. Share Transactions.
Transactions for each class of shares were as follows:
| | Shares | Shares | Dollars | Dollars |
| | Six months ended
June 30, 2016 | Year ended December 31, 2015 | Six months ended
June 30, 2016 | Year ended December 31, 2015 |
| Initial Class | | | | |
| Shares sold | 6,816,686 | 14,124,329 | $86,672,802 | $181,300,197 |
| Reinvestment of distributions | 86,967 | 2,307,903 | 1,077,519 | 28,770,173 |
| Shares redeemed | (9,893,358) | (15,849,228) | (125,158,270) | (203,182,390) |
| Net increase (decrease) | (2,989,705) | 583,004 | $(37,407,949) | $6,887,980 |
| Service Class | | | | |
| Shares sold | 3,168,583 | 16,473,822 | $39,884,566 | $209,904,413 |
| Reinvestment of distributions | 43,775 | 1,158,425 | 536,679 | 14,298,327 |
| Shares redeemed | (4,629,169) | (9,317,150) | (57,930,409) | (117,443,843) |
| Net increase (decrease) | (1,416,811) | 8,315,097 | $(17,509,164) | $106,758,897 |
| Service Class 2 | | | | |
| Shares sold | 11,369,492 | 25,136,170 | $142,565,550 | $316,191,051 |
| Reinvestment of distributions | 103,414 | 2,475,925 | 1,251,311 | 30,189,942 |
| Shares redeemed | (8,146,187) | (15,972,221) | (100,486,099) | (199,946,110) |
| Net increase (decrease) | 3,326,719 | 11,639,874 | $43,330,762 | $146,434,883 |
| Investor Class | | | | |
| Shares sold | 8,473,329 | 10,950,224 | $107,527,385 | $140,247,630 |
| Reinvestment of distributions | 67,821 | 1,721,835 | 836,905 | 21,393,644 |
| Shares redeemed | (3,707,523) | (7,902,704) | (46,529,565) | (100,860,266) |
| Net increase (decrease) | 4,833,627 | 4,769,355 | $61,834,725 | $60,781,008 |
10. Other.
The Fund's organizational documents provide former and current trustees and officers with a limited indemnification against liabilities arising in connection with the performance of their duties to the Fund. In the normal course of business, the Fund may also enter into contracts that provide general indemnifications. The Fund's maximum exposure under these arrangements is unknown as this would be dependent on future claims that may be made against the Fund. The risk of material loss from such claims is considered remote.
At the end of the period, the investment adviser or its affiliates were the owners of record of 24% of the total outstanding shares of the Fund and one otherwise unaffiliated shareholder was the owner of record of 21% of the total outstanding shares of the Fund.
VIP Investment Grade Bond Portfolio
Shareholder Expense Example
As a shareholder of the Fund, you incur two types of costs: (1) transaction costs and (2) ongoing costs, including management fees, distribution and/or service (12b-1) fees and other Fund expenses. This Example is intended to help you understand your ongoing costs (in dollars) of investing in the Fund and to compare these costs with the ongoing costs of investing in other mutual funds.
The Example is based on an investment of $1,000 invested at the beginning of the period and held for the entire period (January 1, 2016 to June 30, 2016).
Actual Expenses
The first line of the accompanying table for each class of the Fund provides information about actual account values and actual expenses. You may use the information in this line, together with the amount you invested, to estimate the expenses that you paid over the period. Simply divide your account value by $1,000.00 (for example, an $8,600 account value divided by $1,000.00 = 8.6), then multiply the result by the number in the first line for a class of the Fund under the heading entitled "Expenses Paid During Period" to estimate the expenses you paid on your account during this period. The estimate of expenses does not include any fees or other expenses of any variable annuity or variable life insurance product. If they were, the estimate of expenses you paid during the period would be higher, and your ending account value would be lower. In addition, the Fund, as a shareholder in the underlying Fidelity Central Funds, will indirectly bear its pro-rata share of the fees and expenses incurred by the underlying Fidelity Central Funds. These fees and expenses are not included in the Fund's annualized expense ratio used to calculate the expense estimate in the table below.
Hypothetical Example for Comparison Purposes
The second line of the accompanying table for each class of the Fund provides information about hypothetical account values and hypothetical expenses based on a Class' actual expense ratio and an assumed rate of return of 5% per year before expenses, which is not the Class' actual return. The hypothetical account values and expenses may not be used to estimate the actual ending account balance or expenses you paid for the period. You may use this information to compare the ongoing costs of investing in the Fund and other funds. To do so, compare this 5% hypothetical example with the 5% hypothetical examples that appear in the shareholder reports of the other funds. The estimate of expenses does not include any fees or other expenses of any variable annuity or variable life insurance product. If they were, the estimate of expenses you paid during the period would be higher, and your ending account value would be lower. In addition, the Fund, as a shareholder in the underlying Fidelity Central Funds, will indirectly bear its pro-rata share of the fees and expenses incurred by the underlying Fidelity Central Funds. These fees and expenses are not included in the Fund's annualized expense ratio used to calculate the expense estimate in the table below.
Please note that the expenses shown in the table are meant to highlight your ongoing costs only and do not reflect any transaction costs. Therefore, the second line of the table is useful in comparing ongoing costs only, and will not help you determine the relative total costs of owning different funds.
| | Annualized Expense Ratio-A | Beginning
Account Value
January 1, 2016 | Ending
Account Value
June 30, 2016 | Expenses Paid
During Period-B
January 1, 2016
to June 30, 2016 |
| Initial Class | .42% | | | |
| Actual | | $1,000.00 | $1,059.30 | $2.15 |
| Hypothetical-C | | $1,000.00 | $1,022.77 | $2.11 |
| Service Class | .52% | | | |
| Actual | | $1,000.00 | $1,059.10 | $2.66 |
| Hypothetical-C | | $1,000.00 | $1,022.28 | $2.61 |
| Service Class 2 | .67% | | | |
| Actual | | $1,000.00 | $1,058.20 | $3.43 |
| Hypothetical-C | | $1,000.00 | $1,021.53 | $3.37 |
| Investor Class | .45% | | | |
| Actual | | $1,000.00 | $1,059.60 | $2.30 |
| Hypothetical-C | | $1,000.00 | $1,022.63 | $2.26 |
A Annualized expense ratio reflects expenses net of applicable fee waivers.
B Expenses are equal to each Class' annualized expense ratio, multiplied by the average account value over the period, multiplied by 182/366 (to reflect the one-half year period). The fees and expenses of the underlying Fidelity Central Funds in which the Fund invests are not included in each Class' annualized expense ratio. In addition to the expenses noted above, the Fund also indirectly bears its proportional share of the expenses of the underlying Fidelity Central Funds. Annualized expenses of the underlying non-money market Fidelity Central Funds as of their most recent fiscal half year were less than .005%.
C 5% return per year before expenses
The following are the financial statements for the Fidelity® VIP Investment Grade Central Fund as of June 30, 2016 which is a direct investment of VIP Investment Grade Bond Portfolio.
Fidelity® VIP Investment Grade Central Fund
Investment Summary (Unaudited)
Quality Diversification (% of fund's net assets)
| As of June 30, 2016 |
| | U.S. Government and U.S. Government Agency Obligations | 44.5% |
| | AAA | 3.0% |
| | AA | 2.8% |
| | A | 8.4% |
| | BBB | 32.3% |
| | BB and Below | 10.7% |
| | Not Rated | 0.1% |
| | Short-Term Investments and Net Other Assets* | (1.8)% |
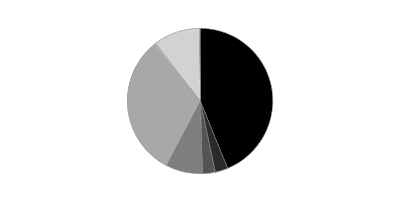
* Short-Term Investments and Net Other Assets (Liabilities) are not included in the pie chart
| As of December 31, 2015 |
| | U.S. Government and U.S. Government Agency Obligations | 33.8% |
| | AAA | 3.4% |
| | AA | 4.2% |
| | A | 12.2% |
| | BBB | 36.8% |
| | BB and Below | 7.2% |
| | Not Rated | 0.1% |
| | Short-Term Investments and Net Other Assets | 2.3% |
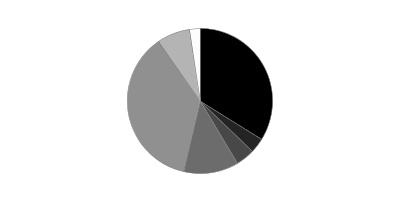
We have used ratings from Moody's Investors Service, Inc. Where Moody's® ratings are not available, we have used S&P® ratings. All ratings are as of the date indicated and do not reflect subsequent changes. Securities rated BB or below were rated investment grade at the time of acquisition.
Asset Allocation (% of fund's net assets)
| As of June 30, 2016*,** |
| | Corporate Bonds | 46.1% |
| | U.S. Government and U.S. Government Agency Obligations | 44.5% |
| | Asset-Backed Securities | 1.1% |
| | CMOs and Other Mortgage Related Securities | 5.3% |
| | Municipal Bonds | 3.3% |
| | Other Investments | 1.5% |
| | Short-Term Investments and Net Other Assets (Liabilities)*** | (1.8)% |
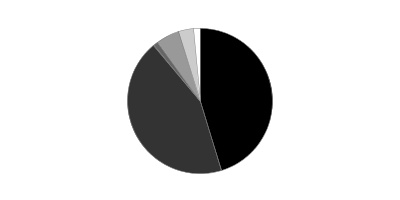
* Futures and Swaps - 0.0%
** Foreign investments - 11.8%
*** Short-Term Investments and Net Other Assets (Liabilities) are not included in the pie chart
| As of December 31, 2015 *,** |
| | Corporate Bonds | 49.7% |
| | U.S. Government and U.S. Government Agency Obligations | 33.8% |
| | Asset-Backed Securities | 1.1% |
| | CMOs and Other Mortgage Related Securities | 7.0% |
| | Municipal Bonds | 4.5% |
| | Other Investments | 1.6% |
| | Short-Term Investments and Net Other Assets (Liabilities) | 2.3% |

* Foreign investments - 13.6%
** Futures and Swaps - 0.0%
Percentages in the above tables are adjusted for the effect of TBA Sale Commitments.
Percentages shown as 0.0% may reflect amounts less than 0.05%.
Fidelity® VIP Investment Grade Central Fund
Investments June 30, 2016
Showing Percentage of Net Assets
| Nonconvertible Bonds - 46.1% | | | |
| | | Principal Amount | Value |
| CONSUMER DISCRETIONARY - 3.7% | | | |
| Automobiles - 1.3% | | | |
| Daimler Finance North America LLC 1.45% 8/1/16 (a) | | $2,724,000 | $2,725,144 |
| General Motors Co.: | | | |
| 3.5% 10/2/18 | | 3,528,000 | 3,632,341 |
| 5.2% 4/1/45 | | 1,863,000 | 1,846,891 |
| 6.25% 10/2/43 | | 599,000 | 665,792 |
| 6.6% 4/1/36 | | 2,299,000 | 2,637,567 |
| 6.75% 4/1/46 | | 3,855,000 | 4,575,573 |
| General Motors Financial Co., Inc.: | | | |
| 2.625% 7/10/17 | | 1,120,000 | 1,130,364 |
| 3.2% 7/13/20 | | 10,000,000 | 10,131,610 |
| 3.25% 5/15/18 | | 1,860,000 | 1,898,554 |
| 3.5% 7/10/19 | | 4,187,000 | 4,332,477 |
| 4.2% 3/1/21 | | 5,411,000 | 5,661,291 |
| 4.25% 5/15/23 | | 2,080,000 | 2,139,355 |
| 4.375% 9/25/21 | | 15,702,000 | 16,571,388 |
| 4.75% 8/15/17 | | 1,940,000 | 2,001,781 |
| | | | 59,950,128 |
| Diversified Consumer Services - 0.1% | | | |
| Ingersoll-Rand Global Holding Co. Ltd.: | | | |
| 2.875% 1/15/19 | | 416,000 | 430,811 |
| 4.25% 6/15/23 | | 2,932,000 | 3,256,115 |
| | | | 3,686,926 |
| Hotels, Restaurants & Leisure - 0.1% | | | |
| McDonald's Corp.: | | | |
| 2.75% 12/9/20 | | 910,000 | 950,136 |
| 3.7% 1/30/26 | | 2,400,000 | 2,594,371 |
| 4.7% 12/9/35 | | 1,239,000 | 1,398,417 |
| 4.875% 12/9/45 | | 1,944,000 | 2,266,696 |
| | | | 7,209,620 |
| Media - 2.2% | | | |
| 21st Century Fox America, Inc.: | | | |
| 6.15% 2/15/41 | | 3,454,000 | 4,317,921 |
| 7.75% 12/1/45 | | 3,169,000 | 4,631,883 |
| AOL Time Warner, Inc.: | | | |
| 2.95% 7/15/26 | | 12,000,000 | 12,097,008 |
| 7.625% 4/15/31 | | 1,625,000 | 2,230,293 |
| Charter Communications Operating LLC/Charter Communications Operating Capital Corp.: | | | |
| 4.464% 7/23/22 (a) | | 5,742,000 | 6,182,256 |
| 4.908% 7/23/25 (a) | | 3,860,000 | 4,207,002 |
| 6.484% 10/23/45 (a) | | 1,317,000 | 1,573,483 |
| Discovery Communications LLC: | | | |
| 3.25% 4/1/23 | | 604,000 | 594,821 |
| 6.35% 6/1/40 | | 2,421,000 | 2,498,034 |
| Thomson Reuters Corp.: | | | |
| 1.3% 2/23/17 | | 1,374,000 | 1,374,235 |
| 3.85% 9/29/24 | | 3,379,000 | 3,602,504 |
| Time Warner Cable, Inc.: | | | |
| 4% 9/1/21 | | 7,363,000 | 7,821,803 |
| 4.5% 9/15/42 | | 1,053,000 | 982,017 |
| 5.5% 9/1/41 | | 1,700,000 | 1,784,337 |
| 5.85% 5/1/17 | | 1,239,000 | 1,282,592 |
| 5.875% 11/15/40 | | 1,500,000 | 1,634,405 |
| 6.55% 5/1/37 | | 18,635,000 | 21,742,945 |
| 6.75% 7/1/18 | | 4,425,000 | 4,854,446 |
| 7.3% 7/1/38 | | 3,781,000 | 4,737,173 |
| 8.25% 4/1/19 | | 7,716,000 | 8,959,827 |
| Time Warner, Inc. 6.5% 11/15/36 | | 2,337,000 | 2,965,214 |
| Viacom, Inc.: | | | |
| 2.5% 9/1/18 | | 546,000 | 553,586 |
| 3.5% 4/1/17 | | 1,312,000 | 1,330,661 |
| | | | 101,958,446 |
|
| TOTAL CONSUMER DISCRETIONARY | | | 172,805,120 |
|
| CONSUMER STAPLES - 2.1% | | | |
| Beverages - 1.0% | | | |
| Anheuser-Busch InBev Finance, Inc.: | | | |
| 2.65% 2/1/21 | | 9,870,000 | 10,227,876 |
| 3.3% 2/1/23 | | 10,630,000 | 11,183,568 |
| 4.7% 2/1/36 | | 10,065,000 | 11,323,759 |
| 4.9% 2/1/46 | | 11,511,000 | 13,483,617 |
| | | | 46,218,820 |
| Food & Staples Retailing - 0.2% | | | |
| CVS Health Corp. 3.5% 7/20/22 | | 2,525,000 | 2,718,988 |
| Walgreens Boots Alliance, Inc.: | | | |
| 2.7% 11/18/19 | | 2,460,000 | 2,541,960 |
| 3.3% 11/18/21 | | 2,918,000 | 3,060,285 |
| | | | 8,321,233 |
| Food Products - 0.0% | | | |
| ConAgra Foods, Inc. 1.9% 1/25/18 | | 1,554,000 | 1,566,283 |
| Tobacco - 0.9% | | | |
| Altria Group, Inc. 4% 1/31/24 | | 2,227,000 | 2,492,478 |
| Imperial Tobacco Finance PLC: | | | |
| 3.75% 7/21/22 (a) | | 4,804,000 | 5,070,291 |
| 4.25% 7/21/25 (a) | | 4,804,000 | 5,202,910 |
| Reynolds American, Inc.: | | | |
| 2.3% 6/12/18 | | 2,110,000 | 2,144,144 |
| 3.25% 6/12/20 | | 939,000 | 992,688 |
| 4% 6/12/22 | | 3,228,000 | 3,508,597 |
| 4.45% 6/12/25 | | 2,341,000 | 2,615,632 |
| 5.7% 8/15/35 | | 1,215,000 | 1,479,514 |
| 5.85% 8/15/45 | | 9,320,000 | 11,916,347 |
| 6.15% 9/15/43 | | 4,000,000 | 5,228,088 |
| 7.25% 6/15/37 | | 2,962,000 | 4,028,018 |
| | | | 44,678,707 |
|
| TOTAL CONSUMER STAPLES | | | 100,785,043 |
|
| ENERGY - 7.8% | | | |
| Energy Equipment & Services - 0.5% | | | |
| DCP Midstream LLC: | | | |
| 4.75% 9/30/21 (a) | | 3,739,000 | 3,495,965 |
| 5.35% 3/15/20 (a) | | 3,724,000 | 3,649,520 |
| El Paso Pipeline Partners Operating Co. LLC 5% 10/1/21 | | 1,517,000 | 1,606,670 |
| Halliburton Co.: | | | |
| 3.8% 11/15/25 | | 2,467,000 | 2,564,395 |
| 4.85% 11/15/35 | | 2,154,000 | 2,333,717 |
| 5% 11/15/45 | | 2,951,000 | 3,217,207 |
| Noble Holding International Ltd.: | | | |
| 5% 3/16/18 (b) | | 342,000 | 336,870 |
| 6.95% 4/1/25 (b) | | 2,180,000 | 1,738,550 |
| 7.95% 4/1/45 | | 2,104,000 | 1,478,060 |
| Transocean, Inc. 5.55% 12/15/16 (b) | | 2,488,000 | 2,512,880 |
| | | | 22,933,834 |
| Oil, Gas & Consumable Fuels - 7.3% | | | |
| Anadarko Finance Co. 7.5% 5/1/31 | | 2,626,000 | 3,145,888 |
| Anadarko Petroleum Corp.: | | | |
| 4.85% 3/15/21 | | 1,620,000 | 1,718,365 |
| 5.55% 3/15/26 | | 3,337,000 | 3,686,724 |
| 6.375% 9/15/17 | | 991,000 | 1,043,087 |
| 6.6% 3/15/46 | | 4,530,000 | 5,473,332 |
| BP Capital Markets PLC: | | | |
| 4.5% 10/1/20 | | 1,811,000 | 2,006,787 |
| 4.742% 3/11/21 | | 3,000,000 | 3,370,164 |
| Canadian Natural Resources Ltd.: | | | |
| 1.75% 1/15/18 | | 1,762,000 | 1,745,170 |
| 3.8% 4/15/24 | | 6,783,000 | 6,696,456 |
| Cenovus Energy, Inc. 5.7% 10/15/19 | | 3,719,000 | 3,933,627 |
| Columbia Pipeline Group, Inc.: | | | |
| 2.45% 6/1/18 | | 894,000 | 896,882 |
| 3.3% 6/1/20 | | 4,379,000 | 4,527,904 |
| 4.5% 6/1/25 | | 1,336,000 | 1,436,750 |
| ConocoPhillips Co. 5.75% 2/1/19 | | 3,900,000 | 4,290,632 |
| DCP Midstream Operating LP: | | | |
| 2.5% 12/1/17 | | 1,990,000 | 1,945,225 |
| 2.7% 4/1/19 | | 4,300,000 | 4,120,294 |
| 3.875% 3/15/23 | | 1,771,000 | 1,611,610 |
| 5.6% 4/1/44 | | 1,227,000 | 1,049,085 |
| Duke Energy Field Services 6.45% 11/3/36 (a) | | 2,477,000 | 2,167,375 |
| El Paso Natural Gas Co. 5.95% 4/15/17 | | 3,330,000 | 3,427,726 |
| Empresa Nacional de Petroleo 4.375% 10/30/24 (a) | | 3,540,000 | 3,660,732 |
| Enable Midstream Partners LP: | | | |
| 2.4% 5/15/19 | | 1,253,000 | 1,176,554 |
| 3.9% 5/15/24 | | 1,322,000 | 1,178,825 |
| Enbridge Energy Partners LP: | | | |
| 4.2% 9/15/21 | | 4,399,000 | 4,511,870 |
| 4.375% 10/15/20 | | 3,093,000 | 3,174,634 |
| EnLink Midstream Partners LP 2.7% 4/1/19 | | 6,288,000 | 6,111,471 |
| Enterprise Products Operating LP: | | | |
| 1.65% 5/7/18 | | 1,969,000 | 1,973,674 |
| 2.55% 10/15/19 | | 863,000 | 886,815 |
| 3.7% 2/15/26 | | 4,800,000 | 5,025,792 |
| 3.75% 2/15/25 | | 2,900,000 | 3,026,031 |
| Kinder Morgan Energy Partners LP: | | | |
| 2.65% 2/1/19 | | 409,000 | 408,824 |
| 3.45% 2/15/23 | | 4,918,000 | 4,783,021 |
| 3.95% 9/1/22 | | 3,454,000 | 3,515,619 |
| 4.25% 9/1/24 | | 813,000 | 823,536 |
| 6.55% 9/15/40 | | 460,000 | 479,837 |
| Kinder Morgan, Inc. 3.05% 12/1/19 | | 1,197,000 | 1,209,501 |
| Marathon Petroleum Corp. 5.125% 3/1/21 | | 2,187,000 | 2,418,656 |
| Motiva Enterprises LLC 5.75% 1/15/20 (a) | | 1,496,000 | 1,636,798 |
| MPLX LP 4% 2/15/25 | | 683,000 | 620,687 |
| Nakilat, Inc. 6.067% 12/31/33 (a) | | 1,808,000 | 2,020,440 |
| Petro-Canada 6.05% 5/15/18 | | 1,480,000 | 1,591,699 |
| Petrobras Global Finance BV: | | | |
| 3% 1/15/19 | | 417,000 | 386,351 |
| 4.375% 5/20/23 | | 7,020,000 | 5,701,644 |
| 4.875% 3/17/20 | | 21,747,000 | 20,387,813 |
| 5.625% 5/20/43 | | 6,681,000 | 4,743,510 |
| 7.25% 3/17/44 | | 24,245,000 | 19,880,900 |
| Petrobras International Finance Co. Ltd.: | | | |
| 5.375% 1/27/21 | | 17,294,000 | 15,840,439 |
| 5.75% 1/20/20 | | 6,461,000 | 6,241,972 |
| 7.875% 3/15/19 | | 4,277,000 | 4,416,003 |
| Petroleos Mexicanos: | | | |
| 3.125% 1/23/19 | | 642,000 | 640,395 |
| 3.5% 7/18/18 | | 5,440,000 | 5,475,360 |
| 3.5% 7/23/20 | | 32,555,000 | 32,526,026 |
| 3.5% 1/30/23 | | 3,410,000 | 3,210,856 |
| 4.5% 1/23/26 | | 6,809,000 | 6,552,982 |
| 4.875% 1/24/22 | | 3,398,000 | 3,474,081 |
| 4.875% 1/18/24 | | 4,539,000 | 4,601,638 |
| 5.5% 1/21/21 | | 3,601,000 | 3,813,099 |
| 5.5% 6/27/44 | | 7,799,000 | 7,046,786 |
| 5.625% 1/23/46 | | 8,402,000 | 7,658,423 |
| 6% 3/5/20 | | 1,625,000 | 1,748,500 |
| 6.375% 1/23/45 | | 4,048,000 | 4,068,240 |
| 6.5% 6/2/41 | | 7,675,000 | 7,770,938 |
| 8% 5/3/19 | | 2,537,000 | 2,826,370 |
| Phillips 66 Co. 4.3% 4/1/22 | | 3,770,000 | 4,118,077 |
| Phillips 66 Partners LP 2.646% 2/15/20 | | 375,000 | 377,082 |
| Plains All American Pipeline LP/PAA Finance Corp.: | | | |
| 3.65% 6/1/22 | | 1,784,000 | 1,749,753 |
| 6.125% 1/15/17 | | 1,250,000 | 1,281,419 |
| Shell International Finance BV 4.375% 5/11/45 | | 10,660,000 | 11,557,551 |
| Southwestern Energy Co.: | | | |
| 3.3% 1/23/18 | | 1,762,000 | 1,800,764 |
| 4.05% 1/23/20 | | 3,196,000 | 3,140,070 |
| 4.95% 1/23/25 | | 2,509,000 | 2,402,368 |
| Spectra Energy Capital, LLC 3.3% 3/15/23 | | 5,000,000 | 4,805,955 |
| Spectra Energy Partners LP 2.95% 9/25/18 | | 733,000 | 747,057 |
| Suncor Energy, Inc. 6.1% 6/1/18 | | 4,665,000 | 5,044,521 |
| The Williams Companies, Inc.: | | | |
| 3.7% 1/15/23 | | 1,208,000 | 1,069,080 |
| 4.55% 6/24/24 | | 13,337,000 | 12,250,035 |
| Western Gas Partners LP: | | | |
| 4.65% 7/1/26 (c) | | 1,132,000 | 1,129,691 |
| 5.375% 6/1/21 | | 4,325,000 | 4,560,483 |
| Williams Partners LP: | | | |
| 3.6% 3/15/22 | | 3,522,000 | 3,334,513 |
| 3.9% 1/15/25 | | 1,216,000 | 1,105,777 |
| 4% 11/15/21 | | 1,605,000 | 1,565,653 |
| 4.3% 3/4/24 | | 5,449,000 | 5,128,234 |
| 4.5% 11/15/23 | | 1,751,000 | 1,679,992 |
| | | | 346,388,500 |
|
| TOTAL ENERGY | | | 369,322,334 |
|
| FINANCIALS - 23.6% | | | |
| Banks - 10.6% | | | |
| Banco Nacional de Desenvolvimento Economico e Social: | | | |
| 3.375% 9/26/16 (a) | | 4,235,000 | 4,232,883 |
| 4% 4/14/19 (a) | | 5,277,000 | 5,208,399 |
| 5.5% 7/12/20 (a) | | 28,200,000 | 29,046,000 |
| 5.75% 9/26/23 (a) | | 3,877,000 | 3,971,987 |
| 6.5% 6/10/19 (a) | | 1,340,000 | 1,413,700 |
| Bank of America Corp.: | | | |
| 2.25% 4/21/20 | | 3,337,000 | 3,355,947 |
| 2.6% 1/15/19 | | 7,155,000 | 7,321,490 |
| 3.875% 8/1/25 | | 2,860,000 | 3,044,035 |
| 3.95% 4/21/25 | | 6,646,000 | 6,757,294 |
| 4% 1/22/25 | | 1,403,000 | 1,431,526 |
| 4.2% 8/26/24 | | 6,867,000 | 7,101,645 |
| 4.25% 10/22/26 | | 4,261,000 | 4,421,371 |
| 4.45% 3/3/26 | | 5,024,000 | 5,257,405 |
| 5.75% 12/1/17 | | 12,290,000 | 13,008,252 |
| 5.875% 1/5/21 | | 1,785,000 | 2,047,895 |
| Barclays PLC: | | | |
| 2% 3/16/18 | | 17,646,000 | 17,510,108 |
| 2.75% 11/8/19 | | 3,581,000 | 3,555,729 |
| 3.25% 1/12/21 | | 4,610,000 | 4,593,851 |
| 4.375% 1/12/26 | | 6,221,000 | 6,281,344 |
| Capital One NA 2.95% 7/23/21 | | 5,645,000 | 5,801,525 |
| Citigroup, Inc.: | | | |
| 1.8% 2/5/18 | | 68,000,000 | 68,299,812 |
| 1.85% 11/24/17 | | 8,579,000 | 8,626,408 |
| 2.15% 7/30/18 | | 9,998,000 | 10,119,866 |
| 3.875% 3/26/25 | | 9,500,000 | 9,600,529 |
| 4.05% 7/30/22 | | 1,800,000 | 1,902,740 |
| 4.3% 11/20/26 | | 9,000,000 | 9,277,254 |
| 5.5% 9/13/25 | | 1,663,000 | 1,864,991 |
| Citizens Bank NA 2.55% 5/13/21 | | 1,560,000 | 1,575,232 |
| Citizens Financial Group, Inc. 4.15% 9/28/22 (a) | | 4,857,000 | 5,060,159 |
| Credit Suisse Group Funding Guernsey Ltd.: | | | |
| 2.75% 3/26/20 | | 4,667,000 | 4,608,126 |
| 3.75% 3/26/25 | | 4,660,000 | 4,563,128 |
| 3.8% 9/15/22 | | 7,240,000 | 7,272,254 |
| 3.8% 6/9/23 (a) | | 8,582,000 | 8,564,982 |
| Discover Bank: | | | |
| 4.2% 8/8/23 | | 2,849,000 | 3,012,607 |
| 7% 4/15/20 | | 2,309,000 | 2,629,937 |
| Fifth Third Bancorp: | | | |
| 2.875% 7/27/20 | | 3,000,000 | 3,126,480 |
| 4.5% 6/1/18 | | 1,179,000 | 1,240,943 |
| 8.25% 3/1/38 | | 4,319,000 | 6,459,315 |
| HBOS PLC 6.75% 5/21/18 (a) | | 2,600,000 | 2,788,768 |
| HSBC Holdings PLC 4.25% 3/14/24 | | 2,200,000 | 2,227,993 |
| HSBC U.S.A., Inc. 1.625% 1/16/18 | | 3,721,000 | 3,714,369 |
| Huntington Bancshares, Inc. 7% 12/15/20 | | 1,004,000 | 1,178,207 |
| Intesa Sanpaolo SpA: | | | |
| 5.017% 6/26/24 (a) | | 3,027,000 | 2,782,004 |
| 5.71% 1/15/26 (a) | | 6,992,000 | 6,632,255 |
| JPMorgan Chase & Co.: | | | |
| 2.75% 6/23/20 | | 5,755,000 | 5,930,660 |
| 3.875% 9/10/24 | | 48,329,000 | 50,002,875 |
| 4.125% 12/15/26 | | 22,108,000 | 23,436,470 |
| MUFG Americas Holdings Corp. 2.25% 2/10/20 | | 4,493,000 | 4,525,808 |
| PNC Bank NA 2.3% 6/1/20 | | 1,450,000 | 1,485,473 |
| Rabobank Nederland 4.375% 8/4/25 | | 7,451,000 | 7,786,481 |
| Regions Bank 6.45% 6/26/37 | | 7,720,000 | 9,217,441 |
| Regions Financial Corp.: | | | |
| 2% 5/15/18 | | 4,497,000 | 4,504,861 |
| 3.2% 2/8/21 | | 2,833,000 | 2,916,293 |
| Royal Bank of Canada 4.65% 1/27/26 | | 5,314,000 | 5,688,515 |
| Royal Bank of Scotland Group PLC: | | | |
| 5.125% 5/28/24 | | 42,740,000 | 41,692,870 |
| 6% 12/19/23 | | 8,517,000 | 8,657,675 |
| 6.1% 6/10/23 | | 11,522,000 | 11,788,193 |
| 6.125% 12/15/22 | | 8,239,000 | 8,641,417 |
| | | | 498,765,777 |
| Capital Markets - 5.0% | | | |
| Affiliated Managers Group, Inc.: | | | |
| 3.5% 8/1/25 | | 5,125,000 | 5,122,110 |
| 4.25% 2/15/24 | | 4,287,000 | 4,539,702 |
| Credit Suisse AG 6% 2/15/18 | | 6,486,000 | 6,852,323 |
| Deutsche Bank AG 4.5% 4/1/25 | | 10,381,000 | 9,599,840 |
| Deutsche Bank AG London Branch: | | | |
| 1.875% 2/13/18 | | 24,542,000 | 24,388,343 |
| 2.85% 5/10/19 | | 9,310,000 | 9,319,012 |
| Goldman Sachs Group, Inc.: | | | |
| 1.748% 9/15/17 | | 13,467,000 | 13,502,445 |
| 2.55% 10/23/19 | | 59,670,000 | 61,051,659 |
| 2.625% 1/31/19 | | 16,652,000 | 17,042,789 |
| 2.9% 7/19/18 | | 6,251,000 | 6,414,589 |
| 5.25% 7/27/21 | | 1,125,000 | 1,271,055 |
| 5.625% 1/15/17 | | 3,000,000 | 3,066,156 |
| 5.95% 1/18/18 | | 755,000 | 804,292 |
| 6.15% 4/1/18 | | 5,954,000 | 6,418,108 |
| Lazard Group LLC: | | | |
| 4.25% 11/14/20 | | 3,307,000 | 3,520,338 |
| 6.85% 6/15/17 | | 689,000 | 720,533 |
| Morgan Stanley: | | | |
| 1.875% 1/5/18 | | 4,357,000 | 4,382,061 |
| 2.125% 4/25/18 | | 4,257,000 | 4,301,554 |
| 2.65% 1/27/20 | | 15,070,000 | 15,319,740 |
| 4.875% 11/1/22 | | 7,751,000 | 8,488,864 |
| 5% 11/24/25 | | 1,047,000 | 1,145,993 |
| 5.75% 1/25/21 | | 3,512,000 | 4,004,579 |
| 6.625% 4/1/18 | | 10,165,000 | 11,020,436 |
| Peachtree Corners Funding Trust 3.976% 2/15/25 (a) | | 5,000,000 | 5,015,260 |
| UBS AG Stamford Branch: | | | |
| 1.375% 6/1/17 | | 3,574,000 | 3,579,429 |
| 2.35% 3/26/20 | | 1,450,000 | 1,485,364 |
| UBS Group Funding Ltd. 4.125% 9/24/25 (a) | | 5,261,000 | 5,463,706 |
| | | | 237,840,280 |
| Consumer Finance - 0.9% | | | |
| Discover Financial Services: | | | |
| 3.85% 11/21/22 | | 5,040,000 | 5,119,289 |
| 3.95% 11/6/24 | | 2,847,000 | 2,919,268 |
| Ford Motor Credit Co. LLC: | | | |
| 2.24% 6/15/18 | | 5,000,000 | 5,049,200 |
| 2.875% 10/1/18 | | 4,500,000 | 4,616,685 |
| Hyundai Capital America: | | | |
| 1.45% 2/6/17 (a) | | 5,241,000 | 5,247,258 |
| 1.875% 8/9/16 (a) | | 1,083,000 | 1,083,563 |
| 2% 3/19/18 (a) | | 6,308,000 | 6,347,551 |
| 2.125% 10/2/17 (a) | | 4,770,000 | 4,800,356 |
| 2.875% 8/9/18 (a) | | 1,921,000 | 1,968,493 |
| Synchrony Financial: | | | |
| 1.875% 8/15/17 | | 994,000 | 995,558 |
| 3% 8/15/19 | | 1,459,000 | 1,487,789 |
| 3.75% 8/15/21 | | 2,203,000 | 2,282,416 |
| 4.25% 8/15/24 | | 2,218,000 | 2,296,446 |
| | | | 44,213,872 |
| Diversified Financial Services - 0.2% | | | |
| Brixmor Operating Partnership LP: | | | |
| 3.875% 8/15/22 | | 3,297,000 | 3,387,684 |
| 4.125% 6/15/26 | | 2,032,000 | 2,086,407 |
| IntercontinentalExchange, Inc.: | | | |
| 2.75% 12/1/20 | | 1,628,000 | 1,710,472 |
| 3.75% 12/1/25 | | 2,910,000 | 3,154,627 |
| | | | 10,339,190 |
| Insurance - 2.1% | | | |
| ACE INA Holdings, Inc. 2.875% 11/3/22 | | 2,975,000 | 3,112,386 |
| AIA Group Ltd. 2.25% 3/11/19 (a) | | 913,000 | 924,716 |
| American International Group, Inc.: | | | |
| 3.3% 3/1/21 | | 2,355,000 | 2,454,984 |
| 3.75% 7/10/25 | | 8,311,000 | 8,474,619 |
| 4.875% 6/1/22 | | 3,597,000 | 4,007,087 |
| Aon Corp. 5% 9/30/20 | | 1,402,000 | 1,566,026 |
| Five Corners Funding Trust 4.419% 11/15/23 (a) | | 4,110,000 | 4,437,435 |
| Liberty Mutual Group, Inc. 5% 6/1/21 (a) | | 4,093,000 | 4,520,035 |
| Marsh & McLennan Companies, Inc. 4.8% 7/15/21 | | 2,278,000 | 2,526,336 |
| Massachusetts Mutual Life Insurance Co. 4.5% 4/15/65 (a) | | 5,285,000 | 5,054,822 |
| MetLife, Inc.: | | | |
| 1.903% 12/15/17 (b) | | 886,000 | 894,025 |
| 4.368% 9/15/23 | | 3,574,000 | 3,958,212 |
| 4.75% 2/8/21 | | 1,477,000 | 1,649,488 |
| Metropolitan Life Global Funding I 3% 1/10/23 (a) | | 2,636,000 | 2,703,484 |
| Pacific Life Insurance Co. 9.25% 6/15/39 (a) | | 2,297,000 | 3,484,485 |
| Pacific LifeCorp: | | | |
| 5.125% 1/30/43 (a) | | 5,252,000 | 5,753,965 |
| 6% 2/10/20 (a) | | 5,271,000 | 5,893,458 |
| Prudential Financial, Inc.: | | | |
| 2.3% 8/15/18 | | 599,000 | 611,326 |
| 4.5% 11/16/21 | | 2,157,000 | 2,422,958 |
| 6.2% 11/15/40 | | 1,297,000 | 1,597,372 |
| 7.375% 6/15/19 | | 1,250,000 | 1,450,199 |
| Teachers Insurance & Annuity Association of America 4.9% 9/15/44 (a) | | 5,347,000 | 5,940,603 |
| TIAA Asset Management Finance LLC: | | | |
| 2.95% 11/1/19 (a) | | 1,222,000 | 1,251,888 |
| 4.125% 11/1/24 (a) | | 1,771,000 | 1,861,261 |
| Unum Group: | | | |
| 3.875% 11/5/25 | | 4,860,000 | 4,951,436 |
| 4% 3/15/24 | | 5,930,000 | 6,125,310 |
| 5.625% 9/15/20 | | 2,889,000 | 3,243,856 |
| 5.75% 8/15/42 | | 7,278,000 | 8,040,683 |
| | | | 98,912,455 |
| Real Estate Investment Trusts - 2.8% | | | |
| Alexandria Real Estate Equities, Inc.: | | | |
| 2.75% 1/15/20 | | 879,000 | 886,775 |
| 4.6% 4/1/22 | | 1,403,000 | 1,517,944 |
| American Campus Communities Operating Partnership LP 3.75% 4/15/23 | | 1,184,000 | 1,222,424 |
| American Tower Corp. 2.8% 6/1/20 | | 9,000,000 | 9,210,744 |
| AvalonBay Communities, Inc.: | | | |
| 3.625% 10/1/20 | | 1,872,000 | 1,998,328 |
| 4.2% 12/15/23 | | 4,000,000 | 4,404,348 |
| Boston Properties, Inc. 3.85% 2/1/23 | | 4,708,000 | 5,040,022 |
| Camden Property Trust: | | | |
| 2.95% 12/15/22 | | 1,607,000 | 1,625,154 |
| 4.25% 1/15/24 | | 3,408,000 | 3,692,786 |
| Corporate Office Properties LP 5% 7/1/25 | | 2,283,000 | 2,407,823 |
| DDR Corp.: | | | |
| 3.625% 2/1/25 | | 2,136,000 | 2,143,337 |
| 4.25% 2/1/26 | | 1,807,000 | 1,895,341 |
| 4.625% 7/15/22 | | 2,855,000 | 3,087,640 |
| 4.75% 4/15/18 | | 3,691,000 | 3,850,938 |
| 7.5% 4/1/17 | | 1,944,000 | 2,026,542 |
| Duke Realty LP: | | | |
| 3.25% 6/30/26 | | 731,000 | 741,539 |
| 3.625% 4/15/23 | | 2,123,000 | 2,215,830 |
| 3.75% 12/1/24 | | 1,576,000 | 1,656,863 |
| 3.875% 10/15/22 | | 3,512,000 | 3,724,111 |
| 4.375% 6/15/22 | | 2,340,000 | 2,542,906 |
| 5.95% 2/15/17 | | 86,000 | 88,410 |
| 6.5% 1/15/18 | | 2,445,000 | 2,627,072 |
| Equity One, Inc.: | | | |
| 3.75% 11/15/22 | | 5,500,000 | 5,592,769 |
| 6% 9/15/17 | | 2,405,000 | 2,520,649 |
| ERP Operating LP: | | | |
| 2.375% 7/1/19 | | 2,683,000 | 2,748,288 |
| 4.625% 12/15/21 | | 5,595,000 | 6,318,702 |
| 4.75% 7/15/20 | | 2,827,000 | 3,134,648 |
| Federal Realty Investment Trust 5.9% 4/1/20 | | 1,046,000 | 1,193,535 |
| Health Care REIT, Inc.: | | | |
| 2.25% 3/15/18 | | 1,731,000 | 1,748,777 |
| 4% 6/1/25 | | 3,216,000 | 3,381,618 |
| 4.7% 9/15/17 | | 568,000 | 588,710 |
| HRPT Properties Trust 6.25% 6/15/17 | | 3,000,000 | 3,059,358 |
| Lexington Corporate Properties Trust 4.4% 6/15/24 | | 1,441,000 | 1,474,559 |
| Omega Healthcare Investors, Inc.: | | | |
| 4.375% 8/1/23 (c) | | 6,023,000 | 6,007,280 |
| 4.5% 1/15/25 | | 1,371,000 | 1,391,562 |
| 4.5% 4/1/27 | | 16,195,000 | 16,139,143 |
| 4.95% 4/1/24 | | 1,354,000 | 1,409,215 |
| 5.25% 1/15/26 | | 5,686,000 | 6,011,683 |
| Retail Opportunity Investments Partnership LP: | | | |
| 4% 12/15/24 | | 978,000 | 961,813 |
| 5% 12/15/23 | | 737,000 | 776,330 |
| Simon Property Group LP 4.125% 12/1/21 | | 2,399,000 | 2,659,896 |
| Weingarten Realty Investors 3.375% 10/15/22 | | 812,000 | 828,060 |
| WP Carey, Inc. 4% 2/1/25 | | 5,360,000 | 5,210,059 |
| | | | 131,763,531 |
| Real Estate Management & Development - 2.0% | | | |
| Brandywine Operating Partnership LP: | | | |
| 3.95% 2/15/23 | | 4,271,000 | 4,317,234 |
| 4.1% 10/1/24 | | 4,251,000 | 4,333,699 |
| 4.55% 10/1/29 | | 4,251,000 | 4,387,929 |
| 4.95% 4/15/18 | | 3,196,000 | 3,353,710 |
| 5.7% 5/1/17 | | 5,000,000 | 5,164,495 |
| Digital Realty Trust LP: | | | |
| 3.4% 10/1/20 | | 4,915,000 | 5,109,088 |
| 3.95% 7/1/22 | | 3,213,000 | 3,366,116 |
| 4.75% 10/1/25 | | 3,533,000 | 3,796,198 |
| 5.25% 3/15/21 | | 1,953,000 | 2,195,529 |
| Essex Portfolio LP 5.5% 3/15/17 | | 670,000 | 688,040 |
| Liberty Property LP: | | | |
| 3.375% 6/15/23 | | 2,202,000 | 2,231,311 |
| 4.125% 6/15/22 | | 2,007,000 | 2,122,200 |
| 4.4% 2/15/24 | | 4,876,000 | 5,255,367 |
| 4.75% 10/1/20 | | 4,185,000 | 4,569,438 |
| 5.5% 12/15/16 | | 2,290,000 | 2,333,769 |
| 6.625% 10/1/17 | | 2,673,000 | 2,831,667 |
| Mack-Cali Realty LP: | | | |
| 2.5% 12/15/17 | | 2,995,000 | 3,004,290 |
| 3.15% 5/15/23 | | 4,988,000 | 4,601,979 |
| 4.5% 4/18/22 | | 1,218,000 | 1,242,420 |
| Mid-America Apartments LP: | | | |
| 4% 11/15/25 | | 1,181,000 | 1,244,156 |
| 4.3% 10/15/23 | | 831,000 | 894,099 |
| Post Apartment Homes LP 3.375% 12/1/22 | | 790,000 | 802,977 |
| Regency Centers LP 5.875% 6/15/17 | | 1,821,000 | 1,892,713 |
| Tanger Properties LP: | | | |
| 3.75% 12/1/24 | | 2,960,000 | 3,047,415 |
| 3.875% 12/1/23 | | 1,792,000 | 1,871,724 |
| 6.125% 6/1/20 | | 4,876,000 | 5,580,826 |
| Ventas Realty LP: | | | |
| 1.55% 9/26/16 | | 2,853,000 | 2,856,381 |
| 3.125% 6/15/23 | | 1,289,000 | 1,315,177 |
| 3.5% 2/1/25 | | 1,593,000 | 1,633,692 |
| 4.125% 1/15/26 | | 1,557,000 | 1,674,029 |
| 4.375% 2/1/45 | | 763,000 | 752,007 |
| Ventas Realty LP/Ventas Capital Corp.: | | | |
| 2% 2/15/18 | | 2,696,000 | 2,709,774 |
| 4% 4/30/19 | | 1,357,000 | 1,429,977 |
| | | | 92,609,426 |
|
| TOTAL FINANCIALS | | | 1,114,444,531 |
|
| HEALTH CARE - 2.5% | | | |
| Biotechnology - 0.4% | | | |
| AbbVie, Inc.: | | | |
| 1.75% 11/6/17 | | 4,266,000 | 4,291,250 |
| 2.9% 11/6/22 | | 4,038,000 | 4,117,779 |
| 3.2% 11/6/22 | | 4,580,000 | 4,736,476 |
| 3.6% 5/14/25 | | 5,737,000 | 6,011,624 |
| | | | 19,157,129 |
| Health Care Equipment & Supplies - 0.4% | | | |
| Becton, Dickinson & Co. 2.675% 12/15/19 | | 1,327,000 | 1,364,862 |
| Zimmer Biomet Holdings, Inc.: | | | |
| 1.45% 4/1/17 | | 8,772,000 | 8,777,658 |
| 2% 4/1/18 | | 9,035,000 | 9,110,768 |
| | | | 19,253,288 |
| Health Care Providers & Services - 0.8% | | | |
| Express Scripts Holding Co. 4.75% 11/15/21 | | 4,787,000 | 5,369,999 |
| HCA Holdings, Inc.: | | | |
| 3.75% 3/15/19 | | 6,803,000 | 7,041,105 |
| 4.25% 10/15/19 | | 11,265,000 | 11,743,763 |
| 4.75% 5/1/23 | | 215,000 | 220,375 |
| 5.875% 3/15/22 | | 260,000 | 282,750 |
| 6.5% 2/15/20 | | 7,140,000 | 7,898,625 |
| Medco Health Solutions, Inc. 4.125% 9/15/20 | | 2,723,000 | 2,936,745 |
| UnitedHealth Group, Inc. 3.35% 7/15/22 | | 1,747,000 | 1,871,180 |
| | | | 37,364,542 |
| Life Sciences Tools & Services - 0.1% | | | |
| Thermo Fisher Scientific, Inc.: | | | |
| 1.3% 2/1/17 | | 1,129,000 | 1,129,846 |
| 2.4% 2/1/19 | | 712,000 | 724,382 |
| 4.15% 2/1/24 | | 1,093,000 | 1,193,377 |
| | | | 3,047,605 |
| Pharmaceuticals - 0.8% | | | |
| Actavis Funding SCS: | | | |
| 2.35% 3/12/18 | | 11,511,000 | 11,667,883 |
| 3% 3/12/20 | | 3,962,000 | 4,082,381 |
| 3.45% 3/15/22 | | 6,868,000 | 7,135,200 |
| Mylan N.V.: | | | |
| 2.5% 6/7/19 (a) | | 2,445,000 | 2,477,465 |
| 3.15% 6/15/21 (a) | | 5,002,000 | 5,079,551 |
| Mylan, Inc. 1.35% 11/29/16 | | 1,345,000 | 1,343,521 |
| Perrigo Co. PLC: | | | |
| 1.3% 11/8/16 | | 1,103,000 | 1,101,842 |
| 2.3% 11/8/18 | | 1,180,000 | 1,190,159 |
| Perrigo Finance PLC: | | | |
| 3.5% 12/15/21 | | 1,065,000 | 1,096,154 |
| 4.9% 12/15/44 | | 696,000 | 686,936 |
| Watson Pharmaceuticals, Inc. 1.875% 10/1/17 | | 1,428,000 | 1,435,147 |
| Zoetis, Inc.: | | | |
| 1.875% 2/1/18 | | 676,000 | 677,982 |
| 3.25% 2/1/23 | | 1,649,000 | 1,680,590 |
| | | | 39,654,811 |
|
| TOTAL HEALTH CARE | | | 118,477,375 |
|
| INDUSTRIALS - 0.7% | | | |
| Airlines - 0.1% | | | |
| Continental Airlines, Inc.: | | | |
| 6.648% 3/15/19 | | 216,282 | 221,429 |
| 6.795% 2/2/20 | | 210,667 | 218,293 |
| Northwest Airlines, Inc. pass-thru trust certificates 7.027% 11/1/19 | | 2,151,689 | 2,426,030 |
| U.S. Airways pass-thru trust certificates: | | | |
| 6.85% 1/30/18 | | 588,391 | 606,042 |
| 8.36% 1/20/19 | | 1,951,557 | 2,050,306 |
| | | | 5,522,100 |
| Trading Companies & Distributors - 0.6% | | | |
| Air Lease Corp.: | | | |
| 2.125% 1/15/18 | | 2,155,000 | 2,144,225 |
| 2.625% 9/4/18 | | 4,630,000 | 4,629,023 |
| 3.375% 6/1/21 | | 2,523,000 | 2,577,295 |
| 3.75% 2/1/22 | | 4,522,000 | 4,632,626 |
| 3.875% 4/1/21 | | 4,057,000 | 4,178,710 |
| 4.25% 9/15/24 | | 3,565,000 | 3,609,563 |
| 4.75% 3/1/20 | | 3,519,000 | 3,765,330 |
| | | | 25,536,772 |
|
| TOTAL INDUSTRIALS | | | 31,058,872 |
|
| INFORMATION TECHNOLOGY - 0.6% | | | |
| Electronic Equipment & Components - 0.0% | | | |
| Amphenol Corp. 3.125% 9/15/21 | | 1,394,000 | 1,441,158 |
| Tyco Electronics Group SA 2.375% 12/17/18 | | 832,000 | 844,315 |
| | | | 2,285,473 |
| Technology Hardware, Storage & Peripherals - 0.6% | | | |
| Apple, Inc. 4.375% 5/13/45 | | 10,649,000 | 11,610,285 |
| Hewlett Packard Enterprise Co.: | | | |
| 3.6% 10/15/20 (a) | | 4,703,000 | 4,909,358 |
| 4.9% 10/15/25 (a) | | 4,703,000 | 4,916,079 |
| 6.35% 10/15/45 (a) | | 4,703,000 | 4,671,636 |
| | | | 26,107,358 |
|
| TOTAL INFORMATION TECHNOLOGY | | | 28,392,831 |
|
| MATERIALS - 0.8% | | | |
| Chemicals - 0.1% | | | |
| The Dow Chemical Co.: | | | |
| 4.125% 11/15/21 | | 3,587,000 | 3,935,671 |
| 4.25% 11/15/20 | | 1,196,000 | 1,307,266 |
| | | | 5,242,937 |
| Metals & Mining - 0.7% | | | |
| Alcoa, Inc. 5.125% 10/1/24 | | 2,956,000 | 2,948,610 |
| BHP Billiton Financial (U.S.A.) Ltd.: | | | |
| 6.25% 10/19/75 (a)(b) | | 1,921,000 | 2,022,813 |
| 6.75% 10/19/75 (a)(b) | | 4,773,000 | 5,071,313 |
| Corporacion Nacional del Cobre de Chile (Codelco): | | | |
| 3.875% 11/3/21 (a) | | 3,750,000 | 3,972,206 |
| 4.5% 8/13/23 (a) | | 9,000,000 | 9,538,029 |
| 4.875% 11/4/44 (a) | | 1,712,000 | 1,719,243 |
| Freeport-McMoRan, Inc. 2.3% 11/14/17 | | 2,852,000 | 2,802,090 |
| Vale Overseas Ltd.: | | | |
| 4.375% 1/11/22 | | 3,818,000 | 3,578,230 |
| 6.25% 1/23/17 | | 3,115,000 | 3,186,334 |
| | | | 34,838,868 |
|
| TOTAL MATERIALS | | | 40,081,805 |
|
| TELECOMMUNICATION SERVICES - 1.5% | | | |
| Diversified Telecommunication Services - 1.5% | | | |
| AT&T, Inc.: | | | |
| 2.45% 6/30/20 | | 3,187,000 | 3,254,086 |
| 3.6% 2/17/23 | | 6,635,000 | 6,945,286 |
| 4.75% 5/15/46 | | 3,738,000 | 3,831,248 |
| 4.8% 6/15/44 | | 8,410,000 | 8,664,848 |
| 5.875% 10/1/19 | | 4,711,000 | 5,329,498 |
| CenturyLink, Inc.: | | | |
| 5.15% 6/15/17 | | 330,000 | 337,425 |
| 6% 4/1/17 | | 825,000 | 845,625 |
| 6.15% 9/15/19 | | 2,305,000 | 2,451,944 |
| Embarq Corp. 7.995% 6/1/36 | | 29,008,000 | 29,044,260 |
| Verizon Communications, Inc.: | | | |
| 5.012% 8/21/54 | | 9,569,000 | 10,161,646 |
| 6.25% 4/1/37 | | 1,380,000 | 1,724,252 |
| | | | 72,590,118 |
| UTILITIES - 2.8% | | | |
| Electric Utilities - 2.0% | | | |
| American Electric Power Co., Inc. 1.65% 12/15/17 | | 1,748,000 | 1,753,060 |
| Dayton Power & Light Co. 1.875% 9/15/16 | | 1,393,000 | 1,394,812 |
| Duquesne Light Holdings, Inc.: | | | |
| 5.9% 12/1/21 (a) | | 2,664,000 | 3,054,188 |
| 6.4% 9/15/20 (a) | | 7,513,000 | 8,644,638 |
| Edison International 3.75% 9/15/17 | | 2,401,000 | 2,472,134 |
| Entergy Corp. 4% 7/15/22 | | 4,900,000 | 5,260,836 |
| Eversource Energy: | | | |
| 1.45% 5/1/18 | | 1,125,000 | 1,126,568 |
| 2.8% 5/1/23 | | 5,110,000 | 5,235,215 |
| Exelon Corp.: | | | |
| 1.55% 6/9/17 | | 934,000 | 935,625 |
| 3.95% 6/15/25 | | 4,402,000 | 4,708,260 |
| FirstEnergy Corp.: | | | |
| 2.75% 3/15/18 | | 10,761,000 | 10,895,007 |
| 4.25% 3/15/23 | | 11,729,000 | 12,104,774 |
| 7.375% 11/15/31 | | 5,897,000 | 7,324,050 |
| FirstEnergy Solutions Corp. 6.05% 8/15/21 | | 7,286,000 | 7,889,980 |
| IPALCO Enterprises, Inc. 3.45% 7/15/20 | | 7,767,000 | 7,883,505 |
| LG&E and KU Energy LLC 3.75% 11/15/20 | | 525,000 | 563,869 |
| Nevada Power Co. 6.5% 5/15/18 | | 3,165,000 | 3,473,667 |
| NV Energy, Inc. 6.25% 11/15/20 | | 1,238,000 | 1,465,689 |
| Pennsylvania Electric Co. 6.05% 9/1/17 | | 2,905,000 | 3,051,418 |
| PG&E Corp. 2.4% 3/1/19 | | 600,000 | 611,767 |
| Progress Energy, Inc. 4.4% 1/15/21 | | 4,274,000 | 4,676,149 |
| TECO Finance, Inc. 5.15% 3/15/20 | | 1,545,000 | 1,716,487 |
| | | | 96,241,698 |
| Gas Utilities - 0.0% | | | |
| Southern Natural Gas Co./Southern Natural Issuing Corp. 4.4% 6/15/21 | | 1,182,000 | 1,225,593 |
| Independent Power and Renewable Electricity Producers - 0.1% | | | |
| Emera U.S. Finance LP: | | | |
| 2.15% 6/15/19 (a) | | 1,201,000 | 1,214,833 |
| 2.7% 6/15/21 (a) | | 1,182,000 | 1,207,901 |
| 3.55% 6/15/26 (a) | | 1,891,000 | 1,931,161 |
| | | | 4,353,895 |
| Multi-Utilities - 0.7% | | | |
| Dominion Resources, Inc. 2.9311% 9/30/66 (b) | | 15,230,000 | 11,253,173 |
| NiSource Finance Corp.: | | | |
| 5.45% 9/15/20 | | 4,156,000 | 4,704,833 |
| 6.4% 3/15/18 | | 1,300,000 | 1,407,207 |
| Puget Energy, Inc.: | | | |
| 6% 9/1/21 | | 4,807,000 | 5,595,151 |
| 6.5% 12/15/20 | | 1,534,000 | 1,787,078 |
| Sempra Energy 2.3% 4/1/17 | | 4,185,000 | 4,219,673 |
| Wisconsin Energy Corp. 6.25% 5/15/67 (b) | | 1,426,000 | 1,131,360 |
| | | | 30,098,475 |
|
| TOTAL UTILITIES | | | 131,919,661 |
|
| TOTAL NONCONVERTIBLE BONDS | | | |
| (Cost $2,127,031,890) | | | 2,179,877,690 |
|
| U.S. Government and Government Agency Obligations - 13.5% | | | |
| U.S. Treasury Inflation-Protected Obligations - 5.8% | | | |
| U.S. Treasury Inflation-Indexed Bonds: | | | |
| 0.75% 2/15/45 | | $48,912,647 | $49,265,667 |
| 1.375% 2/15/44 | | 45,761,141 | 53,027,295 |
| U.S. Treasury Inflation-Indexed Notes: | | | |
| 0.125% 7/15/24 | | 56,750,285 | 57,389,431 |
| 0.25% 1/15/25 | | 49,692,801 | 50,499,763 |
| 0.625% 1/15/26 | | 60,416,400 | 63,671,365 |
|
| TOTAL U.S. TREASURY INFLATION-PROTECTED OBLIGATIONS | | | 273,853,521 |
|
| U.S. Treasury Obligations - 7.7% | | | |
| U.S. Treasury Bonds: | | | |
| 3% 5/15/45 (d)(e) | | 73,793,000 | 84,893,681 |
| 3% 11/15/45 | | 38,163,000 | 43,918,744 |
| U.S. Treasury Notes: | | | |
| 1.25% 3/31/21 | | 132,740,000 | 134,311,111 |
| 1.5% 2/28/23 | | 99,767,000 | 101,263,505 |
|
| TOTAL U.S. TREASURY OBLIGATIONS | | | 364,387,041 |
|
| TOTAL U.S. GOVERNMENT AND GOVERNMENT AGENCY OBLIGATIONS | | | |
| (Cost $609,527,353) | | | 638,240,562 |
|
| U.S. Government Agency - Mortgage Securities - 30.7% | | | |
| Fannie Mae - 17.9% | | | |
| 1.912% 5/1/34 (b) | | 656,121 | 673,284 |
| 2.146% 9/1/33 (b) | | 344,146 | 354,072 |
| 2.15% 7/1/35 (b) | | 21,777 | 22,579 |
| 2.222% 10/1/33 (b) | | 450,547 | 470,836 |
| 2.23% 7/1/34 (b) | | 35,047 | 36,549 |
| 2.302% 6/1/36 (b) | | 76,935 | 80,575 |
| 2.414% 10/1/33 (b) | | 18,583 | 19,238 |
| 2.5% 9/1/27 to 1/1/43 | | 20,838,823 | 21,470,785 |
| 2.5% 7/1/31 (c) | | 8,900,000 | 9,207,936 |
| 2.54% 6/1/42 (b) | | 400,081 | 416,902 |
| 2.557% 10/1/33 (b) | | 45,657 | 48,322 |
| 2.596% 11/1/36 (b) | | 620,070 | 652,832 |
| 2.628% 7/1/35 (b) | | 46,398 | 48,788 |
| 2.662% 2/1/36 (b) | | 509,968 | 537,763 |
| 2.695% 12/1/35 (b) | | 222,419 | 234,835 |
| 2.698% 8/1/36 (b) | | 1,172,727 | 1,243,467 |
| 2.714% 7/1/37 (b) | | 100,520 | 107,069 |
| 2.735% 5/1/36 (b) | | 225,384 | 239,924 |
| 2.819% 9/1/36 (b) | | 663,128 | 703,580 |
| 2.833% 3/1/35 (b) | | 28,624 | 30,287 |
| 2.841% 5/1/35 (b) | | 124,332 | 132,432 |
| 2.951% 11/1/40 (b) | | 226,840 | 238,468 |
| 2.98% 9/1/41 (b) | | 263,562 | 275,386 |
| 2.991% 10/1/41 (b) | | 122,508 | 128,289 |
| 3% 5/1/27 to 5/1/46 | | 107,822,266 | 112,389,661 |
| 3% 7/1/31 (c) | | 1,000,000 | 1,048,335 |
| 3% 7/1/31 (c) | | 1,000,000 | 1,048,335 |
| 3% 7/1/46 (c) | | 900,000 | 933,676 |
| 3% 7/1/46 (c) | | 48,600,000 | 50,418,486 |
| 3.219% 7/1/41 (b) | | 402,133 | 422,256 |
| 3.352% 10/1/41 (b) | | 207,170 | 218,128 |
| 3.5% 10/1/25 to 5/1/46 | | 145,084,951 | 154,568,547 |
| 3.5% 4/1/31 | | 1,500,625 | 1,592,546 |
| 3.5% 7/1/31 (c) | | 1,500,000 | 1,589,406 |
| 3.5% 7/1/46 (c) | | 57,700,000 | 60,863,835 |
| 3.5% 7/1/46 (c) | | 52,800,000 | 55,695,156 |
| 3.557% 7/1/41 (b) | | 512,269 | 540,042 |
| 4% 11/1/31 to 2/1/46 | | 104,895,602 | 113,431,490 |
| 4% 7/1/46 (c) | | 1,000,000 | 1,072,161 |
| 4% 7/1/46 (c) | | 50,400,000 | 54,036,930 |
| 4% 7/1/46 (c) | | 20,900,000 | 22,408,171 |
| 4.5% 4/1/24 to 4/1/45 | | 60,202,588 | 66,386,860 |
| 4.5% 7/1/46 (c) | | 27,500,000 | 30,022,187 |
| 5% 9/1/20 to 11/1/44 | | 29,593,917 | 33,017,301 |
| 5.5% 3/1/18 to 3/1/41 | | 29,687,324 | 33,695,586 |
| 6% 10/1/34 to 1/1/42 | | 7,531,083 | 8,708,234 |
| 6.5% 2/1/17 to 8/1/36 | | 2,640,518 | 3,040,561 |
| 7% 11/1/23 to 8/1/32 | | 644,781 | 747,338 |
| 7.5% 9/1/22 to 11/1/31 | | 498,602 | 590,976 |
| 8% 1/1/30 to 5/1/30 | | 9,293 | 11,280 |
| 8.5% 3/1/25 to 6/1/25 | | 511 | 611 |
|
| TOTAL FANNIE MAE | | | 845,872,293 |
|
| Freddie Mac - 8.4% | | | |
| 2.233% 3/1/36 (b) | | 100,347 | 104,109 |
| 2.494% 4/1/35 (b) | | 409,524 | 425,603 |
| 2.683% 1/1/35 (b) | | 75,902 | 80,280 |
| 2.917% 3/1/33 (b) | | 2,334 | 2,466 |
| 3% 10/1/28 to 8/1/45 | | 56,998,283 | 59,352,958 |
| 3% 2/1/31 | | 3,303,300 | 3,480,219 |
| 3% 7/1/46 (c) | | 12,600,000 | 13,057,186 |
| 3% 7/1/46 (c) | | 10,100,000 | 10,466,474 |
| 3% 7/1/46 (c) | | 8,800,000 | 9,119,304 |
| 3.035% 11/1/35 (b) | | 184,597 | 196,989 |
| 3.205% 9/1/41 (b) | | 283,511 | 297,722 |
| 3.212% 4/1/41 (b) | | 302,648 | 316,772 |
| 3.29% 6/1/41 (b) | | 300,502 | 315,820 |
| 3.433% 5/1/41 (b) | | 237,832 | 249,678 |
| 3.5% 3/1/32 to 5/1/46 | | 162,148,493 | 172,563,569 |
| 3.5% 7/1/46 (c) | | 11,300,000 | 11,911,662 |
| 3.569% 10/1/35 (b) | | 68,959 | 73,451 |
| 3.634% 6/1/41 (b) | | 464,100 | 487,888 |
| 3.704% 5/1/41 (b) | | 384,339 | 404,256 |
| 4% 6/1/24 to 4/1/46 | | 61,160,534 | 65,958,965 |
| 4.5% 7/1/25 to 1/1/45 | | 29,685,136 | 32,621,784 |
| 5% 1/1/35 to 6/1/41 | | 4,934,436 | 5,558,517 |
| 5.5% 1/1/38 to 6/1/41 | | 8,714,459 | 9,902,122 |
| 6% 4/1/32 to 8/1/37 | | 1,271,839 | 1,463,811 |
| 7.5% 5/1/17 to 11/1/31 | | 56,074 | 66,724 |
| 8% 7/1/17 to 5/1/27 | | 3,753 | 4,473 |
| 8.5% 3/1/20 to 1/1/28 | | 14,205 | 16,345 |
|
| TOTAL FREDDIE MAC | | | 398,499,147 |
|
| Ginnie Mae - 4.4% | | | |
| 3% 6/20/42 to 10/20/43 | | 20,226,342 | 21,198,803 |
| 3% 7/1/46 (c) | | 3,370,000 | 3,521,675 |
| 3% 7/1/46 (c) | | 1,500,000 | 1,567,511 |
| 3% 7/1/46 (c) | | 1,800,000 | 1,881,013 |
| 3.5% 1/15/41 to 6/20/46 | | 97,822,209 | 104,499,832 |
| 3.5% 7/1/46 (c) | | 4,800,000 | 5,093,302 |
| 3.5% 7/1/46 (c) | | 2,200,000 | 2,334,430 |
| 3.5% 7/1/46 (c) | | 2,330,000 | 2,472,373 |
| 4% 2/15/40 to 11/20/45 | | 30,168,974 | 32,770,995 |
| 4.5% 5/15/39 to 5/20/41 | | 22,711,195 | 24,956,721 |
| 5% 3/15/39 to 4/15/41 | | 3,346,307 | 3,757,934 |
| 5.5% 6/15/35 | | 1,004,237 | 1,161,795 |
| 6.5% 4/15/35 to 11/15/35 | | 107,218 | 125,473 |
| 7% 1/15/28 to 7/15/32 | | 1,382,045 | 1,651,084 |
| 7.5% 4/15/22 to 10/15/28 | | 327,000 | 385,677 |
| 8% 2/15/17 to 9/15/30 | | 21,134 | 25,668 |
| 8.5% 3/15/30 | | 3,226 | 3,524 |
|
| TOTAL GINNIE MAE | | | 207,407,810 |
|
| TOTAL U.S. GOVERNMENT AGENCY - MORTGAGE SECURITIES | | | |
| (Cost $1,428,830,492) | | | 1,451,779,250 |
|
| Asset-Backed Securities - 1.1% | | | |
| Accredited Mortgage Loan Trust Series 2005-1 Class M1, 1.1583% 4/25/35 (b) | | $234,160 | $211,395 |
| Airspeed Ltd. Series 2007-1A Class C1, 2.9421% 6/15/32 (a)(b) | | 2,002,788 | 535,746 |
| Ameriquest Mortgage Securities, Inc. pass-thru certificates: | | | |
| Series 2003-10 Class M1, 1.5033% 12/25/33 (b) | | 15,276 | 13,907 |
| Series 2004-R2 Class M3, 1.2783% 4/25/34 (b) | | 31,593 | 23,599 |
| Argent Securities, Inc. pass-thru certificates: | | | |
| Series 2003-W7 Class A2, 1.2333% 3/25/34 (b) | | 16,878 | 14,763 |
| Series 2004-W11 Class M2, 1.5033% 11/25/34 (b) | | 198,000 | 190,204 |
| Series 2004-W7 Class M1, 1.2783% 5/25/34 (b) | | 196,721 | 177,609 |
| Series 2006-W4 Class A2C, 0.6133% 5/25/36 (b) | | 399,404 | 131,305 |
| Asset Backed Securities Corp. Home Equity Loan Trust Series 2004-HE2 Class M1, 1.271% 4/25/34 (b) | | 564,196 | 479,115 |
| Capital Auto Receivables Asset Trust Series 2016-1 Class A3, 1.71% 4/20/20 | | 5,328,000 | 5,358,015 |
| Capital Auto Receivables Trust Series 2013-3 Class A3, 1.31% 12/20/17 | | 499,731 | 499,772 |
| Carrington Mortgage Loan Trust Series 2007-RFC1 Class A3, 0.586% 12/25/36 (b) | | 635,000 | 353,031 |
| Citibank Credit Card Issuance Trust Series 2014-A8 Class A8, 1.73% 4/9/20 | | 8,400,000 | 8,508,771 |
| Countrywide Home Loans, Inc.: | | | |
| Series 2003-BC1 Class B1, 5.7033% 3/25/32 (b) | | 11,075 | 10,333 |
| Series 2004-3 Class M4, 1.9083% 4/25/34 (b) | | 21,460 | 18,301 |
| Series 2004-4 Class M2, 1.2483% 6/25/34 (b) | | 33,446 | 30,958 |
| Series 2004-7 Class AF5, 5.868% 1/25/35 | | 869,274 | 896,208 |
| Fannie Mae Series 2004-T5 Class AB3, 1.3664% 5/28/35 (b) | | 13,702 | 11,931 |
| Fieldstone Mortgage Investment Corp. Series 2004-3 Class M5, 2.621% 8/25/34 (b) | | 102,000 | 95,919 |
| First Franklin Mortgage Loan Trust Series 2004-FF2 Class M3, 1.2783% 3/25/34 (b) | | 2,545 | 2,086 |
| Ford Credit Floorplan Master Owner Trust Series 2015-1 Class B, 1.62% 1/15/20 | | 5,416,000 | 5,403,425 |
| Fremont Home Loan Trust Series 2005-A: | | | |
| Class M3, 1.1883% 1/25/35 (b) | | 334,000 | 282,650 |
| Class M4, 1.4733% 1/25/35 (b) | | 122,221 | 64,194 |
| GCO Education Loan Funding Master Trust II Series 2007-1A Class C1L, 1.0423% 2/25/47 (a)(b) | | 354,556 | 293,851 |
| GSAMP Trust Series 2004-AR1 Class B4, 5.5% 6/25/34 (a) | | 56,675 | 1,294 |
| Home Equity Asset Trust: | | | |
| Series 2003-3 Class M1, 1.736% 8/25/33 (b) | | 147,117 | 136,915 |
| Series 2003-5 Class A2, 1.146% 12/25/33 (b) | | 11,595 | 10,609 |
| HSI Asset Securitization Corp. Trust Series 2007-HE1 Class 2A3, 0.636% 1/25/37 (b) | | 436,000 | 272,645 |
| Invitation Homes Trust Series 2015-SFR3 Class E, 4.184% 8/17/32 (a)(b) | | 1,446,000 | 1,426,865 |
| KeyCorp Student Loan Trust Series 1999-A Class A2, 0.9601% 12/27/29 (b) | | 11,851 | 11,752 |
| MASTR Asset Backed Securities Trust Series 2007-HE1 Class M1, 0.746% 5/25/37 (b) | | 86,909 | 3,057 |
| Merrill Lynch Mortgage Investors Trust: | | | |
| Series 2003-OPT1 Class M1, 1.4283% 7/25/34 (b) | | 11,146 | 10,275 |
| Series 2006-FM1 Class A2B, 0.556% 4/25/37 (b) | | 29,809 | 29,453 |
| Series 2006-OPT1 Class A1A, 0.9733% 6/25/35 (b) | | 242,905 | 232,977 |
| Morgan Stanley ABS Capital I Trust: | | | |
| Series 2004-HE6 Class A2, 1.1333% 8/25/34 (b) | | 20,187 | 17,109 |
| Series 2004-NC6 Class M3, 2.6283% 7/25/34 (b) | | 51,379 | 49,811 |
| Series 2004-NC8 Class M6, 2.3283% 9/25/34 (b) | | 58,535 | 53,774 |
| Series 2005-NC1 Class M1, 1.106% 1/25/35 (b) | | 77,702 | 69,877 |
| New Century Home Equity Loan Trust Series 2005-4 Class M2, 0.956% 9/25/35 (b) | | 503,000 | 470,151 |
| Park Place Securities, Inc.: | | | |
| Series 2004-WCW1: | | | |
| Class M3, 2.321% 9/25/34 (b) | | 188,000 | 170,293 |
| Class M4, 2.621% 9/25/34 (b) | | 241,000 | 149,555 |
| Series 2005-WCH1 Class M4, 1.691% 1/25/36 (b) | | 520,000 | 457,656 |
| Salomon Brothers Mortgage Securities VII, Inc. Series 2003-HE1 Class A, 1.2533% 4/25/33 (b) | | 1,796 | 1,506 |
| Santander Drive Auto Receivables Trust: | | | |
| Series 2014-4 Class C, 2.6% 11/16/20 | | 2,365,000 | 2,392,478 |
| Series 2015-1: | | | |
| Class A3, 1.27% 2/15/19 | | 12,161,000 | 12,166,590 |
| Class C, 2.57% 4/15/21 | | 8,000,000 | 8,086,226 |
| Saxon Asset Securities Trust Series 2004-1 Class M1, 1.2483% 3/25/35 (b) | | 237,879 | 219,285 |
| SLM Private Credit Student Loan Trust Series 2004-A Class C, 1.6025% 6/15/33 (b) | | 152,212 | 143,317 |
| Structured Asset Investment Loan Trust Series 2004-8 Class M5, 2.1783% 9/25/34 (b) | | 13,566 | 11,640 |
| Terwin Mortgage Trust Series 2003-4HE Class A1, 1.306% 9/25/34 (b) | | 10,148 | 9,023 |
| TOTAL ASSET-BACKED SECURITIES | | | |
| (Cost $51,439,067) | | | 50,211,221 |
|
| Collateralized Mortgage Obligations - 0.3% | | | |
| Private Sponsor - 0.0% | | | |
| Bear Stearns ALT-A Trust floater Series 2005-1 Class A1, 1.0133% 1/25/35 (b) | | 306,293 | 295,070 |
| MASTR Adjustable Rate Mortgages Trust Series 2007-3 Class 22A2, 0.656% 5/25/47 (b) | | 106,294 | 98,314 |
| Merrill Lynch Alternative Note Asset Trust floater Series 2007-OAR1 Class A1, 0.6233% 2/25/37 (b) | | 188,191 | 170,970 |
| Opteum Mortgage Acceptance Corp. floater Series 2005-3 Class APT, 0.736% 7/25/35 (b) | | 274,535 | 263,580 |
| RESI Finance LP/RESI Finance DE Corp. floater Series 2003-B Class B5, 2.7879% 6/10/35 (a)(b) | | 53,979 | 46,186 |
| Sequoia Mortgage Trust floater Series 2004-6 Class A3B, 1.675% 7/20/34 (b) | | 7,595 | 7,413 |
|
| TOTAL PRIVATE SPONSOR | | | 881,533 |
|
| U.S. Government Agency - 0.3% | | | |
| Fannie Mae planned amortization class: | | | |
| Series 1999-54 Class PH, 6.5% 11/18/29 | | 413,208 | 444,105 |
| Series 1999-57 Class PH, 6.5% 12/25/29 | | 361,303 | 417,434 |
| Series 2002-9 Class PC, 6% 3/25/17 | | 3,803 | 3,852 |
| Freddie Mac planned amortization class Series 2500 Class TE, 5.5% 9/15/17 | | 230,771 | 235,169 |
| Ginnie Mae guaranteed REMIC pass-thru certificates: | | | |
| sequential payer Series 2013-H06 Class HA, 1.65% 1/20/63 (f) | | 5,931,291 | 5,956,026 |
| Series 2007-35 Class SC, 37.5462% 6/16/37 (b)(g) | | 43,346 | 86,801 |
| Series 2015-H21 Class JA, 2.5% 6/20/65 (f) | | 6,894,916 | 7,024,655 |
|
| TOTAL U.S. GOVERNMENT AGENCY | | | 14,168,042 |
|
| TOTAL COLLATERALIZED MORTGAGE OBLIGATIONS | | | |
| (Cost $14,818,965) | | | 15,049,575 |
|
| Commercial Mortgage Securities - 5.3% | | | |
| Banc of America Commercial Mortgage Trust: | | | |
| sequential payer Series 2006-3 Class A4, 5.889% 7/10/44 (b) | | 3,022,261 | 3,018,873 |
| Series 2007-2 Class A4, 5.625% 4/10/49 (b) | | 4,938,225 | 4,977,295 |
| Series 2007-3 Class A4, 5.5387% 6/10/49 (b) | | 2,023,682 | 2,056,978 |
| Banc of America Commercial Mortgage, Inc. sequential payer Series 2001-1 Class A4, 5.451% 1/15/49 | | 6,999,626 | 7,102,669 |
| Bayview Commercial Asset Trust floater: | | | |
| Series 2005-4A: | | | |
| Class A2, 0.8433% 1/25/36 (a)(b) | | 375,334 | 323,780 |
| Class M1, 0.9033% 1/25/36 (a)(b) | | 78,533 | 61,547 |
| Class M2, 0.9233% 1/25/36 (a)(b) | | 23,691 | 18,007 |
| Class M3, 0.9533% 1/25/36 (a)(b) | | 34,440 | 25,100 |
| Series 2007-1 Class A2, 0.7233% 3/25/37 (a)(b) | | 101,421 | 85,357 |
| Series 2007-2A: | | | |
| Class A1, 0.7233% 7/25/37 (a)(b) | | 110,598 | 92,428 |
| Class A2, 0.7733% 7/25/37 (a)(b) | | 103,519 | 81,713 |
| Class M2, 0.8633% 7/25/37 (a)(b) | | 57,511 | 40,644 |
| Class M3, 0.9433% 7/25/37 (a)(b) | | 43,777 | 28,942 |
| Series 2007-3: | | | |
| Class A2, 0.7433% 7/25/37 (a)(b) | | 150,410 | 118,624 |
| Class M1, 0.7633% 7/25/37 (a)(b) | | 61,618 | 46,691 |
| Class M2, 0.7933% 7/25/37 (a)(b) | | 64,777 | 46,737 |
| Class M3, 0.8233% 7/25/37 (a)(b) | | 141,562 | 92,720 |
| Class M4, 0.9533% 7/25/37 (a)(b) | | 223,719 | 102,777 |
| Class M5, 1.0533% 7/25/37 (a)(b) | | 78,228 | 13,640 |
| C-BASS Trust floater Series 2006-SC1 Class A, 0.7233% 5/25/36 (a)(b) | | 29,792 | 29,118 |
| CDGJ Commercial Mortgage Trust Series 2014-BXCH Class DPA, 3.4345% 12/15/27 (a)(b) | | 1,795,000 | 1,751,263 |
| CGBAM Commercial Mortgage Trust Series 2015-SMRT Class D, 3.768% 4/10/28 (a)(b) | | 2,236,000 | 2,261,250 |
| Citigroup/Deutsche Bank Commercial Mortgage Trust sequential payer: | | | |
| Series 2006-CD3 Class A5, 5.617% 10/15/48 | | 402,750 | 402,936 |
| Series 2007-CD4 Class A4, 5.322% 12/11/49 | | 12,307,326 | 12,436,697 |
| COMM Mortgage Trust pass-thru certificates floater Series 2005-F10A Class J, 1.2921% 4/15/17 (a)(b) | | 44,103 | 44,016 |
| Credit Suisse Commercial Mortgage Trust: | | | |
| sequential payer: | | | |
| Series 2007-C2 Class A2, 5.448% 1/15/49 (b) | | 10,599 | 10,579 |
| Series 2007-C3 Class A4, 5.6995% 6/15/39 (b) | | 2,184,910 | 2,222,746 |
| Series 2007-C5 Class A4, 5.695% 9/15/40 (b) | | 2,027,839 | 2,097,004 |
| Credit Suisse First Boston Mortgage Securities Corp. Series 2001-CKN5 Class AX, 0% 9/15/34 (a)(b)(h) | | 154 | 0 |
| CSMC Series 2015-TOWN: | | | |
| Class B, 2.3345% 3/15/17 (a)(b) | | 870,000 | 849,656 |
| Class C, 2.6845% 3/15/17 (a)(b) | | 848,000 | 823,873 |
| Class D, 3.6345% 3/15/17 (a)(b) | | 1,283,000 | 1,248,599 |
| GAHR Commercial Mortgage Trust Series 2015-NRF: | | | |
| Class BFX, 3.3822% 12/15/34 (a)(b) | | 4,550,000 | 4,684,933 |
| Class CFX, 3.3822% 12/15/34 (a)(b) | | 3,823,000 | 3,867,104 |
| Class DFX, 3.3822% 12/15/34 (a)(b) | | 3,240,000 | 3,225,073 |
| GE Capital Commercial Mortgage Corp. sequential payer Series 2007-C1 Class A4, 5.543% 12/10/49 | | 12,036,500 | 12,267,968 |
| Greenwich Capital Commercial Funding Corp. sequential payer Series 2007-GG9 Class A4, 5.444% 3/10/39 | | 1,743,571 | 1,759,595�� |
| GS Mortgage Securities Trust sequential payer Series 2006-GG8 Class A4, 5.56% 11/10/39 | | 412,323 | 413,414 |
| Hilton U.S.A. Trust Series 2013-HLT: | | | |
| Class CFX, 3.7141% 11/5/30 (a) | | 890,000 | 894,935 |
| Class DFX, 4.4065% 11/5/30 (a) | | 8,320,000 | 8,369,376 |
| JPMorgan Chase Commercial Mortgage Securities Trust: | | | |
| floater Series 2014-BXH: | | | |
| Class C, 2.0921% 4/15/27 (a)(b) | | 1,359,000 | 1,322,442 |
| Class D, 2.6921% 4/15/27 (a)(b) | | 2,897,000 | 2,798,508 |
| sequential payer: | | | |
| Series 2006-CB16: | | | |
| Class A1A, 5.546% 5/12/45 | | 2,343,497 | 2,341,492 |
| Class A4, 5.552% 5/12/45 | | 231,919 | 231,695 |
| Series 2006-CB17 Class A4, 5.429% 12/12/43 | | 1,759,638 | 1,771,859 |
| Series 2006-LDP8 Class A1A, 5.397% 5/15/45 | | 806,055 | 804,898 |
| Series 2007-CB18 Class A4, 5.44% 6/12/47 | | 743,161 | 754,453 |
| Series 2007-CB19 Class A4, 5.6987% 2/12/49 (b) | | 4,822,766 | 4,928,107 |
| Series 2007-LD11 Class A4, 5.7428% 6/15/49 (b) | | 6,664,597 | 6,784,446 |
| Series 2007-LDPX Class A3, 5.42% 1/15/49 | | 4,862,588 | 4,935,453 |
| Series 2007-CB20 Class A1A, 5.746% 2/12/51 | | 13,483,363 | 14,007,593 |
| Series 2007-LDP10 Class CS, 5.466% 1/15/49 (b) | | 491,041 | 8 |
| LB Commercial Conduit Mortgage Trust sequential payer Series 2007-C3 Class A4, 5.9233% 7/15/44 (b) | | 3,196,708 | 3,318,695 |
| LB-UBS Commercial Mortgage Trust: | | | |
| sequential payer: | | | |
| Series 2007-C1 Class A4, 5.424% 2/15/40 | | 11,676,567 | 11,822,855 |
| Series 2007-C2 Class A3, 5.43% 2/15/40 | | 943,678 | 957,055 |
| Series 2007-C7 Class A3, 5.866% 9/15/45 | | 4,337,603 | 4,538,144 |
| Merrill Lynch Mortgage Trust Series 2007-C1 Class A4, 5.8319% 6/12/50 (b) | | 10,916,000 | 11,158,347 |
| Merrill Lynch-CFC Commercial Mortgage Trust sequential payer: | | | |
| Series 2006-4 Class A3, 5.172% 12/12/49 (b) | | 330,880 | 332,589 |
| Series 2007-5 Class A4, 5.378% 8/12/48 | | 2,036,163 | 2,057,774 |
| Series 2007-6 Class A4, 5.485% 3/12/51 (b) | | 3,875,000 | 3,937,692 |
| Series 2007-9 Class A4, 5.7% 9/12/49 | | 5,219,152 | 5,428,952 |
| Morgan Stanley Capital I Trust: | | | |
| floater: | | | |
| Series 2006-XLF Class C, 1.642% 7/15/19 (a)(b) | | 113,478 | 113,422 |
| Series 2007-XLFA: | | | |
| Class D, 0.6245% 10/15/20 (a)(b) | | 33,977 | 33,979 |
| Class E, 0.6845% 10/15/20 (a)(b) | | 294,000 | 294,015 |
| Class F, 0.7345% 10/15/20 (a)(b) | | 176,000 | 176,009 |
| Class G, 0.7745% 10/15/20 (a)(b) | | 218,000 | 218,011 |
| Class H, 0.8645% 10/15/20 (a)(b) | | 137,000 | 136,528 |
| Class J, 1.0145% 10/15/20 (a)(b) | | 79,407 | 76,789 |
| sequential payer Series 2007-HQ11 Class A31, 5.439% 2/12/44 | | 517,824 | 517,377 |
| Series 2007-IQ14 Class A4, 5.692% 4/15/49 | | 25,182,000 | 25,654,883 |
| Providence Place Group Ltd. Partnership Series 2000-C1 Class A2, 7.75% 7/20/28 (a) | | 4,556,175 | 5,435,061 |
| Wachovia Bank Commercial Mortgage Trust: | | | |
| sequential payer: | | | |
| Series 2006-C28 Class A4, 5.572% 10/15/48 | | 2,928,781 | 2,927,731 |
| Series 2006-C29 Class A1A, 5.297% 11/15/48 | | 2,869,579 | 2,896,495 |
| Series 2007-C30 Class A5, 5.342% 12/15/43 | | 20,930,000 | 21,219,418 |
| Series 2007-C31 Class A4, 5.509% 4/15/47 | | 6,683,397 | 6,779,867 |
| Series 2007-C32 Class A3, 5.7063% 6/15/49 (b) | | 11,032,000 | 11,335,380 |
| Series 2007-C33 Class A4, 5.9483% 2/15/51 (b) | | 7,255,053 | 7,405,208 |
| Series 2006-C26 Class A1A, 6.009% 6/15/45 (b) | | 1,380,980 | 1,378,987 |
| Series 2006-C27 Class A1A, 5.749% 7/15/45 (b) | | 3,768,715 | 3,764,703 |
| TOTAL COMMERCIAL MORTGAGE SECURITIES | | | |
| (Cost $261,496,469) | | | 252,591,577 |
|
| Municipal Securities - 3.3% | | | |
| California Gen. Oblig.: | | | |
| Series 2009, 7.35% 11/1/39 | | $805,000 | $1,220,734 |
| 6.65% 3/1/22 | | 4,360,000 | 5,423,273 |
| 7.3% 10/1/39 | | 6,270,000 | 9,496,040 |
| 7.5% 4/1/34 | | 5,055,000 | 7,658,881 |
| 7.55% 4/1/39 | | 6,085,000 | 9,618,985 |
| Chicago Gen. Oblig.: | | | |
| (Taxable Proj.): | | | |
| Series 2008 B, 5.63% 1/1/22 | | 880,000 | 893,904 |
| Series 2010 C1, 7.781% 1/1/35 | | 10,090,000 | 11,029,984 |
| Series 2012 B, 5.432% 1/1/42 | | 1,205,000 | 1,025,262 |
| 6.314% 1/1/44 | | 5,300,000 | 4,927,887 |
| Illinois Gen. Oblig.: | | | |
| Series 2003: | | | |
| 4.35% 6/1/18 | | 1,848,000 | 1,904,771 |
| 4.95% 6/1/23 | | 4,950,000 | 5,307,242 |
| 5.1% 6/1/33 | | 43,265,000 | 41,580,694 |
| Series 2010 5, 6.2% 7/1/21 | | 2,260,000 | 2,471,174 |
| Series 2010-1, 6.63% 2/1/35 | | 12,290,000 | 13,089,219 |
| Series 2010-3: | | | |
| 5.547% 4/1/19 | | 120,000 | 128,652 |
| 6.725% 4/1/35 | | 9,480,000 | 10,225,318 |
| 7.35% 7/1/35 | | 5,540,000 | 6,153,056 |
| Series 2011: | | | |
| 5.365% 3/1/17 | | 140,000 | 143,433 |
| 5.665% 3/1/18 | | 4,465,000 | 4,704,815 |
| 5.877% 3/1/19 | | 14,325,000 | 15,511,826 |
| Series 2013: | | | |
| 2.69% 12/1/17 | | 1,225,000 | 1,237,287 |
| 3.14% 12/1/18 | | 1,270,000 | 1,287,577 |
| TOTAL MUNICIPAL SECURITIES | | | |
| (Cost $152,190,171) | | | 155,040,014 |
|
| Bank Notes - 1.5% | | | |
| Bank of America NA 5.3% 3/15/17 | | 3,403,000 | 3,493,870 |
| Capital One NA 1.65% 2/5/18 | | 20,761,000 | 20,778,481 |
| Discover Bank: | | | |
| (Delaware) 3.2% 8/9/21 | | 6,841,000 | 6,960,731 |
| 3.1% 6/4/20 | | 6,380,000 | 6,526,108 |
| 8.7% 11/18/19 | | 1,503,000 | 1,769,802 |
| KeyBank NA: | | | |
| 2.25% 3/16/20 | | 9,000,000 | 9,124,488 |
| 6.95% 2/1/28 | | 800,000 | 1,035,474 |
| Marshall & Ilsley Bank 5% 1/17/17 | | 4,952,000 | 5,042,770 |
| RBS Citizens NA 2.5% 3/14/19 | | 2,751,000 | 2,790,171 |
| Regions Bank 7.5% 5/15/18 | | 13,237,000 | 14,516,952 |
| TOTAL BANK NOTES | | | |
| (Cost $70,502,591) | | | 72,038,847 |
| | | Shares | Value |
|
| Money Market Funds - 7.2% | | | |
| Fidelity Cash Central Fund, 0.43% (i) | | | |
| (Cost $341,339,004) | | 341,339,004 | 341,339,004 |
| TOTAL INVESTMENT PORTFOLIO - 109.0% | | | |
| (Cost $5,057,176,002) | | | 5,156,167,740 |
| NET OTHER ASSETS (LIABILITIES) - (9.0)% | | | (426,595,407) |
| NET ASSETS - 100% | | | $4,729,572,333 |
| TBA Sale Commitments | | |
| | Principal Amount | Value |
| Fannie Mae | | |
| 3% 7/1/31 | $(1,000,000) | $(1,048,335) |
| 3% 7/1/31 | (1,000,000) | (1,048,335) |
| 3% 7/1/46 | (8,800,000) | (9,129,273) |
| 3.5% 7/1/31 | (1,500,000) | (1,589,406) |
| 3.5% 7/1/46 | (2,800,000) | (2,953,531) |
| 3.5% 7/1/46 | (6,300,000) | (6,645,445) |
| 3.5% 7/1/46 | (11,300,000) | (11,919,607) |
| 3.5% 7/1/46 | (54,400,000) | (57,382,888) |
| 3.5% 7/1/46 | (14,300,000) | (15,084,105) |
| 3.5% 7/1/46 | (3,300,000) | (3,480,947) |
| 3.5% 7/1/46 | (1,500,000) | (1,582,249) |
| 4% 7/1/46 | (20,900,000) | (22,408,171) |
| 4% 7/1/46 | (900,000) | (964,945) |
| 4.5% 7/1/46 | (20,900,000) | (22,816,862) |
|
| TOTAL FANNIE MAE | | (158,054,099) |
|
| Ginnie Mae | | |
| 3% 7/1/46 | (100,000) | (104,501) |
| 3% 7/1/46 | (1,900,000) | (1,985,514) |
| 3% 7/1/46 | (1,100,000) | (1,149,508) |
| 3% 7/1/46 | (400,000) | (418,003) |
| 3% 7/1/46 | (2,300,000) | (2,403,517) |
| 3% 7/1/46 | (2,270,000) | (2,372,167) |
| 3.5% 7/1/46 | (9,300,000) | (9,868,272) |
| 3.5% 7/1/46 | (9,000,000) | (9,549,941) |
| 4% 7/1/46 | (1,000,000) | (1,069,042) |
|
| TOTAL GINNIE MAE | | (28,920,465) |
|
| TOTAL TBA SALE COMMITMENTS | | |
| (Proceeds $186,457,240) | | $(186,974,564) |
Swaps
| Underlying Reference | Rating(1) | Expiration Date | Clearinghouse/Counterparty | Fixed Payment Received/(Paid) | Notional Amount(2) | Value(1) | Upfront Premium Received/(Paid) | Unrealized Appreciation/(Depreciation) |
| Credit Default Swaps | | | | | | | | |
| Sell Protection | | | | | | | | |
| Ameriquest Mortgage Securities Inc Series 2004-R11 Class M9 | C | Dec. 2034 | Bank of America | 4.25% | USD 64,371 | $(59,626) | $0 | $(59,626) |
| Ameriquest Mortgage Securities Inc Series 2004-R11 Class M9 | C | Dec. 2034 | Credit Suisse International | 4.25% | 111,823 | (103,587) | 0 | (103,587) |
|
| TOTAL CREDIT DEFAULT SWAPS | | | | | | $(163,213) | $0 | $(163,213) |
|
(1) Ratings are presented for credit default swaps in which the Fund has sold protection on the underlying referenced debt. Ratings for an underlying index represent a weighted average of the ratings of all securities included in the index. The credit rating or value can be measures of the current payment/performance risk. Ratings are from Moody's Investors Service, Inc. Where Moody's® ratings are not available, S&P® ratings are disclosed and are indicated as such. All ratings are as of the report date and do not reflect subsequent changes.
(2) The notional amount of each credit default swap where the Fund has sold protection approximates the maximum potential amount of future payments that the Fund could be required to make if a credit event were to occur.
Legend
(a) Security exempt from registration under Rule 144A of the Securities Act of 1933. These securities may be resold in transactions exempt from registration, normally to qualified institutional buyers. At the end of the period, the value of these securities amounted to $285,612,415 or 6.0% of net assets.
(b) Coupon rates for floating and adjustable rate securities reflect the rates in effect at period end.
(c) Security or a portion of the security purchased on a delayed delivery or when-issued basis.
(d) Security or a portion of the security has been segregated as collateral for open bi-lateral over-the-counter (OTC) swaps. At period end, the value of securities pledged amounted to $1,317,242.
(e) Security or a portion of the security has been segregated as collateral for mortgage-backed or asset-backed securities purchased on a delayed delivery or when-issued basis. At period end, the value of securities pledged amounted to $65,575.
(f) Represents an investment in an underlying pool of reverse mortgages which typically do not require regular principal and interest payments as repayment is deferred until a maturity event.
(g) Coupon is inversely indexed to a floating interest rate multiplied by a specified factor. The price may be considerably more volatile than the price of a comparable fixed rate security.
(h) Security represents right to receive monthly interest payments on an underlying pool of mortgages or assets. Principal shown is the outstanding par amount of the pool as of the end of the period.
(i) Affiliated fund that is generally available only to investment companies and other accounts managed by Fidelity Investments. The rate quoted is the annualized seven-day yield of the fund at period end. A complete unaudited listing of the fund's holdings as of its most recent quarter end is available upon request. In addition, each Fidelity Central Fund's financial statements, which are not covered by the Fund's Report of Independent Registered Public Accounting Firm, are available on the SEC's website or upon request.
Affiliated Central Funds
Information regarding fiscal year to date income earned by the Fund from investments in Fidelity Central Funds is as follows:
| Fund | Income earned |
| Fidelity Cash Central Fund | $272,471 |
| Total | $272,471 |
Investment Valuation
The following is a summary of the inputs used, as of June 30, 2016, involving the Fund's assets and liabilities carried at fair value. The inputs or methodology used for valuing securities may not be an indication of the risk associated with investing in those securities. For more information on valuation inputs, and their aggregation into the levels used below, please refer to the Investment Valuation section in the accompanying Notes to Financial Statements.
| | Valuation Inputs at Reporting Date: |
| Description | Total | Level 1 | Level 2 | Level 3 |
| Investments in Securities: | | | | |
| Corporate Bonds | $2,179,877,690 | $-- | $2,179,877,690 | $-- |
| U.S. Government and Government Agency Obligations | 638,240,562 | -- | 638,240,562 | -- |
| U.S. Government Agency - Mortgage Securities | 1,451,779,250 | -- | 1,451,779,250 | -- |
| Asset-Backed Securities | 50,211,221 | -- | 48,755,948 | 1,455,273 |
| Collateralized Mortgage Obligations | 15,049,575 | -- | 15,049,575 | -- |
| Commercial Mortgage Securities | 252,591,577 | -- | 252,591,577 | -- |
| Municipal Securities | 155,040,014 | -- | 155,040,014 | -- |
| Bank Notes | 72,038,847 | -- | 72,038,847 | -- |
| Money Market Funds | 341,339,004 | 341,339,004 | -- | -- |
| Total Investments in Securities: | $5,156,167,740 | $341,339,004 | $4,813,373,463 | $1,455,273 |
| Derivative Instruments: | | | | |
| Liabilities | | | | |
| Swaps | $(163,213) | $-- | $(163,213) | $-- |
| Total Liabilities | $(163,213) | $-- | $(163,213) | $-- |
| Total Derivative Instruments: | $(163,213) | $-- | $(163,213) | $-- |
| Other Financial Instruments: | | | | |
| TBA Sale Commitments | $(186,974,564) | $-- | $(186,974,564) | $-- |
| Total Other Financial Instruments: | $(186,974,564) | $-- | $(186,974,564) | $-- |
Value of Derivative Instruments
The following table is a summary of the Fund's value of derivative instruments by primary risk exposure as of June 30, 2016. For additional information on derivative instruments, please refer to the Derivative Instruments section in the accompanying Notes to Financial Statements.
| Primary Risk Exposure / Derivative Type | Value |
| | Asset | Liability |
| Credit Risk | | |
| Swaps(a) | $0 | $(163,213) |
| Total Credit Risk | $0 | $(163,213) |
| Total Value of Derivatives | $0 | $(163,213) |
(a) For bi-lateral over-the-counter (OTC) swaps, reflects gross value which is presented in the Statement of Assets and Liabilities in the bi-lateral OTC swaps, at value line-items.
Other Information
Distribution of investments by country or territory of incorporation, as a percentage of Total Net Assets, is as follows (Unaudited):
| United States of America | 88.2% |
| United Kingdom | 2.7% |
| Mexico | 2.1% |
| Netherlands | 1.7% |
| Luxembourg | 1.1% |
| Others (Individually Less Than 1%) | 4.2% |
| | 100.0% |
See accompanying notes which are an integral part of the financial statements.
Fidelity® VIP Investment Grade Central Fund
Financial Statements
Statement of Assets and Liabilities
| | | June 30, 2016 |
| Assets | | |
Investment in securities, at value — See accompanying schedule:
Unaffiliated issuers (cost $4,715,836,998) | $4,814,828,736 | |
| Fidelity Central Funds (cost $341,339,004) | 341,339,004 | |
| Total Investments (cost $5,057,176,002) | | $5,156,167,740 |
| Receivable for investments sold | | 98,349 |
| Receivable for TBA sale commitments | | 186,457,240 |
| Receivable for fund shares sold | | 49 |
| Interest receivable | | 32,028,105 |
| Distributions receivable from Fidelity Central Funds | | 76,904 |
| Other receivables | | 685 |
| Total assets | | 5,374,829,072 |
| Liabilities | | |
| Payable for investments purchased | | |
| Regular delivery | $102,313,641 | |
| Delayed delivery | 355,444,843 | |
| TBA sale commitments, at value | 186,974,564 | |
| Payable for fund shares redeemed | 340,965 | |
| Bi-lateral OTC swaps, at value | 163,213 | |
| Other payables and accrued expenses | 19,513 | |
| Total liabilities | | 645,256,739 |
| Net Assets | | $4,729,572,333 |
| Net Assets consist of: | | |
| Paid in capital | | $4,600,397,001 |
| Undistributed net investment income | | 7,865,870 |
| Accumulated undistributed net realized gain (loss) on investments | | 22,998,261 |
| Net unrealized appreciation (depreciation) on investments | | 98,311,201 |
| Net Assets, for 44,138,802 shares outstanding | | $4,729,572,333 |
| Net Asset Value, offering price and redemption price per share ($4,729,572,333 ÷ 44,138,802 shares) | | $107.15 |
See accompanying notes which are an integral part of the financial statements.
Statement of Operations
| | | Six months ended June 30, 2016 |
| Investment Income | | |
| Interest | | $71,794,671 |
| Income from Fidelity Central Funds | | 272,471 |
| Total income | | 72,067,142 |
| Expenses | | |
| Custodian fees and expenses | $37,805 | |
| Independent trustees' fees and expenses | 10,423 | |
| Total expenses before reductions | 48,228 | |
| Expense reductions | (15,508) | 32,720 |
| Net investment income (loss) | | 72,034,422 |
| Realized and Unrealized Gain (Loss) | | |
| Net realized gain (loss) on: | | |
| Investment securities: | | |
| Unaffiliated issuers | 25,083,861 | |
| Swaps | 51,233 | |
| Total net realized gain (loss) | | 25,135,094 |
Change in net unrealized appreciation (depreciation) on:
Investment securities | 172,970,732 | |
| Swaps | (41,777) | |
| Delayed delivery commitments | (514,881) | |
| Total change in net unrealized appreciation (depreciation) | | 172,414,074 |
| Net gain (loss) | | 197,549,168 |
| Net increase (decrease) in net assets resulting from operations | | $269,583,590 |
See accompanying notes which are an integral part of the financial statements.
Statement of Changes in Net Assets
| | Six months ended June 30, 2016 | Year ended December 31, 2015 |
| Increase (Decrease) in Net Assets | | |
| Operations | | |
| Net investment income (loss) | $72,034,422 | $145,917,288 |
| Net realized gain (loss) | 25,135,094 | 50,400,886 |
| Change in net unrealized appreciation (depreciation) | 172,414,074 | (191,259,826) |
| Net increase (decrease) in net assets resulting from operations | 269,583,590 | 5,058,348 |
| Distributions to shareholders from net investment income | (71,375,591) | (138,953,417) |
| Distributions to shareholders from net realized gain | (46,260,935) | (3,297,143) |
| Total distributions | (117,636,526) | (142,250,560) |
| Share transactions | | |
| Proceeds from sales of shares | 15,948,934 | 513,825,585 |
| Reinvestment of distributions | 117,636,526 | 142,250,560 |
| Cost of shares redeemed | (167,496,521) | (301,190,265) |
| Net increase (decrease) in net assets resulting from share transactions | (33,911,061) | 354,885,880 |
| Total increase (decrease) in net assets | 118,036,003 | 217,693,668 |
| Net Assets | | |
| Beginning of period | 4,611,536,330 | 4,393,842,662 |
| End of period | $4,729,572,333 | $4,611,536,330 |
| Other Information | | |
| Undistributed net investment income end of period | $7,865,870 | $7,207,039 |
| Shares | | |
| Sold | 151,612 | 4,808,405 |
| Issued in reinvestment of distributions | 1,128,171 | 1,342,876 |
| Redeemed | (1,606,015) | (2,865,332) |
| Net increase (decrease) | (326,232) | 3,285,949 |
See accompanying notes which are an integral part of the financial statements.
Financial Highlights — Fidelity VIP Investment Grade Central Fund
| | Six months endedJune 30, | Years ended December 31, | | | | |
| | 2016 | 2015 | 2014 | 2013 | 2012 | 2011 |
| Selected Per–Share Data | | | | | | |
| Net asset value, beginning of period | $103.71 | $106.70 | $103.29 | $108.89 | $107.64 | $105.18 |
| Income from Investment Operations | | | | | | |
| Net investment income (loss)A | 1.641 | 3.292 | 3.178 | 2.829 | 3.111 | 3.817 |
| Net realized and unrealized gain (loss) | 4.494 | (3.071) | 3.336 | (4.398) | 3.442 | 4.385 |
| Total from investment operations | 6.135 | .221 | 6.514 | (1.569) | 6.553 | 8.202 |
| Distributions from net investment income | (1.626) | (3.137) | (3.104) | (2.826) | (3.056) | (3.851) |
| Distributions from net realized gain | (1.069) | (.074) | – | (1.205) | (2.247) | (1.891) |
| Total distributions | (2.695) | (3.211) | (3.104) | (4.031) | (5.303) | (5.742) |
| Net asset value, end of period | $107.15 | $103.71 | $106.70 | $103.29 | $108.89 | $107.64 |
| Total ReturnB,C | 6.01% | .18% | 6.37% | (1.46)% | 6.16% | 7.96% |
| Ratios to Average Net AssetsD,E | | | | | | |
| Expenses before reductionsF | - %G | -% | -% | -% | -% | -% |
| Expenses net of fee waivers, if anyF | - %G | -% | -% | -% | -% | -% |
| Expenses net of all reductionsF | - %G | -% | -% | -% | -% | -% |
| Net investment income (loss) | 3.15%G | 3.11% | 3.01% | 2.68% | 2.84% | 3.57% |
| Supplemental Data | | | | | | |
| Net assets, end of period (000 omitted) | $4,729,572 | $4,611,536 | $4,393,843 | $3,945,749 | $4,252,424 | $3,790,381 |
| Portfolio turnover rateH | 119%G | 248% | 151% | 333% | 291% | 302% |
A Calculated based on average shares outstanding during the period.
B Total returns for periods of less than one year are not annualized.
C Total returns would have been lower if certain expenses had not been reduced during the applicable periods shown.
D Fees and expenses of any underlying Fidelity Central Funds are not included in the Fund's expense ratio. The Fund indirectly bears its proportionate share of the expenses of any underlying Fidelity Central Funds.
E Expense ratios reflect operating expenses of the Fund. Expenses before reductions do not reflect amounts reimbursed by the investment adviser or reductions from expense offset arrangements and do not represent the amount paid by the Fund during periods when reimbursements or reductions occur. Expenses net of fee waivers reflect expenses after reimbursement by the investment adviser but prior to reductions from expense offset arrangements. Expenses net of all reductions represent the net expenses paid by the Fund.
F Amount represents less than .005%.
G Annualized
H Amount does not include the portfolio activity of any underlying Fidelity Central Funds.
See accompanying notes which are an integral part of the financial statements.
Notes to Financial Statements
For the period ended June 30, 2016
1. Organization.
Fidelity VIP Investment Grade Central Fund (the Fund) is a fund of Fidelity Garrison Street Trust (the Trust) and is authorized to issue an unlimited number of shares. Shares of the Fund are only offered to other investment companies and accounts managed by Fidelity Management & Research Company (FMR), or its affiliates (the Investing Funds). The Trust is registered under the Investment Company Act of 1940, as amended (the 1940 Act), as an open-end management investment company organized as a Massachusetts business trust.
2. Investments in Fidelity Central Funds.
The Fund invests in Fidelity Central Funds, which are open-end investment companies generally available only to other investment companies and accounts managed by the investment adviser and its affiliates. The Fund's Schedule of Investments lists each of the Fidelity Central Funds held as of period end, if any, as an investment of the Fund, but does not include the underlying holdings of each Fidelity Central Fund. As an Investing Fund, the Fund indirectly bears its proportionate share of the expenses of the underlying Fidelity Central Funds.
The Money Market Central Funds seek preservation of capital and current income and are managed by Fidelity Investments Money Management, Inc. (FIMM), an affiliate of the investment adviser. Annualized expenses of the Money Market Central Funds as of their most recent shareholder report date are less than .005%.
A complete unaudited list of holdings for each Fidelity Central Fund is available upon request or at the Securities and Exchange Commission (the SEC) website at www.sec.gov. In addition, the financial statements of the Fidelity Central Funds, which are not covered by the Fund's Report of Independent Registered Public Accounting Firm, are available on the SEC website or upon request.
3. Significant Accounting Policies.
The financial statements have been prepared in conformity with accounting principles generally accepted in the United States of America (GAAP), which require management to make certain estimates and assumptions at the date of the financial statements. Actual results could differ from those estimates. Subsequent events, if any, through the date that the financial statements were issued have been evaluated in the preparation of the financial statements. The following summarizes the significant accounting policies of the Fund:
Investment Valuation. Investments are valued as of 4:00 p.m. Eastern time on the last calendar day of the period. The Board of Trustees (the Board) has delegated the day to day responsibility for the valuation of the Fund's investments to the FMR Fair Value Committee (the Committee). In accordance with valuation policies and procedures approved by the Board, the Fund attempts to obtain prices from one or more third party pricing vendors or brokers to value its investments. When current market prices, quotations or currency exchange rates are not readily available or reliable, investments will be fair valued in good faith by the Committee, in accordance with procedures adopted by the Board. Factors used in determining fair value vary by investment type and may include market or investment specific events, changes in interest rates and credit quality. The frequency with which these procedures are used cannot be predicted and they may be utilized to a significant extent. The Committee oversees the Fund's valuation policies and procedures and reports to the Board on the Committee's activities and fair value determinations. The Board monitors the appropriateness of the procedures used in valuing the Fund's investments and ratifies the fair value determinations of the Committee.
The Fund categorizes the inputs to valuation techniques used to value its investments into a disclosure hierarchy consisting of three levels as shown below:
- Level 1 – quoted prices in active markets for identical investments
- Level 2 – other significant observable inputs (including quoted prices for similar investments, interest rates, prepayment speeds, etc.)
- Level 3 – unobservable inputs (including the Fund's own assumptions based on the best information available)
Valuation techniques used to value the Fund's investments by major category are as follows:
Debt securities, including restricted securities, are valued based on evaluated prices received from third party pricing vendors or from brokers who make markets in such securities. Corporate bonds, bank notes, municipal securities and U.S. government and government agency obligations are valued by pricing vendors who utilize matrix pricing which considers yield or price of bonds of comparable quality, coupon, maturity and type or by broker-supplied prices. Asset backed securities, collateralized mortgage obligations, commercial mortgage securities and U.S. government agency mortgage securities are valued by pricing vendors who utilize matrix pricing which considers prepayment speed assumptions, attributes of the collateral, yield or price of bonds of comparable quality, coupon, maturity and type or by broker-supplied prices. Brokers which make markets in asset backed securities, collateralized mortgage obligations and commercial mortgage securities may also consider such factors as the structure of the issue, cash flow assumptions, the value of underlying assets as well as any guarantees. Swaps are marked-to-market daily based on valuations from third party pricing vendors, registered derivatives clearing organizations (clearinghouses) or broker-supplied valuations. These pricing sources may utilize inputs such as interest rate curves, credit spread curves, default possibilities and recovery rates. When independent prices are unavailable or unreliable, debt securities and swaps may be valued utilizing pricing methodologies which consider similar factors that would be used by third party pricing vendors. Debt securities and swaps are generally categorized as Level 2 in the hierarchy but may be Level 3 depending on the circumstances.
Investments in open-end mutual funds, including the Fidelity Central Funds, are valued at their closing net asset value (NAV) each business day and are categorized as Level 1 in the hierarchy.
Changes in valuation techniques may result in transfers in or out of an assigned level within the disclosure hierarchy. The aggregate value of investments by input level as of June 30, 2016 is included at the end of the Fund's Schedule of Investments.
Investment Transactions and Income. For financial reporting purposes, the Fund's investment holdings and NAV include trades executed through the end of the last business day of the period. The NAV per share for processing shareholder transactions is calculated as of the close of business of the New York Stock Exchange (NYSE), normally 4:00 p.m. Eastern time and includes trades executed through the end of the prior business day. Gains and losses on securities sold are determined on the basis of identified cost. Income and capital gain distributions from Fidelity Central Funds, if any, are recorded on the ex-dividend date. Interest income is accrued as earned and includes coupon interest and amortization of premium and accretion of discount on debt securities as applicable. The principal amount on inflation-indexed securities is periodically adjusted to the rate of inflation and interest is accrued based on the principal amount. The adjustments to principal due to inflation are reflected as increases or decreases to Interest in the accompanying Statement of Operations. Debt obligations may be placed on non-accrual status and related interest income may be reduced by ceasing current accruals and writing off interest receivables when the collection of all or a portion of interest has become doubtful based on consistently applied procedures. A debt obligation is removed from non-accrual status when the issuer resumes interest payments or when collectability of interest is reasonably assured.
Expenses. Expenses directly attributable to a fund are charged to that fund. Expenses attributable to more than one fund are allocated among the respective funds on the basis of relative net assets or other appropriate methods. Expense estimates are accrued in the period to which they relate and adjustments are made when actual amounts are known.
Income Tax Information and Distributions to Shareholders. Each year, the Fund intends to qualify as a regulated investment company under Subchapter M of the Internal Revenue Code, including distributing substantially all of its taxable income and realized gains. As a result, no provision for U.S. Federal income taxes is required. The Fund files a U.S. federal tax return, in addition to state and local tax returns as required. The Fund's federal income tax returns are subject to examination by the Internal Revenue Service (IRS) for a period of three fiscal years after they are filed. State and local tax returns may be subject to examination for an additional fiscal year depending on the jurisdiction.
Dividends are declared and recorded daily and paid monthly from net investment income. Distributions from realized gains, if any, are declared and recorded on the ex-dividend date. Income and capital gain distributions are determined in accordance with income tax regulations, which may differ from GAAP.
Capital accounts within the financial statements are adjusted for permanent book-tax differences. These adjustments have no impact on net assets or the results of operations. Capital accounts are not adjusted for temporary book-tax differences which will reverse in a subsequent period.
Book-tax differences are primarily due to futures contracts, market discount, financing transactions, capital loss carryforwards and losses deferred due to wash sales and excise tax regulations.
The federal tax cost of investment securities and unrealized appreciation (depreciation) as of period end were as follows:
| Gross unrealized appreciation | $151,739,839 |
| Gross unrealized depreciation | (47,787,322) |
| Net unrealized appreciation (depreciation) on securities | $103,952,517 |
| Tax cost | $5,052,215,223 |
The Fund elected to defer to its next fiscal year approximately $1,558,662 of capital losses recognized during the period November 1, 2015 to December 31, 2015.
Delayed Delivery Transactions and When-Issued Securities. During the period, the Fund transacted in securities on a delayed delivery or when-issued basis. Payment and delivery may take place after the customary settlement period for that security. The price of the underlying securities and the date when the securities will be delivered and paid for are fixed at the time the transaction is negotiated. The securities purchased on a delayed delivery or when-issued basis are identified as such in the Fund's Schedule of Investments. The Fund may receive compensation for interest forgone in the purchase of a delayed delivery or when-issued security. With respect to purchase commitments, the Fund identifies securities as segregated in its records with a value at least equal to the amount of the commitment. Losses may arise due to changes in the value of the underlying securities or if the counterparty does not perform under the contract's terms, or if the issuer does not issue the securities due to political, economic, or other factors.
To-Be-Announced (TBA) Securities and Mortgage Dollar Rolls. During the period, the Fund transacted in TBA securities that involved buying or selling mortgage-backed securities (MBS) on a forward commitment basis. A TBA transaction typically does not designate the actual security to be delivered and only includes an approximate principal amount; however delivered securities must meet specified terms defined by industry guidelines, including issuer, rate and current principal amount outstanding on underlying mortgage pools. The Fund may enter into a TBA transaction with the intent to take possession of or deliver the underlying MBS, or the Fund may elect to extend the settlement by entering into either a mortgage or reverse mortgage dollar roll. Mortgage dollar rolls are transactions where a fund sells TBA securities and simultaneously agrees to repurchase MBS on a later date at a lower price and with the same counterparty. Reverse mortgage dollar rolls involve the purchase and simultaneous agreement to sell TBA securities on a later date at a lower price. Transactions in mortgage dollar rolls and reverse mortgage dollar rolls are accounted for as purchases and sales and may result in an increase to the Fund's portfolio turnover rate.
Purchases and sales of TBA securities involve risks similar to those discussed above for delayed delivery and when-issued securities. Also, if the counterparty in a mortgage dollar roll or a reverse mortgage dollar roll transaction files for bankruptcy or becomes insolvent, the Fund's right to repurchase or sell securities may be limited. Additionally, when a fund sells TBA securities without already owning or having the right to obtain the deliverable securities (an uncovered forward commitment to sell), it incurs a risk of loss because it could have to purchase the securities at a price that is higher than the price at which it sold them. A fund may be unable to purchase the deliverable securities if the corresponding market is illiquid.
TBA securities subject to a forward commitment to sell at period end are included at the end of the Fund's Schedule of Investments under the caption "TBA Sale Commitments." The proceeds and value of these commitments are reflected in the Fund's Statement of Assets and Liabilities as Receivable for TBA sale commitments and TBA sale commitments, at value, respectively.
Restricted Securities. The Fund may invest in securities that are subject to legal or contractual restrictions on resale. These securities generally may be resold in transactions exempt from registration or to the public if the securities are registered. Disposal of these securities may involve time-consuming negotiations and expense, and prompt sale at an acceptable price may be difficult. Information regarding restricted securities is included at the end of the Fund's Schedule of Investments.
4. Derivative Instruments.
Risk Exposures and the Use of Derivative Instruments. The Fund's investment objective allows the Fund to enter into various types of derivative contracts, including swaps. Derivatives are investments whose value is primarily derived from underlying assets, indices or reference rates and may be transacted on an exchange or over-the-counter (OTC). Derivatives may involve a future commitment to buy or sell a specified asset based on specified terms, to exchange future cash flows at periodic intervals based on a notional principal amount, or for one party to make one or more payments upon the occurrence of specified events in exchange for periodic payments from the other party.
The Fund used derivatives to increase returns, to gain exposure to certain types of assets and to manage exposure to certain risks as defined below. The success of any strategy involving derivatives depends on analysis of numerous economic factors, and if the strategies for investment do not work as intended, the Fund may not achieve its objectives.
The Fund's use of derivatives increased or decreased its exposure to the following risk:
| Credit Risk | Credit risk relates to the ability of the issuer of a financial instrument to make further principal or interest payments on an obligation or commitment that it has to the Fund.
|
The Fund is also exposed to additional risks from investing in derivatives, such as liquidity risk and counterparty credit risk. Liquidity risk is the risk that the Fund will be unable to close out the derivative in the open market in a timely manner. Counterparty credit risk is the risk that the counterparty will not be able to fulfill its obligation to the Fund. Derivative counterparty credit risk is managed through formal evaluation of the creditworthiness of all potential counterparties. On certain OTC derivatives such as bi-lateral swaps, the Fund attempts to reduce its exposure to counterparty credit risk by entering into an International Swaps and Derivatives Association, Inc. (ISDA) Master Agreement with each of its counterparties. The ISDA Master Agreement gives the Fund the right to terminate all transactions traded under such agreement upon the deterioration in the credit quality of the counterparty beyond specified levels. The ISDA Master Agreement gives each party the right, upon an event of default by the other party or a termination of the agreement, to close out all transactions traded under such agreement and to net amounts owed under each transaction to one net payable by one party to the other. To mitigate counterparty credit risk on bi-lateral OTC derivatives, the Fund receives collateral in the form of cash or securities once the Fund's net unrealized appreciation on outstanding derivative contracts under an ISDA Master Agreement exceeds certain applicable thresholds, subject to certain minimum transfer provisions. The collateral received is held in segregated accounts with the Fund's custodian bank in accordance with the collateral agreements entered into between the Fund, the counterparty and the Fund's custodian bank. The Fund could experience delays and costs in gaining access to the collateral even though it is held by the Fund's custodian bank. The Fund's maximum risk of loss from counterparty credit risk related to bi-lateral OTC derivatives is generally the aggregate unrealized appreciation and unpaid counterparty payments in excess of any collateral pledged by the counterparty to the Fund. The Fund may be required to pledge collateral for the benefit of the counterparties on bi-lateral OTC derivatives in an amount not less than each counterparty's unrealized appreciation on outstanding derivative contracts, subject to certain minimum transfer provisions, and any such pledged collateral is identified in the Schedule of Investments.
Investing in derivatives may involve greater risks than investing in the underlying assets directly and, to varying degrees, may involve risk of loss in excess of any initial investment and collateral received and amounts recognized in the Statement of Assets and Liabilities. In addition, there may be the risk that the change in value of the derivative contract does not correspond to the change in value of the underlying instrument.
Net Realized Gain (Loss) and Change in Net Unrealized Appreciation (Depreciation) on Derivatives. The table below, which reflects the impacts of derivatives on the financial performance of the Fund, summarizes the net realized gain (loss) and change in net unrealized appreciation (depreciation) for derivatives during the period as presented in the Statement of Operations.
| Primary Risk Exposure / Derivative Type | Net Realized Gain (Loss) | Change in Net Unrealized Appreciation (Depreciation) |
| Credit Risk | | |
| Swaps | $51,233 | $(41,777) |
| Total Credit Risk | $51,233 | $(41,777) |
A summary of the value of derivatives by primary risk exposure as of period end is included at the end of the Schedule of Investments.
Swaps. A swap is a contract between two parties to exchange future cash flows at periodic intervals based on a notional principal amount. A bi-lateral OTC swap is a transaction between a fund and a dealer counterparty where cash flows are exchanged between the two parties for the life of the swap.
Bi-lateral OTC swaps are marked-to-market daily and changes in value are reflected in the Statement of Assets and Liabilities in the bi-lateral OTC swaps at value line items. Any upfront premiums paid or received upon entering a bi-lateral OTC swap to compensate for differences between stated terms of the swap and prevailing market conditions (e.g. credit spreads, interest rates or other factors) are recorded in net unrealized appreciation (depreciation) in the Statement of Assets and Liabilities and amortized to realized gain or (loss) ratably over the term of the swap. Any unamortized upfront premiums are presented in the Schedule of Investments.
Payments are exchanged at specified intervals, accrued daily commencing with the effective date of the contract and recorded as realized gain or (loss). Some swaps may be terminated prior to the effective date and realize a gain or loss upon termination. The net realized gain (loss) and change in net unrealized appreciation (depreciation) on swaps during the period is included in the Statement of Operations.
Any open swaps at period end are included in the Schedule of Investments under the caption "Swaps" and are representative of volume of activity during the period.
Credit Default Swaps. Credit default swaps enable the Fund to buy or sell protection against specified credit events on a single-name issuer or a traded credit index. Under the terms of a credit default swap the buyer of protection (buyer) receives credit protection in exchange for making periodic payments to the seller of protection (seller) based on a fixed percentage applied to a notional principal amount. In return for these payments, the seller will be required to make a payment upon the occurrence of one or more specified credit events. The Fund enters into credit default swaps as a seller to gain credit exposure to an issuer and/or as a buyer to obtain a measure of protection against defaults of an issuer. Periodic payments are made over the life of the contract by the buyer provided that no credit event occurs.
For credit default swaps on most corporate and sovereign issuers, credit events include bankruptcy, failure to pay or repudiation/moratorium. For credit default swaps on corporate or sovereign issuers, the obligation that may be put to the seller is not limited to the specific reference obligation described in the Schedule of Investments. For credit default swaps on asset-backed securities, a credit event may be triggered by events such as failure to pay principal, maturity extension, rating downgrade or write-down. For credit default swaps on asset-backed securities, the reference obligation described represents the security that may be put to the seller. For credit default swaps on a traded credit index, a specified credit event may affect all or individual underlying securities included in the index.
As a seller, if an underlying credit event occurs, the Fund will pay a net settlement amount of cash equal to the notional amount of the swap less the recovery value of the reference obligation or underlying securities comprising an index. Only in the event of the industry's inability to value the underlying asset will the Fund be required to take delivery of the reference obligation or underlying securities comprising an index and pay an amount equal to the notional amount of the swap.
As a buyer, if an underlying credit event occurs, the Fund will receive a net settlement amount of cash equal to the notional amount of the swap less the recovery value of the reference obligation or underlying securities comprising an index. Only in the event of the industry's inability to value the underlying asset will the Fund be required to deliver the reference obligation or underlying securities comprising an index in exchange for payment of an amount equal to the notional amount of the swap.
Typically, the value of each credit default swap and credit rating disclosed for each reference obligation in the Schedule of Investments, where the Fund is the seller, can be used as measures of the current payment/performance risk of the swap. As the value of the swap changes as a positive or negative percentage of the total notional amount, the payment/performance risk may decrease or increase, respectively. In addition to these measures, the investment adviser monitors a variety of factors including cash flow assumptions, market activity and market sentiment as part of its ongoing process of assessing payment/performance risk.
5. Purchases and Sales of Investments.
Purchases and sales of securities, other than short-term securities and U.S. government securities, aggregated $244,590,807 and $578,742,592, respectively.
6. Fees and Other Transactions with Affiliates.
Management Fee and Expense Contract. Fidelity Investments Money Management, Inc. (the investment adviser), an affiliate of FMR, provides the Fund with investment management services. The Fund does not pay any fees for these services. Pursuant to the Fund's management contract with the investment adviser, FMR pays the investment adviser a portion of the management fees it receives from the Investing Funds. In addition, under an expense contract, FMR also pays all other expenses of the Fund, excluding custody fees, the compensation of the independent Trustees, and certain exceptions such as interest expense.
Interfund Trades. The Fund may purchase from or sell securities to other Fidelity Funds under procedures adopted by the Board. The procedures have been designed to ensure these interfund trades are executed in accordance with Rule 17a-7 of the 1940 Act. Interfund trades are included within the respective purchases and sales amounts shown in the Purchases and Sales of Investments note.
7. Security Lending.
The Fund lends portfolio securities from time to time in order to earn additional income. On the settlement date of the loan, the Fund receives collateral (in the form of U.S. Treasury obligations, letters of credit and/or cash) against the loaned securities and maintains collateral in an amount not less than 100% of the market value of the loaned securities during the period of the loan. The market value of the loaned securities is determined at the close of business of the Fund and any additional required collateral is delivered to the Fund on the next business day. The Fund or borrower may terminate the loan at any time, and if the borrower defaults on its obligation to return the securities loaned because of insolvency or other reasons, the Fund may apply collateral received from the borrower against the obligation. The Fund may experience delays and costs in recovering the securities loaned. Any cash collateral received is maintained at the Fund's custodian and/or invested in cash equivalents. At period end, there were no security loans outstanding. Security lending income represents the income earned on investing cash collateral, less rebates paid to borrowers, plus any premium payments received for lending certain types of securities. Security lending income is presented in the Statement of Operations as a component of interest income. Total security lending income during the period amounted to $60,878.
8. Expense Reductions.
FMR has voluntarily agreed to reimburse a portion of the Fund's operating expenses. For the period, the reimbursement reduced the expenses by $10,423.
In addition, through arrangements with the Fund's custodian, credits realized as a result of certain uninvested cash balances were used to reduce the Fund's expenses. During the period, these credits reduced the Fund's custody expenses by $5,085.
9. Other.
The Fund's organizational documents provide former and current trustees and officers with a limited indemnification against liabilities arising in connection with the performance of their duties to the Fund. In the normal course of business, the Fund may also enter into contracts that provide general indemnifications. The Fund's maximum exposure under these arrangements is unknown as this would be dependent on future claims that may be made against the Fund. The risk of material loss from such claims is considered remote.
At the end of the period, mutual funds managed by FMR or its affiliates were the owners of record of all of the outstanding shares of the Fund according to the following schedule.
| Fund | Ownership % |
| VIP Asset Manager Portfolio | 8.5% |
| VIP Asset Manager: Growth Portfolio | 0.8% |
| VIP Balanced Portfolio | 20.5% |
| VIP Investment Grade Bond Portfolio | 70.2% |
10. Credit Risk.
The Fund invests a portion of its assets in structured securities of issuers backed by commercial and residential mortgage loans, credit card receivables and automotive loans. The value and related income of these securities is sensitive to changes in economic conditions, including delinquencies and/or defaults.
VIP Investment Grade Central Fund
Report of Independent Registered Public Accounting Firm
To the Trustees of Fidelity Garrison Street Trust and Shareholders of Fidelity VIP Investment Grade Central Fund:
We have audited the accompanying statement of assets and liabilities of Fidelity VIP Investment Grade Central Fund (the Fund), a fund of Fidelity Garrison Street Trust, including the schedule of investments, as of June 30, 2016, and the related statement of operations for the six months then ended, the statement of changes in net assets for the six months ended June 30, 2016 and for the year ended December 31, 2015, and the financial highlights for the six months ended June 30, 2016 and for each of the five years in the period ended December 31, 2015. These financial statements and financial highlights are the responsibility of the Fund's management. Our responsibility is to express an opinion on these financial statements and financial highlights based on our audits.
We conducted our audits in accordance with the standards of the Public Company Accounting Oversight Board (United States). Those standards require that we plan and perform the audit to obtain reasonable assurance about whether the financial statements and financial highlights are free of material misstatement. The Fund is not required to have, nor were we engaged to perform, an audit of its internal control over financial reporting. Our audits included consideration of internal control over financial reporting as a basis for designing audit procedures that are appropriate in the circumstances, but not for the purpose of expressing an opinion on the effectiveness of the Fund's internal control over financial reporting. Accordingly, we express no such opinion. An audit also includes examining, on a test basis, evidence supporting the amounts and disclosures in the financial statements, assessing the accounting principles used and significant estimates made by management, as well as evaluating the overall financial statement presentation. Our procedures included confirmation of securities owned as of June 30, 2016, by correspondence with the custodians and brokers; when replies were not received from brokers, we performed other auditing procedures. We believe that our audits provide a reasonable basis for our opinion.
In our opinion, such financial statements and financial highlights referred to above present fairly, in all material respects, the financial position of Fidelity VIP Investment Grade Central Fund as of June 30, 2016, the results of its operations for the six-months then ended, the changes in its net assets for the six months ended June 30, 2016 and for the year ended December 31, 2015, and the financial highlights for the six months ended June 30, 2016 and for each of the five years in the period ended December 31, 2015, in conformity with accounting principles generally accepted in the United States of America.
DELOITTE & TOUCHE LLP
Boston, Massachusetts
August 22, 2016
VIP Investment Grade Central Fund
Shareholder Expense Example
As a shareholder of the Fund, you incur two types of costs: (1) transaction costs and (2) ongoing costs, including other Fund expenses. This Example is intended to help you understand your ongoing costs (in dollars) of investing in the Fund and to compare these costs with the ongoing costs of investing in other mutual funds.
The Example is based on an investment of $1,000 invested at the beginning of the period and held for the entire period (January 1, 2016 to June 30, 2016).
Actual Expenses
The first line of the accompanying table provides information about actual account values and actual expenses. You may use the information in this line, together with the amount you invested, to estimate the expenses that you paid over the period. Simply divide your account value by $1,000.00 (for example, an $8,600 account value divided by $1,000.00 = 8.6), then multiply the result by the number in the first line under the heading entitled "Expenses Paid During Period" to estimate the expenses you paid on your account during this period. In addition, the Fund, as a shareholder in the underlying Fidelity Central Funds, will indirectly bear its pro-rata share of the fees and expenses incurred by the underlying Fidelity Central Funds. These fees and expenses are not included in the Fund's annualized expense ratio used to calculate the expense estimate in the table below.
Hypothetical Example for Comparison Purposes
The second line of the accompanying table provides information about hypothetical account values and hypothetical expenses based on the Fund's actual expense ratio and an assumed rate of return of 5% per year before expenses, which is not the Fund's actual return. The hypothetical account values and expenses may not be used to estimate the actual ending account balance or expenses you paid for the period. You may use this information to compare the ongoing costs of investing in the Fund and other funds. To do so, compare this 5% hypothetical example with the 5% hypothetical examples that appear in the shareholder reports of the other funds. In addition, the Fund, as a shareholder in the underlying Fidelity Central Funds, will indirectly bear its pro-rata share of the fees and expenses incurred by the underlying Fidelity Central Funds. These fees and expenses are not included in the Fund's annualized expense ratio used to calculate the expense estimate in the table below.
Please note that the expenses shown in the table are meant to highlight your ongoing costs only and do not reflect any transaction costs. Therefore, the second line of the table is useful in comparing ongoing costs only, and will not help you determine the relative total costs of owning different funds.
| | Annualized Expense Ratio-A | Beginning
Account Value
January 1, 2016 | Ending
Account Value
June 30, 2016 | Expenses Paid
During Period-B
January 1, 2016
to June 30, 2016 |
| Actual | .0017% | $1,000.00 | $1,060.10 | $.01 |
| Hypothetical-C | | $1,000.00 | $1,024.85 | $.01 |
A Annualized expense ratio reflects expenses net of applicable fee waivers.
B Expenses are equal to the Fund's annualized expense ratio, multiplied by the average account value over the period, multiplied by 182/366 (to reflect the one-half year period).
C 5% return per year before expenses
VIPIGB-SANN-0816
1.705629.118
Item 2.
Code of Ethics
Not applicable.
Item 3.
Audit Committee Financial Expert
Not applicable.
Item 4.
Principal Accountant Fees and Services
Not applicable.
Item 5.
Audit Committee of Listed Registrants
Not applicable.
Item 6.
Investments
(a)
Not applicable.
(b)
Not applicable
Item 7.
Disclosure of Proxy Voting Policies and Procedures for Closed-End Management Investment Companies
Not applicable.
Item 8.
Portfolio Managers of Closed-End Management Investment Companies
Not applicable.
Item 9.
Purchase of Equity Securities by Closed-End Management Investment Company and Affiliated Purchasers
Not applicable.
Item 10.
Submission of Matters to a Vote of Security Holders
There were no material changes to the procedures by which shareholders may recommend nominees to the Variable Insurance Products Fund V’s Board of Trustees.
Item 11.
Controls and Procedures
(a)(i) The President and Treasurer and the Chief Financial Officer have concluded that the Variable Insurance Products Fund V’s (the “Trust”) disclosure controls and procedures (as defined in Rule 30a-3(c) under the Investment Company Act) provide
reasonable assurances that material information relating to the Trust is made known to them by the appropriate persons, based on their evaluation of these controls and procedures as of a date within 90 days of the filing date of this report.
(a)(ii) There was no change in the Trust’s internal control over financial reporting (as defined in Rule 30a-3(d) under the Investment Company Act) that occurred during the second fiscal quarter of the period covered by this report that has materially affected, or is reasonably likely to materially affect, the Trust’s internal control over financial reporting.
Item 12.
Exhibits
| | |
(a) | (1) | Not applicable. |
(a) | (2) | Certification pursuant to Rule 30a-2(a) under the Investment Company Act of 1940 (17 CFR 270.30a-2(a)) is filed and attached hereto as Exhibit 99.CERT. |
(a) | (3) | Not applicable. |
(b) |
| Certification pursuant to Rule 30a-2(b) under the Investment Company Act of 1940 (17 CFR 270.30a-2(b)) is furnished and attached hereto as Exhibit 99.906CERT. |
SIGNATURES
Pursuant to the requirements of the Securities Exchange Act of 1934 and the Investment Company Act of 1940, the registrant has duly caused this report to be signed on its behalf by the undersigned, thereunto duly authorized.
Variable Insurance Products Fund V
| |
By: | /s/Stephanie J. Dorsey |
| Stephanie J. Dorsey |
| President and Treasurer |
|
|
Date: | August 26, 2016 |
Pursuant to the requirements of the Securities Exchange Act of 1934 and the Investment Company Act of 1940, this report has been signed below by the following persons on behalf of the registrant and in the capacities and on the dates indicated.
| |
By: | /s/Stephanie J. Dorsey |
| Stephanie J. Dorsey |
| President and Treasurer |
|
|
Date: | August 26, 2016 |
| |
By: | /s/Howard J. Galligan III |
| Howard J. Galligan III |
| Chief Financial Officer |
|
|
Date: | August 26, 2016 |