Fidelity® Variable Insurance Products: Government Money Market Portfolio
Semi-Annual Report June 30, 2017 |
 |
Contents
To view a fund's proxy voting guidelines and proxy voting record for the 12-month period ended June 30, visit http://www.fidelity.com/proxyvotingresults or visit the Securities and Exchange Commission's (SEC) web site at http://www.sec.gov.
You may also call 1-877-208-0098 to request a free copy of the proxy voting guidelines.
Fidelity® Variable Insurance Products are separate account options which are purchased through a variable insurance contract.
Standard & Poor's, S&P and S&P 500 are registered service marks of The McGraw-Hill Companies, Inc. and have been licensed for use by Fidelity Distributors Corporation.
Other third-party marks appearing herein are the property of their respective owners.
All other marks appearing herein are registered or unregistered trademarks or service marks of FMR LLC or an affiliated company. © 2017 FMR LLC. All rights reserved.
This report and the financial statements contained herein are submitted for the general information of the shareholders of the Fund. This report is not authorized for distribution to prospective investors in the Fund unless preceded or accompanied by an effective prospectus.
A fund files its complete schedule of portfolio holdings with the SEC for the first and third quarters of each fiscal year on Form N-Q. Forms N-Q are available on the SEC’s web site at http://www.sec.gov. A fund's Forms N-Q may be reviewed and copied at the SEC’s Public Reference Room in Washington, DC. Information regarding the operation of the SEC's Public Reference Room may be obtained by calling 1-800-SEC-0330.
For a complete list of a fund's portfolio holdings, view the most recent holdings listing, semiannual report, or annual report on Fidelity's web site at http://www.fidelity.com, http://www.institutional.fidelity.com, or http://www.401k.com, as applicable.
NOT FDIC INSURED •MAY LOSE VALUE •NO BANK GUARANTEE
Neither the Fund nor Fidelity Distributors Corporation is a bank.
Investment Summary/Performance (Unaudited)
Effective Maturity Diversification
| Days | % of fund's investments 6/30/17 | % of fund's investments 12/31/16 | % of fund's investments 6/30/16 |
| 1 - 7 | 37.0 | 20.3 | 21.4 |
| 8 - 30 | 21.7 | 26.1 | 31.1 |
| 31 - 60 | 20.2 | 22.4 | 22.0 |
| 61 - 90 | 15.2 | 20.3 | 13.0 |
| 91 - 180 | 5.8 | 9.4 | 11.5 |
| > 180 | 0.1 | 1.5 | 1.0 |
Effective maturity is determined in accordance with the requirements of Rule 2a-7 under the Investment Company Act of 1940.
Asset Allocation (% of fund's net assets)
| As of June 30, 2017 |
| | Variable Rate Demand Notes (VRDNs) | 1.5% |
| | U.S. Treasury Debt | 10.8% |
| | U.S. Government Agency Debt | 59.2% |
| | Repurchase Agreements | 30.3% |
| | Net Other Assets (Liabilities)* | (1.8)% |
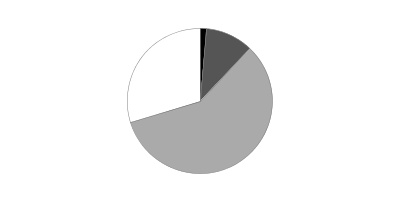
* Net Other Assets (Liabilities) are not included in the pie chart
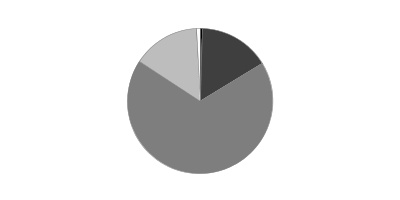
| As of December 31, 2016 |
| | Variable Rate Demand Notes (VRDNs) | 0.5% |
| | U.S. Treasury Debt | 15.8% |
| | U.S. Government Agency Debt | 67.9% |
| | Repurchase Agreements | 15.1% |
| | Net Other Assets (Liabilities) | 0.7% |
Current And Historical 7-Day Yields
| | 6/30/17 | 3/31/17 | 12/31/16 | 9/30/16 | 6/30/16 |
| VIP Government Money Market Portfolio - Initial Class | 0.73% | 0.49% | 0.34% | 0.23% | 0.21% |
| VIP Government Money Market Portfolio - Service Class | 0.63% | 0.40% | 0.24% | 0.13% | 0.11% |
| VIP Government Money Market Portfolio - Service Class 2 | 0.48% | 0.25% | 0.10% | 0.01% | 0.01% |
| VIP Government Money Market Portfolio - Investor Class | 0.71% | 0.47% | 0.32% | 0.20% | 0.19% |
Yield refers to the income paid by the Fund over a given period. Yields for money market funds are usually for seven-day periods, as they are here, though they are expressed as annual percentage rates. Past performance is no guarantee of future results. Yield will vary and it's possible to lose money investing in the Fund.
Investments June 30, 2017 (Unaudited)
Showing Percentage of Net Assets
| U.S. Treasury Debt - 10.8% | | | | |
| | | Yield(a) | Principal Amount | Value |
| U.S. Treasury Obligations - 10.8% | | | | |
| U.S. Treasury Bills | | | | |
| 8/3/17 to 12/28/17 | | 0.63 to 1.13 % | $176,000,000 | $175,662,115 |
| U.S. Treasury Notes | | | | |
| 7/15/17 to 4/30/19 | | 0.69 to 1.18 (b) | 251,000,000 | 251,197,395 |
| TOTAL U.S. TREASURY DEBT | | | | |
| (Cost $426,859,510) | | | | 426,859,510 |
|
| Variable Rate Demand Note - 1.5% | | | | |
| Arizona - 0.1% | | | | |
| FNMA Maricopa County Indl. Dev. Auth. Multi-family Hsg. Rev. (San Martin Apts. Proj.) Series A2, 0.98% 7/7/17, LOC Fannie Mae, VRDN | | | | |
| 7/7/17 | | 0.98 (b)(c) | 4,300,000 | 4,300,000 |
| FNMA Maricopa County Indl. Dev. Auth. Multi-family Hsg. Rev. (Village Square Apts. Proj.) Series 2004, 0.98% 7/7/17, LOC Fannie Mae, VRDN | | | | |
| 7/7/17 | | 0.98 (b)(c) | 1,000,000 | 1,000,000 |
| | | | | 5,300,000 |
| California - 0.2% | | | | |
| FHLMC San Diego Hsg. Auth. Multi-family Hsg. Rev. (Villa Nueva Apts. Proj.) Series 2007 F, 0.97% 7/7/17, LOC Freddie Mac, VRDN | | | | |
| 7/7/17 | | 0.97 (b)(c) | 8,000,000 | 8,000,000 |
| Florida - 0.2% | | | | |
| FNMA Polk County Hsg. Fin. Auth. Multi-family Hsg. Rev. (Cambridge Cove Apts. Proj.) Series 2001, 0.95% 7/7/17, LOC Fannie Mae, VRDN | | | | |
| 7/7/17 | | 0.95 (b)(c) | 7,000,000 | 7,000,000 |
| New Jersey - 0.1% | | | | |
| FNMA Camden County Impt. Auth. Rev. (Parkview Redev. Hsg. Proj.) Series 2006, 1% 7/7/17, LOC Fannie Mae, VRDN | | | | |
| 7/7/17 | | 1.00 (b)(c) | 3,900,000 | 3,900,000 |
| New York - 0.7% | | | | |
| FHLMC New York Hsg. Fin. Agcy. Rev. (Theatre Row Tower Hsg. Proj.) Series 2000 A, 0.93% 7/7/17, LOC Freddie Mac, VRDN | | | | |
| 7/7/17 | | 0.93 (b)(c) | 6,700,000 | 6,700,000 |
| FNMA New York Hsg. Fin. Agcy. Rev. (600 West and 42nd St. Hsg. Proj.) Series 2007 A, 0.97% 7/7/17, LOC Fannie Mae, VRDN | | | | |
| 7/7/17 | | 0.97 (b)(c) | 20,100,000 | 20,100,000 |
| | | | | 26,800,000 |
| Washington - 0.2% | | | | |
| FNMA Washington Hsg. Fin. Commission Multi-family Hsg. Rev. (Vintage Mount Vernon Proj.) Series A, 0.98% 7/7/17, LOC Fannie Mae, VRDN | | | | |
| 7/7/17 | | 0.98 (b)(c) | 7,500,000 | 7,500,000 |
| TOTAL VARIABLE RATE DEMAND NOTE | | | | |
| (Cost $58,500,000) | | | | 58,500,000 |
|
| U.S. Government Agency Debt - 59.2% | | | | |
| Federal Agencies - 59.2% | | | | |
| Fannie Mae | | | | |
| 7/3/17 to 1/11/18 | | 0.78 to 1.13 (b) | 105,000,000 | 104,998,124 |
| Federal Farm Credit Bank | | | | |
| 7/25/17 to 1/8/18 | | 1.04 to 1.25 (b) | 11,000,000 | 11,001,233 |
| Federal Home Loan Bank | | | | |
| 7/5/17 to 12/27/18 | | 0.64 to 1.23 (b) | 2,141,905,000 | 2,140,499,109 |
| Freddie Mac | | | | |
| 7/14/17 to 1/12/18 | | 0.63 to 1.20 (b) | 84,000,000 | 84,000,081 |
| TOTAL U.S. GOVERNMENT AGENCY DEBT | | | | |
| (Cost $2,340,498,547) | | | | 2,340,498,547 |
| U.S. Government Agency Repurchase Agreement - 14.2% | | | |
| | | Maturity Amount | Value |
| In a joint trading account at 1.12% dated 6/30/17 due 7/3/17 (Collateralized by U.S. Government Obligations) # | | $263,618,518 | $263,594,000 |
| With: | | | |
| BMO Harris Bank NA at 1.03%, dated 6/13/17 due 7/7/17 (Collateralized by U.S. Government Obligations valued at $4,082,335, 1.63% - 4.00%, 1/21/20 - 7/1/46) | | 4,003,433 | 4,000,000 |
| BNP Paribas, S.A. at: | | | |
| 0.96%, dated 5/15/17 due 7/7/17 (Collateralized by U.S. Treasury Obligations valued at $11,303,488, 0.00% - 7.13%, 5/15/18 - 6/20/47) | | 11,026,987 | 11,000,000 |
| 1%, dated 5/26/17 due 7/7/17 (Collateralized by U.S. Treasury Obligations valued at $11,331,211, 0.00% - 6.75%, 7/27/17 - 6/20/47) | | 11,029,639 | 11,000,000 |
| 1.01%, dated 6/2/17 due 7/7/17 (Collateralized by U.S. Treasury Obligations valued at $3,092,007, 0.00% - 7.13%, 5/15/18 - 6/20/47) | | 3,006,818 | 3,000,000 |
| 1.07%, dated 6/27/17 due 7/7/17 (Collateralized by U.S. Treasury Obligations valued at $3,087,249, 0.00% - 6.25%, 7/27/17 - 6/20/47) | | 3,005,261 | 3,000,000 |
| 1.13%, dated 6/27/17 due 7/7/17 (Collateralized by U.S. Government Obligations valued at $3,071,976, 0.00% - 6.63%, 5/15/18 - 2/15/46) | | 3,011,300 | 3,000,000 |
| Citibank NA at: | | | |
| 1.05%, dated 6/27/17 due 7/5/17 (Collateralized by U.S. Treasury Obligations valued at $3,090,153, 0.00% - 4.38%, 4/30/19 - 2/15/46) | | 3,000,700 | 3,000,000 |
| 1.06%, dated 6/27/17 due 7/5/17 (Collateralized by U.S. Treasury Obligations valued at $18,363,891, 0.13% - 6.50%, 6/15/18 - 2/15/45) | | 18,004,240 | 18,000,000 |
| Deutsche Bank Securities, Inc. at: | | | |
| 1.09%, dated 6/29/17 due 7/6/17 (Collateralized by U.S. Government Obligations valued at $13,261,794, 2.70% - 3.43%, 9/8/36 - 4/6/45) | | 13,002,755 | 13,000,000 |
| 1.16%, dated 6/30/17 due 7/3/17 (Collateralized by U.S. Government Obligations valued at $18,362,674, 0.00% - 5.38%, 7/28/17 - 4/1/56) | | 18,001,740 | 18,000,000 |
| Goldman Sachs & Co. at 1.15%, dated 6/30/17 due 7/3/17 (Collateralized by U.S. Government Obligations valued at $6,120,587, 3.00% - 6.00%, 11/1/27 - 3/1/47) | | 6,000,575 | 6,000,000 |
| ING Financial Markets LLC at: | | | |
| 0.83%, dated 4/6/17 due 7/6/17 (Collateralized by U.S. Government Obligations valued at $6,136,280, 1.25%, 10/28/19) | | 6,012,588 | 6,000,000 |
| 1.04%, dated: | | | |
| 6/1/17 due 8/4/17 (Collateralized by U.S. Government Obligations valued at $5,104,411, 1.25%, 8/23/19 - 10/28/19) | | 5,013,289 | 5,000,000 |
| 6/5/17 due 8/4/17 (Collateralized by U.S. Government Obligations valued at $7,148,245, 1.25%, 10/28/19) | | 7,018,604 | 7,000,000 |
| 1.05%, dated: | | | |
| 6/6/17 due 8/4/17 (Collateralized by U.S. Government Obligations valued at $6,126,358, 1.25%, 10/28/19) | | 6,016,100 | 6,000,000 |
| 6/7/17 due 8/4/17 (Collateralized by U.S. Government Obligations valued at $3,064,124, 1.25%, 8/23/19) | | 3,008,050 | 3,000,000 |
| 1.07%, dated 6/8/17 due 8/4/17 (Collateralized by U.S. Government Obligations valued at $6,126,358, 1.25%, 10/28/19) | | 6,016,407 | 6,000,000 |
| 1.09%, dated 6/20/17 due 8/4/17: | | | |
| (Collateralized by U.S. Government Obligations valued at $6,126,358, 1.25%, 10/28/19) | | 6,015,805 | 6,000,000 |
| (Collateralized by U.S. Government Obligations valued at $3,064,124, 1.25%, 8/23/19) | | 3,008,175 | 3,000,000 |
| Merrill Lynch, Pierce, Fenner & Smith at 1.06%, dated 6/13/17 due 7/7/17 (Collateralized by U.S. Government Obligations valued at $17,350,212, 3.50%, 3/20/47) | | 17,029,533 | 17,000,000 |
| Mitsubishi UFJ Securities (U.S.A.), Inc. at: | | | |
| 1.04%, dated 6/12/17 due: | | | |
| 8/11/17 (Collateralized by U.S. Government Obligations valued at $10,206,188, 2.24% - 4.50%, 3/1/24 - 6/1/47) | | 10,017,333 | 10,000,000 |
| 8/14/17 (Collateralized by U.S. Government Obligations valued at $8,164,950, 2.41% - 4.50%, 6/1/25 - 6/1/47) | | 8,014,560 | 8,000,000 |
| 1.08%, dated: | | | |
| 6/19/17 due 8/15/17 (Collateralized by U.S. Government Obligations valued at $3,061,285, 2.98% - 4.00%, 6/1/25 - 7/1/47) | | 3,005,130 | 3,000,000 |
| 6/27/17 due 8/25/17 (Collateralized by U.S. Government Obligations valued at $8,161,469, 2.39% - 4.00%, 1/1/30 - 6/1/47) | | 8,014,160 | 8,000,000 |
| 6/28/17 due: | | | |
| 8/28/17 (Collateralized by U.S. Government Obligations valued at $7,141,071, 2.24% - 5.11%, 11/1/23 - 6/1/47) | | 7,012,810 | 7,000,000 |
| 8/29/17 (Collateralized by U.S. Government Obligations valued at $8,161,224, 2.48% - 5.11%, 11/1/23 - 6/1/47) | | 8,014,880 | 8,000,000 |
| RBC Capital Markets Corp. at: | | | |
| 0.88%, dated: | | | |
| 5/4/17 due 8/2/17 (Collateralized by U.S. Government Obligations valued at $3,071,237, 2.24% - 5.00%, 1/1/27 - 6/1/47) | | 3,006,600 | 3,000,000 |
| 5/5/17 due 8/2/17 (Collateralized by U.S. Government Obligations valued at $3,090,228, 1.35% - 5.50%, 10/1/23 - 6/1/47) | | 3,006,527 | 3,000,000 |
| 0.89%, dated 5/8/17 due 8/4/17 (Collateralized by U.S. Government Obligations valued at $3,064,885, 2.24% - 5.00%, 1/1/26 - 6/1/47) | | 3,006,527 | 3,000,000 |
| 1.02%, dated 6/1/17 due 8/30/17 (Collateralized by U.S. Government Obligations valued at $6,125,549, 3.00% - 5.50%, 10/1/23 - 6/1/47) | | 6,015,300 | 6,000,000 |
| 1.04%, dated 6/12/17 due 8/11/17 (Collateralized by U.S. Government Obligations valued at $4,082,588, 2.24% - 4.50%, 1/1/27 - 6/1/47) | | 4,006,933 | 4,000,000 |
| 1.06%, dated 6/12/17 due 9/11/17 (Collateralized by U.S. Government Obligations valued at $6,124,807, 2.20% - 5.50%, 1/1/27 - 6/1/47) | | 6,016,077 | 6,000,000 |
| 1.08%, dated 6/28/17 due 9/20/17 (Collateralized by U.S. Government Obligations valued at $4,084,079, 1.50% - 5.50%, 1/1/27 - 6/1/47) | | 4,010,080 | 4,000,000 |
| 1.09%, dated 6/20/17 due 9/18/17 (Collateralized by U.S. Government Obligations valued at $7,143,512, 2.24% - 8.50%, 3/15/20 - 6/1/47) | | 7,019,075 | 7,000,000 |
| RBC Dominion Securities at: | | | |
| 0.91%, dated 5/25/17 due 7/7/17 (Collateralized by U.S. Government Obligations valued at $6,126,092, 0.88% - 3.50%, 8/31/18 - 5/20/47) | | 6,006,522 | 6,000,000 |
| 0.93%, dated: | | | |
| 5/5/17 due 7/7/17 (Collateralized by U.S. Government Obligations valued at $6,129,342, 0.88% - 3.50%, 8/31/18 - 5/20/47) | | 6,014,105 | 6,000,000 |
| 5/31/17 due 7/6/17 (Collateralized by U.S. Government Obligations valued at $10,208,768, 0.88% - 3.50%, 8/31/18 - 5/20/47) | | 10,009,300 | 10,000,000 |
| 1.04%, dated 6/9/17 due 7/7/17 (Collateralized by U.S. Government Obligations valued at $1,020,771, 1.00% - 3.50%, 8/31/18 - 5/20/47) | | 1,001,733 | 1,000,000 |
| 1.05%, dated: | | | |
| 6/22/17 due 7/7/17: | | | |
| (Collateralized by U.S. Government Obligations valued at $6,122,035, 1.50% - 3.50%, 8/31/18 - 6/20/46) | | 6,004,900 | 6,000,000 |
| (Collateralized by U.S. Government Obligations valued at $6,122,021, 1.50% - 3.50%, 6/15/20 - 6/20/46) | | 6,005,075 | 6,000,000 |
| 6/26/17 due 7/7/17 (Collateralized by U.S. Government Obligations valued at $2,040,440, 1.50% - 3.50%, 8/31/18 - 5/20/47) | | 2,001,808 | 2,000,000 |
| 6/27/17 due 7/7/17: | | | |
| (Collateralized by U.S. Government Obligations valued at $6,121,145, 1.50% - 3.50%, 8/31/18 - 5/20/47) | | 6,005,425 | 6,000,000 |
| (Collateralized by U.S. Government Obligations valued at $1,020,286, 0.88% - 5.00%, 6/15/19 - 5/20/47) | | 1,000,992 | 1,000,000 |
| 6/28/17 due 7/7/17 (Collateralized by U.S. Treasury Obligations valued at $5,100,860, 1.00% - 4.38%, 11/30/18 - 5/15/41) | | 5,004,813 | 5,000,000 |
| 6/29/17 due 7/7/17: | | | |
| (Collateralized by U.S. Government Obligations valued at $6,120,770, 1.38% - 3.50%, 4/30/20 - 5/20/47) | | 6,001,925 | 6,000,000 |
| (Collateralized by U.S. Government Obligations valued at $3,060,385, 1.38% - 3.50%, 4/30/20 - 3/20/47) | | 3,001,050 | 3,000,000 |
| 1.06%, dated: | | | |
| 6/20/17 due 7/7/17 (Collateralized by U.S. Government Obligations valued at $6,122,389, 1.50% - 3.50%, 8/31/18 - 5/20/47) | | 6,005,477 | 6,000,000 |
| 6/21/17 due 7/7/17 (Collateralized by U.S. Government Obligations valued at $3,061,165, 1.38% - 3.50%, 8/31/18 - 5/20/47) | | 3,005,388 | 3,000,000 |
| TOTAL U.S. GOVERNMENT AGENCY REPURCHASE AGREEMENT | | | |
| (Cost $562,594,000) | | | 562,594,000 |
|
| U.S. Treasury Repurchase Agreement - 16.1% | | | |
| With: | | | |
| Barclays Capital, Inc. at 1.09%, dated 6/30/17 due 7/3/17 (Collateralized by U.S. Treasury Obligations valued at $5,100,514, 2.75%, 11/15/23) | | 5,000,454 | 5,000,000 |
| BMO Harris Bank NA at: | | | |
| 0.84%, dated: | | | |
| 4/10/17 due 7/6/17 (Collateralized by U.S. Treasury Obligations valued at $8,327,367, 2.25%, 12/31/23) | | 8,016,240 | 8,000,000 |
| 4/13/17 due: | | | |
| 7/6/17 (Collateralized by U.S. Treasury Obligations valued at $3,182,789, 2.38% - 3.00%, 7/31/17 - 11/15/44) | | 3,005,880 | 3,000,000 |
| 7/7/17 (Collateralized by U.S. Treasury Obligations valued at $5,139,932, 2.00% - 2.38%, 7/31/17 - 11/15/21) | | 5,009,917 | 5,000,000 |
| 0.85%, dated 4/18/17 due 7/7/17 (Collateralized by U.S. Treasury Obligations valued at $10,251,721, 2.25% - 2.38%, 7/31/17 - 11/15/25) | | 10,019,833 | 10,000,000 |
| 0.89%, dated 4/27/17 due 7/7/17 (Collateralized by U.S. Treasury Obligations valued at $4,116,780, 0.63%, 4/30/18) | | 4,007,614 | 4,000,000 |
| 0.9%, dated: | | | |
| 4/26/17 due 7/7/17 (Collateralized by U.S. Treasury Obligations valued at $3,185,458, 3.63%, 2/15/44) | | 3,006,675 | 3,000,000 |
| 5/5/17 due 7/7/17 (Collateralized by U.S. Treasury Obligations valued at $5,145,000, 2.75%, 11/15/23) | | 5,009,625 | 5,000,000 |
| 0.91%, dated 5/16/17 due 7/7/17 (Collateralized by U.S. Treasury Obligations valued at $5,189,789, 2.13%, 2/29/24) | | 5,007,457 | 5,000,000 |
| 0.92%, dated: | | | |
| 5/12/17 due 7/7/17 (Collateralized by U.S. Treasury Obligations valued at $6,176,041, 1.50%, 8/15/26) | | 6,011,807 | 6,000,000 |
| 5/16/17 due 7/7/17 (Collateralized by U.S. Treasury Obligations valued at $4,109,966, 2.25%, 11/15/24) | | 4,006,644 | 4,000,000 |
| 5/25/17 due 7/7/17 (Collateralized by U.S. Treasury Obligations valued at $4,106,559, 0.75%, 9/30/18) | | 4,004,702 | 4,000,000 |
| 0.94%, dated 5/30/17 due 7/7/17 (Collateralized by U.S. Treasury Obligations valued at $5,127,241, 1.25%, 10/31/21) | | 5,005,614 | 5,000,000 |
| 1%, dated 6/7/17 due 7/7/17 (Collateralized by U.S. Treasury Obligations valued at $5,237,616, 1.50% - 3.88%, 8/15/26 - 8/15/40) | | 5,009,861 | 5,000,000 |
| BNP Paribas, S.A. at: | | | |
| 0.95%, dated 5/15/17 due 7/7/17 (Collateralized by U.S. Treasury Obligations valued at $10,213,301, 0.00% - 7.63%, 7/13/17 - 5/15/46) | | 10,024,278 | 10,000,000 |
| 0.97%, dated 5/22/17 due 7/7/17 (Collateralized by U.S. Treasury Obligations valued at $10,211,676, 0.00% - 9.00%, 7/27/17 - 11/15/45) | | 10,022,633 | 10,000,000 |
| 0.99%, dated: | | | |
| 5/26/17 due 7/7/17 (Collateralized by U.S. Treasury Obligations valued at $10,217,730, 0.00% - 9.00%, 7/27/17 - 5/15/46) | | 10,026,675 | 10,000,000 |
| 5/31/17 due 7/7/17 (Collateralized by U.S. Treasury Obligations valued at $15,314,060, 0.00% - 7.63%, 7/27/17 - 5/15/46) | | 15,037,538 | 15,000,000 |
| 1%, dated: | | | |
| 5/26/17 due 7/7/17 (Collateralized by U.S. Treasury Obligations valued at $11,231,935, 0.00% - 7.63%, 7/27/17 - 5/15/46) | | 11,036,056 | 11,000,000 |
| 6/2/17 due 7/7/17 (Collateralized by U.S. Treasury Obligations valued at $8,167,466, 0.88% - 8.88%, 8/15/17 - 2/15/45) | | 8,021,111 | 8,000,000 |
| 1.02%, dated: | | | |
| 6/8/17 due 7/7/17 (Collateralized by U.S. Treasury Obligations valued at $10,220,075, 0.00% - 3.88%, 7/20/17 - 2/15/45) | | 10,017,000 | 10,000,000 |
| 6/9/17 due 7/7/17 (Collateralized by U.S. Treasury Obligations valued at $10,233,676, 0.00% - 3.00%, 7/13/17 - 11/15/46) | | 10,017,000 | 10,000,000 |
| 1.04%, dated: | | | |
| 6/9/17 due 7/7/17 (Collateralized by U.S. Treasury Obligations valued at $10,242,466, 1.25% - 7.63%, 6/30/18 - 5/15/46) | | 10,026,000 | 10,000,000 |
| 6/12/17 due 7/7/17 (Collateralized by U.S. Treasury Obligations valued at $20,607,502, 1.50% - 5.50%, 8/15/17 - 8/15/46) | | 20,034,667 | 20,000,000 |
| 1.05%, dated: | | | |
| 6/12/17 due 7/7/17 (Collateralized by U.S. Treasury Obligations valued at $20,429,544, 1.38% - 6.13%, 8/15/17 - 11/15/46) | | 20,053,083 | 20,000,000 |
| 6/15/17 due 7/7/17 (Collateralized by U.S. Treasury Obligations valued at $20,462,814, 0.00% - 7.25%, 9/14/17 - 5/15/46) | | 20,035,000 | 20,000,000 |
| 1.06%, dated: | | | |
| 6/15/17 due 7/7/17 (Collateralized by U.S. Treasury Obligations valued at $20,445,103, 0.00% - 8.75%, 7/27/17 - 11/15/46) | | 20,053,000 | 20,000,000 |
| 6/27/17 due 7/7/17 (Collateralized by U.S. Treasury Obligations valued at $11,222,006, 0.00% - 8.13%, 7/20/17 - 11/15/44) | | 11,019,109 | 11,000,000 |
| 6/29/17 due 7/7/17 (Collateralized by U.S. Treasury Obligations valued at $5,100,627, 2.13% - 6.13%, 2/15/20 - 11/15/46) | | 5,008,833 | 5,000,000 |
| 1.07%, dated 6/22/17 due 7/7/17 (Collateralized by U.S. Treasury Obligations valued at $16,456,215, 0.00% - 4.75%, 7/13/17 - 5/15/46) | | 16,042,800 | 16,000,000 |
| 1.12%, dated 6/27/17 due 7/7/17 (Collateralized by U.S. Treasury Obligations valued at $6,121,188, 0.00% - 2.00%, 7/13/17 - 11/15/26) | | 6,022,400 | 6,000,000 |
| 1.13%, dated 6/29/17 due 7/7/17 (Collateralized by U.S. Treasury Obligations valued at $6,120,858, 1.00% - 4.38%, 3/15/19 - 8/15/46) | | 6,022,600 | 6,000,000 |
| Commerz Markets LLC at: | | | |
| 1.1%, dated 6/28/17 due 7/5/17 (Collateralized by U.S. Treasury Obligations valued at $8,164,325, 0.88%, 4/15/19) | | 8,001,711 | 8,000,000 |
| 1.15%, dated 6/30/17 due 7/3/17 (Collateralized by U.S. Treasury Obligations valued at $11,222,223, 0.88% - 1.38%, 11/30/18 - 4/15/19) | | 11,001,054 | 11,000,000 |
| Deutsche Bank Securities, Inc. at: | | | |
| 1.05%, dated 6/30/17 due 7/3/17 (Collateralized by U.S. Treasury Obligations valued at $5,100,452, 2.25%, 7/31/21) | | 5,000,438 | 5,000,000 |
| 1.08%, dated 6/29/17 due 7/6/17 (Collateralized by U.S. Treasury Obligations valued at $3,060,409, 1.88%, 1/31/22) | | 3,000,630 | 3,000,000 |
| 1.15%, dated 6/30/17 due 7/3/17 (Collateralized by U.S. Treasury Obligations valued at $2,040,239, 1.88%, 1/31/22) | | 2,000,192 | 2,000,000 |
| HSBC Securities, Inc. at 1.05%, dated 6/28/17 due 7/5/17 (Collateralized by U.S. Treasury Obligations valued at $57,521,167, 4.63% - 5.25%, 11/15/28 - 2/15/40) | | 56,011,433 | 56,000,000 |
| Lloyds Bank PLC at 1%, dated 5/18/17 due 7/14/17 (Collateralized by U.S. Treasury Obligations valued at $15,355,175, 2.63%, 11/15/20) | | 15,023,750 | 15,000,000 |
| Mitsubishi UFJ Securities (U.S.A.), Inc. at 1.05%, dated 6/16/17 due 7/7/17 (Collateralized by U.S. Treasury Obligations valued at $8,174,111, 1.25% - 8.88%, 2/15/19 - 8/15/44) | | 8,007,233 | 8,000,000 |
| MUFG Securities EMEA PLC at: | | | |
| 0.91%, dated 5/1/17 due 7/7/17 (Collateralized by U.S. Treasury Obligations valued at $3,071,827, 1.50%, 11/30/19) | | 3,006,977 | 3,000,000 |
| 1.02%, dated 6/6/17 due 7/7/17 (Collateralized by U.S. Treasury Obligations valued at $3,058,351, 1.13%, 6/30/21) | | 3,007,820 | 3,000,000 |
| 1.04%, dated 6/14/17 due 7/7/17 (Collateralized by U.S. Treasury Obligations valued at $4,076,169, 2.13%, 11/30/23) | | 4,003,467 | 4,000,000 |
| 1.05%, dated: | | | |
| 6/15/17 due 7/7/17 (Collateralized by U.S. Treasury Obligations valued at $10,239,001, 2.63%, 11/15/20) | | 10,009,625 | 10,000,000 |
| 6/16/17 due 7/7/17 (Collateralized by U.S. Treasury Obligations valued at $10,203,218, 2.00%, 11/15/26) | | 10,009,333 | 10,000,000 |
| 1.07%, dated: | | | |
| 6/19/17 due 7/12/17 (Collateralized by U.S. Treasury Obligations valued at $3,091,938, 3.00%, 5/15/45) | | 3,002,051 | 3,000,000 |
| 6/21/17 due 7/12/17 (Collateralized by U.S. Treasury Obligations valued at $7,168,022, 3.13%, 5/15/19) | | 7,004,369 | 7,000,000 |
| 6/22/17 due 7/14/17 (Collateralized by U.S. Treasury Obligations valued at $9,267,877, 2.63%, 8/15/20) | | 9,005,885 | 9,000,000 |
| 6/27/17 due 7/13/17 (Collateralized by U.S. Treasury Obligations valued at $7,140,491, 1.63% - 2.63%, 8/15/20 - 5/15/26) | | 7,003,329 | 7,000,000 |
| 1.1%, dated 6/30/17 due 7/3/17 (Collateralized by U.S. Treasury Obligations valued at $2,039,849, 1.63%, 6/30/20) | | 2,000,183 | 2,000,000 |
| Nomura Securities International, Inc. at 1.08%, dated 6/29/17 due 7/6/17 (Collateralized by U.S. Treasury Obligations valued at $79,854,402, 0.98% - 7.63%, 7/31/17 - 8/15/45) | | 78,016,380 | 78,000,000 |
| Norinchukin Bank at: | | | |
| 1.05%, dated 5/12/17 due 8/14/17 (Collateralized by U.S. Treasury Obligations valued at $3,065,350, 1.88%, 6/30/20) | | 3,008,225 | 3,000,000 |
| 1.08%, dated 5/19/17 due 8/21/17 (Collateralized by U.S. Treasury Obligations valued at $3,065,350, 1.88%, 6/30/20) | | 3,008,460 | 3,000,000 |
| 1.1%, dated 5/30/17 due 8/30/17 (Collateralized by U.S. Treasury Obligations valued at $5,105,550, 1.88%, 6/30/20) | | 5,014,056 | 5,000,000 |
| 1.15%, dated 6/15/17 due 8/31/17 (Collateralized by U.S. Treasury Obligations valued at $3,065,350, 1.88%, 6/30/20) | | 3,007,379 | 3,000,000 |
| 1.2%, dated 6/29/17 due 10/3/17 (Collateralized by U.S. Treasury Obligations valued at $3,060,300, 1.88%, 6/30/20) | | 3,009,600 | 3,000,000 |
| RBC Capital Markets Corp. at: | | | |
| 0.92%, dated 5/4/17 due 7/7/17 (Collateralized by U.S. Treasury Obligations valued at $3,090,228, 0.00% - 8.00%, 9/14/17 - 2/15/46) | | 3,006,977 | 3,000,000 |
| 0.93%, dated 5/9/17 due 7/7/17 (Collateralized by U.S. Treasury Obligations valued at $4,114,328, 0.00% - 8.00%, 9/28/17 - 2/15/46) | | 4,009,300 | 4,000,000 |
| 0.95%, dated 5/15/17 due 7/7/17 (Collateralized by U.S. Treasury Obligations valued at $4,094,481, 0.00% - 8.00%, 9/14/17 - 11/15/45) | | 4,009,711 | 4,000,000 |
| RBC Dominion Securities at: | | | |
| 0.92%, dated 5/31/17 due 7/5/17 (Collateralized by U.S. Treasury Obligations valued at $5,104,347, 1.00% - 4.38%, 8/31/18 - 5/15/41) | | 5,004,472 | 5,000,000 |
| 0.93%, dated 5/8/17 due 7/7/17 (Collateralized by U.S. Treasury Obligations valued at $5,107,489, 0.88% - 4.38%, 11/30/18 - 5/15/41) | | 5,011,883 | 5,000,000 |
| 1.04%, dated: | | | |
| 6/21/17 due 7/7/17 (Collateralized by U.S. Treasury Obligations valued at $3,061,244, 1.00% - 4.38%, 8/31/18 - 5/15/41) | | 3,002,600 | 3,000,000 |
| 6/23/17 due 7/7/17: | | | |
| (Collateralized by U.S. Treasury Obligations valued at $5,101,520, 1.00% - 4.38%, 11/30/18 - 5/15/41) | | 5,004,478 | 5,000,000 |
| (Collateralized by U.S. Treasury Obligations valued at $5,101,557, 1.00% - 4.38%, 10/31/17 - 5/15/41) | | 5,004,622 | 5,000,000 |
| 6/26/17 due 7/7/17 (Collateralized by U.S. Treasury Obligations valued at $4,080,935, 1.00% - 4.38%, 9/30/17 - 5/15/41) | | 4,003,467 | 4,000,000 |
| 1.05%, dated: | | | |
| 6/20/17 due 7/7/17 (Collateralized by U.S. Treasury Obligations valued at $5,101,982, 0.88% - 4.38%, 11/30/18 - 5/15/41) | | 5,004,375 | 5,000,000 |
| 6/30/17 due 7/7/17 (Collateralized by U.S. Treasury Obligations valued at $10,200,952, 0.88% - 4.38%, 8/31/18 - 5/15/41) | | 10,009,333 | 10,000,000 |
| RBS Securities, Inc. at: | | | |
| 1.05%, dated 6/28/17 due 7/5/17 (Collateralized by U.S. Treasury Obligations valued at $7,214,718, 2.50%, 2/15/46) | | 7,001,429 | 7,000,000 |
| 1.06%, dated 6/29/17 due 7/6/17 (Collateralized by U.S. Treasury Obligations valued at $12,245,146, 2.25%, 11/15/24) | | 12,002,473 | 12,000,000 |
| 1.08%, dated 6/30/17 due 7/3/17 (Collateralized by U.S. Treasury Obligations valued at $1,022,589, 0.75%, 4/15/18) | | 1,000,090 | 1,000,000 |
| Societe Generale at: | | | |
| 0.88%, dated 5/15/17 due 7/5/17 (Collateralized by U.S. Treasury Obligations valued at $10,212,244, 0.00% - 5.00%, 11/9/17 - 2/15/45) | | 10,012,467 | 10,000,000 |
| 0.93%, dated 5/19/17 due 7/7/17 (Collateralized by U.S. Treasury Obligations valued at $5,155,673, 0.00% - 5.50%, 10/12/17 - 2/15/45) | | 5,007,750 | 5,000,000 |
| TOTAL U.S. TREASURY REPURCHASE AGREEMENT | | | |
| (Cost $639,000,000) | | | 639,000,000 |
| TOTAL INVESTMENT PORTFOLIO - 101.8% | | | |
| (Cost $4,027,452,057) | | | 4,027,452,057 |
| NET OTHER ASSETS (LIABILITIES) - (1.8)% | | | (70,627,479) |
| NET ASSETS - 100% | | | $3,956,824,578 |
Security Type Abbreviations
VRDN – Variable Rate Demand Note (A debt instrument that is payable upon demand, either daily, weekly or monthly)
The date shown for securities represents the date when principal payments must be paid, taking into account any call options exercised by the issuer and any permissible maturity shortening features other than interest rate resets.
Legend
(a) Yield represents either the annualized yield at the date of purchase, or the stated coupon rate, or, for floating and adjustable rate securities, the rate at period end.
(b) Coupon rates for floating and adjustable rate securities reflect the rates in effect at period end.
(c) Private activity obligations whose interest is subject to the federal alternative minimum tax for individuals.
Investment Valuation
All investments are categorized as Level 2 under the Fair Value Hierarchy. The inputs or methodology used for valuing securities may not be an indication of the risk associated with investing in those securities. For more information on valuation inputs please refer to the Investment Valuation section in the accompanying Notes to Financial Statements.
Other Information
# Additional information on each counterparty to the repurchase agreement is as follows:
| Repurchase Agreement / Counterparty | Value |
| $263,594,000 due 7/03/17 at 1.12% | |
| BNP Paribas, S.A. | $17,075,678 |
| BNY Mellon Capital Markets LLC | 1,922,937 |
| Bank of America NA | 44,950,569 |
| Bank of Nova Scotia | 11,783,756 |
| Citibank NA | 24,229,003 |
| Credit Agricole CIB New York Branch | 7,691,747 |
| ING Financial Markets LLC | 1,784,485 |
| J.P. Morgan Securities, Inc. | 24,967,411 |
| Merrill Lynch, Pierce, Fenner & Smith, Inc. | 6,889,636 |
| Mizuho Securities USA, Inc. | 21,444,591 |
| RBC Dominion Securities, Inc. | 35,382,036 |
| Wells Fargo Securities LLC | 65,472,151 |
| | $263,594,000 |
See accompanying notes which are an integral part of the financial statements.
Financial Statements
Statement of Assets and Liabilities
| | | June 30, 2017 (Unaudited) |
| Assets | | |
Investment in securities, at value (including repurchase agreements of $1,201,594,000) — See accompanying schedule:
Unaffiliated issuers (cost $4,027,452,057) | | $4,027,452,057 |
| Cash | | 10,993 |
| Receivable for fund shares sold | | 12,897,976 |
| Interest receivable | | 2,058,949 |
| Other receivables | | 32,617 |
| Total assets | | 4,042,452,592 |
| Liabilities | | |
| Payable for investments purchased | $69,000,000 | |
| Payable for fund shares redeemed | 15,582,108 | |
| Distributions payable | 8 | |
| Accrued management fee | 565,272 | |
| Distribution and service plan fees payable | 140,122 | |
| Other affiliated payables | 271,110 | |
| Other payables and accrued expenses | 69,394 | |
| Total liabilities | | 85,628,014 |
| Net Assets | | $3,956,824,578 |
| Net Assets consist of: | | |
| Paid in capital | | $3,956,690,794 |
| Distributions in excess of net investment income | | (114,693) |
| Accumulated undistributed net realized gain (loss) on investments | | 248,477 |
| Net Assets | | $3,956,824,578 |
| Initial Class: | | |
| Net Asset Value, offering price and redemption price per share ($1,374,139,664 ÷ 1,374,185,341 shares) | | $1.00 |
| Service Class: | | |
| Net Asset Value, offering price and redemption price per share ($1,104,152,856 ÷ 1,104,135,045 shares) | | $1.00 |
| Service Class 2: | | |
| Net Asset Value, offering price and redemption price per share ($224,026,240 ÷ 224,017,858 shares) | | $1.00 |
| Investor Class: | | |
| Net Asset Value, offering price and redemption price per share ($1,254,505,818 ÷ 1,254,161,434 shares) | | $1.00 |
See accompanying notes which are an integral part of the financial statements.
Statement of Operations
| | | Six months ended June 30, 2017 (Unaudited) |
| Investment Income | | |
| Interest | | 14,054,565 |
| Expenses | | |
| Management fee | $3,299,098 | |
| Transfer agent fees | 1,441,599 | |
| Distribution and service plan fees | 850,024 | |
| Accounting fees and expenses | 167,734 | |
| Custodian fees and expenses | 31,764 | |
| Independent trustees' fees and expenses | 7,131 | |
| Registration fees | 5,376 | |
| Audit | 25,728 | |
| Legal | 3,357 | |
| Interest | 5,457 | |
| Miscellaneous | 10,870 | |
| Total expenses before reductions | 5,848,138 | |
| Expense reductions | (11,577) | 5,836,561 |
| Net investment income (loss) | | 8,218,004 |
| Realized and Unrealized Gain (Loss) | | |
| Net realized gain (loss) on: | | |
| Investment securities: | | |
| Unaffiliated issuers | | 8,967 |
| Total net realized gain (loss) | | 8,967 |
| Net increase in net assets resulting from operations | | $8,226,971 |
See accompanying notes which are an integral part of the financial statements.
Statement of Changes in Net Assets
| | Six months ended June 30, 2017 (Unaudited) | Year ended December 31, 2016 |
| Increase (Decrease) in Net Assets | | |
| Operations | | |
| Net investment income (loss) | $8,218,004 | $5,684,742 |
| Net realized gain (loss) | 8,967 | 44,464 |
| Net increase in net assets resulting from operations | 8,226,971 | 5,729,206 |
| Distributions to shareholders from net investment income | (8,379,659) | (5,579,703) |
| Share transactions - net increase (decrease) | 130,791,660 | 849,501,802 |
| Total increase (decrease) in net assets | 130,638,972 | 849,651,305 |
| Net Assets | | |
| Beginning of period | 3,826,185,606 | 2,976,534,301 |
| End of period | $3,956,824,578 | $3,826,185,606 |
| Other Information | | |
| Undistributed net investment income end of period | $– | $46,962 |
| Distributions in excess of net investment income end of period | $(114,693) | $– |
See accompanying notes which are an integral part of the financial statements.
Financial Highlights — VIP Government Money Market Portfolio Initial Class
| | Six months ended (Unaudited) June 30, | Years ended December 31, | | | | |
| | 2017 | 2016 | 2015 | 2014 | 2013 | 2012 |
| Selected Per–Share Data | | | | | | |
| Net asset value, beginning of period | $1.00 | $1.00 | $1.00 | $1.00 | $1.00 | $1.00 |
| Income from Investment Operations | | | | | | |
| Net investment income (loss) | .002 | .002 | –A | –A | –A | .001 |
| Net realized and unrealized gain (loss)A | – | – | – | – | – | – |
| Total from investment operations | .002 | .002 | –A | –A | –A | .001 |
| Distributions from net investment income | (.002) | (.002) | –A | –A | –A | (.001) |
| Total distributions | (.002) | (.002) | –A | –A | –A | (.001) |
| Net asset value, end of period | $1.00 | $1.00 | $1.00 | $1.00 | $1.00 | $1.00 |
| Total ReturnB,C,D | .25% | .20% | .03% | .01% | .03% | .14% |
| Ratios to Average Net AssetsE | | | | | | |
| Expenses before reductions | .26%F | .25% | .25% | .25% | .26% | .26% |
| Expenses net of fee waivers, if any | .26%F | .25% | .24% | .24% | .25% | .26% |
| Expenses net of all reductions | .26%F | .25% | .24% | .24% | .25% | .26% |
| Net investment income (loss) | .49%F | .21% | .03% | .01% | .03% | .14% |
| Supplemental Data | | | | | | |
| Net assets, end of period (000 omitted) | $1,374,140 | $1,203,187 | $905,170 | $917,742 | $980,120 | $889,797 |
A Amount represents less than $.0005 per share.
B Total returns for periods of less than one year are not annualized.
C Total returns do not reflect charges attributable to your insurance company's separate account. Inclusion of these charges would reduce the total returns shown.
D Total returns would have been lower if certain expenses had not been reduced during the applicable periods shown.
E Expense ratios reflect operating expenses of the class. Expenses before reductions do not reflect amounts reimbursed or waived or reductions from expense offset arrangements and do not represent the amount paid by the class during periods when reimbursements, waivers or reductions occur. Expenses net of fee waivers reflect expenses after reimbursement and waivers but prior to reductions from expense offset arrangements. Expenses net of all reductions represent the net expenses paid by the class.
F Annualized
See accompanying notes which are an integral part of the financial statements.
Financial Highlights — VIP Government Money Market Portfolio Service Class
| | Six months ended (Unaudited) June 30, | Years ended December 31, | | | | |
| | 2017 | 2016 | 2015 | 2014 | 2013 | 2012 |
| Selected Per–Share Data | | | | | | |
| Net asset value, beginning of period | $1.00 | $1.00 | $1.00 | $1.00 | $1.00 | $1.00 |
| Income from Investment Operations | | | | | | |
| Net investment income (loss) | .002 | .001 | –A | –A | –A | –A |
| Net realized and unrealized gain (loss)A | – | – | – | – | – | – |
| Total from investment operations | .002 | .001 | –A | –A | –A | –A |
| Distributions from net investment income | (.002) | (.001) | –A | –A | –A | –A |
| Total distributions | (.002) | (.001) | –A | –A | –A | –A |
| Net asset value, end of period | $1.00 | $1.00 | $1.00 | $1.00 | $1.00 | $1.00 |
| Total ReturnB,C,D | .20% | .10% | .01% | .01% | .01% | .04% |
| Ratios to Average Net AssetsE | | | | | | |
| Expenses before reductions | .36%F | .35% | .35% | .35% | .36% | .36% |
| Expenses net of fee waivers, if any | .36%F | .35% | .26% | .24% | .27% | .36% |
| Expenses net of all reductions | .36%F | .35% | .26% | .24% | .27% | .36% |
| Net investment income (loss) | .39%F | .11% | .01% | .01% | .01% | .04% |
| Supplemental Data | | | | | | |
| Net assets, end of period (000 omitted) | $1,104,153 | $1,158,089 | $759,317 | $643,802 | $117,758 | $115,204 |
A Amount represents less than $.0005 per share.
B Total returns for periods of less than one year are not annualized.
C Total returns do not reflect charges attributable to your insurance company's separate account. Inclusion of these charges would reduce the total returns shown.
D Total returns would have been lower if certain expenses had not been reduced during the applicable periods shown.
E Expense ratios reflect operating expenses of the class. Expenses before reductions do not reflect amounts reimbursed or waived or reductions from expense offset arrangements and do not represent the amount paid by the class during periods when reimbursements, waivers or reductions occur. Expenses net of fee waivers reflect expenses after reimbursement and waivers but prior to reductions from expense offset arrangements. Expenses net of all reductions represent the net expenses paid by the class.
F Annualized
See accompanying notes which are an integral part of the financial statements.
Financial Highlights — VIP Government Money Market Portfolio Service Class 2
| | Six months ended (Unaudited) June 30, | Years ended December 31, | | | | |
| | 2017 | 2016 | 2015 | 2014 | 2013 | 2012 |
| Selected Per–Share Data | | | | | | |
| Net asset value, beginning of period | $1.00 | $1.00 | $1.00 | $1.00 | $1.00 | $1.00 |
| Income from Investment Operations | | | | | | |
| Net investment income (loss) | .001 | –A | –A | –A | –A | –A |
| Net realized and unrealized gain (loss)A | – | – | – | – | – | – |
| Total from investment operations | .001 | –A | –A | –A | –A | –A |
| Distributions from net investment income | (.001) | –A | –A | –A | –A | –A |
| Total distributions | (.001) | –A | –A | –A | –A | –A |
| Net asset value, end of period | $1.00 | $1.00 | $1.00 | $1.00 | $1.00 | $1.00 |
| Total ReturnB,C,D | .12% | .01% | .01% | .01% | .01% | .01% |
| Ratios to Average Net AssetsE | | | | | | |
| Expenses before reductions | .51%F | .50% | .50% | .50% | .51% | .51% |
| Expenses net of fee waivers, if any | .51%F | .44% | .26% | .24% | .27% | .39% |
| Expenses net of all reductions | .51%F | .44% | .26% | .24% | .27% | .39% |
| Net investment income (loss) | .24%F | .02% | .01% | .01% | .01% | .01% |
| Supplemental Data | | | | | | |
| Net assets, end of period (000 omitted) | $224,026 | $222,987 | $210,538 | $135,122 | $144,266 | $157,866 |
A Amount represents less than $.0005 per share.
B Total returns for periods of less than one year are not annualized.
C Total returns do not reflect charges attributable to your insurance company's separate account. Inclusion of these charges would reduce the total returns shown.
D Total returns would have been lower if certain expenses had not been reduced during the applicable periods shown.
E Expense ratios reflect operating expenses of the class. Expenses before reductions do not reflect amounts reimbursed or waived or reductions from expense offset arrangements and do not represent the amount paid by the class during periods when reimbursements, waivers or reductions occur. Expenses net of fee waivers reflect expenses after reimbursement and waivers but prior to reductions from expense offset arrangements. Expenses net of all reductions represent the net expenses paid by the class.
F Annualized
See accompanying notes which are an integral part of the financial statements.
Financial Highlights — VIP Government Money Market Portfolio Investor Class
| | Six months ended (Unaudited) June 30, | Years ended December 31, | | | | |
| | 2017 | 2016 | 2015 | 2014 | 2013 | 2012 |
| Selected Per–Share Data | | | | | | |
| Net asset value, beginning of period | $1.00 | $1.00 | $1.00 | $1.00 | $1.00 | $1.00 |
| Income from Investment Operations | | | | | | |
| Net investment income (loss) | .002 | .002 | –A | –A | –A | .001 |
| Net realized and unrealized gain (loss)A | – | – | – | – | – | – |
| Total from investment operations | .002 | .002 | –A | –A | –A | .001 |
| Distributions from net investment income | (.002) | (.002) | –A | –A | –A | (.001) |
| Total distributions | (.002) | (.002) | –A | –A | –A | (.001) |
| Net asset value, end of period | $1.00 | $1.00 | $1.00 | $1.00 | $1.00 | $1.00 |
| Total ReturnB,C,D | .24% | .18% | .01% | .01% | .02% | .11% |
| Ratios to Average Net AssetsE | | | | | | |
| Expenses before reductions | .28%F | .27% | .28% | .27% | .28% | .28% |
| Expenses net of fee waivers, if any | .28%F | .27% | .26% | .24% | .26% | .28% |
| Expenses net of all reductions | .28%F | .27% | .26% | .24% | .26% | .28% |
| Net investment income (loss) | .46%F | .19% | .01% | .01% | .02% | .12% |
| Supplemental Data | | | | | | |
| Net assets, end of period (000 omitted) | $1,254,506 | $1,241,922 | $1,101,511 | $992,374 | $1,094,606 | $899,015 |
A Amount represents less than $.0005 per share.
B Total returns for periods of less than one year are not annualized.
C Total returns do not reflect charges attributable to your insurance company's separate account. Inclusion of these charges would reduce the total returns shown.
D Total returns would have been lower if certain expenses had not been reduced during the applicable periods shown.
E Expense ratios reflect operating expenses of the class. Expenses before reductions do not reflect amounts reimbursed or waived or reductions from expense offset arrangements and do not represent the amount paid by the class during periods when reimbursements, waivers or reductions occur. Expenses net of fee waivers reflect expenses after reimbursement and waivers but prior to reductions from expense offset arrangements. Expenses net of all reductions represent the net expenses paid by the class.
F Annualized
See accompanying notes which are an integral part of the financial statements.
Notes to Financial Statements (Unaudited)
For the period ended June 30, 2017
1. Organization.
VIP Government Money Market Portfolio (the Fund) is a fund of Variable Insurance Products Fund V (the Trust) and is authorized to issue an unlimited number of shares. The Trust is registered under the Investment Company Act of 1940, as amended (the 1940 Act), as an open-end management investment company organized as a Massachusetts business trust. Shares of the Fund may only be purchased by insurance companies for the purpose of funding variable annuity or variable life insurance contracts. The Fund offers the following classes of shares: Initial Class shares, Service Class shares, Service Class 2 shares and Investor Class shares. All classes have equal rights and voting privileges, except for matters affecting a single class.
2. Significant Accounting Policies.
The Fund is an investment company and applies the accounting and reporting guidance of the Financial Accounting Standards Board (FASB) Accounting Standards Codification Topic 946 Financial Services – Investments Companies. The financial statements have been prepared in conformity with accounting principles generally accepted in the United States of America (GAAP), which require management to make certain estimates and assumptions at the date of the financial statements. Actual results could differ from those estimates. Subsequent events, if any, through the date that the financial statements were issued have been evaluated in the preparation of the financial statements. The following summarizes the significant accounting policies of the Fund:
Investment Valuation. The Fund categorizes the inputs to valuation techniques used to value its investments into a disclosure hierarchy consisting of three levels as shown below:
- Level 1 – quoted prices in active markets for identical investments
- Level 2 – other significant observable inputs (including quoted prices for similar investments, interest rates, prepayment speeds, etc.)
- Level 3 – unobservable inputs (including the Fund's own assumptions based on the best information available)
As permitted by compliance with certain conditions under Rule 2a-7 of the 1940 Act, securities are valued at amortized cost, which approximates fair value. The amortized cost of an instrument is determined by valuing it at its original cost and thereafter amortizing any discount or premium from its face value at a constant rate until maturity. Securities held by a money market fund are generally high quality and liquid; however, they are reflected as Level 2 because the inputs used to determine fair value are not quoted prices in an active market.
Investment Transactions and Income. Gains and losses on securities sold are determined on the basis of identified cost. Interest income is accrued as earned and includes coupon interest and amortization of premium and accretion of discount on debt securities as applicable.
Class Allocations and Expenses. Investment income, realized and unrealized capital gains and losses, common expenses of the Fund, and certain fund-level expense reductions, if any, are allocated daily on a pro-rata basis to each class based on the relative net assets of each class to the total net assets of the Fund. Each class differs with respect to transfer agent and distribution and service plan fees incurred. Certain expense reductions may also differ by class. For the reporting period, the allocated portion of income and expenses to each class as a percent of its average net assets may vary due to the timing of recording these transactions in relation to fluctuating net assets of the classes. Expenses directly attributable to a fund are charged to that fund. Expenses attributable to more than one fund are allocated among the respective funds on the basis of relative net assets or other appropriate methods. Expense estimates are accrued in the period to which they relate and adjustments are made when actual amounts are known.
Deferred Trustee Compensation. Under a Deferred Compensation Plan (the Plan), independent Trustees may elect to defer receipt of a portion of their annual compensation. Deferred amounts are invested in a cross-section of Fidelity funds, are marked-to-market and remain in the Fund until distributed in accordance with the Plan. The investment of deferred amounts and the offsetting payable to the Trustees are included in the accompanying Statement of Assets and Liabilities.
Income Tax Information and Distributions to Shareholders. Each year, the Fund intends to qualify as a regulated investment company under Subchapter M of the Internal Revenue Code, including distributing substantially all of its taxable income and realized gains. As a result, no provision for U.S. Federal income taxes is required. The Fund files a U.S. federal tax return, in addition to state and local tax returns as required. The Fund's federal income tax returns are subject to examination by the Internal Revenue Service (IRS) for a period of three fiscal years after they are filed. State and local tax returns may be subject to examination for an additional fiscal year depending on the jurisdiction.
Dividends are declared and recorded daily and paid monthly from net investment income. Distributions from realized gains, if any, are declared and recorded on the ex-dividend date. Income dividends and capital gain distributions are declared separately for each class. Income and capital gain distributions are determined in accordance with income tax regulations, which may differ from GAAP.
Capital accounts within the financial statements are adjusted for permanent book-tax differences. These adjustments have no impact on net assets or the results of operations. Capital accounts are not adjusted for temporary book-tax differences which will reverse in a subsequent period.
Book-tax differences are primarily due to deferred trustees compensation.
The federal tax cost of investment securities and unrealized appreciation (depreciation) as of period end were as follows:
| Gross unrealized appreciation | $– |
| Gross unrealized depreciation | – |
| Net unrealized appreciation (depreciation) on securities | $– |
| Tax cost | $4,027,452,057 |
Repurchase Agreements. Pursuant to an Exemptive Order issued by the Securities and Exchange Commission (the SEC), the Fund along with other registered investment companies having management contracts with Fidelity Management & Research Company (FMR), or other affiliated entities of FMR, are permitted to transfer uninvested cash balances into joint trading accounts which are then invested in repurchase agreements. The Fund may also invest directly with institutions in repurchase agreements. Upon settlement date, collateral is held in segregated accounts with custodian banks and may be obtained in the event of a default of the counterparty. The Fund monitors, on a daily basis, the value of the collateral to ensure it is at least equal to the principal amount of the repurchase agreement (including accrued interest). In the event of a default by the counterparty, realization of the collateral proceeds could be delayed, during which time the value of the collateral may decline.
Reverse Repurchase Agreements. To enhance its yield, the Fund may enter into reverse repurchase transactions under master repurchase agreements whereby the Fund sells securities to a counterparty in return for cash and agrees to repurchase those securities at a future date and agreed upon price. During the period that reverse repurchase transactions are outstanding, the Fund identifies the securities as pledged in its records with an initial value at least equal to its principal obligation under the agreement. The cash proceeds received by the Fund may be invested in other securities. To the extent cash proceeds received from the counterparty exceed the value of the securities sold, the counterparty may request additional collateral from the Fund. If the counterparty defaults on its obligation, because of insolvency or other reasons, the Fund could experience delays and costs in recovering the securities sold. Information regarding securities sold under a reverse repurchase agreement, if any, is included at the end of the Fund's Schedule of Investments and the cash proceeds are recorded as a liability in the accompanying Statement of Assets and Liabilities. The Fund continues to receive interest and dividend payments on the securities sold during the term of the reverse repurchase agreement. During the period, the average principal balance of reverse repurchase transactions was $7,729,813 and the weighted average interest rate was .45% with payments included in the Statement of Operations as a component of interest expense. At period end, there were no reverse repurchase agreements outstanding.
3. Fees and Other Transactions with Affiliates.
Management Fee. Fidelity Management & Research Company (the investment adviser and its affiliates provide the Fund with investment management related services for which the Fund pays a monthly management fee. The management fee is calculated on the basis of a group fee rate plus a total income-based component. The annualized group fee rate averaged .11% during the period. The group fee rate is based upon the average net assets of all the mutual funds advised by the investment adviser, including any mutual funds previously advised by the investment adviser that are currently advised by Fidelity SelectCo, LLC, an affiliate of the investment adviser. The group fee rate decreases as assets under management increase and increases as assets under management decrease. The total income-based component is calculated according to a graduated schedule providing for different rates based on the Fund's gross annualized yield. The rate increases as the Fund's gross yield increases.
During the period the income-based portion of this fee was $1,235,231 or an annualized rate of .07% of the Fund's average net assets. For the reporting period, the Fund's total annualized management fee rate was .18% of the Fund's average net assets.
Distribution and Service Plan Fees. In accordance with Rule 12b-1 of the 1940 Act, the Fund has adopted separate 12b-1 Plans for each Service Class of shares. Each Service Class pays Fidelity Distributors Corporation (FDC), an affiliate of the investment adviser, a service fee. For the period, the service fee is based on an annual rate of .10% of Service Class' average net assets and .25% of Service Class 2's average net assets.
For the period, total fees, all of which were re-allowed to insurance companies for the distribution of shares and providing shareholder support services, were as follows:
| Service Class | $566,618 |
| Service Class 2 | 283,406 |
| | $850,024 |
Transfer Agent Fees. Fidelity Investments Institutional Operations Company, Inc. (FIIOC), an affiliate of the investment adviser, is the Fund's transfer, dividend disbursing, and shareholder servicing agent. FIIOC receives an asset-based fee with respect to each class. Each class pays a fee for transfer agent services, typesetting and printing and mailing of shareholder reports, excluding mailing of proxy statements, equal to an annual rate of class-level average net assets. The annual rate for Investor Class is .09% and the annual rate for all other classes is .07%. For the period, transfer agent fees for each class were as follows:
| Initial Class | $406,881 |
| Service Class | 385,300 |
| Service Class 2 | 77,086 |
| Investor Class | 572,332 |
| | $1,441,599 |
Accounting Fees. Fidelity Service Company, Inc. (FSC), an affiliate of the investment adviser, maintains the Fund's accounting records. The fee is based on the level of average net assets for each month.
Interfund Trades. The Fund may purchase from or sell securities to other Fidelity Funds under procedures adopted by the Board. The procedures have been designed to ensure these interfund trades are executed in accordance with Rule 17a-7 of the 1940 Act
4. Expense Reductions.
Through arrangements with the Fund's custodian, credits realized as a result of certain uninvested cash balances were used to reduce the Fund's expenses. During the period, these credits reduced the Fund's custody expenses by $111.
In addition, during the period the investment adviser reimbursed and/or waived a portion of fund-level operating expenses in the amount of $11,466.
5. Distributions to Shareholders.
Distributions to shareholders of each class were as follows:
| | Six months ended
June 30, 2017 | Year ended December 31, 2016 |
| From net investment income | | |
| Initial Class | $2,955,039 | $2,249,577 |
| Service Class | 2,219,772 | 1,219,173 |
| Service Class 2 | 275,316 | 31,310 |
| Investor Class | 2,929,532 | 2,079,643 |
| Total | $8,379,659 | $5,579,703 |
6. Share Transactions.
Transactions for each class of shares at a $1.00 per share were as follows:
| | Six months ended
June 30, 2017 | Year ended December 31, 2016 |
| Initial Class | | |
| Shares sold | 675,498,797 | 1,352,476,119 |
| Reinvestment of distributions | 2,966,656 | 2,237,876 |
| Shares redeemed | (507,461,226) | (1,056,751,917) |
| Net increase (decrease) | 171,004,227 | 297,962,078 |
| Service Class | | |
| Shares sold | 373,216,521 | 1,292,715,911 |
| Reinvestment of distributions | 2,227,773 | 1,210,951 |
| Shares redeemed | (429,337,658) | (895,156,954) |
| Net increase (decrease) | (53,893,364) | 398,769,908 |
| Service Class 2 | | |
| Shares sold | 63,039,067 | 115,312,480 |
| Reinvestment of distributions | 275,957 | 30,723 |
| Shares redeemed | (62,266,645) | (102,879,921) |
| Net increase (decrease) | 1,048,379 | 12,463,282 |
| Investor Class | | |
| Shares sold | 258,182,016 | 618,974,155 |
| Reinvestment of distributions | 2,940,654 | 2,068,714 |
| Shares redeemed | (248,490,252) | (480,736,335) |
| Net increase (decrease) | 12,632,418 | 140,306,534 |
7. Other.
The Fund's organizational documents provide former and current trustees and officers with a limited indemnification against liabilities arising in connection with the performance of their duties to the Fund. In the normal course of business, the Fund may also enter into contracts that provide general indemnifications. The Fund's maximum exposure under these arrangements is unknown as this would be dependent on future claims that may be made against the Fund. The risk of material loss from such claims is considered remote.
At the end of the period, the investment adviser or its affiliates were the owners of record of 35% of the total outstanding shares of the Fund.
Shareholder Expense Example
As a shareholder of the Fund, you incur two types of costs: (1) transaction costs and (2) ongoing costs, including management fees, distribution and/or service (12b-1) fees and other Fund expenses. This Example is intended to help you understand your ongoing costs (in dollars) of investing in the Fund and to compare these costs with the ongoing costs of investing in other mutual funds.
The Example is based on an investment of $1,000 invested at the beginning of the period and held for the entire period (January 1, 2017 to June 30, 2017).
Actual Expenses
The first line of the accompanying table for each class of the Fund provides information about actual account values and actual expenses. You may use the information in this line, together with the amount you invested, to estimate the expenses that you paid over the period. Simply divide your account value by $1,000.00 (for example, an $8,600 account value divided by $1,000.00 = 8.6), then multiply the result by the number in the first line for a class of the Fund under the heading entitled "Expenses Paid During Period" to estimate the expenses you paid on your account during this period. The estimate of expenses does not include any fees or other expenses of any variable annuity or variable life insurance product. If they were, the estimate of expenses you paid during the period would be higher, and your ending account value would be lower.
Hypothetical Example for Comparison Purposes
The second line of the accompanying table for each class of the Fund provides information about hypothetical account values and hypothetical expenses based on a Class' actual expense ratio and an assumed rate of return of 5% per year before expenses, which is not the Class' actual return. The hypothetical account values and expenses may not be used to estimate the actual ending account balance or expenses you paid for the period. You may use this information to compare the ongoing costs of investing in the Fund and other funds. To do so, compare this 5% hypothetical example with the 5% hypothetical examples that appear in the shareholder reports of the other funds. The estimate of expenses does not include any fees or other expenses of any variable annuity or variable life insurance product. If they were, the estimate of expenses you paid during the period would be higher, and your ending account value would be lower.
Please note that the expenses shown in the table are meant to highlight your ongoing costs only and do not reflect any transaction costs. Therefore, the second line of the table is useful in comparing ongoing costs only, and will not help you determine the relative total costs of owning different funds.
| | Annualized Expense Ratio-A | Beginning
Account Value
January 1, 2017 | Ending
Account Value
June 30, 2017 | Expenses Paid
During Period-B
January 1, 2017
to June 30, 2017 |
| Initial Class | .26% | | | |
| Actual | | $1,000.00 | $1,002.50 | $1.29 |
| Hypothetical-C | | $1,000.00 | $1,023.51 | $1.30 |
| Service Class | .36% | | | |
| Actual | | $1,000.00 | $1,002.00 | $1.79 |
| Hypothetical-C | | $1,000.00 | $1,023.01 | $1.81 |
| Service Class 2 | .51% | | | |
| Actual | | $1,000.00 | $1,001.20 | $2.53 |
| Hypothetical-C | | $1,000.00 | $1,022.27 | $2.56 |
| Investor Class | .28% | | | |
| Actual | | $1,000.00 | $1,002.40 | $1.39 |
| Hypothetical-C | | $1,000.00 | $1,023.41 | $1.40 |
A Annualized expense ratio reflects expenses net of applicable fee waivers.
B Expenses are equal to each Class' annualized expense ratio, multiplied by the average account value over the period, multiplied by 181/365 (to reflect the one-half year period).
C 5% return per year before expenses

VIPMM-SANN-0817
1.705628.119