UNITED STATES
SECURITIES AND EXCHANGE COMMISSION
Washington, D.C. 20549
FORM N-CSR
CERTIFIED SHAREHOLDER REPORT OF REGISTERED
MANAGEMENT INVESTMENT COMPANIES
Investment Company Act file number 811-05361
Variable Insurance Products Fund V
(Exact name of registrant as specified in charter)
245 Summer St., Boston, MA 02210
(Address of principal executive offices) (Zip code)
Marc Bryant, Secretary
245 Summer St.
Boston, Massachusetts 02210
(Name and address of agent for service)
Registrant's telephone number, including area code:
617-563-7000
| |
Date of fiscal year end: | December 31 |
|
|
Date of reporting period: | June 30, 2018 |
Item 1.
Reports to Stockholders
Fidelity® Variable Insurance Products:
Freedom Funds - Income, 2005, 2010, 2015, 2020, 2025, 2030, 2035, 2040, 2045, 2050
Semi-Annual Report June 30, 2018 |
 |
Contents
To view a fund's proxy voting guidelines and proxy voting record for the 12-month period ended June 30, visit http://www.fidelity.com/proxyvotingresults or visit the Securities and Exchange Commission's (SEC) web site at http://www.sec.gov.
You may also call 1-877-208-0098 to request a free copy of the proxy voting guidelines.
Fidelity® Variable Insurance Products are separate account options which are purchased through a variable insurance contract.
Standard & Poor's, S&P and S&P 500 are registered service marks of The McGraw-Hill Companies, Inc. and have been licensed for use by Fidelity Distributors Corporation.
Other third-party marks appearing herein are the property of their respective owners.
All other marks appearing herein are registered or unregistered trademarks or service marks of FMR LLC or an affiliated company. © 2018 FMR LLC. All rights reserved.
This report and the financial statements contained herein are submitted for the general information of the shareholders of the Funds. This report is not authorized for distribution to prospective investors in the Funds unless preceded or accompanied by an effective prospectus.
A fund files its complete schedule of portfolio holdings with the SEC for the first and third quarters of each fiscal year on Form N-Q. Forms N-Q are available on the SEC’s web site at http://www.sec.gov. A fund's Forms N-Q may be reviewed and copied at the SEC’s Public Reference Room in Washington, DC. Information regarding the operation of the SEC's Public Reference Room may be obtained by calling 1-800-SEC-0330.
For a complete list of a fund's portfolio holdings, view the most recent holdings listing, semiannual report, or annual report on Fidelity's web site at http://www.fidelity.com, http://www.institutional.fidelity.com, or http://www.401k.com, as applicable.
NOT FDIC INSURED •MAY LOSE VALUE •NO BANK GUARANTEE
Neither the Funds nor Fidelity Distributors Corporation is a bank.
Note to shareholders
At its May 2018 meeting, the Board of Trustees approved incremental updates to the strategic asset allocation (i.e., glide path) of VIP Freedom Funds, adding U.S. Treasury Inflation-Protected Securities and long-term U.S. Treasury bonds as fixed exposures in the Funds’ bond allocations, while slightly reducing the equity and short-term debt allocations for shorter-dated Portfolios. These glide path updates are expected to be fully implemented by the end of 2018. In addition, to increase the investment opportunity set, the Board approved allowing VIP Freedom Funds to employ underlying Fidelity funds beyond just VIP portfolios.
VIP Freedom Income Portfolio℠
Investment Summary (Unaudited)
The information in the following tables is based on the direct investments of the Fund.
Top Holdings as of June 30, 2018
| | % of fund's net assets |
| VIP Investment Grade Bond Portfolio Initial Class | 37.2 |
| VIP Government Money Market Portfolio Initial Class 1.71% | 29.2 |
| VIP Overseas Portfolio Initial Class | 6.0 |
| Fidelity Inflation-Protected Bond Index Fund Institutional Class | 5.7 |
| VIP Emerging Markets Portfolio Initial Class | 3.7 |
| Fidelity Long-Term Treasury Bond Index Fund Premium Class | 3.3 |
| VIP Growth & Income Portfolio Initial Class | 2.7 |
| VIP Equity-Income Portfolio Initial Class | 2.4 |
| VIP Growth Portfolio Initial Class | 2.3 |
| VIP Contrafund Portfolio Initial Class | 2.3 |
| | 94.8 |
Asset Allocation (% of fund's net assets)
| Period end |
| | Domestic Equity Funds | 12.9% |
| | International Equity Funds | 9.7% |
| | Bond Funds | 48.2% |
| | Short-Term Funds | 29.2% |

VIP Freedom Income Portfolio℠
Schedule of Investments June 30, 2018 (Unaudited)
Showing Percentage of Net Assets
| Domestic Equity Funds - 12.9% | | | |
| | | Shares | Value |
| VIP Contrafund Portfolio Initial Class (a) | | 27,194 | $969,468 |
| VIP Equity-Income Portfolio Initial Class (a) | | 45,834 | 1,018,881 |
| VIP Growth & Income Portfolio Initial Class (a) | | 53,935 | 1,158,516 |
| VIP Growth Portfolio Initial Class (a) | | 14,286 | 995,163 |
| VIP Mid Cap Portfolio Initial Class (a) | | 7,693 | 281,486 |
| VIP Value Portfolio Initial Class (a) | | 47,449 | 744,482 |
| VIP Value Strategies Portfolio Initial Class (a) | | 26,542 | 363,625 |
| TOTAL DOMESTIC EQUITY FUNDS | | | |
| (Cost $4,182,943) | | | 5,531,621 |
|
| International Equity Funds - 9.7% | | | |
| VIP Emerging Markets Portfolio Initial Class (a) | | 139,845 | 1,595,627 |
| VIP Overseas Portfolio Initial Class (a) | | 115,358 | 2,586,336 |
| TOTAL INTERNATIONAL EQUITY FUNDS | | | |
| (Cost $3,074,376) | | | 4,181,963 |
|
| Bond Funds - 48.2% | | | |
| Fidelity Inflation-Protected Bond Index Fund Institutional Class(a) | | 247,958 | 2,434,951 |
| Fidelity Long-Term Treasury Bond Index Fund Premium Class (a) | | 113,412 | 1,440,328 |
| VIP High Income Portfolio Initial Class (a) | | 159,286 | 856,960 |
| VIP Investment Grade Bond Portfolio Initial Class (a) | | 1,285,495 | 16,042,978 |
| TOTAL BOND FUNDS | | | |
| (Cost $20,986,735) | | | 20,775,217 |
|
| Short-Term Funds - 29.2% | | | |
| VIP Government Money Market Portfolio Initial Class 1.71% (a)(b) | | | |
| (Cost $12,583,793) | | 12,583,793 | 12,583,793 |
| TOTAL INVESTMENT IN SECURITIES - 100.0% | | | |
| (Cost $40,827,847) | | | 43,072,594 |
| NET OTHER ASSETS (LIABILITIES) - 0.0% | | | (4,147) |
| NET ASSETS - 100% | | | $43,068,447 |
Legend
(a) Affiliated Fund
(b) The rate quoted is the annualized seven-day yield of the fund at period end.
Affiliated Central Funds
Information regarding fiscal year to date income earned by the Fund from investments in Fidelity Central Funds is as follows:
| Fund | Income earned |
| Fidelity Cash Central Fund | $3 |
| Total | $3 |
Amounts in the income column in the above table include any capital gain distributions from underlying funds, which are presented in the corresponding line-item in the Statement of Operations if applicable.
Affiliated Underlying Funds
Fiscal year to date information regarding the Fund's investments in affiliated Underlying Funds, excluding any Money Market Central Funds, is presented below. Exchanges between classes of the same affiliated Underlying Funds may occur.
| Affiliate | Value, beginning of period | Purchases | Sales Proceeds | Dividend Income | Realized Gain (loss) | Change in Unrealized appreciation (depreciation) | Value, end of period |
| Fidelity Inflation-Protected Bond Index Fund Institutional Class | $-- | $2,434,951 | $-- | $21 | $-- | $-- | $2,434,951 |
| Fidelity Long-Term Treasury Bond Index Fund Premium Class | 907,985 | 710,051 | 142,376 | 13,355 | (4,298 ) | (31,034) | 1,440,328 |
| VIP Contrafund Portfolio Initial Class | 1,030,804 | 293,603 | 307,185 | 84,146 | 16,551 | (64,305) | 969,468 |
| VIP Emerging Markets Portfolio Initial Class | 1,607,941 | 492,045 | 405,691 | 839 | 48,454 | (147,122) | 1,595,627 |
| VIP Equity-Income Portfolio Initial Class | 1,086,849 | 321,256 | 322,074 | 46,881 | 3,738 | (70,888) | 1,018,881 |
| VIP Government Money Market Portfolio Initial Class 1.71% | 13,710,985 | 2,769,720 | 3,896,912 | 93,311 | -- | -- | 12,583,793 |
| VIP Growth & Income Portfolio Initial Class | 1,246,930 | 350,979 | 384,542 | 64,565 | 26,335 | (81,186) | 1,158,516 |
| VIP Growth Portfolio Initial Class | 1,049,451 | 343,773 | 363,181 | 139,485 | 49,891 | (84,771) | 995,163 |
| VIP High Income Portfolio Initial Class | 841,795 | 177,392 | 152,054 | 7,433 | (536 ) | (9,637) | 856,960 |
| VIP Investment Grade Bond Portfolio Initial Class | 16,519,556 | 3,401,787 | 3,475,467 | 161,242 | (39,058 ) | (363,840) | 16,042,978 |
| VIP Mid Cap Portfolio Initial Class | 302,048 | 85,025 | 91,447 | 23,869 | 4,364 | (18,504) | 281,486 |
| VIP Overseas Portfolio Initial Class | 2,734,339 | 619,062 | 725,189 | 885 | 48,128 | (90,004) | 2,586,336 |
| VIP Value Portfolio Initial Class | 798,503 | 209,957 | 237,014 | 26,995 | 6,759 | (33,723) | 744,482 |
| VIP Value Strategies Portfolio Initial Class | 389,937 | 99,798 | 112,844 | 11,785 | 1,774 | (15,040) | 363,625 |
| Total | $42,227,123 | $12,309,399 | $10,615,976 | $674,812 | $162,102 | $(1,010,054) | $43,072,594 |
Amounts in the income column in the above table include any capital gain distributions from underlying funds, which are presented in the corresponding line-item in the Statement of Operations if applicable.
Investment Valuation
All investments are categorized as Level 1 under the Fair Value Hierarchy. The inputs or methodology used for valuing securities may not be an indication of the risk associated with investing in those securities. For more information on valuation inputs please refer to the Investment Valuation section in the accompanying Notes to Financial Statements.
See accompanying notes which are an integral part of the financial statements.
VIP Freedom Income Portfolio℠
Financial Statements
Statement of Assets and Liabilities
| | | June 30, 2018 (Unaudited) |
| Assets | | |
Investment in securities, at value — See accompanying schedule:
| | |
| Affiliated issuers (cost $40,827,847) | $43,072,594 | |
| Total Investment in Securities (cost $40,827,847) | | $43,072,594 |
| Cash | | 4 |
| Receivable for investments sold | | 2,519,823 |
| Receivable for fund shares sold | | 453,579 |
| Total assets | | 46,046,000 |
| Liabilities | | |
| Payable for investments purchased | $2,926,485 | |
| Payable for fund shares redeemed | 46,864 | |
| Distribution and service plan fees payable | 4,204 | |
| Total liabilities | | 2,977,553 |
| Net Assets | | $43,068,447 |
| Net Assets consist of: | | |
| Paid in capital | | $40,129,251 |
| Undistributed net investment income | | 163,613 |
| Accumulated undistributed net realized gain (loss) on investments | | 530,836 |
| Net unrealized appreciation (depreciation) on investments | | 2,244,747 |
| Net Assets | | $43,068,447 |
| Initial Class: | | |
| Net Asset Value, offering price and redemption price per share ($15,298,641 ÷ 1,334,251 shares) | | $11.47 |
| Service Class: | | |
| Net Asset Value, offering price and redemption price per share ($11,697,930 ÷ 1,021,058 shares) | | $11.46 |
| Service Class 2: | | |
| Net Asset Value, offering price and redemption price per share ($16,071,876 ÷ 1,409,297 shares) | | $11.40 |
See accompanying notes which are an integral part of the financial statements.
Statement of Operations
| | | Six months ended June 30, 2018 (Unaudited) |
| Investment Income | | |
| Dividends: | | |
| Affiliated issuers | | $188,524 |
| Income from Fidelity Central Funds | | 3 |
| Total income | | 188,527 |
| Expenses | | |
| Distribution and service plan fees | $24,350 | |
| Independent trustees' fees and expenses | 131 | |
| Total expenses | | 24,481 |
| Net investment income (loss) | | 164,046 |
| Realized and Unrealized Gain (Loss) | | |
| Net realized gain (loss) on: | | |
| Investment securities: | | |
| Affiliated issuers | 162,102 | |
| Capital gain distributions from underlying funds: | | |
| Affiliated issuers | 486,288 | |
| Total net realized gain (loss) | | 648,390 |
| Change in net unrealized appreciation (depreciation) on: | | |
| Investment securities: | | |
| Affiliated issuers | (1,010,054) | |
| Total change in net unrealized appreciation (depreciation) | | (1,010,054) |
| Net gain (loss) | | (361,664) |
| Net increase (decrease) in net assets resulting from operations | | $(197,618) |
See accompanying notes which are an integral part of the financial statements.
Statement of Changes in Net Assets
| | Six months ended June 30, 2018 (Unaudited) | Year ended December 31, 2017 |
| Increase (Decrease) in Net Assets | | |
| Operations | | |
| Net investment income (loss) | $164,046 | $629,213 |
| Net realized gain (loss) | 648,390 | 565,101 |
| Change in net unrealized appreciation (depreciation) | (1,010,054) | 2,039,401 |
| Net increase (decrease) in net assets resulting from operations | (197,618) | 3,233,715 |
| Distributions to shareholders from net investment income | (7,062) | (619,471) |
| Distributions to shareholders from net realized gain | (388,422) | (345,560) |
| Total distributions | (395,484) | (965,031) |
| Share transactions - net increase (decrease) | 1,437,701 | 1,706,894 |
| Total increase (decrease) in net assets | 844,599 | 3,975,578 |
| Net Assets | | |
| Beginning of period | 42,223,848 | 38,248,270 |
| End of period | $43,068,447 | $42,223,848 |
| Other Information | | |
| Undistributed net investment income end of period | $163,613 | $6,629 |
See accompanying notes which are an integral part of the financial statements.
Financial Highlights
VIP Freedom Income Portfolio Initial Class
| | Six months ended (Unaudited) June 30, | Years endedDecember 31, | | | | |
| | 2018 | 2017 | 2016 | 2015 | 2014 | 2013 |
| Selected Per–Share Data | | | | | | |
| Net asset value, beginning of period | $11.63 | $10.98 | $10.78 | $11.03 | $10.89 | $10.57 |
| Income from Investment Operations | | | | | | |
| Net investment income (loss)A | .05 | .19 | .16 | .21 | .18 | .18 |
| Net realized and unrealized gain (loss) | (.10) | .74 | .32 | (.25) | .23 | .40 |
| Total from investment operations | (.05) | .93 | .48 | (.04) | .41 | .58 |
| Distributions from net investment income | –B | (.18) | (.16) | (.20) | (.17) | (.17) |
| Distributions from net realized gain | (.11) | (.10) | (.11) | (.02) | (.10) | (.10) |
| Total distributions | (.11) | (.28) | (.28)C | (.21)D | (.27) | (.26)E |
| Net asset value, end of period | $11.47 | $11.63 | $10.98 | $10.78 | $11.03 | $10.89 |
| Total ReturnF,G,H | (.41)% | 8.48% | 4.50% | (.34)% | 3.78% | 5.55% |
| Ratios to Average Net AssetsI,J | | | | | | |
| Expenses before reductionsK | - %L | -% | -% | -% | -% | -% |
| Expenses net of fee waivers, if any | - %K,L | -% | -% | -% | -% | -% |
| Expenses net of all reductions | - %K,L | -% | -% | -% | -% | -% |
| Net investment income (loss) | .90%L | 1.67% | 1.48% | 1.85% | 1.62% | 1.67% |
| Supplemental Data | | | | | | |
| Net assets, end of period (000 omitted) | $15,299 | $16,086 | $14,956 | $14,548 | $17,386 | $16,980 |
| Portfolio turnover rateI | 50%L | 35% | 38% | 36% | 32% | 43% |
A Calculated based on average shares outstanding during the period.
B Amount represents less than $.005 per share.
C Total distributions of $.28 per share is comprised of distributions from net investment income of $.164 and distributions from net realized gain of $.113 per share.
D Total distributions of $.21 per share is comprised of distributions from net investment income of $.198 and distributions from net realized gain of $.015 per share.
E Total distributions of $.26 per share is comprised of distributions from net investment income of $.166 and distributions from net realized gain of $.097 per share.
F Total returns for periods of less than one year are not annualized.
G Total returns do not reflect charges attributable to your insurance company's separate account. Inclusion of these charges would reduce the total returns shown.
H Total returns would have been lower if certain expenses had not been reduced during the applicable periods shown.
I Amounts do not include the activity of the Underlying Funds.
J Expense ratios reflect operating expenses of the class. Expenses before reductions do not reflect amounts reimbursed by the investment adviser or reductions from expense offset arrangements and do not represent the amount paid by the class during periods when reimbursements or reductions occur. Expenses net of fee waivers reflect expenses after reimbursement by the investment adviser but prior to reductions from expense offset arrangements. Expenses net of all reductions represent the net expenses paid by the class but do not include expenses of the underlying funds in which the Fund invests.
K Amount represents less than .005%.
L Annualized
See accompanying notes which are an integral part of the financial statements.
VIP Freedom Income Portfolio Service Class
| | Six months ended (Unaudited) June 30, | Years endedDecember 31, | | | | |
| | 2018 | 2017 | 2016 | 2015 | 2014 | 2013 |
| Selected Per–Share Data | | | | | | |
| Net asset value, beginning of period | $11.63 | $10.97 | $10.78 | $11.03 | $10.89 | $10.58 |
| Income from Investment Operations | | | | | | |
| Net investment income (loss)A | .05 | .18 | .15 | .19 | .17 | .17 |
| Net realized and unrealized gain (loss) | (.11) | .75 | .31 | (.24) | .23 | .40 |
| Total from investment operations | (.06) | .93 | .46 | (.05) | .40 | .57 |
| Distributions from net investment income | –B | (.17) | (.15) | (.19) | (.16) | (.16) |
| Distributions from net realized gain | (.11) | (.10) | (.11) | (.02) | (.10) | (.10) |
| Total distributions | (.11) | (.27) | (.27)C | (.20)D | (.26) | (.26) |
| Net asset value, end of period | $11.46 | $11.63 | $10.97 | $10.78 | $11.03 | $10.89 |
| Total ReturnE,F,G | (.50)% | 8.49% | 4.32% | (.42)% | 3.69% | 5.38% |
| Ratios to Average Net AssetsH,I | | | | | | |
| Expenses before reductions | .10%J | .10% | .10% | .10% | .10% | .10% |
| Expenses net of fee waivers, if any | .10%J | .10% | .10% | .10% | .10% | .10% |
| Expenses net of all reductions | .10%J | .10% | .10% | .10% | .10% | .10% |
| Net investment income (loss) | .80%J | 1.57% | 1.38% | 1.75% | 1.52% | 1.57% |
| Supplemental Data | | | | | | |
| Net assets, end of period (000 omitted) | $11,698 | $11,227 | $9,286 | $9,825 | $6,193 | $4,529 |
| Portfolio turnover rateH | 50%J | 35% | 38% | 36% | 32% | 43% |
A Calculated based on average shares outstanding during the period.
B Amount represents less than $.005 per share.
C Total distributions of $.27 per share is comprised of distributions from net investment income of $.154 and distributions from net realized gain of $.113 per share.
D Total distributions of $.20 per share is comprised of distributions from net investment income of $.189 and distributions from net realized gain of $.015 per share.
E Total returns for periods of less than one year are not annualized.
F Total returns do not reflect charges attributable to your insurance company's separate account. Inclusion of these charges would reduce the total returns shown.
G Total returns would have been lower if certain expenses had not been reduced during the applicable periods shown.
H Amounts do not include the activity of the Underlying Funds.
I Expense ratios reflect operating expenses of the class. Expenses before reductions do not reflect amounts reimbursed by the investment adviser or reductions from expense offset arrangements and do not represent the amount paid by the class during periods when reimbursements or reductions occur. Expenses net of fee waivers reflect expenses after reimbursement by the investment adviser but prior to reductions from expense offset arrangements. Expenses net of all reductions represent the net expenses paid by the class but do not include expenses of the underlying funds in which the Fund invests.
J Annualized
See accompanying notes which are an integral part of the financial statements.
VIP Freedom Income Portfolio Service Class 2
| | Six months ended (Unaudited) June 30, | Years endedDecember 31, | | | | |
| | 2018 | 2017 | 2016 | 2015 | 2014 | 2013 |
| Selected Per–Share Data | | | | | | |
| Net asset value, beginning of period | $11.59 | $10.93 | $10.74 | $10.99 | $10.85 | $10.54 |
| Income from Investment Operations | | | | | | |
| Net investment income (loss)A | .04 | .16 | .13 | .18 | .15 | .15 |
| Net realized and unrealized gain (loss) | (.12) | .75 | .31 | (.24) | .23 | .40 |
| Total from investment operations | (.08) | .91 | .44 | (.06) | .38 | .55 |
| Distributions from net investment income | –B | (.15) | (.14) | (.17) | (.14) | (.14) |
| Distributions from net realized gain | (.11) | (.10) | (.11) | (.02) | (.10) | (.10) |
| Total distributions | (.11) | (.25) | (.25) | (.19) | (.24) | (.24) |
| Net asset value, end of period | $11.40 | $11.59 | $10.93 | $10.74 | $10.99 | $10.85 |
| Total ReturnC,D,E | (.68)% | 8.36% | 4.17% | (.57)% | 3.54% | 5.21% |
| Ratios to Average Net AssetsF,G | | | | | | |
| Expenses before reductions | .25%H | .25% | .25% | .25% | .25% | .25% |
| Expenses net of fee waivers, if any | .25%H | .25% | .25% | .25% | .25% | .25% |
| Expenses net of all reductions | .25%H | .25% | .25% | .25% | .25% | .25% |
| Net investment income (loss) | .65%H | 1.42% | 1.23% | 1.60% | 1.37% | 1.42% |
| Supplemental Data | | | | | | |
| Net assets, end of period (000 omitted) | $16,072 | $14,911 | $14,007 | $13,375 | $8,860 | $7,500 |
| Portfolio turnover rateF | 50%H | 35% | 38% | 36% | 32% | 43% |
A Calculated based on average shares outstanding during the period.
B Amount represents less than $.005 per share.
C Total returns for periods of less than one year are not annualized.
D Total returns do not reflect charges attributable to your insurance company's separate account. Inclusion of these charges would reduce the total returns shown.
E Total returns would have been lower if certain expenses had not been reduced during the applicable periods shown.
F Amounts do not include the activity of the Underlying Funds.
G Expense ratios reflect operating expenses of the class. Expenses before reductions do not reflect amounts reimbursed by the investment adviser or reductions from expense offset arrangements and do not represent the amount paid by the class during periods when reimbursements or reductions occur. Expenses net of fee waivers reflect expenses after reimbursement by the investment adviser but prior to reductions from expense offset arrangements. Expenses net of all reductions represent the net expenses paid by the class but do not include expenses of the underlying funds in which the Fund invests.
H Annualized
See accompanying notes which are an integral part of the financial statements.
VIP Freedom 2005 Portfolio℠
Investment Summary (Unaudited)
The information in the following tables is based on the direct investments of the Fund.
Top Holdings as of June 30, 2018
| | % of fund's net assets |
| VIP Investment Grade Bond Portfolio Initial Class | 34.1 |
| VIP Government Money Market Portfolio Initial Class 1.71% | 23.6 |
| VIP Overseas Portfolio Initial Class | 8.0 |
| Fidelity Inflation-Protected Bond Index Fund Premium Class | 5.1 |
| VIP Emerging Markets Portfolio Initial Class | 4.6 |
| VIP Growth & Income Portfolio Initial Class | 4.0 |
| VIP Equity-Income Portfolio Initial Class | 3.5 |
| Fidelity Long-Term Treasury Bond Index Fund Premium Class | 3.5 |
| VIP Growth Portfolio Initial Class | 3.4 |
| VIP Contrafund Portfolio Initial Class | 3.3 |
| | 93.1 |
Asset Allocation (% of fund's net assets)
| Period end |
| | Domestic Equity Funds | 19.1% |
| | International Equity Funds | 12.6% |
| | Bond Funds | 44.7% |
| | Short-Term Funds | 23.6% |

VIP Freedom 2005 Portfolio℠
Schedule of Investments June 30, 2018 (Unaudited)
Showing Percentage of Net Assets
| Domestic Equity Funds - 19.1% | | | |
| | | Shares | Value |
| VIP Contrafund Portfolio Initial Class (a) | | 9,704 | $345,940 |
| VIP Equity-Income Portfolio Initial Class (a) | | 16,355 | 363,568 |
| VIP Growth & Income Portfolio Initial Class (a) | | 19,247 | 413,422 |
| VIP Growth Portfolio Initial Class (a) | | 5,097 | 355,079 |
| VIP Mid Cap Portfolio Initial Class (a) | | 2,745 | 100,449 |
| VIP Value Portfolio Initial Class (a) | | 16,932 | 265,671 |
| VIP Value Strategies Portfolio Initial Class (a) | | 9,472 | 129,762 |
| TOTAL DOMESTIC EQUITY FUNDS | | | |
| (Cost $1,553,485) | | | 1,973,891 |
|
| International Equity Funds - 12.6% | | | |
| VIP Emerging Markets Portfolio Initial Class (a) | | 42,062 | 479,927 |
| VIP Overseas Portfolio Initial Class (a) | | 36,869 | 826,614 |
| TOTAL INTERNATIONAL EQUITY FUNDS | | | |
| (Cost $1,066,288) | | | 1,306,541 |
|
| Bond Funds - 44.7% | | | |
| Fidelity Inflation-Protected Bond Index Fund Premium Class (a) | | 53,977 | 530,052 |
| Fidelity Long-Term Treasury Bond Index Fund Premium Class (a) | | 28,296 | 359,357 |
| VIP High Income Portfolio Initial Class (a) | | 38,265 | 205,865 |
| VIP Investment Grade Bond Portfolio Initial Class (a) | | 282,818 | 3,529,564 |
| TOTAL BOND FUNDS | | | |
| (Cost $4,670,603) | | | 4,624,838 |
|
| Short-Term Funds - 23.6% | | | |
| VIP Government Money Market Portfolio Initial Class 1.71% (a)(b) | | | |
| (Cost $2,449,104) | | 2,449,104 | 2,449,104 |
| TOTAL INVESTMENT IN SECURITIES - 100.0% | | | |
| (Cost $9,739,480) | | | 10,354,374 |
| NET OTHER ASSETS (LIABILITIES) - 0.0% | | | (155) |
| NET ASSETS - 100% | | | $10,354,219 |
Legend
(a) Affiliated Fund
(b) The rate quoted is the annualized seven-day yield of the fund at period end.
Affiliated Underlying Funds
Fiscal year to date information regarding the Fund's investments in affiliated Underlying Funds, excluding any Money Market Central Funds, is presented below. Exchanges between classes of the same affiliated Underlying Funds may occur.
| Affiliate | Value, beginning of period | Purchases | Sales Proceeds | Dividend Income | Realized Gain (loss) | Change in Unrealized appreciation (depreciation) | Value, end of period |
| Fidelity Inflation-Protected Bond Index Fund Premium Class | $-- | $530,052 | $-- | $4 | $-- | $-- | $530,052 |
| Fidelity Long-Term Treasury Bond Index Fund Premium Class | 195,344 | 184,466 | 13,059 | 3,228 | (360 ) | (7,034) | 359,357 |
| VIP Contrafund Portfolio Initial Class | 335,492 | 91,724 | 62,862 | 29,552 | (988 ) | (17,426) | 345,940 |
| VIP Emerging Markets Portfolio Initial Class | 441,488 | 126,599 | 55,452 | 250 | 505 | (33,213) | 479,927 |
| VIP Equity-Income Portfolio Initial Class | 353,732 | 93,013 | 58,341 | 16,466 | (1,667 ) | (23,169) | 363,568 |
| VIP Government Money Market Portfolio Initial Class 1.71% | 2,404,539 | 531,539 | 486,974 | 18,102 | -- | -- | 2,449,104 |
| VIP Growth & Income Portfolio Initial Class | 405,682 | 106,014 | 77,408 | 22,676 | (1,044 ) | (19,822) | 413,422 |
| VIP Growth Portfolio Initial Class | 341,649 | 112,578 | 84,972 | 48,988 | 437 | (14,613) | 355,079 |
| VIP High Income Portfolio Initial Class | 184,319 | 38,355 | 14,221 | 1,773 | (89 ) | (2,499) | 205,865 |
| VIP Investment Grade Bond Portfolio Initial Class | 3,307,006 | 748,294 | 439,600 | 35,414 | (8,398 ) | (77,738) | 3,529,564 |
| VIP Mid Cap Portfolio Initial Class | 98,300 | 26,496 | 18,964 | 8,384 | (205) | (5,178) | 100,449 |
| VIP Overseas Portfolio Initial Class | 803,667 | 161,912 | 122,307 | 281 | (257 ) | (16,401) | 826,614 |
| VIP Value Portfolio Initial Class | 259,879 | 59,118 | 43,067 | 9,482 | (724 ) | (9,535) | 265,671 |
| VIP Value Strategies Portfolio Initial Class | 126,922 | 28,028 | 20,269 | 4,139 | (446 ) | (4,473) | 129,762 |
| Total | $9,258,019 | $2,838,188 | $1,497,496 | $198,739 | $(13,236 ) | $(231,101) | $10,354,374 |
Amounts in the income column in the above table include any capital gain distributions from underlying funds, which are presented in the corresponding line-item in the Statement of Operations if applicable.
Investment Valuation
All investments are categorized as Level 1 under the Fair Value Hierarchy. The inputs or methodology used for valuing securities may not be an indication of the risk associated with investing in those securities. For more information on valuation inputs please refer to the Investment Valuation section in the accompanying Notes to Financial Statements.
See accompanying notes which are an integral part of the financial statements.
VIP Freedom 2005 Portfolio℠
Financial Statements
Statement of Assets and Liabilities
| | | June 30, 2018 (Unaudited) |
| Assets | | |
Investment in securities, at value — See accompanying schedule:
| | |
| Affiliated issuers (cost $9,739,480) | $10,354,374 | |
| Total Investment in Securities (cost $9,739,480) | | $10,354,374 |
| Cash | | 3 |
| Receivable for investments sold | | 643,012 |
| Receivable for fund shares sold | | 58 |
| Total assets | | 10,997,447 |
| Liabilities | | |
| Payable for investments purchased | $642,866 | |
| Payable for fund shares redeemed | 188 | |
| Distribution and service plan fees payable | 174 | |
| Total liabilities | | 643,228 |
| Net Assets | | $10,354,219 |
| Net Assets consist of: | | |
| Paid in capital | | $9,592,798 |
| Undistributed net investment income | | 39,305 |
| Accumulated undistributed net realized gain (loss) on investments | | 107,222 |
| Net unrealized appreciation (depreciation) on investments | | 614,894 |
| Net Assets | | $10,354,219 |
| Initial Class: | | |
| Net Asset Value, offering price and redemption price per share ($8,440,782 ÷ 693,195 shares) | | $12.18 |
| Service Class: | | |
| Net Asset Value, offering price and redemption price per share ($1,801,197 ÷ 147,106 shares) | | $12.24 |
| Service Class 2: | | |
| Net Asset Value, offering price and redemption price per share ($112,240 ÷ 9,246 shares) | | $12.14 |
See accompanying notes which are an integral part of the financial statements.
Statement of Operations
| | | Six months ended June 30, 2018 (Unaudited) |
| Investment Income | | |
| Dividends: | | |
| Affiliated issuers | | $40,940 |
| Expenses | | |
| Distribution and service plan fees | $937 | |
| Independent trustees' fees and expenses | 29 | |
| Total expenses | | 966 |
| Net investment income (loss) | | 39,974 |
| Realized and Unrealized Gain (Loss) | | |
| Net realized gain (loss) on: | | |
| Investment securities: | | |
| Affiliated issuers | (13,236) | |
| Capital gain distributions from underlying funds: | | |
| Affiliated issuers | 157,799 | |
| Total net realized gain (loss) | | 144,563 |
| Change in net unrealized appreciation (depreciation) on: | | |
| Investment securities: | | |
| Affiliated issuers | (231,101) | |
| Total change in net unrealized appreciation (depreciation) | | (231,101) |
| Net gain (loss) | | (86,538) |
| Net increase (decrease) in net assets resulting from operations | | $(46,564) |
See accompanying notes which are an integral part of the financial statements.
Statement of Changes in Net Assets
| | Six months ended June 30, 2018 (Unaudited) | Year ended December 31, 2017 |
| Increase (Decrease) in Net Assets | | |
| Operations | | |
| Net investment income (loss) | $39,974 | $134,097 |
| Net realized gain (loss) | 144,563 | 181,413 |
| Change in net unrealized appreciation (depreciation) | (231,101) | 520,533 |
| Net increase (decrease) in net assets resulting from operations | (46,564) | 836,043 |
| Distributions to shareholders from net investment income | (2,366) | (132,399) |
| Distributions to shareholders from net realized gain | (124,617) | (127,656) |
| Total distributions | (126,983) | (260,055) |
| Share transactions - net increase (decrease) | 1,269,682 | 1,678,577 |
| Total increase (decrease) in net assets | 1,096,135 | 2,254,565 |
| Net Assets | | |
| Beginning of period | 9,258,084 | 7,003,519 |
| End of period | $10,354,219 | $9,258,084 |
| Other Information | | |
| Undistributed net investment income end of period | $39,305 | $1,697 |
See accompanying notes which are an integral part of the financial statements.
Financial Highlights
VIP Freedom 2005 Portfolio Initial Class
| | Six months ended (Unaudited) June 30, | Years endedDecember 31, | | | | |
| | 2018 | 2017 | 2016 | 2015 | 2014 | 2013 |
| Selected Per–Share Data | | | | | | |
| Net asset value, beginning of period | $12.39 | $11.51 | $11.29 | $11.56 | $11.37 | $10.56 |
| Income from Investment Operations | | | | | | |
| Net investment income (loss)A | .05 | .20 | .17 | .19 | .20 | .17 |
| Net realized and unrealized gain (loss) | (.10) | 1.06 | .38 | (.22) | .29 | .86 |
| Total from investment operations | (.05) | 1.26 | .55 | (.03) | .49 | 1.03 |
| Distributions from net investment income | –B | (.19) | (.18) | (.22) | (.19) | (.18) |
| Distributions from net realized gain | (.16) | (.19) | (.15) | (.03) | (.11) | (.04) |
| Total distributions | (.16) | (.38) | (.33) | (.24)C | (.30) | (.22) |
| Net asset value, end of period | $12.18 | $12.39 | $11.51 | $11.29 | $11.56 | $11.37 |
| Total ReturnD,E,F | (.40)% | 11.06% | 5.00% | (.25)% | 4.30% | 9.74% |
| Ratios to Average Net AssetsG,H | | | | | | |
| Expenses before reductionsI | - %J | -% | -% | -% | -% | -% |
| Expenses net of fee waivers, if any | - %I,J | -% | -% | -% | -% | -% |
| Expenses net of all reductions | - %I,J | -% | -% | -% | -% | -% |
| Net investment income (loss) | .81%J | 1.65% | 1.50% | 1.64% | 1.71% | 1.57% |
| Supplemental Data | | | | | | |
| Net assets, end of period (000 omitted) | $8,441 | $7,931 | $6,363 | $6,657 | $8,047 | $7,145 |
| Portfolio turnover rateG | 30%J | 33% | 24% | 23% | 21% | 54% |
A Calculated based on average shares outstanding during the period.
B Amount represents less than $.005 per share.
C Total distributions of $.24 per share is comprised of distributions from net investment income of $.217 and distributions from net realized gain of $.025 per share.
D Total returns for periods of less than one year are not annualized.
E Total returns do not reflect charges attributable to your insurance company's separate account. Inclusion of these charges would reduce the total returns shown.
F Total returns would have been lower if certain expenses had not been reduced during the applicable periods shown.
G Amounts do not include the activity of the Underlying Funds.
H Expense ratios reflect operating expenses of the class. Expenses before reductions do not reflect amounts reimbursed by the investment adviser or reductions from expense offset arrangements and do not represent the amount paid by the class during periods when reimbursements or reductions occur. Expenses net of fee waivers reflect expenses after reimbursement by the investment adviser but prior to reductions from expense offset arrangements. Expenses net of all reductions represent the net expenses paid by the class but do not include expenses of the underlying funds in which the Fund invests.
I Amount represents less than .005%.
J Annualized
See accompanying notes which are an integral part of the financial statements.
VIP Freedom 2005 Portfolio Service Class
| | Six months ended (Unaudited) June 30, | Years endedDecember 31, | | | | |
| | 2018 | 2017 | 2016 | 2015 | 2014 | 2013 |
| Selected Per–Share Data | | | | | | |
| Net asset value, beginning of period | $12.46 | $11.58 | $11.36 | $11.63 | $11.44 | $10.57 |
| Income from Investment Operations | | | | | | |
| Net investment income (loss)A | .04 | .19 | .16 | .18 | .19 | .16 |
| Net realized and unrealized gain (loss) | (.10) | 1.06 | .38 | (.22) | .29 | .85 |
| Total from investment operations | (.06) | 1.25 | .54 | (.04) | .48 | 1.01 |
| Distributions from net investment income | –B | (.18) | (.17) | (.21) | (.18) | (.11) |
| Distributions from net realized gain | (.16) | (.19) | (.15) | (.03) | (.11) | (.04) |
| Total distributions | (.16) | (.37) | (.32) | (.23)C | (.29) | (.14)D |
| Net asset value, end of period | $12.24 | $12.46 | $11.58 | $11.36 | $11.63 | $11.44 |
| Total ReturnE,F,G | (.48)% | 10.90% | 4.89% | (.35)% | 4.18% | 9.60% |
| Ratios to Average Net AssetsH,I | | | | | | |
| Expenses before reductions | .10%J | .10% | .10% | .10% | .10% | .10% |
| Expenses net of fee waivers, if any | .10%J | .10% | .10% | .10% | .10% | .10% |
| Expenses net of all reductions | .10%J | .10% | .10% | .10% | .10% | .10% |
| Net investment income (loss) | .71%J | 1.55% | 1.40% | 1.54% | 1.61% | 1.47% |
| Supplemental Data | | | | | | |
| Net assets, end of period (000 omitted) | $1,801 | $1,222 | $558 | $484 | $408 | $125 |
| Portfolio turnover rateH | 30%J | 33% | 24% | 23% | 21% | 54% |
A Calculated based on average shares outstanding during the period.
B Amount represents less than $.005 per share.
C Total distributions of $.23 per share is comprised of distributions from net investment income of $.206 and distributions from net realized gain of $.025 per share.
D Total distributions of $.14 per share is comprised of distributions from net investment income of $.107 and distributions from net realized gain of $.037 per share.
E Total returns for periods of less than one year are not annualized.
F Total returns do not reflect charges attributable to your insurance company's separate account. Inclusion of these charges would reduce the total returns shown.
G Total returns would have been lower if certain expenses had not been reduced during the applicable periods shown.
H Amounts do not include the activity of the Underlying Funds.
I Expense ratios reflect operating expenses of the class. Expenses before reductions do not reflect amounts reimbursed by the investment adviser or reductions from expense offset arrangements and do not represent the amount paid by the class during periods when reimbursements or reductions occur. Expenses net of fee waivers reflect expenses after reimbursement by the investment adviser but prior to reductions from expense offset arrangements. Expenses net of all reductions represent the net expenses paid by the class but do not include expenses of the underlying funds in which the Fund invests.
J Annualized
See accompanying notes which are an integral part of the financial statements.
VIP Freedom 2005 Portfolio Service Class 2
| | Six months ended (Unaudited) June 30, | Years endedDecember 31, | | | | |
| | 2018 | 2017 | 2016 | 2015 | 2014 | 2013 |
| Selected Per–Share Data | | | | | | |
| Net asset value, beginning of period | $12.37 | $11.50 | $11.28 | $11.55 | $11.36 | $10.55 |
| Income from Investment Operations | | | | | | |
| Net investment income (loss)A | .03 | .17 | .14 | .16 | .17 | .15 |
| Net realized and unrealized gain (loss) | (.10) | 1.05 | .39 | (.21) | .29 | .85 |
| Total from investment operations | (.07) | 1.22 | .53 | (.05) | .46 | 1.00 |
| Distributions from net investment income | –B | (.16) | (.15) | (.19) | (.16) | (.15) |
| Distributions from net realized gain | (.16) | (.19) | (.15) | (.03) | (.11) | (.04) |
| Total distributions | (.16) | (.35) | (.31)C | (.22) | (.27) | (.19) |
| Net asset value, end of period | $12.14 | $12.37 | $11.50 | $11.28 | $11.55 | $11.36 |
| Total ReturnD,E,F | (.56)% | 10.74% | 4.78% | (.49)% | 4.04% | 9.46% |
| Ratios to Average Net AssetsG,H | | | | | | |
| Expenses before reductions | .25%I | .25% | .25% | .25% | .25% | .25% |
| Expenses net of fee waivers, if any | .25%I | .25% | .25% | .25% | .25% | .25% |
| Expenses net of all reductions | .25%I | .25% | .25% | .25% | .25% | .25% |
| Net investment income (loss) | .56%I | 1.40% | 1.25% | 1.39% | 1.46% | 1.31% |
| Supplemental Data | | | | | | |
| Net assets, end of period (000 omitted) | $112 | $104 | $83 | $92 | $79 | $102 |
| Portfolio turnover rateG | 30%I | 33% | 24% | 23% | 21% | 54% |
A Calculated based on average shares outstanding during the period.
B Amount represents less than $.005 per share.
C Total distributions of $.31 per share is comprised of distributions from net investment income of $.152 and distributions from net realized gain of $.153 per share.
D Total returns for periods of less than one year are not annualized.
E Total returns do not reflect charges attributable to your insurance company's separate account. Inclusion of these charges would reduce the total returns shown.
F Total returns would have been lower if certain expenses had not been reduced during the applicable periods shown.
G Amounts do not include the activity of the Underlying Funds.
H Expense ratios reflect operating expenses of the class. Expenses before reductions do not reflect amounts reimbursed by the investment adviser or reductions from expense offset arrangements and do not represent the amount paid by the class during periods when reimbursements or reductions occur. Expenses net of fee waivers reflect expenses after reimbursement by the investment adviser but prior to reductions from expense offset arrangements. Expenses net of all reductions represent the net expenses paid by the class but do not include expenses of the underlying funds in which the Fund invests.
I Annualized
See accompanying notes which are an integral part of the financial statements.
VIP Freedom 2010 Portfolio℠
Investment Summary (Unaudited)
The information in the following tables is based on the direct investments of the Fund.
Top Holdings as of June 30, 2018
| | % of fund's net assets |
| VIP Investment Grade Bond Portfolio Initial Class | 30.6 |
| VIP Government Money Market Portfolio Initial Class 1.71% | 18.5 |
| VIP Overseas Portfolio Initial Class | 10.0 |
| VIP Emerging Markets Portfolio Initial Class | 5.5 |
| VIP Growth & Income Portfolio Initial Class | 5.3 |
| VIP Equity-Income Portfolio Initial Class | 4.7 |
| Fidelity Inflation-Protected Bond Index Fund Institutional Premium Class | 4.6 |
| VIP Growth Portfolio Initial Class | 4.5 |
| VIP Contrafund Portfolio Initial Class | 4.4 |
| Fidelity Long-Term Treasury Bond Index Fund Institutional Class | 3.5 |
| | 91.6 |
Asset Allocation (% of fund's net assets)
| Period end |
| | Domestic Equity Funds | 25.3% |
| | International Equity Funds | 15.5% |
| | Bond Funds | 40.7% |
| | Short-Term Funds | 18.5% |

VIP Freedom 2010 Portfolio℠
Schedule of Investments June 30, 2018 (Unaudited)
Showing Percentage of Net Assets
| Domestic Equity Funds - 25.3% | | | |
| | | Shares | Value |
| VIP Contrafund Portfolio Initial Class (a) | | 376,793 | $13,432,665 |
| VIP Equity-Income Portfolio Initial Class (a) | | 635,056 | 14,117,286 |
| VIP Growth & Income Portfolio Initial Class (a) | | 747,391 | 16,053,956 |
| VIP Growth Portfolio Initial Class (a) | | 197,917 | 13,786,874 |
| VIP Mid Cap Portfolio Initial Class (a) | | 106,602 | 3,900,562 |
| VIP Value Portfolio Initial Class (a) | | 657,523 | 10,316,538 |
| VIP Value Strategies Portfolio Initial Class (a) | | 367,810 | 5,038,996 |
| TOTAL DOMESTIC EQUITY FUNDS | | | |
| (Cost $51,901,162) | | | 76,646,877 |
|
| International Equity Funds - 15.5% | | | |
| VIP Emerging Markets Portfolio Initial Class (a) | | 1,477,168 | 16,854,491 |
| VIP Overseas Portfolio Initial Class (a) | | 1,348,581 | 30,235,181 |
| TOTAL INTERNATIONAL EQUITY FUNDS | | | |
| (Cost $33,741,261) | | | 47,089,672 |
|
| Bond Funds - 40.7% | | | |
| Fidelity Inflation-Protected Bond Index Fund Institutional Premium Class (a) | | 1,413,828 | 13,883,795 |
| Fidelity Long-Term Treasury Bond Index Fund Institutional Class (a) | | 832,294 | 10,570,130 |
| VIP High Income Portfolio Initial Class (a) | | 1,118,670 | 6,018,447 |
| VIP Investment Grade Bond Portfolio Initial Class (a) | | 7,431,468 | 92,744,715 |
| TOTAL BOND FUNDS | | | |
| (Cost $124,648,655) | | | 123,217,087 |
|
| Short-Term Funds - 18.5% | | | |
| VIP Government Money Market Portfolio Initial Class 1.71% (a)(b) | | | |
| (Cost $55,953,098) | | 55,953,098 | 55,953,098 |
| TOTAL INVESTMENT IN SECURITIES - 100.0% | | | |
| (Cost $266,244,176) | | | 302,906,734 |
| NET OTHER ASSETS (LIABILITIES) - 0.0% | | | (54,395) |
| NET ASSETS - 100% | | | $302,852,339 |
Legend
(a) Affiliated Fund
(b) The rate quoted is the annualized seven-day yield of the fund at period end.
Affiliated Underlying Funds
Fiscal year to date information regarding the Fund's investments in affiliated Underlying Funds, excluding any Money Market Central Funds, is presented below. Exchanges between classes of the same affiliated Underlying Funds may occur.
| Affiliate | Value, beginning of period | Purchases | Sales Proceeds | Dividend Income | Realized Gain (loss) | Change in Unrealized appreciation (depreciation) | Value, end of period |
| Fidelity Inflation-Protected Bond Index Fund Institutional Premium Class | $-- | $13,883,795 | $-- | $125 | $-- | $-- | $13,883,795 |
| Fidelity Long-Term Treasury Bond Index Fund Institutional Class | 6,748,543 | 4,475,855 | 403,308 | 103,392 | (5,324 ) | (245,636) | 10,570,130 |
| VIP Contrafund Portfolio Initial Class | 14,831,156 | 1,611,545 | 2,279,308 | 1,233,080 | 294,830 | (1,025,558) | 13,432,665 |
| VIP Emerging Markets Portfolio Initial Class | 17,944,758 | 2,300,184 | 2,306,119 | 9,534 | 432,731 | (1,517,063) | 16,854,491 |
| VIP Equity-Income Portfolio Initial Class | 15,636,506 | 1,599,183 | 2,112,230 | 689,509 | 49,570 | (1,055,743) | 14,117,286 |
| VIP Government Money Market Portfolio Initial Class 1.71% | 64,233,154 | 4,235,093 | 12,515,149 | 436,430 | -- | -- | 55,953,098 |
| VIP Growth & Income Portfolio Initial Class | 17,936,671 | 1,744,160 | 2,781,100 | 948,352 | 410,121 | (1,255,896) | 16,053,956 |
| VIP Growth Portfolio Initial Class | 15,102,658 | 2,429,465 | 3,170,313 | 2,042,168 | 734,950 | (1,309,886) | 13,786,874 |
| VIP High Income Portfolio Initial Class | 6,276,464 | 322,578 | 499,417 | 56,956 | (21,176 ) | (60,002) | 6,018,447 |
| VIP Investment Grade Bond Portfolio Initial Class | 101,851,657 | 7,812,514 | 14,311,374 | 1,036,921 | (306,355 ) | (2,301,727) | 92,744,715 |
| VIP Mid Cap Portfolio Initial Class | 4,345,428 | 462,252 | 690,005 | 351,976 | 66,197 | (283,310) | 3,900,562 |
| VIP Overseas Portfolio Initial Class | 33,672,209 | 1,462,092 | 4,361,786 | 11,158 | 539,227 | (1,076,561) | 30,235,181 |
| VIP Value Portfolio Initial Class | 11,487,777 | 782,684 | 1,532,041 | 397,989 | 126,213 | (548,095) | 10,316,538 |
| VIP Value Strategies Portfolio Initial Class | 5,610,145 | 357,671 | 720,399 | 173,305 | 14,881 | (223,302) | 5,038,996 |
| Total | $315,677,126 | $43,479,071 | $47,682,549 | $7,490,895 | $2,335,865 | $(10,902,779) | $302,906,734 |
Amounts in the income column in the above table include any capital gain distributions from underlying funds, which are presented in the corresponding line-item in the Statement of Operations if applicable.
Investment Valuation
All investments are categorized as Level 1 under the Fair Value Hierarchy. The inputs or methodology used for valuing securities may not be an indication of the risk associated with investing in those securities. For more information on valuation inputs please refer to the Investment Valuation section in the accompanying Notes to Financial Statements.
See accompanying notes which are an integral part of the financial statements.
VIP Freedom 2010 Portfolio℠
Financial Statements
Statement of Assets and Liabilities
| | | June 30, 2018 (Unaudited) |
| Assets | | |
Investment in securities, at value — See accompanying schedule:
| | |
| Affiliated issuers (cost $266,244,176) | $302,906,734 | |
| Total Investment in Securities (cost $266,244,176) | | $302,906,734 |
| Cash | | 4 |
| Receivable for investments sold | | 17,351,862 |
| Receivable for fund shares sold | | 1,920 |
| Total assets | | 320,260,520 |
| Liabilities | | |
| Payable for investments purchased | $16,923,376 | |
| Payable for fund shares redeemed | 427,893 | |
| Distribution and service plan fees payable | 56,912 | |
| Total liabilities | | 17,408,181 |
| Net Assets | | $302,852,339 |
| Net Assets consist of: | | |
| Paid in capital | | $257,585,190 |
| Undistributed net investment income | | 807,283 |
| Accumulated undistributed net realized gain (loss) on investments | | 7,797,308 |
| Net unrealized appreciation (depreciation) on investments | | 36,662,558 |
| Net Assets | | $302,852,339 |
| Initial Class: | | |
| Net Asset Value, offering price and redemption price per share ($17,308,845 ÷ 1,327,570 shares) | | $13.04 |
| Service Class: | | |
| Net Asset Value, offering price and redemption price per share ($25,049,860 ÷ 1,924,930 shares) | | $13.01 |
| Service Class 2: | | |
| Net Asset Value, offering price and redemption price per share ($260,493,634 ÷ 20,133,599 shares) | | $12.94 |
See accompanying notes which are an integral part of the financial statements.
Statement of Operations
| | | Six months ended June 30, 2018 (Unaudited) |
| Investment Income | | |
| Dividends: | | |
| Affiliated issuers | | $1,169,010 |
| Expenses | | |
| Distribution and service plan fees | $345,181 | |
| Independent trustees' fees and expenses | 961 | |
| Total expenses | | 346,142 |
| Net investment income (loss) | | 822,868 |
| Realized and Unrealized Gain (Loss) | | |
| Net realized gain (loss) on: | | |
| Investment securities: | | |
| Affiliated issuers | 2,335,865 | |
| Capital gain distributions from underlying funds: | | |
| Affiliated issuers | 6,321,885 | |
| Total net realized gain (loss) | | 8,657,750 |
| Change in net unrealized appreciation (depreciation) on: | | |
| Investment securities: | | |
| Affiliated issuers | (10,902,779) | |
| Total change in net unrealized appreciation (depreciation) | | (10,902,779) |
| Net gain (loss) | | (2,245,029) |
| Net increase (decrease) in net assets resulting from operations | | $(1,422,161) |
See accompanying notes which are an integral part of the financial statements.
Statement of Changes in Net Assets
| | Six months ended June 30, 2018 (Unaudited) | Year ended December 31, 2017 |
| Increase (Decrease) in Net Assets | | |
| Operations | | |
| Net investment income (loss) | $822,868 | $4,119,804 |
| Net realized gain (loss) | 8,657,750 | 10,286,083 |
| Change in net unrealized appreciation (depreciation) | (10,902,779) | 22,636,461 |
| Net increase (decrease) in net assets resulting from operations | (1,422,161) | 37,042,348 |
| Distributions to shareholders from net investment income | (70,697) | (4,061,300) |
| Distributions to shareholders from net realized gain | (8,059,529) | (6,289,111) |
| Total distributions | (8,130,226) | (10,350,411) |
| Share transactions - net increase (decrease) | (3,218,149) | (7,792,831) |
| Total increase (decrease) in net assets | (12,770,536) | 18,899,106 |
| Net Assets | | |
| Beginning of period | 315,622,875 | 296,723,769 |
| End of period | $302,852,339 | $315,622,875 |
| Other Information | | |
| Undistributed net investment income end of period | $807,283 | $55,112 |
See accompanying notes which are an integral part of the financial statements.
Financial Highlights
VIP Freedom 2010 Portfolio Initial Class
| | Six months ended (Unaudited) June 30, | Years endedDecember 31, | | | | |
| | 2018 | 2017 | 2016 | 2015 | 2014 | 2013 |
| Selected Per–Share Data | | | | | | |
| Net asset value, beginning of period | $13.43 | $12.31 | $12.15 | $12.45 | $12.30 | $11.15 |
| Income from Investment Operations | | | | | | |
| Net investment income (loss)A | .05 | .20 | .18 | .23 | .21 | .22 |
| Net realized and unrealized gain (loss) | (.09) | 1.39 | .45 | (.26) | .34 | 1.27 |
| Total from investment operations | (.04) | 1.59 | .63 | (.03) | .55 | 1.49 |
| Distributions from net investment income | –B | (.21) | (.19) | (.23) | (.21) | (.21) |
| Distributions from net realized gain | (.34) | (.26) | (.28) | (.04) | (.20) | (.14) |
| Total distributions | (.35)C | (.47) | (.47) | (.27) | (.40)D | (.34)E |
| Net asset value, end of period | $13.04 | $13.43 | $12.31 | $12.15 | $12.45 | $12.30 |
| Total ReturnF,G,H | (.35)% | 13.08% | 5.45% | (.29)% | 4.53% | 13.49% |
| Ratios to Average Net AssetsI,J | | | | | | |
| Expenses before reductionsK | - %L | -% | -% | -% | -% | -% |
| Expenses net of fee waivers, if any | - %K,L | -% | -% | -% | -% | -% |
| Expenses net of all reductions | - %K,L | -% | -% | -% | -% | -% |
| Net investment income (loss) | .75%L | 1.56% | 1.51% | 1.84% | 1.67% | 1.83% |
| Supplemental Data | | | | | | |
| Net assets, end of period (000 omitted) | $17,309 | $18,519 | $19,569 | $31,048 | $43,381 | $44,430 |
| Portfolio turnover rateI | 28%L | 22% | 23% | 19% | 19% | 19% |
A Calculated based on average shares outstanding during the period.
B Amount represents less than $.005 per share.
C Total distributions of $.35 per share is comprised of distributions from net investment income of $.003 and distributions from net realized gain of $.342 per share.
D Total distributions of $.40 per share is comprised of distributions from net investment income of $.206 and distributions from net realized gain of $.196 per share.
E Total distributions of $.34 per share is comprised of distributions from net investment income of $.205 and distributions from net realized gain of $.139 per share.
F Total returns for periods of less than one year are not annualized.
G Total returns do not reflect charges attributable to your insurance company's separate account. Inclusion of these charges would reduce the total returns shown.
H Total returns would have been lower if certain expenses had not been reduced during the applicable periods shown.
I Amounts do not include the activity of the Underlying Funds.
J Expense ratios reflect operating expenses of the class. Expenses before reductions do not reflect amounts reimbursed by the investment adviser or reductions from expense offset arrangements and do not represent the amount paid by the class during periods when reimbursements or reductions occur. Expenses net of fee waivers reflect expenses after reimbursement by the investment adviser but prior to reductions from expense offset arrangements. Expenses net of all reductions represent the net expenses paid by the class but do not include expenses of the underlying funds in which the Fund invests.
K Amount represents less than .005%.
L Annualized
See accompanying notes which are an integral part of the financial statements.
VIP Freedom 2010 Portfolio Service Class
| | Six months ended (Unaudited) June 30, | Years endedDecember 31, | | | | |
| | 2018 | 2017 | 2016 | 2015 | 2014 | 2013 |
| Selected Per–Share Data | | | | | | |
| Net asset value, beginning of period | $13.41 | $12.30 | $12.14 | $12.43 | $12.29 | $11.14 |
| Income from Investment Operations | | | | | | |
| Net investment income (loss)A | .04 | .19 | .17 | .22 | .20 | .20 |
| Net realized and unrealized gain (loss) | (.09) | 1.38 | .45 | (.26) | .33 | 1.28 |
| Total from investment operations | (.05) | 1.57 | .62 | (.04) | .53 | 1.48 |
| Distributions from net investment income | –B | (.19) | (.18) | (.22) | (.19) | (.19) |
| Distributions from net realized gain | (.34) | (.26) | (.28) | (.04) | (.20) | (.14) |
| Total distributions | (.35)C | (.46)D | (.46) | (.25)E | (.39) | (.33) |
| Net asset value, end of period | $13.01 | $13.41 | $12.30 | $12.14 | $12.43 | $12.29 |
| Total ReturnF,G,H | (.42)% | 12.90% | 5.36% | (.31)% | 4.35% | 13.39% |
| Ratios to Average Net AssetsI,J | | | | | | |
| Expenses before reductions | .10%K | .10% | .10% | .10% | .10% | .10% |
| Expenses net of fee waivers, if any | .10%K | .10% | .10% | .10% | .10% | .10% |
| Expenses net of all reductions | .10%K | .10% | .10% | .10% | .10% | .10% |
| Net investment income (loss) | .65%K | 1.46% | 1.41% | 1.74% | 1.57% | 1.73% |
| Supplemental Data | | | | | | |
| Net assets, end of period (000 omitted) | $25,050 | $27,597 | $25,360 | $23,770 | $28,049 | $27,143 |
| Portfolio turnover rateI | 28%K | 22% | 23% | 19% | 19% | 19% |
A Calculated based on average shares outstanding during the period.
B Amount represents less than $.005 per share.
C Total distributions of $.35 per share is comprised of distributions from net investment income of $.003 and distributions from net realized gain of $.342 per share.
D Total distributions of $.46 per share is comprised of distributions from net investment income of $.192 and distributions from net realized gain of $.264 per share.
E Total distributions of $.25 per share is comprised of distributions from net investment income of $.217 and distributions from net realized gain of $.036 per share.
F Total returns for periods of less than one year are not annualized.
G Total returns do not reflect charges attributable to your insurance company's separate account. Inclusion of these charges would reduce the total returns shown.
H Total returns would have been lower if certain expenses had not been reduced during the applicable periods shown.
I Amounts do not include the activity of the Underlying Funds.
J Expense ratios reflect operating expenses of the class. Expenses before reductions do not reflect amounts reimbursed by the investment adviser or reductions from expense offset arrangements and do not represent the amount paid by the class during periods when reimbursements or reductions occur. Expenses net of fee waivers reflect expenses after reimbursement by the investment adviser but prior to reductions from expense offset arrangements. Expenses net of all reductions represent the net expenses paid by the class but do not include expenses of the underlying funds in which the Fund invests.
K Annualized
See accompanying notes which are an integral part of the financial statements.
VIP Freedom 2010 Portfolio Service Class 2
| | Six months ended (Unaudited) June 30, | Years endedDecember 31, | | | | |
| | 2018 | 2017 | 2016 | 2015 | 2014 | 2013 |
| Selected Per–Share Data | | | | | | |
| Net asset value, beginning of period | $13.35 | $12.24 | $12.08 | $12.38 | $12.24 | $11.10 |
| Income from Investment Operations | | | | | | |
| Net investment income (loss)A | .03 | .17 | .15 | .20 | .18 | .19 |
| Net realized and unrealized gain (loss) | (.09) | 1.38 | .45 | (.26) | .33 | 1.27 |
| Total from investment operations | (.06) | 1.55 | .60 | (.06) | .51 | 1.46 |
| Distributions from net investment income | –B | (.17) | (.16) | (.20) | (.18) | (.18) |
| Distributions from net realized gain | (.34) | (.26) | (.28) | (.04) | (.20) | (.14) |
| Total distributions | (.35)C | (.44)D | (.44) | (.24) | (.37)E | (.32) |
| Net asset value, end of period | $12.94 | $13.35 | $12.24 | $12.08 | $12.38 | $12.24 |
| Total ReturnF,G,H | (.50)% | 12.80% | 5.23% | (.53)% | 4.21% | 13.20% |
| Ratios to Average Net AssetsI,J | | | | | | |
| Expenses before reductions | .25%K | .25% | .25% | .25% | .25% | .25% |
| Expenses net of fee waivers, if any | .25%K | .25% | .25% | .25% | .25% | .25% |
| Expenses net of all reductions | .25%K | .25% | .25% | .25% | .25% | .25% |
| Net investment income (loss) | .50%K | 1.31% | 1.26% | 1.59% | 1.42% | 1.58% |
| Supplemental Data | | | | | | |
| Net assets, end of period (000 omitted) | $260,494 | $269,507 | $251,795 | $237,969 | $224,300 | $209,377 |
| Portfolio turnover rateI | 28%K | 22% | 23% | 19% | 19% | 19% |
A Calculated based on average shares outstanding during the period.
B Amount represents less than $.005 per share.
C Total distributions of $.35 per share is comprised of distributions from net investment income of $.003 and distributions from net realized gain of $.342 per share.
D Total distributions of $.44 per share is comprised of distributions from net investment income of $.172 and distributions from net realized gain of $.264 per share.
E Total distributions of $.37 per share is comprised of distributions from net investment income of $.175 and distributions from net realized gain of $.196 per share.
F Total returns for periods of less than one year are not annualized.
G Total returns do not reflect charges attributable to your insurance company's separate account. Inclusion of these charges would reduce the total returns shown.
H Total returns would have been lower if certain expenses had not been reduced during the applicable periods shown.
I Amounts do not include the activity of the Underlying Funds.
J Expense ratios reflect operating expenses of the class. Expenses before reductions do not reflect amounts reimbursed by the investment adviser or reductions from expense offset arrangements and do not represent the amount paid by the class during periods when reimbursements or reductions occur. Expenses net of fee waivers reflect expenses after reimbursement by the investment adviser but prior to reductions from expense offset arrangements. Expenses net of all reductions represent the net expenses paid by the class but do not include expenses of the underlying funds in which the Fund invests.
K Annualized
See accompanying notes which are an integral part of the financial statements.
VIP Freedom 2015 Portfolio℠
Investment Summary (Unaudited)
The information in the following tables is based on the direct investments of the Fund.
Top Holdings as of June 30, 2018
| | % of fund's net assets |
| VIP Investment Grade Bond Portfolio Initial Class | 26.9 |
| VIP Government Money Market Portfolio Initial Class 1.71% | 13.7 |
| VIP Overseas Portfolio Initial Class | 12.0 |
| VIP Growth & Income Portfolio Initial Class | 6.6 |
| VIP Emerging Markets Portfolio Initial Class | 6.3 |
| VIP Equity-Income Portfolio Initial Class | 5.8 |
| VIP Growth Portfolio Initial Class | 5.7 |
| VIP Contrafund Portfolio Initial Class | 5.5 |
| VIP Value Portfolio Initial Class | 4.3 |
| Fidelity Inflation-Protected Bond Index Fund Institutional Class | 4.1 |
| | 90.9 |
Asset Allocation (% of fund's net assets)
| Period end |
| | Domestic Equity Funds | 31.6% |
| | International Equity Funds | 18.3% |
| | Bond Funds | 36.4% |
| | Short-Term Funds | 13.7% |

VIP Freedom 2015 Portfolio℠
Schedule of Investments June 30, 2018 (Unaudited)
Showing Percentage of Net Assets
| Domestic Equity Funds - 31.6% | | | |
| | | Shares | Value |
| VIP Contrafund Portfolio Initial Class (a) | | 142,827 | $5,091,794 |
| VIP Equity-Income Portfolio Initial Class (a) | | 240,725 | 5,351,324 |
| VIP Growth & Income Portfolio Initial Class (a) | | 283,316 | 6,085,620 |
| VIP Growth Portfolio Initial Class (a) | | 75,020 | 5,225,919 |
| VIP Mid Cap Portfolio Initial Class (a) | | 40,410 | 1,478,593 |
| VIP Value Portfolio Initial Class (a) | | 249,250 | 3,910,731 |
| VIP Value Strategies Portfolio Initial Class (a) | | 139,429 | 1,910,176 |
| TOTAL DOMESTIC EQUITY FUNDS | | | |
| (Cost $16,727,668) | | | 29,054,157 |
|
| International Equity Funds - 18.3% | | | |
| VIP Emerging Markets Portfolio Initial Class (a) | | 507,031 | 5,785,219 |
| VIP Overseas Portfolio Initial Class (a) | | 491,449 | 11,018,280 |
| TOTAL INTERNATIONAL EQUITY FUNDS | | | |
| (Cost $11,430,868) | | | 16,803,499 |
|
| Bond Funds - 36.4% | | | |
| Fidelity Inflation-Protected Bond Index Fund Institutional Class (a) | | 380,928 | 3,740,715 |
| Fidelity Long-Term Treasury Bond Index Fund Premium Class (a) | | 243,530 | 3,092,835 |
| VIP High Income Portfolio Initial Class (a) | | 338,933 | 1,823,459 |
| VIP Investment Grade Bond Portfolio Initial Class (a) | | 1,982,811 | 24,745,481 |
| TOTAL BOND FUNDS | | | |
| (Cost $33,179,839) | | | 33,402,490 |
|
| Short-Term Funds - 13.7% | | | |
| VIP Government Money Market Portfolio Initial Class 1.71% (a)(b) | | | |
| (Cost $12,571,869) | | 12,571,869 | 12,571,869 |
| TOTAL INVESTMENT IN SECURITIES - 100.0% | | | |
| (Cost $73,910,244) | | | 91,832,015 |
| NET OTHER ASSETS (LIABILITIES) - 0.0% | | | (10,653) |
| NET ASSETS - 100% | | | $91,821,362 |
Legend
(a) Affiliated Fund
(b) The rate quoted is the annualized seven-day yield of the fund at period end.
Affiliated Underlying Funds
Fiscal year to date information regarding the Fund's investments in affiliated Underlying Funds, excluding any Money Market Central Funds, is presented below. Exchanges between classes of the same affiliated Underlying Funds may occur.
| Affiliate | Value, beginning of period | Purchases | Sales Proceeds | Dividend Income | Realized Gain (loss) | Change in Unrealized appreciation (depreciation) | Value, end of period |
| Fidelity Inflation-Protected Bond Index Fund Institutional Class | $-- | $3,740,715 | $-- | $33 | $-- | $-- | $3,740,715 |
| Fidelity Long-Term Treasury Bond Index Fund Premium Class | 2,120,635 | 1,317,869 | 264,682 | 31,127 | (8,546 ) | (72,441) | 3,092,835 |
| VIP Contrafund Portfolio Initial Class | 5,794,662 | 683,097 | 1,093,969 | 482,734 | 126,363 | (418,359) | 5,091,794 |
| VIP Emerging Markets Portfolio Initial Class | 6,382,076 | 814,131 | 1,040,088 | 3,418 | 197,464 | (568,364) | 5,785,219 |
| VIP Equity-Income Portfolio Initial Class | 6,109,403 | 682,250 | 1,046,247 | 268,994 | (26,950 ) | (367,132) | 5,351,324 |
| VIP Government Money Market Portfolio Initial Class 1.71% | 14,959,255 | 1,302,894 | 3,690,280 | 99,504 | -- | -- | 12,571,869 |
| VIP Growth & Income Portfolio Initial Class | 7,008,599 | 740,582 | 1,327,444 | 370,438 | 241,862 | (577,979) | 6,085,620 |
| VIP Growth Portfolio Initial Class | 5,900,626 | 1,005,269 | 1,440,893 | 800,208 | 306,547 | (545,630) | 5,225,919 |
| VIP High Income Portfolio Initial Class | 1,985,779 | 139,867 | 276,173 | 18,031 | (3,630 ) | (22,384) | 1,823,459 |
| VIP Investment Grade Bond Portfolio Initial Class | 28,656,794 | 2,723,292 | 5,901,179 | 288,445 | (100,137 ) | (633,289) | 24,745,481 |
| VIP Mid Cap Portfolio Initial Class | 1,698,024 | 195,320 | 329,053 | 136,964 | 30,808 | (116,506) | 1,478,593 |
| VIP Overseas Portfolio Initial Class | 12,708,972 | 646,688 | 2,139,648 | 4,206 | 233,518 | (431,250) | 11,018,280 |
| VIP Value Portfolio Initial Class | 4,488,546 | 360,150 | 770,694 | 154,900 | 68,752 | (236,023) | 3,910,731 |
| VIP Value Strategies Portfolio Initial Class | 2,192,051 | 161,344 | 359,512 | 67,622 | 5,634 | (89,341) | 1,910,176 |
| Total | $100,005,422 | $14,513,468 | $19,679,862 | $2,726,624 | $1,071,685 | $(4,078,698) | $91,832,015 |
Amounts in the income column in the above table include any capital gain distributions from underlying funds, which are presented in the corresponding line-item in the Statement of Operations if applicable.
Investment Valuation
All investments are categorized as Level 1 under the Fair Value Hierarchy. The inputs or methodology used for valuing securities may not be an indication of the risk associated with investing in those securities. For more information on valuation inputs please refer to the Investment Valuation section in the accompanying Notes to Financial Statements.
See accompanying notes which are an integral part of the financial statements.
VIP Freedom 2015 Portfolio℠
Financial Statements
Statement of Assets and Liabilities
| | | June 30, 2018 (Unaudited) |
| Assets | | |
Investment in securities, at value — See accompanying schedule:
| | |
| Affiliated issuers (cost $73,910,244) | $91,832,015 | |
| Total Investment in Securities (cost $73,910,244) | | $91,832,015 |
| Receivable for investments sold | | 4,786,238 |
| Receivable for fund shares sold | | 2,171 |
| Total assets | | 96,620,424 |
| Liabilities | | |
| Payable to custodian bank | $10 | |
| Payable for investments purchased | 4,589,325 | |
| Payable for fund shares redeemed | 199,003 | |
| Distribution and service plan fees payable | 10,724 | |
| Total liabilities | | 4,799,062 |
| Net Assets | | $91,821,362 |
| Net Assets consist of: | | |
| Paid in capital | | $70,432,402 |
| Undistributed net investment income | | 254,594 |
| Accumulated undistributed net realized gain (loss) on investments | | 3,212,595 |
| Net unrealized appreciation (depreciation) on investments | | 17,921,771 |
| Net Assets | | $91,821,362 |
| Initial Class: | | |
| Net Asset Value, offering price and redemption price per share ($31,854,203 ÷ 2,423,991 shares) | | $13.14 |
| Service Class: | | |
| Net Asset Value, offering price and redemption price per share ($15,178,906 ÷ 1,157,756 shares) | | $13.11 |
| Service Class 2: | | |
| Net Asset Value, offering price and redemption price per share ($44,788,253 ÷ 3,430,122 shares) | | $13.06 |
See accompanying notes which are an integral part of the financial statements.
Statement of Operations
| | | Six months ended June 30, 2018 (Unaudited) |
| Investment Income | | |
| Dividends: | | |
| Affiliated issuers | | $326,516 |
| Expenses | | |
| Distribution and service plan fees | $66,645 | |
| Independent trustees' fees and expenses | 302 | |
| Total expenses before reductions | 66,947 | |
| Expense reductions | (1) | |
| Total expenses after reductions | | 66,946 |
| Net investment income (loss) | | 259,570 |
| Realized and Unrealized Gain (Loss) | | |
| Net realized gain (loss) on: | | |
| Investment securities: | | |
| Affiliated issuers | 1,071,685 | |
| Capital gain distributions from underlying funds: | | |
| Affiliated issuers | 2,400,108 | |
| Total net realized gain (loss) | | 3,471,793 |
| Change in net unrealized appreciation (depreciation) on: | | |
| Investment securities: | | |
| Affiliated issuers | (4,078,698) | |
| Total change in net unrealized appreciation (depreciation) | | (4,078,698) |
| Net gain (loss) | | (606,905) |
| Net increase (decrease) in net assets resulting from operations | | $(347,335) |
See accompanying notes which are an integral part of the financial statements.
Statement of Changes in Net Assets
| | Six months ended June 30, 2018 (Unaudited) | Year ended December 31, 2017 |
| Increase (Decrease) in Net Assets | | |
| Operations | | |
| Net investment income (loss) | $259,570 | $1,369,663 |
| Net realized gain (loss) | 3,471,793 | 4,312,903 |
| Change in net unrealized appreciation (depreciation) | (4,078,698) | 8,280,832 |
| Net increase (decrease) in net assets resulting from operations | (347,335) | 13,963,398 |
| Distributions to shareholders from net investment income | (21,545) | (1,353,095) |
| Distributions to shareholders from net realized gain | (3,540,480) | (2,668,129) |
| Total distributions | (3,562,025) | (4,021,224) |
| Share transactions - net increase (decrease) | (4,263,884) | (7,289,087) |
| Total increase (decrease) in net assets | (8,173,244) | 2,653,087 |
| Net Assets | | |
| Beginning of period | 99,994,606 | 97,341,519 |
| End of period | $91,821,362 | $99,994,606 |
| Other Information | | |
| Undistributed net investment income end of period | $254,594 | $16,569 |
See accompanying notes which are an integral part of the financial statements.
Financial Highlights
VIP Freedom 2015 Portfolio Initial Class
| | Six months ended (Unaudited) June 30, | Years endedDecember 31, | | | | |
| | 2018 | 2017 | 2016 | 2015 | 2014 | 2013 |
| Selected Per–Share Data | | | | | | |
| Net asset value, beginning of period | $13.68 | $12.39 | $12.24 | $12.58 | $12.43 | $11.22 |
| Income from Investment Operations | | | | | | |
| Net investment income (loss)A | .05 | .20 | .18 | .23 | .21 | .21 |
| Net realized and unrealized gain (loss) | (.09) | 1.64 | .50 | (.27) | .37 | 1.39 |
| Total from investment operations | (.04) | 1.84 | .68 | (.04) | .58 | 1.60 |
| Distributions from net investment income | –B | (.21) | (.19) | (.24) | (.21) | (.22) |
| Distributions from net realized gain | (.49) | (.34) | (.34) | (.07) | (.22) | (.18) |
| Total distributions | (.50)C | (.55) | (.53) | (.30)D | (.43) | (.39)E |
| Net asset value, end of period | $13.14 | $13.68 | $12.39 | $12.24 | $12.58 | $12.43 |
| Total ReturnF,G,H | (.35)% | 15.10% | 5.91% | (.33)% | 4.70% | 14.41% |
| Ratios to Average Net AssetsI,J | | | | | | |
| Expenses before reductionsK | - %L | -% | -% | -% | -% | -% |
| Expenses net of fee waivers, if any | - %K,L | -% | -% | -% | -% | -% |
| Expenses net of all reductions | - %K,L | -% | -% | -% | -% | -% |
| Net investment income (loss) | .68%L | 1.51% | 1.46% | 1.82% | 1.68% | 1.79% |
| Supplemental Data | | | | | | |
| Net assets, end of period (000 omitted) | $31,854 | $33,249 | $32,720 | $35,352 | $39,455 | $41,070 |
| Portfolio turnover rateI | 30%L | 27% | 24% | 27% | 29% | 29% |
A Calculated based on average shares outstanding during the period.
B Amount represents less than $.005 per share.
C Total distributions of $.50 per share is comprised of distributions from net investment income of $.003 and distributions from net realized gain of $.493 per share.
D Total distributions of $.30 per share is comprised of distributions from net investment income of $.236 and distributions from net realized gain of $.065 per share.
E Total distributions of $.39 per share is comprised of distributions from net investment income of $.217 and distributions from net realized gain of $.175 per share.
F Total returns for periods of less than one year are not annualized.
G Total returns do not reflect charges attributable to your insurance company's separate account. Inclusion of these charges would reduce the total returns shown.
H Total returns would have been lower if certain expenses had not been reduced during the applicable periods shown.
I Amounts do not include the activity of the Underlying Funds.
J Expense ratios reflect operating expenses of the class. Expenses before reductions do not reflect amounts reimbursed by the investment adviser or reductions from expense offset arrangements and do not represent the amount paid by the class during periods when reimbursements or reductions occur. Expenses net of fee waivers reflect expenses after reimbursement by the investment adviser but prior to reductions from expense offset arrangements. Expenses net of all reductions represent the net expenses paid by the class but do not include expenses of the underlying funds in which the Fund invests.
K Amount represents less than .005%.
L Annualized
See accompanying notes which are an integral part of the financial statements.
VIP Freedom 2015 Portfolio Service Class
| | Six months ended (Unaudited) June 30, | Years endedDecember 31, | | | | |
| | 2018 | 2017 | 2016 | 2015 | 2014 | 2013 |
| Selected Per–Share Data | | | | | | |
| Net asset value, beginning of period | $13.65 | $12.37 | $12.22 | $12.56 | $12.41 | $11.21 |
| Income from Investment Operations | | | | | | |
| Net investment income (loss)A | .04 | .18 | .17 | .22 | .20 | .20 |
| Net realized and unrealized gain (loss) | (.08) | 1.64 | .50 | (.27) | .37 | 1.38 |
| Total from investment operations | (.04) | 1.82 | .67 | (.05) | .57 | 1.58 |
| Distributions from net investment income | –B | (.19) | (.18) | (.22) | (.20) | (.21) |
| Distributions from net realized gain | (.49) | (.34) | (.34) | (.07) | (.22) | (.18) |
| Total distributions | (.50)C | (.54)D | (.52) | (.29) | (.42) | (.38)E |
| Net asset value, end of period | $13.11 | $13.65 | $12.37 | $12.22 | $12.56 | $12.41 |
| Total ReturnF,G,H | (.35)% | 14.93% | 5.81% | (.44)% | 4.63% | 14.24% |
| Ratios to Average Net AssetsI,J | | | | | | |
| Expenses before reductions | .10%K | .10% | .10% | .10% | .10% | .10% |
| Expenses net of fee waivers, if any | .10%K | .10% | .10% | .10% | .10% | .10% |
| Expenses net of all reductions | .10%K | .10% | .10% | .10% | .10% | .10% |
| Net investment income (loss) | .58%K | 1.41% | 1.36% | 1.72% | 1.58% | 1.69% |
| Supplemental Data | | | | | | |
| Net assets, end of period (000 omitted) | $15,179 | $17,058 | $14,384 | $16,378 | $15,842 | $10,762 |
| Portfolio turnover rateI | 30%K | 27% | 24% | 27% | 29% | 29% |
A Calculated based on average shares outstanding during the period.
B Amount represents less than $.005 per share.
C Total distributions of $.50 per share is comprised of distributions from net investment income of $.003 and distributions from net realized gain of $.493 per share.
D Total distributions of $.54 per share is comprised of distributions from net investment income of $.193 and distributions from net realized gain of $.343 per share.
E Total distributions of $.38 per share is comprised of distributions from net investment income of $.207 and distributions from net realized gain of $.175 per share.
F Total returns for periods of less than one year are not annualized.
G Total returns do not reflect charges attributable to your insurance company's separate account. Inclusion of these charges would reduce the total returns shown.
H Total returns would have been lower if certain expenses had not been reduced during the applicable periods shown.
I Amounts do not include the activity of the Underlying Funds.
J Expense ratios reflect operating expenses of the class. Expenses before reductions do not reflect amounts reimbursed by the investment adviser or reductions from expense offset arrangements and do not represent the amount paid by the class during periods when reimbursements or reductions occur. Expenses net of fee waivers reflect expenses after reimbursement by the investment adviser but prior to reductions from expense offset arrangements. Expenses net of all reductions represent the net expenses paid by the class but do not include expenses of the underlying funds in which the Fund invests.
K Annualized
See accompanying notes which are an integral part of the financial statements.
VIP Freedom 2015 Portfolio Service Class 2
| | Six months ended (Unaudited) June 30, | Years endedDecember 31, | | | | |
| | 2018 | 2017 | 2016 | 2015 | 2014 | 2013 |
| Selected Per–Share Data | | | | | | |
| Net asset value, beginning of period | $13.61 | $12.33 | $12.19 | $12.52 | $12.37 | $11.17 |
| Income from Investment Operations | | | | | | |
| Net investment income (loss)A | .03 | .16 | .15 | .20 | .18 | .18 |
| Net realized and unrealized gain (loss) | (.08) | 1.63 | .49 | (.26) | .37 | 1.38 |
| Total from investment operations | (.05) | 1.79 | .64 | (.06) | .55 | 1.56 |
| Distributions from net investment income | –B | (.17) | (.16) | (.20) | (.18) | (.19) |
| Distributions from net realized gain | (.49) | (.34) | (.34) | (.07) | (.22) | (.18) |
| Total distributions | (.50)C | (.51) | (.50) | (.27) | (.40) | (.36)D |
| Net asset value, end of period | $13.06 | $13.61 | $12.33 | $12.19 | $12.52 | $12.37 |
| Total ReturnE,F,G | (.42)% | 14.80% | 5.58% | (.51)% | 4.45% | 14.10% |
| Ratios to Average Net AssetsH,I | | | | | | |
| Expenses before reductions | .25%J | .25% | .25% | .25% | .25% | .25% |
| Expenses net of fee waivers, if any | .25%J | .25% | .25% | .25% | .25% | .25% |
| Expenses net of all reductions | .25%J | .25% | .25% | .25% | .25% | .25% |
| Net investment income (loss) | .43%J | 1.26% | 1.21% | 1.57% | 1.43% | 1.54% |
| Supplemental Data | | | | | | |
| Net assets, end of period (000 omitted) | $44,788 | $49,688 | $50,238 | $57,679 | $63,321 | $62,652 |
| Portfolio turnover rateH | 30%J | 27% | 24% | 27% | 29% | 29% |
A Calculated based on average shares outstanding during the period.
B Amount represents less than $.005 per share.
C Total distributions of $.50 per share is comprised of distributions from net investment income of $.003 and distributions from net realized gain of $.493 per share.
D Total distributions of $.36 per share is comprised of distributions from net investment income of $.186 and distributions from net realized gain of $.175 per share.
E Total returns for periods of less than one year are not annualized.
F Total returns do not reflect charges attributable to your insurance company's separate account. Inclusion of these charges would reduce the total returns shown.
G Total returns would have been lower if certain expenses had not been reduced during the applicable periods shown.
H Amounts do not include the activity of the Underlying Funds.
I Expense ratios reflect operating expenses of the class. Expenses before reductions do not reflect amounts reimbursed by the investment adviser or reductions from expense offset arrangements and do not represent the amount paid by the class during periods when reimbursements or reductions occur. Expenses net of fee waivers reflect expenses after reimbursement by the investment adviser but prior to reductions from expense offset arrangements. Expenses net of all reductions represent the net expenses paid by the class but do not include expenses of the underlying funds in which the Fund invests.
J Annualized
See accompanying notes which are an integral part of the financial statements.
VIP Freedom 2020 Portfolio℠
Investment Summary (Unaudited)
The information in the following tables is based on the direct investments of the Fund.
Top Holdings as of June 30, 2018
| | % of fund's net assets |
| VIP Investment Grade Bond Portfolio Initial Class | 24.1 |
| VIP Overseas Portfolio Initial Class | 13.6 |
| VIP Government Money Market Portfolio Initial Class 1.71% | 9.8 |
| VIP Growth & Income Portfolio Initial Class | 7.7 |
| VIP Emerging Markets Portfolio Initial Class | 6.9 |
| VIP Equity-Income Portfolio Initial Class | 6.8 |
| VIP Growth Portfolio Initial Class | 6.6 |
| VIP Contrafund Portfolio Initial Class | 6.4 |
| VIP Value Portfolio Initial Class | 5.0 |
| Fidelity Inflation-Protected Bond Index Fund Institutional Class | 3.8 |
| | 90.7 |
Asset Allocation (% of fund's net assets)
| Period end |
| | Domestic Equity Funds | 36.8% |
| | International Equity Funds | 20.5% |
| | Bond Funds | 33.0% |
| | Short-Term Funds | 9.8% |
| | Short-Term Investments and Net Other Assets (Liabilities)* | (0.1)% |

* Short-Term Investments and Net Other Assets (Liabilities) are not included in the pie chart
VIP Freedom 2020 Portfolio℠
Schedule of Investments June 30, 2018 (Unaudited)
Showing Percentage of Net Assets
| Domestic Equity Funds - 36.8% | | | |
| | | Shares | Value |
| VIP Contrafund Portfolio Initial Class (a) | | 1,322,016 | $47,129,865 |
| VIP Equity-Income Portfolio Initial Class (a) | | 2,228,167 | 49,532,161 |
| VIP Growth & Income Portfolio Initial Class (a) | | 2,622,457 | 56,330,382 |
| VIP Growth Portfolio Initial Class (a) | | 694,372 | 48,369,986 |
| VIP Mid Cap Portfolio Initial Class (a) | | 374,046 | 13,686,339 |
| VIP Value Portfolio Initial Class (a) | | 2,307,146 | 36,199,128 |
| VIP Value Strategies Portfolio Initial Class (a) | | 1,290,604 | 17,681,280 |
| TOTAL DOMESTIC EQUITY FUNDS | | | |
| (Cost $168,093,663) | | | 268,929,141 |
|
| International Equity Funds - 20.5% | | | |
| VIP Emerging Markets Portfolio Initial Class (a) | | 4,409,040 | 50,307,147 |
| VIP Overseas Portfolio Initial Class (a) | | 4,428,044 | 99,276,755 |
| TOTAL INTERNATIONAL EQUITY FUNDS | | | |
| (Cost $105,546,567) | | | 149,583,902 |
|
| Bond Funds - 33.0% | | | |
| Fidelity Inflation-Protected Bond Index Fund Institutional Class (a) | | 2,810,990 | 27,603,926 |
| Fidelity Long-Term Treasury Bond Index Fund Institutional Class (a) | | 1,793,085 | 22,772,174 |
| VIP High Income Portfolio Initial Class (a) | | 2,696,031 | 14,504,647 |
| VIP Investment Grade Bond Portfolio Initial Class (a) | | 14,090,649 | 175,851,301 |
| TOTAL BOND FUNDS | | | |
| (Cost $244,746,196) | | | 240,732,048 |
|
| Short-Term Funds - 9.8% | | | |
| VIP Government Money Market Portfolio Initial Class 1.71% (a)(b) | | | |
| (Cost $71,586,875) | | 71,586,875 | 71,586,875 |
| TOTAL INVESTMENT IN SECURITIES - 100.1% | | | |
| (Cost $589,973,301) | | | 730,831,966 |
| NET OTHER ASSETS (LIABILITIES) - (0.1)% | | | (535,565) |
| NET ASSETS - 100% | | | $730,296,401 |
Legend
(a) Affiliated Fund
(b) The rate quoted is the annualized seven-day yield of the fund at period end.
Affiliated Central Funds
Information regarding fiscal year to date income earned by the Fund from investments in Fidelity Central Funds is as follows:
| Fund | Income earned |
| Fidelity Cash Central Fund | $5 |
| Total | $5 |
Amounts in the income column in the above table include any capital gain distributions from underlying funds, which are presented in the corresponding line-item in the Statement of Operations if applicable.
Affiliated Underlying Funds
Fiscal year to date information regarding the Fund's investments in affiliated Underlying Funds, excluding any Money Market Central Funds, is presented below. Exchanges between classes of the same affiliated Underlying Funds may occur.
| Affiliate | Value, beginning of period | Purchases | Sales Proceeds | Dividend Income | Realized Gain (loss) | Change in Unrealized appreciation (depreciation) | Value, end of period |
| Fidelity Inflation-Protected Bond Index Fund Institutional Class | $-- | $27,603,926 | $-- | $242 | $-- | $-- | $27,603,926 |
| Fidelity Long-Term Treasury Bond Index Fund Institutional Class | 16,414,453 | 8,313,920 | 1,381,476 | 258,711 | (39,576 ) | (535,147) | 22,772,174 |
| VIP Contrafund Portfolio Initial Class | 51,180,559 | 5,424,175 | 6,824,400 | 4,338,139 | 745,177 | (3,395,646) | 47,129,865 |
| VIP Emerging Markets Portfolio Initial Class | 53,405,909 | 6,906,276 | 6,667,382 | 28,910 | 1,081,017 | (4,418,673) | 50,307,147 |
| VIP Equity-Income Portfolio Initial Class | 53,960,420 | 5,406,004 | 6,235,751 | 2,425,632 | 82,406 | (3,680,918) | 49,532,161 |
| VIP Government Money Market Portfolio Initial Class 1.71% | 83,819,484 | 6,343,200 | 18,575,809 | 571,390 | -- | -- | 71,586,875 |
| VIP Growth & Income Portfolio Initial Class | 61,900,208 | 5,850,857 | 8,367,352 | 3,336,774 | 1,064,105 | (4,117,436) | 56,330,382 |
| VIP Growth Portfolio Initial Class | 52,116,402 | 8,289,322 | 9,910,761 | 7,178,318 | 2,023,263 | (4,148,240) | 48,369,986 |
| VIP High Income Portfolio Initial Class | 15,320,487 | 924,421 | 1,536,537 | 141,285 | (30,266 ) | (173,458) | 14,504,647 |
| VIP Investment Grade Bond Portfolio Initial Class | 200,510,616 | 17,342,469 | 36,795,397 | 2,058,831 | (1,022,066 ) | (4,184,321) | 175,851,301 |
| VIP Mid Cap Portfolio Initial Class | 14,996,962 | 1,555,298 | 2,080,014 | 1,238,893 | 178,832 | (964,739) | 13,686,339 |
| VIP Overseas Portfolio Initial Class | 109,627,518 | 4,045,428 | 12,527,501 | 37,014 | 1,700,955 | (3,569,645) | 99,276,755 |
| VIP Value Portfolio Initial Class | 39,644,129 | 2,640,952 | 4,561,364 | 1,398,400 | 292,740 | (1,817,329) | 36,199,128 |
| VIP Value Strategies Portfolio Initial Class | 19,360,794 | 1,233,242 | 2,165,232 | 608,129 | 20,060 | (767,584) | 17,681,280 |
| Total | $772,257,941 | $101,879,490 | $117,628,976 | $23,620,668 | $6,096,647 | $(31,773,136) | $730,831,966 |
Amounts in the income column in the above table include any capital gain distributions from underlying funds, which are presented in the corresponding line-item in the Statement of Operations if applicable.
Investment Valuation
All investments are categorized as Level 1 under the Fair Value Hierarchy. The inputs or methodology used for valuing securities may not be an indication of the risk associated with investing in those securities. For more information on valuation inputs please refer to the Investment Valuation section in the accompanying Notes to Financial Statements.
See accompanying notes which are an integral part of the financial statements.
VIP Freedom 2020 Portfolio℠
Financial Statements
Statement of Assets and Liabilities
| | | June 30, 2018 (Unaudited) |
| Assets | | |
Investment in securities, at value — See accompanying schedule:
| | |
| Affiliated issuers (cost $589,973,301) | $730,831,966 | |
| Total Investment in Securities (cost $589,973,301) | | $730,831,966 |
| Receivable for investments sold | | 31,689,235 |
| Receivable for fund shares sold | | 225,080 |
| Total assets | | 762,746,281 |
| Liabilities | | |
| Payable to custodian bank | $52 | |
| Payable for investments purchased | 31,556,609 | |
| Payable for fund shares redeemed | 770,676 | |
| Distribution and service plan fees payable | 122,543 | |
| Total liabilities | | 32,449,880 |
| Net Assets | | $730,296,401 |
| Net Assets consist of: | | |
| Paid in capital | | $562,399,657 |
| Undistributed net investment income | | 1,587,799 |
| Accumulated undistributed net realized gain (loss) on investments | | 25,450,280 |
| Net unrealized appreciation (depreciation) on investments | | 140,858,665 |
| Net Assets | | $730,296,401 |
| Initial Class: | | |
| Net Asset Value, offering price and redemption price per share ($72,011,692 ÷ 5,299,263 shares) | | $13.59 |
| Service Class: | | |
| Net Asset Value, offering price and redemption price per share ($135,988,619 ÷ 10,040,988 shares) | | $13.54 |
| Service Class 2: | | |
| Net Asset Value, offering price and redemption price per share ($522,296,090 ÷ 38,722,349 shares) | | $13.49 |
See accompanying notes which are an integral part of the financial statements.
Statement of Operations
| | | Six months ended June 30, 2018 (Unaudited) |
| Investment Income | | |
| Dividends: | | |
| Affiliated issuers | | $2,361,879 |
| Income from Fidelity Central Funds | | 5 |
| Total income | | 2,361,884 |
| Expenses | | |
| Distribution and service plan fees | $750,136 | |
| Independent trustees' fees and expenses | 2,358 | |
| Total expenses before reductions | 752,494 | |
| Expense reductions | (5) | |
| Total expenses after reductions | | 752,489 |
| Net investment income (loss) | | 1,609,395 |
| Realized and Unrealized Gain (Loss) | | |
| Net realized gain (loss) on: | | |
| Investment securities: | | |
| Affiliated issuers | 6,096,647 | |
| Capital gain distributions from underlying funds: | | |
| Affiliated issuers | 21,258,789 | |
| Total net realized gain (loss) | | 27,355,436 |
| Change in net unrealized appreciation (depreciation) on: | | |
| Investment securities: | | |
| Affiliated issuers | (31,773,136) | |
| Total change in net unrealized appreciation (depreciation) | | (31,773,136) |
| Net gain (loss) | | (4,417,700) |
| Net increase (decrease) in net assets resulting from operations | | $(2,808,305) |
See accompanying notes which are an integral part of the financial statements.
Statement of Changes in Net Assets
| | Six months ended June 30, 2018 (Unaudited) | Year ended December 31, 2017 |
| Increase (Decrease) in Net Assets | | |
| Operations | | |
| Net investment income (loss) | $1,609,395 | $9,965,308 |
| Net realized gain (loss) | 27,355,436 | 27,977,499 |
| Change in net unrealized appreciation (depreciation) | (31,773,136) | 74,412,671 |
| Net increase (decrease) in net assets resulting from operations | (2,808,305) | 112,355,478 |
| Distributions to shareholders from net investment income | (55,041) | (9,886,534) |
| Distributions to shareholders from net realized gain | (22,071,233) | (20,593,383) |
| Total distributions | (22,126,274) | (30,479,917) |
| Share transactions - net increase (decrease) | (16,904,756) | (13,668,503) |
| Total increase (decrease) in net assets | (41,839,335) | 68,207,058 |
| Net Assets | | |
| Beginning of period | 772,135,736 | 703,928,678 |
| End of period | $730,296,401 | $772,135,736 |
| Other Information | | |
| Undistributed net investment income end of period | $1,587,799 | $33,445 |
See accompanying notes which are an integral part of the financial statements.
Financial Highlights
VIP Freedom 2020 Portfolio Initial Class
| | Six months ended (Unaudited) June 30, | Years endedDecember 31, | | | | |
| | 2018 | 2017 | 2016 | 2015 | 2014 | 2013 |
| Selected Per–Share Data | | | | | | |
| Net asset value, beginning of period | $14.03 | $12.56 | $12.44 | $12.77 | $12.61 | $11.21 |
| Income from Investment Operations | | | | | | |
| Net investment income (loss)A | .04 | .21 | .18 | .24 | .22 | .22 |
| Net realized and unrealized gain (loss) | (.08) | 1.84 | .53 | (.27) | .38 | 1.56 |
| Total from investment operations | (.04) | 2.05 | .71 | (.03) | .60 | 1.78 |
| Distributions from net investment income | –B | (.21) | (.19) | (.24) | (.22) | (.22) |
| Distributions from net realized gain | (.40) | (.37) | (.39) | (.06) | (.23) | (.16) |
| Total distributions | (.40) | (.58) | (.59)C | (.30) | (.44)D | (.38) |
| Net asset value, end of period | $13.59 | $14.03 | $12.56 | $12.44 | $12.77 | $12.61 |
| Total ReturnE,F,G | (.29)% | 16.62% | 6.12% | (.27)% | 4.82% | 16.01% |
| Ratios to Average Net AssetsH,I | | | | | | |
| Expenses before reductionsJ | - %K | -% | -% | -% | -% | -% |
| Expenses net of fee waivers, if any | - %J,K | -% | -% | -% | -% | -% |
| Expenses net of all reductions | - %J,K | -% | -% | -% | -% | -% |
| Net investment income (loss) | .62%K | 1.54% | 1.50% | 1.84% | 1.70% | 1.84% |
| Supplemental Data | | | | | | |
| Net assets, end of period (000 omitted) | $72,012 | $75,021 | $63,131 | $87,496 | $101,533 | $91,328 |
| Portfolio turnover rateH | 27%K | 21% | 19% | 17% | 15% | 20% |
A Calculated based on average shares outstanding during the period.
B Amount represents less than $.005 per share.
C Total distributions of $.59 per share is comprised of distributions from net investment income of $.193 and distributions from net realized gain of $.393 per share.
D Total distributions of $.44 per share is comprised of distributions from net investment income of $.216 and distributions from net realized gain of $.227 per share.
E Total returns for periods of less than one year are not annualized.
F Total returns do not reflect charges attributable to your insurance company's separate account. Inclusion of these charges would reduce the total returns shown.
G Total returns would have been lower if certain expenses had not been reduced during the applicable periods shown.
H Amounts do not include the activity of the Underlying Funds.
I Expense ratios reflect operating expenses of the class. Expenses before reductions do not reflect amounts reimbursed by the investment adviser or reductions from expense offset arrangements and do not represent the amount paid by the class during periods when reimbursements or reductions occur. Expenses net of fee waivers reflect expenses after reimbursement by the investment adviser but prior to reductions from expense offset arrangements. Expenses net of all reductions represent the net expenses paid by the class but do not include expenses of the underlying funds in which the Fund invests.
J Amount represents less than .005%.
K Annualized
See accompanying notes which are an integral part of the financial statements.
VIP Freedom 2020 Portfolio Service Class
| | Six months ended (Unaudited) June 30, | Years endedDecember 31, | | | | |
| | 2018 | 2017 | 2016 | 2015 | 2014 | 2013 |
| Selected Per–Share Data | | | | | | |
| Net asset value, beginning of period | $13.99 | $12.53 | $12.41 | $12.74 | $12.59 | $11.19 |
| Income from Investment Operations | | | | | | |
| Net investment income (loss)A | .04 | .19 | .17 | .23 | .20 | .21 |
| Net realized and unrealized gain (loss) | (.09) | 1.84 | .53 | (.27) | .38 | 1.56 |
| Total from investment operations | (.05) | 2.03 | .70 | (.04) | .58 | 1.77 |
| Distributions from net investment income | –B | (.20) | (.18) | (.23) | (.21) | (.21) |
| Distributions from net realized gain | (.40) | (.37) | (.39) | (.06) | (.23) | (.16) |
| Total distributions | (.40) | (.57) | (.58)C | (.29) | (.43)D | (.37) |
| Net asset value, end of period | $13.54 | $13.99 | $12.53 | $12.41 | $12.74 | $12.59 |
| Total ReturnE,F,G | (.37)% | 16.47% | 6.04% | (.37)% | 4.66% | 15.95% |
| Ratios to Average Net AssetsH,I | | | | | | |
| Expenses before reductions | .10%J | .10% | .10% | .10% | .10% | .10% |
| Expenses net of fee waivers, if any | .10%J | .10% | .10% | .10% | .10% | .10% |
| Expenses net of all reductions | .10%J | .10% | .10% | .10% | .10% | .10% |
| Net investment income (loss) | .52%J | 1.44% | 1.40% | 1.74% | 1.60% | 1.74% |
| Supplemental Data | | | | | | |
| Net assets, end of period (000 omitted) | $135,989 | $140,686 | $109,279 | $94,022 | $76,679 | $65,867 |
| Portfolio turnover rateH | 27%J | 21% | 19% | 17% | 15% | 20% |
A Calculated based on average shares outstanding during the period.
B Amount represents less than $.005 per share.
C Total distributions of $.58 per share is comprised of distributions from net investment income of $.182 and distributions from net realized gain of $.393 per share.
D Total distributions of $.43 per share is comprised of distributions from net investment income of $.205 and distributions from net realized gain of $.227 per share.
E Total returns for periods of less than one year are not annualized.
F Total returns do not reflect charges attributable to your insurance company's separate account. Inclusion of these charges would reduce the total returns shown.
G Total returns would have been lower if certain expenses had not been reduced during the applicable periods shown.
H Amounts do not include the activity of the Underlying Funds.
I Expense ratios reflect operating expenses of the class. Expenses before reductions do not reflect amounts reimbursed by the investment adviser or reductions from expense offset arrangements and do not represent the amount paid by the class during periods when reimbursements or reductions occur. Expenses net of fee waivers reflect expenses after reimbursement by the investment adviser but prior to reductions from expense offset arrangements. Expenses net of all reductions represent the net expenses paid by the class but do not include expenses of the underlying funds in which the Fund invests.
J Annualized
See accompanying notes which are an integral part of the financial statements.
VIP Freedom 2020 Portfolio Service Class 2
| | Six months ended (Unaudited) June 30, | Years endedDecember 31, | | | | |
| | 2018 | 2017 | 2016 | 2015 | 2014 | 2013 |
| Selected Per–Share Data | | | | | | |
| Net asset value, beginning of period | $13.94 | $12.49 | $12.38 | $12.70 | $12.54 | $11.16 |
| Income from Investment Operations | | | | | | |
| Net investment income (loss)A | .03 | .17 | .15 | .21 | .18 | .19 |
| Net realized and unrealized gain (loss) | (.08) | 1.83 | .51 | (.27) | .39 | 1.54 |
| Total from investment operations | (.05) | 2.00 | .66 | (.06) | .57 | 1.73 |
| Distributions from net investment income | –B | (.17) | (.16) | (.21) | (.18) | (.19) |
| Distributions from net realized gain | (.40) | (.37) | (.39) | (.06) | (.23) | (.16) |
| Total distributions | (.40) | (.55)C | (.55) | (.26)D | (.41) | (.35) |
| Net asset value, end of period | $13.49 | $13.94 | $12.49 | $12.38 | $12.70 | $12.54 |
| Total ReturnE,F,G | (.37)% | 16.26% | 5.80% | (.46)% | 4.60% | 15.63% |
| Ratios to Average Net AssetsH,I | | | | | | |
| Expenses before reductions | .25%J | .25% | .25% | .25% | .25% | .25% |
| Expenses net of fee waivers, if any | .25%J | .25% | .25% | .25% | .25% | .25% |
| Expenses net of all reductions | .25%J | .25% | .25% | .25% | .25% | .25% |
| Net investment income (loss) | .37%J | 1.29% | 1.25% | 1.59% | 1.45% | 1.59% |
| Supplemental Data | | | | | | |
| Net assets, end of period (000 omitted) | $522,296 | $556,429 | $531,518 | $549,528 | $583,496 | $582,722 |
| Portfolio turnover rateH | 27%J | 21% | 19% | 17% | 15% | 20% |
A Calculated based on average shares outstanding during the period.
B Amount represents less than $.005 per share.
C Total distributions of $.55 per share is comprised of distributions from net investment income of $.174 and distributions from net realized gain of $.371 per share.
D Total distributions of $.26 per share is comprised of distributions from net investment income of $.208 and distributions from net realized gain of $.056 per share.
E Total returns for periods of less than one year are not annualized.
F Total returns do not reflect charges attributable to your insurance company's separate account. Inclusion of these charges would reduce the total returns shown.
G Total returns would have been lower if certain expenses had not been reduced during the applicable periods shown.
H Amounts do not include the activity of the Underlying Funds.
I Expense ratios reflect operating expenses of the class. Expenses before reductions do not reflect amounts reimbursed by the investment adviser or reductions from expense offset arrangements and do not represent the amount paid by the class during periods when reimbursements or reductions occur. Expenses net of fee waivers reflect expenses after reimbursement by the investment adviser but prior to reductions from expense offset arrangements. Expenses net of all reductions represent the net expenses paid by the class but do not include expenses of the underlying funds in which the Fund invests.
J Annualized
See accompanying notes which are an integral part of the financial statements.
VIP Freedom 2025 Portfolio℠
Investment Summary (Unaudited)
The information in the following tables is based on the direct investments of the Fund.
Top Holdings as of June 30, 2018
| | % of fund's net assets |
| VIP Investment Grade Bond Portfolio Initial Class | 20.6 |
| VIP Overseas Portfolio Initial Class | 14.9 |
| VIP Growth & Income Portfolio Initial Class | 8.6 |
| VIP Equity-Income Portfolio Initial Class | 7.5 |
| VIP Emerging Markets Portfolio Initial Class | 7.4 |
| VIP Growth Portfolio Initial Class | 7.4 |
| VIP Contrafund Portfolio Initial Class | 7.2 |
| VIP Government Money Market Portfolio Initial Class 1.71% | 7.0 |
| VIP Value Portfolio Initial Class | 5.5 |
| Fidelity Long-Term Treasury Bond Index Fund Institutional Class | 3.6 |
| | 89.7 |
Asset Allocation (% of fund's net assets)
| Period end |
| | Domestic Equity Funds | 41.0% |
| | International Equity Funds | 22.3% |
| | Bond Funds | 29.6% |
| | Short-Term Funds | 7.0% |
| | Net Other Assets (Liabilities) | 0.1% |

VIP Freedom 2025 Portfolio℠
Schedule of Investments June 30, 2018 (Unaudited)
Showing Percentage of Net Assets
| Domestic Equity Funds - 41.0% | | | |
| | | Shares | Value |
| VIP Contrafund Portfolio Initial Class (a) | | 363,137 | $12,945,851 |
| VIP Equity-Income Portfolio Initial Class (a) | | 612,046 | 13,605,790 |
| VIP Growth & Income Portfolio Initial Class (a) | | 720,367 | 15,473,492 |
| VIP Growth Portfolio Initial Class (a) | | 190,730 | 13,286,246 |
| VIP Mid Cap Portfolio Initial Class (a) | | 102,747 | 3,759,511 |
| VIP Value Portfolio Initial Class (a) | | 633,756 | 9,943,637 |
| VIP Value Strategies Portfolio Initial Class (a) | | 354,522 | 4,856,956 |
| TOTAL DOMESTIC EQUITY FUNDS | | | |
| (Cost $57,067,847) | | | 73,871,483 |
|
| International Equity Funds - 22.3% | | | |
| VIP Emerging Markets Portfolio Initial Class (a) | | 1,165,204 | 13,294,980 |
| VIP Overseas Portfolio Initial Class (a) | | 1,198,547 | 26,871,418 |
| TOTAL INTERNATIONAL EQUITY FUNDS | | | |
| (Cost $31,143,380) | | | 40,166,398 |
|
| Bond Funds - 29.6% | | | |
| Fidelity Inflation-Protected Bond Index Fund Institutional Class (a) | | 618,982 | 6,078,403 |
| Fidelity Long-Term Treasury Bond Index Fund Institutional Class (a) | | 513,347 | 6,519,510 |
| VIP High Income Portfolio Initial Class (a) | | 663,709 | 3,570,753 |
| VIP Investment Grade Bond Portfolio Initial Class (a) | | 2,974,196 | 37,117,967 |
| TOTAL BOND FUNDS | | | |
| (Cost $54,001,620) | | | 53,286,633 |
|
| Short-Term Funds - 7.0% | | | |
| VIP Government Money Market Portfolio Initial Class 1.71% (a)(b) | | | |
| (Cost $12,670,137) | | 12,670,137 | 12,670,137 |
| TOTAL INVESTMENT IN SECURITIES - 99.9% | | | |
| (Cost $154,882,984) | | | 179,994,651 |
| NET OTHER ASSETS (LIABILITIES) - 0.1% | | | 91,898 |
| NET ASSETS - 100% | | | $180,086,549 |
Legend
(a) Affiliated Fund
(b) The rate quoted is the annualized seven-day yield of the fund at period end.
Affiliated Underlying Funds
Fiscal year to date information regarding the Fund's investments in affiliated Underlying Funds, excluding any Money Market Central Funds, is presented below. Exchanges between classes of the same affiliated Underlying Funds may occur.
| Affiliate | Value, beginning of period | Purchases | Sales Proceeds | Dividend Income | Realized Gain (loss) | Change in Unrealized appreciation (depreciation) | Value, end of period |
| Fidelity Inflation-Protected Bond Index Fund Institutional Class | $-- | $6,078,403 | $-- | $53 | $-- | $-- | $6,078,403 |
| Fidelity Long-Term Treasury Bond Index Fund Institutional Class | -- | 6,368,673 | 51,600 | 18,861 | (324 ) | 202,761 | 6,519,510 |
| Fidelity Long-Term Treasury Bond Index Fund Premium Class | 3,650,639 | 685,364 | 4,035,283 | 42,284 | (314,111 ) | 13,391 | -- |
| VIP Contrafund Portfolio Initial Class | 12,529,525 | 2,614,817 | 1,537,749 | 1,083,819 | 21,853 | (682,595) | 12,945,851 |
| VIP Emerging Markets Portfolio Initial Class | 12,602,774 | 2,942,670 | 1,367,439 | 6,995 | 116,165 | (999,190) | 13,294,980 |
| VIP Equity-Income Portfolio Initial Class | 13,210,302 | 2,698,539 | 1,408,068 | 603,958 | (1,785 ) | (893,198) | 13,605,790 |
| VIP Government Money Market Portfolio Initial Class 1.71% | 14,325,459 | 2,644,227 | 4,299,549 | 102,193 | -- | -- | 12,670,137 |
| VIP Growth & Income Portfolio Initial Class | 15,154,989 | 2,958,235 | 1,890,034 | 831,726 | 47,572 | (797,270) | 15,473,492 |
| VIP Growth Portfolio Initial Class | 12,758,175 | 3,362,403 | 2,324,602 | 1,796,540 | 162,454 | (672,184) | 13,286,246 |
| VIP High Income Portfolio Initial Class | 3,385,124 | 564,611 | 333,137 | 31,819 | (2,213 ) | (43,632) | 3,570,753 |
| VIP Investment Grade Bond Portfolio Initial Class | 38,578,058 | 7,574,739 | 8,028,198 | 405,393 | (176,853 ) | (829,779) | 37,117,967 |
| VIP Mid Cap Portfolio Initial Class | 3,671,517 | 754,770 | 472,839 | 307,518 | 18,488 | (212,425) | 3,759,511 |
| VIP Overseas Portfolio Initial Class | 26,477,607 | 3,700,795 | 2,799,140 | 9,096 | 51,081 | (558,925) | 26,871,418 |
| VIP Value Portfolio Initial Class | 9,705,542 | 1,652,474 | 1,043,470 | 347,796 | (2,603 ) | (368,306) | 9,943,637 |
| VIP Value Strategies Portfolio Initial Class | 4,739,668 | 774,321 | 477,804 | 151,823 | (8,028 ) | (171,201) | 4,856,956 |
| Total | $170,789,379 | $45,375,041 | $30,068,912 | $5,739,874 | $(88,304 ) | $(6,012,553) | $179,994,651 |
Amounts in the income column in the above table include any capital gain distributions from underlying funds, which are presented in the corresponding line-item in the Statement of Operations if applicable.
Investment Valuation
All investments are categorized as Level 1 under the Fair Value Hierarchy. The inputs or methodology used for valuing securities may not be an indication of the risk associated with investing in those securities. For more information on valuation inputs please refer to the Investment Valuation section in the accompanying Notes to Financial Statements.
See accompanying notes which are an integral part of the financial statements.
VIP Freedom 2025 Portfolio℠
Financial Statements
Statement of Assets and Liabilities
| | | June 30, 2018 (Unaudited) |
| Assets | | |
Investment in securities, at value — See accompanying schedule:
| | |
| Affiliated issuers (cost $154,882,984) | $179,994,651 | |
| Total Investment in Securities (cost $154,882,984) | | $179,994,651 |
| Receivable for investments sold | | 7,756,863 |
| Receivable for fund shares sold | | 169,162 |
| Total assets | | 187,920,676 |
| Liabilities | | |
| Payable to custodian bank | $52 | |
| Payable for investments purchased | 7,375,382 | |
| Payable for fund shares redeemed | 438,413 | |
| Distribution and service plan fees payable | 20,280 | |
| Total liabilities | | 7,834,127 |
| Net Assets | | $180,086,549 |
| Net Assets consist of: | | |
| Paid in capital | | $150,085,457 |
| Undistributed net investment income | | 375,539 |
| Accumulated undistributed net realized gain (loss) on investments | | 4,513,886 |
| Net unrealized appreciation (depreciation) on investments | | 25,111,667 |
| Net Assets | | $180,086,549 |
| Initial Class: | | |
| Net Asset Value, offering price and redemption price per share ($38,005,020 ÷ 2,646,060 shares) | | $14.36 |
| Service Class: | | |
| Net Asset Value, offering price and redemption price per share ($75,390,867 ÷ 5,264,753 shares) | | $14.32 |
| Service Class 2: | | |
| Net Asset Value, offering price and redemption price per share ($66,690,662 ÷ 4,682,761 shares) | | $14.24 |
See accompanying notes which are an integral part of the financial statements.
Statement of Operations
| | | Six months ended June 30, 2018 (Unaudited) |
| Investment Income | | |
| Dividends: | | |
| Affiliated issuers | | $499,621 |
| Expenses | | |
| Distribution and service plan fees | $117,385 | |
| Independent trustees' fees and expenses | 531 | |
| Total expenses before reductions | 117,916 | |
| Expense reductions | (2) | |
| Total expenses after reductions | | 117,914 |
| Net investment income (loss) | | 381,707 |
| Realized and Unrealized Gain (Loss) | | |
| Net realized gain (loss) on: | | |
| Investment securities: | | |
| Affiliated issuers | (88,304) | |
| Capital gain distributions from underlying funds: | | |
| Affiliated issuers | 5,240,253 | |
| Total net realized gain (loss) | | 5,151,949 |
| Change in net unrealized appreciation (depreciation) on: | | |
| Investment securities: | | |
| Affiliated issuers | (6,012,553) | |
| Total change in net unrealized appreciation (depreciation) | | (6,012,553) |
| Net gain (loss) | | (860,604) |
| Net increase (decrease) in net assets resulting from operations | | $(478,897) |
See accompanying notes which are an integral part of the financial statements.
Statement of Changes in Net Assets
| | Six months ended June 30, 2018 (Unaudited) | Year ended December 31, 2017 |
| Increase (Decrease) in Net Assets | | |
| Operations | | |
| Net investment income (loss) | $381,707 | $2,257,138 |
| Net realized gain (loss) | 5,151,949 | 4,502,309 |
| Change in net unrealized appreciation (depreciation) | (6,012,553) | 18,457,939 |
| Net increase (decrease) in net assets resulting from operations | (478,897) | 25,217,386 |
| Distributions to shareholders from net investment income | (23,747) | (2,239,558) |
| Distributions to shareholders from net realized gain | (2,968,375) | (4,161,373) |
| Total distributions | (2,992,122) | (6,400,931) |
| Share transactions - net increase (decrease) | 12,786,585 | 16,381,610 |
| Total increase (decrease) in net assets | 9,315,566 | 35,198,065 |
| Net Assets | | |
| Beginning of period | 170,770,983 | 135,572,918 |
| End of period | $180,086,549 | $170,770,983 |
| Other Information | | |
| Undistributed net investment income end of period | $375,539 | $17,579 |
See accompanying notes which are an integral part of the financial statements.
Financial Highlights
VIP Freedom 2025 Portfolio Initial Class
| | Six months ended (Unaudited) June 30, | Years endedDecember 31, | | | | |
| | 2018 | 2017 | 2016 | 2015 | 2014 | 2013 |
| Selected Per–Share Data | | | | | | |
| Net asset value, beginning of period | $14.64 | $12.95 | $12.82 | $13.16 | $12.99 | $11.20 |
| Income from Investment Operations | | | | | | |
| Net investment income (loss)A | .04 | .22 | .21 | .26 | .24 | .25 |
| Net realized and unrealized gain (loss) | (.07) | 2.06 | .52 | (.28) | .41 | 1.97 |
| Total from investment operations | (.03) | 2.28 | .73 | (.02) | .65 | 2.22 |
| Distributions from net investment income | –B | (.21) | (.20) | (.25) | (.22) | (.23) |
| Distributions from net realized gain | (.25) | (.38) | (.41) | (.07) | (.26) | (.20) |
| Total distributions | (.25) | (.59) | (.60)C | (.32) | (.48) | (.43) |
| Net asset value, end of period | $14.36 | $14.64 | $12.95 | $12.82 | $13.16 | $12.99 |
| Total ReturnD,E,F | (.21)% | 17.89% | 6.18% | (.18)% | 5.06% | 19.95% |
| Ratios to Average Net AssetsG,H | | | | | | |
| Expenses before reductionsI | - %J | -% | -% | -% | -% | -% |
| Expenses net of fee waivers, if any | - %I,J | -% | -% | -% | -% | -% |
| Expenses net of all reductions | - %I,J | -% | -% | -% | -% | -% |
| Net investment income (loss) | .56%J | 1.58% | 1.65% | 1.91% | 1.78% | 2.03% |
| Supplemental Data | | | | | | |
| Net assets, end of period (000 omitted) | $38,005 | $37,773 | $27,359 | $25,152 | $26,137 | $24,548 |
| Portfolio turnover rateH | 34%J | 29% | 24% | 20% | 29% | 30% |
A Calculated based on average shares outstanding during the period.
B Amount represents less than $.005 per share.
C Total distributions of $.60 per share is comprised of distributions from net investment income of $.196 and distributions from net realized gain of $.405 per share.
D Total returns for periods of less than one year are not annualized.
E Total returns do not reflect charges attributable to your insurance company's separate account. Inclusion of these charges would reduce the total returns shown.
F Total returns would have been lower if certain expenses had not been reduced during the applicable periods shown.
G Expense ratios reflect operating expenses of the class. Expenses before reductions do not reflect amounts reimbursed by the investment adviser or reductions from expense offset arrangements and do not represent the amount paid by the class during periods when reimbursements or reductions occur. Expenses net of fee waivers reflect expenses after reimbursement by the investment adviser but prior to reductions from expense offset arrangements. Expenses net of all reductions represent the net expenses paid by the class but do not include expenses of the underlying funds in which the Fund invests.
H Amounts do not include the activity of the Underlying Funds.
I Amount represents less than .005%.
J Annualized
See accompanying notes which are an integral part of the financial statements.
VIP Freedom 2025 Portfolio Service Class
| | Six months ended (Unaudited) June 30, | Years endedDecember 31, | | | | |
| | 2018 | 2017 | 2016 | 2015 | 2014 | 2013 |
| Selected Per–Share Data | | | | | | |
| Net asset value, beginning of period | $14.61 | $12.92 | $12.79 | $13.14 | $12.97 | $11.18 |
| Income from Investment Operations | | | | | | |
| Net investment income (loss)A | .03 | .21 | .20 | .24 | .22 | .23 |
| Net realized and unrealized gain (loss) | (.07) | 2.06 | .52 | (.28) | .42 | 1.98 |
| Total from investment operations | (.04) | 2.27 | .72 | (.04) | .64 | 2.21 |
| Distributions from net investment income | –B | (.20) | (.19) | (.23) | (.21) | (.22) |
| Distributions from net realized gain | (.25) | (.38) | (.41) | (.07) | (.26) | (.20) |
| Total distributions | (.25) | (.58) | (.59)C | (.31)D | (.47) | (.42) |
| Net asset value, end of period | $14.32 | $14.61 | $12.92 | $12.79 | $13.14 | $12.97 |
| Total ReturnE,F,G | (.28)% | 17.84% | 6.11% | (.36)% | 4.98% | 19.89% |
| Ratios to Average Net AssetsH,I | | | | | | |
| Expenses before reductions | .10%J | .10% | .10% | .10% | .10% | .10% |
| Expenses net of fee waivers, if any | .10%J | .10% | .10% | .10% | .10% | .10% |
| Expenses net of all reductions | .10%J | .10% | .10% | .10% | .10% | .10% |
| Net investment income (loss) | .47%J | 1.48% | 1.55% | 1.81% | 1.68% | 1.93% |
| Supplemental Data | | | | | | |
| Net assets, end of period (000 omitted) | $75,391 | $69,430 | $48,319 | $36,677 | $30,291 | $21,780 |
| Portfolio turnover rateI | 34%J | 29% | 24% | 20% | 29% | 30% |
A Calculated based on average shares outstanding during the period.
B Amount represents less than $.005 per share.
C Total distributions of $.59 per share is comprised of distributions from net investment income of $.185 and distributions from net realized gain of $.405 per share.
D Total distributions of $.31 per share is comprised of distributions from net investment income of $.234 and distributions from net realized gain of $.072 per share.
E Total returns for periods of less than one year are not annualized.
F Total returns do not reflect charges attributable to your insurance company's separate account. Inclusion of these charges would reduce the total returns shown.
G Total returns would have been lower if certain expenses had not been reduced during the applicable periods shown.
H Expense ratios reflect operating expenses of the class. Expenses before reductions do not reflect amounts reimbursed by the investment adviser or reductions from expense offset arrangements and do not represent the amount paid by the class during periods when reimbursements or reductions occur. Expenses net of fee waivers reflect expenses after reimbursement by the investment adviser but prior to reductions from expense offset arrangements. Expenses net of all reductions represent the net expenses paid by the class but do not include expenses of the underlying funds in which the Fund invests.
I Amounts do not include the activity of the Underlying Funds.
J Annualized
See accompanying notes which are an integral part of the financial statements.
VIP Freedom 2025 Portfolio Service Class 2
| | Six months ended (Unaudited) June 30, | Years endedDecember 31, | | | | |
| | 2018 | 2017 | 2016 | 2015 | 2014 | 2013 |
| Selected Per–Share Data | | | | | | |
| Net asset value, beginning of period | $14.54 | $12.87 | $12.74 | $13.09 | $12.92 | $11.14 |
| Income from Investment Operations | | | | | | |
| Net investment income (loss)A | .02 | .18 | .18 | .22 | .20 | .22 |
| Net realized and unrealized gain (loss) | (.07) | 2.04 | .52 | (.28) | .42 | 1.96 |
| Total from investment operations | (.05) | 2.22 | .70 | (.06) | .62 | 2.18 |
| Distributions from net investment income | –B | (.18) | (.17) | (.22) | (.19) | (.20) |
| Distributions from net realized gain | (.25) | (.38) | (.41) | (.07) | (.26) | (.20) |
| Total distributions | (.25) | (.55)C | (.57)D | (.29) | (.45) | (.40) |
| Net asset value, end of period | $14.24 | $14.54 | $12.87 | $12.74 | $13.09 | $12.92 |
| Total ReturnE,F,G | (.35)% | 17.57% | 5.98% | (.50)% | 4.85% | 19.71% |
| Ratios to Average Net AssetsH,I | | | | | | |
| Expenses before reductions | .25%J | .25% | .25% | .25% | .25% | .25% |
| Expenses net of fee waivers, if any | .25%J | .25% | .25% | .25% | .25% | .25% |
| Expenses net of all reductions | .25%J | .25% | .25% | .25% | .25% | .25% |
| Net investment income (loss) | .32%J | 1.33% | 1.40% | 1.66% | 1.53% | 1.78% |
| Supplemental Data | | | | | | |
| Net assets, end of period (000 omitted) | $66,691 | $63,568 | $59,895 | $52,321 | $49,366 | $46,379 |
| Portfolio turnover rateI | 34%J | 29% | 24% | 20% | 29% | 30% |
A Calculated based on average shares outstanding during the period.
B Amount represents less than $.005 per share.
C Total distributions of $.55 per share is comprised of distributions from net investment income of $.175 and distributions from net realized gain of $.378 per share.
D Total distributions of $.57 per share is comprised of distributions from net investment income of $.166 and distributions from net realized gain of $.405 per share.
E Total returns for periods of less than one year are not annualized.
F Total returns do not reflect charges attributable to your insurance company's separate account. Inclusion of these charges would reduce the total returns shown.
G Total returns would have been lower if certain expenses had not been reduced during the applicable periods shown.
H Expense ratios reflect operating expenses of the class. Expenses before reductions do not reflect amounts reimbursed by the investment adviser or reductions from expense offset arrangements and do not represent the amount paid by the class during periods when reimbursements or reductions occur. Expenses net of fee waivers reflect expenses after reimbursement by the investment adviser but prior to reductions from expense offset arrangements. Expenses net of all reductions represent the net expenses paid by the class but do not include expenses of the underlying funds in which the Fund invests.
I Amounts do not include the activity of the Underlying Funds.
J Annualized
See accompanying notes which are an integral part of the financial statements.
VIP Freedom 2030 Portfolio℠
Investment Summary (Unaudited)
The information in the following tables is based on the direct investments of the Fund.
Top Holdings as of June 30, 2018
| | % of fund's net assets |
| VIP Overseas Portfolio Initial Class | 17.6 |
| VIP Investment Grade Bond Portfolio Initial Class | 15.2 |
| VIP Growth & Income Portfolio Initial Class | 10.4 |
| VIP Equity-Income Portfolio Initial Class | 9.1 |
| VIP Growth Portfolio Initial Class | 8.9 |
| VIP Contrafund Portfolio Initial Class | 8.7 |
| VIP Emerging Markets Portfolio Initial Class | 8.4 |
| VIP Value Portfolio Initial Class | 6.6 |
| Fidelity Long-Term Treasury Bond Index Fund Institutional Class | 3.8 |
| VIP Value Strategies Portfolio Initial Class | 3.2 |
| | 91.9 |
Asset Allocation (% of fund's net assets)
| Period end |
| | Domestic Equity Funds | 49.4% |
| | International Equity Funds | 26.0% |
| | Bond Funds | 23.0% |
| | Short-Term Funds | 1.6% |

VIP Freedom 2030 Portfolio℠
Schedule of Investments June 30, 2018 (Unaudited)
Showing Percentage of Net Assets
| Domestic Equity Funds - 49.4% | | | |
| | | Shares | Value |
| VIP Contrafund Portfolio Initial Class (a) | | 847,779 | $30,223,324 |
| VIP Equity-Income Portfolio Initial Class (a) | | 1,428,883 | 31,764,065 |
| VIP Growth & Income Portfolio Initial Class (a) | | 1,681,796 | 36,124,967 |
| VIP Growth Portfolio Initial Class (a) | | 445,270 | 31,017,515 |
| VIP Mid Cap Portfolio Initial Class (a) | | 239,876 | 8,777,057 |
| VIP Value Portfolio Initial Class (a) | | 1,479,592 | 23,214,794 |
| VIP Value Strategies Portfolio Initial Class (a) | | 827,683 | 11,339,257 |
| TOTAL DOMESTIC EQUITY FUNDS | | | |
| (Cost $130,583,965) | | | 172,460,979 |
|
| International Equity Funds - 26.0% | | | |
| VIP Emerging Markets Portfolio Initial Class (a) | | 2,562,172 | 29,234,380 |
| VIP Overseas Portfolio Initial Class (a) | | 2,734,612 | 61,310,004 |
| TOTAL INTERNATIONAL EQUITY FUNDS | | | |
| (Cost $69,757,554) | | | 90,544,384 |
|
| Bond Funds - 23.0% | | | |
| Fidelity Inflation-Protected Bond Index Fund Premium Class (a) | | 723,930 | 7,108,989 |
| Fidelity Long-Term Treasury Bond Index Fund Institutional Class (a) | | 1,029,331 | 13,072,509 |
| VIP High Income Portfolio Initial Class (a) | | 1,285,201 | 6,914,382 |
| VIP Investment Grade Bond Portfolio Initial Class (a) | | 4,260,937 | 53,176,492 |
| TOTAL BOND FUNDS | | | |
| (Cost $81,573,258) | | | 80,272,372 |
|
| Short-Term Funds - 1.6% | | | |
| VIP Government Money Market Portfolio Initial Class 1.71% (a)(b) | | | |
| (Cost $5,559,631) | | 5,559,631 | 5,559,631 |
| TOTAL INVESTMENT IN SECURITIES - 100.0% | | | |
| (Cost $287,474,408) | | | 348,837,366 |
| NET OTHER ASSETS (LIABILITIES) - 0.0% | | | 10,248 |
| NET ASSETS - 100% | | | $348,847,614 |
Legend
(a) Affiliated Fund
(b) The rate quoted is the annualized seven-day yield of the fund at period end.
Affiliated Central Funds
Information regarding fiscal year to date income earned by the Fund from investments in Fidelity Central Funds is as follows:
| Fund | Income earned |
| Fidelity Cash Central Fund | $9 |
| Total | $9 |
Amounts in the income column in the above table include any capital gain distributions from underlying funds, which are presented in the corresponding line-item in the Statement of Operations if applicable.
Affiliated Underlying Funds
Fiscal year to date information regarding the Fund's investments in affiliated Underlying Funds, excluding any Money Market Central Funds, is presented below. Exchanges between classes of the same affiliated Underlying Funds may occur.
| Affiliate | Value, beginning of period | Purchases | Sales Proceeds | Dividend Income | Realized Gain (loss) | Change in Unrealized appreciation (depreciation) | Value, end of period |
| Fidelity Inflation-Protected Bond Index Fund Premium Class | $-- | $7,108,989 | $-- | $56 | $-- | $-- | $7,108,989 |
| Fidelity Long-Term Treasury Bond Index Fund Institutional Class | 6,931,994 | 6,615,411 | 299,244 | 120,156 | (4,957 ) | (170,695) | 13,072,509 |
| VIP Contrafund Portfolio Initial Class | 29,317,748 | 5,449,988 | 2,942,923 | 2,564,589 | (41,279 ) | (1,560,210) | 30,223,324 |
| VIP Emerging Markets Portfolio Initial Class | 27,716,095 | 5,751,752 | 2,289,140 | 15,521 | 88,581 | (2,032,908) | 29,234,380 |
| VIP Equity-Income Portfolio Initial Class | 30,909,026 | 5,110,452 | 2,092,527 | 1,434,693 | (48,532 ) | (2,114,354) | 31,764,065 |
| VIP Government Money Market Portfolio Initial Class 1.71% | 8,479,638 | 1,265,096 | 4,185,103 | 54,457 | -- | -- | 5,559,631 |
| VIP Growth & Income Portfolio Initial Class | 35,453,755 | 5,927,645 | 3,423,125 | 1,973,110 | (33,494 ) | (1,799,814) | 36,124,967 |
| VIP Growth Portfolio Initial Class | 29,857,823 | 7,201,042 | 4,772,155 | 4,247,895 | 134,384 | (1,403,579) | 31,017,515 |
| VIP High Income Portfolio Initial Class | 6,529,336 | 998,864 | 522,301 | 62,378 | (7,035 ) | (84,482) | 6,914,382 |
| VIP Investment Grade Bond Portfolio Initial Class | 51,771,229 | 12,014,616 | 9,234,859 | 567,970 | (269,363 ) | (1,105,131) | 53,176,492 |
| VIP Mid Cap Portfolio Initial Class | 8,590,580 | 1,571,845 | 911,835 | 731,244 | (3,977 ) | (469,556) | 8,777,057 |
| VIP Overseas Portfolio Initial Class | 60,533,247 | 6,436,253 | 4,456,297 | 21,107 | 10,440 | (1,213,639) | 61,310,004 |
| VIP Value Portfolio Initial Class | 22,709,068 | 3,115,590 | 1,695,605 | 826,900 | (27,337 ) | (886,922) | 23,214,794 |
| VIP Value Strategies Portfolio Initial Class | 11,091,130 | 1,493,583 | 804,378 | 360,174 | (24,309 ) | (416,769) | 11,339,257 |
| Total | $329,890,669 | $70,061,126 | $37,629,492 | $12,980,250 | $(226,878 ) | $(13,258,059) | $348,837,366 |
Amounts in the income column in the above table include any capital gain distributions from underlying funds, which are presented in the corresponding line-item in the Statement of Operations if applicable.
Investment Valuation
All investments are categorized as Level 1 under the Fair Value Hierarchy. The inputs or methodology used for valuing securities may not be an indication of the risk associated with investing in those securities. For more information on valuation inputs please refer to the Investment Valuation section in the accompanying Notes to Financial Statements.
See accompanying notes which are an integral part of the financial statements.
VIP Freedom 2030 Portfolio℠
Financial Statements
Statement of Assets and Liabilities
| | | June 30, 2018 (Unaudited) |
| Assets | | |
Investment in securities, at value — See accompanying schedule:
| | |
| Affiliated issuers (cost $287,474,408) | $348,837,366 | |
| Total Investment in Securities (cost $287,474,408) | | $348,837,366 |
| Receivable for investments sold | | 9,892,671 |
| Receivable for fund shares sold | | 404,548 |
| Total assets | | 359,134,585 |
| Liabilities | | |
| Payable to custodian bank | $25 | |
| Payable for investments purchased | 9,871,710 | |
| Payable for fund shares redeemed | 373,633 | |
| Distribution and service plan fees payable | 41,603 | |
| Total liabilities | | 10,286,971 |
| Net Assets | | $348,847,614 |
| Net Assets consist of: | | |
| Paid in capital | | $277,599,582 |
| Undistributed net investment income | | 544,065 |
| Accumulated undistributed net realized gain (loss) on investments | | 9,341,009 |
| Net unrealized appreciation (depreciation) on investments | | 61,362,958 |
| Net Assets | | $348,847,614 |
| Initial Class: | | |
| Net Asset Value, offering price and redemption price per share ($77,064,996 ÷ 5,369,577 shares) | | $14.35 |
| Service Class: | | |
| Net Asset Value, offering price and redemption price per share ($122,439,429 ÷ 8,551,784 shares) | | $14.32 |
| Service Class 2: | | |
| Net Asset Value, offering price and redemption price per share ($149,343,189 ÷ 10,474,050 shares) | | $14.26 |
See accompanying notes which are an integral part of the financial statements.
Statement of Operations
| | | Six months ended June 30, 2018 (Unaudited) |
| Investment Income | | |
| Dividends: | | |
| Affiliated issuers | | $805,167 |
| Income from Fidelity Central Funds | | 9 |
| Total income | | 805,176 |
| Expenses | | |
| Distribution and service plan fees | $242,277 | |
| Independent trustees' fees and expenses | 1,012 | |
| Total expenses before reductions | 243,289 | |
| Expense reductions | (5) | |
| Total expenses after reductions | | 243,284 |
| Net investment income (loss) | | 561,892 |
| Realized and Unrealized Gain (Loss) | | |
| Net realized gain (loss) on: | | |
| Investment securities: | | |
| Affiliated issuers | (226,878) | |
| Capital gain distributions from underlying funds: | | |
| Affiliated issuers | 12,175,083 | |
| Total net realized gain (loss) | | 11,948,205 |
| Change in net unrealized appreciation (depreciation) on: | | |
| Investment securities: | | |
| Affiliated issuers | (13,258,059) | |
| Total change in net unrealized appreciation (depreciation) | | (13,258,059) |
| Net gain (loss) | | (1,309,854) |
| Net increase (decrease) in net assets resulting from operations | | $(747,962) |
See accompanying notes which are an integral part of the financial statements.
Statement of Changes in Net Assets
| | Six months ended June 30, 2018 (Unaudited) | Year ended December 31, 2017 |
| Increase (Decrease) in Net Assets | | |
| Operations | | |
| Net investment income (loss) | $561,892 | $3,915,464 |
| Net realized gain (loss) | 11,948,205 | 10,046,374 |
| Change in net unrealized appreciation (depreciation) | (13,258,059) | 41,102,303 |
| Net increase (decrease) in net assets resulting from operations | (747,962) | 55,064,141 |
| Distributions to shareholders from net investment income | (46,164) | (3,887,127) |
| Distributions to shareholders from net realized gain | (7,132,298) | (10,287,699) |
| Total distributions | (7,178,462) | (14,174,826) |
| Share transactions - net increase (decrease) | 26,921,319 | 28,000,979 |
| Total increase (decrease) in net assets | 18,994,895 | 68,890,294 |
| Net Assets | | |
| Beginning of period | 329,852,719 | 260,962,425 |
| End of period | $348,847,614 | $329,852,719 |
| Other Information | | |
| Undistributed net investment income end of period | $544,065 | $28,337 |
See accompanying notes which are an integral part of the financial statements.
Financial Highlights
VIP Freedom 2030 Portfolio Initial Class
| | Six months ended (Unaudited) June 30, | Years endedDecember 31, | | | | |
| | 2018 | 2017 | 2016 | 2015 | 2014 | 2013 |
| Selected Per–Share Data | | | | | | |
| Net asset value, beginning of period | $14.67 | $12.75 | $12.68 | $13.01 | $12.84 | $10.88 |
| Income from Investment Operations | | | | | | |
| Net investment income (loss)A | .03 | .20 | .18 | .22 | .22 | .22 |
| Net realized and unrealized gain (loss) | (.04) | 2.41 | .57 | (.25) | .41 | 2.12 |
| Total from investment operations | (.01) | 2.61 | .75 | (.03) | .63 | 2.34 |
| Distributions from net investment income | –B | (.20) | (.19) | (.23) | (.21) | (.21) |
| Distributions from net realized gain | (.31) | (.49) | (.49) | (.07) | (.25) | (.17) |
| Total distributions | (.31) | (.69) | (.68) | (.30) | (.46) | (.38) |
| Net asset value, end of period | $14.35 | $14.67 | $12.75 | $12.68 | $13.01 | $12.84 |
| Total ReturnC,D,E | (.08)% | 20.96% | 6.61% | (.24)% | 4.96% | 21.66% |
| Ratios to Average Net AssetsF,G | | | | | | |
| Expenses before reductionsH | - %I | -% | -% | -% | -% | -% |
| Expenses net of fee waivers, if any | - %H,I | -% | -% | -% | -% | -% |
| Expenses net of all reductions | - %H,I | -% | -% | -% | -% | -% |
| Net investment income (loss) | .47%I | 1.48% | 1.42% | 1.66% | 1.70% | 1.88% |
| Supplemental Data | | | | | | |
| Net assets, end of period (000 omitted) | $77,065 | $74,247 | $57,779 | $68,661 | $72,243 | $64,173 |
| Portfolio turnover rateF | 22%I | 26% | 25% | 26% | 18% | 30% |
A Calculated based on average shares outstanding during the period.
B Amount represents less than $.005 per share.
C Total returns for periods of less than one year are not annualized.
D Total returns do not reflect charges attributable to your insurance company's separate account. Inclusion of these charges would reduce the total returns shown.
E Total returns would have been lower if certain expenses had not been reduced during the applicable periods shown.
F Amounts do not include the activity of the Underlying Funds.
G Expense ratios reflect operating expenses of the class. Expenses before reductions do not reflect amounts reimbursed by the investment adviser or reductions from expense offset arrangements and do not represent the amount paid by the class during periods when reimbursements or reductions occur. Expenses net of fee waivers reflect expenses after reimbursement by the investment adviser but prior to reductions from expense offset arrangements. Expenses net of all reductions represent the net expenses paid by the class but do not include expenses of the underlying funds in which the Fund invests.
H Amount represents less than .005%.
I Annualized
See accompanying notes which are an integral part of the financial statements.
VIP Freedom 2030 Portfolio Service Class
| | Six months ended (Unaudited) June 30, | Years endedDecember 31, | | | | |
| | 2018 | 2017 | 2016 | 2015 | 2014 | 2013 |
| Selected Per–Share Data | | | | | | |
| Net asset value, beginning of period | $14.64 | $12.73 | $12.66 | $12.99 | $12.82 | $10.87 |
| Income from Investment Operations | | | | | | |
| Net investment income (loss)A | .03 | .19 | .16 | .21 | .21 | .21 |
| Net realized and unrealized gain (loss) | (.04) | 2.40 | .58 | (.25) | .41 | 2.11 |
| Total from investment operations | (.01) | 2.59 | .74 | (.04) | .62 | 2.32 |
| Distributions from net investment income | –B | (.19) | (.17) | (.22) | (.19) | (.20) |
| Distributions from net realized gain | (.31) | (.49) | (.49) | (.07) | (.25) | (.17) |
| Total distributions | (.31) | (.68) | (.67)C | (.29) | (.45)D | (.37) |
| Net asset value, end of period | $14.32 | $14.64 | $12.73 | $12.66 | $12.99 | $12.82 |
| Total ReturnE,F,G | (.08)% | 20.82% | 6.52% | (.34)% | 4.86% | 21.50% |
| Ratios to Average Net AssetsH,I | | | | | | |
| Expenses before reductions | .10%J | .10% | .10% | .10% | .10% | .10% |
| Expenses net of fee waivers, if any | .10%J | .10% | .10% | .10% | .10% | .10% |
| Expenses net of all reductions | .10%J | .10% | .10% | .10% | .10% | .10% |
| Net investment income (loss) | .37%J | 1.38% | 1.32% | 1.56% | 1.60% | 1.78% |
| Supplemental Data | | | | | | |
| Net assets, end of period (000 omitted) | $122,439 | $111,029 | $70,501 | $59,096 | $53,484 | $46,868 |
| Portfolio turnover rateH | 22%J | 26% | 25% | 26% | 18% | 30% |
A Calculated based on average shares outstanding during the period.
B Amount represents less than $.005 per share.
C Total distributions of $.67 per share is comprised of distributions from net investment income of $.173 and distributions from net realized gain of $.494 per share.
D Total distributions of $.45 per share is comprised of distributions from net investment income of $.194 and distributions from net realized gain of $.254 per share.
E Total returns for periods of less than one year are not annualized.
F Total returns do not reflect charges attributable to your insurance company's separate account. Inclusion of these charges would reduce the total returns shown.
G Total returns would have been lower if certain expenses had not been reduced during the applicable periods shown.
H Amounts do not include the activity of the Underlying Funds.
I Expense ratios reflect operating expenses of the class. Expenses before reductions do not reflect amounts reimbursed by the investment adviser or reductions from expense offset arrangements and do not represent the amount paid by the class during periods when reimbursements or reductions occur. Expenses net of fee waivers reflect expenses after reimbursement by the investment adviser but prior to reductions from expense offset arrangements. Expenses net of all reductions represent the net expenses paid by the class but do not include expenses of the underlying funds in which the Fund invests.
J Annualized
See accompanying notes which are an integral part of the financial statements.
VIP Freedom 2030 Portfolio Service Class 2
| | Six months ended (Unaudited) June 30, | Years endedDecember 31, | | | | |
| | 2018 | 2017 | 2016 | 2015 | 2014 | 2013 |
| Selected Per–Share Data | | | | | | |
| Net asset value, beginning of period | $14.60 | $12.69 | $12.62 | $12.95 | $12.78 | $10.83 |
| Income from Investment Operations | | | | | | |
| Net investment income (loss)A | .02 | .17 | .14 | .19 | .19 | .19 |
| Net realized and unrealized gain (loss) | (.05) | 2.40 | .58 | (.25) | .41 | 2.11 |
| Total from investment operations | (.03) | 2.57 | .72 | (.06) | .60 | 2.30 |
| Distributions from net investment income | –B | (.16) | (.15) | (.20) | (.18) | (.18) |
| Distributions from net realized gain | (.31) | (.49) | (.49) | (.07) | (.25) | (.17) |
| Total distributions | (.31) | (.66)C | (.65)D | (.27) | (.43) | (.35) |
| Net asset value, end of period | $14.26 | $14.60 | $12.69 | $12.62 | $12.95 | $12.78 |
| Total ReturnE,F,G | (.22)% | 20.69% | 6.37% | (.53)% | 4.74% | 21.41% |
| Ratios to Average Net AssetsH,I | | | | | | |
| Expenses before reductions | .25%J | .25% | .25% | .25% | .25% | .25% |
| Expenses net of fee waivers, if any | .25%J | .25% | .25% | .25% | .25% | .25% |
| Expenses net of all reductions | .25%J | .25% | .25% | .25% | .25% | .25% |
| Net investment income (loss) | .22%J | 1.23% | 1.17% | 1.41% | 1.45% | 1.63% |
| Supplemental Data | | | | | | |
| Net assets, end of period (000 omitted) | $149,343 | $144,577 | $132,682 | $133,978 | $151,268 | $131,930 |
| Portfolio turnover rateH | 22%J | 26% | 25% | 26% | 18% | 30% |
A Calculated based on average shares outstanding during the period.
B Amount represents less than $.005 per share.
C Total distributions of $.66 per share is comprised of distributions from net investment income of $.162 and distributions from net realized gain of $.494 per share.
D Total distributions of $.65 per share is comprised of distributions from net investment income of $.153 and distributions from net realized gain of $.494 per share.
E Total returns for periods of less than one year are not annualized.
F Total returns do not reflect charges attributable to your insurance company's separate account. Inclusion of these charges would reduce the total returns shown.
G Total returns would have been lower if certain expenses had not been reduced during the applicable periods shown.
H Amounts do not include the activity of the Underlying Funds.
I Expense ratios reflect operating expenses of the class. Expenses before reductions do not reflect amounts reimbursed by the investment adviser or reductions from expense offset arrangements and do not represent the amount paid by the class during periods when reimbursements or reductions occur. Expenses net of fee waivers reflect expenses after reimbursement by the investment adviser but prior to reductions from expense offset arrangements. Expenses net of all reductions represent the net expenses paid by the class but do not include expenses of the underlying funds in which the Fund invests.
J Annualized
See accompanying notes which are an integral part of the financial statements.
VIP Freedom 2035 Portfolio℠
Investment Summary (Unaudited)
The information in the following tables is based on the direct investments of the Fund.
Top Holdings as of June 30, 2018
| | % of fund's net assets |
| VIP Overseas Portfolio Initial Class | 20.4 |
| VIP Growth & Income Portfolio Initial Class | 12.2 |
| VIP Equity-Income Portfolio Initial Class | 10.7 |
| VIP Growth Portfolio Initial Class | 10.5 |
| VIP Contrafund Portfolio Initial Class | 10.2 |
| VIP Emerging Markets Portfolio Initial Class | 9.3 |
| VIP Value Portfolio Initial Class | 7.8 |
| VIP Value Strategies Portfolio Initial Class | 3.8 |
| Fidelity Long-Term Treasury Bond Index Fund Premium Class | 3.8 |
| VIP Mid Cap Portfolio Initial Class | 3.0 |
| | 91.7 |
Asset Allocation (% of fund's net assets)
| Period end |
| | Domestic Equity Funds | 58.2% |
| | International Equity Funds | 29.7% |
| | Bond Funds | 10.5% |
| | Short-Term Funds | 1.6% |

VIP Freedom 2035 Portfolio℠
Schedule of Investments June 30, 2018 (Unaudited)
Showing Percentage of Net Assets
| Domestic Equity Funds - 58.2% | | | |
| | | Shares | Value |
| VIP Contrafund Portfolio Initial Class (a) | | 196,295 | $6,997,918 |
| VIP Equity-Income Portfolio Initial Class (a) | | 330,847 | 7,354,723 |
| VIP Growth & Income Portfolio Initial Class (a) | | 389,418 | 8,364,706 |
| VIP Growth Portfolio Initial Class (a) | | 103,095 | 7,181,630 |
| VIP Mid Cap Portfolio Initial Class (a) | | 55,543 | 2,032,316 |
| VIP Value Portfolio Initial Class (a) | | 342,600 | 5,375,398 |
| VIP Value Strategies Portfolio Initial Class (a) | | 191,653 | 2,625,644 |
| TOTAL DOMESTIC EQUITY FUNDS | | | |
| (Cost $37,444,370) | | | 39,932,335 |
|
| International Equity Funds - 29.7% | | | |
| VIP Emerging Markets Portfolio Initial Class (a) | | 562,071 | 6,413,227 |
| VIP Overseas Portfolio Initial Class (a) | | 623,287 | 13,974,095 |
| TOTAL INTERNATIONAL EQUITY FUNDS | | | |
| (Cost $17,740,768) | | | 20,387,322 |
|
| Bond Funds - 10.5% | | | |
| Fidelity Inflation-Protected Bond Index Fund Premium Class (a) | | 141,761 | 1,392,097 |
| Fidelity Long-Term Treasury Bond Index Fund Premium Class (a) | | 202,074 | 2,566,335 |
| VIP High Income Portfolio Initial Class (a) | | 252,438 | 1,358,117 |
| VIP Investment Grade Bond Portfolio Initial Class (a) | | 149,142 | 1,861,289 |
| TOTAL BOND FUNDS | | | |
| (Cost $7,214,123) | | | 7,177,838 |
|
| Short-Term Funds - 1.6% | | | |
| Fidelity Cash Central Fund, 1.93% (b) | | 4 | 4 |
| VIP Government Money Market Portfolio Initial Class 1.71% (a)(c) | | 1,092,001 | 1,092,001 |
| TOTAL SHORT-TERM FUNDS | | | |
| (Cost $1,092,005) | | | 1,092,005 |
| TOTAL INVESTMENT IN SECURITIES - 100.0% | | | |
| (Cost $63,491,266) | | | 68,589,500 |
| NET OTHER ASSETS (LIABILITIES) - 0.0% | | | 17,234 |
| NET ASSETS - 100% | | | $68,606,734 |
Legend
(a) Affiliated Fund
(b) Affiliated fund that is generally available only to investment companies and other accounts managed by Fidelity Investments. The rate quoted is the annualized seven-day yield of the fund at period end. A complete unaudited listing of the fund's holdings as of its most recent quarter end is available upon request. In addition, each Fidelity Central Fund's financial statements are available on the SEC's website or upon request.
(c) The rate quoted is the annualized seven-day yield of the fund at period end.
Affiliated Central Funds
Information regarding fiscal year to date income earned by the Fund from investments in Fidelity Central Funds is as follows:
| Fund | Income earned |
| Fidelity Cash Central Fund | $9 |
| Total | $9 |
Amounts in the income column in the above table include any capital gain distributions from underlying funds, which are presented in the corresponding line-item in the Statement of Operations if applicable.
Affiliated Underlying Funds
Fiscal year to date information regarding the Fund's investments in affiliated Underlying Funds, excluding any Money Market Central Funds, is presented below. Exchanges between classes of the same affiliated Underlying Funds may occur.
| Affiliate | Value, beginning of period | Purchases | Sales Proceeds | Dividend Income | Realized Gain (loss) | Change in Unrealized appreciation (depreciation) | Value, end of period |
| Fidelity Inflation-Protected Bond Index Fund Premium Class | $-- | $1,392,097 | $-- | $11 | $-- | $-- | $1,392,097 |
| Fidelity Long-Term Treasury Bond Index Fund Premium Class | 1,177,241 | 1,478,863 | 63,625 | 21,653 | (1,013 ) | (25,131) | 2,566,335 |
| VIP Contrafund Portfolio Initial Class | 5,802,256 | 2,101,653 | 579,180 | 519,180 | (12,246 ) | (314,565) | 6,997,918 |
| VIP Emerging Markets Portfolio Initial Class | 5,212,454 | 2,029,154 | 405,761 | 3,003 | (972 ) | (421,648) | 6,413,227 |
| VIP Equity-Income Portfolio Initial Class | 6,117,469 | 2,096,191 | 422,460 | 289,337 | (4,750 ) | (431,727) | 7,354,723 |
| VIP Government Money Market Portfolio Initial Class 1.71% | 1,444,288 | 441,158 | 793,445 | 9,818 | -- | -- | 1,092,001 |
| VIP Growth & Income Portfolio Initial Class | 7,016,521 | 2,397,426 | 683,607 | 398,453 | (16,044 ) | (349,590) | 8,364,706 |
| VIP Growth Portfolio Initial Class | 5,909,386 | 2,480,011 | 960,075 | 860,548 | (21,464 ) | (226,228) | 7,181,630 |
| VIP High Income Portfolio Initial Class | 1,112,102 | 372,724 | 110,881 | 10,825 | (1,034 ) | (14,794) | 1,358,117 |
| VIP Investment Grade Bond Portfolio Initial Class | 2,265,710 | 1,371,016 | 1,715,321 | 26,435 | (46,077 ) | (14,039) | 1,861,289 |
| VIP Mid Cap Portfolio Initial Class | 1,700,145 | 608,661 | 180,924 | 147,321 | (3,719 ) | (91,847) | 2,032,316 |
| VIP Overseas Portfolio Initial Class | 11,820,636 | 3,321,744 | 891,368 | 4,198 | (4,202 ) | (272,715) | 13,974,095 |
| VIP Value Portfolio Initial Class | 4,494,560 | 1,439,611 | 378,741 | 166,622 | (6,609 ) | (173,423) | 5,375,398 |
| VIP Value Strategies Portfolio Initial Class | 2,195,286 | 691,830 | 177,881 | 72,730 | (3,463 ) | (80,128) | 2,625,644 |
| Total | $56,268,054 | $22,222,139 | $7,363,269 | $2,530,134 | $(121,593 ) | $(2,415,835) | $68,589,496 |
Amounts in the income column in the above table include any capital gain distributions from underlying funds, which are presented in the corresponding line-item in the Statement of Operations if applicable.
Investment Valuation
All investments are categorized as Level 1 under the Fair Value Hierarchy. The inputs or methodology used for valuing securities may not be an indication of the risk associated with investing in those securities. For more information on valuation inputs please refer to the Investment Valuation section in the accompanying Notes to Financial Statements.
See accompanying notes which are an integral part of the financial statements.
VIP Freedom 2035 Portfolio℠
Financial Statements
Statement of Assets and Liabilities
| | | June 30, 2018 (Unaudited) |
| Assets | | |
Investment in securities, at value — See accompanying schedule:
| | |
| Fidelity Central Funds (cost $4) | $4 | |
| Other affiliated issuers (cost $63,491,262) | 68,589,496 | |
| Total Investment in Securities (cost $63,491,266) | | $68,589,500 |
| Cash | | 5 |
| Receivable for investments sold | | 1,959,040 |
| Receivable for fund shares sold | | 122,153 |
| Total assets | | 70,670,698 |
| Liabilities | | |
| Payable for investments purchased | $2,030,547 | |
| Payable for fund shares redeemed | 22,418 | |
| Distribution and service plan fees payable | 10,999 | |
| Total liabilities | | 2,063,964 |
| Net Assets | | $68,606,734 |
| Net Assets consist of: | | |
| Paid in capital | | $61,391,168 |
| Undistributed net investment income | | 62,464 |
| Accumulated undistributed net realized gain (loss) on investments | | 2,054,868 |
| Net unrealized appreciation (depreciation) on investments | | 5,098,234 |
| Net Assets | | $68,606,734 |
| Initial Class: | | |
| Net Asset Value, offering price and redemption price per share ($7,775,363 ÷ 344,821 shares) | | $22.55 |
| Service Class: | | |
| Net Asset Value, offering price and redemption price per share ($13,250,298 ÷ 588,927 shares) | | $22.50 |
| Service Class 2: | | |
| Net Asset Value, offering price and redemption price per share ($47,581,073 ÷ 2,126,772 shares) | | $22.37 |
See accompanying notes which are an integral part of the financial statements.
Statement of Operations
| | | Six months ended June 30, 2018 (Unaudited) |
| Investment Income | | |
| Dividends: | | |
| Affiliated issuers | | $122,581 |
| Income from Fidelity Central Funds | | 9 |
| Total income | | 122,590 |
| Expenses | | |
| Distribution and service plan fees | $59,954 | |
| Independent trustees' fees and expenses | 173 | |
| Total expenses before reductions | 60,127 | |
| Expense reductions | (1) | |
| Total expenses after reductions | | 60,126 |
| Net investment income (loss) | | 62,464 |
| Realized and Unrealized Gain (Loss) | | |
| Net realized gain (loss) on: | | |
| Investment securities: | | |
| Affiliated issuers | (121,593) | |
| Capital gain distributions from underlying funds: | | |
| Affiliated issuers | 2,407,553 | |
| Total net realized gain (loss) | | 2,285,960 |
| Change in net unrealized appreciation (depreciation) on: | | |
| Investment securities: | | |
| Affiliated issuers | (2,415,835) | |
| Total change in net unrealized appreciation (depreciation) | | (2,415,835) |
| Net gain (loss) | | (129,875) |
| Net increase (decrease) in net assets resulting from operations | | $(67,411) |
See accompanying notes which are an integral part of the financial statements.
Statement of Changes in Net Assets
| | Six months ended June 30, 2018 (Unaudited) | Year ended December 31, 2017 |
| Increase (Decrease) in Net Assets | | |
| Operations | | |
| Net investment income (loss) | $62,464 | $546,226 |
| Net realized gain (loss) | 2,285,960 | 1,505,660 |
| Change in net unrealized appreciation (depreciation) | (2,415,835) | 7,128,449 |
| Net increase (decrease) in net assets resulting from operations | (67,411) | 9,180,335 |
| Distributions to shareholders from net investment income | – | (542,643) |
| Distributions to shareholders from net realized gain | (931,392) | (1,421,671) |
| Total distributions | (931,392) | (1,964,314) |
| Share transactions - net increase (decrease) | 13,346,466 | 12,393,101 |
| Total increase (decrease) in net assets | 12,347,663 | 19,609,122 |
| Net Assets | | |
| Beginning of period | 56,259,071 | 36,649,949 |
| End of period | $68,606,734 | $56,259,071 |
| Other Information | | |
| Undistributed net investment income end of period | $62,464 | $– |
See accompanying notes which are an integral part of the financial statements.
Financial Highlights
VIP Freedom 2035 Portfolio Initial Class
| | Six months ended (Unaudited) June 30, | Years endedDecember 31, | | | | |
| | 2018 | 2017 | 2016 | 2015 | 2014 | 2013 |
| Selected Per–Share Data | | | | | | |
| Net asset value, beginning of period | $22.88 | $19.39 | $19.05 | $19.52 | $19.16 | $15.76 |
| Income from Investment Operations | | | | | | |
| Net investment income (loss)A | .05 | .30 | .31 | .39 | .39 | .66 |
| Net realized and unrealized gain (loss) | (.02) | 4.14 | .88 | (.44) | .55 | 3.24 |
| Total from investment operations | .03 | 4.44 | 1.19 | (.05) | .94 | 3.90 |
| Distributions from net investment income | – | (.27) | (.26) | (.32) | (.29) | (.29) |
| Distributions from net realized gain | (.36) | (.69) | (.60) | (.10) | (.29) | (.20) |
| Total distributions | (.36) | (.95)B | (.85)C | (.42) | (.58) | (.50)D |
| Net asset value, end of period | $22.55 | $22.88 | $19.39 | $19.05 | $19.52 | $19.16 |
| Total ReturnE,F,G | .13% | 23.35% | 6.87% | (.31)% | 4.93% | 24.84% |
| Ratios to Average Net AssetsH,I | | | | | | |
| Expenses before reductionsJ | - %K | -% | -% | -% | -% | -% |
| Expenses net of fee waivers, if any | - %J,K | -% | -% | -% | -% | -% |
| Expenses net of all reductions | - %J,K | -% | -% | -% | -% | -% |
| Net investment income (loss) | .40%K | 1.42% | 1.65% | 1.98% | 2.02% | 3.72% |
| Supplemental Data | | | | | | |
| Net assets, end of period (000 omitted) | $7,775 | $6,197 | $3,522 | $1,545 | $539 | $1,054 |
| Portfolio turnover rateH | 24%K | 25% | 18% | 22% | 26% | 31% |
A Calculated based on average shares outstanding during the period.
B Total distributions of $.95 per share is comprised of distributions from net investment income of $.266 and distributions from net realized gain of $.685 per share.
C Total distributions of $.85 per share is comprised of distributions from net investment income of $.255 and distributions from net realized gain of $.599 per share.
D Total distributions of $.50 per share is comprised of distributions from net investment income of $.292 and distributions from net realized gain of $.204 per share.
E Total returns for periods of less than one year are not annualized.
F Total returns do not reflect charges attributable to your insurance company's separate account. Inclusion of these charges would reduce the total returns shown.
G Total returns would have been lower if certain expenses had not been reduced during the applicable periods shown.
H Amounts do not include the activity of the Underlying Funds.
I Expense ratios reflect operating expenses of the class. Expenses before reductions do not reflect amounts reimbursed by the investment adviser or reductions from expense offset arrangements and do not represent the amount paid by the class during periods when reimbursements or reductions occur. Expenses net of fee waivers reflect expenses after reimbursement by the investment adviser but prior to reductions from expense offset arrangements. Expenses net of all reductions represent the net expenses paid by the class but do not include expenses of the underlying funds in which the Fund invests.
J Amount represents less than .005%.
K Annualized
See accompanying notes which are an integral part of the financial statements.
VIP Freedom 2035 Portfolio Service Class
| | Six months ended (Unaudited) June 30, | Years endedDecember 31, | | | | |
| | 2018 | 2017 | 2016 | 2015 | 2014 | 2013 |
| Selected Per–Share Data | | | | | | |
| Net asset value, beginning of period | $22.84 | $19.36 | $19.04 | $19.51 | $19.15 | $15.76 |
| Income from Investment Operations | | | | | | |
| Net investment income (loss)A | .03 | .28 | .29 | .37 | .38 | .64 |
| Net realized and unrealized gain (loss) | (.01) | 4.13 | .87 | (.44) | .55 | 3.24 |
| Total from investment operations | .02 | 4.41 | 1.16 | (.07) | .93 | 3.88 |
| Distributions from net investment income | – | (.25) | (.24) | (.30) | (.28) | (.28) |
| Distributions from net realized gain | (.36) | (.69) | (.60) | (.10) | (.29) | (.20) |
| Total distributions | (.36) | (.93)B | (.84) | (.40) | (.57) | (.49)C |
| Net asset value, end of period | $22.50 | $22.84 | $19.36 | $19.04 | $19.51 | $19.15 |
| Total ReturnD,E,F | .08% | 23.24% | 6.70% | (.40)% | 4.87% | 24.72% |
| Ratios to Average Net AssetsG,H | | | | | | |
| Expenses before reductions | .10%I | .10% | .10% | .10% | .10% | .10% |
| Expenses net of fee waivers, if any | .10%I | .10% | .10% | .10% | .10% | .10% |
| Expenses net of all reductions | .10%I | .10% | .10% | .10% | .10% | .10% |
| Net investment income (loss) | .30%I | 1.32% | 1.55% | 1.88% | 1.92% | 3.62% |
| Supplemental Data | | | | | | |
| Net assets, end of period (000 omitted) | $13,250 | $8,385 | $4,661 | $2,010 | $1,639 | $289 |
| Portfolio turnover rateG | 24%I | 25% | 18% | 22% | 26% | 31% |
A Calculated based on average shares outstanding during the period.
B Total distributions of $.93 per share is comprised of distributions from net investment income of $.248 and distributions from net realized gain of $.685 per share.
C Total distributions of $.49 per share is comprised of distributions from net investment income of $.283 and distributions from net realized gain of $.204 per share.
D Total returns for periods of less than one year are not annualized.
E Total returns do not reflect charges attributable to your insurance company's separate account. Inclusion of these charges would reduce the total returns shown.
F Total returns would have been lower if certain expenses had not been reduced during the applicable periods shown.
G Amounts do not include the activity of the Underlying Funds.
H Expense ratios reflect operating expenses of the class. Expenses before reductions do not reflect amounts reimbursed by the investment adviser or reductions from expense offset arrangements and do not represent the amount paid by the class during periods when reimbursements or reductions occur. Expenses net of fee waivers reflect expenses after reimbursement by the investment adviser but prior to reductions from expense offset arrangements. Expenses net of all reductions represent the net expenses paid by the class but do not include expenses of the underlying funds in which the Fund invests.
I Annualized
See accompanying notes which are an integral part of the financial statements.
VIP Freedom 2035 Portfolio Service Class 2
| | Six months ended (Unaudited) June 30, | Years endedDecember 31, | | | | |
| | 2018 | 2017 | 2016 | 2015 | 2014 | 2013 |
| Selected Per–Share Data | | | | | | |
| Net asset value, beginning of period | $22.73 | $19.27 | $18.96 | $19.43 | $19.09 | $15.73 |
| Income from Investment Operations | | | | | | |
| Net investment income (loss)A | .02 | .25 | .26 | .34 | .34 | .62 |
| Net realized and unrealized gain (loss) | (.02) | 4.11 | .86 | (.43) | .54 | 3.22 |
| Total from investment operations | –B | 4.36 | 1.12 | (.09) | .88 | 3.84 |
| Distributions from net investment income | – | (.22) | (.22) | (.28) | (.26) | (.27) |
| Distributions from net realized gain | (.36) | (.69) | (.60) | (.10) | (.29) | (.20) |
| Total distributions | (.36) | (.90)C | (.81)D | (.38) | (.54)E | (.48)F |
| Net asset value, end of period | $22.37 | $22.73 | $19.27 | $18.96 | $19.43 | $19.09 |
| Total ReturnG,H,I | - %J | 23.07% | 6.52% | (.51)% | 4.65% | 24.50% |
| Ratios to Average Net AssetsK,L | | | | | | |
| Expenses before reductions | .25%M | .25% | .25% | .25% | .25% | .25% |
| Expenses net of fee waivers, if any | .25%M | .25% | .25% | .25% | .25% | .25% |
| Expenses net of all reductions | .25%M | .25% | .25% | .25% | .25% | .25% |
| Net investment income (loss) | .15%M | 1.17% | 1.40% | 1.73% | 1.77% | 3.48% |
| Supplemental Data | | | | | | |
| Net assets, end of period (000 omitted) | $47,581 | $41,677 | $28,467 | $20,005 | $13,035 | $4,423 |
| Portfolio turnover rateK | 24%M | 25% | 18% | 22% | 26% | 31% |
A Calculated based on average shares outstanding during the period.
B Amount represents less than $.005 per share.
C Total distributions of $.90 per share is comprised of distributions from net investment income of $.217 and distributions from net realized gain of $.685 per share.
D Total distributions of $.81 per share is comprised of distributions from net investment income of $.215 and distributions from net realized gain of $.599 per share.
E Total distributions of $.54 per share is comprised of distributions from net investment income of $.257 and distributions from net realized gain of $.287 per share.
F Total distributions of $.48 per share is comprised of distributions from net investment income of $.271 and distributions from net realized gain of $.204 per share.
G Total returns for periods of less than one year are not annualized.
H Total returns do not reflect charges attributable to your insurance company's separate account. Inclusion of these charges would reduce the total returns shown.
I Total returns would have been lower if certain expenses had not been reduced during the applicable periods shown.
J Amount represents less than .005%.
K Amounts do not include the activity of the Underlying Funds.
L Expense ratios reflect operating expenses of the class. Expenses before reductions do not reflect amounts reimbursed by the investment adviser or reductions from expense offset arrangements and do not represent the amount paid by the class during periods when reimbursements or reductions occur. Expenses net of fee waivers reflect expenses after reimbursement by the investment adviser but prior to reductions from expense offset arrangements. Expenses net of all reductions represent the net expenses paid by the class but do not include expenses of the underlying funds in which the Fund invests.
M Annualized
See accompanying notes which are an integral part of the financial statements.
VIP Freedom 2040 Portfolio℠
Investment Summary (Unaudited)
The information in the following tables is based on the direct investments of the Fund.
Top Holdings as of June 30, 2018
| | % of fund's net assets |
| VIP Overseas Portfolio Initial Class | 21.0 |
| VIP Growth & Income Portfolio Initial Class | 12.7 |
| VIP Equity-Income Portfolio Initial Class | 11.1 |
| VIP Growth Portfolio Initial Class | 10.9 |
| VIP Contrafund Portfolio Initial Class | 10.6 |
| VIP Emerging Markets Portfolio Initial Class | 9.5 |
| VIP Value Portfolio Initial Class | 8.1 |
| VIP Value Strategies Portfolio Initial Class | 4.0 |
| Fidelity Long-Term Treasury Bond Index Fund Premium Class | 3.4 |
| VIP Mid Cap Portfolio Initial Class | 3.1 |
| | 94.4 |
Asset Allocation (% of fund's net assets)
| Period end |
| | Domestic Equity Funds | 60.5% |
| | International Equity Funds | 30.5% |
| | Bond Funds | 7.3% |
| | Short-Term Funds | 1.7% |

VIP Freedom 2040 Portfolio℠
Schedule of Investments June 30, 2018 (Unaudited)
Showing Percentage of Net Assets
| Domestic Equity Funds - 60.5% | | | |
| | | Shares | Value |
| VIP Contrafund Portfolio Initial Class (a) | | 257,926 | $9,195,047 |
| VIP Equity-Income Portfolio Initial Class (a) | | 434,720 | 9,663,827 |
| VIP Growth & Income Portfolio Initial Class (a) | | 511,683 | 10,990,942 |
| VIP Growth Portfolio Initial Class (a) | | 135,463 | 9,436,344 |
| VIP Mid Cap Portfolio Initial Class (a) | | 72,981 | 2,670,382 |
| VIP Value Portfolio Initial Class (a) | | 450,165 | 7,063,083 |
| VIP Value Strategies Portfolio Initial Class (a) | | 251,824 | 3,449,985 |
| TOTAL DOMESTIC EQUITY FUNDS | | | |
| (Cost $47,390,485) | | | 52,469,610 |
|
| International Equity Funds - 30.5% | | | |
| VIP Emerging Markets Portfolio Initial Class (a) | | 719,853 | 8,213,521 |
| VIP Overseas Portfolio Initial Class (a) | | 814,886 | 18,269,736 |
| TOTAL INTERNATIONAL EQUITY FUNDS | | | |
| (Cost $22,335,791) | | | 26,483,257 |
|
| Bond Funds - 7.3% | | | |
| Fidelity Inflation-Protected Bond Index Fund Premium Class (a) | | 168,020 | 1,649,961 |
| Fidelity Long-Term Treasury Bond Index Fund Premium Class (a) | | 231,785 | 2,943,674 |
| VIP High Income Portfolio Initial Class (a) | | 319,087 | 1,716,690 |
| VIP Investment Grade Bond Portfolio Initial Class (a) | | 149 | 1,859 |
| TOTAL BOND FUNDS | | | |
| (Cost $6,363,434) | | | 6,312,184 |
|
| Short-Term Funds - 1.7% | | | |
| VIP Government Money Market Portfolio Initial Class 1.71% (a)(b) | | | |
| (Cost $1,457,585) | | 1,457,585 | 1,457,585 |
| TOTAL INVESTMENT IN SECURITIES - 100.0% | | | |
| (Cost $77,547,295) | | | 86,722,636 |
| NET OTHER ASSETS (LIABILITIES) - 0.0% | | | 29,662 |
| NET ASSETS - 100% | | | $86,752,298 |
Legend
(a) Affiliated Fund
(b) The rate quoted is the annualized seven-day yield of the fund at period end.
Affiliated Central Funds
Information regarding fiscal year to date income earned by the Fund from investments in Fidelity Central Funds is as follows:
| Fund | Income earned |
| Fidelity Cash Central Fund | $4 |
| Total | $4 |
Amounts in the income column in the above table include any capital gain distributions from underlying funds, which are presented in the corresponding line-item in the Statement of Operations if applicable.
Affiliated Underlying Funds
Fiscal year to date information regarding the Fund's investments in affiliated Underlying Funds, excluding any Money Market Central Funds, is presented below. Exchanges between classes of the same affiliated Underlying Funds may occur.
| Affiliate | Value, beginning of period | Purchases | Sales Proceeds | Dividend Income | Realized Gain (loss) | Change in Unrealized appreciation (depreciation) | Value, end of period |
| Fidelity Inflation-Protected Bond Index Fund Premium Class | $-- | $1,649,961 | $-- | $13 | $-- | $-- | $1,649,961 |
| Fidelity Long-Term Treasury Bond Index Fund Premium Class | 1,649,863 | 1,496,848 | 164,684 | 28,742 | (3,952 ) | (34,401) | 2,943,674 |
| VIP Contrafund Portfolio Initial Class | 8,268,140 | 2,233,759 | 857,922 | 723,212 | (5,448 ) | (443,482) | 9,195,047 |
| VIP Emerging Markets Portfolio Initial Class | 7,375,970 | 2,115,449 | 727,517 | 4,145 | 7,234 | (557,615) | 8,213,521 |
| VIP Equity-Income Portfolio Initial Class | 8,717,213 | 2,285,557 | 736,367 | 403,045 | (5,371 ) | (597,205) | 9,663,827 |
| VIP Government Money Market Portfolio Initial Class 1.71% | 2,012,872 | 530,011 | 1,085,298 | 13,169 | -- | -- | 1,457,585 |
| VIP Growth & Income Portfolio Initial Class | 9,998,142 | 2,528,870 | 1,032,224 | 555,046 | (10,465 ) | (493,381) | 10,990,942 |
| VIP Growth Portfolio Initial Class | 8,420,941 | 2,715,136 | 1,352,308 | 1,198,740 | (13,596 ) | (333,829) | 9,436,344 |
| VIP High Income Portfolio Initial Class | 1,549,948 | 378,236 | 189,950 | 14,688 | (1,809 ) | (19,735) | 1,716,690 |
| VIP Investment Grade Bond Portfolio Initial Class | 1,685,150 | 469,670 | 2,107,894 | 17,416 | (37,326 ) | (7,741) | 1,859 |
| VIP Mid Cap Portfolio Initial Class | 2,422,433 | 636,476 | 257,274 | 205,220 | (981 ) | (130,272) | 2,670,382 |
| VIP Overseas Portfolio Initial Class | 16,805,546 | 3,264,574 | 1,449,709 | 5,835 | 4,470 | (355,145) | 18,269,736 |
| VIP Value Portfolio Initial Class | 6,405,011 | 1,485,111 | 578,033 | 232,106 | (2,826 ) | (246,180) | 7,063,083 |
| VIP Value Strategies Portfolio Initial Class | 3,128,405 | 746,218 | 306,179 | 101,310 | (5,652 ) | (112,807) | 3,449,985 |
| Total | $78,439,634 | $22,535,876 | $10,845,359 | $3,502,687 | $(75,722 ) | $(3,331,793) | $86,722,636 |
Amounts in the income column in the above table include any capital gain distributions from underlying funds, which are presented in the corresponding line-item in the Statement of Operations if applicable.
Investment Valuation
All investments are categorized as Level 1 under the Fair Value Hierarchy. The inputs or methodology used for valuing securities may not be an indication of the risk associated with investing in those securities. For more information on valuation inputs please refer to the Investment Valuation section in the accompanying Notes to Financial Statements.
See accompanying notes which are an integral part of the financial statements.
VIP Freedom 2040 Portfolio℠
Financial Statements
Statement of Assets and Liabilities
| | | June 30, 2018 (Unaudited) |
| Assets | | |
Investment in securities, at value — See accompanying schedule:
| | |
| Affiliated issuers (cost $77,547,295) | $86,722,636 | |
| Total Investment in Securities (cost $77,547,295) | | $86,722,636 |
| Cash | | 4 |
| Receivable for investments sold | | 2,047,263 |
| Receivable for fund shares sold | | 125,997 |
| Total assets | | 88,895,900 |
| Liabilities | | |
| Payable for investments purchased | $2,108,511 | |
| Payable for fund shares redeemed | 27,328 | |
| Distribution and service plan fees payable | 7,763 | |
| Total liabilities | | 2,143,602 |
| Net Assets | | $86,752,298 |
| Net Assets consist of: | | |
| Paid in capital | | $74,660,330 |
| Undistributed net investment income | | 116,340 |
| Accumulated undistributed net realized gain (loss) on investments | | 2,800,287 |
| Net unrealized appreciation (depreciation) on investments | | 9,175,341 |
| Net Assets | | $86,752,298 |
| Initial Class: | | |
| Net Asset Value, offering price and redemption price per share ($19,429,514 ÷ 906,798 shares) | | $21.43 |
| Service Class: | | |
| Net Asset Value, offering price and redemption price per share ($50,053,496 ÷ 2,341,203 shares) | | $21.38 |
| Service Class 2: | | |
| Net Asset Value, offering price and redemption price per share ($17,269,288 ÷ 811,120 shares) | | $21.29 |
See accompanying notes which are an integral part of the financial statements.
Statement of Operations
| | | Six months ended June 30, 2018 (Unaudited) |
| Investment Income | | |
| Dividends: | | |
| Affiliated issuers | | $160,864 |
| Income from Fidelity Central Funds | | 4 |
| Total income | | 160,868 |
| Expenses | | |
| Distribution and service plan fees | $44,292 | |
| Independent trustees' fees and expenses | 238 | |
| Total expenses before reductions | 44,530 | |
| Expense reductions | (2) | |
| Total expenses after reductions | | 44,528 |
| Net investment income (loss) | | 116,340 |
| Realized and Unrealized Gain (Loss) | | |
| Net realized gain (loss) on: | | |
| Investment securities: | | |
| Affiliated issuers | (75,722) | |
| Capital gain distributions from underlying funds: | | |
| Affiliated issuers | 3,341,823 | |
| Total net realized gain (loss) | | 3,266,101 |
| Change in net unrealized appreciation (depreciation) on: | | |
| Investment securities: | | |
| Affiliated issuers | (3,331,793) | |
| Total change in net unrealized appreciation (depreciation) | | (3,331,793) |
| Net gain (loss) | | (65,692) |
| Net increase (decrease) in net assets resulting from operations | | $50,648 |
See accompanying notes which are an integral part of the financial statements.
Statement of Changes in Net Assets
| | Six months ended June 30, 2018 (Unaudited) | Year ended December 31, 2017 |
| Increase (Decrease) in Net Assets | | |
| Operations | | |
| Net investment income (loss) | $116,340 | $808,261 |
| Net realized gain (loss) | 3,266,101 | 2,237,051 |
| Change in net unrealized appreciation (depreciation) | (3,331,793) | 10,038,009 |
| Net increase (decrease) in net assets resulting from operations | 50,648 | 13,083,321 |
| Distributions to shareholders from net investment income | – | (803,474) |
| Distributions to shareholders from net realized gain | (1,317,803) | (1,932,423) |
| Total distributions | (1,317,803) | (2,735,897) |
| Share transactions - net increase (decrease) | 9,586,599 | 18,498,572 |
| Total increase (decrease) in net assets | 8,319,444 | 28,845,996 |
| Net Assets | | |
| Beginning of period | 78,432,854 | 49,586,858 |
| End of period | $86,752,298 | $78,432,854 |
| Other Information | | |
| Undistributed net investment income end of period | $116,340 | $– |
See accompanying notes which are an integral part of the financial statements.
Financial Highlights
VIP Freedom 2040 Portfolio Initial Class
| | Six months ended (Unaudited) June 30, | Years endedDecember 31, | | | | |
| | 2018 | 2017 | 2016 | 2015 | 2014 | 2013 |
| Selected Per–Share Data | | | | | | |
| Net asset value, beginning of period | $21.76 | $18.39 | $18.19 | $18.66 | $18.35 | $15.03 |
| Income from Investment Operations | | | | | | |
| Net investment income (loss)A | .04 | .28 | .23 | .34 | .34 | .38 |
| Net realized and unrealized gain (loss) | (.01) | 3.98 | .88 | (.38) | .56 | 3.41 |
| Total from investment operations | .03 | 4.26 | 1.11 | (.04) | .90 | 3.79 |
| Distributions from net investment income | – | (.25) | (.24) | (.31) | (.28) | (.27) |
| Distributions from net realized gain | (.36) | (.64) | (.67) | (.12) | (.31) | (.19) |
| Total distributions | (.36) | (.89) | (.91) | (.43) | (.59) | (.47)B |
| Net asset value, end of period | $21.43 | $21.76 | $18.39 | $18.19 | $18.66 | $18.35 |
| Total ReturnC,D,E | .13% | 23.60% | 6.83% | (.26)% | 4.91% | 25.29% |
| Ratios to Average Net AssetsF,G | | | | | | |
| Expenses before reductionsH | - %I | -% | -% | -% | -% | -% |
| Expenses net of fee waivers, if any | - %H,I | -% | -% | -% | -% | -% |
| Expenses net of all reductions | - %H,I | -% | -% | -% | -% | -% |
| Net investment income (loss) | .39%I | 1.39% | 1.29% | 1.80% | 1.82% | 2.26% |
| Supplemental Data | | | | | | |
| Net assets, end of period (000 omitted) | $19,430 | $16,561 | $11,515 | $15,388 | $15,234 | $10,262 |
| Portfolio turnover rateG | 26%I | 26% | 36% | 23% | 19% | 36% |
A Calculated based on average shares outstanding during the period.
B Total distributions of $.47 per share is comprised of distributions from net investment income of $.272 and distributions from net realized gain of $.193 per share.
C Total returns for periods of less than one year are not annualized.
D Total returns do not reflect charges attributable to your insurance company's separate account. Inclusion of these charges would reduce the total returns shown.
E Total returns would have been lower if certain expenses had not been reduced during the applicable periods shown.
F Expense ratios reflect operating expenses of the class. Expenses before reductions do not reflect amounts reimbursed by the investment adviser or reductions from expense offset arrangements and do not represent the amount paid by the class during periods when reimbursements or reductions occur. Expenses net of fee waivers reflect expenses after reimbursement by the investment adviser but prior to reductions from expense offset arrangements. Expenses net of all reductions represent the net expenses paid by the class but do not include expenses of the underlying funds in which the Fund invests.
G Amounts do not include the activity of the Underlying Funds.
H Amount represents less than .005%.
I Annualized
See accompanying notes which are an integral part of the financial statements.
VIP Freedom 2040 Portfolio Service Class
| | Six months ended (Unaudited) June 30, | Years endedDecember 31, | | | | |
| | 2018 | 2017 | 2016 | 2015 | 2014 | 2013 |
| Selected Per–Share Data | | | | | | |
| Net asset value, beginning of period | $21.72 | $18.37 | $18.17 | $18.64 | $18.33 | $15.02 |
| Income from Investment Operations | | | | | | |
| Net investment income (loss)A | .03 | .26 | .21 | .32 | .32 | .36 |
| Net realized and unrealized gain (loss) | (.01) | 3.96 | .89 | (.38) | .56 | 3.40 |
| Total from investment operations | .02 | 4.22 | 1.10 | (.06) | .88 | 3.76 |
| Distributions from net investment income | – | (.23) | (.23) | (.29) | (.27) | (.26) |
| Distributions from net realized gain | (.36) | (.64) | (.67) | (.12) | (.31) | (.19) |
| Total distributions | (.36) | (.87) | (.90) | (.41) | (.57)B | (.45) |
| Net asset value, end of period | $21.38 | $21.72 | $18.37 | $18.17 | $18.64 | $18.33 |
| Total ReturnC,D,E | .08% | 23.42% | 6.75% | (.35)% | 4.83% | 25.16% |
| Ratios to Average Net AssetsF,G | | | | | | |
| Expenses before reductions | .10%H | .10% | .10% | .10% | .10% | .10% |
| Expenses net of fee waivers, if any | .10%H | .10% | .10% | .10% | .10% | .10% |
| Expenses net of all reductions | .10%H | .10% | .10% | .10% | .10% | .10% |
| Net investment income (loss) | .29%H | 1.29% | 1.19% | 1.70% | 1.72% | 2.16% |
| Supplemental Data | | | | | | |
| Net assets, end of period (000 omitted) | $50,053 | $45,492 | $22,986 | $18,401 | $12,905 | $9,076 |
| Portfolio turnover rateG | 26%H | 26% | 36% | 23% | 19% | 36% |
A Calculated based on average shares outstanding during the period.
B Total distributions of $.57 per share is comprised of distributions from net investment income of $.266 and distributions from net realized gain of $.305 per share.
C Total returns for periods of less than one year are not annualized.
D Total returns do not reflect charges attributable to your insurance company's separate account. Inclusion of these charges would reduce the total returns shown.
E Total returns would have been lower if certain expenses had not been reduced during the applicable periods shown.
F Expense ratios reflect operating expenses of the class. Expenses before reductions do not reflect amounts reimbursed by the investment adviser or reductions from expense offset arrangements and do not represent the amount paid by the class during periods when reimbursements or reductions occur. Expenses net of fee waivers reflect expenses after reimbursement by the investment adviser but prior to reductions from expense offset arrangements. Expenses net of all reductions represent the net expenses paid by the class but do not include expenses of the underlying funds in which the Fund invests.
G Amounts do not include the activity of the Underlying Funds.
H Annualized
See accompanying notes which are an integral part of the financial statements.
VIP Freedom 2040 Portfolio Service Class 2
| | Six months ended (Unaudited) June 30, | Years endedDecember 31, | | | | |
| | 2018 | 2017 | 2016 | 2015 | 2014 | 2013 |
| Selected Per–Share Data | | | | | | |
| Net asset value, beginning of period | $21.65 | $18.30 | $18.12 | $18.59 | $18.29 | $15.00 |
| Income from Investment Operations | | | | | | |
| Net investment income (loss)A | .02 | .23 | .18 | .29 | .29 | .34 |
| Net realized and unrealized gain (loss) | (.02) | 3.95 | .87 | (.38) | .56 | 3.39 |
| Total from investment operations | –B | 4.18 | 1.05 | (.09) | .85 | 3.73 |
| Distributions from net investment income | – | (.19) | (.20) | (.27) | (.25) | (.25) |
| Distributions from net realized gain | (.36) | (.64) | (.67) | (.12) | (.31) | (.19) |
| Total distributions | (.36) | (.83) | (.87) | (.38)C | (.55)D | (.44) |
| Net asset value, end of period | $21.29 | $21.65 | $18.30 | $18.12 | $18.59 | $18.29 |
| Total ReturnE,F,G | (.01)% | 23.30% | 6.53% | (.49)% | 4.70% | 24.99% |
| Ratios to Average Net AssetsH,I | | | | | | |
| Expenses before reductions | .25%J | .25% | .25% | .25% | .25% | .25% |
| Expenses net of fee waivers, if any | .25%J | .25% | .25% | .25% | .25% | .25% |
| Expenses net of all reductions | .25%J | .25% | .25% | .25% | .25% | .25% |
| Net investment income (loss) | .14%J | 1.14% | 1.04% | 1.55% | 1.57% | 2.01% |
| Supplemental Data | | | | | | |
| Net assets, end of period (000 omitted) | $17,269 | $16,380 | $15,086 | $12,468 | $8,341 | $2,815 |
| Portfolio turnover rateI | 26%J | 26% | 36% | 23% | 19% | 36% |
A Calculated based on average shares outstanding during the period.
B Amount represents less than $.005 per share.
C Total distributions of $.38 per share is comprised of distributions from net investment income of $.268 and distributions from net realized gain of $.116 per share.
D Total distributions of $.55 per share is comprised of distributions from net investment income of $.249 and distributions from net realized gain of $.305 per share.
E Total returns for periods of less than one year are not annualized.
F Total returns do not reflect charges attributable to your insurance company's separate account. Inclusion of these charges would reduce the total returns shown.
G Total returns would have been lower if certain expenses had not been reduced during the applicable periods shown.
H Expense ratios reflect operating expenses of the class. Expenses before reductions do not reflect amounts reimbursed by the investment adviser or reductions from expense offset arrangements and do not represent the amount paid by the class during periods when reimbursements or reductions occur. Expenses net of fee waivers reflect expenses after reimbursement by the investment adviser but prior to reductions from expense offset arrangements. Expenses net of all reductions represent the net expenses paid by the class but do not include expenses of the underlying funds in which the Fund invests.
I Amounts do not include the activity of the Underlying Funds.
J Annualized
See accompanying notes which are an integral part of the financial statements.
VIP Freedom 2045 Portfolio℠
Investment Summary (Unaudited)
The information in the following tables is based on the direct investments of the Fund.
Top Holdings as of June 30, 2018
| | % of fund's net assets |
| VIP Overseas Portfolio Initial Class | 21.0 |
| VIP Growth & Income Portfolio Initial Class | 12.7 |
| VIP Equity-Income Portfolio Initial Class | 11.1 |
| VIP Growth Portfolio Initial Class | 10.9 |
| VIP Contrafund Portfolio Initial Class | 10.6 |
| VIP Emerging Markets Portfolio Initial Class | 9.5 |
| VIP Value Portfolio Initial Class | 8.1 |
| VIP Value Strategies Portfolio Initial Class | 4.0 |
| Fidelity Long-Term Treasury Bond Index Fund Premium Class | 3.4 |
| VIP Mid Cap Portfolio Initial Class | 3.1 |
| | 94.4 |
Asset Allocation (% of fund's net assets)
| Period end |
| | Domestic Equity Funds | 60.5% |
| | International Equity Funds | 30.5% |
| | Bond Funds | 7.3% |
| | Short-Term Funds | 1.7% |

VIP Freedom 2045 Portfolio℠
Schedule of Investments June 30, 2018 (Unaudited)
Showing Percentage of Net Assets
| Domestic Equity Funds - 60.5% | | | |
| | | Shares | Value |
| VIP Contrafund Portfolio Initial Class (a) | | 111,869 | $3,988,123 |
| VIP Equity-Income Portfolio Initial Class (a) | | 188,549 | 4,191,446 |
| VIP Growth & Income Portfolio Initial Class (a) | | 221,929 | 4,767,045 |
| VIP Growth Portfolio Initial Class (a) | | 58,754 | 4,092,785 |
| VIP Mid Cap Portfolio Initial Class (a) | | 31,654 | 1,158,211 |
| VIP Value Portfolio Initial Class (a) | | 195,248 | 3,063,437 |
| VIP Value Strategies Portfolio Initial Class (a) | | 109,222 | 1,496,345 |
| TOTAL DOMESTIC EQUITY FUNDS | | | |
| (Cost $21,639,132) | | | 22,757,392 |
|
| International Equity Funds - 30.5% | | | |
| VIP Emerging Markets Portfolio Initial Class (a) | | 312,220 | 3,562,430 |
| VIP Overseas Portfolio Initial Class (a) | | 353,440 | 7,924,116 |
| TOTAL INTERNATIONAL EQUITY FUNDS | | | |
| (Cost $10,189,973) | | | 11,486,546 |
|
| Bond Funds - 7.3% | | | |
| Fidelity Inflation-Protected Bond Index Fund Premium Class (a) | | 72,864 | 715,521 |
| Fidelity Long-Term Treasury Bond Index Fund Premium Class (a) | | 100,529 | 1,276,715 |
| VIP High Income Portfolio Initial Class (a) | | 138,396 | 744,570 |
| VIP Investment Grade Bond Portfolio Initial Class (a) | | 73 | 912 |
| TOTAL BOND FUNDS | | | |
| (Cost $2,754,251) | | | 2,737,718 |
|
| Short-Term Funds - 1.7% | | | |
| VIP Government Money Market Portfolio Initial Class 1.71% (a)(b) | | | |
| (Cost $632,175) | | 632,175 | 632,175 |
| TOTAL INVESTMENT IN SECURITIES - 100.0% | | | |
| (Cost $35,215,531) | | | 37,613,831 |
| NET OTHER ASSETS (LIABILITIES) - 0.0% | | | 8,913 |
| NET ASSETS - 100% | | | $37,622,744 |
Legend
(a) Affiliated Fund
(b) The rate quoted is the annualized seven-day yield of the fund at period end.
Affiliated Underlying Funds
Fiscal year to date information regarding the Fund's investments in affiliated Underlying Funds, excluding any Money Market Central Funds, is presented below. Exchanges between classes of the same affiliated Underlying Funds may occur.
| Affiliate | Value, beginning of period | Purchases | Sales Proceeds | Dividend Income | Realized Gain (loss) | Change in Unrealized appreciation (depreciation) | Value, end of period |
| Fidelity Inflation-Protected Bond Index Fund Premium Class | $-- | $715,521 | $-- | $6 | $-- | $-- | $715,521 |
| Fidelity Long-Term Treasury Bond Index Fund Premium Class | 627,220 | 700,413 | 38,254 | 12,177 | (1,372 ) | (11,292) | 1,276,715 |
| VIP Contrafund Portfolio Initial Class | 3,248,457 | 1,124,229 | 181,511 | 307,570 | (10,367 ) | (192,685) | 3,988,123 |
| VIP Emerging Markets Portfolio Initial Class | 2,898,390 | 1,048,831 | 134,378 | 1,763 | (2,753 ) | (247,660) | 3,562,430 |
| VIP Equity-Income Portfolio Initial Class | 3,424,784 | 1,169,226 | 136,144 | 171,420 | (6,420 ) | (260,000) | 4,191,446 |
| VIP Government Money Market Portfolio Initial Class 1.71% | 790,864 | 269,060 | 427,749 | 5,587 | -- | -- | 632,175 |
| VIP Growth & Income Portfolio Initial Class | 3,928,070 | 1,278,089 | 212,083 | 236,056 | (11,365 ) | (215,666) | 4,767,045 |
| VIP Growth Portfolio Initial Class | 3,308,459 | 1,336,527 | 390,467 | 509,744 | (20,215 ) | (141,519) | 4,092,785 |
| VIP High Income Portfolio Initial Class | 608,966 | 195,697 | 50,734 | 6,247 | (556 ) | (8,803) | 744,570 |
| VIP Investment Grade Bond Portfolio Initial Class | 682,629 | 217,424 | 880,526 | 7,386 | (15,787 ) | (2,828) | 912 |
| VIP Mid Cap Portfolio Initial Class | 951,854 | 322,409 | 56,615 | 87,275 | (3,250 ) | (56,187) | 1,158,211 |
| VIP Overseas Portfolio Initial Class | 6,602,357 | 1,734,743 | 238,586 | 2,481 | (3,301 ) | (171,097) | 7,924,116 |
| VIP Value Portfolio Initial Class | 2,516,540 | 775,822 | 116,793 | 98,725 | (4,353 ) | (107,779) | 3,063,437 |
| VIP Value Strategies Portfolio Initial Class | 1,229,177 | 386,094 | 67,098 | 43,088 | (3,682 ) | (48,146) | 1,496,345 |
| Total | $30,817,767 | $11,274,085 | $2,930,938 | $1,489,525 | $(83,421 ) | $(1,463,662) | $37,613,831 |
Amounts in the income column in the above table include any capital gain distributions from underlying funds, which are presented in the corresponding line-item in the Statement of Operations if applicable.
Investment Valuation
All investments are categorized as Level 1 under the Fair Value Hierarchy. The inputs or methodology used for valuing securities may not be an indication of the risk associated with investing in those securities. For more information on valuation inputs please refer to the Investment Valuation section in the accompanying Notes to Financial Statements.
See accompanying notes which are an integral part of the financial statements.
VIP Freedom 2045 Portfolio℠
Financial Statements
Statement of Assets and Liabilities
| | | June 30, 2018 (Unaudited) |
| Assets | | |
Investment in securities, at value — See accompanying schedule:
| | |
| Affiliated issuers (cost $35,215,531) | $37,613,831 | |
| Total Investment in Securities (cost $35,215,531) | | $37,613,831 |
| Cash | | 1 |
| Receivable for investments sold | | 903,421 |
| Receivable for fund shares sold | | 36,580 |
| Total assets | | 38,553,833 |
| Liabilities | | |
| Payable for investments purchased | $908,662 | |
| Payable for fund shares redeemed | 15,448 | |
| Distribution and service plan fees payable | 6,979 | |
| Total liabilities | | 931,089 |
| Net Assets | | $37,622,744 |
| Net Assets consist of: | | |
| Paid in capital | | $33,981,886 |
| Undistributed net investment income | | 29,223 |
| Accumulated undistributed net realized gain (loss) on investments | | 1,213,335 |
| Net unrealized appreciation (depreciation) on investments | | 2,398,300 |
| Net Assets | | $37,622,744 |
| Initial Class: | | |
| Net Asset Value, offering price and redemption price per share ($2,388,244 ÷ 111,688 shares) | | $21.38 |
| Service Class: | | |
| Net Asset Value, offering price and redemption price per share ($2,948,087 ÷ 138,123 shares) | | $21.34 |
| Service Class 2: | | |
| Net Asset Value, offering price and redemption price per share ($32,286,413 ÷ 1,520,585 shares) | | $21.23 |
See accompanying notes which are an integral part of the financial statements.
Statement of Operations
| | | Six months ended June 30, 2018 (Unaudited) |
| Investment Income | | |
| Dividends: | | |
| Affiliated issuers | | $68,350 |
| Expenses | | |
| Distribution and service plan fees | $39,031 | |
| Independent trustees' fees and expenses | 96 | |
| Total expenses | | 39,127 |
| Net investment income (loss) | | 29,223 |
| Realized and Unrealized Gain (Loss) | | |
| Net realized gain (loss) on: | | |
| Investment securities: | | |
| Affiliated issuers | (83,421) | |
| Capital gain distributions from underlying funds: | | |
| Affiliated issuers | 1,421,175 | |
| Total net realized gain (loss) | | 1,337,754 |
| Change in net unrealized appreciation (depreciation) on: | | |
| Investment securities: | | |
| Affiliated issuers | (1,463,662) | |
| Total change in net unrealized appreciation (depreciation) | | (1,463,662) |
| Net gain (loss) | | (125,908) |
| Net increase (decrease) in net assets resulting from operations | | $(96,685) |
See accompanying notes which are an integral part of the financial statements.
Statement of Changes in Net Assets
| | Six months ended June 30, 2018 (Unaudited) | Year ended December 31, 2017 |
| Increase (Decrease) in Net Assets | | |
| Operations | | |
| Net investment income (loss) | $29,223 | $283,321 |
| Net realized gain (loss) | 1,337,754 | 781,248 |
| Change in net unrealized appreciation (depreciation) | (1,463,662) | 3,645,899 |
| Net increase (decrease) in net assets resulting from operations | (96,685) | 4,710,468 |
| Distributions to shareholders from net investment income | – | (281,848) |
| Distributions to shareholders from net realized gain | (450,171) | (750,257) |
| Total distributions | (450,171) | (1,032,105) |
| Share transactions - net increase (decrease) | 7,357,376 | 9,278,407 |
| Total increase (decrease) in net assets | 6,810,520 | 12,956,770 |
| Net Assets | | |
| Beginning of period | 30,812,224 | 17,855,454 |
| End of period | $37,622,744 | $30,812,224 |
| Other Information | | |
| Undistributed net investment income end of period | $29,223 | $– |
See accompanying notes which are an integral part of the financial statements.
Financial Highlights
VIP Freedom 2045 Portfolio Initial Class
| | Six months ended (Unaudited) June 30, | Years endedDecember 31, | | | | |
| | 2018 | 2017 | 2016 | 2015 | 2014 | 2013 |
| Selected Per–Share Data | | | | | | |
| Net asset value, beginning of period | $21.64 | $18.31 | $18.03 | $18.50 | $18.18 | $14.83 |
| Income from Investment Operations | | | | | | |
| Net investment income (loss)A | .04 | .30 | .28 | .38 | .40 | .52 |
| Net realized and unrealized gain (loss) | (.01) | 3.93 | .83 | (.42) | .50 | 3.33 |
| Total from investment operations | .03 | 4.23 | 1.11 | (.04) | .90 | 3.85 |
| Distributions from net investment income | – | (.24) | (.24) | (.33) | (.28) | (.29) |
| Distributions from net realized gain | (.29) | (.66) | (.59) | (.10) | (.30) | (.21) |
| Total distributions | (.29) | (.90) | (.83) | (.43) | (.58) | (.50) |
| Net asset value, end of period | $21.38 | $21.64 | $18.31 | $18.03 | $18.50 | $18.18 |
| Total ReturnB,C,D | .12% | 23.59% | 6.80% | (.26)% | 4.95% | 26.07% |
| Ratios to Average Net AssetsE,F | | | | | | |
| Expenses before reductionsG | - %H | -% | -% | -% | -% | -% |
| Expenses net of fee waivers, if any | - %G,H | -% | -% | -% | -% | -% |
| Expenses net of all reductions | - %G,H | -% | -% | -% | -% | -% |
| Net investment income (loss) | .39%H | 1.46% | 1.57% | 2.01% | 2.14% | 3.13% |
| Supplemental Data | | | | | | |
| Net assets, end of period (000 omitted) | $2,388 | $1,491 | $789 | $542 | $342 | $272 |
| Portfolio turnover rateF | 17%H | 23% | 19% | 26% | 19% | 42% |
A Calculated based on average shares outstanding during the period.
B Total returns for periods of less than one year are not annualized.
C Total returns do not reflect charges attributable to your insurance company's separate account. Inclusion of these charges would reduce the total returns shown.
D Total returns would have been lower if certain expenses had not been reduced during the applicable periods shown.
E Expense ratios reflect operating expenses of the class. Expenses before reductions do not reflect amounts reimbursed by the investment adviser or reductions from expense offset arrangements and do not represent the amount paid by the class during periods when reimbursements or reductions occur. Expenses net of fee waivers reflect expenses after reimbursement by the investment adviser but prior to reductions from expense offset arrangements. Expenses net of all reductions represent the net expenses paid by the class but do not include expenses of the underlying funds in which the Fund invests.
F Amounts do not include the activity of the Underlying Funds.
G Amount represents less than .005%.
H Annualized
See accompanying notes which are an integral part of the financial statements.
VIP Freedom 2045 Portfolio Service Class
| | Six months ended (Unaudited) June 30, | Years endedDecember 31, | | | | |
| | 2018 | 2017 | 2016 | 2015 | 2014 | 2013 |
| Selected Per–Share Data | | | | | | |
| Net asset value, beginning of period | $21.61 | $18.30 | $18.02 | $18.49 | $18.18 | $14.83 |
| Income from Investment Operations | | | | | | |
| Net investment income (loss)A | .03 | .28 | .26 | .36 | .38 | .51 |
| Net realized and unrealized gain (loss) | (.01) | 3.92 | .84 | (.42) | .49 | 3.33 |
| Total from investment operations | .02 | 4.20 | 1.10 | (.06) | .87 | 3.84 |
| Distributions from net investment income | – | (.23) | (.23) | (.31) | (.27) | (.27) |
| Distributions from net realized gain | (.29) | (.66) | (.59) | (.10) | (.30) | (.21) |
| Total distributions | (.29) | (.89) | (.82) | (.41) | (.56)B | (.49)C |
| Net asset value, end of period | $21.34 | $21.61 | $18.30 | $18.02 | $18.49 | $18.18 |
| Total ReturnD,E,F | .07% | 23.42% | 6.73% | (.37)% | 4.83% | 25.96% |
| Ratios to Average Net AssetsG,H | | | | | | |
| Expenses before reductions | .10%I | .10% | .10% | .10% | .10% | .10% |
| Expenses net of fee waivers, if any | .10%I | .10% | .10% | .10% | .10% | .10% |
| Expenses net of all reductions | .10%I | .10% | .10% | .10% | .10% | .10% |
| Net investment income (loss) | .29%I | 1.36% | 1.47% | 1.91% | 2.04% | 3.03% |
| Supplemental Data | | | | | | |
| Net assets, end of period (000 omitted) | $2,948 | $1,923 | $396 | $343 | $364 | $169 |
| Portfolio turnover rateH | 17 %I | 23% | 19% | 26% | 19% | 42% |
A Calculated based on average shares outstanding during the period.
B Total distributions of $.56 per share is comprised of distributions from net investment income of $.266 and distributions from net realized gain of $.298 per share.
C Total distributions of $.49 per share is comprised of distributions from net investment income of $.271 and distributions from net realized gain of $.214 per share.
D Total returns for periods of less than one year are not annualized.
E Total returns do not reflect charges attributable to your insurance company's separate account. Inclusion of these charges would reduce the total returns shown.
F Total returns would have been lower if certain expenses had not been reduced during the applicable periods shown.
G Expense ratios reflect operating expenses of the class. Expenses before reductions do not reflect amounts reimbursed by the investment adviser or reductions from expense offset arrangements and do not represent the amount paid by the class during periods when reimbursements or reductions occur. Expenses net of fee waivers reflect expenses after reimbursement by the investment adviser but prior to reductions from expense offset arrangements. Expenses net of all reductions represent the net expenses paid by the class but do not include expenses of the underlying funds in which the Fund invests.
H Amounts do not include the activity of the Underlying Funds.
I Annualized
See accompanying notes which are an integral part of the financial statements.
VIP Freedom 2045 Portfolio Service Class 2
| | Six months ended (Unaudited) June 30, | Years endedDecember 31, | | | | |
| | 2018 | 2017 | 2016 | 2015 | 2014 | 2013 |
| Selected Per–Share Data | | | | | | |
| Net asset value, beginning of period | $21.52 | $18.22 | $17.95 | $18.43 | $18.13 | $14.81 |
| Income from Investment Operations | | | | | | |
| Net investment income (loss)A | .02 | .24 | .23 | .33 | .35 | .49 |
| Net realized and unrealized gain (loss) | (.02) | 3.92 | .84 | (.42) | .49 | 3.31 |
| Total from investment operations | –B | 4.16 | 1.07 | (.09) | .84 | 3.80 |
| Distributions from net investment income | – | (.20) | (.20) | (.29) | (.25) | (.27) |
| Distributions from net realized gain | (.29) | (.66) | (.59) | (.10) | (.30) | (.21) |
| Total distributions | (.29) | (.86) | (.80)C | (.39) | (.54)D | (.48) |
| Net asset value, end of period | $21.23 | $21.52 | $18.22 | $17.95 | $18.43 | $18.13 |
| Total ReturnE,F,G | (.02)% | 23.30% | 6.56% | (.53)% | 4.68% | 25.76% |
| Ratios to Average Net AssetsH,I | | | | | | |
| Expenses before reductions | .25%J | .25% | .25% | .25% | .25% | .25% |
| Expenses net of fee waivers, if any | .25%J | .25% | .25% | .25% | .25% | .25% |
| Expenses net of all reductions | .25%J | .25% | .25% | .25% | .25% | .25% |
| Net investment income (loss) | .14%J | 1.21% | 1.32% | 1.76% | 1.89% | 2.88% |
| Supplemental Data | | | | | | |
| Net assets, end of period (000 omitted) | $32,286 | $27,399 | $16,671 | $11,398 | $7,363 | $2,493 |
| Portfolio turnover rateI | 17 %J | 23% | 19% | 26% | 19% | 42% |
A Calculated based on average shares outstanding during the period.
B Amount represents less than $.005 per share.
C Total distributions of $.80 per share is comprised of distributions from net investment income of $.202 and distributions from net realized gain of $.594 per share.
D Total distributions of $.54 per share is comprised of distributions from net investment income of $.245 and distributions from net realized gain of $.298 per share.
E Total returns for periods of less than one year are not annualized.
F Total returns do not reflect charges attributable to your insurance company's separate account. Inclusion of these charges would reduce the total returns shown.
G Total returns would have been lower if certain expenses had not been reduced during the applicable periods shown.
H Expense ratios reflect operating expenses of the class. Expenses before reductions do not reflect amounts reimbursed by the investment adviser or reductions from expense offset arrangements and do not represent the amount paid by the class during periods when reimbursements or reductions occur. Expenses net of fee waivers reflect expenses after reimbursement by the investment adviser but prior to reductions from expense offset arrangements. Expenses net of all reductions represent the net expenses paid by the class but do not include expenses of the underlying funds in which the Fund invests.
I Amounts do not include the activity of the Underlying Funds.
J Annualized
See accompanying notes which are an integral part of the financial statements.
VIP Freedom 2050 Portfolio℠
Investment Summary (Unaudited)
The information in the following tables is based on the direct investments of the Fund.
Top Holdings as of June 30, 2018
| | % of fund's net assets |
| VIP Overseas Portfolio Initial Class | 21.1 |
| VIP Growth & Income Portfolio Initial Class | 12.7 |
| VIP Equity-Income Portfolio Initial Class | 11.1 |
| VIP Growth Portfolio Initial Class | 10.9 |
| VIP Contrafund Portfolio Initial Class | 10.6 |
| VIP Emerging Markets Portfolio Initial Class | 9.4 |
| VIP Value Portfolio Initial Class | 8.1 |
| VIP Value Strategies Portfolio Initial Class | 4.0 |
| Fidelity Long-Term Treasury Bond Index Fund Premium Class | 3.4 |
| VIP Mid Cap Portfolio Initial Class | 3.1 |
| | 94.4 |
Asset Allocation (% of fund's net assets)
| Period end |
| | Domestic Equity Funds | 60.5% |
| | International Equity Funds | 30.5% |
| | Bond Funds | 7.3% |
| | Short-Term Funds | 1.7% |

VIP Freedom 2050 Portfolio℠
Schedule of Investments June 30, 2018 (Unaudited)
Showing Percentage of Net Assets
| Domestic Equity Funds - 60.5% | | | |
| | | Shares | Value |
| VIP Contrafund Portfolio Initial Class (a) | | 78,886 | $2,812,280 |
| VIP Equity-Income Portfolio Initial Class (a) | | 132,958 | 2,955,662 |
| VIP Growth & Income Portfolio Initial Class (a) | | 156,502 | 3,361,654 |
| VIP Growth Portfolio Initial Class (a) | | 41,430 | 2,885,987 |
| VIP Mid Cap Portfolio Initial Class (a) | | 22,321 | 816,742 |
| VIP Value Portfolio Initial Class (a) | | 137,687 | 2,160,311 |
| VIP Value Strategies Portfolio Initial Class (a) | | 77,023 | 1,055,210 |
| TOTAL DOMESTIC EQUITY FUNDS | | | |
| (Cost $14,701,864) | | | 16,047,846 |
|
| International Equity Funds - 30.5% | | | |
| VIP Emerging Markets Portfolio Initial Class (a) | | 220,122 | 2,511,597 |
| VIP Overseas Portfolio Initial Class (a) | | 249,322 | 5,589,810 |
| TOTAL INTERNATIONAL EQUITY FUNDS | | | |
| (Cost $6,960,794) | | | 8,101,407 |
|
| Bond Funds - 7.3% | | | |
| Fidelity Inflation-Protected Bond Index Fund Premium Class (a) | | 50,937 | 500,198 |
| Fidelity Long-Term Treasury Bond Index Fund Premium Class (a) | | 70,818 | 899,384 |
| VIP High Income Portfolio Initial Class (a) | | 97,602 | 525,098 |
| VIP Investment Grade Bond Portfolio Initial Class (a) | | 406 | 5,068 |
| TOTAL BOND FUNDS | | | |
| (Cost $1,938,503) | | | 1,929,748 |
|
| Short-Term Funds - 1.7% | | | |
| VIP Government Money Market Portfolio Initial Class 1.71% (a)(b) | | | |
| (Cost $445,225) | | 445,225 | 445,225 |
| TOTAL INVESTMENT IN SECURITIES - 100.0% | | | |
| (Cost $24,046,386) | | | 26,524,226 |
| NET OTHER ASSETS (LIABILITIES) - 0.0% | | | (2,740) |
| NET ASSETS - 100% | | | $26,521,486 |
Legend
(a) Affiliated Fund
(b) The rate quoted is the annualized seven-day yield of the fund at period end.
Affiliated Underlying Funds
Fiscal year to date information regarding the Fund's investments in affiliated Underlying Funds, excluding any Money Market Central Funds, is presented below. Exchanges between classes of the same affiliated Underlying Funds may occur.
| Affiliate | Value, beginning of period | Purchases | Sales Proceeds | Dividend Income | Realized Gain (loss) | Change in Unrealized appreciation (depreciation) | Value, end of period |
| Fidelity Inflation-Protected Bond Index Fund Premium Class | $-- | $500,198 | $-- | $4 | $-- | $-- | $500,198 |
| Fidelity Long-Term Treasury Bond Index Fund Premium Class | 446,878 | 496,989 | 34,930 | 8,402 | (848 ) | (8,705) | 899,384 |
| VIP Contrafund Portfolio Initial Class | 2,199,150 | 937,830 | 194,731 | 203,298 | (4,139 ) | (125,830) | 2,812,280 |
| VIP Emerging Markets Portfolio Initial Class | 1,961,713 | 879,070 | 159,567 | 1,167 | (1,264 ) | (168,355) | 2,511,597 |
| VIP Equity-Income Portfolio Initial Class | 2,318,618 | 966,789 | 156,716 | 113,294 | (3,184 ) | (169,845) | 2,955,662 |
| VIP Government Money Market Portfolio Initial Class 1.71% | 535,216 | 211,679 | 301,670 | 3,829 | -- | -- | 445,225 |
| VIP Growth & Income Portfolio Initial Class | 2,659,604 | 1,081,956 | 235,478 | 156,019 | (5,273 ) | (139,155) | 3,361,654 |
| VIP Growth Portfolio Initial Class | 2,239,463 | 1,080,884 | 336,960 | 336,989 | (6,636 ) | (90,764) | 2,885,987 |
| VIP High Income Portfolio Initial Class | 412,135 | 161,698 | 42,561 | 4,130 | (319 ) | (5,855) | 525,098 |
| VIP Investment Grade Bond Portfolio Initial Class | 439,955 | 200,221 | 622,739 | 4,912 | (10,797 ) | (1,572) | 5,068 |
| VIP Mid Cap Portfolio Initial Class | 644,349 | 269,249 | 58,758 | 57,688 | (1,341 ) | (36,757) | 816,742 |
| VIP Overseas Portfolio Initial Class | 4,469,313 | 1,541,782 | 312,121 | 1,640 | (2,038 ) | (107,126) | 5,589,810 |
| VIP Value Portfolio Initial Class | 1,703,449 | 648,314 | 119,947 | 65,242 | (1,624 ) | (69,881) | 2,160,311 |
| VIP Value Strategies Portfolio Initial Class | 831,927 | 321,027 | 64,407 | 28,479 | (867 ) | (32,470) | 1,055,210 |
| Total | $20,861,770 | $9,297,686 | $2,640,585 | $985,093 | $(38,330 ) | $(956,315) | $26,524,226 |
Amounts in the income column in the above table include any capital gain distributions from underlying funds, which are presented in the corresponding line-item in the Statement of Operations if applicable.
Investment Valuation
All investments are categorized as Level 1 under the Fair Value Hierarchy. The inputs or methodology used for valuing securities may not be an indication of the risk associated with investing in those securities. For more information on valuation inputs please refer to the Investment Valuation section in the accompanying Notes to Financial Statements.
See accompanying notes which are an integral part of the financial statements.
VIP Freedom 2050 Portfolio℠
Financial Statements
Statement of Assets and Liabilities
| | | June 30, 2018 (Unaudited) |
| Assets | | |
Investment in securities, at value — See accompanying schedule:
| | |
| Affiliated issuers (cost $24,046,386) | $26,524,226 | |
| Total Investment in Securities (cost $24,046,386) | | $26,524,226 |
| Cash | | 1 |
| Receivable for investments sold | | 626,041 |
| Receivable for fund shares sold | | 239,311 |
| Total assets | | 27,389,579 |
| Liabilities | | |
| Payable for investments purchased | $863,291 | |
| Payable for fund shares redeemed | 2,052 | |
| Distribution and service plan fees payable | 2,750 | |
| Total liabilities | | 868,093 |
| Net Assets | | $26,521,486 |
| Net Assets consist of: | | |
| Paid in capital | | $23,302,772 |
| Undistributed net investment income | | 30,399 |
| Accumulated undistributed net realized gain (loss) on investments | | 710,475 |
| Net unrealized appreciation (depreciation) on investments | | 2,477,840 |
| Net Assets | | $26,521,486 |
| Initial Class: | | |
| Net Asset Value, offering price and redemption price per share ($7,311,506 ÷ 383,097 shares) | | $19.09 |
| Service Class: | | |
| Net Asset Value, offering price and redemption price per share ($9,584,393 ÷ 503,436 shares) | | $19.04 |
| Service Class 2: | | |
| Net Asset Value, offering price and redemption price per share ($9,625,587 ÷ 507,197 shares) | | $18.98 |
See accompanying notes which are an integral part of the financial statements.
Statement of Operations
| | | Six months ended June 30, 2018 (Unaudited) |
| Investment Income | | |
| Dividends: | | |
| Affiliated issuers | | $45,681 |
| Expenses | | |
| Distribution and service plan fees | $15,215 | |
| Independent trustees' fees and expenses | 68 | |
| Total expenses before reductions | 15,283 | |
| Expense reductions | (1) | |
| Total expenses after reductions | | 15,282 |
| Net investment income (loss) | | 30,399 |
| Realized and Unrealized Gain (Loss) | | |
| Net realized gain (loss) on: | | |
| Investment securities: | | |
| Affiliated issuers | (38,330) | |
| Capital gain distributions from underlying funds: | | |
| Affiliated issuers | 939,412 | |
| Total net realized gain (loss) | | 901,082 |
| Change in net unrealized appreciation (depreciation) on: | | |
| Investment securities: | | |
| Affiliated issuers | (956,315) | |
| Total change in net unrealized appreciation (depreciation) | | (956,315) |
| Net gain (loss) | | (55,233) |
| Net increase (decrease) in net assets resulting from operations | | $(24,834) |
See accompanying notes which are an integral part of the financial statements.
Statement of Changes in Net Assets
| | Six months ended June 30, 2018 (Unaudited) | Year ended December 31, 2017 |
| Increase (Decrease) in Net Assets | | |
| Operations | | |
| Net investment income (loss) | $30,399 | $221,405 |
| Net realized gain (loss) | 901,082 | 815,033 |
| Change in net unrealized appreciation (depreciation) | (956,315) | 3,036,282 |
| Net increase (decrease) in net assets resulting from operations | (24,834) | 4,072,720 |
| Distributions to shareholders from net investment income | – | (219,958) |
| Distributions to shareholders from net realized gain | (513,018) | (674,377) |
| Total distributions | (513,018) | (894,335) |
| Share transactions - net increase (decrease) | 6,199,779 | (166,904) |
| Total increase (decrease) in net assets | 5,661,927 | 3,011,481 |
| Net Assets | | |
| Beginning of period | 20,859,559 | 17,848,078 |
| End of period | $26,521,486 | $20,859,559 |
| Other Information | | |
| Undistributed net investment income end of period | $30,399 | $– |
See accompanying notes which are an integral part of the financial statements.
Financial Highlights
VIP Freedom 2050 Portfolio Initial Class
| | Six months ended (Unaudited) June 30, | Years endedDecember 31, | | | | |
| | 2018 | 2017 | 2016 | 2015 | 2014 | 2013 |
| Selected Per–Share Data | | | | | | |
| Net asset value, beginning of period | $19.50 | $16.55 | $16.42 | $16.86 | $16.55 | $13.41 |
| Income from Investment Operations | | | | | | |
| Net investment income (loss)A | .04 | .23 | .25 | .32 | .35 | .37 |
| Net realized and unrealized gain (loss) | –B | 3.58 | .75 | (.36) | .47 | 3.16 |
| Total from investment operations | .04 | 3.81 | 1.00 | (.04) | .82 | 3.53 |
| Distributions from net investment income | – | (.24) | (.25) | (.29) | (.25) | (.22) |
| Distributions from net realized gain | (.45) | (.63) | (.62) | (.11) | (.27) | (.18) |
| Total distributions | (.45) | (.86)C | (.87) | (.40) | (.51)D | (.39)E |
| Net asset value, end of period | $19.09 | $19.50 | $16.55 | $16.42 | $16.86 | $16.55 |
| Total ReturnF,G,H | .17% | 23.52% | 6.84% | (.29)% | 5.01% | 26.44% |
| Ratios to Average Net AssetsI,J | | | | | | |
| Expenses before reductionsK | - %L | -% | -% | -% | -% | -% |
| Expenses net of fee waivers, if any | - %K,L | -% | -% | -% | -% | -% |
| Expenses net of all reductions | - %K,L | -% | -% | -% | -% | -% |
| Net investment income (loss) | .38%L | 1.27% | 1.59% | 1.89% | 2.06% | 2.42% |
| Supplemental Data | | | | | | |
| Net assets, end of period (000 omitted) | $7,312 | $5,826 | $4,171 | $2,266 | $1,684 | $880 |
| Portfolio turnover rateJ | 22%L | 46% | 26% | 37% | 22% | 59% |
A Calculated based on average shares outstanding during the period.
B Amount represents less than $.005 per share.
C Total distributions of $.86 per share is comprised of distributions from net investment income of $.237 and distributions from net realized gain of $.625 per share.
D Total distributions of $.51 per share is comprised of distributions from net investment income of $.248 and distributions from net realized gain of $.266 per share.
E Total distributions of $.39 per share is comprised of distributions from net investment income of $.218 and distributions from net realized gain of $.175 per share.
F Total returns for periods of less than one year are not annualized.
G Total returns do not reflect charges attributable to your insurance company's separate account. Inclusion of these charges would reduce the total returns shown.
H Total returns would have been lower if certain expenses had not been reduced during the applicable periods shown.
I Expense ratios reflect operating expenses of the class. Expenses before reductions do not reflect amounts reimbursed by the investment adviser or reductions from expense offset arrangements and do not represent the amount paid by the class during periods when reimbursements or reductions occur. Expenses net of fee waivers reflect expenses after reimbursement by the investment adviser but prior to reductions from expense offset arrangements. Expenses net of all reductions represent the net expenses paid by the class but do not include expenses of the underlying funds in which the Fund invests.
J Amounts do not include the activity of the Underlying Funds.
K Amount represents less than .005%.
L Annualized
See accompanying notes which are an integral part of the financial statements.
VIP Freedom 2050 Portfolio Service Class
| | Six months ended (Unaudited) June 30, | Years endedDecember 31, | | | | |
| | 2018 | 2017 | 2016 | 2015 | 2014 | 2013 |
| Selected Per–Share Data | | | | | | |
| Net asset value, beginning of period | $19.47 | $16.52 | $16.39 | $16.83 | $16.54 | $13.41 |
| Income from Investment Operations | | | | | | |
| Net investment income (loss)A | .03 | .21 | .24 | .31 | .33 | .35 |
| Net realized and unrealized gain (loss) | (.01) | 3.59 | .74 | (.37) | .46 | 3.17 |
| Total from investment operations | .02 | 3.80 | .98 | (.06) | .79 | 3.52 |
| Distributions from net investment income | – | (.22) | (.23) | (.27) | (.24) | (.21) |
| Distributions from net realized gain | (.45) | (.63) | (.62) | (.11) | (.27) | (.18) |
| Total distributions | (.45) | (.85) | (.85) | (.38) | (.50)B | (.39) |
| Net asset value, end of period | $19.04 | $19.47 | $16.52 | $16.39 | $16.83 | $16.54 |
| Total ReturnC,D,E | .07% | 23.46% | 6.75% | (.38)% | 4.81% | 26.32% |
| Ratios to Average Net AssetsF,G | | | | | | |
| Expenses before reductions | .10%H | .10% | .10% | .10% | .10% | .10% |
| Expenses net of fee waivers, if any | .10%H | .10% | .10% | .10% | .10% | .10% |
| Expenses net of all reductions | .10%H | .10% | .10% | .10% | .10% | .10% |
| Net investment income (loss) | .28%H | 1.17% | 1.49% | 1.79% | 1.96% | 2.32% |
| Supplemental Data | | | | | | |
| Net assets, end of period (000 omitted) | $9,584 | $6,748 | $4,205 | $3,004 | $2,878 | $1,892 |
| Portfolio turnover rateG | 22%H | 46% | 26% | 37% | 22% | 59% |
A Calculated based on average shares outstanding during the period.
B Total distributions of $.50 per share is comprised of distributions from net investment income of $.236 and distributions from net realized gain of $.266 per share.
C Total returns for periods of less than one year are not annualized.
D Total returns do not reflect charges attributable to your insurance company's separate account. Inclusion of these charges would reduce the total returns shown.
E Total returns would have been lower if certain expenses had not been reduced during the applicable periods shown.
F Expense ratios reflect operating expenses of the class. Expenses before reductions do not reflect amounts reimbursed by the investment adviser or reductions from expense offset arrangements and do not represent the amount paid by the class during periods when reimbursements or reductions occur. Expenses net of fee waivers reflect expenses after reimbursement by the investment adviser but prior to reductions from expense offset arrangements. Expenses net of all reductions represent the net expenses paid by the class but do not include expenses of the underlying funds in which the Fund invests.
G Amounts do not include the activity of the Underlying Funds.
H Annualized
See accompanying notes which are an integral part of the financial statements.
VIP Freedom 2050 Portfolio Service Class 2
| | Six months ended (Unaudited) June 30, | Years endedDecember 31, | | | | |
| | 2018 | 2017 | 2016 | 2015 | 2014 | 2013 |
| Selected Per–Share Data | | | | | | |
| Net asset value, beginning of period | $19.42 | $16.47 | $16.35 | $16.80 | $16.51 | $13.39 |
| Income from Investment Operations | | | | | | |
| Net investment income (loss)A | .01 | .18 | .21 | .28 | .30 | .33 |
| Net realized and unrealized gain (loss) | –B | 3.58 | .74 | (.37) | .47 | 3.16 |
| Total from investment operations | .01 | 3.76 | .95 | (.09) | .77 | 3.49 |
| Distributions from net investment income | – | (.18) | (.21) | (.25) | (.22) | (.19) |
| Distributions from net realized gain | (.45) | (.63) | (.62) | (.11) | (.27) | (.18) |
| Total distributions | (.45) | (.81) | (.83) | (.36) | (.48)C | (.37) |
| Net asset value, end of period | $18.98 | $19.42 | $16.47 | $16.35 | $16.80 | $16.51 |
| Total ReturnD,E,F | .01% | 23.30% | 6.56% | (.58)% | 4.71% | 26.13% |
| Ratios to Average Net AssetsG,H | | | | | | |
| Expenses before reductions | .25%I | .25% | .25% | .25% | .25% | .25% |
| Expenses net of fee waivers, if any | .25%I | .25% | .25% | .25% | .25% | .25% |
| Expenses net of all reductions | .25%I | .25% | .25% | .25% | .25% | .25% |
| Net investment income (loss) | .13%I | 1.02% | 1.34% | 1.64% | 1.81% | 2.17% |
| Supplemental Data | | | | | | |
| Net assets, end of period (000 omitted) | $9,626 | $8,285 | $9,472 | $7,649 | $6,436 | $1,666 |
| Portfolio turnover rateH | 22%I | 46% | 26% | 37% | 22% | 59% |
A Calculated based on average shares outstanding during the period.
B Amount represents less than $.005 per share.
C Total distributions of $.48 per share is comprised of distributions from net investment income of $.218 and distributions from net realized gain of $.266 per share.
D Total returns for periods of less than one year are not annualized.
E Total returns do not reflect charges attributable to your insurance company's separate account. Inclusion of these charges would reduce the total returns shown.
F Total returns would have been lower if certain expenses had not been reduced during the applicable periods shown.
G Expense ratios reflect operating expenses of the class. Expenses before reductions do not reflect amounts reimbursed by the investment adviser or reductions from expense offset arrangements and do not represent the amount paid by the class during periods when reimbursements or reductions occur. Expenses net of fee waivers reflect expenses after reimbursement by the investment adviser but prior to reductions from expense offset arrangements. Expenses net of all reductions represent the net expenses paid by the class but do not include expenses of the underlying funds in which the Fund invests.
H Amounts do not include the activity of the Underlying Funds.
I Annualized
See accompanying notes which are an integral part of the financial statements.
Notes to Financial Statements (Unaudited)
For the period ended June 30, 2018
1. Organization.
VIP Freedom Income Portfolio, VIP Freedom 2005 Portfolio, VIP Freedom 2010 Portfolio, VIP Freedom 2015 Portfolio, VIP Freedom 2020 Portfolio, VIP Freedom 2025 Portfolio, VIP Freedom 2030 Portfolio, VIP Freedom 2035 Portfolio, VIP Freedom 2040 Portfolio, VIP Freedom 2045 Portfolio and VIP Freedom 2050 Portfolio (the Funds) are funds of Variable Insurance Products Fund V (the Trust). The Trust is registered under the Investment Company Act of 1940, as amended (the 1940 Act), as an open-end management investment company organized as a Massachusetts business trust. Each Fund is authorized to issue an unlimited number of shares. The Funds invest primarily in a combination of other VIP equity, bond, and short-term funds (the Underlying Funds) managed by Fidelity Management & Research Company (FMR). Shares of each Fund may only be purchased by insurance companies for the purpose of funding variable annuity or variable life insurance contracts. Each Fund offers three classes of shares: Initial Class shares, Service Class shares and Service Class 2 shares. All classes have equal rights and voting privileges, except for matters affecting a single class.
2. Investments in Fidelity Central Funds.
The Funds invests in Fidelity Central Funds, which are open-end investment companies generally available only to other investment companies and accounts managed by the investment adviser and its affiliates. The Funds' Schedules of Investments list each of the Fidelity Central Funds held as of period end, if any, as an investment of each Fund, but does not include the underlying holdings of each Fidelity Central Fund. As an Investing Fund, each Fund indirectly bears its proportionate share of the expenses of the underlying Fidelity Central Funds.
The Money Market Central Funds seek preservation of capital and current income and are managed by Fidelity Investments Money Management, Inc. (FIMM), an affiliate of the investment adviser. Annualized expenses of the Money Market Central Funds as of their most recent shareholder report date are less than .005%.
A complete unaudited list of holdings for each Fidelity Central Fund is available upon request or at the Securities and Exchange Commission (the SEC) website at www.sec.gov. In addition, the financial statements of the Fidelity Central Funds are available on the SEC website or upon request.
3. Significant Accounting Policies.
Each Fund is an investment company and applies the accounting and reporting guidance of the Financial Accounting Standards Board (FASB) Accounting Standards Codification Topic 946 Financial Services – Investments Companies. The financial statements have been prepared in conformity with accounting principles generally accepted in the United States of America (GAAP), which require management to make certain estimates and assumptions at the date of the financial statements. Actual results could differ from those estimates. Subsequent events, if any, through the date that the financial statements were issued have been evaluated in the preparation of the financial statements. The following summarizes the significant accounting policies of the Funds:
Investment Valuation. Investments are valued as of 4:00 p.m. Eastern time on the last calendar day of the period. Each Fund categorizes the inputs to valuation techniques used to value its investments into a disclosure hierarchy consisting of three levels as shown below:
- Level 1 – quoted prices in active markets for identical investments
- Level 2 – other significant observable inputs (including quoted prices for similar investments, interest rates, prepayment speeds, etc.)
- Level 3 – unobservable inputs (including the Fund's own assumptions based on the best information available)
Valuation techniques used to value each Fund's investments by major category are as follows. Investments in the Underlying Funds are valued at their closing net asset value (NAV) each business day and are categorized as Level 1 in the hierarchy.
Investment Transactions and Income. For financial reporting purposes, the Funds' investment holdings and NAV include trades executed through the end of the last business day of the period. The NAV per share for processing shareholder transactions is calculated as of the close of business of the New York Stock Exchange (NYSE), normally 4:00 p.m. Eastern time and includes trades executed through the end of the prior business day. Gains and losses on securities sold are determined on the basis of identified cost. Income and capital gain distributions from the Underlying Funds, if any, are recorded on the ex-dividend date.
Class Allocations and Expenses. Investment income, realized and unrealized capital gains and losses, common expenses of each Fund, and certain fund-level expense reductions, if any, are allocated daily on a pro-rata basis to each class based on the relative net assets of each class to the total net assets of each Fund. Each class differs with respect to distribution and service plan fees incurred. Certain expense reductions may also differ by class. For the reporting period, the allocated portion of income and expenses to each class as a percent of its average net assets may vary due to the timing of recording these transactions in relation to fluctuating net assets of the classes. Expenses directly attributable to a fund are charged to that fund. Expenses attributable to more than one fund are allocated among the respective funds on the basis of relative net assets or other appropriate methods. Expenses included in the accompanying financial statements reflect the expenses of each Fund and do not include any expenses associated with the Underlying Funds. Although not included in each Fund's expenses, each Fund indirectly bears its proportionate share of the Underlying Funds' expenses through the impact of these expenses on each Underlying Fund's NAV. Expense estimates are accrued in the period to which they relate and adjustments are made when actual amounts are known.
Income Tax Information and Distributions to Shareholders. Each year, each Fund intends to qualify as a regulated investment company under Subchapter M of the Internal Revenue Code, including distributing substantially all of its taxable income and realized gains. As a result, no provision for U.S. Federal income taxes is required. Each Fund files a U.S. federal tax return, in addition to state and local tax returns as required. Each Fund's federal income tax returns are subject to examination by the Internal Revenue Service (IRS) for a period of three fiscal years after they are filed. State and local tax returns may be subject to examination for an additional fiscal year depending on the jurisdiction.
Distributions are declared and recorded on the ex-dividend date. Income and capital gain distributions are declared separately for each class. Income and capital gain distributions are determined in accordance with income tax regulations, which may differ from GAAP.
Capital accounts within the financial statements are adjusted for permanent book-tax differences. These adjustments have no impact on net assets or the results of operations. Capital accounts are not adjusted for temporary book-tax differences which will reverse in a subsequent period.
Book-tax differences are primarily due to the short-term gain distributions from the Underlying Funds, losses deferred due to wash sales and excise tax regulations.
As of period end, the cost and unrealized appreciation (depreciation) in securities, and derivatives if applicable, for federal income tax purposes were as follows for each Fund:
| | Tax cost | Gross unrealized appreciation | Gross unrealized depreciation | Net unrealized appreciation (depreciation) |
| VIP Freedom Income | $40,948,786 | $2,542,499 | $(418,691) | $2,123,808 |
| VIP Freedom 2005 | 9,773,447 | 680,436 | (99,509) | 580,927 |
| VIP Freedom 2010 | 266,926,669 | 38,403,241 | (2,423,176) | 35,980,065 |
| VIP Freedom 2015 | 74,135,228 | 18,072,820 | (376,033) | 17,696,787 |
| VIP Freedom 2020 | 591,329,284 | 145,109,665 | (5,606,983) | 139,502,682 |
| VIP Freedom 2025 | 155,341,447 | 26,193,326 | (1,540,122) | 24,653,204 |
| VIP Freedom 2030 | 289,944,691 | 61,772,814 | (2,880,139) | 58,892,675 |
| VIP Freedom 2035 | 63,734,123 | 5,600,778 | (745,401) | 4,855,377 |
| VIP Freedom 2040 | 78,003,553 | 9,463,755 | (744,672) | 8,719,083 |
| VIP Freedom 2045 | 35,368,547 | 2,843,216 | (597,932) | 2,245,284 |
| VIP Freedom 2050 | 24,241,772 | 2,586,598 | (304,144) | 2,282,454 |
4. Purchases and Sales of Investments.
Purchases and sales of securities, other than short-term securities, are noted in the table below.
| | Purchases ($) | Redemptions ($) |
| VIP Freedom Income | 12,309,399 | 10,615,976 |
| VIP Freedom 2005 | 2,838,188 | 1,497,496 |
| VIP Freedom 2010 | 43,479,071 | 47,682,549 |
| VIP Freedom 2015 | 14,513,468 | 19,679,862 |
| VIP Freedom 2020 | 101,879,490 | 117,628,976 |
| VIP Freedom 2025 | 45,375,041 | 30,068,912 |
| VIP Freedom 2030 | 70,061,126 | 37,629,492 |
| VIP Freedom 2035 | 22,222,139 | 7,363,269 |
| VIP Freedom 2040 | 22,535,876 | 10,845,359 |
| VIP Freedom 2045 | 11,274,085 | 2,930,938 |
| VIP Freedom 2050 | 9,297,686 | 2,640,585 |
5. Fees and Other Transactions with Affiliates.
Management Fee. FMR Co., Inc. (the investment adviser), an affiliate of FMR, provides the Funds with investment management related services. The Funds do not pay any fees for these services.
Other Transactions. The investment adviser has entered into an administration agreement with FMR under which FMR provides management and administrative services (other than investment advisory services) necessary for the operation of each Fund. Pursuant to this agreement, FMR pays all expenses of each Fund, excluding distribution and service plan fees, compensation of the independent Trustees and certain other expenses such as interest expense. FMR also contracts with other Fidelity companies to perform the services necessary for the operation of each Fund. The Funds do not pay any fees for these services.
Distribution and Service Plan Fees. In accordance with Rule 12b-1 of the 1940 Act, the Funds have adopted separate 12b-1 Plans for each Service Class of shares. Each Service Class pays Fidelity Distributors Corporation (FDC), an affiliate of the investment adviser, a service fee. For the period, the service fee is based on an annual rate of .10% of Service Class' average net assets and .25% of Service Class 2's average net assets.
For the period, total fees, all of which were reallowed to insurance companies for the distribution of shares and providing shareholder support services were as follows:
| | Service Class | Service Class 2 | Total |
| VIP Freedom Income | $5,715 | $18,635 | $24,350 |
| VIP Freedom 2005 | 804 | 133 | 937 |
| VIP Freedom 2010 | 13,312 | 331,869 | 345,181 |
| VIP Freedom 2015 | 8,050 | 58,595 | 66,645 |
| VIP Freedom 2020 | 72,187 | 677,949 | 750,136 |
| VIP Freedom 2025 | 36,723 | 80,662 | 117,385 |
| VIP Freedom 2030 | 58,897 | 183,380 | 242,277 |
| VIP Freedom 2035 | 5,295 | 54,659 | 59,954 |
| VIP Freedom 2040 | 23,723 | 20,569 | 44,292 |
| VIP Freedom 2045 | 1,226 | 37,805 | 39,031 |
| VIP Freedom 2050 | 4,360 | 10,855 | 15,215 |
6. Expense Reductions.
Through arrangements with each applicable Fund's custodian, credits realized as a result of certain uninvested cash balances were used to reduce each applicable Fund's expenses. During the period, these credits reduced each applicable Fund's expenses by the following amounts:
| VIP Freedom Income | $– |
| VIP Freedom 2005 | – |
| VIP Freedom 2010 | – |
| VIP Freedom 2015 | 1 |
| VIP Freedom 2020 | 5 |
| VIP Freedom 2025 | 2 |
| VIP Freedom 2030 | 5 |
| VIP Freedom 2035 | 1 |
| VIP Freedom 2040 | 2 |
| VIP Freedom 2045 | – |
| VIP Freedom 2050 | 1 |
7. Distributions to Shareholders.
Distributions to shareholders of each class were as follows:
| | Six months ended
June 30, 2018 | Year ended
December 31, 2017 |
| VIP Freedom Income | | |
| From net investment income | | |
| Initial Class | $2,676 | $245,249 |
| Service Class | 1,899 | 182,242 |
| Service Class 2 | 2,487 | 191,980 |
| Total | $7,062 | $619,471 |
| From net realized gain | | |
| Initial Class | $147,187 | $130,464 |
| Service Class | 104,429 | 91,120 |
| Service Class 2 | 136,806 | 123,976 |
| Total | $388,422 | $345,560 |
| VIP Freedom 2005 | | |
| From net investment income | | |
| Initial Class | $2,041 | $117,398 |
| Service Class | 299 | 13,679 |
| Service Class 2 | 26 | 1,322 |
| Total | $2,366 | $132,399 |
| From net realized gain | | |
| Initial Class | $107,506 | $111,476 |
| Service Class | 15,756 | 14,672 |
| Service Class 2 | 1,355 | 1,508 |
| Total | $124,617 | $127,656 |
| VIP Freedom 2010 | | |
| From net investment income | | |
| Initial Class | $3,904 | $277,746 |
| Service Class | 6,162 | 371,542 |
| Service Class 2 | 60,631 | 3,412,012 |
| Total | $70,697 | $4,061,300 |
| From net realized gain | | |
| Initial Class | $445,056 | $389,757 |
| Service Class | 702,491 | 563,752 |
| Service Class 2 | 6,911,982 | 5,335,602 |
| Total | $8,059,529 | $6,289,111 |
| VIP Freedom 2015 | | |
| From net investment income | | |
| Initial Class | $7,305 | $491,317 |
| Service Class | 3,668 | 247,128 |
| Service Class 2 | 10,572 | 614,650 |
| Total | $21,545 | $1,353,095 |
| From net realized gain | | |
| Initial Class | $1,200,396 | $867,181 |
| Service Class | 602,824 | 447,160 |
| Service Class 2 | 1,737,260 | 1,353,788 |
| Total | $3,540,480 | $2,668,129 |
| VIP Freedom 2020 | | |
| From net investment income | | |
| Initial Class | $5,292 | $1,093,675 |
| Service Class | 10,288 | 1,966,503 |
| Service Class 2 | 39,461 | 6,826,356 |
| Total | $55,041 | $9,886,534 |
| From net realized gain | | |
| Initial Class | $2,121,944 | $1,906,359 |
| Service Class | 4,125,506 | 3,390,053 |
| Service Class 2 | 15,823,783 | 15,296,971 |
| Total | $22,071,233 | $20,593,383 |
| VIP Freedom 2025 | | |
| From net investment income | | |
| Initial Class | $5,377 | $527,487 |
| Service Class | 9,746 | 959,236 |
| Service Class 2 | 8,624 | 752,835 |
| Total | $23,747 | $2,239,558 |
| From net realized gain | | |
| Initial Class | $672,167 | $868,126 |
| Service Class | 1,218,260 | 1,583,861 |
| Service Class 2 | 1,077,948 | 1,709,386 |
| Total | $2,968,375 | $4,161,373 |
| VIP Freedom 2030 | | |
| From net investment income | | |
| Initial Class | $10,692 | $978,373 |
| Service Class | 15,636 | 1,347,092 |
| Service Class 2 | 19,836 | 1,561,662 |
| Total | $46,164 | $3,887,127 |
| From net realized gain | | |
| Initial Class | $1,651,870 | $2,303,629 |
| Service Class | 2,415,746 | 2,973,121 |
| Service Class 2 | 3,064,682 | 5,010,949 |
| Total | $7,132,298 | $10,287,699 |
| VIP Freedom 2035 | | |
| From net investment income | | |
| Initial Class | $– | $70,187 |
| Service Class | – | 88,032 |
| Service Class 2 | – | 384,424 |
| Total | $– | $542,643 |
| From net realized gain | | |
| Initial Class | $114,443 | $140,451 |
| Service Class | 145,623 | 204,558 |
| Service Class 2 | 671,326 | 1,076,662 |
| Total | $931,392 | $1,421,671 |
| VIP Freedom 2040 | | |
| From net investment income | | |
| Initial Class | $– | $184,505 |
| Service Class | – | 478,145 |
| Service Class 2 | – | 140,824 |
| Total | $– | $803,474 |
| From net realized gain | | |
| Initial Class | $294,824 | $430,744 |
| Service Class | 746,823 | 997,542 |
| Service Class 2 | 276,156 | 504,137 |
| Total | $1,317,803 | $1,932,423 |
| VIP Freedom 2045 | | |
| From net investment income | | |
| Initial Class | $– | $16,172 |
| Service Class | – | 19,063 |
| Service Class 2 | – | 246,613 |
| Total | $– | $281,848 |
| From net realized gain | | |
| Initial Class | $27,135 | $33,609 |
| Service Class | 28,162 | 31,431 |
| Service Class 2 | 394,874 | 685,217 |
| Total | $450,171 | $750,257 |
| VIP Freedom 2050 | | |
| From net investment income | | |
| Initial Class | $– | $69,125 |
| Service Class | – | 75,422 |
| Service Class 2 | – | 75,411 |
| Total | $– | $219,958 |
| From net realized gain | | |
| Initial Class | $139,035 | $167,295 |
| Service Class | 182,707 | 177,468 |
| Service Class 2 | 191,276 | 329,614 |
| Total | $513,018 | $674,377 |
8. Share Transactions.
Transactions for each class of shares were as follows:
| | Shares | Shares | Dollars | Dollars |
| | Six months ended June 30, 2018 | Year ended December 31, 2017 | Six months ended June 30, 2018 | Year ended December 31, 2017 |
| VIP Freedom Income | | | | |
| Initial Class | | | | |
| Shares sold | 112,000 | 293,531 | $1,289,160 | $3,367,839 |
| Reinvestment of distributions | 13,054 | 32,689 | 149,863 | 375,713 |
| Shares redeemed | (173,510) | (306,177) | (2,001,380) | (3,513,364) |
| Net increase (decrease) | (48,456) | 20,043 | $(562,357) | $230,188 |
| Service Class | | | | |
| Shares sold | 403,418 | 508,631 | $4,631,679 | $5,845,958 |
| Reinvestment of distributions | 9,270 | 23,774 | 106,328 | 273,362 |
| Shares redeemed | (357,008) | (413,202) | (4,115,554) | (4,752,400) |
| Net increase (decrease) | 55,680 | 119,203 | $622,453 | $1,366,920 |
| Service Class 2 | | | | |
| Shares sold | 365,574 | 385,129 | $4,173,838 | $4,396,219 |
| Reinvestment of distributions | 12,187 | 27,648 | 139,293 | 315,956 |
| Shares redeemed | (255,407) | (407,047) | (2,935,526) | (4,602,389) |
| Net increase (decrease) | 122,354 | 5,730 | $1,377,605 | $109,786 |
| VIP Freedom 2005 | | | | |
| Initial Class | | | | |
| Shares sold | 68,457 | 147,674 | $849,738 | $1,796,599 |
| Reinvestment of distributions | 8,972 | 18,899 | 109,547 | 228,874 |
| Shares redeemed | (24,490) | (78,937) | (299,207) | (965,531) |
| Net increase (decrease) | 52,939 | 87,636 | $660,078 | $1,059,942 |
| Service Class | | | | |
| Shares sold | 74,384 | 110,712 | $913,041 | $1,346,116 |
| Reinvestment of distributions | 1,306 | 2,332 | 16,055 | 28,351 |
| Shares redeemed | (26,677) | (63,106) | (329,500) | (770,786) |
| Net increase (decrease) | 49,013 | 49,938 | $599,596 | $603,681 |
| Service Class 2 | | | | |
| Shares sold | 1,478 | 2,646 | $18,048 | $32,004 |
| Reinvestment of distributions | 113 | 235 | 1,381 | 2,830 |
| Shares redeemed | (769) | (1,659) | (9,421) | (19,880) |
| Net increase (decrease) | 822 | 1,222 | $10,008 | $14,954 |
| VIP Freedom 2010 | | | | |
| Initial Class | | | | |
| Shares sold | 51,019 | 355,606 | $673,151 | $4,619,619 |
| Reinvestment of distributions | 34,272 | 51,552 | 448,960 | 667,503 |
| Shares redeemed | (136,605) | (617,919) | (1,826,647) | (8,096,481) |
| Net increase (decrease) | (51,314) | (210,761) | $(704,536) | $(2,809,359) |
| Service Class | | | | |
| Shares sold | 285,655 | 613,852 | $3,770,681 | $7,896,480 |
| Reinvestment of distributions | 54,178 | 72,433 | 708,653 | 935,294 |
| Shares redeemed | (472,512) | (691,276) | (6,214,070) | (8,862,469) |
| Net increase (decrease) | (132,679) | (4,991) | $(1,734,736) | $(30,695) |
| Service Class 2 | | | | |
| Shares sold | 551,096 | 923,947 | $7,235,870 | $11,906,015 |
| Reinvestment of distributions | 535,943 | 680,272 | 6,972,613 | 8,747,614 |
| Shares redeemed | (1,146,270) | (1,987,454) | (14,987,360) | (25,606,406) |
| Net increase (decrease) | (59,231) | (383,235) | $(778,877) | $(4,952,777) |
| VIP Freedom 2015 | | | | |
| Initial Class | | | | |
| Shares sold | 73,745 | 119,565 | $994,711 | $1,582,374 |
| Reinvestment of distributions | 91,285 | 104,146 | 1,207,701 | 1,358,498 |
| Shares redeemed | (172,113) | (434,408) | (2,283,569) | (5,715,907) |
| Net increase (decrease) | (7,083) | (210,697) | $(81,157) | $(2,775,035) |
| Service Class | | | | |
| Shares sold | 186,253 | 525,227 | $2,478,936 | $6,789,935 |
| Reinvestment of distributions | 45,946 | 53,299 | 606,492 | 694,288 |
| Shares redeemed | (323,870) | (492,331) | (4,307,115) | (6,446,194) |
| Net increase (decrease) | (91,671) | 86,195 | $(1,221,687) | $1,038,029 |
| Service Class 2 | | | | |
| Shares sold | 147,933 | 642,081 | $1,967,484 | $8,345,564 |
| Reinvestment of distributions | 132,915 | 152,186 | 1,747,832 | 1,968,438 |
| Shares redeemed | (501,881) | (1,218,651) | (6,676,356) | (15,866,083) |
| Net increase (decrease) | (221,033) | (424,384) | $(2,961,040) | $(5,552,081) |
| VIP Freedom 2020 | | | | |
| Initial Class | | | | |
| Shares sold | 390,127 | 1,055,267 | $5,375,124 | $14,118,345 |
| Reinvestment of distributions | 155,386 | 224,853 | 2,127,236 | 3,000,034 |
| Shares redeemed | (595,020) | (957,719) | (8,178,829) | (12,901,746) |
| Net increase (decrease) | (49,507) | 322,401 | $(676,469) | $4,216,633 |
| Service Class | | | | |
| Shares sold | 1,722,449 | 3,660,093 | $23,698,936 | $48,649,057 |
| Reinvestment of distributions | 302,989 | 402,089 | 4,135,794 | 5,356,556 |
| Shares redeemed | (2,042,976) | (2,726,653) | (27,946,099) | (36,633,358) |
| Net increase (decrease) | (17,538) | 1,335,529 | $(111,369) | $17,372,255 |
| Service Class 2 | | | | |
| Shares sold | 664,021 | 1,175,113 | $9,104,228 | $15,699,528 |
| Reinvestment of distributions | 1,165,558 | 1,676,903 | 15,863,244 | 22,123,327 |
| Shares redeemed | (3,018,202) | (5,501,937) | (41,084,390) | (73,080,246) |
| Net increase (decrease) | (1,188,623) | (2,649,921) | $(16,116,918) | $(35,257,391) |
| VIP Freedom 2025 | | | | |
| Initial Class | | | | |
| Shares sold | 273,173 | 595,839 | $3,997,324 | $8,237,329 |
| Reinvestment of distributions | 46,759 | 100,153 | 677,544 | 1,395,613 |
| Shares redeemed | (253,587) | (228,576) | (3,659,581) | (3,190,637) |
| Net increase (decrease) | 66,345 | 467,416 | $1,015,287 | $6,442,305 |
| Service Class | | | | |
| Shares sold | 1,076,358 | 1,823,019 | $15,499,879 | $25,287,132 |
| Reinvestment of distributions | 84,983 | 182,732 | 1,228,006 | 2,543,097 |
| Shares redeemed | (650,027) | (991,180) | (9,373,356) | (13,974,658) |
| Net increase (decrease) | 511,314 | 1,014,571 | $7,354,529 | $13,855,571 |
| Service Class 2 | | | | |
| Shares sold | 674,522 | 1,292,225 | $9,702,455 | $17,812,495 |
| Reinvestment of distributions | 75,561 | 179,466 | 1,086,572 | 2,462,221 |
| Shares redeemed | (439,667) | (1,754,914) | (6,372,258) | (24,190,982) |
| Net increase (decrease) | 310,416 | (283,223) | $4,416,769 | $(3,916,266) |
| VIP Freedom 2030 | | | | |
| Initial Class | | | | |
| Shares sold | 774,371 | 1,092,781 | $11,318,298 | $15,118,240 |
| Reinvestment of distributions | 114,580 | 239,670 | 1,662,562 | 3,282,002 |
| Shares redeemed | (579,969) | (804,646) | (8,372,557) | (11,216,758) |
| Net increase (decrease) | 308,982 | 527,805 | $4,608,303 | $7,183,484 |
| Service Class | | | | |
| Shares sold | 1,492,973 | 2,991,525 | $21,724,246 | $41,438,157 |
| Reinvestment of distributions | 167,913 | 314,598 | 2,431,382 | 4,320,213 |
| Shares redeemed | (690,952) | (1,263,919) | (10,022,211) | (17,341,408) |
| Net increase (decrease) | 969,934 | 2,042,204 | $14,133,417 | $28,416,962 |
| Service Class 2 | | | | |
| Shares sold | 1,102,654 | 1,854,818 | $15,909,386 | $25,505,152 |
| Reinvestment of distributions | 213,757 | 486,626 | 3,084,518 | 6,572,611 |
| Shares redeemed | (747,805) | (2,895,582) | (10,814,305) | (39,677,230) |
| Net increase (decrease) | 568,606 | (554,138) | $8,179,599 | $(7,599,467) |
| VIP Freedom 2035 | | | | |
| Initial Class | | | | |
| Shares sold | 86,347 | 124,799 | $1,990,220 | $2,780,437 |
| Reinvestment of distributions | 5,008 | 9,786 | 114,443 | 210,638 |
| Shares redeemed | (17,381) | (45,395) | (397,900) | (980,553) |
| Net increase (decrease) | 73,974 | 89,190 | $1,706,763 | $2,010,522 |
| Service Class | | | | |
| Shares sold | 239,783 | 169,721 | $5,444,348 | $3,619,279 |
| Reinvestment of distributions | 6,384 | 13,698 | 145,623 | 292,590 |
| Shares redeemed | (24,339) | (57,075) | (555,265) | (1,180,081) |
| Net increase (decrease) | 221,828 | 126,344 | $5,034,706 | $2,731,788 |
| Service Class 2 | | | | |
| Shares sold | 450,747 | 735,396 | $10,191,401 | $15,625,496 |
| Reinvestment of distributions | 29,587 | 69,106 | 671,326 | 1,461,086 |
| Shares redeemed | (186,926) | (448,068) | (4,257,730) | (9,435,791) |
| Net increase (decrease) | 293,408 | 356,434 | $6,604,997 | $7,650,791 |
| VIP Freedom 2040 | | | | |
| Initial Class | | | | |
| Shares sold | 190,044 | 265,813 | $4,143,944 | $5,363,355 |
| Reinvestment of distributions | 13,574 | 30,326 | 294,824 | 615,249 |
| Shares redeemed | (58,038) | (161,045) | (1,284,018) | (3,233,889) |
| Net increase (decrease) | 145,580 | 135,094 | $3,154,750 | $2,744,715 |
| Service Class | | | | |
| Shares sold | 454,735 | 1,108,841 | $9,760,439 | $22,535,004 |
| Reinvestment of distributions | 34,448 | 72,159 | 746,823 | 1,475,687 |
| Shares redeemed | (242,446) | (338,036) | (5,268,441) | (6,876,084) |
| Net increase (decrease) | 246,737 | 842,964 | $5,238,821 | $17,134,607 |
| Service Class 2 | | | | |
| Shares sold | 152,366 | 224,919 | $3,276,975 | $4,501,983 |
| Reinvestment of distributions | 12,785 | 32,420 | 276,156 | 644,961 |
| Shares redeemed | (110,689) | (324,956) | (2,360,103) | (6,527,694) |
| Net increase (decrease) | 54,462 | (67,617) | $1,193,028 | $(1,380,750) |
| VIP Freedom 2045 | | | | |
| Initial Class | | | | |
| Shares sold | 43,473 | 32,752 | $949,466 | $676,065 |
| Reinvestment of distributions | 1,252 | 2,452 | 27,135 | 49,781 |
| Shares redeemed | (1,923) | (9,404) | (41,547) | (190,642) |
| Net increase (decrease) | 42,802 | 25,800 | $935,054 | $535,204 |
| Service Class | | | | |
| Shares sold | 66,903 | 77,197 | $1,437,366 | $1,573,429 |
| Reinvestment of distributions | 1,301 | 2,448 | 28,162 | 50,494 |
| Shares redeemed | (19,038) | (12,312) | (408,836) | (243,713) |
| Net increase (decrease) | 49,166 | 67,333 | $1,056,692 | $1,380,210 |
| Service Class 2 | | | | |
| Shares sold | 305,397 | 585,284 | $6,612,117 | $11,866,438 |
| Reinvestment of distributions | 18,332 | 46,595 | 394,874 | 931,830 |
| Shares redeemed | (76,469) | (273,338) | (1,641,361) | (5,435,275) |
| Net increase (decrease) | 247,260 | 358,541 | $5,365,630 | $7,362,993 |
| VIP Freedom 2050 | | | | |
| Initial Class | | | | |
| Shares sold | 96,457 | 87,242 | $1,859,293 | $1,592,168 |
| Reinvestment of distributions | 7,185 | 13,043 | 139,035 | 236,420 |
| Shares redeemed | (19,294) | (53,636) | (373,214) | (983,739) |
| Net increase (decrease) | 84,348 | 46,649 | $1,625,114 | $844,849 |
| Service Class | | | | |
| Shares sold | 170,062 | 183,141 | $3,297,931 | $3,380,759 |
| Reinvestment of distributions | 9,462 | 13,917 | 182,707 | 252,890 |
| Shares redeemed | (22,747) | (104,937) | (437,076) | (1,983,735) |
| Net increase (decrease) | 156,777 | 92,121 | $3,043,562 | $1,649,914 |
| Service Class 2 | | | | |
| Shares sold | 149,756 | 170,001 | $2,879,569 | $3,050,110 |
| Reinvestment of distributions | 9,931 | 22,932 | 191,276 | 405,025 |
| Shares redeemed | (79,133) | (341,246) | (1,539,742) | (6,116,802) |
| Net increase (decrease) | 80,554 | (148,313) | $1,531,103 | $(2,661,667) |
9. Other.
The Funds' organizational documents provide former and current trustees and officers with a limited indemnification against liabilities arising in connection with the performance of their duties to the Funds. In the normal course of business, the Funds may also enter into contracts that provide general indemnifications. The Funds' maximum exposure under these arrangements is unknown as this would be dependent on future claims that may be made against the Funds. The risk of material loss from such claims is considered remote.
The Funds do not invest in the Underlying Funds for the purpose of exercising management or control; however, investments by the Funds within their principal investment strategies may represent a significant portion of the Underlying Fund's net assets. At the end of the period, the following Funds were the owners of record of 10% or more of the total outstanding shares of the Underlying Funds.
| Fund | VIP Freedom 2020 Portfolio |
| VIP Emerging Markets Portfolio | 13% |
| VIP Value Portfolio | 10% |
The Funds, in aggregate, were the owners of record of more than 20% of the total outstanding shares of the following Underlying Funds.
| Fund | % of shares held |
| VIP Emerging Markets Portfolio | 56% |
| VIP Value Portfolio | 45% |
In addition, at the end of the period the investment adviser or its affiliates were owners of record of more than 10% and certain otherwise unaffiliated shareholders each were owners of record of more than 10%, respectively, of the outstanding shares of the following Funds:
| | Affiliated % | Number of
Unaffiliated Shareholders | Unaffiliated Shareholders % |
| VIP Freedom Income | 26% | 3 | 32% |
| VIP Freedom 2005 | 74% | – | 15% |
| VIP Freedom 2010 | –% | 1 | 88% |
| VIP Freedom 2015 | 26% | 3 | 46% |
| VIP Freedom 2020 | –% | 1 | 72% |
| VIP Freedom 2025 | 10% | 2 | 48% |
| VIP Freedom 2030 | –% | 1 | 43% |
| VIP Freedom 2035 | –% | 5 | 83% |
| VIP Freedom 2040 | –% | 3 | 67% |
| VIP Freedom 2045 | –% | 3 | 80% |
| VIP Freedom 2050 | –% | 5 | 88% |
Shareholder Expense Example
As a shareholder of a Fund, you incur two types of costs: (1) transaction costs, and (2) ongoing costs, including distribution and/or service (12b-1) fees and other Fund expenses. This Example is intended to help you understand your ongoing costs (in dollars) of investing in the Fund and to compare these costs with the ongoing costs of investing in other mutual funds.
The Example is based on an investment of $1,000 invested at the beginning of the period and held for the entire period (January 1, 2018 to June 30, 2018).
Actual Expenses
The first line of the accompanying table for each Class of each fund provides information about actual account values and actual expenses. You may use the information in this line, together with the amount you invested, to estimate the expenses that you paid over the period. Simply divide your account value by $1,000.00 (for example, an $8,600 account value divided by $1,000.00 = 8.6), then multiply the result by the number in the first line for a Class of the fund under the heading entitled "Expenses Paid During Period" to estimate the expenses you paid on your account during this period. The estimate of expenses does not include any fees or other expenses of any variable annuity or variable life insurance product. If they were, the estimate of expenses you paid during the period would be higher, and your ending account value would be lower. In addition, each Fund, as a shareholder in underlying Fidelity Funds, will indirectly bear its pro-rata share of the fees and expenses incurred by the underlying Fidelity Funds. These fees and expenses are not included in each Fund's annualized expense ratio used to calculate the expense estimates in the table below.
Hypothetical Example for Comparison Purposes
The second line of the accompanying table for each Class of each fund provides information about hypothetical account values and hypothetical expenses based on a Class' actual expense ratio and an assumed rate of return of 5% per year before expenses, which is not the Class' actual return. The hypothetical account values and expenses may not be used to estimate the actual ending account balance or expenses you paid for the period. You may use this information to compare the ongoing costs of investing in the Fund and other funds. To do so, compare this 5% hypothetical example with the 5% hypothetical examples that appear in the shareholder reports of the other funds. The estimate of expenses does not include any fees or other expenses of any variable annuity or variable life insurance product. If they were, the estimate of expenses you paid during the period would be higher, and your ending account value would be lower. In addition, each Fund, as a shareholder in underlying Fidelity Funds, will indirectly bear its pro-rata share of the fees and expenses incurred by the underlying Fidelity Funds. These fees and expenses are not included in each Fund's annualized expense ratio used to calculate the expense estimates in the table below.
Please note that the expenses shown in the table are meant to highlight your ongoing costs only and do not reflect any transaction costs. Therefore, the second line of the table is useful in comparing ongoing costs only, and will not help you determine the relative total costs of owning different funds.
| | Annualized Expense Ratio-A | Beginning
Account Value
January 1, 2018 | Ending
Account Value
June 30, 2018 | Expenses Paid
During Period-B
January 1, 2018
to June 30, 2018 |
| VIP Freedom Income | | | | |
| Initial Class | - %-C | | | |
| Actual | | $1,000.00 | $995.90 | $--D |
| Hypothetical-E | | $1,000.00 | $1,024.79 | $--D |
| Service Class | .10% | | | |
| Actual | | $1,000.00 | $995.00 | $.49 |
| Hypothetical-E | | $1,000.00 | $1,024.30 | $.50 |
| Service Class 2 | .25% | | | |
| Actual | | $1,000.00 | $993.20 | $1.24 |
| Hypothetical-E | | $1,000.00 | $1,023.55 | $1.25 |
| VIP Freedom 2005 | | | | |
| Initial Class | - %-C | | | |
| Actual | | $1,000.00 | $996.00 | $--D |
| Hypothetical-E | | $1,000.00 | $1,024.79 | $--D |
| Service Class | .10% | | | |
| Actual | | $1,000.00 | $995.20 | $.49 |
| Hypothetical-E | | $1,000.00 | $1,024.30 | $.50 |
| Service Class 2 | .25% | | | |
| Actual | | $1,000.00 | $994.40 | $1.24 |
| Hypothetical-E | | $1,000.00 | $1,023.55 | $1.25 |
| VIP Freedom 2010 | | | | |
| Initial Class | - %-C | | | |
| Actual | | $1,000.00 | $996.50 | $--D |
| Hypothetical-E | | $1,000.00 | $1,024.79 | $--D |
| Service Class | .10% | | | |
| Actual | | $1,000.00 | $995.80 | $.49 |
| Hypothetical-E | | $1,000.00 | $1,024.30 | $.50 |
| Service Class 2 | .25% | | | |
| Actual | | $1,000.00 | $995.00 | $1.24 |
| Hypothetical-E | | $1,000.00 | $1,023.55 | $1.25 |
| VIP Freedom 2015 | | | | |
| Initial Class | - %-C | | | |
| Actual | | $1,000.00 | $996.50 | $--D |
| Hypothetical-E | | $1,000.00 | $1,024.79 | $--D |
| Service Class | .10% | | | |
| Actual | | $1,000.00 | $996.50 | $.50 |
| Hypothetical-E | | $1,000.00 | $1,024.30 | $.50 |
| Service Class 2 | .25% | | | |
| Actual | | $1,000.00 | $995.80 | $1.24 |
| Hypothetical-E | | $1,000.00 | $1,023.55 | $1.25 |
| VIP Freedom 2020 | | | | |
| Initial Class | - %-C | | | |
| Actual | | $1,000.00 | $997.10 | $--D |
| Hypothetical-E | | $1,000.00 | $1,024.79 | $--D |
| Service Class | .10% | | | |
| Actual | | $1,000.00 | $996.30 | $.49 |
| Hypothetical-E | | $1,000.00 | $1,024.30 | $.50 |
| Service Class 2 | .25% | | | |
| Actual | | $1,000.00 | $996.30 | $1.24 |
| Hypothetical-E | | $1,000.00 | $1,023.55 | $1.25 |
| VIP Freedom 2025 | | | | |
| Initial Class | - %-C | | | |
| Actual | | $1,000.00 | $997.90 | $--D |
| Hypothetical-E | | $1,000.00 | $1,024.79 | $--D |
| Service Class | .10% | | | |
| Actual | | $1,000.00 | $997.20 | $.50 |
| Hypothetical-E | | $1,000.00 | $1,024.30 | $.50 |
| Service Class 2 | .25% | | | |
| Actual | | $1,000.00 | $996.50 | $1.24 |
| Hypothetical-E | | $1,000.00 | $1,023.55 | $1.25 |
| VIP Freedom 2030 | | | | |
| Initial Class | - %-C | | | |
| Actual | | $1,000.00 | $999.20 | $--D |
| Hypothetical-E | | $1,000.00 | $1,024.79 | $--D |
| Service Class | .10% | | | |
| Actual | | $1,000.00 | $999.20 | $.50 |
| Hypothetical-E | | $1,000.00 | $1,024.30 | $.50 |
| Service Class 2 | .25% | | | |
| Actual | | $1,000.00 | $997.80 | $1.24 |
| Hypothetical-E | | $1,000.00 | $1,023.55 | $1.25 |
| VIP Freedom 2035 | | | | |
| Initial Class | - %-C | | | |
| Actual | | $1,000.00 | $1,001.30 | $--D |
| Hypothetical-E | | $1,000.00 | $1,024.79 | $--D |
| Service Class | .10% | | | |
| Actual | | $1,000.00 | $1,000.80 | $.50 |
| Hypothetical-E | | $1,000.00 | $1,024.30 | $.50 |
| Service Class 2 | .25% | | | |
| Actual | | $1,000.00 | $1,000.00 | $1.24 |
| Hypothetical-E | | $1,000.00 | $1,023.55 | $1.25 |
| VIP Freedom 2040 | | | | |
| Initial Class | - %-C | | | |
| Actual | | $1,000.00 | $1,001.30 | $--D |
| Hypothetical-E | | $1,000.00 | $1,024.79 | $--D |
| Service Class | .10% | | | |
| Actual | | $1,000.00 | $1,000.80 | $.50 |
| Hypothetical-E | | $1,000.00 | $1,024.30 | $.50 |
| Service Class 2 | .25% | | | |
| Actual | | $1,000.00 | $999.90 | $1.24 |
| Hypothetical-E | | $1,000.00 | $1,023.55 | $1.25 |
| VIP Freedom 2045 | | | | |
| Initial Class | - %-C | | | |
| Actual | | $1,000.00 | $1,001.20 | $--D |
| Hypothetical-E | | $1,000.00 | $1,024.79 | $--D |
| Service Class | .10% | | | |
| Actual | | $1,000.00 | $1,000.70 | $.50 |
| Hypothetical-E | | $1,000.00 | $1,024.30 | $.50 |
| Service Class 2 | .25% | | | |
| Actual | | $1,000.00 | $999.80 | $1.24 |
| Hypothetical-E | | $1,000.00 | $1,023.55 | $1.25 |
| VIP Freedom 2050 | | | | |
| Initial Class | - %-C | | | |
| Actual | | $1,000.00 | $1,001.70 | $--D |
| Hypothetical-E | | $1,000.00 | $1,024.79 | $--D |
| Service Class | .10% | | | |
| Actual | | $1,000.00 | $1,000.70 | $.50 |
| Hypothetical-E | | $1,000.00 | $1,024.30 | $.50 |
| Service Class 2 | .25% | | | |
| Actual | | $1,000.00 | $1,000.10 | $1.24 |
| Hypothetical-E | | $1,000.00 | $1,023.55 | $1.25 |
A Annualized expense ratio reflects expenses net of applicable fee waivers.
B Expenses are equal to each Class' annualized expense ratio, multiplied by the average account value over the period, multiplied by 181/ 365 (to reflect the one-half year period). The fees and expenses of the underlying Fidelity Funds in which each Fund invests are not included in each Class' annualized expense ratio.
C Amount represents less than .005%.
D Amount represents less than $.005.
E 5% return per year before expenses

VIPFF2K-SANN-0818
1.819548.114
Fidelity® Variable Insurance Products:
Freedom Lifetime Income Funds - Portfolios I, II & III
Semi-Annual Report June 30, 2018 |
|
Contents
To view a fund's proxy voting guidelines and proxy voting record for the 12-month period ended June 30, visit http://www.fidelity.com/proxyvotingresults or visit the Securities and Exchange Commission's (SEC) web site at http://www.sec.gov.
You may also call 1-877-208-0098 to request a free copy of the proxy voting guidelines.
Fidelity® Variable Insurance Products are separate account options which are purchased through a variable insurance contract.
Standard & Poor's, S&P and S&P 500 are registered service marks of The McGraw-Hill Companies, Inc. and have been licensed for use by Fidelity Distributors Corporation.
Other third-party marks appearing herein are the property of their respective owners.
All other marks appearing herein are registered or unregistered trademarks or service marks of FMR LLC or an affiliated company. © 2018 FMR LLC. All rights reserved.
This report and the financial statements contained herein are submitted for the general information of the shareholders of the Funds. This report is not authorized for distribution to prospective investors in the Funds unless preceded or accompanied by an effective prospectus.
A fund files its complete schedule of portfolio holdings with the SEC for the first and third quarters of each fiscal year on Form N-Q. Forms N-Q are available on the SEC’s web site at http://www.sec.gov. A fund's Forms N-Q may be reviewed and copied at the SEC’s Public Reference Room in Washington, DC. Information regarding the operation of the SEC's Public Reference Room may be obtained by calling 1-800-SEC-0330.
For a complete list of a fund's portfolio holdings, view the most recent holdings listing, semiannual report, or annual report on Fidelity's web site at http://www.fidelity.com, http://www.institutional.fidelity.com, or http://www.401k.com, as applicable.
NOT FDIC INSURED •MAY LOSE VALUE •NO BANK GUARANTEE
Neither the Funds nor Fidelity Distributors Corporation is a bank.
Note to shareholders
At its May 2018 meeting, the Board of Trustees approved incremental updates to the strategic asset allocation (i.e., glide path) of VIP Freedom Lifetime Income Funds, adding U.S. Treasury Inflation-Protected Securities and long-term U.S. Treasury bonds as fixed exposures in the Funds’ bond allocations, while slightly reducing the equity and short-term debt allocations for shorter-dated Portfolios. These glide path updates are expected to be fully implemented by the end of 2018. In addition, to increase the investment opportunity set, the Board approved allowing VIP Freedom Lifetime Funds to employ underlying Fidelity funds beyond just VIP portfolios. Moreover, the Board approved giving the portfolio managers the added flexibility of active asset allocation within the investment process.
VIP Freedom Lifetime Income® I Portfolio
Investment Summary (Unaudited)
The information in the following tables is based on the direct investments of the Fund.
Top Holdings as of June 30, 2018
| | % of fund's net assets |
| VIP Investment Grade Bond Portfolio Investor Class | 46.2 |
| VIP Government Money Market Portfolio Investor Class 1.68% | 18.7 |
| Fidelity Inflation-Protected Bond Index Fund Premium Class | 5.6 |
| VIP Overseas Portfolio Investor Class | 5.3 |
| VIP High Income Portfolio Investor Class | 5.3 |
| VIP Emerging Markets Portfolio Investor Class | 3.5 |
| Fidelity Long-Term Treasury Bond Index Fund Premium Class | 3.4 |
| VIP Growth & Income Portfolio Investor Class | 2.5 |
| VIP Equity-Income Portfolio Investor Class | 2.2 |
| VIP Growth Portfolio Investor Class | 2.2 |
| | 94.9 |
Asset Allocation (% of fund's net assets)
| Period end |
| | Domestic Equity Funds | 12.0% |
| | International Equity Funds | 8.8% |
| | Bond Funds | 60.5% |
| | Short-Term Funds | 18.7% |

VIP Freedom Lifetime Income® I Portfolio
Schedule of Investments June 30, 2018 (Unaudited)
Showing Percentage of Net Assets
| Domestic Equity Funds - 12.0% | | | |
| | | Shares | Value |
| VIP Contrafund Portfolio Investor Class (a) | | 7,649 | $271,006 |
| VIP Equity-Income Portfolio Investor Class (a) | | 12,879 | 284,636 |
| VIP Growth & Income Portfolio Investor Class (a) | | 15,140 | 323,840 |
| VIP Growth Portfolio Investor Class (a) | | 4,017 | 278,315 |
| VIP Mid Cap Portfolio Investor Class (a) | | 2,163 | 78,645 |
| VIP Value Portfolio Investor Class (a) | | 13,280 | 207,971 |
| VIP Value Strategies Portfolio Investor Class (a) | | 7,468 | 101,567 |
| TOTAL DOMESTIC EQUITY FUNDS | | | |
| (Cost $1,159,340) | | | 1,545,980 |
|
| International Equity Funds - 8.8% | | | |
| VIP Emerging Markets Portfolio Investor Class (a) | | 39,245 | 445,824 |
| VIP Overseas Portfolio Investor Class (a) | | 30,613 | 683,894 |
| TOTAL INTERNATIONAL EQUITY FUNDS | | | |
| (Cost $987,015) | | | 1,129,718 |
|
| Bond Funds - 60.5% | | | |
| Fidelity Inflation-Protected Bond Index Fund Premium Class (a) | | 72,644 | 713,360 |
| Fidelity Long-Term Treasury Bond Index Fund Premium Class (a) | | 34,208 | 434,443 |
| VIP High Income Portfolio Investor Class (a) | | 127,597 | 682,642 |
| VIP Investment Grade Bond Portfolio Investor Class (a) | | 478,049 | 5,942,152 |
| TOTAL BOND FUNDS | | | |
| (Cost $7,898,499) | | | 7,772,597 |
|
| Short-Term Funds - 18.7% | | | |
| VIP Government Money Market Portfolio Investor Class 1.68% (a)(b) | | | |
| (Cost $2,409,819) | | 2,409,819 | 2,409,819 |
| TOTAL INVESTMENT IN SECURITIES - 100.0% | | | |
| (Cost $12,454,673) | | | 12,858,114 |
| NET OTHER ASSETS (LIABILITIES) - 0.0% | | | 44 |
| NET ASSETS - 100% | | | $12,858,158 |
Legend
(a) Affiliated Fund
(b) The rate quoted is the annualized seven-day yield of the fund at period end.
Affiliated Underlying Funds
Fiscal year to date information regarding the Fund's investments in affiliated Underlying Funds, excluding any Money Market Central Funds, is presented below. Exchanges between classes of the same affiliated Underlying Funds may occur.
| Affiliate | Value, beginning of period | Purchases | Sales Proceeds | Dividend Income | Realized Gain (loss) | Change in Unrealized appreciation (depreciation) | Value, end of period |
| Fidelity Inflation-Protected Bond Index Fund Premium Class | $-- | $713,360 | $-- | $6 | $-- | $-- | $713,360 |
| Fidelity Long-Term Treasury Bond Index Fund Premium Class | -- | 434,443 | -- | 35 | -- | -- | 434,443 |
| VIP Contrafund Portfolio Investor Class | 357,908 | 32,752 | 103,090 | 28,641 | 11,993 | (28,557) | 271,006 |
| VIP Emerging Markets Portfolio Investor Class | 157,262 | 321,511 | 24,582 | 68 | 7,902 | (16,269) | 445,824 |
| VIP Equity-Income Portfolio Investor Class | 376,040 | 37,883 | 106,400 | 15,935 | (7,033) | (15,854) | 284,636 |
| VIP Government Money Market Portfolio Investor Class 1.68% | 2,031,025 | 524,267 | 145,473 | 13,152 | -- | -- | 2,409,819 |
| VIP Growth & Income Portfolio Investor Class | 436,501 | 37,597 | 131,716 | 21,931 | 32,423 | (50,965) | 323,840 |
| VIP Growth Portfolio Investor Class | 364,765 | 48,063 | 121,678 | 47,463 | 41,298 | (54,133) | 278,315 |
| VIP High Income Portfolio Investor Class | 676,798 | 54,003 | 38,411 | 6,036 | (5,577) | (4,171) | 682,642 |
| VIP Investment Grade Bond Portfolio Investor Class | 8,169,760 | 264,604 | 2,287,346 | 79,651 | (86,931) | (117,935) | 5,942,152 |
| VIP Mid Cap Portfolio Investor Class | 105,369 | 9,399 | 31,319 | 8,128 | 3,494 | (8,298) | 78,645 |
| VIP Overseas Portfolio Investor Class | 600,411 | 163,207 | 71,003 | 145 | 8,230 | (16,951) | 683,894 |
| VIP Value Portfolio Investor Class | 277,982 | 19,305 | 80,136 | 9,138 | 10,274 | (19,454) | 207,971 |
| VIP Value Strategies Portfolio Investor Class | 136,359 | 8,581 | 38,665 | 4,003 | 1,700 | (6,408) | 101,567 |
| Total | $13,690,180 | $2,668,975 | $3,179,819 | $234,332 | $17,773 | $(338,995) | $12,858,114 |
Amounts in the income column in the above table include any capital gain distributions from underlying funds, which are presented in the corresponding line-item in the Statement of Operations if applicable.
Investment Valuation
All investments are categorized as Level 1 under the Fair Value Hierarchy. The inputs or methodology used for valuing securities may not be an indication of the risk associated with investing in those securities. For more information on valuation inputs please refer to the Investment Valuation section in the accompanying Notes to Financial Statements.
See accompanying notes which are an integral part of the financial statements.
VIP Freedom Lifetime Income® I Portfolio
Financial Statements
Statement of Assets and Liabilities
| | | June 30, 2018 (Unaudited) |
| Assets | | |
Investment in securities, at value — See accompanying schedule:
| | |
| Affiliated issuers (cost $12,454,673) | $12,858,114 | |
| Total Investment in Securities (cost $12,454,673) | | $12,858,114 |
| Receivable for investments sold | | 2,108,868 |
| Total assets | | 14,966,982 |
| Liabilities | | |
| Payable for investments purchased | $2,108,613 | |
| Payable for fund shares redeemed | 211 | |
| Total liabilities | | 2,108,824 |
| Net Assets | | $12,858,158 |
| Net Assets consist of: | | |
| Paid in capital | | $12,247,788 |
| Undistributed net investment income | | 52,446 |
| Accumulated undistributed net realized gain (loss) on investments | | 154,483 |
| Net unrealized appreciation (depreciation) on investments | | 403,441 |
| Net Assets, for 1,170,849 shares outstanding | | $12,858,158 |
| Net Asset Value, offering price and redemption price per share ($12,858,158 ÷ 1,170,849 shares) | | $10.98 |
See accompanying notes which are an integral part of the financial statements.
Statement of Operations
| | | Six months ended June 30, 2018 (Unaudited) |
| Investment Income | | |
| Dividends: | | |
| Affiliated issuers | | $53,311 |
| Expenses | | |
| Independent trustees' fees and expenses | $41 | |
| Total expenses | | 41 |
| Net investment income (loss) | | 53,270 |
| Realized and Unrealized Gain (Loss) | | |
| Net realized gain (loss) on: | | |
| Investment securities: | | |
| Affiliated issuers | 17,773 | |
| Capital gain distributions from underlying funds: | | |
| Affiliated issuers | 181,021 | |
| Total net realized gain (loss) | | 198,794 |
| Change in net unrealized appreciation (depreciation) on: | | |
| Investment securities: | | |
| Affiliated issuers | (338,995) | |
| Total change in net unrealized appreciation (depreciation) | | (338,995) |
| Net gain (loss) | | (140,201) |
| Net increase (decrease) in net assets resulting from operations | | $(86,931) |
See accompanying notes which are an integral part of the financial statements.
Statement of Changes in Net Assets
| | Six months ended June 30, 2018 (Unaudited) | Year ended December 31, 2017 |
| Increase (Decrease) in Net Assets | | |
| Operations | | |
| Net investment income (loss) | $53,270 | $274,731 |
| Net realized gain (loss) | 198,794 | 254,637 |
| Change in net unrealized appreciation (depreciation) | (338,995) | 500,520 |
| Net increase (decrease) in net assets resulting from operations | (86,931) | 1,029,888 |
| Distributions to shareholders from net investment income | (2,379) | (273,176) |
| Distributions to shareholders from net realized gain | (178,430) | (170,356) |
| Total distributions | (180,809) | (443,532) |
| Share transactions | | |
| Proceeds from sales of shares | 23,048 | 112,904 |
| Reinvestment of distributions | 180,809 | 443,532 |
| Cost of shares redeemed | (768,259) | (1,630,553) |
| Net increase (decrease) in net assets resulting from share transactions | (564,402) | (1,074,117) |
| Total increase (decrease) in net assets | (832,142) | (487,761) |
| Net Assets | | |
| Beginning of period | 13,690,300 | 14,178,061 |
| End of period | $12,858,158 | $13,690,300 |
| Other Information | | |
| Undistributed net investment income end of period | $52,446 | $1,555 |
| Shares | | |
| Sold | 2,073 | 9,946 |
| Issued in reinvestment of distributions | 16,497 | 40,052 |
| Redeemed | (69,196) | (146,477) |
| Net increase (decrease) | (50,626) | (96,479) |
See accompanying notes which are an integral part of the financial statements.
Financial Highlights
VIP Freedom Lifetime Income I Portfolio
| | Six months ended (Unaudited) June 30, | Years endedDecember 31, | | | | |
| | 2018 | 2017 | 2016 | 2015 | 2014 | 2013 |
| Selected Per–Share Data | | | | | | |
| Net asset value, beginning of period | $11.21 | $10.76 | $10.65 | $11.01 | $10.95 | $10.26 |
| Income from Investment Operations | | | | | | |
| Net investment income (loss)A | .04 | .22 | .21 | .23 | .21 | .19 |
| Net realized and unrealized gain (loss) | (.12) | .59 | .31 | (.27) | .29 | .83 |
| Total from investment operations | (.08) | .81 | .52 | (.04) | .50 | 1.02 |
| Distributions from net investment income | –B | (.23) | (.21) | (.24) | (.20) | (.20) |
| Distributions from net realized gain | (.15) | (.13) | (.20) | (.09) | (.25) | (.13) |
| Total distributions | (.15) | (.36) | (.41) | (.32)C | (.44)D | (.33) |
| Net asset value, end of period | $10.98 | $11.21 | $10.76 | $10.65 | $11.01 | $10.95 |
| Total ReturnE,F,G | (.69)% | 7.62% | 5.05% | (.35)% | 4.68% | 9.96% |
| Ratios to Average Net AssetsH,I | | | | | | |
| Expenses before reductionsJ | - %K | -% | -% | -% | -% | -% |
| Expenses net of fee waivers, if any | - %J,K | -% | -% | -% | -% | -% |
| Expenses net of all reductions | - %J,K | -% | -% | -% | -% | -% |
| Net investment income (loss) | .81%K | 1.97% | 1.90% | 2.05% | 1.89% | 1.81% |
| Supplemental Data | | | | | | |
| Net assets, end of period (000 omitted) | $12,858 | $13,690 | $14,178 | $13,635 | $14,663 | $12,991 |
| Portfolio turnover rateH | 41%K | 9% | 18% | 12% | 12% | 22% |
A Calculated based on average shares outstanding during the period.
B Amount represents less than $.005 per share.
C Total distributions of $.32 per share is comprised of distributions from net investment income of $.235 and distributions from net realized gain of $.088 per share.
D Total distributions of $.44 per share is comprised of distributions from net investment income of $.196 and distributions from net realized gain of $.248 per share.
E Total returns for periods of less than one year are not annualized.
F Total returns do not reflect charges attributable to your insurance company's separate account. Inclusion of these charges would reduce the total returns shown.
G Total returns would have been lower if certain expenses had not been reduced during the applicable periods shown.
H Amounts do not include the activity of the Underlying Funds.
I Expense ratios reflect operating expenses of the Fund. Expenses before reductions do not reflect amounts reimbursed by the investment adviser or reductions from expense offset arrangements and do not represent the amount paid by the Fund during periods when reimbursements or reductions occur. Expenses net of fee waivers reflect expenses after reimbursement by the investment adviser but prior to reductions from expense offset arrangements. Expenses net of all reductions represent the net expenses paid by the Fund but do not include expenses of the underlying funds in which the Fund invests.
J Amount represents less than .005%.
K Annualized
See accompanying notes which are an integral part of the financial statements.
VIP Freedom Lifetime Income® II Portfolio
Investment Summary (Unaudited)
The information in the following tables is based on the direct investments of the Fund.
Top Holdings as of June 30, 2018
| | % of fund's net assets |
| VIP Investment Grade Bond Portfolio Investor Class | 28.3 |
| VIP Government Money Market Portfolio Investor Class 1.68% | 14.6 |
| VIP Overseas Portfolio Investor Class | 9.9 |
| VIP Growth & Income Portfolio Investor Class | 6.0 |
| VIP Emerging Markets Portfolio Investor Class | 5.5 |
| VIP High Income Portfolio Investor Class | 5.3 |
| VIP Equity-Income Portfolio Investor Class | 5.2 |
| VIP Growth Portfolio Investor Class | 5.1 |
| VIP Contrafund Portfolio Investor Class | 5.0 |
| Fidelity Inflation-Protected Bond Index Fund Premium Class | 4.4 |
| | 89.3 |
Asset Allocation (% of fund's net assets)
| Period end |
| | Domestic Equity Funds | 28.5% |
| | International Equity Funds | 15.4% |
| | Bond Funds | 41.5% |
| | Short-Term Funds | 14.6% |

VIP Freedom Lifetime Income® II Portfolio
Schedule of Investments June 30, 2018 (Unaudited)
Showing Percentage of Net Assets
| Domestic Equity Funds - 28.5% | | | |
| | | Shares | Value |
| VIP Contrafund Portfolio Investor Class (a) | | 47,096 | $1,668,625 |
| VIP Equity-Income Portfolio Investor Class (a) | | 79,305 | 1,752,647 |
| VIP Growth & Income Portfolio Investor Class (a) | | 93,238 | 1,994,359 |
| VIP Growth Portfolio Investor Class (a) | | 24,726 | 1,713,289 |
| VIP Mid Cap Portfolio Investor Class (a) | | 13,320 | 484,329 |
| VIP Value Portfolio Investor Class (a) | | 81,791 | 1,280,844 |
| VIP Value Strategies Portfolio Investor Class (a) | | 45,997 | 625,558 |
| TOTAL DOMESTIC EQUITY FUNDS | | | |
| (Cost $7,572,527) | | | 9,519,651 |
|
| International Equity Funds - 15.4% | | | |
| VIP Emerging Markets Portfolio Investor Class (a) | | 162,405 | 1,844,919 |
| VIP Overseas Portfolio Investor Class (a) | | 148,500 | 3,317,495 |
| TOTAL INTERNATIONAL EQUITY FUNDS | | | |
| (Cost $4,413,754) | | | 5,162,414 |
|
| Bond Funds - 41.5% | | | |
| Fidelity Inflation-Protected Bond Index Fund Premium Class (a) | | 150,810 | 1,480,952 |
| Fidelity Long-Term Treasury Bond Index Fund Premium Class (a) | | 90,609 | 1,150,740 |
| VIP High Income Portfolio Investor Class (a) | | 331,114 | 1,771,458 |
| VIP Investment Grade Bond Portfolio Investor Class (a) | | 762,320 | 9,475,632 |
| TOTAL BOND FUNDS | | | |
| (Cost $14,120,786) | | | 13,878,782 |
|
| Short-Term Funds - 14.6% | | | |
| VIP Government Money Market Portfolio Investor Class 1.68% (a)(b) | | | |
| (Cost $4,875,313) | | 4,875,313 | 4,875,313 |
| TOTAL INVESTMENT IN SECURITIES - 100.0% | | | |
| (Cost $30,982,380) | | | 33,436,160 |
| NET OTHER ASSETS (LIABILITIES) - 0.0% | | | 114 |
| NET ASSETS - 100% | | | $33,436,274 |
Legend
(a) Affiliated Fund
(b) The rate quoted is the annualized seven-day yield of the fund at period end.
Affiliated Underlying Funds
Fiscal year to date information regarding the Fund's investments in affiliated Underlying Funds, excluding any Money Market Central Funds, is presented below. Exchanges between classes of the same affiliated Underlying Funds may occur.
| Affiliate | Value, beginning of period | Purchases | Sales Proceeds | Dividend Income | Realized Gain (loss) | Change in Unrealized appreciation (depreciation) | Value, end of period |
| Fidelity Inflation-Protected Bond Index Fund Premium Class | $-- | $1,480,952 | $-- | $12 | $-- | $-- | $1,480,952 |
| Fidelity Long-Term Treasury Bond Index Fund Premium Class | -- | 1,150,740 | -- | 92 | -- | -- | 1,150,740 |
| VIP Contrafund Portfolio Investor Class | 2,033,226 | 169,079 | 431,480 | 168,537 | 35,144 | (137,344) | 1,668,625 |
| VIP Emerging Markets Portfolio Investor Class | 880,044 | 1,119,257 | 104,208 | 396 | 32,023 | (82,197) | 1,844,919 |
| VIP Equity-Income Portfolio Investor Class | 2,136,266 | 197,360 | 442,397 | 93,773 | (35,129) | (103,453) | 1,752,647 |
| VIP Government Money Market Portfolio Investor Class 1.68% | 4,169,506 | 879,116 | 173,309 | 29,319 | -- | -- | 4,875,313 |
| VIP Growth & Income Portfolio Investor Class | 2,479,792 | 200,182 | 571,052 | 129,054 | 71,808 | (186,371) | 1,994,359 |
| VIP Growth Portfolio Investor Class | 2,071,970 | 279,839 | 556,975 | 279,283 | 80,996 | (162,541) | 1,713,289 |
| VIP High Income Portfolio Investor Class | 1,707,134 | 173,778 | 83,421 | 15,785 | (8,801) | (17,232) | 1,771,458 |
| VIP Investment Grade Bond Portfolio Investor Class | 13,027,669 | 560,059 | 3,779,604 | 130,172 | (138,417) | (194,075) | 9,475,632 |
| VIP Mid Cap Portfolio Investor Class | 598,516 | 47,985 | 132,499 | 47,826 | 12,801 | (42,474) | 484,329 |
| VIP Overseas Portfolio Investor Class | 3,359,858 | 277,785 | 263,396 | 841 | 15,344 | (72,096) | 3,317,495 |
| VIP Value Portfolio Investor Class | 1,579,165 | 95,023 | 336,338 | 53,776 | 19,482 | (76,488) | 1,280,844 |
| VIP Value Strategies Portfolio Investor Class | 774,587 | 41,490 | 161,700 | 23,555 | 1,567 | (30,386) | 625,558 |
| Total | $34,817,733 | $6,672,645 | $7,036,379 | $972,421 | $86,818 | $(1,104,657) | $33,436,160 |
Amounts in the income column in the above table include any capital gain distributions from underlying funds, which are presented in the corresponding line-item in the Statement of Operations if applicable.
Investment Valuation
All investments are categorized as Level 1 under the Fair Value Hierarchy. The inputs or methodology used for valuing securities may not be an indication of the risk associated with investing in those securities. For more information on valuation inputs please refer to the Investment Valuation section in the accompanying Notes to Financial Statements.
See accompanying notes which are an integral part of the financial statements.
VIP Freedom Lifetime Income® II Portfolio
Financial Statements
Statement of Assets and Liabilities
| | | June 30, 2018 (Unaudited) |
| Assets | | |
Investment in securities, at value — See accompanying schedule:
| | |
| Affiliated issuers (cost $30,982,380) | $33,436,160 | |
| Total Investment in Securities (cost $30,982,380) | | $33,436,160 |
| Cash | | 4 |
| Receivable for investments sold | | 4,351,253 |
| Total assets | | 37,787,417 |
| Liabilities | | |
| Payable for investments purchased | $4,350,592 | |
| Payable for fund shares redeemed | 551 | |
| Total liabilities | | 4,351,143 |
| Net Assets | | $33,436,274 |
| Net Assets consist of: | | |
| Paid in capital | | $30,046,686 |
| Undistributed net investment income | | 115,488 |
| Accumulated undistributed net realized gain (loss) on investments | | 820,320 |
| Net unrealized appreciation (depreciation) on investments | | 2,453,780 |
| Net Assets, for 2,675,769 shares outstanding | | $33,436,274 |
| Net Asset Value, offering price and redemption price per share ($33,436,274 ÷ 2,675,769 shares) | | $12.50 |
See accompanying notes which are an integral part of the financial statements.
Statement of Operations
| | | Six months ended June 30, 2018 (Unaudited) |
| Investment Income | | |
| Dividends: | | |
| Affiliated issuers | | $115,740 |
| Expenses | | |
| Independent trustees' fees and expenses | $106 | |
| Total expenses | | 106 |
| Net investment income (loss) | | 115,634 |
| Realized and Unrealized Gain (Loss) | | |
| Net realized gain (loss) on: | | |
| Investment securities: | | |
| Affiliated issuers | 86,818 | |
| Capital gain distributions from underlying funds: | | |
| Affiliated issuers | 856,681 | |
| Total net realized gain (loss) | | 943,499 |
| Change in net unrealized appreciation (depreciation) on: | | |
| Investment securities: | | |
| Affiliated issuers | (1,104,657) | |
| Total change in net unrealized appreciation (depreciation) | | (1,104,657) |
| Net gain (loss) | | (161,158) |
| Net increase (decrease) in net assets resulting from operations | | $(45,524) |
See accompanying notes which are an integral part of the financial statements.
Statement of Changes in Net Assets
| | Six months ended June 30, 2018 (Unaudited) | Year ended December 31, 2017 |
| Increase (Decrease) in Net Assets | | |
| Operations | | |
| Net investment income (loss) | $115,634 | $594,293 |
| Net realized gain (loss) | 943,499 | 827,617 |
| Change in net unrealized appreciation (depreciation) | (1,104,657) | 2,630,906 |
| Net increase (decrease) in net assets resulting from operations | (45,524) | 4,052,816 |
| Distributions to shareholders from net investment income | (2,704) | (591,734) |
| Distributions to shareholders from net realized gain | (513,701) | (628,990) |
| Total distributions | (516,405) | (1,220,724) |
| Share transactions | | |
| Proceeds from sales of shares | 9,376 | 1,177,281 |
| Reinvestment of distributions | 516,405 | 1,220,724 |
| Cost of shares redeemed | (1,345,559) | (4,308,811) |
| Net increase (decrease) in net assets resulting from share transactions | (819,778) | (1,910,806) |
| Total increase (decrease) in net assets | (1,381,707) | 921,286 |
| Net Assets | | |
| Beginning of period | 34,817,981 | 33,896,695 |
| End of period | $33,436,274 | $34,817,981 |
| Other Information | | |
| Undistributed net investment income end of period | $115,488 | $2,558 |
| Shares | | |
| Sold | 753 | 97,365 |
| Issued in reinvestment of distributions | 41,246 | 98,613 |
| Redeemed | (107,007) | (348,172) |
| Net increase (decrease) | (65,008) | (152,194) |
See accompanying notes which are an integral part of the financial statements.
Financial Highlights
VIP Freedom Lifetime Income II Portfolio
| | Six months ended (Unaudited) June 30, | Years endedDecember 31, | | | | |
| | 2018 | 2017 | 2016 | 2015 | 2014 | 2013 |
| Selected Per–Share Data | | | | | | |
| Net asset value, beginning of period | $12.70 | $11.72 | $11.47 | $11.76 | $11.43 | $10.36 |
| Income from Investment Operations | | | | | | |
| Net investment income (loss)A | .04 | .21 | .21 | .24 | .23 | .20 |
| Net realized and unrealized gain (loss) | (.05) | 1.22 | .44 | (.27) | .35 | 1.12 |
| Total from investment operations | (.01) | 1.43 | .65 | (.03) | .58 | 1.32 |
| Distributions from net investment income | –B | (.22) | (.20) | (.24) | (.21) | (.21) |
| Distributions from net realized gain | (.19) | (.23) | (.20) | (.03) | (.04) | (.05) |
| Total distributions | (.19) | (.45) | (.40) | (.26)C | (.25) | (.25)D |
| Net asset value, end of period | $12.50 | $12.70 | $11.72 | $11.47 | $11.76 | $11.43 |
| Total ReturnE,F,G | (.07)% | 12.29% | 5.90% | (.23)% | 5.06% | 12.76% |
| Ratios to Average Net AssetsH,I | | | | | | |
| Expenses before reductionsJ | - %K | -% | -% | -% | -% | -% |
| Expenses net of fee waivers, if any | - %J,K | -% | -% | -% | -% | -% |
| Expenses net of all reductions | - %J,K | -% | -% | -% | -% | -% |
| Net investment income (loss) | .68%K | 1.71% | 1.84% | 2.06% | 1.97% | 1.86% |
| Supplemental Data | | | | | | |
| Net assets, end of period (000 omitted) | $33,436 | $34,818 | $33,897 | $30,348 | $29,531 | $23,071 |
| Portfolio turnover rateH | 39%K | 12% | 16% | 14% | 9% | 13% |
A Calculated based on average shares outstanding during the period.
B Amount represents less than $.005 per share.
C Total distributions of $.26 per share is comprised of distributions from net investment income of $.238 and distributions from net realized gain of $.026 per share.
D Total distributions of $.25 per share is comprised of distributions from net investment income of $.206 and distributions from net realized gain of $.045 per share.
E Total returns for periods of less than one year are not annualized.
F Total returns do not reflect charges attributable to your insurance company's separate account. Inclusion of these charges would reduce the total returns shown.
G Total returns would have been lower if certain expenses had not been reduced during the applicable periods shown.
H Amounts do not include the activity of the Underlying Funds.
I Expense ratios reflect operating expenses of the Fund. Expenses before reductions do not reflect amounts reimbursed by the investment adviser or reductions from expense offset arrangements and do not represent the amount paid by the Fund during periods when reimbursements or reductions occur. Expenses net of fee waivers reflect expenses after reimbursement by the investment adviser but prior to reductions from expense offset arrangements. Expenses net of all reductions represent the net expenses paid by the Fund but do not include expenses of the underlying funds in which the Fund invests.
J Amount represents less than .005%.
K Annualized
See accompanying notes which are an integral part of the financial statements.
VIP Freedom Lifetime Income® III Portfolio
Investment Summary (Unaudited)
The information in the following tables is based on the direct investments of the Fund.
Top Holdings as of June 30, 2018
| | % of fund's net assets |
| VIP Investment Grade Bond Portfolio Investor Class | 23.2 |
| VIP Overseas Portfolio Investor Class | 12.7 |
| VIP Growth & Income Portfolio Investor Class | 8.0 |
| VIP Equity-Income Portfolio Investor Class | 7.1 |
| VIP Growth Portfolio Investor Class | 6.9 |
| VIP Contrafund Portfolio Investor Class | 6.7 |
| VIP Emerging Markets Portfolio Investor Class | 6.6 |
| VIP High Income Portfolio Investor Class | 6.2 |
| VIP Government Money Market Portfolio Investor Class 1.68% | 6.2 |
| VIP Value Portfolio Investor Class | 5.2 |
| | 88.8 |
Asset Allocation (% of fund's net assets)
| Period end |
| | Domestic Equity Funds | 38.3% |
| | International Equity Funds | 19.3% |
| | Bond Funds | 36.2% |
| | Short-Term Funds | 6.2% |
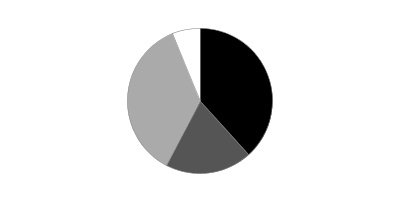
VIP Freedom Lifetime Income® III Portfolio
Schedule of Investments June 30, 2018 (Unaudited)
Showing Percentage of Net Assets
| Domestic Equity Funds - 38.3% | | | |
| | | Shares | Value |
| VIP Contrafund Portfolio Investor Class (a) | | 59,233 | $2,098,609 |
| VIP Equity-Income Portfolio Investor Class (a) | | 99,746 | 2,204,390 |
| VIP Growth & Income Portfolio Investor Class (a) | | 117,288 | 2,508,781 |
| VIP Growth Portfolio Investor Class (a) | | 31,092 | 2,154,363 |
| VIP Mid Cap Portfolio Investor Class (a) | | 16,756 | 609,258 |
| VIP Value Portfolio Investor Class (a) | | 102,892 | 1,611,291 |
| VIP Value Strategies Portfolio Investor Class (a) | | 57,867 | 786,995 |
| TOTAL DOMESTIC EQUITY FUNDS | | | |
| (Cost $9,951,977) | | | 11,973,687 |
|
| International Equity Funds - 19.3% | | | |
| VIP Emerging Markets Portfolio Investor Class (a) | | 179,891 | 2,043,561 |
| VIP Overseas Portfolio Investor Class (a) | | 177,983 | 3,976,133 |
| TOTAL INTERNATIONAL EQUITY FUNDS | | | |
| (Cost $5,081,161) | | | 6,019,694 |
|
| Bond Funds - 36.2% | | | |
| Fidelity Inflation-Protected Bond Index Fund Premium Class (a) | | 117,961 | 1,158,376 |
| Fidelity Long-Term Treasury Bond Index Fund Premium Class (a) | | 76,744 | 974,655 |
| VIP High Income Portfolio Investor Class (a) | | 364,667 | 1,950,968 |
| VIP Investment Grade Bond Portfolio Investor Class (a) | | 581,865 | 7,232,582 |
| TOTAL BOND FUNDS | | | |
| (Cost $11,513,093) | | | 11,316,581 |
|
| Short-Term Funds - 6.2% | | | |
| VIP Government Money Market Portfolio Investor Class 1.68% (a)(b) | | | |
| (Cost $1,929,182) | | 1,929,182 | 1,929,182 |
| TOTAL INVESTMENT IN SECURITIES - 100.0% | | | |
| (Cost $28,475,413) | | | 31,239,144 |
| NET OTHER ASSETS (LIABILITIES) - 0.0% | | | 90 |
| NET ASSETS - 100% | | | $31,239,234 |
Legend
(a) Affiliated Fund
(b) The rate quoted is the annualized seven-day yield of the fund at period end.
Affiliated Underlying Funds
Fiscal year to date information regarding the Fund's investments in affiliated Underlying Funds, excluding any Money Market Central Funds, is presented below. Exchanges between classes of the same affiliated Underlying Funds may occur.
| Affiliate | Value, beginning of period | Purchases | Sales Proceeds | Dividend Income | Realized Gain (loss) | Change in Unrealized appreciation (depreciation) | Value, end of period |
| Fidelity Inflation-Protected Bond Index Fund Premium Class | $-- | $1,158,376 | $-- | $9 | $-- | $-- | $1,158,376 |
| Fidelity Long-Term Treasury Bond Index Fund Premium Class | -- | 974,655 | -- | 78 | -- | -- | 974,655 |
| VIP Contrafund Portfolio Investor Class | 2,489,286 | 206,368 | 472,148 | 206,363 | 34,159 | (159,056) | 2,098,609 |
| VIP Emerging Markets Portfolio Investor Class | 1,077,469 | 1,165,423 | 139,530 | 485 | 40,786 | (100,587) | 2,043,561 |
| VIP Equity-Income Portfolio Investor Class | 2,615,358 | 176,072 | 418,081 | 114,821 | (32,319) | (136,640) | 2,204,390 |
| VIP Government Money Market Portfolio Investor Class 1.68% | 1,093,268 | 882,161 | 46,247 | 8,369 | -- | -- | 1,929,182 |
| VIP Growth & Income Portfolio Investor Class | 3,035,821 | 188,957 | 575,894 | 158,021 | 46,485 | (186,588) | 2,508,781 |
| VIP Growth Portfolio Investor Class | 2,536,867 | 341,966 | 624,306 | 341,960 | 89,430 | (189,594) | 2,154,363 |
| VIP High Income Portfolio Investor Class | 2,120,198 | 93,810 | 230,726 | 19,607 | (16,388) | (15,926) | 1,950,968 |
| VIP Investment Grade Bond Portfolio Investor Class | 9,686,654 | 968,230 | 3,166,462 | 101,664 | (129,058) | (126,782) | 7,232,582 |
| VIP Mid Cap Portfolio Investor Class | 732,753 | 58,563 | 145,774 | 58,561 | 13,564 | (49,848) | 609,258 |
| VIP Overseas Portfolio Investor Class | 4,113,938 | 257,263 | 327,622 | 1,029 | 32,297 | (99,743) | 3,976,133 |
| VIP Value Portfolio Investor Class | 1,933,329 | 65,850 | 318,291 | 65,849 | 15,287 | (84,884) | 1,611,291 |
| VIP Value Strategies Portfolio Investor Class | 948,299 | 28,843 | 154,656 | 28,842 | (8,570) | (26,921) | 786,995 |
| Total | $32,383,240 | $6,566,537 | $6,619,737 | $1,105,658 | $85,673 | $(1,176,569) | $31,239,144 |
Amounts in the income column in the above table include any capital gain distributions from underlying funds, which are presented in the corresponding line-item in the Statement of Operations if applicable.
Investment Valuation
All investments are categorized as Level 1 under the Fair Value Hierarchy. The inputs or methodology used for valuing securities may not be an indication of the risk associated with investing in those securities. For more information on valuation inputs please refer to the Investment Valuation section in the accompanying Notes to Financial Statements.
See accompanying notes which are an integral part of the financial statements.
VIP Freedom Lifetime Income® III Portfolio
Financial Statements
Statement of Assets and Liabilities
| | | June 30, 2018 (Unaudited) |
| Assets | | |
Investment in securities, at value — See accompanying schedule:
| | |
| Affiliated issuers (cost $28,475,413) | $31,239,144 | |
| Total Investment in Securities (cost $28,475,413) | | $31,239,144 |
| Cash | | 2 |
| Receivable for investments sold | | 4,028,164 |
| Total assets | | 35,267,310 |
| Liabilities | | |
| Payable for investments purchased | $4,027,560 | |
| Payable for fund shares redeemed | 516 | |
| Total liabilities | | 4,028,076 |
| Net Assets | | $31,239,234 |
| Net Assets consist of: | | |
| Paid in capital | | $27,410,740 |
| Undistributed net investment income | | 92,161 |
| Accumulated undistributed net realized gain (loss) on investments | | 972,602 |
| Net unrealized appreciation (depreciation) on investments | | 2,763,731 |
| Net Assets, for 2,430,287 shares outstanding | | $31,239,234 |
| Net Asset Value, offering price and redemption price per share ($31,239,234 ÷ 2,430,287 shares) | | $12.85 |
See accompanying notes which are an integral part of the financial statements.
Statement of Operations
| | | Six months ended June 30, 2018 (Unaudited) |
| Investment Income | | |
| Dividends: | | |
| Affiliated issuers | | $92,259 |
| Expenses | | |
| Independent trustees' fees and expenses | $99 | |
| Total expenses | | 99 |
| Net investment income (loss) | | 92,160 |
| Realized and Unrealized Gain (Loss) | | |
| Net realized gain (loss) on: | | |
| Investment securities: | | |
| Affiliated issuers | 85,673 | |
| Capital gain distributions from underlying funds: | | |
| Affiliated issuers | 1,013,399 | |
| Total net realized gain (loss) | | 1,099,072 |
| Change in net unrealized appreciation (depreciation) on: | | |
| Investment securities: | | |
| Affiliated issuers | (1,176,569) | |
| Total change in net unrealized appreciation (depreciation) | | (1,176,569) |
| Net gain (loss) | | (77,497) |
| Net increase (decrease) in net assets resulting from operations | | $14,663 |
See accompanying notes which are an integral part of the financial statements.
Statement of Changes in Net Assets
| | Six months ended June 30, 2018 (Unaudited) | Year ended December 31, 2017 |
| Increase (Decrease) in Net Assets | | |
| Operations | | |
| Net investment income (loss) | $92,160 | $544,485 |
| Net realized gain (loss) | 1,099,072 | 895,739 |
| Change in net unrealized appreciation (depreciation) | (1,176,569) | 3,124,101 |
| Net increase (decrease) in net assets resulting from operations | 14,663 | 4,564,325 |
| Distributions to shareholders from net investment income | – | (543,806) |
| Distributions to shareholders from net realized gain | (553,350) | (812,703) |
| Total distributions | (553,350) | (1,356,509) |
| Share transactions | | |
| Proceeds from sales of shares | – | 1,985,174 |
| Reinvestment of distributions | 553,350 | 1,356,509 |
| Cost of shares redeemed | (1,158,734) | (2,247,094) |
| Net increase (decrease) in net assets resulting from share transactions | (605,384) | 1,094,589 |
| Total increase (decrease) in net assets | (1,144,071) | 4,302,405 |
| Net Assets | | |
| Beginning of period | 32,383,305 | 28,080,900 |
| End of period | $31,239,234 | $32,383,305 |
| Other Information | | |
| Undistributed net investment income end of period | $92,161 | $1 |
| Shares | | |
| Sold | – | 164,920 |
| Issued in reinvestment of distributions | 42,862 | 108,141 |
| Redeemed | (89,402) | (177,878) |
| Net increase (decrease) | (46,540) | 95,183 |
See accompanying notes which are an integral part of the financial statements.
Financial Highlights
VIP Freedom Lifetime Income III Portfolio
| | Six months ended (Unaudited) June 30, | Years endedDecember 31, | | | | |
| | 2018 | 2017 | 2016 | 2015 | 2014 | 2013 |
| Selected Per–Share Data | | | | | | |
| Net asset value, beginning of period | $13.07 | $11.79 | $11.59 | $11.91 | $11.74 | $9.99 |
| Income from Investment Operations | | | | | | |
| Net investment income (loss)A | .04 | .22 | .23 | .27 | .25 | .23 |
| Net realized and unrealized gain (loss) | (.03) | 1.62 | .51 | (.30) | .37 | 1.81 |
| Total from investment operations | .01 | 1.84 | .74 | (.03) | .62 | 2.04 |
| Distributions from net investment income | – | (.23) | (.21) | (.24) | (.22) | (.20) |
| Distributions from net realized gain | (.23) | (.33) | (.33) | (.05) | (.23) | (.09) |
| Total distributions | (.23) | (.56) | (.54) | (.29) | (.45) | (.29) |
| Net asset value, end of period | $12.85 | $13.07 | $11.79 | $11.59 | $11.91 | $11.74 |
| Total ReturnB,C,D | .04% | 15.85% | 6.83% | (.27)% | 5.30% | 20.43% |
| Ratios to Average Net AssetsE,F | | | | | | |
| Expenses before reductionsG | - %H | -% | -% | -% | -% | -% |
| Expenses net of fee waivers, if any | - %G,H | -% | -% | -% | -% | -% |
| Expenses net of all reductions | - %G,H | -% | -% | -% | -% | -% |
| Net investment income (loss) | .58%H | 1.74% | 1.95% | 2.23% | 2.07% | 2.07% |
| Supplemental Data | | | | | | |
| Net assets, end of period (000 omitted) | $31,239 | $32,383 | $28,081 | $21,180 | $17,037 | $12,661 |
| Portfolio turnover rateE | 41%H | 15% | 15% | 12% | 18% | 19% |
A Calculated based on average shares outstanding during the period.
B Total returns for periods of less than one year are not annualized.
C Total returns do not reflect charges attributable to your insurance company's separate account. Inclusion of these charges would reduce the total returns shown.
D Total returns would have been lower if certain expenses had not been reduced during the applicable periods shown.
E Amounts do not include the activity of the Underlying Funds.
F Expense ratios reflect operating expenses of the Fund. Expenses before reductions do not reflect amounts reimbursed by the investment adviser or reductions from expense offset arrangements and do not represent the amount paid by the Fund during periods when reimbursements or reductions occur. Expenses net of fee waivers reflect expenses after reimbursement by the investment adviser but prior to reductions from expense offset arrangements. Expenses net of all reductions represent the net expenses paid by the Fund but do not include expenses of the underlying funds in which the Fund invests.
G Amount represents less than .005%.
H Annualized
See accompanying notes which are an integral part of the financial statements.
Notes to Financial Statements (Unaudited)
For the period ended June 30, 2018
1. Organization.
VIP Freedom Lifetime Income I Portfolio, VIP Freedom Lifetime Income II Portfolio, and VIP Freedom Lifetime Income III Portfolio (the Funds) are funds of Variable Insurance Products Fund V (the Trust). The Trust is registered under the Investment Company Act of 1940, as amended (the 1940 Act), as an open-end management investment company organized as a Massachusetts business trust. Each Fund is authorized to issue an unlimited number of shares. The Funds invest primarily in a combination of other VIP equity, bond, and short-term funds (the Underlying Funds) managed by Fidelity Management & Research Company (FMR). Shares of each Fund may only be purchased by insurance companies for the purpose of funding variable annuity or variable life insurance contracts.
2. Significant Accounting Policies.
Each Fund is an investment company and applies the accounting and reporting guidance of the Financial Accounting Standards Board (FASB) Accounting Standards Codification Topic 946 Financial Services – Investments Companies. The financial statements have been prepared in conformity with accounting principles generally accepted in the United States of America (GAAP), which require management to make certain estimates and assumptions at the date of the financial statements. Actual results could differ from those estimates. Subsequent events, if any, through the date that the financial statements were issued have been evaluated in the preparation of the financial statements. The following summarizes the significant accounting policies of the Funds:
Investment Valuation. Investments are valued as of 4:00 p.m. Eastern time on the last calendar day of the period. Each Fund categorizes the inputs to valuation techniques used to value its investments into a disclosure hierarchy consisting of three levels as shown below:
- Level 1 – quoted prices in active markets for identical investments
- Level 2 – other significant observable inputs (including quoted prices for similar investments, interest rates, prepayment speeds, etc.)
- Level 3 – unobservable inputs (including the Fund's own assumptions based on the best information available)
Valuation techniques used to value each Fund's investments by major category are as follows. Investments in the Underlying Funds are valued at their closing net asset value (NAV) each business day and are categorized as Level 1 in the hierarchy.
Investment Transactions and Income. For financial reporting purposes, the Funds' investment holdings and NAV include trades executed through the end of the last business day of the period. The NAV per share for processing shareholder transactions is calculated as of the close of business of the New York Stock Exchange (NYSE), normally 4:00 p.m. Eastern time and includes trades executed through the end of the prior business day. Gains and losses on securities sold are determined on the basis of identified cost. Income and capital gain distributions from the Underlying Funds, if any, are recorded on the ex-dividend date.
Expenses. Expenses directly attributable to a fund are charged to that fund. Expenses attributable to more than one fund are allocated among the respective funds on the basis of relative net assets or other appropriate methods. Expenses included in the accompanying financial statements reflect the expenses of each Fund and do not include any expenses associated with the Underlying Funds. Although not included in each Fund's expenses, each Fund indirectly bears its proportionate share of the Underlying Funds' expenses through the impact of these expenses on each Underlying Fund's NAV. Expense estimates are accrued in the period to which they relate and adjustments are made when actual amounts are known.
Income Tax Information and Distributions to Shareholders. Each year, each Fund intends to qualify as a regulated investment company under Subchapter M of the Internal Revenue Code, including distributing substantially all of its taxable income and realized gains. As a result, no provision for U.S. Federal income taxes is required. Each Fund files a U.S. federal tax return, in addition to state and local tax returns as required. Each Fund's federal income tax returns are subject to examination by the Internal Revenue Service (IRS) for a period of three fiscal years after they are filed. State and local tax returns may be subject to examination for an additional fiscal year depending on the jurisdiction.
Distributions are declared and recorded on the ex-dividend date. Income and capital gain distributions are determined in accordance with income tax regulations, which may differ from GAAP.
Capital accounts within the financial statements are adjusted for permanent book-tax differences. These adjustments have no impact on net assets or the results of operations. Capital accounts are not adjusted for temporary book-tax differences which will reverse in a subsequent period.
Book-tax differences are primarily due to the short-term gain distributions from the Underlying Funds and losses deferred due to wash sales.
As of period end, the cost and unrealized appreciation (depreciation) in securities, and derivatives if applicable, for federal income tax purposes were as follows for each Fund:
| | Tax cost | Gross unrealized appreciation | Gross unrealized depreciation | Net unrealized appreciation (depreciation) |
| VIP Freedom Lifetime Income I | $12,484,804 | $539,125 | $(165,815) | $373,310 |
| VIP Freedom Lifetime Income II | 31,069,305 | 2,778,177 | (411,322) | 2,366,855 |
| VIP Freedom Lifetime Income III | 28,526,614 | 3,038,317 | (325,787) | 2,712,530 |
3. Purchases and Redemptions of Underlying Fund Shares.
Purchases and redemptions of the Underlying Fund shares are noted in the table below.
| | Purchases ($) | Redemptions ($) |
| VIP Freedom Lifetime Income I | 2,668,975 | 3,179,819 |
| VIP Freedom Lifetime Income II | 6,672,645 | 7,036,379 |
| VIP Freedom Lifetime Income III | 6,566,537 | 6,619,737 |
4. Fees and Other Transactions with Affiliates.
Management Fee. FMR Co., Inc. (the investment adviser), an affiliate of FMR, provides the Funds with investment management related services. The Funds do not pay any fees for these services.
Other Transactions. The investment adviser has entered into an administration agreement with FMR under which FMR provides management and administrative services (other than investment advisory services) necessary for the operation of each Fund. Pursuant to this agreement, FMR pays all expenses of each Fund, excluding compensation of the independent Trustees and certain other expenses such as interest expense. FMR also contracts with other Fidelity companies to perform the services necessary for the operation of each Fund. The Funds do not pay any fees for these services.
5. Other.
The Funds' organizational documents provide former and current trustees and officers with a limited indemnification against liabilities arising in connection with the performance of their duties to the Funds. In the normal course of business, the Funds may also enter into contracts that provide general indemnifications. The Funds' maximum exposure under these arrangements is unknown as this would be dependent on future claims that may be made against the Funds. The risk of material loss from such claims is considered remote.
At the end of the period, the investment adviser or its affiliates were owners of record of all of the outstanding shares of the Funds.
Shareholder Expense Example
As a shareholder of a Fund, you incur two types of costs: (1) transaction costs and (2) ongoing costs, including other Fund expenses. This Example is intended to help you understand your ongoing costs (in dollars) of investing in the Funds and to compare these costs with the ongoing costs of investing in other mutual funds.
The Example is based on an investment of $1,000 invested at the beginning of the period and held for the entire period (January 1, 2018 to June 30, 2018).
Actual Expenses
The first line of the accompanying table for each fund provides information about actual account values and actual expenses. You may use the information in this line, together with the amount you invested, to estimate the expenses that you paid over the period. Simply divide your account value by $1,000.00 (for example, an $8,600 account value divided by $1,000.00 = 8.6), then multiply the result by the number in the first line for a fund under the heading entitled "Expenses Paid During Period" to estimate the expenses you paid on your account during this period. The estimate of expenses does not include any fees or other expenses of any variable annuity or variable life insurance product. If they were, the estimate of expenses you paid during the period would be higher, and your ending account value would be lower. In addition, each Fund, as a shareholder in underlying Fidelity Funds, will indirectly bear its pro-rata share of the fees and expenses incurred by the underlying Fidelity Funds. These fees and expenses are not included in each Fund's annualized expense ratio used to calculate the expense estimates in the table below.
Hypothetical Example for Comparison Purposes
The second line of the accompanying table for each fund provides information about hypothetical account values and hypothetical expenses based on a fund's actual expense ratio and an assumed rate of return of 5% per year before expenses, which is not the Fund's actual return. The hypothetical account values and expenses may not be used to estimate the actual ending account balance or expenses you paid for the period. You may use this information to compare the ongoing costs of investing in the Fund and other funds. To do so, compare this 5% hypothetical example with the 5% hypothetical examples that appear in the shareholder reports of the other funds. The estimate of expenses does not include any fees or other expenses of any variable annuity or variable life insurance product. If they were, the estimate of expenses you paid during the period would be higher, and your ending account value would be lower. In addition, each Fund, as a shareholder in underlying Fidelity Funds, will indirectly bear its pro-rata share of the fees and expenses incurred by the underlying Fidelity Funds. These fees and expenses are not included in each Fund's annualized expense ratio used to calculate the expense estimates in the table below.
Please note that the expenses shown in the table are meant to highlight your ongoing costs only and do not reflect any transaction costs. Therefore, the second line of the table is useful in comparing ongoing costs only, and will not help you determine the relative total costs of owning different funds.
| | Annualized Expense Ratio-A | Beginning
Account Value
January 1, 2018 | Ending
Account Value
June 30, 2018 | Expenses Paid
During Period-B
January 1, 2018
to June 30, 2018 |
| VIP Freedom Lifetime Income I | - %-C | | | |
| Actual | | $1,000.00 | $993.10 | $--D |
| Hypothetical-E | | $1,000.00 | $1,024.79 | $--D |
| VIP Freedom Lifetime Income II | - %-C | | | |
| Actual | | $1,000.00 | $999.30 | $--D |
| Hypothetical-E | | $1,000.00 | $1,024.79 | $--D |
| VIP Freedom Lifetime Income III | - %-C | | | |
| Actual | | $1,000.00 | $1,000.40 | $--D |
| Hypothetical-E | | $1,000.00 | $1,024.79 | $--D |
A Annualized expense ratio reflects expenses net of applicable fee waivers.
B Expenses are equal to each Fund's annualized expense ratio, multiplied by the average account value over the period, multiplied by 181/ 365 (to reflect the one-half year period). The fees and expenses of the underlying Fidelity Funds in which each Fund invests are not included in each Fund's annualized expense ratio.
C Amount represents less than .005%.
D Amount represents less than $.01
E 5% return per year before expenses
VIPFLI-SANN-0818
1.816202.112
Fidelity® Variable Insurance Products:
Investor Freedom Funds - Income, 2005, 2010, 2015, 2020, 2025, 2030 Investor Freedom Income® Portfolio
Investor Freedom® 2005 Portfolio
Investor Freedom® 2010 Portfolio
Investor Freedom® 2015 Portfolio
Investor Freedom® 2020 Portfolio
Investor Freedom® 2025 Portfolio
Investor Freedom® 2030 Portfolio
Semi-Annual Report June 30, 2018 |
|
Contents
To view a fund's proxy voting guidelines and proxy voting record for the 12-month period ended June 30, visit http://www.fidelity.com/proxyvotingresults or visit the Securities and Exchange Commission's (SEC) web site at http://www.sec.gov.
You may also call 1-877-208-0098 to request a free copy of the proxy voting guidelines.
Fidelity® Variable Insurance Products are separate account options which are purchased through a variable insurance contract.
Standard & Poor's, S&P and S&P 500 are registered service marks of The McGraw-Hill Companies, Inc. and have been licensed for use by Fidelity Distributors Corporation.
Other third-party marks appearing herein are the property of their respective owners.
All other marks appearing herein are registered or unregistered trademarks or service marks of FMR LLC or an affiliated company. © 2018 FMR LLC. All rights reserved.
This report and the financial statements contained herein are submitted for the general information of the shareholders of the Funds. This report is not authorized for distribution to prospective investors in the Funds unless preceded or accompanied by an effective prospectus.
A fund files its complete schedule of portfolio holdings with the SEC for the first and third quarters of each fiscal year on Form N-Q. Forms N-Q are available on the SEC’s web site at http://www.sec.gov. A fund's Forms N-Q may be reviewed and copied at the SEC’s Public Reference Room in Washington, DC. Information regarding the operation of the SEC's Public Reference Room may be obtained by calling 1-800-SEC-0330.
For a complete list of a fund's portfolio holdings, view the most recent holdings listing, semiannual report, or annual report on Fidelity's web site at http://www.fidelity.com, http://www.institutional.fidelity.com, or http://www.401k.com, as applicable.
NOT FDIC INSURED •MAY LOSE VALUE •NO BANK GUARANTEE
Neither the Funds nor Fidelity Distributors Corporation is a bank.
Note to shareholders
At its May 2018 meeting, the Board of Trustees approved incremental updates to the strategic asset allocation (i.e., glide path) of VIP Investor Freedom Funds, adding U.S. Treasury Inflation-Protected Securities and long-term U.S. Treasury bonds as fixed exposures in the Funds’ bond allocations, while slightly reducing the equity and short-term debt allocations for shorter-dated Portfolios. These glide path updates are expected to be fully implemented by the end of 2018. In addition, to increase the investment opportunity set, the Board approved allowing VIP Investor Freedom Funds to employ underlying Fidelity funds beyond just VIP portfolios.
VIP Investor Freedom Income Portfolio℠
Investment Summary (Unaudited)
The information in the following tables is based on the direct investments of the Fund.
Top Holdings as of June 30, 2018
| | % of fund's net assets |
| VIP Investment Grade Bond Portfolio Investor Class | 37.2 |
| VIP Government Money Market Portfolio Investor Class 1.68% | 29.2 |
| VIP Overseas Portfolio Investor Class | 6.0 |
| Fidelity Inflation-Protected Bond Index Fund Institutional Premium Class | 5.7 |
| VIP Emerging Markets Portfolio Investor Class | 3.7 |
| Fidelity Long-Term Treasury Bond Index Fund Premium Class | 3.4 |
| VIP Growth & Income Portfolio Investor Class | 2.7 |
| VIP Equity-Income Portfolio Investor Class | 2.4 |
| VIP Growth Portfolio Investor Class | 2.3 |
| VIP Contrafund Portfolio Investor Class | 2.2 |
| | 94.8 |
Asset Allocation (% of fund's net assets)
| Period end |
| | Domestic Equity Funds | 12.8% |
| | International Equity Funds | 9.7% |
| | Bond Funds | 48.3% |
| | Short-Term Funds | 29.2% |

VIP Investor Freedom Income Portfolio℠
Schedule of Investments June 30, 2018 (Unaudited)
Showing Percentage of Net Assets
| Domestic Equity Funds - 12.8% | | | |
| | | Shares | Value |
| VIP Contrafund Portfolio Investor Class (a) | | 49,878 | $1,767,179 |
| VIP Equity-Income Portfolio Investor Class (a) | | 83,995 | 1,856,282 |
| VIP Growth & Income Portfolio Investor Class (a) | | 98,769 | 2,112,660 |
| VIP Growth Portfolio Investor Class (a) | | 26,181 | 1,814,078 |
| VIP Mid Cap Portfolio Investor Class (a) | | 14,111 | 513,059 |
| VIP Value Portfolio Investor Class (a) | | 86,646 | 1,356,877 |
| VIP Value Strategies Portfolio Investor Class (a) | | 48,730 | 662,728 |
| TOTAL DOMESTIC EQUITY FUNDS | | | |
| (Cost $7,497,216) | | | 10,082,863 |
|
| International Equity Funds - 9.7% | | | |
| VIP Emerging Markets Portfolio Investor Class (a) | | 256,444 | 2,913,204 |
| VIP Overseas Portfolio Investor Class (a) | | 211,065 | 4,715,190 |
| TOTAL INTERNATIONAL EQUITY FUNDS | | | |
| (Cost $5,627,343) | | | 7,628,394 |
|
| Bond Funds - 48.3% | | | |
| Fidelity Inflation-Protected Bond Index Fund Institutional Premium Class (a) | | 457,466 | 4,492,319 |
| Fidelity Long-Term Treasury Bond Index Fund Premium Class (a) | | 207,651 | 2,637,162 |
| VIP High Income Portfolio Investor Class (a) | | 292,207 | 1,563,307 |
| VIP Investment Grade Bond Portfolio Investor Class (a) | | 2,353,290 | 29,251,399 |
| TOTAL BOND FUNDS | | | |
| (Cost $38,378,201) | | | 37,944,187 |
|
| Short-Term Funds - 29.2% | | | |
| VIP Government Money Market Portfolio Investor Class 1.68% (a)(b) | | | |
| (Cost $22,928,242) | | 22,928,242 | 22,928,242 |
| TOTAL INVESTMENT IN SECURITIES - 100.0% | | | |
| (Cost $74,431,002) | | | 78,583,686 |
| NET OTHER ASSETS (LIABILITIES) - 0.0% | | | 99 |
| NET ASSETS - 100% | | | $78,583,785 |
Legend
(a) Affiliated Fund
(b) The rate quoted is the annualized seven-day yield of the fund at period end.
Affiliated Central Funds
Information regarding fiscal year to date income earned by the Fund from investments in Fidelity Central Funds is as follows:
| Fund | Income earned |
| Fidelity Cash Central Fund | $3 |
| Total | $3 |
Amounts in the income column in the above table include any capital gain distributions from underlying funds, which are presented in the corresponding line-item in the Statement of Operations if applicable.
Affiliated Underlying Funds
Fiscal year to date information regarding the Fund's investments in affiliated Underlying Funds, excluding any Money Market Central Funds, is presented below. Exchanges between classes of the same affiliated Underlying Funds may occur.
| Affiliate | Value, beginning of period | Purchases | Sales Proceeds | Dividend Income | Realized Gain (loss) | Change in Unrealized appreciation (depreciation) | Value, end of period |
| Fidelity Inflation-Protected Bond Index Fund Institutional Premium Class | $-- | $4,492,319 | $-- | $41 | $-- | $-- | $4,492,319 |
| Fidelity Long-Term Treasury Bond Index Fund Premium Class | 1,613,407 | 1,258,683 | 171,602 | 24,416 | (2,604) | (60,722) | 2,637,162 |
| VIP Contrafund Portfolio Investor Class | 1,841,127 | 445,627 | 423,430 | 156,743 | 15,713 | (111,858) | 1,767,179 |
| VIP Emerging Markets Portfolio Investor Class | 2,868,422 | 726,992 | 494,945 | 1,340 | 56,107 | (243,372) | 2,913,204 |
| VIP Equity-Income Portfolio Investor Class | 1,941,109 | 491,847 | 446,776 | 87,216 | (7,778) | (122,120) | 1,856,282 |
| VIP Government Money Market Portfolio Investor Class 1.68% | 24,499,469 | 4,182,055 | 5,753,282 | 167,732 | -- | -- | 22,928,242 |
| VIP Growth & Income Portfolio Investor Class | 2,226,546 | 534,718 | 540,805 | 120,027 | 25,559 | (133,358) | 2,112,660 |
| VIP Growth Portfolio Investor Class | 1,874,934 | 542,501 | 528,333 | 259,735 | 58,698 | (133,722) | 1,814,078 |
| VIP High Income Portfolio Investor Class | 1,506,782 | 253,540 | 174,613 | 13,868 | (961) | (21,441) | 1,563,307 |
| VIP Investment Grade Bond Portfolio Investor Class | 29,526,046 | 5,345,767 | 4,875,609 | 303,054 | (43,749) | (701,056) | 29,251,399 |
| VIP Mid Cap Portfolio Investor Class | 539,310 | 129,987 | 128,434 | 44,479 | 4,667 | (32,471) | 513,059 |
| VIP Overseas Portfolio Investor Class | 4,883,906 | 889,903 | 968,885 | 1,236 | 46,240 | (135,974) | 4,715,190 |
| VIP Value Portfolio Investor Class | 1,426,078 | 310,417 | 326,873 | 50,019 | 4,114 | (56,859) | 1,356,877 |
| VIP Value Strategies Portfolio Investor Class | 696,511 | 145,682 | 153,281 | 21,909 | 665 | (26,849) | 662,728 |
| | $75,443,647 | $19,750,038 | $14,986,868 | $1,251,815 | $156,671 | $(1,779,802) | $78,583,686 |
Amounts in the income column in the above table include any capital gain distributions from underlying funds, which are presented in the corresponding line-item in the Statement of Operations if applicable.
Investment Valuation
All investments are categorized as Level 1 under the Fair Value Hierarchy. The inputs or methodology used for valuing securities may not be an indication of the risk associated with investing in those securities. For more information on valuation inputs please refer to the Investment Valuation section in the accompanying Notes to Financial Statements.
See accompanying notes which are an integral part of the financial statements.
VIP Investor Freedom Income Portfolio℠
Financial Statements
Statement of Assets and Liabilities
| | | June 30, 2018 (Unaudited) |
| Assets | | |
Investment in securities, at value — See accompanying schedule:
| | |
| Affiliated issuers (cost $74,431,002) | $78,583,686 | |
| Total Investment in Securities (cost $74,431,002) | | $78,583,686 |
| Cash | | 5 |
| Receivable for investments sold | | 5,344,513 |
| Receivable for fund shares sold | | 141,517 |
| Total assets | | 84,069,721 |
| Liabilities | | |
| Payable for investments purchased | 5,485,915 | |
| Payable for fund shares redeemed | 21 | |
| Total liabilities | | 5,485,936 |
| Net Assets | | $78,583,785 |
| Net Assets consist of: | | |
| Paid in capital | | $73,225,039 |
| Undistributed net investment income | | 338,754 |
| Accumulated undistributed net realized gain (loss) on investments | | 867,308 |
| Net unrealized appreciation (depreciation) on investments | | 4,152,684 |
| Net Assets, for 6,836,633 shares outstanding | | $78,583,785 |
| Net Asset Value, offering price and redemption price per share ($78,583,785 ÷ 6,836,633 shares) | | $11.49 |
See accompanying notes which are an integral part of the financial statements.
Statement of Operations
| | | Six months ended June 30, 2018 (Unaudited) |
| Investment Income | | |
| Dividends: | | |
| Affiliated issuers | | $342,315 |
| Income from Fidelity Central Funds | | 3 |
| Total income | | 342,318 |
| Expenses | | |
| Independent trustees' fees and expenses | $232 | |
| Total expenses | | 232 |
| Net investment income (loss) | | 342,086 |
| Realized and Unrealized Gain (Loss) | | |
| Net realized gain (loss) on: | | |
| Investment securities: | | |
| Affiliated issuers | 156,671 | |
| Capital gain distributions from underlying funds: | | |
| Affiliated issuers | 909,500 | |
| Total net realized gain (loss) | | 1,066,171 |
| Change in net unrealized appreciation (depreciation) on: | | |
| Investment securities: | | |
| Affiliated issuers | (1,779,802) | |
| Total change in net unrealized appreciation (depreciation) | | (1,779,802) |
| Net gain (loss) | | (713,631) |
| Net increase (decrease) in net assets resulting from operations | | $(371,545) |
See accompanying notes which are an integral part of the financial statements.
Statement of Changes in Net Assets
| | Six months ended June 30, 2018 (Unaudited) | Year ended December 31, 2017 |
| Increase (Decrease) in Net Assets | | |
| Operations | | |
| Net investment income (loss) | $342,086 | $1,134,659 |
| Net realized gain (loss) | 1,066,171 | 1,086,038 |
| Change in net unrealized appreciation (depreciation) | (1,779,802) | 3,552,258 |
| Net increase (decrease) in net assets resulting from operations | (371,545) | 5,772,955 |
| Distributions to shareholders from net investment income | (19,891) | (1,118,100) |
| Distributions to shareholders from net realized gain | (789,021) | (669,886) |
| Total distributions | (808,912) | (1,787,986) |
| Share transactions | | |
| Proceeds from sales of shares | 11,510,704 | 13,236,976 |
| Reinvestment of distributions | 808,912 | 1,787,986 |
| Cost of shares redeemed | (8,000,463) | (10,654,992) |
| Net increase (decrease) in net assets resulting from share transactions | 4,319,153 | 4,369,970 |
| Total increase (decrease) in net assets | 3,138,696 | 8,354,939 |
| Net Assets | | |
| Beginning of period | 75,445,089 | 67,090,150 |
| End of period | $78,583,785 | $75,445,089 |
| Other Information | | |
| Undistributed net investment income end of period | $338,754 | $16,559 |
| Shares | | |
| Sold | 997,361 | 1,145,861 |
| Issued in reinvestment of distributions | 70,279 | 155,245 |
| Redeemed | (693,561) | (923,119) |
| Net increase (decrease) | 374,079 | 377,987 |
See accompanying notes which are an integral part of the financial statements.
Financial Highlights
VIP Investor Freedom Income Portfolio
| | Six months ended (Unaudited) June 30, | Years endedDecember 31, | | | | |
| | 2018 | 2017 | 2016 | 2015 | 2014 | 2013 |
| Selected Per–Share Data | | | | | | |
| Net asset value, beginning of period | $11.67 | $11.03 | $10.86 | $11.11 | $10.97 | $10.65 |
| Income from Investment Operations | | | | | | |
| Net investment income (loss)A | .05 | .18 | .16 | .19 | .17 | .19 |
| Net realized and unrealized gain (loss) | (.11) | .75 | .31 | (.23) | .25 | .39 |
| Total from investment operations | (.06) | .93 | .47 | (.04) | .42 | .58 |
| Distributions from net investment income | –B | (.18) | (.16) | (.19) | (.17) | (.17) |
| Distributions from net realized gain | (.12) | (.11) | (.14) | (.01) | (.10) | (.09) |
| Total distributions | (.12) | (.29) | (.30) | (.21)C | (.28)D | (.26) |
| Net asset value, end of period | $11.49 | $11.67 | $11.03 | $10.86 | $11.11 | $10.97 |
| Total ReturnE,F,G | (.50)% | 8.45% | 4.43% | (.37)% | 3.80% | 5.43% |
| Ratios to Average Net AssetsH,I | | | | | | |
| Expenses before reductionsJ | - %K | -% | -% | -% | -% | -% |
| Expenses net of fee waivers, if any | - %J,K | -% | -% | -% | -% | -% |
| Expenses net of all reductions | - %J,K | -% | -% | -% | -% | -% |
| Net investment income (loss) | .89%K | 1.59% | 1.47% | 1.68% | 1.57% | 1.77% |
| Supplemental Data | | | | | | |
| Net assets, end of period (000 omitted) | $78,584 | $75,445 | $67,090 | $64,031 | $66,121 | $60,214 |
| Portfolio turnover rateH | 39%K | 25% | 25% | 33% | 26% | 33% |
A Calculated based on average shares outstanding during the period.
B Amount represents less than $.005 per share.
C Total distributions of $.21 per share is comprised of distributions from net investment income of $.194 and distributions from net realized gain of $.015 per share.
D Total distributions of $.28 per share is comprised of distributions from net investment income of $.170 and distributions from net realized gain of $.105 per share.
E Total returns for periods of less than one year are not annualized.
F Total returns do not reflect charges attributable to your insurance company's separate account. Inclusion of these charges would reduce the total returns shown.
G Total returns would have been lower if certain expenses had not been reduced during the applicable periods shown.
H Amounts do not include the activity of the Underlying Funds.
I Expense ratios reflect operating expenses of the Fund. Expenses before reductions do not reflect amounts reimbursed by the investment adviser or reductions from expense offset arrangements and do not represent the amount paid by the Fund during periods when reimbursements or reductions occur. Expenses net of fee waivers reflect expenses after reimbursement by the investment adviser but prior to reductions from expense offset arrangements. Expenses net of all reductions represent the net expenses paid by the Fund but do not include expenses of the underlying funds in which the Fund invests.
J Amount represents less than .005%.
K Annualized
See accompanying notes which are an integral part of the financial statements.
VIP Investor Freedom 2005 Portfolio℠
Investment Summary (Unaudited)
The information in the following tables is based on the direct investments of the Fund.
Top Holdings as of June 30, 2018
| | % of fund's net assets |
| VIP Investment Grade Bond Portfolio Investor Class | 34.1 |
| VIP Government Money Market Portfolio Investor Class 1.68% | 23.6 |
| VIP Overseas Portfolio Investor Class | 8.0 |
| Fidelity Inflation-Protected Bond Index Fund Premium Class | 5.1 |
| VIP Emerging Markets Portfolio Investor Class | 4.6 |
| VIP Growth & Income Portfolio Investor Class | 4.0 |
| VIP Equity-Income Portfolio Investor Class | 3.5 |
| Fidelity Long-Term Treasury Bond Index Fund Premium Class | 3.5 |
| VIP Growth Portfolio Investor Class | 3.4 |
| VIP Contrafund Portfolio Investor Class | 3.3 |
| | 93.1 |
Asset Allocation (% of fund's net assets)
| Period end |
| | Domestic Equity Funds | 19.1% |
| | International Equity Funds | 12.6% |
| | Bond Funds | 44.7% |
| | Short-Term Funds | 23.6% |

VIP Investor Freedom 2005 Portfolio℠
Schedule of Investments June 30, 2018 (Unaudited)
Showing Percentage of Net Assets
| Domestic Equity Funds - 19.1% | | | |
| | | Shares | Value |
| VIP Contrafund Portfolio Investor Class (a) | | 28,310 | $1,003,034 |
| VIP Equity-Income Portfolio Investor Class (a) | | 47,676 | 1,053,634 |
| VIP Growth & Income Portfolio Investor Class (a) | | 56,066 | 1,199,250 |
| VIP Growth Portfolio Investor Class (a) | | 14,858 | 1,029,544 |
| VIP Mid Cap Portfolio Investor Class (a) | | 8,010 | 291,239 |
| VIP Value Portfolio Investor Class (a) | | 49,187 | 770,263 |
| VIP Value Strategies Portfolio Investor Class (a) | | 27,664 | 376,226 |
| TOTAL DOMESTIC EQUITY FUNDS | | | |
| (Cost $4,577,467) | | | 5,723,190 |
|
| International Equity Funds - 12.6% | | | |
| VIP Emerging Markets Portfolio Investor Class (a) | | 122,599 | 1,392,728 |
| VIP Overseas Portfolio Investor Class (a) | | 107,280 | 2,396,639 |
| TOTAL INTERNATIONAL EQUITY FUNDS | | | |
| (Cost $3,014,822) | | | 3,789,367 |
|
| Bond Funds - 44.7% | | | |
| Fidelity Inflation-Protected Bond Index Fund Premium Class (a) | | 156,467 | 1,536,502 |
| Fidelity Long-Term Treasury Bond Index Fund Premium Class (a) | | 82,033 | 1,041,816 |
| VIP High Income Portfolio Investor Class (a) | | 111,560 | 596,845 |
| VIP Investment Grade Bond Portfolio Investor Class (a) | | 823,265 | 10,233,184 |
| TOTAL BOND FUNDS | | | |
| (Cost $13,596,832) | | | 13,408,347 |
|
| Short-Term Funds - 23.6% | | | |
| VIP Government Money Market Portfolio Investor Class 1.68% (a)(b) | | | |
| (Cost $7,100,579) | | 7,100,579 | 7,100,579 |
| TOTAL INVESTMENT IN SECURITIES - 100.0% | | | |
| (Cost $28,289,700) | | | 30,021,483 |
| NET OTHER ASSETS (LIABILITIES) - 0.0% | | | 24 |
| NET ASSETS - 100% | | | $30,021,507 |
Legend
(a) Affiliated Fund
(b) The rate quoted is the annualized seven-day yield of the fund at period end.
Affiliated Underlying Funds
Fiscal year to date information regarding the Fund's investments in affiliated Underlying Funds, excluding any Money Market Central Funds, is presented below. Exchanges between classes of the same affiliated Underlying Funds may occur.
| Affiliate | Value, beginning of period | Purchases | Sales Proceeds | Dividend Income | Realized Gain (loss) | Change in Unrealized appreciation (depreciation) | Value, end of period |
| Fidelity Inflation-Protected Bond Index Fund Premium Class | $-- | $1,536,502 | $-- | $12 | $-- | $-- | $1,536,502 |
| Fidelity Long-Term Treasury Bond Index Fund Fund Premium Class | 618,743 | 504,259 | 57,813 | 9,480 | (1,017) | (22,356) | 1,041,816 |
| VIP Contrafund Portfolio Investor Class | 1,047,027 | 224,369 | 215,439 | 88,190 | 1,259 | (54,182) | 1,003,034 |
| VIP Emerging Markets Portfolio Investor Class | 1,377,196 | 315,976 | 211,578 | 641 | 18,334 | (107,200) | 1,392,728 |
| VIP Equity-Income Portfolio Investor Class | 1,103,928 | 230,553 | 208,132 | 49,064 | (2,655) | (70,060) | 1,053,634 |
| VIP Government Money Market Portfolio Investor Class 1.68% | 7,501,026 | 1,257,474 | 1,657,921 | 51,991 | -- | -- | 7,100,579 |
| VIP Growth & Income Portfolio Investor Class | 1,266,284 | 258,203 | 264,867 | 67,526 | 5,345 | (65,715) | 1,199,250 |
| VIP Growth Portfolio Investor Class | 1,066,201 | 285,426 | 281,914 | 146,146 | 8,966 | (49,135) | 1,029,544 |
| VIP High Income Portfolio Investor Class | 576,160 | 89,176 | 59,795 | 5,300 | (729) | (7,967) | 596,845 |
| VIP Investment Grade Bond Portfolio Investor Class | 10,309,697 | 1,830,231 | 1,643,371 | 106,214 | (25,844) | (237,529) | 10,233,184 |
| VIP Mid Cap Portfolio Investor Class | 306,705 | 64,703 | 64,548 | 25,023 | 2,295 | (17,916) | 291,239 |
| VIP Overseas Portfolio Investor Class | 2,508,357 | 377,570 | 445,689 | 629 | 6,877 | (50,476) | 2,396,639 |
| VIP Value Portfolio Investor Class | 811,018 | 142,538 | 153,549 | 28,137 | 150 | (29,894) | 770,263 |
| VIP Value Strategies Portfolio Investor Class | 396,111 | 67,145 | 72,148 | 12,325 | (549) | (14,333) | 376,226 |
| | $28,888,453 | $7,184,125 | $5,336,764 | $590,678 | $12,432 | $(726,763) | $30,021,483 |
Amounts in the income column in the above table include any capital gain distributions from underlying funds, which are presented in the corresponding line-item in the Statement of Operations if applicable.
Investment Valuation
All investments are categorized as Level 1 under the Fair Value Hierarchy. The inputs or methodology used for valuing securities may not be an indication of the risk associated with investing in those securities. For more information on valuation inputs please refer to the Investment Valuation section in the accompanying Notes to Financial Statements.
See accompanying notes which are an integral part of the financial statements.
VIP Investor Freedom 2005 Portfolio℠
Financial Statements
Statement of Assets and Liabilities
| | | June 30, 2018 (Unaudited) |
| Assets | | |
Investment in securities, at value — See accompanying schedule:
| | |
| Affiliated issuers (cost $28,289,700) | $30,021,483 | |
| Total Investment in Securities (cost $28,289,700) | | $30,021,483 |
| Cash | | 1 |
| Receivable for investments sold | | 1,865,156 |
| Receivable for fund shares sold | | 3,866 |
| Total assets | | 31,890,506 |
| Liabilities | | |
| Payable for investments purchased | 1,868,982 | |
| Payable for fund shares redeemed | 17 | |
| Total liabilities | | 1,868,999 |
| Net Assets | | $30,021,507 |
| Net Assets consist of: | | |
| Paid in capital | | $27,770,343 |
| Undistributed net investment income | | 116,319 |
| Accumulated undistributed net realized gain (loss) on investments | | 403,062 |
| Net unrealized appreciation (depreciation) on investments | | 1,731,783 |
| Net Assets, for 2,567,683 shares outstanding | | $30,021,507 |
| Net Asset Value, offering price and redemption price per share ($30,021,507 ÷ 2,567,683 shares) | | $11.69 |
See accompanying notes which are an integral part of the financial statements.
Statement of Operations
| | | Six months ended June 30, 2018 (Unaudited) |
| Investment Income | | |
| Dividends: | | |
| Affiliated issuers | | $118,655 |
| Expenses | | |
| Independent trustees' fees and expenses | $88 | |
| Total expenses | | 88 |
| Net investment income (loss) | | 118,567 |
| Realized and Unrealized Gain (Loss) | | |
| Net realized gain (loss) on: | | |
| Investment securities: | | |
| Affiliated issuers | 12,432 | |
| Capital gain distributions from underlying funds: | | |
| Affiliated issuers | 472,023 | |
| Total net realized gain (loss) | | 484,455 |
| Change in net unrealized appreciation (depreciation) on: | | |
| Investment securities: | | |
| Affiliated issuers | (726,763) | |
| Total change in net unrealized appreciation (depreciation) | | (726,763) |
| Net gain (loss) | | (242,308) |
| Net increase (decrease) in net assets resulting from operations | | $(123,741) |
See accompanying notes which are an integral part of the financial statements.
Statement of Changes in Net Assets
| | Six months ended June 30, 2018 (Unaudited) | Year ended December 31, 2017 |
| Increase (Decrease) in Net Assets | | |
| Operations | | |
| Net investment income (loss) | $118,567 | $414,006 |
| Net realized gain (loss) | 484,455 | 390,123 |
| Change in net unrealized appreciation (depreciation) | (726,763) | 1,623,402 |
| Net increase (decrease) in net assets resulting from operations | (123,741) | 2,427,531 |
| Distributions to shareholders from net investment income | (7,457) | (408,797) |
| Distributions to shareholders from net realized gain | (251,057) | (299,063) |
| Total distributions | (258,514) | (707,860) |
| Share transactions | | |
| Proceeds from sales of shares | 3,978,246 | 9,434,626 |
| Reinvestment of distributions | 258,514 | 707,860 |
| Cost of shares redeemed | (2,721,892) | (3,744,680) |
| Net increase (decrease) in net assets resulting from share transactions | 1,514,868 | 6,397,806 |
| Total increase (decrease) in net assets | 1,132,613 | 8,117,477 |
| Net Assets | | |
| Beginning of period | 28,888,894 | 20,771,417 |
| End of period | $30,021,507 | $28,888,894 |
| Other Information | | |
| Undistributed net investment income end of period | $116,319 | $5,209 |
| Shares | | |
| Sold | 337,762 | 808,825 |
| Issued in reinvestment of distributions | 22,039 | 60,793 |
| Redeemed | (230,692) | (325,020) |
| Net increase (decrease) | 129,109 | 544,598 |
See accompanying notes which are an integral part of the financial statements.
Financial Highlights
VIP Investor Freedom 2005 Portfolio
| | Six months ended (Unaudited) June 30, | Years endedDecember 31, | | | | |
| | 2018 | 2017 | 2016 | 2015 | 2014 | 2013 |
| Selected Per–Share Data | | | | | | |
| Net asset value, beginning of period | $11.85 | $10.97 | $10.79 | $11.05 | $10.90 | $10.20 |
| Income from Investment Operations | | | | | | |
| Net investment income (loss)A | .05 | .20 | .17 | .19 | .19 | .18 |
| Net realized and unrealized gain (loss) | (.11) | 1.00 | .35 | (.22) | .27 | .81 |
| Total from investment operations | (.06) | 1.20 | .52 | (.03) | .46 | .99 |
| Distributions from net investment income | –B | (.17) | (.16) | (.20) | (.18) | (.17) |
| Distributions from net realized gain | (.10) | (.14) | (.17) | (.03) | (.14) | (.12) |
| Total distributions | (.10) | (.32)C | (.34)D | (.23) | (.31)E | (.29) |
| Net asset value, end of period | $11.69 | $11.85 | $10.97 | $10.79 | $11.05 | $10.90 |
| Total ReturnF,G,H | (.48)% | 10.97% | 4.94% | (.31)% | 4.25% | 9.73% |
| Ratios to Average Net AssetsI,J | | | | | | |
| Expenses before reductionsK | - %L | -% | -% | -% | -% | -% |
| Expenses net of fee waivers, if any | - %K,L | -% | -% | -% | -% | -% |
| Expenses net of all reductions | - %K,L | -% | -% | -% | -% | -% |
| Net investment income (loss) | .81%L | 1.74% | 1.52% | 1.70% | 1.71% | 1.68% |
| Supplemental Data | | | | | | |
| Net assets, end of period (000 omitted) | $30,022 | $28,889 | $20,771 | $20,408 | $22,437 | $18,912 |
| Portfolio turnover rateI | 36%L | 28% | 35% | 25% | 30% | 46% |
A Calculated based on average shares outstanding during the period.
B Amount represents less than $.005 per share.
C Total distributions of $.32 per share is comprised of distributions from net investment income of $.171 and distributions from net realized gain of $.144 per share.
D Total distributions of $.34 per share is comprised of distributions from net investment income of $.163 and distributions from net realized gain of $.173 per share.
E Total distributions of $.31 per share is comprised of distributions from net investment income of $.175 and distributions from net realized gain of $.135 per share.
F Total returns for periods of less than one year are not annualized.
G Total returns do not reflect charges attributable to your insurance company's separate account. Inclusion of these charges would reduce the total returns shown.
H Total returns would have been lower if certain expenses had not been reduced during the applicable periods shown.
I Amounts do not include the activity of the Underlying Funds.
J Expense ratios reflect operating expenses of the Fund. Expenses before reductions do not reflect amounts reimbursed by the investment adviser or reductions from expense offset arrangements and do not represent the amount paid by the Fund during periods when reimbursements or reductions occur. Expenses net of fee waivers reflect expenses after reimbursement by the investment adviser but prior to reductions from expense offset arrangements. Expenses net of all reductions represent the net expenses paid by the Fund but do not include expenses of the underlying funds in which the Fund invests.
K Amount represents less than .005%.
L Annualized
See accompanying notes which are an integral part of the financial statements.
VIP Investor Freedom 2010 Portfolio℠
Investment Summary (Unaudited)
The information in the following tables is based on the direct investments of the Fund.
Top Holdings as of June 30, 2018
| | % of fund's net assets |
| VIP Investment Grade Bond Portfolio Investor Class | 30.6 |
| VIP Government Money Market Portfolio Investor Class 1.68% | 18.5 |
| VIP Overseas Portfolio Investor Class | 10.0 |
| VIP Emerging Markets Portfolio Investor Class | 5.6 |
| VIP Growth & Income Portfolio Investor Class | 5.3 |
| VIP Equity-Income Portfolio Investor Class | 4.7 |
| VIP Growth Portfolio Investor Class | 4.5 |
| Fidelity Inflation-Protected Bond Index Fund Institutional Class | 4.5 |
| VIP Contrafund Portfolio Investor Class | 4.4 |
| Fidelity Long-Term Treasury Bond Index Fund Premium Class | 3.5 |
| | 91.6 |
Asset Allocation (% of fund's net assets)
| Period end |
| | Domestic Equity Funds | 25.3% |
| | International Equity Funds | 15.6% |
| | Bond Funds | 40.6% |
| | Short-Term Funds | 18.5% |

VIP Investor Freedom 2010 Portfolio℠
Schedule of Investments June 30, 2018 (Unaudited)
Showing Percentage of Net Assets
| Domestic Equity Funds - 25.3% | | | |
| | | Shares | Value |
| VIP Contrafund Portfolio Investor Class (a) | | 82,063 | $2,907,480 |
| VIP Equity-Income Portfolio Investor Class (a) | | 138,201 | 3,054,232 |
| VIP Growth & Income Portfolio Investor Class (a) | | 162,535 | 3,476,617 |
| VIP Growth Portfolio Investor Class (a) | | 43,066 | 2,984,045 |
| VIP Mid Cap Portfolio Investor Class (a) | | 23,222 | 844,353 |
| VIP Value Portfolio Investor Class (a) | | 142,602 | 2,233,152 |
| VIP Value Strategies Portfolio Investor Class (a) | | 80,204 | 1,090,776 |
| TOTAL DOMESTIC EQUITY FUNDS | | | |
| (Cost $13,029,267) | | | 16,590,655 |
|
| International Equity Funds - 15.6% | | | |
| VIP Emerging Markets Portfolio Investor Class (a) | | 321,277 | 3,649,707 |
| VIP Overseas Portfolio Investor Class (a) | | 292,978 | 6,545,138 |
| TOTAL INTERNATIONAL EQUITY FUNDS | | | |
| (Cost $8,134,658) | | | 10,194,845 |
|
| Bond Funds - 40.6% | | | |
| Fidelity Inflation-Protected Bond Index Fund Institutional Class (a) | | 300,066 | 2,946,649 |
| Fidelity Long-Term Treasury Bond Index Fund Premium Class (a) | | 179,082 | 2,274,341 |
| VIP High Income Portfolio Investor Class (a) | | 243,341 | 1,301,874 |
| VIP Investment Grade Bond Portfolio Investor Class (a) | | 1,615,873 | 20,085,301 |
| TOTAL BOND FUNDS | | | |
| (Cost $26,850,954) | | | 26,608,165 |
|
| Short-Term Funds - 18.5% | | | |
| VIP Government Money Market Portfolio Investor Class 1.68% (a)(b) | | | |
| (Cost $12,128,741) | | 12,128,741 | 12,128,741 |
| TOTAL INVESTMENT IN SECURITIES - 100.0% | | | |
| (Cost $60,143,620) | | | 65,522,406 |
| NET OTHER ASSETS (LIABILITIES) - 0.0% | | | 44 |
| NET ASSETS - 100% | | | $65,522,450 |
Legend
(a) Affiliated Fund
(b) The rate quoted is the annualized seven-day yield of the fund at period end.
Affiliated Underlying Funds
Fiscal year to date information regarding the Fund's investments in affiliated Underlying Funds, excluding any Money Market Central Funds, is presented below. Exchanges between classes of the same affiliated Underlying Funds may occur.
| Affiliate | Value, beginning of period | Purchases | Sales Proceeds | Dividend Income | Realized Gain (loss) | Change in Unrealized appreciation (depreciation) | Value, end of period |
| Fidelity Inflation-Protected Bond Index Fund Institutional Class | $-- | $2,946,649 | $-- | $26 | $-- | $-- | $2,946,649 |
| Fidelity Long-Term Treasury Bond Index Fund Premium Class | 1,428,916 | 1,043,324 | 143,636 | 21,524 | (3,378) | (50,885) | 2,274,341 |
| VIP Contrafund Portfolio Investor Class | 3,147,693 | 491,139 | 571,283 | 265,829 | 43,952 | (204,021) | 2,907,480 |
| VIP Emerging Markets Portfolio Investor Class | 3,806,001 | 642,407 | 569,874 | 1,772 | 75,126 | (303,953) | 3,649,707 |
| VIP Equity-Income Portfolio Investor Class | 3,318,666 | 497,839 | 545,605 | 147,904 | (26,675) | (189,993) | 3,054,232 |
| VIP Government Money Market Portfolio Investor Class 1.68% | 13,630,209 | 1,577,887 | 3,079,355 | 92,256 | -- | -- | 12,128,741 |
| VIP Growth & Income Portfolio Investor Class | 3,807,071 | 550,755 | 699,747 | 203,555 | 79,929 | (261,391) | 3,476,617 |
| VIP Growth Portfolio Investor Class | 3,205,196 | 670,831 | 763,955 | 440,503 | 149,684 | (277,711) | 2,984,045 |
| VIP High Income Portfolio Investor Class | 1,334,382 | 135,457 | 148,048 | 12,283 | (3,103) | (16,814) | 1,301,874 |
| VIP Investment Grade Bond Portfolio Investor Class | 21,617,518 | 2,726,024 | 3,697,354 | 218,954 | (65,676) | (495,211) | 20,085,301 |
| VIP Mid Cap Portfolio Investor Class | 922,105 | 141,062 | 172,248 | 75,429 | 13,331 | (59,897) | 844,353 |
| VIP Overseas Portfolio Investor Class | 7,146,681 | 644,856 | 1,134,276 | 1,797 | 54,969 | (167,092) | 6,545,138 |
| VIP Value Portfolio Investor Class | 2,438,081 | 287,279 | 402,958 | 84,821 | 16,792 | (106,042) | 2,233,152 |
| VIP Value Strategies Portfolio Investor Class | 1,190,716 | 132,659 | 187,228 | 37,152 | 2,273 | (47,644) | 1,090,776 |
| | $66,993,235 | $12,488,168 | $12,115,567 | $1,603,805 | $337,224 | $(2,180,654) | $65,522,406 |
Amounts in the income column in the above table include any capital gain distributions from underlying funds, which are presented in the corresponding line-item in the Statement of Operations if applicable.
Investment Valuation
All investments are categorized as Level 1 under the Fair Value Hierarchy. The inputs or methodology used for valuing securities may not be an indication of the risk associated with investing in those securities. For more information on valuation inputs please refer to the Investment Valuation section in the accompanying Notes to Financial Statements.
See accompanying notes which are an integral part of the financial statements.
VIP Investor Freedom 2010 Portfolio℠
Financial Statements
Statement of Assets and Liabilities
| | | June 30, 2018 (Unaudited) |
| Assets | | |
Investment in securities, at value — See accompanying schedule:
| | |
| Affiliated issuers (cost $60,143,620) | $65,522,406 | |
| Total Investment in Securities (cost $60,143,620) | | $65,522,406 |
| Cash | | 6 |
| Receivable for investments sold | | 3,605,040 |
| Total assets | | 69,127,452 |
| Liabilities | | |
| Payable for investments purchased | 3,601,493 | |
| Payable for fund shares redeemed | 3,509 | |
| Total liabilities | | 3,605,002 |
| Net Assets | | $65,522,450 |
| Net Assets consist of: | | |
| Paid in capital | | $58,409,734 |
| Undistributed net investment income | | 243,221 |
| Accumulated undistributed net realized gain (loss) on investments | | 1,490,709 |
| Net unrealized appreciation (depreciation) on investments | | 5,378,786 |
| Net Assets, for 5,250,219 shares outstanding | | $65,522,450 |
| Net Asset Value, offering price and redemption price per share ($65,522,450 ÷ 5,250,219 shares) | | $12.48 |
See accompanying notes which are an integral part of the financial statements.
Statement of Operations
| | | Six months ended June 30, 2018 (Unaudited) |
| Investment Income | | |
| Dividends: | | |
| Affiliated issuers | | $243,426 |
| Expenses | | |
| Independent trustees' fees and expenses | $205 | |
| Total expenses | | 205 |
| Net investment income (loss) | | 243,221 |
| Realized and Unrealized Gain (Loss) | | |
| Net realized gain (loss) on: | | |
| Investment securities: | | |
| Affiliated issuers | 337,224 | |
| Capital gain distributions from underlying funds: | | |
| Affiliated issuers | 1,360,379 | |
| Total net realized gain (loss) | | 1,697,603 |
| Change in net unrealized appreciation (depreciation) on: | | |
| Investment securities: | | |
| Affiliated issuers | (2,180,654) | |
| Total change in net unrealized appreciation (depreciation) | | (2,180,654) |
| Net gain (loss) | | (483,051) |
| Net increase (decrease) in net assets resulting from operations | | $(239,830) |
See accompanying notes which are an integral part of the financial statements.
Statement of Changes in Net Assets
| | Six months ended June 30, 2018 (Unaudited) | Year ended December 31, 2017 |
| Increase (Decrease) in Net Assets | | |
| Operations | | |
| Net investment income (loss) | $243,221 | $992,334 |
| Net realized gain (loss) | 1,697,603 | 1,772,099 |
| Change in net unrealized appreciation (depreciation) | (2,180,654) | 5,029,085 |
| Net increase (decrease) in net assets resulting from operations | (239,830) | 7,793,518 |
| Distributions to shareholders from net investment income | – | (983,630) |
| Distributions to shareholders from net realized gain | (1,315,841) | (1,113,146) |
| Total distributions | (1,315,841) | (2,096,776) |
| Share transactions | | |
| Proceeds from sales of shares | 4,893,057 | 7,828,054 |
| Reinvestment of distributions | 1,315,841 | 2,096,776 |
| Cost of shares redeemed | (6,124,016) | (8,132,199) |
| Net increase (decrease) in net assets resulting from share transactions | 84,882 | 1,792,631 |
| Total increase (decrease) in net assets | (1,470,789) | 7,489,373 |
| Net Assets | | |
| Beginning of period | 66,993,239 | 59,503,866 |
| End of period | $65,522,450 | $66,993,239 |
| Other Information | | |
| Undistributed net investment income end of period | $243,221 | $– |
| Shares | | |
| Sold | 386,866 | 636,783 |
| Issued in reinvestment of distributions | 104,932 | 169,127 |
| Redeemed | (483,805) | (657,418) |
| Net increase (decrease) | 7,993 | 148,492 |
See accompanying notes which are an integral part of the financial statements.
Financial Highlights
VIP Investor Freedom 2010 Portfolio
| | Six months ended (Unaudited) June 30, | Years endedDecember 31, | | | | |
| | 2018 | 2017 | 2016 | 2015 | 2014 | 2013 |
| Selected Per–Share Data | | | | | | |
| Net asset value, beginning of period | $12.78 | $11.68 | $11.49 | $11.77 | $11.64 | $10.57 |
| Income from Investment Operations | | | | | | |
| Net investment income (loss)A | .05 | .19 | .17 | .21 | .20 | .20 |
| Net realized and unrealized gain (loss) | (.10) | 1.32 | .42 | (.25) | .33 | 1.21 |
| Total from investment operations | (.05) | 1.51 | .59 | (.04) | .53 | 1.41 |
| Distributions from net investment income | – | (.19) | (.18) | (.21) | (.19) | (.20) |
| Distributions from net realized gain | (.25) | (.22) | (.22) | (.03) | (.20) | (.14) |
| Total distributions | (.25) | (.41) | (.40) | (.24) | (.40)B | (.34) |
| Net asset value, end of period | $12.48 | $12.78 | $11.68 | $11.49 | $11.77 | $11.64 |
| Total ReturnC,D,E | (.39)% | 13.05% | 5.33% | (.34)% | 4.56% | 13.41% |
| Ratios to Average Net AssetsF,G | | | | | | |
| Expenses before reductionsH | - %I | -% | -% | -% | -% | -% |
| Expenses net of fee waivers, if any | - %H,I | -% | -% | -% | -% | -% |
| Expenses net of all reductions | - %H,I | -% | -% | -% | -% | -% |
| Net investment income (loss) | .74%I | 1.55% | 1.47% | 1.76% | 1.66% | 1.76% |
| Supplemental Data | | | | | | |
| Net assets, end of period (000 omitted) | $65,522 | $66,993 | $59,504 | $59,469 | $62,339 | $62,571 |
| Portfolio turnover rateF | 37%I | 25% | 24% | 21% | 27% | 23% |
A Calculated based on average shares outstanding during the period.
B Total distributions of $.40 per share is comprised of distributions from net investment income of $.192 and distributions from net realized gain of $.204 per share.
C Total returns for periods of less than one year are not annualized.
D Total returns do not reflect charges attributable to your insurance company's separate account. Inclusion of these charges would reduce the total returns shown.
E Total returns would have been lower if certain expenses had not been reduced during the applicable periods shown.
F Amounts do not include the activity of the Underlying Funds.
G Expense ratios reflect operating expenses of the Fund. Expenses before reductions do not reflect amounts reimbursed by the investment adviser or reductions from expense offset arrangements and do not represent the amount paid by the Fund during periods when reimbursements or reductions occur. Expenses net of fee waivers reflect expenses after reimbursement by the investment adviser but prior to reductions from expense offset arrangements. Expenses net of all reductions represent the net expenses paid by the Fund but do not include expenses of the underlying funds in which the Fund invests.
H Amount represents less than $.005%.
I Annualized
See accompanying notes which are an integral part of the financial statements.
VIP Investor Freedom 2015 Portfolio℠
Investment Summary (Unaudited)
The information in the following tables is based on the direct investments of the Fund.
Top Holdings as of June 30, 2018
| | % of fund's net assets |
| VIP Investment Grade Bond Portfolio Investor Class | 27.0 |
| VIP Government Money Market Portfolio Investor Class 1.68% | 13.7 |
| VIP Overseas Portfolio Investor Class | 12.0 |
| VIP Growth & Income Portfolio Investor Class | 6.6 |
| VIP Emerging Markets Portfolio Investor Class | 6.3 |
| VIP Equity-Income Portfolio Investor Class | 5.8 |
| VIP Growth Portfolio Investor Class | 5.7 |
| VIP Contrafund Portfolio Investor Class | 5.5 |
| VIP Value Portfolio Investor Class | 4.3 |
| Fidelity Inflation-Protected Bond Index Fund Institutional Class | 4.0 |
| | 90.9 |
Asset Allocation (% of fund's net assets)
| Period end |
| | Domestic Equity Funds | 31.6% |
| | International Equity Funds | 18.3% |
| | Bond Funds | 36.4% |
| | Short-Term Funds | 13.7% |
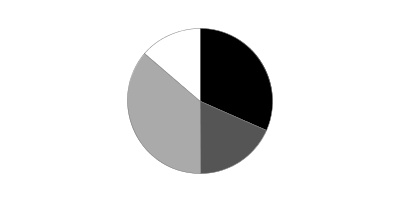
VIP Investor Freedom 2015 Portfolio℠
Schedule of Investments June 30, 2018 (Unaudited)
Showing Percentage of Net Assets
| Domestic Equity Funds - 31.6% | | | |
| | | Shares | Value |
| VIP Contrafund Portfolio Investor Class (a) | | 169,180 | $5,994,053 |
| VIP Equity-Income Portfolio Investor Class (a) | | 284,913 | 6,296,588 |
| VIP Growth & Income Portfolio Investor Class (a) | | 335,078 | 7,167,319 |
| VIP Growth Portfolio Investor Class (a) | | 88,785 | 6,151,879 |
| VIP Mid Cap Portfolio Investor Class (a) | | 47,872 | 1,740,614 |
| VIP Value Portfolio Investor Class (a) | | 293,974 | 4,603,636 |
| VIP Value Strategies Portfolio Investor Class (a) | | 165,339 | 2,248,611 |
| TOTAL DOMESTIC EQUITY FUNDS | | | |
| (Cost $26,316,985) | | | 34,202,700 |
|
| International Equity Funds - 18.3% | | | |
| VIP Emerging Markets Portfolio Investor Class (a) | | 599,878 | 6,814,619 |
| VIP Overseas Portfolio Investor Class (a) | | 580,596 | 12,970,504 |
| TOTAL INTERNATIONAL EQUITY FUNDS | | | |
| (Cost $15,344,523) | | | 19,785,123 |
|
| Bond Funds - 36.4% | | | |
| Fidelity Inflation-Protected Bond Index Fund Institutional Class (a) | | 444,907 | 4,368,991 |
| Fidelity Long-Term Treasury Bond Index Fund Premium Class (a) | | 286,065 | 3,633,032 |
| VIP High Income Portfolio Investor Class (a) | | 401,134 | 2,146,068 |
| VIP Investment Grade Bond Portfolio Investor Class (a) | | 2,344,347 | 29,140,232 |
| TOTAL BOND FUNDS | | | |
| (Cost $39,726,187) | | | 39,288,323 |
|
| Short-Term Funds - 13.7% | | | |
| VIP Government Money Market Portfolio Investor Class 1.68% (a)(b) | | | |
| (Cost $14,808,060) | | 14,808,060 | 14,808,060 |
| TOTAL INVESTMENT IN SECURITIES - 100.0% | | | |
| (Cost $96,195,755) | | | 108,084,206 |
| NET OTHER ASSETS (LIABILITIES) - 0.0% | | | 63 |
| NET ASSETS - 100% | | | $108,084,269 |
Legend
(a) Affiliated Fund
(b) The rate quoted is the annualized seven-day yield of the fund at period end.
Affiliated Underlying Funds
Fiscal year to date information regarding the Fund's investments in affiliated Underlying Funds, excluding any Money Market Central Funds, is presented below. Exchanges between classes of the same affiliated Underlying Funds may occur.
| Affiliate | Value, beginning of period | Purchases | Sales Proceeds | Dividend Income | Realized Gain (loss) | Change in Unrealized appreciation (depreciation) | Value, end of period |
| Fidelity Inflation-Protected Bond Index Fund Institutional Class | $-- | $4,368,991 | $-- | $38 | $-- | $-- | $4,368,991 |
| Fidelity Long-Term Treasury Bond Index Fund Premium Class | 2,371,814 | 1,528,960 | 178,571 | 35,655 | (4,115) | (85,056) | 3,633,032 |
| VIP Contrafund Portfolio Investor Class | 6,414,612 | 824,227 | 911,645 | 540,640 | 74,363 | (407,504) | 5,994,053 |
| VIP Emerging Markets Portfolio Investor Class | 7,059,060 | 1,012,453 | 816,637 | 3,284 | 123,732 | (563,989) | 6,814,619 |
| VIP Equity-Income Portfolio Investor Class | 6,763,168 | 825,054 | 842,523 | 300,812 | (4,898) | (444,213) | 6,296,588 |
| VIP Government Money Market Portfolio Investor Class 1.68% | 16,559,889 | 1,603,234 | 3,355,063 | 111,918 | -- | -- | 14,808,060 |
| VIP Growth & Income Portfolio Investor Class | 7,758,398 | 900,298 | 1,113,924 | 413,983 | 133,929 | (511,382) | 7,167,319 |
| VIP Growth Portfolio Investor Class | 6,531,800 | 1,187,053 | 1,300,558 | 895,891 | 275,543 | (541,959) | 6,151,879 |
| VIP High Income Portfolio Investor Class | 2,202,312 | 175,500 | 198,431 | 20,227 | (5,477) | (27,836) | 2,146,068 |
| VIP Investment Grade Bond Portfolio Investor Class | 31,699,720 | 3,375,436 | 5,113,753 | 322,580 | (100,689) | (720,482) | 29,140,232 |
| VIP Mid Cap Portfolio Investor Class | 1,879,117 | 235,977 | 277,425 | 153,412 | 26,061 | (123,116) | 1,740,614 |
| VIP Overseas Portfolio Investor Class | 14,068,103 | 855,015 | 1,712,636 | 3,530 | 133,452 | (373,430) | 12,970,504 |
| VIP Value Portfolio Investor Class | 4,968,700 | 445,732 | 623,432 | 172,509 | 25,864 | (213,228) | 4,603,636 |
| VIP Value Strategies Portfolio Investor Class | 2,426,589 | 201,788 | 284,845 | 75,563 | 2,614 | (97,535) | 2,248,611 |
| | $110,703,282 | $17,539,718 | $16,729,443 | $3,050,042 | $680,379 | $(4,109,730) | $108,084,206 |
Amounts in the income column in the above table include any capital gain distributions from underlying funds, which are presented in the corresponding line-item in the Statement of Operations if applicable.
Investment Valuation
All investments are categorized as Level 1 under the Fair Value Hierarchy. The inputs or methodology used for valuing securities may not be an indication of the risk associated with investing in those securities. For more information on valuation inputs please refer to the Investment Valuation section in the accompanying Notes to Financial Statements.
See accompanying notes which are an integral part of the financial statements.
VIP Investor Freedom 2015 Portfolio℠
Financial Statements
Statement of Assets and Liabilities
| | | June 30, 2018 (Unaudited) |
| Assets | | |
Investment in securities, at value — See accompanying schedule:
| | |
| Affiliated issuers (cost $96,195,755) | $108,084,206 | |
| Total Investment in Securities (cost $96,195,755) | | $108,084,206 |
| Cash | | 1 |
| Receivable for investments sold | | 5,386,926 |
| Receivable for fund shares sold | | 435,419 |
| Total assets | | 113,906,552 |
| Liabilities | | |
| Payable for investments purchased | 5,822,226 | |
| Payable for fund shares redeemed | 57 | |
| Total liabilities | | 5,822,283 |
| Net Assets | | $108,084,269 |
| Net Assets consist of: | | |
| Paid in capital | | $92,800,613 |
| Undistributed net investment income | | 357,456 |
| Accumulated undistributed net realized gain (loss) on investments | | 3,037,749 |
| Net unrealized appreciation (depreciation) on investments | | 11,888,451 |
| Net Assets, for 8,716,500 shares outstanding | | $108,084,269 |
| Net Asset Value, offering price and redemption price per share ($108,084,269 ÷ 8,716,500 shares) | | $12.40 |
See accompanying notes which are an integral part of the financial statements.
Statement of Operations
| | | Six months ended June 30, 2018 (Unaudited) |
| Investment Income | | |
| Dividends: | | |
| Affiliated issuers | | $359,119 |
| Expenses | | |
| Independent trustees' fees and expenses | $337 | |
| Total expenses | | 337 |
| Net investment income (loss) | | 358,782 |
| Realized and Unrealized Gain (Loss) | | |
| Net realized gain (loss) on: | | |
| Investment securities: | | |
| Affiliated issuers | 680,379 | |
| Capital gain distributions from underlying funds: | | |
| Affiliated issuers | 2,690,923 | |
| Total net realized gain (loss) | | 3,371,302 |
| Change in net unrealized appreciation (depreciation) on: | | |
| Investment securities: | | |
| Affiliated issuers | (4,109,730) | |
| Total change in net unrealized appreciation (depreciation) | | (4,109,730) |
| Net gain (loss) | | (738,428) |
| Net increase (decrease) in net assets resulting from operations | | $(379,646) |
See accompanying notes which are an integral part of the financial statements.
Statement of Changes in Net Assets
| | Six months ended June 30, 2018 (Unaudited) | Year ended December 31, 2017 |
| Increase (Decrease) in Net Assets | | |
| Operations | | |
| Net investment income (loss) | $358,782 | $1,605,912 |
| Net realized gain (loss) | 3,371,302 | 3,274,702 |
| Change in net unrealized appreciation (depreciation) | (4,109,730) | 9,824,411 |
| Net increase (decrease) in net assets resulting from operations | (379,646) | 14,705,025 |
| Distributions to shareholders from net investment income | (8,644) | (1,590,867) |
| Distributions to shareholders from net realized gain | (2,437,635) | (2,315,095) |
| Total distributions | (2,446,279) | (3,905,962) |
| Share transactions | | |
| Proceeds from sales of shares | 5,297,741 | 9,716,733 |
| Reinvestment of distributions | 2,446,279 | 3,905,962 |
| Cost of shares redeemed | (7,538,078) | (11,389,269) |
| Net increase (decrease) in net assets resulting from share transactions | 205,942 | 2,233,426 |
| Total increase (decrease) in net assets | (2,619,983) | 13,032,489 |
| Net Assets | | |
| Beginning of period | 110,704,252 | 97,671,763 |
| End of period | $108,084,269 | $110,704,252 |
| Other Information | | |
| Undistributed net investment income end of period | $357,456 | $7,318 |
| Shares | | |
| Sold | 417,575 | 798,660 |
| Issued in reinvestment of distributions | 196,016 | 319,835 |
| Redeemed | (598,071) | (928,642) |
| Net increase (decrease) | 15,520 | 189,853 |
See accompanying notes which are an integral part of the financial statements.
Financial Highlights
VIP Investor Freedom 2015 Portfolio
| | Six months ended (Unaudited) June 30, | Years endedDecember 31, | | | | |
| | 2018 | 2017 | 2016 | 2015 | 2014 | 2013 |
| Selected Per–Share Data | | | | | | |
| Net asset value, beginning of period | $12.72 | $11.48 | $11.34 | $11.63 | $11.48 | $10.34 |
| Income from Investment Operations | | | | | | |
| Net investment income (loss)A | .04 | .19 | .17 | .21 | .19 | .20 |
| Net realized and unrealized gain (loss) | (.08) | 1.51 | .45 | (.25) | .34 | 1.27 |
| Total from investment operations | (.04) | 1.70 | .62 | (.04) | .53 | 1.47 |
| Distributions from net investment income | –B | (.19) | (.18) | (.22) | (.19) | (.20) |
| Distributions from net realized gain | (.28) | (.27) | (.31) | (.04) | (.19) | (.13) |
| Total distributions | (.28) | (.46) | (.48)C | (.25)D | (.38) | (.33) |
| Net asset value, end of period | $12.40 | $12.72 | $11.48 | $11.34 | $11.63 | $11.48 |
| Total ReturnE,F,G | (.31)% | 14.99% | 5.82% | (.34)% | 4.65% | 14.35% |
| Ratios to Average Net AssetsH,I | | | | | | |
| Expenses before reductionsJ | - %K | -% | -% | -% | -% | -% |
| Expenses net of fee waivers, if any | - %J,K | -% | -% | -% | -% | -% |
| Expenses net of all reductions | - %J,K | -% | -% | -% | -% | -% |
| Net investment income (loss) | .66%K | 1.52% | 1.53% | 1.77% | 1.67% | 1.86% |
| Supplemental Data | | | | | | |
| Net assets, end of period (000 omitted) | $108,084 | $110,704 | $97,672 | $95,761 | $101,740 | $97,221 |
| Portfolio turnover rateH | 31%K | 23% | 23% | 21% | 20% | 21% |
A Calculated based on average shares outstanding during the period.
B Amount represents less than $.005 per share.
C Total distributions of $.48 per share is comprised of distributions from net investment income of $.175 and distributions from net realized gain of $.306 per share.
D Total distributions of $.25 per share is comprised of distributions from net investment income of $.215 and distributions from net realized gain of $.037 per share.
E Total returns for periods of less than one year are not annualized.
F Total returns do not reflect charges attributable to your insurance company's separate account. Inclusion of these charges would reduce the total returns shown.
G Total returns would have been lower if certain expenses had not been reduced during the applicable periods shown.
H Amounts do not include the activity of the Underlying Funds.
I Expense ratios reflect operating expenses of the Fund. Expenses before reductions do not reflect amounts reimbursed by the investment adviser or reductions from expense offset arrangements and do not represent the amount paid by the Fund during periods when reimbursements or reductions occur. Expenses net of fee waivers reflect expenses after reimbursement by the investment adviser but prior to reductions from expense offset arrangements. Expenses net of all reductions represent the net expenses paid by the Fund but do not include expenses of the underlying funds in which the Fund invests.
J Amount represents less than .005%.
K Annualized
See accompanying notes which are an integral part of the financial statements.
VIP Investor Freedom 2020 Portfolio℠
Investment Summary (Unaudited)
The information in the following tables is based on the direct investments of the Fund.
Top Holdings as of June 30, 2018
| | % of fund's net assets |
| VIP Investment Grade Bond Portfolio Investor Class | 24.0 |
| VIP Overseas Portfolio Investor Class | 13.6 |
| VIP Government Money Market Portfolio Investor Class 1.68% | 9.8 |
| VIP Growth & Income Portfolio Investor Class | 7.7 |
| VIP Emerging Markets Portfolio Investor Class | 6.9 |
| VIP Equity-Income Portfolio Investor Class | 6.8 |
| VIP Growth Portfolio Investor Class | 6.6 |
| VIP Contrafund Portfolio Investor Class | 6.4 |
| VIP Value Portfolio Investor Class | 5.0 |
| Fidelity Inflation-Protected Bond Index Fund Institutional Premium Class | 3.8 |
| | 90.6 |
Asset Allocation (% of fund's net assets)
| Period end |
| | Domestic Equity Funds | 36.8% |
| | International Equity Funds | 20.5% |
| | Bond Funds | 32.9% |
| | Short-Term Funds | 9.8% |

VIP Investor Freedom 2020 Portfolio℠
Schedule of Investments June 30, 2018 (Unaudited)
Showing Percentage of Net Assets
| Domestic Equity Funds - 36.8% | | | |
| | | Shares | Value |
| VIP Contrafund Portfolio Investor Class (a) | | 399,571 | $14,156,810 |
| VIP Equity-Income Portfolio Investor Class (a) | | 672,913 | 14,871,373 |
| VIP Growth & Income Portfolio Investor Class (a) | | 791,395 | 16,927,938 |
| VIP Growth Portfolio Investor Class (a) | | 209,692 | 14,529,557 |
| VIP Mid Cap Portfolio Investor Class (a) | | 113,063 | 4,110,984 |
| VIP Value Portfolio Investor Class (a) | | 694,312 | 10,872,919 |
| VIP Value Strategies Portfolio Investor Class (a) | | 390,504 | 5,310,859 |
| TOTAL DOMESTIC EQUITY FUNDS | | | |
| (Cost $63,332,801) | | | 80,780,440 |
|
| International Equity Funds - 20.5% | | | |
| VIP Emerging Markets Portfolio Investor Class (a) | | 1,331,444 | 15,125,204 |
| VIP Overseas Portfolio Investor Class (a) | | 1,334,811 | 29,819,672 |
| TOTAL INTERNATIONAL EQUITY FUNDS | | | |
| (Cost $35,435,625) | | | 44,944,876 |
|
| Bond Funds - 32.9% | | | |
| Fidelity Inflation-Protected Bond Index Fund Institutional Premium Class (a) | | 845,632 | 8,304,108 |
| Fidelity Long-Term Treasury Bond Index Fund Institutional Class (a) | | 538,681 | 6,841,251 |
| VIP High Income Portfolio Investor Class (a) | | 814,324 | 4,356,634 |
| VIP Investment Grade Bond Portfolio Investor Class (a) | | 4,248,799 | 52,812,574 |
| TOTAL BOND FUNDS | | | |
| (Cost $73,027,173) | | | 72,314,567 |
|
| Short-Term Funds - 9.8% | | | |
| VIP Government Money Market Portfolio Investor Class 1.68% (a)(b) | | | |
| (Cost $21,498,516) | | 21,498,516 | 21,498,516 |
| TOTAL INVESTMENT IN SECURITIES - 100.0% | | | |
| (Cost $193,294,115) | | | 219,538,399 |
| NET OTHER ASSETS (LIABILITIES) - 0.0% | | | 110 |
| NET ASSETS - 100% | | | $219,538,509 |
Legend
(a) Affiliated Fund
(b) The rate quoted is the annualized seven-day yield of the fund at period end.
Affiliated Central Funds
Information regarding fiscal year to date income earned by the Fund from investments in Fidelity Central Funds is as follows:
| Fund | Income earned |
| Fidelity Cash Central Fund | $10 |
| Total | $10 |
Amounts in the income column in the above table include any capital gain distributions from underlying funds, which are presented in the corresponding line-item in the Statement of Operations if applicable.
Affiliated Underlying Funds
Fiscal year to date information regarding the Fund's investments in affiliated Underlying Funds, excluding any Money Market Central Funds, is presented below. Exchanges between classes of the same affiliated Underlying Funds may occur.
| Affiliate | Value, beginning of period | Purchases | Sales Proceeds | Dividend Income | Realized Gain (loss) | Change in Unrealized appreciation (depreciation) | Value, end of period |
| Fidelity Inflation-Protected Bond Index Fund Institutional Premium Class | $-- | $8,304,108 | $-- | $75 | $-- | $-- | $8,304,108 |
| Fidelity Long-Term Treasury Bond Index Fund Institutional Class | -- | 6,699,951 | 79,369 | 20,410 | 607 | 220,062 | 6,841,251 |
| Fidelity Long-Term Treasury Bond Index Fund Premium Class | 4,715,362 | 598,237 | 4,929,626 | 53,566 | (401,413) | 17,440 | -- |
| VIP Contrafund Portfolio Investor Class | 14,766,318 | 1,805,983 | 1,631,039 | 1,264,161 | 75,305 | (859,757) | 14,156,810 |
| VIP Emerging Markets Portfolio Investor Class | 15,396,349 | 2,168,941 | 1,448,534 | 7,264 | 191,748 | (1,183,300) | 15,125,204 |
| VIP Equity-Income Portfolio Investor Class | 15,568,306 | 1,838,104 | 1,482,300 | 703,376 | (78,190) | (974,547) | 14,871,373 |
| VIP Government Money Market Portfolio Investor Class 1.68% | 24,186,331 | 2,222,459 | 4,910,274 | 164,512 | -- | -- | 21,498,516 |
| VIP Growth & Income Portfolio Investor Class | 17,858,626 | 1,986,027 | 2,032,467 | 967,995 | 112,407 | (996,655) | 16,927,938 |
| VIP Growth Portfolio Investor Class | 15,036,930 | 2,649,204 | 2,528,489 | 2,094,832 | 345,766 | (973,854) | 14,529,557 |
| VIP High Income Portfolio Investor Class | 4,428,784 | 341,745 | 345,943 | 41,198 | (8,956) | (58,996) | 4,356,634 |
| VIP Investment Grade Bond Portfolio Investor Class | 57,879,888 | 5,937,393 | 9,496,047 | 593,630 | (207,886) | (1,300,774) | 52,812,574 |
| VIP Mid Cap Portfolio Investor Class | 4,325,718 | 516,652 | 502,656 | 358,726 | 29,773 | (258,503) | 4,110,984 |
| VIP Overseas Portfolio Investor Class | 31,631,103 | 1,717,195 | 2,968,311 | 8,058 | 117,480 | (677,795) | 29,819,672 |
| VIP Value Portfolio Investor Class | 11,437,629 | 974,511 | 1,100,554 | 403,377 | 8,150 | (446,817) | 10,872,919 |
| VIP Value Strategies Portfolio Investor Class | 5,586,196 | 439,058 | 494,336 | 176,688 | (3,751) | (216,308) | 5,310,859 |
| | $222,817,540 | $38,199,568 | $33,949,945 | $6,857,868 | $181,040 | $(7,709,804) | $219,538,399 |
Amounts in the income column in the above table include any capital gain distributions from underlying funds, which are presented in the corresponding line-item in the Statement of Operations if applicable.
Investment Valuation
All investments are categorized as Level 1 under the Fair Value Hierarchy. The inputs or methodology used for valuing securities may not be an indication of the risk associated with investing in those securities. For more information on valuation inputs please refer to the Investment Valuation section in the accompanying Notes to Financial Statements.
See accompanying notes which are an integral part of the financial statements.
VIP Investor Freedom 2020 Portfolio℠
Financial Statements
Statement of Assets and Liabilities
| | | June 30, 2018 (Unaudited) |
| Assets | | |
Investment in securities, at value — See accompanying schedule:
| | |
| Affiliated issuers (cost $193,294,115) | $219,538,399 | |
| Total Investment in Securities (cost $193,294,115) | | $219,538,399 |
| Cash | | 9 |
| Receivable for investments sold | | 10,070,966 |
| Total assets | | 229,609,374 |
| Liabilities | | |
| Payable for investments purchased | 9,499,084 | |
| Payable for fund shares redeemed | 571,781 | |
| Total liabilities | | 10,070,865 |
| Net Assets | | $219,538,509 |
| Net Assets consist of: | | |
| Paid in capital | | $186,887,757 |
| Undistributed net investment income | | 661,451 |
| Accumulated undistributed net realized gain (loss) on investments | | 5,745,017 |
| Net unrealized appreciation (depreciation) on investments | | 26,244,284 |
| Net Assets, for 17,328,620 shares outstanding | | $219,538,509 |
| Net Asset Value, offering price and redemption price per share ($219,538,509 ÷ 17,328,620 shares) | | $12.67 |
See accompanying notes which are an integral part of the financial statements.
Statement of Operations
| | | Six months ended June 30, 2018 (Unaudited) |
| Investment Income | | |
| Dividends: | | |
| Affiliated issuers | | $665,004 |
| Income from Fidelity Central Funds | | 10 |
| Total income | | 665,014 |
| Expenses | | |
| Independent trustees' fees and expenses | $678 | |
| Total expenses | | 678 |
| Net investment income (loss) | | 664,336 |
| Realized and Unrealized Gain (Loss) | | |
| Net realized gain (loss) on: | | |
| Investment securities: | | |
| Affiliated issuers | 181,040 | |
| Capital gain distributions from underlying funds: | | |
| Affiliated issuers | 6,192,864 | |
| Total net realized gain (loss) | | 6,373,904 |
| Change in net unrealized appreciation (depreciation) on: | | |
| Investment securities: | | |
| Affiliated issuers | (7,709,804) | |
| Total change in net unrealized appreciation (depreciation) | | (7,709,804) |
| Net gain (loss) | | (1,335,900) |
| Net increase (decrease) in net assets resulting from operations | | $(671,564) |
See accompanying notes which are an integral part of the financial statements.
Statement of Changes in Net Assets
| | Six months ended June 30, 2018 (Unaudited) | Year ended December 31, 2017 |
| Increase (Decrease) in Net Assets | | |
| Operations | | |
| Net investment income (loss) | $664,336 | $3,128,617 |
| Net realized gain (loss) | 6,373,904 | 5,709,147 |
| Change in net unrealized appreciation (depreciation) | (7,709,804) | 22,317,401 |
| Net increase (decrease) in net assets resulting from operations | (671,564) | 31,155,165 |
| Distributions to shareholders from net investment income | (17,200) | (3,096,357) |
| Distributions to shareholders from net realized gain | (4,007,639) | (4,378,420) |
| Total distributions | (4,024,839) | (7,474,777) |
| Share transactions | | |
| Proceeds from sales of shares | 8,725,774 | 20,373,146 |
| Reinvestment of distributions | 4,024,839 | 7,474,777 |
| Cost of shares redeemed | (11,334,658) | (18,523,125) |
| Net increase (decrease) in net assets resulting from share transactions | 1,415,955 | 9,324,798 |
| Total increase (decrease) in net assets | (3,280,448) | 33,005,186 |
| Net Assets | | |
| Beginning of period | 222,818,957 | 189,813,771 |
| End of period | $219,538,509 | $222,818,957 |
| Other Information | | |
| Undistributed net investment income end of period | $661,451 | $14,315 |
| Shares | | |
| Sold | 678,426 | 1,650,223 |
| Issued in reinvestment of distributions | 315,179 | 602,555 |
| Redeemed | (885,562) | (1,520,761) |
| Net increase (decrease) | 108,043 | 732,017 |
See accompanying notes which are an integral part of the financial statements.
Financial Highlights
VIP Investor Freedom 2020 Portfolio
| | Six months ended (Unaudited) June 30, | Years endedDecember 31, | | | | |
| | 2018 | 2017 | 2016 | 2015 | 2014 | 2013 |
| Selected Per–Share Data | | | | | | |
| Net asset value, beginning of period | $12.94 | $11.51 | $11.34 | $11.63 | $11.47 | $10.20 |
| Income from Investment Operations | | | | | | |
| Net investment income (loss)A | .04 | .19 | .17 | .21 | .20 | .20 |
| Net realized and unrealized gain (loss) | (.08) | 1.69 | .47 | (.25) | .34 | 1.42 |
| Total from investment operations | (.04) | 1.88 | .64 | (.04) | .54 | 1.62 |
| Distributions from net investment income | –B | (.18) | (.17) | (.21) | (.19) | (.20) |
| Distributions from net realized gain | (.23) | (.27) | (.30) | (.04) | (.19) | (.15) |
| Total distributions | (.23) | (.45) | (.47) | (.25) | (.38) | (.35) |
| Net asset value, end of period | $12.67 | $12.94 | $11.51 | $11.34 | $11.63 | $11.47 |
| Total ReturnC,D,E | (.29)% | 16.55% | 6.04% | (.35)% | 4.75% | 15.96% |
| Ratios to Average Net AssetsF,G | | | | | | |
| Expenses before reductionsH | - %I | -% | -% | -% | -% | -% |
| Expenses net of fee waivers, if any | - %H,I | -% | -% | -% | -% | -% |
| Expenses net of all reductions | - %H,I | -% | -% | -% | -% | -% |
| Net investment income (loss) | .60%I | 1.52% | 1.52% | 1.79% | 1.74% | 1.87% |
| Supplemental Data | | | | | | |
| Net assets, end of period (000 omitted) | $219,539 | $222,819 | $189,814 | $187,438 | $191,764 | $161,093 |
| Portfolio turnover rateF | 31%I | 21% | 23% | 17% | 13% | 22% |
A Calculated based on average shares outstanding during the period.
B Amount represents less than $.005 per share.
C Total returns for periods of less than one year are not annualized.
D Total returns do not reflect charges attributable to your insurance company's separate account. Inclusion of these charges would reduce the total returns shown.
E Total returns would have been lower if certain expenses had not been reduced during the applicable periods shown.
F Amounts do not include the activity of the Underlying Funds.
G Expense ratios reflect operating expenses of the Fund. Expenses before reductions do not reflect amounts reimbursed by the investment adviser or reductions from expense offset arrangements and do not represent the amount paid by the Fund during periods when reimbursements or reductions occur. Expenses net of fee waivers reflect expenses after reimbursement by the investment adviser but prior to reductions from expense offset arrangements. Expenses net of all reductions represent the net expenses paid by the Fund but do not include expenses of the underlying funds in which the Fund invests.
H Amount represents less than .005%.
I Annualized
See accompanying notes which are an integral part of the financial statements.
VIP Investor Freedom 2025 Portfolio℠
Investment Summary (Unaudited)
The information in the following tables is based on the direct investments of the Fund.
Top Holdings as of June 30, 2018
| | % of fund's net assets |
| VIP Investment Grade Bond Portfolio Investor Class | 20.6 |
| VIP Overseas Portfolio Investor Class | 14.9 |
| VIP Growth & Income Portfolio Investor Class | 8.6 |
| VIP Equity-Income Portfolio Investor Class | 7.6 |
| VIP Emerging Markets Portfolio Investor Class | 7.4 |
| VIP Growth Portfolio Investor Class | 7.4 |
| VIP Contrafund Portfolio Investor Class | 7.2 |
| VIP Government Money Market Portfolio Investor Class 1.68% | 7.0 |
| VIP Value Portfolio Investor Class | 5.5 |
| Fidelity Long-Term Treasury Bond Index Fund Institutional Class | 3.6 |
| | 89.8 |
Asset Allocation (% of fund's net assets)
| Period end |
| | Domestic Equity Funds | 41.1% |
| | International Equity Funds | 22.3% |
| | Bond Funds | 29.6% |
| | Short-Term Funds | 7.0% |

VIP Investor Freedom 2025 Portfolio℠
Schedule of Investments June 30, 2018 (Unaudited)
Showing Percentage of Net Assets
| Domestic Equity Funds - 41.1% | | | |
| | | Shares | Value |
| VIP Contrafund Portfolio Investor Class (a) | | 440,284 | $15,599,255 |
| VIP Equity-Income Portfolio Investor Class (a) | | 741,483 | 16,386,768 |
| VIP Growth & Income Portfolio Investor Class (a) | | 872,059 | 18,653,332 |
| VIP Growth Portfolio Investor Class (a) | | 231,051 | 16,009,527 |
| VIP Mid Cap Portfolio Investor Class (a) | | 124,587 | 4,529,982 |
| VIP Value Portfolio Investor Class (a) | | 765,083 | 11,981,201 |
| VIP Value Strategies Portfolio Investor Class (a) | | 430,314 | 5,852,271 |
| TOTAL DOMESTIC EQUITY FUNDS | | | |
| (Cost $70,315,069) | | | 89,012,336 |
|
| International Equity Funds - 22.3% | | | |
| VIP Emerging Markets Portfolio Investor Class (a) | | 1,411,375 | 16,033,225 |
| VIP Overseas Portfolio Investor Class (a) | | 1,449,323 | 32,377,868 |
| TOTAL INTERNATIONAL EQUITY FUNDS | | | |
| (Cost $38,133,181) | | | 48,411,093 |
|
| Bond Funds - 29.6% | | | |
| Fidelity Inflation-Protected Bond Index Fund Institutional Premium Class (a) | | 745,103 | 7,316,909 |
| Fidelity Long-Term Treasury Bond Index Fund Institutional Class (a) | | 618,433 | 7,854,098 |
| VIP High Income Portfolio Investor Class (a) | | 804,168 | 4,302,297 |
| VIP Investment Grade Bond Portfolio Investor Class (a) | | 3,598,348 | 44,727,466 |
| TOTAL BOND FUNDS | | | |
| (Cost $65,126,391) | | | 64,200,770 |
|
| Short-Term Funds - 7.0% | | | |
| Fidelity Cash Central Fund, 1.93% (b) | | 5 | 5 |
| VIP Government Money Market Portfolio Investor Class 1.68% (a)(c) | | 15,267,519 | 15,267,519 |
| TOTAL SHORT-TERM FUNDS | | | |
| (Cost $15,267,524) | | | 15,267,524 |
| TOTAL INVESTMENT IN SECURITIES - 100.0% | | | |
| (Cost $188,842,165) | | | 216,891,723 |
| NET OTHER ASSETS (LIABILITIES) - 0.0% | | | 91 |
| NET ASSETS - 100% | | | $216,891,814 |
Legend
(a) Affiliated Fund
(b) Affiliated fund that is generally available only to investment companies and other accounts managed by Fidelity Investments. The rate quoted is the annualized seven-day yield of the fund at period end. A complete unaudited listing of the fund's holdings as of its most recent quarter end is available upon request. In addition, each Fidelity Central Fund's financial statements are available on the SEC's website or upon request.
(c) The rate quoted is the annualized seven-day yield of the fund at period end.
Affiliated Central Funds
Information regarding fiscal year to date income earned by the Fund from investments in Fidelity Central Funds is as follows:
| Fund | Income earned |
| Fidelity Cash Central Fund | $9 |
| Total | $9 |
Amounts in the income column in the above table include any capital gain distributions from underlying funds, which are presented in the corresponding line-item in the Statement of Operations if applicable.
Affiliated Underlying Funds
Fiscal year to date information regarding the Fund's investments in affiliated Underlying Funds, excluding any Money Market Central Funds, is presented below. Exchanges between classes of the same affiliated Underlying Funds may occur.
| Affiliate | Value, beginning of period | Purchases | Sales Proceeds | Dividend Income | Realized Gain (loss) | Change in Unrealized appreciation (depreciation) | Value, end of period |
| Fidelity Inflation-Protected Bond Index Fund Institutional Premium Class | $-- | $7,316,909 | $-- | $66 | $-- | $-- | $7,316,909 |
| Fidelity Long-Term Treasury Bond Index Fund Institutional Class | -- | 7,681,233 | 70,226 | 22,575 | (102) | 243,193 | 7,854,098 |
| Fidelity Long-Term Treasury Bond Index Fund Premium Class | 4,558,600 | 615,728 | 4,802,190 | 52,152 | (389,131) | 16,993 | -- |
| VIP Contrafund Portfolio Investor Class | 15,860,487 | 2,131,159 | 1,548,329 | 1,363,910 | 19,336 | (863,398) | 15,599,255 |
| VIP Emerging Markets Portfolio Investor Class | 15,939,402 | 2,482,253 | 1,354,693 | 7,551 | 127,891 | (1,161,628) | 16,033,225 |
| VIP Equity-Income Portfolio Investor Class | 16,721,864 | 2,140,636 | 1,341,002 | 758,890 | 23,029 | (1,157,759) | 16,386,768 |
| VIP Government Money Market Portfolio Investor Class 1.68% | 18,139,153 | 2,004,594 | 4,876,228 | 123,115 | -- | -- | 15,267,519 |
| VIP Growth & Income Portfolio Investor Class | 19,181,934 | 2,319,540 | 1,894,236 | 1,044,388 | 43,276 | (997,182) | 18,653,332 |
| VIP Growth Portfolio Investor Class | 16,150,971 | 3,044,954 | 2,513,842 | 2,260,133 | 221,344 | (893,900) | 16,009,527 |
| VIP High Income Portfolio Investor Class | 4,293,787 | 401,781 | 327,187 | 40,117 | (5,487) | (60,597) | 4,302,297 |
| VIP Investment Grade Bond Portfolio Investor Class | 48,904,422 | 5,900,026 | 8,800,746 | 504,481 | (209,183) | (1,067,053) | 44,727,466 |
| VIP Mid Cap Portfolio Investor Class | 4,646,419 | 610,556 | 480,927 | 387,046 | 19,878 | (265,944) | 4,529,982 |
| VIP Overseas Portfolio Investor Class | 33,516,401 | 2,163,291 | 2,699,689 | 8,580 | 65,518 | (667,653) | 32,377,868 |
| VIP Value Portfolio Investor Class | 12,285,151 | 1,165,050 | 997,994 | 435,215 | 305 | (471,311) | 11,981,201 |
| VIP Value Strategies Portfolio Investor Class | 6,000,118 | 529,410 | 441,255 | 190,633 | (6,507) | (229,495) | 5,852,271 |
| | $216,198,709 | $40,507,120 | $32,148,544 | $7,198,852 | $(89,833) | $(7,575,734) | $216,891,718 |
Amounts in the income column in the above table include any capital gain distributions from underlying funds, which are presented in the corresponding line-item in the Statement of Operations if applicable.
Investment Valuation
All investments are categorized as Level 1 under the Fair Value Hierarchy. The inputs or methodology used for valuing securities may not be an indication of the risk associated with investing in those securities. For more information on valuation inputs please refer to the Investment Valuation section in the accompanying Notes to Financial Statements.
See accompanying notes which are an integral part of the financial statements.
VIP Investor Freedom 2025 Portfolio℠
Financial Statements
Statement of Assets and Liabilities
| | | June 30, 2018 (Unaudited) |
| Assets | | |
Investment in securities, at value — See accompanying schedule:
| | |
| Fidelity Central Funds (cost $5) | $5 | |
| Other affiliated issuers (cost $188,842,160) | 216,891,718 | |
| Total Investment in Securities (cost $188,842,165) | | $216,891,723 |
| Cash | | 3 |
| Receivable for investments sold | | 8,931,618 |
| Total assets | | 225,823,344 |
| Liabilities | | |
| Payable for investments purchased | 8,919,126 | |
| Payable for fund shares redeemed | 12,404 | |
| Total liabilities | | 8,931,530 |
| Net Assets | | $216,891,814 |
| Net Assets consist of: | | |
| Paid in capital | | $182,486,955 |
| Undistributed net investment income | | 596,595 |
| Accumulated undistributed net realized gain (loss) on investments | | 5,758,706 |
| Net unrealized appreciation (depreciation) on investments | | 28,049,558 |
| Net Assets, for 16,015,919 shares outstanding | | $216,891,814 |
| Net Asset Value, offering price and redemption price per share ($216,891,814 ÷ 16,015,919 shares) | | $13.54 |
See accompanying notes which are an integral part of the financial statements.
Statement of Operations
| | | Six months ended June 30, 2018 (Unaudited) |
| Investment Income | | |
| Dividends: | | |
| Affiliated issuers | | $601,238 |
| Income from Fidelity Central Funds | | 9 |
| Total income | | 601,247 |
| Expenses | | |
| Independent trustees' fees and expenses | $656 | |
| Total expenses | | 656 |
| Net investment income (loss) | | 600,591 |
| Realized and Unrealized Gain (Loss) | | |
| Net realized gain (loss) on: | | |
| Investment securities: | | |
| Affiliated issuers | (89,833) | |
| Capital gain distributions from underlying funds: | | |
| Affiliated issuers | 6,597,614 | |
| Total net realized gain (loss) | | 6,507,781 |
| Change in net unrealized appreciation (depreciation) on: | | |
| Investment securities: | | |
| Affiliated issuers | (7,575,734) | |
| Total change in net unrealized appreciation (depreciation) | | (7,575,734) |
| Net gain (loss) | | (1,067,953) |
| Net increase (decrease) in net assets resulting from operations | | $(467,362) |
See accompanying notes which are an integral part of the financial statements.
Statement of Changes in Net Assets
| | Six months ended June 30, 2018 (Unaudited) | Year ended December 31, 2017 |
| Increase (Decrease) in Net Assets | | |
| Operations | | |
| Net investment income (loss) | $600,591 | $2,919,062 |
| Net realized gain (loss) | 6,507,781 | 5,108,636 |
| Change in net unrealized appreciation (depreciation) | (7,575,734) | 22,727,036 |
| Net increase (decrease) in net assets resulting from operations | (467,362) | 30,754,734 |
| Distributions to shareholders from net investment income | (15,697) | (2,897,796) |
| Distributions to shareholders from net realized gain | (3,312,066) | (4,478,683) |
| Total distributions | (3,327,763) | (7,376,479) |
| Share transactions | | |
| Proceeds from sales of shares | 10,940,815 | 31,904,091 |
| Reinvestment of distributions | 3,327,763 | 7,376,479 |
| Cost of shares redeemed | (9,781,414) | (10,391,673) |
| Net increase (decrease) in net assets resulting from share transactions | 4,487,164 | 28,888,897 |
| Total increase (decrease) in net assets | 692,039 | 52,267,152 |
| Net Assets | | |
| Beginning of period | 216,199,775 | 163,932,623 |
| End of period | $216,891,814 | $216,199,775 |
| Other Information | | |
| Undistributed net investment income end of period | $596,595 | $11,701 |
| Shares | | |
| Sold | 800,238 | 2,422,167 |
| Issued in reinvestment of distributions | 243,614 | 560,738 |
| Redeemed | (713,243) | (787,220) |
| Net increase (decrease) | 330,609 | 2,195,685 |
See accompanying notes which are an integral part of the financial statements.
Financial Highlights
VIP Investor Freedom 2025 Portfolio
| | Six months ended (Unaudited) June 30, | Years endedDecember 31, | | | | |
| | 2018 | 2017 | 2016 | 2015 | 2014 | 2013 |
| Selected Per–Share Data | | | | | | |
| Net asset value, beginning of period | $13.78 | $12.15 | $12.04 | $12.35 | $12.16 | $10.45 |
| Income from Investment Operations | | | | | | |
| Net investment income (loss)A | .04 | .20 | .18 | .24 | .21 | .24 |
| Net realized and unrealized gain (loss) | (.07) | 1.94 | .50 | (.28) | .40 | 1.83 |
| Total from investment operations | (.03) | 2.14 | .68 | (.04) | .61 | 2.07 |
| Distributions from net investment income | –B | (.19) | (.18) | (.23) | (.20) | (.21) |
| Distributions from net realized gain | (.21) | (.32) | (.39) | (.04) | (.22) | (.15) |
| Total distributions | (.21) | (.51) | (.57) | (.27) | (.42) | (.36) |
| Net asset value, end of period | $13.54 | $13.78 | $12.15 | $12.04 | $12.35 | $12.16 |
| Total ReturnC,D,E | (.22)% | 17.82% | 6.10% | (.32)% | 5.04% | 19.95% |
| Ratios to Average Net AssetsF,G | | | | | | |
| Expenses before reductionsH | - %I | -% | -% | -% | -% | -% |
| Expenses net of fee waivers, if any | - %H,I | -% | -% | -% | -% | -% |
| Expenses net of all reductions | - %H,I | -% | -% | -% | -% | -% |
| Net investment income (loss) | .55%I | 1.53% | 1.54% | 1.89% | 1.71% | 2.09% |
| Supplemental Data | | | | | | |
| Net assets, end of period (000 omitted) | $216,892 | $216,200 | $163,933 | $156,218 | $139,907 | $114,407 |
| Portfolio turnover rateF | 30%I | 17% | 23% | 16% | 13% | 15% |
A Calculated based on average shares outstanding during the period.
B Amount represents less than $.005 per share.
C Total returns for periods of less than one year are not annualized.
D Total returns do not reflect charges attributable to your insurance company's separate account. Inclusion of these charges would reduce the total returns shown.
E Total returns would have been lower if certain expenses had not been reduced during the applicable periods shown.
F Amounts do not include the activity of the Underlying Funds.
G Expense ratios reflect operating expenses of the Fund. Expenses before reductions do not reflect amounts reimbursed by the investment adviser or reductions from expense offset arrangements and do not represent the amount paid by the Fund during periods when reimbursements or reductions occur. Expenses net of fee waivers reflect expenses after reimbursement by the investment adviser but prior to reductions from expense offset arrangements. Expenses net of all reductions represent the net expenses paid by the Fund but do not include expenses of the underlying funds in which the Fund invests.
H Amount represents less than .005%.
I Annualized
See accompanying notes which are an integral part of the financial statements.
VIP Investor Freedom 2030 Portfolio℠
Investment Summary (Unaudited)
The information in the following tables is based on the direct investments of the Fund.
Top Holdings as of June 30, 2018
| | % of fund's net assets |
| VIP Overseas Portfolio Investor Class | 17.6 |
| VIP Investment Grade Bond Portfolio Investor Class | 15.2 |
| VIP Growth & Income Portfolio Investor Class | 10.4 |
| VIP Equity-Income Portfolio Investor Class | 9.1 |
| VIP Growth Portfolio Investor Class | 8.9 |
| VIP Contrafund Portfolio Investor Class | 8.7 |
| VIP Emerging Markets Portfolio Investor Class | 8.4 |
| VIP Value Portfolio Investor Class | 6.6 |
| Fidelity Long-Term Treasury Bond Index Fund Institutional Class | 3.8 |
| VIP Value Strategies Portfolio Investor Class | 3.2 |
| | 91.9 |
Asset Allocation (% of fund's net assets)
| Period end |
| | Domestic Equity Funds | 49.4% |
| | International Equity Funds | 26.0% |
| | Bond Funds | 23.0% |
| | Short-Term Funds | 1.6% |

VIP Investor Freedom 2030 Portfolio℠
Schedule of Investments June 30, 2018 (Unaudited)
Showing Percentage of Net Assets
| Domestic Equity Funds - 49.4% | | | |
| | | Shares | Value |
| VIP Contrafund Portfolio Investor Class (a) | | 556,664 | $19,722,623 |
| VIP Equity-Income Portfolio Investor Class (a) | | 937,480 | 20,718,312 |
| VIP Growth & Income Portfolio Investor Class (a) | | 1,102,576 | 23,584,109 |
| VIP Growth Portfolio Investor Class (a) | | 292,122 | 20,241,123 |
| VIP Mid Cap Portfolio Investor Class (a) | | 157,520 | 5,727,427 |
| VIP Value Portfolio Investor Class (a) | | 967,323 | 15,148,282 |
| VIP Value Strategies Portfolio Investor Class (a) | | 544,064 | 7,399,266 |
| TOTAL DOMESTIC EQUITY FUNDS | | | |
| (Cost $94,559,480) | | | 112,541,142 |
|
| International Equity Funds - 26.0% | | | |
| VIP Emerging Markets Portfolio Investor Class (a) | | 1,680,794 | 19,093,821 |
| VIP Overseas Portfolio Investor Class (a) | | 1,790,791 | 40,006,280 |
| TOTAL INTERNATIONAL EQUITY FUNDS | | | |
| (Cost $48,326,520) | | | 59,100,101 |
|
| Bond Funds - 23.0% | | | |
| Fidelity Inflation-Protected Bond Index Fund Premium Class (a) | | 472,995 | 4,644,811 |
| Fidelity Long-Term Treasury Bond Index Fund Institutional Class (a) | | 671,807 | 8,531,954 |
| VIP High Income Portfolio Investor Class (a) | | 843,310 | 4,511,709 |
| VIP Investment Grade Bond Portfolio Investor Class (a) | | 2,791,099 | 34,693,364 |
| TOTAL BOND FUNDS | | | |
| (Cost $52,939,199) | | | 52,381,838 |
|
| Short-Term Funds - 1.6% | | | |
| VIP Government Money Market Portfolio Investor Class 1.68% (a)(b) | | | |
| (Cost $3,627,746) | | 3,627,746 | 3,627,746 |
| TOTAL INVESTMENT IN SECURITIES - 100.0% | | | |
| (Cost $199,452,945) | | | 227,650,827 |
| NET OTHER ASSETS (LIABILITIES) - 0.0% | | | 44 |
| NET ASSETS - 100% | | | $227,650,871 |
Legend
(a) Affiliated Fund
(b) The rate quoted is the annualized seven-day yield of the fund at period end.
Affiliated Underlying Funds
Fiscal year to date information regarding the Fund's investments in affiliated Underlying Funds, excluding any Money Market Central Funds, is presented below. Exchanges between classes of the same affiliated Underlying Funds may occur.
| Affiliate | Value, beginning of period | Purchases | Sales Proceeds | Dividend Income | Realized Gain (loss) | Change in Unrealized appreciation (depreciation) | Value, end of period |
| Fidelity Inflation-Protected Bond Index Fund Premium Class | $-- | $4,644,811 | $-- | $37 | $-- | $-- | $4,644,811 |
| Fidelity Long-Term Treasury Bond Index Fund Institutional Class | -- | 8,298,262 | 29,655 | 24,411 | 34 | 263,313 | 8,531,954 |
| Fidelity Long-Term Treasury Bond Index Fund Premium Class | 4,496,919 | 842,704 | 4,960,774 | 53,645 | (395,705) | 16,856 | -- |
| VIP Contrafund Portfolio Investor Class | 19,073,221 | 3,450,339 | 1,752,473 | 1,677,840 | (18,083) | (1,030,381) | 19,722,623 |
| VIP Emerging Markets Portfolio Investor Class | 18,019,994 | 3,519,840 | 1,188,617 | 8,753 | 35,263 | (1,292,659) | 19,093,821 |
| VIP Equity-Income Portfolio Investor Class | 20,109,451 | 3,249,275 | 1,236,415 | 933,600 | 14,280 | (1,418,279) | 20,718,312 |
| VIP Government Money Market Portfolio Investor Class 1.68% | 5,515,093 | 787,078 | 2,674,425 | 34,853 | -- | -- | 3,627,746 |
| VIP Growth & Income Portfolio Investor Class | 23,068,344 | 3,732,443 | 2,038,852 | 1,284,836 | (2,456) | (1,175,370) | 23,584,109 |
| VIP Growth Portfolio Investor Class | 19,422,535 | 4,594,253 | 2,941,013 | 2,780,247 | 101,268 | (935,920) | 20,241,123 |
| VIP High Income Portfolio Investor Class | 4,254,597 | 634,801 | 309,435 | 40,820 | (3,516) | (64,738) | 4,511,709 |
| VIP Investment Grade Bond Portfolio Investor Class | 33,678,873 | 7,681,095 | 5,769,211 | 366,607 | (177,050) | (720,343) | 34,693,364 |
| VIP Mid Cap Portfolio Investor Class | 5,587,812 | 992,489 | 546,448 | 476,138 | 726 | (307,152) | 5,727,427 |
| VIP Overseas Portfolio Investor Class | 39,379,726 | 3,965,160 | 2,568,768 | 10,315 | 27,407 | (797,245) | 40,006,280 |
| VIP Value Portfolio Investor Class | 14,774,188 | 1,977,858 | 1,021,924 | 535,414 | (13,628) | (568,212) | 15,148,282 |
| VIP Value Strategies Portfolio Investor Class | 7,215,746 | 930,122 | 457,310 | 234,508 | (4,553) | (284,739) | 7,399,266 |
| | $214,596,499 | $49,300,530 | $27,495,320 | $8,462,024 | $(436,013) | $(8,314,869) | $227,650,827 |
Amounts in the income column in the above table include any capital gain distributions from underlying funds, which are presented in the corresponding line-item in the Statement of Operations if applicable.
Investment Valuation
All investments are categorized as Level 1 under the Fair Value Hierarchy. The inputs or methodology used for valuing securities may not be an indication of the risk associated with investing in those securities. For more information on valuation inputs please refer to the Investment Valuation section in the accompanying Notes to Financial Statements.
See accompanying notes which are an integral part of the financial statements.
VIP Investor Freedom 2030 Portfolio℠
Financial Statements
Statement of Assets and Liabilities
| | | June 30, 2018 (Unaudited) |
| Assets | | |
Investment in securities, at value — See accompanying schedule:
| | |
| Affiliated issuers (cost $199,452,945) | $227,650,827 | |
| Total Investment in Securities (cost $199,452,945) | | $227,650,827 |
| Cash | | 1 |
| Receivable for investments sold | | 6,481,532 |
| Receivable for fund shares sold | | 8,902 |
| Total assets | | 234,141,262 |
| Liabilities | | |
| Payable for investments purchased | 6,448,703 | |
| Payable for fund shares redeemed | 41,688 | |
| Total liabilities | | 6,490,391 |
| Net Assets | | $227,650,871 |
| Net Assets consist of: | | |
| Paid in capital | | $192,190,466 |
| Undistributed net investment income | | 490,115 |
| Accumulated undistributed net realized gain (loss) on investments | | 6,772,408 |
| Net unrealized appreciation (depreciation) on investments | | 28,197,882 |
| Net Assets, for 17,038,437 shares outstanding | | $227,650,871 |
| Net Asset Value, offering price and redemption price per share ($227,650,871 ÷ 17,038,437 shares) | | $13.36 |
See accompanying notes which are an integral part of the financial statements.
Statement of Operations
| | | Six months ended June 30, 2018 (Unaudited) |
| Investment Income | | |
| Dividends: | | |
| Affiliated issuers | | $502,633 |
| Expenses | | |
| Independent trustees' fees and expenses | $658 | |
| Total expenses | | 658 |
| Net investment income (loss) | | 501,975 |
| Realized and Unrealized Gain (Loss) | | |
| Net realized gain (loss) on: | | |
| Investment securities: | | |
| Affiliated issuers | (436,013) | |
| Capital gain distributions from underlying funds: | | |
| Affiliated issuers | 7,959,391 | |
| Total net realized gain (loss) | | 7,523,378 |
| Change in net unrealized appreciation (depreciation) on: | | |
| Investment securities: | | |
| Affiliated issuers | (8,314,869) | |
| Total change in net unrealized appreciation (depreciation) | | (8,314,869) |
| Net gain (loss) | | (791,491) |
| Net increase (decrease) in net assets resulting from operations | | $(289,516) |
See accompanying notes which are an integral part of the financial statements.
Statement of Changes in Net Assets
| | Six months ended June 30, 2018 (Unaudited) | Year ended December 31, 2017 |
| Increase (Decrease) in Net Assets | | |
| Operations | | |
| Net investment income (loss) | $501,975 | $2,711,747 |
| Net realized gain (loss) | 7,523,378 | 5,755,764 |
| Change in net unrealized appreciation (depreciation) | (8,314,869) | 26,146,448 |
| Net increase (decrease) in net assets resulting from operations | (289,516) | 34,613,959 |
| Distributions to shareholders from net investment income | (32,166) | (2,691,438) |
| Distributions to shareholders from net realized gain | (3,827,694) | (5,515,531) |
| Total distributions | (3,859,860) | (8,206,969) |
| Share transactions | | |
| Proceeds from sales of shares | 20,950,086 | 36,781,109 |
| Reinvestment of distributions | 3,859,860 | 8,206,969 |
| Cost of shares redeemed | (7,606,520) | (12,331,255) |
| Net increase (decrease) in net assets resulting from share transactions | 17,203,426 | 32,656,823 |
| Total increase (decrease) in net assets | 13,054,050 | 59,063,813 |
| Net Assets | | |
| Beginning of period | 214,596,821 | 155,533,008 |
| End of period | $227,650,871 | $214,596,821 |
| Other Information | | |
| Undistributed net investment income end of period | $490,115 | $20,306 |
| Shares | | |
| Sold | 1,548,395 | 2,871,550 |
| Issued in reinvestment of distributions | 285,704 | 641,654 |
| Redeemed | (560,384) | (972,690) |
| Net increase (decrease) | 1,273,715 | 2,540,514 |
See accompanying notes which are an integral part of the financial statements.
Financial Highlights
VIP Investor Freedom 2030 Portfolio
| | Six months ended (Unaudited) June 30, | Years endedDecember 31, | | | | |
| | 2018 | 2017 | 2016 | 2015 | 2014 | 2013 |
| Selected Per–Share Data | | | | | | |
| Net asset value, beginning of period | $13.61 | $11.76 | $11.68 | $11.97 | $11.81 | $10.00 |
| Income from Investment Operations | | | | | | |
| Net investment income (loss)A | .03 | .19 | .17 | .21 | .19 | .21 |
| Net realized and unrealized gain (loss) | (.04) | 2.23 | .51 | (.24) | .38 | 1.95 |
| Total from investment operations | (.01) | 2.42 | .68 | (.03) | .57 | 2.16 |
| Distributions from net investment income | –B | (.17) | (.17) | (.20) | (.18) | (.19) |
| Distributions from net realized gain | (.24) | (.39) | (.44) | (.05) | (.22) | (.16) |
| Total distributions | (.24) | (.57)C | (.60)D | (.26)E | (.41)F | (.35) |
| Net asset value, end of period | $13.36 | $13.61 | $11.76 | $11.68 | $11.97 | $11.81 |
| Total ReturnG,H,I | (.09)% | 20.92% | 6.50% | (.32)% | 4.83% | 21.72% |
| Ratios to Average Net AssetsJ,K | | | | | | |
| Expenses before reductionsL | - %M | -% | -% | -% | -% | -% |
| Expenses net of fee waivers, if any | - %L,M | -% | -% | -% | -% | -% |
| Expenses net of all reductions | - %L,M | -% | -% | -% | -% | -% |
| Net investment income (loss) | .45%M | 1.46% | 1.48% | 1.73% | 1.58% | 1.94% |
| Supplemental Data | | | | | | |
| Net assets, end of period (000 omitted) | $227,651 | $214,597 | $155,533 | $144,692 | $131,425 | $111,157 |
| Portfolio turnover rateJ | 25%M | 19% | 19% | 12% | 13% | 27% |
A Calculated based on average shares outstanding during the period.
B Amount represents less than $.005 per share.
C Total distributions of $.57 per share is comprised of distributions from net investment income of $.174 and distributions from net realized gain of $.391 per share.
D Total distributions of $.60 per share is comprised of distributions from net investment income of $.167 and distributions from net realized gain of $.435 per share.
E Total distributions of $.26 per share is comprised of distributions from net investment income of $.202 and distributions from net realized gain of $.053 per share.
F Total distributions of $.41 per share is comprised of distributions from net investment income of $.182 and distributions from net realized gain of $.224 per share.
G Total returns for periods of less than one year are not annualized.
H Total returns do not reflect charges attributable to your insurance company's separate account. Inclusion of these charges would reduce the total returns shown.
I Total returns would have been lower if certain expenses had not been reduced during the applicable periods shown.
J Amounts do not include the activity of the Underlying Funds.
K Expense ratios reflect operating expenses of the Fund. Expenses before reductions do not reflect amounts reimbursed by the investment adviser or reductions from expense offset arrangements and do not represent the amount paid by the Fund during periods when reimbursements or reductions occur. Expenses net of fee waivers reflect expenses after reimbursement by the investment adviser but prior to reductions from expense offset arrangements. Expenses net of all reductions represent the net expenses paid by the Fund but do not include expenses of the underlying funds in which the Fund invests.
L Amount represents less than .005%.
M Annualized
See accompanying notes which are an integral part of the financial statements.
Notes to Financial Statements (Unaudited)
For the period ended June 30, 2018
1. Organization.
VIP Investor Freedom Income Portfolio, VIP Investor Freedom 2005 Portfolio, VIP Investor Freedom 2010 Portfolio, VIP Investor Freedom 2015 Portfolio, VIP Investor Freedom 2020 Portfolio, VIP Investor Freedom 2025 Portfolio and VIP Investor Freedom 2030 Portfolio (the Funds) are funds of Variable Insurance Products Fund V (the Trust). The Trust is registered under the Investment Company Act of 1940, as amended (the 1940 Act), as an open-end management investment company organized as a Massachusetts business trust. Each Fund is authorized to issue an unlimited number of shares. The Funds invest primarily in a combination of other VIP equity, bond, and short-term funds (the Underlying Funds) managed by Fidelity Management & Research Company (FMR). Shares of each Fund may only be purchased by insurance companies for the purpose of funding variable annuity or variable life insurance contracts.
2. Investments in Fidelity Central Funds.
The Funds may invest in Fidelity Central Funds, which are open-end investment companies generally available only to other investment companies and accounts managed by the investment adviser and its affiliates. The Funds' Schedules of Investments list each of the Fidelity Central Funds held as of period end, if any, as an investment of each Fund, but do not include the underlying holdings of each Fidelity Central Fund. As an Investing Fund, each Fund indirectly bears its proportionate share of the expenses of the underlying Fidelity Central Funds.
The Money Market Central Funds seek preservation of capital and current income and are managed by Fidelity Investments Money Management, Inc. (FIMM), an affiliate of the investment adviser. Annualized expenses of the Money Market Central Funds as of their most recent shareholder report date are less than .005%.
A complete unaudited list of holdings for each Fidelity Central Fund is available upon request or at the Securities and Exchange Commission (the SEC) website at www.sec.gov. In addition, the financial statements of the Fidelity Central Funds are available on the SEC website or upon request.
3. Significant Accounting Policies.
Each Fund is an investment company and applies the accounting and reporting guidance of the Financial Accounting Standards Board (FASB) Accounting Standards Codification Topic 946 Financial Services – Investments Companies. The financial statements have been prepared in conformity with accounting principles generally accepted in the United States of America (GAAP), which require management to make certain estimates and assumptions at the date of the financial statements. Actual results could differ from those estimates. Subsequent events, if any, through the date that the financial statements were issued have been evaluated in the preparation of the financial statements. The following summarizes the significant accounting policies of the Funds:
Investment Valuation. Investments are valued as of 4:00 p.m. Eastern time on the last calendar day of the period. Each Fund categorizes the inputs to valuation techniques used to value its investments into a disclosure hierarchy consisting of three levels as shown below:
- Level 1 – quoted prices in active markets for identical investments
- Level 2 – other significant observable inputs (including quoted prices for similar investments, interest rates, prepayment speeds, etc.)
- Level 3 – unobservable inputs (including the Fund's own assumptions based on the best information available)
Valuation techniques used to value each Fund's investments by major category are as follows. Investments in the Underlying Funds are valued at their closing net asset value (NAV) each business day and are categorized as Level 1 in the hierarchy.
Investment Transactions and Income. For financial reporting purposes, the Funds' investment holdings and NAV include trades executed through the end of the last business day of the period. The NAV per share for processing shareholder transactions is calculated as of the close of business of the New York Stock Exchange (NYSE), normally 4:00 p.m. Eastern time and includes trades executed through the end of the prior business day. Gains and losses on securities sold are determined on the basis of identified cost. Income and capital gain distributions from the Underlying Funds, if any, are recorded on the ex-dividend date.
Expenses. Expenses directly attributable to a fund are charged to that fund. Expenses attributable to more than one fund are allocated among the respective funds on the basis of relative net assets or other appropriate methods. Expenses included in the accompanying financial statements reflect the expenses of each Fund and do not include any expenses associated with the Underlying Funds. Although not included in each Fund's expenses, each Fund indirectly bears its proportionate share of the Underlying Funds' expenses through the impact of these expenses on each Underlying Fund's NAV. Expense estimates are accrued in the period to which they relate and adjustments are made when actual amounts are known.
Income Tax Information and Distributions to Shareholders. Each year, each Fund intends to qualify as a regulated investment company under Subchapter M of the Internal Revenue Code, including distributing substantially all of its taxable income and realized gains. As a result, no provision for U.S. Federal income taxes is required. Each Fund files a U.S. federal tax return, in addition to state and local tax returns as required. Each Fund's federal income tax returns are subject to examination by the Internal Revenue Service (IRS) for a period of three fiscal years after they are filed. State and local tax returns may be subject to examination for an additional fiscal year depending on the jurisdiction.
Distributions are declared and recorded on the ex-dividend date. Income and capital gain distributions are determined in accordance with income tax regulations, which may differ from GAAP.
Capital accounts within the financial statements are adjusted for permanent book-tax differences. These adjustments have no impact on net assets or the results of operations. Capital accounts are not adjusted for temporary book-tax differences which will reverse in a subsequent period.
Book-tax differences are primarily due to the short-term gain distributions from the Underlying Funds and losses deferred due to wash sales.
As of period end, the cost and unrealized appreciation (depreciation) in securities, and derivatives if applicable, for federal income tax purposes were as follows for each Fund:
| | Tax cost | Gross unrealized appreciation | Gross unrealized depreciation | Net unrealized appreciation (depreciation) |
| VIP Investor Freedom Income | $74,587,268 | $4,678,416 | $(681,998) | $3,996,418 |
| VIP Investor Freedom 2005 | 28,360,337 | 1,964,573 | (303,427) | 1,661,146 |
| VIP Investor Freedom 2010 | 60,306,649 | 5,818,235 | (602,478) | 5,215,757 |
| VIP Investor Freedom 2015 | 96,422,864 | 12,639,497 | (978,155) | 11,661,342 |
| VIP Investor Freedom 2020 | 193,808,355 | 27,717,490 | (1,987,446) | 25,730,044 |
| VIP Investor Freedom 2025 | 189,429,337 | 29,280,740 | (1,818,354) | 27,462,386 |
| VIP Investor Freedom 2030 | 200,029,845 | 29,594,307 | (1,973,325) | 27,620,982 |
4. Purchases and Sales of Investments.
Purchases and sales of securities, other than short-term securities and U.S. government securities, are noted in the table below.
| | Purchases ($) | Redemptions ($) |
| VIP Investor Freedom Income | 19,750,038 | 14,986,868 |
| VIP Investor Freedom 2005 | 7,184,125 | 5,336,764 |
| VIP Investor Freedom 2010 | 12,488,168 | 12,115,567 |
| VIP Investor Freedom 2015 | 17,539,718 | 16,729,443 |
| VIP Investor Freedom 2020 | 38,199,568 | 33,949,945 |
| VIP Investor Freedom 2025 | 40,507,120 | 32,148,544 |
| VIP Investor Freedom 2030 | 49,300,530 | 27,495,320 |
5. Fees and Other Transactions with Affiliates.
Management Fee. FMR Co., Inc. (the investment adviser), an affiliate of FMR, provides the Funds with investment management related services. The Funds do not pay any fees for these services.
Other Transactions. The investment adviser has entered into an administration agreement with FMR under which FMR provides management and administrative services (other than investment advisory services) necessary for the operation of each Fund. Pursuant to this agreement, FMR pays all expenses of each Fund, excluding compensation of the independent Trustees and certain other expenses such as interest expense. FMR also contracts with other Fidelity companies to perform the services necessary for the operation of each Fund. The Funds do not pay any fees for these services.
6. Other.
The Funds' organizational documents provide former and current trustees and officers with a limited indemnification against liabilities arising in connection with the performance of their duties to the Funds. In the normal course of business, the Funds may also enter into contracts that provide general indemnifications. The Funds' maximum exposure under these arrangements is unknown as this would be dependent on future claims that may be made against the Funds. The risk of material loss from such claims is considered remote.
At the end of the period, the investment adviser or its affiliates were owners of record of all of the outstanding shares of the Funds.
Shareholder Expense Example
As a shareholder of a Fund, you incur two types of costs: (1) transaction costs and (2) ongoing costs, including other Fund expenses. This Example is intended to help you understand your ongoing costs (in dollars) of investing in the Funds and to compare these costs with the ongoing costs of investing in other mutual funds.
The Example is based on an investment of $1,000 invested at the beginning of the period and held for the entire period (January 1, 2018 to June 30, 2018).
Actual Expenses
The first line of the accompanying table for each fund provides information about actual account values and actual expenses. You may use the information in this line, together with the amount you invested, to estimate the expenses that you paid over the period. Simply divide your account value by $1,000.00 (for example, an $8,600 account value divided by $1,000.00 = 8.6), then multiply the result by the number in the first line for a fund under the heading entitled "Expenses Paid During Period" to estimate the expenses you paid on your account during this period. The estimate of expenses does not include any fees or other expenses of any variable annuity or variable life insurance product. If they were, the estimate of expenses you paid during the period would be higher, and your ending account value would be lower. In addition, each Fund, as a shareholder in underlying Fidelity Central Funds, will indirectly bear its pro-rata share of the fees and expenses incurred by the underlying Fidelity Central Funds. These fees and expenses are not included in each Fund's annualized expense ratio used to calculate the expense estimates in the table below.
Hypothetical Example for Comparison Purposes
The second line of the accompanying table for each fund provides information about hypothetical account values and hypothetical expenses based on a fund's actual expense ratio and an assumed rate of return of 5% per year before expenses, which is not the Fund's actual return. The hypothetical account values and expenses may not be used to estimate the actual ending account balance or expenses you paid for the period. You may use this information to compare the ongoing costs of investing in the Fund and other funds. To do so, compare this 5% hypothetical example with the 5% hypothetical examples that appear in the shareholder reports of the other funds. The estimate of expenses does not include any fees or other expenses of any variable annuity or variable life insurance product. If they were, the estimate of expenses you paid during the period would be higher, and your ending account value would be lower. In addition, each Fund, as a shareholder in underlying Fidelity Central Funds, will indirectly bear its pro-rata share of the fees and expenses incurred by the underlying Fidelity Central Funds. These fees and expenses are not included in each Fund's annualized expense ratio used to calculate the expense estimates in the table below.
Please note that the expenses shown in the table are meant to highlight your ongoing costs only and do not reflect any transaction costs. Therefore, the second line of the table is useful in comparing ongoing costs only, and will not help you determine the relative total costs of owning different funds.
| | Annualized Expense Ratio-A | Beginning
Account Value
January 1, 2018 | Ending
Account Value
June 30, 2018 | Expenses Paid
During Period-B
January 1, 2018
to June 30, 2018 |
| VIP Investor Freedom Income | - % | | | |
| Actual | | $1,000.00 | $995.00 | $- |
| Hypothetical-C | | $1,000.00 | $1,024.79 | $- |
| VIP Investor Freedom 2005 | - % | | | |
| Actual | | $1,000.00 | $995.20 | $- |
| Hypothetical-C | | $1,000.00 | $1,024.79 | $- |
| VIP Investor Freedom 2010 | - % | | | |
| Actual | | $1,000.00 | $996.10 | $- |
| Hypothetical-C | | $1,000.00 | $1,024.79 | $- |
| VIP Investor Freedom 2015 | - % | | | |
| Actual | | $1,000.00 | $996.90 | $- |
| Hypothetical-C | | $1,000.00 | $1,024.79 | $- |
| VIP Investor Freedom 2020 | - % | | | |
| Actual | | $1,000.00 | $997.10 | $- |
| Hypothetical-C | | $1,000.00 | $1,024.79 | $- |
| VIP Investor Freedom 2025 | - % | | | |
| Actual | | $1,000.00 | $997.80 | $- |
| Hypothetical-C | | $1,000.00 | $1,024.79 | $- |
| VIP Investor Freedom 2030 | - % | | | |
| Actual | | $1,000.00 | $999.10 | $- |
| Hypothetical-C | | $1,000.00 | $1,024.79 | $- |
A Annualized expense ratio reflects expenses net of applicable fee waivers.
B Expenses are equal to each Fund's annualized expense ratio, multiplied by the average account value over the period, multiplied by 181/ 365 (to reflect the one-half year period). The fees and expenses of the underlying Fidelity Funds in which each Fund invests are not included in each Fund's annualized expense ratio.
C 5% return per year before expenses
VIPIFF-SANN-0818
1.833440.112
Fidelity® Variable Insurance Products:
FundsManager - 20%, 50%, 60%, 70%, 85% Portfolio
Semi-Annual Report June 30, 2018 |
|
Contents
To view a fund's proxy voting guidelines and proxy voting record for the 12-month period ended June 30, visit http://www.fidelity.com/proxyvotingresults or visit the Securities and Exchange Commission's (SEC) web site at http://www.sec.gov.
You may also call 1-877-208-0098 to request a free copy of the proxy voting guidelines.
Fidelity® Variable Insurance Products are separate account options which are purchased through a variable insurance contract.
Standard & Poor's, S&P and S&P 500 are registered service marks of The McGraw-Hill Companies, Inc. and have been licensed for use by Fidelity Distributors Corporation.
Other third-party marks appearing herein are the property of their respective owners.
All other marks appearing herein are registered or unregistered trademarks or service marks of FMR LLC or an affiliated company. © 2018 FMR LLC. All rights reserved.
This report and the financial statements contained herein are submitted for the general information of the shareholders of the Funds. This report is not authorized for distribution to prospective investors in the Funds unless preceded or accompanied by an effective prospectus.
A fund files its complete schedule of portfolio holdings with the SEC for the first and third quarters of each fiscal year on Form N-Q. Forms N-Q are available on the SEC’s web site at http://www.sec.gov. A fund's Forms N-Q may be reviewed and copied at the SEC’s Public Reference Room in Washington, DC. Information regarding the operation of the SEC's Public Reference Room may be obtained by calling 1-800-SEC-0330.
For a complete list of a fund's portfolio holdings, view the most recent holdings listing, semiannual report, or annual report on Fidelity's web site at http://www.fidelity.com, http://www.institutional.fidelity.com, or http://www.401k.com, as applicable.
NOT FDIC INSURED •MAY LOSE VALUE •NO BANK GUARANTEE
Neither the Funds nor Fidelity Distributors Corporation is a bank.
VIP FundsManager® 20% Portfolio
Investment Summary (Unaudited)
The information in the following tables is based on the direct investments of the Fund.
Top Holdings as of June 30, 2018
| | % of fund's net assets |
| Fidelity U.S. Bond Index Fund Institutional Premium Class | 44.4 |
| Fidelity Investments Money Market Prime Reserves Portfolio - Institutional Class 2.09% | 17.2 |
| Fidelity Stock Selector All Cap Fund | 12.9 |
| Fidelity Investments Money Market Government Portfolio Institutional Class 1.81% | 8.2 |
| Fidelity Inflation-Protected Bond Index Fund Institutional Class | 4.3 |
| Fidelity Long-Term Treasury Bond Index Fund Institutional Class | 2.2 |
| Fidelity Floating Rate High Income Fund | 1.0 |
| Fidelity Mega Cap Stock Fund | 1.0 |
| Fidelity Global Commodity Stock Fund | 0.9 |
| Fidelity Overseas Fund | 0.8 |
| | 92.9 |
Asset Allocation (% of fund's net assets)
| Period end* |
| | Domestic Equity Funds | 17.8% |
| | International Equity Funds | 4.3% |
| | Bond Funds | 52.4% |
| | Short-Term Funds | 25.5% |

* Futures - (1.1)%
VIP FundsManager® 20% Portfolio
Schedule of Investments June 30, 2018 (Unaudited)
Showing Percentage of Net Assets
| Equity Funds - 22.1% | | | |
| | | Shares | Value |
| Fidelity Commodity Strategy Fund (a) | | 73,603 | $775,036 |
| Fidelity Contrafund (a) | | 39,709 | 5,244,411 |
| Fidelity Diversified International Fund (a) | | 132,527 | 5,163,247 |
| Fidelity Equity-Income Fund (a) | | 88,982 | 5,124,466 |
| Fidelity Europe Fund (a) | | 48,795 | 1,983,020 |
| Fidelity Global Commodity Stock Fund (a) | | 509,818 | 6,964,113 |
| Fidelity International Capital Appreciation Fund (a) | | 59,423 | 1,241,343 |
| Fidelity International Discovery Fund (a) | | 98,366 | 4,354,651 |
| Fidelity International Enhanced Index Fund (a) | | 400,998 | 3,949,834 |
| Fidelity International Small Cap Fund (a) | | 59,878 | 1,745,450 |
| Fidelity International Small Cap Opportunities Fund (a) | | 112,713 | 2,182,116 |
| Fidelity International Value Fund (a) | | 315,385 | 2,724,923 |
| Fidelity Japan Smaller Companies Fund (a) | | 173,570 | 3,214,510 |
| Fidelity Low-Priced Stock Fund (a) | | 93,243 | 5,128,345 |
| Fidelity Mega Cap Stock Fund (a) | | 439,120 | 7,693,384 |
| Fidelity Overseas Fund (a) | | 120,089 | 5,979,238 |
| Fidelity Pacific Basin Fund (a) | | 30,222 | 1,034,507 |
| Fidelity Real Estate Investment Portfolio (a) | | 19,421 | 820,922 |
| Fidelity Stock Selector All Cap Fund (a) | | 2,163,143 | 99,526,198 |
| Fidelity Value Discovery Fund (a) | | 91,234 | 2,589,221 |
| iShares S&P 500 Index ETF | | 11,422 | 3,118,777 |
| TOTAL EQUITY FUNDS | | | |
| (Cost $163,539,247) | | | 170,557,712 |
|
| Fixed-Income Funds - 52.4% | | | |
| Fidelity Floating Rate High Income Fund (a) | | 814,463 | 7,810,704 |
| Fidelity Inflation-Protected Bond Index Fund Institutional Class (a) | | 3,342,792 | 32,826,215 |
| Fidelity Long-Term Treasury Bond Index Fund Institutional Class (a) | | 1,363,770 | 17,319,873 |
| Fidelity New Markets Income Fund (a) | | 246,563 | 3,673,789 |
| Fidelity U.S. Bond Index Fund Institutional Premium Class (a) | | 30,446,541 | 342,219,114 |
| TOTAL FIXED-INCOME FUNDS | | | |
| (Cost $404,651,061) | | | 403,849,695 |
|
| Money Market Funds - 25.5% | | | |
| Fidelity Cash Central Fund, 1.93% (b) | | 716,371 | 716,514 |
| Fidelity Investments Money Market Government Portfolio Institutional Class 1.81% (a)(c) | | 63,233,665 | 63,233,665 |
| Fidelity Investments Money Market Prime Reserves Portfolio - Institutional Class 2.09% (a)(c) | | 132,569,021 | 132,608,792 |
| TOTAL MONEY MARKET FUNDS | | | |
| (Cost $196,545,541) | | | 196,558,971 |
| | | Principal Amount | Value |
|
| U.S. Treasury Obligations - 0.0% | | | |
| U.S. Treasury Bills, yield at date of purchase 1.88% to 1.9% 8/16/18 to 9/20/18 (d) | | | |
| (Cost $398,989) | | 400,000 | 399,033 |
| TOTAL INVESTMENT IN SECURITIES - 100.0% | | | |
| (Cost $765,134,838) | | | 771,365,411 |
| NET OTHER ASSETS (LIABILITIES) - 0.0% | | | (160,271) |
| NET ASSETS - 100% | | | $771,205,140 |
| Futures Contracts | | | | | |
| | Number of contracts | Expiration Date | Notional Amount | Value | Unrealized Appreciation/(Depreciation) |
| Sold | | | | | |
| Equity Index Contracts | | | | | |
| ICE E-mini MSCI EAFE Index Contracts (United States) | 86 | Sept. 2018 | $8,408,220 | $253,458 | $253,458 |
The notional amount of futures sold as a percentage of Net Assets is 1.1%
For the period, the average monthly underlying face amount at value for futures contracts in the aggregate was $3,127,419.
Security Type Abbreviations
ETF – Exchange-Traded Fund
Legend
(a) Affiliated Fund
(b) Affiliated fund that is generally available only to investment companies and other accounts managed by Fidelity Investments. The rate quoted is the annualized seven-day yield of the fund at period end. A complete unaudited listing of the fund's holdings as of its most recent quarter end is available upon request. In addition, each Fidelity Central Fund's financial statements are available on the SEC's website or upon request.
(c) The rate quoted is the annualized seven-day yield of the fund at period end.
(d) Security or a portion of the security was pledged to cover margin requirements for futures contracts. At period end, the value of securities pledged amounted to $399,033.
Affiliated Central Funds
Information regarding fiscal year to date income earned by the Fund from investments in Fidelity Central Funds is as follows:
| Fund | Income earned |
| Fidelity Cash Central Fund | $4,784 |
| Total | $4,784 |
Amounts in the income column in the above table include any capital gain distributions from underlying funds, which are presented in the corresponding line-item in the Statement of Operations if applicable.
Fiscal year to date information regarding the Fund’s investments in non-Money Market Central Funds, including the ownership percentage, is presented below.
| Affiliate | Value, beginning of period | Purchases(a) | Sales Proceeds(a) | Realized Gain (loss) | Change in Unrealized appreciation (depreciation) | Value, end of period | % ownership, end of period |
| Fidelity Consumer Discretionary Central Fund | $-- | $8,953,396 | $9,027,548 | $74,152 | $-- | $-- | 0.0% |
| Fidelity Consumer Staples Central Fund | -- | 4,816,241 | 4,856,996 | 40,755 | -- | -- | 0.0% |
| Fidelity Energy Central Fund | -- | 4,301,390 | 4,345,882 | 44,492 | -- | -- | 0.0% |
| Fidelity Financials Central Fund | -- | 12,918,479 | 12,983,948 | 65,469 | -- | -- | 0.0% |
| Fidelity Health Care Central Fund | -- | 11,314,305 | 11,351,684 | 37,379 | -- | -- | 0.0% |
| Fidelity Industrials Central Fund | -- | 8,410,818 | 8,495,300 | 84,482 | -- | -- | 0.0% |
| Fidelity Information Technology Central Fund | -- | 20,550,696 | 20,625,411 | 74,715 | -- | -- | 0.0% |
| Fidelity Materials Central Fund | -- | 2,544,166 | 2,570,338 | 26,172 | -- | -- | 0.0% |
| Fidelity Telecom Services Central Fund | -- | 1,315,216 | 1,334,397 | 19,181 | -- | -- | 0.0% |
| Fidelity Utilities Central Fund | -- | 2,158,269 | 2,185,539 | 27,270 | -- | -- | 0.0% |
| | $-- | $77,282,976 | $77,777,043 | $494,067 | $-- | $-- | |
(a) Includes the value of shares purchased or redeemed through in-kind transactions, if applicable. See the Notes to Financial Statements for additional details.
Amounts in the income column in the above table include any capital gain distributions from underlying funds, which are presented in the corresponding line-item in the Statement of Operations if applicable.
Affiliated Underlying Funds
Fiscal year to date information regarding the Fund's investments in affiliated Underlying Funds, excluding any Money Market Central Funds, is presented below. Exchanges between classes of the same affiliated Underlying Funds may occur.
| Affiliate | Value, beginning of period | Purchases(a) | Sales Proceeds(a) | Dividend Income | Realized Gain (loss) | Change in Unrealized appreciation (depreciation) | Value, end of period |
| Fidelity Air Transportation Portfolio | $545,347 | $38,495 | $526,059 | $28,339 | $125 | $(57,908) | $-- |
| Fidelity Banking Portfolio | 1,290,495 | 121,924 | 1,313,647 | 95,719 | 602,081 | (700,853) | -- |
| Fidelity Biotechnology Portfolio | 648,913 | 41,351 | 686,045 | 25,901 | 127,802 | (132,021) | -- |
| Fidelity Brokerage and Investment Management Portfolio | 284,833 | 19,686 | 292,087 | 13,626 | 30,625 | (43,057) | -- |
| Fidelity Chemicals Portfolio | 288,919 | 21,974 | 278,973 | 16,683 | 119,225 | (151,145) | -- |
| Fidelity Commodity Strategy Fund | 6,280,442 | 852,996 | 6,323,321 | -- | 137,852 | (172,933) | 775,036 |
| Fidelity Construction and Housing Portfolio | 409,106 | 25,964 | 385,039 | 18,538 | (62,102) | 12,071 | -- |
| Fidelity Consumer Discretionary Portfolio | 5,710,919 | 2,143,257 | 7,877,116 | 124,491 | 3,160,325 | (3,137,385) | -- |
| Fidelity Consumer Staples Portfolio | 4,194,088 | 1,276,565 | 4,913,097 | 297,520 | 1,283,059 | (1,840,615) | -- |
| Fidelity Contrafund | 3,044,565 | 2,091,256 | 211,579 | 65,395 | (851) | 321,020 | 5,244,411 |
| Fidelity Defense and Aerospace Portfolio | 1,903,687 | 95,117 | 2,084,246 | 58,324 | 656,965 | (571,523) | -- |
| Fidelity Diversified International Fund | 6,779,012 | 143,138 | 1,622,453 | -- | (52,454) | (83,996) | 5,163,247 |
| Fidelity Emerging Asia Fund | 791,868 | 7,658 | 810,698 | -- | 284,555 | (273,383) | -- |
| Fidelity Emerging Markets Discovery Fund | 1,418,774 | 13,785 | 1,491,466 | -- | 80,132 | (21,225) | -- |
| Fidelity Emerging Markets Fund | 5,855,111 | 55,906 | 6,001,938 | -- | 1,539,412 | (1,448,491) | -- |
| Fidelity Energy Portfolio | 3,352,628 | 963,161 | 4,378,928 | -- | 652,355 | (589,216) | -- |
| Fidelity Equity-Income Fund | 5,038,472 | 1,150,826 | 811,755 | 124,789 | (18,959) | (234,118) | 5,124,466 |
| Fidelity Europe Fund | 2,594,533 | 54,638 | 584,855 | -- | 29,843 | (111,139) | 1,983,020 |
| Fidelity Extended Market Index Fund Premium Class | 22,360 | 21 | 23,957 | 21 | 9,164 | (7,588) | -- |
| Fidelity Financial Services Portfolio | 6,667,195 | 2,546,105 | 8,896,507 | 210,192 | 2,337,899 | (2,654,692) | -- |
| Fidelity Floating Rate High Income Fund | 7,814,907 | 392,740 | 372,242 | 161,607 | (360) | (24,341) | 7,810,704 |
| Fidelity Focused High Income Fund | 272 | 5 | 268 | 6 | (2) | (7) | -- |
| Fidelity Global Commodity Stock Fund | 6,485,492 | 453,052 | 223,378 | -- | 2,806 | 246,141 | 6,964,113 |
| Fidelity Health Care Portfolio | 7,117,118 | 2,790,576 | 10,169,261 | 343,576 | 1,260,422 | (998,855) | -- |
| Fidelity Industrial Equipment Portfolio | 1,351,273 | 177,012 | 4,234 | 170,990 | (13) | (275,682) | -- |
| Fidelity Industrials Portfolio | 2,606,708 | 1,902,951 | 5,570,757 | 227,698 | (115,134) | (72,124) | -- |
| Fidelity Inflation-Protected Bond Index Fund Institutional Class | 29,469,230 | 4,850,189 | 1,487,285 | 40,846 | (8,106) | 2,187 | 32,826,215 |
| Fidelity Insurance Portfolio | 693,241 | 94,723 | 685,566 | 81,238 | 288,263 | (390,661) | -- |
| Fidelity International Capital Appreciation Fund | 1,565,433 | 32,318 | 350,030 | -- | 55,975 | (62,353) | 1,241,343 |
| Fidelity International Discovery Fund | 5,646,974 | 117,741 | 1,282,896 | -- | (28,547) | (98,621) | 4,354,651 |
| Fidelity International Enhanced Index Fund | 5,228,217 | 110,709 | 1,271,621 | -- | (9,110) | (108,361) | 3,949,834 |
| Fidelity International Small Cap Fund | 3,013,116 | 62,338 | 1,297,031 | -- | 257,409 | (290,382) | 1,745,450 |
| Fidelity International Small Cap | 2,794,621 | 56,950 | 688,578 | -- | 159,101 | (139,978) | 2,182,116 |
| Fidelity International Value Fund | 3,699,827 | 77,724 | 920,690 | -- | (3,176) | (128,762) | 2,724,923 |
| Fidelity Investments Money Market Government Portfolio Institutional Class 1.81% | 77,831,034 | 17,043,796 | 31,641,165 | 554,641 | -- | -- | 63,233,665 |
| Fidelity Investments Money Market Prime Reserves Portfolio - Institutional Class 2.09% | 138,479,547 | 14,895,039 | 20,779,150 | 1,160,788 | (64) | 13,420 | 132,608,792 |
| Fidelity Japan Smaller Companies Fund | 3,758,756 | 663,637 | 1,148,311 | -- | 15,318 | (74,890) | 3,214,510 |
| Fidelity Leisure Portfolio | 399,725 | 28,793 | 404,940 | 21,369 | (3,840) | (19,738) | -- |
| Fidelity Long-Term Treasury Bond Index Fund Institutional Class | 14,139,803 | 4,493,402 | 764,915 | 227,544 | (12,308) | (536,109) | 17,319,873 |
| Fidelity Low-Priced Stock Fund | 5,084,008 | 925,862 | 911,580 | -- | 6,582 | 23,473 | 5,128,345 |
| Fidelity Materials Portfolio | 1,864,826 | 648,623 | 2,316,677 | 111,831 | (173,136) | (23,636) | -- |
| Fidelity Medical Equipment and Systems Portfolio | 617,066 | 39,579 | 673,391 | 26,860 | 133,334 | (116,588) | -- |
| Fidelity Mega Cap Stock Fund | 7,599,940 | 1,390,210 | 1,319,460 | -- | (10,601) | 33,295 | 7,693,384 |
| Fidelity Multimedia Portfolio | 473,209 | 34,497 | 460,099 | 25,707 | (25,833) | (21,774) | -- |
| Fidelity Natural Gas Portfolio | 3,887 | 19 | 4,097 | 19 | (561) | 752 | -- |
| Fidelity New Markets Income Fund | 3,984,659 | 200,934 | 186,122 | 85,361 | (2,650) | (323,032) | 3,673,789 |
| Fidelity Overseas Fund | 17,819,753 | 1,627,159 | 13,300,416 | -- | 2,525,443 | (2,692,701) | 5,979,238 |
| Fidelity Pacific Basin Fund | 1,385,939 | 28,475 | 344,289 | -- | 59,551 | (95,169) | 1,034,507 |
| Fidelity Real Estate Investment Portfolio | 2,065,589 | 851,073 | 2,013,065 | 7,269 | (62,334) | (20,341) | 820,922 |
| Fidelity Stock Selector All Cap Fund | -- | 100,260,514 | 2,725,193 | -- | (11,731) | 2,002,608 | 99,526,198 |
| Fidelity Technology Portfolio | 15,749,249 | 5,889,137 | 20,947,968 | 1,964,669 | 3,880,826 | (4,571,244) | -- |
| Fidelity Telecommunications Portfolio | 973,395 | 439,981 | 1,340,290 | 19,404 | (65,973) | (7,113) | -- |
| Fidelity Transportation Portfolio | 402,893 | 26,023 | 391,490 | 18,598 | 44,804 | (82,230) | -- |
| Fidelity U.S. Bond Index Fund Institutional Premium Class | 341,502,115 | 45,933,218 | 34,846,712 | 4,526,021 | (705,827) | (9,663,680) | 342,219,114 |
| Fidelity Utilities Portfolio | 1,634,310 | 544,130 | 2,199,932 | 10,067 | 144,837 | (123,345) | -- |
| Fidelity Value Discovery Fund | 2,587,016 | 562,986 | 506,191 | -- | (4,397) | (50,193) | 2,589,221 |
| | $772,964,415 | $219,309,938 | $213,063,056 | $10,865,647 | $18,508,021 | $(30,588,231) | $767,131,087 |
(a) Includes the value of shares purchased or redeemed through in-kind transactions, if applicable. See the Notes to Financial Statements for additional details.
Amounts in the income column in the above table include any capital gain distributions from underlying funds, which are presented in the corresponding line-item in the Statement of Operations if applicable.
Investment Valuation
The following is a summary of the inputs used, as of June 30, 2018, involving the Fund's assets and liabilities carried at fair value. The inputs or methodology used for valuing securities may not be an indication of the risk associated with investing in those securities. For more information on valuation inputs, and their aggregation into the levels used below, please refer to the Investment Valuation section in the accompanying Notes to Financial Statements.
| | Valuation Inputs at Reporting Date: |
| Description | Total | Level 1 | Level 2 | Level 3 |
| Investments in Securities: | | | | |
| Equity Funds | $170,557,712 | $170,557,712 | $-- | $-- |
| Fixed-Income Funds | 403,849,695 | 403,849,695 | -- | -- |
| Money Market Funds | 196,558,971 | 196,558,971 | -- | -- |
| Other Short-Term Investments and Net Other Assets | 399,033 | -- | 399,033 | -- |
| Total Investments in Securities: | $771,365,411 | $770,966,378 | $399,033 | $-- |
| Derivative Instruments: | | | | |
| Assets | | | | |
| Futures Contracts | $253,458 | $253,458 | $-- | $-- |
| Total Assets | $253,458 | $253,458 | $-- | $-- |
| Total Derivative Instruments: | $253,458 | $253,458 | $-- | $-- |
Value of Derivative Instruments
The following table is a summary of the Fund's value of derivative instruments by primary risk exposure as of June 30, 2018. For additional information on derivative instruments, please refer to the Derivative Instruments section in the accompanying Notes to Financial Statements.
| Primary Risk Exposure / Derivative Type | Value |
| | Asset | Liability |
| Equity Risk | | |
| Futures Contracts(a) | $253,458 | $0 |
| Total Equity Risk | 253,458 | 0 |
| Total Value of Derivatives | $253,458 | $0 |
(a) Reflects gross cumulative appreciation (depreciation) on futures contracts as presented in the Schedule of Investments. In the Statement of Assets and Liabilities, the period end daily variation margin is included in receivable or payable for daily variation margin on futures contracts, and the net cumulative appreciation (depreciation) is included in net unrealized appreciation (depreciation).
See accompanying notes which are an integral part of the financial statements.
VIP FundsManager® 20% Portfolio
Financial Statements
Statement of Assets and Liabilities
| | | June 30, 2018 (Unaudited) |
| Assets | | |
Investment in securities, at value — See accompanying schedule:
Unaffiliated issuers (cost $3,375,059) | $3,517,810 | |
| Fidelity Central Funds (cost $716,514) | 716,514 | |
| Other affiliated issuers (cost $761,043,265) | 767,131,087 | |
| Total Investment in Securities (cost $765,134,838) | | $771,365,411 |
| Receivable for investments sold | | 34,780 |
| Receivable for fund shares sold | | 700 |
| Dividends receivable | | 21,734 |
| Distributions receivable from Fidelity Central Funds | | 721 |
| Other receivables | | 313 |
| Total assets | | 771,423,659 |
| Liabilities | | |
| Payable for fund shares redeemed | $35,420 | |
| Accrued management fee | 129,142 | |
| Distribution and service plan fees payable | 1,067 | |
| Payable for daily variation margin on futures contracts | 52,890 | |
| Total liabilities | | 218,519 |
| Net Assets | | $771,205,140 |
| Net Assets consist of: | | |
| Paid in capital | | $735,660,467 |
| Undistributed net investment income | | 6,092,555 |
| Accumulated undistributed net realized gain (loss) on investments | | 22,968,087 |
| Net unrealized appreciation (depreciation) on investments | | 6,484,031 |
| Net Assets | | $771,205,140 |
| Service Class: | | |
| Net Asset Value, offering price and redemption price per share ($56,845 ÷ 5,098 shares) | | $11.15 |
| Service Class 2: | | |
| Net Asset Value, offering price and redemption price per share ($8,494,116 ÷ 764,242 shares) | | $11.11 |
| Investor Class: | | |
| Net Asset Value, offering price and redemption price per share ($762,654,179 ÷ 68,423,627 shares) | | $11.15 |
See accompanying notes which are an integral part of the financial statements.
Statement of Operations
| | | Six months ended June 30, 2018 (Unaudited) |
| Investment Income | | |
| Dividends: | | |
| Unaffiliated issuers | | $28,667 |
| Affiliated issuers | | 6,853,270 |
| Interest | | 1,016 |
| Income from Fidelity Central Funds | | 4,784 |
| Total income | | 6,887,737 |
| Expenses | | |
| Management fee | $971,255 | |
| Distribution and service plan fees | 10,635 | |
| Independent trustees' fees and expenses | 1,683 | |
| Total expenses before reductions | 983,573 | |
| Expense reductions | (199,976) | |
| Total expenses after reductions | | 783,597 |
| Net investment income (loss) | | 6,104,140 |
| Realized and Unrealized Gain (Loss) | | |
| Net realized gain (loss) on: | | |
| Investment securities: | | |
| Unaffiliated issuers | 294,378 | |
| Fidelity Central Funds | 494,067 | |
| Other affiliated issuers | 18,508,021 | |
| Futures contracts | 138,017 | |
| Capital gain distributions from underlying funds: | | |
| Affiliated issuers | 4,012,377 | |
| Total net realized gain (loss) | | 23,446,860 |
| Change in net unrealized appreciation (depreciation) on: | | |
| Investment securities: | | |
| Unaffiliated issuers | (224,237) | |
| Affiliated issuers | (30,588,231) | |
| Futures contracts | 253,458 | |
| Total change in net unrealized appreciation (depreciation) | | (30,559,010) |
| Net gain (loss) | | (7,112,150) |
| Net increase (decrease) in net assets resulting from operations | | $(1,008,010) |
See accompanying notes which are an integral part of the financial statements.
Statement of Changes in Net Assets
| | Six months ended June 30, 2018 (Unaudited) | Year ended December 31, 2017 |
| Increase (Decrease) in Net Assets | | |
| Operations | | |
| Net investment income (loss) | $6,104,140 | $10,609,958 |
| Net realized gain (loss) | 23,446,860 | 32,992,467 |
| Change in net unrealized appreciation (depreciation) | (30,559,010) | 9,275,256 |
| Net increase (decrease) in net assets resulting from operations | (1,008,010) | 52,877,681 |
| Distributions to shareholders from net investment income | (606,201) | (10,031,370) |
| Distributions to shareholders from net realized gain | (30,377,369) | (4,376,254) |
| Total distributions | (30,983,570) | (14,407,624) |
| Share transactions - net increase (decrease) | 17,658,495 | 405,746 |
| Total increase (decrease) in net assets | (14,333,085) | 38,875,803 |
| Net Assets | | |
| Beginning of period | 785,538,225 | 746,662,422 |
| End of period | $771,205,140 | $785,538,225 |
| Other Information | | |
| Undistributed net investment income end of period | $6,092,555 | $594,616 |
See accompanying notes which are an integral part of the financial statements.
Financial Highlights
VIP FundsManager 20% Portfolio Service Class
| | Six months ended (Unaudited) June 30, | Years endedDecember 31, | | | | |
| | 2018 | 2017 | 2016 | 2015 | 2014 | 2013 |
| Selected Per–Share Data | | | | | | |
| Net asset value, beginning of period | $11.63 | $11.04 | $11.02 | $11.51 | $11.33 | $11.10 |
| Income from Investment Operations | | | | | | |
| Net investment income (loss)A | .09 | .16 | .14 | .13 | .15 | .14 |
| Net realized and unrealized gain (loss) | (.11) | .65 | .17 | (.13) | .32 | .47 |
| Total from investment operations | (.02) | .81 | .31 | –B | .47 | .61 |
| Distributions from net investment income | (.01) | (.15) | (.14) | (.13) | (.15) | (.14) |
| Distributions from net realized gain | (.45) | (.07) | (.15) | (.36) | (.15) | (.24) |
| Total distributions | (.46) | (.22) | (.29) | (.49) | (.29)C | (.38) |
| Net asset value, end of period | $11.15 | $11.63 | $11.04 | $11.02 | $11.51 | $11.33 |
| Total ReturnD,E,F | (.15)% | 7.33% | 2.83% | (.03)% | 4.21% | 5.53% |
| Ratios to Average Net AssetsG,H,I | | | | | | |
| Expenses before reductions | .35%J | .35% | .35% | .35% | .35% | .35% |
| Expenses net of fee waivers, if any | .20%J | .20% | .20% | .20% | .20% | .20% |
| Expenses net of all reductions | .20%J | .20% | .20% | .20% | .20% | .20% |
| Net investment income (loss) | 1.57%J | 1.41% | 1.25% | 1.16% | 1.31% | 1.23% |
| Supplemental Data | | | | | | |
| Net assets, end of period (000 omitted) | $57 | $59 | $60 | $62 | $68 | $72 |
| Portfolio turnover rateG,K | 76%J | 61% | 58% | 44% | 28% | 25% |
A Calculated based on average shares outstanding during the period.
B Amount represents less than $.005 per share.
C Total distributions of $.29 per share is comprised of distributions from net investment income of $.147 and distributions from net realized gain of $.147 per share.
D Total returns for periods of less than one year are not annualized.
E Total returns do not reflect charges attributable to your insurance company's separate account. Inclusion of these charges would reduce the total returns shown.
F Total returns would have been lower if certain expenses had not been reduced during the applicable periods shown.
G Amounts do not include the activity of the Underlying Funds.
H Fees and expenses of any underlying Fidelity Central Funds are not included in the Fund's expense ratio. The Fund indirectly bears its proportionate share of the expenses of any underlying Fidelity Central Funds.
I Expense ratios reflect operating expenses of the class. Expenses before reductions do not reflect amounts reimbursed by the investment adviser or reductions from brokerage service arrangements or reductions from other expense offset arrangements and do not represent the amount paid by the class during periods when reimbursements or reductions occur. Expenses net of fee waivers reflect expenses after reimbursement by the investment adviser but prior to reductions from brokerage service arrangements or other expense offset arrangements. Expenses net of all reductions represent the net expenses paid by the class but do not include expenses of the underlying funds in which the Fund invests.
J Annualized
K Amount does not include the portfolio activity of any underlying Fidelity Central Funds.
See accompanying notes which are an integral part of the financial statements.
VIP FundsManager 20% Portfolio Service Class 2
| | Six months ended (Unaudited) June 30, | Years endedDecember 31, | | | | |
| | 2018 | 2017 | 2016 | 2015 | 2014 | 2013 |
| Selected Per–Share Data | | | | | | |
| Net asset value, beginning of period | $11.60 | $11.01 | $11.00 | $11.49 | $11.32 | $11.08 |
| Income from Investment Operations | | | | | | |
| Net investment income (loss)A | .08 | .14 | .12 | .11 | .13 | .12 |
| Net realized and unrealized gain (loss) | (.11) | .65 | .17 | (.12) | .32 | .48 |
| Total from investment operations | (.03) | .79 | .29 | (.01) | .45 | .60 |
| Distributions from net investment income | (.01) | (.13) | (.13) | (.12) | (.13) | (.12) |
| Distributions from net realized gain | (.45) | (.07) | (.15) | (.36) | (.15) | (.24) |
| Total distributions | (.46) | (.20) | (.28) | (.48) | (.28) | (.36) |
| Net asset value, end of period | $11.11 | $11.60 | $11.01 | $11.00 | $11.49 | $11.32 |
| Total ReturnB,C,D | (.24)% | 7.19% | 2.66% | (.17)% | 3.98% | 5.46% |
| Ratios to Average Net AssetsE,F,G | | | | | | |
| Expenses before reductions | .50%H | .50% | .50% | .50% | .50% | .50% |
| Expenses net of fee waivers, if any | .35%H | .35% | .35% | .35% | .35% | .35% |
| Expenses net of all reductions | .35%H | .35% | .35% | .35% | .35% | .35% |
| Net investment income (loss) | 1.42%H | 1.26% | 1.10% | 1.01% | 1.16% | 1.08% |
| Supplemental Data | | | | | | |
| Net assets, end of period (000 omitted) | $8,494 | $8,188 | $7,529 | $1,454 | $1,426 | $1,197 |
| Portfolio turnover rateE,I | 76%H | 61% | 58% | 44% | 28% | 25% |
A Calculated based on average shares outstanding during the period.
B Total returns for periods of less than one year are not annualized.
C Total returns do not reflect charges attributable to your insurance company's separate account. Inclusion of these charges would reduce the total returns shown.
D Total returns would have been lower if certain expenses had not been reduced during the applicable periods shown.
E Amounts do not include the activity of the Underlying Funds.
F Fees and expenses of any underlying Fidelity Central Funds are not included in the Fund's expense ratio. The Fund indirectly bears its proportionate share of the expenses of any underlying Fidelity Central Funds.
G Expense ratios reflect operating expenses of the class. Expenses before reductions do not reflect amounts reimbursed by the investment adviser or reductions from brokerage service arrangements or reductions from other expense offset arrangements and do not represent the amount paid by the class during periods when reimbursements or reductions occur. Expenses net of fee waivers reflect expenses after reimbursement by the investment adviser but prior to reductions from brokerage service arrangements or other expense offset arrangements. Expenses net of all reductions represent the net expenses paid by the class but do not include expenses of the underlying funds in which the Fund invests.
H Annualized
I Amount does not include the portfolio activity of any underlying Fidelity Central Funds.
See accompanying notes which are an integral part of the financial statements.
VIP FundsManager 20% Portfolio Investor Class
| | Six months ended (Unaudited) June 30, | Years endedDecember 31, | | | | |
| | 2018 | 2017 | 2016 | 2015 | 2014 | 2013 |
| Selected Per–Share Data | | | | | | |
| Net asset value, beginning of period | $11.62 | $11.04 | $11.01 | $11.50 | $11.33 | $11.09 |
| Income from Investment Operations | | | | | | |
| Net investment income (loss)A | .09 | .16 | .14 | .13 | .15 | .14 |
| Net realized and unrealized gain (loss) | (.10) | .64 | .18 | (.13) | .31 | .48 |
| Total from investment operations | (.01) | .80 | .32 | –B | .46 | .62 |
| Distributions from net investment income | (.01) | (.15) | (.14) | (.13) | (.15) | (.14) |
| Distributions from net realized gain | (.45) | (.07) | (.15) | (.36) | (.15) | (.24) |
| Total distributions | (.46) | (.22) | (.29) | (.49) | (.29)C | (.38) |
| Net asset value, end of period | $11.15 | $11.62 | $11.04 | $11.01 | $11.50 | $11.33 |
| Total ReturnD,E,F | (.06)% | 7.24% | 2.93% | (.03)% | 4.12% | 5.62% |
| Ratios to Average Net AssetsG,H,I | | | | | | |
| Expenses before reductions | .25%J | .25% | .25% | .25% | .25% | .25% |
| Expenses net of fee waivers, if any | .20%J | .20% | .20% | .20% | .20% | .20% |
| Expenses net of all reductions | .20%J | .20% | .20% | .20% | .20% | .20% |
| Net investment income (loss) | 1.57%J | 1.41% | 1.25% | 1.16% | 1.31% | 1.23% |
| Supplemental Data | | | | | | |
| Net assets, end of period (000 omitted) | $762,654 | $777,291 | $739,074 | $732,911 | $760,583 | $694,546 |
| Portfolio turnover rateG,K | 76%J | 61% | 58% | 44% | 28% | 25% |
A Calculated based on average shares outstanding during the period.
B Amount represents less than $.005 per share.
C Total distributions of $.29 per share is comprised of distributions from net investment income of $.147 and distributions from net realized gain of $.147 per share.
D Total returns for periods of less than one year are not annualized.
E Total returns do not reflect charges attributable to your insurance company's separate account. Inclusion of these charges would reduce the total returns shown.
F Total returns would have been lower if certain expenses had not been reduced during the applicable periods shown.
G Amounts do not include the activity of the Underlying Funds.
H Fees and expenses of any underlying Fidelity Central Funds are not included in the Fund's expense ratio. The Fund indirectly bears its proportionate share of the expenses of any underlying Fidelity Central Funds.
I Expense ratios reflect operating expenses of the class. Expenses before reductions do not reflect amounts reimbursed by the investment adviser or reductions from brokerage service arrangements or reductions from other expense offset arrangements and do not represent the amount paid by the class during periods when reimbursements or reductions occur. Expenses net of fee waivers reflect expenses after reimbursement by the investment adviser but prior to reductions from brokerage service arrangements or other expense offset arrangements. Expenses net of all reductions represent the net expenses paid by the class but do not include expenses of the underlying funds in which the Fund invests.
J Annualized
K Amount does not include the portfolio activity of any underlying Fidelity Central Funds.
See accompanying notes which are an integral part of the financial statements.
VIP FundsManager® 50% Portfolio
Investment Summary (Unaudited)
The information in the following tables is based on the direct investments of the Fund.
Top Holdings as of June 30, 2018
| | % of fund's net assets |
| Fidelity U.S. Bond Index Fund Institutional Premium Class | 34.4 |
| Fidelity Stock Selector All Cap Fund | 29.0 |
| Fidelity Overseas Fund | 4.2 |
| Fidelity Inflation-Protected Bond Index Fund Institutional Premium Class | 4.1 |
| Fidelity Investments Money Market Prime Reserves Portfolio - Institutional Class 2.09% | 3.9 |
| Fidelity Mega Cap Stock Fund | 2.2 |
| Fidelity Long-Term Treasury Bond Index Fund Institutional Class | 1.9 |
| Fidelity Diversified International Fund | 1.6 |
| Fidelity Contrafund | 1.5 |
| Fidelity Equity-Income Fund | 1.5 |
| | 84.3 |
Asset Allocation (% of fund's net assets)
| Period end* |
| | Domestic Equity Funds | 39.3% |
| | International Equity Funds | 13.3% |
| | Bond Funds | 41.9% |
| | Short-Term Funds | 5.4% |
| | Short-Term Investments | 0.1% |

* Futures - (1.7)%
VIP FundsManager® 50% Portfolio
Schedule of Investments June 30, 2018 (Unaudited)
Showing Percentage of Net Assets
| Equity Funds - 52.6% | | | |
| | | Shares | Value |
| Fidelity Commodity Strategy Fund (a) | | 2,721,148 | $28,653,683 |
| Fidelity Contrafund (a) | | 741,160 | 97,884,949 |
| Fidelity Diversified International Fund (a) | | 2,576,453 | 100,378,620 |
| Fidelity Emerging Asia Fund (a) | | 126,810 | 5,447,743 |
| Fidelity Emerging Markets Discovery Fund (a) | | 685,711 | 9,846,805 |
| Fidelity Emerging Markets Fund (a) | | 459,969 | 14,088,840 |
| Fidelity Equity-Income Fund (a) | | 1,674,342 | 96,425,371 |
| Fidelity Europe Fund (a) | | 931,269 | 37,846,789 |
| Fidelity Global Commodity Stock Fund (a) | | 5,241,356 | 71,596,916 |
| Fidelity International Capital Appreciation Fund (a) | | 1,136,153 | 23,734,229 |
| Fidelity International Discovery Fund (a) | | 1,880,990 | 83,271,422 |
| Fidelity International Enhanced Index Fund (a) | | 7,821,546 | 77,042,225 |
| Fidelity International Small Cap Fund (a) | | 1,254,056 | 36,555,729 |
| Fidelity International Small Cap Opportunities Fund (a) | | 2,049,206 | 39,672,620 |
| Fidelity International Value Fund (a) | | 6,174,764 | 53,349,958 |
| Fidelity Japan Smaller Companies Fund (a) | | 4,200,758 | 77,798,043 |
| Fidelity Low-Priced Stock Fund (a) | | 1,746,784 | 96,073,111 |
| Fidelity Mega Cap Stock Fund (a) | | 8,198,577 | 143,639,068 |
| Fidelity Overseas Fund (a) | | 5,359,094 | 266,829,304 |
| Fidelity Pacific Basin Fund (a) | | 593,452 | 20,313,865 |
| Fidelity Real Estate Investment Portfolio (a) | | 369,067 | 15,600,483 |
| Fidelity Stock Selector All Cap Fund (a) | | 40,368,536 | 1,857,356,354 |
| Fidelity Value Discovery Fund (a) | | 1,691,334 | 48,000,068 |
| iShares S&P 500 Index ETF | | 253,448 | 69,203,976 |
| TOTAL EQUITY FUNDS | | | |
| (Cost $3,162,885,006) | | | 3,370,610,171 |
|
| Fixed-Income Funds - 41.9% | | | |
| Fidelity Floating Rate High Income Fund (a) | | 6,681,804 | 64,078,500 |
| Fidelity Inflation-Protected Bond Index Fund Institutional Premium Class (a) | | 26,601,659 | 261,228,292 |
| Fidelity Long-Term Treasury Bond Index Fund Institutional Class (a) | | 9,836,423 | 124,922,570 |
| Fidelity New Markets Income Fund (a) | | 2,003,284 | 29,848,937 |
| Fidelity U.S. Bond Index Fund Institutional Premium Class (a) | | 196,309,999 | 2,206,524,392 |
| TOTAL FIXED-INCOME FUNDS | | | |
| (Cost $2,737,754,082) | | | 2,686,602,691 |
|
| Money Market Funds - 5.4% | | | |
| Fidelity Cash Central Fund, 1.93% (b) | | 8,249,306 | 8,250,956 |
| Fidelity Investments Money Market Government Portfolio Institutional Class 1.81% (a)(c) | | 89,111,641 | 89,111,641 |
| Fidelity Investments Money Market Prime Reserves Portfolio - Institutional Class 2.09% (a)(c) | | 246,169,811 | 246,243,662 |
| TOTAL MONEY MARKET FUNDS | | | |
| (Cost $343,581,633) | | | 343,606,259 |
| | | Principal Amount | Value |
|
| U.S. Treasury Obligations - 0.1% | | | |
| U.S. Treasury Bills, yield at date of purchase 1.88% to 1.9% 8/16/18 to 9/20/18 (d) | | | |
| (Cost $5,294,796) | | 5,310,000 | 5,295,352 |
| TOTAL INVESTMENT IN SECURITIES - 100.0% | | | |
| (Cost $6,249,515,517) | | | 6,406,114,473 |
| NET OTHER ASSETS (LIABILITIES) - 0.0% | | | (3,011,082) |
| NET ASSETS - 100% | | | $6,403,103,391 |
| Futures Contracts | | | | | |
| | Number of contracts | Expiration Date | Notional Amount | Value | Unrealized Appreciation/(Depreciation) |
| Sold | | | | | |
| Equity Index Contracts | | | | | |
| ICE E-mini MSCI EAFE Index Contracts (United States) | 964 | Sept. 2018 | $94,250,280 | $2,841,086 | $2,841,086 |
| ICE E-mini MSCI Emerging Markets Index Contracts (United States) | 314 | Sept. 2018 | 16,693,810 | 1,085,489 | 1,085,489 |
| TOTAL FUTURES CONTRACTS | | | | | $3,926,575 |
The notional amount of futures sold as a percentage of Net Assets is 1.7%
Security Type Abbreviations
ETF – Exchange-Traded Fund
Legend
(a) Affiliated Fund
(b) Affiliated fund that is generally available only to investment companies and other accounts managed by Fidelity Investments. The rate quoted is the annualized seven-day yield of the fund at period end. A complete unaudited listing of the fund's holdings as of its most recent quarter end is available upon request. In addition, each Fidelity Central Fund's financial statements are available on the SEC's website or upon request.
(c) The rate quoted is the annualized seven-day yield of the fund at period end.
(d) Security or a portion of the security was pledged to cover margin requirements for futures contracts. At period end, the value of securities pledged amounted to $5,295,352.
Affiliated Central Funds
Information regarding fiscal year to date income earned by the Fund from investments in Fidelity Central Funds is as follows:
| Fund | Income earned |
| Fidelity Cash Central Fund | $28,896 |
| Total | $28,896 |
Amounts in the income column in the above table include any capital gain distributions from underlying funds, which are presented in the corresponding line-item in the Statement of Operations if applicable.
Fiscal year to date information regarding the Fund’s investments in non-Money Market Central Funds, including the ownership percentage, is presented below.
| Affiliate | Value, beginning of period | Purchases(a) | Sales Proceeds(a) | Realized Gain (loss) | Change in Unrealized appreciation (depreciation) | Value, end of period | % ownership, end of period |
| Fidelity Consumer Discretionary Central Fund | $-- | $189,203,265 | $190,770,242 | $1,566,977 | $-- | $-- | 0.0% |
| Fidelity Consumer Staples Central Fund | -- | 104,325,190 | 105,207,984 | 882,794 | -- | -- | 0.0% |
| Fidelity Energy Central Fund | -- | 89,827,001 | 90,756,150 | 929,149 | -- | -- | 0.0% |
| Fidelity Financials Central Fund | -- | 274,408,628 | 275,799,301 | 1,390,673 | -- | -- | 0.0% |
| Fidelity Health Care Central Fund | -- | 239,542,218 | 240,333,599 | 791,381 | -- | -- | 0.0% |
| Fidelity Industrials Central Fund | -- | 181,252,381 | 183,072,913 | 1,820,532 | -- | -- | 0.0% |
| Fidelity Information Technology Central Fund | -- | 444,657,410 | 446,274,025 | 1,616,615 | -- | -- | 0.0% |
| Fidelity Materials Central Fund | -- | 54,198,352 | 54,755,890 | 557,538 | -- | -- | 0.0% |
| Fidelity Telecom Services Central Fund | -- | 25,256,683 | 25,625,022 | 368,339 | -- | -- | 0.0% |
| Fidelity Utilities Central Fund | -- | 43,898,700 | 44,453,359 | 554,659 | -- | -- | 0.0% |
| | $-- | $1,646,569,828 | $1,657,048,485 | $10,478,657 | $-- | $-- | |
(a) Includes the value of shares purchased or redeemed through in-kind transactions, if applicable. See the Notes to Financial Statements for additional details.
Amounts in the income column in the above table include any capital gain distributions from underlying funds, which are presented in the corresponding line-item in the Statement of Operations if applicable.
Affiliated Underlying Funds
Fiscal year to date information regarding the Fund's investments in affiliated Underlying Funds, excluding any Money Market Central Funds, is presented below. Exchanges between classes of the same affiliated Underlying Funds may occur.
| Affiliate | Value, beginning of period | Purchases(a) | Sales Proceeds(a) | Dividend Income | Realized Gain (loss) | Change in Unrealized appreciation (depreciation) | Value, end of period |
| Fidelity Air Transportation Portfolio | $14,747,470 | $751,251 | $13,969,681 | $750,313 | $55,704 | $(1,584,744) | $-- |
| Fidelity Banking Portfolio | 34,638,556 | 2,514,773 | 34,599,047 | 2,512,353 | 15,286,931 | (17,841,213) | -- |
| Fidelity Biotechnology Portfolio | 19,549,696 | 764,331 | 20,219,680 | 762,909 | 3,525,188 | (3,619,535) | -- |
| Fidelity Brokerage and Investment Management Portfolio | 7,804,487 | 366,055 | 7,843,927 | 365,540 | 855,351 | (1,181,966) | -- |
| Fidelity Chemicals Portfolio | 7,337,432 | 414,799 | 6,959,082 | 414,329 | 3,131,282 | (3,924,431) | -- |
| Fidelity Commodity Strategy Fund | 66,593,972 | 7,535,432 | 45,160,590 | -- | 138,212 | (453,343) | 28,653,683 |
| Fidelity Construction and Housing Portfolio | 11,092,599 | 492,810 | 10,251,085 | 492,129 | 3,790,902 | (5,125,226) | -- |
| Fidelity Consumer Discretionary Portfolio | 153,712,647 | 6,143,735 | 161,668,800 | 2,533,150 | 44,083,902 | (42,271,484) | -- |
| Fidelity Consumer Staples Portfolio | 112,465,179 | 7,651,857 | 107,231,720 | 6,444,629 | 4,271,866 | (17,157,182) | -- |
| Fidelity Contrafund | 81,685,393 | 16,545,653 | 7,318,733 | 1,378,295 | 50,618 | 6,922,018 | 97,884,949 |
| Fidelity Defense and Aerospace Portfolio | 50,734,762 | 1,525,354 | 54,572,294 | 1,521,965 | 16,156,114 | (13,843,936) | -- |
| Fidelity Diversified International Fund | 119,653,990 | 66,188 | 16,663,059 | -- | 1,518,243 | (4,196,742) | 100,378,620 |
| Fidelity Emerging Asia Fund | 10,085,110 | 1,669 | 4,437,124 | -- | 1,492,763 | (1,694,675) | 5,447,743 |
| Fidelity Emerging Markets Discovery Fund | 18,037,291 | 2,973 | 7,816,815 | -- | 416,557 | (793,201) | 9,846,805 |
| Fidelity Emerging Markets Fund | 74,534,500 | 611,716 | 61,116,976 | -- | 4,552,192 | (4,492,592) | 14,088,840 |
| Fidelity Energy Portfolio | 90,149,858 | 1,605,856 | 92,162,070 | -- | 8,103,954 | (7,697,598) | -- |
| Fidelity Equity-Income Fund | 94,272,283 | 12,220,155 | 5,117,982 | 2,553,549 | (60,562) | (4,888,523) | 96,425,371 |
| Fidelity Europe Fund | 45,709,460 | 25,431 | 6,328,756 | -- | 894,316 | (2,453,662) | 37,846,789 |
| Fidelity Financial Services Portfolio | 179,831,845 | 8,169,736 | 181,813,452 | 4,257,473 | 52,131,482 | (58,319,611) | -- |
| Fidelity Floating Rate High Income Fund | 66,515,556 | 1,392,234 | 3,633,927 | 1,346,684 | 12,113 | (207,476) | 64,078,500 |
| Fidelity Global Commodity Stock Fund | 68,904,073 | 3,335,433 | 3,260,590 | -- | 106,570 | 2,511,430 | 71,596,916 |
| Fidelity Health Care Portfolio | 190,274,554 | 11,183,736 | 208,074,825 | 6,970,311 | 44,110,297 | (37,493,762) | -- |
| Fidelity Industrial Equipment Portfolio | 36,202,251 | 4,548,434 | 213,665 | 4,546,758 | 7,106 | (7,917,047) | -- |
| Fidelity Industrials Portfolio | 69,739,946 | 7,135,281 | 106,836,133 | 4,328,229 | 19,789,434 | (22,455,607) | -- |
| Fidelity Inflation-Protected Bond Index Fund Institutional Premium Class | 230,269,258 | 44,412,526 | 13,534,805 | 335,480 | (216,259) | 297,572 | 261,228,292 |
| Fidelity Insurance Portfolio | 18,878,213 | 2,163,836 | 18,318,298 | 2,162,550 | 6,184,139 | (8,907,890) | -- |
| Fidelity International Capital Appreciation Fund | 27,646,304 | 15,265 | 3,779,255 | -- | 674,466 | (822,551) | 23,734,229 |
| Fidelity International Discovery Fund | 99,518,789 | 54,626 | 13,794,533 | -- | (177,271) | (2,330,189) | 83,271,422 |
| Fidelity International Enhanced Index Fund | 92,140,913 | 51,363 | 12,912,001 | -- | (57,842) | (2,180,208) | 77,042,225 |
| Fidelity International Small Cap Fund | 53,335,370 | 28,724 | 16,021,296 | -- | 3,180,485 | (3,967,554) | 36,555,729 |
| Fidelity International Small Cap Opportunities Fund | 49,520,645 | 26,387 | 10,219,584 | -- | 2,594,539 | (2,249,367) | 39,672,620 |
| Fidelity International Value Fund | 65,028,668 | 36,098 | 9,132,746 | -- | (29,333) | (2,552,729) | 53,349,958 |
| Fidelity Investments Money Market Government Portfolio Institutional Class 1.81% | 153,462,044 | 200,114,193 | 264,464,596 | 1,291,857 | -- | -- | 89,111,641 |
| Fidelity Investments Money Market Prime Reserves Portfolio – Institutional Class 2.09% | 273,777,011 | 84,218,511 | 111,776,477 | 2,163,251 | (9) | 24,626 | 246,243,662 |
| Fidelity Japan Smaller Companies Fund | 61,436,651 | 19,448,338 | 1,021,899 | -- | 23,083 | (2,088,130) | 77,798,043 |
| Fidelity Leisure Portfolio | 10,502,583 | 550,622 | 10,450,420 | 549,958 | (174,800) | (427,985) | -- |
| Fidelity Long-Term Treasury Bond Index Fund Institutional Class | 120,234,118 | 16,437,204 | 6,721,610 | 1,752,492 | (269,666) | (4,757,476) | 124,922,570 |
| Fidelity Low-Priced Stock Fund | 95,296,782 | 5,865,802 | 5,917,177 | -- | 37,068 | 790,636 | 96,073,111 |
| Fidelity Materials Portfolio | 50,059,868 | 3,238,276 | 48,786,422 | 2,334,900 | (4,621,715) | 109,993 | -- |
| Fidelity Medical Equipment and Systems Portfolio | 16,529,722 | 704,819 | 17,694,832 | 703,670 | 4,075,657 | (3,615,366) | -- |
| Fidelity Mega Cap Stock Fund | 141,648,822 | 9,598,801 | 8,377,101 | -- | 13,413 | 755,133 | 143,639,068 |
| Fidelity Multimedia Portfolio | 12,580,033 | 670,194 | 12,017,202 | 669,392 | (646,345) | (586,680) | -- |
| Fidelity New Markets Income Fund | 33,617,791 | 728,330 | 1,816,993 | 705,486 | (87,061) | (2,593,130) | 29,848,937 |
| Fidelity Overseas Fund | 414,602,655 | 228,175 | 142,708,479 | -- | 12,955,184 | (18,248,231) | 266,829,304 |
| Fidelity Pacific Basin Fund | 24,346,923 | 13,413 | 3,323,890 | -- | (30,209) | (692,372) | 20,313,865 |
| Fidelity Real Estate Investment Portfolio | 55,213,638 | 3,649,681 | 40,286,680 | 141,380 | (4,367,192) | 1,391,036 | 15,600,483 |
| Fidelity Stock Selector All Cap Fund | -- | 1,875,671,637 | 56,571,033 | -- | (268,023) | 38,523,773 | 1,857,356,354 |
| Fidelity Technology Portfolio | 421,603,033 | 48,039,443 | 456,610,906 | 42,509,726 | 115,669,419 | (128,700,989) | -- |
| Fidelity Telecommunications Portfolio | 26,241,468 | 1,374,406 | 25,991,496 | 372,619 | (1,854,857) | 230,479 | -- |
| Fidelity Transportation Portfolio | 11,140,085 | 504,449 | 10,629,017 | 503,768 | 762,213 | (1,777,730) | -- |
| Fidelity U.S. Bond Index Fund Institutional Premium Class | 2,245,883,377 | 372,296,673 | 343,189,453 | 29,498,752 | (11,993,820) | (56,472,385) | 2,206,524,392 |
| Fidelity Utilities Portfolio | 43,697,149 | 1,407,877 | 45,155,455 | 204,758 | 1,814,139 | (1,763,710) | -- |
| Fidelity Value Discovery Fund | 47,348,530 | 4,133,040 | 2,568,091 | -- | (3,235) | (910,176) | 48,000,068 |
| | $6,519,833,353 | $2,790,687,601 | $2,881,061,760 | $127,078,655 | $347,606,703 | $(453,701,708) | $6,323,364,189 |
(a) Includes the value of shares purchased or redeemed through in-kind transactions, if applicable. See the Notes to Financial Statements for additional details.
Amounts in the income column in the above table include any capital gain distributions from underlying funds, which are presented in the corresponding line-item in the Statement of Operations if applicable.
Investment Valuation
The following is a summary of the inputs used, as of June 30, 2018, involving the Fund's assets and liabilities carried at fair value. The inputs or methodology used for valuing securities may not be an indication of the risk associated with investing in those securities. For more information on valuation inputs, and their aggregation into the levels used below, please refer to the Investment Valuation section in the accompanying Notes to Financial Statements.
| | Valuation Inputs at Reporting Date: |
| Description | Total | Level 1 | Level 2 | Level 3 |
| Investments in Securities: | | | | |
| Equity Funds | $3,370,610,171 | $3,370,610,171 | $-- | $-- |
| Fixed-Income Funds | 2,686,602,691 | 2,686,602,691 | -- | -- |
| Money Market Funds | 343,606,259 | 343,606,259 | -- | -- |
| Other Short-Term Investments and Net Other Assets | 5,295,352 | -- | 5,295,352 | -- |
| Total Investments in Securities: | $6,406,114,473 | $6,400,819,121 | $5,295,352 | $-- |
| Derivative Instruments: | | | | |
| Assets | | | | |
| Futures Contracts | $3,926,575 | $3,926,575 | $-- | $-- |
| Total Assets | $3,926,575 | $3,926,575 | $-- | $-- |
| Total Derivative Instruments: | $3,926,575 | $3,926,575 | $-- | $-- |
Value of Derivative Instruments
The following table is a summary of the Fund's value of derivative instruments by primary risk exposure as of June 30, 2018. For additional information on derivative instruments, please refer to the Derivative Instruments section in the accompanying Notes to Financial Statements.
| Primary Risk Exposure / Derivative Type | Value |
| | Asset | Liability |
| Equity Risk | | |
| Futures Contracts(a) | $3,926,575 | $0 |
| Total Equity Risk | 3,926,575 | 0 |
| Total Value of Derivatives | $3,926,575 | $0 |
(a) Reflects gross cumulative appreciation (depreciation) on futures contracts as presented in the Schedule of Investments. In the Statement of Assets and Liabilities, the period end daily variation margin is included in receivable or payable for daily variation margin on futures contracts, and the net cumulative appreciation (depreciation) is included in net unrealized appreciation (depreciation).
See accompanying notes which are an integral part of the financial statements.
VIP FundsManager® 50% Portfolio
Financial Statements
Statement of Assets and Liabilities
| | | June 30, 2018 (Unaudited) |
| Assets | | |
Investment in securities, at value — See accompanying schedule:
Unaffiliated issuers (cost $71,331,820) | $74,499,328 | |
| Fidelity Central Funds (cost $8,250,956) | 8,250,956 | |
| Other affiliated issuers (cost $6,169,932,741) | 6,323,364,189 | |
| Total Investment in Securities (cost $6,249,515,517) | | $6,406,114,473 |
| Receivable for investments sold | | 26,004 |
| Receivable for fund shares sold | | 1,421,411 |
| Dividends receivable | | 324,721 |
| Distributions receivable from Fidelity Central Funds | | 7,263 |
| Other receivables | | 4,652 |
| Total assets | | 6,407,898,524 |
| Liabilities | | |
| Payable for investments purchased | $1,409,563 | |
| Payable for fund shares redeemed | 1,410,655 | |
| Accrued management fee | 1,079,044 | |
| Distribution and service plan fees payable | 12,561 | |
| Payable for daily variation margin on futures contracts | 883,310 | |
| Total liabilities | | 4,795,133 |
| Net Assets | | $6,403,103,391 |
| Net Assets consist of: | | |
| Paid in capital | | $5,761,098,835 |
| Undistributed net investment income | | 33,047,897 |
| Accumulated undistributed net realized gain (loss) on investments | | 448,431,128 |
| Net unrealized appreciation (depreciation) on investments | | 160,525,531 |
| Net Assets | | $6,403,103,391 |
| Service Class: | | |
| Net Asset Value, offering price and redemption price per share ($60,244 ÷ 4,753 shares) | | $12.67 |
| Service Class 2: | | |
| Net Asset Value, offering price and redemption price per share ($99,847,399 ÷ 7,911,689 shares) | | $12.62 |
| Investor Class: | | |
| Net Asset Value, offering price and redemption price per share ($6,303,195,748 ÷ 497,462,754 shares) | | $12.67 |
See accompanying notes which are an integral part of the financial statements.
Statement of Operations
| | | Six months ended June 30, 2018 (Unaudited) |
| Investment Income | | |
| Dividends: | | |
| Unaffiliated issuers | | $636,084 |
| Affiliated issuers | | 39,263,683 |
| Interest | | 17,732 |
| Income from Fidelity Central Funds | | 28,896 |
| Total income | | 39,946,395 |
| Expenses | | |
| Management fee | $8,212,894 | |
| Distribution and service plan fees | 125,269 | |
| Independent trustees' fees and expenses | 14,291 | |
| Total expenses before reductions | 8,352,454 | |
| Expense reductions | (1,711,962) | |
| Total expenses after reductions | | 6,640,492 |
| Net investment income (loss) | | 33,305,903 |
| Realized and Unrealized Gain (Loss) | | |
| Net realized gain (loss) on: | | |
| Investment securities: | | |
| Unaffiliated issuers | 5,226,856 | |
| Fidelity Central Funds | 10,478,657 | |
| Other affiliated issuers | 347,606,703 | |
| Futures contracts | 905,723 | |
| Capital gain distributions from underlying funds: | | |
| Affiliated issuers | 87,814,972 | |
| Total net realized gain (loss) | | 452,032,911 |
| Change in net unrealized appreciation (depreciation) on: | | |
| Investment securities: | | |
| Unaffiliated issuers | (2,989,667) | |
| Affiliated issuers | (453,701,708) | |
| Futures contracts | 3,926,575 | |
| Total change in net unrealized appreciation (depreciation) | | (452,764,800) |
| Net gain (loss) | | (731,889) |
| Net increase (decrease) in net assets resulting from operations | | $32,574,014 |
See accompanying notes which are an integral part of the financial statements.
Statement of Changes in Net Assets
| | Six months ended June 30, 2018 (Unaudited) | Year ended December 31, 2017 |
| Increase (Decrease) in Net Assets | | |
| Operations | | |
| Net investment income (loss) | $33,305,903 | $79,301,919 |
| Net realized gain (loss) | 452,032,911 | 495,314,605 |
| Change in net unrealized appreciation (depreciation) | (452,764,800) | 304,741,713 |
| Net increase (decrease) in net assets resulting from operations | 32,574,014 | 879,358,237 |
| Distributions to shareholders from net investment income | (4,415,137) | (75,263,279) |
| Distributions to shareholders from net realized gain | (445,438,267) | (40,613,695) |
| Total distributions | (449,853,404) | (115,876,974) |
| Share transactions - net increase (decrease) | 96,324,388 | (310,047,364) |
| Total increase (decrease) in net assets | (320,955,002) | 453,433,899 |
| Net Assets | | |
| Beginning of period | 6,724,058,393 | 6,270,624,494 |
| End of period | $6,403,103,391 | $6,724,058,393 |
| Other Information | | |
| Undistributed net investment income end of period | $33,047,897 | $4,157,131 |
See accompanying notes which are an integral part of the financial statements.
Financial Highlights
VIP FundsManager 50% Portfolio Service Class
| | Six months ended (Unaudited) June 30, | Years endedDecember 31, | | | | |
| | 2018 | 2017 | 2016 | 2015 | 2014 | 2013 |
| Selected Per–Share Data | | | | | | |
| Net asset value, beginning of period | $13.53 | $12.03 | $11.85 | $12.39 | $12.01 | $10.62 |
| Income from Investment Operations | | | | | | |
| Net investment income (loss)A | .07 | .16 | .15 | .15 | .17 | .15 |
| Net realized and unrealized gain (loss) | (.01) | 1.58 | .35 | (.13) | .45 | 1.42 |
| Total from investment operations | .06 | 1.74 | .50 | .02 | .62 | 1.57 |
| Distributions from net investment income | (.01) | (.15) | (.15) | (.14) | (.14) | (.12) |
| Distributions from net realized gain | (.91) | (.08) | (.16) | (.42) | (.10) | (.07) |
| Total distributions | (.92) | (.24)B | (.32)C | (.56) | (.24) | (.18)D |
| Net asset value, end of period | $12.67 | $13.53 | $12.03 | $11.85 | $12.39 | $12.01 |
| Total ReturnE,F,G | .43% | 14.45% | 4.31% | .06% | 5.18% | 14.79% |
| Ratios to Average Net AssetsH,I,J | | | | | | |
| Expenses before reductions | .35%K | .35% | .35% | .35% | .35% | .35% |
| Expenses net of fee waivers, if any | .20%K | .20% | .20% | .20% | .20% | .20% |
| Expenses net of all reductions | .20%K | .20% | .20% | .20% | .20% | .20% |
| Net investment income (loss) | 1.01%K | 1.21% | 1.26% | 1.19% | 1.38% | 1.33% |
| Supplemental Data | | | | | | |
| Net assets, end of period (000 omitted) | $60 | $64 | $62 | $64 | $73 | $80 |
| Portfolio turnover rateH,L | 135%K | 47% | 40% | 24% | 25% | 15% |
A Calculated based on average shares outstanding during the period.
B Total distributions of $.24 per share is comprised of distributions from net investment income of $.154 and distributions from net realized gain of $.083 per share.
C Total distributions of $.32 per share is comprised of distributions from net investment income of $.152 and distributions from net realized gain of $.164 per share.
D Total distributions of $.18 per share is comprised of distributions from net investment income of $.115 and distributions from net realized gain of $.065 per share.
E Total returns for periods of less than one year are not annualized.
F Total returns do not reflect charges attributable to your insurance company's separate account. Inclusion of these charges would reduce the total returns shown.
G Total returns would have been lower if certain expenses had not been reduced during the applicable periods shown.
H Amounts do not include the activity of the Underlying Funds.
I Fees and expenses of any underlying Fidelity Central Funds are not included in the Fund's expense ratio. The Fund indirectly bears its proportionate share of the expenses of any underlying Fidelity Central Funds.
J Expense ratios reflect operating expenses of the class. Expenses before reductions do not reflect amounts reimbursed by the investment adviser or reductions from brokerage service arrangements or reductions from other expense offset arrangements and do not represent the amount paid by the class during periods when reimbursements or reductions occur. Expenses net of fee waivers reflect expenses after reimbursement by the investment adviser but prior to reductions from brokerage service arrangements or other expense offset arrangements. Expenses net of all reductions represent the net expenses paid by the class but do not include expenses of the underlying funds in which the Fund invests.
K Annualized
L Amount does not include the portfolio activity of any underlying Fidelity Central Funds.
See accompanying notes which are an integral part of the financial statements.
VIP FundsManager 50% Portfolio Service Class 2
| | Six months ended (Unaudited) June 30, | Years endedDecember 31, | | | | |
| | 2018 | 2017 | 2016 | 2015 | 2014 | 2013 |
| Selected Per–Share Data | | | | | | |
| Net asset value, beginning of period | $13.48 | $11.99 | $11.82 | $12.35 | $11.98 | $10.59 |
| Income from Investment Operations | | | | | | |
| Net investment income (loss)A | .06 | .14 | .13 | .13 | .15 | .13 |
| Net realized and unrealized gain (loss) | –B | 1.57 | .34 | (.12) | .44 | 1.42 |
| Total from investment operations | .06 | 1.71 | .47 | .01 | .59 | 1.55 |
| Distributions from net investment income | (.01) | (.13) | (.13) | (.12) | (.12) | (.10) |
| Distributions from net realized gain | (.91) | (.08) | (.16) | (.42) | (.10) | (.07) |
| Total distributions | (.92) | (.22)C | (.30)D | (.54) | (.22) | (.16)E |
| Net asset value, end of period | $12.62 | $13.48 | $11.99 | $11.82 | $12.35 | $11.98 |
| Total ReturnF,G,H | .43% | 14.24% | 4.08% | (.02)% | 4.95% | 14.66% |
| Ratios to Average Net AssetsI,J,K | | | | | | |
| Expenses before reductions | .50%L | .50% | .50% | .50% | .50% | .50% |
| Expenses net of fee waivers, if any | .35%L | .35% | .35% | .35% | .35% | .35% |
| Expenses net of all reductions | .35%L | .35% | .35% | .35% | .35% | .35% |
| Net investment income (loss) | .86%L | 1.06% | 1.11% | 1.04% | 1.23% | 1.18% |
| Supplemental Data | | | | | | |
| Net assets, end of period (000 omitted) | $99,847 | $100,867 | $90,983 | $83,447 | $88,771 | $89,164 |
| Portfolio turnover rateI,M | 135%L | 47% | 40% | 24% | 25% | 15% |
A Calculated based on average shares outstanding during the period.
B Amount represents less than $.005 per share.
C Total distributions of $.22 per share is comprised of distributions from net investment income of $.134 and distributions from net realized gain of $.083 per share.
D Total distributions of $.30 per share is comprised of distributions from net investment income of $.134 and distributions from net realized gain of $.164 per share.
E Total distributions of $.16 per share is comprised of distributions from net investment income of $.097 and distributions from net realized gain of $.065 per share.
F Total returns for periods of less than one year are not annualized.
G Total returns do not reflect charges attributable to your insurance company's separate account. Inclusion of these charges would reduce the total returns shown.
H Total returns would have been lower if certain expenses had not been reduced during the applicable periods shown.
I Amounts do not include the activity of the Underlying Funds.
J Fees and expenses of any underlying Fidelity Central Funds are not included in the Fund's expense ratio. The Fund indirectly bears its proportionate share of the expenses of any underlying Fidelity Central Funds.
K Expense ratios reflect operating expenses of the class. Expenses before reductions do not reflect amounts reimbursed by the investment adviser or reductions from brokerage service arrangements or reductions from other expense offset arrangements and do not represent the amount paid by the class during periods when reimbursements or reductions occur. Expenses net of fee waivers reflect expenses after reimbursement by the investment adviser but prior to reductions from brokerage service arrangements or other expense offset arrangements. Expenses net of all reductions represent the net expenses paid by the class but do not include expenses of the underlying funds in which the Fund invests.
L Annualized
M Amount does not include the portfolio activity of any underlying Fidelity Central Funds.
See accompanying notes which are an integral part of the financial statements.
VIP FundsManager 50% Portfolio Investor Class
| | Six months ended (Unaudited) June 30, | Years endedDecember 31, | | | | |
| | 2018 | 2017 | 2016 | 2015 | 2014 | 2013 |
| Selected Per–Share Data | | | | | | |
| Net asset value, beginning of period | $13.52 | $12.02 | $11.85 | $12.38 | $12.01 | $10.61 |
| Income from Investment Operations | | | | | | |
| Net investment income (loss)A | .07 | .16 | .15 | .15 | .17 | .15 |
| Net realized and unrealized gain (loss) | –B | 1.58 | .34 | (.12) | .44 | 1.43 |
| Total from investment operations | .07 | 1.74 | .49 | .03 | .61 | 1.58 |
| Distributions from net investment income | (.01) | (.15) | (.15) | (.14) | (.14) | (.12) |
| Distributions from net realized gain | (.91) | (.08) | (.16) | (.42) | (.10) | (.07) |
| Total distributions | (.92) | (.24)C | (.32)D | (.56) | (.24) | (.18)E |
| Net asset value, end of period | $12.67 | $13.52 | $12.02 | $11.85 | $12.38 | $12.01 |
| Total ReturnF,G,H | .51% | 14.46% | 4.22% | .14% | 5.10% | 14.90% |
| Ratios to Average Net AssetsI,J,K | | | | | | |
| Expenses before reductions | .25%L | .25% | .25% | .25% | .25% | .25% |
| Expenses net of fee waivers, if any | .20%L | .20% | .20% | .20% | .20% | .20% |
| Expenses net of all reductions | .20%L | .20% | .20% | .20% | .20% | .20% |
| Net investment income (loss) | 1.01%L | 1.21% | 1.26% | 1.19% | 1.38% | 1.33% |
| Supplemental Data | | | | | | |
| Net assets, end of period (000 omitted) | $6,303,196 | $6,623,127 | $6,179,579 | $6,046,146 | $5,085,755 | $3,319,291 |
| Portfolio turnover rateI,M | 135%L | 47% | 40% | 24% | 25% | 15% |
A Calculated based on average shares outstanding during the period.
B Amount represents less than $.005 per share.
C Total distributions of $.24 per share is comprised of distributions from net investment income of $.154 and distributions from net realized gain of $.083 per share.
D Total distributions of $.32 per share is comprised of distributions from net investment income of $.152 and distributions from net realized gain of $.164 per share.
E Total distributions of $.18 per share is comprised of distributions from net investment income of $.115 and distributions from net realized gain of $.065 per share.
F Total returns for periods of less than one year are not annualized.
G Total returns do not reflect charges attributable to your insurance company's separate account. Inclusion of these charges would reduce the total returns shown.
H Total returns would have been lower if certain expenses had not been reduced during the applicable periods shown.
I Amounts do not include the activity of the Underlying Funds.
J Fees and expenses of any underlying Fidelity Central Funds are not included in the Fund's expense ratio. The Fund indirectly bears its proportionate share of the expenses of any underlying Fidelity Central Funds.
K Expense ratios reflect operating expenses of the class. Expenses before reductions do not reflect amounts reimbursed by the investment adviser or reductions from brokerage service arrangements or reductions from other expense offset arrangements and do not represent the amount paid by the class during periods when reimbursements or reductions occur. Expenses net of fee waivers reflect expenses after reimbursement by the investment adviser but prior to reductions from brokerage service arrangements or other expense offset arrangements. Expenses net of all reductions represent the net expenses paid by the class but do not include expenses of the underlying funds in which the Fund invests.
L Annualized
M Amount does not include the portfolio activity of any underlying Fidelity Central Funds.
See accompanying notes which are an integral part of the financial statements.
VIP FundsManager® 60% Portfolio
Investment Summary (Unaudited)
The information in the following tables is based on the direct investments of the Fund.
Top Holdings as of June 30, 2018
| | % of fund's net assets |
| Fidelity Stock Selector All Cap Fund | 34.5 |
| Fidelity U.S. Bond Index Fund Institutional Premium Class | 28.8 |
| Fidelity Overseas Fund | 5.2 |
| Fidelity Inflation-Protected Bond Index Fund Institutional Premium Class | 4.1 |
| Fidelity Mega Cap Stock Fund | 2.6 |
| Fidelity Diversified International Fund | 1.9 |
| Fidelity Contrafund | 1.8 |
| Fidelity Equity-Income Fund | 1.8 |
| Fidelity Low-Priced Stock Fund | 1.8 |
| Fidelity Long-Term Treasury Bond Index Fund Institutional Class | 1.7 |
| | 84.2 |
Asset Allocation (% of fund's net assets)
| Period end* |
| | Domestic Equity Funds | 46.4% |
| | International Equity Funds | 16.2% |
| | Bond Funds | 36.1% |
| | Short-Term Funds | 1.3% |
| | Short-Term Investments | 0.1% |
| | Net Other Assets (Liabilities)** | (0.1)% |

* Futures - (1.7)%
** Short-Term Investments and Net Other Assets (Liabilities) are not included in the pie chart
VIP FundsManager® 60% Portfolio
Schedule of Investments June 30, 2018 (Unaudited)
Showing Percentage of Net Assets
| Equity Funds - 62.6% | | | |
| | | Shares | Value |
| Fidelity Commodity Strategy Fund (a) | | 2,922,588 | $30,774,847 |
| Fidelity Contrafund (a) | | 826,563 | 109,164,187 |
| Fidelity Diversified International Fund (a) | | 2,910,333 | 113,386,578 |
| Fidelity Emerging Asia Fund (a) | | 123,495 | 5,305,344 |
| Fidelity Emerging Markets Discovery Fund (a) | | 665,874 | 9,561,951 |
| Fidelity Emerging Markets Fund (a) | | 777,050 | 23,801,039 |
| Fidelity Equity-Income Fund (a) | | 1,867,384 | 107,542,630 |
| Fidelity Europe Fund (a) | | 1,052,892 | 42,789,551 |
| Fidelity Global Commodity Stock Fund (a) | | 4,956,850 | 67,710,570 |
| Fidelity International Capital Appreciation Fund (a) | | 1,281,401 | 26,768,472 |
| Fidelity International Discovery Fund (a) | | 2,123,851 | 94,022,875 |
| Fidelity International Enhanced Index Fund (a) | | 8,861,182 | 87,282,644 |
| Fidelity International Small Cap Fund (a) | | 1,424,171 | 41,514,573 |
| Fidelity International Small Cap Opportunities Fund (a) | | 2,262,927 | 43,810,265 |
| Fidelity International Value Fund (a) | | 6,980,976 | 60,315,634 |
| Fidelity Japan Smaller Companies Fund (a) | | 4,802,899 | 88,949,688 |
| Fidelity Low-Priced Stock Fund (a) | | 1,948,090 | 107,144,945 |
| Fidelity Mega Cap Stock Fund (a) | | 9,144,198 | 160,206,351 |
| Fidelity Overseas Fund (a) | | 6,334,777 | 315,408,542 |
| Fidelity Pacific Basin Fund (a) | | 673,139 | 23,041,537 |
| Fidelity Real Estate Investment Portfolio (a) | | 412,493 | 17,436,095 |
| Fidelity Stock Selector All Cap Fund (a) | | 45,263,823 | 2,082,588,497 |
| Fidelity Value Discovery Fund (a) | | 1,884,763 | 53,489,569 |
| iShares S&P 500 Index ETF | | 240,478 | 65,662,518 |
| TOTAL EQUITY FUNDS | | | |
| (Cost $3,530,556,154) | | | 3,777,678,902 |
|
| Fixed-Income Funds - 36.1% | | | |
| Fidelity Floating Rate High Income Fund (a) | | 6,269,644 | 60,125,885 |
| Fidelity Inflation-Protected Bond Index Fund Institutional Premium Class (a) | | 25,139,133 | 246,866,286 |
| Fidelity Long-Term Treasury Bond Index Fund Institutional Class (a) | | 8,165,469 | 103,701,454 |
| Fidelity New Markets Income Fund (a) | | 1,882,408 | 28,047,881 |
| Fidelity U.S. Bond Index Fund Institutional Premium Class (a) | | 155,046,535 | 1,742,723,056 |
| TOTAL FIXED-INCOME FUNDS | | | |
| (Cost $2,194,631,457) | | | 2,181,464,562 |
|
| Money Market Funds - 1.3% | | | |
| Fidelity Cash Central Fund, 1.93% (b) | | 6,672,495 | 6,673,830 |
| Fidelity Investments Money Market Government Portfolio Institutional Class 1.81% (a)(c) | | 4,736 | 4,736 |
| Fidelity Investments Money Market Prime Reserves Portfolio - Institutional Class 2.09% (a)(c) | | 73,530,978 | 73,553,038 |
| TOTAL MONEY MARKET FUNDS | | | |
| (Cost $80,224,231) | | | 80,231,604 |
| | | Principal Amount | Value |
|
| U.S. Treasury Obligations - 0.1% | | | |
| U.S. Treasury Bills, yield at date of purchase 1.88% to 1.9% 8/16/18 to 9/20/18 (d) | | | |
| (Cost $4,815,663) | | 4,830,000 | 4,816,161 |
| TOTAL INVESTMENT IN SECURITIES - 100.1% | | | |
| (Cost $5,810,227,505) | | | 6,044,191,229 |
| NET OTHER ASSETS (LIABILITIES) - (0.1)% | | | (3,603,134) |
| NET ASSETS - 100% | | | $6,040,588,095 |
| Futures Contracts | | | | | |
| | Number of contracts | Expiration Date | Notional Amount | Value | Unrealized Appreciation/(Depreciation) |
| Sold | | | | | |
| Equity Index Contracts | | | | | |
| ICE E-mini MSCI EAFE Index Contracts (United States) | 874 | Sept. 2018 | $85,450,980 | $2,575,840 | $2,575,840 |
| ICE E-mini MSCI Emerging Markets Index Contracts (United States) | 286 | Sept. 2018 | 15,205,190 | 988,691 | 988,691 |
| TOTAL FUTURES CONTRACTS | | | | | $3,564,531 |
The notional amount of futures sold as a percentage of Net Assets is 1.7%
Security Type Abbreviations
ETF – Exchange-Traded Fund
Legend
(a) Affiliated Fund
(b) Affiliated fund that is generally available only to investment companies and other accounts managed by Fidelity Investments. The rate quoted is the annualized seven-day yield of the fund at period end. A complete unaudited listing of the fund's holdings as of its most recent quarter end is available upon request. In addition, each Fidelity Central Fund's financial statements are available on the SEC's website or upon request.
(c) The rate quoted is the annualized seven-day yield of the fund at period end.
(d) Security or a portion of the security was pledged to cover margin requirements for futures contracts. At period end, the value of securities pledged amounted to $4,816,161.
Affiliated Central Funds
Information regarding fiscal year to date income earned by the Fund from investments in Fidelity Central Funds is as follows:
| Fund | Income earned |
| Fidelity Cash Central Fund | $18,646 |
| Total | $18,646 |
Amounts in the income column in the above table include any capital gain distributions from underlying funds, which are presented in the corresponding line-item in the Statement of Operations if applicable.
Fiscal year to date information regarding the Fund’s investments in non-Money Market Central Funds, including the ownership percentage, is presented below.
| Affiliate | Value, beginning of period | Purchases(a) | Sales Proceeds(a) | Realized Gain (loss) | Change in Unrealized appreciation (depreciation) | Value, end of period | % ownership, end of period |
| Fidelity Consumer Discretionary Central Fund | $-- | $218,396,936 | $220,205,695 | $1,808,759 | $-- | $-- | 0.0% |
| Fidelity Consumer Staples Central Fund | -- | 120,259,490 | 121,277,119 | 1,017,629 | -- | -- | 0.0% |
| Fidelity Energy Central Fund | -- | 103,608,782 | 104,680,486 | 1,071,704 | -- | -- | 0.0% |
| Fidelity Financials Central Fund | -- | 316,169,389 | 317,771,701 | 1,602,312 | -- | -- | 0.0% |
| Fidelity Health Care Central Fund | -- | 276,430,194 | 277,343,443 | 913,249 | -- | -- | 0.0% |
| Fidelity Industrials Central Fund | -- | 209,101,483 | 211,201,736 | 2,100,253 | -- | -- | 0.0% |
| Fidelity Information Technology Central Fund | -- | 512,782,056 | 514,646,348 | 1,864,292 | -- | -- | 0.0% |
| Fidelity Materials Central Fund | -- | 62,547,233 | 63,190,656 | 643,423 | -- | -- | 0.0% |
| Fidelity Telecom Services Central Fund | -- | 29,243,667 | 29,670,151 | 426,484 | -- | -- | 0.0% |
| Fidelity Utilities Central Fund | -- | 50,874,242 | 51,517,036 | 642,794 | -- | -- | 0.0% |
| | $-- | $1,899,413,472 | $1,911,504,371 | $12,090,899 | $-- | $-- | |
(a) Includes the value of shares purchased or redeemed through in-kind transactions, if applicable. See the Notes to Financial Statements for additional details.
Amounts in the income column in the above table include any capital gain distributions from underlying funds, which are presented in the corresponding line-item in the Statement of Operations if applicable.
Affiliated Underlying Funds
Fiscal year to date information regarding the Fund's investments in affiliated Underlying Funds, excluding any Money Market Central Funds, is presented below. Exchanges between classes of the same affiliated Underlying Funds may occur.
| Affiliate | Value, beginning of period | Purchases(a) | Sales Proceeds(a) | Dividend Income | Realized Gain (loss) | Change in Unrealized appreciation (depreciation) | Value, end of period |
| Fidelity Air Transportation Portfolio | $17,065,030 | $907,927 | $16,208,639 | $865,807 | $129,248 | $(1,893,566) | $-- |
| Fidelity Banking Portfolio | 38,833,828 | 2,914,917 | 38,903,834 | 2,804,494 | 22,211,439 | (25,056,350) | -- |
| Fidelity Biotechnology Portfolio | 22,793,392 | 952,490 | 23,640,886 | 885,894 | 3,856,816 | (3,961,812) | -- |
| Fidelity Brokerage and Investment Management Portfolio | 8,995,032 | 443,667 | 9,064,764 | 419,760 | 989,828 | (1,363,763) | -- |
| Fidelity Chemicals Portfolio | 8,507,109 | 500,663 | 8,092,132 | 478,467 | 5,176,143 | (6,091,783) | -- |
| Fidelity Commodity Strategy Fund | 62,581,079 | 7,884,878 | 39,390,972 | -- | 10,064 | (310,202) | 30,774,847 |
| Fidelity Construction and Housing Portfolio | 12,720,366 | 593,806 | 11,788,485 | 562,500 | 6,347,812 | (7,873,499) | -- |
| Fidelity Consumer Discretionary Portfolio | 177,742,463 | 8,006,935 | 187,852,468 | 2,925,963 | 82,414,033 | (80,310,963) | -- |
| Fidelity Consumer Staples Portfolio | 130,079,825 | 9,158,902 | 124,377,264 | 7,428,955 | 34,733,218 | (49,594,681) | -- |
| Fidelity Contrafund | 94,504,663 | 15,776,271 | 9,033,230 | 1,558,124 | 63,799 | 7,852,684 | 109,164,187 |
| Fidelity Defense and Aerospace Portfolio | 58,700,862 | 1,910,453 | 63,286,706 | 1,755,066 | 18,041,054 | (15,365,663) | -- |
| Fidelity Diversified International Fund | 133,146,732 | 592,072 | 17,325,196 | -- | (385,322) | (2,641,708) | 113,386,578 |
| Fidelity Emerging Asia Fund | 9,493,333 | 27,644 | 4,013,824 | -- | 1,431,214 | (1,633,023) | 5,305,344 |
| Fidelity Emerging Markets Discovery Fund | 16,855,779 | 48,121 | 6,945,938 | -- | 364,783 | (760,794) | 9,561,951 |
| Fidelity Emerging Markets Fund | 70,162,222 | 801,380 | 46,386,559 | -- | 2,127,415 | (2,903,419) | 23,801,039 |
| Fidelity Energy Portfolio | 104,068,551 | 2,366,633 | 106,913,543 | -- | 15,925,701 | (15,447,342) | -- |
| Fidelity Equity-Income Fund | 107,052,709 | 12,295,880 | 6,237,822 | 2,873,143 | (65,218) | (5,502,919) | 107,542,630 |
| Fidelity Europe Fund | 50,969,904 | 226,031 | 6,643,946 | -- | 530,543 | (2,292,981) | 42,789,551 |
| Fidelity Financial Services Portfolio | 208,293,961 | 10,586,394 | 211,732,523 | 4,928,082 | 101,680,852 | (108,828,684) | -- |
| Fidelity Floating Rate High Income Fund | 62,457,906 | 1,577,474 | 3,726,317 | 1,261,741 | (3,420) | (179,758) | 60,125,885 |
| Fidelity Global Commodity Stock Fund | 64,730,477 | 3,991,154 | 3,497,249 | -- | 105,040 | 2,381,148 | 67,710,570 |
| Fidelity Health Care Portfolio | 219,824,598 | 14,054,946 | 241,541,183 | 8,044,149 | 106,672,075 | (99,010,436) | -- |
| Fidelity Industrial Equipment Portfolio | 41,888,749 | 5,296,521 | 373,830 | 5,250,930 | 11,856 | (16,038,159) | -- |
| Fidelity Industrials Portfolio | 80,646,819 | 8,683,142 | 123,940,410 | 4,995,148 | 49,974,989 | (46,149,677) | -- |
| Fidelity Inflation-Protected Bond Index Fund Institutional Premium Class | 216,326,281 | 44,184,781 | 13,742,470 | 315,793 | (204,169) | 301,863 | 246,866,286 |
| Fidelity Insurance Portfolio | 21,811,401 | 2,548,870 | 21,222,939 | 2,490,812 | 9,054,817 | (12,192,149) | -- |
| Fidelity International Capital Appreciation Fund | 30,788,374 | 135,403 | 3,983,919 | -- | 562,742 | (734,128) | 26,768,472 |
| Fidelity International Discovery Fund | 110,711,503 | 490,520 | 14,337,257 | -- | (355,143) | (2,486,748) | 94,022,875 |
| Fidelity International Enhanced Index Fund | 102,707,287 | 457,238 | 13,350,743 | -- | (50,519) | (2,480,619) | 87,282,644 |
| Fidelity International Small Cap Fund | 59,491,088 | 256,616 | 17,326,124 | -- | 3,281,139 | (4,188,146) | 41,514,573 |
| Fidelity International Small Cap Opportunities Fund | 55,147,039 | 234,994 | 11,969,899 | -- | 3,054,471 | (2,656,340) | 43,810,265 |
| Fidelity International Value Fund | 72,391,124 | 323,287 | 9,482,947 | -- | (26,667) | (2,889,163) | 60,315,634 |
| Fidelity Investments Money Market Government Portfolio Institutional Class 1.81% | 43,179,157 | 143,619,752 | 186,794,173 | 463,591 | -- | -- | 4,736 |
| Fidelity Investments Money Market Prime Reserves Portfolio – Institutional Class 2.09% | 77,188,157 | 75,939,494 | 79,583,054 | 662,099 | 1,068 | 7,373 | 73,553,038 |
| Fidelity Japan Smaller Companies Fund | 67,756,712 | 25,026,256 | 1,415,948 | -- | 29,370 | (2,446,702) | 88,949,688 |
| Fidelity Leisure Portfolio | 12,137,474 | 664,367 | 12,108,289 | 633,061 | (252,258) | (441,294) | -- |
| Fidelity Long-Term Treasury Bond Index Fund Institutional Class | 112,926,633 | 2,069,266 | 6,323,537 | 1,531,254 | (288,430) | (4,682,478) | 103,701,454 |
| Fidelity Low-Priced Stock Fund | 108,316,039 | 5,123,436 | 7,238,521 | -- | 61,280 | 882,711 | 107,144,945 |
| Fidelity Materials Portfolio | 57,905,087 | 3,948,003 | 56,650,386 | 2,694,325 | (5,378,274) | 175,570 | -- |
| Fidelity Medical Equipment and Systems Portfolio | 18,997,921 | 858,639 | 20,387,158 | 805,705 | 4,830,574 | (4,299,976) | -- |
| Fidelity Mega Cap Stock Fund | 161,014,872 | 8,686,439 | 10,371,702 | -- | 53,401 | 823,341 | 160,206,351 |
| Fidelity Multimedia Portfolio | 14,598,427 | 811,615 | 13,985,502 | 774,048 | (744,280) | (680,260) | -- |
| Fidelity New Markets Income Fund | 31,606,024 | 819,799 | 1,863,217 | 661,839 | (65,327) | (2,449,398) | 28,047,881 |
| Fidelity Overseas Fund | 467,435,604 | 2,188,100 | 148,031,105 | -- | 27,000,085 | (33,184,142) | 315,408,542 |
| Fidelity Pacific Basin Fund | 27,229,545 | 118,477 | 3,485,929 | -- | 704,041 | (1,524,597) | 23,041,537 |
| Fidelity Real Estate Investment Portfolio | 63,760,160 | 4,258,972 | 47,111,713 | 160,976 | (5,095,989) | 1,624,665 | 17,436,095 |
| Fidelity Stock Selector All Cap Fund | -- | 2,099,413,753 | 60,210,854 | -- | (223,843) | 43,609,441 | 2,082,588,497 |
| Fidelity Technology Portfolio | 487,638,801 | 56,974,005 | 529,681,468 | 49,022,523 | 168,423,083 | (183,354,421) | -- |
| Fidelity Telecommunications Portfolio | 30,354,838 | 1,813,398 | 30,289,088 | 431,440 | (1,925,113) | 45,965 | -- |
| Fidelity Transportation Portfolio | 12,874,248 | 611,912 | 12,316,978 | 580,038 | 1,386,397 | (2,555,579) | -- |
| Fidelity U.S. Bond Index Fund Institutional Premium Class | 1,766,660,900 | 279,421,988 | 249,832,247 | 23,147,103 | (7,368,221) | (46,159,364) | 1,742,723,056 |
| Fidelity Utilities Portfolio | 50,613,596 | 1,979,677 | 52,656,269 | 237,294 | 4,223,760 | (4,160,764) | -- |
| Fidelity Value Discovery Fund | 54,185,632 | 3,562,289 | 3,225,098 | -- | (1,253) | (1,032,001) | 53,489,569 |
| | $6,137,869,313 | $2,876,139,647 | $2,949,896,254 | $131,650,124 | $653,030,704 | $(750,104,690) | $5,967,038,720 |
(a) Includes the value of shares purchased or redeemed through in-kind transactions, if applicable. See the Notes to Financial Statements for additional details.
Amounts in the income column in the above table include any capital gain distributions from underlying funds, which are presented in the corresponding line-item in the Statement of Operations if applicable.
Investment Valuation
The following is a summary of the inputs used, as of June 30, 2018, involving the Fund's assets and liabilities carried at fair value. The inputs or methodology used for valuing securities may not be an indication of the risk associated with investing in those securities. For more information on valuation inputs, and their aggregation into the levels used below, please refer to the Investment Valuation section in the accompanying Notes to Financial Statements.
| | Valuation Inputs at Reporting Date: |
| Description | Total | Level 1 | Level 2 | Level 3 |
| Investments in Securities: | | | | |
| Equity Funds | $3,777,678,902 | $3,777,678,902 | $-- | $-- |
| Fixed-Income Funds | 2,181,464,562 | 2,181,464,562 | -- | -- |
| Money Market Funds | 80,231,604 | 80,231,604 | -- | -- |
| Other Short-Term Investments and Net Other Assets | 4,816,161 | -- | 4,816,161 | -- |
| Total Investments in Securities: | $6,044,191,229 | $6,039,375,068 | $4,816,161 | $-- |
| Derivative Instruments: | | | | |
| Assets | | | | |
| Futures Contracts | $3,564,531 | $3,564,531 | $-- | $-- |
| Total Assets | $3,564,531 | $3,564,531 | $-- | $-- |
| Total Derivative Instruments: | $3,564,531 | $3,564,531 | $-- | $-- |
Value of Derivative Instruments
The following table is a summary of the Fund's value of derivative instruments by primary risk exposure as of June 30, 2018. For additional information on derivative instruments, please refer to the Derivative Instruments section in the accompanying Notes to Financial Statements.
| Primary Risk Exposure / Derivative Type | Value |
| | Asset | Liability |
| Equity Risk | | |
| Futures Contracts(a) | $3,564,531 | $0 |
| Total Equity Risk | 3,564,531 | 0 |
| Total Value of Derivatives | $3,564,531 | $0 |
(a) Reflects gross cumulative appreciation (depreciation) on futures contracts as presented in the Schedule of Investments. In the Statement of Assets and Liabilities, the period end daily variation margin is included in receivable or payable for daily variation margin on futures contracts, and the net cumulative appreciation (depreciation) is included in net unrealized appreciation (depreciation).
See accompanying notes which are an integral part of the financial statements.
VIP FundsManager® 60% Portfolio
Financial Statements
Statement of Assets and Liabilities
| | | June 30, 2018 (Unaudited) |
| Assets | | |
Investment in securities, at value — See accompanying schedule:
Unaffiliated issuers (cost $67,473,263) | $70,478,679 | |
| Fidelity Central Funds (cost $6,673,830) | 6,673,830 | |
| Other affiliated issuers (cost $5,736,080,412) | 5,967,038,720 | |
| Total Investment in Securities (cost $5,810,227,505) | | $6,044,191,229 |
| Receivable for investments sold | | 603,386 |
| Receivable for fund shares sold | | 91,599 |
| Dividends receivable | | 307,996 |
| Distributions receivable from Fidelity Central Funds | | 5,334 |
| Other receivables | | 4,408 |
| Total assets | | 6,045,203,952 |
| Liabilities | | |
| Payable for fund shares redeemed | $2,719,949 | |
| Accrued management fee | 1,019,332 | |
| Distribution and service plan fees payable | 74,516 | |
| Payable for daily variation margin on futures contracts | 802,060 | |
| Total liabilities | | 4,615,857 |
| Net Assets | | $6,040,588,095 |
| Net Assets consist of: | | |
| Paid in capital | | $5,009,190,866 |
| Undistributed net investment income | | 24,484,270 |
| Accumulated undistributed net realized gain (loss) on investments | | 769,384,704 |
| Net unrealized appreciation (depreciation) on investments | | 237,528,255 |
| Net Assets | | $6,040,588,095 |
| Service Class: | | |
| Net Asset Value, offering price and redemption price per share ($54,695 ÷ 4,863 shares) | | $11.25 |
| Service Class 2: | | |
| Net Asset Value, offering price and redemption price per share ($590,312,774 ÷ 52,665,836 shares) | | $11.21 |
| Investor Class: | | |
| Net Asset Value, offering price and redemption price per share ($5,450,220,626 ÷ 484,708,914 shares) | | $11.24 |
See accompanying notes which are an integral part of the financial statements.
Statement of Operations
| | | Six months ended June 30, 2018 (Unaudited) |
| Investment Income | | |
| Dividends: | | |
| Unaffiliated issuers | | $603,534 |
| Affiliated issuers | | 30,542,222 |
| Interest | | 16,852 |
| Income from Fidelity Central Funds | | 18,646 |
| Total income | | 31,181,254 |
| Expenses | | |
| Management fee | $7,739,053 | |
| Distribution and service plan fees | 738,737 | |
| Independent trustees' fees and expenses | 13,460 | |
| Total expenses before reductions | 8,491,250 | |
| Expense reductions | (1,861,554) | |
| Total expenses after reductions | | 6,629,696 |
| Net investment income (loss) | | 24,551,558 |
| Realized and Unrealized Gain (Loss) | | |
| Net realized gain (loss) on: | | |
| Investment securities: | | |
| Unaffiliated issuers | 4,955,748 | |
| Fidelity Central Funds | 12,090,899 | |
| Other affiliated issuers | 653,030,704 | |
| Futures contracts | 701,614 | |
| Capital gain distributions from underlying funds: | | |
| Affiliated issuers | 101,107,902 | |
| Total net realized gain (loss) | | 771,886,867 |
| Change in net unrealized appreciation (depreciation) on: | | |
| Investment securities: | | |
| Unaffiliated issuers | (2,831,818) | |
| Affiliated issuers | (750,104,690) | |
| Futures contracts | 3,564,531 | |
| Total change in net unrealized appreciation (depreciation) | | (749,371,977) |
| Net gain (loss) | | 22,514,890 |
| Net increase (decrease) in net assets resulting from operations | | $47,066,448 |
See accompanying notes which are an integral part of the financial statements.
Statement of Changes in Net Assets
| | Six months ended June 30, 2018 (Unaudited) | Year ended December 31, 2017 |
| Increase (Decrease) in Net Assets | | |
| Operations | | |
| Net investment income (loss) | $24,551,558 | $69,528,865 |
| Net realized gain (loss) | 771,886,867 | 728,591,827 |
| Change in net unrealized appreciation (depreciation) | (749,371,977) | 198,428,497 |
| Net increase (decrease) in net assets resulting from operations | 47,066,448 | 996,549,189 |
| Distributions to shareholders from net investment income | (3,988,718) | (65,831,245) |
| Distributions to shareholders from net realized gain | (668,110,164) | (134,172,261) |
| Total distributions | (672,098,882) | (200,003,506) |
| Share transactions - net increase (decrease) | 334,677,481 | (847,339,302) |
| Total increase (decrease) in net assets | (290,354,953) | (50,793,619) |
| Net Assets | | |
| Beginning of period | 6,330,943,048 | 6,381,736,667 |
| End of period | $6,040,588,095 | $6,330,943,048 |
| Other Information | | |
| Undistributed net investment income end of period | $24,484,270 | $3,921,430 |
See accompanying notes which are an integral part of the financial statements.
Financial Highlights
VIP FundsManager 60% Portfolio Service Class
| | Six months ended (Unaudited) June 30, | Years endedDecember 31, | | | | |
| | 2018 | 2017 | 2016 | 2015 | 2014 | 2013 |
| Selected Per–Share Data | | | | | | |
| Net asset value, beginning of period | $12.50 | $11.03 | $11.06 | $11.97 | $11.81 | $10.44 |
| Income from Investment Operations | | | | | | |
| Net investment income (loss)A | .05 | .13 | .13 | .13 | .15 | .13 |
| Net realized and unrealized gain (loss) | .05 | 1.73 | .36 | (.07) | .48 | 1.80 |
| Total from investment operations | .10 | 1.86 | .49 | .06 | .63 | 1.93 |
| Distributions from net investment income | (.01) | (.13) | (.14) | (.13) | (.15) | (.13) |
| Distributions from net realized gain | (1.34) | (.25) | (.38) | (.84) | (.32) | (.43) |
| Total distributions | (1.35) | (.39)B | (.52) | (.97) | (.47) | (.56) |
| Net asset value, end of period | $11.25 | $12.50 | $11.03 | $11.06 | $11.97 | $11.81 |
| Total ReturnC,D,E | .79% | 16.99% | 4.79% | .41% | 5.40% | 18.62% |
| Ratios to Average Net AssetsF,G,H | | | | | | |
| Expenses before reductions | .35%I | .35% | .35% | .35% | .35% | .35% |
| Expenses net of fee waivers, if any | .20%I | .20% | .20% | .20% | .20% | .20% |
| Expenses net of all reductions | .20%I | .20% | .20% | .20% | .20% | .20% |
| Net investment income (loss) | .81%I | 1.11% | 1.19% | 1.11% | 1.26% | 1.18% |
| Supplemental Data | | | | | | |
| Net assets, end of period (000 omitted) | $55 | $61 | $59 | $60 | $69 | $75 |
| Portfolio turnover rateF,J | 154%I | 47% | 35% | 30% | 36% | 21% |
A Calculated based on average shares outstanding during the period.
B Total distributions of $.39 per share is comprised of distributions from net investment income of $.134 and distributions from net realized gain of $.251 per share.
C Total returns for periods of less than one year are not annualized.
D Total returns do not reflect charges attributable to your insurance company's separate account. Inclusion of these charges would reduce the total returns shown.
E Total returns would have been lower if certain expenses had not been reduced during the applicable periods shown.
F Amounts do not include the activity of the Underlying Funds.
G Fees and expenses of any underlying Fidelity Central Funds are not included in the Fund's expense ratio. The Fund indirectly bears its proportionate share of the expenses of any underlying Fidelity Central Funds.
H Expense ratios reflect operating expenses of the class. Expenses before reductions do not reflect amounts reimbursed by the investment adviser or reductions from brokerage service arrangements or reductions from other expense offset arrangements and do not represent the amount paid by the class during periods when reimbursements or reductions occur. Expenses net of fee waivers reflect expenses after reimbursement by the investment adviser but prior to reductions from brokerage service arrangements or other expense offset arrangements. Expenses net of all reductions represent the net expenses paid by the class but do not include expenses of the underlying funds in which the Fund invests.
I Annualized
J Amount does not include the portfolio activity of any underlying Fidelity Central Funds.
See accompanying notes which are an integral part of the financial statements.
VIP FundsManager 60% Portfolio Service Class 2
| | Six months ended (Unaudited) June 30, | Years endedDecember 31, | | | | |
| | 2018 | 2017 | 2016 | 2015 | 2014 | 2013 |
| Selected Per–Share Data | | | | | | |
| Net asset value, beginning of period | $12.47 | $11.01 | $11.04 | $11.95 | $11.79 | $10.43 |
| Income from Investment Operations | | | | | | |
| Net investment income (loss)A | .04 | .11 | .11 | .11 | .13 | .12 |
| Net realized and unrealized gain (loss) | .05 | 1.72 | .36 | (.07) | .48 | 1.78 |
| Total from investment operations | .09 | 1.83 | .47 | .04 | .61 | 1.90 |
| Distributions from net investment income | (.01) | (.12) | (.12) | (.11) | (.13) | (.12) |
| Distributions from net realized gain | (1.34) | (.25) | (.38) | (.84) | (.32) | (.43) |
| Total distributions | (1.35) | (.37) | (.50) | (.95) | (.45) | (.54)B |
| Net asset value, end of period | $11.21 | $12.47 | $11.01 | $11.04 | $11.95 | $11.79 |
| Total ReturnC,D,E | .71% | 16.76% | 4.65% | .27% | 5.26% | 18.39% |
| Ratios to Average Net AssetsF,G,H | | | | | | |
| Expenses before reductions | .50%I | .50% | .50% | .50% | .50% | .50% |
| Expenses net of fee waivers, if any | .35%I | .35% | .35% | .35% | .35% | .35% |
| Expenses net of all reductions | .35%I | .35% | .35% | .35% | .35% | .35% |
| Net investment income (loss) | .66%I | .96% | 1.04% | .96% | 1.11% | 1.03% |
| Supplemental Data | | | | | | |
| Net assets, end of period (000 omitted) | $590,313 | $585,346 | $507,162 | $497,768 | $425,719 | $372,191 |
| Portfolio turnover rateF,J | 154%I | 47% | 35% | 30% | 36% | 21% |
A Calculated based on average shares outstanding during the period.
B Total distributions of $.54 per share is comprised of distributions from net investment income of $.119 and distributions from net realized gain of $.425 per share.
C Total returns for periods of less than one year are not annualized.
D Total returns do not reflect charges attributable to your insurance company's separate account. Inclusion of these charges would reduce the total returns shown.
E Total returns would have been lower if certain expenses had not been reduced during the applicable periods shown.
F Amounts do not include the activity of the Underlying Funds.
G Fees and expenses of any underlying Fidelity Central Funds are not included in the Fund's expense ratio. The Fund indirectly bears its proportionate share of the expenses of any underlying Fidelity Central Funds.
H Expense ratios reflect operating expenses of the class. Expenses before reductions do not reflect amounts reimbursed by the investment adviser or reductions from brokerage service arrangements or reductions from other expense offset arrangements and do not represent the amount paid by the class during periods when reimbursements or reductions occur. Expenses net of fee waivers reflect expenses after reimbursement by the investment adviser but prior to reductions from brokerage service arrangements or other expense offset arrangements. Expenses net of all reductions represent the net expenses paid by the class but do not include expenses of the underlying funds in which the Fund invests.
I Annualized
J Amount does not include the portfolio activity of any underlying Fidelity Central Funds.
See accompanying notes which are an integral part of the financial statements.
VIP FundsManager 60% Portfolio Investor Class
| | Six months ended (Unaudited) June 30, | Years endedDecember 31, | | | | |
| | 2018 | 2017 | 2016 | 2015 | 2014 | 2013 |
| Selected Per–Share Data | | | | | | |
| Net asset value, beginning of period | $12.50 | $11.03 | $11.06 | $11.97 | $11.81 | $10.44 |
| Income from Investment Operations | | | | | | |
| Net investment income (loss)A | .05 | .13 | .13 | .13 | .15 | .13 |
| Net realized and unrealized gain (loss) | .04 | 1.73 | .36 | (.07) | .48 | 1.80 |
| Total from investment operations | .09 | 1.86 | .49 | .06 | .63 | 1.93 |
| Distributions from net investment income | (.01) | (.13) | (.14) | (.13) | (.15) | (.13) |
| Distributions from net realized gain | (1.34) | (.25) | (.38) | (.84) | (.32) | (.43) |
| Total distributions | (1.35) | (.39)B | (.52) | (.97) | (.47) | (.56) |
| Net asset value, end of period | $11.24 | $12.50 | $11.03 | $11.06 | $11.97 | $11.81 |
| Total ReturnC,D,E | .70% | 16.99% | 4.79% | .41% | 5.40% | 18.62% |
| Ratios to Average Net AssetsF,G,H | | | | | | |
| Expenses before reductions | .25%I | .25% | .25% | .25% | .25% | .25% |
| Expenses net of fee waivers, if any | .20%I | .20% | .20% | .20% | .20% | .20% |
| Expenses net of all reductions | .20%I | .20% | .20% | .20% | .20% | .20% |
| Net investment income (loss) | .81%I | 1.11% | 1.19% | 1.11% | 1.26% | 1.18% |
| Supplemental Data | | | | | | |
| Net assets, end of period (000 omitted) | $5,450,221 | $5,745,537 | $5,874,515 | $6,378,497 | $6,172,435 | $6,037,672 |
| Portfolio turnover rateF,J | 154%I | 47% | 35% | 30% | 36% | 21% |
A Calculated based on average shares outstanding during the period.
B Total distributions of $.39 per share is comprised of distributions from net investment income of $.134 and distributions from net realized gain of $.251 per share.
C Total returns for periods of less than one year are not annualized.
D Total returns do not reflect charges attributable to your insurance company's separate account. Inclusion of these charges would reduce the total returns shown.
E Total returns would have been lower if certain expenses had not been reduced during the applicable periods shown.
F Amounts do not include the activity of the Underlying Funds.
G Fees and expenses of any underlying Fidelity Central Funds are not included in the Fund's expense ratio. The Fund indirectly bears its proportionate share of the expenses of any underlying Fidelity Central Funds.
H Expense ratios reflect operating expenses of the class. Expenses before reductions do not reflect amounts reimbursed by the investment adviser or reductions from brokerage service arrangements or reductions from other expense offset arrangements and do not represent the amount paid by the class during periods when reimbursements or reductions occur. Expenses net of fee waivers reflect expenses after reimbursement by the investment adviser but prior to reductions from brokerage service arrangements or other expense offset arrangements. Expenses net of all reductions represent the net expenses paid by the class but do not include expenses of the underlying funds in which the Fund invests.
I Annualized
J Amount does not include the portfolio activity of any underlying Fidelity Central Funds.
See accompanying notes which are an integral part of the financial statements.
VIP FundsManager® 70% Portfolio
Investment Summary (Unaudited)
The information in the following tables is based on the direct investments of the Fund.
Top Holdings as of June 30, 2018
| | % of fund's net assets |
| Fidelity Stock Selector All Cap Fund | 39.6 |
| Fidelity U.S. Bond Index Fund Institutional Premium Class | 18.7 |
| Fidelity Overseas Fund | 6.7 |
| Fidelity Inflation-Protected Bond Index Fund Institutional Class | 4.1 |
| Fidelity Mega Cap Stock Fund | 3.1 |
| Fidelity Diversified International Fund | 2.1 |
| Fidelity Contrafund | 2.1 |
| Fidelity Equity-Income Fund | 2.1 |
| Fidelity Low-Priced Stock Fund | 2.0 |
| Fidelity International Discovery Fund | 1.8 |
| | 82.3 |
Asset Allocation (% of fund's net assets)
| Period end* |
| | Domestic Equity Funds | 53.2% |
| | International Equity Funds | 19.2% |
| | Bond Funds | 26.0% |
| | Short-Term Funds | 1.6% |

* Futures - (1.4)%
VIP FundsManager® 70% Portfolio
Schedule of Investments June 30, 2018 (Unaudited)
Showing Percentage of Net Assets
| Equity Funds - 72.4% | | | |
| | | Shares | Value |
| Fidelity Commodity Strategy Fund (a) | | 896,008 | $9,434,968 |
| Fidelity Contrafund (a) | | 237,394 | 31,352,674 |
| Fidelity Diversified International Fund (a) | | 820,223 | 31,955,880 |
| Fidelity Emerging Asia Fund (a) | | 43,396 | 1,864,290 |
| Fidelity Emerging Markets Discovery Fund (a) | | 236,940 | 3,402,463 |
| Fidelity Emerging Markets Fund (a) | | 275,347 | 8,433,875 |
| Fidelity Equity-Income Fund (a) | | 536,488 | 30,896,332 |
| Fidelity Europe Fund (a) | | 297,491 | 12,090,053 |
| Fidelity Global Commodity Stock Fund (a) | | 1,232,383 | 16,834,353 |
| Fidelity International Capital Appreciation Fund (a) | | 358,430 | 7,487,597 |
| Fidelity International Discovery Fund (a) | | 598,119 | 26,478,722 |
| Fidelity International Enhanced Index Fund (a) | | 2,493,240 | 24,558,414 |
| Fidelity International Small Cap Fund (a) | | 395,455 | 11,527,509 |
| Fidelity International Small Cap Opportunities Fund (a) | | 618,652 | 11,977,111 |
| Fidelity International Value Fund (a) | | 1,980,320 | 17,109,964 |
| Fidelity Japan Smaller Companies Fund (a) | | 1,351,317 | 25,026,395 |
| Fidelity Low-Priced Stock Fund (a) | | 560,433 | 30,823,823 |
| Fidelity Mega Cap Stock Fund (a) | | 2,627,659 | 46,036,588 |
| Fidelity Overseas Fund (a) | | 2,031,990 | 101,172,776 |
| Fidelity Pacific Basin Fund (a) | | 188,554 | 6,454,208 |
| Fidelity Real Estate Investment Portfolio (a) | | 118,469 | 5,007,676 |
| Fidelity Stock Selector All Cap Fund (a) | | 12,981,583 | 597,282,627 |
| Fidelity Value Discovery Fund (a) | | 544,200 | 15,444,389 |
| iShares S&P 500 Index ETF | | 73,777 | 20,144,810 |
| TOTAL EQUITY FUNDS | | | |
| (Cost $1,033,342,922) | | | 1,092,797,497 |
|
| Fixed-Income Funds - 26.0% | | | |
| Fidelity Floating Rate High Income Fund (a) | | 1,557,317 | 14,934,672 |
| Fidelity Inflation-Protected Bond Index Fund Institutional Class (a) | | 6,284,772 | 61,716,457 |
| Fidelity Long-Term Treasury Bond Index Fund Institutional Class (a) | | 2,023,183 | 25,694,429 |
| Fidelity New Markets Income Fund (a) | | 469,458 | 6,994,924 |
| Fidelity U.S. Bond Index Fund Institutional Premium Class (a) | | 25,198,195 | 283,227,708 |
| TOTAL FIXED-INCOME FUNDS | | | |
| (Cost $393,099,216) | | | 392,568,190 |
|
| Money Market Funds - 1.6% | | | |
| Fidelity Cash Central Fund, 1.93% (b) | | 1,717,423 | 1,717,766 |
| Fidelity Institutional Money Market Funds Prime Reserves Portfolio Class I (a) | | 19,139,494 | 19,145,236 |
| Fidelity Investments Money Market Government Portfolio Institutional Class 1.81% (a)(c) | | 2,915,204 | 2,915,204 |
| TOTAL MONEY MARKET FUNDS | | | |
| (Cost $23,776,289) | | | 23,778,206 |
| | | Principal Amount | Value |
|
| U.S. Treasury Obligations - 0.0% | | | |
| U.S. Treasury Bills, yield at date of purchase 1.88% to 1.9% 8/16/18 to 9/20/18 (d) | | | |
| (Cost $996,828) | | 1,000,000 | 996,927 |
| TOTAL INVESTMENT IN SECURITIES - 100.0% | | | |
| (Cost $1,451,215,255) | | | 1,510,140,820 |
| NET OTHER ASSETS (LIABILITIES) - 0.0% | | | (296,302) |
| NET ASSETS - 100% | | | $1,509,844,518 |
| Futures Contracts | | | | | |
| | Number of contracts | Expiration Date | Notional Amount | Value | Unrealized Appreciation/(Depreciation) |
| Sold | | | | | |
| Equity Index Contracts | | | | | |
| ICE E-mini MSCI EAFE Index Contracts (United States) | 175 | Sept. 2018 | $17,109,750 | $515,757 | $515,757 |
| ICE E-mini MSCI Emerging Markets Index Contracts (United States) | 66 | Sept. 2018 | 3,508,890 | 228,163 | 228,163 |
| TOTAL FUTURES CONTRACTS | | | | | $743,920 |
The notional amount of futures sold as a percentage of Net Assets is 1.4%
Security Type Abbreviations
ETF – Exchange-Traded Fund
Legend
(a) Affiliated Fund
(b) Affiliated fund that is generally available only to investment companies and other accounts managed by Fidelity Investments. The rate quoted is the annualized seven-day yield of the fund at period end. A complete unaudited listing of the fund's holdings as of its most recent quarter end is available upon request. In addition, each Fidelity Central Fund's financial statements are available on the SEC's website or upon request.
(c) The rate quoted is the annualized seven-day yield of the fund at period end.
(d) Security or a portion of the security was pledged to cover margin requirements for futures contracts. At period end, the value of securities pledged amounted to $996,927.
Affiliated Central Funds
Information regarding fiscal year to date income earned by the Fund from investments in Fidelity Central Funds is as follows:
| Fund | Income earned |
| Fidelity Cash Central Fund | $10,573 |
| Total | $10,573 |
Amounts in the income column in the above table include any capital gain distributions from underlying funds, which are presented in the corresponding line-item in the Statement of Operations if applicable.
Fiscal year to date information regarding the Fund’s investments in non-Money Market Central Funds, including the ownership percentage, is presented below.
| Affiliate | Value, beginning of period | Purchases(a) | Sales Proceeds(a) | Realized Gain (loss) | Change in Unrealized appreciation (depreciation) | Value, end of period | % ownership, end of period |
| Fidelity Consumer Discretionary Central Fund | $-- | $60,733,440 | $61,236,433 | $502,993 | $-- | $-- | 0.0% |
| Fidelity Consumer Staples Central Fund | -- | 33,629,099 | 33,913,667 | 284,568 | -- | -- | 0.0% |
| Fidelity Energy Central Fund | -- | 29,013,937 | 29,314,050 | 300,113 | -- | -- | 0.0% |
| Fidelity Financials Central Fund | -- | 88,396,207 | 88,844,189 | 447,982 | -- | -- | 0.0% |
| Fidelity Health Care Central Fund | -- | 77,015,902 | 77,270,341 | 254,439 | -- | -- | 0.0% |
| Fidelity Industrials Central Fund | -- | 58,579,667 | 59,168,052 | 588,385 | -- | -- | 0.0% |
| Fidelity Information Technology Central Fund | -- | 143,385,996 | 143,907,296 | 521,300 | -- | -- | 0.0% |
| Fidelity Materials Central Fund | -- | 17,529,562 | 17,709,889 | 180,327 | -- | -- | 0.0% |
| Fidelity Telecom Services Central Fund | -- | 7,877,583 | 7,992,468 | 114,885 | -- | -- | 0.0% |
| Fidelity Utilities Central Fund | -- | 13,940,381 | 14,116,517 | 176,136 | -- | -- | 0.0% |
| | $-- | $530,101,774 | $533,472,902 | $3,371,128 | $-- | $-- | |
(a) Includes the value of shares purchased or redeemed through in-kind transactions, if applicable. See the Notes to Financial Statements for additional details.
Amounts in the income column in the above table include any capital gain distributions from underlying funds, which are presented in the corresponding line-item in the Statement of Operations if applicable.
Affiliated Underlying Funds
Fiscal year to date information regarding the Fund's investments in affiliated Underlying Funds, excluding any Money Market Central Funds, is presented below. Exchanges between classes of the same affiliated Underlying Funds may occur.
| Affiliate | Value, beginning of period | Purchases(a) | Sales Proceeds(a) | Dividend Income | Realized Gain (loss) | Change in Unrealized appreciation (depreciation) | Value, end of period |
| Fidelity Air Transportation Portfolio | $4,740,075 | $320,483 | $4,557,137 | $247,945 | $2,831 | $(506,252) | $-- |
| Fidelity Banking Portfolio | 11,006,567 | 1,013,712 | 11,171,210 | 821,767 | 6,018,484 | (6,867,553) | -- |
| Fidelity Biotechnology Portfolio | 6,354,617 | 370,364 | 6,679,877 | 255,422 | 1,085,477 | (1,130,581) | -- |
| Fidelity Brokerage and Investment Management Portfolio | 2,563,433 | 163,789 | 2,614,429 | 123,449 | 273,735 | (386,528) | -- |
| Fidelity Chemicals Portfolio | 2,515,918 | 184,994 | 2,421,986 | 146,153 | 1,494,848 | (1,773,774) | -- |
| Fidelity Commodity Strategy Fund | 14,661,971 | 2,272,712 | 7,423,412 | -- | (25,221) | (51,082) | 9,434,968 |
| Fidelity Construction and Housing Portfolio | 3,508,428 | 214,897 | 3,292,924 | 160,007 | 1,650,519 | (2,080,920) | -- |
| Fidelity Consumer Discretionary Portfolio | 48,924,798 | 1,660,084 | 51,133,483 | 807,936 | 15,321,814 | (14,773,213) | -- |
| Fidelity Consumer Staples Portfolio | 35,726,421 | 2,654,657 | 34,238,293 | 2,077,417 | 6,857,616 | (11,000,401) | -- |
| Fidelity Contrafund | 25,982,868 | 4,609,843 | 1,438,384 | 430,627 | 8,831 | 2,189,516 | 31,352,674 |
| Fidelity Defense and Aerospace Portfolio | 16,230,339 | 770,448 | 17,727,788 | 500,221 | 4,221,605 | (3,494,604) | -- |
| Fidelity Diversified International Fund | 34,964,806 | 1,073,073 | 3,222,936 | -- | (93,129) | (765,934) | 31,955,880 |
| Fidelity Emerging Asia Fund | 2,927,113 | 58,716 | 1,045,002 | -- | 261,775 | (338,312) | 1,864,290 |
| Fidelity Emerging Markets Discovery Fund | 5,247,601 | 104,199 | 1,779,674 | -- | 90,651 | (260,314) | 3,402,463 |
| Fidelity Emerging Markets Fund | 21,698,337 | 726,152 | 13,626,675 | -- | 592,687 | (956,626) | 8,433,875 |
| Fidelity Energy Portfolio | 28,932,517 | 465,130 | 29,524,424 | -- | 4,023,593 | (3,896,816) | -- |
| Fidelity Equity-Income Fund | 28,181,266 | 4,879,340 | 638,152 | 800,355 | (11,482) | (1,514,640) | 30,896,332 |
| Fidelity Europe Fund | 13,454,199 | 409,966 | 1,276,119 | -- | 94,813 | (592,806) | 12,090,053 |
| Fidelity Financial Services Portfolio | 57,607,418 | 2,353,187 | 57,933,761 | 1,369,089 | 16,931,172 | (18,958,016) | -- |
| Fidelity Floating Rate High Income Fund | 14,510,876 | 802,075 | 330,712 | 302,556 | (52) | (47,515) | 14,934,672 |
| Fidelity Global Commodity Stock Fund | 15,082,990 | 1,472,712 | 323,412 | -- | 4,080 | 597,983 | 16,834,353 |
| Fidelity Health Care Portfolio | 60,650,947 | 3,299,865 | 65,998,126 | 2,227,086 | 12,399,977 | (10,352,663) | -- |
| Fidelity Industrial Equipment Portfolio | 11,598,859 | 1,505,639 | 64,968 | 1,460,154 | 2,792 | (1,562,177) | -- |
| Fidelity Industrials Portfolio | 22,278,587 | 1,919,559 | 33,828,201 | 1,379,612 | 9,648,352 | (11,498,442) | -- |
| Fidelity Inflation-Protected Bond Index Fund Institutional Class | 50,113,381 | 12,717,166 | 1,187,041 | 73,427 | (4,092) | 77,043 | 61,716,457 |
| Fidelity Institutional Money Market Funds Prime Reserves Portfolio Class I | 8,522,203 | 19,171,671 | 8,550,538 | 133,474 | (17) | 1,917 | 19,145,236 |
| Fidelity Insurance Portfolio | 6,086,712 | 819,706 | 6,001,998 | 717,946 | 2,473,516 | (3,377,936) | -- |
| Fidelity International Capital Appreciation Fund | 8,063,346 | 242,695 | 763,649 | -- | 5,084 | (59,879) | 7,487,597 |
| Fidelity International Discovery Fund | 29,098,951 | 887,841 | 2,697,886 | -- | (55,105) | (755,079) | 26,478,722 |
| Fidelity International Enhanced Index Fund | 26,910,815 | 828,889 | 2,457,957 | -- | (16,059) | (707,274) | 24,558,414 |
| Fidelity International Small Cap Fund | 15,637,038 | 467,885 | 4,315,154 | -- | 673,876 | (936,136) | 11,527,509 |
| Fidelity International Small Cap Opportunities Fund | 14,448,234 | 429,947 | 2,989,347 | -- | 372,745 | (284,468) | 11,977,111 |
| Fidelity International Value Fund | 19,144,694 | 584,754 | 1,794,119 | -- | (5,908) | (819,457) | 17,109,964 |
| Fidelity Investments Money Market Government Portfolio Institutional Class 1.81% | 5,017,733 | 35,240,750 | 37,343,279 | 113,929 | -- | -- | 2,915,204 |
| Fidelity Japan Smaller Companies Fund | 17,538,787 | 8,378,977 | 184,755 | -- | 842 | (707,456) | 25,026,395 |
| Fidelity Leisure Portfolio | 3,443,734 | 237,603 | 3,477,157 | 185,234 | (74,262) | (129,918) | -- |
| Fidelity Long-Term Treasury Bond Index Fund Institutional Class | 26,182,740 | 1,212,773 | 565,619 | 366,268 | (9,795) | (1,125,670) | 25,694,429 |
| Fidelity Low-Priced Stock Fund | 28,413,564 | 2,778,926 | 638,095 | -- | 1,035 | 268,393 | 30,823,823 |
| Fidelity Materials Portfolio | 15,916,471 | 1,014,928 | 15,479,553 | 745,425 | (1,459,942) | 8,096 | -- |
| Fidelity Medical Equipment and Systems Portfolio | 5,299,173 | 322,914 | 5,765,441 | 232,150 | 1,271,429 | (1,128,075) | -- |
| Fidelity Mega Cap Stock Fund | 42,150,387 | 4,967,960 | 1,357,176 | -- | 3,477 | 271,940 | 46,036,588 |
| Fidelity Multimedia Portfolio | 4,055,925 | 286,723 | 3,932,748 | 221,748 | (237,375) | (172,525) | -- |
| Fidelity New Markets Income Fund | 7,358,800 | 408,655 | 165,371 | 158,872 | (2,103) | (605,057) | 6,994,924 |
| Fidelity Overseas Fund | 128,232,790 | 4,033,610 | 29,136,713 | -- | 4,368,933 | (6,325,844) | 101,172,776 |
| Fidelity Pacific Basin Fund | 7,115,823 | 215,200 | 644,891 | -- | (587) | (231,337) | 6,454,208 |
| Fidelity Real Estate Investment Portfolio | 17,600,677 | 895,554 | 12,522,070 | 44,156 | (1,365,607) | 399,122 | 5,007,676 |
| Fidelity Stock Selector All Cap Fund | -- | 589,935,312 | 4,776,532 | -- | (19,572) | 12,143,419 | 597,282,627 |
| Fidelity Technology Portfolio | 134,135,816 | 16,079,137 | 145,777,505 | 13,707,859 | 36,287,258 | (40,724,706) | -- |
| Fidelity Telecommunications Portfolio | 8,355,094 | 261,074 | 8,105,171 | 116,220 | (624,186) | 113,189 | -- |
| Fidelity Transportation Portfolio | 3,580,542 | 221,246 | 3,468,514 | 166,356 | 197,734 | (531,008) | -- |
| Fidelity U.S. Bond Index Fund Institutional Premium Class | 265,768,692 | 66,879,453 | 41,361,239 | 3,621,692 | (1,120,196) | (6,939,002) | 283,227,708 |
| Fidelity Utilities Portfolio | 13,942,184 | 315,409 | 14,261,220 | 65,022 | 235,144 | (231,517) | -- |
| Fidelity Value Discovery Fund | 14,148,254 | 1,889,080 | 319,129 | -- | (1,434) | (272,382) | 15,444,389 |
| | $1,415,633,511 | $805,031,434 | $712,330,952 | $33,779,574 | $121,750,601 | $(142,803,277) | $1,487,281,317 |
(a) Includes the value of shares purchased or redeemed through in-kind transactions, if applicable. See the Notes to Financial Statements for additional details.
Amounts in the income column in the above table include any capital gain distributions from underlying funds, which are presented in the corresponding line-item in the Statement of Operations if applicable.
Investment Valuation
The following is a summary of the inputs used, as of June 30, 2018, involving the Fund's assets and liabilities carried at fair value. The inputs or methodology used for valuing securities may not be an indication of the risk associated with investing in those securities. For more information on valuation inputs, and their aggregation into the levels used below, please refer to the Investment Valuation section in the accompanying Notes to Financial Statements.
| | Valuation Inputs at Reporting Date: |
| Description | Total | Level 1 | Level 2 | Level 3 |
| Investments in Securities: | | | | |
| Equity Funds | $1,092,797,497 | $1,092,797,497 | $-- | $-- |
| Fixed-Income Funds | 392,568,190 | 392,568,190 | -- | -- |
| Money Market Funds | 23,778,206 | 23,778,206 | -- | -- |
| Other Short-Term Investments and Net Other Assets | 996,927 | -- | 996,927 | -- |
| Total Investments in Securities: | $1,510,140,820 | $1,509,143,893 | $996,927 | $-- |
| Derivative Instruments: | | | | |
| Assets | | | | |
| Futures Contracts | $743,920 | $743,920 | $-- | $-- |
| Total Assets | $743,920 | $743,920 | $-- | $-- |
| Total Derivative Instruments: | $743,920 | $743,920 | $-- | $-- |
Value of Derivative Instruments
The following table is a summary of the Fund's value of derivative instruments by primary risk exposure as of June 30, 2018. For additional information on derivative instruments, please refer to the Derivative Instruments section in the accompanying Notes to Financial Statements.
| Primary Risk Exposure / Derivative Type | Value |
| | Asset | Liability |
| Equity Risk | | |
| Futures Contracts(a) | $743,920 | $0 |
| Total Equity Risk | 743,920 | 0 |
| Total Value of Derivatives | $743,920 | $0 |
(a) Reflects gross cumulative appreciation (depreciation) on futures contracts as presented in the Schedule of Investments. In the Statement of Assets and Liabilities, the period end daily variation margin is included in receivable or payable for daily variation margin on futures contracts, and the net cumulative appreciation (depreciation) is included in net unrealized appreciation (depreciation).
See accompanying notes which are an integral part of the financial statements.
VIP FundsManager® 70% Portfolio
Financial Statements
Statement of Assets and Liabilities
| | | June 30, 2018 (Unaudited) |
| Assets | | |
Investment in securities, at value — See accompanying schedule:
Unaffiliated issuers (cost $20,219,812) | $21,141,737 | |
| Fidelity Central Funds (cost $1,717,766) | 1,717,766 | |
| Other affiliated issuers (cost $1,429,277,677) | 1,487,281,317 | |
| Total Investment in Securities (cost $1,451,215,255) | | $1,510,140,820 |
| Receivable for investments sold | | 46,037 |
| Receivable for fund shares sold | | 29,577 |
| Dividends receivable | | 100,783 |
| Distributions receivable from Fidelity Central Funds | | 1,600 |
| Other receivables | | 1,343 |
| Total assets | | 1,510,320,160 |
| Liabilities | | |
| Payable for fund shares redeemed | $47,095 | |
| Accrued management fee | 253,427 | |
| Distribution and service plan fees payable | 6,445 | |
| Payable for daily variation margin on futures contracts | 168,675 | |
| Total liabilities | | 475,642 |
| Net Assets | | $1,509,844,518 |
| Net Assets consist of: | | |
| Paid in capital | | $1,291,978,988 |
| Undistributed net investment income | | 4,055,147 |
| Accumulated undistributed net realized gain (loss) on investments | | 154,140,898 |
| Net unrealized appreciation (depreciation) on investments | | 59,669,485 |
| Net Assets | | $1,509,844,518 |
| Service Class: | | |
| Net Asset Value, offering price and redemption price per share ($70,249 ÷ 5,381 shares) | | $13.06 |
| Service Class 2: | | |
| Net Asset Value, offering price and redemption price per share ($51,202,345 ÷ 3,940,964 shares) | | $12.99 |
| Investor Class: | | |
| Net Asset Value, offering price and redemption price per share ($1,458,571,924 ÷ 111,754,501 shares) | | $13.05 |
See accompanying notes which are an integral part of the financial statements.
Statement of Operations
| | | Six months ended June 30, 2018 (Unaudited) |
| Investment Income | | |
| Dividends: | | |
| Unaffiliated issuers | | $185,157 |
| Affiliated issuers | | 5,473,728 |
| Interest | | 3,837 |
| Income from Fidelity Central Funds | | 10,573 |
| Total income | | 5,673,295 |
| Expenses | | |
| Management fee | $1,867,653 | |
| Distribution and service plan fees | 62,887 | |
| Independent trustees' fees and expenses | 3,201 | |
| Total expenses before reductions | 1,933,741 | |
| Expense reductions | (404,120) | |
| Total expenses after reductions | | 1,529,621 |
| Net investment income (loss) | | 4,143,674 |
| Realized and Unrealized Gain (Loss) | | |
| Net realized gain (loss) on: | | |
| Investment securities: | | |
| Unaffiliated issuers | 1,586,649 | |
| Fidelity Central Funds | 3,371,128 | |
| Other affiliated issuers | 121,750,601 | |
| Futures contracts | 84,283 | |
| Capital gain distributions from underlying funds: | | |
| Affiliated issuers | 28,305,846 | |
| Total net realized gain (loss) | | 155,098,507 |
| Change in net unrealized appreciation (depreciation) on: | | |
| Investment securities: | | |
| Unaffiliated issuers | (860,410) | |
| Affiliated issuers | (142,803,277) | |
| Futures contracts | 743,920 | |
| Total change in net unrealized appreciation (depreciation) | | (142,919,767) |
| Net gain (loss) | | 12,178,740 |
| Net increase (decrease) in net assets resulting from operations | | $16,322,414 |
See accompanying notes which are an integral part of the financial statements.
Statement of Changes in Net Assets
| | Six months ended June 30, 2018 (Unaudited) | Year ended December 31, 2017 |
| Increase (Decrease) in Net Assets | | |
| Operations | | |
| Net investment income (loss) | $4,143,674 | $13,321,959 |
| Net realized gain (loss) | 155,098,507 | 132,697,043 |
| Change in net unrealized appreciation (depreciation) | (142,919,767) | 84,272,124 |
| Net increase (decrease) in net assets resulting from operations | 16,322,414 | 230,291,126 |
| Distributions to shareholders from net investment income | (842,073) | (12,662,563) |
| Distributions to shareholders from net realized gain | (119,574,371) | (9,720,946) |
| Total distributions | (120,416,444) | (22,383,509) |
| Share transactions - net increase (decrease) | 138,814,903 | 90,530,791 |
| Total increase (decrease) in net assets | 34,720,873 | 298,438,408 |
| Net Assets | | |
| Beginning of period | 1,475,123,645 | 1,176,685,237 |
| End of period | $1,509,844,518 | $1,475,123,645 |
| Other Information | | |
| Undistributed net investment income end of period | $4,055,147 | $753,546 |
See accompanying notes which are an integral part of the financial statements.
Financial Highlights
VIP FundsManager 70% Portfolio Service Class
| | Six months ended (Unaudited) June 30, | Years endedDecember 31, | | | | |
| | 2018 | 2017 | 2016 | 2015 | 2014 | 2013 |
| Selected Per–Share Data | | | | | | |
| Net asset value, beginning of period | $14.04 | $11.97 | $12.05 | $12.40 | $12.01 | $10.04 |
| Income from Investment Operations | | | | | | |
| Net investment income (loss)A | .04 | .13 | .13 | .12 | .15 | .13 |
| Net realized and unrealized gain (loss) | .12 | 2.16 | .41 | (.06) | .48 | 2.05 |
| Total from investment operations | .16 | 2.29 | .54 | .06 | .63 | 2.18 |
| Distributions from net investment income | (.01) | (.12) | (.13) | (.12) | (.14) | (.12) |
| Distributions from net realized gain | (1.14) | (.09) | (.49) | (.29) | (.10) | (.09) |
| Total distributions | (1.14)B | (.22)C | (.62) | (.41) | (.24) | (.21) |
| Net asset value, end of period | $13.06 | $14.04 | $11.97 | $12.05 | $12.40 | $12.01 |
| Total ReturnD,E,F | 1.16% | 19.11% | 5.04% | .41% | 5.24% | 21.75% |
| Ratios to Average Net AssetsG,H,I | | | | | | |
| Expenses before reductions | .35%J | .35% | .35% | .35% | .35% | .35% |
| Expenses net of fee waivers, if any | .20%J | .20% | .20% | .20% | .20% | .20% |
| Expenses net of all reductions | .20%J | .20% | .20% | .20% | .20% | .20% |
| Net investment income (loss) | .56%J | 1.01% | 1.11% | .97% | 1.23% | 1.19% |
| Supplemental Data | | | | | | |
| Net assets, end of period (000 omitted) | $70 | $76 | $71 | $72 | $78 | $91 |
| Portfolio turnover rateG,K | 172%J | 57% | 45% | 44% | 49% | 31% |
A Calculated based on average shares outstanding during the period.
B Total distributions of $1.14 per share is comprised of distributions from net investment income of $.008 and distributions from net realized gain of $1.136 per share.
C Total distributions of $.22 per share is comprised of distributions from net investment income of $.123 and distributions from net realized gain of $.094 per share.
D Total returns for periods of less than one year are not annualized.
E Total returns do not reflect charges attributable to your insurance company's separate account. Inclusion of these charges would reduce the total returns shown.
F Total returns would have been lower if certain expenses had not been reduced during the applicable periods shown.
G Amounts do not include the activity of the Underlying Funds.
H Fees and expenses of any underlying Fidelity Central Funds are not included in the Fund's expense ratio. The Fund indirectly bears its proportionate share of the expenses of any underlying Fidelity Central Funds.
I Expense ratios reflect operating expenses of the class. Expenses before reductions do not reflect amounts reimbursed by the investment adviser or reductions from brokerage service arrangements or reductions from other expense offset arrangements and do not represent the amount paid by the class during periods when reimbursements or reductions occur. Expenses net of fee waivers reflect expenses after reimbursement by the investment adviser but prior to reductions from brokerage service arrangements or other expense offset arrangements. Expenses net of all reductions represent the net expenses paid by the class but do not include expenses of the underlying funds in which the Fund invests.
J Annualized
K Amount does not include the portfolio activity of any underlying Fidelity Central Funds.
See accompanying notes which are an integral part of the financial statements.
VIP FundsManager 70% Portfolio Service Class 2
| | Six months ended (Unaudited) June 30, | Years endedDecember 31, | | | | |
| | 2018 | 2017 | 2016 | 2015 | 2014 | 2013 |
| Selected Per–Share Data | | | | | | |
| Net asset value, beginning of period | $13.99 | $11.93 | $12.02 | $12.37 | $11.98 | $10.02 |
| Income from Investment Operations | | | | | | |
| Net investment income (loss)A | .03 | .11 | .11 | .10 | .13 | .12 |
| Net realized and unrealized gain (loss) | .11 | 2.15 | .41 | (.06) | .48 | 2.04 |
| Total from investment operations | .14 | 2.26 | .52 | .04 | .61 | 2.16 |
| Distributions from net investment income | (.01) | (.10) | (.12) | (.10) | (.13) | (.11) |
| Distributions from net realized gain | (1.14) | (.09) | (.49) | (.29) | (.10) | (.09) |
| Total distributions | (1.14)B | (.20)C | (.61) | (.39) | (.22)D | (.20) |
| Net asset value, end of period | $12.99 | $13.99 | $11.93 | $12.02 | $12.37 | $11.98 |
| Total ReturnE,F,G | 1.02% | 18.94% | 4.86% | .29% | 5.10% | 21.54% |
| Ratios to Average Net AssetsH,I,J | | | | | | |
| Expenses before reductions | .50%K | .50% | .50% | .50% | .50% | .50% |
| Expenses net of fee waivers, if any | .35%K | .35% | .35% | .35% | .35% | .35% |
| Expenses net of all reductions | .35%K | .35% | .35% | .35% | .35% | .35% |
| Net investment income (loss) | .41%K | .86% | .96% | .82% | 1.08% | 1.04% |
| Supplemental Data | | | | | | |
| Net assets, end of period (000 omitted) | $51,202 | $48,977 | $38,443 | $12,028 | $7,610 | $6,752 |
| Portfolio turnover rateH,L | 172%K | 57% | 45% | 44% | 49% | 31% |
A Calculated based on average shares outstanding during the period.
B Total distributions of $1.14 per share is comprised of distributions from net investment income of $.008 and distributions from net realized gain of $1.136 per share.
C Total distributions of $.20 per share is comprised of distributions from net investment income of $.104 and distributions from net realized gain of $.094 per share.
D Total distributions of $.22 per share is comprised of distributions from net investment income of $.126 and distributions from net realized gain of $.097 per share.
E Total returns for periods of less than one year are not annualized.
F Total returns do not reflect charges attributable to your insurance company's separate account. Inclusion of these charges would reduce the total returns shown.
G Total returns would have been lower if certain expenses had not been reduced during the applicable periods shown.
H Amounts do not include the activity of the Underlying Funds.
I Fees and expenses of any underlying Fidelity Central Funds are not included in the Fund's expense ratio. The Fund indirectly bears its proportionate share of the expenses of any underlying Fidelity Central Funds.
J Expense ratios reflect operating expenses of the class. Expenses before reductions do not reflect amounts reimbursed by the investment adviser or reductions from brokerage service arrangements or reductions from other expense offset arrangements and do not represent the amount paid by the class during periods when reimbursements or reductions occur. Expenses net of fee waivers reflect expenses after reimbursement by the investment adviser but prior to reductions from brokerage service arrangements or other expense offset arrangements. Expenses net of all reductions represent the net expenses paid by the class but do not include expenses of the underlying funds in which the Fund invests.
K Annualized
L Amount does not include the portfolio activity of any underlying Fidelity Central Funds.
See accompanying notes which are an integral part of the financial statements.
VIP FundsManager 70% Portfolio Investor Class
| | Six months ended (Unaudited) June 30, | Years endedDecember 31, | | | | |
| | 2018 | 2017 | 2016 | 2015 | 2014 | 2013 |
| Selected Per–Share Data | | | | | | |
| Net asset value, beginning of period | $14.04 | $11.96 | $12.05 | $12.39 | $12.01 | $10.04 |
| Income from Investment Operations | | | | | | |
| Net investment income (loss)A | .04 | .13 | .13 | .12 | .15 | .13 |
| Net realized and unrealized gain (loss) | .11 | 2.17 | .40 | (.05) | .47 | 2.05 |
| Total from investment operations | .15 | 2.30 | .53 | .07 | .62 | 2.18 |
| Distributions from net investment income | (.01) | (.12) | (.13) | (.12) | (.14) | (.12) |
| Distributions from net realized gain | (1.14) | (.09) | (.49) | (.29) | (.10) | (.09) |
| Total distributions | (1.14)B | (.22)C | (.62) | (.41) | (.24) | (.21) |
| Net asset value, end of period | $13.05 | $14.04 | $11.96 | $12.05 | $12.39 | $12.01 |
| Total ReturnD,E,F | 1.09% | 19.21% | 4.96% | .49% | 5.15% | 21.75% |
| Ratios to Average Net AssetsG,H,I | | | | | | |
| Expenses before reductions | .25%J | .25% | .25% | .25% | .25% | .25% |
| Expenses net of fee waivers, if any | .20%J | .20% | .20% | .20% | .20% | .20% |
| Expenses net of all reductions | .20%J | .20% | .20% | .20% | .20% | .20% |
| Net investment income (loss) | .56%J | 1.01% | 1.11% | .97% | 1.23% | 1.19% |
| Supplemental Data | | | | | | |
| Net assets, end of period (000 omitted) | $1,458,572 | $1,426,071 | $1,138,172 | $1,096,702 | $1,019,291 | $869,781 |
| Portfolio turnover rateG,K | 172%J | 57% | 45% | 44% | 49% | 31% |
A Calculated based on average shares outstanding during the period.
B Total distributions of $1.14 per share is comprised of distributions from net investment income of $.008 and distributions from net realized gain of $1.136 per share.
C Total distributions of $.22 per share is comprised of distributions from net investment income of $.123 and distributions from net realized gain of $.094 per share.
D Total returns for periods of less than one year are not annualized.
E Total returns do not reflect charges attributable to your insurance company's separate account. Inclusion of these charges would reduce the total returns shown.
F Total returns would have been lower if certain expenses had not been reduced during the applicable periods shown.
G Amounts do not include the activity of the Underlying Funds.
H Fees and expenses of any underlying Fidelity Central Funds are not included in the Fund's expense ratio. The Fund indirectly bears its proportionate share of the expenses of any underlying Fidelity Central Funds.
I Expense ratios reflect operating expenses of the class. Expenses before reductions do not reflect amounts reimbursed by the investment adviser or reductions from brokerage service arrangements or reductions from other expense offset arrangements and do not represent the amount paid by the class during periods when reimbursements or reductions occur. Expenses net of fee waivers reflect expenses after reimbursement by the investment adviser but prior to reductions from brokerage service arrangements or other expense offset arrangements. Expenses net of all reductions represent the net expenses paid by the class but do not include expenses of the underlying funds in which the Fund invests.
J Annualized
K Amount does not include the portfolio activity of any underlying Fidelity Central Funds.
See accompanying notes which are an integral part of the financial statements.
VIP FundsManager® 85% Portfolio
Investment Summary (Unaudited)
The information in the following tables is based on the direct investments of the Fund.
Top Holdings as of June 30, 2018
| | % of fund's net assets |
| Fidelity Stock Selector All Cap Fund | 48.0 |
| Fidelity U.S. Bond Index Fund Institutional Class | 8.1 |
| Fidelity Overseas Fund | 7.9 |
| Fidelity Mega Cap Stock Fund | 3.7 |
| Fidelity Diversified International Fund | 2.5 |
| Fidelity Contrafund | 2.5 |
| Fidelity Equity-Income Fund | 2.5 |
| Fidelity Low-Priced Stock Fund | 2.5 |
| Fidelity International Discovery Fund | 2.1 |
| Fidelity Inflation-Protected Bond Index Fund Institutional Class | 2.0 |
| | 81.8 |
Asset Allocation (% of fund's net assets)
| Period end* |
| | Domestic Equity Funds | 64.2% |
| | International Equity Funds | 22.9% |
| | Bond Funds | 12.7% |
| | Short-Term Funds | 0.2% |

* Futures - (1.0)%
VIP FundsManager® 85% Portfolio
Schedule of Investments June 30, 2018 (Unaudited)
Showing Percentage of Net Assets
| Equity Funds - 87.1% | | | |
| | | Shares | Value |
| Fidelity Commodity Strategy Fund (a) | | 422,240 | $4,446,186 |
| Fidelity Contrafund (a) | | 105,223 | 13,896,790 |
| Fidelity Diversified International Fund (a) | | 358,845 | 13,980,608 |
| Fidelity Emerging Asia Fund (a) | | 20,884 | 897,156 |
| Fidelity Emerging Markets Discovery Fund (a) | | 118,028 | 1,694,881 |
| Fidelity Emerging Markets Fund (a) | | 163,166 | 4,997,776 |
| Fidelity Equity-Income Fund (a) | | 237,514 | 13,678,434 |
| Fidelity Europe Fund (a) | | 129,018 | 5,243,296 |
| Fidelity Global Commodity Stock Fund (a) | | 507,986 | 6,939,084 |
| Fidelity International Capital Appreciation Fund (a) | | 156,216 | 3,263,347 |
| Fidelity International Discovery Fund (a) | | 259,829 | 11,502,629 |
| Fidelity International Enhanced Index Fund (a) | | 1,082,044 | 10,658,136 |
| Fidelity International Small Cap Fund (a) | | 173,586 | 5,060,036 |
| Fidelity International Small Cap Opportunities Fund (a) | | 268,589 | 5,199,873 |
| Fidelity International Value Fund (a) | | 856,745 | 7,402,279 |
| Fidelity Japan Smaller Companies Fund (a) | | 586,588 | 10,863,604 |
| Fidelity Low-Priced Stock Fund (a) | | 248,341 | 13,658,766 |
| Fidelity Mega Cap Stock Fund (a) | | 1,161,468 | 20,348,923 |
| Fidelity Overseas Fund (a) | | 879,020 | 43,766,387 |
| Fidelity Pacific Basin Fund (a) | | 81,271 | 2,781,905 |
| Fidelity Real Estate Investment Portfolio (a) | | 51,800 | 2,189,582 |
| Fidelity Stock Selector All Cap Fund (a) | | 5,776,926 | 265,796,386 |
| Fidelity Value Discovery Fund (a) | | 240,127 | 6,814,806 |
| iShares S&P 500 Index ETF | | 27,645 | 7,548,467 |
| TOTAL EQUITY FUNDS | | | |
| (Cost $459,181,806) | | | 482,629,337 |
|
| Fixed-Income Funds - 12.7% | | | |
| Fidelity Floating Rate High Income Fund (a) | | 576,986 | 5,533,293 |
| Fidelity Inflation-Protected Bond Index Fund Institutional Class (a) | | 1,154,960 | 11,341,711 |
| Fidelity Long-Term Treasury Bond Index Fund Institutional Class (a) | | 698,558 | 8,871,689 |
| Fidelity U.S. Bond Index Fund Institutional Class (a) | | 3,969,164 | 44,613,398 |
| TOTAL FIXED-INCOME FUNDS | | | |
| (Cost $70,415,274) | | | 70,360,091 |
|
| Money Market Funds - 0.2% | | | |
| Fidelity Cash Central Fund, 1.93% (b) | | 550,510 | 550,620 |
| Fidelity Investments Money Market Government Portfolio Institutional Class 1.81% (a)(c) | | 331,578 | 331,578 |
| TOTAL MONEY MARKET FUNDS | | | |
| (Cost $882,198) | | | 882,198 |
| | | Principal Amount | Value |
|
| U.S. Treasury Obligations - 0.0% | | | |
| U.S. Treasury Bills, yield at date of purchase 1.9% 9/20/18 (d) | | | |
| (Cost $268,851) | | 270,000 | 268,874 |
| TOTAL INVESTMENT IN SECURITIES - 100.0% | | | |
| (Cost $530,748,129) | | | 554,140,500 |
| NET OTHER ASSETS (LIABILITIES) - 0.0% | | | (108,450) |
| NET ASSETS - 100% | | | $554,032,050 |
| Futures Contracts | | | | | |
| | Number of contracts | Expiration Date | Notional Amount | Value | Unrealized Appreciation/(Depreciation) |
| Sold | | | | | |
| Equity Index Contracts | | | | | |
| ICE E-mini MSCI EAFE Index Contracts (United States) | 42 | Sept. 2018 | $4,106,340 | $123,782 | $123,781 |
| ICE E-mini MSCI Emerging Markets Index Contracts (United States) | 23 | Sept. 2018 | 1,222,795 | 79,512 | 79,512 |
| TOTAL FUTURES CONTRACTS | | | | | $203,293 |
The notional amount of futures sold as a percentage of Net Assets is 1.0%
Security Type Abbreviations
ETF – Exchange-Traded Fund
Legend
(a) Affiliated Fund
(b) Affiliated fund that is generally available only to investment companies and other accounts managed by Fidelity Investments. The rate quoted is the annualized seven-day yield of the fund at period end. A complete unaudited listing of the fund's holdings as of its most recent quarter end is available upon request. In addition, each Fidelity Central Fund's financial statements are available on the SEC's website or upon request.
(c) The rate quoted is the annualized seven-day yield of the fund at period end.
(d) Security or a portion of the security was pledged to cover margin requirements for futures contracts. At period end, the value of securities pledged amounted to $268,874.
Affiliated Central Funds
Information regarding fiscal year to date income earned by the Fund from investments in Fidelity Central Funds is as follows:
| Fund | Income earned |
| Fidelity Cash Central Fund | $12,262 |
| Total | $12,262 |
Amounts in the income column in the above table include any capital gain distributions from underlying funds, which are presented in the corresponding line-item in the Statement of Operations if applicable.
Fiscal year to date information regarding the Fund’s investments in non-Money Market Central Funds, including the ownership percentage, is presented below.
| Affiliate | Value, beginning of period | Purchases(a) | Sales Proceeds(a) | Realized Gain (loss) | Change in Unrealized appreciation (depreciation) | Value, end of period | % ownership, end of period |
| Fidelity Consumer Discretionary Central Fund | $-- | $27,692,943 | $27,922,295 | $229,352 | $-- | $-- | 0.0% |
| Fidelity Consumer Staples Central Fund | -- | 15,299,989 | 15,429,457 | 129,468 | -- | -- | 0.0% |
| Fidelity Energy Central Fund | -- | 13,209,918 | 13,346,558 | 136,640 | -- | -- | 0.0% |
| Fidelity Financials Central Fund | -- | 40,267,335 | 40,471,405 | 204,070 | -- | -- | 0.0% |
| Fidelity Health Care Central Fund | -- | 35,171,979 | 35,288,177 | 116,198 | -- | -- | 0.0% |
| Fidelity Industrials Central Fund | -- | 26,520,581 | 26,786,958 | 266,377 | -- | -- | 0.0% |
| Fidelity Information Technology Central Fund | -- | 65,165,061 | 65,401,978 | 236,917 | -- | -- | 0.0% |
| Fidelity Materials Central Fund | -- | 7,976,736 | 8,058,793 | 82,057 | -- | -- | 0.0% |
| Fidelity Telecom Services Central Fund | -- | 3,705,101 | 3,759,136 | 54,035 | -- | -- | 0.0% |
| Fidelity Utilities Central Fund | -- | 6,416,927 | 6,498,005 | 81,078 | -- | -- | 0.0% |
| | $-- | $241,426,570 | $242,962,762 | $1,536,192 | $-- | $-- | |
(a) Includes the value of shares purchased or redeemed through in-kind transactions, if applicable. See the Notes to Financial Statements for additional details.
Amounts in the income column in the above table include any capital gain distributions from underlying funds, which are presented in the corresponding line-item in the Statement of Operations if applicable.
Affiliated Underlying Funds
Fiscal year to date information regarding the Fund's investments in affiliated Underlying Funds, excluding any Money Market Central Funds, is presented below. Exchanges between classes of the same affiliated Underlying Funds may occur.
| Affiliate | Value, beginning of period | Purchases(a) | Sales Proceeds(a) | Dividend Income | Realized Gain (loss) | Change in Unrealized appreciation (depreciation) | Value, end of period |
| Fidelity Air Transportation Portfolio | $2,070,849 | $173,013 | $2,020,421 | $110,174 | $(471) | $(222,970) | $-- |
| Fidelity Banking Portfolio | 4,912,947 | 540,522 | 5,063,228 | 373,452 | 2,570,062 | (2,960,303) | -- |
| Fidelity Biotechnology Portfolio | 2,749,582 | 212,842 | 2,939,380 | 112,671 | 442,671 | (465,715) | -- |
| Fidelity Brokerage and Investment Management Portfolio | 1,092,950 | 89,865 | 1,133,020 | 53,596 | 114,835 | (164,630) | -- |
| Fidelity Chemicals Portfolio | 1,038,722 | 95,949 | 1,017,440 | 61,495 | 340,854 | (458,085) | -- |
| Fidelity Commodity Strategy Fund | 5,177,087 | 1,834,604 | 2,531,878 | -- | (17,333) | (16,294) | 4,446,186 |
| Fidelity Construction and Housing Portfolio | 1,541,447 | 118,051 | 1,468,365 | 71,533 | (236,270) | 45,137 | -- |
| Fidelity Consumer Discretionary Portfolio | 21,631,752 | 1,440,713 | 23,291,655 | 370,571 | 7,523,616 | (7,304,426) | -- |
| Fidelity Consumer Staples Portfolio | 15,802,762 | 1,552,390 | 15,488,896 | 945,147 | 1,801,483 | (3,667,739) | -- |
| Fidelity Contrafund | 11,487,804 | 2,034,594 | 601,148 | 189,594 | (637) | 976,177 | 13,896,790 |
| Fidelity Defense and Aerospace Portfolio | 7,146,864 | 461,846 | 7,926,425 | 224,171 | 1,779,393 | (1,461,678) | -- |
| Fidelity Diversified International Fund | 14,697,502 | 787,310 | 1,127,521 | -- | (28,830) | (347,853) | 13,980,608 |
| Fidelity Emerging Asia Fund | 1,305,968 | 51,480 | 422,289 | -- | 120,624 | (158,627) | 897,156 |
| Fidelity Emerging Markets Discovery Fund | 2,339,352 | 90,069 | 639,113 | -- | 31,573 | (127,000) | 1,694,881 |
| Fidelity Emerging Markets Fund | 9,654,078 | 473,729 | 4,861,723 | -- | 208,367 | (476,675) | 4,997,776 |
| Fidelity Energy Portfolio | 12,678,515 | 604,551 | 13,363,233 | -- | 1,706,635 | (1,626,468) | -- |
| Fidelity Equity-Income Fund | 12,252,712 | 2,399,223 | 301,268 | 354,102 | (4,307) | (667,926) | 13,678,434 |
| Fidelity Europe Fund | 5,584,434 | 300,721 | 425,120 | -- | 18,555 | (235,294) | 5,243,296 |
| Fidelity Financial Services Portfolio | 25,342,798 | 1,801,790 | 26,209,229 | 623,314 | 5,601,829 | (6,537,188) | -- |
| Fidelity Floating Rate High Income Fund | 7,552,468 | 3,119,845 | 5,131,022 | 114,338 | 126,857 | (134,855) | 5,533,293 |
| Fidelity Focused High Income Fund | 3,788 | 67 | 3,737 | 78 | 138 | (256) | -- |
| Fidelity Global Commodity Stock Fund | 5,378,234 | 1,434,615 | 131,889 | -- | 2,655 | 255,469 | 6,939,084 |
| Fidelity Health Care Portfolio | 26,796,811 | 2,371,140 | 30,066,931 | 1,022,096 | 7,969,544 | (7,070,564) | -- |
| Fidelity Industrial Equipment Portfolio | 5,092,739 | 683,420 | 15,447 | 646,483 | (769) | (337,637) | -- |
| Fidelity Industrials Portfolio | 9,805,105 | 1,319,064 | 15,349,169 | 631,020 | 4,289,358 | (5,486,664) | -- |
| Fidelity Inflation-Protected Bond Index Fund Institutional Class | 2,591,763 | 8,779,736 | 157,777 | 10,187 | (364) | 128,353 | 11,341,711 |
| Fidelity Insurance Portfolio | 2,663,128 | 407,874 | 2,668,373 | 319,963 | 1,048,913 | (1,451,542) | -- |
| Fidelity International Capital Appreciation Fund | 3,383,963 | 178,379 | 274,142 | -- | 1,599 | (26,452) | 3,263,347 |
| Fidelity International Discovery Fund | 12,176,860 | 651,812 | 971,009 | -- | (17,178) | (337,856) | 11,502,629 |
| Fidelity International Enhanced Index Fund | 11,318,749 | 607,645 | 952,779 | -- | (5,994) | (309,485) | 10,658,136 |
| Fidelity International Small Cap Fund | 6,577,820 | 343,597 | 1,742,747 | -- | 24,142 | (142,776) | 5,060,036 |
| Fidelity International Small Cap Opportunities Fund | 6,083,243 | 314,938 | 1,230,866 | -- | 92,020 | (59,462) | 5,199,873 |
| Fidelity International Value Fund | 8,010,399 | 429,266 | 678,637 | -- | (2,618) | (356,131) | 7,402,279 |
| Fidelity Investments Money Market Government Portfolio Institutional Class 1.81% | -- | 6,628,427 | 6,296,849 | 14,740 | -- | -- | 331,578 |
| Fidelity Japan Smaller Companies Fund | 7,341,195 | 3,900,760 | 65,376 | -- | (55) | (312,920) | 10,863,604 |
| Fidelity Leisure Portfolio | 1,481,606 | 125,730 | 1,517,973 | 81,025 | (21,170) | (68,193) | -- |
| Fidelity Long-Term Treasury Bond Index Fund Institutional Class | 8,820,548 | 639,918 | 209,845 | 125,563 | (2,533) | (376,399) | 8,871,689 |
| Fidelity Low-Priced Stock Fund | 12,393,825 | 1,544,984 | 401,131 | -- | (109) | 121,197 | 13,658,766 |
| Fidelity Materials Portfolio | 7,040,928 | 680,469 | 7,059,976 | 343,229 | (697,971) | 36,550 | -- |
| Fidelity Medical Equipment and Systems Portfolio | 2,335,897 | 184,781 | 2,582,821 | 104,242 | 585,083 | (522,940) | -- |
| Fidelity Mega Cap Stock Fund | 18,458,585 | 2,616,170 | 851,289 | -- | 426 | 125,031 | 20,348,923 |
| Fidelity Multimedia Portfolio | 1,774,584 | 154,277 | 1,746,010 | 98,691 | (103,320) | (79,531) | -- |
| Fidelity Overseas Fund | 54,118,389 | 2,960,314 | 12,485,789 | -- | 1,708,241 | (2,534,768) | 43,766,387 |
| Fidelity Pacific Basin Fund | 2,990,711 | 157,207 | 265,399 | -- | (1,917) | (98,697) | 2,781,905 |
| Fidelity Real Estate Investment Portfolio | 7,727,591 | 616,694 | 5,734,917 | 19,881 | (627,058) | 207,272 | 2,189,582 |
| Fidelity Stock Selector All Cap Fund | -- | 264,575,905 | 4,262,623 | -- | (15,018) | 5,498,122 | 265,796,386 |
| Fidelity Technology Portfolio | 59,231,269 | 8,819,692 | 65,939,940 | 6,229,852 | 16,280,622 | (18,391,643) | -- |
| Fidelity Telecommunications Portfolio | 3,698,240 | 287,118 | 3,751,862 | 54,662 | (299,467) | 65,971 | -- |
| Fidelity Transportation Portfolio | 1,555,377 | 121,101 | 1,529,528 | 73,518 | 181,085 | (328,035) | -- |
| Fidelity U.S. Bond Index Fund Institutional Class | 37,856,867 | 8,834,872 | 951,143 | 533,007 | (6,863) | (1,120,335) | 44,613,398 |
| Fidelity Utilities Portfolio | 6,137,965 | 351,167 | 6,498,617 | 29,931 | 61,575 | (52,090) | -- |
| Fidelity Value Discovery Fund | 6,214,544 | 872,512 | 150,585 | -- | (926) | (120,739) | 6,814,806 |
| | $505,121,316 | $339,776,758 | $292,507,550 | $13,942,326 | $52,541,577 | $(59,159,562) | $545,772,539 |
(a) Includes the value of shares purchased or redeemed through in-kind transactions, if applicable. See the Notes to Financial Statements for additional details.
Amounts in the income column in the above table include any capital gain distributions from underlying funds, which are presented in the corresponding line-item in the Statement of Operations if applicable.
Investment Valuation
The following is a summary of the inputs used, as of June 30, 2018, involving the Fund's assets and liabilities carried at fair value. The inputs or methodology used for valuing securities may not be an indication of the risk associated with investing in those securities. For more information on valuation inputs, and their aggregation into the levels used below, please refer to the Investment Valuation section in the accompanying Notes to Financial Statements.
| | Valuation Inputs at Reporting Date: |
| Description | Total | Level 1 | Level 2 | Level 3 |
| Investments in Securities: | | | | |
| Equity Funds | $482,629,337 | $482,629,337 | $-- | $-- |
| Fixed-Income Funds | 70,360,091 | 70,360,091 | -- | -- |
| Money Market Funds | 882,198 | 882,198 | -- | -- |
| Other Short-Term Investments and Net Other Assets | 268,874 | -- | 268,874 | -- |
| Total Investments in Securities: | $554,140,500 | $553,871,626 | $268,874 | $-- |
| Derivative Instruments: | | | | |
| Assets | | | | |
| Futures Contracts | $203,293 | $203,293 | $-- | $-- |
| Total Assets | $203,293 | $203,293 | $-- | $-- |
| Total Derivative Instruments: | $203,293 | $203,293 | $-- | $-- |
Value of Derivative Instruments
The following table is a summary of the Fund's value of derivative instruments by primary risk exposure as of June 30, 2018. For additional information on derivative instruments, please refer to the Derivative Instruments section in the accompanying Notes to Financial Statements.
| Primary Risk Exposure / Derivative Type | Value |
| | Asset | Liability |
| Equity Risk | | |
| Futures Contracts(a) | $203,293 | $0 |
| Total Equity Risk | 203,293 | 0 |
| Total Value of Derivatives | $203,293 | $0 |
(a) Reflects gross cumulative appreciation (depreciation) on futures contracts as presented in the Schedule of Investments. In the Statement of Assets and Liabilities, the period end daily variation margin is included in receivable or payable for daily variation margin on futures contracts, and the net cumulative appreciation (depreciation) is included in net unrealized appreciation (depreciation).
See accompanying notes which are an integral part of the financial statements.
VIP FundsManager® 85% Portfolio
Financial Statements
Statement of Assets and Liabilities
| | | June 30, 2018 (Unaudited) |
| Assets | | |
Investment in securities, at value — See accompanying schedule:
Unaffiliated issuers (cost $7,471,780) | $7,817,341 | |
| Fidelity Central Funds (cost $550,620) | 550,620 | |
| Other affiliated issuers (cost $522,725,729) | 545,772,539 | |
| Total Investment in Securities (cost $530,748,129) | | $554,140,500 |
| Receivable for investments sold | | 702,325 |
| Receivable for fund shares sold | | 2,558 |
| Dividends receivable | | 35,469 |
| Distributions receivable from Fidelity Central Funds | | 524 |
| Other receivables | | 466 |
| Total assets | | 554,881,842 |
| Liabilities | | |
| Payable for fund shares redeemed | $704,895 | |
| Accrued management fee | 93,476 | |
| Distribution and service plan fees payable | 4,316 | |
| Payable for daily variation margin on futures contracts | 47,105 | |
| Total liabilities | | 849,792 |
| Net Assets | | $554,032,050 |
| Net Assets consist of: | | |
| Paid in capital | | $462,766,510 |
| Undistributed net investment income | | 608,682 |
| Accumulated undistributed net realized gain (loss) on investments | | 67,061,194 |
| Net unrealized appreciation (depreciation) on investments | | 23,595,664 |
| Net Assets | | $554,032,050 |
| Service Class: | | |
| Net Asset Value, offering price and redemption price per share ($1,071 ÷ 81 shares) | | $13.22 |
| Service Class 2: | | |
| Net Asset Value, offering price and redemption price per share ($34,166,969 ÷ 2,599,155 shares) | | $13.15 |
| Investor Class: | | |
| Net Asset Value, offering price and redemption price per share ($519,864,010 ÷ 39,301,461 shares) | | $13.23 |
See accompanying notes which are an integral part of the financial statements.
Statement of Operations
| | | Six months ended June 30, 2018 (Unaudited) |
| Investment Income | | |
| Dividends: | | |
| Unaffiliated issuers | | $69,381 |
| Affiliated issuers | | 1,125,649 |
| Interest | | 1,503 |
| Income from Fidelity Central Funds | | 12,262 |
| Total income | | 1,208,795 |
| Expenses | | |
| Management fee | $681,597 | |
| Distribution and service plan fees | 42,690 | |
| Independent trustees' fees and expenses | 1,159 | |
| Total expenses before reductions | 725,446 | |
| Expense reductions | (155,386) | |
| Total expenses after reductions | | 570,060 |
| Net investment income (loss) | | 638,735 |
| Realized and Unrealized Gain (Loss) | | |
| Net realized gain (loss) on: | | |
| Investment securities: | | |
| Unaffiliated issuers | 545,606 | |
| Fidelity Central Funds | 1,536,192 | |
| Other affiliated issuers | 52,541,577 | |
| Futures contracts | (53,901) | |
| Capital gain distributions from underlying funds: | | |
| Affiliated issuers | 12,816,677 | |
| Total net realized gain (loss) | | 67,386,151 |
| Change in net unrealized appreciation (depreciation) on: | | |
| Investment securities: | | |
| Unaffiliated issuers | (289,566) | |
| Affiliated issuers | (59,159,562) | |
| Futures contracts | 203,293 | |
| Total change in net unrealized appreciation (depreciation) | | (59,245,835) |
| Net gain (loss) | | 8,140,316 |
| Net increase (decrease) in net assets resulting from operations | | $8,779,051 |
See accompanying notes which are an integral part of the financial statements.
Statement of Changes in Net Assets
| | Six months ended June 30, 2018 (Unaudited) | Year ended December 31, 2017 |
| Increase (Decrease) in Net Assets | | |
| Operations | | |
| Net investment income (loss) | $638,735 | $3,835,244 |
| Net realized gain (loss) | 67,386,151 | 55,274,276 |
| Change in net unrealized appreciation (depreciation) | (59,245,835) | 38,870,529 |
| Net increase (decrease) in net assets resulting from operations | 8,779,051 | 97,980,049 |
| Distributions to shareholders from net investment income | (221,852) | (3,643,445) |
| Distributions to shareholders from net realized gain | (48,696,408) | (4,663,732) |
| Total distributions | (48,918,260) | (8,307,177) |
| Share transactions - net increase (decrease) | 67,798,540 | 4,657,475 |
| Total increase (decrease) in net assets | 27,659,331 | 94,330,347 |
| Net Assets | | |
| Beginning of period | 526,372,719 | 432,042,372 |
| End of period | $554,032,050 | $526,372,719 |
| Other Information | | |
| Undistributed net investment income end of period | $608,682 | $191,799 |
See accompanying notes which are an integral part of the financial statements.
Financial Highlights
VIP FundsManager 85% Portfolio Service Class
| | Six months ended (Unaudited) June 30, | Years endedDecember 31, | | | | |
| | 2018 | 2017 | 2016 | 2015 | 2014 | 2013 |
| Selected Per–Share Data | | | | | | |
| Net asset value, beginning of period | $14.30 | $11.81 | $11.87 | $12.46 | $12.07 | $9.62 |
| Income from Investment Operations | | | | | | |
| Net investment income (loss)A | .01 | .11 | .11 | .09 | .13 | .11 |
| Net realized and unrealized gain (loss) | .23 | 2.61 | .48 | (.03) | .51 | 2.57 |
| Total from investment operations | .24 | 2.72 | .59 | .06 | .64 | 2.68 |
| Distributions from net investment income | (.01) | (.10) | (.11) | (.16)B | (.13) | (.10) |
| Distributions from net realized gain | (1.32) | (.13) | (.54) | (.49)B | (.13) | (.13) |
| Total distributions | (1.32)C | (.23) | (.65) | (.65) | (.25)D | (.23) |
| Net asset value, end of period | $13.22 | $14.30 | $11.81 | $11.87 | $12.46 | $12.07 |
| Total ReturnE,F,G | 1.67% | 23.05% | 5.66% | .39% | 5.29% | 27.86% |
| Ratios to Average Net AssetsH,I,J | | | | | | |
| Expenses before reductions | .30%K | .36% | .35% | .35% | .35% | .35% |
| Expenses net of fee waivers, if any | .20%K | .20% | .20% | .20% | .20% | .20% |
| Expenses net of all reductions | .20%K | .20% | .20% | .20% | .20% | .20% |
| Net investment income (loss) | .16%K | .81% | .96% | .74% | 1.04% | 1.00% |
| Supplemental Data | | | | | | |
| Net assets, end of period (000 omitted) | $1 | $2 | $8 | $8 | $8 | $242 |
| Portfolio turnover rateH,L | 203%K | 70% | 59% | 67% | 72% | 51% |
A Calculated based on average shares outstanding during the period.
B The amounts shown reflect certain reclassifications related to book to tax differences that were made in the year shown.
C Total distributions of $1.32 per share is comprised of distributions from net investment income of $.006 and distributions from net realized gain of $1.317 per share.
D Total distributions of $.25 per share is comprised of distributions from net investment income of $.125 and distributions from net realized gain of $.125 per share.
E Total returns for periods of less than one year are not annualized.
F Total returns do not reflect charges attributable to your insurance company's separate account. Inclusion of these charges would reduce the total returns shown.
G Total returns would have been lower if certain expenses had not been reduced during the applicable periods shown.
H Amounts do not include the activity of the Underlying Funds.
I Fees and expenses of any underlying Fidelity Central Funds are not included in the Fund's expense ratio. The Fund indirectly bears its proportionate share of the expenses of any underlying Fidelity Central Funds.
J Expense ratios reflect operating expenses of the class. Expenses before reductions do not reflect amounts reimbursed by the investment adviser or reductions from brokerage service arrangements or reductions from other expense offset arrangements and do not represent the amount paid by the class during periods when reimbursements or reductions occur. Expenses net of fee waivers reflect expenses after reimbursement by the investment adviser but prior to reductions from brokerage service arrangements or other expense offset arrangements. Expenses net of all reductions represent the net expenses paid by the class but do not include expenses of the underlying funds in which the Fund invests.
K Annualized
L Amount does not include the portfolio activity of any underlying Fidelity Central Funds.
See accompanying notes which are an integral part of the financial statements.
VIP FundsManager 85% Portfolio Service Class 2
| | Six months ended (Unaudited) June 30, | Years endedDecember 31, | | | | |
| | 2018 | 2017 | 2016 | 2015 | 2014 | 2013 |
| Selected Per–Share Data | | | | | | |
| Net asset value, beginning of period | $14.24 | $11.76 | $11.83 | $12.41 | $12.03 | $9.60 |
| Income from Investment Operations | | | | | | |
| Net investment income (loss)A | .01 | .09 | .09 | .07 | .11 | .09 |
| Net realized and unrealized gain (loss) | .22 | 2.60 | .47 | (.01) | .50 | 2.55 |
| Total from investment operations | .23 | 2.69 | .56 | .06 | .61 | 2.64 |
| Distributions from net investment income | (.01) | (.08) | (.09) | (.15)B | (.11) | (.09) |
| Distributions from net realized gain | (1.32) | (.13) | (.54) | (.49)B | (.13) | (.13) |
| Total distributions | (1.32)C | (.21) | (.63) | (.64) | (.23)D | (.21)E |
| Net asset value, end of period | $13.15 | $14.24 | $11.76 | $11.83 | $12.41 | $12.03 |
| Total ReturnF,G,H | 1.61% | 22.90% | 5.47% | .35% | 5.08% | 27.54% |
| Ratios to Average Net AssetsI,J,K | | | | | | |
| Expenses before reductions | .50%L | .50% | .50% | .50% | .50% | .50% |
| Expenses net of fee waivers, if any | .35%L | .35% | .35% | .35% | .35% | .35% |
| Expenses net of all reductions | .35%L | .35% | .35% | .35% | .35% | .35% |
| Net investment income (loss) | .09%L | .66% | .81% | .59% | .89% | .85% |
| Supplemental Data | | | | | | |
| Net assets, end of period (000 omitted) | $34,167 | $33,540 | $24,790 | $10,346 | $8,207 | $6,862 |
| Portfolio turnover rateI,M | 203%L | 70% | 59% | 67% | 72% | 51% |
A Calculated based on average shares outstanding during the period.
B The amounts shown reflect certain reclassifications related to book to tax differences that were made in the year shown.
C Total distributions of $1.32 per share is comprised of distributions from net investment income of $.006 and distributions from net realized gain of $1.317 per share.
D Total distributions of $.23 per share is comprised of distributions from net investment income of $.107 and distributions from net realized gain of $.126 per share.
E Total distributions of $.21 per share is comprised of distributions from net investment income of $.085 and distributions from net realized gain of $.128 per share.
F Total returns for periods of less than one year are not annualized.
G Total returns do not reflect charges attributable to your insurance company's separate account. Inclusion of these charges would reduce the total returns shown.
H Total returns would have been lower if certain expenses had not been reduced during the applicable periods shown.
I Amounts do not include the activity of the Underlying Funds.
J Fees and expenses of any underlying Fidelity Central Funds are not included in the Fund's expense ratio. The Fund indirectly bears its proportionate share of the expenses of any underlying Fidelity Central Funds.
K Expense ratios reflect operating expenses of the class. Expenses before reductions do not reflect amounts reimbursed by the investment adviser or reductions from brokerage service arrangements or reductions from other expense offset arrangements and do not represent the amount paid by the class during periods when reimbursements or reductions occur. Expenses net of fee waivers reflect expenses after reimbursement by the investment adviser but prior to reductions from brokerage service arrangements or other expense offset arrangements. Expenses net of all reductions represent the net expenses paid by the class but do not include expenses of the underlying funds in which the Fund invests.
L Annualized
M Amount does not include the portfolio activity of any underlying Fidelity Central Funds.
See accompanying notes which are an integral part of the financial statements.
VIP FundsManager 85% Portfolio Investor Class
| | Six months ended (Unaudited) June 30, | Years endedDecember 31, | | | | |
| | 2018 | 2017 | 2016 | 2015 | 2014 | 2013 |
| Selected Per–Share Data | | | | | | |
| Net asset value, beginning of period | $14.31 | $11.81 | $11.87 | $12.46 | $12.07 | $9.63 |
| Income from Investment Operations | | | | | | |
| Net investment income (loss)A | .02 | .11 | .11 | .09 | .13 | .11 |
| Net realized and unrealized gain (loss) | .22 | 2.62 | .48 | (.03) | .51 | 2.56 |
| Total from investment operations | .24 | 2.73 | .59 | .06 | .64 | 2.67 |
| Distributions from net investment income | (.01) | (.10) | (.11) | (.16)B | (.13) | (.10) |
| Distributions from net realized gain | (1.32) | (.13) | (.54) | (.49)B | (.13) | (.13) |
| Total distributions | (1.32)C | (.23) | (.65) | (.65) | (.25)D | (.23) |
| Net asset value, end of period | $13.23 | $14.31 | $11.81 | $11.87 | $12.46 | $12.07 |
| Total ReturnE,F,G | 1.68% | 23.13% | 5.66% | .39% | 5.29% | 27.73% |
| Ratios to Average Net AssetsH,I,J | | | | | | |
| Expenses before reductions | .25%K | .25% | .25% | .25% | .25% | .25% |
| Expenses net of fee waivers, if any | .20%K | .20% | .20% | .20% | .20% | .20% |
| Expenses net of all reductions | .20%K | .20% | .20% | .20% | .20% | .20% |
| Net investment income (loss) | .24%K | .81% | .96% | .74% | 1.04% | 1.00% |
| Supplemental Data | | | | | | |
| Net assets, end of period (000 omitted) | $519,864 | $492,831 | $407,244 | $399,068 | $376,927 | $325,256 |
| Portfolio turnover rateH,L | 203%K | 70% | 59% | 67% | 72% | 51% |
A Calculated based on average shares outstanding during the period.
B The amounts shown reflect certain reclassifications related to book to tax differences that were made in the year shown.
C Total distributions of $1.32 per share is comprised of distributions from net investment income of $.006 and distributions from net realized gain of $1.317 per share.
D Total distributions of $.25 per share is comprised of distributions from net investment income of $.125 and distributions from net realized gain of $.126 per share.
E Total returns for periods of less than one year are not annualized.
F Total returns do not reflect charges attributable to your insurance company's separate account. Inclusion of these charges would reduce the total returns shown.
G Total returns would have been lower if certain expenses had not been reduced during the applicable periods shown.
H Amounts do not include the activity of the Underlying Funds.
I Fees and expenses of any underlying Fidelity Central Funds are not included in the Fund's expense ratio. The Fund indirectly bears its proportionate share of the expenses of any underlying Fidelity Central Funds.
J Expense ratios reflect operating expenses of the class. Expenses before reductions do not reflect amounts reimbursed by the investment adviser or reductions from brokerage service arrangements or reductions from other expense offset arrangements and do not represent the amount paid by the class during periods when reimbursements or reductions occur. Expenses net of fee waivers reflect expenses after reimbursement by the investment adviser but prior to reductions from brokerage service arrangements or other expense offset arrangements. Expenses net of all reductions represent the net expenses paid by the class but do not include expenses of the underlying funds in which the Fund invests.
K Annualized
L Amount does not include the portfolio activity of any underlying Fidelity Central Funds.
See accompanying notes which are an integral part of the financial statements.
Notes to Financial Statements (Unaudited)
For the period ended June 30, 2018
1. Organization.
VIP FundsManager 20% Portfolio, VIP FundsManager 50% Portfolio, VIP FundsManager 60% Portfolio, VIP FundsManager 70% Portfolio, and VIP FundsManager 85% Portfolio (the Funds) are funds of Variable Insurance Products Fund V (the Trust). The Trust is registered under the Investment Company Act of 1940, as amended (the 1940 Act), as an open-end management investment company organized as a Massachusetts business trust. Each Fund is authorized to issue an unlimited number of shares. The Funds invest primarily in a combination of other Fidelity equity, fixed income, and short-term funds (the Underlying Funds) managed by Fidelity Management & Research Company (FMR). Shares of each Fund may only be purchased by insurance companies for the purpose of funding variable annuity or variable life insurance contracts. Each Fund offers three classes of shares: Service Class shares, Service Class 2 shares, and Investor Class shares. All classes have equal rights and voting privileges, except for matters affecting a single class.
2. Investments in Fidelity Central Funds.
The Funds invest in Fidelity Central Funds, which are open-end investment companies generally available only to other investment companies and accounts managed by the investment adviser and its affiliates. The Funds' Schedules of Investments list each of the Fidelity Central Funds held as of period end, if any, as an investment of each Fund, but does not include the underlying holdings of each Fidelity Central Fund. As an Investing Fund, each Fund indirectly bears its proportionate share of the expenses of the underlying Fidelity Central Funds.
The Money Market Central Funds seek preservation of capital and current income and are managed by Fidelity Investments Money Management, Inc. (FIMM), an affiliate of the investment adviser. Annualized expenses of the Money Market Central Funds as of their most recent shareholder report date are less than .005%.
A complete unaudited list of holdings for each Fidelity Central Fund is available upon request or at the Securities and Exchange Commission (the SEC) website at www.sec.gov. In addition, the financial statements of the Fidelity Central Funds are available on the SEC website or upon request.
3. Significant Accounting Policies.
Each Fund is an investment company and applies the accounting and reporting guidance of the Financial Accounting Standards Board (FASB) Accounting Standards Codification Topic 946 Financial Services – Investments Companies. The financial statements have been prepared in conformity with accounting principles generally accepted in the United States of America (GAAP), which require management to make certain estimates and assumptions at the date of the financial statements. Actual results could differ from those estimates. Subsequent events, if any, through the date that the financial statements were issued have been evaluated in the preparation of the financial statements. The following summarizes the significant accounting policies of the Funds:
Investment Valuation. Investments are valued as of 4:00 p.m. Eastern time on the last calendar day of the period. Each Fund uses a third party pricing vendor approved by the Board of Trustees (the Board) to value its investments. The Board of Trustees (the Board) has delegated the day to day responsibility for the valuation of each Fund's investments to the Fair Value Committee (the Committee) established by the each Fund's investment adviser. In accordance with valuation policies and procedures approved by the Board, each Fund attempts to obtain prices from one or more third party pricing vendors or brokers to value its investments. When current market prices, quotations or currency exchange rates are not readily available or reliable, investments will be fair valued in good faith by the Committee, in accordance with procedures adopted by the Board. Factors used in determining fair value vary by investment type and may include market or investment specific events, changes in interest rates and credit quality. The frequency with which these procedures are used cannot be predicted and they may be utilized to a significant extent. The Committee oversees each Fund's valuation policies and procedures and reports to the Board on the Committee's activities and fair value determinations. The Board monitors the appropriateness of the procedures used in valuing each Fund's investments and ratifies the fair value determinations of the Committee. Each Fund categorizes the inputs to valuation techniques used to value its investments into a disclosure hierarchy consisting of three levels as shown below:
- Level 1 – quoted prices in active markets for identical investments
- Level 2 – other significant observable inputs (including quoted prices for similar investments, interest rates, prepayment speeds, etc.)
- Level 3 – unobservable inputs (including the Fund's own assumptions based on the best information available)
Valuation techniques used to value each Fund's investments by major category are as follows. Investments in open-end mutual funds are valued at their closing net asset value (NAV) each business day and are categorized as Level 1 in the hierarchy. If an unaffiliated open-end mutual fund's NAV is unavailable, shares of that fund may be valued by another method that the Board believes reflects fair value in accordance with the Board's fair value pricing policies and is categorized as Level 2 in the hierarchy. Debt securities, including restricted securities, are valued based on evaluated prices received from third party pricing vendors or from brokers who make markets in such securities. U.S. government and government agency obligations are valued by pricing vendors who utilize matrix pricing which considers yield or price of bonds of comparable quality, coupon, maturity and type or by broker-supplied prices. When independent prices are unavailable or unreliable, debt securities may be valued utilizing pricing methodologies which consider similar factors that would be used by third party pricing vendors. Debt securities are generally categorized as Level 2 in the hierarchy but may be Level 3 depending on the circumstances. Exchange-Traded Funds (ETFs) are valued at their last sale price or official closing price as reported by a third party pricing vendor on the primary market or exchange on which they are traded and are categorized as Level 1 in the hierarchy. In the event there were no sales during the day but the exchange reports a closing bid level, ETFs are valued at the closing bid and would be categorized as Level 1 in the hierarchy. In the event there was no closing bid, ETFs may be valued by another method that the Board believes reflects fair value in accordance with the Board's fair value pricing policies and may be categorized as Level 2 in the hierarchy.
Futures contracts are valued at the settlement price established each day by the board of trade or exchange on which they are traded and are categorized as Level 1 in the hierarchy.
Investment Transactions and Income. For financial reporting purposes, the Funds' investment holdings and NAV include trades executed through the end of the last business day of the period. The NAV per share for processing shareholder transactions is calculated as of the close of business of the New York Stock Exchange (NYSE), normally 4:00 p.m. Eastern time and includes trades executed through the end of the prior business day. Gains and losses on securities sold are determined on the basis of identified cost. Income and capital gain distributions from the Underlying Funds, if any, are recorded on the ex-dividend date. Interest income is accrued as earned. Interest income includes coupon interest and amortization of premium and accretion of discount on debt securities as applicable.
Class Allocations and Expenses. Investment income, realized and unrealized capital gains and losses, common expenses of each Fund, and certain fund-level expense reductions, if any, are allocated daily on a pro-rata basis to each class based on the relative net assets of each class to the total net assets of each Fund. Each class differs with respect to distribution and service plan fees incurred. Certain expense reductions may also differ by class. For the reporting period, the allocated portion of income and expenses to each class as a percent of its average net assets may vary due to the timing of recording these transactions in relation to fluctuating net assets of the classes. Expenses directly attributable to a fund are charged to that fund. Expenses attributable to more than one fund are allocated among the respective funds on the basis of relative net assets or other appropriate methods. Expenses included in the accompanying financial statements reflect the expenses of each Fund and do not include any expenses associated with the Underlying Funds. Although not included in each Fund's expenses, each Fund indirectly bears its proportionate share of the Underlying Funds' expenses through the impact of these expenses on each Underlying Fund's NAV. Expense estimates are accrued in the period to which they relate and adjustments are made when actual amounts are known.
Income Tax Information and Distributions to Shareholders. Each year, each Fund intends to qualify as a regulated investment company under Subchapter M of the Internal Revenue Code, including distributing substantially all of its taxable income and realized gains. As a result, no provision for U.S. Federal income taxes is required. Each Fund files a U.S. federal tax return, in addition to state and local tax returns as required. Each Fund's federal income tax returns are subject to examination by the Internal Revenue Service (IRS) for a period of three fiscal years after they are filed. State and local tax returns may be subject to examination for an additional fiscal year depending on the jurisdiction.
Distributions are declared and recorded on the ex-dividend date. Income and capital gain distributions are declared separately for each class. Income and capital gain distributions are determined in accordance with income tax regulations, which may differ from GAAP.
Capital accounts within the financial statements are adjusted for permanent book-tax differences. These adjustments have no impact on net assets or the results of operations. Capital accounts are not adjusted for temporary book-tax differences which will reverse in a subsequent period.
Book-tax differences are primarily due to short-term gain distributions from Underlying Funds, capital loss carryforwards, and losses deferred due to wash sales.
As of period end, the cost and unrealized appreciation (depreciation) in securities, and derivatives if applicable, for federal income tax purposes were as follows for each Fund:
| | Tax cost | Gross unrealized appreciation | Gross unrealized depreciation | Net unrealized appreciation (depreciation) |
| VIP FundsManager 20% Portfolio | $765,641,959 | $13,023,020 | $(7,046,110) | $5,976,910 |
| VIP FundsManager 50% Portfolio | 6,252,520,582 | 233,247,119 | (75,726,653) | 157,520,466 |
| VIP FundsManager 60% Portfolio | 5,813,406,048 | 285,761,144 | (51,411,432) | 234,349,712 |
| VIP FundsManager 70% Portfolio | 1,451,922,628 | 69,478,503 | (10,516,391) | 58,962,112 |
| VIP FundsManager 85% Portfolio | 530,918,117 | 27,318,399 | (3,892,723) | 23,425,676 |
4. Derivative Instruments.
Risk Exposures and the Use of Derivative Instruments. The Funds' investment objective allows the Funds to enter into various types of derivative contracts, including futures contracts. Derivatives are investments whose value is primarily derived from underlying assets, indices or reference rates and may be transacted on an exchange or over-the-counter (OTC). Derivatives may involve a future commitment to buy or sell a specified asset based on specified terms, to exchange future cash flows at periodic intervals based on a notional principal amount, or for one party to make one or more payments upon the occurrence of specified events in exchange for periodic payments from the other party.
The Funds used derivatives to increase returns and to manage exposure to certain risks as defined below. The success of any strategy involving derivatives depends on analysis of numerous economic factors, and if the strategies for investment do not work as intended, the Funds may not achieve their objectives.
The Funds' use of derivatives increased or decreased their exposure to the following risk:
| Equity Risk | Equity risk relates to the fluctuations in the value of financial instruments as a result of changes in market prices (other than those arising from interest rate risk or foreign exchange risk), whether caused by factors specific to an individual investment, its issuer, or all factors affecting all instruments traded in a market or market segment.
|
The Funds are also exposed to additional risks from investing in derivatives, such as liquidity risk and counterparty credit risk. Liquidity risk is the risk that the Funds will be unable to close out the derivative in the open market in a timely manner. Counterparty credit risk is the risk that the counterparty will not be able to fulfill its obligation to the Funds. Counterparty credit risk related to exchange-traded futures contracts may be mitigated by the protection provided by the exchange on which they trade.
Investing in derivatives may involve greater risks than investing in the underlying assets directly and, to varying degrees, may involve risk of loss in excess of any initial investment and collateral received and amounts recognized in the Statement of Assets and Liabilities. In addition, there may be the risk that the change in value of the derivative contract does not correspond to the change in value of the underlying instrument.
Futures Contracts. A futures contract is an agreement between two parties to buy or sell a specified underlying instrument for a fixed price at a specified future date. The Funds used futures contracts to manage their exposure to the stock market.
Upon entering into a futures contract, a fund is required to deposit either cash or securities (initial margin) with a clearing broker in an amount equal to a certain percentage of the face value of the contract. Futures contracts are marked-to-market daily and subsequent daily payments (variation margin) are made or received by a fund depending on the daily fluctuations in the value of the futures contracts and are recorded as unrealized appreciation or (depreciation). This receivable and/or payable, if any, is included in daily variation margin on futures contracts in the Statement of Assets and Liabilities. Realized gain or (loss) is recorded upon the expiration or closing of a futures contract. The net realized gain (loss) and change in net unrealized appreciation (depreciation) on futures contracts during the period is presented in the Statement of Operations.
Any open futures contracts at period end are presented in the Schedule of Investments under the caption "Futures Contracts". Except for VIP Funds Manager 20% Portfolio, the notional amount at value reflects each contract's exposure to the underlying instrument or index at period end and is representative of volume of activity during the period. Securities deposited to meet initial margin requirements are identified in the Schedule of Investments.
5. Purchases and Redemptions of Underlying Fund Shares.
Purchases and sales of securities, including in-kind transactions, other than short-term securities and U.S. government securities, are noted in the table below.
| | Purchases ($) | Redemptions ($) |
| VIP FundsManager 20% Portfolio | 296,592,914 | 299,712,500 |
| VIP FundsManager 50% Portfolio | 4,437,257,429 | 4,670,925,341 |
| VIP FundsManager 60% Portfolio | 4,775,553,119 | 4,987,269,625 |
| VIP FundsManager 70% Portfolio | 1,335,133,208 | 1,284,229,613 |
| VIP FundsManager 85% Portfolio | 581,203,328 | 548,798,655 |
6. Fees and Other Transactions with Affiliates.
Management Fee. FMR Co., Inc. (the investment adviser), an affiliate of FMR, provides the Funds with investment management related services. For these services each Fund pays a monthly management fee to the investment adviser. The management fee is based on an annual rate of .25% of each fund's average net assets. The management fee is reduced by an amount equal to the fees and expenses paid by the Funds to the independent Trustees.
The investment adviser has contractually agreed to waive 0.05% of its management fee, thereby limiting each Fund's management fee to an annual rate of 0.20% of average net assets, until April 30, 2019.
Other Transactions. The investment adviser has entered into an administration agreement with FMR under which FMR provides management and administrative services (other than investment advisory services) necessary for the operation of each Fund. Pursuant to this agreement, FMR pays all expenses of each Fund, excluding distribution and service plan fees, compensation of the independent Trustees and certain other expenses such as interest expense. FMR also contracts with other Fidelity companies to perform the services necessary for the operation of each Fund.
Distribution and Service Plan Fees. In accordance with Rule 12b-1 of the 1940 Act, the Funds have adopted separate 12b-1 Plans for each Service Class of shares. Each Service Class pays Fidelity Distributors Corporation (FDC), an affiliate of the investment adviser, a service fee. For the period, the service fee is based on an annual rate of .10% of Service Class' average net assets and .25% of Service Class 2's average net assets.
For the period, total fees, all of which were reallowed to insurance companies for the distribution of shares and providing shareholder support services were as follows:
| | Service Class | Service Class 2 | Total |
| VIP FundsManager 20% Portfolio | $29 | $10,606 | $10,635 |
| VIP FundsManager 50% Portfolio | 31 | 125,238 | 125,269 |
| VIP FundsManager 60% Portfolio | 28 | 738,709 | 738,737 |
| VIP FundsManager 70% Portfolio | 36 | 62,851 | 62,887 |
| VIP FundsManager 85% Portfolio | 1 | 42,689 | 42,690 |
Reallocation of Underlying Fund Investments. During the period, the investment adviser reallocated investments of the Funds. This involved taxable redemptions of the Funds' interest in Fidelity Consumer Discretionary Portfolio, Fidelity Consumer Staples Portfolio, Fidelity Energy Portfolio, Fidelity Financial Services Portfolio, Fidelity Health Care Portfolio, Fidelity Industrials Portfolio, Fidelity Materials Portfolio, Fidelity Real Estate Investment Portfolio, Fidelity Technology Portfolio, Fidelity Telecommunications Portfolio, Fidelity Utilities Portfolio (selected Underlying Funds) for investments and cash and non-taxable exchanges of those investments and cash for shares of Fidelity Consumer Discretionary Central Fund, Fidelity Consumer Staples Central Fund, Fidelity Energy Central Fund, Fidelity Financials Central Fund, Fidelity Health Care Central Fund, Fidelity Industrials Central Fund, Fidelity Information Technology Central Fund, Fidelity Materials Central Fund, Fidelity Telecom Services Central Fund, Fidelity Utilities Central Fund (selected Affiliated Central Funds) which are affiliated investment companies managed by FMR.
In addition, the investment adviser reallocated investments of the Fund. This involved taxable redemptions of the Funds' interest in the selected Affiliated Central Funds for investments and non-taxable exchanges of those investments for shares of Fidelity Stock Selector All Cap. Net realized gain (loss) on the redemptions of the selected Underlying Funds and Affiliated Central Funds in connection with the reallocation is included in the accompanying Statements of Operations as "Net realized gain (loss) on: Fidelity Central Funds and Other Affiliated issuers".
Details of these transactions with the related net gain (loss) for the Funds are presented in the accompanying table:
| | Value of Investments and Cash reallocated | Net realized Gain (Loss) on redemptions of selected Underlying Funds and Affiliated Central Funds |
| VIP FundsManager 20% Portfolio | $147,071,445 | $12,809,582 |
| VIP FundsManager 50% Portfolio | 3,091,857,292 | 289,073,621 |
| VIP FundsManager 60% Portfolio | 3,568,089,514 | 562,952,084 |
| VIP FundsManager 70% Portfolio | 993,477,105 | 101,761,955 |
| VIP FundsManager 85% Portfolio | 453,153,954 | 45,157,797 |
7. Expense Reductions.
The investment adviser contractually agreed to limit each Funds' management fee to an annual rate of 0.20% of each Funds' average net assets until April 30, 2019. For the period, each Fund's management fees were reduced by the following amounts:
| | Management Fee Waiver |
| VIP FundsManager 20% Portfolio | $194,587 |
| VIP FundsManager 50% Portfolio | 1,645,437 |
| VIP FundsManager 60% Portfolio | 1,550,503 |
| VIP FundsManager 70% Portfolio | 374,170 |
| VIP FundsManager 85% Portfolio | 136,550 |
In addition, FMR has contractually agreed to reimburse 0.10% of class-level expenses for each Fund's Service Class and Service Class 2. During the period, this reimbursement reduced each Fund's Service Class and Service Class 2's expenses by the following amounts:
| | Reimbursement
|
| VIP FundsManager 20% Portfolio | |
| Service Class | $29 |
| Service Class 2 | 4,242 |
| VIP FundsManager 50% Portfolio | |
| Service Class | 31 |
| Service Class 2 | 50,095 |
| VIP FundsManager 60% Portfolio | |
| Service Class | 28 |
| Service Class 2 | 295,484 |
| VIP FundsManager 70% Portfolio | |
| Service Class | 36 |
| Service Class 2 | 25,140 |
| VIP FundsManager 85% Portfolio | |
| Service Class | 1 |
| Service Class 2 | 17,076 |
In addition, through arrangements with each applicable Fund's custodian, credits realized as a result of certain uninvested cash balances were used to reduce each applicable Fund's management fee. During the period, these credits reduced management fee by the following amounts:
| VIP FundsManager 20% Portfolio | $1,118 |
| VIP FundsManager 50% Portfolio | 16,399 |
| VIP FundsManager 60% Portfolio | 15,539 |
| VIP FundsManager 70% Portfolio | 4,774 |
| VIP FundsManager 85% Portfolio | 1,759 |
8. Distributions to Shareholders.
Distributions to shareholders of each class were as follows:
| | Six months ended
June 30, 2018 | Year ended
December 31, 2017 |
| VIP FundsManager 20% Portfolio | | |
| From net investment income | | |
| Service Class | $46 | $766 |
| Service Class 2 | 6,698 | 92,500 |
| Investor Class | 599,457 | 9,938,104 |
| Total | $606,201 | $10,031,370 |
| From net realized gain | | |
| Service Class | $2,295 | $346 |
| Service Class 2 | 335,626 | 45,931 |
| Investor Class | 30,039,448 | 4,329,977 |
| Total | $30,377,369 | $4,376,254 |
| VIP FundsManager 50% Portfolio | | |
| From net investment income | | |
| Service Class | $43 | $731 |
| Service Class 2 | 66,152 | 989,026 |
| Investor Class | 4,348,942 | 74,273,522 |
| Total | $4,415,137 | $75,263,279 |
| From net realized gain | | |
| Service Class | $4,302 | $393 |
| Service Class 2 | 6,674,000 | 612,425 |
| Investor Class | 438,759,965 | 40,000,877 |
| Total | $445,438,267 | $40,613,695 |
| VIP FundsManager 60% Portfolio | | |
| From net investment income | | |
| Service Class | $39 | $649 |
| Service Class 2 | 375,066 | 5,348,956 |
| Investor Class | 3,613,613 | 60,481,640 |
| Total | $3,988,718 | $65,831,245 |
| From net realized gain | | |
| Service Class | $6,512 | $1,287 |
| Service Class 2 | 62,823,490 | 11,583,334 |
| Investor Class | 605,280,162 | 122,587,640 |
| Total | $668,110,164 | $134,172,261 |
| VIP FundsManager 70% Portfolio | | |
| From net investment income | | |
| Service Class | $43 | $662 |
| Service Class 2 | 28,236 | 359,186 |
| Investor Class | 813,794 | 12,302,715 |
| Total | $842,073 | $12,662,563 |
| From net realized gain | | |
| Service Class | $6,101 | $506 |
| Service Class 2 | 4,009,515 | 324,459 |
| Investor Class | 115,558,755 | 9,395,981 |
| Total | $119,574,371 | $9,720,946 |
| VIP FundsManager 85% Portfolio | | |
| From net investment income | | |
| Service Class | $1 | $13 |
| Service Class 2 | 14,170 | 192,253 |
| Investor Class | 207,681 | 3,451,179 |
| Total | $221,852 | $3,643,445 |
| From net realized gain | | |
| Service Class | $184 | $18 |
| Service Class 2 | 3,110,308 | 298,443 |
| Investor Class | 45,585,916 | 4,365,271 |
| Total | $48,696,408 | $4,663,732 |
9. Share Transactions.
Transactions for each class of shares were as follows:
| | Shares | Shares | Dollars | Dollars |
| | Six months ended June 30, 2018 | Year endedDecember 31, 2017 | Six months ended June 30, 2018 | Year endedDecember 31, 2017 |
| VIP FundsManager 20% Portfolio | | | | |
| Service Class | | | | |
| Shares sold | 163 | 282 | $1,836 | $3,244 |
| Reinvestment of distributions | 4 | 96 | 47 | 1,112 |
| Shares redeemed | (149)(a) | (724) | (1,678)(a) | (8,404) |
| Net increase (decrease) | 18 | (346) | $205 | $(4,048) |
| Service Class 2 | | | | |
| Shares sold | 97,946 | 118,495 | $1,117,889 | $1,345,436 |
| Reinvestment of distributions | 30,924 | 12,043 | 342,324 | 138,431 |
| Shares redeemed | (70,604)(a) | (108,177) | (795,455)(a) | (1,232,660) |
| Net increase (decrease) | 58,266 | 22,361 | $664,758 | $251,207�� |
| Investor Class | | | | |
| Shares sold | 2,304,743 | 5,096,986 | $25,962,494 | $58,749,629 |
| Reinvestment of distributions | 2,762,751 | 1,238,346 | 30,638,905 | 14,268,081 |
| Shares redeemed | (3,526,363)(a) | (6,426,351) | (39,607,867)(a) | (72,859,123) |
| Net increase (decrease) | 1,541,131 | (91,019) | $16,993,532 | $158,587 |
| VIP FundsManager 50% Portfolio | | | | |
| Service Class | | | | |
| Shares sold | 41 | 64 | $531 | $833 |
| Reinvestment of distributions | 5 | 83 | 62 | 1,124 |
| Shares redeemed | (33)(a) | (584) | (421)(a) | (7,870) |
| Net increase (decrease) | 13 | (437) | $172 | $(5,913) |
| Service Class 2 | | | | |
| Shares sold | 705,179 | 1,289,799 | $9,064,201 | $16,633,568 |
| Reinvestment of distributions | 534,509 | 119,256 | 6,740,152 | 1,601,451 |
| Shares redeemed | (809,842)(a) | (1,515,620) | (10,470,472)(a) | (19,679,465) |
| Net increase (decrease) | 429,846 | (106,565) | $5,333,881 | $(1,444,446) |
| Investor Class | | | | |
| Shares sold | 3,335,593 | 6,677,690 | $42,928,210 | $86,961,201 |
| Reinvestment of distributions | 35,028,372 | 8,484,112 | 443,108,907 | 114,274,399 |
| Shares redeemed | (30,693,501)(a) | (39,276,673) | (395,046,782)(a) | (509,832,605) |
| Net increase (decrease) | 7,670,464 | (24,114,871) | $90,990,335 | $(308,597,005) |
| VIP FundsManager 60% Portfolio | | | | |
| Service Class | | | | |
| Shares sold | 90 | 171 | $1,076 | $2,030 |
| Reinvestment of distributions | 11 | 162 | 128 | 1,936 |
| Shares redeemed | (83)(a) | (838) | (960)(a) | (10,318) |
| Net increase (decrease) | 18 | (505) | $244 | $(6,352) |
| Service Class 2 | | | | |
| Shares sold | 3,042,271 | 5,455,249 | $35,293,065 | $64,794,478 |
| Reinvestment of distributions | 5,637,694 | 1,415,209 | 63,198,556 | 16,932,290 |
| Shares redeemed | (2,948,785)(a) | (6,007,106) | (34,360,084)(a) | (71,637,670) |
| Net increase (decrease) | 5,731,180 | 863,352 | $64,131,537 | $10,089,098 |
| Investor Class | | | | |
| Shares sold | 3,684,207 | 5,362,355 | $42,546,485 | $64,258,948 |
| Reinvestment of distributions | 54,172,044 | 15,291,539 | 608,893,775 | 183,069,280 |
| Shares redeemed | (32,852,993)(a) | (93,531,178) | (380,894,560)(a) | (1,104,750,276) |
| Net increase (decrease) | 25,003,258 | (72,877,284) | $270,545,700 | $(857,422,048) |
| VIP FundsManager 70% Portfolio | | | | |
| Service Class | | | | |
| Shares sold | 71 | 130 | $957 | $1,718 |
| Reinvestment of distributions | 3 | 84 | 33 | 1,168 |
| Shares redeemed | (72)(a) | (736) | (957)(a) | (10,148) |
| Net increase (decrease) | 2 | (522) | $33 | $(7,262) |
| Service Class 2 | | | | |
| Shares sold | 247,902 | 458,084 | $3,300,817 | $5,964,434 |
| Reinvestment of distributions | 310,357 | 49,096 | 4,037,751 | 683,645 |
| Shares redeemed | (118,468)(a) | (229,488) | (1,584,252)(a) | (2,995,288) |
| Net increase (decrease) | 439,791 | 277,692 | $5,754,316 | $3,652,791 |
| Investor Class | | | | |
| Shares sold | 3,842,864 | 9,314,585 | $51,535,579 | $123,018,642 |
| Reinvestment of distributions | 8,910,609 | 1,552,500 | 116,372,549 | 21,698,696 |
| Shares redeemed | (2,588,257)(a) | (4,403,710) | (34,847,574)(a) | (57,832,076) |
| Net increase (decrease) | 10,165,216 | 6,463,375 | $133,060,554 | $86,885,262 |
| VIP FundsManager 85% Portfolio | | | | |
| Service Class | | | | |
| Shares sold | 48 | 109 | $672 | $1,463 |
| Reinvestment of distributions | 14 | 2 | 185 | 31 |
| Shares redeemed | (113)(a) | (680) | (1,501)(a) | (9,519) |
| Net increase (decrease) | (51) | (569) | $(644) | $(8,025) |
| Service Class 2 | | | | |
| Shares sold | 142,194 | 418,848 | $1,919,990 | $5,497,731 |
| Reinvestment of distributions | 236,882 | 34,579 | 3,124,478 | 490,696 |
| Shares redeemed | (135,776)(a) | (205,975) | (1,815,398)(a) | (2,696,501) |
| Net increase (decrease) | 243,300 | 247,452 | $3,229,070 | $3,291,926 |
| Investor Class | | | | |
| Shares sold | 2,362,239 | 2,659,836 | $32,027,937 | $35,473,379 |
| Reinvestment of distributions | 3,453,514 | 548,117 | 45,793,597 | 7,816,450 |
| Shares redeemed | (959,337)(a) | (3,236,201) | (13,251,420)(a) | (41,916,255) |
| Net increase (decrease) | 4,856,416 | (28,248) | $64,570,114 | $1,373,574 |
(a) Amount includes in-kind redemptions (see the Redemptions In-Kind note for additional details)
10. Other.
The Funds' organizational documents provide former and current trustees and officers with a limited indemnification against liabilities arising in connection with the performance of their duties to the Funds. In the normal course of business, the Funds may also enter into contracts that provide general indemnifications. The Funds' maximum exposure under these arrangements is unknown as this would be dependent on future claims that may be made against the Funds. The risk of material loss from such claims is considered remote.
The Funds do not invest in the Underlying Funds for the purpose of exercising management or control; however, investments by the Funds within their principal investment strategies may represent a significant portion of the Underlying Fund's net assets. At the end of the period, the following Funds were the owners of record of 10% or more of the total outstanding shares of the Underlying Funds.
| Fund | VIP FundsManager 50% Portfolio | VIP FundsManager 60% Portfolio |
| Fidelity Global Commodity Stock Fund | 11% | 10% |
| Fidelity Japan Smaller Companies Fund | –% | 10% |
| Fidelity International Value Fund | 11% | 12% |
| Fidelity Stock Selector All Cap Fund | 18% | 20% |
The Funds, in aggregate, were the owners of record of more than 20% of the total outstanding shares of the following Underlying Funds.
| Fund | % of shares held |
| Fidelity Global Commodity Stock Fund | 26% |
| Fidelity Japan Smaller Companies Fund | 24% |
| Fidelity International Value Fund | 29% |
| Fidelity Stock Selector All Cap Fund | 48% |
In addition, at the end of the period the investment adviser or its affiliates were owners of record of more than 10% and certain otherwise unaffiliated shareholders each were owners of record of more than 10%, respectively, of the outstanding shares of the following Funds:
| | Affiliated % | Number of
Unaffiliated Shareholders | Unaffiliated Shareholders % |
| VIP FundsManager 20% Portfolio | 98% | – | –% |
| VIP FundsManager 50% Portfolio | 25% | 1 | 68% |
| VIP FundsManager 60% Portfolio | 33% | 2 | 52% |
| VIP FundsManager 70% Portfolio | 96% | – | –% |
| VIP FundsManager 85% Portfolio | 93% | – | –% |
Shareholder Expense Example
As a shareholder of a Fund, you incur two types of costs: (1) transaction costs, and (2) ongoing costs, including management fees, distribution and/or service (12b-1) fees and other Fund expenses. This Example is intended to help you understand your ongoing costs (in dollars) of investing in the Funds and to compare these costs with the ongoing costs of investing in other mutual funds.
The Example is based on an investment of $1,000 invested at the beginning of the period and held for the entire period (January 1, 2018 to June 30, 2018).
Actual Expenses
The first line of the accompanying table for each Class of each fund provides information about actual account values and actual expenses. You may use the information in this line, together with the amount you invested, to estimate the expenses that you paid over the period. Simply divide your account value by $1,000.00 (for example, an $8,600 account value divided by $1,000.00 = 8.6), then multiply the result by the number in the first line for a Class of the fund under the heading entitled "Expenses Paid During Period" to estimate the expenses you paid on your account during this period. The estimate of expenses does not include any fees or other expenses of any variable annuity or variable life insurance product. If they were, the estimate of expenses you paid during the period would be higher, and your ending account value would be lower. In addition, each Fund, as a shareholder in underlying Fidelity Funds, will indirectly bear its pro-rata share of the fees and expenses incurred by the underlying Fidelity Funds. These fees and expenses are not included in each Fund's annualized expense ratio used to calculate the expense estimates in the table below.
Hypothetical Example for Comparison Purposes
The second line of the accompanying table for each Class of each fund provides information about hypothetical account values and hypothetical expenses based on a Class' actual expense ratio and an assumed rate of return of 5% per year before expenses, which is not the Class' actual return. The hypothetical account values and expenses may not be used to estimate the actual ending account balance or expenses you paid for the period. You may use this information to compare the ongoing costs of investing in the Fund and other funds. To do so, compare this 5% hypothetical example with the 5% hypothetical examples that appear in the shareholder reports of the other funds. The estimate of expenses does not include any fees or other expenses of any variable annuity or variable life insurance product. If they were, the estimate of expenses you paid during the period would be higher, and your ending account value would be lower. In addition, each Fund, as a shareholder in underlying Fidelity Funds, will indirectly bear its pro-rata share of the fees and expenses incurred by the underlying Fidelity Funds. These fees and expenses are not included in each Fund's annualized expense ratio used to calculate the expense estimates in the table below.
Please note that the expenses shown in the table are meant to highlight your ongoing costs only and do not reflect any transaction costs. Therefore, the second line of the table is useful in comparing ongoing costs only, and will not help you determine the relative total costs of owning different funds.
| | Annualized Expense RatioA | Beginning
Account Value
January 1, 2018 | Ending
Account Value
June 30, 2018 | Expenses Paid
During Period-B
January 1, 2018
to June 30, 2018 |
| VIP FundsManager 20% Portfolio | | | | |
| Service Class | .20% | | | |
| Actual | | $1,000.00 | $998.50 | $.99 |
| Hypothetical-C | | $1,000.00 | $1,023.80 | $1.00 |
| Service Class 2 | .35% | | | |
| Actual | | $1,000.00 | $997.60 | $1.73 |
| Hypothetical-C | | $1,000.00 | $1,023.06 | $1.76 |
| Investor Class | .20% | | | |
| Actual | | $1,000.00 | $999.40 | $.99 |
| Hypothetical-C | | $1,000.00 | $1,023.80 | $1.00 |
| VIP FundsManager 50% Portfolio | | | | |
| Service Class | .20% | | | |
| Actual | | $1,000.00 | $1,004.30 | $.99 |
| Hypothetical-C | | $1,000.00 | $1,023.80 | $1.00 |
| Service Class 2 | .35% | | | |
| Actual | | $1,000.00 | $1,004.30 | $1.74 |
| Hypothetical-C | | $1,000.00 | $1,023.06 | $1.76 |
| Investor Class | .20% | | | |
| Actual | | $1,000.00 | $1,005.10 | $.99 |
| Hypothetical-C | | $1,000.00 | $1,023.80 | $1.00 |
| VIP FundsManager 60% Portfolio | | | | |
| Service Class | .20% | | | |
| Actual | | $1,000.00 | $1,007.90 | $1.00 |
| Hypothetical-C | | $1,000.00 | $1,023.80 | $1.00 |
| Service Class 2 | .35% | | | |
| Actual | | $1,000.00 | $1,007.10 | $1.74 |
| Hypothetical-C | | $1,000.00 | $1,023.06 | $1.76 |
| Investor Class | .20% | | | |
| Actual | | $1,000.00 | $1,007.00 | $1.00 |
| Hypothetical-C | | $1,000.00 | $1,023.80 | $1.00 |
| VIP FundsManager 70% Portfolio | | | | |
| Service Class | .20% | | | |
| Actual | | $1,000.00 | $1,011.60 | $1.00 |
| Hypothetical-C | | $1,000.00 | $1,023.80 | $1.00 |
| Service Class 2 | .35% | | | |
| Actual | | $1,000.00 | $1,010.20 | $1.74 |
| Hypothetical-C | | $1,000.00 | $1,023.06 | $1.76 |
| Investor Class | .20% | | | |
| Actual | | $1,000.00 | $1,010.90 | $1.00 |
| Hypothetical-C | | $1,000.00 | $1,023.80 | $1.00 |
| VIP FundsManager 85% Portfolio | | | | |
| Service Class | .20% | | | |
| Actual | | $1,000.00 | $1,016.70 | 1.00 |
| Hypothetical-C | | $1,000.00 | $1,023.60 | 1.00 |
| Service Class 2 | .35% | | | |
| Actual | | $1,000.00 | $1,016.10 | $1.75 |
| Hypothetical-C | | $1,000.00 | $1,023.06 | $1.76 |
| Investor Class | .20% | | | |
| Actual | | $1,000.00 | $1,016.80 | $1.00 |
| Hypothetical-C | | $1,000.00 | $1,023.80 | $1.00 |
A Annualized expense ratio reflects expenses net of applicable fee waivers.
B Expenses are equal to each Class' annualized expense ratio, multiplied by the average account value over the period, multiplied by 181/ 365 (to reflect the one-half year period). The fees and expenses of the underlying Fidelity Funds in which each Fund invests are not included in each Class' annualized expense ratio.
C 5% return per year before expenses
VIPFM-SANN-0818
1.833444.112
Fidelity® Variable Insurance Products: Asset Manager: Growth Portfolio
Semi-Annual Report June 30, 2018 |
|
Contents
To view a fund's proxy voting guidelines and proxy voting record for the 12-month period ended June 30, visit http://www.fidelity.com/proxyvotingresults or visit the Securities and Exchange Commission's (SEC) web site at http://www.sec.gov.
You may also call 1-877-208-0098 to request a free copy of the proxy voting guidelines.
Fidelity® Variable Insurance Products are separate account options which are purchased through a variable insurance contract.
Standard & Poor's, S&P and S&P 500 are registered service marks of The McGraw-Hill Companies, Inc. and have been licensed for use by Fidelity Distributors Corporation.
Other third-party marks appearing herein are the property of their respective owners.
All other marks appearing herein are registered or unregistered trademarks or service marks of FMR LLC or an affiliated company. © 2018 FMR LLC. All rights reserved.
This report and the financial statements contained herein are submitted for the general information of the shareholders of the Fund. This report is not authorized for distribution to prospective investors in the Fund unless preceded or accompanied by an effective prospectus.
A fund files its complete schedule of portfolio holdings with the SEC for the first and third quarters of each fiscal year on Form N-Q. Forms N-Q are available on the SEC’s web site at http://www.sec.gov. A fund's Forms N-Q may be reviewed and copied at the SEC’s Public Reference Room in Washington, DC. Information regarding the operation of the SEC's Public Reference Room may be obtained by calling 1-800-SEC-0330.
For a complete list of a fund's portfolio holdings, view the most recent holdings listing, semiannual report, or annual report on Fidelity's web site at http://www.fidelity.com, http://www.institutional.fidelity.com, or http://www.401k.com, as applicable.
NOT FDIC INSURED •MAY LOSE VALUE •NO BANK GUARANTEE
Neither the Fund nor Fidelity Distributors Corporation is a bank.
Investment Summary (Unaudited)
The information in the following tables is based on the combined investments of the Fund and its pro-rata share of the investments of Fidelity's Central Funds, other than the Commodity Strategy and Money Market Central Funds.
Top Ten Stocks as of June 30, 2018
| | % of fund's net assets |
| Microsoft Corp. | 1.6 |
| Amazon.com, Inc. | 1.0 |
| NVIDIA Corp. | 0.7 |
| UnitedHealth Group, Inc. | 0.7 |
| Becton, Dickinson & Co. | 0.6 |
| Boston Scientific Corp. | 0.5 |
| Adobe Systems, Inc. | 0.4 |
| Alibaba Group Holding Ltd. sponsored ADR | 0.4 |
| Parametric Technology Corp. | 0.4 |
| Salesforce.com, Inc. | 0.4 |
| | 6.7 |
Top Market Sectors as of June 30, 2018
| (stocks only) | % of fund's net assets |
| Information Technology | 13.8 |
| Financials | 10.5 |
| Consumer Discretionary | 8.6 |
| Health Care | 8.4 |
| Industrials | 6.7 |
| Consumer Staples | 4.5 |
| Energy | 4.2 |
| Materials | 2.8 |
| Real Estate | 2.7 |
Asset Allocation (% of fund's net assets)
| As of June 30, 2018* |
| | Stock Class and Equity Futures** | 74.8% |
| | Bond Class | 23.3% |
| | Short-Term Class | 1.9% |

* Foreign investments - 24.6%
** Includes investment in Fidelity® Commodity Strategy Central Fund of 1.7%
Asset allocations in the pie chart reflects the categorization of assets as defined in the Fund's prospectus in effect as of the time periods indicated above. Financial Statement categorizations conform to accounting standards and will differ from the pie chart. Percentages are adjusted for the effect of future contracts and swap contracts, if applicable.
An unaudited holdings listing for the Fund, which presents direct holdings as well as the pro-rata share of any securities and other investments held indirectly through its investment in underlying Fidelity Central Funds, other than the Commodity Strategy and Money Market Central Funds, is available at institutional.fidelity.com.
Percentages in the above tables are adjusted for the effect of TBA Sale Commitments.
Schedule of Investments June 30, 2018 (Unaudited)
Showing Percentage of Net Assets
| U.S. Treasury Obligations - 0.1% | | | |
| | | Principal Amount | Value |
| U.S. Treasury Bills, yield at date of purchase 1.86% to 1.9% 8/9/18 to 9/20/18 (a) | | | |
| (Cost $368,960) | | 370,000 | 368,997 |
| | | Shares | Value |
|
| Fixed-Income Funds - 25.9% | | | |
| Fidelity Emerging Markets Debt Central Fund (b) | | 114,663 | $1,076,688 |
| Fidelity Floating Rate Central Fund (b) | | 21,740 | 2,234,230 |
| Fidelity High Income Central Fund 1 (b) | | 36,931 | 3,450,126 |
| Fidelity Inflation-Protected Bond Index Central Fund (b) | | 92,321 | 9,292,109 |
| Fidelity International Credit Central Fund (b) | | 14,063 | 1,373,147 |
| Fidelity VIP Investment Grade Central Fund (b) | | 369,179 | 37,844,541 |
| iShares 20+ Year Treasury Bond ETF | | 32,390 | 3,942,511 |
| TOTAL FIXED-INCOME FUNDS | | | |
| (Cost $58,720,941) | | | 59,213,352 |
|
| Money Market Funds - 0.2% | | | |
| Fidelity Cash Central Fund, 1.93% (c) | | 324,585 | 324,650 |
| Fidelity Money Market Central Fund, 2.29% (c) | | 149,393 | 149,408 |
| TOTAL MONEY MARKET FUNDS | | | |
| (Cost $474,044) | | | 474,058 |
|
| Equity Funds - 73.8% | | | |
| Domestic Equity Funds - 55.8% | | | |
| Fidelity Commodity Strategy Central Fund (b) | | 570,154 | 3,911,257 |
| Fidelity Consumer Discretionary Central Fund (b) | | 37,639 | 12,351,256 |
| Fidelity Consumer Staples Central Fund (b) | | 33,700 | 6,762,504 |
| Fidelity Energy Central Fund (b) | | 49,591 | 6,796,892 |
| Fidelity Financials Central Fund (b) | | 200,011 | 20,805,152 |
| Fidelity Health Care Central Fund (b) | | 38,051 | 16,511,583 |
| Fidelity Industrials Central Fund (b) | | 38,193 | 10,854,186 |
| Fidelity Information Technology Central Fund (b) | | 63,173 | 29,729,219 |
| Fidelity Materials Central Fund (b) | | 13,097 | 3,260,934 |
| Fidelity Real Estate Equity Central Fund (b) | | 8,972 | 984,155 |
| Fidelity Telecom Services Central Fund (b) | | 12,131 | 2,106,763 |
| Fidelity Utilities Central Fund (b) | | 18,665 | 3,487,937 |
| iShares S&P 500 Index ETF | | 36,995 | 10,101,485 |
|
| TOTAL DOMESTIC EQUITY FUNDS | | | 127,663,323 |
|
| International Equity Funds - 18.0% | | | |
| Fidelity Emerging Markets Equity Central Fund (b) | | 33,554 | 7,741,330 |
| Fidelity International Equity Central Fund (b) | | 353,012 | 29,716,512 |
| iShares Core MSCI Emerging Markets ETF | | 10,386 | 545,369 |
| iShares MSCI Japan ETF | | 54,109 | 3,133,452 |
|
| TOTAL INTERNATIONAL EQUITY FUNDS | | | 41,136,663 |
|
| TOTAL EQUITY FUNDS | | | |
| (Cost $144,004,274) | | | 168,799,986 |
| TOTAL INVESTMENT IN SECURITIES - 100.0% | | | |
| (Cost $203,568,219) | | | 228,856,393 |
| NET OTHER ASSETS (LIABILITIES) - 0.0% | | | (54,531) |
| NET ASSETS - 100% | | | $228,801,862 |
| Futures Contracts | | | | | |
| | Number of contracts | Expiration Date | Notional Amount | Value | Unrealized Appreciation/(Depreciation) |
| Sold | | | | | |
| Equity Index Contracts | | | | | |
| ICE E-mini MSCI EAFE Index Contracts (United States) | 75 | Sept. 2018 | $7,332,750 | $221,039 | $221,039 |
The notional amount of futures sold as a percentage of Net Assets is 3.2%
Security Type Abbreviations
ETF – Exchange-Traded Fund
Legend
(a) Security or a portion of the security was pledged to cover margin requirements for futures contracts. At period end, the value of securities pledged amounted to $368,997.
(b) Affiliated fund that is generally available only to investment companies and other accounts managed by Fidelity Investments. A complete unaudited schedule of portfolio holdings for each Fidelity Central Fund is filed with the SEC for the first and third quarters of each fiscal year on Form N-Q and is available upon request or at the SEC's website at www.sec.gov. An unaudited holdings listing for the Fund, which presents direct holdings as well as the pro-rata share of securities and other investments held indirectly through its investment in underlying non-money market Fidelity Central Funds, other than the Commodity Strategy Central Fund, is available at fidelity.com and/or institutional.fidelity.com, as applicable. In addition, each Fidelity Central Fund's financial statements are available on the SEC's website or upon request.
(c) Affiliated fund that is generally available only to investment companies and other accounts managed by Fidelity Investments. The rate quoted is the annualized seven-day yield of the fund at period end. A complete unaudited listing of the fund's holdings as of its most recent quarter end is available upon request. In addition, each Fidelity Central Fund's financial statements are available on the SEC's website or upon request.
Affiliated Central Funds
Information regarding fiscal year to date income earned by the Fund from investments in Fidelity Central Funds is as follows:
| Fund | Income earned |
| Fidelity Cash Central Fund | $25,598 |
| Fidelity Commodity Strategy Central Fund | 0 |
| Fidelity Consumer Discretionary Central Fund | 38,530 |
| Fidelity Consumer Staples Central Fund | 59,698 |
| Fidelity Emerging Markets Debt Central Fund | 29,633 |
| Fidelity Emerging Markets Equity Central Fund | 54,163 |
| Fidelity Energy Central Fund | 30,005 |
| Fidelity Financials Central Fund | 122,713 |
| Fidelity Floating Rate Central Fund | 55,366 |
| Fidelity Health Care Central Fund | 65,538 |
| Fidelity High Income Central Fund 1 | 111,607 |
| Fidelity Industrials Central Fund | 58,124 |
| Fidelity Inflation-Protected Bond Index Central Fund | 14,039 |
| Fidelity Information Technology Central Fund | 77,506 |
| Fidelity International Credit Central Fund | 0 |
| Fidelity International Equity Central Fund | 466,591 |
| Fidelity Materials Central Fund | 23,827 |
| Fidelity Money Market Central Fund | 14,876 |
| Fidelity Real Estate Equity Central Fund | 5,691 |
| Fidelity Securities Lending Cash Central Fund | 555 |
| Fidelity Telecom Services Central Fund | 27,325 |
| Fidelity Utilities Central Fund | 27,432 |
| Fidelity VIP Investment Grade Central Fund | 514,845 |
| Total | $1,823,662 |
Amounts in the income column in the above table include any capital gain distributions from underlying funds, which are presented in the corresponding line-item in the Statement of Operations if applicable.
Fiscal year to date information regarding the Fund’s investments in non-Money Market Central Funds, including the ownership percentage, is presented below.
| Fund | Value, beginning of period | Purchases | Sales Proceeds | Realized Gain/Loss | Change in Unrealized appreciation (depreciation) | Value, end of period | % ownership, end of period |
| Fidelity Commodity Strategy Central Fund | $4,618,829 | $198,354 | $930,479 | $14,908 | $9,645 | $3,911,257 | 0.7% |
| Fidelity Consumer Discretionary Central Fund | 11,085,370 | 766,986 | 607,485 | 10,273 | 1,096,112 | 12,351,256 | 0.5% |
| Fidelity Consumer Staples Central Fund | 7,114,905 | 681,480 | 363,381 | (7,576) | (662,924) | 6,762,504 | 0.5% |
| Fidelity Emerging Markets Debt Central Fund | 1,152,461 | 63,764 | 57,315 | (854) | (81,368) | 1,076,688 | 0.8% |
| Fidelity Emerging Markets Equity Central Fund | 8,905,698 | 353,664 | 866,426 | 18,918 | (670,524) | 7,741,330 | 1.1% |
| Fidelity Energy Central Fund | 6,081,328 | 594,184 | 322,151 | 62 | 443,469 | 6,796,892 | 0.5% |
| Fidelity Financials Central Fund | 20,492,187 | 2,059,787 | 1,111,259 | (5,776) | (629,787) | 20,805,152 | 0.6% |
| Fidelity Floating Rate Central Fund | 2,229,350 | 127,035 | 117,968 | (289) | (3,898) | 2,234,230 | 0.1% |
| Fidelity Health Care Central Fund | 14,107,635 | 1,315,737 | 791,317 | 5,931 | 1,873,597 | 16,511,583 | 0.5% |
| Fidelity High Income Central Fund 1 | 4,328,513 | 416,007 | 1,170,454 | 109,794 | (233,734) | 3,450,126 | 0.9% |
| Fidelity Industrials Central Fund | 10,645,928 | 1,236,921 | 604,033 | (3,936) | (420,694) | 10,854,186 | 0.5% |
| Fidelity Inflation-Protected Bond Index Central Fund | 7,620,576 | 2,079,702 | 423,046 | (721) | 15,598 | 9,292,109 | 0.8% |
| Fidelity Information Technology Central Fund | 25,074,285 | 3,303,483 | 1,505,928 | 2,029 | 2,855,350 | 29,729,219 | 0.5% |
| Fidelity International Credit Central Fund | -- | 1,382,016 | 8,034 | (8) | (827) | 1,373,147 | 0.8% |
| Fidelity International Equity Central Fund | 35,274,088 | 1,489,798 | 5,578,908 | 397,769 | (1,866,235) | 29,716,512 | 1.1% |
| Fidelity Materials Central Fund | 3,266,226 | 343,585 | 180,534 | (1,865) | (166,478) | 3,260,934 | 0.6% |
| Fidelity Real Estate Equity Central Fund | 1,040,939 | 34,422 | 95,972 | (1,617) | 6,383 | 984,155 | 0.8% |
| Fidelity Telecom Services Central Fund | 2,102,367 | 224,808 | 115,766 | (1,496) | (103,150) | 2,106,763 | 0.6% |
| Fidelity Utilities Central Fund | 3,084,957 | 326,148 | 169,975 | 722 | 246,085 | 3,487,937 | 0.6% |
| Fidelity VIP Investment Grade Central Fund | 39,083,985 | 5,967,539 | 6,179,062 | (107,537) | (920,384) | 37,844,541 | 0.7% |
| Total | $207,309,627 | $22,965,420 | $21,199,493 | $428,731 | $786,236 | $210,290,521 | |
Investment Valuation
The following is a summary of the inputs used, as of June 30, 2018, involving the Fund's assets and liabilities carried at fair value. The inputs or methodology used for valuing securities may not be an indication of the risk associated with investing in those securities. For more information on valuation inputs, and their aggregation into the levels used below, please refer to the Investment Valuation section in the accompanying Notes to Financial Statements.
| | Valuation Inputs at Reporting Date: |
| Description | Total | Level 1 | Level 2 | Level 3 |
| Investments in Securities: | | | | |
| U.S. Government and Government Agency Obligations | $368,997 | $-- | $368,997 | $-- |
| Fixed-Income Funds | 59,213,352 | 59,213,352 | -- | -- |
| Money Market Funds | 474,058 | 474,058 | -- | -- |
| Equity Funds | 168,799,986 | 168,799,986 | -- | -- |
| Total Investments in Securities: | $228,856,393 | $228,487,396 | $368,997 | $-- |
| Derivative Instruments: | | | | |
| Assets | | | | |
| Futures Contracts | $221,039 | $221,039 | $-- | $-- |
| Total Assets | $221,039 | $221,039 | $-- | $-- |
| Total Derivative Instruments: | $221,039 | $221,039 | $-- | $-- |
Value of Derivative Instruments
The following table is a summary of the Fund's value of derivative instruments by primary risk exposure as of June 30, 2018. For additional information on derivative instruments, please refer to the Derivative Instruments section in the accompanying Notes to Financial Statements.
| Primary Risk Exposure / Derivative Type | Value |
| | Asset | Liability |
| Equity Risk | | |
| Futures Contracts(a) | $221,039 | $0 |
| Total Equity Risk | 221,039 | 0 |
| Total Value of Derivatives | $221,039 | $0 |
(a) Reflects gross cumulative appreciation (depreciation) on futures contracts as presented in the Schedule of Investments. In the Statement of Assets and Liabilities, the period end daily variation margin is included in receivable or payable for daily variation margin on futures contracts, and the net cumulative appreciation (depreciation) is included in net unrealized appreciation (depreciation).
Other Information
The composition of credit quality ratings as a percentage of Total Net Assets (Unaudited) is as follows. The information in the following tables is based on the combined investments of the Fund and its pro-rata share of the investments of Fidelity's Fixed-Income Central Funds.
| U.S. Government and U.S. Government Agency Obligations | 15.0% |
| AAA,AA,A | 1.2% |
| BBB | 3.9% |
| BB | 2.4% |
| B | 1.4% |
| CCC,CC,C | 0.3% |
| Not Rated | 1.7% |
| Equities | 73.1% |
| Short-Term Investments and Net Other Assets | 1.0% |
| | 100.0% |
We have used ratings from Moody's Investors Service, Inc. Where Moody's® ratings are not available, we have used S&P® ratings. All ratings are as of the date indicated and do not reflect subsequent changes.
Distribution of investments by country or territory of incorporation, as a percentage of Total Net Assets, is as follows (Unaudited):
| United States of America | 75.4% |
| Japan | 3.3% |
| United Kingdom | 3.1% |
| Cayman Islands | 1.9% |
| Canada | 1.7% |
| Netherlands | 1.5% |
| Germany | 1.5% |
| France | 1.4% |
| Others (Individually Less Than 1%) | 10.2% |
| | 100.0% |
See accompanying notes which are an integral part of the financial statements.
Financial Statements
Statement of Assets and Liabilities
| | | June 30, 2018 (Unaudited) |
| Assets | | |
Investment in securities, at value — See accompanying schedule:
Unaffiliated issuers (cost $17,430,992) | $18,091,814 | |
| Fidelity Central Funds (cost $186,137,227) | 210,764,579 | |
| Total Investment in Securities (cost $203,568,219) | | $228,856,393 |
| Cash | | 47 |
| Receivable for investments sold | | 41,484 |
| Receivable for fund shares sold | | 83,147 |
| Dividends receivable | | 49,783 |
| Distributions receivable from Fidelity Central Funds | | 344 |
| Other receivables | | 607 |
| Total assets | | 229,031,805 |
| Liabilities | | |
| Payable for fund shares redeemed | $26,368 | |
| Accrued management fee | 104,255 | |
| Transfer agent fee payable | 20,573 | |
| Distribution and service plan fees payable | 1,036 | |
| Payable for daily variation margin on futures contracts | 46,125 | |
| Other affiliated payables | 9,493 | |
| Other payables and accrued expenses | 22,093 | |
| Total liabilities | | 229,943 |
| Net Assets | | $228,801,862 |
| Net Assets consist of: | | |
| Paid in capital | | $200,268,461 |
| Undistributed net investment income | | 1,129,985 |
| Accumulated undistributed net realized gain (loss) on investments | | 1,894,126 |
| Net unrealized appreciation (depreciation) on investments and assets and liabilities in foreign currencies | | 25,509,290 |
| Net Assets | | $228,801,862 |
| Initial Class: | | |
| Net Asset Value, offering price and redemption price per share ($102,886,846 ÷ 5,480,866 shares) | | $18.77 |
| Service Class: | | |
| Net Asset Value, offering price and redemption price per share ($2,904,483 ÷ 156,019 shares) | | $18.62 |
| Service Class 2: | | |
| Net Asset Value, offering price and redemption price per share ($3,640,260 ÷ 196,940 shares) | | $18.48 |
| Investor Class: | | |
| Net Asset Value, offering price and redemption price per share ($119,370,273 ÷ 6,399,841 shares) | | $18.65 |
See accompanying notes which are an integral part of the financial statements.
Statement of Operations
| | | Six months ended June 30, 2018 (Unaudited) |
| Investment Income | | |
| Dividends | | $150,025 |
| Interest | | 1,242 |
| Income from Fidelity Central Funds | | 1,823,662 |
| Total income | | 1,974,929 |
| Expenses | | |
| Management fee | $623,845 | |
| Transfer agent fees | 121,315 | |
| Distribution and service plan fees | 6,221 | |
| Accounting and security lending fees | 56,843 | |
| Custodian fees and expenses | 680 | |
| Independent trustees' fees and expenses | 489 | |
| Audit | 33,993 | |
| Legal | 3,631 | |
| Miscellaneous | 736 | |
| Total expenses before reductions | 847,753 | |
| Expense reductions | (2,615) | |
| Total expenses after reductions | | 845,138 |
| Net investment income (loss) | | 1,129,791 |
| Realized and Unrealized Gain (Loss) | | |
| Net realized gain (loss) on: | | |
| Investment securities: | | |
| Unaffiliated issuers | 804,331 | |
| Fidelity Central Funds | 433,674 | |
| Futures contracts | 93,782 | |
| Total net realized gain (loss) | | 1,331,787 |
| Change in net unrealized appreciation (depreciation) on: | | |
| Investment securities: | | |
| Unaffiliated issuers | (934,090) | |
| Fidelity Central Funds | 786,183 | |
| Assets and liabilities in foreign currencies | (66) | |
| Futures contracts | 205,616 | |
| Total change in net unrealized appreciation (depreciation) | | 57,643 |
| Net gain (loss) | | 1,389,430 |
| Net increase (decrease) in net assets resulting from operations | | $2,519,221 |
See accompanying notes which are an integral part of the financial statements.
Statement of Changes in Net Assets
| | Six months ended June 30, 2018 (Unaudited) | Year ended December 31, 2017 |
| Increase (Decrease) in Net Assets | | |
| Operations | | |
| Net investment income (loss) | $1,129,791 | $2,770,748 |
| Net realized gain (loss) | 1,331,787 | 12,409,284 |
| Change in net unrealized appreciation (depreciation) | 57,643 | 21,813,931 |
| Net increase (decrease) in net assets resulting from operations | 2,519,221 | 36,993,963 |
| Distributions to shareholders from net investment income | (65,340) | (2,705,207) |
| Distributions to shareholders from net realized gain | (7,589,655) | (28,042,611) |
| Total distributions | (7,654,995) | (30,747,818) |
| Share transactions - net increase (decrease) | 3,845,084 | 19,986,287 |
| Total increase (decrease) in net assets | (1,290,690) | 26,232,432 |
| Net Assets | | |
| Beginning of period | 230,092,552 | 203,860,120 |
| End of period | $228,801,862 | $230,092,552 |
| Other Information | | |
| Undistributed net investment income end of period | $1,129,985 | $65,534 |
See accompanying notes which are an integral part of the financial statements.
Financial Highlights
VIP Asset Manager: Growth Portfolio Initial Class
| | Six months ended (Unaudited) June 30, | Years endedDecember 31, | | | | |
| | 2018 | 2017 | 2016 | 2015 | 2014 | 2013 |
| Selected Per–Share Data | | | | | | |
| Net asset value, beginning of period | $19.21 | $18.81 | $18.90 | $19.15 | $18.30 | $15.14 |
| Income from Investment Operations | | | | | | |
| Net investment income (loss)A | .10 | .25 | .24 | .27 | .23 | .17 |
| Net realized and unrealized gain (loss) | .10 | 2.97 | .20 | (.27) | .85 | 3.22 |
| Total from investment operations | .20 | 3.22 | .44 | .00 | 1.08 | 3.39 |
| Distributions from net investment income | (.01) | (.24) | (.26) | (.24) | (.21) | (.18) |
| Distributions from net realized gain | (.63) | (2.58) | (.26) | (.01) | (.02) | (.05) |
| Total distributions | (.64) | (2.82) | (.53)B | (.25) | (.23) | (.23) |
| Net asset value, end of period | $18.77 | $19.21 | $18.81 | $18.90 | $19.15 | $18.30 |
| Total ReturnC,D,E | 1.15% | 18.73% | 2.52% | .03% | 5.87% | 22.41% |
| Ratios to Average Net AssetsF,G | | | | | | |
| Expenses before reductions | .69%H | .69% | .71% | .70% | .70% | .72% |
| Expenses net of fee waivers, if any | .69%H | .69% | .71% | .70% | .70% | .71% |
| Expenses net of all reductions | .69%H | .69% | .70% | .69% | .70% | .71% |
| Net investment income (loss) | 1.02%H | 1.32% | 1.31% | 1.37% | 1.19% | 1.05% |
| Supplemental Data | | | | | | |
| Net assets, end of period (000 omitted) | $102,887 | $106,903 | $99,882 | $108,324 | $122,484 | $127,423 |
| Portfolio turnover rateI | 23%H | 29% | 142% | 49% | 38% | 52% |
A Calculated based on average shares outstanding during the period.
B Total distributions of $.53 per share is comprised of distributions from net investment income of $.263 and distributions from net realized gain of $.264 per share.
C Total returns for periods of less than one year are not annualized.
D Total returns do not reflect charges attributable to your insurance company's separate account. Inclusion of these charges would reduce the total returns shown.
E Total returns would have been lower if certain expenses had not been reduced during the applicable periods shown.
F Fees and expenses of any underlying Fidelity Central Funds are not included in the Fund's expense ratio. The Fund indirectly bears its proportionate share of the expenses of any underlying Fidelity Central Funds. Based on their most recent shareholder report date, the expenses of any underlying non-money market Fidelity Central Funds ranged from less than .005% to .07%.
G Expense ratios reflect operating expenses of the class. Expenses before reductions do not reflect amounts reimbursed by the investment adviser or reductions from brokerage service arrangements or reductions from other expense offset arrangements and do not represent the amount paid by the class during periods when reimbursements or reductions occur. Expenses net of fee waivers reflect expenses after reimbursement by the investment adviser but prior to reductions from brokerage service arrangements or other expense offset arrangements. Expenses net of all reductions represent the net expenses paid by the class.
H Annualized
I Amount does not include the portfolio activity of any underlying Fidelity Central Funds.
See accompanying notes which are an integral part of the financial statements.
VIP Asset Manager: Growth Portfolio Service Class
| | Six months ended (Unaudited) June 30, | Years endedDecember 31, | | | | |
| | 2018 | 2017 | 2016 | 2015 | 2014 | 2013 |
| Selected Per–Share Data | | | | | | |
| Net asset value, beginning of period | $19.07 | $18.68 | $18.79 | $19.03 | $18.19 | $15.04 |
| Income from Investment Operations | | | | | | |
| Net investment income (loss)A | .09 | .23 | .22 | .25 | .21 | .16 |
| Net realized and unrealized gain (loss) | .10 | 2.96 | .18 | (.26) | .84 | 3.19 |
| Total from investment operations | .19 | 3.19 | .40 | (.01) | 1.05 | 3.35 |
| Distributions from net investment income | (.01) | (.22) | (.25) | (.22) | (.19) | (.15) |
| Distributions from net realized gain | (.63) | (2.58) | (.26) | (.01) | (.02) | (.05) |
| Total distributions | (.64) | (2.80) | (.51) | (.23) | (.21) | (.20) |
| Net asset value, end of period | $18.62 | $19.07 | $18.68 | $18.79 | $19.03 | $18.19 |
| Total ReturnB,C,D | 1.10% | 18.70% | 2.34% | (.03)% | 5.75% | 22.34% |
| Ratios to Average Net AssetsE,F | | | | | | |
| Expenses before reductions | .79%G | .79% | .81% | .80% | .80% | .82% |
| Expenses net of fee waivers, if any | .79%G | .79% | .81% | .80% | .80% | .82% |
| Expenses net of all reductions | .79%G | .79% | .80% | .79% | .80% | .81% |
| Net investment income (loss) | .92%G | 1.22% | 1.21% | 1.27% | 1.09% | .95% |
| Supplemental Data | | | | | | |
| Net assets, end of period (000 omitted) | $2,904 | $3,018 | $2,698 | $2,877 | $3,265 | $3,191 |
| Portfolio turnover rateH | 23%G | 29% | 142% | 49% | 38% | 52% |
A Calculated based on average shares outstanding during the period.
B Total returns for periods of less than one year are not annualized.
C Total returns do not reflect charges attributable to your insurance company's separate account. Inclusion of these charges would reduce the total returns shown.
D Total returns would have been lower if certain expenses had not been reduced during the applicable periods shown.
E Fees and expenses of any underlying Fidelity Central Funds are not included in the Fund's expense ratio. The Fund indirectly bears its proportionate share of the expenses of any underlying Fidelity Central Funds. Based on their most recent shareholder report date, the expenses of any underlying non-money market Fidelity Central Funds ranged from less than .005% to .07%.
F Expense ratios reflect operating expenses of the class. Expenses before reductions do not reflect amounts reimbursed by the investment adviser or reductions from brokerage service arrangements or reductions from other expense offset arrangements and do not represent the amount paid by the class during periods when reimbursements or reductions occur. Expenses net of fee waivers reflect expenses after reimbursement by the investment adviser but prior to reductions from brokerage service arrangements or other expense offset arrangements. Expenses net of all reductions represent the net expenses paid by the class.
G Annualized
H Amount does not include the portfolio activity of any underlying Fidelity Central Funds.
See accompanying notes which are an integral part of the financial statements.
VIP Asset Manager: Growth Portfolio Service Class 2
| | Six months ended (Unaudited) June 30, | Years endedDecember 31, | | | | |
| | 2018 | 2017 | 2016 | 2015 | 2014 | 2013 |
| Selected Per–Share Data | | | | | | |
| Net asset value, beginning of period | $18.95 | $18.58 | $18.70 | $18.94 | $18.10 | $14.97 |
| Income from Investment Operations | | | | | | |
| Net investment income (loss)A | .07 | .20 | .19 | .21 | .17 | .12 |
| Net realized and unrealized gain (loss) | .10 | 2.94 | .18 | (.25) | .84 | 3.18 |
| Total from investment operations | .17 | 3.14 | .37 | (.04) | 1.01 | 3.30 |
| Distributions from net investment income | (.01) | (.20) | (.23) | (.19) | (.15) | (.12) |
| Distributions from net realized gain | (.63) | (2.57) | (.26) | (.01) | (.02) | (.05) |
| Total distributions | (.64) | (2.77) | (.49) | (.20) | (.17) | (.17) |
| Net asset value, end of period | $18.48 | $18.95 | $18.58 | $18.70 | $18.94 | $18.10 |
| Total ReturnB,C,D | 1.00% | 18.49% | 2.18% | (.18)% | 5.55% | 22.09% |
| Ratios to Average Net AssetsE,F | | | | | | |
| Expenses before reductions | .94%G | .94% | .96% | .96% | 1.01% | 1.03% |
| Expenses net of fee waivers, if any | .94%G | .94% | .96% | .96% | 1.01% | 1.02% |
| Expenses net of all reductions | .94%G | .94% | .95% | .95% | 1.00% | 1.02% |
| Net investment income (loss) | .77%G | 1.07% | 1.06% | 1.11% | .88% | .74% |
| Supplemental Data | | | | | | |
| Net assets, end of period (000 omitted) | $3,640 | $3,755 | $3,425 | $3,533 | $3,573 | $3,626 |
| Portfolio turnover rateH | 23%G | 29% | 142% | 49% | 38% | 52% |
A Calculated based on average shares outstanding during the period.
B Total returns for periods of less than one year are not annualized.
C Total returns do not reflect charges attributable to your insurance company's separate account. Inclusion of these charges would reduce the total returns shown.
D Total returns would have been lower if certain expenses had not been reduced during the applicable periods shown.
E Fees and expenses of any underlying Fidelity Central Funds are not included in the Fund's expense ratio. The Fund indirectly bears its proportionate share of the expenses of any underlying Fidelity Central Funds. Based on their most recent shareholder report date, the expenses of any underlying non-money market Fidelity Central Funds ranged from less than .005% to .07%.
F Expense ratios reflect operating expenses of the class. Expenses before reductions do not reflect amounts reimbursed by the investment adviser or reductions from brokerage service arrangements or reductions from other expense offset arrangements and do not represent the amount paid by the class during periods when reimbursements or reductions occur. Expenses net of fee waivers reflect expenses after reimbursement by the investment adviser but prior to reductions from brokerage service arrangements or other expense offset arrangements. Expenses net of all reductions represent the net expenses paid by the class.
G Annualized
H Amount does not include the portfolio activity of any underlying Fidelity Central Funds.
See accompanying notes which are an integral part of the financial statements.
VIP Asset Manager: Growth Portfolio Investor Class
| | Six months ended (Unaudited) June 30, | Years endedDecember 31, | | | | |
| | 2018 | 2017 | 2016 | 2015 | 2014 | 2013 |
| Selected Per–Share Data | | | | | | |
| Net asset value, beginning of period | $19.10 | $18.71 | $18.82 | $19.06 | $18.22 | $15.08 |
| Income from Investment Operations | | | | | | |
| Net investment income (loss)A | .09 | .23 | .22 | .25 | .21 | .16 |
| Net realized and unrealized gain (loss) | .10 | 2.97 | .18 | (.25) | .85 | 3.20 |
| Total from investment operations | .19 | 3.20 | .40 | – | 1.06 | 3.36 |
| Distributions from net investment income | (.01) | (.23) | (.25) | (.23) | (.20) | (.17) |
| Distributions from net realized gain | (.63) | (2.58) | (.26) | (.01) | (.02) | (.05) |
| Total distributions | (.64) | (2.81) | (.51) | (.24) | (.22) | (.22) |
| Net asset value, end of period | $18.65 | $19.10 | $18.71 | $18.82 | $19.06 | $18.22 |
| Total ReturnB,C,D | 1.10% | 18.68% | 2.35% | .01% | 5.79% | 22.30% |
| Ratios to Average Net AssetsE,F | | | | | | |
| Expenses before reductions | .77%G | .77% | .79% | .78% | .78% | .80% |
| Expenses net of fee waivers, if any | .77%G | .77% | .79% | .78% | .78% | .80% |
| Expenses net of all reductions | .76%G | .77% | .79% | .77% | .78% | .79% |
| Net investment income (loss) | .95%G | 1.24% | 1.23% | 1.29% | 1.11% | .97% |
| Supplemental Data | | | | | | |
| Net assets, end of period (000 omitted) | $119,370 | $116,417 | $97,855 | $106,942 | $86,687 | $58,295 |
| Portfolio turnover rateH | 23%G | 29% | 142% | 49% | 38% | 52% |
A Calculated based on average shares outstanding during the period.
B Total returns for periods of less than one year are not annualized.
C Total returns do not reflect charges attributable to your insurance company's separate account. Inclusion of these charges would reduce the total returns shown.
D Total returns would have been lower if certain expenses had not been reduced during the applicable periods shown.
E Fees and expenses of any underlying Fidelity Central Funds are not included in the Fund's expense ratio. The Fund indirectly bears its proportionate share of the expenses of any underlying Fidelity Central Funds. Based on their most recent shareholder report date, the expenses of any underlying non-money market Fidelity Central Funds ranged from less than .005% to .07%.
F Expense ratios reflect operating expenses of the class. Expenses before reductions do not reflect amounts reimbursed by the investment adviser or reductions from brokerage service arrangements or reductions from other expense offset arrangements and do not represent the amount paid by the class during periods when reimbursements or reductions occur. Expenses net of fee waivers reflect expenses after reimbursement by the investment adviser but prior to reductions from brokerage service arrangements or other expense offset arrangements. Expenses net of all reductions represent the net expenses paid by the class.
G Annualized
H Amount does not include the portfolio activity of any underlying Fidelity Central Funds.
See accompanying notes which are an integral part of the financial statements.
Notes to Financial Statements (Unaudited)
For the period ended June 30, 2018
1. Organization.
VIP Asset Manager: Growth Portfolio (the Fund) is a fund of Variable Insurance Products Fund V (the Trust) and is authorized to issue an unlimited number of shares. The Trust is registered under the Investment Company Act of 1940, as amended (the 1940 Act), as an open-end management investment company organized as a Massachusetts business trust. Shares of the Fund may only be purchased by insurance companies for the purpose of funding variable annuity or variable life insurance contracts. The Fund offers the following classes of shares: Initial Class shares, Service Class shares, Service Class 2 shares and Investor Class shares. All classes have equal rights and voting privileges, except for matters affecting a single class.
2. Investments in Fidelity Central Funds.
The Fund invests in Fidelity Central Funds, which are open-end investment companies generally available only to other investment companies and accounts managed by the investment adviser and its affiliates. The Fund's Schedule of Investments lists each of the Fidelity Central Funds held as of period end, if any, as an investment of the Fund, but does not include the underlying holdings of each Fidelity Central Fund. As an Investing Fund, the Fund indirectly bears its proportionate share of the expenses of the underlying Fidelity Central Funds.
Based on its investment objective, each Fidelity Central Fund may invest or participate in various investment vehicles or strategies that are similar to those of the Fund. These strategies are consistent with the investment objectives of the Fund and may involve certain economic risks which may cause a decline in value of each of the Fidelity Central Funds and thus a decline in the value of the Fund. The following summarizes the Fund's investment in each Fidelity Central Fund.
| Fidelity Central Fund | Investment Manager | Investment Objective | Investment Practices | Expense Ratio(a) |
| Fidelity Commodity Strategy Central Fund | Geode Capital Management, LLC (Geode) | Seeks to provide investment returns that correspond to the performance of the commodities market. | Investment in commodity-related investments through a wholly-owned subsidiary organized under the laws of the Cayman Islands
Futures | .05% |
| Fidelity Equity Central Funds | FMR Co., Inc. (FMRC) | Each fund seeks capital appreciation by investing primarily in common stocks, with a concentration in a particular industry. | Foreign Securities
Restricted Securities | Less than .005% to .01% |
| Fidelity Emerging Markets Debt Central Fund | FMRC | Seeks high total return by normally investing in debt securities of issuers in emerging markets and other debt investments that are tied economically to emerging markets. | Foreign Securities
Restricted Securities
| .01% |
| Fidelity Emerging Markets Equity Central Fund | FMRC | Seeks capital appreciation by investing primarily in equity securities of issuers in emerging markets. | Foreign Securities
Futures
| .07% |
| Fidelity International Equity Central Fund | FMRC | Seeks capital appreciation by investing primarily in non-U.S. based common stocks, including securities of issuers located in emerging markets. | Delayed Delivery & When Issued Securities
Foreign Securities
Futures
| .01% |
| Fidelity Floating Rate Central Fund | FMRC | Seeks a high level of income by normally investing in floating rate loans and other floating rate securities. | Delayed Delivery & When Issued Securities
Loans & Direct Debt Instruments
Restricted Securities
| .05% |
| Fidelity High Income Central Fund 1 | FMRC | Seeks a high level of income and may also seek capital appreciation by investing primarily in debt securities, preferred stocks, and convertible securities, with an emphasis on lower-quality debt securities. | Delayed Delivery & When Issued Securities
Loans & Direct Debt Instruments
Restricted Securities
| Less than .005% |
| Fidelity Inflation-Protected Bond Index Central Fund | Fidelity Investment Money Management, Inc. (FIMM) | Seeks to provide investment results that correspond to the performance of the inflation-protected United States Treasury market, and may invest in derivatives. | | Less than .005% |
| Fidelity VIP Investment Grade Central Fund | FIMM | Seeks a high level of current income by normally investing in investment-grade debt securities and repurchase agreements. | Delayed Delivery & When Issued Securities
Repurchase Agreements
Restricted Securities
Swaps | Less than .005% |
| Fidelity International Credit Central Fund | FMRC | Seeks a high level of current income by normally investing in debt securities of foreign issuers, including debt securities of issuers located in emerging markets. Foreign currency exposure is hedged utilizing foreign currency contracts. | Foreign Securities
Forward Foreign Currency Contracts
Futures
Options
Restricted Securities
Swaps | .01% |
| Fidelity Money Market Central Funds | FIMM | Each fund seeks to obtain a high level of current income consistent with the preservation of capital and liquidity. | Short-term Investments
| Less than .005% |
(a) Expenses expressed as a percentage of average net assets and are as of each underlying Central Fund's most recent annual or semi-annual shareholder report.
An unaudited holdings listing for the Fund, which presents direct holdings as well as the pro-rata share of any securities and other investments held indirectly through its investment in underlying non-money market Fidelity Central Funds, is available at institutional.fidelity.com. A complete unaudited list of holdings for each Fidelity Central Fund is available upon request or at the Securities and Exchange Commission (the SEC) website at www.sec.gov. In addition, the financial statements of the Fidelity Central Funds which contain the significant accounting policies (including investment valuation policies) of those funds are available on the SEC website or upon request.
3. Significant Accounting Policies.
The Fund is an investment company and applies the accounting and reporting guidance of the Financial Accounting Standards Board (FASB) Accounting Standards Codification Topic 946 Financial Services – Investments Companies. The financial statements have been prepared in conformity with accounting principles generally accepted in the United States of America (GAAP), which require management to make certain estimates and assumptions at the date of the financial statements. Actual results could differ from those estimates. Subsequent events, if any, through the date that the financial statements were issued have been evaluated in the preparation of the financial statements. The following summarizes the significant accounting policies of the Fund:
Investment Valuation. Investments are valued as of 4:00 p.m. Eastern time on the last calendar day of the period. The Board of Trustees (the Board) has delegated the day to day responsibility for the valuation of the Fund's investments to the Fair Value Committee (the Committee) established by the Fund's investment adviser. In accordance with valuation policies and procedures approved by the Board, the Fund attempts to obtain prices from one or more third party pricing vendors or brokers to value its investments. When current market prices, quotations or currency exchange rates are not readily available or reliable, investments will be fair valued in good faith by the Committee, in accordance with procedures adopted by the Board. Factors used in determining fair value vary by investment type and may include market or investment specific events, changes in interest rates and credit quality. The frequency with which these procedures are used cannot be predicted and they may be utilized to a significant extent. The Committee oversees the Fund's valuation policies and procedures and reports to the Board on the Committee's activities and fair value determinations. The Board monitors the appropriateness of the procedures used in valuing the Fund's investments and ratifies the fair value determinations of the Committee. The Fund categorizes the inputs to valuation techniques used to value its investments into a disclosure hierarchy consisting of three levels as shown below:
- Level 1 – quoted prices in active markets for identical investments
- Level 2 – other significant observable inputs (including quoted prices for similar investments, interest rates, prepayment speeds, etc.)
- Level 3 – unobservable inputs (including the Fund's own assumptions based on the best information available)
Valuation techniques used to value the Fund's investments by major category are as follows. Debt securities, including restricted securities, are valued based on evaluated prices received from third party pricing vendors or from brokers who make markets in such securities. U.S. government and government agency obligations are valued by pricing vendors who utilize matrix pricing which considers yield or price of bonds of comparable quality, coupon, maturity and type or by broker-supplied prices. When independent prices are unavailable or unreliable, debt securities may be valued utilizing pricing methodologies which consider similar factors that would be used by third party pricing vendors. Debt securities are generally categorized as Level 2 in the hierarchy but may be Level 3 depending on the circumstances.
Exchange-Traded Funds (ETFs) are valued at their last sale price or official closing price as reported by a third party pricing vendor on the primary market or exchange on which they are traded and are categorized as Level 1 in the hierarchy. In the event there were no sales during the day but the exchange reports a closing bid level, ETFs are valued at the closing bid and would be categorized as Level 1 in the hierarchy. In the event there was no closing bid, ETFs may be valued by another method that the Board believes reflects fair value in accordance with the Board's fair value pricing policies and may be categorized as Level 2 in the hierarchy.
Futures contracts are valued at the settlement price established each day by the board of trade or exchange on which they are traded and are categorized as Level 1 in the hierarchy. Investments in open-end mutual funds, including the Fidelity Central Funds, are valued at their closing net asset value (NAV) each business day and are categorized as Level 1 in the hierarchy.
Changes in valuation techniques may result in transfers in or out of an assigned level within the disclosure hierarchy. The aggregate value of investments by input level, as of June 30, 2018, is included at the end of the Fund's Schedule of Investments.
Foreign Currency. The Fund may use foreign currency contracts to facilitate transactions in foreign-denominated securities. Gains and losses from these transactions may arise from changes in the value of the foreign currency or if the counterparties do not perform under the contracts' terms.
Foreign-denominated assets, including investment securities, and liabilities are translated into U.S. dollars at the exchange rates at period end. Purchases and sales of investment securities, income and dividends received and expenses denominated in foreign currencies are translated into U.S. dollars at the exchange rate in effect on the transaction date.
The effects of exchange rate fluctuations on investments are included with the net realized and unrealized gain (loss) on investment securities. Other foreign currency transactions resulting in realized and unrealized gain (loss) are disclosed separately.
Investment Transactions and Income. For financial reporting purposes, the Fund's investment holdings and NAV include trades executed through the end of the last business day of the period. The NAV per share for processing shareholder transactions is calculated as of the close of business of the New York Stock Exchange (NYSE), normally 4:00 p.m. Eastern time and includes trades executed through the end of the prior business day. Gains and losses on securities sold are determined on the basis of identified cost and include proceeds received from litigation. Dividend income is recorded on the ex-dividend date, except for certain dividends from foreign securities where the ex-dividend date may have passed, which are recorded as soon as the Fund is informed of the ex-dividend date. Non-cash dividends included in dividend income, if any, are recorded at the fair market value of the securities received. Income and capital gain distributions from Fidelity Central Funds, if any, are recorded on the ex-dividend date. Certain distributions received by the Fund represent a return of capital or capital gain. The Fund determines the components of these distributions subsequent to the ex-dividend date, based upon receipt of tax filings or other correspondence relating to the underlying investment. These distributions are recorded as a reduction of cost of investments and/or as a realized gain. Interest income is accrued as earned and includes coupon interest and amortization of premium and accretion of discount on debt securities as applicable. Investment income is recorded net of foreign taxes withheld where recovery of such taxes is uncertain.
Class Allocations and Expenses. Investment income, realized and unrealized capital gains and losses, common expenses of the Fund, and certain fund-level expense reductions, if any, are allocated daily on a pro-rata basis to each class based on the relative net assets of each class to the total net assets of the Fund. Each class differs with respect to transfer agent and distribution and service plan fees incurred. Certain expense reductions may also differ by class. For the reporting period, the allocated portion of income and expenses to each class as a percent of its average net assets may vary due to the timing of recording these transactions in relation to fluctuating net assets of the classes. Expenses directly attributable to a fund are charged to that fund. Expenses attributable to more than one fund are allocated among the respective funds on the basis of relative net assets or other appropriate methods. Expense estimates are accrued in the period to which they relate and adjustments are made when actual amounts are known. Expenses included in the accompanying financial statements reflect the expenses of the Fund and do not include any expenses of the Fidelity Central Funds. Although not included in the Fund's expenses, the Fund indirectly bears its proportionate share of the Fidelity Central Funds' expenses through the impact of these expenses on each Fidelity Central Fund's NAV.
Income Tax Information and Distributions to Shareholders. Each year, the Fund intends to qualify as a regulated investment company under Subchapter M of the Internal Revenue Code, including distributing substantially all of its taxable income and realized gains. As a result, no provision for U.S. Federal income taxes is required. The Fund files a U.S. federal tax return, in addition to state and local tax returns as required. The Fund's federal income tax returns are subject to examination by the Internal Revenue Service (IRS) for a period of three fiscal years after they are filed. State and local tax returns may be subject to examination for an additional fiscal year depending on the jurisdiction. Foreign taxes are provided for based on the Fund's understanding of the tax rules and rates that exist in the foreign markets in which it invests.
Distributions are declared and recorded on the ex-dividend date. Income and capital gain distributions are declared separately for each class. Income and capital gain distributions are determined in accordance with income tax regulations, which may differ from GAAP.
Capital accounts within the financial statements are adjusted for permanent book-tax differences. These adjustments have no impact on net assets or the results of operations. Capital accounts are not adjusted for temporary book-tax differences which will reverse in a subsequent period.
Book-tax differences are primarily due to the short-term gain distributions from the Fidelity Central Funds, futures contracts, foreign currency transactions, market discount, deferred trustees compensation and losses deferred due to wash sales.
As of period end, the cost and unrealized appreciation (depreciation) in securities, and derivatives if applicable, for federal income tax purposes were as follows:
| Gross unrealized appreciation | $27,919,142 |
| Gross unrealized depreciation | (1,328,304) |
| Net unrealized appreciation (depreciation) | $26,590,838 |
| Tax cost | $202,486,594 |
4. Derivative Instruments.
Risk Exposures and the Use of Derivative Instruments. The Fund's investment objective allows the Fund to enter into various types of derivative contracts, including futures contracts. Derivatives are investments whose value is primarily derived from underlying assets, indices or reference rates and may be transacted on an exchange or over-the-counter (OTC). Derivatives may involve a future commitment to buy or sell a specified asset based on specified terms, to exchange future cash flows at periodic intervals based on a notional principal amount, or for one party to make one or more payments upon the occurrence of specified events in exchange for periodic payments from the other party.
The Fund used derivatives to increase returns and to manage exposure to certain risks as defined below. The success of any strategy involving derivatives depends on analysis of numerous economic factors, and if the strategies for investment do not work as intended, the Fund may not achieve its objectives.
The Fund's use of derivatives increased or decreased its exposure to the following risk:
| Equity Risk | Equity risk relates to the fluctuations in the value of financial instruments as a result of changes in market prices (other than those arising from interest rate risk or foreign exchange risk), whether caused by factors specific to an individual investment, its issuer, or all factors affecting all instruments traded in a market or market segment.
|
The Fund is also exposed to additional risks from investing in derivatives, such as liquidity risk and counterparty credit risk. Liquidity risk is the risk that the Fund will be unable to close out the derivative in the open market in a timely manner. Counterparty credit risk is the risk that the counterparty will not be able to fulfill its obligation to the Fund. Counterparty credit risk related to exchange-traded futures contracts may be mitigated by the protection provided by the exchange on which they trade.
Investing in derivatives may involve greater risks than investing in the underlying assets directly and, to varying degrees, may involve risk of loss in excess of any initial investment and collateral received and amounts recognized in the Statement of Assets and Liabilities. In addition, there may be the risk that the change in value of the derivative contract does not correspond to the change in value of the underlying instrument.
Futures Contracts. A futures contract is an agreement between two parties to buy or sell a specified underlying instrument for a fixed price at a specified future date. The Fund used futures contracts to manage its exposure to the stock market.
Upon entering into a futures contract, a fund is required to deposit either cash or securities (initial margin) with a clearing broker in an amount equal to a certain percentage of the face value of the contract. Futures contracts are marked-to-market daily and subsequent daily payments (variation margin) are made or received by a fund depending on the daily fluctuations in the value of the futures contracts and are recorded as unrealized appreciation or (depreciation). This receivable and/or payable, if any, is included in daily variation margin on futures contracts in the Statement of Assets and Liabilities. Realized gain or (loss) is recorded upon the expiration or closing of a futures contract. The net realized gain (loss) and change in net unrealized appreciation (depreciation) on futures contracts during the period is presented in the Statement of Operations.
Any open futures contracts at period end are presented in the Schedule of Investments under the caption "Futures Contracts". The notional amount at value reflects each contract's exposure to the underlying instrument or index at period end and is representative of volume of activity during the period. Securities deposited to meet initial margin requirements are identified in the Schedule of Investments.
5. Purchases and Redemptions of Underlying Fund Shares.
Purchases and redemptions of the Underlying Fund shares, aggregated $28,276,115 and $26,512,064, respectively.
6. Fees and Other Transactions with Affiliates.
Management Fee. Fidelity Management & Research Company (the investment adviser) and its affiliates provide the Fund with investment management related services for which the Fund pays a monthly management fee. The management fee is the sum of an individual fund fee rate that is based on an annual rate of .30% of the Fund's average net assets and an annualized group fee rate that averaged .24% during the period. The group fee rate is based upon the average net assets of all the mutual funds advised by the investment adviser, including any mutual funds previously advised by the investment adviser that are currently advised by Fidelity SelectCo, LLC, an affiliate of the investment adviser. The group fee rate decreases as assets under management increase and increases as assets under management decrease. For the reporting period, the total annualized management fee rate was .54% of the Fund's average net assets.
The investment adviser pays a portion of the management fees received from the Fund to the Fidelity Central Funds' investment advisers, who are also affiliates, for managing the assets of the Fidelity Central Funds.
Distribution and Service Plan Fees. In accordance with Rule 12b-1 of the 1940 Act, the Fund has adopted separate 12b-1 Plans for each Service Class of shares. Each Service Class pays Fidelity Distributors Corporation (FDC), an affiliate of the investment adviser, a service fee. For the period, the service fee is based on an annual rate of .10% of Service Class' average net assets and .25% of Service Class 2's average net assets.
For the period, total fees, all of which were re-allowed to insurance companies for the distribution of shares and providing shareholder support services, were as follows:
| Service Class | $1,480 |
| Service Class 2 | 4,741 |
| | $6,221 |
Transfer Agent Fees. Fidelity Investments Institutional Operations Company, Inc. (FIIOC), an affiliate of the investment adviser, is the Fund's transfer, dividend disbursing, and shareholder servicing agent. FIIOC receives an asset-based fee with respect to each class. Each class pays a fee for transfer agent services, typesetting and printing and mailing of shareholder reports, excluding mailing of proxy statements, equal to an annual rate of class-level average net assets. The annual rate for Investor Class is .15% and the annual rate for all other classes is .07%. For the period, transfer agent fees for each class were as follows:
| Initial Class | $33,896 |
| Service Class | 953 |
| Service Class 2 | 1,221 |
| Investor Class | 85,245 |
| | $121,315 |
Accounting and Security Lending Fees. Fidelity Service Company, Inc. (FSC), an affiliate of the investment adviser, maintains the Fund's accounting records. The accounting fee is based on the level of average net assets for each month. Under a separate contract, FSC administers the security lending program. The security lending fee is based on the number and duration of lending transactions. For the period, the fees were equivalent to an annualized rate of .05%.
Brokerage Commissions. The Fund placed a portion of its portfolio transactions with brokerage firms which are affiliates of the investment adviser. Brokerage commissions are included in net realized gain (loss) and change in net unrealized appreciation (depreciation) in the Statement of Operations. The commissions paid to these affiliated firms were $2 for the period.
7. Committed Line of Credit.
The Fund participates with other funds managed by the investment adviser or an affiliate in a $4.25 billion credit facility (the "line of credit") to be utilized for temporary or emergency purposes to fund shareholder redemptions or for other short-term liquidity purposes. The Fund has agreed to pay commitment fees on its pro-rata portion of the line of credit, which amounted to $327 and is reflected in Miscellaneous expenses on the Statement of Operations. During the period, the Fund did not borrow on this line of credit.
8. Security Lending.
The Fund lends portfolio securities through a lending agent from time to time in order to earn additional income. For equity securities, a lending agent is used and may loan securities to certain qualified borrowers, including Fidelity Capital Markets (FCM), a broker-dealer affiliated with the Fund. On the settlement date of the loan, the Fund receives collateral (in the form of U.S. Treasury obligations, letters of credit and/or cash) against the loaned securities and maintains collateral in an amount not less than 100% of the market value of the loaned securities during the period of the loan. The market value of the loaned securities is determined at the close of business of the Fund and any additional required collateral is delivered to the Fund on the next business day. The Fund or borrower may terminate the loan at any time, and if the borrower defaults on its obligation to return the securities loaned because of insolvency or other reasons, the Fund may apply collateral received from the borrower against the obligation. The Fund may experience delays and costs in recovering the securities loaned. Any cash collateral received is the Fidelity Securities Lending Cash Central Fund. At period end, there were no security loans outstanding. Security lending income represents the income earned on investing cash collateral, less rebates paid to borrowers and any lending agent fees associated with the loan, plus any premium payments received for lending certain types of securities. Security lending income is presented in the Statement of Operations as a component of income from Fidelity Central Funds. Total security lending income during the period amounted to $555. During the period, there were no securities loaned to FCM.
9. Expense Reductions.
Commissions paid to certain brokers with whom the investment adviser, or its affiliates, places trades on behalf of the Fund include an amount in addition to trade execution, which may be rebated back to the Fund to offset certain expenses. This amount totaled $1,358 for the period. In addition, through arrangements with the Fund's custodian, credits realized as a result of certain uninvested cash balances were used to reduce the Fund's expenses. During the period, these credits reduced the Fund's custody expenses by $117.
In addition, during the period the investment adviser reimbursed and/or waived a portion of fund-level operating expenses in the amount of $1,140.
10. Distributions to Shareholders.
Distributions to shareholders of each class were as follows:
| | Six months ended
June 30, 2018 | Year ended
December 31, 2017 |
| From net investment income | | |
| Initial Class | $32,907 | $1,291,934 |
| Service Class | 776 | 34,278 |
| Service Class 2 | 988 | 37,438 |
| Investor Class | 30,669 | 1,341,557 |
| Total | $65,340 | $2,705,207 |
| From net realized gain | | |
| Initial Class | $3,477,135 | $13,574,774 |
| Service Class | 98,436 | 360,108 |
| Service Class 2 | 125,308 | 472,265 |
| Investor Class | 3,888,776 | 13,635,464 |
| Total | $7,589,655 | $28,042,611 |
11. Share Transactions.
Transactions for each class of shares were as follows:
| | Shares | Shares | Dollars | Dollars |
| | Six months ended June 30, 2018 | Year ended December 31, 2017 | Six months ended June 30, 2018 | Year ended December 31, 2017 |
| Initial Class | | | | |
| Shares sold | 56,718 | 144,059 | $1,078,129 | $2,698,610 |
| Reinvestment of distributions | 192,965 | 833,733 | 3,510,042 | 14,866,708 |
| Shares redeemed | (332,643) | (724,915) | (6,311,054) | (13,492,453) |
| Net increase (decrease) | (82,960) | 252,877 | $(1,722,883) | $4,072,865 |
| Service Class | | | | |
| Shares sold | 562 | 13,458 | $10,728 | $257,481 |
| Reinvestment of distributions | 5,497 | 22,262 | 99,212 | 394,386 |
| Shares redeemed | (8,295) | (21,883) | (156,021) | (404,975) |
| Net increase (decrease) | (2,236) | 13,837 | $(46,081) | $246,892 |
| Service Class 2 | | | | |
| Shares sold | 15,759 | 16,878 | $295,422 | $308,125 |
| Reinvestment of distributions | 7,044 | 29,002 | 126,296 | 509,703 |
| Shares redeemed | (24,023) | (32,013) | (449,976) | (580,303) |
| Net increase (decrease) | (1,220) | 13,867 | $(28,258) | $237,525 |
| Investor Class | | | | |
| Shares sold | 388,057 | 799,928 | $7,371,588 | $14,686,256 |
| Reinvestment of distributions | 216,783 | 843,432 | 3,919,445 | 14,977,021 |
| Shares redeemed | (299,561) | (778,009) | (5,648,727) | (14,234,272) |
| Net increase (decrease) | 305,279 | 865,351 | $5,642,306 | $15,429,005 |
12. Other.
The Fund's organizational documents provide former and current trustees and officers with a limited indemnification against liabilities arising in connection with the performance of their duties to the Fund. In the normal course of business, the Fund may also enter into contracts that provide general indemnifications. The Fund's maximum exposure under these arrangements is unknown as this would be dependent on future claims that may be made against the Fund. The risk of material loss from such claims is considered remote.
At the end of the period, the investment adviser or its affiliates were the owners of record of 86% of the total outstanding shares of the Fund.
Shareholder Expense Example
As a shareholder of the Fund, you incur two types of costs: (1) transaction costs, and (2) ongoing costs, including management fees, distribution and/or service (12b-1) fees and other Fund expenses. This Example is intended to help you understand your ongoing costs (in dollars) of investing in the Fund and to compare these costs with the ongoing costs of investing in other mutual funds.
The Example is based on an investment of $1,000 invested at the beginning of the period and held for the entire period (January 1, 2018 to June 30, 2018).
Actual Expenses
The first line of the accompanying table for each class of the Fund provides information about actual account values and actual expenses. You may use the information in this line, together with the amount you invested, to estimate the expenses that you paid over the period. Simply divide your account value by $1,000.00 (for example, an $8,600 account value divided by $1,000.00 = 8.6), then multiply the result by the number in the first line for a class of the Fund under the heading entitled "Expenses Paid During Period" to estimate the expenses you paid on your account during this period. The estimate of expenses does not include any fees or other expenses of any variable annuity or variable life insurance product. If they were, the estimate of expenses you paid during the period would be higher, and your ending account value would be lower. In addition, the Fund, as a shareholder in the underlying Fidelity Central Funds, will indirectly bear its pro-rata share of the fees and expenses incurred by the underlying Fidelity Central Funds. These fees and expenses are not included in the Fund's annualized expense ratio used to calculate the expense estimate in the table below.
Hypothetical Example for Comparison Purposes
The second line of the accompanying table for each class of the Fund provides information about hypothetical account values and hypothetical expenses based on a Class' actual expense ratio and an assumed rate of return of 5% per year before expenses, which is not the Class' actual return. The hypothetical account values and expenses may not be used to estimate the actual ending account balance or expenses you paid for the period. You may use this information to compare the ongoing costs of investing in the Fund and other funds. To do so, compare this 5% hypothetical example with the 5% hypothetical examples that appear in the shareholder reports of the other funds. The estimate of expenses does not include any fees or other expenses of any variable annuity or variable life insurance product. If they were, the estimate of expenses you paid during the period would be higher, and your ending account value would be lower. In addition, the Fund, as a shareholder in the underlying Fidelity Central Funds, will indirectly bear its pro-rata share of the fees and expenses incurred by the underlying Fidelity Central Funds. These fees and expenses are not included in the Fund's annualized expense ratio used to calculate the expense estimate in the table below.
Please note that the expenses shown in the table are meant to highlight your ongoing costs only and do not reflect any transaction costs. Therefore, the second line of the table is useful in comparing ongoing costs only, and will not help you determine the relative total costs of owning different funds.
| | Annualized Expense Ratio-A | Beginning
Account Value
January 1, 2018 | Ending
Account Value
June 30, 2018 | Expenses Paid
During Period-B
January 1, 2018
to June 30, 2018 |
| Initial Class | .69% | | | |
| Actual | | $1,000.00 | $1,011.50 | $3.44 |
| Hypothetical-C | | $1,000.00 | $1,021.37 | $3.46 |
| Service Class | .79% | | | |
| Actual | | $1,000.00 | $1,011.00 | $3.94 |
| Hypothetical-C | | $1,000.00 | $1,020.88 | $3.96 |
| Service Class 2 | .94% | | | |
| Actual | | $1,000.00 | $1,010.00 | $4.68 |
| Hypothetical-C | | $1,000.00 | $1,020.13 | $4.71 |
| Investor Class | .77% | | | |
| Actual | | $1,000.00 | $1,011.00 | $3.84 |
| Hypothetical-C | | $1,000.00 | $1,020.98 | $3.86 |
A Annualized expense ratio reflects expenses net of applicable fee waivers.
B Expenses are equal to each Class' annualized expense ratio, multiplied by the average account value over the period, multiplied by 181/365 (to reflect the one-half year period). The fees and expenses of the underlying Fidelity Central Funds in which the Fund invests are not included in each Class' annualized expense ratio. In addition to the expenses noted above, the Fund also indirectly bears its proportional share of the expenses of the underlying Fidelity Central Funds. Annualized expenses of the underlying non-money market Fidelity Central Funds as of their most recent fiscal half year ranged from less than .005% to .07%.
C 5% return per year before expenses
VIPAMG-SANN-0818
1.705700.120
Fidelity® Variable Insurance Products: Investment Grade Bond Portfolio
Semi-Annual Report June 30, 2018 |
|
To view a fund's proxy voting guidelines and proxy voting record for the 12-month period ended June 30, visit http://www.fidelity.com/proxyvotingresults or visit the Securities and Exchange Commission's (SEC) web site at http://www.sec.gov.
You may also call 1-877-208-0098 to request a free copy of the proxy voting guidelines.
Fidelity® Variable Insurance Products are separate account options which are purchased through a variable insurance contract.
Standard & Poor's, S&P and S&P 500 are registered service marks of The McGraw-Hill Companies, Inc. and have been licensed for use by Fidelity Distributors Corporation.
Other third-party marks appearing herein are the property of their respective owners.
All other marks appearing herein are registered or unregistered trademarks or service marks of FMR LLC or an affiliated company. © 2018 FMR LLC. All rights reserved.
This report and the financial statements contained herein are submitted for the general information of the shareholders of the Fund. This report is not authorized for distribution to prospective investors in the Fund unless preceded or accompanied by an effective prospectus.
A fund files its complete schedule of portfolio holdings with the SEC for the first and third quarters of each fiscal year on Form N-Q. Forms N-Q are available on the SEC’s web site at http://www.sec.gov. A fund's Forms N-Q may be reviewed and copied at the SEC’s Public Reference Room in Washington, DC. Information regarding the operation of the SEC's Public Reference Room may be obtained by calling 1-800-SEC-0330.
For a complete list of a fund's portfolio holdings, view the most recent holdings listing, semiannual report, or annual report on Fidelity's web site at http://www.fidelity.com, http://www.institutional.fidelity.com, or http://www.401k.com, as applicable.
NOT FDIC INSURED •MAY LOSE VALUE •NO BANK GUARANTEE
Neither the Fund nor Fidelity Distributors Corporation is a bank.
VIP Investment Grade Bond Portfolio
Investment Summary (Unaudited)
Quality Diversification (% of fund's net assets)
| As of June 30, 2018 |
| | U.S. Government and U.S. Government Agency Obligations | 63.9% |
| | AAA | 0.2% |
| | AA | 0.7% |
| | A | 6.2% |
| | BBB | 19.2% |
| | BB and Below | 7.7% |
| | Not Rated | 0.3% |
| | Short-Term Investments and Net Other Assets | 1.8% |

We have used ratings from Moody's Investors Service, Inc. Where Moody's® ratings are not available, we have used S&P® ratings. All ratings are as of the date indicated and do not reflect subsequent changes. Securities rated BB or below were rated investment grade at the time of acquisition. The information in the above tables is based on the combined investments of the Fund and its pro-rata share of investments of Fidelity's fixed-income central funds.
Asset Allocation (% of fund's net assets)
| As of June 30, 2018*,** |
| | Corporate Bonds | 30.4% |
| | U.S. Government and U.S. Government Agency Obligations | 63.9% |
| | Asset-Backed Securities | 0.8% |
| | CMOs and Other Mortgage Related Securities | 0.5% |
| | Municipal Bonds | 1.6% |
| | Other Investments | 1.0% |
| | Short-Term Investments and Net Other Assets (Liabilities) | 1.8% |
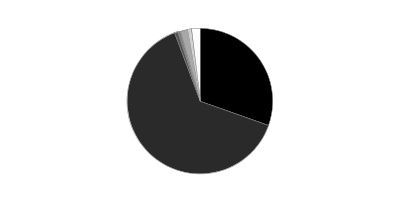
* Foreign investments - 7.1%
** Futures and Swaps - 0.0%
The information in the above table is based on the combined investments of the Fund and its pro rata share of the investments of Fidelity's fixed-income central funds. An unaudited holdings listing for the Fund, which presents direct holdings as well as the pro rata share of any securities and other investments held indirectly through its investment in underlying non-money market Fidelity Central Funds, is available at institutional.fidelity.com. Fidelity VIP Investment Grade Central Fund's holdings and financial statements are included at the end of this report.
Percentages in the above tables are adjusted for the effect of TBA Sale Commitments.
Percentages shown as 0.0% may reflect amounts less than 0.05%.
VIP Investment Grade Bond Portfolio
Schedule of Investments June 30, 2018 (Unaudited)
Showing Percentage of Net Assets
| U.S. Government and Government Agency Obligations - 1.5% | | | |
| | | Principal Amount | Value |
| U.S. Treasury Inflation-Protected Obligations - 0.3% | | | |
| U.S. Treasury Inflation-Indexed Bonds 1% 2/15/46 | | 10,574,000 | 10,898,731 |
| U.S. Treasury Obligations - 1.2% | | | |
| U.S. Treasury Bonds: | | | |
| 2.75% 11/15/47 | | $5,817,000 | $5,544,555 |
| 3% 2/15/47 | | 7,756,000 | 7,776,299 |
| U.S. Treasury Notes: | | | |
| 1.625% 5/31/23 | | 4,186,000 | 3,972,776 |
| 1.625% 5/15/26 | | 35,200,000 | 32,194,250 |
|
| TOTAL U.S. TREASURY OBLIGATIONS | | | 49,487,880 |
|
| TOTAL U.S. GOVERNMENT AND GOVERNMENT AGENCY OBLIGATIONS | | | |
| (Cost $60,480,974) | | | 60,386,611 |
| | | Shares | Value |
|
| Fixed-Income Funds - 98.4% | | | |
| Fidelity Specialized High Income Central Fund (a) | | 1,044,103 | $103,021,596 |
| Fidelity VIP Investment Grade Central Fund (a)(b) | | 37,654,128 | 3,859,924,680 |
| TOTAL FIXED-INCOME FUNDS | | | |
| (Cost $4,024,611,712) | | | 3,962,946,276 |
|
| Money Market Funds - 0.3% | | | |
| Fidelity Cash Central Fund, 1.93% (c) | | | |
| (Cost $11,111,525) | | 11,109,518 | 11,111,739 |
| TOTAL INVESTMENT IN SECURITIES - 100.2% | | | |
| (Cost $4,096,204,211) | | | 4,034,444,626 |
| NET OTHER ASSETS (LIABILITIES) - (0.2)% | | | (9,458,596) |
| NET ASSETS - 100% | | | $4,024,986,030 |
Legend
(a) Affiliated fund that is generally available only to investment companies and other accounts managed by Fidelity Investments. A complete unaudited schedule of portfolio holdings for each Fidelity Central Fund is filed with the SEC for the first and third quarters of each fiscal year on Form N-Q and is available upon request or at the SEC's website at www.sec.gov. An unaudited holdings listing for the Fund, which presents direct holdings as well as the pro-rata share of securities and other investments held indirectly through its investment in underlying non-money market Fidelity Central Funds is available at fidelity.com and/or institutional.fidelity.com, as applicable. In addition, each Fidelity Central Fund's financial statements are available on the SEC's website or upon request.
(b) Affiliated central fund that is available only to investment companies and other accounts managed by Fidelity Investments. Fidelity VIP Investment Grade Central Fund's investments and financial statements are included at the end of this report as an attachment.
(c) Affiliated fund that is generally available only to investment companies and other accounts managed by Fidelity Investments. The rate quoted is the annualized seven-day yield of the fund at period end. A complete unaudited listing of the fund's holdings as of its most recent quarter end is available upon request. In addition, each Fidelity Central Fund's financial statements are available on the SEC's website or upon request.
Affiliated Central Funds
Information regarding fiscal year to date income earned by the Fund from investments in Fidelity Central Funds is as follows:
| Fund | Income earned |
| Fidelity Cash Central Fund | $115,499 |
| Fidelity Specialized High Income Central Fund | 2,663,345 |
| Fidelity VIP Investment Grade Central Fund | 54,134,711 |
| Total | $56,913,555 |
Amounts in the income column in the above table include any capital gain distributions from underlying funds, which are presented in the corresponding line-item in the Statement of Operations if applicable.
Fiscal year to date information regarding the Fund’s investments in non-Money Market Central Funds, including the ownership percentage, is presented below.
| Fund | Value, beginning of period | Purchases | Sales Proceeds | Realized Gain/Loss | Change in Unrealized appreciation (depreciation) | Value, end of period | % ownership, end of period |
| Fidelity Specialized High Income Central Fund | $104,165,619 | $2,663,408 | $-- | $-- | $(3,807,431) | $103,021,596 | 14.7% |
| Fidelity VIP Investment Grade Central Fund | 4,009,235,812 | 81,123,036 | 125,000,000 | (3,760,868) | (101,673,300) | 3,859,924,680 | 70.2% |
| Total | $4,113,401,431 | $83,786,444 | $125,000,000 | $(3,760,868) | $(105,480,731) | $3,962,946,276 | |
Investment Valuation
The following is a summary of the inputs used, as of June 30, 2018, involving the Fund's assets and liabilities carried at fair value. The inputs or methodology used for valuing securities may not be an indication of the risk associated with investing in those securities. For more information on valuation inputs, and their aggregation into the levels used below, please refer to the Investment Valuation section in the accompanying Notes to Financial Statements.
| | Valuation Inputs at Reporting Date: |
| Description | Total | Level 1 | Level 2 | Level 3 |
| Investments in Securities: | | | | |
| U.S. Government and Government Agency Obligations | $60,386,611 | $-- | $60,386,611 | $-- |
| Fixed-Income Funds | 3,962,946,276 | 3,962,946,276 | -- | -- |
| Money Market Funds | 11,111,739 | 11,111,739 | -- | -- |
| Total Investments in Securities: | $4,034,444,626 | $3,974,058,015 | $60,386,611 | $-- |
See accompanying notes which are an integral part of the financial statements.
VIP Investment Grade Bond Portfolio
Financial Statements
Statement of Assets and Liabilities
| | | June 30, 2018 (Unaudited) |
| Assets | | |
Investment in securities, at value — See accompanying schedule:
Unaffiliated issuers (cost $60,480,974) | $60,386,611 | |
| Fidelity Central Funds (cost $4,035,723,237) | 3,974,058,015 | |
| Total Investment in Securities (cost $4,096,204,211) | | $4,034,444,626 |
| Receivable for investments sold | | 65,000,000 |
| Receivable for fund shares sold | | 637,735 |
| Interest receivable | | 226,388 |
| Distributions receivable from Fidelity Central Funds | | 29,755 |
| Total assets | | 4,100,338,504 |
| Liabilities | | |
| Payable for fund shares redeemed | $73,563,655 | |
| Accrued management fee | 1,043,871 | |
| Distribution and service plan fees payable | 365,182 | |
| Other affiliated payables | 354,378 | |
| Other payables and accrued expenses | 25,388 | |
| Total liabilities | | 75,352,474 |
| Net Assets | | $4,024,986,030 |
| Net Assets consist of: | | |
| Paid in capital | | $4,048,818,059 |
| Undistributed net investment income | | 47,169,680 |
| Accumulated undistributed net realized gain (loss) on investments | | (9,242,124) |
| Net unrealized appreciation (depreciation) on investments | | (61,759,585) |
| Net Assets | | $4,024,986,030 |
| Initial Class: | | |
| Net Asset Value, offering price and redemption price per share ($980,038,320 ÷ 78,491,096 shares) | | $12.49 |
| Service Class: | | |
| Net Asset Value, offering price and redemption price per share ($579,766,783 ÷ 46,972,558 shares) | | $12.34 |
| Service Class 2: | | |
| Net Asset Value, offering price and redemption price per share ($1,519,641,358 ÷ 124,891,128 shares) | | $12.17 |
| Investor Class: | | |
| Net Asset Value, offering price and redemption price per share ($945,539,569 ÷ 76,033,784 shares) | | $12.44 |
See accompanying notes which are an integral part of the financial statements.
Statement of Operations
| | | Six months ended June 30, 2018 (Unaudited) |
| Investment Income | | |
| Interest | | $994,491 |
| Income from Fidelity Central Funds | | 56,913,555 |
| Total income | | 57,908,046 |
| Expenses | | |
| Management fee | $6,327,132 | |
| Transfer agent fees | 1,577,845 | |
| Distribution and service plan fees | 2,193,954 | |
| Accounting fees and expenses | 568,373 | |
| Custodian fees and expenses | 7,076 | |
| Independent trustees' fees and expenses | 8,948 | |
| Registration fees | 11,777 | |
| Audit | 25,016 | |
| Legal | 1,554 | |
| Miscellaneous | 16,511 | |
| Total expenses before reductions | 10,738,186 | |
| Expense reductions | (12,789) | |
| Total expenses after reductions | | 10,725,397 |
| Net investment income (loss) | | 47,182,649 |
| Realized and Unrealized Gain (Loss) | | |
| Net realized gain (loss) on: | | |
| Investment securities: | | |
| Unaffiliated issuers | (464,734) | |
| Fidelity Central Funds | (3,760,868) | |
| Total net realized gain (loss) | | (4,225,602) |
| Change in net unrealized appreciation (depreciation) on: | | |
| Investment securities: | | |
| Unaffiliated issuers | (1,672,125) | |
| Fidelity Central Funds | (105,480,731) | |
| Total change in net unrealized appreciation (depreciation) | | (107,152,856) |
| Net gain (loss) | | (111,378,458) |
| Net increase (decrease) in net assets resulting from operations | | $(64,195,809) |
See accompanying notes which are an integral part of the financial statements.
Statement of Changes in Net Assets
| | Six months ended June 30, 2018 (Unaudited) | Year ended December 31, 2017 |
| Increase (Decrease) in Net Assets | | |
| Operations | | |
| Net investment income (loss) | $47,182,649 | $97,964,278 |
| Net realized gain (loss) | (4,225,602) | 21,605,619 |
| Change in net unrealized appreciation (depreciation) | (107,152,856) | 40,386,984 |
| Net increase (decrease) in net assets resulting from operations | (64,195,809) | 159,956,881 |
| Distributions to shareholders from net investment income | (15,645,872) | (96,951,660) |
| Distributions to shareholders from net realized gain | (25,839,179) | (17,412,901) |
| Total distributions | (41,485,051) | (114,364,561) |
| Share transactions - net increase (decrease) | (71,582,618) | 364,622,194 |
| Total increase (decrease) in net assets | (177,263,478) | 410,214,514 |
| Net Assets | | |
| Beginning of period | 4,202,249,508 | 3,792,034,994 |
| End of period | $4,024,986,030 | $4,202,249,508 |
| Other Information | | |
| Undistributed net investment income end of period | $47,169,680 | $15,632,903 |
See accompanying notes which are an integral part of the financial statements.
VIP Investment Grade Bond Portfolio Initial Class
| | Six months ended (Unaudited) June 30, | Years endedDecember 31, | | | | |
| | 2018 | 2017 | 2016 | 2015 | 2014 | 2013 |
| Selected Per–Share Data | | | | | | |
| Net asset value, beginning of period | $12.80 | $12.64 | $12.37 | $12.79 | $12.36 | $13.06 |
| Income from Investment Operations | | | | | | |
| Net investment income (loss)A | .150 | .325 | .344 | .345 | .327 | .295 |
| Net realized and unrealized gain (loss) | (.334) | .204 | .240 | (.419) | .392 | (.526) |
| Total from investment operations | (.184) | .529 | .584 | (.074) | .719 | (.231) |
| Distributions from net investment income | (.049) | (.312) | (.308) | (.336) | (.284) | (.310) |
| Distributions from net realized gain | (.077) | (.057) | (.006) | (.010) | (.005) | (.159) |
| Total distributions | (.126) | (.369) | (.314) | (.346) | (.289) | (.469) |
| Net asset value, end of period | $12.49 | $12.80 | $12.64 | $12.37 | $12.79 | $12.36 |
| Total ReturnB,C,D | (1.43)% | 4.22% | 4.74% | (.60)% | 5.83% | (1.78)% |
| Ratios to Average Net AssetsE,F | | | | | | |
| Expenses before reductions | .41%G | .41% | .41% | .42% | .42% | .42% |
| Expenses net of fee waivers, if any | .41%G | .41% | .41% | .42% | .42% | .42% |
| Expenses net of all reductions | .41%G | .41% | .41% | .42% | .42% | .42% |
| Net investment income (loss) | 2.41%G | 2.53% | 2.67% | 2.69% | 2.56% | 2.29% |
| Supplemental Data | | | | | | |
| Net assets, end of period (000 omitted) | $980,038 | $1,069,371 | $1,023,875 | $1,052,893 | $1,081,564 | $981,378 |
| Portfolio turnover rateH | 9%G | 6% | 11% | 9% | 7% | 4% |
A Calculated based on average shares outstanding during the period.
B Total returns for periods of less than one year are not annualized.
C Total returns do not reflect charges attributable to your insurance company's separate account. Inclusion of these charges would reduce the total returns shown.
D Total returns would have been lower if certain expenses had not been reduced during the applicable periods shown.
E Fees and expenses of any underlying Fidelity Central Funds are not included in the Fund's expense ratio. The Fund indirectly bears its proportionate share of the expenses of any underlying Fidelity Central Funds. Based on their most recent shareholder report date, the expenses of any underlying non-money market Fidelity Central Funds were less than 0.005%.
F Expense ratios reflect operating expenses of the class. Expenses before reductions do not reflect amounts reimbursed by the investment adviser or reductions from expense offset arrangements and do not represent the amount paid by the class during periods when reimbursements or reductions occur. Expenses net of fee waivers reflect expenses after reimbursement by the investment adviser but prior to reductions from expense offset arrangements. Expenses net of all reductions represent the net expenses paid by the class.
G Annualized
H Amount does not include the portfolio activity of any underlying Fidelity Central Funds.
See accompanying notes which are an integral part of the financial statements.
VIP Investment Grade Bond Portfolio Service Class
| | Six months ended (Unaudited) June 30, | Years endedDecember 31, | | | | |
| | 2018 | 2017 | 2016 | 2015 | 2014 | 2013 |
| Selected Per–Share Data | | | | | | |
| Net asset value, beginning of period | $12.66 | $12.50 | $12.24 | $12.66 | $12.24 | $12.94 |
| Income from Investment Operations | | | | | | |
| Net investment income (loss)A | .142 | .309 | .328 | .329 | .312 | .280 |
| Net realized and unrealized gain (loss) | (.338) | .207 | .236 | (.416) | .391 | (.523) |
| Total from investment operations | (.196) | .516 | .564 | (.087) | .703 | (.243) |
| Distributions from net investment income | (.047) | (.299) | (.298) | (.323) | (.278) | (.298) |
| Distributions from net realized gain | (.077) | (.057) | (.006) | (.010) | (.005) | (.159) |
| Total distributions | (.124) | (.356) | (.304) | (.333) | (.283) | (.457) |
| Net asset value, end of period | $12.34 | $12.66 | $12.50 | $12.24 | $12.66 | $12.24 |
| Total ReturnB,C,D | (1.54)% | 4.16% | 4.63% | (.71)% | 5.75% | (1.89)% |
| Ratios to Average Net AssetsE,F | | | | | | |
| Expenses before reductions | .51%G | .51% | .51% | .52% | .52% | .52% |
| Expenses net of fee waivers, if any | .51%G | .51% | .51% | .52% | .52% | .52% |
| Expenses net of all reductions | .51%G | .51% | .51% | .52% | .52% | .52% |
| Net investment income (loss) | 2.31%G | 2.43% | 2.57% | 2.60% | 2.46% | 2.19% |
| Supplemental Data | | | | | | |
| Net assets, end of period (000 omitted) | $579,767 | $587,652 | $541,803 | $520,000 | $432,656 | $265,505 |
| Portfolio turnover rateH | 9%G | 6% | 11% | 9% | 7% | 4% |
A Calculated based on average shares outstanding during the period.
B Total returns for periods of less than one year are not annualized.
C Total returns do not reflect charges attributable to your insurance company's separate account. Inclusion of these charges would reduce the total returns shown.
D Total returns would have been lower if certain expenses had not been reduced during the applicable periods shown.
E Fees and expenses of any underlying Fidelity Central Funds are not included in the Fund's expense ratio. The Fund indirectly bears its proportionate share of the expenses of any underlying Fidelity Central Funds. Based on their most recent shareholder report date, the expenses of any underlying non-money market Fidelity Central Funds were less than 0.005%.
F Expense ratios reflect operating expenses of the class. Expenses before reductions do not reflect amounts reimbursed by the investment adviser or reductions from expense offset arrangements and do not represent the amount paid by the class during periods when reimbursements or reductions occur. Expenses net of fee waivers reflect expenses after reimbursement by the investment adviser but prior to reductions from expense offset arrangements. Expenses net of all reductions represent the net expenses paid by the class.
G Annualized
H Amount does not include the portfolio activity of any underlying Fidelity Central Funds.
See accompanying notes which are an integral part of the financial statements.
VIP Investment Grade Bond Portfolio Service Class 2
| | Six months ended (Unaudited) June 30, | Years endedDecember 31, | | | | |
| | 2018 | 2017 | 2016 | 2015 | 2014 | 2013 |
| Selected Per–Share Data | | | | | | |
| Net asset value, beginning of period | $12.49 | $12.34 | $12.09 | $12.51 | $12.10 | $12.79 |
| Income from Investment Operations | | | | | | |
| Net investment income (loss)A | .131 | .286 | .304 | .306 | .289 | .257 |
| Net realized and unrealized gain (loss) | (.330) | .203 | .235 | (.410) | .379 | (.510) |
| Total from investment operations | (.199) | .489 | .539 | (.104) | .668 | (.253) |
| Distributions from net investment income | (.044) | (.282) | (.283) | (.306) | (.253) | (.278) |
| Distributions from net realized gain | (.077) | (.057) | (.006) | (.010) | (.005) | (.159) |
| Total distributions | (.121) | (.339) | (.289) | (.316) | (.258) | (.437) |
| Net asset value, end of period | $12.17 | $12.49 | $12.34 | $12.09 | $12.51 | $12.10 |
| Total ReturnB,C,D | (1.59)% | 3.99% | 4.48% | (.85)% | 5.53% | (1.99)% |
| Ratios to Average Net AssetsE,F | | | | | | |
| Expenses before reductions | .66%G | .66% | .66% | .67% | .67% | .67% |
| Expenses net of fee waivers, if any | .66%G | .66% | .66% | .67% | .67% | .67% |
| Expenses net of all reductions | .66%G | .66% | .66% | .67% | .67% | .67% |
| Net investment income (loss) | 2.16%G | 2.28% | 2.42% | 2.45% | 2.31% | 2.04% |
| Supplemental Data | | | | | | |
| Net assets, end of period (000 omitted) | $1,519,641 | $1,514,502 | $1,310,808 | $1,186,855 | $1,082,467 | $1,115,493 |
| Portfolio turnover rateH | 9%G | 6% | 11% | 9% | 7% | 4% |
A Calculated based on average shares outstanding during the period.
B Total returns for periods of less than one year are not annualized.
C Total returns do not reflect charges attributable to your insurance company's separate account. Inclusion of these charges would reduce the total returns shown.
D Total returns would have been lower if certain expenses had not been reduced during the applicable periods shown.
E Fees and expenses of any underlying Fidelity Central Funds are not included in the Fund's expense ratio. The Fund indirectly bears its proportionate share of the expenses of any underlying Fidelity Central Funds. Based on their most recent shareholder report date, the expenses of any underlying non-money market Fidelity Central Funds were less than 0.005%.
F Expense ratios reflect operating expenses of the class. Expenses before reductions do not reflect amounts reimbursed by the investment adviser or reductions from expense offset arrangements and do not represent the amount paid by the class during periods when reimbursements or reductions occur. Expenses net of fee waivers reflect expenses after reimbursement by the investment adviser but prior to reductions from expense offset arrangements. Expenses net of all reductions represent the net expenses paid by the class.
G Annualized
H Amount does not include the portfolio activity of any underlying Fidelity Central Funds.
See accompanying notes which are an integral part of the financial statements.
VIP Investment Grade Bond Portfolio Investor Class
| | Six months ended (Unaudited) June 30, | Years endedDecember 31, | | | | |
| | 2018 | 2017 | 2016 | 2015 | 2014 | 2013 |
| Selected Per–Share Data | | | | | | |
| Net asset value, beginning of period | $12.75 | $12.59 | $12.32 | $12.75 | $12.32 | $13.02 |
| Income from Investment Operations | | | | | | |
| Net investment income (loss)A | .147 | .319 | .338 | .340 | .322 | .290 |
| Net realized and unrealized gain (loss) | (.332) | .206 | .243 | (.428) | .395 | (.526) |
| Total from investment operations | (.185) | .525 | .581 | (.088) | .717 | (.236) |
| Distributions from net investment income | (.048) | (.308) | (.305) | (.332) | (.282) | (.305) |
| Distributions from net realized gain | (.077) | (.057) | (.006) | (.010) | (.005) | (.159) |
| Total distributions | (.125) | (.365) | (.311) | (.342) | (.287) | (.464) |
| Net asset value, end of period | $12.44 | $12.75 | $12.59 | $12.32 | $12.75 | $12.32 |
| Total ReturnB,C,D | (1.45)% | 4.20% | 4.74% | (.71)% | 5.83% | (1.82)% |
| Ratios to Average Net AssetsE,F | | | | | | |
| Expenses before reductions | .44%G | .44% | .45% | .45% | .45% | .45% |
| Expenses net of fee waivers, if any | .44%G | .44% | .45% | .45% | .45% | .45% |
| Expenses net of all reductions | .44%G | .44% | .45% | .45% | .45% | .45% |
| Net investment income (loss) | 2.38%G | 2.49% | 2.63% | 2.66% | 2.53% | 2.26% |
| Supplemental Data | | | | | | |
| Net assets, end of period (000 omitted) | $945,540 | $1,030,725 | $915,550 | $792,855 | $759,351 | $582,454 |
| Portfolio turnover rateH | 9%G | 6% | 11% | 9% | 7% | 4% |
A Calculated based on average shares outstanding during the period.
B Total returns for periods of less than one year are not annualized.
C Total returns do not reflect charges attributable to your insurance company's separate account. Inclusion of these charges would reduce the total returns shown.
D Total returns would have been lower if certain expenses had not been reduced during the applicable periods shown.
E Fees and expenses of any underlying Fidelity Central Funds are not included in the Fund's expense ratio. The Fund indirectly bears its proportionate share of the expenses of any underlying Fidelity Central Funds. Based on their most recent shareholder report date, the expenses of any underlying non-money market Fidelity Central Funds were less than 0.005%.
F Expense ratios reflect operating expenses of the class. Expenses before reductions do not reflect amounts reimbursed by the investment adviser or reductions from expense offset arrangements and do not represent the amount paid by the class during periods when reimbursements or reductions occur. Expenses net of fee waivers reflect expenses after reimbursement by the investment adviser but prior to reductions from expense offset arrangements. Expenses net of all reductions represent the net expenses paid by the class.
G Annualized
H Amount does not include the portfolio activity of any underlying Fidelity Central Funds.
See accompanying notes which are an integral part of the financial statements.
Notes to Financial Statements (Unaudited)
For the period ended June 30, 2018
1. Organization.
VIP Investment Grade Bond Portfolio (the Fund) is a fund of Variable Insurance Products Fund V (the Trust) and is authorized to issue an unlimited number of shares. The Trust is registered under the Investment Company Act of 1940, as amended (the 1940 Act), as an open-end management investment company organized as a Massachusetts business trust. Shares of the Fund may only be purchased by insurance companies for the purpose of funding variable annuity or variable life insurance contracts. The Fund offers the following classes of shares: Initial Class shares, Service Class shares, Service Class 2 shares and Investor Class shares. All classes have equal rights and voting privileges, except for matters affecting a single class.
2. Investments in Fidelity Central Funds.
The Fund invests in Fidelity Central Funds, which are open-end investment companies generally available only to other investment companies and accounts managed by the investment adviser and its affiliates. The Fund's Schedule of Investments lists each of the Fidelity Central Funds held as of period end, if any, as an investment of the Fund, but does not include the underlying holdings of each Fidelity Central Fund. As an Investing Fund, the Fund indirectly bears its proportionate share of the expenses of the underlying Fidelity Central Funds.
Based on its investment objective, each Fidelity Central Fund may invest or participate in various investment vehicles or strategies that are similar to those of the Fund. These strategies are consistent with the investment objectives of the Fund and may involve certain economic risks which may cause a decline in value of each of the Fidelity Central Funds and thus a decline in the value of the Fund. The Money Market Central Funds seek preservation of capital and current income and are managed by Fidelity Investments Money Management, Inc. (FIMM), an affiliate of the investment adviser. Annualized expenses of the Money Market Central Funds as of their most recent shareholder report date are less than .005%. The following summarizes the Fund's investment in each non-money market Fidelity Central Fund.
| Fidelity Central Fund | Investment Manager | Investment Objective | Investment Practices | Expense Ratio(a) |
| Fidelity Specialized High Income Central Fund | FMR Co., Inc. (FMRC) | Seeks a high level of current income by normally investing in income-producing debt securities, with an emphasis on lower-quality debt securities. | Loans & Direct Debt Instruments
Restricted Securities | Less than 0.005% |
| Fidelity VIP Investment Grade Central Fund | FIMM | Seeks a high level of current income by normally investing in investment-grade debt securities and repurchase agreements. | Delayed Delivery & When Issued Securities
Repurchase Agreements
Restricted Securities
Swaps | Less than 0.005% |
(a) Expenses expressed as a percentage of average net assets and are as of each underlying Central Fund's most recent annual or semi-annual shareholder report.
An unaudited holdings listing for the Fund, which presents direct holdings as well as the pro-rata share of any securities and other investments held indirectly through its investment in underlying non-money market Fidelity Central Funds, is available at institutional.fidelity.com. A complete unaudited list of holdings for each Fidelity Central Fund is available upon request or at the Securities and Exchange Commission (the SEC) website at www.sec.gov. In addition, the financial statements of the Fidelity Central Funds which contain the significant accounting policies (including investment valuation policies) of those funds are available on the SEC website or upon request.
3. Significant Accounting Policies.
The Fund is an investment company and applies the accounting and reporting guidance of the Financial Accounting Standards Board (FASB) Accounting Standards Codification Topic 946 Financial Services – Investments Companies. The financial statements have been prepared in conformity with accounting principles generally accepted in the United States of America (GAAP), which require management to make certain estimates and assumptions at the date of the financial statements. Actual results could differ from those estimates. Subsequent events, if any, through the date that the financial statements were issued have been evaluated in the preparation of the financial statements. The following summarizes the significant accounting policies of the Fund:
Investment Valuation. Investments are valued as of 4:00 p.m. Eastern time on the last calendar day of the period. The Board of Trustees (the Board) has delegated the day to day responsibility for the valuation of the Fund's investments to the Fair Value Committee (the Committee) established by the Fund's investment adviser. In accordance with valuation policies and procedures approved by the Board, the Fund attempts to obtain prices from one or more third party pricing vendors or brokers to value its investments. When current market prices, quotations or currency exchange rates are not readily available or reliable, investments will be fair valued in good faith by the Committee, in accordance with procedures adopted by the Board. Factors used in determining fair value vary by investment type and may include market or investment specific events, changes in interest rates and credit quality. The frequency with which these procedures are used cannot be predicted and they may be utilized to a significant extent. The Committee oversees the Fund's valuation policies and procedures and reports to the Board on the Committee's activities and fair value determinations. The Board monitors the appropriateness of the procedures used in valuing the Fund's investments and ratifies the fair value determinations of the Committee.
The Fund categorizes the inputs to valuation techniques used to value its investments into a disclosure hierarchy consisting of three levels as shown below:
- Level 1 – quoted prices in active markets for identical investments
- Level 2 – other significant observable inputs (including quoted prices for similar investments, interest rates, prepayment speeds, etc.)
- Level 3 – unobservable inputs (including the Fund's own assumptions based on the best information available)
Valuation techniques used to value the Fund's investments by major category are as follows:
Debt securities, including restricted securities, are valued based on evaluated prices received from third party pricing vendors or from brokers who make markets in such securities. U.S. government and government agency obligations are valued by pricing vendors who utilize matrix pricing which considers yield or price of bonds of comparable quality, coupon, maturity and type or by broker-supplied prices. When independent prices are unavailable or unreliable, debt securities may be valued utilizing pricing methodologies which consider similar factors that would be used by third party pricing vendors. Debt securities are generally categorized as Level 2 in the hierarchy but may be Level 3 depending on the circumstances.
Investments in open-end mutual funds, including the Fidelity Central Funds, are valued at their closing net asset value (NAV) each business day and are categorized as Level 1 in the hierarchy.
Changes in valuation techniques may result in transfers in or out of an assigned level within the disclosure hierarchy. The aggregate value of investments by input level as of June 30, 2018 is included at the end of the Fund's Schedule of Investments.
Investment Transactions and Income. For financial reporting purposes, the Fund's investment holdings and NAV include trades executed through the end of the last business day of the period. The NAV per share for processing shareholder transactions is calculated as of the close of business of the New York Stock Exchange (NYSE), normally 4:00 p.m. Eastern time and includes trades executed through the end of the prior business day. Gains and losses on securities sold are determined on the basis of identified cost. Income and capital gain distributions from Fidelity Central Funds, if any, are recorded on the ex-dividend date. Interest income is accrued as earned and includes coupon interest and amortization of premium and accretion of discount on debt securities as applicable. The principal amount on inflation-indexed securities is periodically adjusted to the rate of inflation and interest is accrued based on the principal amount. The adjustments to principal due to inflation are reflected as increases or decreases to Interest in the accompanying Statement of Operations. Debt obligations may be placed on non-accrual status and related interest income may be reduced by ceasing current accruals and writing off interest receivables when the collection of all or a portion of interest has become doubtful based on consistently applied procedures. A debt obligation is removed from non-accrual status when the issuer resumes interest payments or when collectability of interest is reasonably assured.
Class Allocations and Expenses. Investment income, realized and unrealized capital gains and losses, common expenses of the Fund, and certain fund-level expense reductions, if any, are allocated daily on a pro-rata basis to each class based on the relative net assets of each class to the total net assets of the Fund. Each class differs with respect to transfer agent and distribution and service plan fees incurred. Certain expense reductions may also differ by class. For the reporting period, the allocated portion of income and expenses to each class as a percent of its average net assets may vary due to the timing of recording these transactions in relation to fluctuating net assets of the classes. Expenses directly attributable to a fund are charged to that fund. Expenses attributable to more than one fund are allocated among the respective funds on the basis of relative net assets or other appropriate methods. Expense estimates are accrued in the period to which they relate and adjustments are made when actual amounts are known.
Income Tax Information and Distributions to Shareholders. Each year, the Fund intends to qualify as a regulated investment company under Subchapter M of the Internal Revenue Code, including distributing substantially all of its taxable income and realized gains. As a result, no provision for U.S. Federal income taxes is required. The Fund files a U.S. federal tax return, in addition to state and local tax returns as required. The Fund's federal income tax returns are subject to examination by the Internal Revenue Service (IRS) for a period of three fiscal years after they are filed. State and local tax returns may be subject to examination for an additional fiscal year depending on the jurisdiction.
Distributions are declared and recorded on the ex-dividend date. Income and capital gain distributions are declared separately for each class. Income and capital gain distributions are determined in accordance with income tax regulations, which may differ from GAAP.
Capital accounts within the financial statements are adjusted for permanent book-tax differences. These adjustments have no impact on net assets or the results of operations. Capital accounts are not adjusted for temporary book-tax differences which will reverse in a subsequent period.
Book-tax differences are primarily due to the short-term gain distributions from the Underlying Funds, market discount, deferred trustees compensation, and losses deferred due to wash sales.
As of period end, the cost and unrealized appreciation (depreciation) in securities, and derivatives if applicable, for federal income tax purposes were as follows:
| Gross unrealized appreciation | $49,591,478 |
| Gross unrealized depreciation | (58,725,313) |
| Net unrealized appreciation (depreciation) | $(9,133,835) |
| Tax cost | $4,043,578,461 |
New Accounting Pronouncement. In March 2017, the Financial Accounting Standards Board (FASB) issued an Accounting Standards Update (ASU), ASU 2017-08, which amends the amortization period for certain callable debt securities that are held at a premium. The amendment requires the premium to be amortized to the earliest call date. The amendments do not require an accounting change for securities held at a discount. The ASU is effective for annual periods beginning after December 15, 2018. Management is currently evaluating the potential impact of these changes to the financial statements.
4. Purchases and Sales of Investments.
Purchases and sales of securities (including the Fixed-Income Central Funds), other than short-term securities and U.S. government securities, aggregated $83,786,444 and $128,285,784, respectively.
5. Fees and Other Transactions with Affiliates.
Management Fee. Fidelity Management & Research Company (the investment adviser) and its affiliates provide the Fund with investment management related services for which the Fund pays a monthly management fee. The management fee is the sum of an individual fund fee rate that is based on an annual rate of .20% of the Fund's average net assets and an annualized group fee rate that averaged .11% during the period. The group fee rate is based upon the average net assets of all the mutual funds advised by the investment adviser, including any mutual funds previously advised by the investment adviser that are currently advised by Fidelity SelectCo, LLC, an affiliate of the investment adviser. The group fee rate decreases as assets under management increase and increases as assets under management decrease. For the reporting period, the total annualized management fee rate was .31% of the Fund's average net assets.
Distribution and Service Plan Fees. In accordance with Rule 12b-1 of the 1940 Act, the Fund has adopted separate 12b-1 Plans for each Service Class of shares. Each Service Class pays Fidelity Distributors Corporation (FDC), an affiliate of the investment adviser, a service fee. For the period, the service fee is based on an annual rate of .10% of Service Class' average net assets and .25% of Service Class 2's average net assets.
For the period, total fees, all of which were re-allowed to insurance companies for the distribution of shares and providing shareholder support services, were as follows:
| Service Class | $287,997 |
| Service Class 2 | 1,905,957 |
| | $2,193,954 |
Transfer Agent Fees. Fidelity Investments Institutional Operations Company, Inc. (FIIOC), an affiliate of the investment adviser, is the Fund's transfer, dividend disbursing, and shareholder servicing agent. FIIOC receives an asset-based fee with respect to each class. Each class pays a fee for transfer agent services, typesetting and printing and mailing of shareholder reports, excluding mailing of proxy statements, equal to an annual rate of class-level average net assets. The annual rate for Investor Class is .10% and the annual rate for all other classes is .07%. For the period, transfer agent fees for each class were as follows:
| Initial Class | $352,989 |
| Service Class | 195,838 |
| Service Class 2 | 518,420 |
| Investor Class | 510,598 |
| | $1,577,845 |
Accounting Fees. Fidelity Service Company, Inc. (FSC), an affiliate of the investment adviser, maintains the Fund's accounting records. The fee is based on the level of average net assets for each month. For the period, the fees were equivalent to an annualized rate of .03%.
Interfund Trades. The Fund may purchase from or sell securities to other Fidelity Funds under procedures adopted by the Board. The procedures have been designed to ensure these interfund trades are executed in accordance with Rule 17a-7 of the 1940 Act. Interfund trades are included within the respective purchases and sales amounts shown in the Purchases and Sales of Investments note.
6. Committed Line of Credit.
The Fund participates with other funds managed by the investment adviser or an affiliate in a $4.25 billion credit facility (the "line of credit") to be utilized for temporary or emergency purposes to fund shareholder redemptions or for other short-term liquidity purposes. The Fund has agreed to pay commitment fees on its pro-rata portion of the line of credit, which amounted to $5,979 and is reflected in Miscellaneous expenses on the Statement of Operations. During the period, the Fund did not borrow on this line of credit
7. Expense Reductions.
Through arrangements with the Fund's custodian, credits realized as a result of certain uninvested cash balances were used to reduce the Fund's expenses. During the period, these credits reduced the Fund's custody expenses by $154.
In addition, during the period the investment adviser reimbursed and/or waived a portion of fund-level operating expenses in the amount of $12,635.
8. Distributions to Shareholders.
Distributions to shareholders of each class were as follows:
| | Six months ended
June 30, 2018 | Year ended
December 31, 2017 |
| From net investment income | | |
| Initial Class | $4,085,438 | $26,114,745 |
| Service Class | 2,154,326 | 13,527,204 |
| Service Class 2 | 5,491,278 | 33,028,704 |
| Investor Class | 3,914,830 | 24,281,007 |
| Total | $15,645,872 | $96,951,660 |
| From net realized gain | | |
| Initial Class | $6,419,974 | $4,578,531 |
| Service Class | 3,529,428 | 2,473,896 |
| Service Class 2 | 9,609,737 | 6,260,351 |
| Investor Class | 6,280,040 | 4,100,123 |
| Total | $25,839,179 | $17,412,901 |
9. Share Transactions.
Transactions for each class of shares were as follows:
| | Shares | Shares | Dollars | Dollars |
| | Six months ended June 30, 2018 | Year ended December 31, 2017 | Six months ended June 30, 2018 | Year ended December 31, 2017 |
| Initial Class | | | | |
| Shares sold | 6,497,280 | 15,591,595 | $81,610,086 | $200,373,757 |
| Reinvestment of distributions | 845,846 | 2,409,044 | 10,505,412 | 30,693,276 |
| Shares redeemed | (12,402,220) | (15,446,704) | (155,238,729) | (198,086,545) |
| Net increase (decrease) | (5,059,094) | 2,553,935 | $(63,123,231) | $32,980,488 |
| Service Class | | | | |
| Shares sold | 4,850,608 | 10,351,533 | $59,920,423 | $131,529,873 |
| Reinvestment of distributions | 462,846 | 1,269,621 | 5,683,754 | 16,001,100 |
| Shares redeemed | (4,769,343) | (8,521,274) | (59,156,382) | (108,510,224) |
| Net increase (decrease) | 544,111 | 3,099,880 | $6,447,795 | $39,020,749 |
| Service Class 2 | | | | |
| Shares sold | 8,684,080 | 22,778,348 | $106,749,649 | $284,830,875 |
| Reinvestment of distributions | 1,245,958 | 3,160,058 | 15,101,015 | 39,289,055 |
| Shares redeemed | (6,333,339) | (10,848,664) | (77,203,889) | (136,111,587) |
| Net increase (decrease) | 3,596,699 | 15,089,742 | $44,646,775 | $188,008,343 |
| Investor Class | | | | |
| Shares sold | 3,850,911 | 12,974,918 | $48,233,442 | $166,356,597 |
| Reinvestment of distributions | 824,161 | 2,236,066 | 10,194,870 | 28,381,130 |
| Shares redeemed | (9,490,568) | (7,064,535) | (117,982,269) | (90,125,113) |
| Net increase (decrease) | (4,815,496) | 8,146,449 | $(59,553,957) | $104,612,614 |
10. Other.
The Fund's organizational documents provide former and current trustees and officers with a limited indemnification against liabilities arising in connection with the performance of their duties to the Fund. In the normal course of business, the Fund may also enter into contracts that provide general indemnifications. The Fund's maximum exposure under these arrangements is unknown as this would be dependent on future claims that may be made against the Fund. The risk of material loss from such claims is considered remote.
At the end of the period, the investment adviser or its affiliates were the owners of record of 21% of the total outstanding shares of the Fund and one otherwise unaffiliated shareholder was the owner of record of 25% of the total outstanding shares of the Fund.
VIP Investment Grade Bond Portfolio
Shareholder Expense Example
As a shareholder of the Fund, you incur two types of costs: (1) transaction costs and (2) ongoing costs, including management fees, distribution and/or service (12b-1) fees and other Fund expenses. This Example is intended to help you understand your ongoing costs (in dollars) of investing in the Fund and to compare these costs with the ongoing costs of investing in other mutual funds.
The Example is based on an investment of $1,000 invested at the beginning of the period and held for the entire period (January 1, 2018 to June 30, 2018).
Actual Expenses
The first line of the accompanying table for each class of the Fund provides information about actual account values and actual expenses. You may use the information in this line, together with the amount you invested, to estimate the expenses that you paid over the period. Simply divide your account value by $1,000.00 (for example, an $8,600 account value divided by $1,000.00 = 8.6), then multiply the result by the number in the first line for a class of the Fund under the heading entitled "Expenses Paid During Period" to estimate the expenses you paid on your account during this period. The estimate of expenses does not include any fees or other expenses of any variable annuity or variable life insurance product. If they were, the estimate of expenses you paid during the period would be higher, and your ending account value would be lower. In addition, the Fund, as a shareholder in the underlying Fidelity Central Funds, will indirectly bear its pro-rata share of the fees and expenses incurred by the underlying Fidelity Central Funds. These fees and expenses are not included in the Fund's annualized expense ratio used to calculate the expense estimate in the table below.
Hypothetical Example for Comparison Purposes
The second line of the accompanying table for each class of the Fund provides information about hypothetical account values and hypothetical expenses based on a Class' actual expense ratio and an assumed rate of return of 5% per year before expenses, which is not the Class' actual return. The hypothetical account values and expenses may not be used to estimate the actual ending account balance or expenses you paid for the period. You may use this information to compare the ongoing costs of investing in the Fund and other funds. To do so, compare this 5% hypothetical example with the 5% hypothetical examples that appear in the shareholder reports of the other funds. The estimate of expenses does not include any fees or other expenses of any variable annuity or variable life insurance product. If they were, the estimate of expenses you paid during the period would be higher, and your ending account value would be lower. In addition, the Fund, as a shareholder in the underlying Fidelity Central Funds, will indirectly bear its pro-rata share of the fees and expenses incurred by the underlying Fidelity Central Funds. These fees and expenses are not included in the Fund's annualized expense ratio used to calculate the expense estimate in the table below.
Please note that the expenses shown in the table are meant to highlight your ongoing costs only and do not reflect any transaction costs. Therefore, the second line of the table is useful in comparing ongoing costs only, and will not help you determine the relative total costs of owning different funds.
| | Annualized Expense Ratio-A | Beginning
Account Value
January 1, 2018 | Ending
Account Value
June 30, 2018 | Expenses Paid
During Period-B
January 1, 2018
to June 30, 2018 |
| Initial Class | .41% | | | |
| Actual | | $1,000.00 | $985.70 | $2.02 |
| Hypothetical-C | | $1,000.00 | $1,022.76 | $2.06 |
| Service Class | .51% | | | |
| Actual | | $1,000.00 | $984.60 | $2.51 |
| Hypothetical-C | | $1,000.00 | $1,022.27 | $2.56 |
| Service Class 2 | .66% | | | |
| Actual | | $1,000.00 | $984.10 | $3.25 |
| Hypothetical-C | | $1,000.00 | $1,021.52 | $3.31 |
| Investor Class | .44% | | | |
| Actual | | $1,000.00 | $985.50 | $2.17 |
| Hypothetical-C | | $1,000.00 | $1,022.61 | $2.21 |
A Annualized expense ratio reflects expenses net of applicable fee waivers.
B Expenses are equal to each Class' annualized expense ratio, multiplied by the average account value over the period, multiplied by 181/365 (to reflect the one-half year period). The fees and expenses of the underlying Fidelity Central Funds in which the Fund invests are not included in each Class' annualized expense ratio. In addition to the expenses noted above, the Fund also indirectly bears its proportional share of the expenses of the underlying Fidelity Central Funds. Annualized expenses of the underlying non-money market Fidelity Central Funds as of their most recent fiscal half year were less than 0.005%.
C 5% return per year before expenses
The following are the financial statements for the Fidelity® VIP Investment Grade Central Fund as of June 30, 2018 which is a direct investment of VIP Investment Grade Bond Portfolio.
Fidelity® VIP Investment Grade Central Fund
Investment Summary (Unaudited)
Quality Diversification (% of fund's net assets)
| As of June 30, 2018 |
| | U.S. Government and U.S. Government Agency Obligations | 67.4% |
| | AAA | 0.2% |
| | AA | 0.7% |
| | A | 6.5% |
| | BBB | 20.3% |
| | BB and Below | 6.3% |
| | Not Rated | 0.3% |
| | Short-Term Investments and Net Other Assets* | (1.7)% |

* Short-Term Investments and Net Other Assets (Liabilities) are not included in the pie chart
We have used ratings from Moody's Investors Service, Inc. Where Moody's® ratings are not available, we have used S&P® ratings. All ratings are as of the date indicated and do not reflect subsequent changes. Securities rated BB or below were rated investment grade at the time of acquisition.
Asset Allocation (% of fund's net assets)
| As of June 30, 2018*,** |
| | Corporate Bonds | 30.6% |
| | U.S. Government and U.S. Government Agency Obligations | 67.4% |
| | Asset-Backed Securities | 0.8% |
| | CMOs and Other Mortgage Related Securities | 0.5% |
| | Municipal Bonds | 1.7% |
| | Other Investments | 0.7% |
| | Short-Term Investments and Net Other Assets (Liabilities)*** | (1.7)% |

* Foreign investments - 6.8%
** Futures and Swaps - 0.0%
*** Short-Term Investments and Net Other Assets (Liabilities) are not included in the pie chart
Percentages in the above tables are adjusted for the effect of TBA Sale Commitments.
Percentages shown as 0.0% may reflect amounts less than 0.05%.
Fidelity® VIP Investment Grade Central Fund
Schedule of Investments June 30, 2018 (Unaudited)
Showing Percentage of Net Assets
| Nonconvertible Bonds - 30.6% | | | |
| | | Principal Amount | Value |
| CONSUMER DISCRETIONARY - 2.6% | | | |
| Automobiles - 0.7% | | | |
| General Motors Co. 3.5% 10/2/18 | | $3,528,000 | $3,534,694 |
| General Motors Financial Co., Inc.: | | | |
| 3.2% 7/13/20 | | 10,000,000 | 9,953,108 |
| 3.5% 7/10/19 | | 4,187,000 | 4,208,076 |
| 4.2% 3/1/21 | | 5,411,000 | 5,486,429 |
| 4.25% 5/15/23 | | 2,080,000 | 2,081,331 |
| 4.375% 9/25/21 | | 15,702,000 | 16,003,179 |
| | | | 41,266,817 |
| Diversified Consumer Services - 0.1% | | | |
| Ingersoll-Rand Global Holding Co. Ltd. 4.25% 6/15/23 | | 2,932,000 | 3,013,749 |
| Hotels, Restaurants & Leisure - 0.0% | | | |
| McDonald's Corp. 2.75% 12/9/20 | | 910,000 | 903,593 |
| Media - 1.8% | | | |
| 21st Century Fox America, Inc. 7.75% 12/1/45 | | 3,169,000 | 4,462,822 |
| AOL Time Warner, Inc. 2.95% 7/15/26 | | 12,000,000 | 10,783,769 |
| Charter Communications Operating LLC/Charter Communications Operating Capital Corp.: | | | |
| 4.464% 7/23/22 | | 5,742,000 | 5,805,973 |
| 4.908% 7/23/25 | | 3,860,000 | 3,897,031 |
| 5.375% 5/1/47 | | 10,672,000 | 9,684,256 |
| 6.484% 10/23/45 | | 1,700,000 | 1,790,655 |
| Comcast Corp.: | | | |
| 3.9% 3/1/38 | | 1,072,000 | 975,902 |
| 3.969% 11/1/47 | | 2,402,000 | 2,114,029 |
| 3.999% 11/1/49 | | 3,964,000 | 3,500,914 |
| 4% 3/1/48 | | 1,966,000 | 1,730,606 |
| 4.6% 8/15/45 | | 2,841,000 | 2,735,195 |
| 4.65% 7/15/42 | | 2,539,000 | 2,468,354 |
| NBCUniversal, Inc.: | | | |
| 4.45% 1/15/43 | | 2,012,000 | 1,900,569 |
| 5.95% 4/1/41 | | 1,407,000 | 1,583,561 |
| Time Warner Cable, Inc.: | | | |
| 4% 9/1/21 | | 7,363,000 | 7,362,231 |
| 4.5% 9/15/42 | | 556,000 | 456,516 |
| 5.5% 9/1/41 | | 1,700,000 | 1,580,584 |
| 5.875% 11/15/40 | | 1,500,000 | 1,466,533 |
| 6.55% 5/1/37 | | 18,635,000 | 19,757,921 |
| 6.75% 7/1/18 | | 4,425,000 | 4,425,000 |
| 7.3% 7/1/38 | | 3,781,000 | 4,283,348 |
| 8.25% 4/1/19 | | 7,716,000 | 8,003,369 |
| | | | 100,769,138 |
|
| TOTAL CONSUMER DISCRETIONARY | | | 145,953,297 |
|
| CONSUMER STAPLES - 1.9% | | | |
| Beverages - 1.1% | | | |
| Anheuser-Busch InBev Finance, Inc.: | | | |
| 2.65% 2/1/21 | | 9,870,000 | 9,731,883 |
| 3.3% 2/1/23 | | 10,630,000 | 10,537,706 |
| 4.7% 2/1/36 | | 10,065,000 | 10,194,538 |
| 4.9% 2/1/46 | | 11,511,000 | 11,835,076 |
| Anheuser-Busch InBev Worldwide, Inc. 4.75% 4/15/58 | | 5,750,000 | 5,611,319 |
| Molson Coors Brewing Co. 5% 5/1/42 | | 13,093,000 | 13,165,884 |
| | | | 61,076,406 |
| Food & Staples Retailing - 0.1% | | | |
| Walgreens Boots Alliance, Inc.: | | | |
| 2.7% 11/18/19 | | 2,460,000 | 2,449,619 |
| 3.3% 11/18/21 | | 2,918,000 | 2,899,780 |
| | | | 5,349,399 |
| Tobacco - 0.7% | | | |
| Altria Group, Inc. 4% 1/31/24 | | 2,227,000 | 2,254,041 |
| Imperial Tobacco Finance PLC: | | | |
| 3.75% 7/21/22 (a) | | 4,804,000 | 4,766,858 |
| 4.25% 7/21/25 (a) | | 4,804,000 | 4,780,585 |
| Reynolds American, Inc.: | | | |
| 3.25% 6/12/20 | | 939,000 | 937,113 |
| 4% 6/12/22 | | 3,228,000 | 3,248,032 |
| 4.45% 6/12/25 | | 2,341,000 | 2,352,718 |
| 5.7% 8/15/35 | | 1,215,000 | 1,303,734 |
| 5.85% 8/15/45 | | 9,320,000 | 10,185,568 |
| 6.15% 9/15/43 | | 4,000,000 | 4,537,357 |
| 7.25% 6/15/37 | | 2,962,000 | 3,706,228 |
| | | | 38,072,234 |
|
| TOTAL CONSUMER STAPLES | | | 104,498,039 |
|
| ENERGY - 5.0% | | | |
| Energy Equipment & Services - 0.2% | | | |
| El Paso Pipeline Partners Operating Co. LLC 5% 10/1/21 | | 1,517,000 | 1,575,222 |
| Halliburton Co.: | | | |
| 3.8% 11/15/25 | | 2,467,000 | 2,449,213 |
| 4.85% 11/15/35 | | 2,154,000 | 2,226,040 |
| Noble Holding International Ltd.: | | | |
| 7.95% 4/1/25 (b) | | 2,180,000 | 2,027,400 |
| 8.95% 4/1/45 (b) | | 2,104,000 | 1,919,900 |
| | | | 10,197,775 |
| Oil, Gas & Consumable Fuels - 4.8% | | | |
| Amerada Hess Corp. 7.875% 10/1/29 | | 2,544,000 | 3,091,814 |
| Anadarko Finance Co. 7.5% 5/1/31 | | 6,883,000 | 8,522,138 |
| Anadarko Petroleum Corp.: | | | |
| 4.85% 3/15/21 | | 1,620,000 | 1,667,040 |
| 5.55% 3/15/26 | | 3,337,000 | 3,575,220 |
| 6.45% 9/15/36 | | 1,002,000 | 1,157,295 |
| 6.6% 3/15/46 | | 4,530,000 | 5,440,546 |
| Canadian Natural Resources Ltd.: | | | |
| 3.8% 4/15/24 | | 6,783,000 | 6,720,152 |
| 5.85% 2/1/35 | | 2,497,000 | 2,773,685 |
| Cenovus Energy, Inc. 4.25% 4/15/27 | | 5,557,000 | 5,350,529 |
| Columbia Pipeline Group, Inc.: | | | |
| 3.3% 6/1/20 | | 4,379,000 | 4,360,711 |
| 4.5% 6/1/25 | | 1,336,000 | 1,337,097 |
| DCP Midstream LLC: | | | |
| 4.75% 9/30/21 (a) | | 3,739,000 | 3,776,390 |
| 5.35% 3/15/20 (a) | | 3,724,000 | 3,793,825 |
| DCP Midstream Operating LP: | | | |
| 3.875% 3/15/23 | | 1,771,000 | 1,711,229 |
| 5.6% 4/1/44 | | 1,227,000 | 1,157,981 |
| Duke Energy Field Services 6.45% 11/3/36 (a) | | 2,477,000 | 2,607,043 |
| Empresa Nacional de Petroleo 4.375% 10/30/24 (a) | | 3,540,000 | 3,525,736 |
| Enable Midstream Partners LP: | | | |
| 2.4% 5/15/19 (b) | | 1,253,000 | 1,245,097 |
| 3.9% 5/15/24 (b) | | 1,322,000 | 1,264,987 |
| Enbridge Energy Partners LP: | | | |
| 4.2% 9/15/21 | | 4,399,000 | 4,450,919 |
| 4.375% 10/15/20 | | 3,093,000 | 3,147,468 |
| Enbridge, Inc.: | | | |
| 4.25% 12/1/26 | | 1,773,000 | 1,756,307 |
| 5.5% 12/1/46 | | 2,046,000 | 2,182,505 |
| Energy Transfer Partners LP: | | | |
| 4.2% 9/15/23 | | 1,186,000 | 1,183,949 |
| 4.95% 6/15/28 | | 4,048,000 | 4,033,854 |
| 5.8% 6/15/38 | | 2,257,000 | 2,232,492 |
| 6% 6/15/48 | | 1,470,000 | 1,465,310 |
| EnLink Midstream Partners LP 2.7% 4/1/19 | | 6,288,000 | 6,226,749 |
| Enterprise Products Operating LP: | | | |
| 2.55% 10/15/19 | | 863,000 | 857,152 |
| 3.7% 2/15/26 | | 4,800,000 | 4,688,678 |
| 3.75% 2/15/25 | | 2,900,000 | 2,870,871 |
| Kinder Morgan Energy Partners LP 6.55% 9/15/40 | | 460,000 | 505,129 |
| Marathon Petroleum Corp. 5.125% 3/1/21 | | 2,187,000 | 2,275,130 |
| MPLX LP 4.875% 12/1/24 | | 2,736,000 | 2,819,576 |
| Nakilat, Inc. 6.067% 12/31/33 (a) | | 1,808,000 | 1,975,602 |
| Petrobras Global Finance BV: | | | |
| 4.375% 5/20/23 | | 7,020,000 | 6,558,435 |
| 7.25% 3/17/44 | | 24,245,000 | 22,426,625 |
| Petroleos Mexicanos: | | | |
| 3.5% 1/30/23 | | 3,410,000 | 3,228,145 |
| 4.5% 1/23/26 | | 6,809,000 | 6,388,204 |
| 4.625% 9/21/23 | | 7,350,000 | 7,247,100 |
| 4.875% 1/24/22 | | 3,398,000 | 3,427,902 |
| 4.875% 1/18/24 | | 4,539,000 | 4,480,765 |
| 5.375% 3/13/22 | | 2,700,000 | 2,768,850 |
| 5.5% 1/21/21 | | 3,601,000 | 3,707,193 |
| 5.5% 6/27/44 | | 2,492,000 | 2,102,002 |
| 5.625% 1/23/46 | | 8,402,000 | 7,091,288 |
| 6% 3/5/20 | | 1,034,000 | 1,067,605 |
| 6.35% 2/12/48 (a) | | 4,430,000 | 3,998,075 |
| 6.375% 1/23/45 | | 4,048,000 | 3,728,208 |
| 6.5% 3/13/27 | | 4,830,000 | 4,952,779 |
| 6.5% 6/2/41 | | 7,675,000 | 7,217,570 |
| 6.75% 9/21/47 | | 12,105,000 | 11,505,803 |
| 8% 5/3/19 | | 2,142,000 | 2,220,461 |
| Phillips 66 Co. 4.3% 4/1/22 | | 3,770,000 | 3,881,822 |
| Phillips 66 Partners LP 2.646% 2/15/20 | | 375,000 | 370,716 |
| Plains All American Pipeline LP/PAA Finance Corp. 3.65% 6/1/22 | | 1,784,000 | 1,748,266 |
| Southwestern Energy Co. 6.7% 1/23/25 (b) | | 2,509,000 | 2,455,684 |
| The Williams Companies, Inc.: | | | |
| 3.7% 1/15/23 | | 1,208,000 | 1,168,740 |
| 4.55% 6/24/24 | | 13,337,000 | 13,337,000 |
| Western Gas Partners LP: | | | |
| 4.5% 3/1/28 | | 2,000,000 | 1,923,968 |
| 4.65% 7/1/26 | | 8,532,000 | 8,378,906 |
| 5.375% 6/1/21 | | 6,322,000 | 6,552,849 |
| Williams Partners LP: | | | |
| 3.6% 3/15/22 | | 3,522,000 | 3,503,860 |
| 3.9% 1/15/25 | | 1,216,000 | 1,185,897 |
| 4% 11/15/21 | | 1,605,000 | 1,618,901 |
| 4.3% 3/4/24 | | 5,449,000 | 5,466,479 |
| 4.5% 11/15/23 | | 1,751,000 | 1,777,055 |
| | | | 263,237,359 |
|
| TOTAL ENERGY | | | 273,435,134 |
|
| FINANCIALS - 12.1% | | | |
| Banks - 6.0% | | | |
| Bank of America Corp.: | | | |
| 2.25% 4/21/20 | | 3,337,000 | 3,291,095 |
| 2.6% 1/15/19 | | 1,033,000 | 1,032,352 |
| 3.004% 12/20/23 (b) | | 23,800,000 | 23,078,158 |
| 3.3% 1/11/23 | | 4,342,000 | 4,276,935 |
| 3.419% 12/20/28 (b) | | 18,965,000 | 17,858,853 |
| 3.5% 4/19/26 | | 5,024,000 | 4,857,913 |
| 3.95% 4/21/25 | | 4,125,000 | 4,038,560 |
| 4.2% 8/26/24 | | 6,867,000 | 6,899,988 |
| 4.25% 10/22/26 | | 4,261,000 | 4,209,097 |
| Barclays PLC: | | | |
| 2.75% 11/8/19 | | 3,581,000 | 3,552,527 |
| 3.25% 1/12/21 | | 4,610,000 | 4,543,962 |
| 4.375% 1/12/26 | | 6,221,000 | 6,042,240 |
| 5.2% 5/12/26 | | 5,259,000 | 5,166,237 |
| Citigroup, Inc.: | | | |
| 2.7% 10/27/22 | | 9,998,000 | 9,598,339 |
| 3.875% 3/26/25 | | 9,500,000 | 9,219,690 |
| 4.05% 7/30/22 | | 1,800,000 | 1,809,198 |
| 4.3% 11/20/26 | | 1,733,000 | 1,690,457 |
| 5.5% 9/13/25 | | 4,860,000 | 5,158,321 |
| Citizens Bank NA 2.55% 5/13/21 | | 1,560,000 | 1,521,449 |
| Citizens Financial Group, Inc. 4.15% 9/28/22 (a) | | 4,857,000 | 4,888,642 |
| Credit Suisse Group Funding Guernsey Ltd.: | | | |
| 2.75% 3/26/20 | | 4,667,000 | 4,616,783 |
| 3.75% 3/26/25 | | 4,660,000 | 4,480,526 |
| 3.8% 9/15/22 | | 7,240,000 | 7,206,092 |
| 3.8% 6/9/23 | | 8,582,000 | 8,470,776 |
| Discover Bank: | | | |
| 3.35% 2/6/23 | | 3,206,000 | 3,123,227 |
| 4.2% 8/8/23 | | 2,849,000 | 2,873,705 |
| 7% 4/15/20 | | 2,309,000 | 2,438,295 |
| Fifth Third Bancorp: | | | |
| 2.875% 7/27/20 | | 3,000,000 | 2,982,575 |
| 8.25% 3/1/38 | | 4,319,000 | 5,891,261 |
| HSBC Holdings PLC 4.25% 3/14/24 | | 2,200,000 | 2,187,933 |
| Huntington Bancshares, Inc. 7% 12/15/20 | | 1,004,000 | 1,082,501 |
| Intesa Sanpaolo SpA: | | | |
| 5.017% 6/26/24 (a) | | 4,337,000 | 3,936,547 |
| 5.71% 1/15/26 (a) | | 9,626,000 | 8,799,020 |
| JPMorgan Chase & Co.: | | | |
| 2.75% 6/23/20 | | 5,755,000 | 5,703,606 |
| 2.95% 10/1/26 | | 8,028,000 | 7,454,471 |
| 3.875% 9/10/24 | | 43,751,000 | 43,327,107 |
| 4.125% 12/15/26 | | 14,080,000 | 13,897,234 |
| MUFG Americas Holdings Corp. 2.25% 2/10/20 | | 4,493,000 | 4,426,054 |
| Rabobank Nederland 4.375% 8/4/25 | | 7,451,000 | 7,302,989 |
| Regions Bank 6.45% 6/26/37 | | 7,720,000 | 9,115,865 |
| Regions Financial Corp. 3.2% 2/8/21 | | 2,833,000 | 2,819,928 |
| Royal Bank of Scotland Group PLC: | | | |
| 5.125% 5/28/24 | | 20,522,000 | 20,691,955 |
| 6% 12/19/23 | | 10,433,000 | 10,944,200 |
| 6.1% 6/10/23 | | 11,522,000 | 12,131,004 |
| 6.125% 12/15/22 | | 8,239,000 | 8,668,222 |
| Synchrony Bank 3% 6/15/22 | | 4,542,000 | 4,372,667 |
| | | | 331,678,556 |
| Capital Markets - 3.8% | | | |
| Affiliated Managers Group, Inc.: | | | |
| 3.5% 8/1/25 | | 5,541,000 | 5,369,399 |
| 4.25% 2/15/24 | | 4,287,000 | 4,359,700 |
| Credit Suisse Group AG 3.869% 1/12/29 (a)(b) | | 4,020,000 | 3,778,637 |
| Deutsche Bank AG 4.5% 4/1/25 | | 10,381,000 | 9,465,290 |
| Deutsche Bank AG New York Branch: | | | |
| 3.15% 1/22/21 | | 6,514,000 | 6,301,563 |
| 3.3% 11/16/22 | | 9,310,000 | 8,719,595 |
| Goldman Sachs Group, Inc.: | | | |
| 2.876% 10/31/22 (b) | | 22,903,000 | 22,359,054 |
| 3.2% 2/23/23 | | 7,150,000 | 6,964,981 |
| 3.691% 6/5/28 (b) | | 41,645,000 | 39,463,944 |
| 6.75% 10/1/37 | | 2,246,000 | 2,667,997 |
| IntercontinentalExchange, Inc. 2.75% 12/1/20 | | 1,628,000 | 1,613,112 |
| Lazard Group LLC 4.25% 11/14/20 | | 3,307,000 | 3,371,586 |
| Moody's Corp.: | | | |
| 3.25% 1/15/28 | | 2,386,000 | 2,251,365 |
| 4.875% 2/15/24 | | 2,240,000 | 2,350,770 |
| Morgan Stanley: | | | |
| 3.125% 1/23/23 | | 26,000,000 | 25,358,580 |
| 3.125% 7/27/26 | | 21,964,000 | 20,424,280 |
| 3.625% 1/20/27 | | 11,000,000 | 10,582,790 |
| 3.7% 10/23/24 | | 3,281,000 | 3,237,768 |
| 3.737% 4/24/24 (b) | | 5,000,000 | 4,968,411 |
| 4.875% 11/1/22 | | 7,751,000 | 8,037,030 |
| 5% 11/24/25 | | 1,047,000 | 1,085,013 |
| 5.75% 1/25/21 | | 3,512,000 | 3,713,641 |
| Peachtree Corners Funding Trust 3.976% 2/15/25 (a) | | 5,000,000 | 4,863,436 |
| Thomson Reuters Corp. 3.85% 9/29/24 | | 3,379,000 | 3,327,057 |
| UBS AG Stamford Branch 2.35% 3/26/20 | | 1,450,000 | 1,433,630 |
| UBS Group Funding Ltd. 4.125% 9/24/25 (a) | | 5,261,000 | 5,222,614 |
| | | | 211,291,243 |
| Consumer Finance - 0.7% | | | |
| AerCap Ireland Capital Ltd./AerCap Global Aviation Trust: | | | |
| 3.5% 5/26/22 | | 1,724,000 | 1,685,857 |
| 4.125% 7/3/23 | | 4,192,000 | 4,168,039 |
| Capital One Financial Corp. 3.8% 1/31/28 | | 4,476,000 | 4,223,411 |
| Discover Financial Services: | | | |
| 3.85% 11/21/22 | | 5,040,000 | 5,016,863 |
| 3.95% 11/6/24 | | 2,847,000 | 2,777,053 |
| 4.1% 2/9/27 | | 3,673,000 | 3,521,817 |
| Ford Motor Credit Co. LLC 2.875% 10/1/18 | | 4,500,000 | 4,500,990 |
| Hyundai Capital America 2.875% 8/9/18 (a) | | 1,921,000 | 1,920,723 |
| Synchrony Financial: | | | |
| 3% 8/15/19 | | 1,459,000 | 1,456,122 |
| 3.75% 8/15/21 | | 2,203,000 | 2,200,537 |
| 3.95% 12/1/27 | | 2,800,000 | 2,582,025 |
| 4.25% 8/15/24 | | 2,218,000 | 2,173,446 |
| | | | 36,226,883 |
| Diversified Financial Services - 0.3% | | | |
| AXA Equitable Holdings, Inc. 3.9% 4/20/23 (a) | | 1,041,000 | 1,032,455 |
| Brixmor Operating Partnership LP: | | | |
| 3.25% 9/15/23 | | 5,952,000 | 5,700,812 |
| 3.875% 8/15/22 | | 5,542,000 | 5,520,185 |
| 4.125% 6/15/26 | | 2,032,000 | 1,966,126 |
| Voya Financial, Inc. 3.125% 7/15/24 | | 2,851,000 | 2,692,110 |
| | | | 16,911,688 |
| Insurance - 1.3% | | | |
| AIA Group Ltd. 2.25% 3/11/19 (a) | | 913,000 | 906,939 |
| American International Group, Inc.: | | | |
| 3.3% 3/1/21 | | 2,355,000 | 2,353,172 |
| 3.75% 7/10/25 | | 8,311,000 | 8,021,541 |
| 4.875% 6/1/22 | | 3,597,000 | 3,766,583 |
| Aon Corp. 5% 9/30/20 | | 1,402,000 | 1,453,145 |
| Liberty Mutual Group, Inc. 5% 6/1/21 (a) | | 4,093,000 | 4,241,488 |
| Marsh & McLennan Companies, Inc. 4.8% 7/15/21 | | 2,278,000 | 2,368,423 |
| Massachusetts Mutual Life Insurance Co. 4.5% 4/15/65 (a) | | 5,285,000 | 4,945,705 |
| MetLife, Inc. 4.75% 2/8/21 | | 1,139,000 | 1,182,849 |
| Metropolitan Life Global Funding I 3% 1/10/23 (a) | | 2,636,000 | 2,585,133 |
| Pacific LifeCorp 5.125% 1/30/43 (a) | | 5,252,000 | 5,608,596 |
| Prudential Financial, Inc.: | | | |
| 2.3% 8/15/18 | | 599,000 | 598,835 |
| 7.375% 6/15/19 | | 1,250,000 | 1,301,918 |
| Teachers Insurance & Annuity Association of America 4.9% 9/15/44 (a) | | 5,347,000 | 5,624,307 |
| TIAA Asset Management Finance LLC: | | | |
| 2.95% 11/1/19 (a) | | 1,222,000 | 1,217,200 |
| 4.125% 11/1/24 (a) | | 1,771,000 | 1,760,522 |
| Unum Group: | | | |
| 3.875% 11/5/25 | | 4,860,000 | 4,718,610 |
| 4% 3/15/24 | | 5,930,000 | 5,881,745 |
| 5.625% 9/15/20 | | 2,889,000 | 3,020,119 |
| 5.75% 8/15/42 | | 7,278,000 | 7,732,863 |
| | | | 69,289,693 |
|
| TOTAL FINANCIALS | | | 665,398,063 |
|
| HEALTH CARE - 2.4% | | | |
| Biotechnology - 0.2% | | | |
| AbbVie, Inc. 2.9% 11/6/22 | | 8,618,000 | 8,360,212 |
| Health Care Equipment & Supplies - 0.1% | | | |
| Becton, Dickinson & Co.: | | | |
| 2.675% 12/15/19 | | 1,156,000 | 1,147,296 |
| 2.894% 6/6/22 | | 987,000 | 954,390 |
| 3.363% 6/6/24 | | 3,188,000 | 3,061,095 |
| 3.7% 6/6/27 | | 3,370,000 | 3,186,310 |
| | | | 8,349,091 |
| Health Care Providers & Services - 1.3% | | | |
| CVS Health Corp.: | | | |
| 3.7% 3/9/23 | | 2,500,000 | 2,474,550 |
| 4.1% 3/25/25 | | 11,542,000 | 11,478,753 |
| 4.3% 3/25/28 | | 13,403,000 | 13,215,622 |
| 4.78% 3/25/38 | | 5,967,000 | 5,898,133 |
| 5.05% 3/25/48 | | 8,772,000 | 8,859,691 |
| HCA Holdings, Inc.: | | | |
| 3.75% 3/15/19 | | 6,803,000 | 6,828,511 |
| 4.25% 10/15/19 | | 11,265,000 | 11,349,488 |
| 4.75% 5/1/23 | | 215,000 | 214,463 |
| 5.875% 3/15/22 | | 260,000 | 271,050 |
| 6.5% 2/15/20 | | 7,140,000 | 7,434,525 |
| Medco Health Solutions, Inc. 4.125% 9/15/20 | | 2,723,000 | 2,761,271 |
| | | | 70,786,057 |
| Life Sciences Tools & Services - 0.0% | | | |
| Thermo Fisher Scientific, Inc. 4.15% 2/1/24 | | 1,093,000 | 1,108,980 |
| Pharmaceuticals - 0.8% | | | |
| Actavis Funding SCS: | | | |
| 3% 3/12/20 | | 3,962,000 | 3,942,173 |
| 3.45% 3/15/22 | | 6,868,000 | 6,756,242 |
| Mylan N.V. 4.55% 4/15/28 (a) | | 4,000,000 | 3,907,492 |
| Mylan NV: | | | |
| 2.5% 6/7/19 | | 1,344,000 | 1,337,891 |
| 3.15% 6/15/21 | | 5,002,000 | 4,945,337 |
| 3.95% 6/15/26 | | 2,549,000 | 2,436,564 |
| Perrigo Finance PLC 3.5% 12/15/21 | | 449,000 | 444,316 |
| Shire Acquisitions Investments Ireland DAC 2.4% 9/23/21 | | 9,847,000 | 9,426,366 |
| Teva Pharmaceutical Finance Netherlands III BV: | | | |
| 2.2% 7/21/21 | | 3,623,000 | 3,360,198 |
| 2.8% 7/21/23 | | 2,593,000 | 2,238,915 |
| 3.15% 10/1/26 | | 3,088,000 | 2,481,032 |
| Zoetis, Inc. 3.25% 2/1/23 | | 1,649,000 | 1,623,040 |
| | | | 42,899,566 |
|
| TOTAL HEALTH CARE | | | 131,503,906 |
|
| INDUSTRIALS - 0.5% | | | |
| Airlines - 0.0% | | | |
| Continental Airlines, Inc. 6.795% 8/2/18 | | 83,660 | 83,660 |
| Northwest Airlines, Inc. pass-thru trust certificates 7.027% 11/1/19 | | 1,902,221 | 1,986,870 |
| U.S. Airways pass-thru trust certificates 8.36% 1/20/19 | | 106,247 | 107,310 |
| | | | 2,177,840 |
| Trading Companies & Distributors - 0.5% | | | |
| Air Lease Corp.: | | | |
| 2.625% 9/4/18 | | 4,630,000 | 4,628,116 |
| 3% 9/15/23 | | 877,000 | 830,208 |
| 3.375% 6/1/21 | | 2,523,000 | 2,509,251 |
| 3.75% 2/1/22 | | 4,522,000 | 4,526,173 |
| 3.875% 4/1/21 | | 3,180,000 | 3,203,097 |
| 3.875% 7/3/23 | | 5,581,000 | 5,523,739 |
| 4.25% 9/15/24 | | 3,565,000 | 3,538,061 |
| 4.75% 3/1/20 | | 3,519,000 | 3,593,361 |
| | | | 28,352,006 |
|
| TOTAL INDUSTRIALS | | | 30,529,846 |
|
| INFORMATION TECHNOLOGY - 0.0% | | | |
| Electronic Equipment & Components - 0.0% | | | |
| Tyco Electronics Group SA 2.375% 12/17/18 | | 832,000 | 830,653 |
| MATERIALS - 0.5% | | | |
| Chemicals - 0.1% | | | |
| The Dow Chemical Co.: | | | |
| 4.125% 11/15/21 | | 3,587,000 | 3,656,272 |
| 4.25% 11/15/20 | | 1,196,000 | 1,221,216 |
| | | | 4,877,488 |
| Metals & Mining - 0.4% | | | |
| BHP Billiton Financial (U.S.A.) Ltd.: | | | |
| 6.25% 10/19/75 (a)(b) | | 1,921,000 | 2,008,045 |
| 6.75% 10/19/75 (a)(b) | | 4,773,000 | 5,176,319 |
| Corporacion Nacional del Cobre de Chile (Codelco): | | | |
| 3.625% 8/1/27 (a) | | 1,696,000 | 1,615,491 |
| 4.5% 8/13/23 (a) | | 9,000,000 | 9,223,587 |
| 4.5% 8/1/47 (a) | | 1,720,000 | 1,671,083 |
| Vale Overseas Ltd. 4.375% 1/11/22 | | 1,211,000 | 1,225,520 |
| | | | 20,920,045 |
|
| TOTAL MATERIALS | | | 25,797,533 |
|
| REAL ESTATE - 3.1% | | | |
| Equity Real Estate Investment Trusts (REITs) - 1.8% | | | |
| Alexandria Real Estate Equities, Inc.: | | | |
| 2.75% 1/15/20 | | 879,000 | 871,794 |
| 4.6% 4/1/22 | | 1,403,000 | 1,447,623 |
| American Campus Communities Operating Partnership LP 3.75% 4/15/23 | | 1,184,000 | 1,177,285 |
| American Tower Corp. 2.8% 6/1/20 | | 9,000,000 | 8,922,406 |
| AvalonBay Communities, Inc. 3.625% 10/1/20 | | 1,872,000 | 1,886,285 |
| Boston Properties, Inc. 3.85% 2/1/23 | | 4,708,000 | 4,730,448 |
| Camden Property Trust: | | | |
| 2.95% 12/15/22 | | 1,607,000 | 1,564,381 |
| 4.25% 1/15/24 | | 3,408,000 | 3,471,070 |
| Corporate Office Properties LP 5% 7/1/25 | | 3,156,000 | 3,220,123 |
| DDR Corp.: | | | |
| 3.625% 2/1/25 | | 2,262,000 | 2,145,809 |
| 4.25% 2/1/26 | | 1,807,000 | 1,764,078 |
| 4.625% 7/15/22 | | 2,855,000 | 2,927,013 |
| Duke Realty LP: | | | |
| 3.625% 4/15/23 | | 2,123,000 | 2,104,049 |
| 3.75% 12/1/24 | | 1,576,000 | 1,552,435 |
| 3.875% 10/15/22 | | 3,512,000 | 3,545,305 |
| Equity One, Inc. 3.75% 11/15/22 | | 5,500,000 | 5,475,700 |
| ERP Operating LP: | | | |
| 2.375% 7/1/19 | | 2,683,000 | 2,667,235 |
| 4.75% 7/15/20 | | 2,827,000 | 2,904,676 |
| Lexington Corporate Properties Trust 4.4% 6/15/24 | | 1,441,000 | 1,418,751 |
| Omega Healthcare Investors, Inc.: | | | |
| 4.375% 8/1/23 | | 6,023,000 | 5,977,831 |
| 4.5% 1/15/25 | | 2,677,000 | 2,615,048 |
| 4.5% 4/1/27 | | 16,195,000 | 15,425,782 |
| 4.75% 1/15/28 | | 6,382,000 | 6,150,658 |
| 4.95% 4/1/24 | | 1,354,000 | 1,373,037 |
| 5.25% 1/15/26 | | 5,686,000 | 5,732,911 |
| Retail Opportunity Investments Partnership LP: | | | |
| 4% 12/15/24 | | 978,000 | 923,071 |
| 5% 12/15/23 | | 737,000 | 741,377 |
| Weingarten Realty Investors 3.375% 10/15/22 | | 812,000 | 800,669 |
| WP Carey, Inc. 4% 2/1/25 | | 5,360,000 | 5,199,066 |
| | | | 98,735,916 |
| Real Estate Management & Development - 1.3% | | | |
| Brandywine Operating Partnership LP: | | | |
| 3.95% 2/15/23 | | 5,510,000 | 5,482,220 |
| 3.95% 11/15/27 | | 4,613,000 | 4,381,127 |
| 4.1% 10/1/24 | | 4,251,000 | 4,195,472 |
| 4.55% 10/1/29 | | 4,524,000 | 4,432,877 |
| Digital Realty Trust LP: | | | |
| 3.4% 10/1/20 | | 4,915,000 | 4,918,261 |
| 3.95% 7/1/22 | | 3,320,000 | 3,353,020 |
| 4.75% 10/1/25 | | 3,533,000 | 3,639,622 |
| 5.25% 3/15/21 | | 1,953,000 | 2,033,092 |
| Liberty Property LP: | | | |
| 3.375% 6/15/23 | | 2,202,000 | 2,156,203 |
| 4.125% 6/15/22 | | 2,007,000 | 2,043,242 |
| 4.4% 2/15/24 | | 4,876,000 | 4,967,713 |
| 4.75% 10/1/20 | | 4,185,000 | 4,299,589 |
| Mack-Cali Realty LP: | | | |
| 3.15% 5/15/23 | | 4,988,000 | 4,438,123 |
| 4.5% 4/18/22 | | 1,218,000 | 1,185,653 |
| Post Apartment Homes LP 3.375% 12/1/22 | | 790,000 | 778,627 |
| Tanger Properties LP: | | | |
| 3.125% 9/1/26 | | 2,589,000 | 2,335,358 |
| 3.75% 12/1/24 | | 2,960,000 | 2,840,641 |
| 3.875% 12/1/23 | | 1,792,000 | 1,750,449 |
| Ventas Realty LP: | | | |
| 3.125% 6/15/23 | | 1,289,000 | 1,247,928 |
| 3.5% 2/1/25 | | 6,443,000 | 6,167,797 |
| 4% 3/1/28 | | 2,243,000 | 2,167,575 |
| 4.125% 1/15/26 | | 1,557,000 | 1,531,435 |
| 4.375% 2/1/45 | | 763,000 | 699,694 |
| | | | 71,045,718 |
|
| TOTAL REAL ESTATE | | | 169,781,634 |
|
| TELECOMMUNICATION SERVICES - 0.9% | | | |
| Diversified Telecommunication Services - 0.9% | | | |
| AT&T, Inc.: | | | |
| 2.45% 6/30/20 | | 3,187,000 | 3,137,251 |
| 3.6% 2/17/23 | | 6,270,000 | 6,175,274 |
| 4.45% 4/1/24 | | 480,000 | 484,408 |
| 4.5% 3/9/48 | | 10,800,000 | 9,270,029 |
| 5.875% 10/1/19 | | 4,711,000 | 4,873,323 |
| Verizon Communications, Inc.: | | | |
| 3.85% 11/1/42 | | 1,190,000 | 992,976 |
| 4.522% 9/15/48 | | 1,821,000 | 1,658,875 |
| 4.862% 8/21/46 | | 3,398,000 | 3,244,523 |
| 5.012% 4/15/49 | | 2,962,000 | 2,882,246 |
| 5.012% 8/21/54 | | 9,569,000 | 8,984,090 |
| 5.5% 3/16/47 | | 7,027,000 | 7,357,720 |
| | | | 49,060,715 |
| UTILITIES - 1.6% | | | |
| Electric Utilities - 1.1% | | | |
| Cleco Corporate Holdings LLC 3.743% 5/1/26 | | 2,071,000 | 1,952,804 |
| Duquesne Light Holdings, Inc.: | | | |
| 5.9% 12/1/21 (a) | | 2,664,000 | 2,825,284 |
| 6.4% 9/15/20 (a) | | 7,513,000 | 7,940,950 |
| Eversource Energy 2.8% 5/1/23 | | 5,110,000 | 4,923,687 |
| FirstEnergy Corp.: | | | |
| 4.25% 3/15/23 | | 11,729,000 | 11,913,459 |
| 7.375% 11/15/31 | | 5,897,000 | 7,639,332 |
| FirstEnergy Solutions Corp. 6.05% 8/15/21 (c) | | 7,286,000 | 3,606,570 |
| IPALCO Enterprises, Inc.: | | | |
| 3.45% 7/15/20 | | 7,767,000 | 7,733,447 |
| 3.7% 9/1/24 | | 2,157,000 | 2,091,556 |
| LG&E and KU Energy LLC 3.75% 11/15/20 | | 525,000 | 528,864 |
| NV Energy, Inc. 6.25% 11/15/20 | | 1,238,000 | 1,322,060 |
| Progress Energy, Inc. 4.4% 1/15/21 | | 4,274,000 | 4,365,333 |
| TECO Finance, Inc. 5.15% 3/15/20 | | 1,545,000 | 1,587,197 |
| | | | 58,430,543 |
| Gas Utilities - 0.0% | | | |
| Southern Natural Gas Co./Southern Natural Issuing Corp. 4.4% 6/15/21 | | 1,182,000 | 1,207,372 |
| Independent Power and Renewable Electricity Producers - 0.1% | | | |
| Emera U.S. Finance LP: | | | |
| 2.15% 6/15/19 | | 1,201,000 | 1,188,472 |
| 2.7% 6/15/21 | | 1,182,000 | 1,150,366 |
| 3.55% 6/15/26 | | 1,891,000 | 1,779,885 |
| | | | 4,118,723 |
| Multi-Utilities - 0.4% | | | |
| Dominion Resources, Inc. 3 month U.S. LIBOR + 2.300% 4.602% 9/30/66 (b)(d) | | 15,230,000 | 14,201,975 |
| Puget Energy, Inc.: | | | |
| 6% 9/1/21 | | 4,807,000 | 5,140,609 |
| 6.5% 12/15/20 | | 1,534,000 | 1,642,686 |
| Wisconsin Energy Corp. 3 month U.S. LIBOR + 2.113% 4.455% 5/15/67 (b)(d) | | 1,426,000 | 1,406,464 |
| | | | 22,391,734 |
|
| TOTAL UTILITIES | | | 86,148,372 |
|
| TOTAL NONCONVERTIBLE BONDS | | | |
| (Cost $1,703,401,575) | | | 1,682,937,192 |
|
| U.S. Government and Government Agency Obligations - 42.4% | | | |
| U.S. Treasury Inflation-Protected Obligations - 8.2% | | | |
| U.S. Treasury Inflation-Indexed Bonds: | | | |
| 0.75% 2/15/45 | | $51,219,516 | $49,730,525 |
| 0.875% 2/15/47 | | 3,227,931 | 3,230,532 |
| 1% 2/15/46 | | 13,735,626 | 14,157,452 |
| 1.375% 2/15/44 | | 47,919,462 | 53,533,362 |
| U.S. Treasury Inflation-Indexed Notes: | | | |
| 0.125% 7/15/24 | | 59,427,174 | 57,770,001 |
| 0.125% 7/15/26 | | 39,301,024 | 37,651,704 |
| 0.25% 1/15/25 | | 52,036,847 | 50,614,499 |
| 0.375% 1/15/27 | | 42,691,152 | 41,477,918 |
| 0.375% 7/15/27 | | 82,962,630 | 80,710,354 |
| 0.625% 1/15/26 | | 63,266,400 | 62,922,643 |
|
| TOTAL U.S. TREASURY INFLATION-PROTECTED OBLIGATIONS | | | 451,798,990 |
|
| U.S. Treasury Obligations - 34.2% | | | |
| U.S. Treasury Bonds: | | | |
| 2.75% 11/15/47 | | 26,987,000 | 25,723,038 |
| 3% 5/15/45 (e)(f) | | 42,484,000 | 42,608,465 |
| 3% 11/15/45 | | 38,163,000 | 38,259,898 |
| 3% 2/15/47 | | 113,300,000 | 113,596,528 |
| 3% 5/15/47 | | 49,138,000 | 49,228,214 |
| U.S. Treasury Notes: | | | |
| 1.125% 2/28/19 | | 140,000,000 | 138,971,875 |
| 1.25% 3/31/21 | | 27,924,000 | 26,919,391 |
| 1.25% 10/31/21 | | 264,057,000 | 252,256,953 |
| 1.625% 5/31/23 | | 22,986,000 | 21,815,151 |
| 1.875% 3/31/22 | | 249,649,000 | 242,442,335 |
| 1.875% 7/31/22 | | 250,804,000 | 242,741,043 |
| 2% 12/31/21 | | 437,319,000 | 427,530,567 |
| 2.125% 7/31/24 | | 122,131,000 | 117,532,005 |
| 2.125% 11/30/24 | | 76,892,000 | 73,819,323 |
| 2.25% 12/31/24 | | 55,236,000 | 53,404,150 |
| 2.25% 11/15/27 | | 13,775,000 | 13,089,479 |
|
| TOTAL U.S. TREASURY OBLIGATIONS | | | 1,879,938,415 |
|
| TOTAL U.S. GOVERNMENT AND GOVERNMENT AGENCY OBLIGATIONS | | | |
| (Cost $2,387,808,539) | | | 2,331,737,405 |
|
| U.S. Government Agency - Mortgage Securities - 24.8% | | | |
| Fannie Mae - 12.8% | | | |
| 12 month U.S. LIBOR + 1.480% 3.298% 7/1/34 (b)(d) | | 21,974 | 22,520 |
| 12 month U.S. LIBOR + 1.553% 3.326% 6/1/36 (b)(d) | | 35,200 | 36,646 |
| 12 month U.S. LIBOR + 1.725% 2.575% 6/1/42 (b)(d) | | 261,789 | 270,059 |
| 12 month U.S. LIBOR + 1.728% 3.672% 11/1/36 (b)(d) | | 340,487 | 358,618 |
| 12 month U.S. LIBOR + 1.745% 3.636% 7/1/35 (b)(d) | | 25,071 | 26,152 |
| 12 month U.S. LIBOR + 1.788% 3.651% 2/1/36 (b)(d) | | 216,085 | 222,536 |
| 12 month U.S. LIBOR + 1.800% 3.583% 7/1/41 (b)(d) | | 226,386 | 234,477 |
| 12 month U.S. LIBOR + 1.818% 3.046% 9/1/41 (b)(d) | | 128,303 | 132,674 |
| 12 month U.S. LIBOR + 1.818% 3.539% 7/1/41 (b)(d) | | 183,934 | 193,099 |
| 12 month U.S. LIBOR + 1.820% 3.695% 12/1/35 (b)(d) | | 145,971 | 150,544 |
| 12 month U.S. LIBOR + 1.830% 3.361% 10/1/41 (b)(d) | | 107,369 | 111,030 |
| 12 month U.S. LIBOR + 1.900% 3.745% 7/1/37 (b)(d) | | 37,549 | 39,628 |
| 12 month U.S. LIBOR + 1.906% 4.331% 5/1/36 (b)(d) | | 126,154 | 132,465 |
| 12 month U.S. LIBOR + 1.932% 3.82% 9/1/36 (b)(d) | | 247,817 | 259,144 |
| 6 month U.S. LIBOR + 1.313% 3.702% 5/1/34 (b)(d) | | 197,064 | 199,643 |
| 6 month U.S. LIBOR + 1.383% 3.075% 9/1/33 (b)(d) | | 220,328 | 224,842 |
| 6 month U.S. LIBOR + 1.556% 3.552% 10/1/33 (b)(d) | | 11,135 | 11,349 |
| 6 month U.S. LIBOR + 1.565% 3.19% 7/1/35 (b)(d) | | 15,179 | 15,646 |
| U.S. TREASURY 1 YEAR INDEX + 1.945% 3.076% 10/1/33 (b)(d) | | 289,997 | 301,942 |
| U.S. TREASURY 1 YEAR INDEX + 2.208% 4.083% 3/1/35 (b)(d) | | 13,050 | 13,519 |
| U.S. TREASURY 1 YEAR INDEX + 2.232% 3.643% 8/1/36 (b)(d) | | 638,453 | 673,188 |
| U.S. TREASURY 1 YEAR INDEX + 2.295% 3.539% 10/1/33 (b)(d) | | 30,122 | 31,804 |
| U.S. TREASURY 1 YEAR INDEX + 2.475% 3.959% 5/1/35 (b)(d) | | 63,302 | 67,092 |
| 2.5% 7/1/33 (g) | | 9,325,000 | 9,064,106 |
| 2.5% 7/1/33 (g) | | 7,275,000 | 7,071,461 |
| 2.5% 1/1/43 to 4/1/47 | | 8,741,407 | 8,225,506 |
| 3% 11/1/24 to 1/1/47 | | 90,585,899 | 88,345,332 |
| 3% 7/1/33 (g) | | 18,100,000 | 17,991,081 |
| 3.5% 12/1/25 to 6/1/48 | | 198,428,056 | 198,428,535 |
| 3.5% 7/1/33 (g) | | 10,800,000 | 10,926,847 |
| 4% 11/1/31 to 5/1/48 | | 145,622,668 | 149,045,127 |
| 4.5% 5/1/25 to 5/1/48 | | 38,521,237 | 40,379,681 |
| 4.5% 7/1/48 (g) | | 39,650,000 | 41,283,084 |
| 4.5% 7/1/48 (g) | | 25,900,000 | 26,966,756 |
| 4.5% 7/1/48 (g) | | 9,400,000 | 9,787,163 |
| 4.5% 7/1/48 (g) | | 15,100,000 | 15,721,931 |
| 4.5% 7/1/48 (g) | | 550,000 | 572,653 |
| 4.5% 8/1/48 (g) | | 34,500,000 | 35,861,670 |
| 5% 9/1/20 to 11/1/44 | | 17,992,977 | 19,197,604 |
| 5.5% 7/1/18 to 5/1/44 | | 5,468,568 | 5,960,660 |
| 6% 10/1/34 to 1/1/42 | | 13,627,443 | 15,012,987 |
| 6.5% 12/1/23 to 8/1/36 | | 1,529,749 | 1,707,250 |
| 7% 11/1/23 to 8/1/32 | | 405,578 | 446,101 |
| 7.5% 9/1/22 to 11/1/31 | | 319,958 | 359,500 |
| 8% 1/1/30 to 3/1/30 | | 1,933 | 2,144 |
| 8.5% 3/1/25 to 6/1/25 | | 398 | 448 |
|
| TOTAL FANNIE MAE | | | 706,086,244 |
|
| Freddie Mac - 6.0% | | | |
| 12 month U.S. LIBOR + 1.375% 3.161% 3/1/36 (b)(d) | | 84,507 | 86,914 |
| 12 month U.S. LIBOR + 1.877% 4.21% 4/1/41 (b)(d) | | 102,435 | 105,672 |
| 12 month U.S. LIBOR + 1.880% 3.205% 9/1/41 (b)(d) | | 135,636 | 140,019 |
| 12 month U.S. LIBOR + 1.910% 3.331% 6/1/41 (b)(d) | | 128,803 | 135,476 |
| 12 month U.S. LIBOR + 1.910% 3.894% 6/1/41 (b)(d) | | 182,194 | 191,299 |
| 12 month U.S. LIBOR + 1.910% 4.365% 5/1/41 (b)(d) | | 200,844 | 208,771 |
| 12 month U.S. LIBOR + 1.910% 4.479% 5/1/41 (b)(d) | | 134,655 | 141,961 |
| 12 month U.S. LIBOR + 2.160% 3.91% 11/1/35 (b)(d) | | 89,788 | 94,832 |
| 12 month U.S. LIBOR + 2.197% 3.898% 3/1/33 (b)(d) | | 1,911 | 2,000 |
| 6 month U.S. LIBOR + 1.655% 3.692% 4/1/35 (b)(d) | | 143,987 | 150,401 |
| 6 month U.S. LIBOR + 2.755% 4.845% 10/1/35 (b)(d) | | 49,434 | 52,393 |
| U.S. TREASURY 1 YEAR INDEX + 2.248% 3.722% 1/1/35 (b)(d) | | 41,695 | 43,853 |
| 3% 6/1/31 to 1/1/47 | | 88,239,167 | 85,663,605 |
| 3% 7/1/48 (g) | | 5,350,000 | 5,176,818 |
| 3.5% 3/1/32 to 12/1/47 | | 124,404,889 | 125,144,954 |
| 4% 5/1/25 to 5/1/48 | | 61,648,271 | 63,303,561 |
| 4.5% 7/1/25 to 5/1/48 | | 36,157,230 | 37,887,302 |
| 5% 1/1/35 to 6/1/41 | | 3,312,127 | 3,547,392 |
| 5.5% 1/1/38 to 6/1/41 | | 5,011,363 | 5,458,099 |
| 6% 4/1/32 to 8/1/37 | | 768,560 | 851,081 |
| 7.5% 5/1/26 to 11/1/31 | | 36,226 | 40,992 |
| 8% 4/1/27 to 5/1/27 | | 2,529 | 2,853 |
| 8.5% 5/1/27 to 1/1/28 | | 5,463 | 6,171 |
|
| TOTAL FREDDIE MAC | | | 328,436,419 |
|
| Ginnie Mae - 6.0% | | | |
| 3% 12/20/42 to 11/20/47 | | 100,696,815 | 98,766,929 |
| 3.5% 1/15/41 to 3/20/48 | | 125,698,254 | 126,426,380 |
| 4% 2/15/40 to 7/20/47 | | 46,058,691 | 47,483,810 |
| 4.5% 5/15/39 to 5/20/41 | | 13,598,394 | 14,331,802 |
| 5% 3/15/39 to 4/15/41 | | 2,196,512 | 2,360,946 |
| 6.5% 4/15/35 to 11/15/35 | | 78,593 | 88,733 |
| 7% 1/15/28 to 7/15/32 | | 963,301 | 1,089,392 |
| 7.5% 4/15/22 to 10/15/28 | | 220,200 | 245,629 |
| 8% 3/15/30 to 9/15/30 | | 14,277 | 16,811 |
| 8.5% 3/15/30 | | 1,301 | 1,338 |
| 3.5% 7/1/48 (g) | | 5,000,000 | 5,016,684 |
| 4.5% 7/1/48 (g) | | 6,950,000 | 7,222,867 |
| 4.5% 7/1/48 (g) | | 8,900,000 | 9,249,426 |
| 4.5% 7/1/48 (g) | | 300,000 | 311,778 |
| 4.5% 7/1/48 (g) | | 300,000 | 311,778 |
| 4.5% 7/1/48 (g) | | 6,950,000 | 7,222,867 |
| 4.5% 7/1/48 (g) | | 8,900,000 | 9,249,426 |
|
| TOTAL GINNIE MAE | | | 329,396,596 |
|
| TOTAL U.S. GOVERNMENT AGENCY - MORTGAGE SECURITIES | | | |
| (Cost $1,390,498,961) | | | 1,363,919,259 |
|
| Asset-Backed Securities - 0.8% | | | |
| AASET Trust Series 2018-1A Class A, 3.844% 1/16/38 (a) | | $4,652,661 | $4,617,549 |
| Airspeed Ltd. Series 2007-1A Class C1, 1 month U.S. LIBOR + 2.500% 4.5733% 6/15/32 (a)(b)(d)(h) | | 1,714,995 | 1,039,865 |
| Blackbird Capital Aircraft Series 2016-1A: | | | |
| Class A, 4.213% 12/16/41 (a) | | 8,957,812 | 8,995,238 |
| Class AA, 2.487% 12/16/41 (a) | | 2,085,271 | 2,029,613 |
| Capital Auto Receivables Asset Trust Series 2016-1 Class A3, 1.73% 4/20/20 | | 1,741,088 | 1,737,894 |
| Castlelake Aircraft Structured Trust Series 2018-1 Class A, 0% 6/15/43 (a) | | 7,419,000 | 7,453,122 |
| Countrywide Home Loans, Inc.: | | | |
| Series 2003-BC1 Class B1, 1 month U.S. LIBOR + 5.250% 4.568% 3/25/32 (b)(d) | | 11,075 | 11,525 |
| Series 2004-7 Class AF5, 5.868% 1/25/35 | | 272,705 | 274,651 |
| DB Master Finance LLC: | | | |
| Series 2015-1A Class A2II, 3.98% 2/20/45 (a) | | 9,968,153 | 9,993,970 |
| Series 2017-1A: | | | |
| Class A2I, 3.629% 11/20/47 (a) | | 3,543,195 | 3,461,924 |
| Class A2II, 4.03% 11/20/47 (a) | | 5,997,860 | 5,947,271 |
| First Franklin Mortgage Loan Trust Series 2004-FF2 Class M3, 1 month U.S. LIBOR + 0.825% 2.9161% 3/25/34 (b)(d) | | 616 | 561 |
| New Century Home Equity Loan Trust Series 2005-4 Class M2, 1 month U.S. LIBOR + 0.510% 2.6011% 9/25/35 (b)(d) | | 481,249 | 479,838 |
| Park Place Securities, Inc. Series 2005-WCH1 Class M4, 1 month U.S. LIBOR + 1.245% 3.3361% 1/25/36 (b)(d) | | 520,000 | 522,093 |
| Terwin Mortgage Trust Series 2003-4HE Class A1, 1 month U.S. LIBOR + 0.860% 2.9511% 9/25/34 (b)(d) | | 10,148 | 10,027 |
| TOTAL ASSET-BACKED SECURITIES | | | |
| (Cost $47,194,674) | | | 46,575,141 |
|
| Collateralized Mortgage Obligations - 0.2% | | | |
| Private Sponsor - 0.0% | | | |
| Bear Stearns ALT-A Trust floater Series 2005-1 Class A1, 1 month U.S. LIBOR + 0.560% 2.6511% 1/25/35 (b)(d) | | 119,248 | 119,621 |
| Merrill Lynch Alternative Note Asset Trust floater Series 2007-OAR1 Class A1, 1 month U.S. LIBOR + 0.170% 2.1297% 2/25/37 (b)(d) | | 72,798 | 71,721 |
| Opteum Mortgage Acceptance Corp. floater Series 2005-3 Class APT, 1 month U.S. LIBOR + 0.290% 2.3811% 7/25/35 (b)(d) | | 105,394 | 104,483 |
| Sequoia Mortgage Trust floater Series 2004-6 Class A3B, 6 month U.S. LIBOR + 0.880% 2.6617% 7/20/34 (b)(d) | | 5,249 | 5,200 |
|
| TOTAL PRIVATE SPONSOR | | | 301,025 |
|
| U.S. Government Agency - 0.2% | | | |
| Fannie Mae planned amortization class: | | | |
| Series 1999-54 Class PH, 6.5% 11/18/29 | | 246,046 | 255,722 |
| Series 1999-57 Class PH, 6.5% 12/25/29 | | 275,594 | 303,573 |
| Ginnie Mae guaranteed REMIC pass-thru certificates: | | | |
| sequential payer Series 2013-H06 Class HA, 1.65% 1/20/63 (i) | | 3,440,091 | 3,393,142 |
| Series 2007-35 Class SC, 40.200% - 1 month U.S. LIBOR 27.6896% 6/16/37 (b)(j) | | 27,892 | 44,942 |
| Series 2015-H21 Class JA, 2.5% 6/20/65 (i) | | 3,835,808 | 3,817,008 |
|
| TOTAL U.S. GOVERNMENT AGENCY | | | 7,814,387 |
|
| TOTAL COLLATERALIZED MORTGAGE OBLIGATIONS | | | |
| (Cost $8,068,000) | | | 8,115,412 |
|
| Commercial Mortgage Securities - 0.5% | | | |
| Bayview Commercial Asset Trust floater: | | | |
| Series 2005-4A: | | | |
| Class A2, 1 month U.S. LIBOR + 0.390% 2.4811% 1/25/36 (a)(b)(d) | | 277,324 | 260,235 |
| Class M1, 1 month U.S. LIBOR + 0.450% 2.5411% 1/25/36 (a)(b)(d) | | 58,026 | 54,089 |
| Class M2, 1 month U.S. LIBOR + 0.470% 2.5611% 1/25/36 (a)(b)(d) | | 17,505 | 16,184 |
| Class M3, 1 month U.S. LIBOR + 0.500% 2.5911% 1/25/36 (a)(b)(d) | | 25,447 | 23,321 |
| Series 2007-1 Class A2, 1 month U.S. LIBOR + 0.270% 2.3611% 3/25/37 (a)(b)(d) | | 73,352 | 68,153 |
| Series 2007-2A: | | | |
| Class A1, 1 month U.S. LIBOR + 0.270% 2.3611% 7/25/37 (a)(b)(d) | | 79,094 | 77,793 |
| Class A2, 1 month U.S. LIBOR + 0.320% 2.4111% 7/25/37 (a)(b)(d) | | 74,032 | 72,346 |
| Class M2, 1 month U.S. LIBOR + 0.410% 2.5011% 7/25/37 (a)(b)(d) | | 41,129 | 35,605 |
| Class M3, 1 month U.S. LIBOR + 0.490% 2.5811% 7/25/37 (a)(b)(d) | | 33,226 | 26,336 |
| Series 2007-3: | | | |
| Class A2, 1 month U.S. LIBOR + 0.290% 2.3811% 7/25/37 (a)(b)(d) | | 106,997 | 100,070 |
| Class M1, 1 month U.S. LIBOR + 0.310% 2.4011% 7/25/37 (a)(b)(d) | | 43,833 | 40,357 |
| Class M2, 1 month U.S. LIBOR + 0.340% 2.4311% 7/25/37 (a)(b)(d) | | 46,081 | 41,534 |
| Class M3, 1 month U.S. LIBOR + 0.370% 2.4611% 7/25/37 (a)(b)(d) | | 100,703 | 86,945 |
| Class M4, 1 month U.S. LIBOR + 0.500% 2.5911% 7/25/37 (a)(b)(d) | | 159,147 | 133,325 |
| Class M5, 1 month U.S. LIBOR + 0.600% 2.6911% 7/25/37 (a)(b)(d) | | 44,280 | 42,340 |
| CGBAM Commercial Mortgage Trust Series 2015-SMRT Class D, 3.768% 4/10/28 (a) | | 2,236,000 | 2,227,088 |
| GAHR Commercial Mortgage Trust Series 2015-NRF: | | | |
| Class BFX, 3.4949% 12/15/34 (a)(b) | | 4,550,000 | 4,548,546 |
| Class CFX, 3.4949% 12/15/34 (a)(b) | | 3,823,000 | 3,811,058 |
| Class DFX, 3.4949% 12/15/34 (a)(b) | | 3,240,000 | 3,220,828 |
| MSCG Trust Series 2016-SNR: | | | |
| Class A, 3.4596% 11/15/34 (a)(b) | | 4,846,556 | 4,765,018 |
| Class B, 4.181% 11/15/34 (a) | | 1,710,864 | 1,679,896 |
| Class C, 5.205% 11/15/34 (a) | | 1,199,387 | 1,194,211 |
| Providence Place Group Ltd. Partnership Series 2000-C1 Class A2, 7.75% 7/20/28 (a) | | 4,117,169 | 5,022,946 |
| TOTAL COMMERCIAL MORTGAGE SECURITIES | | | |
| (Cost $27,133,368) | | | 27,548,224 |
|
| Municipal Securities - 1.7% | | | |
| California Gen. Oblig.: | | | |
| Series 2009, 7.35% 11/1/39 | | $805,000 | $1,145,893 |
| 6.65% 3/1/22 | | 4,360,000 | 4,820,678 |
| 7.5% 4/1/34 | | 5,055,000 | 7,099,697 |
| 7.55% 4/1/39 | | 6,085,000 | 8,973,184 |
| Chicago Gen. Oblig. (Taxable Proj.): | | | |
| Series 2008 B, 5.63% 1/1/22 | | 880,000 | 889,962 |
| Series 2010 C1, 7.781% 1/1/35 | | 10,090,000 | 11,604,913 |
| Series 2012 B, 5.432% 1/1/42 | | 1,205,000 | 1,120,445 |
| Illinois Gen. Oblig.: | | | |
| Series 2003: | | | |
| 4.95% 6/1/23 | | 4,950,000 | 5,036,378 |
| 5.1% 6/1/33 | | 4,805,000 | 4,547,260 |
| Series 2010-1, 6.63% 2/1/35 | | 12,290,000 | 13,022,607 |
| Series 2010-3: | | | |
| 5.547% 4/1/19 | | 120,000 | 121,927 |
| 6.725% 4/1/35 | | 9,480,000 | 10,105,680 |
| 7.35% 7/1/35 | | 5,540,000 | 6,186,019 |
| Series 2010-5, 6.2% 7/1/21 | | 1,808,000 | 1,867,628 |
| Series 2011, 5.877% 3/1/19 | | 14,325,000 | 14,578,839 |
| Series 2013, 3.14% 12/1/18 | | 1,270,000 | 1,269,835 |
| TOTAL MUNICIPAL SECURITIES | | | |
| (Cost $91,751,734) | | | 92,390,945 |
|
| Bank Notes - 0.7% | | | |
| Capital One NA 2.95% 7/23/21 | | 5,645,000 | 5,543,876 |
| Discover Bank: | | | |
| (Delaware) 3.2% 8/9/21 | | 6,841,000 | 6,762,564 |
| 3.1% 6/4/20 | | 6,380,000 | 6,346,960 |
| 8.7% 11/18/19 | | 1,503,000 | 1,602,178 |
| KeyBank NA: | | | |
| 2.25% 3/16/20 | | 9,000,000 | 8,880,121 |
| 6.95% 2/1/28 | | 800,000 | 949,915 |
| PNC Bank NA 2.3% 6/1/20 | | 1,450,000 | 1,427,946 |
| RBS Citizens NA 2.5% 3/14/19 | | 2,751,000 | 2,744,783 |
| Synchrony Bank 3.65% 5/24/21 | | 4,766,000 | 4,768,403 |
| TOTAL BANK NOTES | | | |
| (Cost $39,110,899) | | | 39,026,746 |
| | | Shares | Value |
|
| Money Market Funds - 1.8% | | | |
| Fidelity Cash Central Fund, 1.93% (k) | | | |
| (Cost $97,460,989) | | 97,449,701 | 97,469,191 |
| TOTAL INVESTMENT IN SECURITIES - 103.5% | | | |
| (Cost $5,792,428,739) | | | 5,689,719,515 |
| NET OTHER ASSETS (LIABILITIES) - (3.5)% | | | (194,586,086) |
| NET ASSETS - 100% | | | $5,495,133,429 |
| TBA Sale Commitments | | |
| | Principal Amount | Value |
| Fannie Mae | | |
| 3.5% 7/1/33 | $(5,600,000) | $(5,665,773) |
| 4.5% 7/1/48 | (15,100,000) | (15,721,931) |
| 4.5% 7/1/48 | (15,100,000) | (15,721,931) |
| 4.5% 7/1/48 | (34,500,000) | (35,920,969) |
| 4.5% 7/1/48 | (550,000) | (572,653) |
|
| TOTAL FANNIE MAE | | (73,603,257) |
|
| Freddie Mac | | |
| 3% 7/1/48 | (5,350,000) | (5,176,818) |
| Ginnie Mae | | |
| 4.5% 7/1/48 | (16,150,000) | (16,784,072) |
| 4.5% 7/1/48 | (300,000) | (311,778) |
| 4.5% 7/1/48 | (6,950,000) | (7,222,867) |
| 4.5% 7/1/48 | (8,900,000) | (9,249,426) |
|
| TOTAL GINNIE MAE | | (33,568,143) |
|
| TOTAL TBA SALE COMMITMENTS | | |
| (Proceeds $112,183,369) | | $(112,348,218) |
Swaps
| Underlying Reference | Rating(1) | Maturity Date | Clearinghouse / Counterparty | Fixed Payment Received/(Paid) | Payment Frequency | Notional Amount(2) | Value(1) | Upfront Premium Received/(Paid) | Unrealized Appreciation/(Depreciation) |
| Credit Default Swaps | | | | | | | | | |
| Sell Protection | | | | | | | | | |
| Ameriquest Mortgage Securities Inc Series 2004-R11 Class M9 | C | Dec. 2034 | Bank of America | 4.25% | Monthly | $64,579 | $(61,551) | $0 | $(61,551) |
(1) Ratings are presented for credit default swaps in which the Fund has sold protection on the underlying referenced debt. Ratings for an underlying index represent a weighted average of the ratings of all securities included in the index. The credit rating or value can be measures of the current payment/performance risk. Ratings are from Moody's Investors Service, Inc. Where Moody's® ratings are not available, S&P® ratings are disclosed and are indicated as such. All ratings are as of the report date and do not reflect subsequent changes.
(2) The notional amount of each credit default swap where the Fund has sold protection approximates the maximum potential amount of future payments that the Fund could be required to make if a credit event were to occur.
Legend
(a) Security exempt from registration under Rule 144A of the Securities Act of 1933. These securities may be resold in transactions exempt from registration, normally to qualified institutional buyers. At the end of the period, the value of these securities amounted to $196,011,105 or 3.6% of net assets.
(b) Coupon rates for floating and adjustable rate securities reflect the rates in effect at period end.
(c) Non-income producing - Security is in default.
(d) Coupon is indexed to a floating interest rate which may be multiplied by a specified factor and/or subject to caps or floors.
(e) Security or a portion of the security has been segregated as collateral for open bi-lateral over-the-counter (OTC) swaps. At period end, the value of securities pledged amounted to $91,274.
(f) Security or a portion of the security has been segregated as collateral for mortgage-backed or asset-backed securities purchased on a delayed delivery or when-issued basis. At period end, the value of securities pledged amounted to $36,108.
(g) Security or a portion of the security purchased on a delayed delivery or when-issued basis.
(h) Level 3 security
(i) Represents an investment in an underlying pool of reverse mortgages which typically do not require regular principal and interest payments as repayment is deferred until a maturity event.
(j) Coupon is inversely indexed to a floating interest rate multiplied by a specified factor. The price may be considerably more volatile than the price of a comparable fixed rate security.
(k) Affiliated fund that is generally available only to investment companies and other accounts managed by Fidelity Investments. The rate quoted is the annualized seven-day yield of the fund at period end. A complete unaudited listing of the fund's holdings as of its most recent quarter end is available upon request. In addition, each Fidelity Central Fund's financial statements are available on the SEC's website or upon request.
Affiliated Central Funds
Information regarding fiscal year to date income earned by the Fund from investments in Fidelity Central Funds is as follows:
| Fund | Income earned |
| Fidelity Cash Central Fund | $1,134,651 |
| Total | $1,134,651 |
Amounts in the income column in the above table include any capital gain distributions from underlying funds, which are presented in the corresponding line-item in the Statement of Operations if applicable.
Investment Valuation
The following is a summary of the inputs used, as of June 30, 2018, involving the Fund's assets and liabilities carried at fair value. The inputs or methodology used for valuing securities may not be an indication of the risk associated with investing in those securities. For more information on valuation inputs, and their aggregation into the levels used below, please refer to the Investment Valuation section in the accompanying Notes to Financial Statements.
| | Valuation Inputs at Reporting Date: |
| Description | Total | Level 1 | Level 2 | Level 3 |
| Investments in Securities: | | | | |
| Corporate Bonds | $1,682,937,192 | $-- | $1,682,937,192 | $-- |
| U.S. Government and Government Agency Obligations | 2,331,737,405 | -- | 2,331,737,405 | -- |
| U.S. Government Agency - Mortgage Securities | 1,363,919,259 | -- | 1,363,919,259 | -- |
| Asset-Backed Securities | 46,575,141 | -- | 45,535,276 | 1,039,865 |
| Collateralized Mortgage Obligations | 8,115,412 | -- | 8,115,412 | -- |
| Commercial Mortgage Securities | 27,548,224 | -- | 27,548,224 | -- |
| Municipal Securities | 92,390,945 | -- | 92,390,945 | -- |
| Bank Notes | 39,026,746 | -- | 39,026,746 | -- |
| Money Market Funds | 97,469,191 | 97,469,191 | -- | -- |
| Total Investments in Securities: | $5,689,719,515 | $97,469,191 | $5,591,210,459 | $1,039,865 |
| Derivative Instruments: | | | | |
| Liabilities | | | | |
| Swaps | $(61,551) | $-- | $(61,551) | $-- |
| Total Liabilities | $(61,551) | $-- | $(61,551) | $-- |
| Total Derivative Instruments: | $(61,551) | $-- | $(61,551) | $-- |
| Other Financial Instruments: | | | | |
| TBA Sale Commitments | $(112,348,218) | $-- | $(112,348,218) | $-- |
| Total Other Financial Instruments: | $(112,348,218) | $-- | $(112,348,218) | $-- |
Value of Derivative Instruments
The following table is a summary of the Fund's value of derivative instruments by primary risk exposure as of June 30, 2018. For additional information on derivative instruments, please refer to the Derivative Instruments section in the accompanying Notes to Financial Statements.
| Primary Risk Exposure / Derivative Type | Value |
| | Asset | Liability |
| Credit Risk | | |
| Swaps(a) | $0 | $(61,551) |
| Total Credit Risk | 0 | (61,551) |
| Total Value of Derivatives | $0 | $(61,551) |
(a) For bi-lateral over-the-counter (OTC) swaps, reflects gross value which is presented in the Statement of Assets and Liabilities in the bi-lateral OTC swaps, at value line-items.
See accompanying notes which are an integral part of the financial statements.
Fidelity® VIP Investment Grade Central Fund
Financial Statements
Statement of Assets and Liabilities
| | | June 30, 2018 (Unaudited) |
| Assets | | |
Investment in securities, at value — See accompanying schedule:
Unaffiliated issuers (cost $5,694,967,750) | $5,592,250,324 | |
| Fidelity Central Funds (cost $97,460,989) | 97,469,191 | |
| Total Investment in Securities (cost $5,792,428,739) | | $5,689,719,515 |
| Cash | | 177,399 |
| Receivable for investments sold | | 65,830,567 |
| Receivable for TBA sale commitments | | 112,183,369 |
| Interest receivable | | 38,734,074 |
| Distributions receivable from Fidelity Central Funds | | 194,928 |
| Total assets | | 5,906,839,852 |
| Liabilities | | |
| Payable for investments purchased | | |
| Regular delivery | $14,934,411 | |
| Delayed delivery | 218,704,547 | |
| TBA sale commitments, at value | 112,348,218 | |
| Payable for fund shares redeemed | 65,192,313 | |
| Distributions payable | 429,023 | |
| Bi-lateral OTC swaps, at value | 61,551 | |
| Other payables and accrued expenses | 36,360 | |
| Total liabilities | | 411,706,423 |
| Net Assets | | $5,495,133,429 |
| Net Assets consist of: | | |
| Paid in capital | | $5,601,899,868 |
| Undistributed net investment income | | 11,340,234 |
| Accumulated undistributed net realized gain (loss) on investments | | (15,171,049) |
| Net unrealized appreciation (depreciation) on investments | | (102,935,624) |
| Net Assets, for 53,605,550 shares outstanding | | $5,495,133,429 |
| Net Asset Value, offering price and redemption price per share ($5,495,133,429 ÷ 53,605,550 shares) | | $102.51 |
See accompanying notes which are an integral part of the financial statements.
Statement of Operations
| | | Six months ended June 30, 2018 (Unaudited) |
| Investment Income | | |
| Interest | | $83,242,194 |
| Income from Fidelity Central Funds | | 1,134,651 |
| Total income | | 84,376,845 |
| Expenses | | |
| Custodian fees and expenses | $43,872 | |
| Independent trustees' fees and expenses | 12,038 | |
| Total expenses before reductions | 55,910 | |
| Expense reductions | (1,229) | |
| Total expenses after reductions | | 54,681 |
| Net investment income (loss) | | 84,322,164 |
| Realized and Unrealized Gain (Loss) | | |
| Net realized gain (loss) on: | | |
| Investment securities: | | |
| Unaffiliated issuers | (7,363,166) | |
| Fidelity Central Funds | 5,477 | |
| Swaps | 370 | |
| Total net realized gain (loss) | | (7,357,319) |
| Change in net unrealized appreciation (depreciation) on: | | |
| Investment securities: | | |
| Unaffiliated issuers | (149,057,183) | |
| Fidelity Central Funds | (5,477) | |
| Swaps | 1,075 | |
| Delayed delivery commitments | (168,459) | |
| Total change in net unrealized appreciation (depreciation) | | (149,230,044) |
| Net gain (loss) | | (156,587,363) |
| Net increase (decrease) in net assets resulting from operations | | $(72,265,199) |
See accompanying notes which are an integral part of the financial statements.
Statement of Changes in Net Assets
| | Six months ended June 30, 2018 (Unaudited) | Year ended December 31, 2017 |
| Increase (Decrease) in Net Assets | | |
| Operations | | |
| Net investment income (loss) | $84,322,164 | $145,158,781 |
| Net realized gain (loss) | (7,357,319) | 14,111,135 |
| Change in net unrealized appreciation (depreciation) | (149,230,044) | 68,053,550 |
| Net increase (decrease) in net assets resulting from operations | (72,265,199) | 227,323,466 |
| Distributions to shareholders from net investment income | (75,954,637) | (150,350,808) |
| Distributions to shareholders from net realized gain | – | (24,485,599) |
| Total distributions | (75,954,637) | (174,836,407) |
| Share transactions | | |
| Proceeds from sales of shares | 143,572,012 | 633,714,833 |
| Reinvestment of distributions | 76,368,638 | 174,366,683 |
| Cost of shares redeemed | (181,669,624) | (120,993,297) |
| Net increase (decrease) in net assets resulting from share transactions | 38,271,026 | 687,088,219 |
| Total increase (decrease) in net assets | (109,948,810) | 739,575,278 |
| Net Assets | | |
| Beginning of period | 5,605,082,239 | 4,865,506,961 |
| End of period | $5,495,133,429 | $5,605,082,239 |
| Other Information | | |
| Undistributed net investment income end of period | $11,340,234 | $2,972,707 |
| Shares | | |
| Sold | 1,385,636 | 6,036,399 |
| Issued in reinvestment of distributions | 742,078 | 1,661,013 |
| Redeemed | (1,771,248) | (1,149,806) |
| Net increase (decrease) | 356,466 | 6,547,606 |
See accompanying notes which are an integral part of the financial statements.
Fidelity VIP Investment Grade Central Fund
| | Six months ended (Unaudited) June 30, | Years endedDecember 31, | | | | |
| | 2018 | 2017 | 2016 | 2015 | 2014 | 2013 |
| Selected Per–Share Data | | | | | | |
| Net asset value, beginning of period | $105.26 | $104.18 | $103.71 | $106.70 | $103.29 | $108.89 |
| Income from Investment Operations | | | | | | |
| Net investment income (loss)A | 1.559 | 2.887 | 3.167 | 3.292 | 3.178 | 2.829 |
| Net realized and unrealized gain (loss) | (2.897) | 1.693 | 1.659 | (3.071) | 3.336 | (4.398) |
| Total from investment operations | (1.338) | 4.580 | 4.826 | .221 | 6.514 | (1.569) |
| Distributions from net investment income | (1.412) | (2.985) | (3.096) | (3.137) | (3.104) | (2.826) |
| Distributions from net realized gain | – | (.515) | (1.260) | (.074) | – | (1.205) |
| Total distributions | (1.412) | (3.500) | (4.356) | (3.211) | (3.104) | (4.031) |
| Net asset value, end of period | $102.51 | $105.26 | $104.18 | $103.71 | $106.70 | $103.29 |
| Total ReturnB,C | (1.27)% | 4.46% | 4.70% | .18% | 6.37% | (1.46)% |
| Ratios to Average Net AssetsD,E | | | | | | |
| Expenses before reductionsF | - %G | -% | -% | -% | -% | -% |
| Expenses net of fee waivers, if anyF | - %G | -% | -% | -% | -% | -% |
| Expenses net of all reductionsF | - %G | -% | -% | -% | -% | -% |
| Net investment income (loss) | 3.06%G | 2.75% | 3.00% | 3.11% | 3.01% | 2.68% |
| Supplemental Data | | | | | | |
| Net assets, end of period (000 omitted) | $5,495,133 | $5,605,082 | $4,865,507 | $4,611,536 | $4,393,843 | $3,945,749 |
| Portfolio turnover rateH | 95%G | 110% | 162% | 248% | 151% | 333% |
A Calculated based on average shares outstanding during the period.
B Total returns for periods of less than one year are not annualized.
C Total returns would have been lower if certain expenses had not been reduced during the applicable periods shown.
D Fees and expenses of any underlying Fidelity Central Funds are not included in the Fund's expense ratio. The Fund indirectly bears its proportionate share of the expenses of any underlying Fidelity Central Funds.
E Expense ratios reflect operating expenses of the Fund. Expenses before reductions do not reflect amounts reimbursed by the investment adviser or reductions from expense offset arrangements and do not represent the amount paid by the Fund during periods when reimbursements or reductions occur. Expenses net of fee waivers reflect expenses after reimbursement by the investment adviser but prior to reductions from expense offset arrangements. Expenses net of all reductions represent the net expenses paid by the Fund.
F Amount represents less than .005%.
G Annualized
H Amount does not include the portfolio activity of any underlying Fidelity Central Funds.
See accompanying notes which are an integral part of the financial statements.
Notes to Financial Statements (Unaudited)
For the period ended June 30, 2018
1. Organization.
Fidelity VIP Investment Grade Central Fund (the Fund) is a fund of Fidelity Garrison Street Trust (the Trust) and is authorized to issue an unlimited number of shares. Shares of the Fund are only offered to other investment companies and accounts managed by Fidelity Management & Research Company (FMR), or its affiliates (the Investing Funds). The Trust is registered under the Investment Company Act of 1940, as amended (the 1940 Act), as an open-end management investment company organized as a Massachusetts business trust.
2. Investments in Fidelity Central Funds.
The Fund invests in Fidelity Central Funds, which are open-end investment companies generally available only to other investment companies and accounts managed by the investment adviser and its affiliates. The Fund's Schedule of Investments lists each of the Fidelity Central Funds held as of period end, if any, as an investment of the Fund, but does not include the underlying holdings of each Fidelity Central Fund. As an Investing Fund, the Fund indirectly bears its proportionate share of the expenses of the underlying Fidelity Central Funds.
The Money Market Central Funds seek preservation of capital and current income and are managed by Fidelity Investments Money Management, Inc. (FIMM), an affiliate of the investment adviser. Annualized expenses of the Money Market Central Funds as of their most recent shareholder report date are less than .005%.
A complete unaudited list of holdings for each Fidelity Central Fund is available upon request or at the Securities and Exchange Commission (the SEC) website at www.sec.gov. In addition, the financial statements of the Fidelity Central Funds are available on the SEC website or upon request.
3. Significant Accounting Policies.
The Fund is an investment company and applies the accounting and reporting guidance of the Financial Accounting Standards Board (FASB) Accounting Standards Codification Topic 946 Financial Services – Investments Companies. The financial statements have been prepared in conformity with accounting principles generally accepted in the United States of America (GAAP), which require management to make certain estimates and assumptions at the date of the financial statements. Actual results could differ from those estimates. Subsequent events, if any, through the date that the financial statements were issued have been evaluated in the preparation of the financial statements. The following summarizes the significant accounting policies of the Fund:
Investment Valuation. Investments are valued as of 4:00 p.m. Eastern time on the last calendar day of the period. The Board of Trustees (the Board) has delegated the day to day responsibility for the valuation of the Fund's investments to the Fair Value Committee (the Committee) established by the Fund's investment adviser. In accordance with valuation policies and procedures approved by the Board, the Fund attempts to obtain prices from one or more third party pricing vendors or brokers to value its investments. When current market prices, quotations or currency exchange rates are not readily available or reliable, investments will be fair valued in good faith by the Committee, in accordance with procedures adopted by the Board. Factors used in determining fair value vary by investment type and may include market or investment specific events, changes in interest rates and credit quality. The frequency with which these procedures are used cannot be predicted and they may be utilized to a significant extent. The Committee oversees the Fund's valuation policies and procedures and reports to the Board on the Committee's activities and fair value determinations. The Board monitors the appropriateness of the procedures used in valuing the Fund's investments and ratifies the fair value determinations of the Committee.
The Fund categorizes the inputs to valuation techniques used to value its investments into a disclosure hierarchy consisting of three levels as shown below:
- Level 1 – quoted prices in active markets for identical investments
- Level 2 – other significant observable inputs (including quoted prices for similar investments, interest rates, prepayment speeds, etc.)
- Level 3 – unobservable inputs (including the Fund's own assumptions based on the best information available)
Valuation techniques used to value the Fund's investments by major category are as follows:
Debt securities, including restricted securities, are valued based on evaluated prices received from third party pricing vendors or from brokers who make markets in such securities. Corporate bonds, bank notes, municipal securities, and U.S. government and government agency obligations are valued by pricing vendors who utilize matrix pricing which considers yield or price of bonds of comparable quality, coupon, maturity and type or by broker-supplied prices. Asset backed securities, collateralized mortgage obligations, commercial mortgage securities, and U.S. government agency mortgage securities are valued by pricing vendors who utilize matrix pricing which considers prepayment speed assumptions, attributes of the collateral, yield or price of bonds of comparable quality, coupon, maturity and type or by broker-supplied prices. Brokers which make markets in asset backed securities, collateralized mortgage obligations and commercial mortgage securities may also consider such factors as the structure of the issue, cash flow assumptions, the value of underlying assets as well as any guarantees. Swaps are marked-to-market daily based on valuations from third party pricing vendors, registered derivatives clearing organizations (clearinghouses) or broker-supplied valuations. These pricing sources may utilize inputs such as interest rate curves, credit spread curves, default possibilities and recovery rates. When independent prices are unavailable or unreliable, debt securities and swaps may be valued utilizing pricing methodologies which consider similar factors that would be used by third party pricing vendors. Debt securities and swaps are generally categorized as Level 2 in the hierarchy but may be Level 3 depending on the circumstances.
Investments in open-end mutual funds, including the Fidelity Central Funds, are valued at their closing net asset value (NAV) each business day and are categorized as Level 1 in the hierarchy.
Changes in valuation techniques may result in transfers in or out of an assigned level within the disclosure hierarchy. The aggregate value of investments by input level as of June 30, 2018 is included at the end of the Fund's Schedule of Investments.
Investment Transactions and Income. For financial reporting purposes, the Fund's investment holdings and NAV include trades executed through the end of the last business day of the period. The NAV per share for processing shareholder transactions is calculated as of the close of business of the New York Stock Exchange (NYSE), normally 4:00 p.m. Eastern time and includes trades executed through the end of the prior business day. Gains and losses on securities sold are determined on the basis of identified cost and include proceeds received from litigation. Income and capital gain distributions from Fidelity Central Funds, if any, are recorded on the ex-dividend date. Interest income is accrued as earned and includes coupon interest and amortization of premium and accretion of discount on debt securities as applicable. The principal amount on inflation-indexed securities is periodically adjusted to the rate of inflation and interest is accrued based on the principal amount. The adjustments to principal due to inflation are reflected as increases or decreases to Interest in the accompanying Statement of Operations. Debt obligations may be placed on non-accrual status and related interest income may be reduced by ceasing current accruals and writing off interest receivables when the collection of all or a portion of interest has become doubtful based on consistently applied procedures. A debt obligation is removed from non-accrual status when the issuer resumes interest payments or when collectability of interest is reasonably assured.
Expenses. Expenses directly attributable to a fund are charged to that fund. Expenses attributable to more than one fund are allocated among the respective funds on the basis of relative net assets or other appropriate methods. Expense estimates are accrued in the period to which they relate and adjustments are made when actual amounts are known.
Income Tax Information and Distributions to Shareholders. Each year, the Fund intends to qualify as a regulated investment company under Subchapter M of the Internal Revenue Code, including distributing substantially all of its taxable income and realized gains. As a result, no provision for U.S. Federal income taxes is required. The Fund files a U.S. federal tax return, in addition to state and local tax returns as required. The Fund's federal income tax returns are subject to examination by the Internal Revenue Service (IRS) for a period of three fiscal years after they are filed. State and local tax returns may be subject to examination for an additional fiscal year depending on the jurisdiction.
Distributions are declared and recorded daily and paid monthly from net investment income. Distributions from realized gains, if any, are declared and recorded on the ex-dividend date. Income and capital gain distributions are determined in accordance with income tax regulations, which may differ from GAAP.
Capital accounts within the financial statements are adjusted for permanent book-tax differences. These adjustments have no impact on net assets or the results of operations. Capital accounts are not adjusted for temporary book-tax differences which will reverse in a subsequent period.
Book-tax differences are primarily due to futures contracts, swaps, market discount, capital loss carryforwards, and losses deferred due to wash sales and excise tax regulations.
As of period end, the cost and unrealized appreciation (depreciation) in securities, and derivatives if applicable, for federal income tax purposes were as follows:
| Gross unrealized appreciation | $29,608,294 |
| Gross unrealized depreciation | (132,529,438) |
| Net unrealized appreciation (depreciation) | $(102,921,144) |
| Tax cost | $5,792,414,259 |
Capital loss carryforwards are only available to offset future capital gains of the Fund to the extent provided by regulations and may be limited. Under the Regulated Investment Company Modernization Act of 2010 (the Act), the Fund is permitted to carry forward capital losses incurred in taxable years beginning after December 22, 2010 for an unlimited period and such capital losses are required to be used prior to any losses that expire. The capital loss carryforward information presented below, including any applicable limitation, is estimated as of prior fiscal period end and is subject to adjustment.
| No expiration | |
| Short-term | $(7,002,906) |
| Total no expiration | $(7,002,906) |
Delayed Delivery Transactions and When-Issued Securities. During the period, the Fund transacted in securities on a delayed delivery or when-issued basis. Payment and delivery may take place after the customary settlement period for that security. The price of the underlying securities and the date when the securities will be delivered and paid for are fixed at the time the transaction is negotiated. The securities purchased on a delayed delivery or when-issued basis are identified as such in the Fund's Schedule of Investments. The Fund may receive compensation for interest forgone in the purchase of a delayed delivery or when-issued security. With respect to purchase commitments, the Fund identifies securities as segregated in its records with a value at least equal to the amount of the commitment. Losses may arise due to changes in the value of the underlying securities or if the counterparty does not perform under the contract's terms, or if the issuer does not issue the securities due to political, economic, or other factors.
To-Be-Announced (TBA) Securities and Mortgage Dollar Rolls. During the period, the Fund transacted in TBA securities that involved buying or selling mortgage-backed securities (MBS) on a forward commitment basis. A TBA transaction typically does not designate the actual security to be delivered and only includes an approximate principal amount; however delivered securities must meet specified terms defined by industry guidelines, including issuer, rate and current principal amount outstanding on underlying mortgage pools. The Fund may enter into a TBA transaction with the intent to take possession of or deliver the underlying MBS, or the Fund may elect to extend the settlement by entering into either a mortgage or reverse mortgage dollar roll. Mortgage dollar rolls are transactions where a fund sells TBA securities and simultaneously agrees to repurchase MBS on a later date at a lower price and with the same counterparty. Reverse mortgage dollar rolls involve the purchase and simultaneous agreement to sell TBA securities on a later date at a lower price. Transactions in mortgage dollar rolls and reverse mortgage dollar rolls are accounted for as purchases and sales and may result in an increase to the Fund's portfolio turnover rate.
Purchases and sales of TBA securities involve risks similar to those discussed above for delayed delivery and when-issued securities. Also, if the counterparty in a mortgage dollar roll or a reverse mortgage dollar roll transaction files for bankruptcy or becomes insolvent, the Fund's right to repurchase or sell securities may be limited. Additionally, when a fund sells TBA securities without already owning or having the right to obtain the deliverable securities (an uncovered forward commitment to sell), it incurs a risk of loss because it could have to purchase the securities at a price that is higher than the price at which it sold them. A fund may be unable to purchase the deliverable securities if the corresponding market is illiquid.
TBA securities subject to a forward commitment to sell at period end are included at the end of the Fund's Schedule of Investments under the caption "TBA Sale Commitments." The proceeds and value of these commitments are reflected in the Fund's Statement of Assets and Liabilities as Receivable for TBA sale commitments and TBA sale commitments, at value, respectively.
Restricted Securities. The Fund may invest in securities that are subject to legal or contractual restrictions on resale. These securities generally may be resold in transactions exempt from registration or to the public if the securities are registered. Disposal of these securities may involve time-consuming negotiations and expense, and prompt sale at an acceptable price may be difficult. Information regarding restricted securities is included at the end of the Fund's Schedule of Investments.
New Accounting Pronouncement. In March 2017, the Financial Accounting Standards Board (FASB) issued an Accounting Standards Update (ASU), ASU 2017-08, which amends the amortization period for certain callable debt securities that are held at a premium. The amendment requires the premium to be amortized to the earliest call date. The amendments do not require an accounting change for securities held at a discount. The ASU is effective for annual periods beginning after December 15, 2018. Management is currently evaluating the potential impact of these changes to the financial statements.
4. Derivative Instruments.
Risk Exposures and the Use of Derivative Instruments. The Fund's investment objective allows the Fund to enter into various types of derivative contracts, including swaps. Derivatives are investments whose value is primarily derived from underlying assets, indices or reference rates and may be transacted on an exchange or over-the-counter (OTC). Derivatives may involve a future commitment to buy or sell a specified asset based on specified terms, to exchange future cash flows at periodic intervals based on a notional principal amount, or for one party to make one or more payments upon the occurrence of specified events in exchange for periodic payments from the other party.
The Fund used derivatives to increase returns, to gain exposure to certain types of assets and to manage exposure to certain risks as defined below. The success of any strategy involving derivatives depends on analysis of numerous economic factors, and if the strategies for investment do not work as intended, the Fund may not achieve its objectives.
The Fund's use of derivatives increased or decreased its exposure to the following risk:
| Credit Risk | Credit risk relates to the ability of the issuer of a financial instrument to make further principal or interest payments on an obligation or commitment that it has to the Fund. |
The Fund is also exposed to additional risks from investing in derivatives, such as liquidity risk and counterparty credit risk. Liquidity risk is the risk that the Fund will be unable to close out the derivative in the open market in a timely manner. Counterparty credit risk is the risk that the counterparty will not be able to fulfill its obligation to the Fund. Derivative counterparty credit risk is managed through formal evaluation of the creditworthiness of all potential counterparties. On certain OTC derivatives such as bi-lateral swaps, the Fund attempts to reduce its exposure to counterparty credit risk by entering into an International Swaps and Derivatives Association, Inc. (ISDA) Master Agreement with each of its counterparties. The ISDA Master Agreement gives the Fund the right to terminate all transactions traded under such agreement upon the deterioration in the credit quality of the counterparty beyond specified levels. The ISDA Master Agreement gives each party the right, upon an event of default by the other party or a termination of the agreement, to close out all transactions traded under such agreement and to net amounts owed under each transaction to one net payable by one party to the other. To mitigate counterparty credit risk on bi-lateral OTC derivatives, the Fund receives collateral in the form of cash or securities once the Fund's net unrealized appreciation on outstanding derivative contracts under an ISDA Master Agreement exceeds certain applicable thresholds, subject to certain minimum transfer provisions. The collateral received is held in segregated accounts with the Fund's custodian bank in accordance with the collateral agreements entered into between the Fund, the counterparty and the Fund's custodian bank. The Fund could experience delays and costs in gaining access to the collateral even though it is held by the Fund's custodian bank. The Fund's maximum risk of loss from counterparty credit risk related to bi-lateral OTC derivatives is generally the aggregate unrealized appreciation and unpaid counterparty payments in excess of any collateral pledged by the counterparty to the Fund. The Fund may be required to pledge collateral for the benefit of the counterparties on bi-lateral OTC derivatives in an amount not less than each counterparty's unrealized appreciation on outstanding derivative contracts, subject to certain minimum transfer provisions, and any such pledged collateral is identified in the Schedule of Investments.
Investing in derivatives may involve greater risks than investing in the underlying assets directly and, to varying degrees, may involve risk of loss in excess of any initial investment and collateral received and amounts recognized in the Statement of Assets and Liabilities. In addition, there may be the risk that the change in value of the derivative contract does not correspond to the change in value of the underlying instrument.
Net Realized Gain (Loss) and Change in Net Unrealized Appreciation (Depreciation) on Derivatives. The table below, which reflects the impacts of derivatives on the financial performance of the Fund, summarizes the net realized gain (loss) and change in net unrealized appreciation (depreciation) for derivatives during the period as presented in the Statement of Operations.
| Primary Risk Exposure / Derivative Type | Net Realized Gain (Loss) | Change in Net Unrealized Appreciation (Depreciation) |
| Credit Risk | | |
| Swaps | $370 | $1,075 |
| Total Credit Risk | $370 | $1,075 |
A summary of the value of derivatives by primary risk exposure as of period end is included at the end of the Schedule of Investments.
Swaps. A swap is a contract between two parties to exchange future cash flows at periodic intervals based on a notional principal amount. A bi-lateral OTC swap is a transaction between a fund and a dealer counterparty where cash flows are exchanged between the two parties for the life of the swap.
Bi-lateral OTC swaps are marked-to-market daily and changes in value are reflected in the Statement of Assets and Liabilities in the bi-lateral OTC swaps at value line items. Any upfront premiums paid or received upon entering a bi-lateral OTC swap to compensate for differences between stated terms of the swap and prevailing market conditions (e.g. credit spreads, interest rates or other factors) are recorded in net unrealized appreciation (depreciation) in the Statement of Assets and Liabilities and amortized to realized gain or (loss) ratably over the term of the swap. Any unamortized upfront premiums are presented in the Schedule of Investments.
Payments are exchanged at specified intervals, accrued daily commencing with the effective date of the contract and recorded as realized gain or (loss). Some swaps may be terminated prior to the effective date and realize a gain or loss upon termination. The net realized gain (loss) and change in net unrealized appreciation (depreciation) on swaps during the period is presented in the Statement of Operations.
Any open swaps at period end are included in the Schedule of Investments under the caption "Swaps" and are representative of volume of activity during the period.
Credit Default Swaps. Credit default swaps enable the Fund to buy or sell protection against specified credit events on a single-name issuer or a traded credit index. Under the terms of a credit default swap the buyer of protection (buyer) receives credit protection in exchange for making periodic payments to the seller of protection (seller) based on a fixed percentage applied to a notional principal amount. In return for these payments, the seller will be required to make a payment upon the occurrence of one or more specified credit events. The Fund enters into credit default swaps as a seller to gain credit exposure to an issuer and/or as a buyer to obtain a measure of protection against defaults of an issuer. Periodic payments are made over the life of the contract by the buyer provided that no credit event occurs.
For credit default swaps on most corporate and sovereign issuers, credit events include bankruptcy, failure to pay or repudiation/moratorium. For credit default swaps on corporate or sovereign issuers, the obligation that may be put to the seller is not limited to the specific reference obligation described in the Schedule of Investments. For credit default swaps on asset-backed securities, a credit event may be triggered by events such as failure to pay principal, maturity extension, rating downgrade or write-down. For credit default swaps on asset-backed securities, the reference obligation described represents the security that may be put to the seller. For credit default swaps on a traded credit index, a specified credit event may affect all or individual underlying securities included in the index.
As a seller, if an underlying credit event occurs, the Fund will pay a net settlement amount of cash equal to the notional amount of the swap less the recovery value of the reference obligation or underlying securities comprising an index. Only in the event of the industry's inability to value the underlying asset will the Fund be required to take delivery of the reference obligation or underlying securities comprising an index and pay an amount equal to the notional amount of the swap.
As a buyer, if an underlying credit event occurs, the Fund will receive a net settlement amount of cash equal to the notional amount of the swap less the recovery value of the reference obligation or underlying securities comprising an index. Only in the event of the industry's inability to value the underlying asset will the Fund be required to deliver the reference obligation or underlying securities comprising an index in exchange for payment of an amount equal to the notional amount of the swap.
Typically, the value of each credit default swap and credit rating disclosed for each reference obligation in the Schedule of Investments, where the Fund is the seller, can be used as measures of the current payment/performance risk of the swap. As the value of the swap changes as a positive or negative percentage of the total notional amount, the payment/performance risk may decrease or increase, respectively. In addition to these measures, the investment adviser monitors a variety of factors including cash flow assumptions, market activity and market sentiment as part of its ongoing process of assessing payment/performance risk.
5. Purchases and Sales of Investments.
Purchases and sales of securities, other than short-term securities and U.S. government securities, aggregated $278,394,944 and $275,064,547, respectively.
6. Fees and Other Transactions with Affiliates.
Management Fee and Expense Contract. Fidelity Investments Money Management, Inc. (the investment adviser), an affiliate of FMR, provides the Fund with investment management services. The Fund does not pay any fees for these services. Pursuant to the Fund's management contract with the investment adviser, FMR pays the investment adviser a portion of the management fees it receives from the Investing Funds. In addition, under an expense contract, FMR also pays all other expenses of the Fund, excluding custody fees, the compensation of the independent Trustees, and certain miscellaneous expenses such as proxy and shareholder meeting expenses.
Interfund Trades. The Fund may purchase from or sell securities to other Fidelity Funds under procedures adopted by the Board. The procedures have been designed to ensure these interfund trades are executed in accordance with Rule 17a-7 of the 1940 Act. Interfund trades are included within the respective purchases and sales amounts shown in the Purchases and Sales of Investments note.
7. Security Lending.
The Fund lends portfolio securities from time to time in order to earn additional income. On the settlement date of the loan, the Fund receives collateral (in the form of U.S. Treasury obligations, letters of credit and/or cash) against the loaned securities and maintains collateral in an amount not less than 100% of the market value of the loaned securities during the period of the loan. The market value of the loaned securities is determined at the close of business of the Fund and any additional required collateral is delivered to the Fund on the next business day. The Fund or borrower may terminate the loan at any time, and if the borrower defaults on its obligation to return the securities loaned because of insolvency or other reasons, the Fund may apply collateral received from the borrower against the obligation. The Fund may experience delays and costs in recovering the securities loaned. Any cash collateral received is maintained at the Fund's custodian and/or invested in cash equivalents. At period end, there were no security loans outstanding. Security lending income represents the income earned on investing cash collateral, less rebates paid to borrowers, plus any premium payments received for lending certain types of securities. Security lending income is presented in the Statement of Operations as a component of interest income. Total security lending income during the period amounted to $490.
8. Expense Reductions.
Through arrangements with the Fund's custodian, credits realized as a result of certain uninvested cash balances were used to reduce the Fund's expenses. During the period, these credits reduced the Fund's custody expenses by $1,229.
9. Other.
The Fund's organizational documents provide former and current trustees and officers with a limited indemnification against liabilities arising in connection with the performance of their duties to the Fund. In the normal course of business, the Fund may also enter into contracts that provide general indemnifications. The Fund's maximum exposure under these arrangements is unknown as this would be dependent on future claims that may be made against the Fund. The risk of material loss from such claims is considered remote.
At the end of the period, mutual funds managed by FMR or its affiliates were the owners of record of all of the outstanding shares of the Fund according to the following schedule.
| Fund | Ownership % |
| VIP Asset Manager Portfolio | 6.6% |
| VIP Asset Manager: Growth Portfolio | 0.7% |
| VIP Balanced Portfolio | 22.5% |
| VIP Investment Grade Bond Portfolio | 70.2% |
10. Credit Risk.
The Fund invests a portion of its assets in structured securities of issuers backed by commercial and residential mortgage loans, credit card receivables and automotive loans. The value and related income of these securities is sensitive to changes in economic conditions, including delinquencies and/or defaults.
Fidelity® VIP Investment Grade Central Fund
Shareholder Expense Example
As a shareholder of the Fund, you incur two types of costs: (1) transaction costs and (2) ongoing costs, including other Fund expenses. This Example is intended to help you understand your ongoing costs (in dollars) of investing in the Fund and to compare these costs with the ongoing costs of investing in other mutual funds.
The Example is based on an investment of $1,000 invested at the beginning of the period and held for the entire period (January 1, 2018 to June 30, 2018).
Actual Expenses
The first line of the accompanying table provides information about actual account values and actual expenses. You may use the information in this line, together with the amount you invested, to estimate the expenses that you paid over the period. Simply divide your account value by $1,000.00 (for example, an $8,600 account value divided by $1,000.00 = 8.6), then multiply the result by the number in the first line under the heading entitled "Expenses Paid During Period" to estimate the expenses you paid on your account during this period. In addition, the Fund, as a shareholder in the underlying Fidelity Central Funds, will indirectly bear its pro-rata share of the fees and expenses incurred by the underlying Fidelity Central Funds. These fees and expenses are not included in the Fund's annualized expense ratio used to calculate the expense estimate in the table below.
Hypothetical Example for Comparison Purposes
The second line of the accompanying table provides information about hypothetical account values and hypothetical expenses based on the Fund's actual expense ratio and an assumed rate of return of 5% per year before expenses, which is not the Fund's actual return. The hypothetical account values and expenses may not be used to estimate the actual ending account balance or expenses you paid for the period. You may use this information to compare the ongoing costs of investing in the Fund and other funds. To do so, compare this 5% hypothetical example with the 5% hypothetical examples that appear in the shareholder reports of the other funds. In addition, the Fund, as a shareholder in the underlying Fidelity Central Funds, will indirectly bear its pro-rata share of the fees and expenses incurred by the underlying Fidelity Central Funds. These fees and expenses are not included in the Fund's annualized expense ratio used to calculate the expense estimate in the table below.
Please note that the expenses shown in the table are meant to highlight your ongoing costs only and do not reflect any transaction costs. Therefore, the second line of the table is useful in comparing ongoing costs only, and will not help you determine the relative total costs of owning different funds.
| | Annualized Expense Ratio-A | Beginning
Account Value
January 1, 2018 | Ending
Account Value
June 30, 2018 | Expenses Paid
During Period-B
January 1, 2018
to June 30, 2018 |
| Actual | .0020% | $1,000.00 | $987.30 | $.01 |
| Hypothetical-C | | $1,000.00 | $1,024.78 | $.01 |
A Annualized expense ratio reflects expenses net of applicable fee waivers.
B Expenses are equal to the Fund's annualized expense ratio, multiplied by the average account value over the period, multiplied by 181/365 (to reflect the one-half year period).
C 5% return per year before expenses
VIPIGB-SANN-0818
1.705629.120
Fidelity® Variable Insurance Products: Asset Manager Portfolio
Semi-Annual Report June 30, 2018 |
|
Contents
To view a fund's proxy voting guidelines and proxy voting record for the 12-month period ended June 30, visit http://www.fidelity.com/proxyvotingresults or visit the Securities and Exchange Commission's (SEC) web site at http://www.sec.gov.
You may also call 1-877-208-0098 to request a free copy of the proxy voting guidelines.
Fidelity® Variable Insurance Products are separate account options which are purchased through a variable insurance contract.
Standard & Poor's, S&P and S&P 500 are registered service marks of The McGraw-Hill Companies, Inc. and have been licensed for use by Fidelity Distributors Corporation.
Other third-party marks appearing herein are the property of their respective owners.
All other marks appearing herein are registered or unregistered trademarks or service marks of FMR LLC or an affiliated company. © 2018 FMR LLC. All rights reserved.
This report and the financial statements contained herein are submitted for the general information of the shareholders of the Fund. This report is not authorized for distribution to prospective investors in the Fund unless preceded or accompanied by an effective prospectus.
A fund files its complete schedule of portfolio holdings with the SEC for the first and third quarters of each fiscal year on Form N-Q. Forms N-Q are available on the SEC’s web site at http://www.sec.gov. A fund's Forms N-Q may be reviewed and copied at the SEC’s Public Reference Room in Washington, DC. Information regarding the operation of the SEC's Public Reference Room may be obtained by calling 1-800-SEC-0330.
For a complete list of a fund's portfolio holdings, view the most recent holdings listing, semiannual report, or annual report on Fidelity's web site at http://www.fidelity.com, http://www.institutional.fidelity.com, or http://www.401k.com, as applicable.
NOT FDIC INSURED •MAY LOSE VALUE •NO BANK GUARANTEE
Neither the Fund nor Fidelity Distributors Corporation is a bank.
Investment Summary (Unaudited)
The information in the following tables is based on the combined investments of the Fund and its pro-rata share of the investments of Fidelity's Central Funds, other than the Commodity Strategy and Money Market Central Funds.
Top Five Stocks as of June 30, 2018
| | % of fund's net assets |
| Microsoft Corp. | 1.1 |
| Amazon.com, Inc. | 0.7 |
| NVIDIA Corp. | 0.5 |
| UnitedHealth Group, Inc. | 0.5 |
| Becton, Dickinson & Co. | 0.4 |
| | 3.2 |
Top Five Market Sectors as of June 30, 2018
| | % of fund's net assets |
| Financials | 13.6 |
| Information Technology | 10.0 |
| Consumer Discretionary | 7.4 |
| Health Care | 6.9 |
| Investment Companies | 5.8 |
Top Five Bond Issuers as of June 30, 2018
| (with maturities greater than one year) | % of fund's net assets |
| U.S. Treasury Obligations | 16.9 |
| Fannie Mae | 3.8 |
| Freddie Mac | 1.9 |
| Ginnie Mae | 1.7 |
| Petroleos Mexicanos | 0.7 |
| | 25.0 |
Asset Allocation (% of fund's net assets)
| As of June 30, 2018* |
| | Stock Class and Equity Futures** | 55.3% |
| | Bond Class | 38.4% |
| | Short-Term Class | 6.3% |

* Foreign investments - 18.8%
** Includes investment in Fidelity® Commodity Strategy Central Fund of 1.5%
Asset allocations in the pie chart reflects the categorization of assets as defined in the Fund's prospectus in effect as of the time periods indicated above. Financial Statement categorizations conform to accounting standards and will differ from the pie chart. Percentages are adjusted for the effect of future contracts and swap contracts, if applicable.
An unaudited holdings listing for the Fund, which presents direct holdings as well as the pro-rata share of any securities and other investments held indirectly through its investment in underlying Fidelity Central Funds, other than the Commodity Strategy and Money Market Central Funds, is available at institutional.fidelity.com.
Percentages in the above tables are adjusted for the effect of TBA Sale Commitments.
Schedule of Investments June 30, 2018 (Unaudited)
Showing Percentage of Net Assets
| U.S. Treasury Obligations - 0.2% | | | |
| | | Principal Amount | Value |
| U.S. Treasury Bills, yield at date of purchase 1.87% to 1.9% 8/16/18 to 9/20/18 (a) | | | |
| (Cost $1,923,809) | | 1,930,000 | 1,924,005 |
| | | Shares | Value |
|
| Fixed-Income Funds - 41.7% | | | |
| Fidelity Emerging Markets Debt Central Fund (b) | | 593,322 | $5,571,296 |
| Fidelity Floating Rate Central Fund (b) | | 109,593 | 11,262,864 |
| Fidelity High Income Central Fund 1 (b) | | 180,659 | 16,877,166 |
| Fidelity Inflation-Protected Bond Index Central Fund (b) | | 452,719 | 45,566,138 |
| Fidelity International Credit Central Fund (b) | | 66,962 | 6,538,140 |
| Fidelity VIP Investment Grade Central Fund (b) | | 3,538,102 | 362,690,868 |
| iShares 20+ Year Treasury Bond ETF (c) | | 172,353 | 20,978,807 |
| TOTAL FIXED-INCOME FUNDS | | | |
| (Cost $468,598,441) | | | 469,485,279 |
|
| Money Market Funds - 4.3% | | | |
| Fidelity Cash Central Fund, 1.93% (d) | | 12,135,089 | 12,137,516 |
| Fidelity Money Market Central Fund, 2.29% (d) | | 35,370,897 | 35,374,434 |
| Fidelity Securities Lending Cash Central Fund 1.92% (d)(e) | | 986,951 | 987,148 |
| TOTAL MONEY MARKET FUNDS | | | |
| (Cost $48,495,468) | | | 48,499,098 |
|
| Equity Funds - 53.9% | | | |
| Domestic Equity Funds - 41.3% | | | |
| Fidelity Commodity Strategy Central Fund (b) | | 2,461,143 | 16,883,438 |
| Fidelity Consumer Discretionary Central Fund (b) | | 132,399 | 43,446,669 |
| Fidelity Consumer Staples Central Fund (b) | | 116,931 | 23,464,527 |
| Fidelity Energy Central Fund (b) | | 172,782 | 23,681,564 |
| Fidelity Financials Central Fund (b) | | 694,339 | 72,225,182 |
| Fidelity Health Care Central Fund (b) | | 132,214 | 57,371,432 |
| Fidelity Industrials Central Fund (b) | | 132,907 | 37,770,959 |
| Fidelity Information Technology Central Fund (b) | | 215,880 | 101,592,968 |
| Fidelity Materials Central Fund (b) | | 45,676 | 11,372,856 |
| Fidelity Real Estate Equity Central Fund (b) | | 44,096 | 4,836,884 |
| Fidelity Telecom Services Central Fund (b) | | 42,215 | 7,331,421 |
| Fidelity Utilities Central Fund (b) | | 65,049 | 12,155,711 |
| iShares S&P 500 Index ETF | | 194,194 | 53,024,672 |
|
| TOTAL DOMESTIC EQUITY FUNDS | | | 465,158,283 |
|
| International Equity Funds - 12.6% | | | |
| Fidelity Emerging Markets Equity Central Fund (b) | | 116,011 | 26,764,866 |
| Fidelity International Equity Central Fund (b) | | 1,227,259 | 103,310,657 |
| iShares MSCI Japan ETF | | 213,533 | 12,365,696 |
|
| TOTAL INTERNATIONAL EQUITY FUNDS | | | 142,441,219 |
|
| TOTAL EQUITY FUNDS | | | |
| (Cost $512,033,463) | | | 607,599,502 |
| TOTAL INVESTMENT IN SECURITIES - 100.1% | | | |
| (Cost $1,031,051,181) | | | 1,127,507,884 |
| NET OTHER ASSETS (LIABILITIES) - (0.1)% | | | (1,166,002) |
| NET ASSETS - 100% | | | $1,126,341,882 |
| Futures Contracts | | | | | |
| | Number of contracts | Expiration Date | Notional Amount | Value | Unrealized Appreciation/(Depreciation) |
| Sold | | | | | |
| Equity Index Contracts | | | | | |
| ICE E-mini MSCI EAFE Index Contracts (United States) | 397 | Sept. 2018 | $38,814,690 | $1,170,032 | $1,170,032 |
The notional amount of futures sold as a percentage of Net Assets is 3.4%
Security Type Abbreviations
ETF – Exchange-Traded Fund
Legend
(a) Security or a portion of the security was pledged to cover margin requirements for futures contracts. At period end, the value of securities pledged amounted to $1,924,005.
(b) Affiliated fund that is generally available only to investment companies and other accounts managed by Fidelity Investments. A complete unaudited schedule of portfolio holdings for each Fidelity Central Fund is filed with the SEC for the first and third quarters of each fiscal year on Form N-Q and is available upon request or at the SEC's website at www.sec.gov. An unaudited holdings listing for the Fund, which presents direct holdings as well as the pro-rata share of securities and other investments held indirectly through its investment in underlying non-money market Fidelity Central Funds, other than the Commodity Strategy Central Fund, is available at fidelity.com and/or institutional.fidelity.com, as applicable. In addition, each Fidelity Central Fund's financial statements are available on the SEC's website or upon request.
(c) Security or a portion of the security is on loan at period end.
(d) Affiliated fund that is generally available only to investment companies and other accounts managed by Fidelity Investments. The rate quoted is the annualized seven-day yield of the fund at period end. A complete unaudited listing of the fund's holdings as of its most recent quarter end is available upon request. In addition, each Fidelity Central Fund's financial statements are available on the SEC's website or upon request.
(e) Investment made with cash collateral received from securities on loan.
Affiliated Central Funds
Information regarding fiscal year to date income earned by the Fund from investments in Fidelity Central Funds is as follows:
| Fund | Income earned |
| Fidelity Cash Central Fund | $186,104 |
| Fidelity Consumer Discretionary Central Fund | 136,205 |
| Fidelity Consumer Staples Central Fund | 208,698 |
| Fidelity Emerging Markets Debt Central Fund | 155,632 |
| Fidelity Emerging Markets Equity Central Fund | 190,009 |
| Fidelity Energy Central Fund | 105,558 |
| Fidelity Financials Central Fund | 428,614 |
| Fidelity Floating Rate Central Fund | 283,547 |
| Fidelity Health Care Central Fund | 230,534 |
| Fidelity High Income Central Fund 1 | 556,619 |
| Fidelity Industrials Central Fund | 203,452 |
| Fidelity Inflation-Protected Bond Index Central Fund | 70,378 |
| Fidelity Information Technology Central Fund | 266,301 |
| Fidelity International Credit Central Fund | 39,645 |
| Fidelity International Equity Central Fund | 1,662,422 |
| Fidelity Materials Central Fund | 83,607 |
| Fidelity Money Market Central Fund | 436,059 |
| Fidelity Real Estate Equity Central Fund | 28,227 |
| Fidelity Securities Lending Cash Central Fund | 11,987 |
| Fidelity Telecom Services Central Fund | 96,131 |
| Fidelity Utilities Central Fund | 96,073 |
| Fidelity VIP Investment Grade Central Fund | 4,979,392 |
| Total | $10,455,194 |
Amounts in the income column in the above table include any capital gain distributions from underlying funds, which are presented in the corresponding line-item in the Statement of Operations if applicable.
Fiscal year to date information regarding the Fund’s investments in non-Money Market Central Funds, including the ownership percentage, is presented below.
| Fund | Value, beginning of period | Purchases | Sales Proceeds | Realized Gain/Loss | Change in Unrealized appreciation (depreciation) | Value, end of period | % ownership, end of period |
| Fidelity Commodity Strategy Central Fund | $24,141,586 | $154,498 | $7,531,760 | $322,810 | $(203,696) | $16,883,438 | 3.0% |
| Fidelity Consumer Discretionary Central Fund | 39,907,667 | 2,233,626 | 2,639,990 | 90,367 | 3,854,999 | 43,446,669 | 1.9 |
| Fidelity Consumer Staples Central Fund | 25,594,068 | 1,800,708 | 1,563,461 | (63,477) | (2,303,311) | 23,464,527 | 1.8 |
| Fidelity Emerging Markets Debt Central Fund | 6,149,917 | 204,318 | 352,906 | (8,168) | (421,865) | 5,571,296 | 4.3 |
| Fidelity Emerging Markets Equity Central Fund | 35,072,978 | 576,850 | 6,818,741 | 782,567 | (2,848,788) | 26,764,866 | 3.9 |
| Fidelity Energy Central Fund | 21,953,260 | 1,640,877 | 1,397,527 | (7,776) | 1,492,730 | 23,681,564 | 1.9 |
| Fidelity Financials Central Fund | 73,707,560 | 5,534,559 | 4,803,536 | (38,213) | (2,175,188) | 72,225,182 | 2.0 |
| Fidelity Floating Rate Central Fund | 11,607,545 | 381,621 | 706,572 | 37,569 | (57,299) | 11,262,864 | 0.5 |
| Fidelity Health Care Central Fund | 50,835,229 | 3,346,848 | 3,440,842 | 43,991 | 6,586,206 | 57,371,432 | 1.9 |
| Fidelity High Income Central Fund 1 | 22,661,288 | 710,249 | 5,874,771 | 1,103,600 | (1,723,200) | 16,877,166 | 4.2 |
| Fidelity Industrials Central Fund | 38,362,342 | 3,501,126 | 2,614,523 | (21,294) | (1,456,692) | 37,770,959 | 1.9 |
| Fidelity Inflation-Protected Bond Index Central Fund | 38,335,640 | 9,807,811 | 2,641,943 | (11,714) | 76,344 | 45,566,138 | 4.0 |
| Fidelity Information Technology Central Fund | 89,977,814 | 8,016,484 | 6,508,259 | 97,951 | 10,008,978 | 101,592,968 | 1.8 |
| Fidelity International Credit Central Fund | 6,770,597 | 366,198 | 450,259 | (5,078) | (143,318) | 6,538,140 | 3.8 |
| Fidelity International Equity Central Fund | 132,600,366 | 2,650,688 | 26,782,126 | 2,787,807 | (7,946,078) | 103,310,657 | 3.9 |
| Fidelity Materials Central Fund | 11,835,527 | 916,688 | 781,619 | (15,383) | (582,357) | 11,372,856 | 1.9 |
| Fidelity Real Estate Equity Central Fund | 5,419,890 | 68,041 | 658,493 | 2,222 | 5,224 | 4,836,884 | 3.8 |
| Fidelity Telecom Services Central Fund | 7,600,063 | 603,917 | 495,470 | (9,105) | (367,984) | 7,331,421 | 1.9 |
| Fidelity Utilities Central Fund | 11,146,784 | 891,083 | 732,176 | 2,960 | 847,060 | 12,155,711 | 2.0 |
| Fidelity VIP Investment Grade Central Fund | 382,978,640 | 40,161,495 | 50,490,691 | (497,446) | (9,461,130) | 362,690,868 | 6.6 |
| | $1,036,658,761 | $83,567,685 | $127,285,665 | $4,594,190 | $(6,819,365) | $990,715,606 | |
Investment Valuation
The following is a summary of the inputs used, as of June 30, 2018, involving the Fund's assets and liabilities carried at fair value. The inputs or methodology used for valuing securities may not be an indication of the risk associated with investing in those securities. For more information on valuation inputs, and their aggregation into the levels used below, please refer to the Investment Valuation section in the accompanying Notes to Financial Statements.
| | Valuation Inputs at Reporting Date: |
| Description | Total | Level 1 | Level 2 | Level 3 |
| Investments in Securities: | | | | |
| U.S. Government and Government Agency Obligations | $1,924,005 | $-- | $1,924,005 | $-- |
| Fixed-Income Funds | 469,485,279 | 469,485,279 | -- | -- |
| Money Market Funds | 48,499,098 | 48,499,098 | -- | -- |
| Equity Funds | 607,599,502 | 607,599,502 | -- | -- |
| Total Investments in Securities: | $1,127,507,884 | $1,125,583,879 | $1,924,005 | $-- |
| Derivative Instruments: | | | | |
| Assets | | | | |
| Futures Contracts | $1,170,032 | $1,170,032 | $-- | $-- |
| Total Assets | $1,170,032 | $1,170,032 | $-- | $-- |
| Total Derivative Instruments: | $1,170,032 | $1,170,032 | $-- | $-- |
Value of Derivative Instruments
The following table is a summary of the Fund's value of derivative instruments by primary risk exposure as of June 30, 2018. For additional information on derivative instruments, please refer to the Derivative Instruments section in the accompanying Notes to Financial Statements.
| Primary Risk Exposure / Derivative Type | Value |
| | Asset | Liability |
| Equity Risk | | |
| Futures Contracts(a) | $1,170,032 | $0 |
| Total Equity Risk | 1,170,032 | 0 |
| Total Value of Derivatives | $1,170,032 | $0 |
(a) Reflects gross cumulative appreciation (depreciation) on futures contracts as presented in the Schedule of Investments. In the Statement of Assets and Liabilities, the period end daily variation margin is included in receivable or payable for daily variation margin on futures contracts, and the net cumulative appreciation (depreciation) is included in net unrealized appreciation (depreciation).
Other Information
The composition of credit quality ratings as a percentage of Total Net Assets (Unaudited) is as follows. The information in the following tables is based on the combined investments of the Fund and its pro-rata share of the investments of Fidelity's Fixed-Income Central Funds.
| U.S. Government and U.S. Government Agency Obligations | 25.1% |
| AAA,AA,A | 2.2% |
| BBB | 7.0% |
| BB | 3.4% |
| B | 1.4% |
| CCC,CC,C | 0.3% |
| Not Rated | 1.6% |
| Equities | 54.3% |
| Short-Term Investments and Net Other Assets | 4.7% |
| | 100.0% |
We have used ratings from Moody's Investors Service, Inc. Where Moody's® ratings are not available, we have used S&P® ratings. All ratings are as of the date indicated and do not reflect subsequent changes.
Distribution of investments by country or territory of incorporation, as a percentage of Total Net Assets, is as follows (Unaudited):
| United States of America | 81.2% |
| United Kingdom | 2.6% |
| Japan | 2.3% |
| Canada | 1.5% |
| Cayman Islands | 1.3% |
| Netherlands | 1.3% |
| Germany | 1.1% |
| Others (Individually Less Than 1%) | 8.7% |
| | 100.0% |
See accompanying notes which are an integral part of the financial statements.
Financial Statements
Statement of Assets and Liabilities
| | | June 30, 2018 (Unaudited) |
| Assets | | |
Investment in securities, at value (including securities loaned of $961,588) — See accompanying schedule:
Unaffiliated issuers (cost $85,081,654) | $88,293,180 | |
| Fidelity Central Funds (cost $945,969,527) | 1,039,214,704 | |
| Total Investment in Securities (cost $1,031,051,181) | | $1,127,507,884 |
| Receivable for investments sold | | 518,415 |
| Receivable for fund shares sold | | 142,736 |
| Dividends receivable | | 193,378 |
| Distributions receivable from Fidelity Central Funds | | 74,436 |
| Other receivables | | 46,478 |
| Total assets | | 1,128,483,327 |
| Liabilities | | |
| Payable for fund shares redeemed | $255,918 | |
| Accrued management fee | 465,409 | |
| Distribution and service plan fees payable | 4,777 | |
| Payable for daily variation margin on futures contracts | 244,155 | |
| Other affiliated payables | 115,388 | |
| Other payables and accrued expenses | 70,273 | |
| Collateral on securities loaned | 985,525 | |
| Total liabilities | | 2,141,445 |
| Net Assets | | $1,126,341,882 |
| Net Assets consist of: | | |
| Paid in capital | | $1,020,117,098 |
| Undistributed net investment income | | 7,552,353 |
| Accumulated undistributed net realized gain (loss) on investments | | 1,045,696 |
| Net unrealized appreciation (depreciation) on investments | | 97,626,735 |
| Net Assets | | $1,126,341,882 |
| Initial Class: | | |
| Net Asset Value, offering price and redemption price per share ($886,768,924 ÷ 59,531,387 shares) | | $14.90 |
| Service Class: | | |
| Net Asset Value, offering price and redemption price per share ($4,896,467 ÷ 331,912 shares) | | $14.75 |
| Service Class 2: | | |
| Net Asset Value, offering price and redemption price per share ($20,231,501 ÷ 1,394,461 shares) | | $14.51 |
| Investor Class: | | |
| Net Asset Value, offering price and redemption price per share ($214,444,990 ÷ 14,496,563 shares) | | $14.79 |
See accompanying notes which are an integral part of the financial statements.
Statement of Operations
| | | Six months ended June 30, 2018 (Unaudited) |
| Investment Income | | |
| Dividends | | $741,232 |
| Interest | | 5,964 |
| Income from Fidelity Central Funds | | 10,455,194 |
| Total income | | 11,202,390 |
| Expenses | | |
| Management fee | $2,828,015 | |
| Transfer agent fees | 455,747 | |
| Distribution and service plan fees | 28,621 | |
| Accounting and security lending fees | 239,087 | |
| Custodian fees and expenses | 1,083 | |
| Independent trustees' fees and expenses | 2,464 | |
| Audit | 38,791 | |
| Legal | 3,532 | |
| Miscellaneous | 4,652 | |
| Total expenses before reductions | 3,601,992 | |
| Expense reductions | (10,165) | |
| Total expenses after reductions | | 3,591,827 |
| Net investment income (loss) | | 7,610,563 |
| Realized and Unrealized Gain (Loss) | | |
| Net realized gain (loss) on: | | |
| Investment securities: | | |
| Unaffiliated issuers | 2,175,660 | |
| Fidelity Central Funds | 4,602,915 | |
| Futures contracts | 298,881 | |
| Total net realized gain (loss) | | 7,077,456 |
| Change in net unrealized appreciation (depreciation) on: | | |
| Investment securities: | | |
| Unaffiliated issuers | (2,697,236) | |
| Fidelity Central Funds | (6,820,345) | |
| Futures contracts | 1,170,032 | |
| Total change in net unrealized appreciation (depreciation) | | (8,347,549) |
| Net gain (loss) | | (1,270,093) |
| Net increase (decrease) in net assets resulting from operations | | $6,340,470 |
See accompanying notes which are an integral part of the financial statements.
Statement of Changes in Net Assets
| | Six months ended June 30, 2018 (Unaudited) | Year ended December 31, 2017 |
| Increase (Decrease) in Net Assets | | |
| Operations | | |
| Net investment income (loss) | $7,610,563 | $17,739,065 |
| Net realized gain (loss) | 7,077,456 | 56,482,409 |
| Change in net unrealized appreciation (depreciation) | (8,347,549) | 78,489,067 |
| Net increase (decrease) in net assets resulting from operations | 6,340,470 | 152,710,541 |
| Distributions to shareholders from net investment income | (533,473) | (21,295,471) |
| Distributions to shareholders from net realized gain | (30,639,935) | (129,896,975) |
| Total distributions | (31,173,408) | (151,192,446) |
| Share transactions - net increase (decrease) | (25,641,180) | 33,637,892 |
| Total increase (decrease) in net assets | (50,474,118) | 35,155,987 |
| Net Assets | | |
| Beginning of period | 1,176,816,000 | 1,141,660,013 |
| End of period | $1,126,341,882 | $1,176,816,000 |
| Other Information | | |
| Undistributed net investment income end of period | $7,552,353 | $475,263 |
See accompanying notes which are an integral part of the financial statements.
Financial Highlights
VIP Asset Manager Portfolio Initial Class
| | Six months ended (Unaudited) June 30, | Years endedDecember 31, | | | | |
| | 2018 | 2017 | 2016 | 2015 | 2014 | 2013 |
| Selected Per–Share Data | | | | | | |
| Net asset value, beginning of period | $15.23 | $15.29 | $15.76 | $17.15 | $17.24 | $15.17 |
| Income from Investment Operations | | | | | | |
| Net investment income (loss)A | .10 | .23 | .24 | .27 | .27 | .23 |
| Net realized and unrealized gain (loss) | (.02) | 1.76 | .18 | (.22) | .72 | 2.15 |
| Total from investment operations | .08 | 1.99 | .42 | .05 | .99 | 2.38 |
| Distributions from net investment income | (.01) | (.29) | (.23) | (.26) | (.27) | (.26) |
| Distributions from net realized gain | (.40) | (1.76) | (.66) | (1.17) | (.81) | (.04) |
| Total distributions | (.41) | (2.05) | (.89) | (1.44)B | (1.08) | (.31)C |
| Net asset value, end of period | $14.90 | $15.23 | $15.29 | $15.76 | $17.15 | $17.24 |
| Total ReturnD,E,F | .58% | 14.03% | 3.14% | .14% | 5.83% | 15.71% |
| Ratios to Average Net AssetsG,H | | | | | | |
| Expenses before reductions | .61%I | .61% | .62% | .62% | .61% | .62% |
| Expenses net of fee waivers, if any | .60%I | .61% | .61% | .62% | .61% | .62% |
| Expenses net of all reductions | .60%I | .61% | .61% | .61% | .61% | .61% |
| Net investment income (loss) | 1.34%I | 1.54% | 1.57% | 1.65% | 1.54% | 1.40% |
| Supplemental Data | | | | | | |
| Net assets, end of period (000 omitted) | $886,769 | $937,508 | $932,248 | $1,008,018 | $1,117,675 | $1,160,093 |
| Portfolio turnover rateJ | 20%I | 26% | 108% | 39% | 30% | 41% |
A Calculated based on average shares outstanding during the period.
B Total distributions of $1.44 per share is comprised of distributions from net investment income of $.263 and distributions from net realized gain of $1.174 per share.
C Total distributions of $.31 per share is comprised of distributions from net investment income of $.264 and distributions from net realized gain of $.041 per share.
D Total returns for periods of less than one year are not annualized.
E Total returns do not reflect charges attributable to your insurance company's separate account. Inclusion of these charges would reduce the total returns shown.
F Total returns would have been lower if certain expenses had not been reduced during the applicable periods shown.
G Fees and expenses of any underlying Fidelity Central Funds are not included in the Fund's expense ratio. The Fund indirectly bears its proportionate share of the expenses of any underlying Fidelity Central Funds. Based on their most recent shareholder report date, the expenses of any underlying non-money market Fidelity Central Funds ranged from less than .005% to .07%.
H Expense ratios reflect operating expenses of the class. Expenses before reductions do not reflect amounts reimbursed by the investment adviser or reductions from brokerage service arrangements or reductions from other expense offset arrangements and do not represent the amount paid by the class during periods when reimbursements or reductions occur. Expenses net of fee waivers reflect expenses after reimbursement by the investment adviser but prior to reductions from brokerage service arrangements or other expense offset arrangements. Expenses net of all reductions represent the net expenses paid by the class.
I Annualized
J Amount does not include the portfolio activity of any underlying Fidelity Central Funds.
See accompanying notes which are an integral part of the financial statements.
VIP Asset Manager Portfolio Service Class
| | Six months ended (Unaudited) June 30, | Years endedDecember 31, | | | | |
| | 2018 | 2017 | 2016 | 2015 | 2014 | 2013 |
| Selected Per–Share Data | | | | | | |
| Net asset value, beginning of period | $15.09 | $15.16 | $15.64 | $17.03 | $17.13 | $15.08 |
| Income from Investment Operations | | | | | | |
| Net investment income (loss)A | .09 | .21 | .22 | .25 | .25 | .21 |
| Net realized and unrealized gain (loss) | (.02) | 1.75 | .18 | (.22) | .71 | 2.13 |
| Total from investment operations | .07 | 1.96 | .40 | .03 | .96 | 2.34 |
| Distributions from net investment income | (.01) | (.27) | (.22) | (.24) | (.25) | (.24) |
| Distributions from net realized gain | (.40) | (1.76) | (.66) | (1.17) | (.81) | (.04) |
| Total distributions | (.41) | (2.03) | (.88) | (1.42)B | (1.06) | (.29)C |
| Net asset value, end of period | $14.75 | $15.09 | $15.16 | $15.64 | $17.03 | $17.13 |
| Total ReturnD,E,F | .52% | 13.94% | 3.01% | .03% | 5.69% | 15.53% |
| Ratios to Average Net AssetsG,H | | | | | | |
| Expenses before reductions | .71%I | .71% | .72% | .72% | .73% | .74% |
| Expenses net of fee waivers, if any | .70%I | .71% | .71% | .72% | .73% | .73% |
| Expenses net of all reductions | .70%I | .71% | .71% | .72% | .73% | .73% |
| Net investment income (loss) | 1.24%I | 1.44% | 1.47% | 1.54% | 1.43% | 1.28% |
| Supplemental Data | | | | | | |
| Net assets, end of period (000 omitted) | $4,896 | $5,004 | $5,437 | $5,806 | $6,990 | $7,970 |
| Portfolio turnover rateJ | 20%I | 26% | 108% | 39% | 30% | 41% |
A Calculated based on average shares outstanding during the period.
B Total distributions of $1.42 per share is comprised of distributions from net investment income of $.244 and distributions from net realized gain of $1.174 per share.
C Total distributions of $.29 per share is comprised of distributions from net investment income of $.244 and distributions from net realized gain of $.041 per share.
D Total returns for periods of less than one year are not annualized.
E Total returns do not reflect charges attributable to your insurance company's separate account. Inclusion of these charges would reduce the total returns shown.
F Total returns would have been lower if certain expenses had not been reduced during the applicable periods shown.
G Fees and expenses of any underlying Fidelity Central Funds are not included in the Fund's expense ratio. The Fund indirectly bears its proportionate share of the expenses of any underlying Fidelity Central Funds. Based on their most recent shareholder report date, the expenses of any underlying non-money market Fidelity Central Funds ranged from less than .005% to .07%.
H Expense ratios reflect operating expenses of the class. Expenses before reductions do not reflect amounts reimbursed by the investment adviser or reductions from brokerage service arrangements or reductions from other expense offset arrangements and do not represent the amount paid by the class during periods when reimbursements or reductions occur. Expenses net of fee waivers reflect expenses after reimbursement by the investment adviser but prior to reductions from brokerage service arrangements or other expense offset arrangements. Expenses net of all reductions represent the net expenses paid by the class.
I Annualized
J Amount does not include the portfolio activity of any underlying Fidelity Central Funds.
See accompanying notes which are an integral part of the financial statements.
VIP Asset Manager Portfolio Service Class 2
| | Six months ended (Unaudited) June 30, | Years endedDecember 31, | | | | |
| | 2018 | 2017 | 2016 | 2015 | 2014 | 2013 |
| Selected Per–Share Data | | | | | | |
| Net asset value, beginning of period | $14.86 | $14.96 | $15.45 | $16.83 | $16.94 | $14.92 |
| Income from Investment Operations | | | | | | |
| Net investment income (loss)A | .08 | .19 | .20 | .23 | .22 | .18 |
| Net realized and unrealized gain (loss) | (.02) | 1.71 | .17 | (.21) | .70 | 2.10 |
| Total from investment operations | .06 | 1.90 | .37 | .02 | .92 | 2.28 |
| Distributions from net investment income | (.01) | (.25) | (.20) | (.22) | (.22) | (.22) |
| Distributions from net realized gain | (.40) | (1.76) | (.66) | (1.17) | (.81) | (.04) |
| Total distributions | (.41) | (2.00)B | (.86) | (1.40)C | (1.03) | (.26) |
| Net asset value, end of period | $14.51 | $14.86 | $14.96 | $15.45 | $16.83 | $16.94 |
| Total ReturnD,E,F | .45% | 13.74% | 2.84% | (.06)% | 5.54% | 15.34% |
| Ratios to Average Net AssetsG,H | | | | | | |
| Expenses before reductions | .86%I | .86% | .87% | .87% | .88% | .88% |
| Expenses net of fee waivers, if any | .85%I | .86% | .86% | .87% | .88% | .88% |
| Expenses net of all reductions | .85%I | .86% | .86% | .87% | .87% | .88% |
| Net investment income (loss) | 1.09%I | 1.29% | 1.32% | 1.39% | 1.28% | 1.14% |
| Supplemental Data | | | | | | |
| Net assets, end of period (000 omitted) | $20,232 | $20,807 | $21,651 | $24,520 | $28,230 | $31,119 |
| Portfolio turnover rateJ | 20%I | 26% | 108% | 39% | 30% | 41% |
A Calculated based on average shares outstanding during the period.
B Total distributions of $2.00 per share is comprised of distributions from net investment income of $.245 and distributions from net realized gain of $1.757 per share.
C Total distributions of $1.40 per share is comprised of distributions from net investment income of $.221 and distributions from net realized gain of $1.174 per share.
D Total returns for periods of less than one year are not annualized.
E Total returns do not reflect charges attributable to your insurance company's separate account. Inclusion of these charges would reduce the total returns shown.
F Total returns would have been lower if certain expenses had not been reduced during the applicable periods shown.
G Fees and expenses of any underlying Fidelity Central Funds are not included in the Fund's expense ratio. The Fund indirectly bears its proportionate share of the expenses of any underlying Fidelity Central Funds. Based on their most recent shareholder report date, the expenses of any underlying non-money market Fidelity Central Funds ranged from less than .005% to .07%.
H Expense ratios reflect operating expenses of the class. Expenses before reductions do not reflect amounts reimbursed by the investment adviser or reductions from brokerage service arrangements or reductions from other expense offset arrangements and do not represent the amount paid by the class during periods when reimbursements or reductions occur. Expenses net of fee waivers reflect expenses after reimbursement by the investment adviser but prior to reductions from brokerage service arrangements or other expense offset arrangements. Expenses net of all reductions represent the net expenses paid by the class.
I Annualized
J Amount does not include the portfolio activity of any underlying Fidelity Central Funds.
See accompanying notes which are an integral part of the financial statements.
VIP Asset Manager Portfolio Investor Class
| | Six months ended (Unaudited) June 30, | Years endedDecember 31, | | | | |
| | 2018 | 2017 | 2016 | 2015 | 2014 | 2013 |
| Selected Per–Share Data | | | | | | |
| Net asset value, beginning of period | $15.13 | $15.20 | $15.68 | $17.07 | $17.17 | $15.11 |
| Income from Investment Operations | | | | | | |
| Net investment income (loss)A | .09 | .22 | .23 | .26 | .25 | .21 |
| Net realized and unrealized gain (loss) | (.02) | 1.74 | .17 | (.22) | .72 | 2.14 |
| Total from investment operations | .07 | 1.96 | .40 | .04 | .97 | 2.35 |
| Distributions from net investment income | (.01) | (.28) | (.22) | (.25) | (.26) | (.25) |
| Distributions from net realized gain | (.40) | (1.76) | (.66) | (1.17) | (.81) | (.04) |
| Total distributions | (.41) | (2.03)B | (.88) | (1.43)C | (1.07) | (.29) |
| Net asset value, end of period | $14.79 | $15.13 | $15.20 | $15.68 | $17.07 | $17.17 |
| Total ReturnD,E,F | .51% | 13.95% | 3.01% | .07% | 5.73% | 15.62% |
| Ratios to Average Net AssetsG,H | | | | | | |
| Expenses before reductions | .68%I | .69% | .70% | .70% | .70% | .71% |
| Expenses net of fee waivers, if any | .68%I | .69% | .70% | .70% | .70% | .70% |
| Expenses net of all reductions | .68%I | .69% | .69% | .69% | .69% | .70% |
| Net investment income (loss) | 1.26%I | 1.46% | 1.49% | 1.57% | 1.46% | 1.31% |
| Supplemental Data | | | | | | |
| Net assets, end of period (000 omitted) | $214,445 | $213,497 | $182,324 | $192,234 | $180,160 | $138,902 |
| Portfolio turnover rateJ | 20%I | 26% | 108% | 39% | 30% | 41% |
A Calculated based on average shares outstanding during the period.
B Total distributions of $2.03 per share is comprised of distributions from net investment income of $.276 and distributions from net realized gain of $1.757 per share.
C Total distributions of $1.43 per share is comprised of distributions from net investment income of $.251 and distributions from net realized gain of $1.174 per share.
D Total returns for periods of less than one year are not annualized.
E Total returns do not reflect charges attributable to your insurance company's separate account. Inclusion of these charges would reduce the total returns shown.
F Total returns would have been lower if certain expenses had not been reduced during the applicable periods shown.
G Fees and expenses of any underlying Fidelity Central Funds are not included in the Fund's expense ratio. The Fund indirectly bears its proportionate share of the expenses of any underlying Fidelity Central Funds. Based on their most recent shareholder report date, the expenses of any underlying non-money market Fidelity Central Funds ranged from less than .005% to .07%.
H Expense ratios reflect operating expenses of the class. Expenses before reductions do not reflect amounts reimbursed by the investment adviser or reductions from brokerage service arrangements or reductions from other expense offset arrangements and do not represent the amount paid by the class during periods when reimbursements or reductions occur. Expenses net of fee waivers reflect expenses after reimbursement by the investment adviser but prior to reductions from brokerage service arrangements or other expense offset arrangements. Expenses net of all reductions represent the net expenses paid by the class.
I Annualized
J Amount does not include the portfolio activity of any underlying Fidelity Central Funds.
See accompanying notes which are an integral part of the financial statements.
Notes to Financial Statements (Unaudited)
For the period ended June 30, 2018
1. Organization.
VIP Asset Manager Portfolio (the Fund) is a fund of Variable Insurance Products Fund V (the Trust) and is authorized to issue an unlimited number of shares. The Trust is registered under the Investment Company Act of 1940, as amended (the 1940 Act), as an open-end management investment company organized as a Massachusetts business trust. Shares of the Fund may only be purchased by insurance companies for the purpose of funding variable annuity or variable life insurance contracts. The Fund offers the following classes of shares: Initial Class shares, Service Class shares, Service Class 2 shares and Investor Class shares. All classes have equal rights and voting privileges, except for matters affecting a single class.
2. Investments in Fidelity Central Funds.
The Fund invests in Fidelity Central Funds, which are open-end investment companies generally available only to other investment companies and accounts managed by the investment adviser and its affiliates. The Fund's Schedule of Investments lists each of the Fidelity Central Funds held as of period end as an investment of the Fund, but does not include the underlying holdings of each Fidelity Central Fund. As an Investing Fund, the Fund indirectly bears its proportionate share of the expenses of the underlying Fidelity Central Funds.
Based on its investment objective, each Fidelity Central Fund may invest or participate in various investment vehicles or strategies that are similar to those of the Fund. These strategies are consistent with the investment objectives of the Fund and may involve certain economic risks which may cause a decline in value of each of the Fidelity Central Funds and thus a decline in the value of the Fund. The following summarizes the Fund's investment in each Fidelity Central Fund.
| Fidelity Central Fund | Investment Manager | Investment Objective | Investment Practices | Expense Ratio(a) |
| Fidelity Commodity Strategy Central Fund | Geode Capital Management, LLC (Geode) | Seeks to provide investment returns that correspond to the performance of the commodities market. | Investment in commodity-related investments through a wholly-owned subsidiary organized under the laws of the Cayman Islands
Futures | .05% |
| Fidelity Equity Central Funds | FMR Co., Inc. (FMRC) | Each fund seeks capital appreciation by investing primarily in common stocks, with a concentration in a particular industry. | Foreign Securities
Restricted Securities | Less than .005% to .01% |
| Fidelity Emerging Markets Debt Central Fund | FMRC | Seeks high total return by normally investing in debt securities of issuers in emerging markets and other debt investments that are tied economically to emerging markets. | Foreign Securities
Restricted Securities | .01% |
| Fidelity Emerging Markets Equity Central Fund | FMRC | Seeks capital appreciation by investing primarily in equity securities of issuers in emerging markets. | Foreign Securities
Futures | .07% |
| Fidelity International Equity Central Fund | FMRC | Seeks capital appreciation by investing primarily in non-U.S. based common stocks, including securities of issuers located in emerging markets. | Delayed Delivery & When Issued Securities
Foreign Securities
Futures
| .01% |
| Fidelity Floating Rate Central Fund | FMRC | Seeks a high level of income by normally investing in floating rate loans and other floating rate securities. | Delayed Delivery & When Issued Securities
Loans & Direct Debt Instruments
Restricted Securities | .05% |
| Fidelity High Income Central Fund 1 | FMRC | Seeks a high level of income and may also seek capital appreciation by investing primarily in debt securities, preferred stocks, and convertible securities, with an emphasis on lower-quality debt securities. | Delayed Delivery & When Issued Securities
Loans & Direct Debt Instruments
Restricted Securities | Less than .005% |
| Fidelity High Income Central Fund 2 | FMRC | Seeks a high level of income and may also seek capital appreciation by investing primarily in debt securities, preferred stocks, and convertible securities, with an emphasis on lower-quality debt securities. | Foreign Securities
Loans & Direct Debt Instruments
Restricted Securities | Less than .005% |
| Fidelity Inflation-Protected Bond Index Central Fund | Fidelity Investment Money Management, Inc. (FIMM) | Seeks to provide investment results that correspond to the performance of the inflation-protected United States Treasury market, and may invest in derivatives. | | Less than .005% |
| Fidelity Specialized High Income Central Fund | FMRC | Seeks a high level of current income by normally investing in income-producing debt securities, with an emphasis on lower-quality debt securities. | Loans & Direct Debt Instruments
Restricted Securities | Less than .005% |
| Fidelity VIP Investment Grade Central Fund | FIMM | Seeks a high level of current income by normally investing in investment-grade debt securities and repurchase agreements. | Delayed Delivery & When Issued Securities
Repurchase Agreements
Restricted Securities
Swaps | Less than .005% |
| Fidelity International Credit Central Fund | FMRC | Seeks a high level of current income by normally investing in debt securities of foreign issuers, including debt securities of issuers located in emerging markets. Foreign currency exposure is hedged utilizing foreign currency contracts. | Foreign Securities
Forward Foreign Currency Contracts
Futures
Options
Restricted Securities
Swaps | .01% |
| Fidelity Money Market Central Funds | FIMM | Each fund seeks to obtain a high level of current income consistent with the preservation of capital and liquidity. | Short-term Investments | Less than .005% |
(a) Expenses expressed as a percentage of average net assets and are as of each underlying Central Fund's most recent annual or semi-annual shareholder report.
An unaudited holdings listing for the Fund, which presents direct holdings as well as the pro-rata share of any securities and other investments held indirectly through its investment in underlying non-money market Fidelity Central Funds, is available at institutional.fidelity.com. A complete unaudited list of holdings for each Fidelity Central Fund is available upon request or at the Securities and Exchange Commission (the SEC) website at www.sec.gov. In addition, the financial statements of the Fidelity Central Funds which contain the significant accounting policies (including investment valuation policies) of those funds are available on the SEC website or upon request.
3. Significant Accounting Policies.
The Fund is an investment company and applies the accounting and reporting guidance of the Financial Accounting Standards Board (FASB) Accounting Standards Codification Topic 946 Financial Services – Investments Companies. The financial statements have been prepared in conformity with accounting principles generally accepted in the United States of America (GAAP), which require management to make certain estimates and assumptions at the date of the financial statements. Actual results could differ from those estimates. Subsequent events, if any, through the date that the financial statements were issued have been evaluated in the preparation of the financial statements. The following summarizes the significant accounting policies of the Fund:
Investment Valuation. Investments are valued as of 4:00 p.m. Eastern time on the last calendar day of the period. The Board of Trustees (the Board) has delegated the day to day responsibility for the valuation of the Fund's investments to the Fair Value Committee (the Committee) established by the Fund's investment adviser. In accordance with valuation policies and procedures approved by the Board, the Fund attempts to obtain prices from one or more third party pricing vendors or brokers to value its investments. When current market prices, quotations or currency exchange rates are not readily available or reliable, investments will be fair valued in good faith by the Committee, in accordance with procedures adopted by the Board. Factors used in determining fair value vary by investment type and may include market or investment specific events, changes in interest rates and credit quality. The frequency with which these procedures are used cannot be predicted and they may be utilized to a significant extent. The Committee oversees the Fund's valuation policies and procedures and reports to the Board on the Committee's activities and fair value determinations. The Board monitors the appropriateness of the procedures used in valuing the Fund's investments and ratifies the fair value determinations of the Committee. The Fund categorizes the inputs to valuation techniques used to value its investments into a disclosure hierarchy consisting of three levels as shown below:
- Level 1 – quoted prices in active markets for identical investments
- Level 2 – other significant observable inputs (including quoted prices for similar investments, interest rates, prepayment speeds, etc.)
- Level 3 – unobservable inputs (including the Fund's own assumptions based on the best information available)
Valuation techniques used to value the Fund's investments by major category are as follows. Debt securities, including restricted securities, are valued based on evaluated prices received from third party pricing vendors or from brokers who make markets in such securities. U.S. government and government agency obligations are valued by pricing vendors who utilize matrix pricing which considers yield or price of bonds of comparable quality, coupon, maturity and type or by broker-supplied prices. When independent prices are unavailable or unreliable, debt securities may be valued utilizing pricing methodologies which consider similar factors that would be used by third party pricing vendors. Debt securities are generally categorized as Level 2 in the hierarchy but may be Level 3 depending on the circumstances.
Exchange-Traded Funds (ETFs) are valued at their last sale price or official closing price as reported by a third party pricing vendor on the primary market or exchange on which they are traded and are categorized as Level 1 in the hierarchy. In the event there were no sales during the day but the exchange reports a closing bid level, ETFs are valued at the closing bid and would be categorized as Level 1 in the hierarchy. In the event there was no closing bid, ETFs may be valued by another method that the Board believes reflects fair value in accordance with the Board's fair value pricing policies and may be categorized as Level 2 in the hierarchy.
Futures contracts are valued at the settlement price established each day by the board of trade or exchange on which they are traded and are categorized as Level 1 in the hierarchy. Investments in open-end mutual funds, including the Fidelity Central Funds, are valued at their closing net asset value (NAV) each business day and are categorized as Level 1 in the hierarchy.
Changes in valuation techniques may result in transfers in or out of an assigned level within the disclosure hierarchy. The aggregate value of investments by input level, as of June 30, 2018, is included at the end of the Fund's Schedule of Investments.
Investment Transactions and Income. For financial reporting purposes, the Fund's investment holdings and NAV include trades executed through the end of the last business day of the period. The NAV per share for processing shareholder transactions is calculated as of the close of business of the New York Stock Exchange (NYSE), normally 4:00 p.m. Eastern time and includes trades executed through the end of the prior business day. Gains and losses on securities sold are determined on the basis of identified cost and include proceeds received from litigation. Dividend income is recorded on the ex-dividend date, except for certain dividends from foreign securities where the ex-dividend date may have passed, which are recorded as soon as the Fund is informed of the ex-dividend date. Non-cash dividends included in dividend income, if any, are recorded at the fair market value of the securities received. Income and capital gain distributions from Fidelity Central Funds, if any, are recorded on the ex-dividend date. Certain distributions received by the Fund represent a return of capital or capital gain. The Fund determines the components of these distributions subsequent to the ex-dividend date, based upon receipt of tax filings or other correspondence relating to the underlying investment. These distributions are recorded as a reduction of cost of investments and/or as a realized gain. Interest income is accrued as earned and includes coupon interest and amortization of premium and accretion of discount on debt securities as applicable.
Class Allocations and Expenses. Investment income, realized and unrealized capital gains and losses, common expenses of the Fund, and certain fund-level expense reductions, if any, are allocated daily on a pro-rata basis to each class based on the relative net assets of each class to the total net assets of the Fund. Each class differs with respect to transfer agent and distribution and service plan fees incurred. Certain expense reductions may also differ by class. For the reporting period, the allocated portion of income and expenses to each class as a percent of its average net assets may vary due to the timing of recording these transactions in relation to fluctuating net assets of the classes. Expenses directly attributable to a fund are charged to that fund. Expenses attributable to more than one fund are allocated among the respective funds on the basis of relative net assets or other appropriate methods. Expense estimates are accrued in the period to which they relate and adjustments are made when actual amounts are known. Expenses included in the accompanying financial statements reflect the expenses of the Fund and do not include any expenses of the Fidelity Central Funds. Although not included in the Fund's expenses, the Fund indirectly bears its proportionate share of the Fidelity Central Funds' expenses through the impact of these expenses on each Fidelity Central Fund's NAV.
Deferred Trustee Compensation. Under a Deferred Compensation Plan (the Plan), certain independent Trustees have elected to defer receipt of a portion of their annual compensation. Deferred amounts are invested in a cross-section of Fidelity funds, are marked-to-market and remain in the Fund until distributed in accordance with the Plan. The investment of deferred amounts and the offsetting payable to the Trustees of $44,294 are included in the accompanying Statement of Assets and Liabilities in other receivables and other payables and accrued expenses, respectively.
Income Tax Information and Distributions to Shareholders. Each year, the Fund intends to qualify as a regulated investment company under Subchapter M of the Internal Revenue Code, including distributing substantially all of its taxable income and realized gains. As a result, no provision for U.S. Federal income taxes is required. The Fund files a U.S. federal tax return, in addition to state and local tax returns as required. The Fund's federal income tax returns are subject to examination by the Internal Revenue Service (IRS) for a period of three fiscal years after they are filed. State and local tax returns may be subject to examination for an additional fiscal year depending on the jurisdiction.
Distributions are declared and recorded on the ex-dividend date. Income and capital gain distributions are declared separately for each class. Income and capital gain distributions are determined in accordance with income tax regulations, which may differ from GAAP.
Capital accounts within the financial statements are adjusted for permanent book-tax differences. These adjustments have no impact on net assets or the results of operations. Capital accounts are not adjusted for temporary book-tax differences which will reverse in a subsequent period.
Book-tax differences are primarily due to the short-term gain distributions from the Underlying Funds, foreign currency transactions, deferred trustees compensation and losses deferred due to wash sales.
As of period end, the cost and unrealized appreciation (depreciation) in securities, and derivatives if applicable, for federal income tax purposes were as follows:
| Gross unrealized appreciation | $107,029,093 |
| Gross unrealized depreciation | (4,437,145) |
| Net unrealized appreciation (depreciation) | $102,591,948 |
| Tax cost | $1,026,085,968 |
4. Derivative Instruments.
Risk Exposures and the Use of Derivative Instruments. The Fund's investment objective allows the Fund to enter into various types of derivative contracts, including futures contracts. Derivatives are investments whose value is primarily derived from underlying assets, indices or reference rates and may be transacted on an exchange or over-the-counter (OTC). Derivatives may involve a future commitment to buy or sell a specified asset based on specified terms, to exchange future cash flows at periodic intervals based on a notional principal amount, or for one party to make one or more payments upon the occurrence of specified events in exchange for periodic payments from the other party.
The Fund used derivatives to increase returns and to manage exposure to certain risks as defined below. The success of any strategy involving derivatives depends on analysis of numerous economic factors, and if the strategies for investment do not work as intended, the Fund may not achieve its objectives.
The Fund's use of derivatives increased or decreased its exposure to the following risk:
| Equity Risk | Equity risk relates to the fluctuations in the value of financial instruments as a result of changes in market prices (other than those arising from interest rate risk or foreign exchange risk), whether caused by factors specific to an individual investment, its issuer, or all factors affecting all instruments traded in a market or market segment.
|
The Fund is also exposed to additional risks from investing in derivatives, such as liquidity risk and counterparty credit risk. Liquidity risk is the risk that the Fund will be unable to close out the derivative in the open market in a timely manner. Counterparty credit risk is the risk that the counterparty will not be able to fulfill its obligation to the Fund. Counterparty credit risk related to exchange-traded futures contracts may be mitigated by the protection provided by the exchange on which they trade.
Investing in derivatives may involve greater risks than investing in the underlying assets directly and, to varying degrees, may involve risk of loss in excess of any initial investment and collateral received and amounts recognized in the Statement of Assets and Liabilities. In addition, there may be the risk that the change in value of the derivative contract does not correspond to the change in value of the underlying instrument.
Futures Contracts. A futures contract is an agreement between two parties to buy or sell a specified underlying instrument for a fixed price at a specified future date. The Fund used futures contracts to manage its exposure to the stock market.
Upon entering into a futures contract, a fund is required to deposit either cash or securities (initial margin) with a clearing broker in an amount equal to a certain percentage of the face value of the contract. Futures contracts are marked-to-market daily and subsequent daily payments (variation margin) are made or received by a fund depending on the daily fluctuations in the value of the futures contracts and are recorded as unrealized appreciation or (depreciation). This receivable and/or payable, if any, is included in daily variation margin on futures contracts in the Statement of Assets and Liabilities. Realized gain or (loss) is recorded upon the expiration or closing of a futures contract. The net realized gain (loss) and change in net unrealized appreciation (depreciation) on futures contracts during the period is presented in the Statement of Operations.
Any open futures contracts at period end are presented in the Schedule of Investments under the caption "Futures Contracts". The notional amount at value reflects each contract's exposure to the underlying instrument or index at period end and is representative of volume of activity during the period. Securities deposited to meet initial margin requirements are identified in the Schedule of Investments.
5. Purchases and Redemptions of Underlying Fund Shares.
Purchases and redemptions of the Underlying Fund shares, aggregated $109,523,477 and $136,527,425, respectively.
6. Fees and Other Transactions with Affiliates.
Management Fee. Fidelity Management & Research Company (the investment adviser) and its affiliates provide the Fund with investment management related services for which the Fund pays a monthly management fee. The management fee is the sum of an individual fund fee rate that is based on an annual rate of .25% of the Fund's average net assets and an annualized group fee rate that averaged .24% during the period. The group fee rate is based upon the average net assets of all the mutual funds advised by the investment adviser, including any mutual funds previously advised by the investment adviser that are currently advised by Fidelity SelectCo, LLC, an affiliate of the investment adviser. The group fee rate decreases as assets under management increase and increases as assets under management decrease. For the reporting period, the total annualized management fee rate was .49% of the Fund's average net assets.
The investment adviser pays a portion of the management fees received from the Fund to the Fidelity Central Funds' investment advisers, who are also affiliates, for managing the assets of the Fidelity Central Funds.
Distribution and Service Plan Fees. In accordance with Rule 12b-1 of the 1940 Act, the Fund has adopted separate 12b-1 Plans for each Service Class of shares. Each Service Class pays Fidelity Distributors Corporation (FDC), an affiliate of the investment adviser, a service fee. For the period, the service fee is based on an annual rate of .10% of Service Class' average net assets and .25% of Service Class 2's average net assets.
For the period, total fees, all of which were re-allowed to insurance companies for the distribution of shares and providing shareholder support services, were as follows:
| Service Class | $2,462 |
| Service Class 2 | 26,159 |
| | $28,621 |
Transfer Agent Fees. Fidelity Investments Institutional Operations Company, Inc. (FIIOC), an affiliate of the investment adviser, is the Fund's transfer, dividend disbursing, and shareholder servicing agent. FIIOC receives an asset-based fee with respect to each class. Each class pays a fee for transfer agent services, typesetting and printing and mailing of shareholder reports, excluding mailing of proxy statements, equal to an annual rate of class-level average net assets. The annual rate for Investor Class is .15% and the annual rate for all other classes is .07%. For the period, transfer agent fees for each class were as follows:
| Initial Class | $294,163 |
| Service Class | 1,585 |
| Service Class 2 | 6,736 |
| Investor Class | 153,263 |
| | $455,747 |
Accounting and Security Lending Fees. Fidelity Service Company, Inc. (FSC), an affiliate of the investment adviser, maintains the Fund's accounting records. The accounting fee is based on the level of average net assets for each month. Under a separate contract, FSC administers the security lending program. The security lending fee is based on the number and duration of lending transactions. For the period, the fees were equivalent to an annualized rate of .04%.
Brokerage Commissions. The Fund placed a portion of its portfolio transactions with brokerage firms which are affiliates of the investment adviser. Brokerage commissions are included in net realized gain (loss) and change in net unrealized appreciation (depreciation) in the Statement of Operations. The commissions paid to these affiliated firms were $5 for the period.
7. Committed Line of Credit.
The Fund participates with other funds managed by the investment adviser or an affiliate in a $4.25 billion credit facility (the "line of credit") to be utilized for temporary or emergency purposes to fund shareholder redemptions or for other short-term liquidity purposes. The Fund has agreed to pay commitment fees on its pro-rata portion of the line of credit, which amounted to $1,677 and is reflected in Miscellaneous expenses on the Statement of Operations. During the period, the Fund did not borrow on this line of credit.
8. Security Lending.
The Fund lends portfolio securities through a lending agent from time to time in order to earn additional income. For equity securities, a lending agent is used and may loan securities to certain qualified borrowers, including Fidelity Capital Markets (FCM), a broker-dealer affiliated with the Fund. On the settlement date of the loan, the Fund receives collateral (in the form of U.S. Treasury obligations, letters of credit and/or cash) against the loaned securities and maintains collateral in an amount not less than 100% of the market value of the loaned securities during the period of the loan. The market value of the loaned securities is determined at the close of business of the Fund and any additional required collateral is delivered to the Fund on the next business day. The Fund or borrower may terminate the loan at any time, and if the borrower defaults on its obligation to return the securities loaned because of insolvency or other reasons, the Fund may apply collateral received from the borrower against the obligation. The Fund may experience delays and costs in recovering the securities loaned. Any cash collateral received is invested in the Fidelity Securities Lending Cash Central Fund. The value of loaned securities and cash collateral at period end are disclosed on the Fund's Statement of Assets and Liabilities. Security lending income represents the income earned on investing cash collateral, less rebates paid to borrowers and any lending agent fees associated with the loan, plus any premium payments received for lending certain types of securities. Security lending income is presented in the Statement of Operations as a component of income from Fidelity Central Funds. Total security lending income during the period amounted to $11,987. During the period, there were no securities loaned to FCM.
9. Expense Reductions.
Commissions paid to certain brokers with whom the investment adviser, or its affiliates, places trades on behalf of the Fund include an amount in addition to trade execution, which may be rebated back to the Fund to offset certain expenses. This amount totaled $4,171 for the period.
Through arrangements with the Fund's custodian, credits realized as a result of certain uninvested cash balances were used to reduce the Fund's expenses. During the period, these credits reduced the Fund's custody expenses by $144.
In addition, during the period the investment adviser reimbursed and/or waived a portion of fund-level operating expenses in the amount of $5,850.
10. Distributions to Shareholders.
Distributions to shareholders of each class were as follows:
| | Six months ended
June 30, 2018 | Year ended
December 31, 2017 |
| From net investment income | | |
| Initial Class | $424,894 | $17,221,395 |
| Service Class | 2,276 | 88,590 |
| Service Class 2 | 8,330 | 334,864 |
| Investor Class | 97,973 | 3,650,622 |
| Total | $533,473 | $21,295,471 |
| From net realized gain | | |
| Initial Class | $24,340,357 | $105,443,540 |
| Service Class | 130,392 | 614,590 |
| Service Class 2 | 556,709 | 2,471,533 |
| Investor Class | 5,612,477 | 21,367,312 |
| Total | $30,639,935 | $129,896,975 |
11. Share Transactions.
Transactions for each class of shares were as follows:
| | Shares | Shares | Dollars | Dollars |
| | Six months ended June 30, 2018 | Year ended December 31, 2017 | Six months ended June 30, 2018 | Year ended December 31, 2017 |
| Initial Class | | | | |
| Shares sold | 672,165 | 1,545,508 | $10,113,179 | $23,303,863 |
| Reinvestment of distributions | 1,704,422 | 8,456,436 | 24,765,251 | 122,664,935 |
| Shares redeemed | (4,405,989) | (9,429,410) | (66,043,114) | (142,193,085) |
| Net increase (decrease) | (2,029,402) | 572,534 | $(31,164,684) | $3,775,713 |
| Service Class | | | | |
| Shares sold | 9,389 | 32,246 | $139,142 | $490,318 |
| Reinvestment of distributions | 9,213 | 48,970 | 132,668 | 703,180 |
| Shares redeemed | (18,230) | (108,242) | (273,489) | (1,616,243) |
| Net increase (decrease) | 372 | (27,026) | $(1,679) | $(422,745) |
| Service Class 2 | | | | |
| Shares sold | 106,445 | 115,984 | $1,549,254 | $1,717,563 |
| Reinvestment of distributions | 39,876 | 198,362 | 565,039 | 2,806,397 |
| Shares redeemed | (151,954) | (361,686) | (2,206,391) | (5,269,021) |
| Net increase (decrease) | (5,633) | (47,340) | $(92,098) | $(745,061) |
| Investor Class | | | | |
| Shares sold | 814,720 | 1,515,351 | $12,132,613 | $22,923,652 |
| Reinvestment of distributions | 395,461 | 1,732,942 | 5,710,450 | 25,017,934 |
| Shares redeemed | (822,173) | (1,134,202) | (12,225,782) | (16,911,601) |
| Net increase (decrease) | 388,008 | 2,114,091 | $5,617,281 | $31,029,985 |
12. Other.
The Fund's organizational documents provide former and current trustees and officers with a limited indemnification against liabilities arising in connection with the performance of their duties to the Fund. In the normal course of business, the Fund may also enter into contracts that provide general indemnifications. The Fund's maximum exposure under these arrangements is unknown as this would be dependent on future claims that may be made against the Fund. The risk of material loss from such claims is considered remote.
At the end of the period, the investment adviser or its affiliates were the owners of record of 40% of the total outstanding shares of the Fund and two otherwise unaffiliated shareholders were the owners of record of 27% of the total outstanding shares of the Fund.
Shareholder Expense Example
As a shareholder of the Fund, you incur two types of costs: (1) transaction costs and (2) ongoing costs, including management fees, distribution and/or service (12b-1) fees and other Fund expenses. This Example is intended to help you understand your ongoing costs (in dollars) of investing in the Fund and to compare these costs with the ongoing costs of investing in other mutual funds.
The Example is based on an investment of $1,000 invested at the beginning of the period and held for the entire period (January 1, 2018 to June 30, 2018).
Actual Expenses
The first line of the accompanying table for each class of the Fund provides information about actual account values and actual expenses. You may use the information in this line, together with the amount you invested, to estimate the expenses that you paid over the period. Simply divide your account value by $1,000.00 (for example, an $8,600 account value divided by $1,000.00 = 8.6), then multiply the result by the number in the first line for a class of the Fund under the heading entitled "Expenses Paid During Period" to estimate the expenses you paid on your account during this period. The estimate of expenses does not include any fees or other expenses of any variable annuity or variable life insurance product. If they were, the estimate of expenses you paid during the period would be higher, and your ending account value would be lower. In addition, the Fund, as a shareholder in the underlying Fidelity Central Funds, will indirectly bear its pro-rata share of the fees and expenses incurred by the underlying Fidelity Central Funds. These fees and expenses are not included in the Fund's annualized expense ratio used to calculate the expense estimate in the table below.
Hypothetical Example for Comparison Purposes
The second line of the accompanying table for each class of the Fund provides information about hypothetical account values and hypothetical expenses based on a Class' actual expense ratio and an assumed rate of return of 5% per year before expenses, which is not the Class' actual return. The hypothetical account values and expenses may not be used to estimate the actual ending account balance or expenses you paid for the period. You may use this information to compare the ongoing costs of investing in the Fund and other funds. To do so, compare this 5% hypothetical example with the 5% hypothetical examples that appear in the shareholder reports of the other funds. The estimate of expenses does not include any fees or other expenses of any variable annuity or variable life insurance product. If they were, the estimate of expenses you paid during the period would be higher, and your ending account value would be lower. In addition, the Fund, as a shareholder in the underlying Fidelity Central Funds, will indirectly bear its pro-rata share of the fees and expenses incurred by the underlying Fidelity Central Funds. These fees and expenses are not included in the Fund's annualized expense ratio used to calculate the expense estimate in the table below.
Please note that the expenses shown in the table are meant to highlight your ongoing costs only and do not reflect any transaction costs. Therefore, the second line of the table is useful in comparing ongoing costs only, and will not help you determine the relative total costs of owning different funds.
| | Annualized Expense Ratio-A | Beginning
Account Value
January 1, 2018 | Ending
Account Value
June 30, 2018 | Expenses Paid
During Period-B
January 1, 2018
to June 30, 2018 |
| Initial Class | .60% | | | |
| Actual | | $1,000.00 | $1,005.80 | $2.98 |
| Hypothetical-C | | $1,000.00 | $1,021.82 | $3.01 |
| Service Class | .70% | | | |
| Actual | | $1,000.00 | $1,005.20 | $3.48 |
| Hypothetical-C | | $1,000.00 | $1,021.32 | $3.51 |
| Service Class 2 | .85% | | | |
| Actual | | $1,000.00 | $1,004.50 | $4.22 |
| Hypothetical-C | | $1,000.00 | $1,020.58 | $4.26 |
| Investor Class | .68% | | | |
| Actual | | $1,000.00 | $1,005.10 | $3.38 |
| Hypothetical-C | | $1,000.00 | $1,021.42 | $3.41 |
A Annualized expense ratio reflects expenses net of applicable fee waivers.
B Expenses are equal to each Class' annualized expense ratio, multiplied by the average account value over the period, multiplied by 181/365 (to reflect the one-half year period). The fees and expenses of the underlying Fidelity Central Funds in which the Fund invests are not included in each Class' annualized expense ratio. In addition to the expenses noted above, the Fund also indirectly bears its proportional share of the expenses of the underlying Fidelity Central Funds. Annualized expenses of the underlying non-money market Fidelity Central Funds as of their most recent fiscal half year ranged from less than .005% to .07%.
C 5% return per year before expenses
VIPAM-SANN-0818
1.705701.120
Fidelity® Variable Insurance Products: Strategic Income Portfolio
Semi-Annual Report June 30, 2018 |
|
Contents
To view a fund's proxy voting guidelines and proxy voting record for the 12-month period ended June 30, visit http://www.fidelity.com/proxyvotingresults or visit the Securities and Exchange Commission's (SEC) web site at http://www.sec.gov.
You may also call 1-877-208-0098 to request a free copy of the proxy voting guidelines.
Fidelity® Variable Insurance Products are separate account options which are purchased through a variable insurance contract.
Standard & Poor's, S&P and S&P 500 are registered service marks of The McGraw-Hill Companies, Inc. and have been licensed for use by Fidelity Distributors Corporation.
Other third-party marks appearing herein are the property of their respective owners.
All other marks appearing herein are registered or unregistered trademarks or service marks of FMR LLC or an affiliated company. © 2018 FMR LLC. All rights reserved.
This report and the financial statements contained herein are submitted for the general information of the shareholders of the Fund. This report is not authorized for distribution to prospective investors in the Fund unless preceded or accompanied by an effective prospectus.
A fund files its complete schedule of portfolio holdings with the SEC for the first and third quarters of each fiscal year on Form N-Q. Forms N-Q are available on the SEC’s web site at http://www.sec.gov. A fund's Forms N-Q may be reviewed and copied at the SEC’s Public Reference Room in Washington, DC. Information regarding the operation of the SEC's Public Reference Room may be obtained by calling 1-800-SEC-0330.
For a complete list of a fund's portfolio holdings, view the most recent holdings listing, semiannual report, or annual report on Fidelity's web site at http://www.fidelity.com, http://www.institutional.fidelity.com, or http://www.401k.com, as applicable.
NOT FDIC INSURED •MAY LOSE VALUE •NO BANK GUARANTEE
Neither the Fund nor Fidelity Distributors Corporation is a bank.
Investment Summary (Unaudited)
The information in the following tables is based on the combined investments of the Fund and its pro-rata share of the investments of Fidelity's Fixed-Income Central Funds.
Top Five Holdings as of June 30, 2018
| (by issuer, excluding cash equivalents) | % of fund's net assets |
| U.S. Treasury Obligations | 16.2 |
| Freddie Mac | 2.1 |
| Ginnie Mae guaranteed REMIC pass-thru certificates | 2.1 |
| Japan Government | 2.1 |
| Ally Financial, Inc. | 1.8 |
| | 24.3 |
Top Five Market Sectors as of June 30, 2018
| | % of fund's net assets |
| Financials | 12.7 |
| Consumer Discretionary | 10.4 |
| Energy | 8.2 |
| Information Technology | 5.5 |
| Materials | 4.7 |
Quality Diversification (% of fund's net assets)
| As of June 30, 2018 |
| | U.S. Government and U.S. Government Agency Obligations* | 22.9% |
| | AAA,AA,A | 8.0% |
| | BBB | 6.3% |
| | BB | 21.9% |
| | B | 21.6% |
| | CCC,CC,C | 5.4% |
| | Not Rated | 1.9% |
| | Equities | 6.0% |
| | Short-Term Investments and Net Other Assets | 6.0% |

* Includes NCUA Guaranteed Notes
We have used ratings from Moody's Investors Service, Inc. Where Moody's® ratings are not available, we have used S&P® ratings. All ratings are as of the date indicated and do not reflect subsequent changes.
Asset Allocation (% of fund's net assets)
| As of June 30, 2018*,** |
| | Preferred Securities | 4.2% |
| | Corporate Bonds | 37.2% |
| | U.S. Government and U.S. Government Agency Obligations*** | 22.9% |
| | Foreign Government & Government Agency Obligations | 12.2% |
| | Bank Loan Obligations | 10.5% |
| | Stocks | 6.0% |
| | Other Investments | 1.0% |
| | Short-Term Investments and Net Other Assets (Liabilities) | 6.0% |

* Foreign investments - 30.9%
** Futures and Swaps - 1.9%
*** Includes NCUA Guaranteed Notes
An unaudited holdings listing for the Fund, which presents direct holdings as well as the pro-rata share of any securities and other investments held indirectly through its investment in underlying non-money market Fidelity Central Funds, is available at fidelity.com and/or institutional.fidelity.com, as applicable.
Percentages in the above tables are adjusted for the effect of TBA Sale Commitments.
Schedule of Investments June 30, 2018 (Unaudited)
Showing Percentage of Net Assets
| Corporate Bonds - 36.9% | | | |
| | | Principal Amount(a) | Value |
| Convertible Bonds - 0.3% | | | |
| CONSUMER DISCRETIONARY - 0.3% | | | |
| Auto Components - 0.0% | | | |
| Exide Technologies 7% 4/30/25 pay-in-kind (b) | | $599,427 | $389,628 |
| Media - 0.3% | | | |
| DISH Network Corp. 3.375% 8/15/26 | | 3,820,000 | 3,700,037 |
| TOTAL CONSUMER DISCRETIONARY | | | 4,089,665 |
| Nonconvertible Bonds - 36.6% | | | |
| CONSUMER DISCRETIONARY - 5.8% | | | |
| Auto Components - 0.3% | | | |
| Allison Transmission, Inc. 5% 10/1/24 (c) | | 635,000 | 624,681 |
| Delphi Technologies PLC 5% 10/1/25 (c) | | 680,000 | 648,550 |
| Exide Technologies 11% 4/30/22 pay-in-kind (b)(c) | | 586,899 | 525,275 |
| Metalsa SA de CV 4.9% 4/24/23 (c) | | 1,640,000 | 1,594,900 |
| Tenedora Nemak SA de CV 4.75% 1/23/25 (c) | | 210,000 | 198,555 |
| Tenneco, Inc. 5% 7/15/26 | | 450,000 | 401,850 |
| | | | 3,993,811 |
| Automobiles - 0.1% | | | |
| Tesla, Inc. 5.3% 8/15/25 (c) | | 1,535,000 | 1,366,150 |
| Distributors - 0.0% | | | |
| LKQ Corp. 4.75% 5/15/23 | | 115,000 | 114,425 |
| Diversified Consumer Services - 0.1% | | | |
| Laureate Education, Inc. 8.25% 5/1/25 (c) | | 1,710,000 | 1,824,365 |
| Hotels, Restaurants & Leisure - 1.9% | | | |
| 1011778 BC Unlimited Liability Co./New Red Finance, Inc. 5% 10/15/25 (c) | | 2,085,000 | 1,972,827 |
| Boyd Gaming Corp. 6% 8/15/26 (c) | | 325,000 | 320,531 |
| Cedar Fair LP/Canada's Wonderland Co. 5.375% 4/15/27 | | 345,000 | 339,825 |
| Choice Hotels International, Inc. 5.75% 7/1/22 | | 145,000 | 150,438 |
| Churchill Downs, Inc. 4.75% 1/15/28 (c) | | 465,000 | 430,125 |
| Eldorado Resorts, Inc. 6% 4/1/25 | | 630,000 | 630,788 |
| FelCor Lodging LP 6% 6/1/25 | | 565,000 | 579,125 |
| GLP Capital LP/GLP Financing II, Inc.: | | | |
| 5.25% 6/1/25 | | 615,000 | 615,000 |
| 5.75% 6/1/28 | | 485,000 | 488,638 |
| Golden Nugget, Inc.: | | | |
| 6.75% 10/15/24 (c) | | 1,135,000 | 1,135,204 |
| 8.75% 10/1/25 (c) | | 1,235,000 | 1,268,604 |
| Hilton Domestic Operating Co., Inc. 5.125% 5/1/26 (c) | | 925,000 | 908,813 |
| Hilton Worldwide Finance LLC/Hilton Worldwide Finance Corp.: | | | |
| 4.625% 4/1/25 | | 925,000 | 901,875 |
| 4.875% 4/1/27 | | 435,000 | 419,775 |
| Jacobs Entertainment, Inc. 7.875% 2/1/24 (c) | | 150,000 | 156,750 |
| KFC Holding Co./Pizza Hut Holding LLC: | | | |
| 4.75% 6/1/27 (c) | | 475,000 | 448,875 |
| 5% 6/1/24 (c) | | 475,000 | 468,920 |
| 5.25% 6/1/26 (c) | | 3,225,000 | 3,176,625 |
| LHMC Finco SARL 7.875% 12/20/23 (c) | | 600,000 | 584,220 |
| LTF Merger Sub, Inc. 8.5% 6/15/23 (c) | | 380,000 | 395,200 |
| MCE Finance Ltd. 4.875% 6/6/25 (c) | | 1,062,000 | 1,003,036 |
| Merlin Entertainments PLC 5.75% 6/15/26 (c) | | 615,000 | 624,287 |
| MGM Growth Properties Operating Partnership LP 5.625% 5/1/24 | | 365,000 | 369,563 |
| MGM Mirage, Inc. 5.75% 6/15/25 | | 755,000 | 762,550 |
| Penn National Gaming, Inc. 5.625% 1/15/27 (c) | | 120,000 | 113,100 |
| Scientific Games Corp.: | | | |
| 5% 10/15/25 (c) | | 980,000 | 933,450 |
| 10% 12/1/22 | | 1,276,000 | 1,361,454 |
| Silversea Cruises 7.25% 2/1/25 (c) | | 255,000 | 275,426 |
| Six Flags Entertainment Corp.: | | | |
| 4.875% 7/31/24 (c) | | 715,000 | 694,766 |
| 5.5% 4/15/27 (c) | | 380,000 | 368,965 |
| Stars Group Holdings BV 7% 7/15/26 (c)(d) | | 640,000 | 646,400 |
| Station Casinos LLC 5% 10/1/25 (c) | | 620,000 | 582,800 |
| Studio City Co. Ltd.: | | | |
| 5.875% 11/30/19 (c) | | 420,000 | 424,200 |
| 7.25% 11/30/21 (c) | | 1,085,000 | 1,120,263 |
| Viking Cruises Ltd. 5.875% 9/15/27 (c) | | 595,000 | 562,275 |
| Voc Escrow Ltd. 5% 2/15/28 (c) | | 545,000 | 514,867 |
| Wynn Las Vegas LLC/Wynn Las Vegas Capital Corp. 5.25% 5/15/27 (c) | | 1,410,000 | 1,318,350 |
| Wynn Macau Ltd.: | | | |
| 4.875% 10/1/24 (c) | | 855,000 | 816,269 |
| 5.5% 10/1/27 (c) | | 1,230,000 | 1,174,650 |
| | | | 29,058,829 |
| Household Durables - 0.5% | | | |
| Lennar Corp. 4.75% 11/29/27 | | 620,000 | 579,514 |
| LGI Homes, Inc. 6.875% 7/15/26 (c) | | 605,000 | 603,488 |
| Reynolds Group Issuer, Inc./Reynolds Group Issuer LLC/Reynolds Group Issuer (Luxembourg) SA: | | | |
| 5.125% 7/15/23 (c) | | 285,000 | 281,438 |
| 5.75% 10/15/20 | | 2,476,070 | 2,485,355 |
| 7% 7/15/24 (c) | | 360,000 | 367,650 |
| Taylor Morrison Communities, Inc./Monarch Communities, Inc. 5.875% 4/15/23 (c) | | 435,000 | 432,825 |
| Toll Brothers Finance Corp. 4.375% 4/15/23 | | 1,106,000 | 1,083,880 |
| TRI Pointe Homes, Inc.: | | | |
| 4.375% 6/15/19 | | 320,000 | 321,664 |
| 5.875% 6/15/24 | | 780,000 | 774,150 |
| William Lyon Homes, Inc.: | | | |
| 5.875% 1/31/25 | | 380,000 | 359,575 |
| 6% 9/1/23 (c) | | 375,000 | 370,204 |
| | | | 7,659,743 |
| Internet & Direct Marketing Retail - 0.6% | | | |
| Netflix, Inc.: | | | |
| 4.375% 11/15/26 | | 640,000 | 602,880 |
| 4.875% 4/15/28 (c) | | 1,465,000 | 1,396,394 |
| 5.375% 2/1/21 (c) | | 420,000 | 431,676 |
| 5.75% 3/1/24 | | 612,000 | 627,361 |
| 5.875% 2/15/25 | | 1,395,000 | 1,430,977 |
| 5.875% 11/15/28 (c) | | 2,845,000 | 2,872,597 |
| Zayo Group LLC/Zayo Capital, Inc.: | | | |
| 5.75% 1/15/27 (c) | | 1,605,000 | 1,576,913 |
| 6% 4/1/23 | | 580,000 | 590,150 |
| 6.375% 5/15/25 | | 120,000 | 122,250 |
| | | | 9,651,198 |
| Media - 2.2% | | | |
| Altice SA 7.625% 2/15/25 (c) | | 925,000 | 851,000 |
| Altice U.S. Finance SA 5.5% 5/15/26 (c) | | 1,780,000 | 1,717,700 |
| Block Communications, Inc. 6.875% 2/15/25 (c) | | 480,000 | 478,800 |
| Cablevision SA 6.5% 6/15/21 (c) | | 420,000 | 417,287 |
| CCO Holdings LLC/CCO Holdings Capital Corp.: | | | |
| 5% 2/1/28 (c) | | 1,530,000 | 1,399,950 |
| 5.125% 2/15/23 | | 1,565,000 | 1,548,865 |
| 5.125% 5/1/23 (c) | | 720,000 | 710,784 |
| 5.125% 5/1/27 (c) | | 2,570,000 | 2,399,738 |
| 5.375% 5/1/25 (c) | | 720,000 | 696,600 |
| 5.5% 5/1/26 (c) | | 2,450,000 | 2,375,765 |
| 5.75% 9/1/23 | | 500,000 | 503,750 |
| 5.75% 1/15/24 | | 555,000 | 556,388 |
| 5.75% 2/15/26 (c) | | 1,030,000 | 1,011,975 |
| Cequel Communications Holdings I LLC/Cequel Capital Corp.: | | | |
| 5.125% 12/15/21 (c) | | 1,490,000 | 1,480,688 |
| 7.5% 4/1/28 (c) | | 1,540,000 | 1,558,788 |
| CSC Holdings LLC 5.375% 2/1/28 (c) | | 890,000 | 823,250 |
| Globo Comunicacao e Participacoes SA: | | | |
| 4.843% 6/8/25 (c) | | 590,000 | 553,426 |
| 4.875% 4/11/22 (c) | | 250,000 | 245,625 |
| 5.125% 3/31/27 (c) | | 205,000 | 190,396 |
| iHeartCommunications, Inc. 11.25% 3/1/21 (c)(e) | | 630,000 | 466,200 |
| Liberty Media Corp.: | | | |
| 8.25% 2/1/30 | | 1,610,000 | 1,707,647 |
| 8.5% 7/15/29 | | 270,000 | 290,250 |
| Lions Gate Entertainment Corp. 5.875% 11/1/24 (c) | | 215,000 | 217,688 |
| New Cotai LLC/New Cotai Capital Corp. 10.625% 5/1/19 pay-in-kind (b)(c) | | 1,892,145 | 1,863,763 |
| Nielsen Finance LLC/Nielsen Finance Co. 5% 4/15/22 (c) | | 295,000 | 289,867 |
| Quebecor Media, Inc. 5.75% 1/15/23 | | 790,000 | 805,800 |
| Sirius XM Radio, Inc.: | | | |
| 4.625% 5/15/23 (c) | | 260,000 | 254,475 |
| 5% 8/1/27 (c) | | 615,000 | 573,488 |
| 5.375% 4/15/25 (c) | | 620,000 | 611,475 |
| 5.375% 7/15/26 (c) | | 620,000 | 596,750 |
| Tegna, Inc. 5.5% 9/15/24 (c) | | 410,000 | 410,000 |
| TV Azteca SA de CV 8.25% 8/9/24 (Reg. S) | | 1,900,000 | 1,853,450 |
| Videotron Ltd. 5.125% 4/15/27 (c) | | 615,000 | 596,673 |
| VTR Finance BV 6.875% 1/15/24 (c) | | 1,000,000 | 1,004,700 |
| WMG Acquisition Corp. 5.625% 4/15/22 (c) | | 103,000 | 105,306 |
| Ziggo Bond Finance BV 6% 1/15/27 (c) | | 635,000 | 586,581 |
| Ziggo Secured Finance BV 5.5% 1/15/27 (c) | | 1,270,000 | 1,186,307 |
| | | | 32,941,195 |
| Specialty Retail - 0.1% | | | |
| Penske Automotive Group, Inc. 5.5% 5/15/26 | | 460,000 | 450,800 |
| Sonic Automotive, Inc.: | | | |
| 5% 5/15/23 | | 85,000 | 81,175 |
| 6.125% 3/15/27 | | 310,000 | 292,950 |
| | | | 824,925 |
| Textiles, Apparel & Luxury Goods - 0.0% | | | |
| Tecpetrol SA 4.875% 12/12/22 (c) | | 170,000 | 156,774 |
| TOTAL CONSUMER DISCRETIONARY | | | 87,591,415 |
| CONSUMER STAPLES - 1.4% | | | |
| Beverages - 0.0% | | | |
| Central American Bottling Corp. 5.75% 1/31/27 (c) | | 105,000 | 104,475 |
| Food & Staples Retailing - 0.1% | | | |
| ESAL GmbH 6.25% 2/5/23 (c) | | 1,705,000 | 1,587,798 |
| Minerva Luxembourg SA 6.5% 9/20/26 (c) | | 380,000 | 348,175 |
| | | | 1,935,973 |
| Food Products - 1.0% | | | |
| B&G Foods, Inc. 4.625% 6/1/21 | | 565,000 | 556,525 |
| CF Industries Holdings, Inc.: | | | |
| 4.95% 6/1/43 | | 610,000 | 513,547 |
| 5.15% 3/15/34 | | 615,000 | 570,413 |
| 5.375% 3/15/44 | | 615,000 | 542,738 |
| JBS Investments GmbH: | | | |
| 7.25% 4/3/24 (c) | | 2,205,000 | 2,135,631 |
| 7.75% 10/28/20 (c) | | 560,000 | 569,800 |
| JBS U.S.A. LLC/JBS U.S.A. Finance, Inc.: | | | |
| 5.75% 6/15/25 (c) | | 1,030,000 | 957,900 |
| 5.875% 7/15/24 (c) | | 1,812,000 | 1,730,460 |
| 6.75% 2/15/28 (c) | | 925,000 | 873,848 |
| 7.25% 6/1/21 (c) | | 350,000 | 353,500 |
| Lamb Weston Holdings, Inc.: | | | |
| 4.625% 11/1/24 (c) | | 425,000 | 413,313 |
| 4.875% 11/1/26 (c) | | 430,000 | 418,175 |
| Pilgrim's Pride Corp.: | | | |
| 5.75% 3/15/25 (c) | | 925,000 | 888,000 |
| 5.875% 9/30/27 (c) | | 360,000 | 333,900 |
| Post Holdings, Inc.: | | | |
| 5% 8/15/26 (c) | | 2,440,000 | 2,275,300 |
| 5.5% 3/1/25 (c) | | 530,000 | 517,413 |
| 5.75% 3/1/27 (c) | | 405,000 | 390,825 |
| TreeHouse Foods, Inc. 4.875% 3/15/22 | | 200,000 | 200,250 |
| | | | 14,241,538 |
| Household Products - 0.1% | | | |
| Edgewell Personal Care Co. 5.5% 6/15/25 (c) | | 375,000 | 368,438 |
| Spectrum Brands Holdings, Inc. 5.75% 7/15/25 | | 600,000 | 592,500 |
| | | | 960,938 |
| Personal Products - 0.1% | | | |
| First Quality Finance Co., Inc. 5% 7/1/25 (c) | | 490,000 | 448,350 |
| Prestige Brands, Inc. 5.375% 12/15/21 (c) | | 725,000 | 725,000 |
| | | | 1,173,350 |
| Tobacco - 0.1% | | | |
| BAT International Finance PLC 2.25% 1/16/30 | EUR | 1,715,000 | 1,993,913 |
| TOTAL CONSUMER STAPLES | | | 20,410,187 |
| ENERGY - 6.2% | | | |
| Energy Equipment & Services - 0.9% | | | |
| Borets Finance DAC 6.5% 4/7/22 (c) | | 310,000 | 308,450 |
| Compressco Partners LP/Compressco Finance, Inc. 7.5% 4/1/25 (c) | | 615,000 | 617,306 |
| Ensco PLC: | | | |
| 4.5% 10/1/24 | | 665,000 | 547,794 |
| 5.2% 3/15/25 | | 420,000 | 348,600 |
| 5.75% 10/1/44 | | 600,000 | 423,750 |
| 7.75% 2/1/26 | | 685,000 | 647,120 |
| Exterran Energy Solutions LP 8.125% 5/1/25 | | 575,000 | 606,625 |
| Exterran Partners LP/EXLP Finance Corp. 6% 10/1/22 | | 385,000 | 381,150 |
| Forum Energy Technologies, Inc. 6.25% 10/1/21 | | 715,000 | 713,213 |
| Hornbeck Offshore Services, Inc. 5.875% 4/1/20 | | 415,000 | 309,175 |
| Jonah Energy LLC 7.25% 10/15/25 (c) | | 650,000 | 524,875 |
| Noble Holding International Ltd.: | | | |
| 6.2% 8/1/40 | | 235,000 | 169,200 |
| 7.875% 2/1/26 (c) | | 1,210,000 | 1,246,300 |
| 7.95% 4/1/25 (b) | | 520,000 | 483,600 |
| 8.95% 4/1/45 (b) | | 120,000 | 109,500 |
| SESI LLC 7.75% 9/15/24 | | 365,000 | 374,581 |
| Southern Gas Corridor CJSC 6.875% 3/24/26 (c) | | 610,000 | 657,653 |
| Summit Midstream Holdings LLC 5.75% 4/15/25 | | 440,000 | 418,000 |
| The Oil and Gas Holding Co. 7.5% 10/25/27 (c) | | 500,000 | 444,562 |
| Transocean Guardian Ltd. 5.875% 1/15/24 (c)(d) | | 860,000 | 857,850 |
| Transocean, Inc.: | | | |
| 7.5% 1/15/26 (c) | | 645,000 | 655,078 |
| 9% 7/15/23 (c) | | 1,330,000 | 1,431,413 |
| Trinidad Drilling Ltd. 6.625% 2/15/25 (c) | | 250,000 | 240,625 |
| Unit Corp. 6.625% 5/15/21 | | 120,000 | 119,700 |
| Weatherford International, Inc. 9.875% 3/1/25 (c) | | 770,000 | 773,850 |
| | | | 13,409,970 |
| Oil, Gas & Consumable Fuels - 5.3% | | | |
| American Energy-Permian Basin LLC/AEPB Finance Corp. 13% 11/30/20 (c) | | 940,000 | 1,038,700 |
| Antero Midstream Partners LP/Antero Midstream Finance Corp. 5.375% 9/15/24 | | 245,000 | 246,838 |
| Antero Resources Corp.: | | | |
| 5.125% 12/1/22 | | 45,000 | 45,113 |
| 5.625% 6/1/23 (Reg. S) | | 560,000 | 567,000 |
| Antero Resources Finance Corp. 5.375% 11/1/21 | | 295,000 | 298,688 |
| California Resources Corp. 8% 12/15/22 (c) | | 300,000 | 272,250 |
| Callon Petroleum Co. 6.125% 10/1/24 | | 225,000 | 227,813 |
| Carrizo Oil & Gas, Inc. 6.25% 4/15/23 | | 380,000 | 384,750 |
| Cheniere Corpus Christi Holdings LLC: | | | |
| 5.125% 6/30/27 | | 630,000 | 624,488 |
| 5.875% 3/31/25 | | 790,000 | 821,600 |
| 7% 6/30/24 | | 710,000 | 773,900 |
| Chesapeake Energy Corp.: | | | |
| 8% 12/15/22 (c) | | 1,222,000 | 1,282,733 |
| 8% 1/15/25 | | 345,000 | 351,365 |
| Citgo Holding, Inc. 10.75% 2/15/20 (c) | | 3,117,000 | 3,315,709 |
| CNX Midstream Partners LP 6.5% 3/15/26 (c) | | 335,000 | 325,788 |
| Concho Resources, Inc. 4.375% 1/15/25 | | 630,000 | 632,658 |
| Consolidated Energy Finance SA: | | | |
| 3 month U.S. LIBOR + 3.750% 6.0906% 6/15/22 (b)(c)(f) | | 155,000 | 155,058 |
| 6.5% 5/15/26 (c) | | 615,000 | 608,850 |
| 6.875% 6/15/25 (c) | | 310,000 | 318,138 |
| Continental Resources, Inc. 4.375% 1/15/28 | | 775,000 | 770,458 |
| Crestwood Midstream Partners LP/Crestwood Midstream Finance Corp.: | | | |
| 5.75% 4/1/25 | | 465,000 | 464,419 |
| 6.25% 4/1/23 | | 1,975,000 | 2,014,500 |
| CVR Refining LLC/Coffeyville Finance, Inc. 6.5% 11/1/22 | | 1,070,000 | 1,091,400 |
| Denbury Resources, Inc.: | | | |
| 4.625% 7/15/23 | | 705,000 | 615,324 |
| 5.5% 5/1/22 | | 1,945,000 | 1,789,400 |
| 6.375% 8/15/21 | | 1,050,000 | 1,005,375 |
| 9% 5/15/21 (c) | | 2,465,000 | 2,605,998 |
| Diamondback Energy, Inc.: | | | |
| 4.75% 11/1/24 | | 540,000 | 526,500 |
| 5.375% 5/31/25 | | 255,000 | 255,000 |
| DTEK Finance PLC 10.75% 12/31/24 pay-in-kind (b) | | 945,000 | 972,046 |
| Endeavor Energy Resources LP/EER Finance, Inc.: | | | |
| 5.5% 1/30/26 (c) | | 265,000 | 257,050 |
| 5.75% 1/30/28 (c) | | 265,000 | 258,375 |
| Energy Transfer Equity LP 5.5% 6/1/27 | | 860,000 | 860,000 |
| EnLink Midstream Partners LP: | | | |
| 4.15% 6/1/25 | | 465,000 | 429,632 |
| 4.4% 4/1/24 | | 460,000 | 442,335 |
| EP Energy LLC/Everest Acquisition Finance, Inc.: | | | |
| 7.75% 5/15/26 (c) | | 2,075,000 | 2,121,688 |
| 8% 11/29/24 (c) | | 350,000 | 353,500 |
| Extraction Oil & Gas, Inc. 7.375% 5/15/24 (c) | | 365,000 | 382,338 |
| Frontera Energy Corp. 9.7% 6/25/23 (c) | | 415,000 | 411,369 |
| Genesis Energy LP/Genesis Energy Finance Corp. 6.25% 5/15/26 | | 465,000 | 438,263 |
| Georgian Oil & Gas Corp. 6.75% 4/26/21 (c) | | 495,000 | 497,396 |
| Global Partners LP/GLP Finance Corp.: | | | |
| 6.25% 7/15/22 | | 130,000 | 126,100 |
| 7% 6/15/23 | | 580,000 | 575,650 |
| Gran Tierra Energy International Holdings Ltd. 6.25% 2/15/25 (c) | | 225,000 | 211,219 |
| Hess Infrastructure Partners LP 5.625% 2/15/26 (c) | | 795,000 | 793,013 |
| Hilcorp Energy I LP/Hilcorp Finance Co.: | | | |
| 5% 12/1/24 (c) | | 510,000 | 494,700 |
| 5.75% 10/1/25 (c) | | 580,000 | 578,550 |
| Holly Energy Partners LP/Holly Finance Corp. 6% 8/1/24 (c) | | 390,000 | 393,900 |
| Indigo Natural Resources LLC 6.875% 2/15/26 (c) | | 710,000 | 686,925 |
| Indika Energy Capital II Pte. Ltd. 6.875% 4/10/22 (c) | | 755,000 | 739,685 |
| Jupiter Resources, Inc. 8.5% 10/1/22 (c) | | 360,000 | 146,700 |
| KazMunaiGaz Finance Sub BV: | | | |
| 4.75% 4/24/25 (c) | | 295,000 | 295,000 |
| 6.375% 10/24/48 (c) | | 170,000 | 171,658 |
| Kosmos Energy Ltd.: | | | |
| 7.875% 8/1/21 (c) | | 1,020,000 | 1,036,575 |
| 7.875% 8/1/21 (c) | | 1,140,000 | 1,158,525 |
| Murphy Oil U.S.A., Inc. 5.625% 5/1/27 | | 305,000 | 298,138 |
| Newfield Exploration Co.: | | | |
| 5.375% 1/1/26 | | 475,000 | 485,688 |
| 5.625% 7/1/24 | | 75,000 | 79,031 |
| NGL Energy Partners LP/NGL Energy Finance Corp. 6.125% 3/1/25 | | 625,000 | 590,625 |
| NGPL PipeCo LLC: | | | |
| 4.375% 8/15/22 (c) | | 150,000 | 148,500 |
| 4.875% 8/15/27 (c) | | 150,000 | 148,125 |
| Nostrum Oil & Gas Finance BV 8% 7/25/22 (c) | | 1,785,000 | 1,693,965 |
| Pan American Energy LLC 7.875% 5/7/21 (c) | | 990,000 | 1,016,304 |
| Parsley Energy LLC/Parsley: | | | |
| 5.25% 8/15/25 (c) | | 380,000 | 373,350 |
| 5.625% 10/15/27 (c) | | 300,000 | 297,750 |
| 6.25% 6/1/24 (c) | | 420,000 | 435,750 |
| PBF Holding Co. LLC/PBF Finance Corp.: | | | |
| 7% 11/15/23 | | 1,695,000 | 1,754,325 |
| 7.25% 6/15/25 | | 1,145,000 | 1,203,681 |
| PBF Logistics LP/PBF Logistics Finance, Inc. 6.875% 5/15/23 | | 435,000 | 438,806 |
| PDC Energy, Inc. 6.125% 9/15/24 | | 200,000 | 204,000 |
| Pemex Project Funding Master Trust: | | | |
| 6.625% 6/15/35 | | 1,615,000 | 1,578,663 |
| 8.625% 12/1/23 (b) | | 250,000 | 285,034 |
| Petrobras Energia SA 7.375% 7/21/23 (c) | | 620,000 | 591,480 |
| Petrobras Global Finance BV: | | | |
| 5.999% 1/27/28 (c) | | 451,000 | 409,914 |
| 6.125% 1/17/22 | | 633,000 | 643,761 |
| 6.25% 3/17/24 | | 570,000 | 565,155 |
| 8.75% 5/23/26 | | 2,815,000 | 3,047,238 |
| Petrobras International Finance Co. Ltd. 6.875% 1/20/40 | | 119,000 | 107,636 |
| Petroleos de Venezuela SA: | | | |
| 5.375% 4/12/27 (e) | | 480,000 | 110,400 |
| 6% 5/16/24 (c)(e) | | 385,000 | 81,120 |
| 6% 11/15/26 (c)(e) | | 930,000 | 195,300 |
| 12.75% 2/17/22 (c)(e) | | 110,000 | 28,270 |
| Petroleos Mexicanos: | | | |
| 4.625% 9/21/23 | | 100,000 | 98,600 |
| 4.875% 1/18/24 | | 110,000 | 108,589 |
| 6.375% 1/23/45 | | 815,000 | 750,615 |
| 6.5% 6/2/41 | | 2,680,000 | 2,520,272 |
| 6.625% (c)(g) | | 730,000 | 687,930 |
| 6.75% 9/21/47 | | 1,613,000 | 1,533,157 |
| Petroleum Co. of Trinidad & Tobago Ltd. 9.75% 8/14/19 (Reg. S) | | 100,000 | 102,875 |
| PT Pertamina Persero 6.5% 5/27/41 (c) | | 175,000 | 184,153 |
| QEP Resources, Inc. 5.25% 5/1/23 | | 610,000 | 596,275 |
| Range Resources Corp. 5% 3/15/23 | | 960,000 | 932,640 |
| RSP Permian, Inc.: | | | |
| 5.25% 1/15/25 | | 220,000 | 235,180 |
| 6.625% 10/1/22 | | 230,000 | 241,661 |
| Sabine Pass Liquefaction LLC: | | | |
| 5% 3/15/27 | | 955,000 | 970,133 |
| 5.875% 6/30/26 | | 925,000 | 991,755 |
| SemGroup Corp.: | | | |
| 6.375% 3/15/25 | | 310,000 | 294,500 |
| 7.25% 3/15/26 | | 580,000 | 568,400 |
| SM Energy Co.: | | | |
| 5.625% 6/1/25 | | 280,000 | 270,200 |
| 6.75% 9/15/26 | | 250,000 | 250,625 |
| Southern Star Central Corp. 5.125% 7/15/22 (c) | | 320,000 | 319,200 |
| Southwestern Energy Co.: | | | |
| 4.1% 3/15/22 | | 910,000 | 869,050 |
| 7.5% 4/1/26 | | 470,000 | 486,450 |
| 7.75% 10/1/27 | | 420,000 | 434,700 |
| SRC Energy, Inc. 6.25% 12/1/25 (c) | | 380,000 | 379,525 |
| Sunoco LP/Sunoco Finance Corp.: | | | |
| 4.875% 1/15/23 (c) | | 465,000 | 446,400 |
| 5.5% 2/15/26 (c) | | 595,000 | 563,763 |
| Targa Resources Partners LP/Targa Resources Partners Finance Corp.: | | | |
| 5% 1/15/28 (c) | | 620,000 | 576,600 |
| 5.125% 2/1/25 | | 320,000 | 316,000 |
| 5.375% 2/1/27 | | 320,000 | 310,400 |
| 5.875% 4/15/26 (c) | | 925,000 | 931,938 |
| Teekay Corp. 8.5% 1/15/20 | | 880,000 | 906,400 |
| Teine Energy Ltd. 6.875% 9/30/22 (c) | | 590,000 | 595,900 |
| Tennessee Gas Pipeline Co. 7.625% 4/1/37 | | 50,000 | 60,243 |
| Tesoro Logistics LP/Tesoro Logistics Finance Corp. 6.375% 5/1/24 | | 245,000 | 261,538 |
| Transportadora de Gas del Sur SA 6.75% 5/2/25 (c) | | 1,065,000 | 974,475 |
| Tullow Oil PLC 7% 3/1/25 (c) | | 280,000 | 265,370 |
| Ultra Resources, Inc.: | | | |
| 6.875% 4/15/22 (c) | | 460,000 | 348,450 |
| 7.125% 4/15/25 (c) | | 305,000 | 214,263 |
| Whiting Petroleum Corp. 6.625% 1/15/26 (c) | | 425,000 | 438,281 |
| WPX Energy, Inc.: | | | |
| 5.25% 9/15/24 | | 490,000 | 482,038 |
| 5.75% 6/1/26 | | 465,000 | 467,186 |
| 6% 1/15/22 | | 730,000 | 759,200 |
| YPF SA: | | | |
| 7% 12/15/47 (c) | | 745,000 | 562,475 |
| 8.5% 3/23/21 (c) | | 445,000 | 452,343 |
| 8.75% 4/4/24 (c) | | 1,805,000 | 1,778,106 |
| | | | 80,611,868 |
| TOTAL ENERGY | | | 94,021,838 |
| FINANCIALS - 8.4% | | | |
| Banks - 2.6% | | | |
| Access Bank PLC: | | | |
| 9.25% 6/24/21 (b)(c) | | 450,000 | 439,313 |
| 10.5% 10/19/21 (c) | | 95,000 | 98,487 |
| Akbank TAS/Ak Finansal Kiralama A/S 7.2% 3/16/27 (b)(c) | | 330,000 | 298,073 |
| Banco de Bogota SA 6.25% 5/12/26 (c) | | 270,000 | 275,570 |
| Banco de Reservas de La Republica Dominicana 7% 2/1/23 (c) | | 500,000 | 502,500 |
| Banco Do Brasil SA: | | | |
| 4.625% 1/15/25 (c) | | 280,000 | 257,953 |
| 4.875% 4/19/23 (c) | | 280,000 | 268,100 |
| Banco Hipotecario SA 9.75% 11/30/20 (c) | | 1,810,000 | 1,866,689 |
| Banco Macro SA 6.75% 11/4/26 (b)(c) | | 1,170,000 | 1,093,950 |
| Banque Centrale de Tunisie 5.75% 1/30/25 (c) | | 385,000 | 338,609 |
| Barclays Bank PLC 6.625% 3/30/22 (Reg. S) | EUR | 500,000 | 688,406 |
| Barclays PLC 2% 2/7/28 (Reg. S) (b) | EUR | 1,800,000 | 2,008,852 |
| BBVA Bancomer SA 7.25% 4/22/20 (c) | | 475,000 | 496,375 |
| Biz Finance PLC 9.625% 4/27/22 (c) | | 150,000 | 150,030 |
| BTA Bank JSC 5.5% 12/21/22 (c) | | 227,000 | 226,342 |
| CaixaBank SA 2.75% 7/14/28 (Reg. S) (b) | EUR | 1,700,000 | 2,010,528 |
| CBOM Finance PLC 7.5% 10/5/27 (b)(c) | | 485,000 | 394,546 |
| CIT Group, Inc.: | | | |
| 5% 8/15/22 | | 696,000 | 703,830 |
| 5.375% 5/15/20 | | 69,000 | 70,811 |
| Citigroup, Inc. 1.625% 3/21/28 (Reg. S) | EUR | 1,700,000 | 1,971,653 |
| Export-Import Bank of Korea 6.2% 8/7/21 (c) | INR | 21,400,000 | 296,680 |
| Fidelity Bank PLC 10.5% 10/16/22 (c) | | 510,000 | 499,565 |
| HBOS PLC 4.5% 3/18/30 (b) | EUR | 1,350,000 | 1,777,386 |
| ING Groep NV 2% 3/22/30 (b) | EUR | 3,000,000 | 3,437,620 |
| Intesa Sanpaolo SpA 3.928% 9/15/26 (Reg. S) | EUR | 400,000 | 472,432 |
| Itau Unibanco Holding SA: | | | |
| 5.125% 5/13/23 (Reg. S) | | 530,000 | 524,700 |
| 5.5% 8/6/22 (c) | | 490,000 | 496,125 |
| JSC BGEO Group 6% 7/26/23 (c) | | 850,000 | 845,575 |
| Lloyds Banking Group PLC 0.625% 1/15/24 (b) | EUR | 3,000,000 | 3,411,783 |
| PSB Finance SA 5.25% 10/19/19 | | 425,000 | 386,750 |
| Royal Bank of Scotland Group PLC 3.625% 3/25/24 (Reg. S) (b) | EUR | 1,000,000 | 1,189,717 |
| SB Capital SA 5.5% 2/26/24 (b)(c) | | 435,000 | 435,291 |
| Trade and Development Bank of Mongolia LLC 9.375% 5/19/20 (c) | | 695,000 | 730,907 |
| Turkiye Garanti Bankasi A/S: | | | |
| 6.125% 5/24/27 (b)(c) | | 360,000 | 315,228 |
| 6.25% 4/20/21 (c) | | 200,000 | 199,501 |
| Turkiye Ihracat Kredi Bankasi A/S 6.125% 5/3/24 (c) | | 265,000 | 245,258 |
| Turkiye Is Bankasi A/S: | | | |
| 5.5% 4/21/19 (c) | | 200,000 | 198,704 |
| 5.5% 4/21/22 (c) | | 410,000 | 377,241 |
| Turkiye Vakiflar Bankasi TAO: | | | |
| 5.75% 1/30/23 (c) | | 285,000 | 254,672 |
| 6.875% 2/3/25 (Reg. S) (b) | | 1,000,000 | 891,208 |
| UniCredit SpA 6.95% 10/31/22 (Reg. S) | EUR | 3,800,000 | 5,127,382 |
| Zenith Bank PLC: | | | |
| 6.25% 4/22/19 (c) | | 1,705,000 | 1,705,887 |
| 7.375% 5/30/22 (c) | | 1,135,000 | 1,126,011 |
| | | | 39,106,240 |
| Capital Markets - 0.4% | | | |
| AssuredPartners, Inc. 7% 8/15/25 (c) | | 245,000 | 235,813 |
| BCD Acquisition, Inc. 9.625% 9/15/23 (c) | | 945,000 | 1,006,425 |
| Goldman Sachs Group, Inc. 2% 3/22/28 | EUR | 1,300,000 | 1,544,840 |
| JAB Holdings BV 2.5% 6/25/29 | EUR | 2,000,000 | 2,350,041 |
| MSCI, Inc.: | | | |
| 5.25% 11/15/24 (c) | | 345,000 | 348,450 |
| 5.75% 8/15/25 (c) | | 365,000 | 375,950 |
| | | | 5,861,519 |
| Consumer Finance - 2.4% | | | |
| Ally Financial, Inc.: | | | |
| 4.125% 2/13/22 | | 1,160,000 | 1,139,352 |
| 4.625% 3/30/25 | | 1,915,000 | 1,886,275 |
| 5.125% 9/30/24 | | 2,750,000 | 2,798,125 |
| 8% 11/1/31 | | 16,143,000 | 19,210,170 |
| 8% 11/1/31 | | 823,000 | 975,255 |
| Credito Real S.A.B. de CV 7.5% 3/13/19 (c) | | 430,000 | 433,225 |
| Navient Corp.: | | | |
| 5.875% 10/25/24 | | 2,745,000 | 2,652,356 |
| 6.5% 6/15/22 | | 470,000 | 481,825 |
| 7.25% 9/25/23 | | 285,000 | 298,538 |
| SLM Corp.: | | | |
| 5.5% 1/25/23 | | 1,685,000 | 1,655,513 |
| 6.125% 3/25/24 | | 830,000 | 819,625 |
| 7.25% 1/25/22 | | 2,650,000 | 2,772,563 |
| Springleaf Financial Corp. 6.875% 3/15/25 | | 1,170,000 | 1,161,225 |
| | | | 36,284,047 |
| Diversified Financial Services - 1.3% | | | |
| 1MDB Global Investments Ltd. 4.4% 3/9/23 | | 1,000,000 | 878,160 |
| Cimpor Financial Operations BV 5.75% 7/17/24 (c) | | 705,000 | 564,000 |
| Eagle Intermediate Global Holding BV 7.5% 5/1/25 (c) | | 235,000 | 234,706 |
| Grinding Media, Inc./MC Grinding Media Canada, Inc. 7.375% 12/15/23 (c) | | 390,000 | 406,575 |
| Icahn Enterprises LP/Icahn Enterprises Finance Corp.: | | | |
| 5.875% 2/1/22 | | 3,370,000 | 3,374,213 |
| 6% 8/1/20 | | 995,000 | 1,007,438 |
| 6.25% 2/1/22 | | 1,050,000 | 1,071,000 |
| 6.375% 12/15/25 | | 2,785,000 | 2,788,481 |
| 6.75% 2/1/24 | | 535,000 | 539,013 |
| j2 Cloud Services LLC/j2 Global Communications, Inc. 6% 7/15/25 (c) | | 410,000 | 415,125 |
| James Hardie International Finance Ltd.: | | | |
| 4.75% 1/15/25 (c) | | 450,000 | 438,750 |
| 5% 1/15/28 (c) | | 455,000 | 429,975 |
| PT Bukit Makmur Mandiri Utama 7.75% 2/13/22 (c) | | 610,000 | 588,454 |
| Sistema International Funding SA 6.95% 5/17/19 (c) | | 1,065,000 | 1,051,475 |
| Solera LLC/Solera Finance, Inc. 10.5% 3/1/24 (c) | | 1,590,000 | 1,765,902 |
| Sparc Em Spc 0% 12/5/22 (c) | | 200,000 | 178,900 |
| TMK Capital SA 6.75% 4/3/20 (Reg. S) | | 400,000 | 403,800 |
| Valvoline, Inc. 5.5% 7/15/24 | | 230,000 | 232,300 |
| Venator Finance SARL/Venator Capital Management Ltd. 5.75% 7/15/25 (c) | | 525,000 | 501,375 |
| Vertiv Inter Holding Corp. 12% 2/15/22 pay-in-kind (b)(c) | | 915,000 | 887,550 |
| Wendel SA 2.75% 10/2/24 (Reg. S) | EUR | 1,600,000 | 2,007,196 |
| | | | 19,764,388 |
| Insurance - 1.3% | | | |
| ACE INA Holdings, Inc.: | | | |
| 1.55% 3/15/28 | EUR | 1,350,000 | 1,563,790 |
| 2.5% 3/15/38 | EUR | 750,000 | 881,403 |
| Acrisure LLC 7% 11/15/25 (c) | | 910,000 | 828,100 |
| Alliant Holdings Co.-Issuer, Inc./Wayne Merger Sub LLC 8.25% 8/1/23 (c) | | 1,440,000 | 1,486,620 |
| AmWINS Group, Inc. 7.75% 7/1/26 (c) | | 300,000 | 304,500 |
| Assicurazioni Generali SpA 7.75% 12/12/42 (b) | EUR | 3,000,000 | 4,087,662 |
| Aviva PLC 6.125% 7/5/43 (b) | EUR | 700,000 | 965,142 |
| AXA SA 3.25% 5/28/49 (b) | EUR | 1,500,000 | 1,680,584 |
| Centene Escrow Corp. 5.375% 6/1/26 (c) | | 1,545,000 | 1,565,286 |
| Credit Agricole Assurances SA 2.625% 1/29/48 (b) | EUR | 3,100,000 | 3,262,499 |
| HUB International Ltd. 7% 5/1/26 (c) | | 595,000 | 587,563 |
| MAPFRE SA 4.375% 3/31/47 (Reg. S) (b) | EUR | 1,600,000 | 1,950,693 |
| USIS Merger Sub, Inc. 6.875% 5/1/25 (c) | | 615,000 | 611,925 |
| | | | 19,775,767 |
| Mortgage Real Estate Investment Trusts - 0.1% | | | |
| Starwood Property Trust, Inc. 4.75% 3/15/25 (c) | | 595,000 | 571,200 |
| Thrifts & Mortgage Finance - 0.3% | | | |
| Nationwide Building Society 2% 7/25/29 (Reg. S) (b) | EUR | 3,821,000 | 4,379,730 |
| TOTAL FINANCIALS | | | 125,742,891 |
| HEALTH CARE - 2.8% | | | |
| Biotechnology - 0.0% | | | |
| AMAG Pharmaceuticals, Inc. 7.875% 9/1/23 (c) | | 305,000 | 323,491 |
| Health Care Equipment & Supplies - 0.1% | | | |
| Hill-Rom Holdings, Inc. 5.75% 9/1/23 (c) | | 290,000 | 295,075 |
| Hologic, Inc.: | | | |
| 4.375% 10/15/25 (c) | | 320,000 | 305,600 |
| 4.625% 2/1/28 (c) | | 215,000 | 202,100 |
| Teleflex, Inc. 4.625% 11/15/27 | | 255,000 | 240,751 |
| | | | 1,043,526 |
| Health Care Providers & Services - 1.7% | | | |
| Community Health Systems, Inc.: | | | |
| 6.875% 2/1/22 | | 2,265,000 | 1,155,150 |
| 8.125% 6/30/24 (c) | | 2,207,000 | 1,823,534 |
| 8.625% 1/15/24 (c) | | 1,510,000 | 1,513,926 |
| 11% 6/30/23 (c)(h) | | 285,000 | 256,856 |
| HCA Holdings, Inc.: | | | |
| 4.75% 5/1/23 | | 630,000 | 628,425 |
| 5.25% 6/15/26 | | 750,000 | 744,900 |
| 5.375% 2/1/25 | | 1,155,000 | 1,137,329 |
| 5.875% 3/15/22 | | 1,915,000 | 1,996,388 |
| 5.875% 5/1/23 | | 2,145,000 | 2,225,438 |
| 5.875% 2/15/26 | | 2,995,000 | 3,021,206 |
| 6.5% 2/15/20 | | 2,410,000 | 2,509,413 |
| 7.5% 2/15/22 | | 1,175,000 | 1,277,813 |
| HealthSouth Corp.: | | | |
| 5.125% 3/15/23 | | 330,000 | 330,000 |
| 5.75% 11/1/24 | | 1,135,000 | 1,135,658 |
| MPH Acquisition Holdings LLC 7.125% 6/1/24 (c) | | 335,000 | 343,375 |
| Polaris Intermediate Corp. 8.5% 12/1/22 pay-in-kind (b)(c) | | 2,105,000 | 2,170,781 |
| Quintiles Transnational Corp. 4.875% 5/15/23 (c) | | 445,000 | 449,450 |
| Sabra Health Care LP/Sabra Capital Corp. 5.375% 6/1/23 | | 260,000 | 261,300 |
| Tenet Healthcare Corp.: | | | |
| 4.625% 7/15/24 (c) | | 305,000 | 288,896 |
| 6.875% 11/15/31 | | 1,205,000 | 1,096,550 |
| 7.5% 1/1/22 (c) | | 365,000 | 379,600 |
| THC Escrow Corp. III 5.125% 5/1/25 (c) | | 305,000 | 289,941 |
| Vizient, Inc. 10.375% 3/1/24 (c) | | 660,000 | 727,650 |
| Wellcare Health Plans, Inc. 5.25% 4/1/25 | | 475,000 | 472,625 |
| West Street Merger Sub, Inc. 6.375% 9/1/25 (c) | | 305,000 | 291,275 |
| | | | 26,527,479 |
| Pharmaceuticals - 1.0% | | | |
| Bayer AG 2.125% 12/15/29 (Reg. S) | EUR | 2,100,000 | 2,484,675 |
| Catalent Pharma Solutions 4.875% 1/15/26 (c) | | 205,000 | 196,859 |
| Inventiv Group Holdings, Inc. / Investment 7.5% 10/1/24 (c) | | 228,000 | 238,830 |
| NVA Holdings, Inc. 6.875% 4/1/26 (c) | | 330,000 | 327,938 |
| Teva Pharmaceutical Finance Co. BV 3.65% 11/10/21 | | 175,000 | 167,583 |
| Teva Pharmaceutical Finance IV BV 3.65% 11/10/21 | | 740,000 | 708,637 |
| Teva Pharmaceutical Finance IV LLC 2.25% 3/18/20 | | 310,000 | 298,819 |
| Valeant Pharmaceuticals International, Inc.: | | | |
| 5.5% 11/1/25 (c) | | 3,688,000 | 3,634,524 |
| 5.875% 5/15/23 (c) | | 2,165,000 | 2,033,747 |
| 6.5% 3/15/22 (c) | | 620,000 | 641,700 |
| 7% 3/15/24 (c) | | 925,000 | 967,495 |
| 8.5% 1/31/27 (c) | | 620,000 | 629,300 |
| 9% 12/15/25 (c) | | 2,415,000 | 2,505,563 |
| | | | 14,835,670 |
| TOTAL HEALTH CARE | | | 42,730,166 |
| INDUSTRIALS - 1.9% | | | |
| Aerospace & Defense - 0.6% | | | |
| BBA U.S. Holdings, Inc. 5.375% 5/1/26 (c) | | 225,000 | 225,846 |
| BWX Technologies, Inc. 5.375% 7/15/26 (c) | | 430,000 | 435,375 |
| DAE Funding LLC: | | | |
| 4% 8/1/20 (c) | | 355,000 | 351,006 |
| 4.5% 8/1/22 (c) | | 440,000 | 426,800 |
| 5% 8/1/24 (c) | | 605,000 | 581,103 |
| Huntington Ingalls Industries, Inc. 5% 11/15/25 (c) | | 550,000 | 568,860 |
| KLX, Inc. 5.875% 12/1/22 (c) | | 1,455,000 | 1,511,381 |
| TransDigm UK Holdings PLC 6.875% 5/15/26 (c) | | 1,805,000 | 1,829,819 |
| TransDigm, Inc.: | | | |
| 6.375% 6/15/26 | | 1,930,000 | 1,915,525 |
| 6.5% 5/15/25 | | 835,000 | 844,394 |
| | | | 8,690,109 |
| Air Freight & Logistics - 0.1% | | | |
| Rumo Luxembourg Sarl 7.375% 2/9/24 (c) | | 1,080,000 | 1,090,811 |
| XPO Logistics, Inc. 6.125% 9/1/23 (c) | | 490,000 | 500,270 |
| | | | 1,591,081 |
| Airlines - 0.1% | | | |
| Air Canada 2013-1 Pass Through Trust 5.375% 11/15/22 (c) | | 121,043 | 123,367 |
| Allegiant Travel Co. 5.5% 7/15/19 | | 160,000 | 160,800 |
| Azul Investments LLP 5.875% 10/26/24 (c) | | 300,000 | 254,250 |
| Continental Airlines, Inc. pass-thru trust certificates 6.903% 4/19/22 | | 13,460 | 13,945 |
| Delta Air Lines, Inc. pass-thru trust certificates 8.021% 2/10/24 | | 109,414 | 120,235 |
| Hawaiian Airlines pass-thru certificates Series 2013-1 Class B, 4.95% 7/15/23 | | 208,838 | 209,318 |
| U.S. Airways pass-thru certificates: | | | |
| Series 2011-1 Class A, 7.125% 10/22/23 | | 289,292 | 322,147 |
| Series 2012-2 Class B, 6.75% 6/3/21 | | 145,769 | 153,745 |
| Series 2013-1 Class B, 5.375% 11/15/21 | | 194,004 | 198,330 |
| | | | 1,556,137 |
| Building Products - 0.1% | | | |
| Jeld-Wen, Inc.: | | | |
| 4.625% 12/15/25 (c) | | 265,000 | 252,413 |
| 4.875% 12/15/27 (c) | | 265,000 | 246,450 |
| Shea Homes Ltd. Partnership/Corp.: | | | |
| 5.875% 4/1/23 (c) | | 185,000 | 185,231 |
| 6.125% 4/1/25 (c) | | 185,000 | 184,075 |
| USG Corp. 4.875% 6/1/27 (c) | | 160,000 | 163,600 |
| | | | 1,031,769 |
| Commercial Services & Supplies - 0.4% | | | |
| ADS Waste Holdings, Inc. 5.625% 11/15/24 (c) | | 565,000 | 562,175 |
| Brand Energy & Infrastructure Services, Inc. 8.5% 7/15/25 (c) | | 110,000 | 111,375 |
| CD&R Waterworks Merger Sub LLC 6.125% 8/15/25 (c) | | 240,000 | 227,400 |
| Covanta Holding Corp.: | | | |
| 5.875% 3/1/24 | | 1,870,000 | 1,841,950 |
| 5.875% 7/1/25 | | 165,000 | 159,225 |
| Harland Clarke Holdings Corp. 8.375% 8/15/22 (c) | | 1,035,000 | 1,014,300 |
| KAR Auction Services, Inc. 5.125% 6/1/25 (c) | | 525,000 | 501,375 |
| Kissner Holdings LP/Kissner Milling Co. Ltd./BSC Holding, Inc./Kissner U.S.A. 8.375% 12/1/22 (c) | | 530,000 | 541,925 |
| Ritchie Brothers Auctioneers, Inc. 5.375% 1/15/25 (c) | | 190,000 | 184,300 |
| Tervita Escrow Corp. 7.625% 12/1/21 (c) | | 280,000 | 285,600 |
| The Brink's Co. 4.625% 10/15/27 (c) | | 620,000 | 573,500 |
| | | | 6,003,125 |
| Construction & Engineering - 0.2% | | | |
| AECOM 5.125% 3/15/27 | | 625,000 | 589,063 |
| Blueline Rental Finance Corp./Blueline Rental LLC 9.25% 3/15/24 (c) | | 1,160,000 | 1,234,124 |
| Cementos Progreso Trust 7.125% 11/6/23 (c) | | 440,000 | 453,200 |
| Odebrecht Finance Ltd.: | | | |
| 4.375% 4/25/25 (c) | | 1,530,000 | 527,850 |
| 5.25% 6/27/29 (c) | | 580,000 | 197,200 |
| 7.125% 6/26/42 (c) | | 1,406,000 | 492,100 |
| | | | 3,493,537 |
| Electrical Equipment - 0.0% | | | |
| Sensata Technologies BV 5% 10/1/25 (c) | | 575,000 | 579,313 |
| Industrial Conglomerates - 0.0% | | | |
| Alfa SA de CV 5.25% 3/25/24 (c) | | 200,000 | 201,750 |
| Machinery - 0.1% | | | |
| U.S.A. Compression Partners LP 6.875% 4/1/26 (c) | | 220,000 | 227,700 |
| Xerium Technologies, Inc. 9.5% 8/15/21 | | 940,000 | 991,700 |
| | | | 1,219,400 |
| Marine - 0.0% | | | |
| Navios Maritime Acquisition Corp./Navios Acquisition Finance U.S., Inc. 8.125% 11/15/21 (c) | | 150,000 | 122,625 |
| Navios South American Logistics, Inc./Navios Logistics Finance U.S., Inc. 7.25% 5/1/22 (c) | | 490,000 | 474,075 |
| | | | 596,700 |
| Professional Services - 0.1% | | | |
| IHS Markit Ltd.: | | | |
| 4% 3/1/26 (c) | | 275,000 | 262,281 |
| 4.75% 2/15/25 (c) | | 485,000 | 480,150 |
| | | | 742,431 |
| Road & Rail - 0.0% | | | |
| JSC Georgian Railway 7.75% 7/11/22 (c) | | 200,000 | 209,920 |
| Trading Companies & Distributors - 0.2% | | | |
| Aircastle Ltd.: | | | |
| 5% 4/1/23 | | 345,000 | 347,129 |
| 5.5% 2/15/22 | | 555,000 | 569,336 |
| Ashtead Capital, Inc. 5.625% 10/1/24 (c) | | 550,000 | 562,898 |
| Avantor, Inc. 6% 10/1/24 (c) | | 625,000 | 618,250 |
| FLY Leasing Ltd. 5.25% 10/15/24 | | 490,000 | 459,375 |
| United Rentals North America, Inc. 5.5% 5/15/27 | | 405,000 | 392,850 |
| | | | 2,949,838 |
| Transportation Infrastructure - 0.0% | | | |
| Aeropuertos Argentina 2000 SA 6.875% 2/1/27 (c) | | 505,000 | 484,548 |
| TOTAL INDUSTRIALS | | | 29,349,658 |
| INFORMATION TECHNOLOGY - 1.2% | | | |
| Communications Equipment - 0.2% | | | |
| Banglalink Digital Communications Ltd.: | | | |
| 8.625% 5/6/19 (c) | | 1,605,000 | 1,625,063 |
| 8.625% 5/6/19 (Reg. S) | | 200,000 | 202,500 |
| Commscope Technologies LLC 5% 3/15/27 (c) | | 665,000 | 625,931 |
| | | | 2,453,494 |
| Electronic Equipment & Components - 0.1% | | | |
| Conduent Finance, Inc./Xerox Business Service LLC 10.5% 12/15/24 (c) | | 1,425,000 | 1,704,656 |
| TTM Technologies, Inc. 5.625% 10/1/25 (c) | | 210,000 | 204,750 |
| | | | 1,909,406 |
| Internet Software & Services - 0.1% | | | |
| Balboa Merger Sub, Inc. 11.375% 12/1/21 (c) | | 1,260,000 | 1,360,800 |
| Camelot Finance SA 7.875% 10/15/24 (c) | | 280,000 | 280,700 |
| CyrusOne LP/CyrusOne Finance Corp.: | | | |
| 5% 3/15/24 | | 165,000 | 165,000 |
| 5.375% 3/15/27 | | 140,000 | 138,950 |
| GTT Communications, Inc. 7.875% 12/31/24 (c) | | 300,000 | 297,000 |
| | | | 2,242,450 |
| IT Services - 0.1% | | | |
| CDW LLC/CDW Finance Corp.: | | | |
| 5% 9/1/23 | | 565,000 | 565,509 |
| 5% 9/1/25 | | 335,000 | 329,138 |
| Gartner, Inc. 5.125% 4/1/25 (c) | | 305,000 | 303,475 |
| | | | 1,198,122 |
| Semiconductors & Semiconductor Equipment - 0.5% | | | |
| NXP BV/NXP Funding LLC: | | | |
| 4.125% 6/1/21 (c) | | 465,000 | 463,838 |
| 4.625% 6/15/22 (c) | | 900,000 | 913,500 |
| 4.625% 6/1/23 (c) | | 1,865,000 | 1,881,319 |
| Qorvo, Inc. 7% 12/1/25 | | 2,856,000 | 3,070,200 |
| Sensata Technologies UK Financing Co. PLC 6.25% 2/15/26 (c) | | 585,000 | 608,400 |
| Versum Materials, Inc. 5.5% 9/30/24 (c) | | 330,000 | 334,587 |
| | | | 7,271,844 |
| Software - 0.2% | | | |
| Ascend Learning LLC 6.875% 8/1/25 (c) | | 210,000 | 211,838 |
| CDK Global, Inc. 5.875% 6/15/26 | | 225,000 | 229,781 |
| Ensemble S Merger Sub, Inc. 9% 9/30/23 (c) | | 970,000 | 1,018,379 |
| Fair Isaac Corp. 5.25% 5/15/26 (c) | | 315,000 | 316,181 |
| JDA Escrow LLC/JDA Bond Finance, Inc. 7.375% 10/15/24 (c) | | 225,000 | 231,683 |
| Open Text Corp. 5.875% 6/1/26 (c) | | 465,000 | 474,300 |
| Parametric Technology Corp. 6% 5/15/24 | | 190,000 | 197,600 |
| Symantec Corp. 5% 4/15/25 (c) | | 530,000 | 513,305 |
| | | | 3,193,067 |
| TOTAL INFORMATION TECHNOLOGY | | | 18,268,383 |
| MATERIALS - 3.4% | | | |
| Chemicals - 0.9% | | | |
| Braskem Finance Ltd.: | | | |
| 5.375% 5/2/22 (c) | | 415,000 | 425,417 |
| 5.75% 4/15/21 (c) | | 400,000 | 413,000 |
| Hexion, Inc. 10.375% 2/1/22 (c) | | 235,000 | 230,300 |
| LSB Industries, Inc. 9.625% 5/1/23 (c) | | 310,000 | 312,325 |
| Momentive Performance Materials, Inc.: | | | |
| 3.88% 10/24/21 | | 5,080,000 | 5,334,000 |
| 4.69% 4/24/22 | | 1,515,000 | 1,617,263 |
| 10% 10/15/20 (e)(i) | | 1,515,000 | 0 |
| MPM Escrow LLC/MPM Finance Escrow Corp. 8.875% 10/15/20 (e)(i) | | 3,580,000 | 0 |
| NOVA Chemicals Corp.: | | | |
| 4.875% 6/1/24 (c) | | 770,000 | 731,500 |
| 5.25% 6/1/27 (c) | | 660,000 | 615,038 |
| OCI NV 6.625% 4/15/23 (c) | | 270,000 | 274,239 |
| OCP SA 5.625% 4/25/24 (c) | | 200,000 | 204,432 |
| Petkim Petrokimya Holding A/S 5.875% 1/26/23 (c) | | 535,000 | 486,129 |
| Platform Specialty Products Corp.: | | | |
| 5.875% 12/1/25 (c) | | 945,000 | 923,738 |
| 6.5% 2/1/22 (c) | | 555,000 | 564,713 |
| SunCoke Energy Partners LP/SunCoke Energy Partners Finance Corp. 7.5% 6/15/25 (c) | | 495,000 | 503,663 |
| The Chemours Co. LLC 5.375% 5/15/27 | | 255,000 | 246,713 |
| TPC Group, Inc. 8.75% 12/15/20 (c) | | 765,000 | 757,350 |
| Tronox Finance PLC 5.75% 10/1/25 (c) | | 285,000 | 276,806 |
| | | | 13,916,626 |
| Construction Materials - 0.2% | | | |
| CEMEX Finance LLC 6% 4/1/24 (c) | | 400,000 | 405,000 |
| CEMEX S.A.B. de CV 7.75% 4/16/26 (c) | | 685,000 | 742,129 |
| Holcim Finance Luxembourg SA 2.25% 5/26/28 (Reg. S) | EUR | 672,000 | 792,659 |
| Summit Materials LLC/Summit Materials Finance Corp. 5.125% 6/1/25 (c) | | 260,000 | 244,400 |
| U.S. Concrete, Inc. 6.375% 6/1/24 | | 300,000 | 300,000 |
| Union Andina de Cementos SAA 5.875% 10/30/21 (c) | | 400,000 | 409,500 |
| | | | 2,893,688 |
| Containers & Packaging - 0.6% | | | |
| Ard Securities Finance Sarl 8.75% 1/31/23 pay-in-kind (b)(c) | | 365,000 | 371,388 |
| Ardagh Packaging Finance PLC/Ardagh MP Holdings U.S.A., Inc.: | | | |
| 4.625% 5/15/23 (c) | | 615,000 | 608,081 |
| 6% 6/30/21 (c) | | 350,000 | 353,938 |
| 6% 2/15/25 (c) | | 1,040,000 | 1,012,700 |
| 7.25% 5/15/24 (c) | | 1,100,000 | 1,144,000 |
| Crown Cork & Seal, Inc.: | | | |
| 7.375% 12/15/26 | | 1,210,000 | 1,306,800 |
| 7.5% 12/15/96 | | 160,000 | 160,400 |
| Flex Acquisition Co., Inc. 6.875% 1/15/25 (c) | | 280,000 | 269,500 |
| Mondi Finance PLC 1.625% 4/27/26 (Reg. S) | EUR | 2,650,000 | 3,103,954 |
| Plastipak Holdings, Inc. 6.25% 10/15/25 (c) | | 180,000 | 165,600 |
| Sealed Air Corp. 5.25% 4/1/23 (c) | | 270,000 | 275,400 |
| | | | 8,771,761 |
| Metals & Mining - 1.7% | | | |
| Alcoa Nederland Holding BV: | | | |
| 6.125% 5/15/28 (c) | | 200,000 | 201,250 |
| 6.75% 9/30/24 (c) | | 430,000 | 453,474 |
| 7% 9/30/26 (c) | | 355,000 | 376,300 |
| Aleris International, Inc. 6% 6/1/20 (c)(i) | | 1,759 | 1,759 |
| ArcelorMittal SA 0.95% 1/17/23 (Reg. S) | EUR | 1,775,000 | 2,034,182 |
| Big River Steel LLC/BRS Finance Corp. 7.25% 9/1/25 (c) | | 475,000 | 488,110 |
| Cleveland-Cliffs, Inc.: | | | |
| 4.875% 1/15/24 (c) | | 620,000 | 598,300 |
| 5.75% 3/1/25 | | 615,000 | 582,713 |
| Commercial Metals Co. 5.75% 4/15/26 (c) | | 460,000 | 443,900 |
| Constellium NV 5.875% 2/15/26 (c) | | 255,000 | 246,075 |
| CSN Islands XI Corp. 6.875% 9/21/19 (c) | | 985,000 | 972,688 |
| CSN Resources SA 6.5% 7/21/20 (c) | | 1,000,000 | 931,250 |
| EVRAZ Group SA 8.25% 1/28/21 (Reg. S) | | 400,000 | 426,080 |
| Ferrexpo Finance PLC: | | | |
| 10.375% 4/7/19 (c) | | 129,000 | 132,828 |
| 10.375% 4/7/19 (c) | | 187,500 | 193,064 |
| 10.375% 4/7/19 (Reg. S) | | 75,000 | 77,226 |
| 10.375% 4/7/19 (Reg. S) | | 222,500 | 229,103 |
| First Quantum Minerals Ltd.: | | | |
| 6.5% 3/1/24 (c) | | 460,000 | 443,900 |
| 6.875% 3/1/26 (c) | | 460,000 | 440,450 |
| 7% 2/15/21 (c) | | 745,000 | 752,450 |
| 7.25% 5/15/22 (c) | | 615,000 | 621,150 |
| 7.25% 4/1/23 (c) | | 1,280,000 | 1,280,000 |
| 7.5% 4/1/25 (c) | | 760,000 | 750,044 |
| FMG Resources (August 2006) Pty Ltd.: | | | |
| 4.75% 5/15/22 (c) | | 405,000 | 390,825 |
| 5.125% 3/15/23 (c) | | 650,000 | 630,500 |
| 5.125% 5/15/24 (c) | | 495,000 | 470,869 |
| Freeport-McMoRan, Inc.: | | | |
| 3.55% 3/1/22 | | 310,000 | 294,500 |
| 3.875% 3/15/23 | | 930,000 | 878,850 |
| 5.4% 11/14/34 | | 300,000 | 272,250 |
| 5.45% 3/15/43 | | 1,945,000 | 1,706,154 |
| Gold Fields Orogen Holding BVI Ltd. 4.875% 10/7/20 (c) | | 540,000 | 538,553 |
| GTL Trade Finance, Inc. 5.893% 4/29/24 (c) | | 230,000 | 231,665 |
| JMC Steel Group, Inc. 9.875% 6/15/23 (c) | | 405,000 | 443,475 |
| Joseph T Ryerson & Son, Inc. 11% 5/15/22 (c) | | 350,000 | 385,000 |
| Lundin Mining Corp. 7.875% 11/1/22 (c) | | 30,000 | 31,410 |
| Metinvest BV 7.75% 4/23/23 (c) | | 2,140,000 | 2,009,460 |
| Murray Energy Corp. 11.25% 4/15/21 (c) | | 660,000 | 389,400 |
| Polyus Finance PLC 5.25% 2/7/23 (c) | | 760,000 | 741,456 |
| Stillwater Mining Co.: | | | |
| 6.125% 6/27/22 (c) | | 915,000 | 815,247 |
| 7.125% 6/27/25 (c) | | 410,000 | 359,324 |
| United States Steel Corp. 6.25% 3/15/26 | | 615,000 | 606,550 |
| Vedanta Resources PLC: | | | |
| 6.375% 7/30/22 (c) | | 880,000 | 838,200 |
| 8.25% 6/7/21 (c) | | 540,000 | 564,300 |
| VM Holding SA 5.375% 5/4/27 (c) | | 135,000 | 130,950 |
| | | | 25,405,234 |
| Paper & Forest Products - 0.0% | | | |
| Boise Cascade Co. 5.625% 9/1/24 (c) | | 225,000 | 225,563 |
| NewPage Corp.: | | | |
| 3 month U.S. LIBOR + 6.250% 6.7159% 5/1/12 (b)(e)(f)(i) | | 90,000 | 0 |
| 11.375% 12/31/2014 (e)(i) | | 317,581 | 0 |
| | | | 225,563 |
| TOTAL MATERIALS | | | 51,212,872 |
| REAL ESTATE - 0.7% | | | |
| Equity Real Estate Investment Trusts (REITs) - 0.3% | | | |
| Crown Castle International Corp. 5.25% 1/15/23 | | 1,530,000 | 1,603,191 |
| Equinix, Inc. 5.375% 5/15/27 | | 480,000 | 478,800 |
| MPT Operating Partnership LP/MPT Finance Corp.: | | | |
| 5% 10/15/27 | | 1,025,000 | 978,875 |
| 5.25% 8/1/26 | | 385,000 | 377,300 |
| 6.375% 3/1/24 | | 195,000 | 204,263 |
| | | | 3,642,429 |
| Real Estate Management & Development - 0.4% | | | |
| Deutsche Annington Finance BV 2.75% 3/22/38 | EUR | 1,200,000 | 1,409,348 |
| Grand City Properties SA 1.375% 8/3/26 (Reg. S) | EUR | 1,600,000 | 1,801,674 |
| Howard Hughes Corp. 5.375% 3/15/25 (c) | | 665,000 | 652,531 |
| Inversiones y Representaciones SA 11.5% 7/20/20 (Reg. S) | | 85,000 | 88,400 |
| IRSA Propiedades Comerciales SA 8.75% 3/23/23 (c) | | 700,000 | 703,192 |
| Mattamy Group Corp. 6.875% 12/15/23 (c) | | 470,000 | 476,392 |
| Shimao Property Holdings Ltd. 4.75% 7/3/22 | | 655,000 | 623,859 |
| Taylor Morrison Communities, Inc./Monarch Communities, Inc. 5.25% 4/15/21 (c) | | 785,000 | 785,000 |
| | | | 6,540,396 |
| TOTAL REAL ESTATE | | | 10,182,825 |
| TELECOMMUNICATION SERVICES - 3.5% | | | |
| Diversified Telecommunication Services - 1.8% | | | |
| AT&T, Inc. 3.15% 9/4/36 | EUR | 1,775,000 | 2,075,415 |
| Axtel S.A.B. de CV 6.375% 11/14/24 (c) | | 570,000 | 540,075 |
| Citizens Communications Co.: | | | |
| 7.875% 1/15/27 | | 280,000 | 163,100 |
| 9% 8/15/31 | | 220,000 | 144,100 |
| Colombia Telecomunicaciones SA 5.375% 9/27/22 (c) | | 320,000 | 317,920 |
| Frontier Communications Corp. 8.5% 4/1/26 (c) | | 1,595,000 | 1,539,175 |
| GCI, Inc. 6.875% 4/15/25 | | 560,000 | 579,768 |
| GTH Finance BV: | | | |
| 6.25% 4/26/20 (c) | | 275,000 | 279,991 |
| 7.25% 4/26/23 (c) | | 1,280,000 | 1,324,826 |
| Level 3 Financing, Inc.: | | | |
| 5.125% 5/1/23 | | 575,000 | 563,500 |
| 5.375% 5/1/25 | | 575,000 | 553,438 |
| Lynx II Corp. 6.375% 4/15/23 (c) | | 200,000 | 200,000 |
| Oztel Holdings SPC Ltd. 5.625% 10/24/23 (c) | | 295,000 | 289,469 |
| Sable International Finance Ltd. 6.875% 8/1/22 (c) | | 2,630,000 | 2,708,111 |
| SFR Group SA: | | | |
| 6.25% 5/15/24 (c) | | 3,245,000 | 3,151,706 |
| 7.375% 5/1/26 (c) | | 4,860,000 | 4,751,622 |
| Sprint Capital Corp.: | | | |
| 6.875% 11/15/28 | | 1,272,000 | 1,221,120 |
| 8.75% 3/15/32 | | 1,906,000 | 2,039,420 |
| Telefonica Celular del Paraguay SA 6.75% 12/13/22 (c) | | 600,000 | 612,000 |
| Telenet Finance Luxembourg Notes SARL 5.5% 3/1/28 (c) | | 1,200,000 | 1,092,000 |
| U.S. West Communications: | | | |
| 6.875% 9/15/33 | | 170,000 | 159,401 |
| 7.25% 9/15/25 | | 35,000 | 37,388 |
| 7.25% 10/15/35 | | 70,000 | 68,227 |
| UPCB Finance IV Ltd. 5.375% 1/15/25 (c) | | 615,000 | 584,312 |
| Verizon Communications, Inc. 2.875% 1/15/38 | EUR | 1,200,000 | 1,376,804 |
| Virgin Media Finance PLC 4.875% 2/15/22 | | 565,000 | 537,456 |
| | | | 26,910,344 |
| Wireless Telecommunication Services - 1.7% | | | |
| America Movil S.A.B. de CV 6.45% 12/5/22 | MXN | 6,890,000 | 317,144 |
| Comcel Trust 6.875% 2/6/24 (c) | | 855,000 | 876,204 |
| Digicel Group Ltd. 6.75% 3/1/23 (c) | | 385,000 | 319,550 |
| Intelsat Jackson Holdings SA: | | | |
| 5.5% 8/1/23 | | 1,395,000 | 1,251,594 |
| 9.75% 7/15/25 (c) | | 775,000 | 817,625 |
| Millicom International Cellular SA 6% 3/15/25 (c) | | 1,145,000 | 1,152,156 |
| MTN (Mauritius) Investments Ltd. 6.5% 10/13/26 (c) | | 230,000 | 230,278 |
| MTS International Funding Ltd. 5% 5/30/23 (c) | | 225,000 | 219,488 |
| Sprint Communications, Inc. 6% 11/15/22 | | 1,410,000 | 1,397,663 |
| Sprint Corp.: | | | |
| 7.125% 6/15/24 | | 2,940,000 | 2,968,195 |
| 7.625% 2/15/25 | | 1,655,000 | 1,696,375 |
| 7.625% 3/1/26 | | 1,230,000 | 1,253,063 |
| 7.875% 9/15/23 | | 1,505,000 | 1,560,497 |
| T-Mobile U.S.A., Inc.: | | | |
| 6% 4/15/24 | | 920,000 | 952,200 |
| 6.375% 3/1/25 | | 6,800,000 | 7,039,360 |
| 6.5% 1/15/24 | | 2,548,000 | 2,662,660 |
| TBG Global Pte. Ltd. 5.25% 2/10/22 (Reg. S) | | 400,000 | 390,869 |
| | | | 25,104,921 |
| TOTAL TELECOMMUNICATION SERVICES | | | 52,015,265 |
| UTILITIES - 1.3% | | | |
| Electric Utilities - 0.2% | | | |
| Enel SpA 3.375% 11/24/81 (Reg. S) (b) | EUR | 1,375,000 | 1,513,396 |
| InterGen NV 7% 6/30/23 (c) | | 200,000 | 197,000 |
| Israel Electric Corp. Ltd. 7.75% 12/15/27 (Reg. S) | | 250,000 | 300,625 |
| Pampa Holding SA 7.5% 1/24/27 (c) | | 295,000 | 265,500 |
| | | | 2,276,521 |
| Gas Utilities - 0.0% | | | |
| Southern Natural Gas Co.: | | | |
| 7.35% 2/15/31 | | 175,000 | 213,044 |
| 8% 3/1/32 | | 335,000 | 432,694 |
| | | | 645,738 |
| Independent Power and Renewable Electricity Producers - 1.0% | | | |
| Calpine Corp. 5.25% 6/1/26 (c) | | 620,000 | 584,350 |
| Dynegy, Inc.: | | | |
| 7.375% 11/1/22 | | 1,910,000 | 1,995,950 |
| 7.625% 11/1/24 | | 3,665,000 | 3,907,806 |
| 8% 1/15/25 (c) | | 1,100,000 | 1,180,795 |
| 8.125% 1/30/26 (c) | | 1,225,000 | 1,330,656 |
| NextEra Energy Partners LP: | | | |
| 4.25% 9/15/24 (c) | | 415,000 | 399,438 |
| 4.5% 9/15/27 (c) | | 290,000 | 271,150 |
| NRG Energy, Inc.: | | | |
| 5.75% 1/15/28 (c) | | 1,740,000 | 1,709,550 |
| 6.625% 1/15/27 | | 1,345,000 | 1,381,988 |
| Pattern Energy Group, Inc. 5.875% 2/1/24 (c) | | 295,000 | 294,263 |
| Talen Energy Supply LLC: | | | |
| 6.5% 6/1/25 | | 460,000 | 350,750 |
| 10.5% 1/15/26 (c) | | 435,000 | 387,694 |
| TerraForm Power Operating LLC: | | | |
| 4.25% 1/31/23 (c) | | 320,000 | 308,800 |
| 5% 1/31/28 (c) | | 320,000 | 303,200 |
| 6.625% 6/15/25 (b)(c) | | 418,000 | 445,170 |
| The AES Corp.: | | | |
| 4% 3/15/21 | | 460,000 | 457,686 |
| 4.5% 3/15/23 | | 460,000 | 455,975 |
| | | | 15,765,221 |
| Multi-Utilities - 0.1% | | | |
| RWE AG 5.75% 2/14/33 (Reg. S) | EUR | 450,000 | 765,366 |
| TOTAL UTILITIES | | | 19,452,846 |
|
| TOTAL NONCONVERTIBLE BONDS | | | 550,978,346 |
|
| TOTAL CORPORATE BONDS | | | |
| (Cost $557,572,039) | | | 555,068,011 |
|
| U.S. Government and Government Agency Obligations - 16.5% | | | |
| U.S. Government Agency Obligations - 0.0% | | | |
| Tennessee Valley Authority: | | | |
| 5.25% 9/15/39 | | $126,000 | $159,079 |
| 5.375% 4/1/56 | | 302,000 | 406,192 |
|
| TOTAL U.S. GOVERNMENT AGENCY OBLIGATIONS | | | 565,271 |
|
| U.S. Treasury Obligations - 16.2% | | | |
| U.S. Treasury Bonds: | | | |
| stripped coupon 2/15/34 | | 2,020,000 | 1,264,276 |
| 2.5% 2/15/46 | | 3,344,000 | 3,037,162 |
| 2.75% 8/15/47 | | 13,122,000 | 12,508,444 |
| 2.75% 11/15/47 | | 2,450,000 | 2,335,252 |
| 2.875% 8/15/45 | | 6,384,000 | 6,250,335 |
| 3% 11/15/44 | | 582,000 | 583,523 |
| 3% 11/15/45 | | 100,000 | 100,254 |
| 3% 5/15/47 | | 900,000 | 901,652 |
| 3% 2/15/48 | | 2,182,000 | 2,187,114 |
| 3.125% 5/15/48 | | 2,607,000 | 2,676,961 |
| 3.625% 2/15/44 | | 9,514,000 | 10,602,164 |
| 4.25% 5/15/39 | | 3,488,000 | 4,203,312 |
| 4.75% 2/15/37 | | 7,087,000 | 8,974,744 |
| 5.25% 2/15/29 (j)(k) | | 2,206,000 | 2,684,685 |
| 6.125% 8/15/29 | | 923,000 | 1,207,255 |
| 6.25% 8/15/23 (j) | | 2,249,000 | 2,624,126 |
| 7.875% 2/15/21 | | 200,000 | 226,586 |
| U.S. Treasury Notes: | | | |
| 0.75% 7/15/19 | | 1,522,000 | 1,496,792 |
| 1.125% 9/30/21 | | 9,774,000 | 9,311,644 |
| 1.375% 4/30/20 | | 4,287,000 | 4,199,250 |
| 1.375% 8/31/23 | | 500,000 | 466,914 |
| 1.5% 10/31/19 | | 3,630,000 | 3,584,909 |
| 1.5% 7/15/20 | | 3,268,000 | 3,200,342 |
| 1.5% 8/15/26 | | 2,627,000 | 2,371,791 |
| 1.625% 7/31/20 | | 1,500,000 | 1,471,758 |
| 1.625% 8/31/22 | | 4,833,000 | 4,627,409 |
| 1.625% 5/31/23 | | 760,000 | 721,288 |
| 1.75% 12/31/20 | | 2,634,000 | 2,580,394 |
| 1.75% 5/31/22 | | 2,500,000 | 2,412,012 |
| 1.75% 6/30/22 | | 3,913,000 | 3,771,918 |
| 1.875% 1/31/22 | | 3,691,000 | 3,589,786 |
| 1.875% 3/31/22 | | 16,954,000 | 16,464,586 |
| 1.875% 7/31/22 | | 6,969,000 | 6,744,958 |
| 2% 9/30/20 | | 12,766,000 | 12,605,926 |
| 2% 1/15/21 | | 2,831,000 | 2,789,309 |
| 2% 12/31/21 | | 12,241,000 | 11,967,012 |
| 2% 10/31/22 | | 4,900,000 | 4,756,828 |
| 2% 8/15/25 | | 768,000 | 727,350 |
| 2% 11/15/26 | | 5,945,000 | 5,569,490 |
| 2.125% 6/30/21 | | 1,500,000 | 1,478,203 |
| 2.125% 12/31/22 | | 591,000 | 576,017 |
| 2.125% 7/31/24 | | 13,464,000 | 12,956,996 |
| 2.125% 5/15/25 | | 1,911,000 | 1,828,364 |
| 2.25% 2/29/20 | | 1,000,000 | 995,859 |
| 2.25% 7/31/21 | | 10,479,000 | 10,359,883 |
| 2.25% 12/31/24 | | 8,414,000 | 8,134,958 |
| 2.25% 2/15/27 | | 1,940,000 | 1,850,805 |
| 2.25% 8/15/27 | | 2,954,000 | 2,810,685 |
| 2.25% 11/15/27 | | 1,545,000 | 1,468,112 |
| 2.375% 4/15/21 | | 10,490,000 | 10,421,979 |
| 2.375% 5/15/27 | | 1,276,000 | 1,228,349 |
| 2.5% 3/31/23 | | 3,330,000 | 3,295,659 |
| 2.75% 4/30/23 | | 3,110,000 | 3,112,065 |
| 2.75% 5/31/23 | | 600,000 | 600,539 |
| 2.75% 2/15/28 | | 410,000 | 406,332 |
| 2.875% 4/30/25 | | 8,130,000 | 8,160,170 |
| 3.625% 8/15/19 | | 6,382,000 | 6,467,509 |
|
| TOTAL U.S. TREASURY OBLIGATIONS | | | 243,951,995 |
|
| Other Government Related - 0.3% | | | |
| National Credit Union Administration Guaranteed Notes: | | | |
| Series 2010-A1 Class A, 1 month U.S. LIBOR + 0.350% 2.2727% 12/7/20 (NCUA Guaranteed) (b)(f) | | 84,309 | 84,415 |
| Series 2011-R1 Class 1A, 1 month U.S. LIBOR + 0.450% 2.3727% 1/8/20 (NCUA Guaranteed) (b)(f) | | 166,445 | 166,755 |
| National Credit Union Administration Guaranteed Notes Master Trust 3.45% 6/12/21 (NCUA Guaranteed) | | 3,400,000 | 3,464,384 |
|
| TOTAL OTHER GOVERNMENT RELATED | | | 3,715,554 |
|
| TOTAL U.S. GOVERNMENT AND GOVERNMENT AGENCY OBLIGATIONS | | | |
| (Cost $252,749,817) | | | 248,232,820 |
|
| U.S. Government Agency - Mortgage Securities - 3.1% | | | |
| Fannie Mae - 1.7% | | | |
| 12 month U.S. LIBOR + 1.365% 3.115% 10/1/35 (b)(f) | | 800 | 826 |
| 12 month U.S. LIBOR + 1.415% 3.165% 11/1/33 (b)(f) | | 692 | 713 |
| 12 month U.S. LIBOR + 1.495% 3.296% 1/1/35 (b)(f) | | 4,333 | 4,430 |
| 12 month U.S. LIBOR + 1.553% 3.326% 6/1/36 (b)(f) | | 1,123 | 1,170 |
| 12 month U.S. LIBOR + 1.565% 3.565% 3/1/37 (b)(f) | | 1,470 | 1,526 |
| 12 month U.S. LIBOR + 1.617% 3.514% 3/1/33 (b)(f) | | 3,059 | 3,173 |
| 12 month U.S. LIBOR + 1.643% 3.315% 9/1/36 (b)(f) | | 1,797 | 1,871 |
| 12 month U.S. LIBOR + 1.645% 3.589% 6/1/47 (b)(f) | | 2,759 | 2,839 |
| 12 month U.S. LIBOR + 1.725% 2.575% 6/1/42 (b)(f) | | 19,155 | 19,760 |
| 12 month U.S. LIBOR + 1.728% 3.672% 11/1/36 (b)(f) | | 1,502 | 1,582 |
| 12 month U.S. LIBOR + 1.745% 3.636% 7/1/35 (b)(f) | | 8,617 | 8,989 |
| 12 month U.S. LIBOR + 1.760% 3.613% 2/1/37 (b)(f) | | 11,131 | 11,470 |
| 12 month U.S. LIBOR + 1.800% 2.732% 1/1/42 (b)(f) | | 74,504 | 77,560 |
| 12 month U.S. LIBOR + 1.800% 3.583% 7/1/41 (b)(f) | | 16,565 | 17,157 |
| 12 month U.S. LIBOR + 1.818% 2.686% 2/1/42 (b)(f) | | 101,594 | 105,596 |
| 12 month U.S. LIBOR + 1.818% 3.046% 9/1/41 (b)(f) | | 11,321 | 11,707 |
| 12 month U.S. LIBOR + 1.818% 3.539% 7/1/41 (b)(f) | | 13,934 | 14,629 |
| 12 month U.S. LIBOR + 1.830% 3.361% 10/1/41 (b)(f) | | 9,203 | 9,517 |
| 12 month U.S. LIBOR + 1.851% 4.271% 5/1/36 (b)(f) | | 501 | 525 |
| 12 month U.S. LIBOR + 1.885% 3.971% 4/1/36 (b)(f) | | 8,046 | 8,506 |
| 12 month U.S. LIBOR + 2.176% 4.193% 8/1/35 (b)(f) | | 8,262 | 8,571 |
| 6 month U.S. LIBOR + 1.550% 3.403% 9/1/33 (b)(f) | | 12,865 | 13,227 |
| 6 month U.S. LIBOR + 1.550% 3.818% 11/1/35 (b)(f) | | 5,165 | 5,265 |
| U.S. TREASURY 1 YEAR INDEX + 1.965% 3.715% 2/1/36 (b)(f) | | 589 | 616 |
| 3% 7/1/48 (d) | | 200,000 | 193,682 |
| 3.5% 7/1/32 | | 1,216,524 | 1,229,410 |
| 3.5% 7/1/48 (d) | | 1,200,000 | 1,194,054 |
| 4% 7/1/48 (d) | | 2,211,000 | 2,253,982 |
| 4% 7/1/48 (d) | | 2,089,000 | 2,129,611 |
| 4.5% 11/1/25 to 6/1/41 | | 671,386 | 702,535 |
| 4.5% 7/1/48 (d) | | 7,100,000 | 7,392,431 |
| 4.5% 8/1/48 (d) | | 7,100,000 | 7,380,228 |
| 5.5% 12/1/39 to 5/1/44 | | 2,336,711 | 2,545,922 |
| 6% 1/1/34 to 6/1/36 | | 271,904 | 301,176 |
| 6.5% 5/1/26 to 8/1/36 | | 268,548 | 299,650 |
|
| TOTAL FANNIE MAE | | | 25,953,906 |
|
| Freddie Mac - 0.1% | | | |
| 12 month U.S. LIBOR + 1.325% 3.075% 1/1/36 (b)(f) | | 2,404 | 2,442 |
| 12 month U.S. LIBOR + 1.325% 3.075% 3/1/37 (b)(f) | | 952 | 977 |
| 12 month U.S. LIBOR + 1.600% 3.35% 7/1/35 (b)(f) | | 1,878 | 1,928 |
| 12 month U.S. LIBOR + 1.665% 3.54% 7/1/36 (b)(f) | | 128,988 | 133,992 |
| 12 month U.S. LIBOR + 1.754% 3.086% 9/1/41 (b)(f) | | 97,780 | 100,725 |
| 12 month U.S. LIBOR + 1.793% 3.543% 4/1/37 (b)(f) | | 2,036 | 2,128 |
| 12 month U.S. LIBOR + 1.874% 3.712% 10/1/42 (b)(f) | | 60,174 | 62,848 |
| 12 month U.S. LIBOR + 1.877% 4.21% 4/1/41 (b)(f) | | 7,495 | 7,732 |
| 12 month U.S. LIBOR + 1.880% 3.056% 10/1/41 (b)(f) | | 89,430 | 93,353 |
| 12 month U.S. LIBOR + 1.880% 3.205% 9/1/41 (b)(f) | | 11,968 | 12,355 |
| 12 month U.S. LIBOR + 1.910% 3.331% 6/1/41 (b)(f) | | 10,734 | 11,290 |
| 12 month U.S. LIBOR + 1.910% 3.894% 6/1/41 (b)(f) | | 13,202 | 13,862 |
| 12 month U.S. LIBOR + 1.910% 4.365% 5/1/41 (b)(f) | | 14,554 | 15,128 |
| 12 month U.S. LIBOR + 1.910% 4.479% 5/1/41 (b)(f) | | 9,618 | 10,140 |
| 12 month U.S. LIBOR + 2.045% 3.811% 7/1/36 (b)(f) | | 3,212 | 3,396 |
| 6 month U.S. LIBOR + 1.445% 3.445% 3/1/35 (b)(f) | | 2,009 | 2,054 |
| 6 month U.S. LIBOR + 1.647% 3.309% 2/1/37 (b)(f) | | 2,064 | 2,132 |
| 6 month U.S. LIBOR + 1.685% 3.865% 1/1/37 (b)(f) | | 10,475 | 10,779 |
| 6 month U.S. LIBOR + 1.720% 3.345% 8/1/37 (b)(f) | | 2,859 | 2,962 |
| 6 month U.S. LIBOR + 1.746% 3.83% 5/1/37 (b)(f) | | 768 | 787 |
| 6 month U.S. LIBOR + 1.932% 3.84% 10/1/36 (b)(f) | | 9,504 | 9,862 |
| 6 month U.S. LIBOR + 1.976% 4.073% 10/1/35 (b)(f) | | 6,416 | 6,677 |
| 6 month U.S. LIBOR + 2.010% 4.174% 5/1/37 (b)(f) | | 11,163 | 11,491 |
| 6 month U.S. LIBOR + 2.010% 4.26% 5/1/37 (b)(f) | | 7,982 | 8,346 |
| 6 month U.S. LIBOR + 2.040% 3.622% 6/1/37 (b)(f) | | 3,323 | 3,482 |
| 6 month U.S. LIBOR + 2.066% 4.336% 6/1/37 (b)(f) | | 2,176 | 2,280 |
| 6 month U.S. LIBOR + 2.755% 4.845% 10/1/35 (b)(f) | | 1,412 | 1,497 |
| U.S. TREASURY 1 YEAR INDEX + 2.035% 3.899% 6/1/33 (b)(f) | | 8,449 | 8,808 |
| U.S. TREASURY 1 YEAR INDEX + 2.548% 3.548% 7/1/35 (b)(f) | | 4,642 | 4,919 |
| 3% 11/1/33 | | 781,183 | 774,815 |
| 3.5% 7/1/32 | | 428,585 | 433,124 |
| 6% 1/1/24 | | 53,036 | 55,684 |
| 6.5% 9/1/21 to 3/1/22 | | 8,866 | 9,272 |
|
| TOTAL FREDDIE MAC | | | 1,821,267 |
|
| Ginnie Mae - 1.3% | | | |
| 6% 6/15/36 | | 227,074 | 253,350 |
| 4.312% 8/20/61 (b)(l) | | 62,420 | 62,698 |
| 4.5% 3/20/47 | | 238,239 | 248,635 |
| 4.5% 7/1/48 (d) | | 5,250,000 | 5,456,122 |
| 4.5% 7/1/48 (d) | | 6,800,000 | 7,066,978 |
| 4.5% 7/1/48 (d) | | 4,900,000 | 5,092,381 |
| 4.5% 7/1/48 (d) | | 300,000 | 311,778 |
| 4.618% 2/20/62 (b)(l) | | 93,272 | 94,532 |
| 4.677% 2/20/62 (b)(l) | | 120,141 | 121,269 |
| 4.716% 1/20/62 (b)(l) | | 485,596 | 490,093 |
| 5.47% 8/20/59 (b)(l) | | 1,011 | 1,039 |
|
| TOTAL GINNIE MAE | | | 19,198,875 |
|
| TOTAL U.S. GOVERNMENT AGENCY - MORTGAGE SECURITIES | | | |
| (Cost $46,984,012) | | | 46,974,048 |
|
| Asset-Backed Securities - 0.9% | | | |
| ALG Student Loan Trust Series 2017-1A Class A3, 3 month U.S. LIBOR + 0.090% 2.4488% 6/28/23 (b)(c)(f) | | $1,622,263 | $1,613,796 |
| GCO Education Loan Funding Trust Series 2006-1 Class A8L, 3 month U.S. LIBOR + 0.130% 2.46% 5/25/25 (b)(f) | | 383,488 | 382,878 |
| Goal Capital Funding Trust Series 2005-2 Class A3, 3 month U.S. LIBOR + 0.170% 2.5% 5/28/30 (b)(f) | | 201,621 | 201,433 |
| Higher Education Funding Series 2005-1 Class A5, 3 month U.S. LIBOR + 0.160% 2.49% 2/25/32 (b)(f) | | 220,486 | 220,197 |
| Illinois Student Assistance Commission Student Loan Rev. Series 2010-1 Class A2, 3 month U.S. LIBOR + 1.050% 3.4095% 4/25/22 (b)(f) | | 44,595 | 44,646 |
| Navient Student Loan Trust: | | | |
| Series 2017-3A: | | | |
| Class A1, 1 month U.S. LIBOR + 0.300% 2.3911% 7/26/66 (b)(c)(f) | | 494,075 | 494,504 |
| Class A2, 1 month U.S. LIBOR + 0.600% 2.6911% 7/26/66 (b)(c)(f) | | 980,000 | 987,361 |
| Series 2018-1A Class A1, 1 month U.S. LIBOR + 0.190% 2.2811% 3/25/67 (b)(c)(f) | | 1,196,510 | 1,196,136 |
| Northstar Education Finance, Inc., Delaware Series 2004-2 Class A4, 3 month U.S. LIBOR + 0.230% 2.5888% 7/28/21 (b)(f) | | 2,349,560 | 2,350,149 |
| SLM Student Loan Trust Series 2007-8 Class A4, 3 month U.S. LIBOR + 0.470% 2.8295% 1/26/26 (b)(f) | | 6,206,114 | 6,220,945 |
| TOTAL ASSET-BACKED SECURITIES | | | |
| (Cost $13,703,218) | | | 13,712,045 |
|
| Collateralized Mortgage Obligations - 2.5% | | | |
| U.S. Government Agency - 2.5% | | | |
| Fannie Mae: | | | |
| floater Series 2010-15 Class FJ, 1 month U.S. LIBOR + 0.930% 3.0211% 6/25/36 (b)(f) | | 234,201 | 238,578 |
| planned amortization class: | | | |
| Series 2003-70 Class BJ, 5% 7/25/33 | | 12,402 | 13,226 |
| Series 2005-19 Class PA, 5.5% 7/25/34 | | 42,064 | 42,956 |
| Series 2005-64 Class PX, 5.5% 6/25/35 | | 59,498 | 62,491 |
| Series 2005-68 Class CZ, 5.5% 8/25/35 | | 295,634 | 321,040 |
| Series 2010-118 Class PB, 4.5% 10/25/40 | | 208,793 | 216,125 |
| Series 2012-149: | | | |
| Class DA, 1.75% 1/25/43 | | 101,793 | 96,867 |
| Class GA, 1.75% 6/25/42 | | 101,335 | 96,297 |
| sequential payer: | | | |
| Series 2003-117 Class MD, 5% 12/25/23 | | 43,659 | 45,223 |
| Series 2004-52 Class KZ, 5.5% 7/25/34 | | 547,947 | 597,901 |
| Series 2004-91 Class Z, 5% 12/25/34 | | 200,785 | 214,247 |
| Series 2005-117 Class JN, 4.5% 1/25/36 | | 16,835 | 17,416 |
| Series 2005-14 Class ZB, 5% 3/25/35 | | 81,852 | 87,350 |
| Series 2006-72 Class CY, 6% 8/25/26 | | 34,637 | 36,661 |
| Series 2009-59 Class HB, 5% 8/25/39 | | 120,172 | 128,227 |
| Series 2009-85 Class IB, 4.5% 8/25/24 (m) | | 5,103 | 140 |
| Series 2009-93 Class IC, 4.5% 9/25/24 (m) | | 6,865 | 169 |
| Series 2010-139 Class NI, 4.5% 2/25/40 (m) | | 105,702 | 10,283 |
| Series 2010-39 Class FG, 1 month U.S. LIBOR + 0.920% 3.0111% 3/25/36 (b)(f) | | 145,441 | 149,111 |
| Series 2010-97 Class CI, 4.5% 8/25/25 (m) | | 21,439 | 859 |
| Series 2011-67 Class AI, 4% 7/25/26 (m) | | 33,721 | 2,952 |
| Series 2012-27 Class EZ, 4.25% 3/25/42 | | 406,066 | 419,631 |
| Series 2016-26 Class CG, 3% 5/25/46 | | 740,587 | 733,097 |
| Freddie Mac: | | | |
| floater Series 2711 Class FC, 1 month U.S. LIBOR + 0.900% 2.9733% 2/15/33 (b)(f) | | 74,117 | 75,629 |
| floater planned amortization class Series 2770 Class FH, 1 month U.S. LIBOR + 0.400% 2.4733% 3/15/34 (b)(f) | | 96,806 | 97,338 |
| planned amortization class: | | | |
| Series 2101 Class PD, 6% 11/15/28 | | 1,725 | 1,820 |
| Series 2996 Class MK, 5.5% 6/15/35 | | 3,295 | 3,517 |
| Series 3415 Class PC, 5% 12/15/37 | | 32,765 | 34,653 |
| Series 3840 Class VA, 4.5% 9/15/27 | | 137,270 | 138,523 |
| Series 3857 Class ZP, 5% 5/15/41 | | 182,265 | 205,019 |
| Series 4135 Class AB, 1.75% 6/15/42 | | 75,582 | 71,890 |
| sequential payer: | | | |
| Series 2004-2802 Class ZG, 5.5% 5/15/34 | | 451,635 | 490,376 |
| Series 2303 Class ZV, 6% 4/15/31 | | 4,026 | 4,354 |
| Series 2877 Class ZD, 5% 10/15/34 | | 244,239 | 260,307 |
| Series 3745 Class KV, 4.5% 12/15/26 | | 351,823 | 366,145 |
| Series 3843 Class PZ, 5% 4/15/41 | | 160,235 | 178,163 |
| Freddie Mac Multi-family Structured pass-thru certificates sequential payer: | | | |
| Series 4335 Class AL, 4.25% 3/15/40 | | 291,667 | 298,805 |
| Series 4341 Class ML, 3.5% 11/15/31 | | 407,903 | 412,500 |
| Ginnie Mae guaranteed REMIC pass-thru certificates: | | | |
| floater: | | | |
| Series 2007-59 Class FC, 1 month U.S. LIBOR + 0.500% 2.5838% 7/20/37 (b)(f) | | 50,225 | 50,586 |
| Series 2008-2 Class FD, 1 month U.S. LIBOR + 0.480% 2.5638% 1/20/38 (b)(f) | | 12,484 | 12,573 |
| Series 2008-73 Class FA, 1 month U.S. LIBOR + 0.860% 2.9438% 8/20/38 (b)(f) | | 84,359 | 85,897 |
| Series 2008-83 Class FB, 1 month U.S. LIBOR + 0.900% 2.9838% 9/20/38 (b)(f) | | 71,311 | 72,963 |
| Series 2009-108 Class CF, 1 month U.S. LIBOR + 0.600% 2.6851% 11/16/39 (b)(f) | | 54,530 | 55,077 |
| Series 2009-116 Class KF, 1 month U.S. LIBOR + 0.530% 2.6151% 12/16/39 (b)(f) | | 41,853 | 42,232 |
| Series 2010-H17 Class FA, 1 month U.S. LIBOR + 0.330% 2.3056% 7/20/60 (b)(f)(l) | | 373,884 | 373,417 |
| Series 2010-H18 Class AF, 1 month U.S. LIBOR + 0.300% 2.2171% 9/20/60 (b)(f)(l) | | 454,738 | 453,806 |
| Series 2010-H19 Class FG, 1 month U.S. LIBOR + 0.300% 2.2171% 8/20/60 (b)(f)(l) | | 481,436 | 480,426 |
| Series 2010-H27 Series FA, 1 month U.S. LIBOR + 0.380% 2.2971% 12/20/60 (b)(f)(l) | | 204,196 | 204,228 |
| Series 2011-H05 Class FA, 1 month U.S. LIBOR + 0.500% 2.4171% 12/20/60 (b)(f)(l) | | 271,050 | 271,854 |
| Series 2011-H07 Class FA, 1 month U.S. LIBOR + 0.500% 2.4171% 2/20/61 (b)(f)(l) | | 493,771 | 494,957 |
| Series 2011-H12 Class FA, 1 month U.S. LIBOR + 0.490% 2.4071% 2/20/61 (b)(f)(l) | | 703,836 | 705,394 |
| Series 2011-H13 Class FA, 1 month U.S. LIBOR + 0.500% 2.4171% 4/20/61 (b)(f)(l) | | 222,764 | 223,434 |
| Series 2011-H14: | | | |
| Class FB, 1 month U.S. LIBOR + 0.500% 2.4171% 5/20/61 (b)(f)(l) | | 275,720 | 276,680 |
| Class FC, 1 month U.S. LIBOR + 0.500% 2.4171% 5/20/61 (b)(f)(l) | | 249,072 | 249,871 |
| Series 2011-H17 Class FA, 1 month U.S. LIBOR + 0.530% 2.4471% 6/20/61 (b)(f)(l) | | 312,274 | 313,378 |
| Series 2011-H21 Class FA, 1 month U.S. LIBOR + 0.600% 2.5171% 10/20/61 (b)(f)(l) | | 350,604 | 352,525 |
| Series 2012-H01 Class FA, 1 month U.S. LIBOR + 0.700% 2.6171% 11/20/61 (b)(f)(l) | | 309,097 | 311,692 |
| Series 2012-H03 Class FA, 1 month U.S. LIBOR + 0.700% 2.6171% 1/20/62 (b)(f)(l) | | 197,471 | 199,049 |
| Series 2012-H06 Class FA, 1 month U.S. LIBOR + 0.630% 2.5471% 1/20/62 (b)(f)(l) | | 294,190 | 296,085 |
| Series 2012-H07 Class FA, 1 month U.S. LIBOR + 0.630% 2.5471% 3/20/62 (b)(f)(l) | | 183,989 | 185,044 |
| Series 2012-H21 Class DF, 1 month U.S. LIBOR + 0.650% 2.5671% 5/20/61 (b)(f)(l) | | 54,391 | 54,523 |
| Series 2013-H19 Class FD, 1 month U.S. LIBOR + 0.600% 2.5171% 8/20/63 (b)(f)(l) | | 170,138 | 170,884 |
| Series 2014-H11 Class BA, 1 month U.S. LIBOR + 0.500% 2.4171% 6/20/64 (b)(f)(l) | | 1,451,351 | 1,456,206 |
| Series 2015-H13 Class FL, 1 month U.S. LIBOR + 0.280% 2.1971% 5/20/63 (b)(f)(l) | | 365,673 | 365,744 |
| Series 2015-H19 Class FA, 1 month U.S. LIBOR + 0.200% 2.1171% 4/20/63 (b)(f)(l) | | 424,507 | 424,375 |
| Series 2016-H20 Class FM, 1 month U.S. LIBOR + 0.400% 2.3171% 12/20/62 (b)(f)(l) | | 392,349 | 392,679 |
| planned amortization class: | | | |
| Series 2010-31 Class BP, 5% 3/20/40 | | 620,000 | 682,643 |
| Series 2011-136 Class WI, 4.5% 5/20/40 (m) | | 69,254 | 8,209 |
| Series 2017-134 Class BA, 2.5% 11/20/46 | | 90,583 | 86,885 |
| sequential payer: | | | |
| Series 2011-69 Class GX, 4.5% 5/16/40 | | 470,000 | 491,541 |
| Series 2013-H06 Class HA, 1.65% 1/20/63 (l) | | 179,706 | 177,254 |
| Series 2013-H26 Class HA, 3.5% 9/20/63 (l) | | 866,781 | 871,016 |
| Series 2014-H04 Class HA, 2.75% 2/20/64 (l) | | 1,947,822 | 1,932,896 |
| Series 2014-H12 Class KA, 2.75% 5/20/64 (l) | | 271,377 | 267,598 |
| Series 2016-H02 Class FM, 1 month U.S. LIBOR + 0.500% 2.4171% 9/20/62 (b)(f)(l) | | 804,481 | 806,393 |
| Series 2016-H04 Class FE, 1 month U.S. LIBOR + 0.650% 2.5671% 11/20/65 (b)(f)(l) | | 154,049 | 154,503 |
| Series 2004-22 Class M1, 5.5% 4/20/34 | | 50,043 | 61,722 |
| Series 2010-169 Class Z, 4.5% 12/20/40 | | 403,979 | 421,911 |
| Series 2010-H15 Class TP, 5.15% 8/20/60 (l) | | 529,708 | 537,626 |
| Series 2010-H16 Class BA, 3.55% 7/20/60 (l) | | 2,533,123 | 2,540,793 |
| Series 2010-H17 Class XP, 5.2972% 7/20/60 (b)(l) | | 571,238 | 580,631 |
| Series 2010-H18 Class PL, 5.01% 9/20/60 (b)(l) | | 450,532 | 456,751 |
| Series 2010-H22 Class LA, 3.75% 10/20/60 (l) | | 541,503 | 544,116 |
| Series 2010-H28 Class KA, 3.75% 12/20/60 (l) | | 1,117,035 | 1,123,279 |
| Series 2012-64 Class KI, 3.5% 11/20/36 (m) | | 53,110 | 3,907 |
| Series 2013-124: | | | |
| Class ES, 8.667% - 1 month U.S. LIBOR 5.8883% 4/20/39 (b)(n) | | 245,810 | 249,841 |
| Class ST, 8.800% - 1 month U.S. LIBOR 6.0217% 8/20/39 (b)(n) | | 741,156 | 760,363 |
| Series 2013-H01 Class FA, 1.65% 1/20/63 (l) | | 932,881 | 917,962 |
| Series 2013-H07 Class JA, 1.75% 3/20/63 (l) | | 1,482,713 | 1,460,153 |
| Series 2015-H17 Class HA, 2.5% 5/20/65 (l) | | 875,343 | 870,806 |
| Series 2015-H21: | | | |
| Class HA, 2.5% 6/20/63 (l) | | 1,683,558 | 1,676,796 |
| Class JA, 2.5% 6/20/65 (l) | | 206,243 | 205,232 |
| Series 2015-H30 Class HA, 1.75% 9/20/62 (b)(l) | | 1,935,427 | 1,912,433 |
| Series 2016-H13 Class FB, U.S. TREASURY 1 YEAR INDEX + 0.500% 2.59% 5/20/66 (b)(f)(l) | | 1,166,212 | 1,171,177 |
| Series 2017-H06 Class FA, U.S. TREASURY 1 YEAR INDEX + 0.350% 2.6% 8/20/66 (b)(f)(l) | | 1,360,331 | 1,362,383 |
| Series 2090-118 Class XZ, 5% 12/20/39 | | 802,326 | 873,420 |
| TOTAL COLLATERALIZED MORTGAGE OBLIGATIONS | | | |
| (Cost $38,428,483) | | | 37,955,705 |
|
| Commercial Mortgage Securities - 2.4% | | | |
| Fannie Mae Series 2017-T1 Class A, 2.898% 6/25/27 | | 3,198,131 | 3,043,438 |
| Freddie Mac: | | | |
| floater: | | | |
| Series KP04 Class AG1, 1 month U.S. LIBOR + 0.220% 2.2207% 7/25/20 (b)(f) | | 900,000 | 900,540 |
| Series KP04, Class AG2, 1 month U.S. LIBOR + 0.200% 2.2007% 10/25/19 (b)(f) | | 1,800,000 | 1,800,002 |
| pass-thru certificates sequential payer Series K011 Class A2, 4.084% 11/25/20 | | 260,000 | 266,108 |
| sequential payer: | | | |
| Series 2017-SR01 Class A2, 2.75% 11/25/22 | | 1,600,000 | 1,565,866 |
| Series 2018-K731 Class A2, 3.6% 2/25/25 | | 1,840,000 | 1,878,870 |
| Series K006 Class A2, 4.251% 1/25/20 | | 1,042,000 | 1,057,829 |
| Series K069 Class A2, 3.187% 9/25/27 | | 600,000 | 587,701 |
| Series K071 Class A2, 3.286% 11/25/27 | | 800,000 | 789,586 |
| Series K072 Class A2, 3.444% 12/25/27 | | 2,173,000 | 2,173,585 |
| Series K073 Class A2, 3.35% 1/25/28 | | 3,500,000 | 3,471,614 |
| Series K155: | | | |
| Class A1, 3.589% 11/25/29 | | 70,000 | 71,597 |
| Class A2, 3.75% 11/25/32 | | 1,100,000 | 1,119,005 |
| Series K708 Class A2, 2.13% 1/25/19 | | 1,956,709 | 1,949,705 |
| Series K709 Class A2, 2.086% 3/25/19 | | 1,080,000 | 1,075,028 |
| Series K710 Class A2, 1.883% 5/25/19 | | 913,494 | 908,130 |
| Series K712 Class A2, 1.869% 11/25/19 | | 1,048,946 | 1,036,283 |
| Series K713 Class A2, 2.313% 3/25/20 | | 276,064 | 273,880 |
| Series K717 Class A2, 2.991% 9/25/21 | | 2,612,000 | 2,607,950 |
| Series 2018-K075 Class A1, 3.568% 10/25/27 (b) | | 2,167,210 | 2,203,266 |
| Series K076 Class A2, 3.9% 4/25/28 | | 900,000 | 931,427 |
| Series K077 Class A2, 3.85% 5/25/28 | | 1,300,000 | 1,343,733 |
| Series K504 Class A2, 2.566% 9/25/20 | | 1,213,000 | 1,207,995 |
| Series K704 Class A2, 2.412% 8/25/18 | | 140,559 | 140,319 |
| Series K706 Class A2, 2.323% 10/25/18 | | 690,990 | 689,327 |
| Freddie Mac Multi-family floater Series 2017-KT01 Class A, 1 month U.S. LIBOR + 0.320% 2.4036% 2/25/20 (b)(f) | | 2,634,000 | 2,640,067 |
| TOTAL COMMERCIAL MORTGAGE SECURITIES | | | |
| (Cost $36,165,057) | | | 35,732,851 |
|
| Foreign Government and Government Agency Obligations - 12.2% | | | |
| Angola Republic 9.375% 5/8/48 (c) | | 180,000 | 181,505 |
| Arab Republic of Egypt: | | | |
| 5.577% 2/21/23 (c) | | 585,000 | 554,288 |
| 5.875% 6/11/25 | | 200,000 | 186,026 |
| 5.875% 6/11/25 (c) | | 200,000 | 186,026 |
| 6.125% 1/31/22 (c) | | 1,990,000 | 1,956,273 |
| 7.5% 1/31/27 (c) | | 215,000 | 211,349 |
| 7.903% 2/21/48 (c) | | 360,000 | 327,542 |
| 8.5% 1/31/47 (c) | | 685,000 | 662,820 |
| Argentine Republic: | | | |
| 5.625% 1/26/22 | | 485,000 | 453,233 |
| 6.875% 4/22/21 | | 5,455,000 | 5,373,175 |
| 7.125% 6/28/2117 | | 275,000 | 211,241 |
| 7.5% 4/22/26 | | 3,240,000 | 2,988,900 |
| 7.625% 4/22/46 | | 645,000 | 520,515 |
| 21.2% 9/19/18 | ARS | 2,635,000 | 87,828 |
| Australian Commonwealth: | | | |
| 2.25% 11/21/22 | AUD | 5,650,000 | 4,183,440 |
| 2.25% 5/21/28 (Reg. S) | AUD | 1,900,000 | 1,358,679 |
| 2.75% 10/21/19 | AUD | 3,400,000 | 2,540,874 |
| Bahamian Republic 6% 11/21/28 (c) | | 180,000 | 179,550 |
| Barbados Government: | | | |
| 7% 8/4/22 (c)(e) | | 330,000 | 181,500 |
| 7.25% 12/15/21 (c)(e) | | 35,000 | 19,250 |
| Belarus Republic: | | | |
| 6.875% 2/28/23 (c) | | 835,000 | 863,348 |
| 7.625% 6/29/27 (c) | | 345,000 | 360,163 |
| Brazilian Federative Republic: | | | |
| 5.625% 1/7/41 | | 1,125,000 | 977,063 |
| 5.625% 2/21/47 | | 300,000 | 254,550 |
| 7.125% 1/20/37 | | 210,000 | 221,025 |
| 8.25% 1/20/34 | | 1,715,000 | 1,955,958 |
| 10% 1/1/21 | BRL | 1,105,000 | 289,573 |
| Buenos Aires Province: | | | |
| 6.5% 2/15/23 (c) | | 115,000 | 104,979 |
| 9.95% 6/9/21 (c) | | 785,000 | 807,373 |
| 10.875% 1/26/21 (c) | | 750,000 | 770,625 |
| 10.875% 1/26/21 (Reg. S) | | 2,500,000 | 2,568,750 |
| Buoni del Tesoro Poliennali: | | | |
| 2% 2/1/28 | EUR | 5,570,000 | 6,141,648 |
| 2.7% 3/1/47 (c) | EUR | 1,050,000 | 1,095,233 |
| Cameroon Republic 9.5% 11/19/25 (c) | | 440,000 | 462,852 |
| Canadian Government: | | | |
| Real Return Bond 1.25% 12/1/47 | CAD | 1,837,836 | 1,700,233 |
| 0.75% 5/1/19 | CAD | 8,800,000 | 6,641,518 |
| 1% 6/1/27 | CAD | 1,400,000 | 965,512 |
| 3.5% 12/1/45 | CAD | 700,000 | 672,466 |
| City of Buenos Aires 8.95% 2/19/21 (c) | | 200,000 | 204,340 |
| Colombian Republic: | | | |
| 7.375% 9/18/37 | | 185,000 | 230,325 |
| 10.375% 1/28/33 | | 605,000 | 921,113 |
| Croatia Republic 5.5% 4/4/23 (c) | | 165,000 | 173,430 |
| Danish Kingdom 1.75% 11/15/25 | DKK | 10,000,000 | 1,761,095 |
| Democratic Socialist Republic of Sri Lanka: | | | |
| 5.125% 4/11/19 (c) | | 195,000 | 194,635 |
| 5.75% 4/18/23 (c) | | 280,000 | 268,075 |
| 6.2% 5/11/27 (c) | | 100,000 | 91,253 |
| 6.25% 10/4/20 (c) | | 100,000 | 101,250 |
| 6.25% 7/27/21 (c) | | 210,000 | 211,312 |
| Dominican Republic: | | | |
| 5.95% 1/25/27 (c) | | 395,000 | 390,063 |
| 6.6% 1/28/24 (c) | | 100,000 | 104,844 |
| 6.85% 1/27/45 (c) | | 165,000 | 163,297 |
| 6.875% 1/29/26 (c) | | 460,000 | 487,301 |
| 7.45% 4/30/44 (c) | | 370,000 | 383,875 |
| Ecuador Republic: | | | |
| 8.875% 10/23/27 (c) | | 445,000 | 393,247 |
| 9.65% 12/13/26 (c) | | 400,000 | 374,680 |
| El Salvador Republic: | | | |
| 7.375% 12/1/19 (c) | | 915,000 | 934,453 |
| 7.75% 1/24/23 (c) | | 230,000 | 241,355 |
| French Government 2% 5/25/48 (c) | EUR | 1,000,000 | 1,295,452 |
| Gabonese Republic 6.375% 12/12/24 (c) | | 225,000 | 200,962 |
| Georgia Republic 6.875% 4/12/21 (c) | | 125,000 | 132,524 |
| German Federal Republic 0% 3/13/20 | EUR | 400,000 | 472,536 |
| Ghana Republic 8.627% 6/16/49 (c) | | 290,000 | 282,176 |
| Hong Kong Government SAR 1.32% 12/23/19 | HKD | 2,700,000 | 341,744 |
| Indonesian Republic: | | | |
| 7.75% 1/17/38 (c) | | 690,000 | 886,258 |
| 8.375% 3/15/24 | IDR | 4,041,000,000 | 288,059 |
| 8.5% 10/12/35 (Reg. S) | | 700,000 | 941,702 |
| Irish Republic 1.3% 5/15/33 | EUR | 150,000 | 175,466 |
| Islamic Republic of Pakistan: | | | |
| 6.75% 12/3/19 (c) | | 710,000 | 695,050 |
| 7.25% 4/15/19 (c) | | 2,050,000 | 2,023,473 |
| 8.25% 4/15/24 (c) | | 240,000 | 229,109 |
| Israeli State (guaranteed by U.S. Government through Agency for International Development): | | | |
| 5.5% 9/18/23 | | 4,140,000 | 4,658,615 |
| 5.5% 12/4/23 | | 1,628,000 | 1,839,617 |
| Ivory Coast 5.75% 12/31/32 | | 141,750 | 131,272 |
| Japan Government: | | | |
| 0.4% 3/20/56 | JPY | 628,000,000 | 4,873,119 |
| 0.9% 6/20/22 | JPY | 2,833,600,000 | 26,623,731 |
| Jordanian Kingdom: | | | |
| 3% 6/30/25 | | 1,179,000 | 1,168,340 |
| 7.375% 10/10/47 (c) | | 200,000 | 183,132 |
| Kingdom of Norway 3.75% 5/25/21 | NOK | 5,000,000 | 659,999 |
| Kingdom of Saudi Arabia 3.625% 3/4/28 (c) | | 285,000 | 271,001 |
| Lebanese Republic: | | | |
| 5.15% 11/12/18 | | 2,473,000 | 2,464,592 |
| 5.45% 11/28/19 | | 735,000 | 704,681 |
| 5.5% 4/23/19 | | 365,000 | 357,290 |
| 5.8% 4/14/20 | | 170,000 | 161,109 |
| 6% 5/20/19 | | 1,225,000 | 1,200,931 |
| 6.375% 3/9/20 | | 150,000 | 143,616 |
| Ministry of Finance Russian Federation 4.75% 5/27/26 | | 400,000 | 400,402 |
| Mongolian People's Republic 8.75% 3/9/24 (c) | | 685,000 | 734,075 |
| New Zealand Government 6% 5/15/21 | NZD | 1,000,000 | 753,704 |
| Panamanian Republic 9.375% 4/1/29 | | 80,000 | 112,000 |
| Peruvian Republic: | | | |
| 4% 3/7/27 (h)(i) | | 570,000 | 559,832 |
| 8.2% 8/12/26 (Reg. S) | PEN | 790,000 | 286,539 |
| Plurinational State of Bolivia 5.95% 8/22/23 (c) | | 100,000 | 100,744 |
| Portuguese Republic 2.25% 4/18/34 (c) | EUR | 1,350,000 | 1,563,035 |
| Province of Santa Fe 7% 3/23/23 (c) | | 1,080,000 | 998,514 |
| Provincia de Cordoba: | | | |
| 7.125% 6/10/21 (c) | | 1,465,000 | 1,384,425 |
| 7.45% 9/1/24 (c) | | 695,000 | 624,047 |
| Republic of Angola 7% 8/17/19 (Issued by Northern Lights III BV for Republic of Angola) (Reg. S) | | 234,375 | 235,066 |
| Republic of Armenia: | | | |
| 6% 9/30/20 (c) | | 710,000 | 725,052 |
| 7.15% 3/26/25 (c) | | 200,000 | 209,100 |
| Republic of Iraq: | | | |
| 5.8% 1/15/28 (Reg. S) | | 2,000,000 | 1,791,208 |
| 6.752% 3/9/23 (c) | | 380,000 | 364,511 |
| Republic of Kenya: | | | |
| 5.875% 6/24/19 (c) | | 145,000 | 145,380 |
| 6.875% 6/24/24 (c) | | 100,000 | 98,646 |
| 7.25% 2/28/28 (c) | | 215,000 | 206,407 |
| Republic of Nigeria: | | | |
| 6.75% 1/28/21(c) | | 90,000 | 91,463 |
| 7.625% 11/28/47 (c) | | 215,000 | 195,847 |
| Republic of Portugal 4.95% 10/25/23 | EUR | 2,350,000 | 3,360,020 |
| Republic of Senegal 6.75% 3/13/48 (c) | | 105,000 | 89,629 |
| Republic of Serbia 7.25% 9/28/21 (c) | | 120,000 | 130,950 |
| Republic of Singapore 3.25% 9/1/20 | SGD | 4,600,000 | 3,465,615 |
| Russian Federation: | | | |
| 4.25% 6/23/27 (c) | | 200,000 | 192,734 |
| 5.25% 6/23/47 (c) | | 1,400,000 | 1,348,200 |
| 5.625% 4/4/42 (c) | | 400,000 | 417,800 |
| 5.875% 9/16/43 (c) | | 280,000 | 300,826 |
| 12.75% 6/24/28 (Reg. S) | | 1,340,000 | 2,185,031 |
| Rwanda Republic 6.625% 5/2/23 (c) | | 400,000 | 396,842 |
| South African Republic: | | | |
| 5.875% 9/16/25 | | 150,000 | 153,960 |
| 5.875% 6/22/30 | | 145,000 | 143,751 |
| 10.5% 12/21/26 | ZAR | 9,540,000 | 761,731 |
| Spanish Kingdom: | | | |
| 1.4% 4/30/28 (Reg. S) (c) | EUR | 700,000 | 822,723 |
| 2.9% 10/31/46(Reg. S) (c) | EUR | 750,000 | 955,100 |
| State of Qatar: | | | |
| 3.875% 4/23/23 (c) | | 430,000 | 429,687 |
| 9.75% 6/15/30 (c) | | 200,000 | 291,926 |
| Sultanate of Oman 6.75% 1/17/48 (c) | | 490,000 | 443,450 |
| Sweden Kingdom 4.25% 3/12/19 | SEK | 21,700,000 | 2,507,792 |
| Switzerland Confederation 3% 5/12/19 | CHF | 3,200,000 | 3,337,009 |
| Turkish Republic: | | | |
| 4.875% 10/9/26 | | 220,000 | 193,494 |
| 5.125% 3/25/22 | | 175,000 | 169,411 |
| 5.625% 3/30/21 | | 550,000 | 546,717 |
| 5.75% 5/11/47 | | 140,000 | 112,963 |
| 6% 3/25/27 | | 325,000 | 305,388 |
| 6.25% 9/26/22 | | 2,660,000 | 2,667,560 |
| 6.75% 5/30/40 | | 250,000 | 228,468 |
| 6.875% 3/17/36 | | 530,000 | 498,423 |
| 7% 6/5/20 | | 230,000 | 235,442 |
| 7.25% 3/5/38 | | 370,000 | 361,120 |
| 7.375% 2/5/25 | | 415,000 | 429,110 |
| 8% 2/14/34 | | 175,000 | 183,261 |
| Turkiye Ihracat Kredi Bankasi A/S 5.375% 2/8/21 (c) | | 265,000 | 257,812 |
| Ukraine Government: | | | |
| 1.471% 9/29/21 | | 1,600,000 | 1,535,973 |
| 7.75% 9/1/20 (c) | | 1,395,000 | 1,386,722 |
| 7.75% 9/1/21 (c) | | 4,838,000 | 4,765,430 |
| 7.75% 9/1/22 (c) | | 4,041,000 | 3,945,115 |
| United Kingdom, Great Britain and Northern Ireland: | | | |
| 1.75% 7/22/19 (Reg.S) | GBP | 8,750,000 | 11,677,090 |
| 4.25% 12/7/27 | GBP | 2,250,000 | 3,749,877 |
| United Kingdom, Great Britain and Northern Ireland Treasury GILT 2.5% 7/22/65 (Reg. S) | GBP | 1,800,000 | 3,102,922 |
| United Mexican States: | | | |
| 6.05% 1/11/40 | | 200,000 | 220,500 |
| 6.5% 6/9/22 | MXN | 1,600,000 | 77,278 |
| Uruguay Republic 7.875% 1/15/33 pay-in-kind | | 105,000 | 137,114 |
| Venezuelan Republic: | | | |
| oil recovery warrants 4/15/20 (i)(o) | | 1,251 | 1,877 |
| 9.25% 9/15/27 (e) | | 2,550,000 | 718,335 |
| 11.95% 8/5/31 (Reg. S) (e) | | 840,000 | 238,308 |
| 12.75% 8/23/22 (e) | | 190,000 | 52,953 |
| Vietnamese Socialist Republic: | | | |
| 6 month U.S. LIBOR + 0.813% 3.125% 3/13/28 (b)(f)(i) | | 75,000 | 64,364 |
| 5.5% 3/12/28 | | 2,107,000 | 2,051,354 |
| TOTAL FOREIGN GOVERNMENT AND GOVERNMENT AGENCY OBLIGATIONS | | | |
| (Cost $185,612,688) | | | 183,481,536 |
|
| Supranational Obligations - 0.0% | | | |
European Bank for Reconstruction & Development 6% 5/4/20 (Reg. S)
(Cost $513,300) | INR | 33,000,000 | 468,970 |
| | | Shares | Value |
|
| Common Stocks - 5.3% | | | |
| CONSUMER DISCRETIONARY - 1.2% | | | |
| Auto Components - 0.1% | | | |
| Chassix Holdings, Inc. warrants 7/29/20 (i)(p) | | 1,921 | 20,612 |
| Exide Technologies (i)(p) | | 2,115 | 0 |
| Exide Technologies (i)(p) | | 7,052 | 4,936 |
| Lear Corp. | | 6,800 | 1,263,508 |
| UC Holdings, Inc. (i) | | 33,750 | 859,950 |
| | | | 2,149,006 |
| Automobiles - 0.0% | | | |
| Fiat Chrysler Automobiles NV | | 34,200 | 646,038 |
| Diversified Consumer Services - 0.0% | | | |
| Houghton Mifflin Harcourt Co. warrants 6/22/19 (p)(q) | | 2,218 | 39 |
| Hotels, Restaurants & Leisure - 0.5% | | | |
| Boyd Gaming Corp. | | 27,300 | 946,218 |
| Melco Crown Entertainment Ltd. sponsored ADR | | 42,900 | 1,201,200 |
| MGM Mirage, Inc. | | 19,100 | 554,473 |
| Penn National Gaming, Inc. (p) | | 27,600 | 927,084 |
| Royal Caribbean Cruises Ltd. | | 6,000 | 621,600 |
| Scientific Games Corp. Class A (p) | | 16,300 | 801,145 |
| The Stars Group, Inc. (p) | | 18,100 | 657,030 |
| Wyndham Destinations, Inc. | | 6,300 | 278,901 |
| Wyndham Hotels & Resorts, Inc. | | 6,300 | 370,629 |
| Wynn Resorts Ltd. | | 5,000 | 836,700 |
| | | | 7,194,980 |
| Household Durables - 0.1% | | | |
| Lennar Corp.: | | | |
| Class A | | 17,469 | 917,123 |
| Class B | | 349 | 14,899 |
| Toll Brothers, Inc. | | 15,700 | 580,743 |
| | | | 1,512,765 |
| Internet & Direct Marketing Retail - 0.2% | | | |
| Netflix, Inc. (p) | | 4,000 | 1,565,720 |
| The Booking Holdings, Inc. (p) | | 400 | 810,836 |
| | | | 2,376,556 |
| Media - 0.2% | | | |
| Naspers Ltd. Class N | | 9,500 | 2,413,523 |
| Textiles, Apparel & Luxury Goods - 0.1% | | | |
| adidas AG | | 5,102 | 1,113,870 |
|
| TOTAL CONSUMER DISCRETIONARY | | | 17,406,777 |
|
| CONSUMER STAPLES - 0.2% | | | |
| Food & Staples Retailing - 0.0% | | | |
| Southeastern Grocers, Inc. (i)(p) | | 16,631 | 506,414 |
| Food Products - 0.2% | | | |
| Darling International, Inc. (p) | | 71,600 | 1,423,408 |
| JBS SA | | 281,400 | 675,229 |
| Reddy Ice Holdings, Inc. (p) | | 5,683 | 1,137 |
| | | | 2,099,774 |
|
| TOTAL CONSUMER STAPLES | | | 2,606,188 |
|
| ENERGY - 0.2% | | | |
| Energy Equipment & Services - 0.1% | | | |
| Forbes Energy Services Ltd. (p) | | 6,562 | 59,058 |
| Weatherford International PLC (p)(r) | | 184,000 | 605,360 |
| | | | 664,418 |
| Oil, Gas & Consumable Fuels - 0.1% | | | |
| Chaparral Energy, Inc.: | | | |
| Class A (p) | | 4,142 | 78,284 |
| Class B (p) | | 887 | 15,611 |
| Crestwood Equity Partners LP | | 7,975 | 253,206 |
| Frontera Energy Corp. (p) | | 23,050 | 335,410 |
| Frontera Energy Corp. (p) | | 102 | 1,484 |
| Goodrich Petroleum Corp. (p) | | 4,211 | 52,090 |
| Harvest Oil & Gas Corp. (i)(p) | | 13,350 | 293,700 |
| Parsley Energy, Inc. Class A (p) | | 23,000 | 696,440 |
| VNR Finance Corp. | | 4,091 | 20,987 |
| VNR Finance Corp. (c) | | 19,701 | 101,066 |
| | | | 1,848,278 |
|
| TOTAL ENERGY | | | 2,512,696 |
|
| FINANCIALS - 0.3% | | | |
| Banks - 0.1% | | | |
| Bank of America Corp. | | 36,200 | 1,020,478 |
| JPMorgan Chase & Co. | | 10,000 | 1,042,000 |
| | | | 2,062,478 |
| Capital Markets - 0.0% | | | |
| Penson Worldwide, Inc. Class A (i)(p) | | 314,563 | 3 |
| Consumer Finance - 0.1% | | | |
| OneMain Holdings, Inc. (p) | | 27,700 | 922,133 |
| Diversified Financial Services - 0.1% | | | |
| GDS Holdings Ltd. ADR (p) | | 30,400 | 1,218,736 |
|
| TOTAL FINANCIALS | | | 4,203,350 |
|
| HEALTH CARE - 0.2% | | | |
| Health Care Providers & Services - 0.2% | | | |
| HCA Holdings, Inc. | | 7,600 | 779,760 |
| Humana, Inc. | | 3,200 | 952,416 |
| Rotech Healthcare, Inc. (i)(p) | | 6,069 | 9,710 |
| UnitedHealth Group, Inc. | | 3,100 | 760,554 |
| | | | 2,502,440 |
| Pharmaceuticals - 0.0% | | | |
| Jazz Pharmaceuticals PLC (p) | | 4,700 | 809,810 |
|
| TOTAL HEALTH CARE | | | 3,312,250 |
|
| INDUSTRIALS - 0.4% | | | |
| Airlines - 0.1% | | | |
| Air Canada (p) | | 106,500 | 1,721,466 |
| Commercial Services & Supplies - 0.0% | | | |
| Novus Holdings Ltd. | | 3,285 | 797 |
| Machinery - 0.0% | | | |
| Allison Transmission Holdings, Inc. | | 12,900 | 522,321 |
| Marine - 0.0% | | | |
| U.S. Shipping Partners Corp. (i)(p) | | 644 | 0 |
| U.S. Shipping Partners Corp. warrants 12/31/29 (i)(p) | | 6,028 | 0 |
| | | | 0 |
| Trading Companies & Distributors - 0.3% | | | |
| HD Supply Holdings, Inc. (p) | | 37,300 | 1,599,797 |
| Penhall Acquisition Co.: | | | |
| Class A (i)(p) | | 321 | 25,112 |
| Class B (i)(p) | | 107 | 8,371 |
| United Rentals, Inc. (p) | | 14,763 | 2,179,314 |
| | | | 3,812,594 |
| Transportation Infrastructure - 0.0% | | | |
| Tricer Holdco SCA: | | | |
| Class A1 (i) | | 16,755 | 10,891 |
| Class A2 (i) | | 16,755 | 10,891 |
| Class A3 (i) | | 16,755 | 10,891 |
| Class A4 (i) | | 16,755 | 10,891 |
| Class A5 (i) | | 16,755 | 10,891 |
| Class A6 (i) | | 16,755 | 10,891 |
| Class A7 (i) | | 16,755 | 10,891 |
| Class A8 (i) | | 16,755 | 10,891 |
| Class A9 (i) | | 16,755 | 10,891 |
| | | | 98,019 |
|
| TOTAL INDUSTRIALS | | | 6,155,197 |
|
| INFORMATION TECHNOLOGY - 2.2% | | | |
| Electronic Equipment & Components - 0.1% | | | |
| CDW Corp. | | 8,600 | 694,794 |
| Internet Software & Services - 0.6% | | | |
| Alibaba Group Holding Ltd. sponsored ADR (p) | | 22,300 | 4,137,319 |
| Alphabet, Inc. Class A (p) | | 2,600 | 2,935,894 |
| Facebook, Inc. Class A (p) | | 7,700 | 1,496,264 |
| | | | 8,569,477 |
| IT Services - 0.5% | | | |
| EPAM Systems, Inc. (p) | | 8,700 | 1,081,671 |
| Global Payments, Inc. | | 14,600 | 1,627,754 |
| MasterCard, Inc. Class A | | 8,900 | 1,749,028 |
| PayPal Holdings, Inc. (p) | | 19,200 | 1,598,784 |
| Visa, Inc. Class A | | 13,700 | 1,814,565 |
| | | | 7,871,802 |
| Semiconductors & Semiconductor Equipment - 0.5% | | | |
| Broadcom, Inc. | | 7,300 | 1,771,272 |
| Cypress Semiconductor Corp. | | 309 | 4,814 |
| MagnaChip Semiconductor Corp. (p) | | 2,669 | 27,357 |
| Marvell Technology Group Ltd. | | 28,500 | 611,040 |
| Microchip Technology, Inc. | | 11,900 | 1,082,305 |
| Micron Technology, Inc. (p) | | 25,000 | 1,311,000 |
| NVIDIA Corp. | | 7,600 | 1,800,440 |
| ON Semiconductor Corp. (p) | | 65,900 | 1,465,287 |
| | | | 8,073,515 |
| Software - 0.4% | | | |
| Adobe Systems, Inc. (p) | | 7,700 | 1,877,337 |
| Electronic Arts, Inc. (p) | | 7,200 | 1,015,344 |
| Microsoft Corp. | | 9,700 | 956,517 |
| Salesforce.com, Inc.(p) | | 6,200 | 845,680 |
| SS&C Technologies Holdings, Inc. | | 18,300 | 949,770 |
| Take-Two Interactive Software, Inc. (p) | | 6,600 | 781,176 |
| | | | 6,425,824 |
| Technology Hardware, Storage & Peripherals - 0.1% | | | |
| Apple, Inc. | | 4,300 | 795,973 |
|
| TOTAL INFORMATION TECHNOLOGY | | | 32,431,385 |
|
| MATERIALS - 0.5% | | | |
| Chemicals - 0.3% | | | |
| DowDuPont, Inc. | | 11,000 | 725,120 |
| Ingevity Corp. (p) | | 6 | 485 |
| LyondellBasell Industries NV Class A | | 16,600 | 1,823,510 |
| The Chemours Co. LLC | | 30,200 | 1,339,672 |
| Westlake Chemical Corp. | | 1,500 | 161,445 |
| | | | 4,050,232 |
| Containers & Packaging - 0.1% | | | |
| Crown Holdings, Inc. (p) | | 14,300 | 640,068 |
| WestRock Co. | | 12,005 | 687,034 |
| | | | 1,327,102 |
| Metals & Mining - 0.1% | | | |
| Aleris Corp. (i)(p) | | 2,037 | 7,644 |
| First Quantum Minerals Ltd. | | 65,200 | 960,654 |
| Freeport-McMoRan, Inc. | | 50,800 | 876,808 |
| | | | 1,845,106 |
|
| TOTAL MATERIALS | | | 7,222,440 |
|
| TELECOMMUNICATION SERVICES - 0.1% | | | |
| Wireless Telecommunication Services - 0.1% | | | |
| T-Mobile U.S., Inc. (p) | | 34,700 | 2,073,325 |
| UTILITIES - 0.0% | | | |
| Electric Utilities - 0.0% | | | |
| Portland General Electric Co. | | 140 | 5,986 |
| Vistra Energy Corp. (p) | | 34,600 | 818,636 |
| | | | 824,622 |
| TOTAL COMMON STOCKS | | | |
| (Cost $63,865,283) | | | 78,748,230 |
|
| Preferred Stocks - 0.0% | | | |
| Convertible Preferred Stocks - 0.0% | | | |
| CONSUMER STAPLES - 0.0% | | | |
| Food Products - 0.0% | | | |
| Reddy Ice Holdings, Inc. 7.00% pay-in-kind (i)(p) | | 2,286 | 16,665 |
| Nonconvertible Preferred Stocks - 0.0% | | | |
| INDUSTRIALS - 0.0% | | | |
| Transportation Infrastructure - 0.0% | | | |
| Tricer Holdco SCA (i)(p)(q) | | 8,042,141 | 80,421 |
| TOTAL PREFERRED STOCKS | | | |
| (Cost $303,071) | | | 97,086 |
| | | Principal Amount(a) | Value |
|
| Bank Loan Obligations - 1.9% | | | |
| CONSUMER DISCRETIONARY - 0.2% | | | |
| Diversified Consumer Services - 0.0% | | | |
| KUEHG Corp. Tranche B 2LN, term loan 3 month U.S. LIBOR + 8.250% 10.552% 8/22/25 (b)(f) | | 305,000 | 308,050 |
| Hotels, Restaurants & Leisure - 0.2% | | | |
| Stars Group Holdings BV Tranche B, term loan 3 month U.S. LIBOR + 3.500% 7/29/25 (f)(s) | | 2,855,000 | 2,856,799 |
|
| TOTAL CONSUMER DISCRETIONARY | | | 3,164,849 |
|
| CONSUMER STAPLES - 0.1% | | | |
| Personal Products - 0.1% | | | |
| Revlon Consumer Products Corp. Tranche B, term loan 3 month U.S. LIBOR + 3.500% 5.4756% 9/7/23 (b)(f) | | 926,205 | 713,178 |
| ENERGY - 0.7% | | | |
| Energy Equipment & Services - 0.0% | | | |
| Brazos Delaware II LLC Tranche B, term loan 3 month U.S. LIBOR + 4.000% 6.0879% 5/21/25 (b)(f) | | 250,000 | 250,000 |
| Forbes Energy Services LLC Tranche B, term loan 14% 4/13/21 (b)(i) | | 66,914 | 67,416 |
| | | | 317,416 |
| Oil, Gas & Consumable Fuels - 0.7% | | | |
| Bcp Raptor LLC Tranche B, term loan 3 month U.S. LIBOR + 4.250% 6.4211% 6/22/24 (b)(f) | | 455,400 | 444,584 |
| California Resources Corp.: | | | |
| Tranche 1LN, term loan 3 month U.S. LIBOR + 10.375% 12.4661% 12/31/21 (b)(f) | | 5,345,000 | 5,906,225 |
| Tranche B, term loan 3 month U.S. LIBOR + 4.750% 6.8379% 12/31/22 (b)(f) | | 2,090,000 | 2,125,279 |
| Chesapeake Energy Corp. Tranche 1LN, term loan 3 month U.S. LIBOR + 7.500% 9.5935% 8/23/21 (b)(f) | | 2,030,000 | 2,121,776 |
| | | | 10,597,864 |
|
| TOTAL ENERGY | | | 10,915,280 |
|
| FINANCIALS - 0.0% | | | |
| Diversified Financial Services - 0.0% | | | |
| Bcp Renaissance Parent LLC Tranche B, term loan 3 month U.S. LIBOR + 3.500% 5.8629% 10/31/24 (b)(f) | | 150,000 | 149,601 |
| Insurance - 0.0% | | | |
| HUB International Ltd. Tranche B, term loan 3 month U.S. LIBOR + 2.750% 5.3595% 4/25/25 (b)(f) | | 275,000 | 273,180 |
|
| TOTAL FINANCIALS | | | 422,781 |
|
| HEALTH CARE - 0.0% | | | |
| Pharmaceuticals - 0.0% | | | |
| Valeant Pharmaceuticals International, Inc. Tranche B, term loan 3 month U.S. LIBOR + 3.000% 4.9825% 6/1/25 (b)(f) | | 120,000 | 119,513 |
| INDUSTRIALS - 0.0% | | | |
| Commercial Services & Supplies - 0.0% | | | |
| Harland Clarke Holdings Corp. Tranche B 7LN, term loan 3 month U.S. LIBOR + 4.750% 7.0844% 11/3/23 (b)(f) | | 182,952 | 177,769 |
| Construction & Engineering - 0.0% | | | |
| Traverse Midstream Partners Ll Tranche B, term loan 3 month U.S. LIBOR + 4.000% 6.34% 9/27/24 (b)(f) | | 155,000 | 154,806 |
|
| TOTAL INDUSTRIALS | | | 332,575 |
|
| INFORMATION TECHNOLOGY - 0.7% | | | |
| Internet Software & Services - 0.2% | | | |
| McAfee LLC Tranche B, term loan: | | | |
| 3 month U.S. LIBOR + 4.500% 6.5935% 9/29/24 (b)(f) | | 243,163 | 244,162 |
| 3 month U.S. LIBOR + 8.500% 10.5935% 9/29/25 (b)(f) | | 1,445,000 | 1,465,230 |
| Uber Technologies, Inc. Tranche B, term loan 3 month U.S. LIBOR + 4.000% 6.0007% 4/4/25 (b)(f) | | 675,000 | 676,404 |
| | | | 2,385,796 |
| IT Services - 0.1% | | | |
| Banff Merger Sub, Inc. Tranche B, term loan 3 month U.S. LIBOR + 4.250% 6/28/25 (f)(s) | | 1,810,000 | 1,798,688 |
| Semiconductors & Semiconductor Equipment - 0.1% | | | |
| Microchip Technology, Inc. Tranche B, term loan 3 month U.S. LIBOR + 2.000% 4.1% 5/29/25 (b)(f) | | 1,485,000 | 1,481,911 |
| Software - 0.3% | | | |
| Almonde, Inc.: | | | |
| Tranche 2LN, term loan 3 month U.S. LIBOR + 7.250% 9.5572% 6/13/25 (b)(f) | | 1,264,344 | 1,215,742 |
| Tranche B 1LN, term loan 3 month U.S. LIBOR + 3.500% 5.8072% 6/13/24 (b)(f) | | 287,825 | 282,469 |
| Digicert Holdings, Inc. Tranche B, term loan: | | | |
| 3 month U.S. LIBOR + 4.750% 6.8435% 10/31/24 (b)(f) | | 199,500 | 199,209 |
| 3 month U.S. LIBOR + 8.000% 10.0935% 10/31/25 (b)(f) | | 250,000 | 243,750 |
| Kronos, Inc. 2LN, term loan 3 month U.S. LIBOR + 8.250% 10.6081% 11/1/24 (b)(f) | | 1,090,000 | 1,119,975 |
| Landesk Group, Inc. term loan: | | | |
| 3 month U.S. LIBOR + 4.250% 6.35% 1/20/24 (b)(f) | | 167,992 | 166,208 |
| 3 month U.S. LIBOR + 9.000% 11.1% 1/20/25 (b)(f) | | 535,000 | 505,131 |
| Vertafore, Inc. Tranche B 1LN, term loan 3 month U.S. LIBOR + 3.250% 7/2/25 (f)(s) | | 1,130,000 | 1,122,237 |
| | | | 4,854,721 |
|
| TOTAL INFORMATION TECHNOLOGY | | | 10,521,116 |
|
| MATERIALS - 0.2% | | | |
| Containers & Packaging - 0.1% | | | |
| Flex Acquisition Co., Inc. Tranche B 1LN, term loan 3 month U.S. LIBOR + 3.250% 5.7506% 6/22/25 (b)(f) | | 860,000 | 857,489 |
| Metals & Mining - 0.1% | | | |
| Essar Steel Algoma, Inc. Tranche B, term loan 3 month U.S. LIBOR + 6.500% 0% 8/16/19 (e)(f) | | 267,300 | 358,182 |
| Murray Energy Corp. Tranche B 2LN, term loan 3 month U.S. LIBOR + 7.250% 9.3268% 10/17/22(b)(f) | | 1,232,825 | 1,155,774 |
| | | | 1,513,956 |
|
| TOTAL MATERIALS | | | 2,371,445 |
|
| TOTAL BANK LOAN OBLIGATIONS | | | |
| (Cost $28,132,457) | | | 28,560,737 |
| | | Shares | Value |
|
| Fixed-Income Funds - 10.0% | | | |
| Fidelity Floating Rate Central Fund (t) | | 1,352,271 | 138,972,891 |
| iShares JPMorgan USD Emerging Markets Bond ETF | | 102,800 | 10,975,956 |
| TOTAL FIXED-INCOME FUNDS | | | |
| (Cost $151,822,648) | | | 149,948,847 |
| | | Principal Amount(a) | Value |
|
| Preferred Securities - 4.2% | | | |
| CONSUMER DISCRETIONARY - 0.2% | | | |
| Automobiles - 0.2% | | | |
| Volkswagen International Finance NV 4.625% (Reg. S) (b)(g) | EUR | 1,900,000 | 2,204,545 |
| CONSUMER STAPLES - 0.1% | | | |
| Food Products - 0.1% | | | |
| Cosan Overseas Ltd. 8.25% (g) | | 1,585,000 | 1,601,291 |
| ENERGY - 0.5% | | | |
| Oil, Gas & Consumable Fuels - 0.5% | | | |
| Andeavor Logistics LP 6.875% (b)(g) | | 1,550,000 | 1,573,264 |
| DCP Midstream Partners LP 7.375% (b)(g) | | 775,000 | 744,561 |
| Energy Transfer Partners LP: | | | |
| 6.25% (b)(g) | | 3,335,000 | 3,166,911 |
| 6.625% (b)(g) | | 1,370,000 | 1,284,224 |
| Summit Midstream Partners LP 9.5% (b)(g) | | 775,000 | 762,719 |
| | | | 7,531,679 |
| FINANCIALS - 3.1% | | | |
| Banks - 2.8% | | | |
| Alfa Bond Issuance PLC 8% (Reg. S) (b)(g) | | 675,000 | 670,992 |
| Banco Do Brasil SA 9% (b)(c)(g) | | 1,560,000 | 1,506,019 |
| Banco Mercantil del Norte SA 7.625% (b)(c)(g) | | 675,000 | 678,723 |
| Bank of America Corp.: | | | |
| 5.125% (b)(g) | | 1,345,000 | 1,357,724 |
| 5.2% (b)(g) | | 3,067,000 | 3,037,901 |
| 5.875% (b)(g) | | 3,940,000 | 3,919,283 |
| 6.25% (b)(g) | | 1,410,000 | 1,501,707 |
| Barclays Bank PLC 7.625% 11/21/22 | | 895,000 | 971,071 |
| Citigroup, Inc.: | | | |
| 5.8% (b)(g) | | 1,130,000 | 1,163,095 |
| 5.9% (b)(g) | | 1,455,000 | 1,512,714 |
| 5.95% (b)(g) | | 2,675,000 | 2,788,643 |
| 6.25% (b)(g) | | 920,000 | 976,102 |
| 6.3% (b)(g) | | 270,000 | 276,198 |
| Huntington Bancshares, Inc. 5.7% (b)(f)(g) | | 615,000 | 618,531 |
| Itau Unibanco Holding SA 6.125% (b)(c)(g) | | 865,000 | 811,331 |
| JPMorgan Chase & Co.: | | | |
| 5% (b)(g) | | 1,615,000 | 1,663,450 |
| 5.3% (b)(g) | | 865,000 | 888,602 |
| 6% (b)(g) | | 6,524,000 | 6,824,834 |
| 6.125% (b)(g) | | 850,000 | 882,194 |
| 6.75% (b)(g) | | 400,000 | 446,188 |
| Royal Bank of Scotland Group PLC 8.625% (b)(g) | | 2,190,000 | 2,327,936 |
| Tinkoff Credit Systems 9.25% (Reg. S) (b)(g) | | 405,000 | 416,349 |
| Wells Fargo & Co.: | | | |
| 5.875% (b)(g) | | 2,600,000 | 2,687,928 |
| 5.9% (b)(g) | | 3,065,000 | 3,083,020 |
| | | | 41,010,535 |
| Capital Markets - 0.3% | | | |
| Goldman Sachs Group, Inc.: | | | |
| 5% (b)(g) | | 1,545,000 | 1,460,280 |
| 5.375% (b)(g) | | 1,665,000 | 1,702,621 |
| 5.7% (b)(g) | | 1,701,000 | 1,738,514 |
| | | | 4,901,415 |
| Diversified Financial Services - 0.0% | | | |
| Magnesita Finance Ltd. 8.625% (c)(g) | | 396,000 | 402,184 |
|
| TOTAL FINANCIALS | | | 46,314,134 |
|
| INDUSTRIALS - 0.1% | | | |
| Construction & Engineering - 0.1% | | | |
| Odebrecht Finance Ltd.: | | | |
| 7.5% (c)(g) | | 1,910,000 | 715,226 |
| 7.5% (Reg. S) (g) | | 100,000 | 37,447 |
| | | | 752,673 |
| REAL ESTATE - 0.2% | | | |
| Equity Real Estate Investment Trusts (REITs) - 0.2% | | | |
| Unibail-Rodamco 2.125% (Reg. S) (b)(g) | EUR | 3,000,000 | 3,438,202 |
| TELECOMMUNICATION SERVICES - 0.0% | | | |
| Diversified Telecommunication Services - 0.0% | | | |
| Colombia Telecomunicaciones SA 8.5% (b)(c)(g) | | 440,000 | 468,152 |
| TOTAL PREFERRED SECURITIES | | | |
| (Cost $63,078,590) | | | 62,310,676 |
| | | Shares | Value |
|
| Money Market Funds - 6.6% | | | |
| Fidelity Cash Central Fund, 1.93% (u) | | 98,590,594 | 98,610,312 |
| Fidelity Securities Lending Cash Central Fund 1.92% (u)(v) | | 630,252 | 630,378 |
| TOTAL MONEY MARKET FUNDS | | | |
| (Cost $99,233,594) | | | 99,240,690 |
| Purchased Swaptions - 0.1% | | | | |
| | | Expiration Date | Notional Amount | Value |
| Put Options - 0.1% | | | | |
| Option on an interest rate swap with Goldman Sachs Bank U.S.A. to pay semi-annually a fixed rate of 2.495% and receive quarterly a floating rate based on 3-month LIBOR, expiring October 2027 | | 10/5/20 | 3,300,000 | $143,941 |
| Option on an interest rate swap with Goldman Sachs Bank U.S.A. to pay semi-annually a fixed rate of 2.7875% and receive quarterly a floating rate based on 3-month LIBOR, expiring January 2028 | | 1/25/21 | 4,800,000 | 165,882 |
| Option on an interest rate swap with JPMorgan Chase Bank NA to pay semi-annually a fixed rate of 2.5340% and receive quarterly a floating rate based on 3-month LIBOR, expiring December 2027 | | 12/8/20 | 11,700,000 | 502,534 |
| Option on an interest rate swap with JPMorgan Chase Bank NA to pay semi-annually a fixed rate of 2.5575% and receive quarterly a floating rate based on 3-month LIBOR, expiring October 2027 | | 10/6/20 | 1,100,000 | 45,264 |
| Option on an interest rate swap with JPMorgan Chase Bank NA to pay semi-annually a fixed rate of 3.0580% and receive quarterly a floating rate based on 3-month LIBOR, expiring April 2028 | | 4/20/21 | 2,200,000 | 61,904 |
|
| TOTAL PUT OPTIONS | | | | 919,525 |
|
| Call Options - 0.0% | | | | |
| Option on an interest rate swap with Goldman Sachs Bank U.S.A. to receive semi-annually a fixed rate of 2.495% and pay quarterly a floating rate based on 3-month LIBOR, expiring October 2027 | | 10/5/20 | 3,300,000 | 52,448 |
| Option on an interest rate swap with Goldman Sachs Bank U.S.A. to receive semi-annually a fixed rate of 2.7875% and pay quarterly a floating rate based on 3-month LIBOR, expiring January 2028 | | 1/25/21 | 4,800,000 | 116,641 |
| Option on an interest rate swap with JPMorgan Chase Bank NA to receive semi-annually a fixed rate of 2.5340% and pay quarterly a floating rate based on 3-month LIBOR, expiring December 2027 | | 12/8/20 | 11,700,000 | 205,494 |
| Option on an interest rate swap with JPMorgan Chase Bank NA to receive semi-annually a fixed rate of 2.5575% and pay quarterly a floating rate based on 3-month LIBOR, expiring October 2027 | | 10/6/20 | 1,100,000 | 18,903 |
| Option on an interest rate swap with JPMorgan Chase Bank NA to receive semi-annually a fixed rate of 3.058% and pay quarterly a floating rate based on 3-month LIBOR, expiring April 2028 | | 4/20/21 | 2,200,000 | 74,200 |
|
| TOTAL CALL OPTIONS | | | | 467,686 |
|
| TOTAL PURCHASED SWAPTIONS | | | | |
| (Cost $1,429,386) | | | | 1,387,211 |
| TOTAL INVESTMENT IN SECURITIES - 102.6% | | | | |
| (Cost $1,539,593,643) | | | | 1,541,919,463 |
| NET OTHER ASSETS (LIABILITIES) - (2.6)% | | | | (38,829,528) |
| NET ASSETS - 100% | | | | $1,503,089,935 |
| TBA Sale Commitments | | |
| | Principal Amount | Value |
| Fannie Mae | | |
| 4.5% 7/1/48 | $(7,100,000) | $(7,392,431) |
| Ginnie Mae | | |
| 4.5% 7/1/48 | (7,100,000) | (7,378,756) |
| 4.5% 7/1/48 | (4,900,000) | (5,092,381) |
| 4.5% 7/1/48 | (4,900,000) | (5,092,381) |
| 4.5% 7/1/48 | (300,000) | (311,778) |
|
| TOTAL GINNIE MAE | | (17,875,296) |
|
| TOTAL TBA SALE COMMITMENTS | | |
| (Proceeds $25,257,006) | | $(25,267,727) |
| Futures Contracts | | | | | |
| | Number of contracts | Expiration Date | Notional Amount | Value | Unrealized Appreciation/(Depreciation) |
| Purchased | | | | | |
| Treasury Contracts | | | | | |
| CBOT 10-Year U.S. Treasury Note Contracts (United States) | 18 | Sept. 2018 | $2,163,375 | $18,243 | $18,243 |
| CBOT 2-Year U.S. Treasury Note Contracts (United States) | 31 | Sept. 2018 | 6,566,672 | (24,280) | (24,280) |
| CBOT 5-Year U.S. Treasury Note Contracts (United States) | 125 | Sept. 2018 | 14,202,148 | 47,344 | 47,344 |
| CBOT Ultra Long Term U.S. Treasury Bond Contracts (United States) | 18 | Sept. 2018 | 2,872,125 | 110,213 | 110,213 |
|
| TOTAL PURCHASED | | | | | 151,520 |
|
| Sold | | | | | |
| Treasury Contracts | | | | | |
| CBOT Ultra 10-Year U.S. Treasury Note Contracts (United States) | 2 | Sept. 2018 | 256,469 | 215 | 215 |
| TOTAL FUTURES CONTRACTS | | | | | $151,735 |
The notional amount of futures purchased as a percentage of Net Assets is 1.7%
The notional amount of futures sold as a percentage of Net Assets is 0.0%
Swaps
| Payment Received | Payment Frequency | Payment Paid | Payment Frequency | Clearinghouse / Counterparty(1) | Maturity Date | Notional Amount | Value | Upfront Premium Received/(Paid)(2) | Unrealized Appreciation/(Depreciation) |
| Interest Rate Swaps | | | | | | | | | |
| 2.25% | Semi - annual | 3-month LIBOR(3) | Quarterly | LCH | Sep. 2025 | $2,905,000 | $16,642 | $0 | $16,642 |
(1) Swaps with LCH Clearnet Group (LCH) are centrally cleared over-the-counter (OTC) swaps.
(2) Any premiums for centrally cleared over-the-counter (OTC) swaps are recorded periodically throughout the term of the swap to variation margin and included in unrealized appreciation (depreciation).
(3) Represents floating rate.
Currency Abbreviations
ARS – Argentine peso
AUD – Australian dollar
BRL – Brazilian real
CAD – Canadian dollar
CHF – Swiss franc
DKK – Danish krone
EUR – European Monetary Unit
GBP – British pound
HKD – Hong Kong dollar
IDR – Indonesian rupiah
INR – Indian rupee
JPY – Japanese yen
MXN – Mexican peso
NOK – Norwegian krone
NZD – New Zealand dollar
PEN – Peruvian new sol
SEK – Swedish krona
SGD – Singapore dollar
ZAR – South African rand
Security Type Abbreviations
ETF – Exchange-Traded Fund
Percentages shown as 0.0% in the Schedule of Investments may reflect amounts less than 0.05%.
Legend
(a) Amount is stated in United States dollars unless otherwise noted.
(b) Coupon rates for floating and adjustable rate securities reflect the rates in effect at period end.
(c) Security exempt from registration under Rule 144A of the Securities Act of 1933. These securities may be resold in transactions exempt from registration, normally to qualified institutional buyers. At the end of the period, the value of these securities amounted to $322,131,336 or 21.4% of net assets.
(d) Security or a portion of the security purchased on a delayed delivery or when-issued basis.
(e) Non-income producing - Security is in default.
(f) Coupon is indexed to a floating interest rate which may be multiplied by a specified factor and/or subject to caps or floors.
(g) Security is perpetual in nature with no stated maturity date.
(h) Security initially issued at one coupon which converts to a higher coupon at a specified date. The rate shown is the rate at period end.
(i) Level 3 security
(j) Security or a portion of the security was pledged to cover margin requirements for futures contracts. At period end, the value of securities pledged amounted to $194,469.
(k) Security or a portion of the security was pledged to cover margin requirements for centrally cleared OTC swaps. At period end, the value of securities pledged amounted to $102,228.
(l) Represents an investment in an underlying pool of reverse mortgages which typically do not require regular principal and interest payments as repayment is deferred until a maturity event.
(m) Security represents right to receive monthly interest payments on an underlying pool of mortgages or assets. Principal shown is the outstanding par amount of the pool as of the end of the period.
(n) Coupon is inversely indexed to a floating interest rate multiplied by a specified factor. The price may be considerably more volatile than the price of a comparable fixed rate security.
(o) Quantity represents share amount.
(p) Non-income producing
(q) Restricted securities - Investment in securities not registered under the Securities Act of 1933 (excluding 144A issues). At the end of the period, the value of restricted securities (excluding 144A issues) amounted to $80,460 or 0.0% of net assets.
(r) Security or a portion of the security is on loan at period end.
(s) The coupon rate will be determined upon settlement of the loan after period end.
(t) Affiliated fund that is generally available only to investment companies and other accounts managed by Fidelity Investments. A complete unaudited schedule of portfolio holdings for each Fidelity Central Fund is filed with the SEC for the first and third quarters of each fiscal year on Form N-Q and is available upon request or at the SEC's website at www.sec.gov. An unaudited holdings listing for the Fund, which presents direct holdings as well as the pro-rata share of securities and other investments held indirectly through its investment in underlying non-money market Fidelity Central Funds, is available at fidelity.com and/or institutional.fidelity.com, as applicable. In addition, each Fidelity Central Fund's financial statements are available on the SEC's website or upon request.
(u) Affiliated fund that is generally available only to investment companies and other accounts managed by Fidelity Investments. The rate quoted is the annualized seven-day yield of the fund at period end. A complete unaudited listing of the fund's holdings as of its most recent quarter end is available upon request. In addition, each Fidelity Central Fund's financial statements are available on the SEC's website or upon request.
(v) Investment made with cash collateral received from securities on loan.
Additional information on each restricted holding is as follows:
| Security | Acquisition Date | Acquisition Cost |
| Houghton Mifflin Harcourt Co. warrants 6/22/19 | 6/22/12 | $4,281 |
| Tricer Holdco SCA | 12/19/16 - 1/29/18 | $286,754 |
Affiliated Central Funds
Information regarding fiscal year to date income earned by the Fund from investments in Fidelity Central Funds is as follows:
| Fund | Income earned |
| Fidelity Cash Central Fund | $927,334 |
| Fidelity Floating Rate Central Fund | 3,343,106 |
| Fidelity Securities Lending Cash Central Fund | 711 |
| Total | $4,271,151 |
Amounts in the income column in the above table include any capital gain distributions from underlying funds, which are presented in the corresponding line-item in the Statement of Operations if applicable.
Fiscal year to date information regarding the Fund’s investments in non-Money Market Central Funds, including the ownership percentage, is presented below.
| Fund | Value, beginning of period | Purchases | Sales Proceeds | Realized Gain/Loss | Change in Unrealized appreciation (depreciation) | Value, end of period | % ownership, end of period |
| Fidelity Floating Rate Central Fund | $107,568,078 | $34,012,079 | $2,198,266 | $(14,662) | $(394,338) | $138,972,891 | 6.1% |
| Total | $107,568,078 | $34,012,079 | $2,198,266 | $(14,662) | $(394,338) | $138,972,891 | |
Investment Valuation
The following is a summary of the inputs used, as of June 30, 2018, involving the Fund's assets and liabilities carried at fair value. The inputs or methodology used for valuing securities may not be an indication of the risk associated with investing in those securities. For more information on valuation inputs, and their aggregation into the levels used below, please refer to the Investment Valuation section in the accompanying Notes to Financial Statements.
| | Valuation Inputs at Reporting Date: |
| Description | Total | Level 1 | Level 2 | Level 3 |
| Investments in Securities: | | | | |
| Equities: | | | | |
| Consumer Discretionary | $17,406,777 | $16,521,240 | $39 | $885,498 |
| Consumer Staples | 2,622,853 | 2,099,774 | -- | 523,079 |
| Energy | 2,512,696 | 2,218,996 | -- | 293,700 |
| Financials | 4,203,350 | 4,203,347 | -- | 3 |
| Health Care | 3,312,250 | 3,302,540 | -- | 9,710 |
| Industrials | 6,235,618 | 6,023,695 | -- | 211,923 |
| Information Technology | 32,431,385 | 32,431,385 | -- | -- |
| Materials | 7,222,440 | 7,214,796 | -- | 7,644 |
| Telecommunication Services | 2,073,325 | 2,073,325 | -- | -- |
| Utilities | 824,622 | 824,622 | -- | -- |
| Corporate Bonds | 555,068,011 | -- | 555,066,252 | 1,759 |
| U.S. Government and Government Agency Obligations | 248,232,820 | -- | 248,232,820 | -- |
| U.S. Government Agency - Mortgage Securities | 46,974,048 | -- | 46,974,048 | -- |
| Asset-Backed Securities | 13,712,045 | -- | 13,712,045 | -- |
| Collateralized Mortgage Obligations | 37,955,705 | -- | 37,955,705 | -- |
| Commercial Mortgage Securities | 35,732,851 | -- | 35,732,851 | -- |
| Foreign Government and Government Agency Obligations | 183,481,536 | -- | 182,855,463 | 626,073 |
| Supranational Obligations | 468,970 | -- | 468,970 | -- |
| Bank Loan Obligations | 28,560,737 | -- | 28,493,321 | 67,416 |
| Fixed-Income Funds | 149,948,847 | 149,948,847 | -- | -- |
| Preferred Securities | 62,310,676 | -- | 62,310,676 | -- |
| Money Market Funds | 99,240,690 | 99,240,690 | -- | -- |
| Purchased Swaptions | 1,387,211 | -- | 1,387,211 | -- |
| Total Investments in Securities: | $1,541,919,463 | $326,103,257 | $1,213,189,401 | $2,626,805 |
| Derivative Instruments: | | | | |
| Assets | | | | |
| Futures Contracts | $176,015 | $176,015 | $-- | $-- |
| Swaps | 16,642 | -- | 16,642 | -- |
| Total Assets | $192,657 | $176,015 | $16,642 | $-- |
| Liabilities | | | | |
| Futures Contracts | $(24,280) | $(24,280) | $-- | $-- |
| Total Liabilities | $(24,280) | $(24,280) | $-- | $-- |
| Total Derivative Instruments: | $168,377 | $151,735 | $16,642 | $-- |
| Other Financial Instruments: | | | | |
| TBA Sale Commitments | $(25,267,727) | $-- | $(25,267,727) | $-- |
| Total Other Financial Instruments: | $(25,267,727) | $-- | $(25,267,727) | $-- |
Value of Derivative Instruments
The following table is a summary of the Fund's value of derivative instruments by primary risk exposure as of June 30, 2018. For additional information on derivative instruments, please refer to the Derivative Instruments section in the accompanying Notes to Financial Statements.
| Primary Risk Exposure / Derivative Type | Value |
| | Asset | Liability |
| Interest Rate Risk | | |
| Futures Contracts(a) | $176,015 | $(24,280) |
| Purchased Swaptions(b) | 1,387,211 | 0 |
| Swaps(c) | 16,642 | 0 |
| Total Value of Derivatives | $1,579,868 | $(24,280) |
(a) Reflects gross cumulative appreciation (depreciation) on futures contracts as presented in the Schedule of Investments. In the Statement of Assets and Liabilities, the period end daily variation margin is included in receivable or payable for daily variation margin on futures contracts, and the net cumulative appreciation (depreciation) is included in net unrealized appreciation (depreciation).
(b) Gross value is included in the Statement of Assets and Liabilities in the investments, at value line-item.
(c) For centrally cleared over-the-counter (OTC) swaps, reflects gross cumulative appreciation (depreciation) as presented in the Schedule of Investments. In the Statement of Assets and Liabilities, the period end daily variation margin for centrally cleared OTC swaps is included in receivable or payable for daily variation margin on centrally cleared OTC swaps, and the net cumulative appreciation (depreciation) for centrally cleared OTC swaps is included in net unrealized appreciation (depreciation).
Other Information
Distribution of investments by country or territory of incorporation, as a percentage of Total Net Assets, is as follows (Unaudited):
| United States of America | 69.1% |
| United Kingdom | 3.7% |
| Canada | 2.8% |
| Netherlands | 2.3% |
| Japan | 2.1% |
| Cayman Islands | 2.0% |
| Argentina | 2.0% |
| Luxembourg | 1.8% |
| Italy | 1.3% |
| France | 1.2% |
| Others (Individually Less Than 1%) | 11.7% |
| | 100.0% |
See accompanying notes which are an integral part of the financial statements.
Financial Statements
Statement of Assets and Liabilities
| | | June 30, 2018 (Unaudited) |
| Assets | | |
Investment in securities, at value (including securities loaned of $592,529) — See accompanying schedule:
Unaffiliated issuers (cost $1,299,610,489) | $1,303,705,881 | |
| Fidelity Central Funds (cost $239,983,154) | 238,213,582 | |
| Total Investment in Securities (cost $1,539,593,643) | | $1,541,919,463 |
| Cash | | 740,165 |
| Foreign currency held at value (cost $1,471) | | 1,471 |
| Receivable for investments sold | | |
| Regular delivery | | 2,368,839 |
| Delayed delivery | | 18,095 |
| Receivable for TBA sale commitments | | 25,257,006 |
| Receivable for fund shares sold | | 340,505 |
| Dividends receivable | | 109,675 |
| Interest receivable | | 13,461,269 |
| Distributions receivable from Fidelity Central Funds | | 783,841 |
| Other receivables | | 32,946 |
| Total assets | | 1,585,033,275 |
| Liabilities | | |
| Payable for investments purchased | | |
| Regular delivery | $14,106,523 | |
| Delayed delivery | 39,928,005 | |
| TBA sale commitments, at value | 25,267,727 | |
| Payable for fund shares redeemed | 990,790 | |
| Accrued management fee | 696,234 | |
| Distribution and service plan fees payable | 83,009 | |
| Payable for daily variation margin on futures contracts | 5,023 | |
| Payable for daily variation margin on centrally cleared OTC swaps | 2,537 | |
| Other affiliated payables | 156,363 | |
| Other payables and accrued expenses | 76,779 | |
| Collateral on securities loaned | 630,350 | |
| Total liabilities | | 81,943,340 |
| Net Assets | | $1,503,089,935 |
| Net Assets consist of: | | |
| Paid in capital | | $1,469,008,096 |
| Undistributed net investment income | | 30,993,555 |
| Accumulated undistributed net realized gain (loss) on investments and foreign currency transactions | | 646,243 |
| Net unrealized appreciation (depreciation) on investments and assets and liabilities in foreign currencies | | 2,442,041 |
| Net Assets | | $1,503,089,935 |
| Initial Class: | | |
| Net Asset Value, offering price and redemption price per share ($90,820,765 ÷ 7,971,624 shares) | | $11.39 |
| Service Class: | | |
| Net Asset Value, offering price and redemption price per share ($1,742,633 ÷ 153,430 shares) | | $11.36 |
| Service Class 2: | | |
| Net Asset Value, offering price and redemption price per share ($398,150,825 ÷ 35,307,872 shares) | | $11.28 |
| Investor Class: | | |
| Net Asset Value, offering price and redemption price per share ($1,012,375,712 ÷ 89,169,996 shares) | | $11.35 |
See accompanying notes which are an integral part of the financial statements.
Statement of Operations
| | | Six months ended June 30, 2018 (Unaudited) |
| Investment Income | | |
| Dividends | | $1,801,747 |
| Interest | | 26,351,676 |
| Income from Fidelity Central Funds | | 4,271,151 |
| Total income | | 32,424,574 |
| Expenses | | |
| Management fee | $4,243,974 | |
| Transfer agent fees | 697,536 | |
| Distribution and service plan fees | 480,173 | |
| Accounting and security lending fees | 258,424 | |
| Custodian fees and expenses | 39,387 | |
| Independent trustees' fees and expenses | 3,310 | |
| Registration fees | 182 | |
| Audit | 54,032 | |
| Legal | (109,360) | |
| Miscellaneous | 6,347 | |
| Total expenses before reductions | 5,674,005 | |
| Expense reductions | (14,618) | |
| Total expenses after reductions | | 5,659,387 |
| Net investment income (loss) | | 26,765,187 |
| Realized and Unrealized Gain (Loss) | | |
| Net realized gain (loss) on: | | |
| Investment securities: | | |
| Unaffiliated issuers | 1,840,901 | |
| Fidelity Central Funds | (14,768) | |
| Foreign currency transactions | (163,905) | |
| Futures contracts | (429,248) | |
| Swaps | (96,529) | |
| Written options | 23,589 | |
| Total net realized gain (loss) | | 1,160,040 |
| Change in net unrealized appreciation (depreciation) on: | | |
| Investment securities: | | |
| Unaffiliated issuers | (41,996,680) | |
| Fidelity Central Funds | (394,275) | |
| Assets and liabilities in foreign currencies | (51,397) | |
| Futures contracts | 155,911 | |
| Swaps | 18,851 | |
| Delayed delivery commitments | (10,721) | |
| Total change in net unrealized appreciation (depreciation) | | (42,278,311) |
| Net gain (loss) | | (41,118,271) |
| Net increase (decrease) in net assets resulting from operations | | $(14,353,084) |
See accompanying notes which are an integral part of the financial statements.
Statement of Changes in Net Assets
| | Six months ended June 30, 2018 (Unaudited) | Year ended December 31, 2017 |
| Increase (Decrease) in Net Assets | | |
| Operations | | |
| Net investment income (loss) | $26,765,187 | $48,290,503 |
| Net realized gain (loss) | 1,160,040 | 15,785,344 |
| Change in net unrealized appreciation (depreciation) | (42,278,311) | 40,260,354 |
| Net increase (decrease) in net assets resulting from operations | (14,353,084) | 104,336,201 |
| Distributions to shareholders from net investment income | – | (47,218,735) |
| Distributions to shareholders from net realized gain | (802,719) | (7,817,967) |
| Total distributions | (802,719) | (55,036,702) |
| Share transactions - net increase (decrease) | (27,532,709) | 198,447,298 |
| Total increase (decrease) in net assets | (42,688,512) | 247,746,797 |
| Net Assets | | |
| Beginning of period | 1,545,778,447 | 1,298,031,650 |
| End of period | $1,503,089,935 | $1,545,778,447 |
| Other Information | | |
| Undistributed net investment income end of period | $30,993,555 | $4,228,368 |
See accompanying notes which are an integral part of the financial statements.
Financial Highlights
VIP Strategic Income Portfolio Initial Class
| | Six months ended (Unaudited) June 30, | Years endedDecember 31, | | | | |
| | 2018 | 2017 | 2016 | 2015 | 2014 | 2013 |
| Selected Per–Share Data | | | | | | |
| Net asset value, beginning of period | $11.50 | $11.07 | $10.60 | $11.12 | $11.20 | $11.76 |
| Income from Investment Operations | | | | | | |
| Net investment income (loss)A | .206 | .399 | .429 | .413 | .413 | .437 |
| Net realized and unrealized gain (loss) | (.310) | .462 | .446 | (.593) | (.010) | (.403) |
| Total from investment operations | (.104) | .861 | .875 | (.180) | .403 | .034 |
| Distributions from net investment income | – | (.371) | (.405) | (.306) | (.350) | (.483) |
| Distributions from net realized gain | (.006) | (.060) | – | – | (.133) | (.111) |
| Tax return of capital | – | – | – | (.034) | – | – |
| Total distributions | (.006) | (.431) | (.405) | (.340) | (.483) | (.594) |
| Net asset value, end of period | $11.39 | $11.50 | $11.07 | $10.60 | $11.12 | $11.20 |
| Total ReturnB,C,D | (.90)% | 7.79% | 8.27% | (1.63)% | 3.60% | .29% |
| Ratios to Average Net AssetsE,F | | | | | | |
| Expenses before reductions | .66%G | .67% | .68% | .69% | .68% | .68% |
| Expenses net of fee waivers, if any | .66%G | .67% | .68% | .69% | .68% | .68% |
| Expenses net of all reductions | .66%G | .67% | .68% | .69% | .68% | .68% |
| Net investment income (loss) | 3.61%G | 3.45% | 3.84% | 3.69% | 3.56% | 3.74% |
| Supplemental Data | | | | | | |
| Net assets, end of period (000 omitted) | $90,821 | $96,952 | $91,630 | $91,714 | $107,847 | $119,063 |
| Portfolio turnover rateH | 138%G | 124% | 81% | 92% | 119% | 141% |
A Calculated based on average shares outstanding during the period.
B Total returns for periods of less than one year are not annualized.
C Total returns do not reflect charges attributable to your insurance company's separate account. Inclusion of these charges would reduce the total returns shown.
D Total returns would have been lower if certain expenses had not been reduced during the applicable periods shown.
E Fees and expenses of any underlying Fidelity Central Funds are not included in the Fund's expense ratio. The Fund indirectly bears its proportionate share of the expenses of any underlying Fidelity Central Funds. Based on their most recent shareholder report date, the expenses of any underlying non-money market Fidelity Central Funds were .05%.
F Expense ratios reflect operating expenses of the class. Expenses before reductions do not reflect amounts reimbursed by the investment adviser or reductions from brokerage service arrangements or reductions from other expense offset arrangements and do not represent the amount paid by the class during periods when reimbursements or reductions occur. Expenses net of fee waivers reflect expenses after reimbursement by the investment adviser but prior to reductions from brokerage service arrangements or other expense offset arrangements. Expenses net of all reductions represent the net expenses paid by the class.
G Annualized
H Amount does not include the portfolio activity of any underlying Fidelity Central Funds.
See accompanying notes which are an integral part of the financial statements.
VIP Strategic Income Portfolio Service Class
| | Six months ended (Unaudited) June 30, | Years endedDecember 31, | | | | |
| | 2018 | 2017 | 2016 | 2015 | 2014 | 2013 |
| Selected Per–Share Data | | | | | | |
| Net asset value, beginning of period | $11.47 | $11.05 | $10.59 | $11.11 | $11.19 | $11.75 |
| Income from Investment Operations | | | | | | |
| Net investment income (loss)A | .199 | .389 | .417 | .401 | .401 | .425 |
| Net realized and unrealized gain (loss) | (.303) | .461 | .444 | (.592) | (.009) | (.403) |
| Total from investment operations | (.104) | .850 | .861 | (.191) | .392 | .022 |
| Distributions from net investment income | – | (.370) | (.401) | (.295) | (.339) | (.471) |
| Distributions from net realized gain | (.006) | (.060) | – | – | (.133) | (.111) |
| Tax return of capital | – | – | – | (.034) | – | – |
| Total distributions | (.006) | (.430) | (.401) | (.329) | (.472) | (.582) |
| Net asset value, end of period | $11.36 | $11.47 | $11.05 | $10.59 | $11.11 | $11.19 |
| Total ReturnB,C,D | (.91)% | 7.71% | 8.14% | (1.73)% | 3.51% | .19% |
| Ratios to Average Net AssetsE,F | | | | | | |
| Expenses before reductions | .76%G | .77% | .78% | .79% | .78% | .78% |
| Expenses net of fee waivers, if any | .76%G | .77% | .78% | .79% | .78% | .78% |
| Expenses net of all reductions | .76%G | .77% | .78% | .79% | .78% | .78% |
| Net investment income (loss) | 3.51%G | 3.35% | 3.75% | 3.59% | 3.46% | 3.64% |
| Supplemental Data | | | | | | |
| Net assets, end of period (000 omitted) | $1,743 | $1,899 | $526 | $753 | $831 | $837 |
| Portfolio turnover rateH | 138%G | 124% | 81% | 92% | 119% | 141% |
A Calculated based on average shares outstanding during the period.
B Total returns for periods of less than one year are not annualized.
C Total returns do not reflect charges attributable to your insurance company's separate account. Inclusion of these charges would reduce the total returns shown.
D Total returns would have been lower if certain expenses had not been reduced during the applicable periods shown.
E Fees and expenses of any underlying Fidelity Central Funds are not included in the Fund's expense ratio. The Fund indirectly bears its proportionate share of the expenses of any underlying Fidelity Central Funds. Based on their most recent shareholder report date, the expenses of any underlying non-money market Fidelity Central Funds were .05%.
F Expense ratios reflect operating expenses of the class. Expenses before reductions do not reflect amounts reimbursed by the investment adviser or reductions from brokerage service arrangements or reductions from other expense offset arrangements and do not represent the amount paid by the class during periods when reimbursements or reductions occur. Expenses net of fee waivers reflect expenses after reimbursement by the investment adviser but prior to reductions from brokerage service arrangements or other expense offset arrangements. Expenses net of all reductions represent the net expenses paid by the class.
G Annualized
H Amount does not include the portfolio activity of any underlying Fidelity Central Funds.
See accompanying notes which are an integral part of the financial statements.
VIP Strategic Income Portfolio Service Class 2
| | Six months ended (Unaudited) June 30, | Years endedDecember 31, | | | | |
| | 2018 | 2017 | 2016 | 2015 | 2014 | 2013 |
| Selected Per–Share Data | | | | | | |
| Net asset value, beginning of period | $11.40 | $10.98 | $10.52 | $11.05 | $11.14 | $11.71 |
| Income from Investment Operations | | | | | | |
| Net investment income (loss)A | .189 | .368 | .398 | .380 | .380 | .404 |
| Net realized and unrealized gain (loss) | (.303) | .459 | .444 | (.593) | (.005) | (.400) |
| Total from investment operations | (.114) | .827 | .842 | (.213) | .375 | .004 |
| Distributions from net investment income | – | (.347) | (.382) | (.283) | (.332) | (.463) |
| Distributions from net realized gain | (.006) | (.060) | – | – | (.133) | (.111) |
| Tax return of capital | – | – | – | (.034) | – | – |
| Total distributions | (.006) | (.407) | (.382) | (.317) | (.465) | (.574) |
| Net asset value, end of period | $11.28 | $11.40 | $10.98 | $10.52 | $11.05 | $11.14 |
| Total ReturnB,C,D | (1.00)% | 7.54% | 8.02% | (1.94)% | 3.37% | .03% |
| Ratios to Average Net AssetsE,F | | | | | | |
| Expenses before reductions | .91%G | .92% | .93% | .94% | .93% | .93% |
| Expenses net of fee waivers, if any | .91%G | .92% | .93% | .94% | .93% | .93% |
| Expenses net of all reductions | .91%G | .92% | .93% | .94% | .93% | .93% |
| Net investment income (loss) | 3.36%G | 3.20% | 3.59% | 3.44% | 3.31% | 3.49% |
| Supplemental Data | | | | | | |
| Net assets, end of period (000 omitted) | $398,151 | $374,227 | $260,789 | $185,925 | $137,892 | $68,196 |
| Portfolio turnover rateH | 138%G | 124% | 81% | 92% | 119% | 141% |
A Calculated based on average shares outstanding during the period.
B Total returns for periods of less than one year are not annualized.
C Total returns do not reflect charges attributable to your insurance company's separate account. Inclusion of these charges would reduce the total returns shown.
D Total returns would have been lower if certain expenses had not been reduced during the applicable periods shown.
E Fees and expenses of any underlying Fidelity Central Funds are not included in the Fund's expense ratio. The Fund indirectly bears its proportionate share of the expenses of any underlying Fidelity Central Funds. Based on their most recent shareholder report date, the expenses of any underlying non-money market Fidelity Central Funds were .05%.
F Expense ratios reflect operating expenses of the class. Expenses before reductions do not reflect amounts reimbursed by the investment adviser or reductions from brokerage service arrangements or reductions from other expense offset arrangements and do not represent the amount paid by the class during periods when reimbursements or reductions occur. Expenses net of fee waivers reflect expenses after reimbursement by the investment adviser but prior to reductions from brokerage service arrangements or other expense offset arrangements. Expenses net of all reductions represent the net expenses paid by the class.
G Annualized
H Amount does not include the portfolio activity of any underlying Fidelity Central Funds.
See accompanying notes which are an integral part of the financial statements.
VIP Strategic Income Portfolio Investor Class
| | Six months ended (Unaudited) June 30, | Years endedDecember 31, | | | | |
| | 2018 | 2017 | 2016 | 2015 | 2014 | 2013 |
| Selected Per–Share Data | | | | | | |
| Net asset value, beginning of period | $11.46 | $11.03 | $10.57 | $11.09 | $11.17 | $11.73 |
| Income from Investment Operations | | | | | | |
| Net investment income (loss)A | .203 | .394 | .424 | .408 | .408 | .432 |
| Net realized and unrealized gain (loss) | (.307) | .463 | .438 | (.591) | (.008) | (.401) |
| Total from investment operations | (.104) | .857 | .862 | (.183) | .400 | .031 |
| Distributions from net investment income | – | (.367) | (.402) | (.303) | (.347) | (.480) |
| Distributions from net realized gain | (.006) | (.060) | – | – | (.133) | (.111) |
| Tax return of capital | – | – | – | (.034) | – | – |
| Total distributions | (.006) | (.427) | (.402) | (.337) | (.480) | (.591) |
| Net asset value, end of period | $11.35 | $11.46 | $11.03 | $10.57 | $11.09 | $11.17 |
| Total ReturnB,C,D | (.91)% | 7.78% | 8.17% | (1.66)% | 3.58% | .27% |
| Ratios to Average Net AssetsE,F | | | | | | |
| Expenses before reductions | .70%G | .71% | .72% | .72% | .71% | .72% |
| Expenses net of fee waivers, if any | .69%G | .71% | .72% | .72% | .71% | .71% |
| Expenses net of all reductions | .69%G | .71% | .72% | .72% | .71% | .71% |
| Net investment income (loss) | 3.58%G | 3.41% | 3.81% | 3.65% | 3.52% | 3.70% |
| Supplemental Data | | | | | | |
| Net assets, end of period (000 omitted) | $1,012,376 | $1,072,701 | $945,087 | $907,266 | $981,928 | $939,177 |
| Portfolio turnover rateH | 138%G | 124% | 81% | 92% | 119% | 141% |
A Calculated based on average shares outstanding during the period.
B Total returns for periods of less than one year are not annualized.
C Total returns do not reflect charges attributable to your insurance company's separate account. Inclusion of these charges would reduce the total returns shown.
D Total returns would have been lower if certain expenses had not been reduced during the applicable periods shown.
E Fees and expenses of any underlying Fidelity Central Funds are not included in the Fund's expense ratio. The Fund indirectly bears its proportionate share of the expenses of any underlying Fidelity Central Funds. Based on their most recent shareholder report date, the expenses of any underlying non-money market Fidelity Central Funds were .05%.
F Expense ratios reflect operating expenses of the class. Expenses before reductions do not reflect amounts reimbursed by the investment adviser or reductions from brokerage service arrangements or reductions from other expense offset arrangements and do not represent the amount paid by the class during periods when reimbursements or reductions occur. Expenses net of fee waivers reflect expenses after reimbursement by the investment adviser but prior to reductions from brokerage service arrangements or other expense offset arrangements. Expenses net of all reductions represent the net expenses paid by the class.
G Annualized
H Amount does not include the portfolio activity of any underlying Fidelity Central Funds.
See accompanying notes which are an integral part of the financial statements.
Notes to Financial Statements (Unaudited)
For the period ended June 30, 2018
1. Organization.
VIP Strategic Income Portfolio (the Fund) is a fund of Variable Insurance Products Fund V (the Trust) and is authorized to issue an unlimited number of shares. The Trust is registered under the Investment Company Act of 1940, as amended (the 1940 Act), as an open-end management investment company organized as a Massachusetts business trust. Shares of the Fund may only be purchased by insurance companies for the purpose of funding variable annuity or variable life insurance contracts. The Fund offers the following classes of shares: Initial Class shares, Service Class shares, Service Class 2 shares and Investor Class shares. All classes have equal rights and voting privileges, except for matters affecting a single class.
2. Investments in Fidelity Central Funds.
The Fund invests in Fidelity Central Funds, which are open-end investment companies generally available only to other investment companies and accounts managed by the investment adviser and its affiliates. The Fund's Schedule of Investments lists each of the Fidelity Central Funds held as of period end, if any, as an investment of the Fund, but does not include the underlying holdings of each Fidelity Central Fund. As an Investing Fund, the Fund indirectly bears its proportionate share of the expenses of the underlying Fidelity Central Funds.
Based on its investment objective, each Fidelity Central Fund may invest or participate in various investment vehicles or strategies that are similar to those of the Fund. These strategies are consistent with the investment objectives of the Fund and may involve certain economic risks which may cause a decline in value of each of the Fidelity Central Funds and thus a decline in the value of the Fund. The Money Market Central Funds seek preservation of capital and current income and are managed by Fidelity Investments Money Management, Inc. (FIMM), an affiliate of the investment adviser. Annualized expenses of the Money Market Central Funds as of their most recent shareholder report date are less than .005%. The following summarizes the Fund's investment in each non-money market Fidelity Central Fund.
| Fidelity Central Fund | Investment Manager | Investment Objective | Investment Practices | Expense Ratio(a) |
| Fidelity Floating Rate Central Fund | FMR Co., Inc. (FMRC) | Seeks a high level of income by normally investing in floating rate loans and other floating rate securities. | Delayed Delivery & When Issued Securities
Loans & Direct Debt Instruments
Restricted Securities
| .05% |
(a) Expenses expressed as a percentage of average net assets and are as of each underlying Central Fund's most recent annual or semi-annual shareholder report.
An unaudited holdings listing for the Fund, which presents direct holdings as well as the pro-rata share of any securities and other investments held indirectly through its investment in underlying non-money market Fidelity Central Funds, is available at institutional.fidelity.com. A complete unaudited list of holdings for each Fidelity Central Fund is available upon request or at the Securities and Exchange Commission (the SEC) website at www.sec.gov. In addition, the financial statements of the Fidelity Central Funds which contain the significant accounting policies (including investment valuation policies) of those funds are available on the SEC website or upon request.
3. Significant Accounting Policies.
The Fund is an investment company and applies the accounting and reporting guidance of the Financial Accounting Standards Board (FASB) Accounting Standards Codification Topic 946 Financial Services – Investments Companies. The financial statements have been prepared in conformity with accounting principles generally accepted in the United States of America (GAAP), which require management to make certain estimates and assumptions at the date of the financial statements. Actual results could differ from those estimates. Subsequent events, if any, through the date that the financial statements were issued have been evaluated in the preparation of the financial statements. The following summarizes the significant accounting policies of the Fund:
Investment Valuation. Investments are valued as of 4:00 p.m. Eastern time on the last calendar day of the period. The Board of Trustees (the Board) has delegated the day to day responsibility for the valuation of the Fund's investments to the Fair Value Committee (the Committee) established by the Fund's investment adviser. In accordance with valuation policies and procedures approved by the Board, the Fund attempts to obtain prices from one or more third party pricing vendors or brokers to value its investments. When current market prices, quotations or currency exchange rates are not readily available or reliable, investments will be fair valued in good faith by the Committee, in accordance with procedures adopted by the Board. Factors used in determining fair value vary by investment type and may include market or investment specific events, changes in interest rates and credit quality. The frequency with which these procedures are used cannot be predicted and they may be utilized to a significant extent. The Committee oversees the Fund's valuation policies and procedures and reports to the Board on the Committee's activities and fair value determinations. The Board monitors the appropriateness of the procedures used in valuing the Fund's investments and ratifies the fair value determinations of the Committee.
The Fund categorizes the inputs to valuation techniques used to value its investments into a disclosure hierarchy consisting of three levels as shown below:
- Level 1 – quoted prices in active markets for identical investments
- Level 2 – other significant observable inputs (including quoted prices for similar investments, interest rates, prepayment speeds, etc.)
- Level 3 – unobservable inputs (including the Fund's own assumptions based on the best information available)
Valuation techniques used to value the Fund's investments by major category are as follows:
Debt securities, including restricted securities, are valued based on evaluated prices received from third party pricing vendors or from brokers who make markets in such securities. Corporate bonds, bank loan obligations, foreign government and government agency obligations, preferred securities, supranational obligations and U.S. government and government agency obligations are valued by pricing vendors who utilize matrix pricing which considers yield or price of bonds of comparable quality, coupon, maturity and type or by broker-supplied prices. Asset backed securities, collateralized mortgage obligations, commercial mortgage securities and U.S. government agency mortgage securities are valued by pricing vendors who utilize matrix pricing which considers prepayment speed assumptions, attributes of the collateral, yield or price of bonds of comparable quality, coupon, maturity and type or by broker-supplied prices. Swaps are marked-to-market daily based on valuations from third party pricing vendors, registered derivatives clearing organizations (clearinghouses) or broker-supplied valuations. These pricing sources may utilize inputs such as interest rate curves, credit spread curves, default possibilities and recovery rates. When independent prices are unavailable or unreliable, debt securities and swaps may be valued utilizing pricing methodologies which consider similar factors that would be used by third party pricing vendors. For foreign debt securities, when significant market or security specific events arise, valuations may be determined in good faith in accordance with procedures adopted by the Board. Debt securities and swaps are generally categorized as Level 2 in the hierarchy but may be Level 3 depending on the circumstances. The Fund invests a significant portion of its assets in below investment grade securities. The value of these securities can be more volatile due to changes in the credit quality of the issuer and is sensitive to changes in economic, market and regulatory conditions.
Equity securities, including restricted securities, for which market quotations are readily available, are valued at the last reported sale price or official closing price as reported by a third party pricing vendor on the primary market or exchange on which they are traded and are categorized as Level 1 in the hierarchy. In the event there were no sales during the day or closing prices are not available, securities are valued at the last quoted bid price or may be valued using the last available price and are generally categorized as Level 2 in the hierarchy. For foreign equity securities, when market or security specific events arise, comparisons to the valuation of American Depositary Receipts (ADRs), futures contracts, Exchange-Traded Funds (ETFs) and certain indexes as well as quoted prices for similar securities may be used and would be categorized as Level 2 in the hierarchy. Utilizing these techniques may result in transfers between Level 1 and Level 2. For equity securities, including restricted securities, where observable inputs are limited, assumptions about market activity and risk are used and these securities may be categorized as Level 3 in the hierarchy.
ETFs are valued at their last sale price or official closing price as reported by a third party pricing vendor on the primary market or exchange on which they are traded and are categorized as Level 1 in the hierarchy. In the event there were no sales during the day but the exchange reports a closing bid level, ETFs are valued at the closing bid and would be categorized as Level 1 in the hierarchy. In the event there was no closing bid, ETFs may be valued by another method that the Board believes reflects fair value in accordance with the Board's fair value pricing policies and may be categorized as Level 2 in the hierarchy.
Futures contracts are valued at the settlement price established each day by the board of trade or exchange on which they are traded and are categorized as Level 1 in the hierarchy. Options traded over-the-counter are valued using vendor or broker-supplied valuations and are categorized as Level 2 in the hierarchy. Investments in open-end mutual funds, including the Fidelity Central Funds, are valued at their closing net asset value (NAV) each business day and are categorized as Level 1 in the hierarchy.
Changes in valuation techniques may result in transfers in or out of an assigned level within the disclosure hierarchy. The aggregate value of investments by input level as of June 30, 2018 is included at the end of the Fund's Schedule of Investments.
Foreign Currency. The Fund may use foreign currency contracts to facilitate transactions in foreign-denominated securities. Gains and losses from these transactions may arise from changes in the value of the foreign currency or if the counterparties do not perform under the contracts' terms.
Foreign-denominated assets, including investment securities, and liabilities are translated into U.S. dollars at the exchange rates at period end. Purchases and sales of investment securities, income and dividends received and expenses denominated in foreign currencies are translated into U.S. dollars at the exchange rate in effect on the transaction date.
The effects of exchange rate fluctuations on investments are included with the net realized and unrealized gain (loss) on investment securities. Other foreign currency transactions resulting in realized and unrealized gain (loss) are disclosed separately.
Investment Transactions and Income. For financial reporting purposes, the Fund's investment holdings and NAV include trades executed through the end of the last business day of the period. The NAV per share for processing shareholder transactions is calculated as of the close of business of the New York Stock Exchange (NYSE), normally 4:00 p.m. Eastern time and includes trades executed through the end of the prior business day. Gains and losses on securities sold are determined on the basis of identified cost and include proceeds received from litigation. Dividend income is recorded on the ex-dividend date, except for certain dividends from foreign securities where the ex-dividend date may have passed, which are recorded as soon as the Fund is informed of the ex-dividend date. Non-cash dividends included in dividend income, if any, are recorded at the fair market value of the securities received. Income and capital gain distributions from Fidelity Central Funds, if any, are recorded on the ex-dividend date. Certain distributions received by the Fund represent a return of capital or capital gain. The Fund determines the components of these distributions subsequent to the ex-dividend date, based upon receipt of tax filings or other correspondence relating to the underlying investment. These distributions are recorded as a reduction of cost of investments and/or as a realized gain. Interest income is accrued as earned and includes coupon interest and amortization of premium and accretion of discount on debt securities as applicable. Paid in Kind (PIK) income is recorded at the fair market value of the securities received. Investment income is recorded net of foreign taxes withheld where recovery of such taxes is uncertain. Debt obligations may be placed on non-accrual status and related interest income may be reduced by ceasing current accruals and writing off interest receivables when the collection of all or a portion of interest has become doubtful based on consistently applied procedures. A debt obligation is removed from non-accrual status when the issuer resumes interest payments or when collectability of interest is reasonably assured.
Class Allocations and Expenses. Investment income, realized and unrealized capital gains and losses, common expenses of the Fund, and certain fund-level expense reductions, if any, are allocated daily on a pro-rata basis to each class based on the relative net assets of each class to the total net assets of the Fund. Each class differs with respect to transfer agent and distribution and service plan fees incurred. Certain expense reductions may also differ by class. For the reporting period, the allocated portion of income and expenses to each class as a percent of its average net assets may vary due to the timing of recording these transactions in relation to fluctuating net assets of the classes. Expenses directly attributable to a fund are charged to that fund. Expenses attributable to more than one fund are allocated among the respective funds on the basis of relative net assets or other appropriate methods. Expense estimates are accrued in the period to which they relate and adjustments are made when actual amounts are known.
Income Tax Information and Distributions to Shareholders. Each year, the Fund intends to qualify as a regulated investment company under Subchapter M of the Internal Revenue Code, including distributing substantially all of its taxable income and realized gains. As a result, no provision for U.S. Federal income taxes is required. The Fund files a U.S. federal tax return, in addition to state and local tax returns as required. The Fund's federal income tax returns are subject to examination by the Internal Revenue Service (IRS) for a period of three fiscal years after they are filed. State and local tax returns may be subject to examination for an additional fiscal year depending on the jurisdiction. Foreign taxes are provided for based on the Fund's understanding of the tax rules and rates that exist in the foreign markets in which it invests.
Distributions are declared and recorded on the ex-dividend date. Income and capital gain distributions are declared separately for each class. Income and capital gain distributions are determined in accordance with income tax regulations, which may differ from GAAP.
Capital accounts within the financial statements are adjusted for permanent book-tax differences. These adjustments have no impact on net assets or the results of operations. Capital accounts are not adjusted for temporary book-tax differences which will reverse in a subsequent period.
Book-tax differences are primarily due to the short-term gain distributions from the Fidelity Central Funds, futures contracts, swaps, foreign currency transactions, market discount, partnerships (including allocations from Fidelity Central Funds), capital loss carryforwards and losses deferred due to wash sales and excise tax regulations.
As of period end, the cost and unrealized appreciation (depreciation) in securities, and derivatives if applicable, for federal income tax purposes were as follows:
| Gross unrealized appreciation | $43,939,126 |
| Gross unrealized depreciation | (38,427,934) |
| Net unrealized appreciation (depreciation) | $5,511,192 |
| Tax cost | $1,536,565,927 |
Capital loss carryforwards are only available to offset future capital gains of the Fund to the extent provided by regulations and may be limited. Under the Regulated Investment Company Modernization Act of 2010 (the Act), the Fund is permitted to carry forward capital losses incurred in taxable years beginning after December 22, 2010 for an unlimited period and such capital losses are required to be used prior to any losses that expire. The capital loss carryforward information presented below, including any applicable limitation, is estimated as of prior fiscal period end and is subject to adjustment.
| No expiration | |
| Short-term | $(594,547) |
Delayed Delivery Transactions and When-Issued Securities. During the period, the Fund transacted in securities on a delayed delivery or when-issued basis. Payment and delivery may take place after the customary settlement period for that security. The price of the underlying securities and the date when the securities will be delivered and paid for are fixed at the time the transaction is negotiated. The securities purchased on a delayed delivery or when-issued basis are identified as such in the Fund's Schedule of Investments. The Fund may receive compensation for interest forgone in the purchase of a delayed delivery or when-issued security. With respect to purchase commitments, the Fund identifies securities as segregated in its records with a value at least equal to the amount of the commitment. Losses may arise due to changes in the value of the underlying securities or if the counterparty does not perform under the contract's terms, or if the issuer does not issue the securities due to political, economic, or other factors.
To-Be-Announced (TBA) Securities and Mortgage Dollar Rolls. During the period, the Fund transacted in TBA securities that involved buying or selling mortgage-backed securities (MBS) on a forward commitment basis. A TBA transaction typically does not designate the actual security to be delivered and only includes an approximate principal amount; however delivered securities must meet specified terms defined by industry guidelines, including issuer, rate and current principal amount outstanding on underlying mortgage pools. The Fund may enter into a TBA transaction with the intent to take possession of or deliver the underlying MBS, or the Fund may elect to extend the settlement by entering into either a mortgage or reverse mortgage dollar roll. Mortgage dollar rolls are transactions where a fund sells TBA securities and simultaneously agrees to repurchase MBS on a later date at a lower price and with the same counterparty. Reverse mortgage dollar rolls involve the purchase and simultaneous agreement to sell TBA securities on a later date at a lower price. Transactions in mortgage dollar rolls and reverse mortgage dollar rolls are accounted for as purchases and sales and may result in an increase to the Fund's portfolio turnover rate.
Purchases and sales of TBA securities involve risks similar to those discussed above for delayed delivery and when-issued securities. Also, if the counterparty in a mortgage dollar roll or a reverse mortgage dollar roll transaction files for bankruptcy or becomes insolvent, the Fund's right to repurchase or sell securities may be limited. Additionally, when a fund sells TBA securities without already owning or having the right to obtain the deliverable securities (an uncovered forward commitment to sell), it incurs a risk of loss because it could have to purchase the securities at a price that is higher than the price at which it sold them. A fund may be unable to purchase the deliverable securities if the corresponding market is illiquid.
TBA securities subject to a forward commitment to sell at period end are included at the end of the Fund's Schedule of Investments under the caption "TBA Sale Commitments." The proceeds and value of these commitments are reflected in the Fund's Statement of Assets and Liabilities as Receivable for TBA sale commitments and TBA sale commitments, at value, respectively.
Restricted Securities. The Fund may invest in securities that are subject to legal or contractual restrictions on resale. These securities generally may be resold in transactions exempt from registration or to the public if the securities are registered. Disposal of these securities may involve time-consuming negotiations and expense, and prompt sale at an acceptable price may be difficult. Information regarding restricted securities is included at the end of the Fund's Schedule of Investments.
Loans and Other Direct Debt Instruments. The Fund invests in direct debt instruments which are interests in amounts owed to lenders by corporate or other borrowers. These instruments may be in the form of loans, trade claims or other receivables and may include standby financing commitments such as revolving credit facilities that obligate the Fund to supply additional cash to the borrower on demand. Loans may be acquired through assignment or participation. The Fund did not have any unfunded loan commitments, which are contractual obligations for future funding, at period end.
New Accounting Pronouncement. In March 2017, the Financial Accounting Standards Board (FASB) issued an Accounting Standards Update (ASU), ASU 2017-08, which amends the amortization period for certain callable debt securities that are held at a premium. The amendment requires the premium to be amortized to the earliest call date. The amendments do not require an accounting change for securities held at a discount. The ASU is effective for annual periods beginning after December 15, 2018. Management is currently evaluating the potential impact of these changes to the financial statements.
4. Derivative Instruments.
Risk Exposures and the Use of Derivative Instruments. The Fund's investment objective allows the Fund to enter into various types of derivative contracts, including futures contracts, options and swaps. Derivatives are investments whose value is primarily derived from underlying assets, indices or reference rates and may be transacted on an exchange or over-the-counter (OTC). Derivatives may involve a future commitment to buy or sell a specified asset based on specified terms, to exchange future cash flows at periodic intervals based on a notional principal amount, or for one party to make one or more payments upon the occurrence of specified events in exchange for periodic payments from the other party.
The Fund used derivatives to increase returns, to gain exposure to certain types of assets and to manage exposure to certain risks as defined below. The success of any strategy involving derivatives depends on analysis of numerous economic factors, and if the strategies for investment do not work as intended, the Fund may not achieve its objectives.
The Fund's use of derivatives increased or decreased its exposure to the following risk:
| Interest Rate Risk | Interest rate risk relates to the fluctuations in the value of interest-bearing securities due to changes in the prevailing levels of market interest rates. |
The Fund is also exposed to additional risks from investing in derivatives, such as liquidity risk and counterparty credit risk. Liquidity risk is the risk that the Fund will be unable to close out the derivative in the open market in a timely manner. Counterparty credit risk is the risk that the counterparty will not be able to fulfill its obligation to the Fund. Derivative counterparty credit risk is managed through formal evaluation of the creditworthiness of all potential counterparties. On certain OTC derivatives such as options, the Fund attempts to reduce its exposure to counterparty credit risk by entering into an International Swaps and Derivatives Association, Inc. (ISDA) Master Agreement with each of its counterparties. The ISDA Master Agreement gives the Fund the right to terminate all transactions traded under such agreement upon the deterioration in the credit quality of the counterparty beyond specified levels. The ISDA Master Agreement gives each party the right, upon an event of default by the other party or a termination of the agreement, to close out all transactions traded under such agreement and to net amounts owed under each transaction to one net payable by one party to the other. To mitigate counterparty credit risk on bi-lateral OTC derivatives, the Fund receives collateral in the form of cash or securities once the Fund's net unrealized appreciation on outstanding derivative contracts under an ISDA Master Agreement exceeds certain applicable thresholds, subject to certain minimum transfer provisions. The collateral received is held in segregated accounts with the Fund's custodian bank in accordance with the collateral agreements entered into between the Fund, the counterparty and the Fund's custodian bank. The Fund could experience delays and costs in gaining access to the collateral even though it is held by the Fund's custodian bank. The Fund's maximum risk of loss from counterparty credit risk related to bi-lateral OTC derivatives is generally the aggregate unrealized appreciation and unpaid counterparty payments in excess of any collateral pledged by the counterparty to the Fund. The Fund may be required to pledge collateral for the benefit of the counterparties on bi-lateral OTC derivatives in an amount not less than each counterparty's unrealized appreciation on outstanding derivative contracts, subject to certain minimum transfer provisions, and any such pledged collateral is identified in the Schedule of Investments. Exchange-traded futures contracts are not covered by the ISDA Master Agreement; however counterparty credit risk related to exchange-traded futures contracts may be mitigated by the protection provided by the exchange on which they trade. Counterparty credit risk related to centrally cleared OTC swaps may be mitigated by the protection provided by the clearinghouse.
Investing in derivatives may involve greater risks than investing in the underlying assets directly and, to varying degrees, may involve risk of loss in excess of any initial investment and collateral received and amounts recognized in the Statement of Assets and Liabilities. In addition, there may be the risk that the change in value of the derivative contract does not correspond to the change in value of the underlying instrument.
Net Realized Gain (Loss) and Change in Net Unrealized Appreciation (Depreciation) on Derivatives. The table below, which reflects the impacts of derivatives on the financial performance of the Fund, summarizes the net realized gain (loss) and change in net unrealized appreciation (depreciation) for derivatives during the period as presented in the Statement of Operations.
| Primary Risk Exposure / Derivative Type | Net Realized Gain (Loss) | Change in Net Unrealized Appreciation (Depreciation) |
| Interest Rate Risk | | |
| Futures Contracts | $(429,248) | $155,911 |
| Purchased Options | 5,270 | 42,570 |
| Written Options | 23,589 | – |
| Swaps | (96,529) | 18,851 |
| Totals | $(496,918) | $217,332 |
A summary of the value of derivatives by primary risk exposure as of period end is included at the end of the Schedule of Investments.
Futures Contracts. A futures contract is an agreement between two parties to buy or sell a specified underlying instrument for a fixed price at a specified future date. The Fund used futures contracts to manage its exposure to the bond market and fluctuations in interest rates.
Upon entering into a futures contract, a fund is required to deposit either cash or securities (initial margin) with a clearing broker in an amount equal to a certain percentage of the face value of the contract. Futures contracts are marked-to-market daily and subsequent daily payments (variation margin) are made or received by a fund depending on the daily fluctuations in the value of the futures contracts and are recorded as unrealized appreciation or (depreciation). This receivable and/or payable, if any, is included in daily variation margin on futures contracts in the Statement of Assets and Liabilities. Realized gain or (loss) is recorded upon the expiration or closing of a futures contract. The net realized gain (loss) and change in net unrealized appreciation (depreciation) on futures contracts during the period is presented in the Statement of Operations.
Any open futures contracts at period end are presented in the Schedule of Investments under the caption "Futures Contracts". The notional amount at value reflects each contract's exposure to the underlying instrument or index at period end and is representative of volume of activity during the period. Securities deposited to meet initial margin requirements are identified in the Schedule of Investments.
Options. Options give the purchaser the right, but not the obligation, to buy (call) or sell (put) an underlying security or financial instrument at an agreed exercise or strike price between or on certain dates. Options obligate the seller (writer) to buy (put) or sell (call) an underlying instrument at the exercise or strike price or cash settle an underlying derivative instrument if the holder exercises the option on or before the expiration date. The Fund uses OTC options, such as swaptions, which are options where the underlying instrument is a swap, to manage its exposure to fluctuations in interest rates.
Upon entering into an options contract, a fund will pay or receive a premium. Premiums paid on purchased options are reflected as cost of investments and premiums received on written options are reflected as a liability on the Statement of Assets and Liabilities. Certain options may be purchased or written with premiums to be paid or received on a future date. Options are valued daily and any unrealized appreciation (depreciation) is reflected on the Statement of Assets and Liabilities. When an option is exercised, the cost or proceeds of the underlying instrument purchased or sold is adjusted by the amount of the premium. When an option is closed the Fund will realize a gain or loss depending on whether the proceeds or amount paid for the closing sale transaction is greater or less than the premium received or paid. When an option expires, gains and losses are realized to the extent of premiums received and paid, respectively. The net realized and unrealized gains (losses) on purchased options are included in the Statement of Operations in net realized gain (loss) and change in net unrealized appreciation (depreciation) on investment securities. The net realized gain (loss) and change in net unrealized appreciation (depreciation) on written options are presented in the Statement of Operations.
Any open options at period end are presented in the Schedule of Investments under the captions "Purchased Options," "Purchased Swaptions," "Written Options" and "Written Swaptions," as applicable, and are representative of volume of activity during the period.
Writing puts and buying calls tend to increase exposure to the underlying instrument while buying puts and writing calls tend to decrease exposure to the underlying instrument. For purchased options, risk of loss is limited to the premium paid, and for written options, risk of loss is the change in value in excess of the premium received.
Swaps. A swap is a contract between two parties to exchange future cash flows at periodic intervals based on a notional principal amount. A centrally cleared OTC swap is a transaction executed between a fund and a dealer counterparty, then cleared by a futures commission merchant (FCM) through a clearinghouse. Once cleared, the clearinghouse serves as a central counterparty, with whom a fund exchanges cash flows for the life of the transaction, similar to transactions in futures contracts.
Centrally cleared OTC swaps require a fund to deposit either cash or securities (initial margin) with the FCM, at the instruction of and for the benefit of the clearinghouse. Securities deposited to meet initial margin requirements are identified in the Schedule of Investments. Centrally cleared OTC swaps are marked-to-market daily and subsequent payments (variation margin) are made or received depending on the daily fluctuations in the value of the swaps and are recorded as unrealized appreciation or (depreciation). These daily payments, if any, are included in receivable or payable for daily variation margin on centrally cleared OTC swaps in the Statement of Assets and Liabilities. Any premiums for centrally cleared OTC swaps are recorded periodically throughout the term of the swap to variation margin and included in unrealized appreciation (depreciation) in the Statement of Assets and Liabilities. Any premiums are recognized as realized gain (loss) upon termination or maturity of the swap.
Payments are exchanged at specified intervals, accrued daily commencing with the effective date of the contract and recorded as realized gain or (loss). Some swaps may be terminated prior to the effective date and realize a gain or loss upon termination. The net realized gain (loss) and change in net unrealized appreciation (depreciation) on swaps during the period is presented in the Statement of Operations.
Any open swaps at period end are included in the Schedule of Investments under the caption "Swaps" and are representative of volume of activity during the period.
Interest Rate Swaps. Interest rate swaps are agreements between counterparties to exchange cash flows, one based on a fixed rate, and the other on a floating rate. The Fund entered into interest rate swaps to manage its exposure to interest rate changes. Changes in interest rates can have an effect on both the value of bond holdings as well as the amount of interest income earned. In general, the value of bonds can fall when interest rates rise and can rise when interest rates fall.
5. Purchases and Sales of Investments.
Purchases and sales of securities (including the Fixed-Income Central Funds), other than short-term securities and U.S. government securities, aggregated $680,599,278 and $627,475,564, respectively.
6. Fees and Other Transactions with Affiliates.
Management Fee. Fidelity Management & Research Company (the investment adviser) and its affiliates provide the Fund with investment management related services for which the Fund pays a monthly management fee. The management fee is the sum of an individual fund fee rate that is based on an annual rate of .45% of the Fund's average net assets and an annualized group fee rate that averaged .11% during the period. The group fee rate is based upon the average net assets of all the mutual funds advised by the investment adviser, including any mutual funds previously advised by the investment adviser that are currently advised by Fidelity SelectCo, LLC, an affiliate of the investment adviser. The group fee rate decreases as assets under management increase and increases as assets under management decrease. For the reporting period, the total annualized management fee rate was .56% of the Fund's average net assets.
Distribution and Service Plan Fees. In accordance with Rule 12b-1 of the 1940 Act, the Fund has adopted separate 12b-1 Plans for each Service Class of shares. Each Service Class pays Fidelity Distributors Corporation (FDC), an affiliate of the investment adviser, a service fee. For the period, the service fee is based on an annual rate of .10% of Service Class' average net assets and .25% of Service Class 2's average net assets.
For the period, total fees, all of which were re-allowed to insurance companies for the distribution of shares and providing shareholder support services, were as follows:
| Service Class | $893 |
| Service Class 2 | 479,280 |
| | $480,173 |
Transfer Agent Fees. Fidelity Investments Institutional Operations Company, Inc. (FIIOC), an affiliate of the investment adviser, is the Fund's transfer, dividend disbursing, and shareholder servicing agent. FIIOC receives an asset-based fee with respect to each class. Each class pays a fee for transfer agent services, typesetting and printing and mailing of shareholder reports, excluding mailing of proxy statements, equal to an annual rate of class-level average net assets. The annual rate for Investor Class is .10% and the annual rate for all other classes is .07%. For the period, transfer agent fees for each class were as follows:
| Initial Class | $32,083 |
| Service Class | 607 |
| Service Class 2 | 130,364 |
| Investor Class | 534,482 |
| | $697,536 |
Accounting and Security Lending Fees. Fidelity Service Company, Inc. (FSC), an affiliate of the investment adviser, maintains the Fund's accounting records. The accounting fee is based on the level of average net assets for each month. Under a separate contract, FSC administers the security lending program. The security lending fee is based on the number and duration of lending transactions. For the period, the fees were equivalent to an annualized rate of .03%.
Brokerage Commissions. The Fund placed a portion of its portfolio transactions with brokerage firms which are affiliates of the investment adviser. Brokerage commissions are included in net realized gain (loss) and change in net unrealized appreciation (depreciation) in the Statement of Operations. The commissions paid to these affiliated firms were $682 for the period.
Interfund Trades. The Fund may purchase from or sell securities to other Fidelity Funds under procedures adopted by the Board. The procedures have been designed to ensure these interfund trades are executed in accordance with Rule 17a-7 of the 1940 Act. Interfund trades are included within the respective purchases and sales amounts shown in the Purchases and Sales of Investments note.
Other. During the period, the investment adviser reimbursed the Fund for certain losses in the amount of $8,852.
7. Committed Line of Credit.
The Fund participates with other funds managed by the investment adviser or an affiliate in a $4.25 billion credit facility (the "line of credit") to be utilized for temporary or emergency purposes to fund shareholder redemptions or for other short-term liquidity purposes. The Fund has agreed to pay commitment fees on its pro-rata portion of the line of credit, which amounted to $2,182 and is reflected in Miscellaneous expenses on the Statement of Operations. During the period, the Fund did not borrow on this line of credit.
8. Security Lending.
The Fund lends portfolio securities through a lending agent from time to time in order to earn additional income. For equity securities, a lending agent is used and may loan securities to certain qualified borrowers, including Fidelity Capital Markets (FCM), a broker-dealer affiliated with the Fund. On the settlement date of the loan, the Fund receives collateral (in the form of U.S. Treasury obligations, letters of credit and/or cash) against the loaned securities and maintains collateral in an amount not less than 100% of the market value of the loaned securities during the period of the loan. The market value of the loaned securities is determined at the close of business of the Fund and any additional required collateral is delivered to the Fund on the next business day. The Fund or borrower may terminate the loan at any time, and if the borrower defaults on its obligation to return the securities loaned because of insolvency or other reasons, the Fund may apply collateral received from the borrower against the obligation. The Fund may experience delays and costs in recovering the securities loaned. Any cash collateral received is invested in the Fidelity Securities Lending Cash Central Fund. The value of loaned securities and cash collateral at period end are disclosed on the Fund's Statement of Assets and Liabilities. Security lending income represents the income earned on investing cash collateral, less rebates paid to borrowers and any lending agent fees associated with the loan, plus any premium payments received for lending certain types of securities. Security lending income is presented in the Statement of Operations as a component of income from Fidelity Central Funds. Total security lending income during the period amounted to $711. During the period, there were no securities loaned to FCM.
9. Expense Reductions.
Commissions paid to certain brokers with whom the investment adviser, or its affiliates, places trades on behalf of the Fund include an amount in addition to trade execution, which may be rebated back to the Fund to offset certain expenses. This amount totaled $5,930 for the period. In addition, through arrangements with the Fund's custodian, credits realized as a result of certain uninvested cash balances were used to reduce the Fund's expenses. During the period, these credits reduced the Fund's custody expenses by $4,074.
In addition, during the period the investment adviser reimbursed and/or waived a portion of fund-level operating expenses in the amount of $4,614.
10. Distributions to Shareholders.
Distributions to shareholders of each class were as follows:
| | Six months ended
June 30, 2018 | Year ended
December 31, 2017 |
| From net investment income | | |
| Initial Class | $– | $3,029,902 |
| Service Class | – | 59,576 |
| Service Class 2 | – | 11,005,331 |
| Investor Class | – | 33,123,926 |
| Total | $– | $47,218,735 |
| From net realized gain | | |
| Initial Class | $50,277 | $490,011 |
| Service Class | 958 | 9,661 |
| Service Class 2 | 197,540 | 1,902,939 |
| Investor Class | 553,944 | 5,415,356 |
| Total | $802,719 | $7,817,967 |
11. Share Transactions.
Transactions for each class of shares were as follows:
| | Shares | Shares | Dollars | Dollars |
| | Six months ended June 30, 2018 | Year ended December 31, 2017 | Six months ended June 30, 2018 | Year ended December 31, 2017 |
| Initial Class | | | | |
| Shares sold | 440,874 | 1,069,761 | $5,062,129 | $12,377,067 |
| Reinvestment of distributions | 4,380 | 307,148 | 50,277 | 3,519,913 |
| Shares redeemed | (903,236) | (1,225,267) | (10,347,687) | (14,213,181) |
| Net increase (decrease) | (457,982) | 151,642 | $(5,235,281) | $1,683,799 |
| Service Class | | | | |
| Shares sold | 8,173 | 118,271 | $93,594 | $1,401,470 |
| Reinvestment of distributions | 61 | 6,058 | 700 | 69,237 |
| Shares redeemed | (20,375) | (6,343) | (232,735) | (73,173) |
| Net increase (decrease) | (12,141) | 117,986 | $(138,441) | $1,397,534 |
| Service Class 2 | | | | |
| Shares sold | 4,996,114 | 11,423,463 | $56,776,387 | $131,276,350 |
| Reinvestment of distributions | 17,374 | 1,136,291 | 197,540 | 12,908,270 |
| Shares redeemed | (2,540,127) | (3,479,579) | (28,869,716) | (39,915,663) |
| Net increase (decrease) | 2,473,361 | 9,080,175 | $28,104,211 | $104,268,957 |
| Investor Class | | | | |
| Shares sold | 2,037,746 | 7,944,671 | $23,360,806 | $91,654,283 |
| Reinvestment of distributions | 48,422 | 3,374,718 | 553,944 | 38,539,282 |
| Shares redeemed | (6,496,816) | (3,392,440) | (74,177,948) | (39,096,557) |
| Net increase (decrease) | (4,410,648) | 7,926,949 | $(50,263,198) | $91,097,008 |
12. Other.
The Fund's organizational documents provide former and current trustees and officers with a limited indemnification against liabilities arising in connection with the performance of their duties to the Fund. In the normal course of business, the Fund may also enter into contracts that provide general indemnifications. The Fund's maximum exposure under these arrangements is unknown as this would be dependent on future claims that may be made against the Fund. The risk of material loss from such claims is considered remote.
At the end of the period, the investment adviser or its affiliates were the owners of record of 72% of the total outstanding shares of the Fund.
13. Credit Risk.
The Fund's relatively large investment in countries with limited or developing capital markets may involve greater risks than investments in more developed markets and the prices of such investments may be volatile. The yields of emerging market debt obligations reflect, among other things, perceived credit risk. The consequences of political, social or economic changes in these markets may have disruptive effects on the market prices of the Fund's investments and the income they generate, as well as the Fund's ability to repatriate such amounts.
14. Litigation.
The Fund, and other entities managed by FMR or its affiliates were named as defendants in a lawsuit filed in the United States Bankruptcy Court for the Southern District of New York in 2009. The lawsuit was brought by creditors of Motors Liquidation Company (f/k/a General Motors), which went through Chapter 11 bankruptcy proceedings in 2009, and is captioned Official Committee of Unsecured Creditors of Motors Liquidation Company v. JPMorgan Chase Bank, N.A., et al., Adversary No. 09-00504 (REG). The plaintiffs are seeking an order that the Fund and other defendants return proceeds received in 2009 in full payment of the principal and interest on General Motors secured debt. The plaintiffs contend that the Fund and the other defendants were not secured creditors at the time of the 2009 payments and, thus, were not entitled to payment in full. In January 2015, the Court of Appeals ruled that JPMorgan, as administrative agent for all of the debtholders, released the security interest on certain collateral securing the debt prior to the 2009 payments. In September 2017, an opinion was issued in a trial intended to help determine the value of any remaining, unreleased collateral. The parties have engaged in mediation but continue to disagree on the value of the unreleased collateral. At this time, Management cannot determine the amount of loss that may be realized, but expects the amount to be less than the $1,208,199 received in 2009. The Fund is also incurring legal costs in defending the case.
Shareholder Expense Example
As a shareholder of the Fund, you incur two types of costs: (1) transaction costs and (2) ongoing costs, including management fees, distribution and/or service (12b-1) fees and other Fund expenses. This Example is intended to help you understand your ongoing costs (in dollars) of investing in the Fund and to compare these costs with the ongoing costs of investing in other mutual funds.
The Example is based on an investment of $1,000 invested at the beginning of the period and held for the entire period (January 1, 2018 to June 30, 2018).
Actual Expenses
The first line of the accompanying table for each class of the Fund provides information about actual account values and actual expenses. You may use the information in this line, together with the amount you invested, to estimate the expenses that you paid over the period. Simply divide your account value by $1,000.00 (for example, an $8,600 account value divided by $1,000.00 = 8.6), then multiply the result by the number in the first line for a class of the Fund under the heading entitled "Expenses Paid During Period" to estimate the expenses you paid on your account during this period. The estimate of expenses does not include any fees or other expenses of any variable annuity or variable life insurance product. If they were, the estimate of expenses you paid during the period would be higher, and your ending account value would be lower. In addition, the Fund, as a shareholder in the underlying Fidelity Central Funds, will indirectly bear its pro-rata share of the fees and expenses incurred by the underlying Fidelity Central Funds. These fees and expenses are not included in the Fund's annualized expense ratio used to calculate the expense estimate in the table below.
Hypothetical Example for Comparison Purposes
The second line of the accompanying table for each class of the Fund provides information about hypothetical account values and hypothetical expenses based on a Class' actual expense ratio and an assumed rate of return of 5% per year before expenses, which is not the Class' actual return. The hypothetical account values and expenses may not be used to estimate the actual ending account balance or expenses you paid for the period. You may use this information to compare the ongoing costs of investing in the Fund and other funds. To do so, compare this 5% hypothetical example with the 5% hypothetical examples that appear in the shareholder reports of the other funds. The estimate of expenses does not include any fees or other expenses of any variable annuity or variable life insurance product. If they were, the estimate of expenses you paid during the period would be higher, and your ending account value would be lower. In addition, the Fund, as a shareholder in the underlying Fidelity Central Funds, will indirectly bear its pro-rata share of the fees and expenses incurred by the underlying Fidelity Central Funds. These fees and expenses are not included in the Fund's annualized expense ratio used to calculate the expense estimate in the table below.
Please note that the expenses shown in the table are meant to highlight your ongoing costs only and do not reflect any transaction costs. Therefore, the second line of the table is useful in comparing ongoing costs only, and will not help you determine the relative total costs of owning different funds.
| | Annualized Expense Ratio-A | Beginning
Account Value
January 1, 2018 | Ending
Account Value
June 30, 2018 | Expenses Paid
During Period-B
January 1, 2018
to June 30, 2018 |
| Initial Class | .66% | | | |
| Actual | | $1,000.00 | $991.00 | $3.26 |
| Hypothetical-C | | $1,000.00 | $1,021.52 | $3.31 |
| Service Class | .76% | | | |
| Actual | | $1,000.00 | $990.90 | $3.75 |
| Hypothetical-C | | $1,000.00 | $1,021.03 | $3.81 |
| Service Class 2 | .91% | | | |
| Actual | | $1,000.00 | $990.00 | $4.49 |
| Hypothetical-C | | $1,000.00 | $1,020.28 | $4.56 |
| Investor Class | .69% | | | |
| Actual | | $1,000.00 | $990.90 | $3.41 |
| Hypothetical-C | | $1,000.00 | $1,021.37 | $3.46 |
A Annualized expense ratio reflects expenses net of applicable fee waivers.
B Expenses are equal to each Class' annualized expense ratio, multiplied by the average account value over the period, multiplied by 181/365 (to reflect the one-half year period). The fees and expenses of the underlying Fidelity Central Funds in which the Fund invests are not included in each Class' annualized expense ratio. In addition to the expenses noted above, the Fund also indirectly bears its proportional share of the expenses of the underlying Fidelity Central Funds. Annualized expenses of the underlying non-money market Fidelity Central Funds as of their most recent fiscal half year were .05%.
C 5% return per year before expenses
VIPSI-SANN-0818
1.803539.114
Fidelity® Variable Insurance Products: Target Volatility Portfolio
Semi-Annual Report June 30, 2018 |
|
Contents
To view a fund's proxy voting guidelines and proxy voting record for the 12-month period ended June 30, visit http://www.fidelity.com/proxyvotingresults or visit the Securities and Exchange Commission's (SEC) web site at http://www.sec.gov.
You may also call 1-877-208-0098 to request a free copy of the proxy voting guidelines.
Fidelity® Variable Insurance Products are separate account options which are purchased through a variable insurance contract.
Standard & Poor's, S&P and S&P 500 are registered service marks of The McGraw-Hill Companies, Inc. and have been licensed for use by Fidelity Distributors Corporation.
Other third-party marks appearing herein are the property of their respective owners.
All other marks appearing herein are registered or unregistered trademarks or service marks of FMR LLC or an affiliated company. © 2018 FMR LLC. All rights reserved.
This report and the financial statements contained herein are submitted for the general information of the shareholders of the Fund. This report is not authorized for distribution to prospective investors in the Fund unless preceded or accompanied by an effective prospectus.
A fund files its complete schedule of portfolio holdings with the SEC for the first and third quarters of each fiscal year on Form N-Q. Forms N-Q are available on the SEC’s web site at http://www.sec.gov. A fund's Forms N-Q may be reviewed and copied at the SEC’s Public Reference Room in Washington, DC. Information regarding the operation of the SEC's Public Reference Room may be obtained by calling 1-800-SEC-0330.
For a complete list of a fund's portfolio holdings, view the most recent holdings listing, semiannual report, or annual report on Fidelity's web site at http://www.fidelity.com, http://www.institutional.fidelity.com, or http://www.401k.com, as applicable.
NOT FDIC INSURED •MAY LOSE VALUE •NO BANK GUARANTEE
Neither the Fund nor Fidelity Distributors Corporation is a bank.
Investment Summary (Unaudited)
The information in the following tables is based on the direct investments of the Fund.
Top Holdings as of June 30, 2018
| | % of fund's net assets |
| Fidelity Total Bond Fund | 17.5 |
| Fidelity Technology Portfolio | 7.4 |
| Fidelity U.S. Bond Index Fund Institutional Class | 5.8 |
| iShares Barclays Aggregate Bond ETF | 5.7 |
| Fidelity Overseas Fund | 5.1 |
| Fidelity Financial Services Portfolio | 4.2 |
| Fidelity Health Care Portfolio | 4.2 |
| Fidelity Inflation-Protected Bond Index Fund Institutional Class | 4.1 |
| Fidelity Consumer Discretionary Portfolio | 3.0 |
| Fidelity Industrials Portfolio | 2.9 |
| | 59.9 |
Asset Allocation (% of fund's net assets)
| As of June 30, 2018 |
| | Domestic Equity Funds | 48.1% |
| | International Equity Funds | 14.3% |
| | Fixed-Income Funds | 37.3% |
| | Cash Equivalents | 0.3% |

Schedule of Investments June 30, 2018 (Unaudited)
Showing Percentage of Net Assets
| Equity Funds - 62.4% | | | |
| | | Shares | Value |
| Domestic Equity Funds - 48.1% | | | |
| Consumer Discretionary Select Sector SPDR ETF | | 31,703 | $3,465,138 |
| Consumer Staples Select Sector SPDR ETF | | 31,945 | 1,646,126 |
| Energy Select Sector SPDR ETF | | 7,719 | 586,181 |
| Fidelity Commodity Strategy Fund (a) | | 290,203 | 3,055,833 |
| Fidelity Consumer Discretionary Portfolio (a) | | 206,189 | 9,249,652 |
| Fidelity Consumer Staples Portfolio (a) | | 74,739 | 5,903,639 |
| Fidelity Contrafund (a) | | 43,665 | 5,766,822 |
| Fidelity Energy Portfolio (a) | | 114,757 | 5,493,435 |
| Fidelity Equity-Income Fund (a) | | 98,828 | 5,691,490 |
| Fidelity Financial Services Portfolio (a) | | 122,020 | 13,107,381 |
| Fidelity Global Commodity Stock Fund (a) | | 235,676 | 3,219,340 |
| Fidelity Health Care Portfolio (a) | | 53,268 | 13,053,434 |
| Fidelity Industrials Portfolio (a) | | 259,736 | 8,831,039 |
| Fidelity Low-Priced Stock Fund (a) | | 103,535 | 5,694,448 |
| Fidelity Materials Portfolio (a) | | 32,163 | 2,655,345 |
| Fidelity Mega Cap Stock Fund (a) | | 485,564 | 8,507,079 |
| Fidelity Real Estate Investment Portfolio (a) | | 81,559 | 3,447,517 |
| Fidelity Technology Portfolio (a) | | 127,159 | 22,749,946 |
| Fidelity Telecommunications Portfolio (a) | | 32,328 | 1,798,072 |
| Fidelity Utilities Portfolio (a) | | 31,994 | 2,745,442 |
| Fidelity Value Discovery Fund (a) | | 100,060 | 2,839,712 |
| Financial Select Sector SPDR ETF | | 145,470 | 3,868,047 |
| Health Care Select Sector SPDR ETF | | 33,480 | 2,794,241 |
| Industrial Select Sector SPDR ETF | | 37,831 | 2,709,835 |
| Materials Select Sector SPDR ETF | | 16,116 | 935,856 |
| Real Estate Select Sector SPDR ETF | | 20,053 | 655,934 |
| SPDR S&P Telecom ETF | | 8,160 | 589,886 |
| Technology Select Sector SPDR ETF | | 99,224 | 6,893,091 |
| Utilities Select Sector SPDR ETF | | 14,710 | 764,332 |
|
| TOTAL DOMESTIC EQUITY FUNDS | | | 148,718,293 |
|
| International Equity Funds - 14.3% | | | |
| Fidelity Diversified International Fund (a) | | 105,184 | 4,097,957 |
| Fidelity International Capital Appreciation Fund (a) | | 46,152 | 964,116 |
| Fidelity International Discovery Fund (a) | | 76,033 | 3,365,973 |
| Fidelity International Enhanced Index Fund (a) | | 316,013 | 3,112,732 |
| Fidelity International Small Cap Fund (a) | | 61,065 | 1,780,032 |
| Fidelity International Small Cap Opportunities Fund (a) | | 84,286 | 1,631,773 |
| Fidelity International Value Fund (a) | | 253,804 | 2,192,869 |
| Fidelity Japan Smaller Companies Fund (a) | | 103,491 | 1,916,655 |
| Fidelity Overseas Fund (a) | | 318,311 | 15,848,703 |
| Fidelity Pacific Basin Fund (a) | | 24,166 | 827,208 |
| iShares MSCI EAFE Index ETF | | 126,909 | 8,499,096 |
|
| TOTAL INTERNATIONAL EQUITY FUNDS | | | 44,237,114 |
|
| TOTAL EQUITY FUNDS | | | |
| (Cost $178,968,742) | | | 192,955,407 |
|
| Fixed-Income Funds - 37.3% | | | |
| Fidelity Conservative Income Bond Fund (a) | | 336,646 | 3,376,557 |
| Fidelity Floating Rate High Income Fund (a) | | 314,488 | 3,015,943 |
| Fidelity Inflation-Protected Bond Index Fund Institutional Class (a) | | 1,284,785 | 12,616,587 |
| Fidelity Long-Term Treasury Bond Index Fund Premium Class (a) | | 414,371 | 5,262,510 |
| Fidelity New Markets Income Fund (a) | | 96,173 | 1,432,977 |
| Fidelity Total Bond Fund (a) | | 5,220,140 | 54,080,645 |
| Fidelity U.S. Bond Index Fund Institutional Class (a) | | 1,591,223 | 17,885,349 |
| iShares Barclays Aggregate Bond ETF | | 165,133 | 17,556,941 |
| TOTAL FIXED-INCOME FUNDS | | | |
| (Cost $117,327,891) | | | 115,227,509 |
|
| Cash Equivalents - 0.3% | | | |
| Fidelity Cash Central Fund, 1.93% (b) | | | |
| (Cost $1,103,128) | | 1,102,989 | 1,103,210 |
| TOTAL INVESTMENT IN SECURITIES - 100.0% | | | |
| (Cost $297,399,761) | | | 309,286,126 |
| NET OTHER ASSETS (LIABILITIES) - 0.0% | | | (106,598) |
| NET ASSETS - 100% | | | $309,179,528 |
Security Type Abbreviations
ETF – Exchange-Traded Fund
Legend
(a) Affiliated Fund
(b) Affiliated fund that is generally available only to investment companies and other accounts managed by Fidelity Investments. The rate quoted is the annualized seven-day yield of the fund at period end. A complete unaudited listing of the fund's holdings as of its most recent quarter end is available upon request. In addition, each Fidelity Central Fund's financial statements are available on the SEC's website or upon request.
Affiliated Central Funds
Information regarding fiscal year to date income earned by the Fund from investments in Fidelity Central Funds is as follows:
| Fund | Income earned |
| Fidelity Cash Central Fund | $38,371 |
| Total | $38,371 |
Amounts in the income column in the above table include any capital gain distributions from underlying funds, which are presented in the corresponding line-item in the Statement of Operations if applicable.
Affiliated Underlying Funds
Fiscal year to date information regarding the Fund's investments in affiliated Underlying Funds, excluding any Money Market Central Funds, is presented below. Exchanges between classes of the same affiliated Underlying Funds may occur.
| Affiliate | Value, beginning of period | Purchases | Sales Proceeds | Dividend Income | Realized Gain (loss) | Change in Unrealized appreciation (depreciation) | Value, end of period |
| Fidelity Commodity Strategy Fund | $2,961,457 | $142,981 | $38,882 | $-- | $(39) | $(9,684) | $3,055,833 |
| Fidelity Conservative Income Bond Fund | 1,281,303 | 8,054,671 | 5,956,210 | 57,724 | (5) | (3,202) | 3,376,557 |
| Fidelity Consumer Discretionary Portfolio | 8,574,573 | 1,147,948 | 1,170,847 | 126,309 | 54,087 | 643,891 | 9,249,652 |
| Fidelity Consumer Staples Portfolio | 5,274,662 | 1,487,756 | 104,816 | 309,784 | (5,089) | (748,874) | 5,903,639 |
| Fidelity Contrafund | 4,901,862 | 735,432 | 255,394 | 74,869 | (4,968) | 389,890 | 5,766,822 |
| Fidelity Diversified International Fund | 3,942,059 | 910,166 | 651,341 | -- | (17,906) | (85,021) | 4,097,957 |
| Fidelity Emerging Markets Fund | 10,041,660 | 86,502 | 10,125,655 | -- | 492,314 | (494,821) | -- |
| Fidelity Energy Portfolio | 4,948,991 | 478,684 | 261,135 | -- | (8,236) | 335,131 | 5,493,435 |
| Fidelity Equity-Income Fund | 5,056,201 | 1,090,190 | 193,880 | 131,253 | (3,396) | (257,625) | 5,691,490 |
| Fidelity Europe Fund | 1,532,815 | 44,328 | 1,560,023 | -- | 137,082 | (154,202) | -- |
| Fidelity Financial Services Portfolio | 12,810,727 | 1,936,906 | 844,711 | 291,587 | 1,506 | (797,047) | 13,107,381 |
| Fidelity Floating Rate High Income Fund | 2,910,934 | 200,347 | 85,752 | 60,493 | (29) | (9,557) | 3,015,943 |
| Fidelity Global Commodity Stock Fund | 3,128,217 | 139,850 | 155,752 | -- | 1,693 | 105,332 | 3,219,340 |
| Fidelity Health Care Portfolio | 11,408,189 | 1,069,962 | 537,034 | 409,978 | 365 | 1,111,952 | 13,053,434 |
| Fidelity High Income Fund | 5,800,259 | 66,874 | 5,801,677 | 36,117 | (106,875) | 41,419 | -- |
| Fidelity Industrials Portfolio | 8,559,787 | 1,478,108 | 546,562 | 337,299 | (2,502) | (657,792) | 8,831,039 |
| Fidelity Inflation-Protected Bond Index Fund Institutional Class | 10,063,487 | 2,665,993 | 136,028 | 14,010 | (718) | 23,853 | 12,616,587 |
| Fidelity International Capital Appreciation Fund | 907,700 | 76,117 | 12,007 | -- | (22) | (7,672) | 964,116 |
| Fidelity International Discovery Fund | 3,279,937 | 728,081 | 544,365 | -- | (10,451) | (87,229) | 3,365,973 |
| Fidelity International Enhanced Index Fund | 2,949,764 | 735,220 | 490,489 | -- | 5,200 | (86,963) | 3,112,732 |
| Fidelity International Small Cap Fund | 1,773,116 | 310,379 | 258,009 | -- | 48 | (45,502) | 1,780,032 |
| Fidelity International Small Cap Opportunities Fund | 1,673,261 | 221,833 | 262,178 | 1 | (1,064) | (79) | 1,631,773 |
| Fidelity International Value Fund | 2,136,870 | 493,838 | 334,535 | -- | 158 | (103,462) | 2,192,869 |
| Fidelity Japan Smaller Companies Fund | 1,906,594 | 69,081 | 13,133 | -- | (25) | (45,862) | 1,916,655 |
| Fidelity Long-Term Treasury Bond Index Fund Premium Class | 5,366,736 | 4,339,213 | 4,174,026 | 81,070 | (147,643) | (121,770) | 5,262,510 |
| Fidelity Low-Priced Stock Fund | 5,073,415 | 828,937 | 243,881 | -- | 393 | 35,584 | 5,694,448 |
| Fidelity Materials Portfolio | 2,494,334 | 433,020 | 29,859 | 119,915 | (1,015) | (241,135) | 2,655,345 |
| Fidelity Mega Cap Stock Fund | 7,562,015 | 1,230,569 | 312,888 | -- | (2,679) | 30,062 | 8,507,079 |
| Fidelity Mid Cap Value Fund | 289 | 13 | 278 | 13 | 4 | (28) | -- |
| Fidelity New Markets Income Fund | 1,466,582 | 108,541 | 19,446 | 32,038 | (295) | (122,405) | 1,432,977 |
| Fidelity Overseas Fund | 15,397,464 | 3,407,690 | 2,703,677 | -- | 28,332 | (281,106) | 15,848,703 |
| Fidelity Pacific Basin Fund | 804,359 | 60,243 | 7,574 | -- | (111) | (29,709) | 827,208 |
| Fidelity Real Estate Investment Portfolio | 3,039,348 | 375,734 | 32,135 | 19,751 | (486) | 65,056 | 3,447,517 |
| Fidelity Technology Portfolio | 20,218,973 | 3,850,057 | 1,431,991 | 1,983,339 | 46 | 112,861 | 22,749,946 |
| Fidelity Telecommunications Portfolio | 1,546,446 | 354,551 | 25,444 | 22,273 | (1,345) | (76,136) | 1,798,072 |
| Fidelity Total Bond Fund | 48,308,494 | 8,100,846 | 1,005,717 | 671,057 | (13,339) | (1,309,639) | 54,080,645 |
| Fidelity U.S. Bond Index Fund Institutional Class | 16,348,663 | 2,254,947 | 222,298 | 224,124 | (2,110) | (493,853) | 17,885,349 |
| Fidelity Utilities Portfolio | 2,306,243 | 280,362 | 38,232 | 11,518 | (423) | 197,492 | 2,745,442 |
| Fidelity Value Discovery Fund | 2,497,953 | 449,366 | 56,886 | -- | (570) | (50,151) | 2,839,712 |
| | $250,255,739 | $50,445,336 | $40,644,747 | $5,014,522 | $389,887 | $(3,228,003) | $257,218,212 |
Amounts in the income column in the above table include any capital gain distributions from underlying funds, which are presented in the corresponding line-item in the Statement of Operations if applicable.
Investment Valuation
All investments are categorized as Level 1 under the Fair Value Hierarchy. The inputs or methodology used for valuing securities may not be an indication of the risk associated with investing in those securities. For more information on valuation inputs please refer to the Investment Valuation section in the accompanying Notes to Financial Statements.
See accompanying notes which are an integral part of the financial statements.
Financial Statements
Statement of Assets and Liabilities
| | | June 30, 2018 (Unaudited) |
| Assets | | |
Investment in securities, at value — See accompanying schedule:
Unaffiliated issuers (cost $49,886,339) | $50,964,704 | |
| Fidelity Central Funds (cost $1,103,128) | 1,103,210 | |
| Other affiliated issuers (cost $246,410,294) | 257,218,212 | |
| Total Investment in Securities (cost $297,399,761) | | $309,286,126 |
| Receivable for investments sold | | 14,920 |
| Receivable for fund shares sold | | 106,399 |
| Dividends receivable | | 200,184 |
| Distributions receivable from Fidelity Central Funds | | 1,712 |
| Other receivables | | 1,447 |
| Total assets | | 309,610,788 |
| Liabilities | | |
| Payable for investments purchased | $200,573 | |
| Payable for fund shares redeemed | 121,322 | |
| Accrued management fee | 64,618 | |
| Distribution and service plan fees payable | 38,597 | |
| Other affiliated payables | 6,150 | |
| Total liabilities | | 431,260 |
| Net Assets | | $309,179,528 |
| Net Assets consist of: | | |
| Paid in capital | | $291,850,866 |
| Undistributed net investment income | | 1,241,421 |
| Accumulated undistributed net realized gain (loss) on investments | | 4,200,876 |
| Net unrealized appreciation (depreciation) on investments | | 11,886,365 |
| Net Assets | | $309,179,528 |
| Service Class: | | |
| Net Asset Value, offering price and redemption price per share ($1,396,748 ÷ 115,681 shares) | | $12.07 |
| Service Class 2: | | |
| Net Asset Value, offering price and redemption price per share ($307,782,780 ÷ 25,572,934 shares) | | $12.04 |
See accompanying notes which are an integral part of the financial statements.
Statement of Operations
| | | Six months ended June 30, 2018 (Unaudited) |
| Investment Income | | |
| Dividends: | | |
| Unaffiliated issuers | | $544,166 |
| Affiliated issuers | | 1,288,612 |
| Income from Fidelity Central Funds | | 38,371 |
| Total income | | 1,871,149 |
| Expenses | | |
| Management fee | $454,604 | |
| Transfer agent fees | 33,590 | |
| Distribution and service plan fees | 375,945 | |
| Independent trustees' fees and expenses | 645 | |
| Miscellaneous | 417 | |
| Total expenses before reductions | 865,201 | |
| Expense reductions | (239,452) | |
| Total expenses after reductions | | 625,749 |
| Net investment income (loss) | | 1,245,400 |
| Realized and Unrealized Gain (Loss) | | |
| Net realized gain (loss) on: | | |
| Investment securities: | | |
| Unaffiliated issuers | 222,682 | |
| Affiliated issuers | 389,887 | |
| Capital gain distributions from underlying funds: | | |
| Affiliated issuers | 3,725,910 | |
| Total net realized gain (loss) | | 4,338,479 |
| Change in net unrealized appreciation (depreciation) on: | | |
| Investment securities: | | |
| Unaffiliated issuers | (813,254) | |
| Fidelity Central Funds | (1) | |
| Other affiliated issuers | (3,228,003) | |
| Total change in net unrealized appreciation (depreciation) | | (4,041,258) |
| Net gain (loss) | | 297,221 |
| Net increase (decrease) in net assets resulting from operations | | $1,542,621 |
See accompanying notes which are an integral part of the financial statements.
Statement of Changes in Net Assets
| | Six months ended June 30, 2018 (Unaudited) | Year ended December 31, 2017 |
| Increase (Decrease) in Net Assets | | |
| Operations | | |
| Net investment income (loss) | $1,245,400 | $3,321,049 |
| Net realized gain (loss) | 4,338,479 | 25,115,499 |
| Change in net unrealized appreciation (depreciation) | (4,041,258) | 10,079,993 |
| Net increase (decrease) in net assets resulting from operations | 1,542,621 | 38,516,541 |
| Distributions to shareholders from net investment income | (123,196) | (3,201,834) |
| Distributions to shareholders from net realized gain | (3,252,398) | (17,462,503) |
| Total distributions | (3,375,594) | (20,664,337) |
| Share transactions - net increase (decrease) | 13,712,157 | 56,380,347 |
| Total increase (decrease) in net assets | 11,879,184 | 74,232,551 |
| Net Assets | | |
| Beginning of period | 297,300,344 | 223,067,793 |
| End of period | $309,179,528 | $297,300,344 |
| Other Information | | |
| Undistributed net investment income end of period | $1,241,421 | $119,217 |
See accompanying notes which are an integral part of the financial statements.
Financial Highlights
VIP Target Volatility Portfolio Service Class
| | Six months ended (Unaudited) June 30, | Years endedDecember 31, | | | | |
| | 2018 | 2017 | 2016 | 2015 | 2014 | 2013 A |
| Selected Per–Share Data | | | | | | |
| Net asset value, beginning of period | $12.14 | $11.22 | $10.87 | $11.34 | $11.19 | $10.00 |
| Income from Investment Operations | | | | | | |
| Net investment income (loss)B | .06 | .17 | .15 | .16 | .17 | .19 |
| Net realized and unrealized gain (loss) | .01 | 1.67 | .42 | (.29) | .49 | 1.26 |
| Total from investment operations | .07 | 1.84 | .57 | (.13) | .66 | 1.45 |
| Distributions from net investment income | (.01) | (.16) | (.16)C | (.13) | (.13) | (.07) |
| Distributions from net realized gain | (.13) | (.76) | (.07)C | (.21) | (.38) | (.18) |
| Total distributions | (.14) | (.92) | (.22)D | (.34) | (.51) | (.26)E |
| Net asset value, end of period | $12.07 | $12.14 | $11.22 | $10.87 | $11.34 | $11.19 |
| Total ReturnF,G,H | .58% | 16.39% | 5.30% | (1.22)% | 5.94% | 14.46% |
| Ratios to Average Net AssetsI,J | | | | | | |
| Expenses before reductions | .42%K | .42% | .42% | .42% | .41% | .42%K |
| Expenses net of fee waivers, if any | .27%K | .27% | .27% | .27% | .26% | .26%K |
| Expenses net of all reductions | .26%K | .27% | .26% | .26% | .26% | .26%K |
| Net investment income (loss) | .97%K | 1.43% | 1.38% | 1.39% | 1.49% | 1.98%K |
| Supplemental Data | | | | | | |
| Net assets, end of period (000 omitted) | $1,397 | $1,444 | $1,477 | $2,143 | $2,880 | $2,802 |
| Portfolio turnover rateL | 35%K | 91% | 91% | 119% | 80% | 91%K |
A For the period February 13, 2013 (commencement of operations) to December 31, 2013.
B Calculated based on average shares outstanding during the period.
C The amounts shown reflect certain reclassifications related to book to tax differences that were made in the year shown.
D Total distributions of $.22 per share is comprised of distributions from net investment income of $.156 and distributions from net realized gain of $.065 per share.
E Total distributions of $.26 per share is comprised of distributions from net investment income of $.072 and distributions from net realized gain of $.183 per share.
F Total returns for periods of less than one year are not annualized.
G Total returns do not reflect charges attributable to your insurance company's separate account. Inclusion of these charges would reduce the total returns shown.
H Total returns would have been lower if certain expenses had not been reduced during the applicable periods shown.
I Fees and expenses of any underlying Fidelity Central Funds are not included in the Fund's expense ratio. The Fund indirectly bears its proportionate share of the expenses of any underlying Fidelity Central Funds.
J Expense ratios reflect operating expenses of the class. Expenses before reductions do not reflect amounts reimbursed by the investment adviser or reductions from brokerage service arrangements or reductions from other expense offset arrangements and do not represent the amount paid by the class during periods when reimbursements or reductions occur. Expense ratios before reductions for start-up periods may not be representative of longer-term operating periods. Expenses net of fee waivers reflect expenses after reimbursement by the investment adviser but prior to reductions from brokerage service arrangements or other expense offset arrangements. Expenses net of all reductions represent the net expenses paid by the class.
K Annualized
L Amount does not include the portfolio activity of any underlying Fidelity Central Funds.
See accompanying notes which are an integral part of the financial statements.
VIP Target Volatility Portfolio Service Class 2
| | Six months ended (Unaudited) June 30, | Years endedDecember 31, | | | | |
| | 2018 | 2017 | 2016 | 2015 | 2014 | 2013 A |
| Selected Per–Share Data | | | | | | |
| Net asset value, beginning of period | $12.11 | $11.19 | $10.85 | $11.32 | $11.18 | $10.00 |
| Income from Investment Operations | | | | | | |
| Net investment income (loss)B | .05 | .16 | .13 | .14 | .15 | .17 |
| Net realized and unrealized gain (loss) | .02 | 1.66 | .41 | (.28) | .49 | 1.26 |
| Total from investment operations | .07 | 1.82 | .54 | (.14) | .64 | 1.43 |
| Distributions from net investment income | (.01) | (.14) | (.14)C | (.11) | (.12) | (.07) |
| Distributions from net realized gain | (.13) | (.76) | (.07)C | (.21) | (.38) | (.18) |
| Total distributions | (.14) | (.90) | (.20)D | (.33)E | (.50) | (.25) |
| Net asset value, end of period | $12.04 | $12.11 | $11.19 | $10.85 | $11.32 | $11.18 |
| Total ReturnF,G,H | .58% | 16.29% | 5.06% | (1.34)% | 5.74% | 14.32% |
| Ratios to Average Net AssetsI,J | | | | | | |
| Expenses before reductions | .57%K | .57% | .57% | .57% | .56% | .56%K |
| Expenses net of fee waivers, if any | .42%K | .42% | .42% | .42% | .41% | .41%K |
| Expenses net of all reductions | .41%K | .42% | .41% | .41% | .41% | .40%K |
| Net investment income (loss) | .82%K | 1.28% | 1.22% | 1.24% | 1.34% | 1.83%K |
| Supplemental Data | | | | | | |
| Net assets, end of period (000 omitted) | $307,783 | $295,856 | $221,591 | $209,108 | $131,419 | $60,451 |
| Portfolio turnover rateL | 35%K | 91% | 91% | 119% | 80% | 91%K |
A For the period February 13, 2013 (commencement of operations) to December 31, 2013.
B Calculated based on average shares outstanding during the period.
C The amounts shown reflect certain reclassifications related to book to tax differences that were made in the year shown.
D Total distributions of $.20 per share is comprised of distributions from net investment income of $.139 and distributions from net realized gain of $.065 per share.
E Total distributions of $.33 per share is comprised of distributions from net investment income of $.114 and distributions from net realized gain of $.212 per share.
F Total returns for periods of less than one year are not annualized.
G Total returns do not reflect charges attributable to your insurance company's separate account. Inclusion of these charges would reduce the total returns shown.
H Total returns would have been lower if certain expenses had not been reduced during the applicable periods shown.
I Fees and expenses of any underlying Fidelity Central Funds are not included in the Fund's expense ratio. The Fund indirectly bears its proportionate share of the expenses of any underlying Fidelity Central Funds.
J Expense ratios reflect operating expenses of the class. Expenses before reductions do not reflect amounts reimbursed by the investment adviser or reductions from brokerage service arrangements or reductions from other expense offset arrangements and do not represent the amount paid by the class during periods when reimbursements or reductions occur. Expense ratios before reductions for start-up periods may not be representative of longer-term operating periods. Expenses net of fee waivers reflect expenses after reimbursement by the investment adviser but prior to reductions from brokerage service arrangements or other expense offset arrangements. Expenses net of all reductions represent the net expenses paid by the class.
K Annualized
L Amount does not include the portfolio activity of any underlying Fidelity Central Funds.
See accompanying notes which are an integral part of the financial statements.
Notes to Financial Statements (Unaudited)
For the period ended June 30, 2018
1. Organization.
VIP Target Volatility Portfolio (the Fund) is a fund of Variable Insurance Products Fund V (the Trust) and is authorized to issue an unlimited number of shares. The Trust is registered under the Investment Company Act of 1940, as amended (the 1940 Act), as an open-end management investment company organized as a Massachusetts business trust. Shares of the Fund may only be purchased by insurance companies for the purpose of funding variable annuity or variable life insurance contracts. The Fund offers the following classes of shares: Service Class shares and Service Class 2 shares. All classes have equal rights and voting privileges, except for matters affecting a single class.
2. Investments in Fidelity Central Funds.
The Fund invests in Fidelity Central Funds, which are open-end investment companies generally available only to other investment companies and accounts managed by the investment adviser and its affiliates. The Fund's Schedule of Investments lists each of the Fidelity Central Funds held as of period end, if any, as an investment of the Fund, but does not include the underlying holdings of each Fidelity Central Fund. As an Investing Fund, the Fund indirectly bears its proportionate share of the expenses of the underlying Fidelity Central Funds.
The Money Market Central Funds seek preservation of capital and current income and are managed by Fidelity Investments Money Management, Inc. (FIMM), an affiliate of the investment adviser. Annualized expenses of the Money Market Central Funds as of their most recent shareholder report date are less than .005%.
A complete unaudited list of holdings for each Fidelity Central Fund is available upon request or at the Securities and Exchange Commission (the SEC) website at www.sec.gov. In addition, the financial statements of the Fidelity Central Funds are available on the SEC website or upon request.
3. Significant Accounting Policies.
The Fund is an investment company and applies the accounting and reporting guidance of the Financial Accounting Standards Board (FASB) Accounting Standards Codification Topic 946 Financial Services – Investments Companies. The financial statements have been prepared in conformity with accounting principles generally accepted in the United States of America (GAAP), which require management to make certain estimates and assumptions at the date of the financial statements. Actual results could differ from those estimates. Subsequent events, if any, through the date that the financial statements were issued have been evaluated in the preparation of the financial statements. The Fund's Schedule of Investments lists each of the Underlying Funds as an investment of the Fund but does not include the underlying holdings of each Underlying Fund. The following summarizes the significant accounting policies of the Fund:
Investment Valuation. Investments are valued as of 4:00 p.m. Eastern time on the last calendar day of the period. The Fund uses a third party pricing vendor approved by the Board of Trustees (the Board) to value its investments. The Board of Trustees (the Board) has delegated the day to day responsibility for the valuation of the Fund's investments to the Fair Value Committee (the Committee) established by the Fund's investment adviser. In accordance with valuation policies and procedures approved by the Board, the Fund attempts to obtain prices from one or more third party pricing vendors or brokers to value its investments. When current market prices, quotations or currency exchange rates are not readily available or reliable, investments will be fair valued in good faith by the Committee, in accordance with procedures adopted by the Board. Factors used in determining fair value vary by investment type and may include market or investment specific events. The frequency with which these procedures are used cannot be predicted and they may be utilized to a significant extent. The Committee oversees the Fund's valuation policies and procedures and reports to the Board on the Committee's activities and fair value determinations. The Board monitors the appropriateness of the procedures used in valuing the Fund's investments and ratifies the fair value determinations of the Committee. The Fund categorizes the inputs to valuation techniques used to value its investments into a disclosure hierarchy consisting of three levels as shown below:
- Level 1 – quoted prices in active markets for identical investments
- Level 2 – other significant observable inputs (including quoted prices for similar investments, interest rates, prepayment speeds, etc.)
- Level 3 – unobservable inputs (including the Fund's own assumptions based on the best information available)
Valuation techniques used to value the Fund's investments by major category are as follows. Investments in open-end mutual funds are valued at their closing net asset value (NAV) each business day and are categorized as Level 1 in the hierarchy. If an unaffiliated open-end mutual fund's NAV is unavailable, shares of that fund may be valued by another method that the Board believes reflects fair value in accordance with the Board's fair value pricing policies and is categorized as Level 2 in the hierarchy. Exchange-Traded Funds (ETFs) are valued at their last sale price or official closing price as reported by a third party pricing vendor on the primary market or exchange on which they are traded and are categorized as Level 1 in the hierarchy. In the event there were no sales during the day but the exchange reports a closing bid level, ETFs are valued at the closing bid and would be categorized as Level 1 in the hierarchy. In the event there was no closing bid, ETFs may be valued by another method that the Board believes reflects fair value in accordance with the Board's fair value pricing policies and may be categorized as Level 2 in the hierarchy.
Investment Transactions and Income. For financial reporting purposes, the Fund's investment holdings and NAV include trades executed through the end of the last business day of the period. The NAV per share for processing shareholder transactions is calculated as of the close of business of the New York Stock Exchange (NYSE), normally 4:00 p.m. Eastern time and includes trades executed through the end of the prior business day. Gains and losses on securities sold are determined on the basis of identified cost. Income and capital gain distributions from the Underlying Funds, if any, are recorded on the ex-dividend date. Interest income is accrued as earned. Interest income includes coupon interest and amortization of premium and accretion of discount on debt securities as applicable.
Class Allocations and Expenses. Investment income, realized and unrealized capital gains and losses, common expenses of the Fund, and certain fund-level expense reductions, if any, are allocated daily on a pro-rata basis to each class based on the relative net assets of each class to the total net assets of the Fund. Each class differs with respect to transfer agent and distribution and service plan fees incurred. Certain expense reductions may also differ by class. For the reporting period, the allocated portion of income and expenses to each class as a percent of its average net assets may vary due to the timing of recording these transactions in relation to fluctuating net assets of the classes. Expenses directly attributable to a fund are charged to that fund. Expenses attributable to more than one fund are allocated among the respective funds on the basis of relative net assets or other appropriate methods. Expenses included in the accompanying financial statements reflect the expenses of the Fund and do not include any expenses associated with the Underlying Funds. Although not included in the Fund's expenses, the Fund indirectly bears its proportionate share of the Underlying Funds' expenses through the impact of these expenses on each Underlying Fund's NAV. Expense estimates are accrued in the period to which they relate and adjustments are made when actual amounts are known.
Income Tax Information and Distributions to Shareholders. Each year, the Fund intends to qualify as a regulated investment company under Subchapter M of the Internal Revenue Code, including distributing substantially all of its taxable income and realized gains. As a result, no provision for U.S. Federal income taxes is required. The Fund files a U.S. federal tax return, in addition to state and local tax returns as required. The Fund's federal income tax returns are subject to examination by the Internal Revenue Service (IRS) for a period of three fiscal years after they are filed. State and local tax returns may be subject to examination for an additional fiscal year depending on the jurisdiction.
Distributions are declared and recorded on the ex-dividend date. Income and capital gain distributions are declared separately for each class. Income and capital gain distributions are determined in accordance with income tax regulations, which may differ from GAAP.
Capital accounts within the financial statements are adjusted for permanent book-tax differences. These adjustments have no impact on net assets or the results of operations. Capital accounts are not adjusted for temporary book-tax differences which will reverse in a subsequent period.
Book-tax differences are primarily due to the short-term gain distributions from the Underlying Funds, futures contracts, market discount, partnerships, capital loss carryforwards and losses deferred due to wash sales.
As of period end, the cost and unrealized appreciation (depreciation) in securities, and derivatives if applicable, for federal income tax purposes were as follows:
| Gross unrealized appreciation | $17,204,930 |
| Gross unrealized depreciation | (5,548,209) |
| Net unrealized appreciation (depreciation) | $11,656,721 |
| Tax cost | $297,629,405 |
4. Purchases and Redemptions of Underlying Fund Shares.
Purchases and redemptions of the Underlying Fund shares, aggregated $67,298,291 and $52,042,640, respectively.
5. Fees and Other Transactions with Affiliates.
Management Fee. FMR Co., Inc. (the investment adviser), an affiliate of Fidelity Management & Research Company (FMR), provides the Fund with investment management related services. For these services the Fund pays a monthly management fee to the investment adviser. The management fee is computed at an annual rate of .30% of the Fund's average net assets.
During the period, the investment adviser waived a portion of its management fee as described in the expense reduction note.
Other Transactions. The investment adviser has entered into an administration agreement with FMR under which FMR provides management and administrative services (other than investment advisory services) necessary for the operation of the Fund. Pursuant to this agreement, FMR pays all expenses of the Fund, excluding distribution and service plan fees, transfer agent fees, compensation of the independent Trustees and certain other expenses such as interest expense. FMR also contracts with other Fidelity companies to perform the services necessary for the operation of the Fund.
Distribution and Service Plan Fees. In accordance with Rule 12b-1 of the 1940 Act, the Fund has adopted separate 12b-1 Plans for each Service Class of shares. Each Service Class pays Fidelity Distributors Corporation (FDC), an affiliate of the investment adviser, a service fee. For the period, the service fee is based on an annual rate of .10% of Service Class' average net assets and .25% of Service Class 2's average net assets.
For the period, total fees, all of which were re-allowed to insurance companies for the distribution of shares and providing shareholder support services, were as follows:
| Service Class | $693 |
| Service Class 2 | 375,252 |
| | $375,945 |
Transfer Agent Fees. Fidelity Investments Institutional Operations Company, Inc. (FIIOC), an affiliate of the investment adviser, is the Fund's transfer, dividend disbursing, and shareholder servicing agent. FIIOC receives an asset-based fee with respect to each class. Each class pays a fee for transfer agent services, typesetting and printing and mailing of shareholder reports, excluding mailing of proxy statements, equal to an annual rate of .15% of class-level average net assets invested in Underlying Funds that are not managed by the investment adviser or its affiliates. For the period, transfer agent fees for each class were as follows:
| Service Class | $155 |
| Service Class 2 | 33,435 |
| | $33,590 |
Brokerage Commissions. The Fund placed a portion of its portfolio transactions with brokerage firms which are affiliates of the investment adviser. Brokerage commissions are included in net realized gain (loss) and change in net unrealized appreciation (depreciation) in the Statement of Operations. The commissions paid to these affiliated firms were $716 for the period.
6. Committed Line of Credit.
The Fund participates with other funds managed by the investment adviser or an affiliate in a $4.25 billion credit facility (the "line of credit") to be utilized for temporary or emergency purposes to fund shareholder redemptions or for other short-term liquidity purposes. The Fund has agreed to pay commitment fees on its pro-rata portion of the line of credit, which amounted to $417 and is reflected in Miscellaneous expenses on the Statement of Operations. During the period, the Fund did not borrow on this line of credit.
7. Expense Reductions.
The investment adviser contractually agreed to waive the Fund's management fee in an amount equal to .05% of the Funds' average net assets until April 30, 2019. During the period, the Fund's management fee was reduced by $76,825.
In addition, FMR has contractually agreed to reimburse .10% of class-level expenses for Service Class and Service Class 2. During the period, this reimbursement reduced the Fund's Service Class and Service Class 2's expenses by the following amounts:
| | Reimbursement |
| Service Class | $702 |
| Service Class 2 | 150,833 |
Commissions paid to certain brokers with whom the investment adviser, or its affiliates, places trades on behalf of the Fund include an amount in addition to trade execution, which may be rebated back to the Fund to offset certain expenses. This amount totaled $11,013 for the period.
In addition, through arrangements with the Fund's custodian, credits realized as a result of certain uninvested cash balances were used to reduce the Fund's expenses. During the period, these credits reduced the Fund's custody expenses by $79.
8. Distributions to Shareholders.
Distributions to shareholders of each class were as follows:
| | Six months ended
June 30, 2018 | Year ended
December 31, 2017 |
| From net investment income | | |
| Service Class | $578 | $18,515 |
| Service Class 2 | 122,618 | 3,183,319 |
| Total | $123,196 | $3,201,834 |
| From net realized gain | | |
| Service Class | $15,270 | $90,675 |
| Service Class 2 | 3,237,128 | 17,371,828 |
| Total | $3,252,398 | $17,462,503 |
9. Share Transactions.
Transactions for each class of shares were as follows:
| | Shares | Shares | Dollars | Dollars |
| | Six months ended June 30, 2018 | Year ended December 31, 2017 | Six months ended June 30, 2018 | Year ended December 31, 2017 |
| Service Class | | | | |
| Reinvestment of distributions | – | 229 | $– | $2,784 |
| Shares redeemed | (3,233) | (12,992) | (39,923) | (157,252) |
| Net increase (decrease) | (3,233) | (12,763) | $(39,923) | $(154,468) |
| Service Class 2 | | | | |
| Shares sold | 2,579,423 | 6,196,371 | $31,173,936 | $75,448,510 |
| Reinvestment of distributions | 286,179 | 1,695,969 | 3,359,746 | 20,555,147 |
| Shares redeemed | (1,718,192) | (3,265,117) | (20,781,602) | (39,468,842) |
| Net increase (decrease) | 1,147,410 | 4,627,223 | $13,752,080 | $56,534,815 |
10. Other.
The Fund's organizational documents provide former and current trustees and officers with a limited indemnification against liabilities arising in connection with the performance of their duties to the Fund. In the normal course of business, the Fund may also enter into contracts that provide general indemnifications. The Fund's maximum exposure under these arrangements is unknown as this would be dependent on future claims that may be made against the Fund. The risk of material loss from such claims is considered remote.
At the end of the period, one otherwise unaffiliated shareholder was the owner of record of 95% of the total outstanding shares of the Fund.
Shareholder Expense Example
As a shareholder of the Fund, you incur two types of costs: (1) transaction costs and (2) ongoing costs, including management fees, distribution and/or service (12b-1) fees and other Fund expenses. This Example is intended to help you understand your ongoing costs (in dollars) of investing in the Fund and to compare these costs with the ongoing costs of investing in other mutual funds.
The Example is based on an investment of $1,000 invested at the beginning of the period and held for the entire period (January 1, 2018 to June 30, 2018).
Actual Expenses
The first line of the accompanying table for each class of the Fund provides information about actual account values and actual expenses. You may use the information in this line, together with the amount you invested, to estimate the expenses that you paid over the period. Simply divide your account value by $1,000.00 (for example, an $8,600 account value divided by $1,000.00 = 8.6), then multiply the result by the number in the first line for a class of the Fund under the heading entitled "Expenses Paid During Period" to estimate the expenses you paid on your account during this period. The estimate of expenses does not include any fees or other expenses of any variable annuity or variable life insurance product. If they were, the estimate of expenses you paid during the period would be higher, and your ending account value would be lower. In addition, the Fund, as a shareholder in underlying mutual funds and exchange-traded funds (ETFs)(the Underlying Funds), will indirectly bear its pro-rata share of the fees and expenses incurred by the underlying Fidelity Funds. These fees and expenses are not included in the Fund's annualized expense ratio used to calculate the expense estimate in the table below.
Hypothetical Example for Comparison Purposes
The second line of the accompanying table for each class of the Fund provides information about hypothetical account values and hypothetical expenses based on a Class' actual expense ratio and an assumed rate of return of 5% per year before expenses, which is not the Class' actual return. The hypothetical account values and expenses may not be used to estimate the actual ending account balance or expenses you paid for the period. You may use this information to compare the ongoing costs of investing in the Fund and other funds. To do so, compare this 5% hypothetical example with the 5% hypothetical examples that appear in the shareholder reports of the other funds. The estimate of expenses does not include any fees or other expenses of any variable annuity or variable life insurance product. If they were, the estimate of expenses you paid during the period would be higher, and your ending account value would be lower. In addition, the Fund, as a shareholder in underlying mutual funds and exchange-traded funds (ETFs)(the Underlying Funds), will indirectly bear its pro-rata share of the fees and expenses incurred by the underlying Fidelity Funds. These fees and expenses are not included in the Fund's annualized expense ratio used to calculate the expense estimate in the table below.
Please note that the expenses shown in the table are meant to highlight your ongoing costs only and do not reflect any transaction costs. Therefore, the second line of the table is useful in comparing ongoing costs only, and will not help you determine the relative total costs of owning different funds.
| | Annualized Expense Ratio-A | Beginning
Account Value
January 1, 2018 | Ending
Account Value
June 30, 2018 | Expenses Paid
During Period-B
January 1, 2018
to June 30, 2018 |
| Service Class | .27% | | | |
| Actual | | $1,000.00 | $1,005.80 | $1.34 |
| Hypothetical-C | | $1,000.00 | $1,023.46 | $1.35 |
| Service Class 2 | .42% | | | |
| Actual | | $1,000.00 | $1,005.80 | $2.09 |
| Hypothetical-C | | $1,000.00 | $1,022.71 | $2.11 |
A Annualized expense ratio reflects expenses net of applicable fee waivers.
B Expenses are equal to each Class' annualized expense ratio, multiplied by the average account value over the period, multiplied by 181/365 (to reflect the one-half year period).
C 5% return per year before expenses
VIPTV-SANN-0818
1.955018.105
Fidelity® Variable Insurance Products: Bond Index Portfolio
Semi-Annual Report June 30, 2018 |
|
Contents
To view a fund's proxy voting guidelines and proxy voting record for the 12-month period ended June 30, visit http://www.fidelity.com/proxyvotingresults or visit the Securities and Exchange Commission's (SEC) web site at http://www.sec.gov.
You may also call 1-877-208-0098 to request a free copy of the proxy voting guidelines.
Fidelity® Variable Insurance Products are separate account options which are purchased through a variable insurance contract.
Standard & Poor's, S&P and S&P 500 are registered service marks of The McGraw-Hill Companies, Inc. and have been licensed for use by Fidelity Distributors Corporation.
Other third-party marks appearing herein are the property of their respective owners.
All other marks appearing herein are registered or unregistered trademarks or service marks of FMR LLC or an affiliated company. © 2018 FMR LLC. All rights reserved.
This report and the financial statements contained herein are submitted for the general information of the shareholders of the Fund. This report is not authorized for distribution to prospective investors in the Fund unless preceded or accompanied by an effective prospectus.
A fund files its complete schedule of portfolio holdings with the SEC for the first and third quarters of each fiscal year on Form N-Q. Forms N-Q are available on the SEC’s web site at http://www.sec.gov. A fund's Forms N-Q may be reviewed and copied at the SEC’s Public Reference Room in Washington, DC. Information regarding the operation of the SEC's Public Reference Room may be obtained by calling 1-800-SEC-0330.
For a complete list of a fund's portfolio holdings, view the most recent holdings listing, semiannual report, or annual report on Fidelity's web site at http://www.fidelity.com, http://www.institutional.fidelity.com, or http://www.401k.com, as applicable.
NOT FDIC INSURED •MAY LOSE VALUE •NO BANK GUARANTEE
Neither the Fund nor Fidelity Distributors Corporation is a bank.
Investment Summary (Unaudited)
Quality Diversification (% of fund's net assets)
| As of June 30, 2018 |
| | U.S. Government and U.S. Government Agency Obligations | 73.9% |
| | AAA | 2.1% |
| | AA | 2.2% |
| | A | 8.2% |
| | BBB | 12.2% |
| | BB and Below | 0.2% |
| | Short-Term Investments and Net Other Assets | 1.2% |

We have used ratings from Moody's Investors Service, Inc. Where Moody's® ratings are not available, we have used S&P® ratings. All ratings are as of the date indicated and do not reflect subsequent changes.
Asset Allocation (% of fund's net assets)
| As of June 30, 2018* |
| | Corporate Bonds | 21.9% |
| | U.S. Government and U.S. Government Agency Obligations | 73.9% |
| | CMOs and Other Mortgage Related Securities | 0.7% |
| | Municipal Bonds | 0.1% |
| | Other Investments | 2.2% |
| | Short-Term Investments and Net Other Assets (Liabilities) | 1.2% |

* Foreign investments - 5.9%
Percentages in the above tables are adjusted for the effect of TBA Sale Commitments.
Schedule of Investments June 30, 2018 (Unaudited)
Showing Percentage of Net Assets
| Nonconvertible Bonds - 21.9% | | | |
| | | Principal Amount | Value |
| CONSUMER DISCRETIONARY - 1.8% | | | |
| Automobiles - 0.4% | | | |
| Ford Motor Co. 5.291% 12/8/46 | | $30,000 | $27,828 |
| General Motors Co. 6.75% 4/1/46 | | 24,000 | 26,588 |
| General Motors Financial Co., Inc. 4.35% 4/9/25 | | 84,000 | 82,763 |
| | | | 137,179 |
| Diversified Consumer Services - 0.2% | | | |
| Ingersoll-Rand Global Holding Co. Ltd. 3.75% 8/21/28 | | 90,000 | 87,520 |
| Hotels, Restaurants & Leisure - 0.1% | | | |
| McDonald's Corp. 4.7% 12/9/35 | | 39,000 | 40,618 |
| Internet & Direct Marketing Retail - 0.1% | | | |
| Amazon.com, Inc. 4.05% 8/22/47 | | 44,000 | 43,028 |
| Media - 0.8% | | | |
| Charter Communications Operating LLC/Charter Communications Operating Capital Corp. 5.375% 4/1/38 | | 42,000 | 39,651 |
| Comcast Corp. 3.55% 5/1/28 | | 76,000 | 72,552 |
| Discovery Communications LLC 5.2% 9/20/47 | | 18,000 | 17,446 |
| Time Warner, Inc. 4.85% 7/15/45 | | 32,000 | 29,128 |
| Viacom, Inc. 3.45% 10/4/26 | | 70,000 | 64,083 |
| Walt Disney Co. 2.95% 6/15/27 | | 98,000 | 92,828 |
| | | | 315,688 |
| Multiline Retail - 0.1% | | | |
| Target Corp. 4% 7/1/42 | | 15,000 | 14,273 |
| Specialty Retail - 0.1% | | | |
| Home Depot, Inc. 3.9% 6/15/47 | | 29,000 | 27,753 |
| Lowe's Companies, Inc. 4.05% 5/3/47 | | 17,000 | 16,067 |
| | | | 43,820 |
|
| TOTAL CONSUMER DISCRETIONARY | | | 682,126 |
|
| CONSUMER STAPLES - 1.2% | | | |
| Beverages - 0.4% | | | |
| Anheuser-Busch InBev Worldwide, Inc.: | | | |
| 4% 4/13/28 | | 91,000 | 90,752 |
| 4.6% 4/15/48 | | 33,000 | 32,357 |
| Molson Coors Brewing Co. 4.2% 7/15/46 | | 32,000 | 28,707 |
| | | | 151,816 |
| Food & Staples Retailing - 0.2% | | | |
| Walmart, Inc.: | | | |
| 3.625% 12/15/47 | | 20,000 | 18,703 |
| 3.7% 6/26/28 | | 60,000 | 60,395 |
| | | | 79,098 |
| Food Products - 0.1% | | | |
| Kellogg Co. 4.5% 4/1/46 | | 32,000 | 30,265 |
| Household Products - 0.0% | | | |
| Procter & Gamble Co. 3.5% 10/25/47 | | 18,000 | 16,489 |
| Tobacco - 0.5% | | | |
| Altria Group, Inc. 2.625% 9/16/26 | | 110,000 | 100,133 |
| Philip Morris International, Inc. 3.125% 3/2/28 | | 94,000 | 88,712 |
| | | | 188,845 |
|
| TOTAL CONSUMER STAPLES | | | 466,513 |
|
| ENERGY - 2.6% | | | |
| Energy Equipment & Services - 0.1% | | | |
| Baker Hughes A Ge Co. LLC 4.08% 12/15/47 | | 32,000 | 28,573 |
| Oil, Gas & Consumable Fuels - 2.5% | | | |
| Anadarko Petroleum Corp. 6.6% 3/15/46 | | 21,000 | 25,221 |
| BP Capital Markets PLC 3.216% 11/28/23 | | 94,000 | 92,163 |
| Canadian Natural Resources Ltd. 4.95% 6/1/47 | | 19,000 | 19,595 |
| ConocoPhillips Co. 5.95% 3/15/46 | | 26,000 | 32,326 |
| Enbridge Energy Partners LP 5.875% 10/15/25 | | 76,000 | 82,686 |
| Energy Transfer Partners LP 6% 6/15/48 | | 7,000 | 6,978 |
| Enterprise Products Operating LP 3.95% 2/15/27 | | 85,000 | 84,101 |
| Kinder Morgan, Inc. 3.15% 1/15/23 | | 119,000 | 114,842 |
| Magellan Midstream Partners LP 5% 3/1/26 | | 72,000 | 75,804 |
| Marathon Petroleum Corp. 4.75% 9/15/44 | | 21,000 | 19,965 |
| MPLX LP 4.5% 4/15/38 | | 38,000 | 35,076 |
| Occidental Petroleum Corp. 4.2% 3/15/48 | | 16,000 | 15,926 |
| Petroleos Mexicanos: | | | |
| 4.25% 1/15/25 | | 280,000 | 261,800 |
| 6.35% 2/12/48 (a) | | 50,000 | 45,125 |
| Shell International Finance BV 4.375% 5/11/45 | | 33,000 | 33,799 |
| Suncor Energy, Inc. 4% 11/15/47 | | 19,000 | 17,730 |
| | | | 963,137 |
|
| TOTAL ENERGY | | | 991,710 |
|
| FINANCIALS - 6.5% | | | |
| Banks - 3.3% | | | |
| Bank of America Corp.: | | | |
| 3.95% 1/23/49 (b) | | 23,000 | 20,860 |
| 3.97% 3/5/29 (b) | | 125,000 | 122,980 |
| Barclays Bank PLC 2.65% 1/11/21 | | 200,000 | 195,684 |
| Citigroup, Inc. 3 month U.S. LIBOR + 1.151% 3.52% 10/27/28 (b)(c) | | 95,000 | 89,221 |
| Citizens Financial Group, Inc. 4.3% 12/3/25 | | 78,000 | 77,474 |
| HSBC Holdings PLC 2.95% 5/25/21 | | 200,000 | 197,225 |
| JPMorgan Chase & Co.: | | | |
| 4.005% 4/23/29 (b) | | 43,000 | 42,444 |
| 4.95% 6/1/45 | | 65,000 | 66,104 |
| Mitsubishi UFJ Financial Group, Inc. 3.777% 3/2/25 | | 84,000 | 83,687 |
| Rabobank Nederland New York Branch 3.125% 4/26/21 | | 250,000 | 249,024 |
| Santander Holdings U.S.A., Inc. 4.5% 7/17/25 | | 82,000 | 80,410 |
| Wells Fargo & Co. 4.75% 12/7/46 | | 45,000 | 43,511 |
| | | | 1,268,624 |
| Capital Markets - 1.2% | | | |
| Bank New York Mellon Corp. 3.85% 4/28/28 | | 27,000 | 27,259 |
| BlackRock, Inc. 3.375% 6/1/22 | | 37,000 | 37,276 |
| Brighthouse Financial, Inc. 4.7% 6/22/47 | | 28,000 | 23,060 |
| Goldman Sachs Group, Inc. 3.2% 2/23/23 | | 200,000 | 194,825 |
| Morgan Stanley 3 month U.S. LIBOR + 1.431% 4.45% 4/22/39 (b)(c) | | 90,000 | 88,014 |
| Thomson Reuters Corp. 3.35% 5/15/26 | | 76,000 | 70,287 |
| | | | 440,721 |
| Consumer Finance - 0.5% | | | |
| American Express Credit Corp. 3.3% 5/3/27 | | 30,000 | 28,898 |
| Capital One Financial Corp. 3.2% 1/30/23 | | 176,000 | 170,863 |
| | | | 199,761 |
| Diversified Financial Services - 0.8% | | | |
| Berkshire Hathaway, Inc. 4.5% 2/11/43 | | 33,000 | 34,250 |
| Broadcom Corp./Broadcom Cayman LP 3.125% 1/15/25 | | 82,000 | 76,054 |
| Goldman Sachs Group, Inc. 4.75% 10/21/45 | | 28,000 | 27,696 |
| KfW: | | | |
| 2.375% 12/29/22 | | 146,000 | 142,689 |
| 2.875% 4/3/28 | | 14,000 | 13,826 |
| | | | 294,515 |
| Insurance - 0.7% | | | |
| ACE INA Holdings, Inc. 2.3% 11/3/20 | | 210,000 | 205,821 |
| American International Group, Inc. 4.5% 7/16/44 | | 25,000 | 23,254 |
| MetLife, Inc. 4.05% 3/1/45 | | 18,000 | 16,704 |
| The Travelers Companies, Inc. 4% 5/30/47 | | 32,000 | 30,752 |
| | | | 276,531 |
|
| TOTAL FINANCIALS | | | 2,480,152 |
|
| HEALTH CARE - 2.9% | | | |
| Biotechnology - 0.3% | | | |
| AbbVie, Inc. 4.3% 5/14/36 | | 40,000 | 38,255 |
| Amgen, Inc. 4.4% 5/1/45 | | 32,000 | 30,609 |
| Gilead Sciences, Inc. 4% 9/1/36 | | 40,000 | 38,463 |
| | | | 107,327 |
| Health Care Equipment & Supplies - 0.3% | | | |
| Abbott Laboratories 4.9% 11/30/46 | | 20,000 | 21,399 |
| Becton, Dickinson & Co. 4.669% 6/6/47 | | 20,000 | 19,313 |
| Boston Scientific Corp. 4% 3/1/28 | | 50,000 | 48,744 |
| Medtronic, Inc. 4.625% 3/15/45 | | 28,000 | 29,657 |
| | | | 119,113 |
| Health Care Providers & Services - 1.2% | | | |
| Aetna, Inc. 2.8% 6/15/23 | | 110,000 | 104,865 |
| Anthem, Inc. 3.35% 12/1/24 | | 89,000 | 85,941 |
| Cardinal Health, Inc. 3.41% 6/15/27 | | 32,000 | 29,394 |
| CVS Health Corp. 4.3% 3/25/28 | | 94,000 | 92,686 |
| Express Scripts Holding Co. 4.5% 2/25/26 | | 74,000 | 73,438 |
| Kaiser Foundation Hospitals 4.15% 5/1/47 | | 30,000 | 30,353 |
| UnitedHealth Group, Inc. 3.75% 10/15/47 | | 30,000 | 27,550 |
| | | | 444,227 |
| Pharmaceuticals - 1.1% | | | |
| Actavis Funding SCS 3.8% 3/15/25 | | 61,000 | 59,216 |
| Johnson & Johnson 3.4% 1/15/38 | | 36,000 | 33,977 |
| Pfizer, Inc. 4% 12/15/36 | | 36,000 | 35,992 |
| Shire Acquisitions Investments Ireland DAC 3.2% 9/23/26 | | 110,000 | 100,767 |
| Zoetis, Inc. 3.45% 11/13/20 | | 206,000 | 206,613 |
| | | | 436,565 |
|
| TOTAL HEALTH CARE | | | 1,107,232 |
|
| INDUSTRIALS - 1.5% | | | |
| Aerospace & Defense - 0.3% | | | |
| Lockheed Martin Corp. 4.7% 5/15/46 | | 28,000 | 29,637 |
| Northrop Grumman Corp. 3.25% 1/15/28 | | 80,000 | 75,268 |
| United Technologies Corp. 4.05% 5/4/47 | | 18,000 | 16,459 |
| | | | 121,364 |
| Air Freight & Logistics - 0.2% | | | |
| United Parcel Service, Inc. 2.8% 11/15/24 | | 88,000 | 84,467 |
| Commercial Services & Supplies - 0.1% | | | |
| Republic Services, Inc. 3.95% 5/15/28 | | 28,000 | 27,610 |
| Industrial Conglomerates - 0.4% | | | |
| General Electric Co. 4.5% 3/11/44 | | 25,000 | 24,491 |
| Honeywell International, Inc. 3.812% 11/21/47 | | 20,000 | 19,564 |
| Roper Technologies, Inc. 2.8% 12/15/21 | | 108,000 | 105,465 |
| | | | 149,520 |
| Machinery - 0.1% | | | |
| John Deere Capital Corp. 2.8% 3/6/23 | | 64,000 | 62,427 |
| Road & Rail - 0.2% | | | |
| Norfolk Southern Corp. 4.15% 2/28/48 | | 38,000 | 36,522 |
| Union Pacific Corp. 3.6% 9/15/37 | | 38,000 | 34,835 |
| | | | 71,357 |
| Trading Companies & Distributors - 0.2% | | | |
| Air Lease Corp. 3.25% 3/1/25 | | 88,000 | 81,425 |
|
| TOTAL INDUSTRIALS | | | 598,170 |
|
| INFORMATION TECHNOLOGY - 1.7% | | | |
| Communications Equipment - 0.3% | | | |
| Cisco Systems, Inc. 2.2% 9/20/23 | | 130,000 | 122,623 |
| Electronic Equipment & Components - 0.1% | | | |
| Diamond 1 Finance Corp./Diamond 2 Finance Corp. 8.35% 7/15/46 (a) | | 24,000 | 28,886 |
| IT Services - 0.4% | | | |
| IBM Corp. 2.5% 1/27/22 | | 104,000 | 101,605 |
| Visa, Inc. 4.15% 12/14/35 | | 38,000 | 39,350 |
| | | | 140,955 |
| Semiconductors & Semiconductor Equipment - 0.1% | | | |
| Applied Materials, Inc. 4.35% 4/1/47 | | 28,000 | 27,962 |
| Intel Corp. 3.734% 12/8/47 | | 30,000 | 28,239 |
| | | | 56,201 |
| Software - 0.5% | | | |
| Microsoft Corp.: | | | |
| 4.1% 2/6/37 | | 63,000 | 65,595 |
| 4.25% 2/6/47 | | 34,000 | 36,035 |
| Oracle Corp. 3.25% 11/15/27 | | 96,000 | 91,806 |
| | | | 193,436 |
| Technology Hardware, Storage & Peripherals - 0.3% | | | |
| Apple, Inc.: | | | |
| 3% 11/13/27 | | 96,000 | 91,186 |
| 3.75% 11/13/47 | | 32,000 | 30,027 |
| | | | 121,213 |
|
| TOTAL INFORMATION TECHNOLOGY | | | 663,314 |
|
| MATERIALS - 0.7% | | | |
| Chemicals - 0.4% | | | |
| LYB International Finance II BV 3.5% 3/2/27 | | 104,000 | 97,498 |
| The Dow Chemical Co. 3.5% 10/1/24 | | 64,000 | 62,304 |
| | | | 159,802 |
| Containers & Packaging - 0.1% | | | |
| International Paper Co. 3% 2/15/27 | | 51,000 | 46,148 |
| Metals & Mining - 0.2% | | | |
| BHP Billiton Financial (U.S.A.) Ltd. 5% 9/30/43 | | 36,000 | 40,361 |
| Southern Copper Corp. 5.875% 4/23/45 | | 30,000 | 31,901 |
| | | | 72,262 |
|
| TOTAL MATERIALS | | | 278,212 |
|
| REAL ESTATE - 0.5% | | | |
| Equity Real Estate Investment Trusts (REITs) - 0.1% | | | |
| Simon Property Group LP 3.375% 12/1/27 | | 36,000 | 34,238 |
| Real Estate Management & Development - 0.4% | | | |
| Ventas Realty LP/Ventas Capital Corp. 3.25% 8/15/22 | | 161,000 | 157,851 |
|
| TOTAL REAL ESTATE | | | 192,089 |
|
| TELECOMMUNICATION SERVICES - 0.6% | | | |
| Diversified Telecommunication Services - 0.6% | | | |
| AT&T, Inc. 4.9% 8/15/37 (a) | | 100,000 | 94,834 |
| Verizon Communications, Inc.: | | | |
| 4.329% 9/21/28 (a) | | 63,000 | 62,437 |
| 5.012% 8/21/54 | | 38,000 | 35,677 |
| 5.5% 3/16/47 | | 30,000 | 31,412 |
| | | | 224,360 |
| UTILITIES - 1.9% | | | |
| Electric Utilities - 1.3% | | | |
| Appalachian Power Co. 4.45% 6/1/45 | | 18,000 | 18,493 |
| Commonwealth Edison Co. 4% 3/1/48 | | 42,000 | 41,048 |
| Duke Energy Carolinas LLC 3.95% 3/15/48 | | 31,000 | 30,059 |
| Duke Energy Corp. 3.15% 8/15/27 | | 84,000 | 77,939 |
| Entergy Corp. 4% 7/15/22 | | 130,000 | 131,581 |
| Florida Power & Light Co. 4.125% 6/1/48 | | 26,000 | 26,257 |
| Mid-American Energy Co. 3.65% 8/1/48 | | 30,000 | 27,859 |
| PPL Capital Funding, Inc. 4% 9/15/47 | | 20,000 | 18,270 |
| Southern Co. 3.25% 7/1/26 | | 112,000 | 105,095 |
| | | | 476,601 |
| Multi-Utilities - 0.6% | | | |
| Consolidated Edison, Inc. 2% 5/15/21 | | 176,000 | 169,819 |
| Dominion Resources, Inc. 4.7% 12/1/44 | | 26,000 | 26,178 |
| NiSource Finance Corp. 3.95% 3/30/48 | | 46,000 | 42,502 |
| | | | 238,499 |
|
| TOTAL UTILITIES | | | 715,100 |
|
| TOTAL NONCONVERTIBLE BONDS | | | |
| (Cost $8,494,986) | | | 8,398,978 |
|
| U.S. Government and Government Agency Obligations - 46.8% | | | |
| U.S. Government Agency Obligations - 1.6% | | | |
| Fannie Mae 2.125% 4/24/26 | | 170,000 | 159,196 |
| Federal Home Loan Bank 1.875% 11/29/21 | | 285,000 | 277,493 |
| Freddie Mac 1.875% 11/17/20 | | 157,000 | 154,099 |
| Tennessee Valley Authority 4.25% 9/15/65 | | 30,000 | 33,945 |
|
| TOTAL U.S. GOVERNMENT AGENCY OBLIGATIONS | | | 624,733 |
|
| U.S. Treasury Obligations - 45.2% | | | |
| U.S. Treasury Bonds: | | | |
| 2.5% 2/15/46 | | $54,000 | $49,045 |
| 2.75% 8/15/42 | | 240,000 | 230,616 |
| 2.75% 11/15/42 | | 29,000 | 27,852 |
| 2.75% 11/15/47 | | 273,000 | 260,214 |
| 3% 11/15/44 | | 33,000 | 33,086 |
| 3% 5/15/45 | | 228,000 | 228,668 |
| 3% 2/15/48 | | 109,000 | 109,255 |
| 3.125% 11/15/41 | | 44,000 | 45,155 |
| 3.125% 2/15/42 | | 17,000 | 17,442 |
| 3.125% 5/15/48 | | 78,000 | 80,093 |
| 3.625% 8/15/43 | | 196,000 | 218,180 |
| 3.75% 11/15/43 | | 556,000 | 631,277 |
| 4.375% 2/15/38 | | 277,000 | 337,312 |
| 4.5% 5/15/38 | | 173,000 | 214,256 |
| 4.75% 2/15/41 | | 331,000 | 428,516 |
| 5.5% 8/15/28 | | 21,000 | 25,837 |
| 7.125% 2/15/23 | | 175,000 | 208,202 |
| 7.25% 8/15/22 | | 637,000 | 749,769 |
| 8.125% 8/15/19 | | 941,000 | 999,886 |
| 8.75% 8/15/20 | | 841,000 | 947,669 |
| U.S. Treasury Notes: | | | |
| 1% 10/15/19 | | 233,000 | 228,759 |
| 1.375% 9/30/19 | | 288,000 | 284,276 |
| 1.375% 4/30/20 | | 270,000 | 264,473 |
| 1.375% 10/31/20 | | 380,000 | 369,624 |
| 1.5% 8/15/26 | | 825,000 | 744,853 |
| 1.625% 8/31/22 | | 823,000 | 787,990 |
| 1.75% 2/28/22 | | 539,000 | 521,419 |
| 1.875% 5/31/22 | | 705,000 | 683,575 |
| 2% 2/28/21 | | 453,000 | 445,904 |
| 2% 10/31/22 | | 243,000 | 235,900 |
| 2% 2/15/25 | | 736,000 | 699,804 |
| 2% 11/15/26 | | 349,000 | 326,956 |
| 2.125% 6/30/22 | | 682,000 | 667,108 |
| 2.125% 5/15/25 | | 46,000 | 44,011 |
| 2.25% 2/29/20 | | 134,000 | 133,445 |
| 2.25% 3/31/20 | | 57,000 | 56,739 |
| 2.375% 4/30/20 | | 280,000 | 279,256 |
| 2.375% 3/15/21 | | 78,000 | 77,522 |
| 2.375% 4/15/21 | | 400,000 | 397,406 |
| 2.375% 1/31/23 | | 528,000 | 519,998 |
| 2.375% 5/15/27 | | 89,000 | 85,676 |
| 2.5% 5/31/20 | | 431,000 | 430,781 |
| 2.5% 8/15/23 | | 57,000 | 56,323 |
| 2.625% 6/15/21 | | 190,000 | 190,007 |
| 2.625% 2/28/23 | | 417,000 | 415,208 |
| 2.75% 4/30/23 | | 120,000 | 120,080 |
| 2.75% 5/31/23 | | 432,000 | 432,388 |
| 2.875% 5/31/25 | | 340,000 | 341,235 |
| 2.875% 5/15/28 | | 100,000 | 100,156 |
| 3.375% 11/15/19 | | 629,000 | 636,543 |
| 3.625% 2/15/20 | | 872,000 | 887,430 |
|
| TOTAL U.S. TREASURY OBLIGATIONS | | | 17,307,175 |
|
| TOTAL U.S. GOVERNMENT AND GOVERNMENT AGENCY OBLIGATIONS | | | |
| (Cost $17,899,360) | | | 17,931,908 |
|
| U.S. Government Agency - Mortgage Securities - 28.1% | | | |
| Fannie Mae - 20.2% | | | |
| 2.5% 11/1/32 to 2/1/47 | | 495,747 | 478,931 |
| 2.5% 7/1/33 (d) | | 100,000 | 97,202 |
| 2.5% 7/1/33 (d) | | 100,000 | 97,202 |
| 3% 1/1/33 to 3/1/48 | | 1,492,719 | 1,456,781 |
| 3% 7/1/33 (d) | | 100,000 | 99,398 |
| 3% 7/1/48 (d) | | 100,000 | 96,841 |
| 3% 7/1/48 (d) | | 100,000 | 96,841 |
| 3% 7/1/48 (d) | | 100,000 | 96,841 |
| 3% 7/1/48 (d) | | 200,000 | 193,682 |
| 3.5% 7/1/33 (d) | | 100,000 | 101,175 |
| 3.5% 7/1/33 (d) | | 100,000 | 101,175 |
| 3.5% 7/1/48 | | 1,400,000 | 1,393,829 |
| 3.5% 7/1/48 (d) | | 100,000 | 99,505 |
| 3.5% 7/1/48 (d) | | 100,000 | 99,505 |
| 3.5% 7/1/48 (d) | | 200,000 | 199,009 |
| 3.5% 7/1/48 (d) | | 300,000 | 298,514 |
| 4% 5/1/33 to 5/1/48 | | 1,189,713 | 1,214,698 |
| 4% 7/1/48 (d) | | 100,000 | 101,944 |
| 4% 7/1/48 (d) | | 100,000 | 101,944 |
| 4% 7/1/48 (d) | | 100,000 | 101,944 |
| 4% 7/1/48 (d) | | 200,000 | 203,888 |
| 4.5% 7/1/48 (d) | | 200,000 | 208,238 |
| 4.5% 7/1/48 (d) | | 100,000 | 104,119 |
| 4.5% 7/1/48 (d) | | 100,000 | 104,119 |
| 4.5% 7/1/48 (d) | | 100,000 | 104,119 |
| 4.5% 8/1/48 (d) | | 200,000 | 207,894 |
| 5% 7/1/48 (d) | | 100,000 | 105,935 |
| 5.5% 5/1/44 | | 90,457 | 98,345 |
| 5.5% 7/1/48 (d) | | 100,000 | 107,170 |
|
| TOTAL FANNIE MAE | | | 7,770,788 |
|
| Freddie Mac - 0.3% | | | |
| 5% 4/1/48 | | 97,668 | 103,426 |
| Ginnie Mae - 7.6% | | | |
| 3% 2/20/48 | | 597,719 | 585,020 |
| 3% 7/1/48 (d) | | 100,000 | 97,797 |
| 3% 7/1/48 (d) | | 100,000 | 97,797 |
| 3.5% 2/20/48 | | 399,999 | 401,740 |
| 3.5% 7/1/48 (d) | | 400,000 | 401,335 |
| 3.5% 7/1/48 (d) | | 100,000 | 100,334 |
| 3.5% 7/1/48 (d) | | 100,000 | 100,334 |
| 3.5% 7/1/48 (d) | | 100,000 | 100,334 |
| 3.5% 7/1/48 (d) | | 100,000 | 100,334 |
| 4% 11/20/47 to 3/20/48 | | 397,622 | 407,950 |
| 4% 7/1/48 (d) | | 100,000 | 102,461 |
| 4% 7/1/48 (d) | | 100,000 | 102,461 |
| 4.5% 1/20/47 | | 48,989 | 51,096 |
| 4.5% 7/1/48 (d) | | 50,000 | 51,963 |
| 4.5% 7/1/48 (d) | | 100,000 | 103,926 |
| 5% 11/20/47 | | 97,096 | 102,313 |
|
| TOTAL GINNIE MAE | | | 2,907,195 |
|
| TOTAL U.S. GOVERNMENT AGENCY - MORTGAGE SECURITIES | | | |
| (Cost $10,757,969) | | | 10,781,409 |
|
| Commercial Mortgage Securities - 0.7% | | | |
| Citigroup Commercial Mortgage Trust sequential payer: | | | |
| Series 2015-GC29 Class A4, 3.192% 4/10/48 | | $80,000 | $78,346 |
| Series 2016-C1 Class A4, 3.209% 5/10/49 | | 90,000 | 87,470 |
| GS Mortgage Securities Trust sequential payer Series 2014-GC26 Class A4, 3.364% 11/10/47 | | 110,000 | 108,902 |
| TOTAL COMMERCIAL MORTGAGE SECURITIES | | | |
| (Cost $274,758) | | | 274,718 |
|
| Municipal Securities - 0.1% | | | |
| California Gen. Oblig. 7.55% 4/1/39 | | | |
| (Cost $37,100) | | 25,000 | 36,866 |
|
| Foreign Government and Government Agency Obligations - 1.9% | | | |
| Canadian Government 2% 11/15/22 | | $120,000 | $115,873 |
| Colombian Republic 11.75% 2/25/20 | | 260,000 | 295,100 |
| Ontario Province 2.5% 4/27/26 | | 40,000 | 37,926 |
| Polish Government 3.25% 4/6/26 | | 73,000 | 70,445 |
| Province of Quebec: | | | |
| 2.375% 1/31/22 | | 25,000 | 24,441 |
| 2.75% 4/12/27 | | 25,000 | 24,048 |
| United Mexican States 4% 10/2/23 | | 160,000 | 160,480 |
| TOTAL FOREIGN GOVERNMENT AND GOVERNMENT AGENCY OBLIGATIONS | | | |
| (Cost $729,644) | | | 728,313 |
|
| Supranational Obligations - 0.3% | | | |
| Inter-American Development Bank 4.375% 1/24/44 | | 39,000 | 46,588 |
| International Bank for Reconstruction & Development 2.5% 11/22/27 | | 92,000 | 88,036 |
| TOTAL SUPRANATIONAL OBLIGATIONS | | | |
| (Cost $134,274) | | | 134,624 |
| | | Shares | Value |
|
| Money Market Funds - 12.2% | | | |
| Fidelity Cash Central Fund, 1.93% (e) | | | |
| (Cost $4,665,119) | | 4,664,186 | 4,665,119 |
| TOTAL INVESTMENT IN SECURITIES - 112.0% | | | |
| (Cost $42,993,210) | | | 42,951,935 |
| NET OTHER ASSETS (LIABILITIES) - (12.0)% | | | (4,603,083) |
| NET ASSETS - 100% | | | $38,348,852 |
| TBA Sale Commitments | | |
| | Principal Amount | Value |
| Fannie Mae | | |
| 4% 7/1/48 | $(200,000) | $(203,888) |
| 4.5% 7/1/48 | (200,000) | (208,238) |
| TOTAL TBA SALE COMMITMENTS | | |
| (Proceeds $410,777) | | $(412,126) |
Legend
(a) Security exempt from registration under Rule 144A of the Securities Act of 1933. These securities may be resold in transactions exempt from registration, normally to qualified institutional buyers. At the end of the period, the value of these securities amounted to $231,282 or 0.6% of net assets.
(b) Coupon rates for floating and adjustable rate securities reflect the rates in effect at period end.
(c) Coupon is indexed to a floating interest rate which may be multiplied by a specified factor and/or subject to caps or floors.
(d) Security or a portion of the security purchased on a delayed delivery or when-issued basis.
(e) Affiliated fund that is generally available only to investment companies and other accounts managed by Fidelity Investments. The rate quoted is the annualized seven-day yield of the fund at period end. A complete unaudited listing of the fund's holdings as of its most recent quarter end is available upon request. In addition, each Fidelity Central Fund's financial statements are available on the SEC's website or upon request.
Affiliated Central Funds
Information regarding fiscal year to date income earned by the Fund from investments in Fidelity Central Funds is as follows:
| Fund | Income earned |
| Fidelity Cash Central Fund | $14,444 |
| Total | $14,444 |
Amounts in the income column in the above table include any capital gain distributions from underlying funds, which are presented in the corresponding line-item in the Statement of Operations if applicable.
Investment Valuation
The following is a summary of the inputs used, as of June 30, 2018, involving the Fund's assets and liabilities carried at fair value. The inputs or methodology used for valuing securities may not be an indication of the risk associated with investing in those securities. For more information on valuation inputs, and their aggregation into the levels used below, please refer to the Investment Valuation section in the accompanying Notes to Financial Statements.
| | Valuation Inputs at Reporting Date: |
| Description | Total | Level 1 | Level 2 | Level 3 |
| Investments in Securities: | | | | |
| Corporate Bonds | $8,398,978 | $-- | $8,398,978 | $-- |
| U.S. Government and Government Agency Obligations | 17,931,908 | -- | 17,931,908 | -- |
| U.S. Government Agency - Mortgage Securities | 10,781,409 | -- | 10,781,409 | -- |
| Commercial Mortgage Securities | 274,718 | -- | 274,718 | -- |
| Municipal Securities | 36,866 | -- | 36,866 | -- |
| Foreign Government and Government Agency Obligations | 728,313 | -- | 728,313 | -- |
| Supranational Obligations | 134,624 | -- | 134,624 | -- |
| Money Market Funds | 4,665,119 | 4,665,119 | -- | -- |
| Total Investments in Securities: | $42,951,935 | $4,665,119 | $38,286,816 | $-- |
| Other Financial Instruments: | | | | |
| TBA Sale Commitments | $(412,126) | $-- | $(412,126) | $-- |
| Total Other Financial Instruments: | $(412,126) | $-- | $(412,126) | $-- |
See accompanying notes which are an integral part of the financial statements.
Financial Statements
Statement of Assets and Liabilities
| | | June 30, 2018 (Unaudited) |
| Assets | | |
Investment in securities, at value — See accompanying schedule:
Unaffiliated issuers (cost $38,328,091) | $38,286,816 | |
| Fidelity Central Funds (cost $4,665,119) | 4,665,119 | |
| Total Investment in Securities (cost $42,993,210) | | $42,951,935 |
| Receivable for investments sold | | 26,045 |
| Receivable for TBA sale commitments | | 410,777 |
| Receivable for fund shares sold | | 1,120,491 |
| Interest receivable | | 279,747 |
| Distributions receivable from Fidelity Central Funds | | 4,126 |
| Total assets | | 44,793,121 |
| Liabilities | | |
| Payable for investments purchased | | |
| Regular delivery | $1,548,057 | |
| Delayed delivery | 4,480,566 | |
| TBA sale commitments, at value | 412,126 | |
| Accrued management fee | 2,129 | |
| Distribution and service plan fees payable | 209 | |
| Other affiliated payables | 1,182 | |
| Total liabilities | | 6,444,269 |
| Net Assets | | $38,348,852 |
| Net Assets consist of: | | |
| Paid in capital | | $38,250,881 |
| Undistributed net investment income | | 143,022 |
| Accumulated undistributed net realized gain (loss) on investments | | (2,427) |
| Net unrealized appreciation (depreciation) on investments | | (42,624) |
| Net Assets | | $38,348,852 |
| Initial Class: | | |
| Net Asset Value, offering price and redemption price per share ($37,346,273 ÷ 3,723,237 shares) | | $10.03 |
| Service Class 2: | | |
| Net Asset Value, offering price and redemption price per share ($1,002,579 ÷ 100,000 shares) | | $10.03 |
See accompanying notes which are an integral part of the financial statements.
Statement of Operations
| | | For the period
April 19, 2018 (commencement of operations) to
June 30, 2018 (Unaudited) |
| Investment Income | | |
| Interest | | $136,409 |
| Income from Fidelity Central Funds | | 14,444 |
| Total income | | 150,853 |
| Expenses | | |
| Management fee | $4,707 | |
| Transfer agent fees | 2,615 | |
| Distribution and service plan fees | 495 | |
| Independent trustees' fees and expenses | 14 | |
| Total expenses | | 7,831 |
| Net investment income (loss) | | 143,022 |
| Realized and Unrealized Gain (Loss) | | |
| Net realized gain (loss) on: | | |
| Investment securities: | | |
| Unaffiliated issuers | (2,427) | |
| Total net realized gain (loss) | | (2,427) |
| Change in net unrealized appreciation (depreciation) on: | | |
| Investment securities: | | |
| Unaffiliated issuers | (41,275) | |
| Delayed delivery commitments | (1,349) | |
| Total change in net unrealized appreciation (depreciation) | | (42,624) |
| Net gain (loss) | | (45,051) |
| Net increase (decrease) in net assets resulting from operations | | $97,971 |
See accompanying notes which are an integral part of the financial statements.
Statement of Changes in Net Assets
| | For the period
April 19, 2018 (commencement of operations) to
June 30, 2018 (Unaudited) |
| Increase (Decrease) in Net Assets | |
| Operations | |
| Net investment income (loss) | $143,022 |
| Net realized gain (loss) | (2,427) |
| Change in net unrealized appreciation (depreciation) | (42,624) |
| Net increase (decrease) in net assets resulting from operations | 97,971 |
| Share transactions - net increase (decrease) | 38,250,881 |
| Total increase (decrease) in net assets | 38,348,852 |
| Net Assets | |
| Beginning of period | – |
| End of period | $38,348,852 |
| Other Information | |
| Undistributed net investment income end of period | $143,022 |
See accompanying notes which are an integral part of the financial statements.
Financial Highlights
VIP Bond Index Portfolio Initial Class
| | Six months ended (Unaudited) June 30, |
| | 2018 A |
| Selected Per–Share Data | |
| Net asset value, beginning of period | $10.00 |
| Income from Investment Operations | |
| Net investment income (loss)B | .054 |
| Net realized and unrealized gain (loss) | (.024) |
| Total from investment operations | .030 |
| Net asset value, end of period | $10.03 |
| Total ReturnC,D | .30% |
| Ratios to Average Net AssetsE,F | |
| Expenses before reductions | .14%G |
| Expenses net of fee waivers, if any | .14%G |
| Expenses net of all reductions | .14%G |
| Net investment income (loss) | 2.72%G |
| Supplemental Data | |
| Net assets, end of period (000 omitted) | $37,346 |
| Portfolio turnover rateH | 39%I |
A For the period April 19, 2018 (commencement of operations) to June 30, 2018.
B Calculated based on average shares outstanding during the period.
C Total returns for periods of less than one year are not annualized.
D Total returns do not reflect charges attributable to your insurance company's separate account. Inclusion of these charges would reduce the total returns shown.
E Fees and expenses of any underlying Fidelity Central Funds are not included in the Fund's expense ratio. The Fund indirectly bears its proportionate share of the expenses of any underlying Fidelity Central Funds.
F Expense ratios reflect operating expenses of the class. Expenses before reductions do not reflect amounts reimbursed by the investment adviser or reductions from expense offset arrangements and do not represent the amount paid by the class during periods when reimbursements or reductions occur. Expense ratios before reductions for start-up periods may not be representative of longer-term operating periods. Expenses net of fee waivers reflect expenses after reimbursement by the investment adviser but prior to reductions from expense offset arrangements. Expenses net of all reductions represent the net expenses paid by the class.
G Annualized
H Amount does not include the portfolio activity of any underlying Fidelity Central Funds.
I Amount not annualized.
See accompanying notes which are an integral part of the financial statements.
VIP Bond Index Portfolio Service Class 2
| | Six months ended (Unaudited) June 30, |
| | 2018 A |
| Selected Per–Share Data | |
| Net asset value, beginning of period | $10.00 |
| Income from Investment Operations | |
| Net investment income (loss)B | .049 |
| Net realized and unrealized gain (loss) | (.019) |
| Total from investment operations | .030 |
| Net asset value, end of period | $10.03 |
| Total ReturnC,D | .30% |
| Ratios to Average Net AssetsE,F | |
| Expenses before reductions | .39%G |
| Expenses net of fee waivers, if any | .39%G |
| Expenses net of all reductions | .39%G |
| Net investment income (loss) | 2.47%G |
| Supplemental Data | |
| Net assets, end of period (000 omitted) | $1,003 |
| Portfolio turnover rateH | 39%I |
A For the period April 19, 2018 (commencement of operations) to June 30, 2018.
B Calculated based on average shares outstanding during the period.
C Total returns for periods of less than one year are not annualized.
D Total returns do not reflect charges attributable to your insurance company's separate account. Inclusion of these charges would reduce the total returns shown.
E Fees and expenses of any underlying Fidelity Central Funds are not included in the Fund's expense ratio. The Fund indirectly bears its proportionate share of the expenses of any underlying Fidelity Central Funds.
F Expense ratios reflect operating expenses of the class. Expenses before reductions do not reflect amounts reimbursed by the investment adviser or reductions from expense offset arrangements and do not represent the amount paid by the class during periods when reimbursements or reductions occur. Expense ratios before reductions for start-up periods may not be representative of longer-term operating periods. Expenses net of fee waivers reflect expenses after reimbursement by the investment adviser but prior to reductions from expense offset arrangements. Expenses net of all reductions represent the net expenses paid by the class.
G Annualized
H Amount does not include the portfolio activity of any underlying Fidelity Central Funds.
I Amount not annualized.
See accompanying notes which are an integral part of the financial statements.
Notes to Financial Statements (Unaudited)
For the period ended June 30, 2018
1. Organization.
VIP Bond Index Portfolio (the Fund) is a fund of Variable Insurance Products Fund V (the Trust) and is authorized to issue an unlimited number of shares. The Trust is registered under the Investment Company Act of 1940, as amended (the 1940 Act), as an open-end management investment company organized as a Massachusetts business trust. Shares of the Fund may only be purchased by insurance companies for the purpose of funding variable annuity or variable life insurance contracts. The Fund offers the following classes of shares: Initial Class shares and Service Class 2 shares. All classes have equal rights and voting privileges, except for matters affecting a single class.
2. Investments in Fidelity Central Funds.
The Fund invests in Fidelity Central Funds, which are open-end investment companies generally available only to other investment companies and accounts managed by the investment adviser and its affiliates. The Fund's Schedule of Investments lists each of the Fidelity Central Funds held as of period end, if any, as an investment of the Fund, but does not include the underlying holdings of each Fidelity Central Fund. As an Investing Fund, the Fund indirectly bears its proportionate share of the expenses of the underlying Fidelity Central Funds.
The Money Market Central Funds seek preservation of capital and current income and are managed by Fidelity Investments Money Management, Inc. (FIMM), an affiliate of the investment adviser. Annualized expenses of the Money Market Central Funds as of their most recent shareholder report date are less than .005%.
A complete unaudited list of holdings for each Fidelity Central Fund is available upon request or at the Securities and Exchange Commission (the SEC) website at www.sec.gov. In addition, the financial statements of the Fidelity Central Funds are available on the SEC website or upon request.
3. Significant Accounting Policies.
The Fund is an investment company and applies the accounting and reporting guidance of the Financial Accounting Standards Board (FASB) Accounting Standards Codification Topic 946 Financial Services – Investments Companies. The financial statements have been prepared in conformity with accounting principles generally accepted in the United States of America (GAAP), which require management to make certain estimates and assumptions at the date of the financial statements. Actual results could differ from those estimates. Subsequent events, if any, through the date that the financial statements were issued have been evaluated in the preparation of the financial statements. The following summarizes the significant accounting policies of the Fund:
Investment Valuation. Investments are valued as of 4:00 p.m. Eastern time on the last calendar day of the period. The Board of Trustees (the Board) has delegated the day to day responsibility for the valuation of the Fund's investments to the Fair Value Committee (the Committee) established by the Fund's investment adviser. In accordance with valuation policies and procedures approved by the Board, the Fund attempts to obtain prices from one or more third party pricing vendors or brokers to value its investments. When current market prices, quotations or currency exchange rates are not readily available or reliable, investments will be fair valued in good faith by the Committee, in accordance with procedures adopted by the Board. Factors used in determining fair value vary by investment type and may include market or investment specific events, changes in interest rates and credit quality. The frequency with which these procedures are used cannot be predicted and they may be utilized to a significant extent. The Committee oversees the Fund's valuation policies and procedures and reports to the Board on the Committee's activities and fair value determinations. The Board monitors the appropriateness of the procedures used in valuing the Fund's investments and ratifies the fair value determinations of the Committee.
The Fund categorizes the inputs to valuation techniques used to value its investments into a disclosure hierarchy consisting of three levels as shown below:
- Level 1 – quoted prices in active markets for identical investments
- Level 2 – other significant observable inputs (including quoted prices for similar investments, interest rates, prepayment speeds, etc.)
- Level 3 – unobservable inputs (including the Fund's own assumptions based on the best information available)
Valuation techniques used to value the Fund's investments by major category are as follows:
Debt securities, including restricted securities, are valued based on evaluated prices received from third party pricing vendors or from brokers who make markets in such securities. Corporate bonds, foreign government and government agency obligations, municipal securities, supranational obligations and U.S. government and government agency obligations are valued by pricing vendors who utilize matrix pricing which considers yield or price of bonds of comparable quality, coupon, maturity and type or by broker-supplied prices. Commercial mortgage securities and U.S. government agency mortgage securities are valued by pricing vendors who utilize matrix pricing which considers prepayment speed assumptions, attributes of the collateral, yield or price of bonds of comparable quality, coupon, maturity and type or by broker-supplied prices. When independent prices are unavailable or unreliable, debt securities may be valued utilizing pricing methodologies which consider similar factors that would be used by third party pricing vendors. Debt securities are generally categorized as Level 2 in the hierarchy but may be Level 3 depending on the circumstances.
Investments in open-end mutual funds, including the Fidelity Central Funds, are valued at their closing net asset value (NAV) each business day and are categorized as Level 1 in the hierarchy.
Changes in valuation techniques may result in transfers in or out of an assigned level within the disclosure hierarchy. The aggregate value of investments by input level as of June 30, 2018 is included at the end of the Fund's Schedule of Investments.
Investment Transactions and Income. For financial reporting purposes, the Fund's investment holdings and NAV include trades executed through the end of the last business day of the period. The NAV per share for processing shareholder transactions is calculated as of the close of business of the New York Stock Exchange (NYSE), normally 4:00 p.m. Eastern time and includes trades executed through the end of the prior business day. Gains and losses on securities sold are determined on the basis of identified cost. Income and capital gain distributions from Fidelity Central Funds, if any, are recorded on the ex-dividend date. Interest income is accrued as earned and includes coupon interest and amortization of premium and accretion of discount on debt securities as applicable. Debt obligations may be placed on non-accrual status and related interest income may be reduced by ceasing current accruals and writing off interest receivables when the collection of all or a portion of interest has become doubtful based on consistently applied procedures. A debt obligation is removed from non-accrual status when the issuer resumes interest payments or when collectability of interest is reasonably assured.
Class Allocations and Expenses. Investment income, realized and unrealized capital gains and losses, common expenses of the Fund, and certain fund-level expense reductions, if any, are allocated daily on a pro-rata basis to each class based on the relative net assets of each class to the total net assets of the Fund. Each class differs with respect to transfer agent and distribution and service plan fees incurred. Certain expense reductions may also differ by class. For the reporting period, the allocated portion of income and expenses to each class as a percent of its average net assets may vary due to the timing of recording these transactions in relation to fluctuating net assets of the classes. Expenses directly attributable to a fund are charged to that fund. Expenses attributable to more than one fund are allocated among the respective funds on the basis of relative net assets or other appropriate methods. Expense estimates are accrued in the period to which they relate and adjustments are made when actual amounts are known.
Income Tax Information and Distributions to Shareholders. Each year, the Fund intends to qualify as a regulated investment company under Subchapter M of the Internal Revenue Code, including distributing substantially all of its taxable income and realized gains. As a result, no provision for U.S. Federal income taxes is required. The Fund files a U.S. federal tax return, in addition to state and local tax returns as required. The Fund's federal income tax returns are subject to examination by the Internal Revenue Service (IRS) for a period of three fiscal years after they are filed. State and local tax returns may be subject to examination for an additional fiscal year depending on the jurisdiction.
Distributions are declared and recorded on the ex-dividend date. Income and capital gain distributions are declared separately for each class. Income and capital gain distributions are determined in accordance with income tax regulations, which may differ from GAAP.
Capital accounts within the financial statements are adjusted for permanent book-tax differences. These adjustments have no impact on net assets or the results of operations. Capital accounts are not adjusted for temporary book-tax differences which will reverse in a subsequent period.
As of period end, the cost and unrealized appreciation (depreciation) in securities, and derivatives if applicable, for federal income tax purposes were as follows:
| Gross unrealized appreciation | $77,975 |
| Gross unrealized depreciation | (110,394) |
| Net unrealized appreciation (depreciation) | $(32,419) |
| Tax cost | $42,983,005 |
Delayed Delivery Transactions and When-Issued Securities. During the period, the Fund transacted in securities on a delayed delivery or when-issued basis. Payment and delivery may take place after the customary settlement period for that security. The price of the underlying securities and the date when the securities will be delivered and paid for are fixed at the time the transaction is negotiated. The securities purchased on a delayed delivery or when-issued basis are identified as such in the Fund's Schedule of Investments. The Fund may receive compensation for interest forgone in the purchase of a delayed delivery or when-issued security. With respect to purchase commitments, the Fund identifies securities as segregated in its records with a value at least equal to the amount of the commitment. Losses may arise due to changes in the value of the underlying securities or if the counterparty does not perform under the contract's terms, or if the issuer does not issue the securities due to political, economic, or other factors.
To-Be-Announced (TBA) Securities and Mortgage Dollar Rolls. During the period, the Fund transacted in TBA securities that involved buying or selling mortgage-backed securities (MBS) on a forward commitment basis. A TBA transaction typically does not designate the actual security to be delivered and only includes an approximate principal amount; however delivered securities must meet specified terms defined by industry guidelines, including issuer, rate and current principal amount outstanding on underlying mortgage pools. The Fund may enter into a TBA transaction with the intent to take possession of or deliver the underlying MBS, or the Fund may elect to extend the settlement by entering into either a mortgage or reverse mortgage dollar roll. Mortgage dollar rolls are transactions where a fund sells TBA securities and simultaneously agrees to repurchase MBS on a later date at a lower price and with the same counterparty. Reverse mortgage dollar rolls involve the purchase and simultaneous agreement to sell TBA securities on a later date at a lower price. Transactions in mortgage dollar rolls and reverse mortgage dollar rolls are accounted for as purchases and sales and may result in an increase to the Fund's portfolio turnover rate.
Purchases and sales of TBA securities involve risks similar to those discussed above for delayed delivery and when-issued securities. Also, if the counterparty in a mortgage dollar roll or a reverse mortgage dollar roll transaction files for bankruptcy or becomes insolvent, the Fund's right to repurchase or sell securities may be limited. Additionally, when a fund sells TBA securities without already owning or having the right to obtain the deliverable securities (an uncovered forward commitment to sell), it incurs a risk of loss because it could have to purchase the securities at a price that is higher than the price at which it sold them. A fund may be unable to purchase the deliverable securities if the corresponding market is illiquid.
TBA securities subject to a forward commitment to sell at period end are included at the end of the Fund's Schedule of Investments under the caption "TBA Sale Commitments." The proceeds and value of these commitments are reflected in the Fund's Statement of Assets and Liabilities as Receivable for TBA sale commitments and TBA sale commitments, at value, respectively.
Restricted Securities. The Fund may invest in securities that are subject to legal or contractual restrictions on resale. These securities generally may be resold in transactions exempt from registration or to the public if the securities are registered. Disposal of these securities may involve time-consuming negotiations and expense, and prompt sale at an acceptable price may be difficult. Information regarding restricted securities is included at the end of the Fund's Schedule of Investments.
New Accounting Pronouncement. In March 2017, the Financial Accounting Standards Board (FASB) issued an Accounting Standards Update (ASU), ASU 2017-08, which amends the amortization period for certain callable debt securities that are held at a premium. The amendment requires the premium to be amortized to the earliest call date. The amendments do not require an accounting change for securities held at a discount. The ASU is effective for annual periods beginning after December 15, 2018. Management is currently evaluating the potential impact of these changes to the financial statements.
4. Purchases and Sales of Investments.
Purchases and sales of securities, other than short-term securities and U.S. government securities, aggregated $9,724,323 and $56,560, respectively.
5. Fees and Other Transactions with Affiliates.
Management Fee and Expense Contract. Fidelity Management & Research Company (the investment adviser) and its affiliates provide the Fund with investment management related services for which the Fund pays a monthly management fee. The management fee is based on an annual rate of .09% of the Fund's average net assets. Under the management contract, the investment adviser pays all other fund-level expenses, except the compensation of the independent Trustees and certain other expenses such as interest expense, including commitment fees.
In addition, under the expense contract, the investment adviser pays class-level expenses as necessary so that the total expenses do not exceed certain amounts of each class' average net assets on an annual basis with certain exceptions, as noted in the following table:
| Initial Class | .14% |
| Service Class 2 | .39% |
Distribution and Service Plan Fees. In accordance with Rule 12b-1 of the 1940 Act, the Fund has adopted separate 12b-1 Plans for Service Class 2 of shares. Service Class 2 pays Fidelity Distributors Corporation (FDC), an affiliate of the investment adviser, a service fee. For the period, the service fee is based on an annual rate of .25% of Service Class 2's average net assets.
For the period, total fees, all of which were re-allowed to insurance companies for the distribution of shares and providing shareholder support services, were as follows:
Transfer Agent Fees. Fidelity Investments Institutional Operations Company, Inc. (FIIOC), an affiliate of the investment adviser, is the transfer, dividend disbursing, and shareholder servicing agent for each class. FIIOC receives asset-based fees of .07% of each class's average net assets for transfer agent services, typesetting, and printing and mailing of shareholder reports, excluding mailing of proxy statements. Under the expense contract, each class pays a portion of the transfer agent fees equal to an annual rate of .05% of class-level average net assets. For the period, transfer agent fees for each class were as follows:
| Initial Class | $ 2,516 |
| Service Class 2 | 99 |
| | $ 2,615 |
Interfund Trades. The Fund may purchase from or sell securities to other Fidelity Funds under procedures adopted by the Board. The procedures have been designed to ensure these interfund trades are executed in accordance with Rule 17a-7 of the 1940 Act. Interfund trades are included within the respective purchases and sales amounts shown in the Purchases and Sales of Investments note.
6. Share Transactions.
Transactions for each class of shares were as follows:
| | Shares | Dollars |
| | Six months ended June 30, 2018 (a) | Six months ended June 30, 2018(a) |
| Initial Class | | |
| Shares sold | 3,723,237 | $37,250,881 |
| Net increase (decrease) | 3,723,237 | $37,250,881 |
| Service Class 2 | | |
| Shares sold | 100,000 | $1,000,000 |
| Net increase (decrease) | 100,000 | $1,000,000 |
(a) For the period April 19, 2018 (commencement of operations) to June 30, 2018.
7. Other.
The Fund's organizational documents provide former and current trustees and officers with a limited indemnification against liabilities arising in connection with the performance of their duties to the Fund. In the normal course of business, the Fund may also enter into contracts that provide general indemnifications. The Fund's maximum exposure under these arrangements is unknown as this would be dependent on future claims that may be made against the Fund. The risk of material loss from such claims is considered remote.
At the end of the period, the investment adviser or its affiliates were the owners of record of approximately 92% of the total outstanding shares of the Fund.
Shareholder Expense Example
As a shareholder of the Fund, you incur two types of costs: (1) transaction costs and (2) ongoing costs, including management fees, distribution and/or service (12b-1) fees and other Fund expenses. This Example is intended to help you understand your ongoing costs (in dollars) of investing in the Fund and to compare these costs with the ongoing costs of investing in other mutual funds.
The actual expense Example is based on an investment of $1,000 invested at the beginning of the period and held for the entire period (April 19, 2018 to June 30, 2018). The hypothetical expense Example is based on an investment of $1,000 invested for the one-half year period (January 1, 2018 to June 30, 2018).
Actual Expenses
The first line of the accompanying table for each class of the Fund provides information about actual account values and actual expenses. You may use the information in this line, together with the amount you invested, to estimate the expenses that you paid over the period. Simply divide your account value by $1,000.00 (for example, an $8,600 account value divided by $1,000.00 = 8.6), then multiply the result by the number in the first line for a class of the Fund under the heading entitled "Expenses Paid During Period" to estimate the expenses you paid on your account during this period. The estimate of expenses does not include any fees or other expenses of any variable annuity or variable life insurance product. If they were, the estimate of expenses you paid during the period would be higher, and your ending account value would be lower. In addition, the Fund, as a shareholder in the underlying Fidelity Central Funds, will indirectly bear its pro-rata share of the fees and expenses incurred by the underlying Fidelity Central Funds. These fees and expenses are not included in the Fund's annualized expense ratio used to calculate the expense estimate in the table below.
Hypothetical Example for Comparison Purposes
The second line of the accompanying table for each class of the Fund provides information about hypothetical account values and hypothetical expenses based on a Class' actual expense ratio and an assumed rate of return of 5% per year before expenses, which is not the Class' actual return. The hypothetical account values and expenses may not be used to estimate the actual ending account balance or expenses you paid for the period. You may use this information to compare the ongoing costs of investing in the Fund and other funds. To do so, compare this 5% hypothetical example with the 5% hypothetical examples that appear in the shareholder reports of the other funds. The estimate of expenses does not include any fees or other expenses of any variable annuity or variable life insurance product. If they were, the estimate of expenses you paid during the period would be higher, and your ending account value would be lower. In addition, the Fund, as a shareholder in the underlying Fidelity Central Funds, will indirectly bear its pro-rata share of the fees and expenses incurred by the underlying Fidelity Central Funds. These fees and expenses are not included in the Fund's annualized expense ratio used to calculate the expense estimate in the table below.
Please note that the expenses shown in the table are meant to highlight your ongoing costs only and do not reflect any transaction costs. Therefore, the second line of the table is useful in comparing ongoing costs only, and will not help you determine the relative total costs of owning different funds.
| | Annualized Expense Ratio-A | Beginning
Account Value
| Ending
Account Value
June 30, 2018 | Expenses Paid
During Period
|
| Initial Class | .14% | | | |
| Actual | | $1,000.00 | $1,003.00 | $.28-B |
| Hypothetical-C | | $1,000.00 | $1,024.10 | $.70-D |
| Service Class 2 | .39% | | | |
| Actual | | $1,000.00 | $1,003.00 | $.78-B |
| Hypothetical-C | | $1,000.00 | $1,022.86 | $1.96-D |
A Annualized expense ratio reflects expenses net of applicable fee waivers.
B Actual expenses are equal to each Class' annualized expense ratio, multiplied by the average account value over the period, multiplied by 73/365 (to reflect the period April 19, 2018 to June 30, 2018).
C 5% return per year before expenses
D Hypothetical expenses are equal to each Class' annualized expense ratio, multiplied by the average account value over the period, multiplied by 181/365 (to reflect the one-half year period).
Board Approval of Investment Advisory Contracts and Management Fees
VIP Bond Index Portfolio
On January 18, 2018, the Board of Trustees, including the Independent Trustees (together, the Board), voted to approve the management contract with Fidelity Management & Research Company (FMR) and the sub-advisory agreements with affiliates of FMR (together, the Advisory Contracts) for the fund. FMR and the sub-advisers are collectively referred to herein as the Investment Advisers. The Board, assisted by the advice of fund counsel and Independent Trustees' counsel, considered a broad range of information.
Nature, Extent, and Quality of Services Provided. The Board considered Fidelity's staffing as it relates to the fund, including the backgrounds of investment personnel of Fidelity, and also considered the fund's investment objective, strategies, and related investment philosophy. The Board considered the structure of the investment personnel compensation program and whether this structure provides appropriate incentives to act in the best interests of the fund.
Resources Dedicated to Investment Management and Support Services. The Board reviewed the general qualifications and capabilities of Fidelity's investment staff, including its size, education, experience, and resources, as well as Fidelity's approach to recruiting, managing, and compensating investment personnel. The Board noted that Fidelity has continued to increase the resources devoted to non-U.S. offices, including expansion of Fidelity's global investment organization. The Board also noted that Fidelity's analysts have extensive resources, tools and capabilities that allow them to conduct sophisticated quantitative and fundamental analysis, as well as credit analysis of issuers, counterparties and guarantors. Further, the Board considered that Fidelity's investment professionals have sufficient access to global information and data so as to provide competitive investment results over time, and that those professionals also have access to sophisticated tools that permit them to assess portfolio construction and risk and performance attribution characteristics continuously, as well as to transmit new information and research conclusions rapidly around the world. Additionally, in its deliberations, the Board considered Fidelity's trading, risk management compliance, and technology and operations capabilities and resources, which are integral parts of the investment management process. The Board also considered their familiarity with Fidelity's management of other fixed income index funds overseen by the Board.
Shareholder and Administrative Services. The Board considered the nature, extent, quality, and cost of advisory, administrative, and shareholder services to be performed by the Investment Advisers and their affiliates under the Advisory Contracts and under separate agreements covering transfer agency, pricing and bookkeeping, and securities lending services for the fund. The Board also considered the nature and extent of the supervision of third party service providers, principally custodians, subcustodians, and pricing vendors.
The Board noted that the growth of fund assets over time across the complex allows Fidelity to reinvest in the development of services designed to enhance the value or convenience of the Fidelity funds as investment vehicles. These services include 24-hour access to account information and market information through telephone representatives and over the Internet, investor education materials and asset allocation tools, and the expanded availability of Fidelity Investor Centers.
Investment Performance. The fund is a new fund and therefore had no historical performance for the Board to review at the time it approved the fund's Advisory Contracts.
Based on its review, the Board concluded that the nature, extent, and quality of services to be provided to the fund under the Advisory Contracts should benefit the shareholders of the fund.
Competitiveness of Management Fee and Total Expense Ratio. In reviewing the Advisory Contracts, the Board considered the fund's proposed management fee rate out of which FMR will pay all "fund-level" expenses, with certain limited exceptions, and the projected total expense ratio of each class of the fund. The Board noted that they oversee a similar fund that is very large and competes in different markets and pays a lower management fee than the proposed management fee, and that the fund's proposed management fee rate is lower than the median fee rate of funds with similar Lipper investment objective categories and comparable investment mandates, regardless of whether their management fee structures are comparable. The Board also considered that the projected total expense ratio of each class of the fund (after taking into account the expense contract discussed below) is below the median those funds and classes used by the Board for management fee comparisons that have a similar sales load structure.
The Board also noted that FMR has contractual arrangements between FMR and the fund limiting the total expenses for each class of the fund, which may not be increased without the approval of the Board.
The Board considered that contractual arrangements for the fund oblige FMR to pay all "class-level" expenses of each class of the fund to the extent necessary to limit total operating expenses, with certain exceptions, as follows: Initial Class: 0.14% and Service Class 2: 0.39%.
Based on its review, the Board concluded that the management fee and projected total expense ratio of each class of the fund were reasonable in light of the services that the fund and its shareholders will receive and the other factors considered.
Costs of the Services and Profitability. The fund is a new fund and therefore no revenue, cost, or profitability data was available for the Board to review in respect of the fund at the time it approved the Advisory Contracts. In connection with its future renewal of the fund's Advisory Contracts, the Board will consider the revenues earned and the expenses incurred by Fidelity in conducting the business of developing, marketing, distributing, managing, administering and servicing the fund and servicing the fund's shareholders.
Economies of Scale. The Board will consider economies of scale when there is operating experience to permit assessment thereof. It noted that, notwithstanding the entrepreneurial risk associated with a new fund, the management fee was at a level normally associated, by comparison with competitors, with very high fund net assets, and Fidelity asserted to the Board that the level of the fee anticipated economies of scale at lower asset levels even before, if ever, economies of scale are achieved. The Board also noted that the fund and its shareholders would have access to the very considerable number and variety of services available through Fidelity and its affiliates.
Based on its evaluation of all of the conclusions noted above, and after considering all factors it believed relevant, the Board concluded that the advisory fee structures are fair and reasonable, and that the fund's Advisory Contracts should be approved.
VUSB-SANN-0818
1.9887311.100
Item 2.
Code of Ethics
Not applicable.
Item 3.
Audit Committee Financial Expert
Not applicable.
Item 4.
Principal Accountant Fees and Services
Not applicable.
Item 5.
Audit Committee of Listed Registrants
Not applicable.
Item 6.
Investments
(a)
Not applicable.
(b)
Not applicable
Item 7.
Disclosure of Proxy Voting Policies and Procedures for Closed-End Management Investment Companies
Not applicable.
Item 8.
Portfolio Managers of Closed-End Management Investment Companies
Not applicable.
Item 9.
Purchase of Equity Securities by Closed-End Management Investment Company and Affiliated Purchasers
Not applicable.
Item 10.
Submission of Matters to a Vote of Security Holders
There were no material changes to the procedures by which shareholders may recommend nominees to the Variable Insurance Products Fund V’s Board of Trustees.
Item 11.
Controls and Procedures
(a)(i) The President and Treasurer and the Chief Financial Officer have concluded that the Variable Insurance Products Fund V’s (the “Trust”) disclosure controls and
procedures (as defined in Rule 30a-3(c) under the Investment Company Act) provide reasonable assurances that material information relating to the Trust is made known to them by the appropriate persons, based on their evaluation of these controls and procedures as of a date within 90 days of the filing date of this report.
(a)(ii) There was no change in the Trust’s internal control over financial reporting (as defined in Rule 30a-3(d) under the Investment Company Act) that occurred during the period covered by this report that has materially affected, or is reasonably likely to materially affect, the Trust’s internal control over financial reporting.
Item 12.
Disclosure of Securities Lending Activities for Closed-End Management
Investment Companies
Not applicable.
Item 13.
Exhibits
| | |
(a) | (1) | Not applicable. |
(a) | (2) | Certification pursuant to Rule 30a-2(a) under the Investment Company Act of 1940 (17 CFR 270.30a-2(a)) is filed and attached hereto as Exhibit 99.CERT. |
(a) | (3) | Not applicable. |
(b) |
| Certification pursuant to Rule 30a-2(b) under the Investment Company Act of 1940 (17 CFR 270.30a-2(b)) is furnished and attached hereto as Exhibit 99.906CERT. |
SIGNATURES
Pursuant to the requirements of the Securities Exchange Act of 1934 and the Investment Company Act of 1940, the registrant has duly caused this report to be signed on its behalf by the undersigned, thereunto duly authorized.
Variable Insurance Products Fund V
| |
By: | /s/Laura M. Del Prato |
| Laura M. Del Prato |
| President and Treasurer |
|
|
Date: | August 23, 2018 |
Pursuant to the requirements of the Securities Exchange Act of 1934 and the Investment Company Act of 1940, this report has been signed below by the following persons on behalf of the registrant and in the capacities and on the dates indicated.
| |
By: | /s/Laura M. Del Prato |
| Laura M. Del Prato |
| President and Treasurer |
|
|
Date: | August 23, 2018 |
| |
By: | /s/John J. Burke III |
| John J. Burke III |
| Chief Financial Officer |
|
|
Date: | August 23, 2018 |