UNITED STATES
SECURITIES AND EXCHANGE COMMISSION
Washington, D.C. 20549
FORM N-CSR
CERTIFIED SHAREHOLDER REPORT OF REGISTERED
MANAGEMENT INVESTMENT COMPANIES
Investment Company Act file number 811-05361
Variable Insurance Products Fund V
(Exact name of registrant as specified in charter)
245 Summer St., Boston, Massachusetts 02210
(Address of principal executive offices) (Zip code)
William C. Coffey, Secretary
245 Summer St.
Boston, Massachusetts 02210
(Name and address of agent for service)
Registrant's telephone number, including area code:
617-563-7000
| |
Date of fiscal year end: | December 31 |
| |
Date of reporting period: | December 31, 2018 |
This report on Form N-CSR relates solely to the Registrant’s VIP Asset Manager Growth Portfolio, VIP Asset Manager Portfolio, VIP Bond Index Portfolio, VIP Freedom 2005 Portfolio, VIP Freedom 2010 Portfolio, VIP Freedom 2015 Portfolio, VIP Freedom 2020 Portfolio, VIP Freedom 2025 Portfolio, VIP Freedom 2030 Portfolio, VIP Freedom 2035 Portfolio, VIP Freedom 2040 Portfolio, VIP Freedom 2045 Portfolio, VIP Freedom 2050 Portfolio, VIP Freedom Income Portfolio, VIP Freedom Lifetime Income I Portfolio, VIP Freedom Lifetime Income II Portfolio, VIP Freedom Lifetime Income III Portfolio, VIP FundsManager 20% Portfolio, VIP FundsManager 50% Portfolio, VIP FundsManager 60% Portfolio, VIP FundsManager 70% Portfolio, VIP FundsManager 85% Portfolio, VIP Investment Grade Bond Portfolio, VIP Investor Freedom 2005 Portfolio, VIP Investor Freedom 2010 Portfolio, VIP Investor Freedom 2015 Portfolio, VIP Investor Freedom 2020 Portfolio, VIP Investor Freedom 2025 Portfolio, VIP Investor Freedom 2030 Portfolio, VIP Investor Freedom Income Portfolio, VIP Strategic Income Portfolio and VIP Target Volatility Portfolio series (each, a “Fund” and collectively, the “Funds”).
Item 1.
Reports to Stockholders
Fidelity® Variable Insurance Products: Asset Manager: Growth Portfolio
Annual Report December 31, 2018 |
 |
Beginning on January 1, 2021, as permitted by regulations adopted by the Securities and Exchange Commission, and if your insurance carrier elects to participate, you may not be receiving paper copies of the Fund’s shareholder reports from the insurance company that offers your variable insurance product unless you specifically request paper copies from your financial professional or the administrator of your variable insurance product. Instead, the reports will be made available on a website, and you will be notified by mail each time a report is posted and provided with a website link to access the report.
If you already elected to receive shareholder reports electronically, you will not be affected by this change and you need not take any action. You may elect to receive shareholder reports and other communications from the Fund electronically, by contacting your financial professional or the administrator of your variable insurance product. If you own a Fidelity-administered variable insurance product, please visit fidelity.com/mailpreferences to make your election or call 1-800-343-3548.
You may elect to receive all future reports in paper free of charge. If you wish to continue receiving paper copies of your shareholder reports, you may contact your financial professional or the administrator of your variable insurance product. If you own a Fidelity-administered variable insurance product, please visit fidelity.com/mailpreferences to make your election or call 1-800-343-3548. Your election to receive reports in paper will apply to all funds available under your variable insurance product.
Contents
To view a fund's proxy voting guidelines and proxy voting record for the 12-month period ended June 30, visit http://www.fidelity.com/proxyvotingresults or visit the Securities and Exchange Commission's (SEC) web site at http://www.sec.gov.
You may also call 1-877-208-0098 to request a free copy of the proxy voting guidelines.
Fidelity® Variable Insurance Products are separate account options which are purchased through a variable insurance contract.
Standard & Poor's, S&P and S&P 500 are registered service marks of The McGraw-Hill Companies, Inc. and have been licensed for use by Fidelity Distributors Corporation.
Other third-party marks appearing herein are the property of their respective owners.
All other marks appearing herein are registered or unregistered trademarks or service marks of FMR LLC or an affiliated company. © 2019 FMR LLC. All rights reserved.
This report and the financial statements contained herein are submitted for the general information of the shareholders of the Fund. This report is not authorized for distribution to prospective investors in the Fund unless preceded or accompanied by an effective prospectus.
A fund files its complete schedule of portfolio holdings with the SEC for the first and third quarters of each fiscal year on Form N-Q. Forms N-Q are available on the SEC’s web site at http://www.sec.gov. A fund's Forms N-Q may be reviewed and copied at the SEC’s Public Reference Room in Washington, DC. Information regarding the operation of the SEC's Public Reference Room may be obtained by calling 1-800-SEC-0330.
For a complete list of a fund's portfolio holdings, view the most recent holdings listing, semiannual report, or annual report on Fidelity's web site at http://www.fidelity.com, http://www.institutional.fidelity.com, or http://www.401k.com, as applicable.
NOT FDIC INSURED •MAY LOSE VALUE •NO BANK GUARANTEE
Neither the Fund nor Fidelity Distributors Corporation is a bank.
Performance: The Bottom Line
Average annual total return reflects the change in the value of an investment, assuming reinvestment of distributions from dividend income and capital gains (the profits earned upon the sale of securities that have grown in value, if any) and assuming a constant rate of performance each year. During periods of reimbursement by Fidelity, a fund’s total return will be greater than it would be had the reimbursement not occurred. Performance numbers are net of all underlying fund operating expenses, but do not include any insurance charges imposed by your insurance company’s separate account. If performance information included the effect of these additional charges, the total returns would have been lower. How a fund did yesterday is no guarantee of how it will do tomorrow.
Average Annual Total Returns
| For the periods ended December 31, 2018 | Past 1 year | Past 5 years | Past 10 years |
| Initial Class | (7.65)% | 3.55% | 9.33% |
| Service Class | (7.75)% | 3.45% | 9.23% |
| Service Class 2 | (7.88)% | 3.28% | 9.04% |
| Investor Class | (7.72)% | 3.47% | 9.24% |
$10,000 Over 10 Years
Let's say hypothetically that $10,000 was invested in VIP Asset Manager: Growth Portfolio - Initial Class on December 31, 2008.
The chart shows how the value of your investment would have changed, and also shows how the S&P 500® Index performed over the same period.
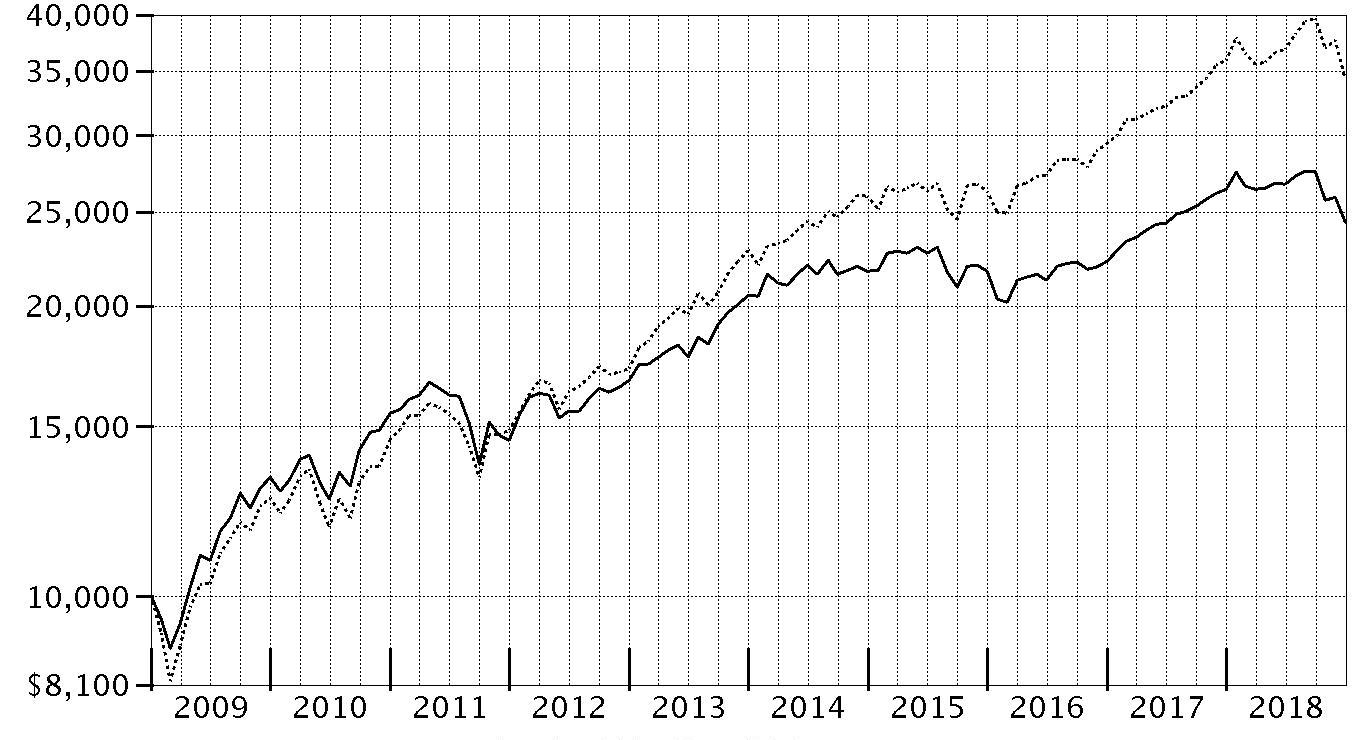
| Period Ending Values |
| $24,410 | VIP Asset Manager: Growth Portfolio - Initial Class |
| $34,303 | S&P 500® Index |
Management's Discussion of Fund Performance
Market Recap: The global economy remained in expansion in 2018, but growth became less synchronous and more uneven. Meanwhile, global monetary policy became a headwind, and this uncertainty spurred an increase in volatility among risk assets. This was particularly true in the latter part of the year due to several factors including China entering a growth recession, emerging late-cycle conditions in the U.S., falling commodity prices, China-U.S. trade-policy uncertainty and the U.K.’s planned “Brexit” from the European Union. Against this backdrop, U.S. equities, as measured by the S&P 500
® index returned -4.38% in 2018. Sector-wise, seven of the 11 major sectors in the S&P 500
® lost ground this period. Falling crude-oil prices caused energy stocks (-18%) to suffer most, while slowing global growth concerns felled the materials (-15%), industrials (-13%) and financials (-13%) sectors. Conversely, health care (+6%) led the way, followed by the utilities (+4%), information technology (+3%) and consumer discretionary (+2%) sectors. Overseas, equities suffered a pronounced, broad-based correction, returning -14.04% for the year, according to the MSCI ACWI ex USA Index. Among regions in the index, Asia-Pacific (-11%) and Japan (-13%) held up best, whereas resource-rich Canada (-17%), Europe (-14%) and emerging markets (-14%) lagged. In terms of fixed income, investment-grade bonds were roughly flat for the 12 months, according to the Bloomberg Barclays U.S. Aggregate Bond Index. Late in the year, concerns about global growth pushed Treasury yields lower and credit spreads wider. Short-term debt led most U.S. investment-grade sectors, followed by asset-backed securities and agency bonds while corporate credit produced negative returns according to Bloomberg Barclays.
Comments from Lead Portfolio Manager Geoff Stein and Co-Portfolio Manager Avishek Hazrachoudhury: For the year, the fund’s share classes returned roughly -8%, trailing the -5.30% result of the Fidelity Asset Manager 70% Composite Index℠. The fund underperformed the Composite benchmark primarily because of weak U.S. stock selection during the final quarter of 2018. More specifically, security selection within information technology had the greatest negative impact. Picks among international developed-markets (DM) equities also notably detracted from performance, while choices in emerging-markets (EM) stocks produced moderately negative relative results. Overall, asset allocation aided performance versus the benchmark, driven by equity positioning. Underweighted exposure to international stocks fueled the fund’s positive equity allocation results, as both DM and EM lagged U.S. equities, primarily due to a strengthening U.S. dollar. Conversely, our small allocation to commodities modestly hampered our equity strategy, largely due to falling oil prices. Our fixed-income allocation strategy – underweighting cash and investment-grade bonds to help fund various out-of-benchmark positions – detracted versus the Composite benchmark and partially offset the performance benefit provided by our equity strategy. Underweighting cash in the portfolio hurt, since it was the best performer across all the asset classes we invest in. The fund's underweighting in investment-grade debt was a further dampener, primarily because some of the alternative bond sectors we invested in didn’t perform as well as expected. Looking ahead, we have a broadly neutral view toward stocks, but believe international markets – particularly EM – may offer more attractive opportunities than the U.S.
The views expressed above reflect those of the portfolio manager(s) only through the end of the period as stated on the cover of this report and do not necessarily represent the views of Fidelity or any other person in the Fidelity organization. Any such views are subject to change at any time based upon market or other conditions and Fidelity disclaims any responsibility to update such views. These views may not be relied on as investment advice and, because investment decisions for a Fidelity fund are based on numerous factors, may not be relied on as an indication of trading intent on behalf of any Fidelity fund.
Note to shareholders: Avishek Hazrachoudhury joined Geoff Stein as Co-Manager of the fund on April 28, 2018.
Investment Summary (Unaudited)
The information in the following tables is based on the combined investments of the Fund and its pro-rata share of the investments of Fidelity's Central Funds, other than the Commodity Strategy and Money Market Central Funds.
Top Ten Stocks as of December 31, 2018
| | % of fund's net assets |
| Apple, Inc. | 1.9 |
| Microsoft Corp. | 1.9 |
| Amazon.com, Inc. | 1.1 |
| Alphabet, Inc. Class A | 1.0 |
| UnitedHealth Group, Inc. | 0.7 |
| Roche Holding AG (participation certificate) | 0.6 |
| Becton, Dickinson & Co. | 0.5 |
| AstraZeneca PLC (United Kingdom) | 0.5 |
| Adobe, Inc. | 0.5 |
| The Boeing Co. | 0.5 |
| | 9.2 |
Top Market Sectors as of December 31, 2018
| (stocks only) | % of fund's net assets |
| Information Technology | 10.4 |
| Financials | 10.0 |
| Health Care | 8.4 |
| Investment Companies | 6.6 |
| Consumer Discretionary | 6.4 |
| Industrials | 6.2 |
| Communication Services | 4.9 |
| Consumer Staples | 4.4 |
| Energy | 3.4 |
| Real Estate | 2.6 |
Asset Allocation (% of fund's net assets)
| As of December 31, 2018* |
| | Stock Class and Equity Futures** | 72.0% |
| | Bonds | 22.6% |
| | Short-Term Class | 5.4% |

* Foreign investments - 22.0%
** Includes investment in Fidelity® Commodity Strategy Central Fund of 0.7%
Asset allocations in the pie chart reflects the categorization of assets as defined in the Fund's prospectus in effect as of the time periods indicated above. Financial Statement categorizations conform to accounting standards and will differ from the pie chart. Percentages are adjusted for the effect of future contracts and swap contracts, if applicable.
An unaudited holdings listing for the Fund, which presents direct holdings as well as the pro-rata share of any securities and other investments held indirectly through its investment in underlying Fidelity Central Funds, other than the Commodity Strategy and Money Market Central Funds, is available at institutional.fidelity.com.
Percentages in the above tables are adjusted for the effect of TBA Sale Commitments.
Schedule of Investments December 31, 2018
Showing Percentage of Net Assets
| U.S. Treasury Obligations - 0.1% | | | |
| | | Principal Amount | Value |
| U.S. Treasury Bills, yield at date of purchase 2.36% to 2.39% 3/21/19 to 3/28/19 (a) | | | |
| (Cost $188,986) | | 190,000 | 188,980 |
| | | Shares | Value |
|
| Fixed-Income Funds - 24.5% | | | |
| Fidelity Emerging Markets Debt Central Fund (b) | | 112,065 | $1,020,915 |
| Fidelity Floating Rate Central Fund (b) | | 21,235 | 2,090,602 |
| Fidelity High Income Central Fund 1 (b) | | 43,565 | 3,842,872 |
| Fidelity Inflation-Protected Bond Index Central Fund (b) | | 76,633 | 7,470,174 |
| Fidelity International Credit Central Fund (b) | | 13,824 | 1,311,077 |
| Fidelity VIP Investment Grade Central Fund (b) | | 290,037 | 29,673,651 |
| iShares 20+ Year Treasury Bond ETF | | 27,776 | 3,375,062 |
| TOTAL FIXED-INCOME FUNDS | | | |
| (Cost $48,796,270) | | | 48,784,353 |
|
| Money Market Funds - 7.7% | | | |
| Fidelity Cash Central Fund, 2.42% (c) | | 10,404,631 | 10,406,712 |
| Fidelity Money Market Central Fund, 2.65% (c) | | 150,312 | 150,312 |
| Fidelity Securities Lending Cash Central Fund 2.41% (c)(d) | | 4,731,520 | 4,731,993 |
| TOTAL MONEY MARKET FUNDS | | | |
| (Cost $15,289,015) | | | 15,289,017 |
|
| Equity Funds - 69.9% | | | |
| Domestic Equity Funds - 48.5% | | | |
| Fidelity Commodity Strategy Central Fund (b) | | 295,200 | 1,369,730 |
| Fidelity Communication Services Central Fund (b) | | 42,869 | 7,214,391 |
| Fidelity Consumer Discretionary Central Fund (b) | | 32,921 | 9,362,394 |
| Fidelity Consumer Staples Central Fund (b) | | 35,385 | 5,886,298 |
| Fidelity Energy Central Fund (b) | | 46,930 | 4,467,763 |
| Fidelity Financials Central Fund (b) | | 198,891 | 17,255,789 |
| Fidelity Health Care Central Fund (b) | | 36,899 | 14,253,091 |
| Fidelity Industrials Central Fund (b) | | 37,653 | 8,748,390 |
| Fidelity Information Technology Central Fund (b) | | 64,101 | 19,976,403 |
| Fidelity Materials Central Fund (b) | | 13,560 | 2,453,816 |
| Fidelity Real Estate Equity Central Fund (b) | | 8,976 | 872,167 |
| Fidelity Utilities Central Fund (b) | | 18,910 | 3,217,606 |
| iShares S&P 500 Index ETF | | 5,388 | 1,355,675 |
|
| TOTAL DOMESTIC EQUITY FUNDS | | | 96,433,513 |
|
| International Equity Funds - 21.4% | | | |
| Fidelity Emerging Markets Equity Central Fund (b) | | 33,867 | 6,442,240 |
| Fidelity International Equity Central Fund (b) | | 356,996 | 24,536,329 |
| iShares Core MSCI Emerging Markets ETF | | 120,059 | 5,660,782 |
| iShares MSCI EAFE Index ETF | | 22,583 | 1,327,429 |
| iShares MSCI Japan ETF (e) | | 92,673 | 4,697,594 |
|
| TOTAL INTERNATIONAL EQUITY FUNDS | | | 42,664,374 |
|
| TOTAL EQUITY FUNDS | | | |
| (Cost $144,916,736) | | | 139,097,887 |
| TOTAL INVESTMENT IN SECURITIES - 102.2% | | | |
| (Cost $209,191,007) | | | 203,360,237 |
| NET OTHER ASSETS (LIABILITIES) - (2.2)% | | | (4,348,160) |
| NET ASSETS - 100% | | | $199,012,077 |
| Futures Contracts | | | | | |
| | Number of contracts | Expiration Date | Notional Amount | Value | Unrealized Appreciation/(Depreciation) |
| Purchased | | | | | |
| Equity Index Contracts | | | | | |
| ICE E-mini MSCI Emerging Markets Index Contracts (United States) | 68 | March 2019 | $3,287,120 | $(324) | $(324) |
The notional amount of futures purchased as a percentage of Net Assets is 1.7%
Security Type Abbreviations
ETF – Exchange-Traded Fund
Legend
(a) Security or a portion of the security was pledged to cover margin requirements for futures contracts. At period end, the value of securities pledged amounted to $188,980.
(b) Affiliated fund that is generally available only to investment companies and other accounts managed by Fidelity Investments. A complete unaudited schedule of portfolio holdings for each Fidelity Central Fund is filed with the SEC for the first and third quarters of each fiscal year on Form N-Q and is available upon request or at the SEC's website at www.sec.gov. An unaudited holdings listing for the Fund, which presents direct holdings as well as the pro-rata share of securities and other investments held indirectly through its investment in underlying non-money market Fidelity Central Funds, other than the Commodity Strategy Central Fund, is available at fidelity.com and/or institutional.fidelity.com, as applicable. In addition, each Fidelity Central Fund's financial statements, which are not covered by the Fund's Report of Independent Registered Public Accounting Firm, are available on the SEC's website or upon request.
(c) Affiliated fund that is generally available only to investment companies and other accounts managed by Fidelity Investments. The rate quoted is the annualized seven-day yield of the fund at period end. A complete unaudited listing of the fund's holdings as of its most recent quarter end is available upon request. In addition, each Fidelity Central Fund's financial statements, which are not covered by the Fund's Report of Independent Registered Public Accounting Firm, are available on the SEC's website or upon request.
(d) Investment made with cash collateral received from securities on loan.
(e) Security or a portion of the security is on loan at period end.
Affiliated Central Funds
Information regarding fiscal year to date income earned by the Fund from investments in Fidelity Central Funds is as follows:
| Fund | Income earned |
| Fidelity Cash Central Fund | $86,995 |
| Fidelity Commodity Strategy Central Fund | 108,596 |
| Fidelity Communication Services Central Fund | 75,162 |
| Fidelity Consumer Discretionary Central Fund | 446,358 |
| Fidelity Consumer Staples Central Fund | 740,404 |
| Fidelity Emerging Markets Debt Central Fund | 62,450 |
| Fidelity Emerging Markets Equity Central Fund | 630,036 |
| Fidelity Energy Central Fund | 109,230 |
| Fidelity Financials Central Fund | 1,259,377 |
| Fidelity Floating Rate Central Fund | 117,938 |
| Fidelity Health Care Central Fund | 935,862 |
| Fidelity High Income Central Fund 1 | 228,949 |
| Fidelity Industrials Central Fund | 596,422 |
| Fidelity Inflation-Protected Bond Index Central Fund | 216,571 |
| Fidelity Information Technology Central Fund | 4,174,076 |
| Fidelity International Credit Central Fund | 44,526 |
| Fidelity International Equity Central Fund | 2,062,054 |
| Fidelity Materials Central Fund | 258,675 |
| Fidelity Money Market Central Fund | 16,669 |
| Fidelity Real Estate Equity Central Fund | 49,895 |
| Fidelity Securities Lending Cash Central Fund | 2,736 |
| Fidelity Utilities Central Fund | 344,293 |
| Fidelity VIP Investment Grade Central Fund | 1,008,054 |
| Total | $13,575,328 |
Amounts in the income column in the above table include any capital gain distributions from underlying funds, which are presented in the corresponding line-item in the Statement of Operations if applicable.
Fiscal year to date information regarding the Fund’s investments in non-Money Market Central Funds, including the ownership percentage, is presented below.
| Affiliate | Value, beginning of period | Purchases(a) | Sales Proceeds(a) | Realized Gain (loss) | Change in Unrealized appreciation (depreciation) | Value, end of period | % ownership, end of period |
| Fidelity Commodity Strategy Central Fund | $4,618,829 | $1,468,400 | $4,285,958 | $302,455 | $(733,996) | $1,369,730 | 0.5% |
| Fidelity Communication Services Central Fund | 2,102,367 | 6,033,424 | 293,170 | (6,221) | (622,009) | 7,214,391 | 0.5% |
| Fidelity Consumer Discretionary Central Fund | 11,085,370 | 1,578,283 | 2,995,088 | 275,100 | (581,271) | 9,362,394 | 0.5% |
| Fidelity Consumer Staples Central Fund | 7,114,905 | 1,448,729 | 885,849 | (37,093) | (1,754,394) | 5,886,298 | 0.5% |
| Fidelity Emerging Markets Debt Central Fund | 1,152,461 | 110,772 | 128,761 | (3,021) | (110,536) | 1,020,915 | 0.8% |
| Fidelity Emerging Markets Equity Central Fund | 8,905,698 | 1,073,251 | 1,590,206 | 21,268 | (1,967,771) | 6,442,240 | 1.1% |
| Fidelity Energy Central Fund | 6,081,328 | 758,347 | 826,501 | (20,478) | (1,524,933) | 4,467,763 | 0.5% |
| Fidelity Financials Central Fund | 20,492,187 | 3,466,299 | 2,805,897 | (62,497) | (3,834,303) | 17,255,789 | 0.6% |
| Fidelity Floating Rate Central Fund | 2,229,350 | 214,584 | 257,521 | (2,732) | (93,079) | 2,090,602 | 0.1% |
| Fidelity Health Care Central Fund | 14,107,635 | 2,389,053 | 2,529,954 | 179,105 | 107,252 | 14,253,091 | 0.5% |
| Fidelity High Income Central Fund 1 | 4,328,513 | 1,265,183 | 1,400,198 | 118,953 | (469,579) | 3,842,872 | 0.9% |
| Fidelity Industrials Central Fund | 10,645,928 | 1,919,576 | 1,545,207 | (29,785) | (2,242,122) | 8,748,390 | 0.5% |
| Fidelity Inflation-Protected Bond Index Central Fund | 7,620,576 | 2,378,789 | 2,303,422 | 23,352 | (249,121) | 7,470,174 | 0.7% |
| Fidelity Information Technology Central Fund | 25,074,285 | 8,607,233 | 7,899,720 | (76,209) | (5,729,186) | 19,976,403 | 0.5% |
| Fidelity International Credit Central Fund | -- | 1,443,590 | 93,790 | (390) | (38,333) | 1,311,077 | 0.8% |
| Fidelity International Equity Central Fund | 35,274,088 | 3,446,985 | 7,420,731 | 410,524 | (7,174,537) | 24,536,329 | 1.1% |
| Fidelity Materials Central Fund | 3,266,226 | 619,695 | 413,064 | (26,745) | (992,296) | 2,453,816 | 0.5% |
| Fidelity Real Estate Equity Central Fund | 1,040,939 | 89,998 | 153,147 | 306 | (105,929) | 872,167 | 0.8% |
| Fidelity Utilities Central Fund | 3,084,957 | 687,892 | 509,273 | 18,636 | (64,606) | 3,217,606 | 0.5% |
| Fidelity VIP Investment Grade Central Fund | 39,083,985 | 6,947,323 | 15,176,037 | (342,633) | (838,987) | 29,673,651 | 0.6% |
| | $207,309,627 | $45,947,406 | $53,513,494 | $741,895 | $(29,019,736) | $171,465,698 | |
(a) Includes the value of shares purchased or redeemed through in-kind transactions, if applicable. See the Notes to Financial Statements for additional details.
Investment Valuation
The following is a summary of the inputs used, as of December 31, 2018, involving the Fund's assets and liabilities carried at fair value. The inputs or methodology used for valuing securities may not be an indication of the risk associated with investing in those securities. For more information on valuation inputs, and their aggregation into the levels used below, please refer to the Investment Valuation section in the accompanying Notes to Financial Statements.
| | Valuation Inputs at Reporting Date: |
| Description | Total | Level 1 | Level 2 | Level 3 |
| Investments in Securities: | | | | |
| U.S. Government and Government Agency Obligations | $188,980 | $-- | $188,980 | $-- |
| Fixed-Income Funds | 48,784,353 | 48,784,353 | -- | -- |
| Money Market Funds | 15,289,017 | 15,289,017 | -- | -- |
| Equity Funds | 139,097,887 | 139,097,887 | -- | -- |
| Total Investments in Securities: | $203,360,237 | $203,171,257 | $188,980 | $-- |
| Derivative Instruments: | | | | |
| Liabilities | | | | |
| Futures Contracts | $(324) | $(324) | $-- | $-- |
| Total Liabilities | $(324) | $(324) | $-- | $-- |
| Total Derivative Instruments: | $(324) | $(324) | $-- | $-- |
Value of Derivative Instruments
The following table is a summary of the Fund's value of derivative instruments by primary risk exposure as of December 31, 2018. For additional information on derivative instruments, please refer to the Derivative Instruments section in the accompanying Notes to Financial Statements.
| Primary Risk Exposure / Derivative Type | Value |
| | Asset | Liability |
| Equity Risk | | |
| Futures Contracts(a) | $0 | $(324) |
| Total Equity Risk | 0 | (324) |
| Total Value of Derivatives | $0 | $(324) |
(a) Reflects gross cumulative appreciation (depreciation) on futures contracts as presented in the Schedule of Investments. In the Statement of Assets and Liabilities, the period end daily variation margin is included in receivable or payable for daily variation margin on futures contracts, and the net cumulative appreciation (depreciation) is included in net unrealized appreciation (depreciation).
Other Information
The information in the following tables is based on the combined investments of the Fund and its pro-rata share of the investments of Fidelity's Central Funds, other than the Commodity Strategy and Money Market Central Funds. Percentages in the below tables are adjusted for the effect of TBA Sale Commitments.
The composition of credit quality ratings as a percentage of Total Net Assets is as follows (Unaudited):
| U.S. Government and U.S. Government Agency Obligations | 13.4% |
| AAA,AA,A | 1.5% |
| BBB | 3.7% |
| BB | 2.4% |
| B | 1.3% |
| CCC,CC,C | 0.4% |
| D | 0.0% |
| Not Rated | 0.8% |
| Equities | 69.6% |
| Short-Term Investments and Net Other Assets | 6.9% |
| | 100.0% |
We have used ratings from Moody's Investors Service, Inc. Where Moody's® ratings are not available, we have used S&P® ratings. All ratings are as of the date indicated and do not reflect subsequent changes.
Distribution of investments by country or territory of incorporation, as a percentage of Total Net Assets, is as follows (Unaudited):
| United States of America | 78.0% |
| United Kingdom | 3.0% |
| Japan | 2.4% |
| Switzerland | 1.7% |
| Canada | 1.7% |
| Framce | 1.5% |
| Netherlands | 1.5% |
| Germany | 1.4% |
| Cayman Islands | 1.2% |
| Others (Individually Less Than 1%) | 7.6% |
| | 100.0% |
See accompanying notes which are an integral part of the financial statements.
Financial Statements
Statement of Assets and Liabilities
| | | December 31, 2018 |
| Assets | | |
Investment in securities, at value (including securities loaned of $4,612,790) — See accompanying schedule:
Unaffiliated issuers (cost $17,257,659) | $16,605,522 | |
| Fidelity Central Funds (cost $191,933,348) | 186,754,715 | |
| Total Investment in Securities (cost $209,191,007) | | $203,360,237 |
| Cash | | 432,847 |
| Receivable for investments sold | | 1,389,881 |
| Receivable for fund shares sold | | 54,596 |
| Dividends receivable | | 3,501 |
| Distributions receivable from Fidelity Central Funds | | 19,704 |
| Prepaid expenses | | 335 |
| Other receivables | | 3,426 |
| Total assets | | 205,264,527 |
| Liabilities | | |
| Payable for investments purchased | $1,316,606 | |
| Payable for fund shares redeemed | 39,872 | |
| Accrued management fee | 91,347 | |
| Distribution and service plan fees payable | 842 | |
| Payable for daily variation margin on futures contracts | 11,900 | |
| Other affiliated payables | 26,407 | |
| Other payables and accrued expenses | 33,476 | |
| Collateral on securities loaned | 4,732,000 | |
| Total liabilities | | 6,252,450 |
| Net Assets | | $199,012,077 |
| Net Assets consist of: | | |
| Paid in capital | | $193,904,949 |
| Total distributable earnings (loss) | | 5,107,128 |
| Net Assets | | $199,012,077 |
| Net Asset Value and Maximum Offering Price | | |
| Initial Class: | | |
| Net Asset Value, offering price and redemption price per share ($89,477,331 ÷ 5,339,208 shares) | | $16.76 |
| Service Class: | | |
| Net Asset Value, offering price and redemption price per share ($2,621,382 ÷ 157,668 shares) | | $16.63 |
| Service Class 2: | | |
| Net Asset Value, offering price and redemption price per share ($2,903,710 ÷ 175,695 shares) | | $16.53 |
| Investor Class: | | |
| Net Asset Value, offering price and redemption price per share ($104,009,654 ÷ 6,244,083 shares) | | $16.66 |
See accompanying notes which are an integral part of the financial statements.
Statement of Operations
| | | Year ended December 31, 2018 |
| Investment Income | | |
| Dividends | | $412,344 |
| Interest | | 4,413 |
| Income from Fidelity Central Funds | | 4,290,522 |
| Total income | | 4,707,279 |
| Expenses | | |
| Management fee | $1,218,206 | |
| Transfer agent fees | 239,077 | |
| Distribution and service plan fees | 11,866 | |
| Accounting and security lending fees | 111,229 | |
| Custodian fees and expenses | 1,319 | |
| Independent trustees' fees and expenses | 1,045 | |
| Audit | 57,554 | |
| Legal | 8,494 | |
| Miscellaneous | 1,504 | |
| Total expenses before reductions | 1,650,294 | |
| Expense reductions | (4,362) | |
| Total expenses after reductions | | 1,645,932 |
| Net investment income (loss) | | 3,061,347 |
| Realized and Unrealized Gain (Loss) | | |
| Net realized gain (loss) on: | | |
| Investment securities: | | |
| Unaffiliated issuers | 1,024,872 | |
| Fidelity Central Funds | 751,689 | |
| Futures contracts | 544,025 | |
| Capital gain distributions from Fidelity Central Funds | 9,284,806 | |
| Total net realized gain (loss) | | 11,605,392 |
| Change in net unrealized appreciation (depreciation) on: | | |
| Investment securities: | | |
| Unaffiliated issuers | (2,247,049) | |
| Fidelity Central Funds | (29,019,802) | |
| Assets and liabilities in foreign currencies | (115) | |
| Futures contracts | (15,747) | |
| Total change in net unrealized appreciation (depreciation) | | (31,282,713) |
| Net gain (loss) | | (19,677,321) |
| Net increase (decrease) in net assets resulting from operations | | $(16,615,974) |
See accompanying notes which are an integral part of the financial statements.
Statement of Changes in Net Assets
| | Year ended December 31, 2018 | Year ended December 31, 2017 |
| Increase (Decrease) in Net Assets | | |
| Operations | | |
| Net investment income (loss) | $3,061,347 | $2,770,748 |
| Net realized gain (loss) | 11,605,392 | 12,409,284 |
| Change in net unrealized appreciation (depreciation) | (31,282,713) | 21,813,931 |
| Net increase (decrease) in net assets resulting from operations | (16,615,974) | 36,993,963 |
| Distributions to shareholders | (11,946,072) | – |
| Distributions to shareholders from net investment income | – | (2,705,207) |
| Distributions to shareholders from net realized gain | – | (28,042,611) |
| Total distributions | (11,946,072) | (30,747,818) |
| Share transactions - net increase (decrease) | (2,518,429) | 19,986,287 |
| Total increase (decrease) in net assets | (31,080,475) | 26,232,432 |
| Net Assets | | |
| Beginning of period | 230,092,552 | 203,860,120 |
| End of period | $199,012,077 | $230,092,552 |
| Other Information | | |
| Undistributed net investment income end of period | | $65,534 |
See accompanying notes which are an integral part of the financial statements.
Financial Highlights
VIP Asset Manager: Growth Portfolio Initial Class
| Years ended December 31, | 2018 | 2017 | 2016 | 2015 | 2014 |
| Selected Per–Share Data | | | | | |
| Net asset value, beginning of period | $19.21 | $18.81 | $18.90 | $19.15 | $18.30 |
| Income from Investment Operations | | | | | |
| Net investment income (loss)A | .26 | .25 | .24 | .27 | .23 |
| Net realized and unrealized gain (loss) | (1.69) | 2.97 | .20 | (.27) | .85 |
| Total from investment operations | (1.43) | 3.22 | .44 | – | 1.08 |
| Distributions from net investment income | (.28) | (.24) | (.26) | (.24) | (.21) |
| Distributions from net realized gain | (.74) | (2.58) | (.26) | (.01) | (.02) |
| Total distributions | (1.02) | (2.82) | (.53)B | (.25) | (.23) |
| Net asset value, end of period | $16.76 | $19.21 | $18.81 | $18.90 | $19.15 |
| Total ReturnC,D | (7.65)% | 18.73% | 2.52% | .03% | 5.87% |
| Ratios to Average Net AssetsE,F | | | | | |
| Expenses before reductions | .68% | .69% | .71% | .70% | .70% |
| Expenses net of fee waivers, if any | .68% | .69% | .71% | .70% | .70% |
| Expenses net of all reductions | .68% | .69% | .70% | .69% | .70% |
| Net investment income (loss) | 1.40% | 1.32% | 1.31% | 1.37% | 1.19% |
| Supplemental Data | | | | | |
| Net assets, end of period (000 omitted) | $89,477 | $106,903 | $99,882 | $108,324 | $122,484 |
| Portfolio turnover rateG | 32% | 29% | 142% | 49% | 38% |
A Calculated based on average shares outstanding during the period.
B Total distributions of $.53 per share is comprised of distributions from net investment income of $.263 and distributions from net realized gain of $.264 per share.
C Total returns do not reflect charges attributable to your insurance company's separate account. Inclusion of these charges would reduce the total returns shown.
D Total returns would have been lower if certain expenses had not been reduced during the applicable periods shown.
E Fees and expenses of any underlying Fidelity Central Funds are not included in the Fund's expense ratio. The Fund indirectly bears its proportionate share of the expenses of any underlying Fidelity Central Funds. Based on their most recent shareholder report date, the expenses of any underlying non-money market Fidelity Central Funds ranged from less than .005% to .07%.
F Expense ratios reflect operating expenses of the class. Expenses before reductions do not reflect amounts reimbursed by the investment adviser or reductions from brokerage service arrangements or reductions from other expense offset arrangements and do not represent the amount paid by the class during periods when reimbursements or reductions occur. Expenses net of fee waivers reflect expenses after reimbursement by the investment adviser but prior to reductions from brokerage service arrangements or other expense offset arrangements. Expenses net of all reductions represent the net expenses paid by the class.
G Amount does not include the portfolio activity of any underlying Fidelity Central Funds.
See accompanying notes which are an integral part of the financial statements.
VIP Asset Manager: Growth Portfolio Service Class
| Years ended December 31, | 2018 | 2017 | 2016 | 2015 | 2014 |
| Selected Per–Share Data | | | | | |
| Net asset value, beginning of period | $19.07 | $18.68 | $18.79 | $19.03 | $18.19 |
| Income from Investment Operations | | | | | |
| Net investment income (loss)A | .24 | .23 | .22 | .25 | .21 |
| Net realized and unrealized gain (loss) | (1.68) | 2.96 | .18 | (.26) | .84 |
| Total from investment operations | (1.44) | 3.19 | .40 | (.01) | 1.05 |
| Distributions from net investment income | (.26) | (.22) | (.25) | (.22) | (.19) |
| Distributions from net realized gain | (.74) | (2.58) | (.26) | (.01) | (.02) |
| Total distributions | (1.00) | (2.80) | (.51) | (.23) | (.21) |
| Net asset value, end of period | $16.63 | $19.07 | $18.68 | $18.79 | $19.03 |
| Total ReturnB,C | (7.75)% | 18.70% | 2.34% | (.03)% | 5.75% |
| Ratios to Average Net AssetsD,E | | | | | |
| Expenses before reductions | .78% | .79% | .81% | .80% | .80% |
| Expenses net of fee waivers, if any | .78% | .79% | .81% | .80% | .80% |
| Expenses net of all reductions | .78% | .79% | .80% | .79% | .80% |
| Net investment income (loss) | 1.30% | 1.22% | 1.21% | 1.27% | 1.09% |
| Supplemental Data | | | | | |
| Net assets, end of period (000 omitted) | $2,621 | $3,018 | $2,698 | $2,877 | $3,265 |
| Portfolio turnover rateF | 32% | 29% | 142% | 49% | 38% |
A Calculated based on average shares outstanding during the period.
B Total returns do not reflect charges attributable to your insurance company's separate account. Inclusion of these charges would reduce the total returns shown.
C Total returns would have been lower if certain expenses had not been reduced during the applicable periods shown.
D Fees and expenses of any underlying Fidelity Central Funds are not included in the Fund's expense ratio. The Fund indirectly bears its proportionate share of the expenses of any underlying Fidelity Central Funds. Based on their most recent shareholder report date, the expenses of any underlying non-money market Fidelity Central Funds ranged from less than .005% to .07%.
E Expense ratios reflect operating expenses of the class. Expenses before reductions do not reflect amounts reimbursed by the investment adviser or reductions from brokerage service arrangements or reductions from other expense offset arrangements and do not represent the amount paid by the class during periods when reimbursements or reductions occur. Expenses net of fee waivers reflect expenses after reimbursement by the investment adviser but prior to reductions from brokerage service arrangements or other expense offset arrangements. Expenses net of all reductions represent the net expenses paid by the class.
F Amount does not include the portfolio activity of any underlying Fidelity Central Funds.
See accompanying notes which are an integral part of the financial statements.
VIP Asset Manager: Growth Portfolio Service Class 2
| Years ended December 31, | 2018 | 2017 | 2016 | 2015 | 2014 |
| Selected Per–Share Data | | | | | |
| Net asset value, beginning of period | $18.95 | $18.58 | $18.70 | $18.94 | $18.10 |
| Income from Investment Operations | | | | | |
| Net investment income (loss)A | .21 | .20 | .19 | .21 | .17 |
| Net realized and unrealized gain (loss) | (1.67) | 2.94 | .18 | (.25) | .84 |
| Total from investment operations | (1.46) | 3.14 | .37 | (.04) | 1.01 |
| Distributions from net investment income | (.22) | (.20) | (.23) | (.19) | (.15) |
| Distributions from net realized gain | (.74) | (2.57) | (.26) | (.01) | (.02) |
| Total distributions | (.96) | (2.77) | (.49) | (.20) | (.17) |
| Net asset value, end of period | $16.53 | $18.95 | $18.58 | $18.70 | $18.94 |
| Total ReturnB,C | (7.88)% | 18.49% | 2.18% | (.18)% | 5.55% |
| Ratios to Average Net AssetsD,E | | | | | |
| Expenses before reductions | .93% | .94% | .96% | .96% | 1.01% |
| Expenses net of fee waivers, if any | .93% | .94% | .96% | .96% | 1.01% |
| Expenses net of all reductions | .93% | .94% | .95% | .95% | 1.00% |
| Net investment income (loss) | 1.15% | 1.07% | 1.06% | 1.11% | .88% |
| Supplemental Data | | | | | |
| Net assets, end of period (000 omitted) | $2,904 | $3,755 | $3,425 | $3,533 | $3,573 |
| Portfolio turnover rateF | 32% | 29% | 142% | 49% | 38% |
A Calculated based on average shares outstanding during the period.
B Total returns do not reflect charges attributable to your insurance company's separate account. Inclusion of these charges would reduce the total returns shown.
C Total returns would have been lower if certain expenses had not been reduced during the applicable periods shown.
D Fees and expenses of any underlying Fidelity Central Funds are not included in the Fund's expense ratio. The Fund indirectly bears its proportionate share of the expenses of any underlying Fidelity Central Funds. Based on their most recent shareholder report date, the expenses of any underlying non-money market Fidelity Central Funds ranged from less than .005% to .07%.
E Expense ratios reflect operating expenses of the class. Expenses before reductions do not reflect amounts reimbursed by the investment adviser or reductions from brokerage service arrangements or reductions from other expense offset arrangements and do not represent the amount paid by the class during periods when reimbursements or reductions occur. Expenses net of fee waivers reflect expenses after reimbursement by the investment adviser but prior to reductions from brokerage service arrangements or other expense offset arrangements. Expenses net of all reductions represent the net expenses paid by the class.
F Amount does not include the portfolio activity of any underlying Fidelity Central Funds.
See accompanying notes which are an integral part of the financial statements.
VIP Asset Manager: Growth Portfolio Investor Class
| Years ended December 31, | 2018 | 2017 | 2016 | 2015 | 2014 |
| Selected Per–Share Data | | | | | |
| Net asset value, beginning of period | $19.10 | $18.71 | $18.82 | $19.06 | $18.22 |
| Income from Investment Operations | | | | | |
| Net investment income (loss)A | .25 | .23 | .22 | .25 | .21 |
| Net realized and unrealized gain (loss) | (1.69) | 2.97 | .18 | (.25) | .85 |
| Total from investment operations | (1.44) | 3.20 | .40 | – | 1.06 |
| Distributions from net investment income | (.26) | (.23) | (.25) | (.23) | (.20) |
| Distributions from net realized gain | (.74) | (2.58) | (.26) | (.01) | (.02) |
| Total distributions | (1.00) | (2.81) | (.51) | (.24) | (.22) |
| Net asset value, end of period | $16.66 | $19.10 | $18.71 | $18.82 | $19.06 |
| Total ReturnB,C | (7.72)% | 18.68% | 2.35% | .01% | 5.79% |
| Ratios to Average Net AssetsD,E | | | | | |
| Expenses before reductions | .76% | .77% | .79% | .78% | .78% |
| Expenses net of fee waivers, if any | .76% | .77% | .79% | .78% | .78% |
| Expenses net of all reductions | .76% | .77% | .79% | .77% | .78% |
| Net investment income (loss) | 1.32% | 1.24% | 1.23% | 1.29% | 1.11% |
| Supplemental Data | | | | | |
| Net assets, end of period (000 omitted) | $104,010 | $116,417 | $97,855 | $106,942 | $86,687 |
| Portfolio turnover rateF | 32% | 29% | 142% | 49% | 38% |
A Calculated based on average shares outstanding during the period.
B Total returns do not reflect charges attributable to your insurance company's separate account. Inclusion of these charges would reduce the total returns shown.
C Total returns would have been lower if certain expenses had not been reduced during the applicable periods shown.
D Fees and expenses of any underlying Fidelity Central Funds are not included in the Fund's expense ratio. The Fund indirectly bears its proportionate share of the expenses of any underlying Fidelity Central Funds. Based on their most recent shareholder report date, the expenses of any underlying non-money market Fidelity Central Funds ranged from less than .005% to .07%.
E Expense ratios reflect operating expenses of the class. Expenses before reductions do not reflect amounts reimbursed by the investment adviser or reductions from brokerage service arrangements or reductions from other expense offset arrangements and do not represent the amount paid by the class during periods when reimbursements or reductions occur. Expenses net of fee waivers reflect expenses after reimbursement by the investment adviser but prior to reductions from brokerage service arrangements or other expense offset arrangements. Expenses net of all reductions represent the net expenses paid by the class.
F Amount does not include the portfolio activity of any underlying Fidelity Central Funds.
See accompanying notes which are an integral part of the financial statements.
Notes to Financial Statements
For the period ended December 31, 2018
1. Organization.
VIP Asset Manager: Growth Portfolio (the Fund) is a fund of Variable Insurance Products Fund V (the Trust) and is authorized to issue an unlimited number of shares. The Trust is registered under the Investment Company Act of 1940, as amended (the 1940 Act), as an open-end management investment company organized as a Massachusetts business trust. Shares of the Fund may only be purchased by insurance companies for the purpose of funding variable annuity or variable life insurance contracts. The Fund offers the following classes of shares: Initial Class shares, Service Class shares, Service Class 2 shares and Investor Class shares. All classes have equal rights and voting privileges, except for matters affecting a single class. Certain Underlying Funds incurred name changes since their most recent shareholder report. The names of the Underlying Funds are those in effect at period end.
2. Investments in Fidelity Central Funds.
The Fund invests in Fidelity Central Funds, which are open-end investment companies generally available only to other investment companies and accounts managed by the investment adviser and its affiliates. The Fund's Schedule of Investments lists each of the Fidelity Central Funds held as of period end, as an investment of the Fund, but does not include the underlying holdings of each Fidelity Central Fund. As an Investing Fund, the Fund indirectly bears its proportionate share of the expenses of the underlying Fidelity Central Funds.
Based on its investment objective, each Fidelity Central Fund may invest or participate in various investment vehicles or strategies that are similar to those of the Fund. These strategies are consistent with the investment objectives of the Fund and may involve certain economic risks which may cause a decline in value of each of the Fidelity Central Funds and thus a decline in the value of the Fund. The following summarizes the Fund's investment in each Fidelity Central Fund.
| Fidelity Central Fund | Investment Manager | Investment Objective | Investment Practices | Expense Ratio(a) |
| Fidelity Commodity Strategy Central Fund | Geode Capital Management, LLC (Geode) | Seeks to provide investment returns that correspond to the performance of the commodities market. | Investment in commodity-related investments through a wholly-owned subsidiary organized under the laws of the Cayman Islands
Futures | .06% |
| Fidelity Equity Central Funds | FMR Co., Inc. (FMRC) | Each fund seeks capital appreciation by investing primarily in common stocks, with a concentration in a particular industry. | Foreign Securities
Restricted Securities | Less than .005% to .01% |
| Fidelity Emerging Markets Debt Central Fund | FMRC | Seeks high total return by normally investing in debt securities of issuers in emerging markets and other debt investments that are tied economically to emerging markets. | Foreign Securities
Restricted Securities
| .01% |
| Fidelity Emerging Markets Equity Central Fund | FMRC | Seeks capital appreciation by investing primarily in equity securities of issuers in emerging markets. | Foreign Securities
Futures
| .07% |
| Fidelity International Equity Central Fund | FMRC | Seeks capital appreciation by investing primarily in non-U.S. based common stocks, including securities of issuers located in emerging markets. | Delayed Delivery & When Issued Securities
Foreign Securities
Futures
Restricted Securities
| .01% |
| Fidelity Floating Rate Central Fund | FMRC | Seeks a high level of income by normally investing in floating rate loans and other floating rate securities. | Loans & Direct Debt Instruments
Restricted Securities | Less than .005% |
| Fidelity High Income Central Fund 1 | FMRC | Seeks a high level of income and may also seek capital appreciation by investing primarily in debt securities, preferred stocks, and convertible securities, with an emphasis on lower-quality debt securities. | Loans & Direct Debt Instruments
Restricted Securities | Less than .005% |
| Fidelity Inflation-Protected Bond Index Central Fund | Fidelity Investment Money Management, Inc. (FIMM) | Seeks to provide investment results that correspond to the performance of the inflation-protected United States Treasury market, and may invest in derivatives. | | Less than .005% |
| Fidelity VIP Investment Grade Central Fund | FIMM | Seeks a high level of current income by normally investing in investment-grade debt securities and repurchase agreements. | Delayed Delivery & When Issued Securities
Repurchase Agreements
Restricted Securities
Swaps
| Less than .005% |
| Fidelity Real Estate Equity Central Fund | FMRC | Seeks above-average income and long-term capital growth by investing primarily in equity securities of issuers in the real estate industry. | Foreign Securities
Restricted Securities
| Less than .005% to .01% |
| Fidelity International Credit Central Fund | FMRC | Seeks a high level of current income by normally investing in debt securities of foreign issuers, including debt securities of issuers located in emerging markets. Foreign currency exposure is hedged utilizing foreign currency contracts. | Foreign Securities
Futures
Options
Restricted Securities
Swaps
| .01% |
| Fidelity Money Market Central Funds | FIMM | Each fund seeks to obtain a high level of current income consistent with the preservation of capital and liquidity. | Short-term Investments | Less than .005% |
(a) Expenses expressed as a percentage of average net assets and are as of each underlying Central Fund's most recent annual or semi-annual shareholder report.
An unaudited holdings listing for the Fund, which presents direct holdings as well as the pro-rata share of any securities and other investments held indirectly through its investment in underlying non-money market Fidelity Central Funds, is available at institutional.fidelity.com. A complete unaudited list of holdings for each Fidelity Central Fund is available upon request or at the Securities and Exchange Commission (the SEC) website at www.sec.gov. In addition, the financial statements of the Fidelity Central Funds which contain the significant accounting policies (including investment valuation policies) of those funds, which are not covered by the Fund's Report of Independent Registered Public Accounting Firm, are available on the SEC website or upon request.
3. Significant Accounting Policies.
The Fund is an investment company and applies the accounting and reporting guidance of the Financial Accounting Standards Board (FASB) Accounting Standards Codification Topic 946 Financial Services – Investments Companies. The financial statements have been prepared in conformity with accounting principles generally accepted in the United States of America (GAAP), which require management to make certain estimates and assumptions at the date of the financial statements. Actual results could differ from those estimates. Subsequent events, if any, through the date that the financial statements were issued have been evaluated in the preparation of the financial statements. The following summarizes the significant accounting policies of the Fund:
Investment Valuation. Investments are valued as of 4:00 p.m. Eastern time on the last calendar day of the period. The Board of Trustees (the Board) has delegated the day to day responsibility for the valuation of the Fund's investments to the Fair Value Committee (the Committee) established by the Fund's investment adviser. In accordance with valuation policies and procedures approved by the Board, the Fund attempts to obtain prices from one or more third party pricing vendors or brokers to value its investments. When current market prices, quotations or currency exchange rates are not readily available or reliable, investments will be fair valued in good faith by the Committee, in accordance with procedures adopted by the Board. Factors used in determining fair value vary by investment type and may include market or investment specific events, changes in interest rates and credit quality. The frequency with which these procedures are used cannot be predicted and they may be utilized to a significant extent. The Committee oversees the Fund's valuation policies and procedures and reports to the Board on the Committee's activities and fair value determinations. The Board monitors the appropriateness of the procedures used in valuing the Fund's investments and ratifies the fair value determinations of the Committee. The Fund categorizes the inputs to valuation techniques used to value its investments into a disclosure hierarchy consisting of three levels as shown below:
- Level 1 – quoted prices in active markets for identical investments
- Level 2 – other significant observable inputs (including quoted prices for similar investments, interest rates, prepayment speeds, etc.)
- Level 3 – unobservable inputs (including the Fund's own assumptions based on the best information available)
Valuation techniques used to value the Fund's investments by major category are as follows. Debt securities, including restricted securities, are valued based on evaluated prices received from third party pricing vendors or from brokers who make markets in such securities. U.S. government and government agency obligations are valued by pricing vendors who utilize matrix pricing which considers yield or price of bonds of comparable quality, coupon, maturity and type or by broker-supplied prices. When independent prices are unavailable or unreliable, debt securities may be valued utilizing pricing methodologies which consider similar factors that would be used by third party pricing vendors. Debt securities are generally categorized as Level 2 in the hierarchy but may be Level 3 depending on the circumstances.
Exchange-Traded Funds (ETFs) are valued at their last sale price or official closing price as reported by a third party pricing vendor on the primary market or exchange on which they are traded and are categorized as Level 1 in the hierarchy. In the event there were no sales during the day but the exchange reports a closing bid level, ETFs are valued at the closing bid and would be categorized as Level 1 in the hierarchy. In the event there was no closing bid, ETFs may be valued by another method that the Board believes reflects fair value in accordance with the Board's fair value pricing policies and may be categorized as Level 2 in the hierarchy.
Futures contracts are valued at the settlement price established each day by the board of trade or exchange on which they are traded and are categorized as Level 1 in the hierarchy. Investments in open-end mutual funds, including the Fidelity Central Funds, are valued at their closing net asset value (NAV) each business day and are categorized as Level 1 in the hierarchy.
Changes in valuation techniques may result in transfers in or out of an assigned level within the disclosure hierarchy. The aggregate value of investments by input level, as of December 31, 2018, is included at the end of the Fund's Schedule of Investments.
Foreign Currency. The Fund may use foreign currency contracts to facilitate transactions in foreign-denominated securities. Gains and losses from these transactions may arise from changes in the value of the foreign currency or if the counterparties do not perform under the contracts' terms.
Foreign-denominated assets, including investment securities, and liabilities are translated into U.S. dollars at the exchange rates at period end. Purchases and sales of investment securities, income and dividends received and expenses denominated in foreign currencies are translated into U.S. dollars at the exchange rate in effect on the transaction date.
The effects of exchange rate fluctuations on investments are included with the net realized and unrealized gain (loss) on investment securities. Other foreign currency transactions resulting in realized and unrealized gain (loss) are disclosed separately.
Investment Transactions and Income. For financial reporting purposes, the Fund's investment holdings and NAV include trades executed through the end of the last business day of the period. The NAV per share for processing shareholder transactions is calculated as of the close of business of the New York Stock Exchange (NYSE), normally 4:00 p.m. Eastern time and includes trades executed through the end of the prior business day. Gains and losses on securities sold are determined on the basis of identified cost and include proceeds received from litigation. Dividend income is recorded on the ex-dividend date, except for certain dividends from foreign securities where the ex-dividend date may have passed, which are recorded as soon as the Fund is informed of the ex-dividend date. Non-cash dividends included in dividend income, if any, are recorded at the fair market value of the securities received. Income and capital gain distributions from Fidelity Central Funds, if any, are recorded on the ex-dividend date. Certain distributions received by the Fund represent a return of capital or capital gain. The Fund determines the components of these distributions subsequent to the ex-dividend date, based upon receipt of tax filings or other correspondence relating to the underlying investment. These distributions are recorded as a reduction of cost of investments and/or as a realized gain. Interest income is accrued as earned and includes coupon interest and amortization of premium and accretion of discount on debt securities as applicable. Investment income is recorded net of foreign taxes withheld where recovery of such taxes is uncertain.
Class Allocations and Expenses. Investment income, realized and unrealized capital gains and losses, common expenses of the Fund, and certain fund-level expense reductions, if any, are allocated daily on a pro-rata basis to each class based on the relative net assets of each class to the total net assets of the Fund. Each class differs with respect to transfer agent and distribution and service plan fees incurred. Certain expense reductions may also differ by class. For the reporting period, the allocated portion of income and expenses to each class as a percent of its average net assets may vary due to the timing of recording these transactions in relation to fluctuating net assets of the classes. Expenses directly attributable to a fund are charged to that fund. Expenses attributable to more than one fund are allocated among the respective funds on the basis of relative net assets or other appropriate methods. Expense estimates are accrued in the period to which they relate and adjustments are made when actual amounts are known. Expenses included in the accompanying financial statements reflect the expenses of the Fund and do not include any expenses of the Fidelity Central Funds. Although not included in the Fund's expenses, the Fund indirectly bears its proportionate share of the Fidelity Central Funds' expenses through the impact of these expenses on each Fidelity Central Fund's NAV.
Income Tax Information and Distributions to Shareholders. Each year, the Fund intends to qualify as a regulated investment company under Subchapter M of the Internal Revenue Code, including distributing substantially all of its taxable income and realized gains. As a result, no provision for U.S. Federal income taxes is required. As of December 31, 2018, the Fund did not have any unrecognized tax benefits in the financial statements; nor is the Fund aware of any tax positions for which it is reasonably possible that the total amounts of unrecognized tax benefits will significantly change in the next twelve months. The Fund files a U.S. federal tax return, in addition to state and local tax returns as required. The Fund's federal income tax returns are subject to examination by the Internal Revenue Service (IRS) for a period of three fiscal years after they are filed. State and local tax returns may be subject to examination for an additional fiscal year depending on the jurisdiction. Foreign taxes are provided for based on the Fund's understanding of the tax rules and rates that exist in the foreign markets in which it invests.
Distributions are declared and recorded on the ex-dividend date. Income and capital gain distributions are declared separately for each class. Income and capital gain distributions are determined in accordance with income tax regulations, which may differ from GAAP.
Capital accounts within the financial statements are adjusted for permanent book-tax differences. These adjustments have no impact on net assets or the results of operations. Capital accounts are not adjusted for temporary book-tax differences which will reverse in a subsequent period.
Book-tax differences are primarily due to the short-term distributions from the Fidelity Central Funds, futures contracts, market discount, deferred trustees compensation and losses deferred due to wash sales and excise tax regulations.
As of period end, the cost and unrealized appreciation (depreciation) in securities, and derivatives if applicable, for federal income tax purposes were as follows:
| Gross unrealized appreciation | $4,595,195 |
| Gross unrealized depreciation | (9,620,121) |
| Net unrealized appreciation (depreciation) | $(5,024,926) |
| Tax Cost | $208,385,163 |
The tax-based components of distributable earnings as of period end were as follows:
| Undistributed long-term capital gain | $11,143,012 |
| Net unrealized appreciation (depreciation) on securities and other investments | $(5,024,898) |
The Fund intends to elect to defer to its next fiscal year $591,591 of capital losses recognized during the period November 1, 2018 to December 31, 2018.
The tax character of distributions paid was as follows:
| | December 31, 2018 | December 31, 2017 |
| Ordinary Income | $5,170,450 | $ 9,340,144 |
| Long-term Capital Gains | 6,775,622 | 21,407,674 |
| Total | $11,946,072 | $ 30,747,818 |
New Rule Issuance. During August 2018, the U.S. Securities and Exchange Commission issued Final Rule Release No. 33-10532, Disclosure Update and Simplification. This Final Rule includes amendments specific to registered investment companies that are intended to eliminate overlap in disclosure requirements between Regulation S-X and GAAP. In accordance with these amendments, certain line-items in the Fund's financial statements have been combined or removed for the current period as outlined in the table below.
| Financial Statement | Current Line-Item Presentation | Prior Line-Item Presentation |
| Statement of Assets and Liabilities | Total distributable earnings (loss) | Undistributed/Distributions in excess of/Accumulated net investment income (loss)
Accumulated/Undistributed net realized gain (loss)
Net unrealized appreciation (depreciation) |
| Statement of Changes in Net Assets | N/A - removed | Undistributed/Distributions in excess of/Accumulated net investment income (loss) end of period |
| Statement of Changes in Net Assets | Distributions to shareholders | Distributions to shareholders from net investment income
Distributions to shareholders from net realized gain |
| Distributions to Shareholders Note to Financial Statements | Distributions to shareholders | Distributions to shareholders from net investment income
Distributions to shareholders from net realized gain |
4. Derivative Instruments.
Risk Exposures and the Use of Derivative Instruments. The Fund's investment objective allows the Fund to enter into various types of derivative contracts, including futures contracts. Derivatives are investments whose value is primarily derived from underlying assets, indices or reference rates and may be transacted on an exchange or over-the-counter (OTC). Derivatives may involve a future commitment to buy or sell a specified asset based on specified terms, to exchange future cash flows at periodic intervals based on a notional principal amount, or for one party to make one or more payments upon the occurrence of specified events in exchange for periodic payments from the other party.
The Fund used derivatives to increase returns and to manage exposure to certain risks as defined below. The success of any strategy involving derivatives depends on analysis of numerous economic factors, and if the strategies for investment do not work as intended, the Fund may not achieve its objectives.
The Fund's use of derivatives increased or decreased its exposure to the following risk:
| Equity Risk | Equity risk relates to the fluctuations in the value of financial instruments as a result of changes in market prices (other than those arising from interest rate risk or foreign exchange risk), whether caused by factors specific to an individual investment, its issuer, or all factors affecting all instruments traded in a market or market segment.
|
The Fund is also exposed to additional risks from investing in derivatives, such as liquidity risk and counterparty credit risk. Liquidity risk is the risk that the Fund will be unable to close out the derivative in the open market in a timely manner. Counterparty credit risk is the risk that the counterparty will not be able to fulfill its obligation to the Fund. Counterparty credit risk related to exchange-traded futures contracts may be mitigated by the protection provided by the exchange on which they trade.
Investing in derivatives may involve greater risks than investing in the underlying assets directly and, to varying degrees, may involve risk of loss in excess of any initial investment and collateral received and amounts recognized in the Statement of Assets and Liabilities. In addition, there may be the risk that the change in value of the derivative contract does not correspond to the change in value of the underlying instrument.
Futures Contracts. A futures contract is an agreement between two parties to buy or sell a specified underlying instrument for a fixed price at a specified future date. The Fund used futures contracts to manage its exposure to the stock market.
Upon entering into a futures contract, a fund is required to deposit either cash or securities (initial margin) with a clearing broker in an amount equal to a certain percentage of the face value of the contract. Futures contracts are marked-to-market daily and subsequent daily payments (variation margin) are made or received by a fund depending on the daily fluctuations in the value of the futures contracts and are recorded as unrealized appreciation or (depreciation). This receivable and/or payable, if any, is included in daily variation margin on futures contracts in the Statement of Assets and Liabilities. Realized gain or (loss) is recorded upon the expiration or closing of a futures contract. The net realized gain (loss) and change in net unrealized appreciation (depreciation) on futures contracts during the period is presented in the Statement of Operations.
Any open futures contracts at period end are presented in the Schedule of Investments under the caption "Futures Contracts". The notional amount at value reflects each contract's exposure to the underlying instrument or index at period end and is representative of volume of activity during the period. Securities deposited to meet initial margin requirements are identified in the Schedule of Investments.
5. Purchases and Redemptions of Underlying Fund Shares.
Purchases and redemptions of the Underlying Fund shares, including in-kind transactions, aggregated $70,522,638 and $78,225,514, respectively.
6. Fees and Other Transactions with Affiliates.
Management Fee. Fidelity Management & Research Company (the investment adviser) and its affiliates provide the Fund with investment management related services for which the Fund pays a monthly management fee. The management fee is the sum of an individual fund fee rate that is based on an annual rate of .30% of the Fund's average net assets and an annualized group fee rate that averaged .24% during the period. The group fee rate is based upon the average net assets of all the mutual funds advised by the investment adviser, including any mutual funds previously advised by the investment adviser that are currently advised by Fidelity SelectCo, LLC, an affiliate of the investment adviser. The group fee rate decreases as assets under management increase and increases as assets under management decrease. For the reporting period, the total annual management fee rate was .54% of the Fund's average net assets.
The investment adviser pays a portion of the management fees received from the Fund to the Fidelity Central Funds' investment advisers, who are also affiliates, for managing the assets of the Fidelity Central Funds.
Distribution and Service Plan Fees. In accordance with Rule 12b-1 of the 1940 Act, the Fund has adopted separate 12b-1 Plans for each Service Class of shares. Each Service Class pays Fidelity Distributors Corporation (FDC), an affiliate of the investment adviser, a service fee. For the period, the service fee is based on an annual rate of .10% of Service Class' average net assets and .25% of Service Class 2's average net assets.
For the period, total fees, all of which were re-allowed to insurance companies for the distribution of shares and providing shareholder support services, were as follows:
| Service Class | $2,905 |
| Service Class 2 | 8,961 |
| | $11,866 |
Transfer Agent Fees. Fidelity Investments Institutional Operations Company, Inc. (FIIOC), an affiliate of the investment adviser, is the Fund's transfer, dividend disbursing, and shareholder servicing agent. FIIOC receives an asset-based fee with respect to each class. Each class pays a fee for transfer agent services, typesetting and printing and mailing of shareholder reports, excluding mailing of proxy statements, equal to an annual rate of class-level average net assets. The annual rate for Investor Class is .15% and the annual rate for all other classes is .07%. For the period, transfer agent fees for each class were as follows:
| Initial Class | $66,060 |
| Service Class | 1,879 |
| Service Class 2 | 2,318 |
| Investor Class | 168,820 |
| | $239,077 |
Accounting and Security Lending Fees. Fidelity Service Company, Inc. (FSC), an affiliate of the investment adviser, maintains the Fund's accounting records. The accounting fee is based on the level of average net assets for each month. Under a separate contract, FSC administers the security lending program. The security lending fee is based on the number and duration of lending transactions. For the period, the fees were equivalent to an annual rate of .05%.
Brokerage Commissions. The Fund placed a portion of its portfolio transactions with brokerage firms which are affiliates of the investment adviser. Brokerage commissions are included in net realized gain (loss) and change in net unrealized appreciation (depreciation) in the Statement of Operations. The commissions paid to these affiliated firms were $191 for the period.
Interfund Trades. The Fund may purchase from or sell securities to other Fidelity Funds under procedures adopted by the Board. The procedures have been designed to ensure these interfund trades are executed in accordance with Rule 17a-7 of the 1940 Act. Interfund trades are included within the respective purchases and sales amounts shown in the Purchases and Sales of Investments note.
Reallocation of Underlying Fund Investments. During the period, the investment adviser reallocated portions of investments of the Fund. This involved taxable redemptions of Fidelity Consumer Discretionary Central Fund and Fidelity Information Technology Central Fund for investments, including accrued interest, with a value of $5,291,161 and a non-taxable exchange of those investments, including accrued interest, for 28,806 shares of Fidelity Communication Services Central Fund (formerly Fidelity Telecom Services Central Fund). Net realized gain of $140,418 on redemptions from Fidelity Consumer Discretionary Central Fund and Fidelity Information Technology Central Fund in connection with the reallocation is included in the Statement of Operations as "Net realized gain (loss) on Fidelity Central Funds". Fidelity Communication Services Central Fund, Fidelity Consumer Discretionary Central Fund and Fidelity Information Technology Central Fund are affiliated investment companies managed by FMR.
7. Committed Line of Credit.
The Fund participates with other funds managed by the investment adviser or an affiliate in a $4.25 billion credit facility (the "line of credit") to be utilized for temporary or emergency purposes to fund shareholder redemptions or for other short-term liquidity purposes. The Fund has agreed to pay commitment fees on its pro-rata portion of the line of credit, which amounted to $624 and is reflected in Miscellaneous expenses on the Statement of Operations. During the period, the Fund did not borrow on this line of credit.
8. Security Lending.
The Fund lends portfolio securities through a lending agent from time to time in order to earn additional income. For equity securities, a lending agent is used and may loan securities to certain qualified borrowers, including Fidelity Capital Markets (FCM), a broker-dealer affiliated with the Fund. On the settlement date of the loan, the Fund receives collateral (in the form of U.S. Treasury obligations, letters of credit and/or cash) against the loaned securities and maintains collateral in an amount not less than 100% of the market value of the loaned securities during the period of the loan. The market value of the loaned securities is determined at the close of business of the Fund and any additional required collateral is delivered to the Fund on the next business day. The Fund or borrower may terminate the loan at any time, and if the borrower defaults on its obligation to return the securities loaned because of insolvency or other reasons, the Fund may apply collateral received from the borrower against the obligation. The Fund may experience delays and costs in recovering the securities loaned. Any cash collateral received is invested in the Fidelity Securities Lending Cash Central Fund. The value of loaned securities and cash collateral at period end are disclosed on the Fund's Statement of Assets and Liabilities. Security lending income represents the income earned on investing cash collateral, less rebates paid to borrowers and any lending agent fees associated with the loan, plus any premium payments received for lending certain types of securities. Security lending income is presented in the Statement of Operations as a component of income from Fidelity Central Funds. Total security lending income during the period amounted to $2,736. During the period, there were no securities loaned to FCM.
9. Expense Reductions.
Commissions paid to certain brokers with whom the investment adviser, or its affiliates, places trades on behalf of the Fund include an amount in addition to trade execution, which may be rebated back to the Fund to offset certain expenses. This amount totaled $1,759 for the period. In addition, through arrangements with the Fund's custodian, credits realized as a result of certain uninvested cash balances were used to reduce the Fund's expenses. During the period, these credits reduced the Fund's custody expenses by $324.
In addition, during the period the investment adviser reimbursed and/or waived a portion of fund-level operating expenses in the amount of $2,279.
10. Distributions to Shareholders.
Distributions to shareholders of each class were as follows:
| | Year ended
December 31, 2018 | Year ended
December 31, 2017 |
| Distributions to shareholders | | |
| Initial Class | $5,474,519 | $– |
| Service Class | 154,464 | – |
| Service Class 2 | 182,137 | – |
| Investor Class | 6,134,952 | – |
| Total | $11,946,072 | $– |
| From net investment income | | |
| Initial Class | $– | $1,291,934 |
| Service Class | – | 34,278 |
| Service Class 2 | – | 37,438 |
| Investor Class | – | 1,341,557 |
| Total | $– | $2,705,207 |
| From net realized gain | | |
| Initial Class | $– | $13,574,774 |
| Service Class | – | 360,108 |
| Service Class 2 | – | 472,265 |
| Investor Class | – | 13,635,464 |
| Total | $– | $28,042,611 |
11. Share Transactions.
Transactions for each class of shares were as follows:
| | Shares | Shares | Dollars | Dollars |
| | Year ended December 31, 2018 | Year ended December 31, 2017 | Year ended December 31, 2018 | Year ended December 31, 2017 |
| Initial Class | | | | |
| Shares sold | 98,417 | 144,059 | $1,851,440 | $2,698,610 |
| Reinvestment of distributions | 310,740 | 833,733 | 5,474,519 | 14,866,708 |
| Shares redeemed | (633,775) | (724,915) | (11,956,373) | (13,492,453) |
| Net increase (decrease) | (224,618) | 252,877 | $(4,630,414) | $4,072,865 |
| Service Class | | | | |
| Shares sold | 2,011 | 13,458 | $36,529 | $257,481 |
| Reinvestment of distributions | 8,837 | 22,262 | 154,464 | 394,386 |
| Shares redeemed | (11,435) | (21,883) | (213,769) | (404,975) |
| Net increase (decrease) | (587) | 13,837 | $(22,776) | $246,892 |
| Service Class 2 | | | | |
| Shares sold | 27,263 | 16,878 | $509,323 | $308,125 |
| Reinvestment of distributions | 10,440 | 29,002 | 182,137 | 509,703 |
| Shares redeemed | (60,168) | (32,013) | (1,122,114) | (580,303) |
| Net increase (decrease) | (22,465) | 13,867 | $(430,654) | $237,525 |
| Investor Class | | | | |
| Shares sold | 588,689 | 799,928 | $11,085,014 | $14,686,256 |
| Reinvestment of distributions | 350,489 | 843,432 | 6,134,952 | 14,977,021 |
| Shares redeemed | (789,657) | (778,009) | (14,654,551) | (14,234,272) |
| Net increase (decrease) | 149,521 | 865,351 | $2,565,415 | $15,429,005 |
12. Other.
The Fund's organizational documents provide former and current trustees and officers with a limited indemnification against liabilities arising in connection with the performance of their duties to the Fund. In the normal course of business, the Fund may also enter into contracts that provide general indemnifications. The Fund's maximum exposure under these arrangements is unknown as this would be dependent on future claims that may be made against the Fund. The risk of material loss from such claims is considered remote.
At the end of the period, the investment adviser or its affiliates were the owners of record of 86% of the total outstanding shares of the Fund.
Report of Independent Registered Public Accounting Firm
To the Trustees of Variable Insurance Products Fund V and Shareholders of VIP Asset Manager: Growth Portfolio:
Opinion on the Financial Statements and Financial Highlights
We have audited the accompanying statement of assets and liabilities of VIP Asset Manager Growth Portfolio (the "Fund"), a fund of Variable Insurance Products Fund V, including the schedule of investments, as of December 31, 2018, and the related statement of operations for the year then ended, the statement of changes in net assets for each of the two years in the period then ended, the financial highlights for each of the five years in the period then ended, and the related notes. In our opinion, the financial statements and financial highlights present fairly, in all material respects, the financial position of the Fund as of December 31, 2018, and the results of its operations for the year then ended, the changes in its net assets for each of the two years in the period then ended, and the financial highlights for each of the five years in the period then ended, in conformity with accounting principles generally accepted in the United States of America.
Basis for Opinion
These financial statements and financial highlights are the responsibility of the Fund's management. Our responsibility is to express an opinion on the Fund's financial statements and financial highlights based on our audits. We are a public accounting firm registered with the Public Company Accounting Oversight Board (United States) (PCAOB) and are required to be independent with respect to the Fund in accordance with the U.S. federal securities laws and the applicable rules and regulations of the Securities and Exchange Commission and the PCAOB.
We conducted our audits in accordance with the standards of the PCAOB. Those standards require that we plan and perform the audit to obtain reasonable assurance about whether the financial statements and financial highlights are free of material misstatement, whether due to error or fraud. The Fund is not required to have, nor were we engaged to perform, an audit of its internal control over financial reporting. As part of our audits we are required to obtain an understanding of internal control over financial reporting but not for the purpose of expressing an opinion on the effectiveness of the Fund’s internal control over financial reporting. Accordingly, we express no such opinion.
Our audits included performing procedures to assess the risks of material misstatement of the financial statements and financial highlights, whether due to error or fraud, and performing procedures that respond to those risks. Such procedures included examining, on a test basis, evidence regarding the amounts and disclosures in the financial statements and financial highlights. Our audits also included evaluating the accounting principles used and significant estimates made by management, as well as evaluating the overall presentation of the financial statements and financial highlights. Our procedures included confirmation of securities owned as of December 31, 2018, by correspondence with the custodians and brokers; when replies were not received from brokers, we performed other auditing procedures. We believe that our audits provide a reasonable basis for our opinion.
/s/ Deloitte & Touche LLP
Boston, Massachusetts
February 19, 2019
We have served as the auditor of one or more of the Fidelity investment companies since 1999.
Trustees and Officers
The Trustees, Members of the Advisory Board (if any), and officers of the trust and fund, as applicable, are listed below. The Board of Trustees governs the fund and is responsible for protecting the interests of shareholders. The Trustees are experienced executives who meet periodically throughout the year to oversee the fund's activities, review contractual arrangements with companies that provide services to the fund, oversee management of the risks associated with such activities and contractual arrangements, and review the fund's performance. Each of the Trustees oversees 260 funds.
The Trustees hold office without limit in time except that (a) any Trustee may resign; (b) any Trustee may be removed by written instrument, signed by at least two-thirds of the number of Trustees prior to such removal; (c) any Trustee who requests to be retired or who has become incapacitated by illness or injury may be retired by written instrument signed by a majority of the other Trustees; and (d) any Trustee may be removed at any special meeting of shareholders by a two-thirds vote of the outstanding voting securities of the trust. Each Trustee who is not an interested person (as defined in the 1940 Act) of the trust and the fund is referred to herein as an Independent Trustee. Each Independent Trustee shall retire not later than the last day of the calendar year in which his or her 75th birthday occurs. The Independent Trustees may waive this mandatory retirement age policy with respect to individual Trustees. Officers and Advisory Board Members hold office without limit in time, except that any officer or Advisory Board Member may resign or may be removed by a vote of a majority of the Trustees at any regular meeting or any special meeting of the Trustees. Except as indicated, each individual has held the office shown or other offices in the same company for the past five years.
The fund’s Statement of Additional Information (SAI) includes more information about the Trustees. To request a free copy, call Fidelity at 1-877-208-0098.
Experience, Skills, Attributes, and Qualifications of the Trustees. The Governance and Nominating Committee has adopted a statement of policy that describes the experience, qualifications, attributes, and skills that are necessary and desirable for potential Independent Trustee candidates (Statement of Policy). The Board believes that each Trustee satisfied at the time he or she was initially elected or appointed a Trustee, and continues to satisfy, the standards contemplated by the Statement of Policy. The Governance and Nominating Committee also engages professional search firms to help identify potential Independent Trustee candidates who have the experience, qualifications, attributes, and skills consistent with the Statement of Policy. From time to time, additional criteria based on the composition and skills of the current Independent Trustees, as well as experience or skills that may be appropriate in light of future changes to board composition, business conditions, and regulatory or other developments, have also been considered by the professional search firms and the Governance and Nominating Committee. In addition, the Board takes into account the Trustees' commitment and participation in Board and committee meetings, as well as their leadership of standing and ad hoc committees throughout their tenure.
In determining that a particular Trustee was and continues to be qualified to serve as a Trustee, the Board has considered a variety of criteria, none of which, in isolation, was controlling. The Board believes that, collectively, the Trustees have balanced and diverse experience, qualifications, attributes, and skills, which allow the Board to operate effectively in governing the fund and protecting the interests of shareholders. Information about the specific experience, skills, attributes, and qualifications of each Trustee, which in each case led to the Board's conclusion that the Trustee should serve (or continue to serve) as a trustee of the fund, is provided below.
Board Structure and Oversight Function. Abigail P. Johnson is an interested person and currently serves as Chairman. The Trustees have determined that an interested Chairman is appropriate and benefits shareholders because an interested Chairman has a personal and professional stake in the quality and continuity of services provided to the fund. Independent Trustees exercise their informed business judgment to appoint an individual of their choosing to serve as Chairman, regardless of whether the Trustee happens to be independent or a member of management. The Independent Trustees have determined that they can act independently and effectively without having an Independent Trustee serve as Chairman and that a key structural component for assuring that they are in a position to do so is for the Independent Trustees to constitute a substantial majority for the Board. The Independent Trustees also regularly meet in executive session. Arthur E. Johnson serves as Chairman of the Independent Trustees and as such (i) acts as a liaison between the Independent Trustees and management with respect to matters important to the Independent Trustees and (ii) with management prepares agendas for Board meetings.
Fidelity® funds are overseen by different Boards of Trustees. The fund's Board oversees Fidelity's investment-grade bond, money market, asset allocation and certain equity funds, and other Boards oversee Fidelity's high income and other equity funds. The asset allocation funds may invest in Fidelity® funds that are overseen by such other Boards. The use of separate Boards, each with its own committee structure, allows the Trustees of each group of Fidelity® funds to focus on the unique issues of the funds they oversee, including common research, investment, and operational issues. On occasion, the separate Boards establish joint committees to address issues of overlapping consequences for the Fidelity® funds overseen by each Board.
The Trustees operate using a system of committees to facilitate the timely and efficient consideration of all matters of importance to the Trustees, the fund, and fund shareholders and to facilitate compliance with legal and regulatory requirements and oversight of the fund's activities and associated risks. The Board, acting through its committees, has charged FMR and its affiliates with (i) identifying events or circumstances the occurrence of which could have demonstrably adverse effects on the fund's business and/or reputation; (ii) implementing processes and controls to lessen the possibility that such events or circumstances occur or to mitigate the effects of such events or circumstances if they do occur; and (iii) creating and maintaining a system designed to evaluate continuously business and market conditions in order to facilitate the identification and implementation processes described in (i) and (ii) above. Because the day-to-day operations and activities of the fund are carried out by or through FMR, its affiliates, and other service providers, the fund's exposure to risks is mitigated but not eliminated by the processes overseen by the Trustees. While each of the Board's committees has responsibility for overseeing different aspects of the fund's activities, oversight is exercised primarily through the Operations and Audit Committees. In addition, an ad hoc Board committee of Independent Trustees has worked with FMR to enhance the Board's oversight of investment and financial risks, legal and regulatory risks, technology risks, and operational risks, including the development of additional risk reporting to the Board. Appropriate personnel, including but not limited to the fund's Chief Compliance Officer (CCO), FMR's internal auditor, the independent accountants, the fund's Treasurer and portfolio management personnel, make periodic reports to the Board's committees, as appropriate, including an annual review of Fidelity's risk management program for the Fidelity® funds. The responsibilities of each standing committee, including their oversight responsibilities, are described further under "Standing Committees of the Trustees."
Interested Trustees*:
Correspondence intended for a Trustee who is an interested person may be sent to Fidelity Investments, 245 Summer Street, Boston, Massachusetts 02210.
Name, Year of Birth; Principal Occupations and Other Relevant Experience+
Abigail P. Johnson (1961)
Year of Election or Appointment: 2009
Trustee
Chairman of the Board of Trustees
Ms. Johnson also serves as Trustee of other Fidelity® funds. Ms. Johnson serves as Chairman (2016-present), Chief Executive Officer (2014-present), and Director (2007-present) of FMR LLC (diversified financial services company), President of Fidelity Financial Services (2012-present) and President of Personal, Workplace and Institutional Services (2005-present). Ms. Johnson is Chairman and Director of FMR Co., Inc. (investment adviser firm, 2011-present) and Chairman and Director of FMR (investment adviser firm, 2011-present). Previously, Ms. Johnson served as Vice Chairman (2007-2016) and President (2013-2016) of FMR LLC, President and a Director of FMR (2001-2005), a Trustee of other investment companies advised by FMR, Fidelity Investments Money Management, Inc. (investment adviser firm), and FMR Co., Inc. (2001-2005), Senior Vice President of the Fidelity® funds (2001-2005), and managed a number of Fidelity® funds. Ms. Abigail P. Johnson and Mr. Arthur E. Johnson are not related.
Jennifer Toolin McAuliffe (1959)
Year of Election or Appointment: 2016
Trustee
Ms. McAuliffe also serves as Trustee of other Fidelity® funds. Ms. McAuliffe previously served as a Member of the Advisory Board of certain Fidelity® funds (2016) and as Co-Head of Fixed Income of Fidelity Investments Limited (now known as FIL Limited (FIL)) (diversified financial services company). Earlier roles at FIL included Director of Research for FIL’s credit and quantitative teams in London, Hong Kong and Tokyo. Ms. McAuliffe also was the Director of Research for taxable and municipal bonds at Fidelity Investments Money Management, Inc. Ms. McAuliffe is also a director or trustee of several not-for-profit entities.
* Determined to be an “Interested Trustee” by virtue of, among other things, his or her affiliation with the trust or various entities under common control with FMR.
+ The information includes the Trustee's principal occupation during the last five years and other information relating to the experience, attributes, and skills relevant to the Trustee's qualifications to serve as a Trustee, which led to the conclusion that the Trustee should serve as a Trustee for the fund.
Independent Trustees:
Correspondence intended for an Independent Trustee may be sent to Fidelity Investments, P.O. Box 55235, Boston, Massachusetts 02205-5235.
Name, Year of Birth; Principal Occupations and Other Relevant Experience+
Elizabeth S. Acton (1951)
Year of Election or Appointment: 2013
Trustee
Ms. Acton also serves as Trustee of other Fidelity® funds. Prior to her retirement in April 2012, Ms. Acton was Executive Vice President, Finance (2011-2012), Executive Vice President, Chief Financial Officer (2002-2011), and Treasurer (2004-2005) of Comerica Incorporated (financial services). Prior to joining Comerica, Ms. Acton held a variety of positions at Ford Motor Company (1983-2002), including Vice President and Treasurer (2000-2002) and Executive Vice President and Chief Financial Officer of Ford Motor Credit Company (1998-2000). Ms. Acton currently serves as a member of the Board of Directors and Audit and Finance Committees of Beazer Homes USA, Inc. (homebuilding, 2012-present). Previously, Ms. Acton served as a Member of the Advisory Board of certain Fidelity® funds (2013-2016).
Ann E. Dunwoody (1953)
Year of Election or Appointment: 2018
Trustee
General Dunwoody also serves as Trustee of other Fidelity® funds. General Dunwoody (United States Army, Retired) was the first woman in U.S. military history to achieve the rank of four-star general and prior to her retirement in 2012 held a variety of positions within the U.S. Army, including Commanding General, U.S. Army Material Command (2008-2012). She is the President of First to Four LLC (leadership and mentoring services, 2012-present). She also serves as a member of the Board of Directors and Nominating and Corporate Governance Committee of L3 Technologies, Inc. (communication, electronic, sensor, and aerospace systems, 2013-present), Board of Directors and Nomination and Corporate Governance Committees of Kforce Inc. (professional staffing services, 2016-present) and Board of Directors of Automattic Inc. (software engineering, 2018-present). Previously, General Dunwoody served as a Member of the Advisory Board of certain Fidelity® funds (2018), a member of the Board of Directors and Audit and Sustainability and Corporate Responsibility Committees of Republic Services, Inc. (waste collection, disposal and recycling, 2013-2016). Ms. Dunwoody also serves on several boards for non-profit organizations, including as a member of the Board of Directors, Chair of the Nomination and Governance Committee and member of the Audit Committee of Logistics Management Institute (consulting non-profit, 2012-present), a member of the Board of Directors of the Army Historical Foundation (2015-present), a member of the Council of Trustees for the Association of the United States Army (advocacy non-profit, 2013-present) and a member of the Board of Trustees of Florida Institute of Technology (2015-present) and ThanksUSA (military family education non-profit, 2014-present).
John Engler (1948)
Year of Election or Appointment: 2014
Trustee
Mr. Engler also serves as Trustee of other Fidelity® funds. He serves on the board of directors for Universal Forest Products (manufacturer and distributor of wood and wood-alternative products, 2003-present) and K12 Inc. (technology-based education company, 2012-present). Previously, Mr. Engler served as interim president of Michigan State University (2018-2019), a Member of the Advisory Board of certain Fidelity® funds (2014-2016), president of the Business Roundtable (2011-2017), a trustee of The Munder Funds (2003-2014), president and CEO of the National Association of Manufacturers (2004-2011), member of the Board of Trustees of the Annie E. Casey Foundation (2004-2015), and as governor of Michigan (1991-2003). He is a past chairman of the National Governors Association.
Robert F. Gartland (1951)
Year of Election or Appointment: 2010
Trustee
Mr. Gartland also serves as Trustee of other Fidelity® funds. Mr. Gartland is Chairman and an investor in Gartland & Mellina Group Corp. (consulting, 2009-present). Previously, Mr. Gartland served as a partner and investor of Vietnam Partners LLC (investments and consulting, 2008-2011). Prior to his retirement, Mr. Gartland held a variety of positions at Morgan Stanley (financial services, 1979-2007), including Managing Director (1987-2007), and Chase Manhattan Bank (1975-1978).
Arthur E. Johnson (1947)
Year of Election or Appointment: 2008
Trustee
Chairman of the Independent Trustees
Mr. Johnson also serves as Trustee of other Fidelity® funds. Mr. Johnson serves as a member of the Board of Directors of Eaton Corporation plc (diversified power management, 2009-present) and Booz Allen Hamilton (management consulting, 2011-present). Prior to his retirement, Mr. Johnson served as Senior Vice President of Corporate Strategic Development of Lockheed Martin Corporation (defense contractor, 1999-2009). He previously served on the Board of Directors of IKON Office Solutions, Inc. (1999-2008), AGL Resources, Inc. (holding company, 2002-2016), and Delta Airlines (2005-2007). Mr. Arthur E. Johnson is not related to Ms. Abigail P. Johnson.
Michael E. Kenneally (1954)
Year of Election or Appointment: 2009
Trustee
Vice Chairman of the Independent Trustees
Mr. Kenneally also serves as Trustee of other Fidelity® funds. Prior to his retirement, Mr. Kenneally served as Chairman and Global Chief Executive Officer of Credit Suisse Asset Management. Before joining Credit Suisse, he was an Executive Vice President and Chief Investment Officer for Bank of America Corporation. Earlier roles at Bank of America included Director of Research, Senior Portfolio Manager and Research Analyst, and Mr. Kenneally was awarded the Chartered Financial Analyst (CFA) designation in 1991.
Marie L. Knowles (1946)
Year of Election or Appointment: 2001
Trustee
Ms. Knowles also serves as Trustee of other Fidelity® funds. Prior to Ms. Knowles' retirement in June 2000, she served as Executive Vice President and Chief Financial Officer of Atlantic Richfield Company (ARCO) (diversified energy, 1996-2000). From 1993 to 1996, she was a Senior Vice President of ARCO and President of ARCO Transportation Company (pipeline and tanker operations). Ms. Knowles currently serves as a Director and Chairman of the Audit Committee of McKesson Corporation (healthcare service, since 2002). Ms. Knowles is a member of the Board of the Santa Catalina Island Company (real estate, 2009-present). Ms. Knowles is a Member of the Investment Company Institute Board of Governors and a Member of the Governing Council of the Independent Directors Council (2014-present). She also serves as a member of the Advisory Board for the School of Engineering of the University of Southern California. Previously, Ms. Knowles served as a Director of Phelps Dodge Corporation (copper mining and manufacturing, 1994-2007), URS Corporation (engineering and construction, 2000-2003) and America West (airline, 1999-2002). Ms. Knowles previously served as Chairman (2015-2018) and Vice Chairman (2012-2015) of the Independent Trustees of certain Fidelity® funds.
Mark A. Murray (1954)
Year of Election or Appointment: 2016
Trustee
Mr. Murray also serves as Trustee of other Fidelity® funds. Mr. Murray is Vice Chairman (2013-present) of Meijer, Inc. (regional retail chain). Previously, Mr. Murray served as a Member of the Advisory Board of certain Fidelity® funds (2016) and as Co-Chief Executive Officer (2013-2016) and President (2006-2013) of Meijer, Inc. Mr. Murray serves as a member of the Board of Directors and Nuclear Review and Public Policy and Responsibility Committees of DTE Energy Company (diversified energy company, 2009-present). Mr. Murray also serves as a member of the Board of Directors of Spectrum Health (not-for-profit health system, 2015-present). Mr. Murray previously served as President of Grand Valley State University (2001-2006), Treasurer for the State of Michigan (1999-2001), Vice President of Finance and Administration for Michigan State University (1998-1999), and a member of the Board of Directors and Audit Committee and Chairman of the Nominating and Corporate Governance Committee of Universal Forest Products, Inc. (manufacturer and distributor of wood and wood-alternative products, 2004-2016). Mr. Murray is also a director or trustee of many community and professional organizations.
+ The information includes the Trustee's principal occupation during the last five years and other information relating to the experience, attributes, and skills relevant to the Trustee's qualifications to serve as a Trustee, which led to the conclusion that the Trustee should serve as a Trustee for the fund.
Advisory Board Members and Officers:
Correspondence intended for an officer may be sent to Fidelity Investments, 245 Summer Street, Boston, Massachusetts 02210. Officers appear below in alphabetical order.
Name, Year of Birth; Principal Occupation
Elizabeth Paige Baumann (1968)
Year of Election or Appointment: 2017
Anti-Money Laundering (AML) Officer
Ms. Baumann also serves as AML Officer of other funds. She is Chief AML Officer (2012-present) and Senior Vice President (2014-present) of FMR LLC (diversified financial services company) and is an employee of Fidelity Investments. Previously, Ms. Baumann served as AML Officer of the funds (2012-2016), and Vice President (2007-2014) and Deputy Anti-Money Laundering Officer (2007-2012) of FMR LLC.
Craig S. Brown (1977)
Year of Election or Appointment: 2019
Assistant Treasurer
Mr. Brown also serves as Assistant Treasurer of other funds. Mr. Brown is an employee of Fidelity Investments (2013-present).
John J. Burke III (1964)
Year of Election or Appointment: 2018
Chief Financial Officer
Mr. Burke also serves as Chief Financial Officer of other funds. Mr. Burke serves as Head of Investment Operations for Fidelity Fund and Investment Operations (2018-present) and is an employee of Fidelity Investments (1998-present). Previously Mr. Burke served as head of Asset Management Investment Operations (2012-2018).
William C. Coffey (1969)
Year of Election or Appointment: 2018
Secretary and Chief Legal Officer (CLO)
Mr. Coffey also serves as Secretary and CLO of other funds. Mr. Coffey serves as CLO, Secretary, and Senior Vice President of Fidelity Management & Research Company and FMR Co., Inc. (investment adviser firms, 2018-present); Secretary of Fidelity SelectCo, LLC and Fidelity Investments Money Management, Inc. (investment adviser firms, 2018-present); and CLO of Fidelity Management & Research (Hong Kong) Limited, FMR Investment Management (UK) Limited, and Fidelity Management & Research (Japan) Limited (investment adviser firms, 2018-present). He is Senior Vice President and Deputy General Counsel of FMR LLC (diversified financial services company, 2010-present), and is an employee of Fidelity Investments. Previously, Mr. Coffey served as Assistant Secretary of certain funds (2009-2018) and as Vice President and Associate General Counsel of FMR LLC (2005-2009).
Jonathan Davis (1968)
Year of Election or Appointment: 2010
Assistant Treasurer
Mr. Davis also serves as Assistant Treasurer of other funds. Mr. Davis serves as Assistant Treasurer of FMR Capital, Inc. (2017-present) and is an employee of Fidelity Investments. Previously, Mr. Davis served as Vice President and Associate General Counsel of FMR LLC (diversified financial services company, 2003-2010).
Adrien E. Deberghes (1967)
Year of Election or Appointment: 2010
Assistant Treasurer
Mr. Deberghes also serves as an officer of other funds. He serves as Assistant Treasurer of FMR Capital, Inc. (2017-present), Executive Vice President of Fidelity Investments Money Management, Inc. (FIMM) (investment adviser firm, 2016-present), and is an employee of Fidelity Investments (2008-present). Previously, Mr. Deberghes served as President and Treasurer of certain Fidelity® funds (2013-2018). Prior to joining Fidelity Investments, Mr. Deberghes was Senior Vice President of Mutual Fund Administration at State Street Corporation (2007-2008), Senior Director of Mutual Fund Administration at Investors Bank & Trust (2005-2007), and Director of Finance for Dunkin' Brands (2000-2005). Previously, Mr. Deberghes served in other fund officer roles.
Laura M. Del Prato (1964)
Year of Election or Appointment: 2018
President and Treasurer
Ms. Del Prato also serves as an officer of other funds. Ms. Del Prato is an employee of Fidelity Investments (2017-present). Prior to joining Fidelity Investments, Ms. Del Prato served as a Managing Director and Treasurer of the JPMorgan Mutual Funds (2014-2017). Prior to JPMorgan, Ms. Del Prato served as a partner at Cohen Fund Audit Services (accounting firm, 2012-2013) and KPMG LLP (accounting firm, 2004-2012).
Colm A. Hogan (1973)
Year of Election or Appointment: 2016
Assistant Treasurer
Mr. Hogan also serves as an officer of other funds. Mr. Hogan serves as Assistant Treasurer of FMR Capital, Inc. (2017-present) and is an employee of Fidelity Investments (2005-present). Previously, Mr. Hogan served as Assistant Treasurer of certain Fidelity® funds (2016-2018).
Chris Maher (1972)
Year of Election or Appointment: 2013
Assistant Treasurer
Mr. Maher serves as Assistant Treasurer of other funds. Mr. Maher is Vice President of Valuation Oversight, serves as Assistant Treasurer of FMR Capital, Inc. (2017-present), and is an employee of Fidelity Investments. Previously, Mr. Maher served as Vice President of Asset Management Compliance (2013), Vice President of the Program Management Group of FMR (investment adviser firm, 2010-2013), and Vice President of Valuation Oversight (2008-2010).
John B. McGinty, Jr. (1962)
Year of Election or Appointment: 2016
Chief Compliance Officer
Mr. McGinty also serves as Chief Compliance Officer of other funds. Mr. McGinty is Senior Vice President of Asset Management Compliance for Fidelity Investments and is an employee of Fidelity Investments (2016-present). Mr. McGinty previously served as Vice President, Senior Attorney at Eaton Vance Management (investment management firm, 2015-2016), and prior to Eaton Vance as global CCO for all firm operations and registered investment companies at GMO LLC (investment management firm, 2009-2015). Before joining GMO LLC, Mr. McGinty served as Senior Vice President, Deputy General Counsel for Fidelity Investments (2007-2009).
Jason P. Pogorelec (1975)
Year of Election or Appointment: 2015
Assistant Secretary
Mr. Pogorelec also serves as Assistant Secretary of other funds. Mr. Pogorelec serves as Vice President, Associate General Counsel (2010-present) and is an employee of Fidelity Investments (2006-present).
Nancy D. Prior (1967)
Year of Election or Appointment: 2014
Vice President
Ms. Prior also serves as Vice President of other funds. Ms. Prior serves as President Fixed Income, High Income/Emerging Market Debt and Multi Asset Class Strategies of FIAM LLC (2018-present), President (2016-present) and Director (2014-present) of Fidelity Investments Money Management, Inc. (FIMM) (investment adviser firm), President, Fixed Income (2014-present), and is an employee of Fidelity Investments (2002-present). Previously, Ms. Prior served as Vice Chairman of FIAM LLC (investment adviser firm, 2014-2018), a Director of FMR Investment Management (UK) Limited (investment adviser firm, 2015-2018), President Multi-Asset Class Strategies of FMR's Global Asset Allocation Division (2017-2018), Vice President of Fidelity's Money Market Funds (2012-2014), President, Money Market and Short Duration Bond Group of Fidelity Management & Research (FMR) (investment adviser firm, 2013-2014), President, Money Market Group of FMR (2011-2013), Managing Director of Research (2009-2011), Senior Vice President and Deputy General Counsel (2007-2009), and Assistant Secretary of certain Fidelity® funds (2008-2009).
Stacie M. Smith (1974)
Year of Election or Appointment: 2013
Assistant Treasurer
Ms. Smith also serves as an officer of other funds. Ms. Smith serves as Assistant Treasurer of FMR Capital, Inc. (2017-present), is an employee of Fidelity Investments (2009-present), and has served in other fund officer roles. Prior to joining Fidelity Investments, Ms. Smith served as Senior Audit Manager of Ernst & Young LLP (accounting firm, 1996-2009). Previously, Ms. Smith served as Assistant Treasurer (2013-2018) and Deputy Treasurer (2013-2016) of certain Fidelity® funds.
Marc L. Spector (1972)
Year of Election or Appointment: 2016
Deputy Treasurer
Mr. Spector also serves as an officer of other funds. Mr. Spector serves as Assistant Treasurer of FMR Capital, Inc. (2017-present) and is an employee of Fidelity Investments (2016-present). Prior to joining Fidelity Investments, Mr. Spector served as Director at the Siegfried Group (accounting firm, 2013-2016), and prior to Siegfried Group as audit senior manager at Deloitte & Touche (accounting firm, 2005-2013).
Jim Wegmann (1979)
Year of Election or Appointment: 2019
Assistant Treasurer
Mr. Wegmann also serves as Assistant Treasurer of other funds. Mr. Wegmann is an employee of Fidelity Investments (2011-present).
Shareholder Expense Example
As a shareholder of the Fund, you incur two types of costs: (1) transaction costs and (2) ongoing costs, including management fees, distribution and/or service (12b-1) fees and other Fund expenses. This Example is intended to help you understand your ongoing costs (in dollars) of investing in the Fund and to compare these costs with the ongoing costs of investing in other mutual funds.
The Example is based on an investment of $1,000 invested at the beginning of the period and held for the entire period (July 1, 2018 to December 31, 2018).
Actual Expenses
The first line of the accompanying table for each class of the Fund provides information about actual account values and actual expenses. You may use the information in this line, together with the amount you invested, to estimate the expenses that you paid over the period. Simply divide your account value by $1,000.00 (for example, an $8,600 account value divided by $1,000.00 = 8.6), then multiply the result by the number in the first line for a class of the Fund under the heading entitled "Expenses Paid During Period" to estimate the expenses you paid on your account during this period. The estimate of expenses does not include any fees or other expenses of any variable annuity or variable life insurance product. If they were, the estimate of expenses you paid during the period would be higher, and your ending account value would be lower. In addition, the Fund, as a shareholder in the underlying Fidelity Central Funds, will indirectly bear its pro-rata share of the fees and expenses incurred by the underlying Fidelity Central Funds. These fees and expenses are not included in the Fund's annualized expense ratio used to calculate the expense estimate in the table below.
Hypothetical Example for Comparison Purposes
The second line of the accompanying table for each class of the Fund provides information about hypothetical account values and hypothetical expenses based on a Class' actual expense ratio and an assumed rate of return of 5% per year before expenses, which is not the Class' actual return. The hypothetical account values and expenses may not be used to estimate the actual ending account balance or expenses you paid for the period. You may use this information to compare the ongoing costs of investing in the Fund and other funds. To do so, compare this 5% hypothetical example with the 5% hypothetical examples that appear in the shareholder reports of the other funds. The estimate of expenses does not include any fees or other expenses of any variable annuity or variable life insurance product. If they were, the estimate of expenses you paid during the period would be higher, and your ending account value would be lower. In addition, the Fund, as a shareholder in the underlying Fidelity Central Funds, will indirectly bear its pro-rata share of the fees and expenses incurred by the underlying Fidelity Central Funds. These fees and expenses are not included in the Fund's annualized expense ratio used to calculate the expense estimate in the table below.
Please note that the expenses shown in the table are meant to highlight your ongoing costs only and do not reflect any transaction costs. Therefore, the second line of the table is useful in comparing ongoing costs only, and will not help you determine the relative total costs of owning different funds.
| | Annualized Expense Ratio-A | Beginning
Account Value
July 1, 2018 | Ending
Account Value
December 31, 2018 | Expenses Paid
During Period-B
July 1, 2018
to December 31, 2018 |
| Initial Class | .68% | | | |
| Actual | | $1,000.00 | $913.00 | $3.28 |
| Hypothetical-C | | $1,000.00 | $1,021.78 | $3.47 |
| Service Class | .78% | | | |
| Actual | | $1,000.00 | $912.50 | $3.76 |
| Hypothetical-C | | $1,000.00 | $1,021.27 | $3.97 |
| Service Class 2 | .93% | | | |
| Actual | | $1,000.00 | $912.10 | $4.48 |
| Hypothetical-C | | $1,000.00 | $1,020.52 | $4.74 |
| Investor Class | .76% | | | |
| Actual | | $1,000.00 | $912.80 | $3.66 |
| Hypothetical-C | | $1,000.00 | $1,021.37 | $3.87 |
A Annualized expense ratio reflects expenses net of applicable fee waivers.
B Expenses are equal to each Class' annualized expense ratio, multiplied by the average account value over the period, multiplied by 184/365 (to reflect the one-half year period). The fees and expenses of the underlying Fidelity Central Funds in which the Fund invests are not included in each Class' annualized expense ratio. In addition to the expenses noted above, the Fund also indirectly bears its proportional share of the expenses of the underlying Fidelity Central Funds. Annualized expenses of the underlying non-money market Fidelity Central Funds as of their most recent fiscal half year ranged from less than .005% to .07%.
C 5% return per year before expenses
Distributions (Unaudited)
The Board of Trustees of VIP Asset Manager: Growth Portfolio voted to pay to shareholders of record at the opening of business on record date, the following distributions per share derived from capital gains realized from sales of portfolio securities:
| | Pay Date | Record Date | Capital Gains |
| VIP Asset Manager: Growth Portfolio | | | |
| Initial Class | 02/15/19 | 02/15/19 | $0.937 |
| Service Class | 02/15/19 | 02/15/19 | $0.937 |
| Service Class 2 | 02/15/19 | 02/15/19 | $0.937 |
| Investor Class | 02/15/19 | 02/15/19 | $0.937 |
The fund hereby designates as a capital gain dividend with respect to the taxable year ended December 31, 2018, $11,143,013, or, if subsequently determined to be different, the net capital gain of such year.
A total of 3.47% of the dividends distributed during the fiscal year was derived from interest on U.S. Government securities which is generally exempt from state income tax.
Initial Class designates 1% and 30%; Service Class designates 1% and 31%; Service Class 2 designates 1% and 35%; and Investor Class designates 1% and 31%; of the dividends distributed in February and December, respectively during the fiscal year as qualifying for the dividends–received deduction for corporate shareholders.
The amounts per share which represent income derived from sources within, and taxes paid to, foreign countries or possessions of the United States are as follows:
| | Pay Date | Income | Taxes |
| VIP Asset Manager: Growth Portfolio | | | |
| Initial Class | 12/28/18 | $0.0470 | $0.0090 |
| Service Class | 12/28/18 | $0.0448 | $0.0090 |
| Service Class 2 | 12/28/18 | $0.0406 | $0.0090 |
| Investor Class | 12/28/18 | $0.0451 | $0.0090 |
Board Approval of Investment Advisory Contracts and Management Fees
VIP Asset Manager: Growth Portfolio
Each year, the Board of Trustees, including the Independent Trustees (together, the Board), votes on the renewal of the management contract with Fidelity Management & Research Company (FMR) and the sub-advisory agreements (together, the Advisory Contracts) for the fund. FMR and the sub-advisers are referred to herein as the Investment Advisers. The Board, assisted by the advice of fund counsel and Independent Trustees' counsel, requests and considers a broad range of information relevant to the renewal of the Advisory Contracts throughout the year.
The Board meets regularly and, at each of its meetings, covers an extensive agenda of topics and materials and considers factors that are relevant to its annual consideration of the renewal of the fund's Advisory Contracts, including the services and support provided to the fund and its shareholders. The Board has established four standing committees (Committees) — Operations, Audit, Fair Valuation, and Governance and Nominating — each composed of and chaired by Independent Trustees with varying backgrounds, to which the Board has assigned specific subject matter responsibilities in order to enhance effective decision-making by the Board. The Operations Committee, of which all of the Independent Trustees are members, meets regularly throughout the year and considers, among other matters, information specifically related to the annual consideration of the renewal of the fund's Advisory Contracts. The Board, acting directly and through its Committees, requests and receives information concerning the annual consideration of the renewal of the fund's Advisory Contracts. The Board also meets as needed to review matters specifically related to the Board's annual consideration of the renewal of the Advisory Contracts. Members of the Board may also meet with trustees of other Fidelity funds through joint ad hoc committees to discuss certain matters relevant to all of the Fidelity funds.
At its September 2018 meeting, the Board unanimously determined to renew the fund's Advisory Contracts. In reaching its determination, the Board considered all factors it believed relevant, including (i) the nature, extent, and quality of the services to be provided to the fund and its shareholders (including the investment performance of the fund); (ii) the competitiveness of the fund's management fee and total expense ratio relative to peer funds; (iii) the total costs of the services to be provided by and the profits to be realized by Fidelity from its relationships with the fund; and (iv) the extent to which, if any, economies of scale exist and would be realized as the fund grows, and whether any economies of scale are appropriately shared with fund shareholders.
In considering whether to renew the Advisory Contracts for the fund, the Board reached a determination, with the assistance of fund counsel and Independent Trustees' counsel and through the exercise of its business judgment, that the renewal of the Advisory Contracts was in the best interests of the fund and its shareholders and that the compensation payable under the Advisory Contracts was fair and reasonable. The Board's decision to renew the Advisory Contracts was not based on any single factor, but rather was based on a comprehensive consideration of all the information provided to the Board at its meetings throughout the year. The Board, in reaching its determination to renew the Advisory Contracts, was aware that shareholders of the fund have a broad range of investment choices available to them, including a wide choice among funds offered by Fidelity's competitors, and that the fund's shareholders, who have the opportunity to review and weigh the disclosure provided by the fund in its prospectus and other public disclosures, have chosen to invest in this fund, which is part of the Fidelity family of funds.
Nature, Extent, and Quality of Services Provided. The Board considered Fidelity's staffing as it relates to the fund, including the backgrounds of investment personnel of Fidelity, and also considered the fund's investment objective, strategies, and related investment philosophy. The Independent Trustees also had discussions with senior management of Fidelity's investment operations and investment groups. The Board considered the structure of the investment personnel compensation program and whether this structure provides appropriate incentives to act in the best interests of the fund. Additionally, the Board considered the portfolio managers' investments, if any, in the funds that they manage.
Resources Dedicated to Investment Management and Support Services. The Board reviewed the general qualifications and capabilities of Fidelity's investment staff, including its size, education, experience, and resources, as well as Fidelity's approach to recruiting, managing, and compensating investment personnel. The Board noted that Fidelity has continued to increase the resources devoted to non-U.S. offices, including expansion of Fidelity's global investment organization. The Board also noted that Fidelity's analysts have extensive resources, tools and capabilities that allow them to conduct sophisticated quantitative and fundamental analysis, as well as credit analysis of issuers, counterparties and guarantors. Further, the Board considered that Fidelity's investment professionals have sufficient access to global information and data so as to provide competitive investment results over time, and that those professionals also have access to sophisticated tools that permit them to assess portfolio construction and risk and performance attribution characteristics continuously, as well as to transmit new information and research conclusions rapidly around the world. Additionally, in its deliberations, the Board considered Fidelity's trading, risk management, compliance, and technology and operations capabilities and resources, which are integral parts of the investment management process.
Shareholder and Administrative Services. The Board considered (i) the nature, extent, quality, and cost of advisory, administrative, and shareholder services performed by the Investment Advisers and their affiliates under the Advisory Contracts and under separate agreements covering transfer agency, pricing and bookkeeping, and securities lending services for the fund; (ii) the nature and extent of the supervision of third party service providers, principally custodians, subcustodians, and pricing vendors; and (iii) the resources devoted to, and the record of compliance with, the fund's compliance policies and procedures. The Board also reviewed the allocation of fund brokerage, including allocations to brokers affiliated with the Investment Advisers, the use of brokerage commissions to pay fund expenses, and the use of "soft" commission dollars to pay for research services.
The Board noted that the growth of fund assets over time across the complex allows Fidelity to reinvest in the development of services designed to enhance the value and convenience of the Fidelity funds as investment vehicles. These services include 24-hour access to account information and market information through telephone representatives and over the Internet, investor education materials and asset allocation tools, and the expanded availability of Fidelity Investor Centers.
Investment in a Large Fund Family. The Board considered the benefits to shareholders of investing in a Fidelity fund, including the benefits of investing in a fund that is part of a large family of funds offering a variety of investment disciplines and providing a large variety of mutual fund investor services. The Board noted that Fidelity had taken, or had made recommendations that resulted in the Fidelity funds taking, a number of actions over the previous year that benefited particular funds, including: (i) continuing to dedicate additional resources to Fidelity's investment research process, which includes meetings with management of issuers of securities in which the funds invest, and to the support of the senior management team that oversees asset management; (ii) continuing efforts to enhance Fidelity's global research capabilities; (iii) launching new funds and making other enhancements to meet client needs; (iv) launching new share classes of existing funds; (v) eliminating purchase minimums and broadening eligibility requirements for certain funds and share classes; (vi) reducing management fees and total expenses for certain growth equity funds and index funds; (vii) lowering expense caps for certain existing funds and classes, and converting certain voluntary expense caps to contractual caps, to reduce expenses borne by shareholders; (viii) eliminating short-term redemption fees for funds that had such fees; (ix) rationalizing product lines and gaining increased efficiencies from fund mergers and share class consolidations; (x) continuing to develop, acquire and implement systems and technology to improve services to the funds and shareholders, strengthen information security, and increase efficiency; and (xi) continuing to implement enhancements to further strengthen Fidelity's product line to increase investors' probability of success in achieving their investment goals, including retirement income goals.
Investment Performance. The Board considered whether the fund has operated in accordance with its investment objective, as well as its record of compliance with its investment restrictions and its performance history. The Board noted that there was a portfolio management change for the fund in April 2018.
The Board took into account discussions that occur at Board meetings throughout the year with representatives of the Investment Advisers about fund investment performance. In this regard the Board noted that as part of regularly scheduled fund reviews and other reports to the Board on fund performance, the Board considers annualized return information for the fund for different time periods, measured against one or more appropriate securities market indices, including a customized blended index that reflects the respective weights of the fund's asset classes (each a "benchmark index") and a peer group of funds with similar objectives ("peer group"), if any. In its evaluation of fund investment performance at meetings throughout the year, the Board gave particular attention to information indicating underperformance of certain Fidelity funds for specific time periods and discussed with the Investment Advisers the reasons for such underperformance.
In addition to reviewing absolute and relative fund performance, the Independent Trustees periodically consider the appropriateness of fund performance metrics in evaluating the results achieved. In general, the Independent Trustees believe that fund performance should be evaluated based on gross performance (before fees and expenses but after transaction costs) compared to appropriate benchmark indices, over appropriate time periods that may include full market cycles, and on net performance (after fees and expenses) compared to peer groups, as applicable, over the same periods, taking into account relevant factors including the following: general market conditions; expectations for interest rate levels and credit conditions; issuer-specific information including credit quality; and fund cash flows and other factors. Depending on the circumstances, the Independent Trustees may be satisfied with a fund's performance notwithstanding that it lags its benchmark index or peer group for certain periods.
The Independent Trustees recognize that shareholders evaluate performance on a net basis over their own holding periods, for which one-, three-, and five-year periods are often used as a proxy. For this reason, the performance information reviewed by the Board also included net cumulative calendar year total return information for the fund and an appropriate benchmark index and peer group for the most recent one-, three-, and five-year periods.
Based on its review, the Board concluded that the nature, extent, and quality of services provided to the fund under the Advisory Contracts should continue to benefit the shareholders of the fund.
Competitiveness of Management Fee and Total Expense Ratio. The Board considered the fund's management fee and total expense ratio compared to "mapped groups" of competitive funds and classes created for the purpose of facilitating the Trustees' competitive analysis of management fees and total expenses. Fidelity creates "mapped groups" by combining similar Lipper investment objective categories that have comparable investment mandates. Combining Lipper investment objective categories aids the Board's management fee and total expense ratio comparisons by broadening the competitive group used for comparison.
Management Fee. The Board considered two proprietary management fee comparisons for the 12-month periods shown in basis points (BP) in the chart below. The group of Lipper funds used by the Board for management fee comparisons is referred to below as the "Total Mapped Group." The Total Mapped Group comparison focuses on a fund's standing in terms of gross management fees before expense reimbursements or caps relative to the total universe of funds with comparable investment mandates, regardless of whether their management fee structures also are comparable. Funds with comparable investment mandates offer exposure to similar types of securities. Funds with comparable management fee structures have similar management fee contractual arrangements (
e.g., flat rate charged for advisory services, all-inclusive fee rate,
etc.). "TMG %" represents the percentage of funds in the Total Mapped Group that had management fees that were lower than the fund's. For example, a hypothetical TMG % of 20% would mean that 80% of the funds in the Total Mapped Group had higher, and 20% had lower, management fees than the fund. The fund's actual TMG %s and the number of funds in the Total Mapped Group are in the chart below. The "Asset-Size Peer Group" (ASPG) comparison focuses on a fund's standing relative to a subset of non-Fidelity funds within the Total Mapped Group that are similar in size and management fee structure. For example, if a fund is in the first quartile of the ASPG, the fund's management fee ranks in the least expensive or lowest 25% of funds in the ASPG. The ASPG represents at least 15% of the funds in the Total Mapped Group with comparable asset size and management fee structures, subject to a minimum of 50 funds (or all funds in the Total Mapped Group if fewer than 50). Additional information, such as the ASPG quartile in which the fund's management fee rate ranked, is also included in the chart and was considered by the Board.
VIP Asset Manager: Growth Portfolio

The Board noted that the fund's management fee rate ranked below the median of its Total Mapped Group and below the median of its ASPG for 2017.
The Board noted that it and the boards of other Fidelity funds formed an ad hoc Committee on Group Fee, which meets periodically, to conduct an in-depth review of the "group fee" component of the management fee of funds with such management fee structures. The Committee's focus included the mechanics of the group fee, the competitive landscape of group fee structures, Fidelity funds with no group fee component and investment products not included in group fee assets. The Board also considered that, for funds subject to the group fee, FMR agreed to voluntarily waive fees over a specified period of time in amounts designed to account for assets converted from certain funds to certain collective investment trusts.
Based on its review, the Board concluded that the fund's management fee is fair and reasonable in light of the services that the fund receives and the other factors considered.
Total Expense Ratio. In its review of each class's total expense ratio, the Board considered the fund's management fee rate as well as other fund or class expenses, as applicable, such as transfer agent fees, pricing and bookkeeping fees, fund-paid 12b-1 fees, and custodial, legal, and audit fees. The Board also noted that Fidelity may agree to waive fees and expenses from time to time, and the extent to which, if any, it has done so for the fund. As part of its review, the Board also considered the current and historical total expense ratios of each class of the fund compared to competitive fund median expenses. Each class of the fund is compared to those funds and classes in the Total Mapped Group (used by the Board for management fee comparisons) that have a similar sales load structure.
The Board noted that the total expense ratio of each of Initial Class, Investor Class, and Service Class ranked below the competitive median for 2017 and the total expense ratio of Service Class 2 ranked above the competitive median for 2017. The Board considered that, in general, various factors can affect total expense ratios. The Board noted that the total expense ratio of Service Class 2 was above the competitive median because of its 12b-1 fees and that excluding 12b-1 fees of both the class and competitor classes, the total expense ratio of Service Class 2 ranked below the median. The Board noted that the fund offers multiple classes, each of which has a different 12b-1 fee structure, and that the multiple structures are intended to offer a range of pricing options for the intermediary market. The Board also noted that the total expense ratios of the classes vary primarily by the level of their 12b-1 fees, although differences in transfer agent fees may also cause expenses to vary from class to class.
Fees Charged to Other Fidelity Clients. The Board also considered Fidelity fee structures and other information with respect to clients of Fidelity, such as other funds advised or subadvised by Fidelity, pension plan clients, and other institutional clients with similar mandates. The Board noted that a joint ad hoc committee created by it and the boards of other Fidelity funds periodically reviews and compares Fidelity's institutional investment advisory business with its business of providing services to the Fidelity funds and also noted the most recent findings of the committee. The Board noted that the committee's review included a consideration of the differences in services provided, fees charged, and costs incurred, as well as competition in the markets serving the different categories of clients.
Based on its review of total expense ratios and fees charged to other Fidelity clients, the Board concluded that the total expense ratio of each class of the fund was reasonable in light of the services that the fund and its shareholders receive and the other factors considered.
Costs of the Services and Profitability. The Board considered the revenues earned and the expenses incurred by Fidelity in conducting the business of developing, marketing, distributing, managing, administering and servicing the fund and servicing the fund's shareholders. The Board also considered the level of Fidelity's profits in respect of all the Fidelity funds.
On an annual basis, Fidelity presents to the Board information about the profitability of its relationships with the fund. Fidelity calculates profitability information for each fund, as well as aggregate profitability information for groups of Fidelity funds and all Fidelity funds, using a series of detailed revenue and cost allocation methodologies which originate with the books and records of Fidelity on which Fidelity's audited financial statements are based. The Audit Committee of the Board reviews any significant changes from the prior year's methodologies.
PricewaterhouseCoopers LLP (PwC), auditor to Fidelity and certain Fidelity funds, has been engaged annually by the Board as part of the Board's assessment of Fidelity's profitability analysis. PwC's engagement includes the review and assessment of the methodologies used by Fidelity in determining the revenues and expenses attributable to Fidelity's mutual fund business, and completion of agreed-upon procedures in respect of the mathematical accuracy of the fund profitability information and its conformity to established allocation methodologies. After considering PwC's reports issued under the engagement and information provided by Fidelity, the Board concluded that while other allocation methods may also be reasonable, Fidelity's profitability methodologies are reasonable in all material respects.
The Board also reviewed Fidelity's non-fund businesses and potential indirect benefits such businesses may have received as a result of their association with Fidelity's mutual fund business (i.e., fall-out benefits) as well as cases where Fidelity's affiliates may benefit from the fund's business. The Board noted that changes to fall-out benefits year-over-year reflect business developments at Fidelity's various businesses.
The Board considered the costs of the services provided by and the profits realized by Fidelity in connection with the operation of the fund and was satisfied that the profitability was not excessive.
Economies of Scale. The Board considered whether there have been economies of scale in respect of the management of the Fidelity funds, whether the Fidelity funds (including the fund) have appropriately benefited from any such economies of scale, and whether there is potential for realization of any further economies of scale. The Board considered the extent to which the fund will benefit from economies of scale as assets grow through increased services to the fund, through waivers or reimbursements, or through fee or expense ratio reductions. The Board also noted that a committee (the Economies of Scale Committee) created by it and the boards of other Fidelity funds periodically analyzes whether Fidelity attains economies of scale in respect of the management and servicing of the Fidelity funds, whether the Fidelity funds have appropriately benefited from such economies of scale, and whether there is potential for realization of any further economies of scale.
The Board recognized that the fund's management contract incorporates a "group fee" structure, which provides for lower group fee rates as total group assets increase, and for higher group fee rates as total group assets decrease (with "group assets" defined to include fund assets under FMR's management plus the assets of sector funds previously under FMR's management). FMR calculates the group fee rates based on a tiered asset "breakpoint" schedule that varies based on asset class. The Board considered that the group fee is designed to deliver the benefits of economies of scale to fund shareholders when total Fidelity fund assets increase, even if assets of any particular fund are unchanged or have declined, because some portion of Fidelity's costs are attributable to services provided to all Fidelity funds, and all funds benefit if those costs can be allocated among more assets. The Board concluded that, given the group fee structure, fund shareholders will benefit from lower management fees as group assets increase at the fund complex level, regardless of whether Fidelity achieves any such economies of scale.
The Board concluded, taking into account the analysis of the Economies of Scale Committee, that economies of scale, if any, are being appropriately shared between fund shareholders and Fidelity.
Additional Information Requested by the Board. In order to develop fully the factual basis for consideration of the Fidelity funds' advisory contracts, the Board requested and received additional information on certain topics, including: (i) Fidelity's fund profitability methodology, profitability trends for certain funds, the allocation of various costs to different funds, and the impact of certain factors on fund profitability results; (ii) portfolio manager changes that have occurred during the past year and the amount of the investment that each portfolio manager has made in the Fidelity fund(s) that he or she manages; (iii) Fidelity's compensation structure for portfolio managers, research analysts, and other key personnel, including its effects on fund profitability, the rationale for the compensation structure, and the extent to which current market conditions have affected retention and recruitment; (iv) the arrangements with and compensation paid to certain fund sub-advisers on behalf of the Fidelity funds and the treatment of such compensation within Fidelity's fund profitability methodology; (v) the terms of Fidelity's voluntary expense limitation agreements; (vi) the methodology with respect to competitive fund data and peer group classifications; (vii) Fidelity's transfer agent fee, expense, and service structures for different funds and classes relative to competitive trends, and the impact of the increased use of omnibus accounts; (viii) new developments in the retail and institutional marketplaces and the competitive positioning of the funds relative to other investment products and services; (ix) the impact of recent changes to the money market fund landscape, including the full implementation of money market fund reform and rising interest rates, on Fidelity's money market funds; (x) the funds' share class structures and distribution channels; and (xi) explanations regarding the relative total expense ratios of certain funds and classes, total expense competitive trends and methodologies for total expense competitive comparisons, and actions that might be taken by Fidelity to reduce total expense ratios for certain classes. In addition, the Board considered its discussions with Fidelity throughout the year regarding enhanced information security initiatives and the funds' fair valuation policies.
Based on its evaluation of all of the conclusions noted above, and after considering all factors it believed relevant, the Board concluded that the advisory fee arrangements are fair and reasonable, and that the fund's Advisory Contracts should be renewed.

VIPAMG-ANN-0219
1.540207.121
Fidelity® Variable Insurance Products: Investment Grade Bond Portfolio
Annual Report December 31, 2018 |
|
Beginning on January 1, 2021, as permitted by regulations adopted by the Securities and Exchange Commission, and if your insurance carrier elects to participate, you may not be receiving paper copies of the Fund’s shareholder reports from the insurance company that offers your variable insurance product unless you specifically request paper copies from your financial professional or the administrator of your variable insurance product. Instead, the reports will be made available on a website, and you will be notified by mail each time a report is posted and provided with a website link to access the report.
If you already elected to receive shareholder reports electronically, you will not be affected by this change and you need not take any action. You may elect to receive shareholder reports and other communications from the Fund electronically, by contacting your financial professional or the administrator of your variable insurance product. If you own a Fidelity-administered variable insurance product, please visit fidelity.com/mailpreferences to make your election or call 1-800-343-3548.
You may elect to receive all future reports in paper free of charge. If you wish to continue receiving paper copies of your shareholder reports, you may contact your financial professional or the administrator of your variable insurance product. If you own a Fidelity-administered variable insurance product, please visit fidelity.com/mailpreferences to make your election or call 1-800-343-3548. Your election to receive reports in paper will apply to all funds available under your variable insurance product.
To view a fund's proxy voting guidelines and proxy voting record for the 12-month period ended June 30, visit http://www.fidelity.com/proxyvotingresults or visit the Securities and Exchange Commission's (SEC) web site at http://www.sec.gov.
You may also call 1-877-208-0098 to request a free copy of the proxy voting guidelines.
Fidelity® Variable Insurance Products are separate account options which are purchased through a variable insurance contract.
Standard & Poor's, S&P and S&P 500 are registered service marks of The McGraw-Hill Companies, Inc. and have been licensed for use by Fidelity Distributors Corporation.
Other third-party marks appearing herein are the property of their respective owners.
All other marks appearing herein are registered or unregistered trademarks or service marks of FMR LLC or an affiliated company. © 2019 FMR LLC. All rights reserved.
This report and the financial statements contained herein are submitted for the general information of the shareholders of the Fund. This report is not authorized for distribution to prospective investors in the Fund unless preceded or accompanied by an effective prospectus.
A fund files its complete schedule of portfolio holdings with the SEC for the first and third quarters of each fiscal year on Form N-Q. Forms N-Q are available on the SEC’s web site at http://www.sec.gov. A fund's Forms N-Q may be reviewed and copied at the SEC’s Public Reference Room in Washington, DC. Information regarding the operation of the SEC's Public Reference Room may be obtained by calling 1-800-SEC-0330.
For a complete list of a fund's portfolio holdings, view the most recent holdings listing, semiannual report, or annual report on Fidelity's web site at http://www.fidelity.com, http://www.institutional.fidelity.com, or http://www.401k.com, as applicable.
NOT FDIC INSURED •MAY LOSE VALUE •NO BANK GUARANTEE
Neither the Fund nor Fidelity Distributors Corporation is a bank.
VIP Investment Grade Bond Portfolio
Performance: The Bottom Line
Average annual total return reflects the change in the value of an investment, assuming reinvestment of distributions from dividend income and capital gains (the profits earned upon the sale of securities that have grown in value, if any) and assuming a constant rate of performance each year. During periods of reimbursement by Fidelity, a fund’s total return will be greater than it would be had the reimbursement not occurred. Performance numbers are net of all underlying fund operating expenses, but do not include any insurance charges imposed by your insurance company’s separate account. If performance information included the effect of these additional charges, the total returns would have been lower. How a fund did yesterday is no guarantee of how it will do tomorrow.
Average Annual Total Returns
| For the periods ended December 31, 2018 | Past 1 year | Past 5 years | Past 10 years |
| Initial Class | (0.53)% | 2.70% | 4.75% |
| Service Class | (0.63)% | 2.60% | 4.65% |
| Service Class 2 | (0.79)% | 2.44% | 4.49% |
| Investor Class | (0.57)% | 2.66% | 4.72% |
$10,000 Over 10 Years
Let's say hypothetically that $10,000 was invested in VIP Investment Grade Bond Portfolio - Initial Class on December 31, 2008.
The chart shows how the value of your investment would have changed, and also shows how the Bloomberg Barclays U.S. Aggregate Bond Index performed over the same period.
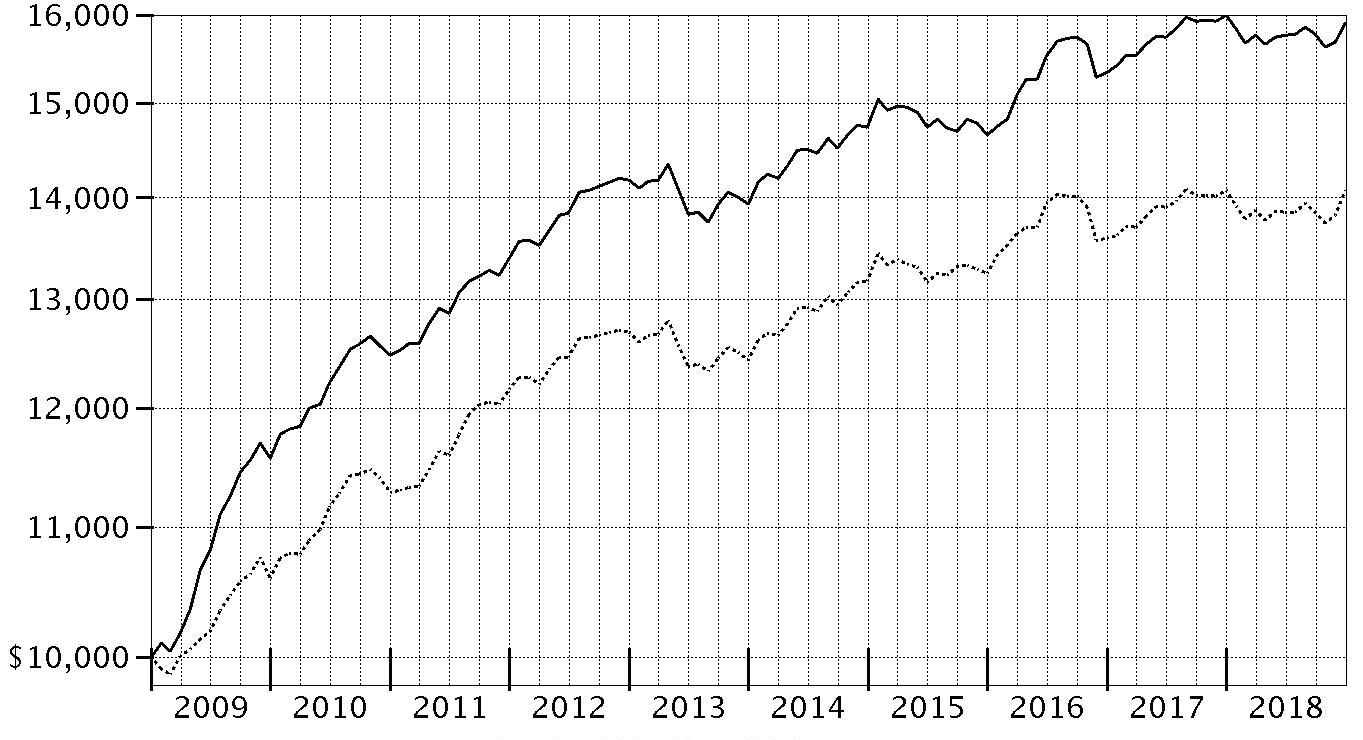
| Period Ending Values |
| $15,909 | VIP Investment Grade Bond Portfolio - Initial Class |
| $14,075 | Bloomberg Barclays U.S. Aggregate Bond Index |
VIP Investment Grade Bond Portfolio
Management's Discussion of Fund Performance
Market Recap: U.S. taxable investment-grade bonds roughly broke even in 2018, as the upward trend in yields early in the year reversed notably in the fourth quarter. The Bloomberg Barclays U.S. Aggregate Bond Index gained 0.01% for the year. Longer-term bond yields rose through mid-May, driven by policy-rate hikes, plans by the U.S. Federal Reserve to gradually reduce its balance sheet and tax reform that went into effect in January. Longer-term yields moderated in the summer, with spreads between shorter-term and longer-term Treasury bonds remaining tight, partly because of escalating global trade tension. Yields rose again in September and early October, amid increased inflation expectations and hints that central banks may curtail economic stimulus. Yields then declined notably and credit spreads widened in November and December due to broad market volatility, disappointing U.S. economic data, and signs of economic weakness in China and parts of Europe. Within the Bloomberg Barclays index, U.S. Treasuries (+0.86%) topped all major market segments. Conversely, investment-grade corporates (-2.51%) performed worst. Outside the index, most non-core fixed-income segments posted a negative return, while Treasury Inflation-Protected Securities (TIPS) returned -1.26%, as inflation expectations moderated near year-end.
Comments from Co-Portfolio Managers Celso Munoz and Ford O’Neil: For the year ending December 31, 2018, the fund’s share classes posted slightly negative returns that lagged, net of fees, the 0.01% gain of the Bloomberg Barclays U.S. Aggregate Bond Index. The fund’s exposure to Treasury Inflation-Protected Securities hampered the fund’s relative return, as these bonds faltered toward year-end when inflation expectations slid amid falling energy prices and concern over the economic outlook. A stake in high-yield bonds, which accounted for about 2.7% of fund assets, on average, for the year, also cost the fund some ground. Elsewhere, owning specific government-related names tied to energy, particularly Petroleos Mexicanos (PEMEX), disappointed. In contrast, duration (interest rate) positioning helped relative performance, particularly because it was shorter than that of the benchmark throughout much of the period and, thus, held in better as interest rates rose. Positioning among investment-grade corporates also bolstered relative performance; slightly overweighting this sector contributed for the full year. Within investment-grade corporates, underweighting the corporate bonds of industrial companies particularly added value, although relative performance in this group was offset by disappointing choices among certain consumer non-cyclical (British American Tobacco and InBev) and financial names (Deutsche Bank and Royal Bank of Scotland).
The views expressed above reflect those of the portfolio manager(s) only through the end of the period as stated on the cover of this report and do not necessarily represent the views of Fidelity or any other person in the Fidelity organization. Any such views are subject to change at any time based upon market or other conditions and Fidelity disclaims any responsibility to update such views. These views may not be relied on as investment advice and, because investment decisions for a Fidelity fund are based on numerous factors, may not be relied on as an indication of trading intent on behalf of any Fidelity fund.
VIP Investment Grade Bond Portfolio
Investment Summary (Unaudited)
Quality Diversification (% of fund's net assets)
| As of December 31, 2018 |
| | U.S. Government and U.S. Government Agency Obligations | 64.5% |
| | AAA | 0.9% |
| | AA | 0.8% |
| | A | 7.1% |
| | BBB | 21.9% |
| | BB and Below | 7.9% |
| | Not Rated | 0.5% |
| | Short-Term Investments and Net Other Assets* | (3.6)% |

* Short-Term Investments and Net Other Assets (Liabilities) are not included in the pie chart
We have used ratings from Moody's Investors Service, Inc. Where Moody's® ratings are not available, we have used S&P® ratings. All ratings are as of the date indicated and do not reflect subsequent changes. Securities rated BB or below were rated investment grade at the time of acquisition. The information in the above tables is based on the combined investments of the Fund and its pro-rata share of investments of Fidelity's fixed-income central funds.
Asset Allocation (% of fund's net assets)
| As of December 31, 2018 *,** |
| | Corporate Bonds | 33.8% |
| | U.S. Government and U.S. Government Agency Obligations | 64.5% |
| | Asset-Backed Securities | 1.0% |
| | CMOs and Other Mortgage Related Securities | 1.6% |
| | Municipal Bonds | 1.6% |
| | Other Investments | 1.1% |
| | Short-Term Investments and Net Other Assets (Liabilities)*** | (3.6)% |
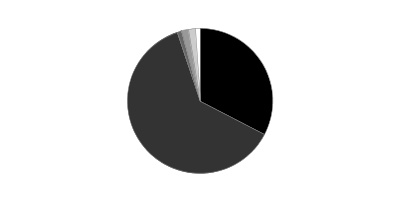
* Foreign investments - 7.3%
** Futures and Swaps - 0.0%
*** Short-Term Investments and Net Other Assets (Liabilities) are not included in the pie chart
The information in the above table is based on the combined investments of the Fund and its pro rata share of the investments of Fidelity's fixed-income central funds. An unaudited holdings listing for the Fund, which presents direct holdings as well as the pro rata share of any securities and other investments held indirectly through its investment in underlying non-money market Fidelity Central Funds, is available at institutional.fidelity.com. Fidelity VIP Investment Grade Central Fund's holdings and financial statements are included at the end of this report.
Percentages in the above tables are adjusted for the effect of TBA Sale Commitments.
Percentages shown as 0.0% may reflect amounts less than 0.05%.
VIP Investment Grade Bond Portfolio
Schedule of Investments December 31, 2018
Showing Percentage of Net Assets
| U.S. Government and Government Agency Obligations - 1.3% | | | |
| | | Principal Amount | Value |
| U.S. Treasury Inflation-Protected Obligations - 0.2% | | | |
| U.S. Treasury Inflation-Indexed Bonds 1% 2/15/46 | | 10,672,800 | 10,142,999 |
| U.S. Treasury Obligations - 1.1% | | | |
| U.S. Treasury Bonds: | | | |
| 2.75% 11/15/47 | | $5,817,000 | $5,513,954 |
| 3.375% 11/15/48 | | 7,124,000 | 7,631,004 |
| U.S. Treasury Notes 1.625% 5/15/26 | | 30,200,000 | 28,218,514 |
|
| TOTAL U.S. TREASURY OBLIGATIONS | | | 41,363,472 |
|
| TOTAL U.S. GOVERNMENT AND GOVERNMENT AGENCY OBLIGATIONS | | | |
| (Cost $51,213,675) | | | 51,506,471 |
| | | Shares | Value |
|
| Fixed-Income Funds - 98.6% | | | |
| Fidelity Specialized High Income Central Fund (a) | | 1,597,341 | $150,693,137 |
| Fidelity VIP Investment Grade Central Fund (a)(b) | | 35,788,580 | 3,661,529,582 |
| TOTAL FIXED-INCOME FUNDS | | | |
| (Cost $3,876,691,716) | | | 3,812,222,719 |
|
| Money Market Funds - 0.5% | | | |
| Fidelity Cash Central Fund, 2.42% (c) | | | |
| (Cost $20,060,357) | | 20,056,729 | 20,060,740 |
| TOTAL INVESTMENT IN SECURITIES - 100.4% | | | |
| (Cost $3,947,965,748) | | | 3,883,789,930 |
| NET OTHER ASSETS (LIABILITIES) - (0.4)% | | | (16,793,815) |
| NET ASSETS - 100% | | | $3,866,996,115 |
Legend
(a) Affiliated fund that is generally available only to investment companies and other accounts managed by Fidelity Investments. A complete unaudited schedule of portfolio holdings for each Fidelity Central Fund is filed with the SEC for the first and third quarters of each fiscal year on Form N-Q and is available upon request or at the SEC's website at www.sec.gov. An unaudited holdings listing for the Fund, which presents direct holdings as well as the pro-rata share of securities and other investments held indirectly through its investment in underlying non-money market Fidelity Central Funds is available at fidelity.com and/or institutional.fidelity.com, as applicable. In addition, each Fidelity Central Fund's financial statements, which are not covered by the Fund's Report of Independent Registered Public Accounting Firm, are available on the SEC's website or upon request.
(b) Affiliated central fund that is available only to investment companies and other accounts managed by Fidelity Investments. Fidelity VIP Investment Grade Central Fund's investments and financial statements are included at the end of this report as an attachment.
(c) Affiliated fund that is generally available only to investment companies and other accounts managed by Fidelity Investments. The rate quoted is the annualized seven-day yield of the fund at period end. A complete unaudited listing of the fund's holdings as of its most recent quarter end is available upon request. In addition, each Fidelity Central Fund's financial statements, which are not covered by the Fund's Report of Independent Registered Public Accounting Firm, are available on the SEC's website or upon request.
Affiliated Central Funds
Information regarding fiscal year to date income earned by the Fund from investments in Fidelity Central Funds is as follows:
| Fund | Income earned |
| Fidelity Cash Central Fund | $278,088 |
| Fidelity Specialized High Income Central Fund | 6,308,771 |
| Fidelity VIP Investment Grade Central Fund | 109,080,811 |
| Total | $115,667,670 |
Amounts in the income column in the above table include any capital gain distributions from underlying funds, which are presented in the corresponding line-item in the Statement of Operations if applicable.
Fiscal year to date information regarding the Fund’s investments in non-Money Market Central Funds, including the ownership percentage, is presented below.
| Fund | Value, beginning of period | Purchases | Sales Proceeds | Realized Gain/Loss | Change in Unrealized appreciation (depreciation) | Value, end of period | % ownership, end of period |
| Fidelity Specialized High Income Central Fund | $104,165,619 | $56,308,757 | $-- | $-- | $(9,781,239) | $150,693,137 | 19.8% |
| Fidelity VIP Investment Grade Central Fund | 4,009,235,812 | 136,077,851 | 369,500,000 | (15,781,028) | (98,503,053) | 3,661,529,582 | 69.5% |
| Total | $4,113,401,431 | $192,386,608 | $369,500,000 | $(15,781,028) | $(108,284,292) | $3,812,222,719 | |
Investment Valuation
The following is a summary of the inputs used, as of December 31, 2018, involving the Fund's assets and liabilities carried at fair value. The inputs or methodology used for valuing securities may not be an indication of the risk associated with investing in those securities. For more information on valuation inputs, and their aggregation into the levels used below, please refer to the Investment Valuation section in the accompanying Notes to Financial Statements.
| | Valuation Inputs at Reporting Date: |
| Description | Total | Level 1 | Level 2 | Level 3 |
| Investments in Securities: | | | | |
| U.S. Government and Government Agency Obligations | $51,506,471 | $-- | $51,506,471 | $-- |
| Fixed-Income Funds | 3,812,222,719 | 3,812,222,719 | -- | -- |
| Money Market Funds | 20,060,740 | 20,060,740 | -- | -- |
| Total Investments in Securities: | $3,883,789,930 | $3,832,283,459 | $51,506,471 | $-- |
See accompanying notes which are an integral part of the financial statements.
VIP Investment Grade Bond Portfolio
Financial Statements
Statement of Assets and Liabilities
| | | December 31, 2018 |
| Assets | | |
Investment in securities, at value — See accompanying schedule:
Unaffiliated issuers (cost $51,213,675) | $51,506,471 | |
| Fidelity Central Funds (cost $3,896,752,073) | 3,832,283,459 | |
| Total Investment in Securities (cost $3,947,965,748) | | $3,883,789,930 |
| Receivable for investments sold | | 20,000,000 |
| Receivable for fund shares sold | | 827,129 |
| Interest receivable | | 156,015 |
| Distributions receivable from Fidelity Central Funds | | 41,696 |
| Prepaid expenses | | 5,938 |
| Total assets | | 3,904,820,708 |
| Liabilities | | |
| Payable for fund shares redeemed | $36,101,502 | |
| Accrued management fee | 987,697 | |
| Distribution and service plan fees payable | 359,252 | |
| Other affiliated payables | 338,655 | |
| Other payables and accrued expenses | 37,487 | |
| Total liabilities | | 37,824,593 |
| Net Assets | | $3,866,996,115 |
| Net Assets consist of: | | |
| Paid in capital | | $3,935,782,077 |
| Total distributable earnings (loss) | | (68,785,962) |
| Net Assets | | $3,866,996,115 |
| Net Asset Value and Maximum Offering Price | | |
| Initial Class: | | |
| Net Asset Value, offering price and redemption price per share ($928,285,178 ÷ 75,221,047 shares) | | $12.34 |
| Service Class: | | |
| Net Asset Value, offering price and redemption price per share ($553,442,045 ÷ 45,367,881 shares) | | $12.20 |
| Service Class 2: | | |
| Net Asset Value, offering price and redemption price per share ($1,505,565,633 ÷ 125,165,803 shares) | | $12.03 |
| Investor Class: | | |
| Net Asset Value, offering price and redemption price per share ($879,703,259 ÷ 71,571,201 shares) | | $12.29 |
See accompanying notes which are an integral part of the financial statements.
Statement of Operations
| | | Year ended December 31, 2018 |
| Investment Income | | |
| Interest | | $1,832,591 |
| Income from Fidelity Central Funds | | 115,070,997 |
| Total income | | 116,903,588 |
| Expenses | | |
| Management fee | $12,337,729 | |
| Transfer agent fees | 3,072,199 | |
| Distribution and service plan fees | 4,361,697 | |
| Accounting fees and expenses | 1,132,651 | |
| Custodian fees and expenses | 8,119 | |
| Independent trustees' fees and expenses | 18,754 | |
| Registration fees | 11,777 | |
| Audit | 50,862 | |
| Legal | 8,392 | |
| Miscellaneous | 28,732 | |
| Total expenses before reductions | 21,030,912 | |
| Expense reductions | (25,581) | |
| Total expenses after reductions | | 21,005,331 |
| Net investment income (loss) | | 95,898,257 |
| Realized and Unrealized Gain (Loss) | | |
| Net realized gain (loss) on: | | |
| Investment securities: | | |
| Unaffiliated issuers | (1,355,321) | |
| Fidelity Central Funds | (15,780,968) | |
| Capital gain distributions from Fidelity Central Funds | 596,673 | |
| Total net realized gain (loss) | | (16,539,616) |
| Change in net unrealized appreciation (depreciation) on: | | |
| Investment securities: | | |
| Unaffiliated issuers | (1,284,966) | |
| Fidelity Central Funds | (108,284,123) | |
| Total change in net unrealized appreciation (depreciation) | | (109,569,089) |
| Net gain (loss) | | (126,108,705) |
| Net increase (decrease) in net assets resulting from operations | | $(30,210,448) |
See accompanying notes which are an integral part of the financial statements.
Statement of Changes in Net Assets
| | Year ended December 31, 2018 | Year ended December 31, 2017 |
| Increase (Decrease) in Net Assets | | |
| Operations | | |
| Net investment income (loss) | $95,898,257 | $97,964,278 |
| Net realized gain (loss) | (16,539,616) | 21,605,619 |
| Change in net unrealized appreciation (depreciation) | (109,569,089) | 40,386,984 |
| Net increase (decrease) in net assets resulting from operations | (30,210,448) | 159,956,881 |
| Distributions to shareholders | (120,424,344) | – |
| Distributions to shareholders from net investment income | – | (96,951,660) |
| Distributions to shareholders from net realized gain | – | (17,412,901) |
| Total distributions | (120,424,344) | (114,364,561) |
| Share transactions - net increase (decrease) | (184,618,601) | 364,622,194 |
| Total increase (decrease) in net assets | (335,253,393) | 410,214,514 |
| Net Assets | | |
| Beginning of period | 4,202,249,508 | 3,792,034,994 |
| End of period | $3,866,996,115 | $4,202,249,508 |
| Other Information | | |
| Undistributed net investment income end of period | | $15,632,903 |
See accompanying notes which are an integral part of the financial statements.
Financial Highlights
VIP Investment Grade Bond Portfolio Initial Class
| Years ended December 31, | 2018 | 2017 | 2016 | 2015 | 2014 |
| Selected Per–Share Data | | | | | |
| Net asset value, beginning of period | $12.80 | $12.64 | $12.37 | $12.79 | $12.36 |
| Income from Investment Operations | | | | | |
| Net investment income (loss)A | .311 | .325 | .344 | .345 | .327 |
| Net realized and unrealized gain (loss) | (.381) | .204 | .240 | (.419) | .392 |
| Total from investment operations | (.070) | .529 | .584 | (.074) | .719 |
| Distributions from net investment income | (.313) | (.312) | (.308) | (.336) | (.284) |
| Distributions from net realized gain | (.077) | (.057) | (.006) | (.010) | (.005) |
| Total distributions | (.390) | (.369) | (.314) | (.346) | (.289) |
| Net asset value, end of period | $12.34 | $12.80 | $12.64 | $12.37 | $12.79 |
| Total ReturnB,C | (.53)% | 4.22% | 4.74% | (.60)% | 5.83% |
| Ratios to Average Net AssetsD,E | | | | | |
| Expenses before reductions | .40% | .41% | .41% | .42% | .42% |
| Expenses net of fee waivers, if any | .40% | .41% | .41% | .42% | .42% |
| Expenses net of all reductions | .40% | .41% | .41% | .42% | .42% |
| Net investment income (loss) | 2.49% | 2.53% | 2.67% | 2.69% | 2.56% |
| Supplemental Data | | | | | |
| Net assets, end of period (000 omitted) | $928,285 | $1,069,371 | $1,023,875 | $1,052,893 | $1,081,564 |
| Portfolio turnover rateF | 8% | 6% | 11% | 9% | 7% |
A Calculated based on average shares outstanding during the period.
B Total returns do not reflect charges attributable to your insurance company's separate account. Inclusion of these charges would reduce the total returns shown.
C Total returns would have been lower if certain expenses had not been reduced during the applicable periods shown.
D Fees and expenses of any underlying Fidelity Central Funds are not included in the Fund's expense ratio. The Fund indirectly bears its proportionate share of the expenses of any underlying Fidelity Central Funds. Based on their most recent shareholder report date, the expenses of any underlying non-money market Fidelity Central Funds were less than.005%.
E Expense ratios reflect operating expenses of the class. Expenses before reductions do not reflect amounts reimbursed by the investment adviser or reductions from expense offset arrangements and do not represent the amount paid by the class during periods when reimbursements or reductions occur. Expenses net of fee waivers reflect expenses after reimbursement by the investment adviser but prior to reductions from expense offset arrangements. Expenses net of all reductions represent the net expenses paid by the class.
F Amount does not include the portfolio activity of any underlying Fidelity Central Funds.
See accompanying notes which are an integral part of the financial statements.
VIP Investment Grade Bond Portfolio Service Class
| Years ended December 31, | 2018 | 2017 | 2016 | 2015 | 2014 |
| Selected Per–Share Data | | | | | |
| Net asset value, beginning of period | $12.66 | $12.50 | $12.24 | $12.66 | $12.24 |
| Income from Investment Operations | | | | | |
| Net investment income (loss)A | .295 | .309 | .328 | .329 | .312 |
| Net realized and unrealized gain (loss) | (.377) | .207 | .236 | (.416) | .391 |
| Total from investment operations | (.082) | .516 | .564 | (.087) | .703 |
| Distributions from net investment income | (.301) | (.299) | (.298) | (.323) | (.278) |
| Distributions from net realized gain | (.077) | (.057) | (.006) | (.010) | (.005) |
| Total distributions | (.378) | (.356) | (.304) | (.333) | (.283) |
| Net asset value, end of period | $12.20 | $12.66 | $12.50 | $12.24 | $12.66 |
| Total ReturnB,C | (.63)% | 4.16% | 4.63% | (.71)% | 5.75% |
| Ratios to Average Net AssetsD,E | | | | | |
| Expenses before reductions | .50% | .51% | .51% | .52% | .52% |
| Expenses net of fee waivers, if any | .50% | .51% | .51% | .52% | .52% |
| Expenses net of all reductions | .50% | .51% | .51% | .52% | .52% |
| Net investment income (loss) | 2.39% | 2.43% | 2.57% | 2.60% | 2.46% |
| Supplemental Data | | | | | |
| Net assets, end of period (000 omitted) | $553,442 | $587,652 | $541,803 | $520,000 | $432,656 |
| Portfolio turnover rateF | 8% | 6% | 11% | 9% | 7% |
A Calculated based on average shares outstanding during the period.
B Total returns do not reflect charges attributable to your insurance company's separate account. Inclusion of these charges would reduce the total returns shown.
C Total returns would have been lower if certain expenses had not been reduced during the applicable periods shown.
D Fees and expenses of any underlying Fidelity Central Funds are not included in the Fund's expense ratio. The Fund indirectly bears its proportionate share of the expenses of any underlying Fidelity Central Funds. Based on their most recent shareholder report date, the expenses of any underlying non-money market Fidelity Central Funds were less than .005%.
E Expense ratios reflect operating expenses of the class. Expenses before reductions do not reflect amounts reimbursed by the investment adviser or reductions from expense offset arrangements and do not represent the amount paid by the class during periods when reimbursements or reductions occur. Expenses net of fee waivers reflect expenses after reimbursement by the investment adviser but prior to reductions from expense offset arrangements. Expenses net of all reductions represent the net expenses paid by the class.
F Amount does not include the portfolio activity of any underlying Fidelity Central Funds.
See accompanying notes which are an integral part of the financial statements.
VIP Investment Grade Bond Portfolio Service Class 2
| Years ended December 31, | 2018 | 2017 | 2016 | 2015 | 2014 |
| Selected Per–Share Data | | | | | |
| Net asset value, beginning of period | $12.49 | $12.34 | $12.09 | $12.51 | $12.10 |
| Income from Investment Operations | | | | | |
| Net investment income (loss)A | .272 | .286 | .304 | .306 | .289 |
| Net realized and unrealized gain (loss) | (.372) | .203 | .235 | (.410) | .379 |
| Total from investment operations | (.100) | .489 | .539 | (.104) | .668 |
| Distributions from net investment income | (.283) | (.282) | (.283) | (.306) | (.253) |
| Distributions from net realized gain | (.077) | (.057) | (.006) | (.010) | (.005) |
| Total distributions | (.360) | (.339) | (.289) | (.316) | (.258) |
| Net asset value, end of period | $12.03 | $12.49 | $12.34 | $12.09 | $12.51 |
| Total ReturnB,C | (.79)% | 3.99% | 4.48% | (.85)% | 5.53% |
| Ratios to Average Net AssetsD,E | | | | | |
| Expenses before reductions | .65% | .66% | .66% | .67% | .67% |
| Expenses net of fee waivers, if any | .65% | .66% | .66% | .67% | .67% |
| Expenses net of all reductions | .65% | .66% | .66% | .67% | .67% |
| Net investment income (loss) | 2.24% | 2.28% | 2.42% | 2.45% | 2.31% |
| Supplemental Data | | | | | |
| Net assets, end of period (000 omitted) | $1,505,566 | $1,514,502 | $1,310,808 | $1,186,855 | $1,082,467 |
| Portfolio turnover rateF | 8% | 6% | 11% | 9% | 7% |
A Calculated based on average shares outstanding during the period.
B Total returns do not reflect charges attributable to your insurance company's separate account. Inclusion of these charges would reduce the total returns shown.
C Total returns would have been lower if certain expenses had not been reduced during the applicable periods shown.
D Fees and expenses of any underlying Fidelity Central Funds are not included in the Fund's expense ratio. The Fund indirectly bears its proportionate share of the expenses of any underlying Fidelity Central Funds. Based on their most recent shareholder report date, the expenses of any underlying non-money market Fidelity Central Funds were less than .005%.
E Expense ratios reflect operating expenses of the class. Expenses before reductions do not reflect amounts reimbursed by the investment adviser or reductions from expense offset arrangements and do not represent the amount paid by the class during periods when reimbursements or reductions occur. Expenses net of fee waivers reflect expenses after reimbursement by the investment adviser but prior to reductions from expense offset arrangements. Expenses net of all reductions represent the net expenses paid by the class.
F Amount does not include the portfolio activity of any underlying Fidelity Central Funds.
See accompanying notes which are an integral part of the financial statements.
VIP Investment Grade Bond Portfolio Investor Class
| Years ended December 31, | 2018 | 2017 | 2016 | 2015 | 2014 |
| Selected Per–Share Data | | | | | |
| Net asset value, beginning of period | $12.75 | $12.59 | $12.32 | $12.75 | $12.32 |
| Income from Investment Operations | | | | | |
| Net investment income (loss)A | .305 | .319 | .338 | .340 | .322 |
| Net realized and unrealized gain (loss) | (.380) | .206 | .243 | (.428) | .395 |
| Total from investment operations | (.075) | .525 | .581 | (.088) | .717 |
| Distributions from net investment income | (.308) | (.308) | (.305) | (.332) | (.282) |
| Distributions from net realized gain | (.077) | (.057) | (.006) | (.010) | (.005) |
| Total distributions | (.385) | (.365) | (.311) | (.342) | (.287) |
| Net asset value, end of period | $12.29 | $12.75 | $12.59 | $12.32 | $12.75 |
| Total ReturnB,C | (.57)% | 4.20% | 4.74% | (.71)% | 5.83% |
| Ratios to Average Net AssetsD,E | | | | | |
| Expenses before reductions | .44% | .44% | .45% | .45% | .45% |
| Expenses net of fee waivers, if any | .44% | .44% | .45% | .45% | .45% |
| Expenses net of all reductions | .44% | .44% | .45% | .45% | .45% |
| Net investment income (loss) | 2.46% | 2.49% | 2.63% | 2.66% | 2.53% |
| Supplemental Data | | | | | |
| Net assets, end of period (000 omitted) | $879,703 | $1,030,725 | $915,550 | $792,855 | $759,351 |
| Portfolio turnover rateF | 8% | 6% | 11% | 9% | 7% |
A Calculated based on average shares outstanding during the period.
B Total returns do not reflect charges attributable to your insurance company's separate account. Inclusion of these charges would reduce the total returns shown.
C Total returns would have been lower if certain expenses had not been reduced during the applicable periods shown.
D Fees and expenses of any underlying Fidelity Central Funds are not included in the Fund's expense ratio. The Fund indirectly bears its proportionate share of the expenses of any underlying Fidelity Central Funds. Based on their most recent shareholder report date, the expenses of any underlying non-money market Fidelity Central Funds were less than .005%.
E Expense ratios reflect operating expenses of the class. Expenses before reductions do not reflect amounts reimbursed by the investment adviser or reductions from expense offset arrangements and do not represent the amount paid by the class during periods when reimbursements or reductions occur. Expenses net of fee waivers reflect expenses after reimbursement by the investment adviser but prior to reductions from expense offset arrangements. Expenses net of all reductions represent the net expenses paid by the class.
F Amount does not include the portfolio activity of any underlying Fidelity Central Funds.
See accompanying notes which are an integral part of the financial statements.
Notes to Financial Statements
For the period ended December 31, 2018
1. Organization.
VIP Investment Grade Bond Portfolio (the Fund) is a fund of Variable Insurance Products Fund V (the Trust) and is authorized to issue an unlimited number of shares. The Trust is registered under the Investment Company Act of 1940, as amended (the 1940 Act), as an open-end management investment company organized as a Massachusetts business trust. Shares of the Fund may only be purchased by insurance companies for the purpose of funding variable annuity or variable life insurance contracts. The Fund offers the following classes of shares: Initial Class shares, Service Class shares, Service Class 2 shares and Investor Class shares. All classes have equal rights and voting privileges, except for matters affecting a single class.
2. Investments in Fidelity Central Funds.
The Fund invests in Fidelity Central Funds, which are open-end investment companies generally available only to other investment companies and accounts managed by the investment adviser and its affiliates. The Fund's Schedule of Investments lists each of the Fidelity Central Funds held as of period end, if any, as an investment of the Fund, but does not include the underlying holdings of each Fidelity Central Fund. As an Investing Fund, the Fund indirectly bears its proportionate share of the expenses of the underlying Fidelity Central Funds.
Based on its investment objective, each Fidelity Central Fund may invest or participate in various investment vehicles or strategies that are similar to those of the Fund. These strategies are consistent with the investment objectives of the Fund and may involve certain economic risks which may cause a decline in value of each of the Fidelity Central Funds and thus a decline in the value of the Fund. The Money Market Central Funds seek preservation of capital and current income and are managed by Fidelity Investments Money Management, Inc. (FIMM), an affiliate of the investment adviser. Annualized expenses of the Money Market Central Funds as of their most recent shareholder report date are less than .005%. The following summarizes the Fund's investment in each non-money market Fidelity Central Fund.
| Fidelity Central Fund | Investment Manager | Investment Objective | Investment Practices | Expense Ratio(a) |
| Fidelity Specialized High Income Central Fund | FMR Co., Inc. (FMRC) | Seeks a high level of current income by normally investing in income-producing debt securities, with an emphasis on lower-quality debt securities. | Loans & Direct Debt Instruments
Restricted Securities
| Less than .005% |
| Fidelity Investment Grade Bond Central Fund | FIMM | Seeks a high level of income by normally investing in investment–grade debt securities. | Delayed Delivery & When Issued Securities
Repurchase Agreements
Restricted Securities
Swaps | Less than .005% |
(a) Expenses expressed as a percentage of average net assets and are as of each underlying Central Fund's most recent annual or semi-annual shareholder report.
An unaudited holdings listing for the Fund, which presents direct holdings as well as the pro-rata share of any securities and other investments held indirectly through its investment in underlying non-money market Fidelity Central Funds, is available at institutional.fidelity.com. A complete unaudited list of holdings for each Fidelity Central Fund is available upon request or at the Securities and Exchange Commission (the SEC) website at www.sec.gov. In addition, the financial statements of the Fidelity Central Funds which contain the significant accounting policies (including investment valuation policies) of those funds, which are not covered by the Fund's Report of Independent Registered Public Accounting Firm, are available on the SEC website or upon request.
3. Significant Accounting Policies.
The Fund is an investment company and applies the accounting and reporting guidance of the Financial Accounting Standards Board (FASB) Accounting Standards Codification Topic 946 Financial Services – Investments Companies. The financial statements have been prepared in conformity with accounting principles generally accepted in the United States of America (GAAP), which require management to make certain estimates and assumptions at the date of the financial statements. Actual results could differ from those estimates. Subsequent events, if any, through the date that the financial statements were issued have been evaluated in the preparation of the financial statements. The following summarizes the significant accounting policies of the Fund:
Investment Valuation. Investments are valued as of 4:00 p.m. Eastern time on the last calendar day of the period. The Board of Trustees (the Board) has delegated the day to day responsibility for the valuation of the Fund's investments to the Fair Value Committee (the Committee) established by the Fund's investment adviser. In accordance with valuation policies and procedures approved by the Board, the Fund attempts to obtain prices from one or more third party pricing vendors or brokers to value its investments. When current market prices, quotations or currency exchange rates are not readily available or reliable, investments will be fair valued in good faith by the Committee, in accordance with procedures adopted by the Board. Factors used in determining fair value vary by investment type and may include market or investment specific events, changes in interest rates and credit quality. The frequency with which these procedures are used cannot be predicted and they may be utilized to a significant extent. The Committee oversees the Fund's valuation policies and procedures and reports to the Board on the Committee's activities and fair value determinations. The Board monitors the appropriateness of the procedures used in valuing the Fund's investments and ratifies the fair value determinations of the Committee.
The Fund categorizes the inputs to valuation techniques used to value its investments into a disclosure hierarchy consisting of three levels as shown below:
- Level 1 – quoted prices in active markets for identical investments
- Level 2 – other significant observable inputs (including quoted prices for similar investments, interest rates, prepayment speeds, etc.)
- Level 3 – unobservable inputs (including the Fund's own assumptions based on the best information available)
Valuation techniques used to value the Fund's investments by major category are as follows:
Debt securities, including restricted securities, are valued based on evaluated prices received from third party pricing vendors or from brokers who make markets in such securities. U.S. government and government agency obligations are valued by pricing vendors who utilize matrix pricing which considers yield or price of bonds of comparable quality, coupon, maturity and type or by broker-supplied prices. When independent prices are unavailable or unreliable, debt securities may be valued utilizing pricing methodologies which consider similar factors that would be used by third party pricing vendors. Debt securities are generally categorized as Level 2 in the hierarchy but may be Level 3 depending on the circumstances.
Investments in open-end mutual funds, including the Fidelity Central Funds, are valued at their closing net asset value (NAV) each business day and are categorized as Level 1 in the hierarchy.
Changes in valuation techniques may result in transfers in or out of an assigned level within the disclosure hierarchy. The aggregate value of investments by input level as of December 31, 2018 is included at the end of the Fund's Schedule of Investments.
Investment Transactions and Income. For financial reporting purposes, the Fund's investment holdings and NAV include trades executed through the end of the last business day of the period. The NAV per share for processing shareholder transactions is calculated as of the close of business of the New York Stock Exchange (NYSE), normally 4:00 p.m. Eastern time and includes trades executed through the end of the prior business day. Gains and losses on securities sold are determined on the basis of identified cost. Income and capital gain distributions from Fidelity Central Funds, if any, are recorded on the ex-dividend date. Interest income is accrued as earned and includes coupon interest and amortization of premium and accretion of discount on debt securities as applicable. The principal amount on inflation-indexed securities is periodically adjusted to the rate of inflation and interest is accrued based on the principal amount. The adjustments to principal due to inflation are reflected as increases or decreases to Interest in the accompanying Statement of Operations. Debt obligations may be placed on non-accrual status and related interest income may be reduced by ceasing current accruals and writing off interest receivables when the collection of all or a portion of interest has become doubtful based on consistently applied procedures. A debt obligation is removed from non-accrual status when the issuer resumes interest payments or when collectability of interest is reasonably assured.
Class Allocations and Expenses. Investment income, realized and unrealized capital gains and losses, common expenses of the Fund, and certain fund-level expense reductions, if any, are allocated daily on a pro-rata basis to each class based on the relative net assets of each class to the total net assets of the Fund. Each class differs with respect to transfer agent and distribution and service plan fees incurred. Certain expense reductions may also differ by class. For the reporting period, the allocated portion of income and expenses to each class as a percent of its average net assets may vary due to the timing of recording these transactions in relation to fluctuating net assets of the classes. Expenses directly attributable to a fund are charged to that fund. Expenses attributable to more than one fund are allocated among the respective funds on the basis of relative net assets or other appropriate methods. Expense estimates are accrued in the period to which they relate and adjustments are made when actual amounts are known.
Income Tax Information and Distributions to Shareholders. Each year, the Fund intends to qualify as a regulated investment company under Subchapter M of the Internal Revenue Code, including distributing substantially all of its taxable income and realized gains. As a result, no provision for U.S. Federal income taxes is required. As of December 31, 2018, the Fund did not have any unrecognized tax benefits in the financial statements; nor is the Fund aware of any tax positions for which it is reasonably possible that the total amounts of unrecognized tax benefits will significantly change in the next twelve months. The Fund files a U.S. federal tax return, in addition to state and local tax returns as required. The Fund's federal income tax returns are subject to examination by the Internal Revenue Service (IRS) for a period of three fiscal years after they are filed. State and local tax returns may be subject to examination for an additional fiscal year depending on the jurisdiction.
Distributions are declared and recorded on the ex-dividend date. Income and capital gain distributions are declared separately for each class. Income and capital gain distributions are determined in accordance with income tax regulations, which may differ from GAAP.
Capital accounts within the financial statements are adjusted for permanent book-tax differences. These adjustments have no impact on net assets or the results of operations. Capital accounts are not adjusted for temporary book-tax differences which will reverse in a subsequent period.
Book-tax differences are primarily due to market discount, deferred trustees compensation and losses deferred due to wash sales.
As of period end, the cost and unrealized appreciation (depreciation) in securities, and derivatives if applicable, for federal income tax purposes were as follows:
| Gross unrealized appreciation | $45,650,800 |
| Gross unrealized depreciation | (58,526,559) |
| Net unrealized appreciation (depreciation) | $(12,875,759) |
| Tax Cost | $3,896,665,689 |
The tax-based components of distributable earnings as of period end were as follows:
| Undistributed ordinary income | $15,938,062 |
| Capital loss carryforward | $(17,096,391) |
| Net unrealized appreciation (depreciation) on securities and other investments | $(12,875,759) |
Capital loss carryforwards are only available to offset future capital gains of the Fund to the extent provided by regulations and may be limited. Under the Regulated Investment Company Modernization Act of 2010 (the Act), the Fund is permitted to carry forward capital losses incurred in taxable years beginning after December 22, 2010 for an unlimited period and such capital losses are required to be used prior to any losses that expire. The capital loss carryforward information presented below, including any applicable limitation, is estimated as of fiscal period end and is subject to adjustment.
| No expiration | |
| Short-term | $(3,656,109) |
| Long-term | (13,440,282) |
| Total no expiration | $(17,096,391) |
| Total capital loss carryforward | $(17,096,391) |
The tax character of distributions paid was as follows:
| | December 31, 2018 | December 31, 2017 |
| Ordinary Income | $95,927,460 | $ 104,588,897 |
| Long-term Capital Gains | 24,496,884 | 9,775,664 |
| Total | $120,424,344 | $ 114,364,561 |
New Rule Issuance. During August 2018, the U.S. Securities and Exchange Commission issued Final Rule Release No. 33-10532, Disclosure Update and Simplification. This Final Rule includes amendments specific to registered investment companies that are intended to eliminate overlap in disclosure requirements between Regulation S-X and GAAP. In accordance with these amendments, certain line-items in the Fund's financial statements have been combined or removed for the current period as outlined in the table below.
| Financial Statement | Current Line-Item Presentation | Prior Line-Item Presentation |
| Statement of Assets and Liabilities | Total distributable earnings (loss) | Undistributed/Distributions in excess of/Accumulated net investment income (loss)
Accumulated/Undistributed net realized gain (loss)
Net unrealized appreciation (depreciation) |
| Statement of Changes in Net Assets | N/A - removed | Undistributed/Distributions in excess of/Accumulated net investment income (loss) end of period |
| Statement of Changes in Net Assets | Distributions to shareholders | Distributions to shareholders from net investment income
Distributions to shareholders from net realized gain |
| Distributions to Shareholders Note to Financial Statements | Distributions to shareholders | Distributions to shareholders from net investment income
Distributions to shareholders from net realized gain |
4. Purchases and Sales of Investments.
Purchases and sales of securities (including the Fixed-Income Central Funds), other than short-term securities and U.S. government securities, aggregated $192,386,608 and $372,785,784, respectively.
5. Fees and Other Transactions with Affiliates.
Management Fee. Fidelity Management & Research Company (the investment adviser) and its affiliates provide the Fund with investment management related services for which the Fund pays a monthly management fee. The management fee is the sum of an individual fund fee rate that is based on an annual rate of .20% of the Fund's average net assets and an annualized group fee rate that averaged .11% during the period. The group fee rate is based upon the average net assets of all the mutual funds advised by the investment adviser, including any mutual funds previously advised by the investment adviser that are currently advised by Fidelity SelectCo, LLC, an affiliate of the investment adviser. The group fee rate decreases as assets under management increase and increases as assets under management decrease. For the reporting period, the total annual management fee rate was .31% of the Fund's average net assets.
Distribution and Service Plan Fees. In accordance with Rule 12b-1 of the 1940 Act, the Fund has adopted separate 12b-1 Plans for each Service Class of shares. Each Service Class pays Fidelity Distributors Corporation (FDC), an affiliate of the investment adviser, a service fee. For the period, the service fee is based on an annual rate of .10% of Service Class' average net assets and .25% of Service Class 2's average net assets.
For the period, total fees, all of which were re-allowed to insurance companies for the distribution of shares and providing shareholder support services, were as follows:
| Service Class | $571,735 |
| Service Class 2 | 3,789,962 |
| | $4,361,697 |
Transfer Agent Fees. Fidelity Investments Institutional Operations Company, Inc. (FIIOC), an affiliate of the investment adviser, is the Fund's transfer, dividend disbursing, and shareholder servicing agent. FIIOC receives an asset-based fee with respect to each class. Each class pays a fee for transfer agent services, typesetting and printing and mailing of shareholder reports, excluding mailing of proxy statements, equal to an annual rate of class-level average net assets. The annual rate for Investor Class is .10% and the annual rate for all other classes is .07%. For the period, transfer agent fees for each class were as follows:
| Initial Class | $678,091 |
| Service Class | 388,780 |
| Service Class 2 | 1,030,870 |
| Investor Class | 974,458 |
| | $3,072,199 |
Accounting Fees. Fidelity Service Company, Inc. (FSC), an affiliate of the investment adviser, maintains the Fund's accounting records. The fee is based on the level of average net assets for each month. For the period, the fees were equivalent to an annual rate of .03%.
Interfund Trades. The Fund may purchase from or sell securities to other Fidelity Funds under procedures adopted by the Board. The procedures have been designed to ensure these interfund trades are executed in accordance with Rule 17a-7 of the 1940 Act. Interfund trades are included within the respective purchases and sales amounts shown in the Purchases and Sales of Investments note.
6. Committed Line of Credit.
The Fund participates with other funds managed by the investment adviser or an affiliate in a $4.25 billion credit facility (the "line of credit") to be utilized for temporary or emergency purposes to fund shareholder redemptions or for other short-term liquidity purposes. The Fund has agreed to pay commitment fees on its pro-rata portion of the line of credit, which amounted to $11,251 and is reflected in Miscellaneous expenses on the Statement of Operations. During the period, the Fund did not borrow on this line of credit.
7. Expense Reductions.
Through arrangements with the Fund's custodian, credits realized as a result of certain uninvested cash balances were used to reduce the Fund's expenses. During the period, these credits reduced the Fund's custody expenses by $312.
In addition, during the period the investment adviser reimbursed and/or waived a portion of fund-level operating expenses in the amount of $25,269.
8. Distributions to Shareholders.
Distributions to shareholders of each class were as follows:
| | Year ended
December 31, 2018 | Year ended
December 31, 2017 |
| Distributions to shareholders | | |
| Initial Class | $30,244,978 | $– |
| Service Class | 17,030,044 | – |
| Service Class 2 | 44,529,426 | – |
| Investor Class | 28,619,896 | – |
| Total | $120,424,344 | $– |
| From net investment income | | |
| Initial Class | $– | $26,114,745 |
| Service Class | – | 13,527,204 |
| Service Class 2 | – | 33,028,704 |
| Investor Class | – | 24,281,007 |
| Total | $– | $96,951,660 |
| From net realized gain | | |
| Initial Class | $– | $4,578,531 |
| Service Class | – | 2,473,896 |
| Service Class 2 | – | 6,260,351 |
| Investor Class | – | 4,100,123 |
| Total | $– | $17,412,901 |
9. Share Transactions.
Transactions for each class of shares were as follows:
| | Shares | Shares | Dollars | Dollars |
| | Year ended December 31, 2018 | Year ended December 31, 2017 | Year ended December 31, 2018 | Year ended December 31, 2017 |
| Initial Class | | | | |
| Shares sold | 11,083,174 | 15,591,595 | $138,630,179 | $200,373,757 |
| Reinvestment of distributions | 2,446,784 | 2,409,044 | 30,244,978 | 30,693,276 |
| Shares redeemed | (21,859,101) | (15,446,704) | (272,805,561) | (198,086,545) |
| Net increase (decrease) | (8,329,143) | 2,553,935 | $(103,930,404) | $32,980,488 |
| Service Class | | | | |
| Shares sold | 8,812,788 | 10,351,533 | $108,723,787 | $131,529,873 |
| Reinvestment of distributions | 1,393,633 | 1,269,621 | 17,030,044 | 16,001,100 |
| Shares redeemed | (11,266,987) | (8,521,274) | (139,229,053) | (108,510,224) |
| Net increase (decrease) | (1,060,566) | 3,099,880 | $(13,475,222) | $39,020,749 |
| Service Class 2 | | | | |
| Shares sold | 16,374,257 | 22,778,348 | $200,205,468 | $284,830,875 |
| Reinvestment of distributions | 3,694,245 | 3,160,058 | 44,529,426 | 39,289,055 |
| Shares redeemed | (16,197,128) | (10,848,664) | (196,947,640) | (136,111,587) |
| Net increase (decrease) | 3,871,374 | 15,089,742 | $47,787,254 | $188,008,343 |
| Investor Class | | | | |
| Shares sold | 6,025,031 | 12,974,918 | $75,215,767 | $166,356,597 |
| Reinvestment of distributions | 2,324,570 | 2,236,066 | 28,619,896 | 28,381,130 |
| Shares redeemed | (17,627,680) | (7,064,535) | (218,835,892) | (90,125,113) |
| Net increase (decrease) | (9,278,079) | 8,146,449 | $(115,000,229) | $104,612,614 |
10. Other.
The Fund's organizational documents provide former and current trustees and officers with a limited indemnification against liabilities arising in connection with the performance of their duties to the Fund. In the normal course of business, the Fund may also enter into contracts that provide general indemnifications. The Fund's maximum exposure under these arrangements is unknown as this would be dependent on future claims that may be made against the Fund. The risk of material loss from such claims is considered remote.
At the end of the period, the investment adviser or its affiliates were the owners of record of 22% of the total outstanding shares of the Fund and one otherwise unaffiliated shareholder was the owner of record of 28% of the total outstanding shares of the fund.
VIP Investment Grade Bond Portfolio
Report of Independent Registered Public Accounting Firm
To the Trustees of Variable Insurance Products Fund V and Shareholders of VIP Investment Grade Bond Portfolio:
Opinion on the Financial Statements and Financial Highlights
We have audited the accompanying statement of assets and liabilities of VIP Investment Grade Bond Portfolio (the "Fund"), a fund of Variable Insurance Products Fund V, including the schedule of investments, as of December 31, 2018, and the related statement of operations for the year then ended, the statement of changes in net assets for each of the two years in the period then ended, the financial highlights for each of the five years in the period then ended, and the related notes. In our opinion, the financial statements and financial highlights present fairly, in all material respects, the financial position of the Fund as of December 31, 2018, and the results of its operations for the year then ended, the changes in its net assets for each of the two years in the period then ended, and the financial highlights for each of the five years in the period then ended, in conformity with accounting principles generally accepted in the United States of America.
Basis for Opinion
These financial statements and financial highlights are the responsibility of the Fund's management. Our responsibility is to express an opinion on the Fund's financial statements and financial highlights based on our audits. We are a public accounting firm registered with the Public Company Accounting Oversight Board (United States) (PCAOB) and are required to be independent with respect to the Fund in accordance with the U.S. federal securities laws and the applicable rules and regulations of the Securities and Exchange Commission and the PCAOB.
We conducted our audits in accordance with the standards of the PCAOB. Those standards require that we plan and perform the audit to obtain reasonable assurance about whether the financial statements and financial highlights are free of material misstatement, whether due to error or fraud. The Fund is not required to have, nor were we engaged to perform, an audit of its internal control over financial reporting. As part of our audits we are required to obtain an understanding of internal control over financial reporting but not for the purpose of expressing an opinion on the effectiveness of the Fund’s internal control over financial reporting. Accordingly, we express no such opinion.
Our audits included performing procedures to assess the risks of material misstatement of the financial statements and financial highlights, whether due to error or fraud, and performing procedures that respond to those risks. Such procedures included examining, on a test basis, evidence regarding the amounts and disclosures in the financial statements and financial highlights. Our audits also included evaluating the accounting principles used and significant estimates made by management, as well as evaluating the overall presentation of the financial statements and financial highlights. Our procedures included confirmation of securities owned as of December 31, 2018, by correspondence with the custodians and brokers; when replies were not received from brokers, we performed other auditing procedures. We believe that our audits provide a reasonable basis for our opinion.
/s/ Deloitte & Touche LLP
Boston, Massachusetts
February 19, 2019
We have served as the auditor of one or more of the Fidelity investment companies since 1999.
VIP Investment Grade Bond Portfolio
Trustees and Officers
The Trustees, Members of the Advisory Board (if any), and officers of the trust and fund, as applicable, are listed below. The Board of Trustees governs the fund and is responsible for protecting the interests of shareholders. The Trustees are experienced executives who meet periodically throughout the year to oversee the fund's activities, review contractual arrangements with companies that provide services to the fund, oversee management of the risks associated with such activities and contractual arrangements, and review the fund's performance. Each of the Trustees oversees 260 funds.
The Trustees hold office without limit in time except that (a) any Trustee may resign; (b) any Trustee may be removed by written instrument, signed by at least two-thirds of the number of Trustees prior to such removal; (c) any Trustee who requests to be retired or who has become incapacitated by illness or injury may be retired by written instrument signed by a majority of the other Trustees; and (d) any Trustee may be removed at any special meeting of shareholders by a two-thirds vote of the outstanding voting securities of the trust. Each Trustee who is not an interested person (as defined in the 1940 Act) of the trust and the fund is referred to herein as an Independent Trustee. Each Independent Trustee shall retire not later than the last day of the calendar year in which his or her 75th birthday occurs. The Independent Trustees may waive this mandatory retirement age policy with respect to individual Trustees. Officers and Advisory Board Members hold office without limit in time, except that any officer or Advisory Board Member may resign or may be removed by a vote of a majority of the Trustees at any regular meeting or any special meeting of the Trustees. Except as indicated, each individual has held the office shown or other offices in the same company for the past five years.
The fund’s Statement of Additional Information (SAI) includes more information about the Trustees. To request a free copy, call Fidelity at 1-877-208-0098.
Experience, Skills, Attributes, and Qualifications of the Trustees. The Governance and Nominating Committee has adopted a statement of policy that describes the experience, qualifications, attributes, and skills that are necessary and desirable for potential Independent Trustee candidates (Statement of Policy). The Board believes that each Trustee satisfied at the time he or she was initially elected or appointed a Trustee, and continues to satisfy, the standards contemplated by the Statement of Policy. The Governance and Nominating Committee also engages professional search firms to help identify potential Independent Trustee candidates who have the experience, qualifications, attributes, and skills consistent with the Statement of Policy. From time to time, additional criteria based on the composition and skills of the current Independent Trustees, as well as experience or skills that may be appropriate in light of future changes to board composition, business conditions, and regulatory or other developments, have also been considered by the professional search firms and the Governance and Nominating Committee. In addition, the Board takes into account the Trustees' commitment and participation in Board and committee meetings, as well as their leadership of standing and ad hoc committees throughout their tenure.
In determining that a particular Trustee was and continues to be qualified to serve as a Trustee, the Board has considered a variety of criteria, none of which, in isolation, was controlling. The Board believes that, collectively, the Trustees have balanced and diverse experience, qualifications, attributes, and skills, which allow the Board to operate effectively in governing the fund and protecting the interests of shareholders. Information about the specific experience, skills, attributes, and qualifications of each Trustee, which in each case led to the Board's conclusion that the Trustee should serve (or continue to serve) as a trustee of the fund, is provided below.
Board Structure and Oversight Function. Abigail P. Johnson is an interested person and currently serves as Chairman. The Trustees have determined that an interested Chairman is appropriate and benefits shareholders because an interested Chairman has a personal and professional stake in the quality and continuity of services provided to the fund. Independent Trustees exercise their informed business judgment to appoint an individual of their choosing to serve as Chairman, regardless of whether the Trustee happens to be independent or a member of management. The Independent Trustees have determined that they can act independently and effectively without having an Independent Trustee serve as Chairman and that a key structural component for assuring that they are in a position to do so is for the Independent Trustees to constitute a substantial majority for the Board. The Independent Trustees also regularly meet in executive session. Arthur E. Johnson serves as Chairman of the Independent Trustees and as such (i) acts as a liaison between the Independent Trustees and management with respect to matters important to the Independent Trustees and (ii) with management prepares agendas for Board meetings.
Fidelity® funds are overseen by different Boards of Trustees. The fund's Board oversees Fidelity's investment-grade bond, money market, asset allocation and certain equity funds, and other Boards oversee Fidelity's high income and other equity funds. The asset allocation funds may invest in Fidelity® funds that are overseen by such other Boards. The use of separate Boards, each with its own committee structure, allows the Trustees of each group of Fidelity® funds to focus on the unique issues of the funds they oversee, including common research, investment, and operational issues. On occasion, the separate Boards establish joint committees to address issues of overlapping consequences for the Fidelity® funds overseen by each Board.
The Trustees operate using a system of committees to facilitate the timely and efficient consideration of all matters of importance to the Trustees, the fund, and fund shareholders and to facilitate compliance with legal and regulatory requirements and oversight of the fund's activities and associated risks. The Board, acting through its committees, has charged FMR and its affiliates with (i) identifying events or circumstances the occurrence of which could have demonstrably adverse effects on the fund's business and/or reputation; (ii) implementing processes and controls to lessen the possibility that such events or circumstances occur or to mitigate the effects of such events or circumstances if they do occur; and (iii) creating and maintaining a system designed to evaluate continuously business and market conditions in order to facilitate the identification and implementation processes described in (i) and (ii) above. Because the day-to-day operations and activities of the fund are carried out by or through FMR, its affiliates, and other service providers, the fund's exposure to risks is mitigated but not eliminated by the processes overseen by the Trustees. While each of the Board's committees has responsibility for overseeing different aspects of the fund's activities, oversight is exercised primarily through the Operations and Audit Committees. In addition, an ad hoc Board committee of Independent Trustees has worked with FMR to enhance the Board's oversight of investment and financial risks, legal and regulatory risks, technology risks, and operational risks, including the development of additional risk reporting to the Board. Appropriate personnel, including but not limited to the fund's Chief Compliance Officer (CCO), FMR's internal auditor, the independent accountants, the fund's Treasurer and portfolio management personnel, make periodic reports to the Board's committees, as appropriate, including an annual review of Fidelity's risk management program for the Fidelity® funds. The responsibilities of each standing committee, including their oversight responsibilities, are described further under "Standing Committees of the Trustees."
Interested Trustees*:
Correspondence intended for a Trustee who is an interested person may be sent to Fidelity Investments, 245 Summer Street, Boston, Massachusetts 02210.
Name, Year of Birth; Principal Occupations and Other Relevant Experience+
Abigail P. Johnson (1961)
Year of Election or Appointment: 2009
Trustee
Chairman of the Board of Trustees
Ms. Johnson also serves as Trustee of other Fidelity® funds. Ms. Johnson serves as Chairman (2016-present), Chief Executive Officer (2014-present), and Director (2007-present) of FMR LLC (diversified financial services company), President of Fidelity Financial Services (2012-present) and President of Personal, Workplace and Institutional Services (2005-present). Ms. Johnson is Chairman and Director of FMR Co., Inc. (investment adviser firm, 2011-present) and Chairman and Director of FMR (investment adviser firm, 2011-present). Previously, Ms. Johnson served as Vice Chairman (2007-2016) and President (2013-2016) of FMR LLC, President and a Director of FMR (2001-2005), a Trustee of other investment companies advised by FMR, Fidelity Investments Money Management, Inc. (investment adviser firm), and FMR Co., Inc. (2001-2005), Senior Vice President of the Fidelity® funds (2001-2005), and managed a number of Fidelity® funds. Ms. Abigail P. Johnson and Mr. Arthur E. Johnson are not related.
Jennifer Toolin McAuliffe (1959)
Year of Election or Appointment: 2016
Trustee
Ms. McAuliffe also serves as Trustee of other Fidelity® funds. Ms. McAuliffe previously served as a Member of the Advisory Board of certain Fidelity® funds (2016) and as Co-Head of Fixed Income of Fidelity Investments Limited (now known as FIL Limited (FIL)) (diversified financial services company). Earlier roles at FIL included Director of Research for FIL’s credit and quantitative teams in London, Hong Kong and Tokyo. Ms. McAuliffe also was the Director of Research for taxable and municipal bonds at Fidelity Investments Money Management, Inc. Ms. McAuliffe is also a director or trustee of several not-for-profit entities.
* Determined to be an “Interested Trustee” by virtue of, among other things, his or her affiliation with the trust or various entities under common control with FMR.
+ The information includes the Trustee's principal occupation during the last five years and other information relating to the experience, attributes, and skills relevant to the Trustee's qualifications to serve as a Trustee, which led to the conclusion that the Trustee should serve as a Trustee for the fund.
Independent Trustees:
Correspondence intended for an Independent Trustee may be sent to Fidelity Investments, P.O. Box 55235, Boston, Massachusetts 02205-5235.
Name, Year of Birth; Principal Occupations and Other Relevant Experience+
Elizabeth S. Acton (1951)
Year of Election or Appointment: 2013
Trustee
Ms. Acton also serves as Trustee of other Fidelity® funds. Prior to her retirement in April 2012, Ms. Acton was Executive Vice President, Finance (2011-2012), Executive Vice President, Chief Financial Officer (2002-2011), and Treasurer (2004-2005) of Comerica Incorporated (financial services). Prior to joining Comerica, Ms. Acton held a variety of positions at Ford Motor Company (1983-2002), including Vice President and Treasurer (2000-2002) and Executive Vice President and Chief Financial Officer of Ford Motor Credit Company (1998-2000). Ms. Acton currently serves as a member of the Board of Directors and Audit and Finance Committees of Beazer Homes USA, Inc. (homebuilding, 2012-present). Previously, Ms. Acton served as a Member of the Advisory Board of certain Fidelity® funds (2013-2016).
Ann E. Dunwoody (1953)
Year of Election or Appointment: 2018
Trustee
General Dunwoody also serves as Trustee of other Fidelity® funds. General Dunwoody (United States Army, Retired) was the first woman in U.S. military history to achieve the rank of four-star general and prior to her retirement in 2012 held a variety of positions within the U.S. Army, including Commanding General, U.S. Army Material Command (2008-2012). She is the President of First to Four LLC (leadership and mentoring services, 2012-present). She also serves as a member of the Board of Directors and Nominating and Corporate Governance Committee of L3 Technologies, Inc. (communication, electronic, sensor, and aerospace systems, 2013-present), Board of Directors and Nomination and Corporate Governance Committees of Kforce Inc. (professional staffing services, 2016-present) and Board of Directors of Automattic Inc. (software engineering, 2018-present). Previously, General Dunwoody served as a Member of the Advisory Board of certain Fidelity® funds (2018), a member of the Board of Directors and Audit and Sustainability and Corporate Responsibility Committees of Republic Services, Inc. (waste collection, disposal and recycling, 2013-2016). Ms. Dunwoody also serves on several boards for non-profit organizations, including as a member of the Board of Directors, Chair of the Nomination and Governance Committee and member of the Audit Committee of Logistics Management Institute (consulting non-profit, 2012-present), a member of the Board of Directors of the Army Historical Foundation (2015-present), a member of the Council of Trustees for the Association of the United States Army (advocacy non-profit, 2013-present) and a member of the Board of Trustees of Florida Institute of Technology (2015-present) and ThanksUSA (military family education non-profit, 2014-present).
John Engler (1948)
Year of Election or Appointment: 2014
Trustee
Mr. Engler also serves as Trustee of other Fidelity® funds. He serves on the board of directors for Universal Forest Products (manufacturer and distributor of wood and wood-alternative products, 2003-present) and K12 Inc. (technology-based education company, 2012-present). Previously, Mr. Engler served as interim president of Michigan State University (2018-2019), a Member of the Advisory Board of certain Fidelity® funds (2014-2016), president of the Business Roundtable (2011-2017), a trustee of The Munder Funds (2003-2014), president and CEO of the National Association of Manufacturers (2004-2011), member of the Board of Trustees of the Annie E. Casey Foundation (2004-2015), and as governor of Michigan (1991-2003). He is a past chairman of the National Governors Association.
Robert F. Gartland (1951)
Year of Election or Appointment: 2010
Trustee
Mr. Gartland also serves as Trustee of other Fidelity® funds. Mr. Gartland is Chairman and an investor in Gartland & Mellina Group Corp. (consulting, 2009-present). Previously, Mr. Gartland served as a partner and investor of Vietnam Partners LLC (investments and consulting, 2008-2011). Prior to his retirement, Mr. Gartland held a variety of positions at Morgan Stanley (financial services, 1979-2007), including Managing Director (1987-2007), and Chase Manhattan Bank (1975-1978).
Arthur E. Johnson (1947)
Year of Election or Appointment: 2008
Trustee
Chairman of the Independent Trustees
Mr. Johnson also serves as Trustee of other Fidelity® funds. Mr. Johnson serves as a member of the Board of Directors of Eaton Corporation plc (diversified power management, 2009-present) and Booz Allen Hamilton (management consulting, 2011-present). Prior to his retirement, Mr. Johnson served as Senior Vice President of Corporate Strategic Development of Lockheed Martin Corporation (defense contractor, 1999-2009). He previously served on the Board of Directors of IKON Office Solutions, Inc. (1999-2008), AGL Resources, Inc. (holding company, 2002-2016), and Delta Airlines (2005-2007). Mr. Arthur E. Johnson is not related to Ms. Abigail P. Johnson.
Michael E. Kenneally (1954)
Year of Election or Appointment: 2009
Trustee
Vice Chairman of the Independent Trustees
Mr. Kenneally also serves as Trustee of other Fidelity® funds. Prior to his retirement, Mr. Kenneally served as Chairman and Global Chief Executive Officer of Credit Suisse Asset Management. Before joining Credit Suisse, he was an Executive Vice President and Chief Investment Officer for Bank of America Corporation. Earlier roles at Bank of America included Director of Research, Senior Portfolio Manager and Research Analyst, and Mr. Kenneally was awarded the Chartered Financial Analyst (CFA) designation in 1991.
Marie L. Knowles (1946)
Year of Election or Appointment: 2001
Trustee
Ms. Knowles also serves as Trustee of other Fidelity® funds. Prior to Ms. Knowles' retirement in June 2000, she served as Executive Vice President and Chief Financial Officer of Atlantic Richfield Company (ARCO) (diversified energy, 1996-2000). From 1993 to 1996, she was a Senior Vice President of ARCO and President of ARCO Transportation Company (pipeline and tanker operations). Ms. Knowles currently serves as a Director and Chairman of the Audit Committee of McKesson Corporation (healthcare service, since 2002). Ms. Knowles is a member of the Board of the Santa Catalina Island Company (real estate, 2009-present). Ms. Knowles is a Member of the Investment Company Institute Board of Governors and a Member of the Governing Council of the Independent Directors Council (2014-present). She also serves as a member of the Advisory Board for the School of Engineering of the University of Southern California. Previously, Ms. Knowles served as a Director of Phelps Dodge Corporation (copper mining and manufacturing, 1994-2007), URS Corporation (engineering and construction, 2000-2003) and America West (airline, 1999-2002). Ms. Knowles previously served as Chairman (2015-2018) and Vice Chairman (2012-2015) of the Independent Trustees of certain Fidelity® funds.
Mark A. Murray (1954)
Year of Election or Appointment: 2016
Trustee
Mr. Murray also serves as Trustee of other Fidelity® funds. Mr. Murray is Vice Chairman (2013-present) of Meijer, Inc. (regional retail chain). Previously, Mr. Murray served as a Member of the Advisory Board of certain Fidelity® funds (2016) and as Co-Chief Executive Officer (2013-2016) and President (2006-2013) of Meijer, Inc. Mr. Murray serves as a member of the Board of Directors and Nuclear Review and Public Policy and Responsibility Committees of DTE Energy Company (diversified energy company, 2009-present). Mr. Murray also serves as a member of the Board of Directors of Spectrum Health (not-for-profit health system, 2015-present). Mr. Murray previously served as President of Grand Valley State University (2001-2006), Treasurer for the State of Michigan (1999-2001), Vice President of Finance and Administration for Michigan State University (1998-1999), and a member of the Board of Directors and Audit Committee and Chairman of the Nominating and Corporate Governance Committee of Universal Forest Products, Inc. (manufacturer and distributor of wood and wood-alternative products, 2004-2016). Mr. Murray is also a director or trustee of many community and professional organizations.
+ The information includes the Trustee's principal occupation during the last five years and other information relating to the experience, attributes, and skills relevant to the Trustee's qualifications to serve as a Trustee, which led to the conclusion that the Trustee should serve as a Trustee for the fund.
Advisory Board Members and Officers:
Correspondence intended for an officer may be sent to Fidelity Investments, 245 Summer Street, Boston, Massachusetts 02210. Officers appear below in alphabetical order.
Name, Year of Birth; Principal Occupation
Elizabeth Paige Baumann (1968)
Year of Election or Appointment: 2017
Anti-Money Laundering (AML) Officer
Ms. Baumann also serves as AML Officer of other funds. She is Chief AML Officer (2012-present) and Senior Vice President (2014-present) of FMR LLC (diversified financial services company) and is an employee of Fidelity Investments. Previously, Ms. Baumann served as AML Officer of the funds (2012-2016), and Vice President (2007-2014) and Deputy Anti-Money Laundering Officer (2007-2012) of FMR LLC.
Craig S. Brown (1977)
Year of Election or Appointment: 2019
Assistant Treasurer
Mr. Brown also serves as Assistant Treasurer of other funds. Mr. Brown is an employee of Fidelity Investments (2013-present).
John J. Burke III (1964)
Year of Election or Appointment: 2018
Chief Financial Officer
Mr. Burke also serves as Chief Financial Officer of other funds. Mr. Burke serves as Head of Investment Operations for Fidelity Fund and Investment Operations (2018-present) and is an employee of Fidelity Investments (1998-present). Previously Mr. Burke served as head of Asset Management Investment Operations (2012-2018).
William C. Coffey (1969)
Year of Election or Appointment: 2018
Secretary and Chief Legal Officer (CLO)
Mr. Coffey also serves as Secretary and CLO of other funds. Mr. Coffey serves as CLO, Secretary, and Senior Vice President of Fidelity Management & Research Company and FMR Co., Inc. (investment adviser firms, 2018-present); Secretary of Fidelity SelectCo, LLC and Fidelity Investments Money Management, Inc. (investment adviser firms, 2018-present); and CLO of Fidelity Management & Research (Hong Kong) Limited, FMR Investment Management (UK) Limited, and Fidelity Management & Research (Japan) Limited (investment adviser firms, 2018-present). He is Senior Vice President and Deputy General Counsel of FMR LLC (diversified financial services company, 2010-present), and is an employee of Fidelity Investments. Previously, Mr. Coffey served as Assistant Secretary of certain funds (2009-2018) and as Vice President and Associate General Counsel of FMR LLC (2005-2009).
Jonathan Davis (1968)
Year of Election or Appointment: 2010
Assistant Treasurer
Mr. Davis also serves as Assistant Treasurer of other funds. Mr. Davis serves as Assistant Treasurer of FMR Capital, Inc. (2017-present) and is an employee of Fidelity Investments. Previously, Mr. Davis served as Vice President and Associate General Counsel of FMR LLC (diversified financial services company, 2003-2010).
Adrien E. Deberghes (1967)
Year of Election or Appointment: 2010
Assistant Treasurer
Mr. Deberghes also serves as an officer of other funds. He serves as Assistant Treasurer of FMR Capital, Inc. (2017-present), Executive Vice President of Fidelity Investments Money Management, Inc. (FIMM) (investment adviser firm, 2016-present), and is an employee of Fidelity Investments (2008-present). Previously, Mr. Deberghes served as President and Treasurer of certain Fidelity® funds (2013-2018). Prior to joining Fidelity Investments, Mr. Deberghes was Senior Vice President of Mutual Fund Administration at State Street Corporation (2007-2008), Senior Director of Mutual Fund Administration at Investors Bank & Trust (2005-2007), and Director of Finance for Dunkin' Brands (2000-2005). Previously, Mr. Deberghes served in other fund officer roles.
Laura M. Del Prato (1964)
Year of Election or Appointment: 2018
President and Treasurer
Ms. Del Prato also serves as an officer of other funds. Ms. Del Prato is an employee of Fidelity Investments (2017-present). Prior to joining Fidelity Investments, Ms. Del Prato served as a Managing Director and Treasurer of the JPMorgan Mutual Funds (2014-2017). Prior to JPMorgan, Ms. Del Prato served as a partner at Cohen Fund Audit Services (accounting firm, 2012-2013) and KPMG LLP (accounting firm, 2004-2012).
Colm A. Hogan (1973)
Year of Election or Appointment: 2016
Assistant Treasurer
Mr. Hogan also serves as an officer of other funds. Mr. Hogan serves as Assistant Treasurer of FMR Capital, Inc. (2017-present) and is an employee of Fidelity Investments (2005-present). Previously, Mr. Hogan served as Assistant Treasurer of certain Fidelity® funds (2016-2018).
Chris Maher (1972)
Year of Election or Appointment: 2013
Assistant Treasurer
Mr. Maher serves as Assistant Treasurer of other funds. Mr. Maher is Vice President of Valuation Oversight, serves as Assistant Treasurer of FMR Capital, Inc. (2017-present), and is an employee of Fidelity Investments. Previously, Mr. Maher served as Vice President of Asset Management Compliance (2013), Vice President of the Program Management Group of FMR (investment adviser firm, 2010-2013), and Vice President of Valuation Oversight (2008-2010).
John B. McGinty, Jr. (1962)
Year of Election or Appointment: 2016
Chief Compliance Officer
Mr. McGinty also serves as Chief Compliance Officer of other funds. Mr. McGinty is Senior Vice President of Asset Management Compliance for Fidelity Investments and is an employee of Fidelity Investments (2016-present). Mr. McGinty previously served as Vice President, Senior Attorney at Eaton Vance Management (investment management firm, 2015-2016), and prior to Eaton Vance as global CCO for all firm operations and registered investment companies at GMO LLC (investment management firm, 2009-2015). Before joining GMO LLC, Mr. McGinty served as Senior Vice President, Deputy General Counsel for Fidelity Investments (2007-2009).
Jason P. Pogorelec (1975)
Year of Election or Appointment: 2015
Assistant Secretary
Mr. Pogorelec also serves as Assistant Secretary of other funds. Mr. Pogorelec serves as Vice President, Associate General Counsel (2010-present) and is an employee of Fidelity Investments (2006-present).
Nancy D. Prior (1967)
Year of Election or Appointment: 2014
Vice President
Ms. Prior also serves as Vice President of other funds. Ms. Prior serves as President Fixed Income, High Income/Emerging Market Debt and Multi Asset Class Strategies of FIAM LLC (2018-present), President (2016-present) and Director (2014-present) of Fidelity Investments Money Management, Inc. (FIMM) (investment adviser firm), President, Fixed Income (2014-present), and is an employee of Fidelity Investments (2002-present). Previously, Ms. Prior served as Vice Chairman of FIAM LLC (investment adviser firm, 2014-2018), a Director of FMR Investment Management (UK) Limited (investment adviser firm, 2015-2018), President Multi-Asset Class Strategies of FMR's Global Asset Allocation Division (2017-2018), Vice President of Fidelity's Money Market Funds (2012-2014), President, Money Market and Short Duration Bond Group of Fidelity Management & Research (FMR) (investment adviser firm, 2013-2014), President, Money Market Group of FMR (2011-2013), Managing Director of Research (2009-2011), Senior Vice President and Deputy General Counsel (2007-2009), and Assistant Secretary of certain Fidelity® funds (2008-2009).
Stacie M. Smith (1974)
Year of Election or Appointment: 2013
Assistant Treasurer
Ms. Smith also serves as an officer of other funds. Ms. Smith serves as Assistant Treasurer of FMR Capital, Inc. (2017-present), is an employee of Fidelity Investments (2009-present), and has served in other fund officer roles. Prior to joining Fidelity Investments, Ms. Smith served as Senior Audit Manager of Ernst & Young LLP (accounting firm, 1996-2009). Previously, Ms. Smith served as Assistant Treasurer (2013-2018) and Deputy Treasurer (2013-2016) of certain Fidelity® funds.
Marc L. Spector (1972)
Year of Election or Appointment: 2016
Deputy Treasurer
Mr. Spector also serves as an officer of other funds. Mr. Spector serves as Assistant Treasurer of FMR Capital, Inc. (2017-present) and is an employee of Fidelity Investments (2016-present). Prior to joining Fidelity Investments, Mr. Spector served as Director at the Siegfried Group (accounting firm, 2013-2016), and prior to Siegfried Group as audit senior manager at Deloitte & Touche (accounting firm, 2005-2013).
Jim Wegmann (1979)
Year of Election or Appointment: 2019
Assistant Treasurer
Mr. Wegmann also serves as Assistant Treasurer of other funds. Mr. Wegmann is an employee of Fidelity Investments (2011-present).
VIP Investment Grade Bond Portfolio
Shareholder Expense Example
As a shareholder of the Fund, you incur two types of costs: (1) transaction costs and (2) ongoing costs, including management fees, distribution and/or service (12b-1) fees and other Fund expenses. This Example is intended to help you understand your ongoing costs (in dollars) of investing in the Fund and to compare these costs with the ongoing costs of investing in other mutual funds.
The Example is based on an investment of $1,000 invested at the beginning of the period and held for the entire period (July 1, 2018 to December 31, 2018).
Actual Expenses
The first line of the accompanying table for each class of the Fund provides information about actual account values and actual expenses. You may use the information in this line, together with the amount you invested, to estimate the expenses that you paid over the period. Simply divide your account value by $1,000.00 (for example, an $8,600 account value divided by $1,000.00 = 8.6), then multiply the result by the number in the first line for a class of the Fund under the heading entitled "Expenses Paid During Period" to estimate the expenses you paid on your account during this period. The estimate of expenses does not include any fees or other expenses of any variable annuity or variable life insurance product. If they were, the estimate of expenses you paid during the period would be higher, and your ending account value would be lower. In addition, the Fund, as a shareholder in the underlying Fidelity Central Funds, will indirectly bear its pro-rata share of the fees and expenses incurred by the underlying Fidelity Central Funds. These fees and expenses are not included in the Fund's annualized expense ratio used to calculate the expense estimate in the table below.
Hypothetical Example for Comparison Purposes
The second line of the accompanying table for each class of the Fund provides information about hypothetical account values and hypothetical expenses based on a Class' actual expense ratio and an assumed rate of return of 5% per year before expenses, which is not the Class' actual return. The hypothetical account values and expenses may not be used to estimate the actual ending account balance or expenses you paid for the period. You may use this information to compare the ongoing costs of investing in the Fund and other funds. To do so, compare this 5% hypothetical example with the 5% hypothetical examples that appear in the shareholder reports of the other funds. The estimate of expenses does not include any fees or other expenses of any variable annuity or variable life insurance product. If they were, the estimate of expenses you paid during the period would be higher, and your ending account value would be lower. In addition, the Fund, as a shareholder in the underlying Fidelity Central Funds, will indirectly bear its pro-rata share of the fees and expenses incurred by the underlying Fidelity Central Funds. These fees and expenses are not included in the Fund's annualized expense ratio used to calculate the expense estimate in the table below.
Please note that the expenses shown in the table are meant to highlight your ongoing costs only and do not reflect any transaction costs. Therefore, the second line of the table is useful in comparing ongoing costs only, and will not help you determine the relative total costs of owning different funds.
| | Annualized Expense Ratio-A | Beginning
Account Value
July 1, 2018 | Ending
Account Value
December 31, 2018 | Expenses Paid
During Period-B
July 1, 2018
to December 31, 2018 |
| Initial Class | .40% | | | |
| Actual | | $1,000.00 | $1,009.10 | $2.03 |
| Hypothetical-C | | $1,000.00 | $1,023.19 | $2.04 |
| Service Class | .50% | | | |
| Actual | | $1,000.00 | $1,009.30 | $2.53 |
| Hypothetical-C | | $1,000.00 | $1,022.68 | $2.55 |
| Service Class 2 | .65% | | | |
| Actual | | $1,000.00 | $1,008.20 | $3.29 |
| Hypothetical-C | | $1,000.00 | $1,021.93 | $3.31 |
| Investor Class | .43% | | | |
| Actual | | $1,000.00 | $1,008.90 | $2.18 |
| Hypothetical-C | | $1,000.00 | $1,023.04 | $2.19 |
A Annualized expense ratio reflects expenses net of applicable fee waivers.
B Expenses are equal to each Class' annualized expense ratio, multiplied by the average account value over the period, multiplied by 184/365 (to reflect the one-half year period). The fees and expenses of the underlying Fidelity Central Funds in which the Fund invests are not included in each Class' annualized expense ratio. In addition to the expenses noted above, the Fund also indirectly bears its proportional share of the expenses of the underlying Fidelity Central Funds. Annualized expenses of the underlying non-money market Fidelity Central Funds as of their most recent fiscal half year were less than .005%.
C 5% return per year before expenses
VIP Investment Grade Bond Portfolio
Distributions (Unaudited)
A total of 28.78% of the dividends distributed during the fiscal year was derived from interest on U.S. Government securities which is generally exempt from state income tax.
Board Approval of Investment Advisory Contracts and Management Fees
VIP Investment Grade Bond Portfolio
Each year, the Board of Trustees, including the Independent Trustees (together, the Board), votes on the renewal of the management contract with Fidelity Management & Research Company (FMR) and the sub-advisory agreements (together, the Advisory Contracts) for the fund. FMR and the sub-advisers are referred to herein as the Investment Advisers. The Board, assisted by the advice of fund counsel and Independent Trustees' counsel, requests and considers a broad range of information relevant to the renewal of the Advisory Contracts throughout the year.
The Board meets regularly and, at each of its meetings, covers an extensive agenda of topics and materials and considers factors that are relevant to its annual consideration of the renewal of the fund's Advisory Contracts, including the services and support provided to the fund and its shareholders. The Board has established four standing committees (Committees) — Operations, Audit, Fair Valuation, and Governance and Nominating — each composed of and chaired by Independent Trustees with varying backgrounds, to which the Board has assigned specific subject matter responsibilities in order to enhance effective decision-making by the Board. The Operations Committee, of which all of the Independent Trustees are members, meets regularly throughout the year and considers, among other matters, information specifically related to the annual consideration of the renewal of the fund's Advisory Contracts. The Board, acting directly and through its Committees, requests and receives information concerning the annual consideration of the renewal of the fund's Advisory Contracts. The Board also meets as needed to review matters specifically related to the Board's annual consideration of the renewal of the Advisory Contracts. Members of the Board may also meet with trustees of other Fidelity funds through joint ad hoc committees to discuss certain matters relevant to all of the Fidelity funds.
At its September 2018 meeting, the Board unanimously determined to renew the fund's Advisory Contracts. In reaching its determination, the Board considered all factors it believed relevant, including (i) the nature, extent, and quality of the services to be provided to the fund and its shareholders (including the investment performance of the fund); (ii) the competitiveness of the fund's management fee and total expense ratio relative to peer funds; (iii) the total costs of the services to be provided by and the profits to be realized by Fidelity from its relationships with the fund; and (iv) the extent to which, if any, economies of scale exist and would be realized as the fund grows, and whether any economies of scale are appropriately shared with fund shareholders.
In considering whether to renew the Advisory Contracts for the fund, the Board reached a determination, with the assistance of fund counsel and Independent Trustees' counsel and through the exercise of its business judgment, that the renewal of the Advisory Contracts was in the best interests of the fund and its shareholders and that the compensation payable under the Advisory Contracts was fair and reasonable. The Board's decision to renew the Advisory Contracts was not based on any single factor, but rather was based on a comprehensive consideration of all the information provided to the Board at its meetings throughout the year. The Board, in reaching its determination to renew the Advisory Contracts, was aware that shareholders of the fund have a broad range of investment choices available to them, including a wide choice among funds offered by Fidelity's competitors, and that the fund's shareholders, who have the opportunity to review and weigh the disclosure provided by the fund in its prospectus and other public disclosures, have chosen to invest in this fund, which is part of the Fidelity family of funds.
Nature, Extent, and Quality of Services Provided. The Board considered Fidelity's staffing as it relates to the fund, including the backgrounds of investment personnel of Fidelity, and also considered the fund's investment objective, strategies, and related investment philosophy. The Independent Trustees also had discussions with senior management of Fidelity's investment operations and investment groups. The Board considered the structure of the investment personnel compensation program and whether this structure provides appropriate incentives to act in the best interests of the fund. Additionally, the Board considered the portfolio managers' investments, if any, in the funds that they manage.
Resources Dedicated to Investment Management and Support Services. The Board reviewed the general qualifications and capabilities of Fidelity's investment staff, including its size, education, experience, and resources, as well as Fidelity's approach to recruiting, managing, and compensating investment personnel. The Board noted that Fidelity has continued to increase the resources devoted to non-U.S. offices, including expansion of Fidelity's global investment organization. The Board also noted that Fidelity's analysts have extensive resources, tools and capabilities that allow them to conduct sophisticated quantitative and fundamental analysis, as well as credit analysis of issuers, counterparties and guarantors. Further, the Board considered that Fidelity's investment professionals have sufficient access to global information and data so as to provide competitive investment results over time, and that those professionals also have access to sophisticated tools that permit them to assess portfolio construction and risk and performance attribution characteristics continuously, as well as to transmit new information and research conclusions rapidly around the world. Additionally, in its deliberations, the Board considered Fidelity's trading, risk management, compliance, and technology and operations capabilities and resources, which are integral parts of the investment management process.
Shareholder and Administrative Services. The Board considered (i) the nature, extent, quality, and cost of advisory, administrative, and shareholder services performed by the Investment Advisers and their affiliates under the Advisory Contracts and under separate agreements covering transfer agency, pricing and bookkeeping, and securities lending services for the fund; (ii) the nature and extent of the supervision of third party service providers, principally custodians, subcustodians, and pricing vendors; and (iii) the resources devoted to, and the record of compliance with, the fund's compliance policies and procedures.
The Board noted that the growth of fund assets over time across the complex allows Fidelity to reinvest in the development of services designed to enhance the value and convenience of the Fidelity funds as investment vehicles. These services include 24-hour access to account information and market information through telephone representatives and over the Internet, investor education materials and asset allocation tools, and the expanded availability of Fidelity Investor Centers.
Investment in a Large Fund Family. The Board considered the benefits to shareholders of investing in a Fidelity fund, including the benefits of investing in a fund that is part of a large family of funds offering a variety of investment disciplines and providing a large variety of mutual fund investor services. The Board noted that Fidelity had taken, or had made recommendations that resulted in the Fidelity funds taking, a number of actions over the previous year that benefited particular funds, including: (i) continuing to dedicate additional resources to Fidelity's investment research process, which includes meetings with management of issuers of securities in which the funds invest, and to the support of the senior management team that oversees asset management; (ii) continuing efforts to enhance Fidelity's global research capabilities; (iii) launching new funds and making other enhancements to meet client needs; (iv) launching new share classes of existing funds; (v) eliminating purchase minimums and broadening eligibility requirements for certain funds and share classes; (vi) reducing management fees and total expenses for certain growth equity funds and index funds; (vii) lowering expense caps for certain existing funds and classes, and converting certain voluntary expense caps to contractual caps, to reduce expenses borne by shareholders; (viii) eliminating short-term redemption fees for funds that had such fees; (ix) rationalizing product lines and gaining increased efficiencies from fund mergers and share class consolidations; (x) continuing to develop, acquire and implement systems and technology to improve services to the funds and shareholders, strengthen information security, and increase efficiency; and (xi) continuing to implement enhancements to further strengthen Fidelity's product line to increase investors' probability of success in achieving their investment goals, including retirement income goals.
Investment Performance. The Board considered whether the fund has operated in accordance with its investment objective, as well as its record of compliance with its investment restrictions and its performance history.
The Board took into account discussions that occur at Board meetings throughout the year with representatives of the Investment Advisers about fund investment performance. In this regard the Board noted that as part of regularly scheduled fund reviews and other reports to the Board on fund performance, the Board considers annualized return information for the fund for different time periods, measured against an appropriate securities market index ("benchmark index") and a peer group of funds with similar objectives ("peer group"), if any. In its evaluation of fund investment performance at meetings throughout the year, the Board gave particular attention to information indicating underperformance of certain Fidelity funds for specific time periods and discussed with the Investment Advisers the reasons for such underperformance.
In addition to reviewing absolute and relative fund performance, the Independent Trustees periodically consider the appropriateness of fund performance metrics in evaluating the results achieved. In general, the Independent Trustees believe that fund performance should be evaluated based on gross performance (before fees and expenses but after transaction costs) compared to appropriate benchmark indices, over appropriate time periods that may include full market cycles, and on net performance (after fees and expenses) compared to peer groups, as applicable, over the same periods, taking into account relevant factors including the following: general market conditions; expectations for interest rate levels and credit conditions; issuer-specific information including credit quality; the potential for incremental return versus the fund's benchmark index weighed against the risks involved in obtaining that incremental return, including the risk of diminished or negative total returns; and fund cash flows and other factors. Depending on the circumstances, the Independent Trustees may be satisfied with a fund's performance notwithstanding that it lags its benchmark index or peer group for certain periods.
The Independent Trustees recognize that shareholders evaluate performance on a net basis over their own holding periods, for which one-, three-, and five-year periods are often used as a proxy. For this reason, the performance information reviewed by the Board also included net cumulative calendar year total return information for the fund and an appropriate benchmark index and peer group for the most recent one-, three-, and five-year periods.
Based on its review, the Board concluded that the nature, extent, and quality of services provided to the fund under the Advisory Contracts should continue to benefit the shareholders of the fund.
Competitiveness of Management Fee and Total Expense Ratio. The Board considered the fund's management fee and total expense ratio compared to "mapped groups" of competitive funds and classes created for the purpose of facilitating the Trustees' competitive analysis of management fees and total expenses. Fidelity creates "mapped groups" by combining similar Lipper investment objective categories that have comparable investment mandates. Combining Lipper investment objective categories aids the Board's management fee and total expense ratio comparisons by broadening the competitive group used for comparison.
Management Fee. The Board considered two proprietary management fee comparisons for the 12-month periods shown in basis points (BP) in the chart below. The group of Lipper funds used by the Board for management fee comparisons is referred to below as the "Total Mapped Group" and, for the reasons explained above, is broader than the Lipper peer group used by the Board for performance comparisons. The Total Mapped Group comparison focuses on a fund's standing in terms of gross management fees before expense reimbursements or caps relative to the total universe of funds with comparable investment mandates, regardless of whether their management fee structures also are comparable. Funds with comparable investment mandates offer exposure to similar types of securities. Funds with comparable management fee structures have similar management fee contractual arrangements (
e.g., flat rate charged for advisory services, all-inclusive fee rate,
etc.). "TMG %" represents the percentage of funds in the Total Mapped Group that had management fees that were lower than the fund's. For example, a hypothetical TMG % of 20% would mean that 80% of the funds in the Total Mapped Group had higher, and 20% had lower, management fees than the fund. The fund's actual TMG %s and the number of funds in the Total Mapped Group are in the chart below. The "Asset-Size Peer Group" (ASPG) comparison focuses on a fund's standing relative to a subset of non-Fidelity funds within the Total Mapped Group that are similar in size and management fee structure. For example, if a fund is in the first quartile of the ASPG, the fund's management fee ranks in the least expensive or lowest 25% of funds in the ASPG. The ASPG represents at least 15% of the funds in the Total Mapped Group with comparable asset size and management fee structures, subject to a minimum of 50 funds (or all funds in the Total Mapped Group if fewer than 50). Additional information, such as the ASPG quartile in which the fund's management fee rate ranked, is also included in the chart and was considered by the Board.
VIP Investment Grade Bond Portfolio
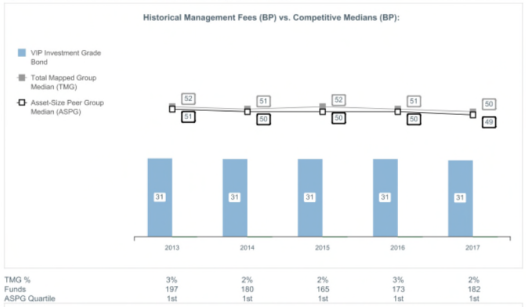
The Board noted that the fund's management fee rate ranked below the median of its Total Mapped Group and below the median of its ASPG for 2017.
The Board noted that it and the boards of other Fidelity funds formed an ad hoc Committee on Group Fee, which meets periodically, to conduct an in-depth review of the "group fee" component of the management fee of funds with such management fee structures. The Committee's focus included the mechanics of the group fee, the competitive landscape of group fee structures, Fidelity funds with no group fee component and investment products not included in group fee assets. The Board also considered that, for funds subject to the group fee, FMR agreed to voluntarily waive fees over a specified period of time in amounts designed to account for assets converted from certain funds to certain collective investment trusts.
Based on its review, the Board concluded that the fund's management fee is fair and reasonable in light of the services that the fund receives and the other factors considered.
Total Expense Ratio. In its review of each class's total expense ratio, the Board considered the fund's management fee rate as well as other fund or class expenses, as applicable, such as transfer agent fees, pricing and bookkeeping fees, fund-paid 12b-1 fees, and custodial, legal, and audit fees. The Board also noted that Fidelity may agree to waive fees and expenses from time to time, and the extent to which, if any, it has done so for the fund. As part of its review, the Board also considered the current and historical total expense ratios of each class of the fund compared to competitive fund median expenses. Each class of the fund is compared to those funds and classes in the Total Mapped Group (used by the Board for management fee comparisons) that have a similar sales load structure.
The Board noted that the total expense ratio of each class ranked below the competitive median for 2017.
Fees Charged to Other Fidelity Clients. The Board also considered Fidelity fee structures and other information with respect to clients of Fidelity, such as other funds advised or subadvised by Fidelity, pension plan clients, and other institutional clients with similar mandates. The Board noted that a joint ad hoc committee created by it and the boards of other Fidelity funds periodically reviews and compares Fidelity's institutional investment advisory business with its business of providing services to the Fidelity funds and also noted the most recent findings of the committee. The Board noted that the committee's review included a consideration of the differences in services provided, fees charged, and costs incurred, as well as competition in the markets serving the different categories of clients.
Based on its review of total expense ratios and fees charged to other Fidelity clients, the Board concluded that the total expense ratio of each class of the fund was reasonable in light of the services that the fund and its shareholders receive and the other factors considered.
Costs of the Services and Profitability. The Board considered the revenues earned and the expenses incurred by Fidelity in conducting the business of developing, marketing, distributing, managing, administering and servicing the fund and servicing the fund's shareholders. The Board also considered the level of Fidelity's profits in respect of all the Fidelity funds.
On an annual basis, Fidelity presents to the Board information about the profitability of its relationships with the fund. Fidelity calculates profitability information for each fund, as well as aggregate profitability information for groups of Fidelity funds and all Fidelity funds, using a series of detailed revenue and cost allocation methodologies which originate with the books and records of Fidelity on which Fidelity's audited financial statements are based. The Audit Committee of the Board reviews any significant changes from the prior year's methodologies.
PricewaterhouseCoopers LLP (PwC), auditor to Fidelity and certain Fidelity funds, has been engaged annually by the Board as part of the Board's assessment of Fidelity's profitability analysis. PwC's engagement includes the review and assessment of the methodologies used by Fidelity in determining the revenues and expenses attributable to Fidelity's mutual fund business, and completion of agreed-upon procedures in respect of the mathematical accuracy of the fund profitability information and its conformity to established allocation methodologies. After considering PwC's reports issued under the engagement and information provided by Fidelity, the Board concluded that while other allocation methods may also be reasonable, Fidelity's profitability methodologies are reasonable in all material respects.
The Board also reviewed Fidelity's non-fund businesses and potential indirect benefits such businesses may have received as a result of their association with Fidelity's mutual fund business (i.e., fall-out benefits) as well as cases where Fidelity's affiliates may benefit from the fund's business. The Board noted that changes to fall-out benefits year-over-year reflect business developments at Fidelity's various businesses.
The Board considered the costs of the services provided by and the profits realized by Fidelity in connection with the operation of the fund and was satisfied that the profitability was not excessive.
Economies of Scale. The Board considered whether there have been economies of scale in respect of the management of the Fidelity funds, whether the Fidelity funds (including the fund) have appropriately benefited from any such economies of scale, and whether there is potential for realization of any further economies of scale. The Board considered the extent to which the fund will benefit from economies of scale as assets grow through increased services to the fund, through waivers or reimbursements, or through fee or expense ratio reductions. The Board also noted that a committee (the Economies of Scale Committee) created by it and the boards of other Fidelity funds periodically analyzes whether Fidelity attains economies of scale in respect of the management and servicing of the Fidelity funds, whether the Fidelity funds have appropriately benefited from such economies of scale, and whether there is potential for realization of any further economies of scale.
The Board recognized that the fund's management contract incorporates a "group fee" structure, which provides for lower group fee rates as total group assets increase, and for higher group fee rates as total group assets decrease (with "group assets" defined to include fund assets under FMR's management plus the assets of sector funds previously under FMR's management). FMR calculates the group fee rates based on a tiered asset "breakpoint" schedule that varies based on asset class. The Board considered that the group fee is designed to deliver the benefits of economies of scale to fund shareholders when total Fidelity fund assets increase, even if assets of any particular fund are unchanged or have declined, because some portion of Fidelity's costs are attributable to services provided to all Fidelity funds, and all funds benefit if those costs can be allocated among more assets. The Board concluded that, given the group fee structure, fund shareholders will benefit from lower management fees as group assets increase at the fund complex level, regardless of whether Fidelity achieves any such economies of scale.
The Board concluded, taking into account the analysis of the Economies of Scale Committee, that economies of scale, if any, are being appropriately shared between fund shareholders and Fidelity.
Additional Information Requested by the Board. In order to develop fully the factual basis for consideration of the Fidelity funds' advisory contracts, the Board requested and received additional information on certain topics, including: (i) Fidelity's fund profitability methodology, profitability trends for certain funds, the allocation of various costs to different funds, and the impact of certain factors on fund profitability results; (ii) portfolio manager changes that have occurred during the past year and the amount of the investment that each portfolio manager has made in the Fidelity fund(s) that he or she manages; (iii) Fidelity's compensation structure for portfolio managers, research analysts, and other key personnel, including its effects on fund profitability, the rationale for the compensation structure, and the extent to which current market conditions have affected retention and recruitment; (iv) the arrangements with and compensation paid to certain fund sub-advisers on behalf of the Fidelity funds and the treatment of such compensation within Fidelity's fund profitability methodology; (v) the terms of Fidelity's voluntary expense limitation agreements; (vi) the methodology with respect to competitive fund data and peer group classifications; (vii) Fidelity's transfer agent fee, expense, and service structures for different funds and classes relative to competitive trends, and the impact of the increased use of omnibus accounts; (viii) new developments in the retail and institutional marketplaces and the competitive positioning of the funds relative to other investment products and services; (ix) the impact of recent changes to the money market fund landscape, including the full implementation of money market fund reform and rising interest rates, on Fidelity's money market funds; (x) the funds' share class structures and distribution channels; and (xi) explanations regarding the relative total expense ratios of certain funds and classes, total expense competitive trends and methodologies for total expense competitive comparisons, and actions that might be taken by Fidelity to reduce total expense ratios for certain classes. In addition, the Board considered its discussions with Fidelity throughout the year regarding enhanced information security initiatives and the funds' fair valuation policies.
Based on its evaluation of all of the conclusions noted above, and after considering all factors it believed relevant, the Board concluded that the advisory fee arrangements are fair and reasonable, and that the fund's Advisory Contracts should be renewed.
The following are the financial statements for the Fidelity® VIP Investment Grade Central Fund as of December 31, 2018 which is a direct investment of VIP Investment Grade Bond Portfolio.
Fidelity® VIP Investment Grade Central Fund
Performance: The Bottom Line
Average annual total return reflects the change in the value of an investment, assuming reinvestment of distributions from dividend income and capital gains (the profits earned upon the sale of securities that have grown in value, if any) and assuming a constant rate of performance each year. The hypothetical investment and the average annual total returns do not reflect the deduction of taxes that a shareholder would pay on fund distributions or the redemption of fund shares. During periods of reimbursement by Fidelity, a fund’s total return will be greater than it would be had the reimbursement not occurred. How a fund did yesterday is no guarantee of how it will do tomorrow.
Average Annual Total Returns
| For the periods ended December 31, 2018 | Past 1 year | Past 5 years | Past 10 years |
| Fidelity VIP Investment Grade Central Fund | (0.01)% | 3.11% | 5.11% |
$10,000 Over 10 Years
Let's say hypothetically that $10,000 was invested in Fidelity® VIP Investment Grade Central Fund on December 31, 2008.
The chart shows how the value of your investment would have changed, and also shows how the Bloomberg Barclays U.S. Aggregate Bond Index performed over the same period.

| Period Ending Values |
| $16,467 | Fidelity VIP Investment Grade Central Fund |
| $14,075 | Bloomberg Barclays U.S. Aggregate Bond Index |
Fidelity® VIP Investment Grade Central Fund
Management's Discussion of Fund Performance
Market Recap: U.S. taxable investment-grade bonds roughly broke even in 2018, as the upward trend in yields early in the year reversed notably in the fourth quarter. The Bloomberg Barclays U.S. Aggregate Bond Index gained 0.01% for the year. Longer-term bond yields rose through mid-May, driven by policy-rate hikes, plans by the U.S. Federal Reserve to gradually reduce its balance sheet and tax reform that went into effect in January. Longer-term yields moderated in the summer, with spreads between shorter-term and longer-term Treasury bonds remaining tight, partly because of escalating global trade tension. Yields rose again in September and early October, amid increased inflation expectations and hints that central banks may curtail economic stimulus. Yields then declined notably and credit spreads widened in November and December due to broad market volatility, disappointing U.S. economic data, and signs of economic weakness in China and parts of Europe. Within the Bloomberg Barclays index, U.S. Treasuries (+0.86%) topped all major market segments. Conversely, investment-grade corporates (-2.51%) performed worst. Outside the index, most non-core fixed-income segments posted a negative return, while Treasury Inflation-Protected Securities (TIPS) returned -1.26%, as inflation expectations moderated near year-end.
Comments from Co-Portfolio Managers Celso Munoz and Ford O’Neil: For the annual reporting period ending December 31, 2018, the fund returned -0.01%, nearly equal to the 0.01% gain of the Bloomberg Barclays U.S. Aggregate Bond Index. The fund’s exposure to Treasury Inflation-Protected Securities hampered the fund’s relative return, as these bonds faltered toward year-end when inflation expectations slid amid falling energy prices and concerns over the economic outlook. Elsewhere, owning specific government-related names tied to energy, particularly Petroleos Mexicanos (PEMEX), disappointed. In contrast, duration (interest rate) positioning helped relative performance, particularly because it was shorter than that of the benchmark throughout much of the period and, thus, held in better as interest rates rose. Positioning among investment-grade corporates also bolstered relative performance; slightly overweighting this sector contributed for the full year. Within investment-grade corporates, underweighting the corporate bonds of industrial companies particularly added value, although relative performance in this group was offset by disappointing choices among certain consumer non-cyclical (British American Tobacco and InBev) and financial names (Deutsche Bank and Royal Bank of Scotland).
The views expressed above reflect those of the portfolio manager(s) only through the end of the period as stated on the cover of this report and do not necessarily represent the views of Fidelity or any other person in the Fidelity organization. Any such views are subject to change at any time based upon market or other conditions and Fidelity disclaims any responsibility to update such views. These views may not be relied on as investment advice and, because investment decisions for a Fidelity fund are based on numerous factors, may not be relied on as an indication of trading intent on behalf of any Fidelity fund.
Fidelity® VIP Investment Grade Central Fund
Investment Summary (Unaudited)
Quality Diversification (% of fund's net assets)
| As of December 31, 2018 |
| | U.S. Government and U.S. Government Agency Obligations | 66.7% |
| | AAA | 0.9% |
| | AA | 0.8% |
| | A | 7.0% |
| | BBB | 23.4% |
| | BB and Below | 4.6% |
| | Not Rated | 0.6% |
| | Short-Term Investments and Net Other Assets* | (4.0)% |

* Short-Term Investments and Net Other Assets (Liabilities) are not included in the pie chart
We have used ratings from Moody's Investors Service, Inc. Where Moody's® ratings are not available, we have used S&P® ratings. All ratings are as of the date indicated and do not reflect subsequent changes. Securities rated BB or below were rated investment grade at the time of acquisition.
Asset Allocation (% of fund's net assets)
| As of December 31, 2018 *,** |
| | Corporate Bonds | 32.0% |
| | U.S. Government and U.S. Government Agency Obligations | 66.7% |
| | Asset-Backed Securities | 1.0% |
| | CMOs and Other Mortgage Related Securities | 1.7% |
| | Municipal Bonds | 1.7% |
| | Other Investments | 0.9% |
| | Short-Term Investments and Net Other Assets (Liabilities)*** | (4.0)% |
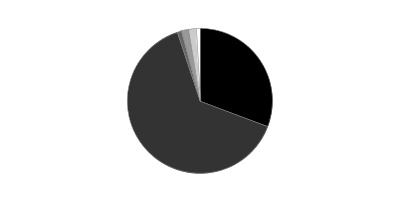
* Foreign investments - 7.2%
** Futures and Swaps - 0.0%
*** Short-Term Investments and Net Other Assets (Liabilities) are not included in the pie chart
Percentages in the above tables are adjusted for the effect of TBA Sale Commitments.
Percentages shown as 0.0% may reflect amounts less than 0.05%.
Fidelity® VIP Investment Grade Central Fund
Schedule of Investments December 31, 2018
Showing Percentage of Net Assets
| Nonconvertible Bonds - 32.0% | | | |
| | | Principal Amount | Value |
| COMMUNICATION SERVICES - 2.7% | | | |
| Diversified Telecommunication Services - 0.8% | | | |
| AT&T, Inc.: | | | |
| 2.45% 6/30/20 | | $3,187,000 | $3,145,030 |
| 3.6% 2/17/23 | | 6,270,000 | 6,237,736 |
| 4.45% 4/1/24 | | 480,000 | 487,932 |
| 4.5% 3/9/48 | | 10,800,000 | 9,311,511 |
| Verizon Communications, Inc.: | | | |
| 3.85% 11/1/42 | | 1,190,000 | 1,030,575 |
| 4.522% 9/15/48 | | 1,821,000 | 1,708,358 |
| 4.862% 8/21/46 | | 3,398,000 | 3,343,892 |
| 5.012% 4/15/49 | | 2,962,000 | 2,955,388 |
| 5.012% 8/21/54 | | 9,569,000 | 9,259,617 |
| 5.5% 3/16/47 | | 7,027,000 | 7,482,335 |
| | | | 44,962,374 |
| Entertainment - 0.3% | | | |
| AOL Time Warner, Inc. 2.95% 7/15/26 | | 12,000,000 | 10,733,957 |
| NBCUniversal, Inc.: | | | |
| 4.45% 1/15/43 | | 2,012,000 | 1,941,914 |
| 5.95% 4/1/41 | | 1,407,000 | 1,616,757 |
| | | | 14,292,628 |
| Media - 1.6% | | | |
| 21st Century Fox America, Inc. 7.75% 12/1/45 | | 3,169,000 | 4,658,415 |
| Charter Communications Operating LLC/Charter Communications Operating Capital Corp.: | | | |
| 4.464% 7/23/22 | | 5,742,000 | 5,796,884 |
| 4.908% 7/23/25 | | 3,860,000 | 3,836,479 |
| 5.375% 5/1/47 | | 10,672,000 | 9,682,435 |
| 6.484% 10/23/45 | | 1,700,000 | 1,754,559 |
| Comcast Corp.: | | | |
| 3.9% 3/1/38 | | 1,072,000 | 993,510 |
| 3.969% 11/1/47 | | 3,461,000 | 3,098,105 |
| 3.999% 11/1/49 | | 3,964,000 | 3,557,283 |
| 4% 3/1/48 | | 1,966,000 | 1,794,091 |
| 4.6% 8/15/45 | | 2,841,000 | 2,771,808 |
| 4.65% 7/15/42 | | 2,539,000 | 2,515,532 |
| Time Warner Cable, Inc.: | | | |
| 4% 9/1/21 | | 7,363,000 | 7,317,948 |
| 4.5% 9/15/42 | | 556,000 | 447,497 |
| 5.5% 9/1/41 | | 1,700,000 | 1,504,199 |
| 5.875% 11/15/40 | | 1,500,000 | 1,415,363 |
| 6.55% 5/1/37 | | 18,635,000 | 19,142,093 |
| 7.3% 7/1/38 | | 3,781,000 | 4,102,692 |
| 8.25% 4/1/19 | | 7,716,000 | 7,802,607 |
| | | | 82,191,500 |
|
| TOTAL COMMUNICATION SERVICES | | | 141,446,502 |
|
| CONSUMER DISCRETIONARY - 0.8% | | | |
| Automobiles - 0.7% | | | |
| General Motors Financial Co., Inc.: | | | |
| 3.2% 7/13/20 | | 10,000,000 | 9,874,271 |
| 3.5% 7/10/19 | | 4,187,000 | 4,186,346 |
| 4.2% 3/1/21 | | 5,411,000 | 5,407,458 |
| 4.25% 5/15/23 | | 2,080,000 | 2,031,241 |
| 4.375% 9/25/21 | | 15,702,000 | 15,765,588 |
| | | | 37,264,904 |
| Diversified Consumer Services - 0.1% | | | |
| Ingersoll-Rand Global Holding Co. Ltd. 4.25% 6/15/23 | | 2,932,000 | 3,004,315 |
|
| TOTAL CONSUMER DISCRETIONARY | | | 40,269,219 |
|
| CONSUMER STAPLES - 2.0% | | | |
| Beverages - 1.0% | | | |
| Anheuser-Busch InBev Finance, Inc.: | | | |
| 2.65% 2/1/21 | | 4,821,000 | 4,738,588 |
| 3.3% 2/1/23 | | 10,630,000 | 10,350,037 |
| 4.7% 2/1/36 | | 10,065,000 | 9,372,452 |
| 4.9% 2/1/46 | | 11,511,000 | 10,688,771 |
| Anheuser-Busch InBev Worldwide, Inc. 4.75% 4/15/58 | | 5,750,000 | 5,012,821 |
| Molson Coors Brewing Co.: | | | |
| 3% 7/15/26 | | 3,500,000 | 3,118,682 |
| 5% 5/1/42 | | 13,093,000 | 12,338,715 |
| | | | 55,620,066 |
| Food & Staples Retailing - 0.1% | | | |
| Walgreens Boots Alliance, Inc.: | | | |
| 2.7% 11/18/19 | | 2,460,000 | 2,445,995 |
| 3.3% 11/18/21 | | 2,918,000 | 2,904,449 |
| | | | 5,350,444 |
| Tobacco - 0.9% | | | |
| Altria Group, Inc.: | | | |
| 3.875% 9/16/46 | | 484,000 | 369,166 |
| 4% 1/31/24 | | 2,227,000 | 2,188,426 |
| 4.25% 8/9/42 | | 1,237,000 | 998,925 |
| Imperial Tobacco Finance PLC: | | | |
| 3.75% 7/21/22 (a) | | 4,804,000 | 4,765,081 |
| 4.25% 7/21/25 (a) | | 15,488,000 | 15,240,477 |
| Reynolds American, Inc.: | | | |
| 3.25% 6/12/20 | | 939,000 | 933,092 |
| 4% 6/12/22 | | 3,228,000 | 3,193,053 |
| 4.45% 6/12/25 | | 2,341,000 | 2,258,248 |
| 5.7% 8/15/35 | | 1,215,000 | 1,187,472 |
| 5.85% 8/15/45 | | 9,320,000 | 8,668,470 |
| 6.15% 9/15/43 | | 4,000,000 | 3,902,733 |
| 7.25% 6/15/37 | | 2,962,000 | 3,235,818 |
| | | | 46,940,961 |
|
| TOTAL CONSUMER STAPLES | | | 107,911,471 |
|
| ENERGY - 5.4% | | | |
| Energy Equipment & Services - 0.2% | | | |
| El Paso Pipeline Partners Operating Co. LLC 5% 10/1/21 | | 1,517,000 | 1,559,719 |
| Halliburton Co.: | | | |
| 3.8% 11/15/25 | | 2,467,000 | 2,392,501 |
| 4.85% 11/15/35 | | 2,154,000 | 2,117,083 |
| Noble Holding International Ltd.: | | | |
| 7.95% 4/1/25 (b) | | 2,180,000 | 1,637,725 |
| 8.95% 4/1/45 (b) | | 2,104,000 | 1,599,040 |
| | | | 9,306,068 |
| Oil, Gas & Consumable Fuels - 5.2% | | | |
| Amerada Hess Corp. 7.875% 10/1/29 | | 2,544,000 | 2,847,004 |
| Anadarko Finance Co. 7.5% 5/1/31 | | 6,883,000 | 8,144,811 |
| Anadarko Petroleum Corp.: | | | |
| 4.85% 3/15/21 | | 1,620,000 | 1,658,630 |
| 5.55% 3/15/26 | | 3,337,000 | 3,496,544 |
| 6.2% 3/15/40 | | 1,700,000 | 1,761,027 |
| 6.45% 9/15/36 | | 2,922,000 | 3,158,758 |
| 6.6% 3/15/46 | | 5,708,000 | 6,309,988 |
| Canadian Natural Resources Ltd.: | | | |
| 3.8% 4/15/24 | | 6,783,000 | 6,688,399 |
| 5.85% 2/1/35 | | 2,497,000 | 2,656,719 |
| Cenovus Energy, Inc.: | | | |
| 4.25% 4/15/27 | | 5,557,000 | 5,064,137 |
| 6.75% 11/15/39 | | 2,500,000 | 2,442,154 |
| Columbia Pipeline Group, Inc.: | | | |
| 3.3% 6/1/20 | | 4,379,000 | 4,363,291 |
| 4.5% 6/1/25 | | 1,336,000 | 1,346,183 |
| DCP Midstream LLC: | | | |
| 4.75% 9/30/21 (a) | | 3,739,000 | 3,692,263 |
| 5.35% 3/15/20 (a) | | 3,724,000 | 3,737,965 |
| DCP Midstream Operating LP: | | | |
| 3.875% 3/15/23 | | 1,771,000 | 1,660,313 |
| 5.6% 4/1/44 | | 1,227,000 | 1,061,355 |
| Duke Energy Field Services 6.45% 11/3/36 (a) | | 2,477,000 | 2,402,690 |
| Empresa Nacional de Petroleo 4.375% 10/30/24 (a) | | 3,540,000 | 3,480,441 |
| Enable Midstream Partners LP: | | | |
| 2.4% 5/15/19 (b) | | 1,253,000 | 1,245,902 |
| 3.9% 5/15/24 (b) | | 1,322,000 | 1,268,019 |
| Enbridge Energy Partners LP: | | | |
| 4.2% 9/15/21 | | 4,399,000 | 4,458,542 |
| 4.375% 10/15/20 | | 3,093,000 | 3,128,569 |
| Enbridge, Inc.: | | | |
| 4.25% 12/1/26 | | 1,773,000 | 1,754,096 |
| 5.5% 12/1/46 | | 2,046,000 | 2,197,740 |
| Energy Transfer Partners LP: | | | |
| 4.2% 9/15/23 | | 1,186,000 | 1,168,776 |
| 4.95% 6/15/28 | | 4,048,000 | 3,968,577 |
| 5.8% 6/15/38 | | 2,257,000 | 2,199,114 |
| 6% 6/15/48 | | 1,470,000 | 1,433,222 |
| EnLink Midstream Partners LP 2.7% 4/1/19 | | 6,288,000 | 6,248,682 |
| Enterprise Products Operating LP: | | | |
| 2.55% 10/15/19 | | 863,000 | 858,436 |
| 3.7% 2/15/26 | | 4,800,000 | 4,731,700 |
| 3.75% 2/15/25 | | 2,900,000 | 2,870,641 |
| Kinder Morgan Energy Partners LP 6.55% 9/15/40 | | 460,000 | 496,970 |
| Marathon Petroleum Corp. 5.125% 3/1/21 | | 2,187,000 | 2,250,420 |
| MPLX LP: | | | |
| 4.5% 7/15/23 | | 1,975,000 | 1,994,657 |
| 4.8% 2/15/29 | | 1,126,000 | 1,123,924 |
| 4.875% 12/1/24 | | 2,736,000 | 2,784,853 |
| 5.5% 2/15/49 | | 3,377,000 | 3,289,051 |
| Nakilat, Inc. 6.067% 12/31/33 (a) | | 1,808,000 | 1,963,090 |
| Petrobras Global Finance BV: | | | |
| 4.375% 5/20/23 | | 7,020,000 | 6,696,167 |
| 7.25% 3/17/44 | | 24,245,000 | 23,893,690 |
| Petroleos Mexicanos: | | | |
| 3.5% 1/30/23 | | 3,410,000 | 3,086,050 |
| 4.5% 1/23/26 | | 6,809,000 | 5,869,358 |
| 4.625% 9/21/23 | | 7,350,000 | 6,897,975 |
| 4.875% 1/24/22 | | 3,398,000 | 3,307,953 |
| 4.875% 1/18/24 | | 4,539,000 | 4,230,348 |
| 5.375% 3/13/22 | | 2,700,000 | 2,644,650 |
| 5.5% 1/21/21 | | 3,601,000 | 3,586,488 |
| 5.5% 6/27/44 | | 2,492,000 | 1,889,385 |
| 5.625% 1/23/46 | | 8,402,000 | 6,359,390 |
| 6% 3/5/20 | | 1,034,000 | 1,052,871 |
| 6.35% 2/12/48 | | 4,430,000 | 3,528,584 |
| 6.375% 1/23/45 | | 4,048,000 | 3,258,640 |
| 6.5% 3/13/27 | | 4,830,000 | 4,540,200 |
| 6.5% 1/23/29 | | 5,560,000 | 5,184,700 |
| 6.5% 6/2/41 | | 7,675,000 | 6,354,900 |
| 6.75% 9/21/47 | | 12,105,000 | 10,009,503 |
| 8% 5/3/19 | | 2,142,000 | 2,165,562 |
| Phillips 66 Co. 4.3% 4/1/22 | | 3,770,000 | 3,870,218 |
| Phillips 66 Partners LP 2.646% 2/15/20 | | 375,000 | 371,724 |
| Plains All American Pipeline LP/PAA Finance Corp. 3.65% 6/1/22 | | 2,155,000 | 2,115,528 |
| Southwestern Energy Co. 6.2% 1/23/25 (b) | | 2,509,000 | 2,242,419 |
| The Williams Companies, Inc.: | | | |
| 3.7% 1/15/23 | | 1,208,000 | 1,178,416 |
| 4.55% 6/24/24 | | 13,337,000 | 13,466,502 |
| Western Gas Partners LP: | | | |
| 4.5% 3/1/28 | | 2,000,000 | 1,870,524 |
| 4.65% 7/1/26 | | 8,532,000 | 8,255,006 |
| 4.75% 8/15/28 | | 1,155,000 | 1,100,113 |
| 5.375% 6/1/21 | | 6,322,000 | 6,511,288 |
| Williams Partners LP: | | | |
| 3.6% 3/15/22 | | 3,522,000 | 3,457,838 |
| 3.9% 1/15/25 | | 1,216,000 | 1,181,912 |
| 4% 11/15/21 | | 1,605,000 | 1,611,176 |
| 4.3% 3/4/24 | | 5,449,000 | 5,429,631 |
| 4.5% 11/15/23 | | 1,751,000 | 1,760,114 |
| | | | 276,386,476 |
|
| TOTAL ENERGY | | | 285,692,544 |
|
| FINANCIALS - 12.9% | | | |
| Banks - 6.4% | | | |
| Bank of America Corp.: | | | |
| 3.004% 12/20/23 (b) | | 23,800,000 | 23,106,384 |
| 3.3% 1/11/23 | | 4,342,000 | 4,276,018 |
| 3.419% 12/20/28 (b) | | 18,965,000 | 17,716,145 |
| 3.5% 4/19/26 | | 5,024,000 | 4,838,766 |
| 3.864% 7/23/24 (b) | | 4,370,000 | 4,359,319 |
| 3.95% 4/21/25 | | 4,125,000 | 3,998,579 |
| 4.2% 8/26/24 | | 6,867,000 | 6,810,182 |
| 4.25% 10/22/26 | | 4,261,000 | 4,146,368 |
| 4.45% 3/3/26 | | 1,517,000 | 1,500,950 |
| Barclays PLC: | | | |
| 2.75% 11/8/19 | | 3,581,000 | 3,554,945 |
| 3.25% 1/12/21 | | 4,610,000 | 4,514,564 |
| 4.375% 1/12/26 | | 6,221,000 | 5,909,527 |
| 5.2% 5/12/26 | | 6,222,000 | 5,964,297 |
| Citigroup, Inc.: | | | |
| 2.7% 10/27/22 | | 9,998,000 | 9,637,069 |
| 3.875% 3/26/25 | | 9,500,000 | 9,187,828 |
| 4.05% 7/30/22 | | 1,800,000 | 1,808,093 |
| 4.3% 11/20/26 | | 1,733,000 | 1,667,348 |
| 4.45% 9/29/27 | | 10,000,000 | 9,642,433 |
| 5.5% 9/13/25 | | 5,524,000 | 5,799,359 |
| Citizens Bank NA 2.55% 5/13/21 | | 1,560,000 | 1,525,746 |
| Citizens Financial Group, Inc. 4.15% 9/28/22 (a) | | 4,857,000 | 4,881,734 |
| Credit Suisse Group Funding Guernsey Ltd.: | | | |
| 2.75% 3/26/20 | | 4,667,000 | 4,616,046 |
| 3.75% 3/26/25 | | 4,660,000 | 4,458,020 |
| 3.8% 9/15/22 | | 7,240,000 | 7,186,813 |
| 3.8% 6/9/23 | | 8,582,000 | 8,420,894 |
| 4.55% 4/17/26 | | 2,575,000 | 2,550,695 |
| Discover Bank: | | | |
| 4.2% 8/8/23 | | 2,849,000 | 2,849,478 |
| 7% 4/15/20 | | 2,309,000 | 2,403,557 |
| Fifth Third Bancorp: | | | |
| 2.875% 7/27/20 | | 3,000,000 | 2,981,422 |
| 8.25% 3/1/38 | | 4,319,000 | 5,738,031 |
| HSBC Holdings PLC 4.25% 3/14/24 | | 2,200,000 | 2,183,152 |
| Huntington Bancshares, Inc. 7% 12/15/20 | | 1,004,000 | 1,071,716 |
| Intesa Sanpaolo SpA: | | | |
| 5.017% 6/26/24 (a) | | 4,337,000 | 3,933,152 |
| 5.71% 1/15/26 (a) | | 9,864,000 | 9,046,088 |
| JPMorgan Chase & Co.: | | | |
| 2.95% 10/1/26 | | 8,028,000 | 7,418,033 |
| 3.797% 7/23/24 (b) | | 5,719,000 | 5,728,967 |
| 3.875% 9/10/24 | | 43,751,000 | 43,131,576 |
| 4.125% 12/15/26 | | 14,080,000 | 13,795,322 |
| Rabobank Nederland 4.375% 8/4/25 | | 7,451,000 | 7,321,312 |
| Regions Bank 6.45% 6/26/37 | | 7,720,000 | 9,044,157 |
| Regions Financial Corp. 3.2% 2/8/21 | | 2,833,000 | 2,814,785 |
| Royal Bank of Scotland Group PLC: | | | |
| 5.125% 5/28/24 | | 20,522,000 | 19,896,047 |
| 6% 12/19/23 | | 10,433,000 | 10,558,597 |
| 6.1% 6/10/23 | | 11,522,000 | 11,703,285 |
| 6.125% 12/15/22 | | 8,239,000 | 8,349,458 |
| Synchrony Bank 3% 6/15/22 | | 4,542,000 | 4,243,970 |
| | | | 336,290,227 |
| Capital Markets - 4.1% | | | |
| Affiliated Managers Group, Inc.: | | | |
| 3.5% 8/1/25 | | 5,541,000 | 5,386,909 |
| 4.25% 2/15/24 | | 4,287,000 | 4,373,420 |
| Credit Suisse Group AG 3.869% 1/12/29 (a)(b) | | 4,020,000 | 3,742,034 |
| Deutsche Bank AG 4.5% 4/1/25 | | 10,381,000 | 9,111,723 |
| Deutsche Bank AG New York Branch: | | | |
| 3.15% 1/22/21 | | 6,514,000 | 6,295,336 |
| 3.3% 11/16/22 | | 9,310,000 | 8,627,583 |
| Goldman Sachs Group, Inc.: | | | |
| 2.876% 10/31/22 (b) | | 22,903,000 | 22,242,595 |
| 3.2% 2/23/23 | | 7,150,000 | 6,934,844 |
| 3.691% 6/5/28 (b) | | 41,645,000 | 38,725,140 |
| 4.25% 10/21/25 | | 2,269,000 | 2,173,837 |
| 6.75% 10/1/37 | | 2,246,000 | 2,538,859 |
| IntercontinentalExchange, Inc. 2.75% 12/1/20 | | 1,628,000 | 1,617,483 |
| Lazard Group LLC 4.25% 11/14/20 | | 1,269,000 | 1,285,632 |
| Moody's Corp.: | | | |
| 3.25% 1/15/28 | | 2,386,000 | 2,259,353 |
| 4.875% 2/15/24 | | 2,240,000 | 2,356,814 |
| Morgan Stanley: | | | |
| 3.125% 1/23/23 | | 26,000,000 | 25,380,453 |
| 3.125% 7/27/26 | | 21,964,000 | 20,272,418 |
| 3.625% 1/20/27 | | 11,000,000 | 10,460,000 |
| 3.7% 10/23/24 | | 3,281,000 | 3,226,253 |
| 3.737% 4/24/24 (b) | | 5,000,000 | 4,961,806 |
| 4.35% 9/8/26 | | 4,310,000 | 4,190,588 |
| 4.875% 11/1/22 | | 7,751,000 | 7,986,931 |
| 5% 11/24/25 | | 4,708,000 | 4,802,769 |
| 5.75% 1/25/21 | | 3,512,000 | 3,666,326 |
| Peachtree Corners Funding Trust 3.976% 2/15/25 (a) | | 5,000,000 | 4,852,115 |
| UBS AG Stamford Branch 2.35% 3/26/20 | | 1,450,000 | 1,435,429 |
| UBS Group Funding Ltd. 4.125% 9/24/25 (a) | | 5,261,000 | 5,227,349 |
| | | | 214,133,999 |
| Consumer Finance - 0.6% | | | |
| AerCap Ireland Capital Ltd./AerCap Global Aviation Trust: | | | |
| 3.5% 5/26/22 | | 1,724,000 | 1,671,439 |
| 4.125% 7/3/23 | | 4,192,000 | 4,075,783 |
| Capital One Financial Corp. 3.8% 1/31/28 | | 4,476,000 | 4,138,988 |
| Discover Financial Services: | | | |
| 3.85% 11/21/22 | | 5,040,000 | 5,004,793 |
| 3.95% 11/6/24 | | 2,847,000 | 2,808,909 |
| 4.1% 2/9/27 | | 3,673,000 | 3,430,811 |
| Synchrony Financial: | | | |
| 3% 8/15/19 | | 1,459,000 | 1,449,390 |
| 3.75% 8/15/21 | | 2,203,000 | 2,143,864 |
| 3.95% 12/1/27 | | 7,201,000 | 6,068,679 |
| 4.25% 8/15/24 | | 2,218,000 | 2,036,950 |
| | | | 32,829,606 |
| Diversified Financial Services - 0.6% | | | |
| AXA Equitable Holdings, Inc. 3.9% 4/20/23 (a) | | 1,041,000 | 1,028,040 |
| Brixmor Operating Partnership LP: | | | |
| 3.25% 9/15/23 | | 5,952,000 | 5,748,261 |
| 3.875% 8/15/22 | | 5,542,000 | 5,525,477 |
| 4.125% 6/15/26 | | 2,032,000 | 1,968,618 |
| Cigna Corp.: | | | |
| 4.125% 11/15/25 (a) | | 2,350,000 | 2,347,780 |
| 4.375% 10/15/28 (a) | | 6,064,000 | 6,101,537 |
| 4.8% 8/15/38 (a) | | 3,776,000 | 3,744,273 |
| 4.9% 12/15/48 (a) | | 3,772,000 | 3,695,574 |
| Voya Financial, Inc. 3.125% 7/15/24 | | 2,851,000 | 2,688,144 |
| | | | 32,847,704 |
| Insurance - 1.2% | | | |
| AIA Group Ltd. 2.25% 3/11/19 (a) | | 913,000 | 911,312 |
| American International Group, Inc.: | | | |
| 3.3% 3/1/21 | | 2,355,000 | 2,346,932 |
| 3.75% 7/10/25 | | 8,311,000 | 7,961,193 |
| 4.875% 6/1/22 | | 3,597,000 | 3,731,799 |
| Aon Corp. 5% 9/30/20 | | 1,402,000 | 1,442,638 |
| Liberty Mutual Group, Inc. 5% 6/1/21 (a) | | 4,093,000 | 4,203,331 |
| Marsh & McLennan Companies, Inc. 4.8% 7/15/21 | | 2,278,000 | 2,347,561 |
| Massachusetts Mutual Life Insurance Co. 4.5% 4/15/65 (a) | | 5,285,000 | 4,934,641 |
| MetLife, Inc. 4.75% 2/8/21 | | 481,000 | 496,218 |
| Metropolitan Life Global Funding I 3% 1/10/23 (a) | | 2,636,000 | 2,594,917 |
| Pacific LifeCorp 5.125% 1/30/43 (a) | | 5,252,000 | 5,368,835 |
| Prudential Financial, Inc. 7.375% 6/15/19 | | 1,250,000 | 1,272,674 |
| Teachers Insurance & Annuity Association of America 4.9% 9/15/44 (a) | | 5,347,000 | 5,551,656 |
| TIAA Asset Management Finance LLC 4.125% 11/1/24 (a) | | 1,771,000 | 1,803,791 |
| Unum Group: | | | |
| 3.875% 11/5/25 | | 4,860,000 | 4,742,915 |
| 4% 3/15/24 | | 5,930,000 | 5,885,489 |
| 5.625% 9/15/20 | | 2,889,000 | 2,988,715 |
| 5.75% 8/15/42 | | 7,278,000 | 7,261,811 |
| | | | 65,846,428 |
|
| TOTAL FINANCIALS | | | 681,947,964 |
|
| HEALTH CARE - 2.4% | | | |
| Health Care Equipment & Supplies - 0.1% | | | |
| Becton, Dickinson & Co.: | | | |
| 2.675% 12/15/19 | | 1,156,000 | 1,145,025 |
| 3.7% 6/6/27 | | 3,370,000 | 3,185,922 |
| | | | 4,330,947 |
| Health Care Providers & Services - 1.6% | | | |
| Cigna Corp. 3.75% 7/15/23 (a) | | 4,859,000 | 4,842,519 |
| CVS Health Corp.: | | | |
| 3.7% 3/9/23 | | 2,500,000 | 2,473,095 |
| 4.1% 3/25/25 | | 11,542,000 | 11,440,705 |
| 4.3% 3/25/28 | | 13,403,000 | 13,124,051 |
| 4.78% 3/25/38 | | 5,967,000 | 5,724,149 |
| 5.05% 3/25/48 | | 8,772,000 | 8,543,070 |
| Elanco Animal Health, Inc.: | | | |
| 3.912% 8/27/21 (a) | | 1,003,000 | 1,009,199 |
| 4.272% 8/28/23 (a) | | 3,166,000 | 3,163,123 |
| 4.9% 8/28/28 (a) | | 1,334,000 | 1,358,242 |
| HCA Holdings, Inc.: | | | |
| 4.25% 10/15/19 | | 11,265,000 | 11,236,838 |
| 4.75% 5/1/23 | | 215,000 | 211,775 |
| 5.875% 3/15/22 | | 260,000 | 266,500 |
| 6.5% 2/15/20 | | 7,140,000 | 7,318,500 |
| Medco Health Solutions, Inc. 4.125% 9/15/20 | | 2,723,000 | 2,751,873 |
| Toledo Hospital: | | | |
| 5.325% 11/15/28 | | 2,109,000 | 2,139,314 |
| 6.015% 11/15/48 | | 10,123,000 | 10,302,068 |
| | | | 85,905,021 |
| Life Sciences Tools & Services - 0.0% | | | |
| Thermo Fisher Scientific, Inc. 4.15% 2/1/24 | | 1,093,000 | 1,107,111 |
| Pharmaceuticals - 0.7% | | | |
| Actavis Funding SCS 3.45% 3/15/22 | | 6,868,000 | 6,762,625 |
| Mylan NV: | | | |
| 2.5% 6/7/19 | | 1,344,000 | 1,337,684 |
| 3.15% 6/15/21 | | 5,002,000 | 4,898,247 |
| 3.95% 6/15/26 | | 2,549,000 | 2,324,337 |
| 4.55% 4/15/28 (a) | | 4,000,000 | 3,730,266 |
| Perrigo Finance PLC 3.5% 12/15/21 | | 449,000 | 431,690 |
| Shire Acquisitions Investments Ireland DAC 2.4% 9/23/21 | | 9,847,000 | 9,521,477 |
| Teva Pharmaceutical Finance Netherlands III BV: | | | |
| 2.2% 7/21/21 | | 3,623,000 | 3,330,171 |
| 2.8% 7/21/23 | | 1,463,000 | 1,259,924 |
| Zoetis, Inc. 3.25% 2/1/23 | | 1,649,000 | 1,621,881 |
| | | | 35,218,302 |
|
| TOTAL HEALTH CARE | | | 126,561,381 |
|
| INDUSTRIALS - 0.5% | | | |
| Airlines - 0.0% | | | |
| Northwest Airlines, Inc. pass-thru trust certificates 7.027% 11/1/19 | | 1,844,483 | 1,895,096 |
| U.S. Airways pass-thru trust certificates 8.36% 1/20/19 | | 106,247 | 106,247 |
| | | | 2,001,343 |
| Professional Services - 0.0% | | | |
| Thomson Reuters Corp. 3.85% 9/29/24 | | 1,034,000 | 1,013,411 |
| Trading Companies & Distributors - 0.5% | | | |
| Air Lease Corp.: | | | |
| 3% 9/15/23 | | 877,000 | 823,466 |
| 3.375% 6/1/21 | | 2,523,000 | 2,498,832 |
| 3.75% 2/1/22 | | 4,522,000 | 4,474,567 |
| 3.875% 4/1/21 | | 3,180,000 | 3,183,941 |
| 3.875% 7/3/23 | | 5,581,000 | 5,492,534 |
| 4.25% 9/15/24 | | 3,565,000 | 3,484,457 |
| 4.75% 3/1/20 | | 3,519,000 | 3,567,048 |
| | | | 23,524,845 |
|
| TOTAL INDUSTRIALS | | | 26,539,599 |
|
| INFORMATION TECHNOLOGY - 0.0% | | | |
| Electronic Equipment & Components - 0.0% | | | |
| Diamond 1 Finance Corp./Diamond 2 Finance Corp. 6.02% 6/15/26 (a) | | 500,000 | 502,488 |
| MATERIALS - 0.5% | | | |
| Chemicals - 0.1% | | | |
| The Dow Chemical Co.: | | | |
| 4.125% 11/15/21 | | 3,587,000 | 3,649,961 |
| 4.25% 11/15/20 | | 1,196,000 | 1,217,058 |
| | | | 4,867,019 |
| Metals & Mining - 0.4% | | | |
| BHP Billiton Financial (U.S.A.) Ltd.: | | | |
| 6.25% 10/19/75 (a)(b) | | 1,921,000 | 1,963,396 |
| 6.75% 10/19/75 (a)(b) | | 4,773,000 | 4,963,920 |
| Corporacion Nacional del Cobre de Chile (Codelco): | | | |
| 3.625% 8/1/27 (a) | | 1,696,000 | 1,615,186 |
| 4.5% 8/13/23 (a) | | 9,000,000 | 9,207,171 |
| 4.5% 8/1/47 (a) | | 1,720,000 | 1,658,527 |
| | | | 19,408,200 |
|
| TOTAL MATERIALS | | | 24,275,219 |
|
| REAL ESTATE - 3.3% | | | |
| Equity Real Estate Investment Trusts (REITs) - 2.2% | | | |
| Alexandria Real Estate Equities, Inc.: | | | |
| 2.75% 1/15/20 | | 879,000 | 872,035 |
| 4.6% 4/1/22 | | 1,403,000 | 1,444,257 |
| American Campus Communities Operating Partnership LP 3.75% 4/15/23 | | 1,184,000 | 1,175,380 |
| American Tower Corp. 2.8% 6/1/20 | | 9,000,000 | 8,929,503 |
| AvalonBay Communities, Inc. 3.625% 10/1/20 | | 1,872,000 | 1,882,449 |
| Boston Properties, Inc.: | | | |
| 3.85% 2/1/23 | | 4,708,000 | 4,716,133 |
| 4.5% 12/1/28 | | 3,891,000 | 3,980,772 |
| Camden Property Trust: | | | |
| 2.95% 12/15/22 | | 1,607,000 | 1,571,997 |
| 4.25% 1/15/24 | | 3,408,000 | 3,475,366 |
| Corporate Office Properties LP 5% 7/1/25 | | 3,156,000 | 3,214,685 |
| DDR Corp.: | | | |
| 3.625% 2/1/25 | | 2,262,000 | 2,160,779 |
| 4.25% 2/1/26 | | 1,807,000 | 1,773,983 |
| 4.625% 7/15/22 | | 896,000 | 919,939 |
| Duke Realty LP: | | | |
| 3.625% 4/15/23 | | 2,123,000 | 2,121,235 |
| 3.75% 12/1/24 | | 1,576,000 | 1,563,983 |
| 3.875% 10/15/22 | | 3,512,000 | 3,545,563 |
| Equity One, Inc. 3.75% 11/15/22 | | 5,500,000 | 5,490,962 |
| ERP Operating LP: | | | |
| 2.375% 7/1/19 | | 2,683,000 | 2,674,737 |
| 4.75% 7/15/20 | | 2,827,000 | 2,881,010 |
| Lexington Corporate Properties Trust 4.4% 6/15/24 | | 1,441,000 | 1,419,421 |
| Omega Healthcare Investors, Inc.: | | | |
| 4.375% 8/1/23 | | 6,023,000 | 6,048,004 |
| 4.5% 1/15/25 | | 2,677,000 | 2,637,467 |
| 4.5% 4/1/27 | | 16,195,000 | 15,647,580 |
| 4.75% 1/15/28 | | 6,382,000 | 6,255,980 |
| 4.95% 4/1/24 | | 1,354,000 | 1,375,931 |
| 5.25% 1/15/26 | | 5,686,000 | 5,788,613 |
| Retail Opportunity Investments Partnership LP: | | | |
| 4% 12/15/24 | | 978,000 | 923,647 |
| 5% 12/15/23 | | 737,000 | 739,931 |
| Ventas Realty LP: | | | |
| 3.125% 6/15/23 | | 1,289,000 | 1,256,437 |
| 3.5% 2/1/25 | | 6,443,000 | 6,170,269 |
| 4% 3/1/28 | | 2,243,000 | 2,175,124 |
| 4.125% 1/15/26 | | 1,557,000 | 1,544,793 |
| 4.375% 2/1/45 | | 763,000 | 693,754 |
| Weingarten Realty Investors 3.375% 10/15/22 | | 812,000 | 800,566 |
| WP Carey, Inc. 4% 2/1/25 | | 5,360,000 | 5,217,495 |
| | | | 113,089,780 |
| Real Estate Management & Development - 1.1% | | | |
| Brandywine Operating Partnership LP: | | | |
| 3.95% 2/15/23 | | 5,510,000 | 5,479,771 |
| 3.95% 11/15/27 | | 4,613,000 | 4,385,379 |
| 4.1% 10/1/24 | | 4,251,000 | 4,204,661 |
| 4.55% 10/1/29 | | 4,524,000 | 4,457,933 |
| Digital Realty Trust LP: | | | |
| 3.4% 10/1/20 | | 4,915,000 | 4,898,411 |
| 3.95% 7/1/22 | | 3,320,000 | 3,339,568 |
| 4.75% 10/1/25 | | 3,533,000 | 3,611,280 |
| 5.25% 3/15/21 | | 1,953,000 | 2,016,637 |
| Liberty Property LP: | | | |
| 3.375% 6/15/23 | | 2,202,000 | 2,168,830 |
| 4.125% 6/15/22 | | 2,007,000 | 2,044,779 |
| 4.4% 2/15/24 | | 4,876,000 | 5,006,039 |
| 4.75% 10/1/20 | | 4,185,000 | 4,268,022 |
| Mack-Cali Realty LP: | | | |
| 3.15% 5/15/23 | | 4,988,000 | 4,420,888 |
| 4.5% 4/18/22 | | 1,218,000 | 1,175,296 |
| Post Apartment Homes LP 3.375% 12/1/22 | | 790,000 | 780,845 |
| Tanger Properties LP: | | | |
| 3.125% 9/1/26 | | 3,109,000 | 2,773,545 |
| 3.75% 12/1/24 | | 2,960,000 | 2,870,416 |
| 3.875% 12/1/23 | | 1,792,000 | 1,765,151 |
| | | | 59,667,451 |
|
| TOTAL REAL ESTATE | | | 172,757,231 |
|
| UTILITIES - 1.5% | | | |
| Electric Utilities - 1.0% | | | |
| Cleco Corporate Holdings LLC 3.743% 5/1/26 | | 2,071,000 | 1,976,596 |
| Duquesne Light Holdings, Inc.: | | | |
| 5.9% 12/1/21 (a) | | 2,664,000 | 2,818,384 |
| 6.4% 9/15/20 (a) | | 7,513,000 | 7,833,815 |
| Eversource Energy 2.8% 5/1/23 | | 5,110,000 | 4,986,110 |
| FirstEnergy Corp.: | | | |
| 4.25% 3/15/23 | | 11,729,000 | 11,916,005 |
| 7.375% 11/15/31 | | 5,897,000 | 7,456,309 |
| IPALCO Enterprises, Inc.: | | | |
| 3.45% 7/15/20 | | 7,767,000 | 7,755,866 |
| 3.7% 9/1/24 | | 2,157,000 | 2,099,837 |
| LG&E and KU Energy LLC 3.75% 11/15/20 | | 525,000 | 526,927 |
| NV Energy, Inc. 6.25% 11/15/20 | | 1,238,000 | 1,300,460 |
| TECO Finance, Inc. 5.15% 3/15/20 | | 1,545,000 | 1,579,797 |
| | | | 50,250,106 |
| Gas Utilities - 0.0% | | | |
| Southern Natural Gas Co./Southern Natural Issuing Corp. 4.4% 6/15/21 | | 1,182,000 | 1,198,799 |
| Independent Power and Renewable Electricity Producers - 0.1% | | | |
| Emera U.S. Finance LP: | | | |
| 2.15% 6/15/19 | | 1,201,000 | 1,191,185 |
| 2.7% 6/15/21 | | 1,182,000 | 1,151,455 |
| 3.55% 6/15/26 | | 1,891,000 | 1,794,113 |
| | | | 4,136,753 |
| Multi-Utilities - 0.4% | | | |
| Dominion Resources, Inc. 3 month U.S. LIBOR + 2.300% 5.103% 9/30/66 (b)(c) | | 15,230,000 | 13,554,700 |
| Puget Energy, Inc.: | | | |
| 6% 9/1/21 | | 4,807,000 | 5,084,777 |
| 6.5% 12/15/20 | | 1,534,000 | 1,620,293 |
| Wisconsin Energy Corp. 3 month U.S. LIBOR + 2.113% 4.7286% 5/15/67 (b)(c) | | 1,426,000 | 1,163,488 |
| | | | 21,423,258 |
|
| TOTAL UTILITIES | | | 77,008,916 |
|
| TOTAL NONCONVERTIBLE BONDS | | | |
| (Cost $1,725,346,851) | | | 1,684,912,534 |
|
| U.S. Government and Government Agency Obligations - 37.7% | | | |
| U.S. Treasury Inflation-Protected Obligations - 8.9% | | | |
| U.S. Treasury Inflation-Indexed Bonds: | | | |
| 0.75% 2/15/45 | | $51,698,027 | $46,347,904 |
| 0.875% 2/15/47 | | 3,258,067 | 2,997,912 |
| 1% 2/15/46 | | 13,863,967 | 13,175,756 |
| 1.375% 2/15/44 | | 48,366,995 | 50,053,334 |
| U.S. Treasury Inflation-Indexed Notes: | | | |
| 0.125% 7/15/24 | | 59,981,926 | 57,536,135 |
| 0.125% 7/15/26 | | 39,668,000 | 37,267,652 |
| 0.25% 1/15/25 | | 52,522,382 | 50,311,246 |
| 0.375% 1/15/27 | | 43,089,992 | 40,956,303 |
| 0.375% 7/15/27 | | 83,736,930 | 79,494,147 |
| 0.625% 1/15/26 | | 63,856,800 | 62,197,872 |
| 0.75% 7/15/28 | | 26,697,160 | 26,151,140 |
|
| TOTAL U.S. TREASURY INFLATION-PROTECTED OBLIGATIONS | | | 466,489,401 |
|
| U.S. Treasury Obligations - 28.8% | | | |
| U.S. Treasury Bonds: | | | |
| 2.75% 11/15/47 | | 5,383,000 | 5,102,564 |
| 3% 5/15/45 (d) | | 42,484,000 | 42,479,525 |
| 3% 5/15/47 | | 49,138,000 | 49,013,716 |
| 3.375% 11/15/48 | | 138,201,000 | 148,036,550 |
| U.S. Treasury Notes: | | | |
| 1.125% 2/28/19 | | 25,000,000 | 24,949,636 |
| 1.25% 10/31/21 | | 204,057,000 | 197,234,281 |
| 1.875% 3/31/22 | | 229,649,000 | 225,338,401 |
| 1.875% 7/31/22 | | 200,804,000 | 196,640,217 |
| 2% 12/31/21 | | 437,319,000 | 431,323,819 |
| 2.125% 7/31/24 | | 40,638,000 | 39,754,825 |
| 2.125% 11/30/24 | | 76,892,000 | 75,057,550 |
| 2.25% 12/31/24 | | 41,778,000 | 41,051,326 |
| 2.25% 11/15/27 | | 15,350,000 | 14,839,092 |
| 2.875% 8/15/28 | | 28,500,000 | 28,960,999 |
|
| TOTAL U.S. TREASURY OBLIGATIONS | | | 1,519,782,501 |
|
| TOTAL U.S. GOVERNMENT AND GOVERNMENT AGENCY OBLIGATIONS | | | |
| (Cost $2,024,673,338) | | | 1,986,271,902 |
|
| U.S. Government Agency - Mortgage Securities - 28.9% | | | |
| Fannie Mae - 13.4% | | | |
| 12 month U.S. LIBOR + 1.480% 4.287% 7/1/34 (b)(c) | | 21,472 | 22,227 |
| 12 month U.S. LIBOR + 1.553% 4.276% 6/1/36 (b)(c) | | 24,042 | 24,996 |
| 12 month U.S. LIBOR + 1.725% 2.586% 6/1/42 (b)(c) | | 212,388 | 220,586 |
| 12 month U.S. LIBOR + 1.728% 4.138% 11/1/36 (b)(c) | | 273,606 | 286,158 |
| 12 month U.S. LIBOR + 1.745% 3.808% 7/1/35 (b)(c) | | 23,549 | 24,628 |
| 12 month U.S. LIBOR + 1.788% 3.663% 2/1/36 (b)(c) | | 159,732 | 165,667 |
| 12 month U.S. LIBOR + 1.800% 4.547% 7/1/41 (b)(c) | | 180,548 | 190,295 |
| 12 month U.S. LIBOR + 1.818% 4.546% 7/1/41 (b)(c) | | 114,228 | 118,125 |
| 12 month U.S. LIBOR + 1.818% 4.568% 9/1/41 (b)(c) | | 67,702 | 71,359 |
| 12 month U.S. LIBOR + 1.820% 3.695% 12/1/35 (b)(c) | | 134,031 | 140,828 |
| 12 month U.S. LIBOR + 1.830% 4.662% 10/1/41 (b)(c) | | 69,848 | 73,693 |
| 12 month U.S. LIBOR + 1.900% 4.634% 7/1/37 (b)(c) | | 36,922 | 38,915 |
| 12 month U.S. LIBOR + 1.906% 4.312% 5/1/36 (b)(c) | | 113,068 | 118,642 |
| 12 month U.S. LIBOR + 1.932% 4.523% 9/1/36 (b)(c) | | 169,829 | 176,397 |
| 6 month U.S. LIBOR + 1.313% 3.882% 5/1/34 (b)(c) | | 150,939 | 152,779 |
| 6 month U.S. LIBOR + 1.383% 3.87% 9/1/33 (b)(c) | | 197,214 | 201,517 |
| 6 month U.S. LIBOR + 1.556% 4.059% 10/1/33 (b)(c) | | 10,135 | 10,416 |
| 6 month U.S. LIBOR + 1.565% 4.065% 7/1/35 (b)(c) | | 10,161 | 10,466 |
| U.S. TREASURY 1 YEAR INDEX + 1.945% 4.24% 10/1/33 (b)(c) | | 282,036 | 293,455 |
| U.S. TREASURY 1 YEAR INDEX + 2.208% 4.083% 3/1/35 (b)(c) | | 7,044 | 7,323 |
| U.S. TREASURY 1 YEAR INDEX + 2.232% 3.883% 8/1/36 (b)(c) | | 473,920 | 501,071 |
| U.S. TREASURY 1 YEAR INDEX + 2.295% 4.678% 10/1/33 (b)(c) | | 26,243 | 27,689 |
| U.S. TREASURY 1 YEAR INDEX + 2.475% 4.47% 5/1/35 (b)(c) | | 51,165 | 54,096 |
| 2.5% 1/1/34 (e) | | 16,600,000 | 16,223,368 |
| 2.5% 1/1/43 to 4/1/47 | | 8,311,393 | 7,895,135 |
| 3% 11/1/24 to 7/1/48 | | 150,698,894 | 147,604,131 |
| 3.5% 12/1/23 to 11/1/48 | | 182,600,934 | 183,176,281 |
| 3.5% 1/1/34 (e) | | 2,450,000 | 2,480,362 |
| 3.5% 1/1/34 (e) | | 2,475,000 | 2,505,672 |
| 3.5% 1/1/34 (e) | | 6,400,000 | 6,479,313 |
| 3.5% 1/1/34 (e) | | 8,500,000 | 8,605,337 |
| 3.5% 1/1/34 (e) | | 6,400,000 | 6,479,313 |
| 3.5% 1/1/34 (e) | | 4,225,000 | 4,277,359 |
| 3.5% 1/1/34 (e) | | 1,400,000 | 1,417,350 |
| 3.5% 1/1/34 (e) | | 1,775,000 | 1,796,997 |
| 3.5% 1/1/34 (e) | | 1,775,000 | 1,796,997 |
| 4% 11/1/31 to 12/1/48 | | 198,908,405 | 203,519,855 |
| 4.5% 5/1/25 to 11/1/48 | | 53,566,489 | 55,800,304 |
| 4.5% 1/1/49 (e) | | 10,600,000 | 10,973,181 |
| 4.5% 1/1/49 (e) | | 4,100,000 | 4,244,344 |
| 5% 9/1/20 to 11/1/44 | | 16,344,643 | 17,303,550 |
| 5.5% 4/1/34 to 5/1/44 | | 4,985,077 | 5,359,385 |
| 6% 10/1/34 to 1/1/42 | | 12,193,660 | 13,475,281 |
| 6.5% 12/1/23 to 8/1/36 | | 1,388,061 | 1,551,755 |
| 7% 11/1/23 to 8/1/32 | | 348,674 | 382,451 |
| 7.5% 9/1/22 to 11/1/31 | | 279,615 | 313,785 |
| 8% 1/1/30 to 3/1/30 | | 1,618 | 1,777 |
| 8.5% 3/1/25 to 6/1/25 | | 364 | 407 |
|
| TOTAL FANNIE MAE | | | 706,595,018 |
|
| Freddie Mac - 6.7% | | | |
| 12 month U.S. LIBOR + 1.375% 3.884% 3/1/36 (b)(c) | | 82,752 | 85,268 |
| 12 month U.S. LIBOR + 1.877% 4.202% 4/1/41 (b)(c) | | 85,635 | 90,096 |
| 12 month U.S. LIBOR + 1.880% 4.63% 9/1/41 (b)(c) | | 82,229 | 86,529 |
| 12 month U.S. LIBOR + 1.910% 4.358% 5/1/41 (b)(c) | | 177,465 | 183,386 |
| 12 month U.S. LIBOR + 1.910% 4.477% 5/1/41 (b)(c) | | 128,260 | 135,169 |
| 12 month U.S. LIBOR + 1.910% 4.583% 6/1/41 (b)(c) | | 166,898 | 172,415 |
| 12 month U.S. LIBOR + 1.910% 4.66% 6/1/41 (b)(c) | | 88,077 | 90,856 |
| 12 month U.S. LIBOR + 2.077% 4.394% 3/1/33 (b)(c)�� | | 1,782 | 1,866 |
| 12 month U.S. LIBOR + 2.160% 5.035% 11/1/35 (b)(c) | | 58,216 | 61,003 |
| 6 month U.S. LIBOR + 1.655% 4.155% 4/1/35 (b)(c) | | 136,766 | 141,820 |
| 6 month U.S. LIBOR + 2.590% 5.09% 10/1/35 (b)(c) | | 35,363 | 37,087 |
| U.S. TREASURY 1 YEAR INDEX + 2.249% 3.715% 1/1/35 (b)(c) | | 32,554 | 34,330 |
| 3% 6/1/31 to 1/1/47 | | 83,736,491 | 81,862,638 |
| 3.5% 3/1/32 to 12/1/47 (f) | | 116,664,606 | 117,865,909 |
| 3.5% 1/1/49 (e) | | 6,650,000 | 6,645,898 |
| 3.5% 1/1/49 (e) | | 5,350,000 | 5,346,700 |
| 3.5% 1/1/49 (e) | | 4,000,000 | 3,997,533 |
| 3.5% 1/1/49 (e) | | 6,100,000 | 6,096,238 |
| 3.5% 1/1/49 (e) | | 8,900,000 | 8,894,510 |
| 4% 5/1/25 to 5/1/48 | | 60,207,151 | 61,802,363 |
| 4.5% 7/1/25 to 5/1/48 | | 34,739,269 | 36,236,682 |
| 4.5% 1/1/49 (e) | | 11,600,000 | 12,002,950 |
| 5% 1/1/35 to 6/1/41 | | 3,084,321 | 3,279,331 |
| 5.5% 1/1/38 to 6/1/41 | | 4,521,118 | 4,856,584 |
| 6% 4/1/32 to 8/1/37 | | 710,442 | 786,574 |
| 7.5% 5/1/26 to 11/1/31 | | 33,326 | 37,675 |
| 8% 4/1/27 to 5/1/27 | | 2,338 | 2,626 |
| 8.5% 5/1/27 to 1/1/28 | | 4,951 | 5,585 |
|
| TOTAL FREDDIE MAC | | | 350,839,621 |
|
| Ginnie Mae - 8.8% | | | |
| 3% 12/20/42 to 11/20/47 | | 94,192,045 | 92,939,616 |
| 3.5% 1/15/41 to 8/20/48 | | 132,574,090 | 133,711,208 |
| 4% 2/15/40 to 9/20/48 | | 63,569,872 | 65,361,095 |
| 4.5% 5/15/39 to 5/20/41 | | 12,416,944 | 13,035,973 |
| 5% 3/15/39 to 4/15/41 | | 1,996,255 | 2,117,058 |
| 6.5% 4/15/35 to 11/15/35 | | 77,158 | 87,323 |
| 7% 1/15/28 to 7/15/32 | | 874,583 | 986,244 |
| 7.5% 4/15/22 to 10/15/28 | | 205,355 | 227,654 |
| 8% 3/15/30 to 9/15/30 | | 13,907 | 16,308 |
| 8.5% 3/15/30 | | 764 | 774 |
| 4.5% 1/1/49 (e) | | 34,600,000 | 35,785,379 |
| 4.5% 1/1/49 (e) | | 25,400,000 | 26,270,191 |
| 4.5% 1/1/49 (e) | | 28,900,000 | 29,890,100 |
| 4.5% 1/1/49 (e) | | 12,000,000 | 12,411,114 |
| 4.5% 2/1/49 (e) | | 26,100,000 | 26,969,702 |
| 4.5% 2/1/49 (e) | | 13,100,000 | 13,536,517 |
| 4.5% 2/1/49 (e) | | 12,600,000 | 13,019,856 |
|
| TOTAL GINNIE MAE | | | 466,366,112 |
|
| TOTAL U.S. GOVERNMENT AGENCY - MORTGAGE SECURITIES | | | |
| (Cost $1,539,845,532) | | | 1,523,800,751 |
|
| Asset-Backed Securities - 1.0% | | | |
| AASET Trust Series 2018-1A Class A, 3.844% 1/16/38 (a) | | $4,408,162 | $4,423,764 |
| Blackbird Capital Aircraft Series 2016-1A: | | | |
| Class A, 4.213% 12/16/41 (a) | | 8,650,687 | 8,745,810 |
| Class AA, 2.487% 12/16/41 (a) | | 1,926,896 | 1,884,898 |
| Castlelake Aircraft Structured Trust Series 2018-1 Class A, 4.125% 6/15/43 (a) | | 7,154,142 | 7,266,946 |
| Countrywide Home Loans, Inc.: | | | |
| Series 2003-BC1 Class B1, 1 month U.S. LIBOR + 5.250% 7.7563% 3/25/32 (b)(c) | | 11,075 | 11,214 |
| Series 2004-7 Class AF5, 5.868% 1/25/35 | | 159,440 | 159,928 |
| DB Master Finance LLC: | | | |
| Series 2015-1A Class A2II, 3.98% 2/20/45 (a) | | 11,743,463 | 11,907,166 |
| Series 2017-1A: | | | |
| Class A2I, 3.629% 11/20/47 (a) | | 3,525,390 | 3,469,727 |
| Class A2II, 4.03% 11/20/47 (a) | | 5,967,720 | 5,738,277 |
| First Franklin Mortgage Loan Trust Series 2004-FF2 Class M3, 1 month U.S. LIBOR + 0.825% 3.3313% 3/25/34 (b)(c) | | 616 | 572 |
| Horizon Aircraft Finance I Ltd. Series 2018-1 Class A, 4.458% 12/15/38 (a) | | 3,051,000 | 3,109,965 |
| New Century Home Equity Loan Trust Series 2005-4 Class M2, 1 month U.S. LIBOR + 0.510% 3.0163% 9/25/35 (b)(c) | | 370,361 | 369,669 |
| Park Place Securities, Inc. Series 2005-WCH1 Class M4, 1 month U.S. LIBOR + 1.245% 3.7513% 1/25/36 (b)(c) | | 520,000 | 514,884 |
| Terwin Mortgage Trust Series 2003-4HE Class A1, 1 month U.S. LIBOR + 0.860% 3.3663% 9/25/34 (b)(c) | | 8,753 | 8,339 |
| Thunderbolt Aircraft Lease Ltd. Series 2018-A Class A, 4.147% 9/15/38 (a) | | 6,940,804 | 6,991,923 |
| TOTAL ASSET-BACKED SECURITIES | | | |
| (Cost $54,276,786) | | | 54,603,082 |
|
| Collateralized Mortgage Obligations - 0.1% | | | |
| Private Sponsor - 0.0% | | | |
| Bear Stearns ALT-A Trust floater Series 2005-1 Class A1, 1 month U.S. LIBOR + 0.560% 3.0663% 1/25/35 (b)(c) | | 78,189 | 77,927 |
| Merrill Lynch Alternative Note Asset Trust floater Series 2007-OAR1 Class A1, 1 month U.S. LIBOR + 0.170% 2.4851% 2/25/37 (b)(c) | | 49,799 | 48,969 |
| Opteum Mortgage Acceptance Corp. floater Series 2005-3 Class APT, 1 month U.S. LIBOR + 0.290% 2.7963% 7/25/35 (b)(c) | | 72,663 | 71,909 |
| Sequoia Mortgage Trust floater Series 2004-6 Class A3B, 6 month U.S. LIBOR + 0.880% 3.3769% 7/20/34 (b)(c) | | 4,901 | 4,655 |
|
| TOTAL PRIVATE SPONSOR | | | 203,460 |
|
| U.S. Government Agency - 0.1% | | | |
| Fannie Mae planned amortization class: | | | |
| Series 1999-54 Class PH, 6.5% 11/18/29 | | 213,303 | 220,823 |
| Series 1999-57 Class PH, 6.5% 12/25/29 | | 243,397 | 268,661 |
| Ginnie Mae guaranteed REMIC pass-thru certificates: | | | |
| sequential payer Series 2013-H06 Class HA, 1.65% 1/20/63 (g) | | 2,590,749 | 2,557,856 |
| Series 2007-35 Class SC, 40.200% - 1 month U.S. LIBOR 25.4692% 6/16/37 (b)(h) | | 25,167 | 41,283 |
| Series 2015-H21 Class JA, 2.5% 6/20/65 (g) | | 2,637,623 | 2,621,895 |
|
| TOTAL U.S. GOVERNMENT AGENCY | | | 5,710,518 |
|
| TOTAL COLLATERALIZED MORTGAGE OBLIGATIONS | | | |
| (Cost $5,864,034) | | | 5,913,978 |
|
| Commercial Mortgage Securities - 1.7% | | | |
| Benchmark Mortgage Trust Series 2018-B8 Class A5, 4.2317% 1/15/52 | | 10,296,000 | 10,716,185 |
| BX Trust floater: | | | |
| Series 2018-EXCL Class D, 1 month U.S. LIBOR + 2.625% 5.0801% 9/15/37 (a)(b)(c) | | 1,975,000 | 1,946,265 |
| Series 2018-IND Class F, 1 month U.S. LIBOR + 1.800% 4.2551% 11/15/35 (a)(b)(c) | | 2,921,640 | 2,872,479 |
| CGBAM Commercial Mortgage Trust Series 2015-SMRT Class D, 3.768% 4/10/28 (a) | | 2,236,000 | 2,235,663 |
| Citigroup Commercial Mortgage Trust Series 2018-C6 Class A4, 4.412% 11/10/51 | | 3,364,000 | 3,564,153 |
| Credit Suisse Mortgage Trust Series 2018-SITE: | | | |
| Class A, 4.284% 4/15/36 (a) | | 3,682,000 | 3,796,484 |
| Class B, 4.5349% 4/15/36 (a) | | 660,000 | 680,595 |
| Class C, 4.782% 4/15/36 (a) | | 760,000 | 777,090 |
| Class D, 4.782% 4/15/36 (a) | | 1,519,000 | 1,517,727 |
| CSAIL Commercial Mtg Trust Series 2018-C14 Class A4 4.4216% 11/15/51 | | 2,763,000 | 2,908,800 |
| GAHR Commercial Mortgage Trust Series 2015-NRF: | | | |
| Class BFX, 3.3822% 12/15/34 (a)(b) | | 4,550,000 | 4,529,489 |
| Class CFX, 3.3822% 12/15/34 (a)(b) | | 3,823,000 | 3,789,926 |
| Class DFX, 3.3822% 12/15/34 (a)(b) | | 3,240,000 | 3,198,335 |
| JPMorgan Chase Commercial Mortgage Securities Trust Series 2018-WPT: | | | |
| Class CFX, 4.9498% 7/5/33 (a) | | 729,000 | 753,148 |
| Class DFX, 5.3503% 7/5/33 (a) | | 1,121,000 | 1,155,354 |
| Class EFX, 5.5422% 7/5/33 (a) | | 1,533,000 | 1,557,776 |
| Morgan Stanley Capital I Trust: | | | |
| floater Series 2018-BOP: | | | |
| Class B, 1 month U.S. LIBOR + 1.250% 3.7051% 8/15/33 (a)(b)(c) | | 4,318,000 | 4,282,967 |
| Class C, 1 month U.S. LIBOR + 1.500% 3.9551% 8/15/33 (a)(b)(c) | | 10,400,000 | 10,272,255 |
| Series 2018-H4 Class A4, 4.31% 12/15/51 | | 10,381,000 | 10,820,444 |
| MSCG Trust Series 2016-SNR: | | | |
| Class A, 3.348% 11/15/34 (a)(b) | | 3,879,515 | 3,780,310 |
| Class B, 4.181% 11/15/34 (a) | | 1,632,000 | 1,602,542 |
| Class C, 5.205% 11/15/34 (a) | | 1,144,100 | 1,131,544 |
| Providence Place Group Ltd. Partnership Series 2000-C1 Class A2, 7.75% 7/20/28 (a) | | 3,984,018 | 4,643,265 |
| Wells Fargo Commercial Mortgage Trust Series 2018-C48 Class A5, 4.302% 1/15/52 | | 7,796,000 | 8,120,417 |
| TOTAL COMMERCIAL MORTGAGE SECURITIES | | | |
| (Cost $90,286,335) | | | 90,653,213 |
|
| Municipal Securities - 1.7% | | | |
| California Gen. Oblig.: | | | |
| Series 2009: | | $ | $ |
| 7.35% 11/1/39 | | 805,000 | 1,111,294 |
| 7.5% 4/1/34 | | 5,055,000 | 6,888,600 |
| 7.55% 4/1/39 | | 6,085,000 | 8,717,067 |
| 6.65% 3/1/22 | | 4,360,000 | 4,773,284 |
| Chicago Gen. Oblig. (Taxable Proj.): | | | |
| Series 2008 B, 5.63% 1/1/22 | | 880,000 | 890,164 |
| Series 2010 C1, 7.781% 1/1/35 | | 10,090,000 | 11,383,841 |
| Series 2012 B, 5.432% 1/1/42 | | 1,205,000 | 1,068,220 |
| Illinois Gen. Oblig.: | | | |
| Series 2003: | | | |
| 4.95% 6/1/23 | | 4,950,000 | 5,025,933 |
| 5.1% 6/1/33 | | 4,805,000 | 4,581,231 |
| Series 2010-1, 6.63% 2/1/35 | | 12,290,000 | 13,068,449 |
| Series 2010-3: | | | |
| 5.547% 4/1/19 | | 120,000 | 120,669 |
| 6.725% 4/1/35 | | 9,480,000 | 10,153,744 |
| 7.35% 7/1/35 | | 5,540,000 | 6,140,702 |
| Series 2010-5, 6.2% 7/1/21 | | 1,356,000 | 1,404,762 |
| Series 2011, 5.877% 3/1/19 | | 14,325,000 | 14,388,295 |
| TOTAL MUNICIPAL SECURITIES | | | |
| (Cost $89,630,771) | | | 89,716,255 |
|
| Bank Notes - 0.9% | | | |
| Capital One NA 2.95% 7/23/21 | | 5,645,000 | 5,554,629 |
| Discover Bank: | | | |
| (Delaware) 3.2% 8/9/21 | | 6,841,000 | 6,769,650 |
| 3.1% 6/4/20 | | 6,380,000 | 6,335,360 |
| 3.35% 2/6/23 | | 3,206,000 | 3,120,413 |
| 4.682% 8/9/28 (b) | | 2,761,000 | 2,701,915 |
| 8.7% 11/18/19 | | 1,503,000 | 1,567,598 |
| KeyBank NA: | | | |
| 2.25% 3/16/20 | | 9,000,000 | 8,903,230 |
| 6.95% 2/1/28 | | 800,000 | 948,823 |
| PNC Bank NA 2.3% 6/1/20 | | 1,450,000 | 1,430,264 |
| RBS Citizens NA 2.5% 3/14/19 | | 2,751,000 | 2,748,375 |
| Synchrony Bank 3.65% 5/24/21 | | 4,766,000 | 4,663,099 |
| TOTAL BANK NOTES | | | |
| (Cost $45,082,280) | | | 44,743,356 |
| | | Shares | Value |
|
| Money Market Funds - 0.4% | | | |
| Fidelity Cash Central Fund, 2.42% (i) | | | |
| (Cost $21,691,115) | | 21,690,207 | 21,694,545 |
| TOTAL INVESTMENT IN SECURITIES - 104.4% | | | |
| (Cost $5,596,697,042) | | | 5,502,309,616 |
| NET OTHER ASSETS (LIABILITIES) - (4.4)% | | | (233,172,686) |
| NET ASSETS - 100% | | | $5,269,136,930 |
| TBA Sale Commitments | | |
| | Principal Amount | Value |
| Fannie Mae | | |
| 3% 1/1/49 | $(6,050,000) | $(5,903,041) |
| 3% 1/1/49 | (4,850,000) | (4,732,190) |
| 3% 1/1/49 | (3,650,000) | (3,561,339) |
| 3% 1/1/49 | (5,550,000) | (5,415,186) |
| 3.5% 1/1/49 | (2,250,000) | (2,249,140) |
| 3.5% 1/1/49 | (550,000) | (549,790) |
| 3.5% 1/1/49 | (2,025,000) | (2,024,225) |
| 3.5% 1/1/49 | (2,025,000) | (2,024,225) |
| 4% 1/1/49 | (5,850,000) | (5,963,127) |
| 4% 1/1/49 | (5,850,000) | (5,963,127) |
| 4.5% 1/1/49 | (14,700,000) | (15,217,525) |
| 4.5% 1/1/49 | (2,725,000) | (2,820,936) |
| 4.5% 1/1/49 | (2,725,000) | (2,820,936) |
| 4.5% 1/1/49 | (1,800,000) | (1,863,370) |
|
| TOTAL FANNIE MAE | | (61,108,157) |
|
| Ginnie Mae | | |
| 3.5% 1/1/49 | (12,000,000) | (12,082,208) |
| 4% 1/1/49 | (23,200,000) | (23,757,480) |
| 4.5% 1/1/49 | (26,100,000) | (26,994,173) |
| 4.5% 1/1/49 | (13,100,000) | (13,548,799) |
| 4.5% 1/1/49 | (12,600,000) | (13,031,670) |
| 4.5% 1/1/49 | (5,175,000) | (5,352,293) |
| 4.5% 1/1/49 | (5,200,000) | (5,378,149) |
| 4.5% 1/1/49 | (13,850,000) | (14,324,494) |
| 4.5% 1/1/49 | (10,375,000) | (10,730,442) |
| 4.5% 1/1/49 | (14,500,000) | (14,996,763) |
|
| TOTAL GINNIE MAE | | (140,196,471) |
|
| TOTAL TBA SALE COMMITMENTS | | |
| (Proceeds $200,429,607) | | $(201,304,628) |
Swaps
| Underlying Reference | Rating(1) | Maturity Date | Clearinghouse / Counterparty | Fixed Payment Received/(Paid) | Payment Frequency | Notional Amount(2) | Value(1) | Upfront Premium Received/(Paid) | Unrealized Appreciation/(Depreciation) |
| Credit Default Swaps | | | | | | | | | |
| Sell Protection | | | | | | | | | |
| Ameriquest Mortgage Securities Inc Series 2004-R11 Class M9 | C | Dec. 2034 | Bank of America | 4.25% | Monthly | $64,579 | $(63,128) | $0 | $(63,128) |
(1) Ratings are presented for credit default swaps in which the Fund has sold protection on the underlying referenced debt. Ratings for an underlying index represent a weighted average of the ratings of all securities included in the index. The credit rating or value can be measures of the current payment/performance risk. Ratings are from Moody's Investors Service, Inc. Where Moody's® ratings are not available, S&P® ratings are disclosed and are indicated as such. All ratings are as of the report date and do not reflect subsequent changes.
(2) The notional amount of each credit default swap where the Fund has sold protection approximates the maximum potential amount of future payments that the Fund could be required to make if a credit event were to occur.
Legend
(a) Security exempt from registration under Rule 144A of the Securities Act of 1933. These securities may be resold in transactions exempt from registration, normally to qualified institutional buyers. At the end of the period, the value of these securities amounted to $261,978,092 or 5.0% of net assets.
(b) Coupon rates for floating and adjustable rate securities reflect the rates in effect at period end.
(c) Coupon is indexed to a floating interest rate which may be multiplied by a specified factor and/or subject to caps or floors.
(d) Security or a portion of the security has been segregated as collateral for open bi-lateral over-the-counter (OTC) swaps. At period end, the value of securities pledged amounted to $90,990.
(e) Security or a portion of the security purchased on a delayed delivery or when-issued basis.
(f) Security or a portion of the security has been segregated as collateral for mortgage-backed or asset-backed securities purchased on a delayed delivery or when-issued basis. At period end, the value of securities pledged amounted to $26,218.
(g) Represents an investment in an underlying pool of reverse mortgages which typically do not require regular principal and interest payments as repayment is deferred until a maturity event.
(h) Coupon is inversely indexed to a floating interest rate multiplied by a specified factor. The price may be considerably more volatile than the price of a comparable fixed rate security.
(i) Affiliated fund that is generally available only to investment companies and other accounts managed by Fidelity Investments. The rate quoted is the annualized seven-day yield of the fund at period end. A complete unaudited listing of the fund's holdings as of its most recent quarter end is available upon request. In addition, each Fidelity Central Fund's financial statements, which are not covered by the Fund's Report of Independent Registered Public Accounting Firm, are available on the SEC's website or upon request.
Affiliated Central Funds
Information regarding fiscal year to date income earned by the Fund from investments in Fidelity Central Funds is as follows:
| Fund | Income earned |
| Fidelity Cash Central Fund | $2,020,551 |
| Total | $2,020,551 |
Amounts in the income column in the above table include any capital gain distributions from underlying funds, which are presented in the corresponding line-item in the Statement of Operations if applicable.
Investment Valuation
The following is a summary of the inputs used, as of December 31, 2018, involving the Fund's assets and liabilities carried at fair value. The inputs or methodology used for valuing securities may not be an indication of the risk associated with investing in those securities. For more information on valuation inputs, and their aggregation into the levels used below, please refer to the Investment Valuation section in the accompanying Notes to Financial Statements.
| | Valuation Inputs at Reporting Date: |
| Description | Total | Level 1 | Level 2 | Level 3 |
| Investments in Securities: | | | | |
| Corporate Bonds | $1,684,912,534 | $-- | $1,684,912,534 | $-- |
| U.S. Government and Government Agency Obligations | 1,986,271,902 | -- | 1,986,271,902 | -- |
| U.S. Government Agency - Mortgage Securities | 1,523,800,751 | -- | 1,523,800,751 | -- |
| Asset-Backed Securities | 54,603,082 | -- | 54,603,082 | -- |
| Collateralized Mortgage Obligations | 5,913,978 | -- | 5,913,978 | -- |
| Commercial Mortgage Securities | 90,653,213 | -- | 90,653,213 | -- |
| Municipal Securities | 89,716,255 | -- | 89,716,255 | -- |
| Bank Notes | 44,743,356 | -- | 44,743,356 | -- |
| Money Market Funds | 21,694,545 | 21,694,545 | -- | -- |
| Total Investments in Securities: | $5,502,309,616 | $21,694,545 | $5,480,615,071 | $-- |
| Derivative Instruments: | | | | |
| Liabilities | | | | |
| Swaps | $(63,128) | $-- | $(63,128) | $-- |
| Total Liabilities | $(63,128) | $-- | $(63,128) | $-- |
| Total Derivative Instruments: | $(63,128) | $-- | $(63,128) | $-- |
| Other Financial Instruments: | | | | |
| TBA Sale Commitments | $(201,304,628) | $-- | $(201,304,628) | $-- |
| Total Other Financial Instruments: | $(201,304,628) | $-- | $(201,304,628) | $-- |
Value of Derivative Instruments
The following table is a summary of the Fund's value of derivative instruments by primary risk exposure as of December 31, 2018. For additional information on derivative instruments, please refer to the Derivative Instruments section in the accompanying Notes to Financial Statements.
| Primary Risk Exposure / Derivative Type | Value |
| | Asset | Liability |
| Credit Risk | | |
| Swaps(a) | $0 | $(63,128) |
| Total Credit Risk | 0 | (63,128) |
| Total Value of Derivatives | $0 | $(63,128) |
(a) For bi-lateral over-the-counter (OTC) swaps, reflects gross value which is presented in the Statement of Assets and Liabilities in the bi-lateral OTC swaps, at value line-items.
See accompanying notes which are an integral part of the financial statements.
Fidelity® VIP Investment Grade Central Fund
Financial Statements
Statement of Assets and Liabilities
| | | December 31, 2018 |
| Assets | | |
Investment in securities, at value — See accompanying schedule:
Unaffiliated issuers (cost $5,575,005,927) | $5,480,615,071 | |
| Fidelity Central Funds (cost $21,691,115) | 21,694,545 | |
| Total Investment in Securities (cost $5,596,697,042) | | $5,502,309,616 |
| Receivable for investments sold | | 22,148,812 |
| Receivable for TBA sale commitments | | 200,429,607 |
| Interest receivable | | 32,876,401 |
| Distributions receivable from Fidelity Central Funds | | 85,072 |
| Total assets | | 5,757,849,508 |
| Liabilities | | |
| TBA sale commitments, at value | $201,304,628 | |
| Payable for investments purchased on a delayed delivery basis | 266,844,954 | |
| Payable for fund shares redeemed | 20,472,041 | |
| Bi-lateral OTC swaps, at value | 63,128 | |
| Other payables and accrued expenses | 27,827 | |
| Total liabilities | | 488,712,578 |
| Net Assets | | $5,269,136,930 |
| Net Assets consist of: | | |
| Paid in capital | | $5,388,475,157 |
| Total distributable earnings (loss) | | (119,338,227) |
| Net Assets, for 51,503,719 shares outstanding | | $5,269,136,930 |
| Net Asset Value, offering price and redemption price per share ($5,269,136,930 ÷ 51,503,719 shares) | | $102.31 |
See accompanying notes which are an integral part of the financial statements.
Statement of Operations
| | | Year ended December 31, 2018 |
| Investment Income | | |
| Interest | | $166,927,782 |
| Income from Fidelity Central Funds | | 2,020,551 |
| Total income | | 168,948,333 |
| Expenses | | |
| Custodian fees and expenses | $84,705 | |
| Independent trustees' fees and expenses | 25,378 | |
| Total expenses before reductions | 110,083 | |
| Expense reductions | (11,340) | |
| Total expenses after reductions | | 98,743 |
| Net investment income (loss) | | 168,849,590 |
| Realized and Unrealized Gain (Loss) | | |
| Net realized gain (loss) on: | | |
| Investment securities: | | |
| Unaffiliated issuers | (33,954,278) | |
| Fidelity Central Funds | 10,078 | |
| Swaps | 814 | |
| Total net realized gain (loss) | | (33,943,386) |
| Change in net unrealized appreciation (depreciation) on: | | |
| Investment securities: | | |
| Unaffiliated issuers | (140,730,613) | |
| Fidelity Central Funds | (10,249) | |
| Swaps | (502) | |
| Delayed delivery commitments | (878,631) | |
| Total change in net unrealized appreciation (depreciation) | | (141,619,995) |
| Net gain (loss) | | (175,563,381) |
| Net increase (decrease) in net assets resulting from operations | | $(6,713,791) |
See accompanying notes which are an integral part of the financial statements.
Statement of Changes in Net Assets
| | Year ended December 31, 2018 | Year ended December 31, 2017 |
| Increase (Decrease) in Net Assets | | |
| Operations | | |
| Net investment income (loss) | $168,849,590 | $145,158,781 |
| Net realized gain (loss) | (33,943,386) | 14,111,135 |
| Change in net unrealized appreciation (depreciation) | (141,619,995) | 68,053,550 |
| Net increase (decrease) in net assets resulting from operations | (6,713,791) | 227,323,466 |
| Distributions to shareholders | (154,089,100) | – |
| Distributions to shareholders from net investment income | – | (150,350,808) |
| Distributions to shareholders from net realized gain | – | (24,485,599) |
| Total distributions | (154,089,100) | (174,836,407) |
| Share transactions | | |
| Proceeds from sales of shares | 147,079,625 | 633,714,833 |
| Reinvestment of distributions | 154,932,119 | 174,366,683 |
| Cost of shares redeemed | (477,154,162) | (120,993,297) |
| Net increase (decrease) in net assets resulting from share transactions | (175,142,418) | 687,088,219 |
| Total increase (decrease) in net assets | (335,945,309) | 739,575,278 |
| Net Assets | | |
| Beginning of period | 5,605,082,239 | 4,865,506,961 |
| End of period | $5,269,136,930 | $5,605,082,239 |
| Other Information | | |
| Undistributed net investment income end of period | | $2,972,707 |
| Shares | | |
| Sold | 1,420,080 | 6,036,399 |
| Issued in reinvestment of distributions | 1,513,446 | 1,661,013 |
| Redeemed | (4,678,891) | (1,149,806) |
| Net increase (decrease) | (1,745,365) | 6,547,606 |
See accompanying notes which are an integral part of the financial statements.
Financial Highlights
Fidelity VIP Investment Grade Central Fund
| | | | | | |
| Years ended December 31, | 2018 | 2017 | 2016 | 2015 | 2014 |
| Selected Per–Share Data | | | | | |
| Net asset value, beginning of period | $105.26 | $104.18 | $103.71 | $106.70 | $103.29 |
| Income from Investment Operations | | | | | |
| Net investment income (loss)A | 3.163 | 2.887 | 3.167 | 3.292 | 3.178 |
| Net realized and unrealized gain (loss) | (3.209) | 1.693 | 1.659 | (3.071) | 3.336 |
| Total from investment operations | (.046) | 4.580 | 4.826 | .221 | 6.514 |
| Distributions from net investment income | (2.904) | (2.985) | (3.096) | (3.137) | (3.104) |
| Distributions from net realized gain | – | (.515) | (1.260) | (.074) | – |
| Total distributions | (2.904) | (3.500) | (4.356) | (3.211) | (3.104) |
| Net asset value, end of period | $102.31 | $105.26 | $104.18 | $103.71 | $106.70 |
| Total ReturnB | (.01)% | 4.46% | 4.70% | .18% | 6.37% |
| Ratios to Average Net AssetsC,D | | | | | |
| Expenses before reductionsE | -% | -% | -% | -% | -% |
| Expenses net of fee waivers, if anyE | -% | -% | -% | -% | -% |
| Expenses net of all reductionsE | -% | -% | -% | -% | -% |
| Net investment income (loss) | 3.09% | 2.75% | 3.00% | 3.11% | 3.01% |
| Supplemental Data | | | | | |
| Net assets, end of period (000 omitted) | $5,269,137 | $5,605,082 | $4,865,507 | $4,611,536 | $4,393,843 |
| Portfolio turnover rateF | 92% | 110% | 162% | 248% | 151% |
A Calculated based on average shares outstanding during the period.
B Total returns would have been lower if certain expenses had not been reduced during the applicable periods shown.
C Fees and expenses of any underlying Fidelity Central Funds are not included in the Fund's expense ratio. The Fund indirectly bears its proportionate share of the expenses of any underlying Fidelity Central Funds.
D Expense ratios reflect operating expenses of the Fund. Expenses before reductions do not reflect amounts reimbursed by the investment adviser or reductions from expense offset arrangements and do not represent the amount paid by the Fund during periods when reimbursements or reductions occur. Expenses net of fee waivers reflect expenses after reimbursement by the investment adviser but prior to reductions from expense offset arrangements. Expenses net of all reductions represent the net expenses paid by the Fund.
E Amount represents less than .005%.
F Amount does not include the portfolio activity of any underlying Fidelity Central Funds.
See accompanying notes which are an integral part of the financial statements.
Notes to Financial Statements
For the period ended December 31, 2018
1. Organization.
Fidelity VIP Investment Grade Central Fund (the Fund) is a fund of Fidelity Garrison Street Trust (the Trust) and is authorized to issue an unlimited number of shares. Shares of the Fund are only offered to other investment companies and accounts managed by Fidelity Management & Research Company (FMR), or its affiliates (the Investing Funds). The Trust is registered under the Investment Company Act of 1940, as amended (the 1940 Act), as an open-end management investment company organized as a Massachusetts business trust.
2. Investments in Fidelity Central Funds.
The Fund invests in Fidelity Central Funds, which are open-end investment companies generally available only to other investment companies and accounts managed by the investment adviser and its affiliates. The Fund's Schedule of Investments lists each of the Fidelity Central Funds held as of period end, if any, as an investment of the Fund, but does not include the underlying holdings of each Fidelity Central Fund. As an Investing Fund, the Fund indirectly bears its proportionate share of the expenses of the underlying Fidelity Central Funds.
The Money Market Central Funds seek preservation of capital and current income and are managed by Fidelity Investments Money Management, Inc. (FIMM), an affiliate of the investment adviser. Annualized expenses of the Money Market Central Funds as of their most recent shareholder report date are less than .005%.
A complete unaudited list of holdings for each Fidelity Central Fund is available upon request or at the Securities and Exchange Commission (the SEC) website at www.sec.gov. In addition, the financial statements of the Fidelity Central Funds, which are not covered by the Fund's Report of Independent Registered Public Accounting Firm, are available on the SEC website or upon request.
3. Significant Accounting Policies.
The Fund is an investment company and applies the accounting and reporting guidance of the Financial Accounting Standards Board (FASB) Accounting Standards Codification Topic 946 Financial Services – Investments Companies. The financial statements have been prepared in conformity with accounting principles generally accepted in the United States of America (GAAP), which require management to make certain estimates and assumptions at the date of the financial statements. Actual results could differ from those estimates. Subsequent events, if any, through the date that the financial statements were issued have been evaluated in the preparation of the financial statements. The following summarizes the significant accounting policies of the Fund:
Investment Valuation. Investments are valued as of 4:00 p.m. Eastern time on the last calendar day of the period. The Board of Trustees (the Board) has delegated the day to day responsibility for the valuation of the Fund's investments to the Fair Value Committee (the Committee) established by the Fund's investment adviser. In accordance with valuation policies and procedures approved by the Board, the Fund attempts to obtain prices from one or more third party pricing vendors or brokers to value its investments. When current market prices, quotations or currency exchange rates are not readily available or reliable, investments will be fair valued in good faith by the Committee, in accordance with procedures adopted by the Board. Factors used in determining fair value vary by investment type and may include market or investment specific events, changes in interest rates and credit quality. The frequency with which these procedures are used cannot be predicted and they may be utilized to a significant extent. The Committee oversees the Fund's valuation policies and procedures and reports to the Board on the Committee's activities and fair value determinations. The Board monitors the appropriateness of the procedures used in valuing the Fund's investments and ratifies the fair value determinations of the Committee.
The Fund categorizes the inputs to valuation techniques used to value its investments into a disclosure hierarchy consisting of three levels as shown below:
- Level 1 – quoted prices in active markets for identical investments
- Level 2 – other significant observable inputs (including quoted prices for similar investments, interest rates, prepayment speeds, etc.)
- Level 3 – unobservable inputs (including the Fund's own assumptions based on the best information available)
Valuation techniques used to value the Fund's investments by major category are as follows:
Debt securities, including restricted securities, are valued based on evaluated prices received from third party pricing vendors or from brokers who make markets in such securities. Corporate bonds, bank notes, municipal securities and U.S. government and government agency obligations are valued by pricing vendors who utilize matrix pricing which considers yield or price of bonds of comparable quality, coupon, maturity and type or by broker-supplied prices. Asset backed securities, collateralized mortgage obligations, commercial mortgage securities and U.S. government agency mortgage securities are valued by pricing vendors who utilize matrix pricing which considers prepayment speed assumptions, attributes of the collateral, yield or price of bonds of comparable quality, coupon, maturity and type or by broker-supplied prices. Brokers which make markets in asset backed securities, collateralized mortgage obligations and commercial mortgage securities may also consider such factors as the structure of the issue, cash flow assumptions, the value of underlying assets as well as any guarantees. Swaps are marked-to-market daily based on valuations from third party pricing vendors, registered derivatives clearing organizations (clearinghouses) or broker-supplied valuations. These pricing sources may utilize inputs such as interest rate curves, credit spread curves, default possibilities and recovery rates. When independent prices are unavailable or unreliable, debt securities and swaps may be valued utilizing pricing methodologies which consider similar factors that would be used by third party pricing vendors. Debt securities and swaps are generally categorized as Level 2 in the hierarchy but may be Level 3 depending on the circumstances.
Investments in open-end mutual funds, including the Fidelity Central Funds, are valued at their closing net asset value (NAV) each business day and are categorized as Level 1 in the hierarchy.
Changes in valuation techniques may result in transfers in or out of an assigned level within the disclosure hierarchy. The aggregate value of investments by input level as of December 31, 2018 is included at the end of the Fund's Schedule of Investments.
Investment Transactions and Income. For financial reporting purposes, the Fund's investment holdings and NAV include trades executed through the end of the last business day of the period. The NAV per share for processing shareholder transactions is calculated as of the close of business of the New York Stock Exchange (NYSE), normally 4:00 p.m. Eastern time and includes trades executed through the end of the prior business day. Gains and losses on securities sold are determined on the basis of identified cost and include proceeds received from litigation. Income and capital gain distributions from Fidelity Central Funds, if any, are recorded on the ex-dividend date. Interest income is accrued as earned and includes coupon interest and amortization of premium and accretion of discount on debt securities as applicable. The principal amount on inflation-indexed securities is periodically adjusted to the rate of inflation and interest is accrued based on the principal amount. The adjustments to principal due to inflation are reflected as increases or decreases to Interest in the accompanying Statement of Operations. Debt obligations may be placed on non-accrual status and related interest income may be reduced by ceasing current accruals and writing off interest receivables when the collection of all or a portion of interest has become doubtful based on consistently applied procedures. A debt obligation is removed from non-accrual status when the issuer resumes interest payments or when collectability of interest is reasonably assured.
Expenses. Expenses directly attributable to a fund are charged to that fund. Expenses attributable to more than one fund are allocated among the respective funds on the basis of relative net assets or other appropriate methods. Expense estimates are accrued in the period to which they relate and adjustments are made when actual amounts are known.
Income Tax Information and Distributions to Shareholders. Each year, the Fund intends to qualify as a regulated investment company under Subchapter M of the Internal Revenue Code, including distributing substantially all of its taxable income and realized gains. As a result, no provision for U.S. Federal income taxes is required. As of December 31, 2018, the Fund did not have any unrecognized tax benefits in the financial statements; nor is the Fund aware of any tax positions for which it is reasonably possible that the total amounts of unrecognized tax benefits will significantly change in the next twelve months. The Fund files a U.S. federal tax return, in addition to state and local tax returns as required. The Fund's federal income tax returns are subject to examination by the Internal Revenue Service (IRS) for a period of three fiscal years after they are filed. State and local tax returns may be subject to examination for an additional fiscal year depending on the jurisdiction.
Distributions are declared and recorded daily and paid monthly from net investment income. Distributions from realized gains, if any, are declared and recorded on the ex-dividend date. Income and capital gain distributions are determined in accordance with income tax regulations, which may differ from GAAP.
Capital accounts within the financial statements are adjusted for permanent book-tax differences. These adjustments have no impact on net assets or the results of operations. Capital accounts are not adjusted for temporary book-tax differences which will reverse in a subsequent period.
Book-tax differences are primarily due to swaps, market discount, capital loss carryforwards and losses deferred due to wash sales and excise tax regulations.
As of period end, the cost and unrealized appreciation (depreciation) in securities, and derivatives if applicable, for federal income tax purposes were as follows:
| Gross unrealized appreciation | $39,862,923 |
| Gross unrealized depreciation | (129,640,572) |
| Net unrealized appreciation (depreciation) | $(89,777,649) |
| Tax Cost | $5,591,149,094 |
The tax-based components of distributable earnings as of period end were as follows:
| Undistributed ordinary income | $10,375,104 |
| Capital loss carryforward | $(29,984,912) |
| Net unrealized appreciation (depreciation) on securities and other investments | $(89,777,649) |
Capital loss carryforwards are only available to offset future capital gains of the Fund to the extent provided by regulations and may be limited. Under the Regulated Investment Company Modernization Act of 2010 (the Act), the Fund is permitted to carry forward capital losses incurred in taxable years beginning after December 22, 2010 for an unlimited period and such capital losses are required to be used prior to any losses that expire. The capital loss carryforward information presented below, including any applicable limitation, is estimated as of fiscal period end and is subject to adjustment.
| No expiration | |
| Short-term | $(18,649,430) |
| Long-term | (11,335,482) |
| Total capital loss carryforward | $(29,984,912) |
The Fund intends to elect to defer to its next fiscal year $9,950,770 of capital losses recognized during the period November 1, 2018 to December 31, 2018.
The tax character of distributions paid was as follows:
| | December 31, 2018 | December 31, 2017 |
| Ordinary Income | $154,089,100 | $ 150,350,808 |
| Long-term Capital Gains | – | 24,485,599 |
| Total | $154,089,100 | $ 174,836,407 |
Delayed Delivery Transactions and When-Issued Securities. During the period, the Fund transacted in securities on a delayed delivery or when-issued basis. Payment and delivery may take place after the customary settlement period for that security. The price of the underlying securities and the date when the securities will be delivered and paid for are fixed at the time the transaction is negotiated. The securities purchased on a delayed delivery or when-issued basis are identified as such in the Fund's Schedule of Investments. The Fund may receive compensation for interest forgone in the purchase of a delayed delivery or when-issued security. With respect to purchase commitments, the Fund identifies securities as segregated in its records with a value at least equal to the amount of the commitment. Losses may arise due to changes in the value of the underlying securities or if the counterparty does not perform under the contract's terms, or if the issuer does not issue the securities due to political, economic, or other factors.
To-Be-Announced (TBA) Securities and Mortgage Dollar Rolls. During the period, the Fund transacted in TBA securities that involved buying or selling mortgage-backed securities (MBS) on a forward commitment basis. A TBA transaction typically does not designate the actual security to be delivered and only includes an approximate principal amount; however delivered securities must meet specified terms defined by industry guidelines, including issuer, rate and current principal amount outstanding on underlying mortgage pools. The Fund may enter into a TBA transaction with the intent to take possession of or deliver the underlying MBS, or the Fund may elect to extend the settlement by entering into either a mortgage or reverse mortgage dollar roll. Mortgage dollar rolls are transactions where a fund sells TBA securities and simultaneously agrees to repurchase MBS on a later date at a lower price and with the same counterparty. Reverse mortgage dollar rolls involve the purchase and simultaneous agreement to sell TBA securities on a later date at a lower price. Transactions in mortgage dollar rolls and reverse mortgage dollar rolls are accounted for as purchases and sales and may result in an increase to the Fund's portfolio turnover rate.
Purchases and sales of TBA securities involve risks similar to those discussed above for delayed delivery and when-issued securities. Also, if the counterparty in a mortgage dollar roll or a reverse mortgage dollar roll transaction files for bankruptcy or becomes insolvent, the Fund's right to repurchase or sell securities may be limited. Additionally, when a fund sells TBA securities without already owning or having the right to obtain the deliverable securities (an uncovered forward commitment to sell), it incurs a risk of loss because it could have to purchase the securities at a price that is higher than the price at which it sold them. A fund may be unable to purchase the deliverable securities if the corresponding market is illiquid.
TBA securities subject to a forward commitment to sell at period end are included at the end of the Fund's Schedule of Investments under the caption "TBA Sale Commitments." The proceeds and value of these commitments are reflected in the Fund's Statement of Assets and Liabilities as Receivable for TBA sale commitments and TBA sale commitments, at value, respectively.
Restricted Securities. The Fund may invest in securities that are subject to legal or contractual restrictions on resale. These securities generally may be resold in transactions exempt from registration or to the public if the securities are registered. Disposal of these securities may involve time-consuming negotiations and expense, and prompt sale at an acceptable price may be difficult. Information regarding restricted securities is included at the end of the Fund's Schedule of Investments.
New Rule Issuance. During August 2018, the U.S. Securities and Exchange Commission issued Final Rule Release No. 33-10532, Disclosure Update and Simplification. This Final Rule includes amendments specific to registered investment companies that are intended to eliminate overlap in disclosure requirements between Regulation S-X and GAAP. In accordance with these amendments, certain line-items in the Fund's financial statements have been combined or removed for the current period as outlined in the table below.
| Financial Statement | Current Line-Item Presentation | Prior Line-Item Presentation |
| Statement of Assets and Liabilities | Total distributable earnings (loss) | Undistributed/Distributions in excess of/Accumulated net investment income (loss)
Accumulated/Undistributed net realized gain (loss)
Net unrealized appreciation (depreciation) |
| Statement of Changes in Net Assets | N/A - removed | Undistributed/Distributions in excess of/Accumulated net investment income (loss) end of period |
| Statement of Changes in Net Assets | Distributions to shareholders | Distributions to shareholders from net investment income
Distributions to shareholders from net realized gain |
4. Derivative Instruments.
Risk Exposures and the Use of Derivative Instruments. The Fund's investment objective allows the Fund to enter into various types of derivative contracts, including swaps. Derivatives are investments whose value is primarily derived from underlying assets, indices or reference rates and may be transacted on an exchange or over-the-counter (OTC). Derivatives may involve a future commitment to buy or sell a specified asset based on specified terms, to exchange future cash flows at periodic intervals based on a notional principal amount, or for one party to make one or more payments upon the occurrence of specified events in exchange for periodic payments from the other party.
The Fund used derivatives to increase returns, to gain exposure to certain types of assets and to manage exposure to certain risks as defined below. The success of any strategy involving derivatives depends on analysis of numerous economic factors, and if the strategies for investment do not work as intended, the Fund may not achieve its objectives.
The Fund's use of derivatives increased or decreased its exposure to the following risk:
| Credit Risk | Credit risk relates to the ability of the issuer of a financial instrument to make further principal or interest payments on an obligation or commitment that it has to the Fund.
|
The Fund is also exposed to additional risks from investing in derivatives, such as liquidity risk and counterparty credit risk. Liquidity risk is the risk that the Fund will be unable to close out the derivative in the open market in a timely manner. Counterparty credit risk is the risk that the counterparty will not be able to fulfill its obligation to the Fund. Derivative counterparty credit risk is managed through formal evaluation of the creditworthiness of all potential counterparties. On certain OTC derivatives such as bi-lateral swaps, the Fund attempts to reduce its exposure to counterparty credit risk by entering into an International Swaps and Derivatives Association, Inc. (ISDA) Master Agreement with each of its counterparties. The ISDA Master Agreement gives the Fund the right to terminate all transactions traded under such agreement upon the deterioration in the credit quality of the counterparty beyond specified levels. The ISDA Master Agreement gives each party the right, upon an event of default by the other party or a termination of the agreement, to close out all transactions traded under such agreement and to net amounts owed under each transaction to one net payable by one party to the other. To mitigate counterparty credit risk on bi-lateral OTC derivatives, the Fund receives collateral in the form of cash or securities once the Fund's net unrealized appreciation on outstanding derivative contracts under an ISDA Master Agreement exceeds certain applicable thresholds, subject to certain minimum transfer provisions. The collateral received is held in segregated accounts with the Fund's custodian bank in accordance with the collateral agreements entered into between the Fund, the counterparty and the Fund's custodian bank. The Fund could experience delays and costs in gaining access to the collateral even though it is held by the Fund's custodian bank. The Fund's maximum risk of loss from counterparty credit risk related to bi-lateral OTC derivatives is generally the aggregate unrealized appreciation and unpaid counterparty payments in excess of any collateral pledged by the counterparty to the Fund. The Fund may be required to pledge collateral for the benefit of the counterparties on bi-lateral OTC derivatives in an amount not less than each counterparty's unrealized appreciation on outstanding derivative contracts, subject to certain minimum transfer provisions, and any such pledged collateral is identified in the Schedule of Investments.
Investing in derivatives may involve greater risks than investing in the underlying assets directly and, to varying degrees, may involve risk of loss in excess of any initial investment and collateral received and amounts recognized in the Statement of Assets and Liabilities. In addition, there may be the risk that the change in value of the derivative contract does not correspond to the change in value of the underlying instrument.
Swaps. A swap is a contract between two parties to exchange future cash flows at periodic intervals based on a notional principal amount. A bi-lateral OTC swap is a transaction between a fund and a dealer counterparty where cash flows are exchanged between the two parties for the life of the swap.
Bi-lateral OTC swaps are marked-to-market daily and changes in value are reflected in the Statement of Assets and Liabilities in the bi-lateral OTC swaps at value line items. Any upfront premiums paid or received upon entering a bi-lateral OTC swap to compensate for differences between stated terms of the swap and prevailing market conditions (e.g. credit spreads, interest rates or other factors) are recorded in net unrealized appreciation (depreciation) in the Statement of Assets and Liabilities and amortized to realized gain or (loss) ratably over the term of the swap. Any unamortized upfront premiums are presented in the Schedule of Investments.
Payments are exchanged at specified intervals, accrued daily commencing with the effective date of the contract and recorded as realized gain or (loss). Some swaps may be terminated prior to the effective date and realize a gain or loss upon termination. The net realized gain (loss) and change in net unrealized appreciation (depreciation) on swaps during the period is presented in the Statement of Operations.
Any open swaps at period end are included in the Schedule of Investments under the caption "Swaps" and are representative of volume of activity during the period.
Credit Default Swaps. Credit default swaps enable the Fund to buy or sell protection against specified credit events on a single-name issuer or a traded credit index. Under the terms of a credit default swap the buyer of protection (buyer) receives credit protection in exchange for making periodic payments to the seller of protection (seller) based on a fixed percentage applied to a notional principal amount. In return for these payments, the seller will be required to make a payment upon the occurrence of one or more specified credit events. The Fund enters into credit default swaps as a seller to gain credit exposure to an issuer and/or as a buyer to obtain a measure of protection against defaults of an issuer. Periodic payments are made over the life of the contract by the buyer provided that no credit event occurs.
For credit default swaps on most corporate and sovereign issuers, credit events include bankruptcy, failure to pay or repudiation/moratorium. For credit default swaps on corporate or sovereign issuers, the obligation that may be put to the seller is not limited to the specific reference obligation described in the Schedule of Investments. For credit default swaps on asset-backed securities, a credit event may be triggered by events such as failure to pay principal, maturity extension, rating downgrade or write-down. For credit default swaps on asset-backed securities, the reference obligation described represents the security that may be put to the seller. For credit default swaps on a traded credit index, a specified credit event may affect all or individual underlying securities included in the index.
As a seller, if an underlying credit event occurs, the Fund will pay a net settlement amount of cash equal to the notional amount of the swap less the recovery value of the reference obligation or underlying securities comprising an index. Only in the event of the industry's inability to value the underlying asset will the Fund be required to take delivery of the reference obligation or underlying securities comprising an index and pay an amount equal to the notional amount of the swap.
As a buyer, if an underlying credit event occurs, the Fund will receive a net settlement amount of cash equal to the notional amount of the swap less the recovery value of the reference obligation or underlying securities comprising an index. Only in the event of the industry's inability to value the underlying asset will the Fund be required to deliver the reference obligation or underlying securities comprising an index in exchange for payment of an amount equal to the notional amount of the swap.
Typically, the value of each credit default swap and credit rating disclosed for each reference obligation in the Schedule of Investments, where the Fund is the seller, can be used as measures of the current payment/performance risk of the swap. As the value of the swap changes as a positive or negative percentage of the total notional amount, the payment/performance risk may decrease or increase, respectively. In addition to these measures, the investment adviser monitors a variety of factors including cash flow assumptions, market activity and market sentiment as part of its ongoing process of assessing payment/performance risk.
5. Purchases and Sales of Investments.
Purchases and sales of securities, other than short-term securities and U.S. government securities, aggregated $479,253,742 and $375,836,915, respectively.
6. Fees and Other Transactions with Affiliates.
Management Fee and Expense Contract. Fidelity Investments Money Management, Inc. (the investment adviser), an affiliate of FMR, provides the Fund with investment management services. The Fund does not pay any fees for these services. Pursuant to the Fund's management contract with the investment adviser, FMR pays the investment adviser a portion of the management fees it receives from the Investing Funds. In addition, under an expense contract, FMR also pays all other expenses of the Fund, excluding custody fees, the compensation of the independent Trustees, and certain miscellaneous expenses such as proxy and shareholder meeting expenses.
Interfund Trades. The Fund may purchase from or sell securities to other Fidelity Funds under procedures adopted by the Board. The procedures have been designed to ensure these interfund trades are executed in accordance with Rule 17a-7 of the 1940 Act. Interfund trades are included within the respective purchases and sales amounts shown in the Purchases and Sales of Investments note.
7. Security Lending.
The Fund lends portfolio securities from time to time in order to earn additional income. On the settlement date of the loan, the Fund receives collateral (in the form of U.S. Treasury obligations, letters of credit and/or cash) against the loaned securities and maintains collateral in an amount not less than 100% of the market value of the loaned securities during the period of the loan. The market value of the loaned securities is determined at the close of business of the Fund and any additional required collateral is delivered to the Fund on the next business day. The Fund or borrower may terminate the loan at any time, and if the borrower defaults on its obligation to return the securities loaned because of insolvency or other reasons, the Fund may apply collateral received from the borrower against the obligation. The Fund may experience delays and costs in recovering the securities loaned. Any cash collateral received is maintained at the Fund's custodian and/or invested in cash equivalents. At period end, there were no security loans outstanding. Security lending income represents the income earned on investing cash collateral, less rebates paid to borrowers, plus any premium payments received for lending certain types of securities. Security lending income is presented in the Statement of Operations as a component of interest income. Total security lending income during the period amounted to $2,245.
8. Expense Reductions.
Through arrangements with the Fund's custodian, credits realized as a result of certain uninvested cash balances were used to reduce the Fund's expenses. During the period, these credits reduced the Fund's custody expenses by $11,340.
9. Other.
The Fund's organizational documents provide former and current trustees and officers with a limited indemnification against liabilities arising in connection with the performance of their duties to the Fund. In the normal course of business, the Fund may also enter into contracts that provide general indemnifications. The Fund's maximum exposure under these arrangements is unknown as this would be dependent on future claims that may be made against the Fund. The risk of material loss from such claims is considered remote.
At the end of the period, mutual funds managed by FMR or its affiliates were the owners of record of all of the outstanding shares of the Fund according to the following schedule.
| Fund | Ownership % |
| VIP Asset Manager Portfolio | 6.2% |
| VIP Asset Manager: Growth Portfolio | 0.6% |
| VIP Balanced Portfolio | 23.7% |
| VIP Investment Grade Bond Portfolio | 69.5% |
10. Credit Risk.
The Fund invests a portion of its assets in structured securities of issuers backed by commercial and residential mortgage loans, credit card receivables and automotive loans. The value and related income of these securities is sensitive to changes in economic conditions, including delinquencies and/or defaults.
Fidelity® VIP Investment Grade Central Fund
Report of Independent Registered Public Accounting Firm
To the Trustees of Fidelity Garrison Street Trust and Shareholders of Fidelity® VIP Investment Grade Central Fund:
Opinion on the Financial Statements and Financial Highlights
We have audited the accompanying statement of assets and liabilities of Fidelity® VIP Investment Grade Central Fund (the "Fund"), a fund of Fidelity Garrison Street Trust, including the schedule of investments, as of December 31, 2018, and the related statement of operations for the year then ended, the statement of changes in net assets for each of the two years in the period then ended, the financial highlights for each of the five years in the period then ended, and the related notes. In our opinion, the financial statements and financial highlights present fairly, in all material respects, the financial position of the Fund as of December 31, 2018, and the results of its operations for the year then ended, the changes in its net assets for each of the two years in the period then ended, and the financial highlights for each of the five years in the period then ended, in conformity with accounting principles generally accepted in the United States of America.
Basis for Opinion
These financial statements and financial highlights are the responsibility of the Fund's management. Our responsibility is to express an opinion on the Fund's financial statements and financial highlights based on our audits. We are a public accounting firm registered with the Public Company Accounting Oversight Board (United States) (PCAOB) and are required to be independent with respect to the Fund in accordance with the U.S. federal securities laws and the applicable rules and regulations of the Securities and Exchange Commission and the PCAOB.
We conducted our audits in accordance with the standards of the PCAOB. Those standards require that we plan and perform the audit to obtain reasonable assurance about whether the financial statements and financial highlights are free of material misstatement, whether due to error or fraud. The Fund is not required to have, nor were we engaged to perform, an audit of its internal control over financial reporting. As part of our audits we are required to obtain an understanding of internal control over financial reporting but not for the purpose of expressing an opinion on the effectiveness of the Fund's internal control over financial reporting. Accordingly, we express no such opinion.
Our audits included performing procedures to assess the risks of material misstatement of the financial statements and financial highlights, whether due to error or fraud, and performing procedures that respond to those risks. Such procedures included examining, on a test basis, evidence regarding the amounts and disclosures in the financial statements and financial highlights. Our audits also included evaluating the accounting principles used and significant estimates made by management, as well as evaluating the overall presentation of the financial statements and financial highlights. Our procedures included confirmation of securities owned as of December 31, 2018, by correspondence with the custodians and brokers; when replies were not received from brokers, we performed other auditing procedures. We believe that our audits provide a reasonable basis for our opinion.
/s/ Deloitte & Touche LLP
Boston, Massachusetts
February 19, 2019
We have served as the auditor of one or more of the Fidelity investment companies since 1999.
Fidelity® VIP Investment Grade Central Fund
Trustees and Officers
The Trustees, Members of the Advisory Board (if any), and officers of the trust and fund, as applicable, are listed below. The Board of Trustees governs the fund and is responsible for protecting the interests of shareholders. The Trustees are experienced executives who meet periodically throughout the year to oversee the fund's activities, review contractual arrangements with companies that provide services to the fund, oversee management of the risks associated with such activities and contractual arrangements, and review the fund's performance. Each of the Trustees oversees 260 funds.
The Trustees hold office without limit in time except that (a) any Trustee may resign; (b) any Trustee may be removed by written instrument, signed by at least two-thirds of the number of Trustees prior to such removal; (c) any Trustee who requests to be retired or who has become incapacitated by illness or injury may be retired by written instrument signed by a majority of the other Trustees; and (d) any Trustee may be removed at any special meeting of shareholders by a two-thirds vote of the outstanding voting securities of the trust. Each Trustee who is not an interested person (as defined in the 1940 Act) of the trust and the fund is referred to herein as an Independent Trustee. Each Independent Trustee shall retire not later than the last day of the calendar year in which his or her 75th birthday occurs. The Independent Trustees may waive this mandatory retirement age policy with respect to individual Trustees. Officers and Advisory Board Members hold office without limit in time, except that any officer or Advisory Board Member may resign or may be removed by a vote of a majority of the Trustees at any regular meeting or any special meeting of the Trustees. Except as indicated, each individual has held the office shown or other offices in the same company for the past five years.
The fund’s Statement of Additional Information (SAI) includes more information about the Trustees. To request a free copy, call Fidelity at 1-800-544,8544.
Experience, Skills, Attributes, and Qualifications of the Trustees. The Governance and Nominating Committee has adopted a statement of policy that describes the experience, qualifications, attributes, and skills that are necessary and desirable for potential Independent Trustee candidates (Statement of Policy). The Board believes that each Trustee satisfied at the time he or she was initially elected or appointed a Trustee, and continues to satisfy, the standards contemplated by the Statement of Policy. The Governance and Nominating Committee also engages professional search firms to help identify potential Independent Trustee candidates who have the experience, qualifications, attributes, and skills consistent with the Statement of Policy. From time to time, additional criteria based on the composition and skills of the current Independent Trustees, as well as experience or skills that may be appropriate in light of future changes to board composition, business conditions, and regulatory or other developments, have also been considered by the professional search firms and the Governance and Nominating Committee. In addition, the Board takes into account the Trustees' commitment and participation in Board and committee meetings, as well as their leadership of standing and ad hoc committees throughout their tenure.
In determining that a particular Trustee was and continues to be qualified to serve as a Trustee, the Board has considered a variety of criteria, none of which, in isolation, was controlling. The Board believes that, collectively, the Trustees have balanced and diverse experience, qualifications, attributes, and skills, which allow the Board to operate effectively in governing the fund and protecting the interests of shareholders. Information about the specific experience, skills, attributes, and qualifications of each Trustee, which in each case led to the Board's conclusion that the Trustee should serve (or continue to serve) as a trustee of the fund, is provided below.
Board Structure and Oversight Function. Abigail P. Johnson is an interested person and currently serves as Chairman. The Trustees have determined that an interested Chairman is appropriate and benefits shareholders because an interested Chairman has a personal and professional stake in the quality and continuity of services provided to the fund. Independent Trustees exercise their informed business judgment to appoint an individual of their choosing to serve as Chairman, regardless of whether the Trustee happens to be independent or a member of management. The Independent Trustees have determined that they can act independently and effectively without having an Independent Trustee serve as Chairman and that a key structural component for assuring that they are in a position to do so is for the Independent Trustees to constitute a substantial majority for the Board. The Independent Trustees also regularly meet in executive session. Arthur E. Johnson serves as Chairman of the Independent Trustees and as such (i) acts as a liaison between the Independent Trustees and management with respect to matters important to the Independent Trustees and (ii) with management prepares agendas for Board meetings.
Fidelity® funds are overseen by different Boards of Trustees. The fund's Board oversees Fidelity's investment-grade bond, money market, asset allocation and certain equity funds, and other Boards oversee Fidelity's high income and other equity funds. The asset allocation funds may invest in Fidelity® funds that are overseen by such other Boards. The use of separate Boards, each with its own committee structure, allows the Trustees of each group of Fidelity® funds to focus on the unique issues of the funds they oversee, including common research, investment, and operational issues. On occasion, the separate Boards establish joint committees to address issues of overlapping consequences for the Fidelity® funds overseen by each Board.
The Trustees operate using a system of committees to facilitate the timely and efficient consideration of all matters of importance to the Trustees, the fund, and fund shareholders and to facilitate compliance with legal and regulatory requirements and oversight of the fund's activities and associated risks. The Board, acting through its committees, has charged FMR and its affiliates with (i) identifying events or circumstances the occurrence of which could have demonstrably adverse effects on the fund's business and/or reputation; (ii) implementing processes and controls to lessen the possibility that such events or circumstances occur or to mitigate the effects of such events or circumstances if they do occur; and (iii) creating and maintaining a system designed to evaluate continuously business and market conditions in order to facilitate the identification and implementation processes described in (i) and (ii) above. Because the day-to-day operations and activities of the fund are carried out by or through FMR, its affiliates, and other service providers, the fund's exposure to risks is mitigated but not eliminated by the processes overseen by the Trustees. While each of the Board's committees has responsibility for overseeing different aspects of the fund's activities, oversight is exercised primarily through the Operations and Audit Committees. In addition, an ad hoc Board committee of Independent Trustees has worked with FMR to enhance the Board's oversight of investment and financial risks, legal and regulatory risks, technology risks, and operational risks, including the development of additional risk reporting to the Board. Appropriate personnel, including but not limited to the fund's Chief Compliance Officer (CCO), FMR's internal auditor, the independent accountants, the fund's Treasurer and portfolio management personnel, make periodic reports to the Board's committees, as appropriate, including an annual review of Fidelity's risk management program for the Fidelity® funds. The responsibilities of each standing committee, including their oversight responsibilities, are described further under "Standing Committees of the Trustees."
Interested Trustees*:
Correspondence intended for a Trustee who is an interested person may be sent to Fidelity Investments, 245 Summer Street, Boston, Massachusetts 02210.
Name, Year of Birth; Principal Occupations and Other Relevant Experience+
Abigail P. Johnson (1961)
Year of Election or Appointment: 2009
Trustee
Chairman of the Board of Trustees
Ms. Johnson also serves as Trustee of other Fidelity® funds. Ms. Johnson serves as Chairman (2016-present), Chief Executive Officer (2014-present), and Director (2007-present) of FMR LLC (diversified financial services company), President of Fidelity Financial Services (2012-present) and President of Personal, Workplace and Institutional Services (2005-present). Ms. Johnson is Chairman and Director of FMR Co., Inc. (investment adviser firm, 2011-present) and Chairman and Director of FMR (investment adviser firm, 2011-present). Previously, Ms. Johnson served as Vice Chairman (2007-2016) and President (2013-2016) of FMR LLC, President and a Director of FMR (2001-2005), a Trustee of other investment companies advised by FMR, Fidelity Investments Money Management, Inc. (investment adviser firm), and FMR Co., Inc. (2001-2005), Senior Vice President of the Fidelity® funds (2001-2005), and managed a number of Fidelity® funds. Ms. Abigail P. Johnson and Mr. Arthur E. Johnson are not related.
Jennifer Toolin McAuliffe (1959)
Year of Election or Appointment: 2016
Trustee
Ms. McAuliffe also serves as Trustee of other Fidelity® funds. Ms. McAuliffe previously served as a Member of the Advisory Board of certain Fidelity® funds (2016) and as Co-Head of Fixed Income of Fidelity Investments Limited (now known as FIL Limited (FIL)) (diversified financial services company). Earlier roles at FIL included Director of Research for FIL’s credit and quantitative teams in London, Hong Kong and Tokyo. Ms. McAuliffe also was the Director of Research for taxable and municipal bonds at Fidelity Investments Money Management, Inc. Ms. McAuliffe is also a director or trustee of several not-for-profit entities.
* Determined to be an “Interested Trustee” by virtue of, among other things, his or her affiliation with the trust or various entities under common control with FMR.
+ The information includes the Trustee's principal occupation during the last five years and other information relating to the experience, attributes, and skills relevant to the Trustee's qualifications to serve as a Trustee, which led to the conclusion that the Trustee should serve as a Trustee for the fund.
Independent Trustees:
Correspondence intended for an Independent Trustee may be sent to Fidelity Investments, P.O. Box 55235, Boston, Massachusetts 02205-5235.
Name, Year of Birth; Principal Occupations and Other Relevant Experience+
Elizabeth S. Acton (1951)
Year of Election or Appointment: 2013
Trustee
Ms. Acton also serves as Trustee of other Fidelity® funds. Prior to her retirement in April 2012, Ms. Acton was Executive Vice President, Finance (2011-2012), Executive Vice President, Chief Financial Officer (2002-2011), and Treasurer (2004-2005) of Comerica Incorporated (financial services). Prior to joining Comerica, Ms. Acton held a variety of positions at Ford Motor Company (1983-2002), including Vice President and Treasurer (2000-2002) and Executive Vice President and Chief Financial Officer of Ford Motor Credit Company (1998-2000). Ms. Acton currently serves as a member of the Board of Directors and Audit and Finance Committees of Beazer Homes USA, Inc. (homebuilding, 2012-present). Previously, Ms. Acton served as a Member of the Advisory Board of certain Fidelity® funds (2013-2016).
Ann E. Dunwoody (1953)
Year of Election or Appointment: 2018
Trustee
General Dunwoody also serves as Trustee of other Fidelity® funds. General Dunwoody (United States Army, Retired) was the first woman in U.S. military history to achieve the rank of four-star general and prior to her retirement in 2012 held a variety of positions within the U.S. Army, including Commanding General, U.S. Army Material Command (2008-2012). She is the President of First to Four LLC (leadership and mentoring services, 2012-present). She also serves as a member of the Board of Directors and Nominating and Corporate Governance Committee of L3 Technologies, Inc. (communication, electronic, sensor, and aerospace systems, 2013-present), Board of Directors and Nomination and Corporate Governance Committees of Kforce Inc. (professional staffing services, 2016-present) and Board of Directors of Automattic Inc. (software engineering, 2018-present). Previously, General Dunwoody served as a Member of the Advisory Board of certain Fidelity® funds (2018), a member of the Board of Directors and Audit and Sustainability and Corporate Responsibility Committees of Republic Services, Inc. (waste collection, disposal and recycling, 2013-2016). Ms. Dunwoody also serves on several boards for non-profit organizations, including as a member of the Board of Directors, Chair of the Nomination and Governance Committee and member of the Audit Committee of Logistics Management Institute (consulting non-profit, 2012-present), a member of the Board of Directors of the Army Historical Foundation (2015-present), a member of the Council of Trustees for the Association of the United States Army (advocacy non-profit, 2013-present) and a member of the Board of Trustees of Florida Institute of Technology (2015-present) and ThanksUSA (military family education non-profit, 2014-present).
John Engler (1948)
Year of Election or Appointment: 2014
Trustee
Mr. Engler also serves as Trustee of other Fidelity® funds. He serves on the board of directors for Universal Forest Products (manufacturer and distributor of wood and wood-alternative products, 2003-present) and K12 Inc. (technology-based education company, 2012-present). Previously, Mr. Engler served as interim president of Michigan State University (2018-2019), a Member of the Advisory Board of certain Fidelity® funds (2014-2016), president of the Business Roundtable (2011-2017), a trustee of The Munder Funds (2003-2014), president and CEO of the National Association of Manufacturers (2004-2011), member of the Board of Trustees of the Annie E. Casey Foundation (2004-2015), and as governor of Michigan (1991-2003). He is a past chairman of the National Governors Association.
Robert F. Gartland (1951)
Year of Election or Appointment: 2010
Trustee
Mr. Gartland also serves as Trustee of other Fidelity® funds. Mr. Gartland is Chairman and an investor in Gartland & Mellina Group Corp. (consulting, 2009-present). Previously, Mr. Gartland served as a partner and investor of Vietnam Partners LLC (investments and consulting, 2008-2011). Prior to his retirement, Mr. Gartland held a variety of positions at Morgan Stanley (financial services, 1979-2007), including Managing Director (1987-2007), and Chase Manhattan Bank (1975-1978).
Arthur E. Johnson (1947)
Year of Election or Appointment: 2008
Trustee
Chairman of the Independent Trustees
Mr. Johnson also serves as Trustee of other Fidelity® funds. Mr. Johnson serves as a member of the Board of Directors of Eaton Corporation plc (diversified power management, 2009-present) and Booz Allen Hamilton (management consulting, 2011-present). Prior to his retirement, Mr. Johnson served as Senior Vice President of Corporate Strategic Development of Lockheed Martin Corporation (defense contractor, 1999-2009). He previously served on the Board of Directors of IKON Office Solutions, Inc. (1999-2008), AGL Resources, Inc. (holding company, 2002-2016), and Delta Airlines (2005-2007). Mr. Arthur E. Johnson is not related to Ms. Abigail P. Johnson.
Michael E. Kenneally (1954)
Year of Election or Appointment: 2009
Trustee
Vice Chairman of the Independent Trustees
Mr. Kenneally also serves as Trustee of other Fidelity® funds. Prior to his retirement, Mr. Kenneally served as Chairman and Global Chief Executive Officer of Credit Suisse Asset Management. Before joining Credit Suisse, he was an Executive Vice President and Chief Investment Officer for Bank of America Corporation. Earlier roles at Bank of America included Director of Research, Senior Portfolio Manager and Research Analyst, and Mr. Kenneally was awarded the Chartered Financial Analyst (CFA) designation in 1991.
Marie L. Knowles (1946)
Year of Election or Appointment: 2001
Trustee
Ms. Knowles also serves as Trustee of other Fidelity® funds. Prior to Ms. Knowles' retirement in June 2000, she served as Executive Vice President and Chief Financial Officer of Atlantic Richfield Company (ARCO) (diversified energy, 1996-2000). From 1993 to 1996, she was a Senior Vice President of ARCO and President of ARCO Transportation Company (pipeline and tanker operations). Ms. Knowles currently serves as a Director and Chairman of the Audit Committee of McKesson Corporation (healthcare service, since 2002). Ms. Knowles is a member of the Board of the Santa Catalina Island Company (real estate, 2009-present). Ms. Knowles is a Member of the Investment Company Institute Board of Governors and a Member of the Governing Council of the Independent Directors Council (2014-present). She also serves as a member of the Advisory Board for the School of Engineering of the University of Southern California. Previously, Ms. Knowles served as a Director of Phelps Dodge Corporation (copper mining and manufacturing, 1994-2007), URS Corporation (engineering and construction, 2000-2003) and America West (airline, 1999-2002). Ms. Knowles previously served as Chairman (2015-2018) and Vice Chairman (2012-2015) of the Independent Trustees of certain Fidelity® funds.
Mark A. Murray (1954)
Year of Election or Appointment: 2016
Trustee
Mr. Murray also serves as Trustee of other Fidelity® funds. Mr. Murray is Vice Chairman (2013-present) of Meijer, Inc. (regional retail chain). Previously, Mr. Murray served as a Member of the Advisory Board of certain Fidelity® funds (2016) and as Co-Chief Executive Officer (2013-2016) and President (2006-2013) of Meijer, Inc. Mr. Murray serves as a member of the Board of Directors and Nuclear Review and Public Policy and Responsibility Committees of DTE Energy Company (diversified energy company, 2009-present). Mr. Murray also serves as a member of the Board of Directors of Spectrum Health (not-for-profit health system, 2015-present). Mr. Murray previously served as President of Grand Valley State University (2001-2006), Treasurer for the State of Michigan (1999-2001), Vice President of Finance and Administration for Michigan State University (1998-1999), and a member of the Board of Directors and Audit Committee and Chairman of the Nominating and Corporate Governance Committee of Universal Forest Products, Inc. (manufacturer and distributor of wood and wood-alternative products, 2004-2016). Mr. Murray is also a director or trustee of many community and professional organizations.
+ The information includes the Trustee's principal occupation during the last five years and other information relating to the experience, attributes, and skills relevant to the Trustee's qualifications to serve as a Trustee, which led to the conclusion that the Trustee should serve as a Trustee for the fund.
Advisory Board Members and Officers:
Correspondence intended for an officer may be sent to Fidelity Investments, 245 Summer Street, Boston, Massachusetts 02210. Officers appear below in alphabetical order.
Name, Year of Birth; Principal Occupation
Elizabeth Paige Baumann (1968)
Year of Election or Appointment: 2017
Anti-Money Laundering (AML) Officer
Ms. Baumann also serves as AML Officer of other funds. She is Chief AML Officer (2012-present) and Senior Vice President (2014-present) of FMR LLC (diversified financial services company) and is an employee of Fidelity Investments. Previously, Ms. Baumann served as AML Officer of the funds (2012-2016), and Vice President (2007-2014) and Deputy Anti-Money Laundering Officer (2007-2012) of FMR LLC.
Craig S. Brown (1977)
Year of Election or Appointment: 2019
Assistant Treasurer
Mr. Brown also serves as Assistant Treasurer of other funds. Mr. Brown is an employee of Fidelity Investments (2013-present).
John J. Burke III (1964)
Year of Election or Appointment: 2018
Chief Financial Officer
Mr. Burke also serves as Chief Financial Officer of other funds. Mr. Burke serves as Head of Investment Operations for Fidelity Fund and Investment Operations (2018-present) and is an employee of Fidelity Investments (1998-present). Previously Mr. Burke served as head of Asset Management Investment Operations (2012-2018).
William C. Coffey (1969)
Year of Election or Appointment: 2018
Secretary and Chief Legal Officer (CLO)
Mr. Coffey also serves as Secretary and CLO of other funds. Mr. Coffey serves as CLO, Secretary, and Senior Vice President of Fidelity Management & Research Company and FMR Co., Inc. (investment adviser firms, 2018-present); Secretary of Fidelity SelectCo, LLC and Fidelity Investments Money Management, Inc. (investment adviser firms, 2018-present); and CLO of Fidelity Management & Research (Hong Kong) Limited, FMR Investment Management (UK) Limited, and Fidelity Management & Research (Japan) Limited (investment adviser firms, 2018-present). He is Senior Vice President and Deputy General Counsel of FMR LLC (diversified financial services company, 2010-present), and is an employee of Fidelity Investments. Previously, Mr. Coffey served as Assistant Secretary of certain funds (2009-2018) and as Vice President and Associate General Counsel of FMR LLC (2005-2009).
Jonathan Davis (1968)
Year of Election or Appointment: 2010
Assistant Treasurer
Mr. Davis also serves as Assistant Treasurer of other funds. Mr. Davis serves as Assistant Treasurer of FMR Capital, Inc. (2017-present) and is an employee of Fidelity Investments. Previously, Mr. Davis served as Vice President and Associate General Counsel of FMR LLC (diversified financial services company, 2003-2010).
Adrien E. Deberghes (1967)
Year of Election or Appointment: 2010
Assistant Treasurer
Mr. Deberghes also serves as an officer of other funds. He serves as Assistant Treasurer of FMR Capital, Inc. (2017-present), Executive Vice President of Fidelity Investments Money Management, Inc. (FIMM) (investment adviser firm, 2016-present), and is an employee of Fidelity Investments (2008-present). Previously, Mr. Deberghes served as President and Treasurer of certain Fidelity® funds (2013-2018). Prior to joining Fidelity Investments, Mr. Deberghes was Senior Vice President of Mutual Fund Administration at State Street Corporation (2007-2008), Senior Director of Mutual Fund Administration at Investors Bank & Trust (2005-2007), and Director of Finance for Dunkin' Brands (2000-2005). Previously, Mr. Deberghes served in other fund officer roles.
Laura M. Del Prato (1964)
Year of Election or Appointment: 2018
President and Treasurer
Ms. Del Prato also serves as an officer of other funds. Ms. Del Prato is an employee of Fidelity Investments (2017-present). Prior to joining Fidelity Investments, Ms. Del Prato served as a Managing Director and Treasurer of the JPMorgan Mutual Funds (2014-2017). Prior to JPMorgan, Ms. Del Prato served as a partner at Cohen Fund Audit Services (accounting firm, 2012-2013) and KPMG LLP (accounting firm, 2004-2012).
Colm A. Hogan (1973)
Year of Election or Appointment: 2016
Assistant Treasurer
Mr. Hogan also serves as an officer of other funds. Mr. Hogan serves as Assistant Treasurer of FMR Capital, Inc. (2017-present) and is an employee of Fidelity Investments (2005-present). Previously, Mr. Hogan served as Assistant Treasurer of certain Fidelity® funds (2016-2018).
Chris Maher (1972)
Year of Election or Appointment: 2013
Assistant Treasurer
Mr. Maher serves as Assistant Treasurer of other funds. Mr. Maher is Vice President of Valuation Oversight, serves as Assistant Treasurer of FMR Capital, Inc. (2017-present), and is an employee of Fidelity Investments. Previously, Mr. Maher served as Vice President of Asset Management Compliance (2013), Vice President of the Program Management Group of FMR (investment adviser firm, 2010-2013), and Vice President of Valuation Oversight (2008-2010).
John B. McGinty, Jr. (1962)
Year of Election or Appointment: 2016
Chief Compliance Officer
Mr. McGinty also serves as Chief Compliance Officer of other funds. Mr. McGinty is Senior Vice President of Asset Management Compliance for Fidelity Investments and is an employee of Fidelity Investments (2016-present). Mr. McGinty previously served as Vice President, Senior Attorney at Eaton Vance Management (investment management firm, 2015-2016), and prior to Eaton Vance as global CCO for all firm operations and registered investment companies at GMO LLC (investment management firm, 2009-2015). Before joining GMO LLC, Mr. McGinty served as Senior Vice President, Deputy General Counsel for Fidelity Investments (2007-2009).
Jason P. Pogorelec (1975)
Year of Election or Appointment: 2015
Assistant Secretary
Mr. Pogorelec also serves as Assistant Secretary of other funds. Mr. Pogorelec serves as Vice President, Associate General Counsel (2010-present) and is an employee of Fidelity Investments (2006-present).
Nancy D. Prior (1967)
Year of Election or Appointment: 2014
Vice President
Ms. Prior also serves as Vice President of other funds. Ms. Prior serves as President Fixed Income, High Income/Emerging Market Debt and Multi Asset Class Strategies of FIAM LLC (2018-present), President (2016-present) and Director (2014-present) of Fidelity Investments Money Management, Inc. (FIMM) (investment adviser firm), President, Fixed Income (2014-present), and is an employee of Fidelity Investments (2002-present). Previously, Ms. Prior served as Vice Chairman of FIAM LLC (investment adviser firm, 2014-2018), a Director of FMR Investment Management (UK) Limited (investment adviser firm, 2015-2018), President Multi-Asset Class Strategies of FMR's Global Asset Allocation Division (2017-2018), Vice President of Fidelity's Money Market Funds (2012-2014), President, Money Market and Short Duration Bond Group of Fidelity Management & Research (FMR) (investment adviser firm, 2013-2014), President, Money Market Group of FMR (2011-2013), Managing Director of Research (2009-2011), Senior Vice President and Deputy General Counsel (2007-2009), and Assistant Secretary of certain Fidelity® funds (2008-2009).
Stacie M. Smith (1974)
Year of Election or Appointment: 2013
Assistant Treasurer
Ms. Smith also serves as an officer of other funds. Ms. Smith serves as Assistant Treasurer of FMR Capital, Inc. (2017-present), is an employee of Fidelity Investments (2009-present), and has served in other fund officer roles. Prior to joining Fidelity Investments, Ms. Smith served as Senior Audit Manager of Ernst & Young LLP (accounting firm, 1996-2009). Previously, Ms. Smith served as Assistant Treasurer (2013-2018) and Deputy Treasurer (2013-2016) of certain Fidelity® funds.
Marc L. Spector (1972)
Year of Election or Appointment: 2016
Deputy Treasurer
Mr. Spector also serves as an officer of other funds. Mr. Spector serves as Assistant Treasurer of FMR Capital, Inc. (2017-present) and is an employee of Fidelity Investments (2016-present). Prior to joining Fidelity Investments, Mr. Spector served as Director at the Siegfried Group (accounting firm, 2013-2016), and prior to Siegfried Group as audit senior manager at Deloitte & Touche (accounting firm, 2005-2013).
Jim Wegmann (1979)
Year of Election or Appointment: 2019
Assistant Treasurer
Mr. Wegmann also serves as Assistant Treasurer of other funds. Mr. Wegmann is an employee of Fidelity Investments (2011-present).
Fidelity® VIP Investment Grade Central Fund
Shareholder Expense Example
As a shareholder of the Fund, you incur two types of costs: (1) transaction costs and (2) ongoing costs, including other Fund expenses. This Example is intended to help you understand your ongoing costs (in dollars) of investing in the Fund and to compare these costs with the ongoing costs of investing in other mutual funds.
The Example is based on an investment of $1,000 invested at the beginning of the period and held for the entire period (July 1, 2018 to December 31, 2018).
Actual Expenses
The first line of the accompanying table provides information about actual account values and actual expenses. You may use the information in this line, together with the amount you invested, to estimate the expenses that you paid over the period. Simply divide your account value by $1,000.00 (for example, an $8,600 account value divided by $1,000.00 = 8.6), then multiply the result by the number in the first line under the heading entitled "Expenses Paid During Period" to estimate the expenses you paid on your account during this period. In addition, the Fund, as a shareholder in the underlying Fidelity Central Funds, will indirectly bear its pro-rata share of the fees and expenses incurred by the underlying Fidelity Central Funds. These fees and expenses are not included in the Fund's annualized expense ratio used to calculate the expense estimate in the table below.
Hypothetical Example for Comparison Purposes
The second line of the accompanying table provides information about hypothetical account values and hypothetical expenses based on the Fund's actual expense ratio and an assumed rate of return of 5% per year before expenses, which is not the Fund's actual return. The hypothetical account values and expenses may not be used to estimate the actual ending account balance or expenses you paid for the period. You may use this information to compare the ongoing costs of investing in the Fund and other funds. To do so, compare this 5% hypothetical example with the 5% hypothetical examples that appear in the shareholder reports of the other funds. In addition, the Fund, as a shareholder in the underlying Fidelity Central Funds, will indirectly bear its pro-rata share of the fees and expenses incurred by the underlying Fidelity Central Funds. These fees and expenses are not included in the Fund's annualized expense ratio used to calculate the expense estimate in the table below.
Please note that the expenses shown in the table are meant to highlight your ongoing costs only and do not reflect any transaction costs. Therefore, the second line of the table is useful in comparing ongoing costs only, and will not help you determine the relative total costs of owning different funds.
| | Annualized Expense Ratio-A | Beginning
Account Value
July 1, 2018 | Ending
Account Value
December 31, 2018 | Expenses Paid
During Period-B
July 1, 2018
to December 31, 2018 |
| Actual | .0020% | $1,000.00 | $1,012.80 | $.01 |
| Hypothetical-C | | $1,000.00 | $1,025.20 | $.01 |
A Annualized expense ratio reflects expenses net of applicable fee waivers.
B Expenses are equal to the Fund's annualized expense ratio, multiplied by the average account value over the period, multiplied by 184/365 (to reflect the one-half year period).
C 5% return per year before expenses
Board Approval of Investment Advisory Contracts and Management Fees
VIP Investment Grade Central Fund
Each year, the Board of Trustees, including the Independent Trustees (together, the Board), votes on the renewal of the management contract with Fidelity Investments Money Management, Inc. (FIMM) and the sub-advisory agreements (together, the Advisory Contracts) for the fund. FIMM and the sub-advisers are referred to herein as the Investment Advisers. The Board, assisted by the advice of fund counsel and Independent Trustees' counsel, requests and considers a broad range of information relevant to the renewal of the Advisory Contracts throughout the year.
The Board meets regularly and, at each of its meetings, covers an extensive agenda of topics and materials and considers factors that are relevant to its annual consideration of the renewal of the fund's Advisory Contracts, including the services and support provided to the fund and its shareholders. The Board has established four standing committees (Committees) — Operations, Audit, Fair Valuation, and Governance and Nominating — each composed of and chaired by Independent Trustees with varying backgrounds, to which the Board has assigned specific subject matter responsibilities in order to enhance effective decision-making by the Board. The Operations Committee, of which all of the Independent Trustees are members, meets regularly throughout the year and considers, among other matters, information specifically related to the annual consideration of the renewal of the fund's Advisory Contracts. The Board, acting directly and through its Committees, requests and receives information concerning the annual consideration of the renewal of the fund's Advisory Contracts. The Board also meets as needed to review matters specifically related to the Board's annual consideration of the renewal of the Advisory Contracts. Members of the Board may also meet with trustees of other Fidelity funds through joint ad hoc committees to discuss certain matters relevant to all of the Fidelity funds.
At its September 2018 meeting, the Board unanimously determined to renew the fund's Advisory Contracts. In reaching its determination, the Board considered all factors it believed relevant and reached a determination, with the assistance of fund counsel and Independent Trustees' counsel and through the exercise of its business judgment, that the renewal of the Advisory Contracts was in the best interests of the fund and its shareholders and the fact that no fee is payable under the management contract was fair and reasonable.
Nature, Extent, and Quality of Services Provided. The Board considered Fidelity's staffing as it relates to the fund, including the backgrounds of investment personnel of Fidelity, and also considered the fund's investment objective, strategies, and related investment philosophy. The Independent Trustees also had discussions with senior management of Fidelity's investment operations and investment groups. The Board considered the structure of the investment personnel compensation program and whether this structure provides appropriate incentives to act in the best interests of the fund.
Resources Dedicated to Investment Management and Support Services. The Board reviewed the general qualifications and capabilities of Fidelity's investment staff, including its size, education, experience, and resources, as well as Fidelity's approach to recruiting, managing, and compensating investment personnel. The Board noted that Fidelity has continued to increase the resources devoted to non-U.S. offices, including expansion of Fidelity's global investment organization. The Board also noted that Fidelity's analysts have extensive resources, tools and capabilities that allow them to conduct sophisticated quantitative and fundamental analysis, as well as credit analysis of issuers, counterparties and guarantors. Further, the Board considered that Fidelity's investment professionals have sufficient access to global information and data so as to provide competitive investment results over time, and that those professionals also have access to sophisticated tools that permit them to assess portfolio construction and risk and performance attribution characteristics continuously, as well as to transmit new information and research conclusions rapidly around the world. Additionally, in its deliberations, the Board considered Fidelity's trading, risk management, compliance, and technology and operations capabilities and resources, which are integral parts of the investment management process.
Administrative Services. The Board considered (i) the nature, extent, quality, and cost of advisory and administrative services performed by the Investment Advisers and their affiliates under the Advisory Contracts and under separate agreements covering transfer agency, pricing and bookkeeping, and securities lending services for the fund; (ii) the nature and extent of the supervision of third party service providers, principally custodians, subcustodians, and pricing vendors; and (iii) the resources devoted to, and the record of compliance with, the fund's compliance policies and procedures.
Investment Performance. The Board considered whether the fund has operated in accordance with its investment objective, as well as its record of compliance with its investment restrictions. The Board reviewed the fund's absolute investment performance, as well as the fund's relative investment performance. In this regard, the Board noted that the fund is designed to offer a liquid investment option for other Fidelity funds and accounts and ultimately to enhance the performance of those funds and accounts.
Based on its review, the Board concluded that the nature, extent, and quality of services provided to the fund under the Advisory Contracts should continue to benefit the shareholders of the fund.
Competitiveness of Management Fee and Total Expense Ratio. The Board considered that while the fund does not pay a management fee, Fidelity Management & Research Company (FMR) pays FIMM a management fee for providing services to the fund and that FMR receives fees for providing services to funds that invest in the fund. The Board also noted that FMR bears all expenses of the fund with certain limited exceptions (i.e., custody fees, interest, taxes, brokerage commissions, fees and expenses of the Independent Trustees, proxy and shareholder meeting expenses, and extraordinary expenses). Based on its review, the Board concluded that the management fee received for providing services to the fund and the fund's total expense ratio were reasonable in light of the services that the fund and its shareholders receive and the other factors considered.
Costs of the Services and Profitability. The Board considered the level of Fidelity's profits in respect of all the Fidelity funds, as well as the profitability of the funds that invest in the fund.
PricewaterhouseCoopers LLP (PwC), auditor to Fidelity and certain Fidelity funds, has been engaged annually by the Board as part of the Board's assessment of Fidelity's profitability analysis. PwC's engagement includes the review and assessment of the methodologies used by Fidelity in determining the revenues and expenses attributable to Fidelity's mutual fund business, and completion of agreed-upon procedures in respect of the mathematical accuracy of the fund profitability information and its conformity to established allocation methodologies. After considering PwC's reports issued under the engagement and information provided by Fidelity, the Board concluded that while other allocation methods may also be reasonable, Fidelity's profitability methodologies are reasonable in all material respects.
The Board also reviewed Fidelity's non-fund businesses and potential indirect benefits such businesses may have received as a result of their association with Fidelity's mutual fund business (i.e., fall-out benefits) as well as cases where Fidelity's affiliates may benefit from the fund's business. The Board noted that changes to fall-out benefits year-over-year reflect business developments at Fidelity's various businesses.
The Board concluded that the costs of the services provided by and the profits realized by Fidelity in connection with the operation of the fund were not relevant to the renewal of the Advisory Contracts because the fund pays no advisory fees and FMR bears all expenses of the fund with certain limited exceptions.
Economies of Scale. The Board concluded that because the fund pays no advisory fees and FMR bears all expenses of the fund with certain limited exceptions, the realization of economies of scale was not a material factor in the Board's decision to renew the fund's Advisory Contract.
Additional Information Requested by the Board. In order to develop fully the factual basis for consideration of the Fidelity funds' advisory contracts, the Board requested and received additional information on certain topics, including: (i) Fidelity's fund profitability methodology, profitability trends for certain funds, the allocation of various costs to different funds, and the impact of certain factors on fund profitability results; (ii) portfolio manager changes that have occurred during the past year and the amount of the investment that each portfolio manager has made in the Fidelity fund(s) that he or she manages; (iii) Fidelity's compensation structure for portfolio managers, research analysts, and other key personnel, including its effects on fund profitability, the rationale for the compensation structure, and the extent to which current market conditions have affected retention and recruitment; (iv) the arrangements with and compensation paid to certain fund sub-advisers on behalf of the Fidelity funds and the treatment of such compensation within Fidelity's fund profitability methodology; (v) the terms of Fidelity's voluntary expense limitation agreements; (vi) the methodology with respect to competitive fund data and peer group classifications; (vii) Fidelity's transfer agent fee, expense, and service structures for different funds and classes relative to competitive trends, and the impact of the increased use of omnibus accounts; (viii) new developments in the retail and institutional marketplaces and the competitive positioning of the funds relative to other investment products and services; (ix) the impact of recent changes to the money market fund landscape, including the full implementation of money market fund reform and rising interest rates, on Fidelity's money market funds; (x) the funds' share class structures and distribution channels; and (xi) explanations regarding the relative total expense ratios of certain funds and classes, total expense competitive trends and methodologies for total expense competitive comparisons, and actions that might be taken by Fidelity to reduce total expense ratios for certain classes. In addition, the Board considered its discussions with Fidelity throughout the year regarding enhanced information security initiatives and the funds' fair valuation policies.
Based on its evaluation of all of the conclusions noted above, and after considering all factors it believed relevant, the Board concluded that the advisory fee arrangements are fair and reasonable, and that the fund's Advisory Contracts should be renewed.
VIPIGB-ANN-0219
1.540025.121
Fidelity® Variable Insurance Products: Asset Manager Portfolio
Annual Report December 31, 2018 |
|
Beginning on January 1, 2021, as permitted by regulations adopted by the Securities and Exchange Commission, and if your insurance carrier elects to participate, you may not be receiving paper copies of the Fund’s shareholder reports from the insurance company that offers your variable insurance product unless you specifically request paper copies from your financial professional or the administrator of your variable insurance product. Instead, the reports will be made available on a website, and you will be notified by mail each time a report is posted and provided with a website link to access the report.
If you already elected to receive shareholder reports electronically, you will not be affected by this change and you need not take any action. You may elect to receive shareholder reports and other communications from the Fund electronically, by contacting your financial professional or the administrator of your variable insurance product. If you own a Fidelity-administered variable insurance product, please visit fidelity.com/mailpreferences to make your election or call 1-800-343-3548.
You may elect to receive all future reports in paper free of charge. If you wish to continue receiving paper copies of your shareholder reports, you may contact your financial professional or the administrator of your variable insurance product. If you own a Fidelity-administered variable insurance product, please visit fidelity.com/mailpreferences to make your election or call 1-800-343-3548. Your election to receive reports in paper will apply to all funds available under your variable insurance product.
Contents
To view a fund's proxy voting guidelines and proxy voting record for the 12-month period ended June 30, visit http://www.fidelity.com/proxyvotingresults or visit the Securities and Exchange Commission's (SEC) web site at http://www.sec.gov.
You may also call 1-877-208-0098 to request a free copy of the proxy voting guidelines.
Fidelity® Variable Insurance Products are separate account options which are purchased through a variable insurance contract.
Standard & Poor's, S&P and S&P 500 are registered service marks of The McGraw-Hill Companies, Inc. and have been licensed for use by Fidelity Distributors Corporation.
Other third-party marks appearing herein are the property of their respective owners.
All other marks appearing herein are registered or unregistered trademarks or service marks of FMR LLC or an affiliated company. © 2019 FMR LLC. All rights reserved.
This report and the financial statements contained herein are submitted for the general information of the shareholders of the Fund. This report is not authorized for distribution to prospective investors in the Fund unless preceded or accompanied by an effective prospectus.
A fund files its complete schedule of portfolio holdings with the SEC for the first and third quarters of each fiscal year on Form N-Q. Forms N-Q are available on the SEC’s web site at http://www.sec.gov. A fund's Forms N-Q may be reviewed and copied at the SEC’s Public Reference Room in Washington, DC. Information regarding the operation of the SEC's Public Reference Room may be obtained by calling 1-800-SEC-0330.
For a complete list of a fund's portfolio holdings, view the most recent holdings listing, semiannual report, or annual report on Fidelity's web site at http://www.fidelity.com, http://www.institutional.fidelity.com, or http://www.401k.com, as applicable.
NOT FDIC INSURED •MAY LOSE VALUE •NO BANK GUARANTEE
Neither the Fund nor Fidelity Distributors Corporation is a bank.
Performance: The Bottom Line
Average annual total return reflects the change in the value of an investment, assuming reinvestment of distributions from dividend income and capital gains (the profits earned upon the sale of securities that have grown in value, if any) and assuming a constant rate of performance each year. During periods of reimbursement by Fidelity, a fund’s total return will be greater than it would be had the reimbursement not occurred. Performance numbers are net of all underlying fund operating expenses, but do not include any insurance charges imposed by your insurance company’s separate account. If performance information included the effect of these additional charges, the total returns would have been lower. How a fund did yesterday is no guarantee of how it will do tomorrow.
Average Annual Total Returns
| For the periods ended December 31, 2018 | Past 1 year | Past 5 years | Past 10 years |
| Initial Class | (5.35)% | 3.36% | 8.24% |
| Service Class | (5.44)% | 3.25% | 8.12% |
| Service Class 2 | (5.61)% | 3.09% | 7.95% |
| Investor Class | (5.39)% | 3.28% | 8.15% |
$10,000 Over 10 Years
Let's say hypothetically that $10,000 was invested in VIP Asset Manager Portfolio - Initial Class on December 31, 2008.
The chart shows how the value of your investment would have changed, and also shows how the S&P 500® Index performed over the same period.

| Period Ending Values |
| $22,072 | VIP Asset Manager Portfolio - Initial Class |
| $34,303 | S&P 500® Index |
Management's Discussion of Fund Performance
Market Recap: The global economy remained in expansion in 2018, but growth became less synchronous and more uneven. Meanwhile, global monetary policy became a headwind, and this uncertainty spurred an increase in volatility among risk assets. This was particularly true in the latter part of the year due to several factors including China entering a growth recession, emerging late-cycle conditions in the U.S., falling commodity prices, China-U.S. trade-policy uncertainty and the U.K.’s planned “Brexit” from the European Union. Against this backdrop, U.S. equities, as measured by the S&P 500
® index returned -4.38% in 2018. Sector-wise, seven of the 11 major sectors in the S&P 500
® lost ground this period. Falling crude-oil prices caused energy stocks (-18%) to suffer most, while slowing global growth concerns felled the materials (-15%), industrials (-13%) and financials (-13%) sectors. Conversely, health care (+6%) led the way, followed by the utilities (+4%), information technology (+3%) and consumer discretionary (+2%) sectors. Overseas, equities suffered a pronounced, broad-based correction, returning -14.04% for the year, according to the MSCI ACWI ex USA Index. Among regions in the index, Asia-Pacific (-11%) and Japan (-13%) held up best, whereas resource-rich Canada (-17%), Europe (-14%) and emerging markets (-14%) lagged. In terms of fixed income, investment-grade bonds were roughly flat for the 12 months, according to the Bloomberg Barclays U.S. Aggregate Bond Index. Late in the year, concerns about global growth pushed Treasury yields lower and credit spreads wider. Short-term debt led most U.S. investment-grade sectors, followed by asset-backed securities and agency bonds while corporate credit produced negative returns according to Bloomberg Barclays.
Comments from Lead Portfolio Manager Geoff Stein and Co-Portfolio Manager Avishek Hazrachoudhury: For the year, the fund’s share classes returned roughly -5% to -6%, trailing the -3.59% result of the Fidelity Asset Manager 50% Composite Index℠. The fund underperformed the Composite benchmark primarily because of weak U.S. stock selection during the final quarter of 2018. More specifically, security selection within information technology had the greatest negative impact. Picks among international developed-markets (DM) equities also notably detracted from performance. Overall, asset allocation aided performance versus the benchmark, driven by equity positioning. Underweighted exposure to international stocks fueled the fund’s positive equity allocation results, as both DM and emerging-markets (EM) lagged U.S. equities, primarily due to a strengthening U.S. dollar. Conversely, our small allocation to commodities modestly hampered our equity strategy, largely due to falling oil prices. Our fixed-income allocation strategy – underweighting cash and investment-grade bonds to help fund various out-of-benchmark positions – detracted versus the Composite benchmark and partially offset the performance benefit provided by our equity strategy. Underweighting cash in the portfolio hurt, since it was the best performer across all the asset classes we invest in. The fund's underweighting in investment-grade debt was a further dampener, primarily because some of the alternative bond sectors we invested in didn’t perform as well as expected. Looking ahead, we have a broadly neutral view toward stocks, but believe international markets – particularly EM – may offer more attractive opportunities than the U.S.
The views expressed above reflect those of the portfolio manager(s) only through the end of the period as stated on the cover of this report and do not necessarily represent the views of Fidelity or any other person in the Fidelity organization. Any such views are subject to change at any time based upon market or other conditions and Fidelity disclaims any responsibility to update such views. These views may not be relied on as investment advice and, because investment decisions for a Fidelity fund are based on numerous factors, may not be relied on as an indication of trading intent on behalf of any Fidelity fund.
Note to shareholders: Avishek Hazrachoudhury joined Geoff Stein as Co-Manager of the fund on April 28, 2018.
Investment Summary (Unaudited)
The information in the following tables is based on the combined investments of the Fund and its pro-rata share of the investments of Fidelity's Central Funds, other than the Commodity Strategy and Money Market Central Funds.
Top Five Stocks as of December 31, 2018
| | % of fund's net assets |
| Apple, Inc. | 1.3 |
| Microsoft Corp. | 1.3 |
| Amazon.com, Inc. | 0.7 |
| Alphabet, Inc. Class A | 0.7 |
| UnitedHealth Group, Inc. | 0.5 |
| | 4.5 |
Top Five Bond Issuers as of December 31, 2018
| (with maturities greater than one year) | % of fund's net assets |
| U.S. Treasury Obligations | 16.3 |
| Fannie Mae | 4.2 |
| Freddie Mac | 2.2 |
| Ginnie Mae | 2.0 |
| Morgan Stanley | 0.5 |
| | 25.2 |
Top Five Market Sectors as of December 31, 2018
| | % of fund's net assets |
| Financials | 12.4 |
| Information Technology | 7.5 |
| Health Care | 6.7 |
| Consumer Discretionary | 5.2 |
| Investment Companies | 4.9 |
Asset Allocation (% of fund's net assets)
| As of December 31, 2018* |
| | Stock Class and Equity Futures** | 51.7% |
| | Bonds | 40.2% |
| | Short-Term Class | 8.1% |

* Foreign investments - 17.3%
** Includes investment in Fidelity® Commodity Strategy Central Fund of 0.5%
Asset allocations in the pie chart reflects the categorization of assets as defined in the Fund's prospectus in effect as of the time periods indicated above. Financial Statement categorizations conform to accounting standards and will differ from the pie chart. Percentages are adjusted for the effect of future contracts and swap contracts, if applicable.
An unaudited holdings listing for the Fund, which presents direct holdings as well as the pro-rata share of any securities and other investments held indirectly through its investment in underlying Fidelity Central Funds, other than the Commodity Strategy and Money Market Central Funds, is available at institutional.fidelity.com.
Percentages in the above tables are adjusted for the effect of TBA Sale Commitments.
Schedule of Investments December 31, 2018
Showing Percentage of Net Assets
| U.S. Treasury Obligations - 0.1% | | | |
| | | Principal Amount | Value |
| U.S. Treasury Bills, yield at date of purchase 2.36% to 2.39% 3/21/19 to 3/28/19 (a) | | | |
| (Cost $964,809) | | 970,000 | 964,781 |
| | | Shares | Value |
|
| Fixed-Income Funds - 42.8% | | | |
| Fidelity Emerging Markets Debt Central Fund (b) | | 583,285 | $5,313,724 |
| Fidelity Floating Rate Central Fund (b) | | 107,533 | 10,586,662 |
| Fidelity High Income Central Fund 1 (b) | | 200,517 | 17,687,634 |
| Fidelity Inflation-Protected Bond Index Central Fund (b) | | 443,582 | 43,240,395 |
| Fidelity International Credit Central Fund (b) | | 65,923 | 6,252,182 |
| Fidelity VIP Investment Grade Central Fund (b) | | 3,203,467 | 327,746,738 |
| iShares 20+ Year Treasury Bond ETF (c) | | 190,245 | 23,116,669 |
| TOTAL FIXED-INCOME FUNDS | | | |
| (Cost $436,749,818) | | | 433,944,004 |
|
| Money Market Funds - 10.8% | | | |
| Fidelity Cash Central Fund, 2.42% (d) | | 57,853,819 | 57,865,390 |
| Fidelity Money Market Central Fund, 2.65% (d) | | 28,433,757 | 28,433,757 |
| Fidelity Securities Lending Cash Central Fund 2.41% (d)(e) | | 23,349,775 | 23,352,110 |
| TOTAL MONEY MARKET FUNDS | | | |
| (Cost $109,651,203) | | | 109,651,257 |
|
| Equity Funds - 48.6% | | | |
| Domestic Equity Funds - 33.7% | | | |
| Fidelity Commodity Strategy Central Fund (b) | | 1,245,244 | 5,777,933 |
| Fidelity Communication Services Central Fund (b) | | 150,068 | 25,254,865 |
| Fidelity Consumer Discretionary Central Fund (b) | | 114,930 | 32,684,891 |
| Fidelity Consumer Staples Central Fund (b) | | 123,965 | 20,621,637 |
| Fidelity Energy Central Fund (b) | | 164,551 | 15,665,211 |
| Fidelity Financials Central Fund (b) | | 694,519 | 60,256,487 |
| Fidelity Health Care Central Fund (b) | | 128,983 | 49,822,385 |
| Fidelity Industrials Central Fund (b) | | 131,273 | 30,499,994 |
| Fidelity Information Technology Central Fund (b) | | 223,975 | 69,799,551 |
| Fidelity Materials Central Fund (b) | | 47,749 | 8,640,671 |
| Fidelity Real Estate Equity Central Fund (b) | | 44,248 | 4,299,574 |
| Fidelity Utilities Central Fund (b) | | 66,488 | 11,312,941 |
| iShares S&P 500 Index ETF | | 27,589 | 6,941,668 |
|
| TOTAL DOMESTIC EQUITY FUNDS | | | 341,577,808 |
|
| International Equity Funds - 14.9% | | | |
| Fidelity Emerging Markets Equity Central Fund (b) | | 117,437 | 22,338,825 |
| Fidelity International Equity Central Fund (b) | | 1,247,747 | 85,757,636 |
| iShares Core MSCI Emerging Markets ETF | | 340,860 | 16,071,549 |
| iShares MSCI EAFE Index ETF | | 115,641 | 6,797,378 |
| iShares MSCI Japan ETF | | 383,139 | 19,421,316 |
|
| TOTAL INTERNATIONAL EQUITY FUNDS | | | 150,386,704 |
|
| TOTAL EQUITY FUNDS | | | |
| (Cost $506,716,765) | | | 491,964,512 |
| TOTAL INVESTMENT IN SECURITIES - 102.3% | | | |
| (Cost $1,054,082,595) | | | 1,036,524,554 |
| NET OTHER ASSETS (LIABILITIES) - (2.3)% | | | (23,560,520) |
| NET ASSETS - 100% | | | $1,012,964,034 |
| Futures Contracts | | | | | |
| | Number of contracts | Expiration Date | Notional Amount | Value | Unrealized Appreciation/(Depreciation) |
| Purchased | | | | | |
| Equity Index Contracts | | | | | |
| ICE E-mini MSCI Emerging Markets Index Contracts (United States) | 349 | March 2019 | $16,870,660 | $(2,263) | $(2,263) |
The notional amount of futures purchased as a percentage of Net Assets is 1.7%
For the period, the average monthly underlying face amount at value for futures contracts in the aggregate was $22,850,543.
Security Type Abbreviations
ETF – Exchange-Traded Fund
Legend
(a) Security or a portion of the security was pledged to cover margin requirements for futures contracts. At period end, the value of securities pledged amounted to $964,781.
(b) Affiliated fund that is generally available only to investment companies and other accounts managed by Fidelity Investments. A complete unaudited schedule of portfolio holdings for each Fidelity Central Fund is filed with the SEC for the first and third quarters of each fiscal year on Form N-Q and is available upon request or at the SEC's website at www.sec.gov. An unaudited holdings listing for the Fund, which presents direct holdings as well as the pro-rata share of securities and other investments held indirectly through its investment in underlying non-money market Fidelity Central Funds, other than the Commodity Strategy Central Fund, is available at fidelity.com and/or institutional.fidelity.com, as applicable. In addition, each Fidelity Central Fund's financial statements, which are not covered by the Fund's Report of Independent Registered Public Accounting Firm, are available on the SEC's website or upon request.
(c) Security or a portion of the security is on loan at period end.
(d) Affiliated fund that is generally available only to investment companies and other accounts managed by Fidelity Investments. The rate quoted is the annualized seven-day yield of the fund at period end. A complete unaudited listing of the fund's holdings as of its most recent quarter end is available upon request. In addition, each Fidelity Central Fund's financial statements, which are not covered by the Fund's Report of Independent Registered Public Accounting Firm, are available on the SEC's website or upon request.
(e) Investment made with cash collateral received from securities on loan.
Affiliated Central Funds
Information regarding fiscal year to date income earned by the Fund from investments in Fidelity Central Funds is as follows:
| Fund | Income earned |
| Fidelity Cash Central Fund | $504,726 |
| Fidelity Commodity Strategy Central Fund | 532,111 |
| Fidelity Communication Services Central Fund | 263,473 |
| Fidelity Consumer Discretionary Central Fund | 1,560,299 |
| Fidelity Consumer Staples Central Fund | 2,588,938 |
| Fidelity Emerging Markets Debt Central Fund | 326,557 |
| Fidelity Emerging Markets Equity Central Fund | 2,184,184 |
| Fidelity Energy Central Fund | 383,330 |
| Fidelity Financials Central Fund | 4,393,573 |
| Fidelity Floating Rate Central Fund | 600,798 |
| Fidelity Health Care Central Fund | 3,268,769 |
| Fidelity High Income Central Fund 1 | 1,115,488 |
| Fidelity Industrials Central Fund | 2,078,651 |
| Fidelity Inflation-Protected Bond Index Central Fund | 1,243,231 |
| Fidelity Information Technology Central Fund | 14,555,369 |
| Fidelity International Credit Central Fund | 251,878 |
| Fidelity International Equity Central Fund | 7,231,238 |
| Fidelity Materials Central Fund | 909,043 |
| Fidelity Money Market Central Fund | 789,821 |
| Fidelity Real Estate Equity Central Fund | 246,150 |
| Fidelity Securities Lending Cash Central Fund | 27,487 |
| Fidelity Utilities Central Fund | 1,208,346 |
| Fidelity VIP Investment Grade Central Fund | 10,016,799 |
| Total | $56,280,259 |
Amounts in the income column in the above table include any capital gain distributions from underlying funds, which are presented in the corresponding line-item in the Statement of Operations if applicable.
Fiscal year to date information regarding the Fund’s investments in non-Money Market Central Funds, including the ownership percentage, is presented below.
| Affiliate | Value, beginning of period | Purchases(a) | Sales Proceeds(a) | Realized Gain (loss) | Change in Unrealized appreciation (depreciation) | Value, end of period | % ownership, end of period |
| Fidelity Commodity Strategy Central Fund | $24,141,586 | $5,247,855 | $21,732,462 | $1,882,127 | $(3,761,173) | $5,777,933 | 2.3% |
| Fidelity Communication Services Central Fund | 7,600,063 | 20,853,987 | 990,599 | (136,519) | (2,072,067) | 25,254,865 | 1.8% |
| Fidelity Consumer Discretionary Central Fund | 39,907,667 | 4,140,852 | 10,367,028 | 1,268,156 | (2,264,756) | 32,684,891 | 1.9% |
| Fidelity Consumer Staples Central Fund | 25,594,068 | 4,382,344 | 3,064,095 | (164,824) | (6,125,856) | 20,621,637 | 1.8% |
| Fidelity Emerging Markets Debt Central Fund | 6,149,917 | 420,285 | 662,314 | (28,483) | (565,681) | 5,313,724 | 4.1% |
| Fidelity Emerging Markets Equity Central Fund | 35,072,978 | 2,907,002 | 9,067,518 | 709,536 | (7,283,173) | 22,338,825 | 3.6% |
| Fidelity Energy Central Fund | 21,953,260 | 2,115,560 | 2,881,874 | (134,577) | (5,387,158) | 15,665,211 | 1.9% |
| Fidelity Financials Central Fund | 73,707,560 | 10,125,972 | 9,965,470 | (218,141) | (13,393,434) | 60,256,487 | 2.0% |
| Fidelity Floating Rate Central Fund | 11,607,545 | 788,254 | 1,324,633 | 62,226 | (546,730) | 10,586,662 | 0.5% |
| Fidelity Health Care Central Fund | 50,835,229 | 6,849,920 | 8,903,751 | 868,498 | 172,489 | 49,822,385 | 1.8% |
| Fidelity High Income Central Fund 1 | 22,661,288 | 3,540,166 | 6,848,505 | 1,136,446 | (2,801,761) | 17,687,634 | 4.0% |
| Fidelity Industrials Central Fund | 38,362,342 | 5,713,475 | 5,643,332 | (110,057) | (7,822,434) | 30,499,994 | 1.9% |
| Fidelity Inflation-Protected Bond Index Central Fund | 38,335,640 | 11,341,010 | 5,117,221 | (19,954) | (1,299,080) | 43,240,395 | 3.9% |
| Fidelity Information Technology Central Fund | 89,977,814 | 27,459,635 | 27,410,682 | 289,667 | (20,516,883) | 69,799,551 | 1.9% |
| Fidelity International Credit Central Fund | 6,770,597 | 604,313 | 793,752 | (11,433) | (317,543) | 6,252,182 | 3.6% |
| Fidelity International Equity Central Fund | 132,600,366 | 8,920,548 | 32,069,741 | 3,284,763 | (26,978,300) | 85,757,636 | 3.8% |
| Fidelity Materials Central Fund | 11,835,527 | 1,838,926 | 1,441,096 | (93,504) | (3,499,182) | 8,640,671 | 1.9% |
| Fidelity Real Estate Equity Central Fund | 5,419,890 | 322,186 | 906,209 | 11,062 | (547,355) | 4,299,574 | 3.7% |
| Fidelity Utilities Central Fund | 11,146,784 | 2,108,363 | 1,762,051 | 57,158 | (237,313) | 11,312,941 | 1.9% |
| Fidelity VIP Investment Grade Central Fund | 382,978,640 | 48,220,914 | 92,478,404 | (1,121,390) | (9,853,022) | 327,746,738 | 6.2% |
| | $1,036,658,761 | $167,901,567 | $243,430,737 | $7,530,757 | $(115,100,412) | $853,559,936 | |
(a) Includes the value of shares purchased or redeemed through in-kind transactions, if applicable. See the Notes to Financial Statements for additional details.
Investment Valuation
The following is a summary of the inputs used, as of December 31, 2018, involving the Fund's assets and liabilities carried at fair value. The inputs or methodology used for valuing securities may not be an indication of the risk associated with investing in those securities. For more information on valuation inputs, and their aggregation into the levels used below, please refer to the Investment Valuation section in the accompanying Notes to Financial Statements.
| | Valuation Inputs at Reporting Date: |
| Description | Total | Level 1 | Level 2 | Level 3 |
| Investments in Securities: | | | | |
| U.S. Government and Government Agency Obligations | $964,781 | $-- | $964,781 | $-- |
| Fixed-Income Funds | 433,944,004 | 433,944,004 | -- | -- |
| Money Market Funds | 109,651,257 | 109,651,257 | -- | -- |
| Equity Funds | 491,964,512 | 491,964,512 | -- | -- |
| Total Investments in Securities: | $1,036,524,554 | $1,035,559,773 | $964,781 | $-- |
| Derivative Instruments: | | | | |
| Liabilities | | | | |
| Futures Contracts | $(2,263) | $(2,263) | $-- | $-- |
| Total Liabilities | $(2,263) | $(2,263) | $-- | $-- |
| Total Derivative Instruments: | $(2,263) | $(2,263) | $-- | $-- |
Value of Derivative Instruments
The following table is a summary of the Fund's value of derivative instruments by primary risk exposure as of December 31, 2018. For additional information on derivative instruments, please refer to the Derivative Instruments section in the accompanying Notes to Financial Statements.
| Primary Risk Exposure / Derivative Type | Value |
| | Asset | Liability |
| Equity Risk | | |
| Futures Contracts(a) | $0 | $(2,263) |
| Total Equity Risk | 0 | (2,263) |
| Total Value of Derivatives | $0 | $(2,263) |
(a) Reflects gross cumulative appreciation (depreciation) on futures contracts as presented in the Schedule of Investments. In the Statement of Assets and Liabilities, the period end daily variation margin is included in receivable or payable for daily variation margin on futures contracts, and the net cumulative appreciation (depreciation) is included in net unrealized appreciation (depreciation).
Other Information
The information in the following tables is based on the combined investments of the Fund and its pro-rata share of the investments of Fidelity's Central Funds, other than the Commodity Strategy and Money Market Central Funds. Percentages in the below tables are adjusted for the effect of TBA Sale Commitments.
The composition of credit quality ratings as a percentage of Total Net Assets is as follows (Unaudited):
| U.S. Government and U.S. Government Agency Obligations | 24.9% |
| AAA,AA,A | 2.9% |
| BBB | 7.7% |
| BB | 3.2% |
| B | 1.3% |
| CCC,CC,C | 0.4% |
| D | 0.0% |
| Not Rated | 0.8% |
| Equities | 49.4% |
| Short-Term Investments and Net Other Assets | 8.4% |
| | 100.0% |
We have used ratings from Moody's Investors Service, Inc. Where Moody's® ratings are not available, we have used S&P® ratings. All ratings are as of the date indicated and do not reflect subsequent changes.
Distribution of investments by country or territory of incorporation, as a percentage of Total Net Assets, is as follows (Unaudited):
| United States of America | 82.8% |
| United Kingdom | 2.4% |
| Japan | 1.9% |
| Netherlands | 1.3% |
| Canada | 1.3% |
| Switzerland | 1.2% |
| Germany | 1.0% |
| Others (Individually Less Than 1%) | 8.1% |
| | 100.0% |
See accompanying notes which are an integral part of the financial statements.
Financial Statements
Statement of Assets and Liabilities
| | | December 31, 2018 |
| Assets | | |
Investment in securities, at value (including securities loaned of $22,977,541) — See accompanying schedule:
Unaffiliated issuers (cost $75,831,953) | $73,313,361 | |
| Fidelity Central Funds (cost $978,250,642) | 963,211,193 | |
| Total Investment in Securities (cost $1,054,082,595) | | $1,036,524,554 |
| Receivable for investments sold | | 8,081,192 |
| Receivable for fund shares sold | | 47,139 |
| Dividends receivable | | 6,001 |
| Distributions receivable from Fidelity Central Funds | | 103,874 |
| Prepaid expenses | | 1,649 |
| Other receivables | | 44,843 |
| Total assets | | 1,044,809,252 |
| Liabilities | | |
| Payable for investments purchased | $6,722,340 | |
| Payable for fund shares redeemed | 1,101,030 | |
| Accrued management fee | 419,091 | |
| Distribution and service plan fees payable | 4,216 | |
| Payable for daily variation margin on futures contracts | 61,075 | |
| Other affiliated payables | 105,210 | |
| Other payables and accrued expenses | 78,406 | |
| Collateral on securities loaned | 23,353,850 | |
| Total liabilities | | 31,845,218 |
| Net Assets | | $1,012,964,034 |
| Net Assets consist of: | | |
| Paid in capital | | $995,084,076 |
| Total distributable earnings (loss) | | 17,879,958 |
| Net Assets | | $1,012,964,034 |
| Net Asset Value and Maximum Offering Price | | |
| Initial Class: | | |
| Net Asset Value, offering price and redemption price per share ($788,193,259 ÷ 57,627,032 shares) | | $13.68 |
| Service Class: | | |
| Net Asset Value, offering price and redemption price per share ($4,378,169 ÷ 323,099 shares) | | $13.55 |
| Service Class 2: | | |
| Net Asset Value, offering price and redemption price per share ($18,210,527 ÷ 1,365,820 shares) | | $13.33 |
| Investor Class: | | |
| Net Asset Value, offering price and redemption price per share ($202,182,079 ÷ 14,881,712 shares) | | $13.59 |
See accompanying notes which are an integral part of the financial statements.
Statement of Operations
| | | Year ended December 31, 2018 |
| Investment Income | | |
| Dividends | | $1,932,155 |
| Interest | | 23,392 |
| Income from Fidelity Central Funds | | 23,279,933 |
| Total income | | 25,235,480 |
| Expenses | | |
| Management fee | $5,505,158 | |
| Transfer agent fees | 896,995 | |
| Distribution and service plan fees | 55,989 | |
| Accounting and security lending fees | 467,811 | |
| Custodian fees and expenses | 2,134 | |
| Independent trustees' fees and expenses | 5,212 | |
| Audit | 63,820 | |
| Legal | 9,916 | |
| Miscellaneous | 8,134 | |
| Total expenses before reductions | 7,015,169 | |
| Expense reductions | (18,833) | |
| Total expenses after reductions | | 6,996,336 |
| Net investment income (loss) | | 18,239,144 |
| Realized and Unrealized Gain (Loss) | | |
| Net realized gain (loss) on: | | |
| Investment securities: | | |
| Unaffiliated issuers | 4,017,932 | |
| Fidelity Central Funds | 7,594,602 | |
| Futures contracts | 3,102,930 | |
| Capital gain distributions from Fidelity Central Funds | 33,000,326 | |
| Total net realized gain (loss) | | 47,715,790 |
| Change in net unrealized appreciation (depreciation) on: | | |
| Investment securities: | | |
| Unaffiliated issuers | (8,427,354) | |
| Fidelity Central Funds | (115,104,971) | |
| Futures contracts | (2,263) | |
| Total change in net unrealized appreciation (depreciation) | | (123,534,588) |
| Net gain (loss) | | (75,818,798) |
| Net increase (decrease) in net assets resulting from operations | | $(57,579,654) |
See accompanying notes which are an integral part of the financial statements.
Statement of Changes in Net Assets
| | Year ended December 31, 2018 | Year ended December 31, 2017 |
| Increase (Decrease) in Net Assets | | |
| Operations | | |
| Net investment income (loss) | $18,239,144 | $17,739,065 |
| Net realized gain (loss) | 47,715,790 | 56,482,409 |
| Change in net unrealized appreciation (depreciation) | (123,534,588) | 78,489,067 |
| Net increase (decrease) in net assets resulting from operations | (57,579,654) | 152,710,541 |
| Distributions to shareholders | (55,614,527) | – |
| Distributions to shareholders from net investment income | – | (21,295,471) |
| Distributions to shareholders from net realized gain | – | (129,896,975) |
| Total distributions | (55,614,527) | (151,192,446) |
| Share transactions - net increase (decrease) | (50,657,785) | 33,637,892 |
| Total increase (decrease) in net assets | (163,851,966) | 35,155,987 |
| Net Assets | | |
| Beginning of period | 1,176,816,000 | 1,141,660,013 |
| End of period | $1,012,964,034 | $1,176,816,000 |
| Other Information | | |
| Undistributed net investment income end of period | | $475,263 |
See accompanying notes which are an integral part of the financial statements.
Financial Highlights
VIP Asset Manager Portfolio Initial Class
| Years ended December 31, | 2018 | 2017 | 2016 | 2015 | 2014 |
| Selected Per–Share Data | | | | | |
| Net asset value, beginning of period | $15.23 | $15.29 | $15.76 | $17.15 | $17.24 |
| Income from Investment Operations | | | | | |
| Net investment income (loss)A | .24 | .23 | .24 | .27 | .27 |
| Net realized and unrealized gain (loss) | (1.04) | 1.76 | .18 | (.22) | .72 |
| Total from investment operations | (.80) | 1.99 | .42 | .05 | .99 |
| Distributions from net investment income | (.26)B | (.29) | (.23) | (.26) | (.27) |
| Distributions from net realized gain | (.49)B | (1.76) | (.66) | (1.17) | (.81) |
| Total distributions | (.75) | (2.05) | (.89) | (1.44)C | (1.08) |
| Net asset value, end of period | $13.68 | $15.23 | $15.29 | $15.76 | $17.15 |
| Total ReturnD,E | (5.35)% | 14.03% | 3.14% | .14% | 5.83% |
| Ratios to Average Net AssetsF,G | | | | | |
| Expenses before reductions | .60% | .61% | .62% | .62% | .61% |
| Expenses net of fee waivers, if any | .60% | .61% | .61% | .62% | .61% |
| Expenses net of all reductions | .60% | .61% | .61% | .61% | .61% |
| Net investment income (loss) | 1.64% | 1.54% | 1.57% | 1.65% | 1.54% |
| Supplemental Data | | | | | |
| Net assets, end of period (000 omitted) | $788,193 | $937,508 | $932,248 | $1,008,018 | $1,117,675 |
| Portfolio turnover rateH | 27% | 26% | 108% | 39% | 30% |
A Calculated based on average shares outstanding during the period.
B The amounts shown reflect certain reclassifications related to book to tax differences that were made in the year shown.
C Total distributions of $1.44 per share is comprised of distributions from net investment income of $.263 and distributions from net realized gain of $1.174 per share.
D Total returns do not reflect charges attributable to your insurance company's separate account. Inclusion of these charges would reduce the total returns shown.
E Total returns would have been lower if certain expenses had not been reduced during the applicable periods shown.
F Fees and expenses of any underlying Fidelity Central Funds are not included in the Fund's expense ratio. The Fund indirectly bears its proportionate share of the expenses of any underlying Fidelity Central Funds. Based on their most recent shareholder report date, the expenses of any underlying non-money market Fidelity Central Funds ranged from less than .005% to .07%.
G Expense ratios reflect operating expenses of the class. Expenses before reductions do not reflect amounts reimbursed by the investment adviser or reductions from brokerage service arrangements or reductions from other expense offset arrangements and do not represent the amount paid by the class during periods when reimbursements or reductions occur. Expenses net of fee waivers reflect expenses after reimbursement by the investment adviser but prior to reductions from brokerage service arrangements or other expense offset arrangements. Expenses net of all reductions represent the net expenses paid by the class.
H Amount does not include the portfolio activity of any underlying Fidelity Central Funds.
See accompanying notes which are an integral part of the financial statements.
VIP Asset Manager Portfolio Service Class
| Years ended December 31, | 2018 | 2017 | 2016 | 2015 | 2014 |
| Selected Per–Share Data | | | | | |
| Net asset value, beginning of period | $15.09 | $15.16 | $15.64 | $17.03 | $17.13 |
| Income from Investment Operations | | | | | |
| Net investment income (loss)A | .23 | .21 | .22 | .25 | .25 |
| Net realized and unrealized gain (loss) | (1.03) | 1.75 | .18 | (.22) | .71 |
| Total from investment operations | (.80) | 1.96 | .40 | .03 | .96 |
| Distributions from net investment income | (.25)B | (.27) | (.22) | (.24) | (.25) |
| Distributions from net realized gain | (.49)B | (1.76) | (.66) | (1.17) | (.81) |
| Total distributions | (.74) | (2.03) | (.88) | (1.42)C | (1.06) |
| Net asset value, end of period | $13.55 | $15.09 | $15.16 | $15.64 | $17.03 |
| Total ReturnD,E | (5.44)% | 13.94% | 3.01% | .03% | 5.69% |
| Ratios to Average Net AssetsF,G | | | | | |
| Expenses before reductions | .70% | .71% | .72% | .72% | .73% |
| Expenses net of fee waivers, if any | .70% | .71% | .71% | .72% | .73% |
| Expenses net of all reductions | .70% | .71% | .71% | .72% | .73% |
| Net investment income (loss) | 1.54% | 1.44% | 1.47% | 1.54% | 1.43% |
| Supplemental Data | | | | | |
| Net assets, end of period (000 omitted) | $4,378 | $5,004 | $5,437 | $5,806 | $6,990 |
| Portfolio turnover rateH | 27% | 26% | 108% | 39% | 30% |
A Calculated based on average shares outstanding during the period.
B The amounts shown reflect certain reclassifications related to book to tax differences that were made in the year shown.
C Total distributions of $1.42 per share is comprised of distributions from net investment income of $.244 and distributions from net realized gain of $1.174 per share.
D Total returns do not reflect charges attributable to your insurance company's separate account. Inclusion of these charges would reduce the total returns shown.
E Total returns would have been lower if certain expenses had not been reduced during the applicable periods shown.
F Fees and expenses of any underlying Fidelity Central Funds are not included in the Fund's expense ratio. The Fund indirectly bears its proportionate share of the expenses of any underlying Fidelity Central Funds. Based on their most recent shareholder report date, the expenses of any underlying non-money market Fidelity Central Funds ranged from less than .005% to .07%.
G Expense ratios reflect operating expenses of the class. Expenses before reductions do not reflect amounts reimbursed by the investment adviser or reductions from brokerage service arrangements or reductions from other expense offset arrangements and do not represent the amount paid by the class during periods when reimbursements or reductions occur. Expenses net of fee waivers reflect expenses after reimbursement by the investment adviser but prior to reductions from brokerage service arrangements or other expense offset arrangements. Expenses net of all reductions represent the net expenses paid by the class.
H Amount does not include the portfolio activity of any underlying Fidelity Central Funds.
See accompanying notes which are an integral part of the financial statements.
VIP Asset Manager Portfolio Service Class 2
| Years ended December 31, | 2018 | 2017 | 2016 | 2015 | 2014 |
| Selected Per–Share Data | | | | | |
| Net asset value, beginning of period | $14.86 | $14.96 | $15.45 | $16.83 | $16.94 |
| Income from Investment Operations | | | | | |
| Net investment income (loss)A | .20 | .19 | .20 | .23 | .22 |
| Net realized and unrealized gain (loss) | (1.02) | 1.71 | .17 | (.21) | .70 |
| Total from investment operations | (.82) | 1.90 | .37 | .02 | .92 |
| Distributions from net investment income | (.22)B | (.25) | (.20) | (.22) | (.22) |
| Distributions from net realized gain | (.49)B | (1.76) | (.66) | (1.17) | (.81) |
| Total distributions | (.71) | (2.00)C | (.86) | (1.40)D | (1.03) |
| Net asset value, end of period | $13.33 | $14.86 | $14.96 | $15.45 | $16.83 |
| Total ReturnE,F | (5.61)% | 13.74% | 2.84% | (.06)% | 5.54% |
| Ratios to Average Net AssetsG,H | | | | | |
| Expenses before reductions | .85% | .86% | .87% | .87% | .88% |
| Expenses net of fee waivers, if any | .85% | .86% | .86% | .87% | .88% |
| Expenses net of all reductions | .85% | .86% | .86% | .87% | .87% |
| Net investment income (loss) | 1.39% | 1.29% | 1.32% | 1.39% | 1.28% |
| Supplemental Data | | | | | |
| Net assets, end of period (000 omitted) | $18,211 | $20,807 | $21,651 | $24,520 | $28,230 |
| Portfolio turnover rateI | 27% | 26% | 108% | 39% | 30% |
A Calculated based on average shares outstanding during the period.
B The amounts shown reflect certain reclassifications related to book to tax differences that were made in the year shown.
C Total distributions of $2.00 per share is comprised of distributions from net investment income of $.245 and distributions from net realized gain of $1.757 per share.
D Total distributions of $1.40 per share is comprised of distributions from net investment income of $.221 and distributions from net realized gain of $1.174 per share.
E Total returns do not reflect charges attributable to your insurance company's separate account. Inclusion of these charges would reduce the total returns shown.
F Total returns would have been lower if certain expenses had not been reduced during the applicable periods shown.
G Fees and expenses of any underlying Fidelity Central Funds are not included in the Fund's expense ratio. The Fund indirectly bears its proportionate share of the expenses of any underlying Fidelity Central Funds. Based on their most recent shareholder report date, the expenses of any underlying non-money market Fidelity Central Funds ranged from less than .005% to .07%.
H Expense ratios reflect operating expenses of the class. Expenses before reductions do not reflect amounts reimbursed by the investment adviser or reductions from brokerage service arrangements or reductions from other expense offset arrangements and do not represent the amount paid by the class during periods when reimbursements or reductions occur. Expenses net of fee waivers reflect expenses after reimbursement by the investment adviser but prior to reductions from brokerage service arrangements or other expense offset arrangements. Expenses net of all reductions represent the net expenses paid by the class.
I Amount does not include the portfolio activity of any underlying Fidelity Central Funds.
See accompanying notes which are an integral part of the financial statements.
VIP Asset Manager Portfolio Investor Class
| Years ended December 31, | 2018 | 2017 | 2016 | 2015 | 2014 |
| Selected Per–Share Data | | | | | |
| Net asset value, beginning of period | $15.13 | $15.20 | $15.68 | $17.07 | $17.17 |
| Income from Investment Operations | | | | | |
| Net investment income (loss)A | .23 | .22 | .23 | .26 | .25 |
| Net realized and unrealized gain (loss) | (1.03) | 1.74 | .17 | (.22) | .72 |
| Total from investment operations | (.80) | 1.96 | .40 | .04 | .97 |
| Distributions from net investment income | (.25)B | (.28) | (.22) | (.25) | (.26) |
| Distributions from net realized gain | (.49)B | (1.76) | (.66) | (1.17) | (.81) |
| Total distributions | (.74) | (2.03)C | (.88) | (1.43)D | (1.07) |
| Net asset value, end of period | $13.59 | $15.13 | $15.20 | $15.68 | $17.07 |
| Total ReturnE,F | (5.39)% | 13.95% | 3.01% | .07% | 5.73% |
| Ratios to Average Net AssetsG,H | | | | | |
| Expenses before reductions | .68% | .69% | .70% | .70% | .70% |
| Expenses net of fee waivers, if any | .68% | .69% | .70% | .70% | .70% |
| Expenses net of all reductions | .68% | .69% | .69% | .69% | .69% |
| Net investment income (loss) | 1.56% | 1.46% | 1.49% | 1.57% | 1.46% |
| Supplemental Data | | | | | |
| Net assets, end of period (000 omitted) | $202,182 | $213,497 | $182,324 | $192,234 | $180,160 |
| Portfolio turnover rateI | 27% | 26% | 108% | 39% | 30% |
A Calculated based on average shares outstanding during the period.
B The amounts shown reflect certain reclassifications related to book to tax differences that were made in the year shown.
C Total distributions of $2.03 per share is comprised of distributions from net investment income of $.276 and distributions from net realized gain of $1.757 per share.
D Total distributions of $1.43 per share is comprised of distributions from net investment income of $.251 and distributions from net realized gain of $1.174 per share.
E Total returns do not reflect charges attributable to your insurance company's separate account. Inclusion of these charges would reduce the total returns shown.
F Total returns would have been lower if certain expenses had not been reduced during the applicable periods shown.
G Fees and expenses of any underlying Fidelity Central Funds are not included in the Fund's expense ratio. The Fund indirectly bears its proportionate share of the expenses of any underlying Fidelity Central Funds. Based on their most recent shareholder report date, the expenses of any underlying non-money market Fidelity Central Funds ranged from less than .005% to .07%.
H Expense ratios reflect operating expenses of the class. Expenses before reductions do not reflect amounts reimbursed by the investment adviser or reductions from brokerage service arrangements or reductions from other expense offset arrangements and do not represent the amount paid by the class during periods when reimbursements or reductions occur. Expenses net of fee waivers reflect expenses after reimbursement by the investment adviser but prior to reductions from brokerage service arrangements or other expense offset arrangements. Expenses net of all reductions represent the net expenses paid by the class.
I Amount does not include the portfolio activity of any underlying Fidelity Central Funds.
See accompanying notes which are an integral part of the financial statements.
Notes to Financial Statements
For the period ended December 31, 2018
1. Organization.
VIP Asset Manager Portfolio (the Fund) is a fund of Variable Insurance Products Fund V (the Trust) and is authorized to issue an unlimited number of shares. The Trust is registered under the Investment Company Act of 1940, as amended (the 1940 Act), as an open-end management investment company organized as a Massachusetts business trust. Shares of the Fund may only be purchased by insurance companies for the purpose of funding variable annuity or variable life insurance contracts. The Fund offers the following classes of shares: Initial Class shares, Service Class shares, Service Class 2 shares and Investor Class shares. All classes have equal rights and voting privileges, except for matters affecting a single class. Certain Underlying Funds incurred name changes since their most recent shareholder report. The names of the Underlying Funds are those in effect at period end.
2. Investments in Fidelity Central Funds.
The Fund invests in Fidelity Central Funds, which are open-end investment companies generally available only to other investment companies and accounts managed by the investment adviser and its affiliates. The Fund's Schedule of Investments lists each of the Fidelity Central Funds held as of period end, as an investment of the Fund, but does not include the underlying holdings of each Fidelity Central Fund. As an Investing Fund, the Fund indirectly bears its proportionate share of the expenses of the underlying Fidelity Central Funds.
Based on its investment objective, each Fidelity Central Fund may invest or participate in various investment vehicles or strategies that are similar to those of the Fund. These strategies are consistent with the investment objectives of the Fund and may involve certain economic risks which may cause a decline in value of each of the Fidelity Central Funds and thus a decline in the value of the Fund. The following summarizes the Fund's investment in each Fidelity Central Fund.
| Fidelity Central Fund | Investment Manager | Investment Objective | Investment Practices | Expense Ratio(a) |
| Fidelity Commodity Strategy Central Fund | Geode Capital Management, LLC (Geode) | Seeks to provide investment returns that correspond to the performance of the commodities market. | Investment in commodity-related investments through a wholly-owned subsidiary organized under the laws of the Cayman Islands
Futures | .06% |
| Fidelity Equity Central Funds | FMR Co., Inc. (FMRC) | Each fund seeks capital appreciation by investing primarily in common stocks, with a concentration in a particular industry. | Foreign Securities
Restricted Securities
| Less than .005% to .01% |
| Fidelity Emerging Markets Debt Central Fund | FMRC | Seeks high total return by normally investing in debt securities of issuers in emerging markets and other debt investments that are tied economically to emerging markets. | Foreign Securities
Restricted Securities
| .01% |
| Fidelity Emerging Markets Equity Central Fund | FMRC | Seeks capital appreciation by investing primarily in equity securities of issuers in emerging markets. | Foreign Securities
Futures
| .07% |
| Fidelity International Equity Central Fund | FMRC | Seeks capital appreciation by investing primarily in non-U.S. based common stocks, including securities of issuers located in emerging markets. | Delayed Delivery & When Issued Securities
Foreign Securities
Futures
Restricted Securities
| .01% |
| Fidelity Floating Rate Central Fund | FMRC | Seeks a high level of income by normally investing in floating rate loans and other floating rate securities. | Loans & Direct Debt Instruments
Restricted Securities
| Less than .005% |
| Fidelity High Income Central Fund 1 | FMRC | Seeks a high level of income and may also seek capital appreciation by investing primarily in debt securities, preferred stocks, and convertible securities, with an emphasis on lower-quality debt securities. | Loans & Direct Debt Instruments
Restricted Securities
| Less than .005% |
| Fidelity Inflation-Protected Bond Index Central Fund | Fidelity Investment Money Management, Inc. (FIMM) | Seeks to provide investment results that correspond to the performance of the inflation-protected United States Treasury market, and may invest in derivatives. | | Less than .005% |
| Fidelity VIP Investment Grade Central Fund | FIMM | Seeks a high level of current income by normally investing in investment-grade debt securities and repurchase agreements. | Delayed Delivery & When Issued Securities
Repurchase Agreements
Restricted Securities
Swaps
| Less than .005% |
| Fidelity International Credit Central Fund | FMRC | Seeks a high level of current income by normally investing in debt securities of foreign issuers, including debt securities of issuers located in emerging markets. Foreign currency exposure is hedged utilizing foreign currency contracts. | Delayed Delivery & When Issued Securities
Foreign Securities
Futures
Restricted Securities
Swaps
| .01% |
| Fidelity Money Market Central Funds | FIMM | Each fund seeks to obtain a high level of current income consistent with the preservation of capital and liquidity. | Short-term Investments | Less than .005% |
(a) Expenses expressed as a percentage of average net assets and are as of each underlying Central Fund's most recent annual or semi-annual shareholder report.
An unaudited holdings listing for the Fund, which presents direct holdings as well as the pro-rata share of any securities and other investments held indirectly through its investment in underlying non-money market Fidelity Central Funds, is available at institutional.fidelity.com. A complete unaudited list of holdings for each Fidelity Central Fund is available upon request or at the Securities and Exchange Commission (the SEC) website at www.sec.gov. In addition, the financial statements of the Fidelity Central Funds which contain the significant accounting policies (including investment valuation policies) of those funds, which are not covered by the Fund's Report of Independent Registered Public Accounting Firm, are available on the SEC website or upon request.
3. Significant Accounting Policies.
The Fund is an investment company and applies the accounting and reporting guidance of the Financial Accounting Standards Board (FASB) Accounting Standards Codification Topic 946 Financial Services – Investments Companies. The financial statements have been prepared in conformity with accounting principles generally accepted in the United States of America (GAAP), which require management to make certain estimates and assumptions at the date of the financial statements. Actual results could differ from those estimates. Subsequent events, if any, through the date that the financial statements were issued have been evaluated in the preparation of the financial statements. The following summarizes the significant accounting policies of the Fund:
Investment Valuation. Investments are valued as of 4:00 p.m. Eastern time on the last calendar day of the period. The Board of Trustees (the Board) has delegated the day to day responsibility for the valuation of the Fund's investments to the Fair Value Committee (the Committee) established by the Fund's investment adviser. In accordance with valuation policies and procedures approved by the Board, the Fund attempts to obtain prices from one or more third party pricing vendors or brokers to value its investments. When current market prices, quotations or currency exchange rates are not readily available or reliable, investments will be fair valued in good faith by the Committee, in accordance with procedures adopted by the Board. Factors used in determining fair value vary by investment type and may include market or investment specific events, changes in interest rates and credit quality. The frequency with which these procedures are used cannot be predicted and they may be utilized to a significant extent. The Committee oversees the Fund's valuation policies and procedures and reports to the Board on the Committee's activities and fair value determinations. The Board monitors the appropriateness of the procedures used in valuing the Fund's investments and ratifies the fair value determinations of the Committee. The Fund categorizes the inputs to valuation techniques used to value its investments into a disclosure hierarchy consisting of three levels as shown below:
- Level 1 – quoted prices in active markets for identical investments
- Level 2 – other significant observable inputs (including quoted prices for similar investments, interest rates, prepayment speeds, etc.)
- Level 3 – unobservable inputs (including the Fund's own assumptions based on the best information available)
Valuation techniques used to value the Fund's investments by major category are as follows. Debt securities, including restricted securities, are valued based on evaluated prices received from third party pricing vendors or from brokers who make markets in such securities. U.S. government and government agency obligations are valued by pricing vendors who utilize matrix pricing which considers yield or price of bonds of comparable quality, coupon, maturity and type or by broker-supplied prices. When independent prices are unavailable or unreliable, debt securities may be valued utilizing pricing methodologies which consider similar factors that would be used by third party pricing vendors. Debt securities are generally categorized as Level 2 in the hierarchy but may be Level depending on the circumstances.
Exchange-Traded Funds (ETFs) are valued at their last sale price or official closing price as reported by a third party pricing vendor on the primary market or exchange on which they are traded and are categorized as Level 1 in the hierarchy. In the event there were no sales during the day but the exchange reports a closing bid level, ETFs are valued at the closing bid and would be categorized as Level 1 in the hierarchy. In the event there was no closing bid, ETFs may be valued by another method that the Board believes reflects fair value in accordance with the Board's fair value pricing policies and may be categorized as Level 2 in the hierarchy.
Futures contracts are valued at the settlement price established each day by the board of trade or exchange on which they are traded and are categorized as Level 1 in the hierarchy. Investments in open-end mutual funds, including the Fidelity Central Funds, are valued at their closing net asset value (NAV) each business day and are categorized as Level 1 in the hierarchy.
Changes in valuation techniques may result in transfers in or out of an assigned level within the disclosure hierarchy. The aggregate value of investments by input level, as of December 31, 2018, is included at the end of the Fund's Schedule of Investments.
Investment Transactions and Income. For financial reporting purposes, the Fund's investment holdings and NAV include trades executed through the end of the last business day of the period. The NAV per share for processing shareholder transactions is calculated as of the close of business of the New York Stock Exchange (NYSE), normally 4:00 p.m. Eastern time and includes trades executed through the end of the prior business day. Gains and losses on securities sold are determined on the basis of identified cost and include proceeds received from litigation. Dividend income is recorded on the ex-dividend date, except for certain dividends from foreign securities where the ex-dividend date may have passed, which are recorded as soon as the Fund is informed of the ex-dividend date. Non-cash dividends included in dividend income, if any, are recorded at the fair market value of the securities received. Income and capital gain distributions from Fidelity Central Funds, if any, are recorded on the ex-dividend date. Certain distributions received by the Fund represent a return of capital or capital gain. The Fund determines the components of these distributions subsequent to the ex-dividend date, based upon receipt of tax filings or other correspondence relating to the underlying investment. These distributions are recorded as a reduction of cost of investments and/or as a realized gain. Interest income is accrued as earned and includes coupon interest and amortization of premium and accretion of discount on debt securities as applicable.
Class Allocations and Expenses. Investment income, realized and unrealized capital gains and losses, common expenses of the Fund, and certain fund-level expense reductions, if any, are allocated daily on a pro-rata basis to each class based on the relative net assets of each class to the total net assets of the Fund. Each class differs with respect to transfer agent and distribution and service plan fees incurred. Certain expense reductions may also differ by class. For the reporting period, the allocated portion of income and expenses to each class as a percent of its average net assets may vary due to the timing of recording these transactions in relation to fluctuating net assets of the classes. Expenses directly attributable to a fund are charged to that fund. Expenses attributable to more than one fund are allocated among the respective funds on the basis of relative net assets or other appropriate methods. Expense estimates are accrued in the period to which they relate and adjustments are made when actual amounts are known. Expenses included in the accompanying financial statements reflect the expenses of the Fund and do not include any expenses of the Fidelity Central Funds. Although not included in the Fund's expenses, the Fund indirectly bears its proportionate share of the Fidelity Central Funds' expenses through the impact of these expenses on each Fidelity Central Fund's NAV.
Deferred Trustee Compensation. Under a Deferred Compensation Plan (the Plan), certain independent Trustees have elected to defer receipt of a portion of their annual compensation. Deferred amounts are invested in a cross-section of Fidelity funds, are marked-to-market and remain in the Fund until distributed in accordance with the Plan. The investment of deferred amounts and the offsetting payable to the Trustees of $42,235 are included in the accompanying Statement of Assets and Liabilities in other receivables and other payables and accrued expenses, respectively.
Income Tax Information and Distributions to Shareholders. Each year, the Fund intends to qualify as a regulated investment company under Subchapter M of the Internal Revenue Code, including distributing substantially all of its taxable income and realized gains. As a result, no provision for U.S. Federal income taxes is required. As of December 31, 2018, the Fund did not have any unrecognized tax benefits in the financial statements; nor is the Fund aware of any tax positions for which it is reasonably possible that the total amounts of unrecognized tax benefits will significantly change in the next twelve months. The Fund files a U.S. federal tax return, in addition to state and local tax returns as required. The Fund's federal income tax returns are subject to examination by the Internal Revenue Service (IRS) for a period of three fiscal years after they are filed. State and local tax returns may be subject to examination for an additional fiscal year depending on the jurisdiction.
Distributions are declared and recorded on the ex-dividend date. Income and capital gain distributions are declared separately for each class. Income and capital gain distributions are determined in accordance with income tax regulations, which may differ from GAAP. These differences resulted in distribution reclassifications.
Capital accounts within the financial statements are adjusted for permanent book-tax differences. These adjustments have no impact on net assets or the results of operations. Capital accounts are not adjusted for temporary book-tax differences which will reverse in a subsequent period.
Book-tax differences are primarily due to futures contracts, market discount, short-term gain distributions from the Underlying Funds, deferred trustees compensation, losses deferred due to wash sales and excise tax regulations.
As of period end, the cost and unrealized appreciation (depreciation) in securities, and derivatives if applicable, for federal income tax purposes were as follows:
| Gross unrealized appreciation | $21,718,113 |
| Gross unrealized depreciation | (34,899,393) |
| Net unrealized appreciation (depreciation) | $(13,181,280) |
| Tax Cost | $1,049,705,834 |
The tax-based components of distributable earnings as of period end were as follows:
| Undistributed long-term capital gain | $43,199,800 |
| Net unrealized appreciation (depreciation) on securities and other investments | $(13,181,280) |
The Fund intends to elect to defer to its next fiscal year $2,501,528 of capital losses recognized during the period November 1, 2018 to December 31, 2018.
The tax character of distributions paid was as follows:
| | December 31, 2018 | December 31, 2017 |
| Ordinary Income | $28,183,763 | $ 49,614,041 |
| Long-term Capital Gains | 27,430,764 | 101,578,405 |
| Total | $55,614,527 | $ 151,192,446 |
New Rule Issuance. During August 2018, the U.S. Securities and Exchange Commission issued Final Rule Release No. 33-10532, Disclosure Update and Simplification. This Final Rule includes amendments specific to registered investment companies that are intended to eliminate overlap in disclosure requirements between Regulation S-X and GAAP. In accordance with these amendments, certain line-items in the Fund's financial statements have been combined or removed for the current period as outlined in the table below.
| Financial Statement | Current Line-Item Presentation | Prior Line-Item Presentation |
| Statement of Assets and Liabilities | Total distributable earnings (loss) | Undistributed/Distributions in excess of/Accumulated net investment income (loss)
Accumulated/Undistributed net realized gain (loss)
Net unrealized appreciation (depreciation) |
| Statement of Changes in Net Assets | N/A - removed | Undistributed/Distributions in excess of/Accumulated net investment income (loss) end of period |
| Statement of Changes in Net Assets | Distributions to shareholders | Distributions to shareholders from net investment income
Distributions to shareholders from net realized gain |
| Distributions to Shareholders Note to Financial Statements | Distributions to shareholders | Distributions to shareholders from net investment income
Distributions to shareholders from net realized gain |
4. Derivative Instruments.
Risk Exposures and the Use of Derivative Instruments. The Fund's investment objective allows the Fund to enter into various types of derivative contracts, including futures contracts. Derivatives are investments whose value is primarily derived from underlying assets, indices or reference rates and may be transacted on an exchange or over-the-counter (OTC). Derivatives may involve a future commitment to buy or sell a specified asset based on specified terms, to exchange future cash flows at periodic intervals based on a notional principal amount, or for one party to make one or more payments upon the occurrence of specified events in exchange for periodic payments from the other party.
The Fund used derivatives to increase returns and to manage exposure to certain risks as defined below. The success of any strategy involving derivatives depends on analysis of numerous economic factors, and if the strategies for investment do not work as intended, the Fund may not achieve its objectives.
The Fund's use of derivatives increased or decreased its exposure to the following risk:
| Equity Risk | Equity risk relates to the fluctuations in the value of financial instruments as a result of changes in market prices (other than those arising from interest rate risk or foreign exchange risk), whether caused by factors specific to an individual investment, its issuer, or all factors affecting all instruments traded in a market or market segment.
|
The Fund is also exposed to additional risks from investing in derivatives, such as liquidity risk and counterparty credit risk. Liquidity risk is the risk that the Fund will be unable to close out the derivative in the open market in a timely manner. Counterparty credit risk is the risk that the counterparty will not be able to fulfill its obligation to the Fund. Counterparty credit risk related to exchange-traded futures contracts may be mitigated by the protection provided by the exchange on which they trade.
Investing in derivatives may involve greater risks than investing in the underlying assets directly and, to varying degrees, may involve risk of loss in excess of any initial investment and collateral received and amounts recognized in the Statement of Assets and Liabilities. In addition, there may be the risk that the change in value of the derivative contract does not correspond to the change in value of the underlying instrument.
Futures Contracts. A futures contract is an agreement between two parties to buy or sell a specified underlying instrument for a fixed price at a specified future date. The Fund used futures contracts to manage its exposure to the stock market.
Upon entering into a futures contract, a fund is required to deposit either cash or securities (initial margin) with a clearing broker in an amount equal to a certain percentage of the face value of the contract. Futures contracts are marked-to-market daily and subsequent daily payments (variation margin) are made or received by a fund depending on the daily fluctuations in the value of the futures contracts and are recorded as unrealized appreciation or (depreciation). This receivable and/or payable, if any, is included in daily variation margin on futures contracts in the Statement of Assets and Liabilities. Realized gain or (loss) is recorded upon the expiration or closing of a futures contract. The net realized gain (loss) and change in net unrealized appreciation (depreciation) on futures contracts during the period is presented in the Statement of Operations.
Any open futures contracts at period end are presented in the Schedule of Investments under the caption "Futures Contracts". The notional amount at value reflects each contract's exposure to the underlying instrument or index at period end. Securities deposited to meet initial margin requirements are identified in the Schedule of Investments.
5. Purchases and Redemptions of Underlying Fund Shares.
Purchases and redemptions of the Underlying Fund shares, including in-kind redemptions, aggregated $285,020,146 and $353,535,008, respectively.
6. Fees and Other Transactions with Affiliates.
Management Fee. Fidelity Management & Research Company (the investment adviser) and its affiliates provide the Fund with investment management related services for which the Fund pays a monthly management fee. The management fee is the sum of an individual fund fee rate that is based on an annual rate of .25% of the Fund's average net assets and an annualized group fee rate that averaged .24% during the period. The group fee rate is based upon the average net assets of all the mutual funds advised by the investment adviser, including any mutual funds previously advised by the investment adviser that are currently advised by Fidelity SelectCo, LLC, an affiliate of the investment adviser. The group fee rate decreases as assets under management increase and increases as assets under management decrease. For the reporting period, the total annual management fee rate was .49% of the Fund's average net assets.
The investment adviser pays a portion of the management fees received from the Fund to the Fidelity Central Funds' investment advisers, who are also affiliates, for managing the assets of the Fidelity Central Funds.
Distribution and Service Plan Fees. In accordance with Rule 12b-1 of the 1940 Act, the Fund has adopted separate 12b-1 Plans for each Service Class of shares. Each Service Class pays Fidelity Distributors Corporation (FDC), an affiliate of the investment adviser, a service fee. For the period, the service fee is based on an annual rate of .10% of Service Class' average net assets and .25% of Service Class 2's average net assets.
For the period, total fees, all of which were re-allowed to insurance companies for the distribution of shares and providing shareholder support services, were as follows:
| Service Class | $4,819 |
| Service Class 2 | 51,170 |
| | $55,989 |
Transfer Agent Fees. Fidelity Investments Institutional Operations Company, Inc. (FIIOC), an affiliate of the investment adviser, is the Fund's transfer, dividend disbursing, and shareholder servicing agent. FIIOC receives an asset-based fee with respect to each class. Each class pays a fee for transfer agent services, typesetting and printing and mailing of shareholder reports, excluding mailing of proxy statements, equal to an annual rate of class-level average net assets. The annual rate for Investor Class is .15% and the annual rate for all other classes is .07%. For the period, transfer agent fees for each class were as follows:
| Initial Class | $572,353 |
| Service Class | 3,116 |
| Service Class 2 | 13,239 |
| Investor Class | 308,287 |
| | $896,995 |
Accounting and Security Lending Fees. Fidelity Service Company, Inc. (FSC), an affiliate of the investment adviser, maintains the Fund's accounting records. The accounting fee is based on the level of average net assets for each month. Under a separate contract, FSC administers the security lending program. The security lending fee is based on the number and duration of lending transactions. For the period, the fees were equivalent to an annual rate of .04%.
Brokerage Commissions. The Fund placed a portion of its portfolio transactions with brokerage firms which are affiliates of the investment adviser. Brokerage commissions are included in net realized gain (loss) and change in net unrealized appreciation (depreciation) in the Statement of Operations. The commissions paid to these affiliated firms were $839 for the period.
Interfund Trades. The Fund may purchase from or sell securities to other Fidelity Funds under procedures adopted by the Board. The procedures have been designed to ensure these interfund trades are executed in accordance with Rule 17a-7 of the 1940 Act. Interfund trades are included within the respective purchases and sales amounts shown in the Purchases and Sales of Investments note.
Reallocation of Underlying Fund Investments. During the period, the investment adviser reallocated portions of investments of the Fund. This involved taxable redemptions of Fidelity Consumer Discretionary Central Fund and Fidelity Information Technology Central Fund for investments, including accrued interest, with a value of $18,496,311 and a non-taxable exchange of those investments, including accrued interest, for 100,699 shares of Fidelity Communication Services Central Fund (formerly Fidelity Telecom Services Central Fund). Net realized gain of $776,604 on redemptions from Fidelity Consumer Discretionary Central Fund and Fidelity Information Technology Central Fund in connection with the reallocation is included in the Statement of Operations as "Net realized gain (loss) on Fidelity Central Funds". Fidelity Communication Services Central Fund, Fidelity Consumer Discretionary Central Fund and Fidelity Information Technology Central Fund are affiliated investment companies managed by FMR.
7. Committed Line of Credit.
The Fund participates with other funds managed by the investment adviser or an affiliate in a $4.25 billion credit facility (the "line of credit") to be utilized for temporary or emergency purposes to fund shareholder redemptions or for other short-term liquidity purposes. The Fund has agreed to pay commitment fees on its pro-rata portion of the line of credit, which amounted to $3,151 and is reflected in Miscellaneous expenses on the Statement of Operations. During the period, the Fund did not borrow on this line of credit.
8. Security Lending.
The Fund lends portfolio securities through a lending agent from time to time in order to earn additional income. For equity securities, a lending agent is used and may loan securities to certain qualified borrowers, including Fidelity Capital Markets (FCM), a broker-dealer affiliated with the Fund. On the settlement date of the loan, the Fund receives collateral (in the form of U.S. Treasury obligations, letters of credit and/or cash) against the loaned securities and maintains collateral in an amount not less than 100% of the market value of the loaned securities during the period of the loan. The market value of the loaned securities is determined at the close of business of the Fund and any additional required collateral is delivered to the Fund on the next business day. The Fund or borrower may terminate the loan at any time, and if the borrower defaults on its obligation to return the securities loaned because of insolvency or other reasons, the Fund may apply collateral received from the borrower against the obligation. The Fund may experience delays and costs in recovering the securities loaned. Any cash collateral received is invested in the Fidelity Securities Lending Cash Central Fund. The value of loaned securities and cash collateral at period end are disclosed on the Fund's Statement of Assets and Liabilities. Security lending income represents the income earned on investing cash collateral, less rebates paid to borrowers and any lending agent fees associated with the loan, plus any premium payments received for lending certain types of securities. Security lending income is presented in the Statement of Operations as a component of income from Fidelity Central Funds. Total security lending income during the period amounted to $27,487. During the period, there were no securities loaned to FCM.
9. Expense Reductions.
Commissions paid to certain brokers with whom the investment adviser, or its affiliates, places trades on behalf of the Fund include an amount in addition to trade execution, which may be rebated back to the Fund to offset certain expenses. This amount totaled $7,075 for the period. Through arrangements with the Fund's custodian, credits realized as a result of certain uninvested cash balances were used to reduce the Fund's expenses. During the period, these credits reduced the Fund's custody expenses by $58.
In addition, during the period the investment adviser reimbursed and/or waived a portion of fund-level operating expenses in the amount of $11,700.
10. Distributions to Shareholders.
Distributions to shareholders of each class were as follows:
| | Year ended
December 31, 2018 | Year ended
December 31, 2017 |
| Distributions to shareholders | | |
| Initial Class | $43,900,608 | $– |
| Service Class | 235,219 | – |
| Service Class 2 | 969,884 | – |
| Investor Class | 10,508,816 | – |
| Total | $55,614,527 | $– |
| From net investment income | | |
| Initial Class | $– | $17,221,395 |
| Service Class | – | 88,590 |
| Service Class 2 | – | 334,864 |
| Investor Class | – | 3,650,622 |
| Total | $– | $21,295,471 |
| From net realized gain | | |
| Initial Class | $– | $105,443,540 |
| Service Class | – | 614,590 |
| Service Class 2 | – | 2,471,533 |
| Investor Class | – | 21,367,312 |
| Total | $– | $129,896,975 |
11. Share Transactions.
Transactions for each class of shares were as follows:
| | Shares | Shares | Dollars | Dollars |
| | Year ended December 31, 2018 | Year ended December 31, 2017 | Year ended December 31, 2018 | Year ended December 31, 2017 |
| Initial Class | | | | |
| Shares sold | 4,576,003 | 1,545,508 | $66,847,699 | $23,303,863 |
| Reinvestment of distributions | 3,109,367 | 8,456,436 | 43,900,608 | 122,664,935 |
| Shares redeemed | (11,619,127) | (9,429,410) | (171,701,667) | (142,193,085) |
| Net increase (decrease) | (3,933,757) | 572,534 | $(60,953,360) | $3,775,713 |
| Service Class | | | | |
| Shares sold | 13,766 | 32,246 | $202,445 | $490,318 |
| Reinvestment of distributions | 16,809 | 48,970 | 235,219 | 703,180 |
| Shares redeemed | (39,016) | (108,242) | (577,716) | (1,616,243) |
| Net increase (decrease) | (8,441) | (27,026) | $(140,052) | $(422,745) |
| Service Class 2 | | | | |
| Shares sold | 192,921 | 115,984 | $2,816,049 | $1,717,563 |
| Reinvestment of distributions | 70,361 | 198,362 | 969,884 | 2,806,397 |
| Shares redeemed | (297,556) | (361,686) | (4,294,360) | (5,269,021) |
| Net increase (decrease) | (34,274) | (47,340) | $(508,427) | $(745,061) |
| Investor Class | | | | |
| Shares sold | 1,679,697 | 1,515,351 | $24,882,126 | $22,923,652 |
| Reinvestment of distributions | 750,107 | 1,732,942 | 10,508,816 | 25,017,934 |
| Shares redeemed | (1,656,647) | (1,134,202) | (24,446,888) | (16,911,601) |
| Net increase (decrease) | 773,157 | 2,114,091 | $10,944,054 | $31,029,985 |
12. Other.
The Fund's organizational documents provide former and current trustees and officers with a limited indemnification against liabilities arising in connection with the performance of their duties to the Fund. In the normal course of business, the Fund may also enter into contracts that provide general indemnifications. The Fund's maximum exposure under these arrangements is unknown as this would be dependent on future claims that may be made against the Fund. The risk of material loss from such claims is considered remote.
At the end of the period, the investment adviser or its affiliates were the owners of record of 41% of the total outstanding shares of the Fund and two otherwise unaffiliated shareholders were the owners of record of 27% of the total outstanding shares of the Fund.
Report of Independent Registered Public Accounting Firm
To the Board of Trustees of Variable Insurance Products Fund V and Shareholders of VIP Asset Manager Portfolio:
Opinion on the Financial Statements and Financial Highlights
We have audited the accompanying statement of assets and liabilities of VIP Asset Manager Portfolio (the "Fund"), a fund of Variable Insurance Products Fund V, including the schedule of investments, as of December 31, 2018, and the related statement of operations for the year then ended, the statement of changes in net assets for each of the two years in the period then ended, the financial highlights for each of the five years in the period then ended, and the related notes. In our opinion, the financial statements and financial highlights present fairly, in all material respects, the financial position of the Fund as of December 31, 2018, and the results of its operations for the year then ended, the changes in its net assets for each of the two years in the period then ended, and the financial highlights for each of the five years in the period then ended, in conformity with accounting principles generally accepted in the United States of America.
Basis for Opinion
These financial statements and financial highlights are the responsibility of the Fund's management. Our responsibility is to express an opinion on the Fund's financial statements and financial highlights based on our audits. We are a public accounting firm registered with the Public Company Accounting Oversight Board (United States) (PCAOB) and are required to be independent with respect to the Fund in accordance with the U.S. federal securities laws and the applicable rules and regulations of the Securities and Exchange Commission and the PCAOB.
We conducted our audits in accordance with the standards of the PCAOB. Those standards require that we plan and perform the audit to obtain reasonable assurance about whether the financial statements and financial highlights are free of material misstatement, whether due to error or fraud. The Fund is not required to have, nor were we engaged to perform, an audit of its internal control over financial reporting. As part of our audits we are required to obtain an understanding of internal control over financial reporting but not for the purpose of expressing an opinion on the effectiveness of the Fund’s internal control over financial reporting. Accordingly, we express no such opinion.
Our audits included performing procedures to assess the risks of material misstatement of the financial statements and financial highlights, whether due to error or fraud, and performing procedures that respond to those risks. Such procedures included examining, on a test basis, evidence regarding the amounts and disclosures in the financial statements and financial highlights. Our audits also included evaluating the accounting principles used and significant estimates made by management, as well as evaluating the overall presentation of the financial statements and financial highlights. Our procedures included confirmation of securities owned as of December 31, 2018, by correspondence with the custodians and brokers; when replies were not received from brokers, we performed other auditing procedures. We believe that our audits provide a reasonable basis for our opinion.
/s/ Deloitte & Touche LLP
Boston, Massachusetts
February 19, 2019
We have served as the auditor of one or more of the Fidelity investment companies since 1999.
Trustees and Officers
The Trustees, Members of the Advisory Board (if any), and officers of the trust and fund, as applicable, are listed below. The Board of Trustees governs the fund and is responsible for protecting the interests of shareholders. The Trustees are experienced executives who meet periodically throughout the year to oversee the fund's activities, review contractual arrangements with companies that provide services to the fund, oversee management of the risks associated with such activities and contractual arrangements, and review the fund's performance. Each of the Trustees oversees 260 funds.
The Trustees hold office without limit in time except that (a) any Trustee may resign; (b) any Trustee may be removed by written instrument, signed by at least two-thirds of the number of Trustees prior to such removal; (c) any Trustee who requests to be retired or who has become incapacitated by illness or injury may be retired by written instrument signed by a majority of the other Trustees; and (d) any Trustee may be removed at any special meeting of shareholders by a two-thirds vote of the outstanding voting securities of the trust. Each Trustee who is not an interested person (as defined in the 1940 Act) of the trust and the fund is referred to herein as an Independent Trustee. Each Independent Trustee shall retire not later than the last day of the calendar year in which his or her 75th birthday occurs. The Independent Trustees may waive this mandatory retirement age policy with respect to individual Trustees. Officers and Advisory Board Members hold office without limit in time, except that any officer or Advisory Board Member may resign or may be removed by a vote of a majority of the Trustees at any regular meeting or any special meeting of the Trustees. Except as indicated, each individual has held the office shown or other offices in the same company for the past five years.
The fund’s Statement of Additional Information (SAI) includes more information about the Trustees. To request a free copy, call Fidelity at 1-877-208-0098.
Experience, Skills, Attributes, and Qualifications of the Trustees. The Governance and Nominating Committee has adopted a statement of policy that describes the experience, qualifications, attributes, and skills that are necessary and desirable for potential Independent Trustee candidates (Statement of Policy). The Board believes that each Trustee satisfied at the time he or she was initially elected or appointed a Trustee, and continues to satisfy, the standards contemplated by the Statement of Policy. The Governance and Nominating Committee also engages professional search firms to help identify potential Independent Trustee candidates who have the experience, qualifications, attributes, and skills consistent with the Statement of Policy. From time to time, additional criteria based on the composition and skills of the current Independent Trustees, as well as experience or skills that may be appropriate in light of future changes to board composition, business conditions, and regulatory or other developments, have also been considered by the professional search firms and the Governance and Nominating Committee. In addition, the Board takes into account the Trustees' commitment and participation in Board and committee meetings, as well as their leadership of standing and ad hoc committees throughout their tenure.
In determining that a particular Trustee was and continues to be qualified to serve as a Trustee, the Board has considered a variety of criteria, none of which, in isolation, was controlling. The Board believes that, collectively, the Trustees have balanced and diverse experience, qualifications, attributes, and skills, which allow the Board to operate effectively in governing the fund and protecting the interests of shareholders. Information about the specific experience, skills, attributes, and qualifications of each Trustee, which in each case led to the Board's conclusion that the Trustee should serve (or continue to serve) as a trustee of the fund, is provided below.
Board Structure and Oversight Function. Abigail P. Johnson is an interested person and currently serves as Chairman. The Trustees have determined that an interested Chairman is appropriate and benefits shareholders because an interested Chairman has a personal and professional stake in the quality and continuity of services provided to the fund. Independent Trustees exercise their informed business judgment to appoint an individual of their choosing to serve as Chairman, regardless of whether the Trustee happens to be independent or a member of management. The Independent Trustees have determined that they can act independently and effectively without having an Independent Trustee serve as Chairman and that a key structural component for assuring that they are in a position to do so is for the Independent Trustees to constitute a substantial majority for the Board. The Independent Trustees also regularly meet in executive session. Arthur E. Johnson serves as Chairman of the Independent Trustees and as such (i) acts as a liaison between the Independent Trustees and management with respect to matters important to the Independent Trustees and (ii) with management prepares agendas for Board meetings.
Fidelity® funds are overseen by different Boards of Trustees. The fund's Board oversees Fidelity's investment-grade bond, money market, asset allocation and certain equity funds, and other Boards oversee Fidelity's high income and other equity funds. The asset allocation funds may invest in Fidelity® funds that are overseen by such other Boards. The use of separate Boards, each with its own committee structure, allows the Trustees of each group of Fidelity® funds to focus on the unique issues of the funds they oversee, including common research, investment, and operational issues. On occasion, the separate Boards establish joint committees to address issues of overlapping consequences for the Fidelity® funds overseen by each Board.
The Trustees operate using a system of committees to facilitate the timely and efficient consideration of all matters of importance to the Trustees, the fund, and fund shareholders and to facilitate compliance with legal and regulatory requirements and oversight of the fund's activities and associated risks. The Board, acting through its committees, has charged FMR and its affiliates with (i) identifying events or circumstances the occurrence of which could have demonstrably adverse effects on the fund's business and/or reputation; (ii) implementing processes and controls to lessen the possibility that such events or circumstances occur or to mitigate the effects of such events or circumstances if they do occur; and (iii) creating and maintaining a system designed to evaluate continuously business and market conditions in order to facilitate the identification and implementation processes described in (i) and (ii) above. Because the day-to-day operations and activities of the fund are carried out by or through FMR, its affiliates, and other service providers, the fund's exposure to risks is mitigated but not eliminated by the processes overseen by the Trustees. While each of the Board's committees has responsibility for overseeing different aspects of the fund's activities, oversight is exercised primarily through the Operations and Audit Committees. In addition, an ad hoc Board committee of Independent Trustees has worked with FMR to enhance the Board's oversight of investment and financial risks, legal and regulatory risks, technology risks, and operational risks, including the development of additional risk reporting to the Board. Appropriate personnel, including but not limited to the fund's Chief Compliance Officer (CCO), FMR's internal auditor, the independent accountants, the fund's Treasurer and portfolio management personnel, make periodic reports to the Board's committees, as appropriate, including an annual review of Fidelity's risk management program for the Fidelity® funds. The responsibilities of each standing committee, including their oversight responsibilities, are described further under "Standing Committees of the Trustees."
Interested Trustees*:
Correspondence intended for a Trustee who is an interested person may be sent to Fidelity Investments, 245 Summer Street, Boston, Massachusetts 02210.
Name, Year of Birth; Principal Occupations and Other Relevant Experience+
Abigail P. Johnson (1961)
Year of Election or Appointment: 2009
Trustee
Chairman of the Board of Trustees
Ms. Johnson also serves as Trustee of other Fidelity® funds. Ms. Johnson serves as Chairman (2016-present), Chief Executive Officer (2014-present), and Director (2007-present) of FMR LLC (diversified financial services company), President of Fidelity Financial Services (2012-present) and President of Personal, Workplace and Institutional Services (2005-present). Ms. Johnson is Chairman and Director of FMR Co., Inc. (investment adviser firm, 2011-present) and Chairman and Director of FMR (investment adviser firm, 2011-present). Previously, Ms. Johnson served as Vice Chairman (2007-2016) and President (2013-2016) of FMR LLC, President and a Director of FMR (2001-2005), a Trustee of other investment companies advised by FMR, Fidelity Investments Money Management, Inc. (investment adviser firm), and FMR Co., Inc. (2001-2005), Senior Vice President of the Fidelity® funds (2001-2005), and managed a number of Fidelity® funds. Ms. Abigail P. Johnson and Mr. Arthur E. Johnson are not related.
Jennifer Toolin McAuliffe (1959)
Year of Election or Appointment: 2016
Trustee
Ms. McAuliffe also serves as Trustee of other Fidelity® funds. Ms. McAuliffe previously served as a Member of the Advisory Board of certain Fidelity® funds (2016) and as Co-Head of Fixed Income of Fidelity Investments Limited (now known as FIL Limited (FIL)) (diversified financial services company). Earlier roles at FIL included Director of Research for FIL’s credit and quantitative teams in London, Hong Kong and Tokyo. Ms. McAuliffe also was the Director of Research for taxable and municipal bonds at Fidelity Investments Money Management, Inc. Ms. McAuliffe is also a director or trustee of several not-for-profit entities.
* Determined to be an “Interested Trustee” by virtue of, among other things, his or her affiliation with the trust or various entities under common control with FMR.
+ The information includes the Trustee's principal occupation during the last five years and other information relating to the experience, attributes, and skills relevant to the Trustee's qualifications to serve as a Trustee, which led to the conclusion that the Trustee should serve as a Trustee for the fund.
Independent Trustees:
Correspondence intended for an Independent Trustee may be sent to Fidelity Investments, P.O. Box 55235, Boston, Massachusetts 02205-5235.
Name, Year of Birth; Principal Occupations and Other Relevant Experience+
Elizabeth S. Acton (1951)
Year of Election or Appointment: 2013
Trustee
Ms. Acton also serves as Trustee of other Fidelity® funds. Prior to her retirement in April 2012, Ms. Acton was Executive Vice President, Finance (2011-2012), Executive Vice President, Chief Financial Officer (2002-2011), and Treasurer (2004-2005) of Comerica Incorporated (financial services). Prior to joining Comerica, Ms. Acton held a variety of positions at Ford Motor Company (1983-2002), including Vice President and Treasurer (2000-2002) and Executive Vice President and Chief Financial Officer of Ford Motor Credit Company (1998-2000). Ms. Acton currently serves as a member of the Board of Directors and Audit and Finance Committees of Beazer Homes USA, Inc. (homebuilding, 2012-present). Previously, Ms. Acton served as a Member of the Advisory Board of certain Fidelity® funds (2013-2016).
Ann E. Dunwoody (1953)
Year of Election or Appointment: 2018
Trustee
General Dunwoody also serves as Trustee of other Fidelity® funds. General Dunwoody (United States Army, Retired) was the first woman in U.S. military history to achieve the rank of four-star general and prior to her retirement in 2012 held a variety of positions within the U.S. Army, including Commanding General, U.S. Army Material Command (2008-2012). She is the President of First to Four LLC (leadership and mentoring services, 2012-present). She also serves as a member of the Board of Directors and Nominating and Corporate Governance Committee of L3 Technologies, Inc. (communication, electronic, sensor, and aerospace systems, 2013-present), Board of Directors and Nomination and Corporate Governance Committees of Kforce Inc. (professional staffing services, 2016-present) and Board of Directors of Automattic Inc. (software engineering, 2018-present). Previously, General Dunwoody served as a Member of the Advisory Board of certain Fidelity® funds (2018), a member of the Board of Directors and Audit and Sustainability and Corporate Responsibility Committees of Republic Services, Inc. (waste collection, disposal and recycling, 2013-2016). Ms. Dunwoody also serves on several boards for non-profit organizations, including as a member of the Board of Directors, Chair of the Nomination and Governance Committee and member of the Audit Committee of Logistics Management Institute (consulting non-profit, 2012-present), a member of the Board of Directors of the Army Historical Foundation (2015-present), a member of the Council of Trustees for the Association of the United States Army (advocacy non-profit, 2013-present) and a member of the Board of Trustees of Florida Institute of Technology (2015-present) and ThanksUSA (military family education non-profit, 2014-present).
John Engler (1948)
Year of Election or Appointment: 2014
Trustee
Mr. Engler also serves as Trustee of other Fidelity® funds. He serves on the board of directors for Universal Forest Products (manufacturer and distributor of wood and wood-alternative products, 2003-present) and K12 Inc. (technology-based education company, 2012-present). Previously, Mr. Engler served as interim president of Michigan State University (2018-2019), a Member of the Advisory Board of certain Fidelity® funds (2014-2016), president of the Business Roundtable (2011-2017), a trustee of The Munder Funds (2003-2014), president and CEO of the National Association of Manufacturers (2004-2011), member of the Board of Trustees of the Annie E. Casey Foundation (2004-2015), and as governor of Michigan (1991-2003). He is a past chairman of the National Governors Association.
Robert F. Gartland (1951)
Year of Election or Appointment: 2010
Trustee
Mr. Gartland also serves as Trustee of other Fidelity® funds. Mr. Gartland is Chairman and an investor in Gartland & Mellina Group Corp. (consulting, 2009-present). Previously, Mr. Gartland served as a partner and investor of Vietnam Partners LLC (investments and consulting, 2008-2011). Prior to his retirement, Mr. Gartland held a variety of positions at Morgan Stanley (financial services, 1979-2007), including Managing Director (1987-2007), and Chase Manhattan Bank (1975-1978).
Arthur E. Johnson (1947)
Year of Election or Appointment: 2008
Trustee
Chairman of the Independent Trustees
Mr. Johnson also serves as Trustee of other Fidelity® funds. Mr. Johnson serves as a member of the Board of Directors of Eaton Corporation plc (diversified power management, 2009-present) and Booz Allen Hamilton (management consulting, 2011-present). Prior to his retirement, Mr. Johnson served as Senior Vice President of Corporate Strategic Development of Lockheed Martin Corporation (defense contractor, 1999-2009). He previously served on the Board of Directors of IKON Office Solutions, Inc. (1999-2008), AGL Resources, Inc. (holding company, 2002-2016), and Delta Airlines (2005-2007). Mr. Arthur E. Johnson is not related to Ms. Abigail P. Johnson.
Michael E. Kenneally (1954)
Year of Election or Appointment: 2009
Trustee
Vice Chairman of the Independent Trustees
Mr. Kenneally also serves as Trustee of other Fidelity® funds. Prior to his retirement, Mr. Kenneally served as Chairman and Global Chief Executive Officer of Credit Suisse Asset Management. Before joining Credit Suisse, he was an Executive Vice President and Chief Investment Officer for Bank of America Corporation. Earlier roles at Bank of America included Director of Research, Senior Portfolio Manager and Research Analyst, and Mr. Kenneally was awarded the Chartered Financial Analyst (CFA) designation in 1991.
Marie L. Knowles (1946)
Year of Election or Appointment: 2001
Trustee
Ms. Knowles also serves as Trustee of other Fidelity® funds. Prior to Ms. Knowles' retirement in June 2000, she served as Executive Vice President and Chief Financial Officer of Atlantic Richfield Company (ARCO) (diversified energy, 1996-2000). From 1993 to 1996, she was a Senior Vice President of ARCO and President of ARCO Transportation Company (pipeline and tanker operations). Ms. Knowles currently serves as a Director and Chairman of the Audit Committee of McKesson Corporation (healthcare service, since 2002). Ms. Knowles is a member of the Board of the Santa Catalina Island Company (real estate, 2009-present). Ms. Knowles is a Member of the Investment Company Institute Board of Governors and a Member of the Governing Council of the Independent Directors Council (2014-present). She also serves as a member of the Advisory Board for the School of Engineering of the University of Southern California. Previously, Ms. Knowles served as a Director of Phelps Dodge Corporation (copper mining and manufacturing, 1994-2007), URS Corporation (engineering and construction, 2000-2003) and America West (airline, 1999-2002). Ms. Knowles previously served as Chairman (2015-2018) and Vice Chairman (2012-2015) of the Independent Trustees of certain Fidelity® funds.
Mark A. Murray (1954)
Year of Election or Appointment: 2016
Trustee
Mr. Murray also serves as Trustee of other Fidelity® funds. Mr. Murray is Vice Chairman (2013-present) of Meijer, Inc. (regional retail chain). Previously, Mr. Murray served as a Member of the Advisory Board of certain Fidelity® funds (2016) and as Co-Chief Executive Officer (2013-2016) and President (2006-2013) of Meijer, Inc. Mr. Murray serves as a member of the Board of Directors and Nuclear Review and Public Policy and Responsibility Committees of DTE Energy Company (diversified energy company, 2009-present). Mr. Murray also serves as a member of the Board of Directors of Spectrum Health (not-for-profit health system, 2015-present). Mr. Murray previously served as President of Grand Valley State University (2001-2006), Treasurer for the State of Michigan (1999-2001), Vice President of Finance and Administration for Michigan State University (1998-1999), and a member of the Board of Directors and Audit Committee and Chairman of the Nominating and Corporate Governance Committee of Universal Forest Products, Inc. (manufacturer and distributor of wood and wood-alternative products, 2004-2016). Mr. Murray is also a director or trustee of many community and professional organizations.
+ The information includes the Trustee's principal occupation during the last five years and other information relating to the experience, attributes, and skills relevant to the Trustee's qualifications to serve as a Trustee, which led to the conclusion that the Trustee should serve as a Trustee for the fund.
Advisory Board Members and Officers:
Correspondence intended for an officer may be sent to Fidelity Investments, 245 Summer Street, Boston, Massachusetts 02210. Officers appear below in alphabetical order.
Name, Year of Birth; Principal Occupation
Elizabeth Paige Baumann (1968)
Year of Election or Appointment: 2017
Anti-Money Laundering (AML) Officer
Ms. Baumann also serves as AML Officer of other funds. She is Chief AML Officer (2012-present) and Senior Vice President (2014-present) of FMR LLC (diversified financial services company) and is an employee of Fidelity Investments. Previously, Ms. Baumann served as AML Officer of the funds (2012-2016), and Vice President (2007-2014) and Deputy Anti-Money Laundering Officer (2007-2012) of FMR LLC.
Craig S. Brown (1977)
Year of Election or Appointment: 2019
Assistant Treasurer
Mr. Brown also serves as Assistant Treasurer of other funds. Mr. Brown is an employee of Fidelity Investments (2013-present).
John J. Burke III (1964)
Year of Election or Appointment: 2018
Chief Financial Officer
Mr. Burke also serves as Chief Financial Officer of other funds. Mr. Burke serves as Head of Investment Operations for Fidelity Fund and Investment Operations (2018-present) and is an employee of Fidelity Investments (1998-present). Previously Mr. Burke served as head of Asset Management Investment Operations (2012-2018).
William C. Coffey (1969)
Year of Election or Appointment: 2018
Secretary and Chief Legal Officer (CLO)
Mr. Coffey also serves as Secretary and CLO of other funds. Mr. Coffey serves as CLO, Secretary, and Senior Vice President of Fidelity Management & Research Company and FMR Co., Inc. (investment adviser firms, 2018-present); Secretary of Fidelity SelectCo, LLC and Fidelity Investments Money Management, Inc. (investment adviser firms, 2018-present); and CLO of Fidelity Management & Research (Hong Kong) Limited, FMR Investment Management (UK) Limited, and Fidelity Management & Research (Japan) Limited (investment adviser firms, 2018-present). He is Senior Vice President and Deputy General Counsel of FMR LLC (diversified financial services company, 2010-present), and is an employee of Fidelity Investments. Previously, Mr. Coffey served as Assistant Secretary of certain funds (2009-2018) and as Vice President and Associate General Counsel of FMR LLC (2005-2009).
Jonathan Davis (1968)
Year of Election or Appointment: 2010
Assistant Treasurer
Mr. Davis also serves as Assistant Treasurer of other funds. Mr. Davis serves as Assistant Treasurer of FMR Capital, Inc. (2017-present) and is an employee of Fidelity Investments. Previously, Mr. Davis served as Vice President and Associate General Counsel of FMR LLC (diversified financial services company, 2003-2010).
Adrien E. Deberghes (1967)
Year of Election or Appointment: 2010
Assistant Treasurer
Mr. Deberghes also serves as an officer of other funds. He serves as Assistant Treasurer of FMR Capital, Inc. (2017-present), Executive Vice President of Fidelity Investments Money Management, Inc. (FIMM) (investment adviser firm, 2016-present), and is an employee of Fidelity Investments (2008-present). Previously, Mr. Deberghes served as President and Treasurer of certain Fidelity® funds (2013-2018). Prior to joining Fidelity Investments, Mr. Deberghes was Senior Vice President of Mutual Fund Administration at State Street Corporation (2007-2008), Senior Director of Mutual Fund Administration at Investors Bank & Trust (2005-2007), and Director of Finance for Dunkin' Brands (2000-2005). Previously, Mr. Deberghes served in other fund officer roles.
Laura M. Del Prato (1964)
Year of Election or Appointment: 2018
President and Treasurer
Ms. Del Prato also serves as an officer of other funds. Ms. Del Prato is an employee of Fidelity Investments (2017-present). Prior to joining Fidelity Investments, Ms. Del Prato served as a Managing Director and Treasurer of the JPMorgan Mutual Funds (2014-2017). Prior to JPMorgan, Ms. Del Prato served as a partner at Cohen Fund Audit Services (accounting firm, 2012-2013) and KPMG LLP (accounting firm, 2004-2012).
Colm A. Hogan (1973)
Year of Election or Appointment: 2016
Assistant Treasurer
Mr. Hogan also serves as an officer of other funds. Mr. Hogan serves as Assistant Treasurer of FMR Capital, Inc. (2017-present) and is an employee of Fidelity Investments (2005-present). Previously, Mr. Hogan served as Assistant Treasurer of certain Fidelity® funds (2016-2018).
Chris Maher (1972)
Year of Election or Appointment: 2013
Assistant Treasurer
Mr. Maher serves as Assistant Treasurer of other funds. Mr. Maher is Vice President of Valuation Oversight, serves as Assistant Treasurer of FMR Capital, Inc. (2017-present), and is an employee of Fidelity Investments. Previously, Mr. Maher served as Vice President of Asset Management Compliance (2013), Vice President of the Program Management Group of FMR (investment adviser firm, 2010-2013), and Vice President of Valuation Oversight (2008-2010).
John B. McGinty, Jr. (1962)
Year of Election or Appointment: 2016
Chief Compliance Officer
Mr. McGinty also serves as Chief Compliance Officer of other funds. Mr. McGinty is Senior Vice President of Asset Management Compliance for Fidelity Investments and is an employee of Fidelity Investments (2016-present). Mr. McGinty previously served as Vice President, Senior Attorney at Eaton Vance Management (investment management firm, 2015-2016), and prior to Eaton Vance as global CCO for all firm operations and registered investment companies at GMO LLC (investment management firm, 2009-2015). Before joining GMO LLC, Mr. McGinty served as Senior Vice President, Deputy General Counsel for Fidelity Investments (2007-2009).
Jason P. Pogorelec (1975)
Year of Election or Appointment: 2015
Assistant Secretary
Mr. Pogorelec also serves as Assistant Secretary of other funds. Mr. Pogorelec serves as Vice President, Associate General Counsel (2010-present) and is an employee of Fidelity Investments (2006-present).
Nancy D. Prior (1967)
Year of Election or Appointment: 2014
Vice President
Ms. Prior also serves as Vice President of other funds. Ms. Prior serves as President Fixed Income, High Income/Emerging Market Debt and Multi Asset Class Strategies of FIAM LLC (2018-present), President (2016-present) and Director (2014-present) of Fidelity Investments Money Management, Inc. (FIMM) (investment adviser firm), President, Fixed Income (2014-present), and is an employee of Fidelity Investments (2002-present). Previously, Ms. Prior served as Vice Chairman of FIAM LLC (investment adviser firm, 2014-2018), a Director of FMR Investment Management (UK) Limited (investment adviser firm, 2015-2018), President Multi-Asset Class Strategies of FMR's Global Asset Allocation Division (2017-2018), Vice President of Fidelity's Money Market Funds (2012-2014), President, Money Market and Short Duration Bond Group of Fidelity Management & Research (FMR) (investment adviser firm, 2013-2014), President, Money Market Group of FMR (2011-2013), Managing Director of Research (2009-2011), Senior Vice President and Deputy General Counsel (2007-2009), and Assistant Secretary of certain Fidelity® funds (2008-2009).
Stacie M. Smith (1974)
Year of Election or Appointment: 2013
Assistant Treasurer
Ms. Smith also serves as an officer of other funds. Ms. Smith serves as Assistant Treasurer of FMR Capital, Inc. (2017-present), is an employee of Fidelity Investments (2009-present), and has served in other fund officer roles. Prior to joining Fidelity Investments, Ms. Smith served as Senior Audit Manager of Ernst & Young LLP (accounting firm, 1996-2009). Previously, Ms. Smith served as Assistant Treasurer (2013-2018) and Deputy Treasurer (2013-2016) of certain Fidelity® funds.
Marc L. Spector (1972)
Year of Election or Appointment: 2016
Deputy Treasurer
Mr. Spector also serves as an officer of other funds. Mr. Spector serves as Assistant Treasurer of FMR Capital, Inc. (2017-present) and is an employee of Fidelity Investments (2016-present). Prior to joining Fidelity Investments, Mr. Spector served as Director at the Siegfried Group (accounting firm, 2013-2016), and prior to Siegfried Group as audit senior manager at Deloitte & Touche (accounting firm, 2005-2013).
Jim Wegmann (1979)
Year of Election or Appointment: 2019
Assistant Treasurer
Mr. Wegmann also serves as Assistant Treasurer of other funds. Mr. Wegmann is an employee of Fidelity Investments (2011-present).
Shareholder Expense Example
As a shareholder of the Fund, you incur two types of costs: (1) transaction costs and (2) ongoing costs, including management fees, distribution and/or service (12b-1) fees and other Fund expenses. This Example is intended to help you understand your ongoing costs (in dollars) of investing in the Fund and to compare these costs with the ongoing costs of investing in other mutual funds.
The Example is based on an investment of $1,000 invested at the beginning of the period and held for the entire period (July 1, 2018 to December 31, 2018).
Actual Expenses
The first line of the accompanying table for each class of the Fund provides information about actual account values and actual expenses. You may use the information in this line, together with the amount you invested, to estimate the expenses that you paid over the period. Simply divide your account value by $1,000.00 (for example, an $8,600 account value divided by $1,000.00 = 8.6), then multiply the result by the number in the first line for a class of the Fund under the heading entitled "Expenses Paid During Period" to estimate the expenses you paid on your account during this period. The estimate of expenses does not include any fees or other expenses of any variable annuity or variable life insurance product. If they were, the estimate of expenses you paid during the period would be higher, and your ending account value would be lower. In addition, the Fund, as a shareholder in the underlying Fidelity Central Funds, will indirectly bear its pro-rata share of the fees and expenses incurred by the underlying Fidelity Central Funds. These fees and expenses are not included in the Fund's annualized expense ratio used to calculate the expense estimate in the table below.
Hypothetical Example for Comparison Purposes
The second line of the accompanying table for each class of the Fund provides information about hypothetical account values and hypothetical expenses based on a Class' actual expense ratio and an assumed rate of return of 5% per year before expenses, which is not the Class' actual return. The hypothetical account values and expenses may not be used to estimate the actual ending account balance or expenses you paid for the period. You may use this information to compare the ongoing costs of investing in the Fund and other funds. To do so, compare this 5% hypothetical example with the 5% hypothetical examples that appear in the shareholder reports of the other funds. The estimate of expenses does not include any fees or other expenses of any variable annuity or variable life insurance product. If they were, the estimate of expenses you paid during the period would be higher, and your ending account value would be lower. In addition, the Fund, as a shareholder in the underlying Fidelity Central Funds, will indirectly bear its pro-rata share of the fees and expenses incurred by the underlying Fidelity Central Funds. These fees and expenses are not included in the Fund's annualized expense ratio used to calculate the expense estimate in the table below.
Please note that the expenses shown in the table are meant to highlight your ongoing costs only and do not reflect any transaction costs. Therefore, the second line of the table is useful in comparing ongoing costs only, and will not help you determine the relative total costs of owning different funds.
| | Annualized Expense Ratio-A | Beginning
Account Value
July 1, 2018 | Ending
Account Value
December 31, 2018 | Expenses Paid
During Period-B
July 1, 2018
to December 31, 2018 |
| Initial Class | .60% | | | |
| Actual | | $1,000.00 | $941.00 | $2.94 |
| Hypothetical-C | | $1,000.00 | $1,022.18 | $3.06 |
| Service Class | .70% | | | |
| Actual | | $1,000.00 | $940.80 | $3.42 |
| Hypothetical-C | | $1,000.00 | $1,021.68 | $3.57 |
| Service Class 2 | .85% | | | |
| Actual | | $1,000.00 | $939.60 | $4.16 |
| Hypothetical-C | | $1,000.00 | $1,020.92 | $4.33 |
| Investor Class | .68% | | | |
| Actual | | $1,000.00 | $941.20 | $3.33 |
| Hypothetical-C | | $1,000.00 | $1,021.78 | $3.47 |
A Annualized expense ratio reflects expenses net of applicable fee waivers.
B Expenses are equal to each Class' annualized expense ratio, multiplied by the average account value over the period, multiplied by 184/365 (to reflect the one-half year period). The fees and expenses of the underlying Fidelity Central Funds in which the Fund invests are not included in each Class' annualized expense ratio. In addition to the expenses noted above, the Fund also indirectly bears its proportional share of the expenses of the underlying Fidelity Central Funds. Annualized expenses of the underlying non-money market Fidelity Central Funds as of their most recent fiscal half year ranged from less than .005% to .07%.
C 5% return per year before expenses
Distributions (Unaudited)
The Board of Trustees of VIP Asset Manager Portfolio voted to pay to shareholders of record at the opening of business on record date, the following distributions per share derived from capital gains realized from sales of portfolio securities.
| | Pay Date | Record Date | Capital Gains |
| VIP Asset Manager Portfolio | | | |
| Initial Class | 02/08/19 | 02/08/19 | $0.593 |
| Service Class | 02/08/19 | 02/08/19 | $0.593 |
| Service Class 2 | 02/08/19 | 02/08/19 | $0.593 |
| Investor Class | 02/08/19 | 02/08/19 | $0.593 |
|
The fund hereby designates as a capital gain dividend with respect to the taxable year ended December 31, 2018, $ 44,212,287 or, if subsequently determined to be different, the net capital gain of such year.
A total of 6.52% of the dividends distributed during the fiscal year was derived from interest on U.S. Government securities which is generally exempt from state income tax.
Initial Class designates 1% and 20%; Service Class designates 1% and 21%; Service Class 2 designates 1% and 23% and Investor Class designates 1% and 21% of the dividends distributed in February and December 2018, respectively, during the fiscal year as qualifying for the dividends–received deduction for corporate shareholders.
The amounts per share which represent income derived from sources within, and taxes paid to, foreign countries or possessions of the United States are as follows:
| | Pay Date | Income | Taxes |
| VIP Asset Manager Portfolio | | | |
| Initial Class | 12/28/2018 | $0.0262 | $0.0051 |
| Service Class | 12/28/2018 | $0.0250 | $0.0051 |
| Service Class 2 | 12/28/2018 | $0.0233 | $0.0051 |
| Investor Class | 12/28/2018 | $0.0253 | $0.0051 |
Board Approval of Investment Advisory Contracts and Management Fees
VIP Asset Manager Portfolio
Each year, the Board of Trustees, including the Independent Trustees (together, the Board), votes on the renewal of the management contract with Fidelity Management & Research Company (FMR) and the sub-advisory agreements (together, the Advisory Contracts) for the fund. FMR and the sub-advisers are referred to herein as the Investment Advisers. The Board, assisted by the advice of fund counsel and Independent Trustees' counsel, requests and considers a broad range of information relevant to the renewal of the Advisory Contracts throughout the year.
The Board meets regularly and, at each of its meetings, covers an extensive agenda of topics and materials and considers factors that are relevant to its annual consideration of the renewal of the fund's Advisory Contracts, including the services and support provided to the fund and its shareholders. The Board has established four standing committees (Committees) — Operations, Audit, Fair Valuation, and Governance and Nominating — each composed of and chaired by Independent Trustees with varying backgrounds, to which the Board has assigned specific subject matter responsibilities in order to enhance effective decision-making by the Board. The Operations Committee, of which all of the Independent Trustees are members, meets regularly throughout the year and considers, among other matters, information specifically related to the annual consideration of the renewal of the fund's Advisory Contracts. The Board, acting directly and through its Committees, requests and receives information concerning the annual consideration of the renewal of the fund's Advisory Contracts. The Board also meets as needed to review matters specifically related to the Board's annual consideration of the renewal of the Advisory Contracts. Members of the Board may also meet with trustees of other Fidelity funds through joint ad hoc committees to discuss certain matters relevant to all of the Fidelity funds.
At its September 2018 meeting, the Board unanimously determined to renew the fund's Advisory Contracts. In reaching its determination, the Board considered all factors it believed relevant, including (i) the nature, extent, and quality of the services to be provided to the fund and its shareholders (including the investment performance of the fund); (ii) the competitiveness of the fund's management fee and total expense ratio relative to peer funds; (iii) the total costs of the services to be provided by and the profits to be realized by Fidelity from its relationships with the fund; and (iv) the extent to which, if any, economies of scale exist and would be realized as the fund grows, and whether any economies of scale are appropriately shared with fund shareholders.
In considering whether to renew the Advisory Contracts for the fund, the Board reached a determination, with the assistance of fund counsel and Independent Trustees' counsel and through the exercise of its business judgment, that the renewal of the Advisory Contracts was in the best interests of the fund and its shareholders and that the compensation payable under the Advisory Contracts was fair and reasonable. The Board's decision to renew the Advisory Contracts was not based on any single factor, but rather was based on a comprehensive consideration of all the information provided to the Board at its meetings throughout the year. The Board, in reaching its determination to renew the Advisory Contracts, was aware that shareholders of the fund have a broad range of investment choices available to them, including a wide choice among funds offered by Fidelity's competitors, and that the fund's shareholders, who have the opportunity to review and weigh the disclosure provided by the fund in its prospectus and other public disclosures, have chosen to invest in this fund, which is part of the Fidelity family of funds.
Nature, Extent, and Quality of Services Provided. The Board considered Fidelity's staffing as it relates to the fund, including the backgrounds of investment personnel of Fidelity, and also considered the fund's investment objective, strategies, and related investment philosophy. The Independent Trustees also had discussions with senior management of Fidelity's investment operations and investment groups. The Board considered the structure of the investment personnel compensation program and whether this structure provides appropriate incentives to act in the best interests of the fund. Additionally, the Board considered the portfolio managers' investments, if any, in the funds that they manage.
Resources Dedicated to Investment Management and Support Services. The Board reviewed the general qualifications and capabilities of Fidelity's investment staff, including its size, education, experience, and resources, as well as Fidelity's approach to recruiting, managing, and compensating investment personnel. The Board noted that Fidelity has continued to increase the resources devoted to non-U.S. offices, including expansion of Fidelity's global investment organization. The Board also noted that Fidelity's analysts have extensive resources, tools and capabilities that allow them to conduct sophisticated quantitative and fundamental analysis, as well as credit analysis of issuers, counterparties and guarantors. Further, the Board considered that Fidelity's investment professionals have sufficient access to global information and data so as to provide competitive investment results over time, and that those professionals also have access to sophisticated tools that permit them to assess portfolio construction and risk and performance attribution characteristics continuously, as well as to transmit new information and research conclusions rapidly around the world. Additionally, in its deliberations, the Board considered Fidelity's trading, risk management, compliance, and technology and operations capabilities and resources, which are integral parts of the investment management process.
Shareholder and Administrative Services. The Board considered (i) the nature, extent, quality, and cost of advisory, administrative, and shareholder services performed by the Investment Advisers and their affiliates under the Advisory Contracts and under separate agreements covering transfer agency, pricing and bookkeeping, and securities lending services for the fund; (ii) the nature and extent of the supervision of third party service providers, principally custodians, subcustodians, and pricing vendors; and (iii) the resources devoted to, and the record of compliance with, the fund's compliance policies and procedures. The Board also reviewed the allocation of fund brokerage, including allocations to brokers affiliated with the Investment Advisers, the use of brokerage commissions to pay fund expenses, and the use of "soft" commission dollars to pay for research services.
The Board noted that the growth of fund assets over time across the complex allows Fidelity to reinvest in the development of services designed to enhance the value and convenience of the Fidelity funds as investment vehicles. These services include 24-hour access to account information and market information through telephone representatives and over the Internet, investor education materials and asset allocation tools, and the expanded availability of Fidelity Investor Centers.
Investment in a Large Fund Family. The Board considered the benefits to shareholders of investing in a Fidelity fund, including the benefits of investing in a fund that is part of a large family of funds offering a variety of investment disciplines and providing a large variety of mutual fund investor services. The Board noted that Fidelity had taken, or had made recommendations that resulted in the Fidelity funds taking, a number of actions over the previous year that benefited particular funds, including: (i) continuing to dedicate additional resources to Fidelity's investment research process, which includes meetings with management of issuers of securities in which the funds invest, and to the support of the senior management team that oversees asset management; (ii) continuing efforts to enhance Fidelity's global research capabilities; (iii) launching new funds and making other enhancements to meet client needs; (iv) launching new share classes of existing funds; (v) eliminating purchase minimums and broadening eligibility requirements for certain funds and share classes; (vi) reducing management fees and total expenses for certain growth equity funds and index funds; (vii) lowering expense caps for certain existing funds and classes, and converting certain voluntary expense caps to contractual caps, to reduce expenses borne by shareholders; (viii) eliminating short-term redemption fees for funds that had such fees; (ix) rationalizing product lines and gaining increased efficiencies from fund mergers and share class consolidations; (x) continuing to develop, acquire and implement systems and technology to improve services to the funds and shareholders, strengthen information security, and increase efficiency; and (xi) continuing to implement enhancements to further strengthen Fidelity's product line to increase investors' probability of success in achieving their investment goals, including retirement income goals.
Investment Performance. The Board considered whether the fund has operated in accordance with its investment objective, as well as its record of compliance with its investment restrictions and its performance history. The Board noted that there was a portfolio management change for the fund in April 2018.
The Board took into account discussions that occur at Board meetings throughout the year with representatives of the Investment Advisers about fund investment performance. In this regard the Board noted that as part of regularly scheduled fund reviews and other reports to the Board on fund performance, the Board considers annualized return information for the fund for different time periods, measured against one or more appropriate securities market indices, including a customized blended index that reflects the respective weights of the fund's asset classes (each a "benchmark index") and a peer group of funds with similar objectives ("peer group"), if any. In its evaluation of fund investment performance at meetings throughout the year, the Board gave particular attention to information indicating underperformance of certain Fidelity funds for specific time periods and discussed with the Investment Advisers the reasons for such underperformance.
In addition to reviewing absolute and relative fund performance, the Independent Trustees periodically consider the appropriateness of fund performance metrics in evaluating the results achieved. In general, the Independent Trustees believe that fund performance should be evaluated based on gross performance (before fees and expenses but after transaction costs) compared to appropriate benchmark indices, over appropriate time periods that may include full market cycles, and on net performance (after fees and expenses) compared to peer groups, as applicable, over the same periods, taking into account relevant factors including the following: general market conditions; expectations for interest rate levels and credit conditions; issuer-specific information including credit quality; and fund cash flows and other factors. Depending on the circumstances, the Independent Trustees may be satisfied with a fund's performance notwithstanding that it lags its benchmark index or peer group for certain periods.
The Independent Trustees recognize that shareholders evaluate performance on a net basis over their own holding periods, for which one-, three-, and five-year periods are often used as a proxy. For this reason, the performance information reviewed by the Board also included net cumulative calendar year total return information for the fund and an appropriate benchmark index and peer group for the most recent one-, three-, and five-year periods.
Based on its review, the Board concluded that the nature, extent, and quality of services provided to the fund under the Advisory Contracts should continue to benefit the shareholders of the fund.
Competitiveness of Management Fee and Total Expense Ratio. The Board considered the fund's management fee and total expense ratio compared to "mapped groups" of competitive funds and classes created for the purpose of facilitating the Trustees' competitive analysis of management fees and total expenses. Fidelity creates "mapped groups" by combining similar Lipper investment objective categories that have comparable investment mandates. Combining Lipper investment objective categories aids the Board's management fee and total expense ratio comparisons by broadening the competitive group used for comparison.
Management Fee. The Board considered two proprietary management fee comparisons for the 12-month periods shown in basis points (BP) in the chart below. The group of Lipper funds used by the Board for management fee comparisons is referred to below as the "Total Mapped Group." The Total Mapped Group comparison focuses on a fund's standing in terms of gross management fees before expense reimbursements or caps relative to the total universe of funds with comparable investment mandates, regardless of whether their management fee structures also are comparable. Funds with comparable investment mandates offer exposure to similar types of securities. Funds with comparable management fee structures have similar management fee contractual arrangements (
e.g., flat rate charged for advisory services, all-inclusive fee rate,
etc.). "TMG %" represents the percentage of funds in the Total Mapped Group that had management fees that were lower than the fund's. For example, a hypothetical TMG % of 20% would mean that 80% of the funds in the Total Mapped Group had higher, and 20% had lower, management fees than the fund. The fund's actual TMG %s and the number of funds in the Total Mapped Group are in the chart below. The "Asset-Size Peer Group" (ASPG) comparison focuses on a fund's standing relative to a subset of non-Fidelity funds within the Total Mapped Group that are similar in size and management fee structure. For example, if a fund is in the first quartile of the ASPG, the fund's management fee ranks in the least expensive or lowest 25% of funds in the ASPG. The ASPG represents at least 15% of the funds in the Total Mapped Group with comparable asset size and management fee structures, subject to a minimum of 50 funds (or all funds in the Total Mapped Group if fewer than 50). Additional information, such as the ASPG quartile in which the fund's management fee rate ranked, is also included in the chart and was considered by the Board.
VIP Asset Manager Portfolio
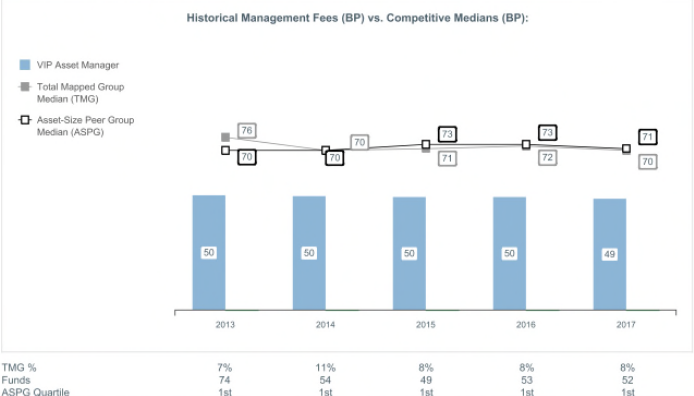
The Board noted that the fund's management fee rate ranked below the median of its Total Mapped Group and below the median of its ASPG for 2017.
The Board noted that it and the boards of other Fidelity funds formed an ad hoc Committee on Group Fee, which meets periodically, to conduct an in-depth review of the "group fee" component of the management fee of funds with such management fee structures. The Committee's focus included the mechanics of the group fee, the competitive landscape of group fee structures, Fidelity funds with no group fee component and investment products not included in group fee assets. The Board also considered that, for funds subject to the group fee, FMR agreed to voluntarily waive fees over a specified period of time in amounts designed to account for assets converted from certain funds to certain collective investment trusts.
Based on its review, the Board concluded that the fund's management fee is fair and reasonable in light of the services that the fund receives and the other factors considered.
Total Expense Ratio. In its review of each class's total expense ratio, the Board considered the fund's management fee rate as well as other fund or class expenses, as applicable, such as transfer agent fees, pricing and bookkeeping fees, fund-paid 12b-1 fees, and custodial, legal, and audit fees. The Board also noted that Fidelity may agree to waive fees and expenses from time to time, and the extent to which, if any, it has done so for the fund. As part of its review, the Board also considered the current and historical total expense ratios of each class of the fund compared to competitive fund median expenses. Each class of the fund is compared to those funds and classes in the Total Mapped Group (used by the Board for management fee comparisons) that have a similar sales load structure.
The Board noted that the total expense ratio of each class ranked below the competitive median for 2017.
Fees Charged to Other Fidelity Clients. The Board also considered Fidelity fee structures and other information with respect to clients of Fidelity, such as other funds advised or subadvised by Fidelity, pension plan clients, and other institutional clients with similar mandates. The Board noted that a joint ad hoc committee created by it and the boards of other Fidelity funds periodically reviews and compares Fidelity's institutional investment advisory business with its business of providing services to the Fidelity funds and also noted the most recent findings of the committee. The Board noted that the committee's review included a consideration of the differences in services provided, fees charged, and costs incurred, as well as competition in the markets serving the different categories of clients.
Based on its review of total expense ratios and fees charged to other Fidelity clients, the Board concluded that the total expense ratio of each class of the fund was reasonable in light of the services that the fund and its shareholders receive and the other factors considered.
Costs of the Services and Profitability. The Board considered the revenues earned and the expenses incurred by Fidelity in conducting the business of developing, marketing, distributing, managing, administering and servicing the fund and servicing the fund's shareholders. The Board also considered the level of Fidelity's profits in respect of all the Fidelity funds.
On an annual basis, Fidelity presents to the Board information about the profitability of its relationships with the fund. Fidelity calculates profitability information for each fund, as well as aggregate profitability information for groups of Fidelity funds and all Fidelity funds, using a series of detailed revenue and cost allocation methodologies which originate with the books and records of Fidelity on which Fidelity's audited financial statements are based. The Audit Committee of the Board reviews any significant changes from the prior year's methodologies.
PricewaterhouseCoopers LLP (PwC), auditor to Fidelity and certain Fidelity funds, has been engaged annually by the Board as part of the Board's assessment of Fidelity's profitability analysis. PwC's engagement includes the review and assessment of the methodologies used by Fidelity in determining the revenues and expenses attributable to Fidelity's mutual fund business, and completion of agreed-upon procedures in respect of the mathematical accuracy of the fund profitability information and its conformity to established allocation methodologies. After considering PwC's reports issued under the engagement and information provided by Fidelity, the Board concluded that while other allocation methods may also be reasonable, Fidelity's profitability methodologies are reasonable in all material respects.
The Board also reviewed Fidelity's non-fund businesses and potential indirect benefits such businesses may have received as a result of their association with Fidelity's mutual fund business (i.e., fall-out benefits) as well as cases where Fidelity's affiliates may benefit from the fund's business. The Board noted that changes to fall-out benefits year-over-year reflect business developments at Fidelity's various businesses.
The Board considered the costs of the services provided by and the profits realized by Fidelity in connection with the operation of the fund and was satisfied that the profitability was not excessive.
Economies of Scale. The Board considered whether there have been economies of scale in respect of the management of the Fidelity funds, whether the Fidelity funds (including the fund) have appropriately benefited from any such economies of scale, and whether there is potential for realization of any further economies of scale. The Board considered the extent to which the fund will benefit from economies of scale as assets grow through increased services to the fund, through waivers or reimbursements, or through fee or expense ratio reductions. The Board also noted that a committee (the Economies of Scale Committee) created by it and the boards of other Fidelity funds periodically analyzes whether Fidelity attains economies of scale in respect of the management and servicing of the Fidelity funds, whether the Fidelity funds have appropriately benefited from such economies of scale, and whether there is potential for realization of any further economies of scale.
The Board recognized that the fund's management contract incorporates a "group fee" structure, which provides for lower group fee rates as total group assets increase, and for higher group fee rates as total group assets decrease (with "group assets" defined to include fund assets under FMR's management plus the assets of sector funds previously under FMR's management). FMR calculates the group fee rates based on a tiered asset "breakpoint" schedule that varies based on asset class. The Board considered that the group fee is designed to deliver the benefits of economies of scale to fund shareholders when total Fidelity fund assets increase, even if assets of any particular fund are unchanged or have declined, because some portion of Fidelity's costs are attributable to services provided to all Fidelity funds, and all funds benefit if those costs can be allocated among more assets. The Board concluded that, given the group fee structure, fund shareholders will benefit from lower management fees as group assets increase at the fund complex level, regardless of whether Fidelity achieves any such economies of scale.
The Board concluded, taking into account the analysis of the Economies of Scale Committee, that economies of scale, if any, are being appropriately shared between fund shareholders and Fidelity.
Additional Information Requested by the Board. In order to develop fully the factual basis for consideration of the Fidelity funds' advisory contracts, the Board requested and received additional information on certain topics, including: (i) Fidelity's fund profitability methodology, profitability trends for certain funds, the allocation of various costs to different funds, and the impact of certain factors on fund profitability results; (ii) portfolio manager changes that have occurred during the past year and the amount of the investment that each portfolio manager has made in the Fidelity fund(s) that he or she manages; (iii) Fidelity's compensation structure for portfolio managers, research analysts, and other key personnel, including its effects on fund profitability, the rationale for the compensation structure, and the extent to which current market conditions have affected retention and recruitment; (iv) the arrangements with and compensation paid to certain fund sub-advisers on behalf of the Fidelity funds and the treatment of such compensation within Fidelity's fund profitability methodology; (v) the terms of Fidelity's voluntary expense limitation agreements; (vi) the methodology with respect to competitive fund data and peer group classifications; (vii) Fidelity's transfer agent fee, expense, and service structures for different funds and classes relative to competitive trends, and the impact of the increased use of omnibus accounts; (viii) new developments in the retail and institutional marketplaces and the competitive positioning of the funds relative to other investment products and services; (ix) the impact of recent changes to the money market fund landscape, including the full implementation of money market fund reform and rising interest rates, on Fidelity's money market funds; (x) the funds' share class structures and distribution channels; and (xi) explanations regarding the relative total expense ratios of certain funds and classes, total expense competitive trends and methodologies for total expense competitive comparisons, and actions that might be taken by Fidelity to reduce total expense ratios for certain classes. In addition, the Board considered its discussions with Fidelity throughout the year regarding enhanced information security initiatives and the funds' fair valuation policies.
Based on its evaluation of all of the conclusions noted above, and after considering all factors it believed relevant, the Board concluded that the advisory fee arrangements are fair and reasonable, and that the fund's Advisory Contracts should be renewed.
VIPAM-ANN-0219
1.540206.121
Fidelity® Variable Insurance Products: Strategic Income Portfolio
Annual Report December 31, 2018 |
|
Beginning on January 1, 2021, as permitted by regulations adopted by the Securities and Exchange Commission, and if your insurance carrier elects to participate, you may not be receiving paper copies of the Fund’s shareholder reports from the insurance company that offers your variable insurance product unless you specifically request paper copies from your financial professional or the administrator of your variable insurance product. Instead, the reports will be made available on a website, and you will be notified by mail each time a report is posted and provided with a website link to access the report.
If you already elected to receive shareholder reports electronically, you will not be affected by this change and you need not take any action. You may elect to receive shareholder reports and other communications from the Fund electronically, by contacting your financial professional or the administrator of your variable insurance product. If you own a Fidelity-administered variable insurance product, please visit fidelity.com/mailpreferences to make your election or call 1-800-343-3548.
You may elect to receive all future reports in paper free of charge. If you wish to continue receiving paper copies of your shareholder reports, you may contact your financial professional or the administrator of your variable insurance product. If you own a Fidelity-administered variable insurance product, please visit fidelity.com/mailpreferences to make your election or call 1-800-343-3548. Your election to receive reports in paper will apply to all funds available under your variable insurance product.
Contents
To view a fund's proxy voting guidelines and proxy voting record for the 12-month period ended June 30, visit http://www.fidelity.com/proxyvotingresults or visit the Securities and Exchange Commission's (SEC) web site at http://www.sec.gov.
You may also call 1-877-208-0098 to request a free copy of the proxy voting guidelines.
Fidelity® Variable Insurance Products are separate account options which are purchased through a variable insurance contract.
Standard & Poor's, S&P and S&P 500 are registered service marks of The McGraw-Hill Companies, Inc. and have been licensed for use by Fidelity Distributors Corporation.
Other third-party marks appearing herein are the property of their respective owners.
All other marks appearing herein are registered or unregistered trademarks or service marks of FMR LLC or an affiliated company. © 2019 FMR LLC. All rights reserved.
This report and the financial statements contained herein are submitted for the general information of the shareholders of the Fund. This report is not authorized for distribution to prospective investors in the Fund unless preceded or accompanied by an effective prospectus.
A fund files its complete schedule of portfolio holdings with the SEC for the first and third quarters of each fiscal year on Form N-Q. Forms N-Q are available on the SEC’s web site at http://www.sec.gov. A fund's Forms N-Q may be reviewed and copied at the SEC’s Public Reference Room in Washington, DC. Information regarding the operation of the SEC's Public Reference Room may be obtained by calling 1-800-SEC-0330.
For a complete list of a fund's portfolio holdings, view the most recent holdings listing, semiannual report, or annual report on Fidelity's web site at http://www.fidelity.com, http://www.institutional.fidelity.com, or http://www.401k.com, as applicable.
NOT FDIC INSURED •MAY LOSE VALUE •NO BANK GUARANTEE
Neither the Fund nor Fidelity Distributors Corporation is a bank.
Performance: The Bottom Line
Performance numbers are net of all underlying fund operating expenses, but do not include any insurance charges imposed by your insurance company’s separate account. If performance information included the effect of these additional charges, the total returns would have been lower.
Average annual total return reflects the change in the value of an investment, assuming reinvestment of distributions from dividend income and capital gains (the profits earned upon the sale of securities that have grown in value, if any) and assuming a constant rate of performance each year. During periods of reimbursement by Fidelity, a fund’s total return will be greater than it would be had the reimbursement not occurred. Performance numbers are net of all underlying fund operating expenses, but do not include any insurance charges imposed by your insurance company’s separate account. If performance information included the effect of these additional charges, the total returns would have been lower. How a fund did yesterday is no guarantee of how it will do tomorrow.
Average Annual Total Returns
| For the periods ended December 31, 2018 | Past 1 year | Past 5 years | Past 10 years |
| Initial Class | (2.57)% | 2.99% | 6.72% |
| Service Class | (2.68)% | 2.89% | 6.62% |
| Service Class 2 | (2.82)% | 2.73% | 6.46% |
| Investor Class | (2.62)% | 2.95% | 6.69% |
$10,000 Over 10 Years
Let's say hypothetically that $10,000 was invested in VIP Strategic Income Portfolio - Initial Class on December 31, 2008.
The chart shows how the value of your investment would have changed, and also shows how the Bloomberg Barclays U.S. Universal Bond Index performed over the same period.

| Period Ending Values |
| $19,160 | VIP Strategic Income Portfolio - Initial Class |
| $14,884 | Bloomberg Barclays U.S. Universal Bond Index |
Management's Discussion of Fund Performance
Market Recap: In 2018, the U.S. economy continued its robust expansion, even as volatile financial markets in the fourth quarter suggested investors were becoming nervous about the pace of that growth. Against this backdrop, the Fidelity Strategic Income Composite Index℠ returned -1.44%, with three of the five asset classes reflected in this index losing ground. Non-U.S. developed-market bonds struggled amid a variety of factors, including escalating trade tension, a surging U.S. dollar, tepid economic growth in Europe, global central bank tightening, concerns about Italy’s budget stalemate with the EU, and weakness in China. For the year, the Bloomberg Barclays Global Aggregate Developed Markets GDP Weighted ex USD Index returned -3.08%. Several of these aforementioned factors, coupled with the generally “risk off” environment that spurred higher-quality bonds to outperform riskier credits, also weighed on emerging-market bonds, as the Bloomberg Barclays Emerging Markets Aggregate USD Bond Index returned -2.46%. Meanwhile, U.S. high-yield bonds, as measured by the ICE BofAML
®U.S. High Yield Constrained Index, returned -2.27%, reflecting widening credit spreads. U.S. Treasuries gained modest ground, with the Bloomberg Barclays US Government Bond Index adding 0.88%. Of final note, following a turbulent December, floating-rate bank loans eked out a 0.60% gain in 2018, as measured by the S&P/LSTA
® Leveraged Performing Loan Index.
Comments from Co-Lead Portfolio Manager Adam Kramer: For the year, the fund's share classes returned about -3%, lagging the -0.25% result of our primary benchmark, the Bloomberg Barclays U.S. Universal Bond Index, as well as the -1.44% return of the Fidelity Strategic Income Composite Index℠. We see the Composite index, given its mix of investments, as a closer match for the fund. By far, the biggest negative came from subpar security selection in the fund's high-yield bond subportfolio. Security selection in the fund's emerging-markets debt subportfolio also detracted, though to a lesser extent. On the positive side, asset allocation was positive overall, including our decision to overweight floating-rate debt. These securities' high yields and limited duration added to their performance in a mostly rising interest-rate environment. Another source of added value was our small position in long-dated U.S. Treasury futures, which we added to the portfolio around midyear. This modest out-of-benchmark allocation contributed to relative performance, given that Treasuries outperformed the Composite index. Another positive performance factor was our underweighting in non-U.S. developed market debt, the worst-performing category in the fund's investment universe. In contrast, the only negative performance factor stemming from asset allocation was our slight underweighting in U.S. government bonds, which in total outperformed the index for the year.
The views expressed above reflect those of the portfolio manager(s) only through the end of the period as stated on the cover of this report and do not necessarily represent the views of Fidelity or any other person in the Fidelity organization. Any such views are subject to change at any time based upon market or other conditions and Fidelity disclaims any responsibility to update such views. These views may not be relied on as investment advice and, because investment decisions for a Fidelity fund are based on numerous factors, may not be relied on as an indication of trading intent on behalf of any Fidelity fund.
Notes to Shareholders: On December 1, 2018, Timothy Gill assumed co-management responsibilities for the emerging-markets debt subportfolio, joining Co-Manager Jonathan Kelly. On March 28, 2019, Ario Emami Nejad and Rosie McMellin will assume co-management responsibilities for the Developed Market Debt subportfolio, succeeding David Simner.
Investment Summary (Unaudited)
The information in the following tables is based on the combined investments of the Fund and its pro-rata share of the investments of Fidelity's Fixed-Income Central Funds.
Top Five Holdings as of December 31, 2018
| (by issuer, excluding cash equivalents) | % of fund's net assets |
| U.S. Treasury Obligations | 16.1 |
| Freddie Mac | 2.4 |
| Ginnie Mae guaranteed REMIC pass-thru certificates | 2.3 |
| Japan Government | 2.3 |
| Ally Financial, Inc. | 1.8 |
| | 24.9 |
Top Five Market Sectors as of December 31, 2018
| | % of fund's net assets |
| Financials | 12.6 |
| Energy | 8.2 |
| Communication Services | 7.3 |
| Consumer Discretionary | 6.1 |
| Information Technology | 4.2 |
Quality Diversification (% of fund's net assets)
| As of December 31, 2018 |
| | U.S. Government and U.S. Government Agency Obligations* | 23.6% |
| | AAA,AA,A | 9.3% |
| | BBB | 6.0% |
| | BB | 21.3% |
| | B | 20.7% |
| | CCC,CC,C | 4.6% |
| | Not Rated | 1.4% |
| | Equities | 4.6% |
| | Short-Term Investments and Net Other Assets | 8.5% |

* Includes NCUA Guaranteed Notes
We have used ratings from Moody's Investors Service, Inc. Where Moody's® ratings are not available, we have used S&P® ratings. All ratings are as of the date indicated and do not reflect subsequent changes.
Asset Allocation (% of fund's net assets)
| As of December 31, 2018*,** |
| | Preferred Securities | 4.7% |
| | Corporate Bonds | 33.6% |
| | U.S. Government and U.S. Government Agency Obligations*** | 23.6% |
| | Foreign Government & Government Agency Obligations | 14.7% |
| | Bank Loan Obligations | 9.5% |
| | Stocks | 4.6% |
| | Other Investments | 0.8% |
| | Short-Term Investments and Net Other Assets (Liabilities) | 8.5% |
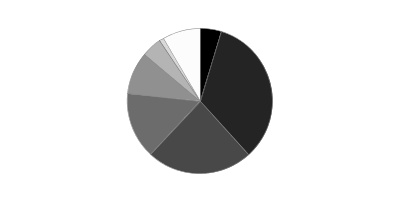
* Foreign investments - 31.7%
** Futures and Swaps - 4.6%
*** Includes NCUA Guaranteed Notes
An unaudited holdings listing for the Fund, which presents direct holdings as well as the pro-rata share of any securities and other investments held indirectly through its investment in underlying non-money market Fidelity Central Funds, is available at fidelity.com and/or institutional.fidelity.com, as applicable.
Percentages in the above tables are adjusted for the effect of TBA Sale Commitments.
Schedule of Investments December 31, 2018
Showing Percentage of Net Assets
| Corporate Bonds - 33.3% | | | |
| | | Principal Amount(a) | Value |
| Convertible Bonds - 0.0% | | | |
| CONSUMER DISCRETIONARY - 0.0% | | | |
| Auto Components - 0.0% | | | |
| Exide Technologies 7% 4/30/25 pay-in-kind (b) | | $620,406 | $341,223 |
| Nonconvertible Bonds - 33.3% | | | |
| COMMUNICATION SERVICES - 5.5% | | | |
| Diversified Telecommunication Services - 1.6% | | | |
| AT&T, Inc. 3.15% 9/4/36 | EUR | 1,925,000 | 2,101,682 |
| Axtel S.A.B. de CV 6.375% 11/14/24 (c) | | 450,000 | 427,190 |
| Citizens Communications Co.: | | | |
| 7.875% 1/15/27 | | 280,000 | 135,800 |
| 9% 8/15/31 | | 220,000 | 117,700 |
| Colombia Telecomunicaciones SA 5.375% 9/27/22 (c) | | 320,000 | 318,800 |
| Frontier Communications Corp. 8.5% 4/1/26 (c) | | 1,595,000 | 1,395,625 |
| GCI, Inc. 6.875% 4/15/25 | | 560,000 | 543,200 |
| GTH Finance BV: | | | |
| 6.25% 4/26/20 (c) | | 130,000 | 131,648 |
| 7.25% 4/26/23 (c) | | 1,180,000 | 1,209,151 |
| Level 3 Financing, Inc.: | | | |
| 5.125% 5/1/23 | | 575,000 | 554,875 |
| 5.375% 5/1/25 | | 575,000 | 539,063 |
| Oztel Holdings SPC Ltd. 5.625% 10/24/23 (c) | | 295,000 | 281,460 |
| Sable International Finance Ltd. 6.875% 8/1/22 (c) | | 1,701,000 | 1,735,871 |
| SFR Group SA: | | | |
| 7.375% 5/1/26 (c) | | 5,100,000 | 4,679,250 |
| 8.125% 2/1/27 (c) | | 370,000 | 348,725 |
| Sprint Capital Corp.: | | | |
| 6.875% 11/15/28 | | 1,497,000 | 1,414,665 |
| 8.75% 3/15/32 | | 1,906,000 | 2,010,830 |
| Telefonica Celular del Paraguay SA 6.75% 12/13/22 (c) | | 600,000 | 605,100 |
| Telenet Finance Luxembourg Notes SARL 5.5% 3/1/28 (c) | | 1,400,000 | 1,267,000 |
| Turk Telekomunikasyon A/S 3.75% 6/19/19 (c) | | 305,000 | 300,673 |
| U.S. West Communications: | | | |
| 6.875% 9/15/33 | | 170,000 | 151,973 |
| 7.25% 9/15/25 | | 35,000 | 36,050 |
| UPCB Finance IV Ltd. 5.375% 1/15/25 (c) | | 615,000 | 575,099 |
| Virgin Media Finance PLC 4.875% 2/15/22 | | 565,000 | 557,938 |
| | | | 21,439,368 |
| Entertainment - 0.5% | | | |
| Lions Gate Entertainment Corp. 5.875% 11/1/24 (c) | | 215,000 | 210,700 |
| Netflix, Inc.: | | | |
| 4.375% 11/15/26 | | 640,000 | 578,688 |
| 5.375% 2/1/21 | | 230,000 | 232,875 |
| 5.75% 3/1/24 | | 527,000 | 534,246 |
| 5.875% 2/15/25 | | 1,395,000 | 1,407,206 |
| 5.875% 11/15/28 (c) | | 3,265,000 | 3,181,514 |
| New Cotai LLC/New Cotai Capital Corp. 10.625% 5/1/19 pay-in-kind (b)(c) | | 1,992,665 | 1,095,966 |
| WMG Acquisition Corp. 5.625% 4/15/22 (c) | | 92,000 | 91,770 |
| | | | 7,332,965 |
| Media - 2.4% | | | |
| Altice SA 7.625% 2/15/25 (c) | | 1,965,000 | 1,468,838 |
| Block Communications, Inc. 6.875% 2/15/25 (c) | | 480,000 | 481,200 |
| Cablevision SA 6.5% 6/15/21 (c) | | 200,000 | 192,750 |
| CCO Holdings LLC/CCO Holdings Capital Corp.: | | | |
| 5% 2/1/28 (c) | | 2,685,000 | 2,470,200 |
| 5.125% 2/15/23 | | 1,565,000 | 1,525,875 |
| 5.125% 5/1/23 (c) | | 720,000 | 700,200 |
| 5.125% 5/1/27 (c) | | 3,500,000 | 3,259,900 |
| 5.375% 5/1/25 (c) | | 720,000 | 690,300 |
| 5.5% 5/1/26 (c) | | 2,450,000 | 2,355,063 |
| 5.75% 9/1/23 | | 500,000 | 497,500 |
| 5.75% 1/15/24 | | 555,000 | 549,450 |
| 5.75% 2/15/26 (c) | | 1,030,000 | 1,009,400 |
| 5.875% 5/1/27 (c) | | 855,000 | 829,350 |
| CSC Holdings LLC: | | | |
| 5.125% 12/15/21 (c) | | 1,490,000 | 1,460,200 |
| 5.375% 2/1/28 (c) | | 1,190,000 | 1,094,419 |
| 5.5% 5/15/26 (c) | | 2,555,000 | 2,408,088 |
| 7.5% 4/1/28 (c) | | 725,000 | 723,188 |
| Globo Comunicacao e Participacoes SA: | | | |
| 4.843% 6/8/25 (c) | | 525,000 | 494,293 |
| 4.875% 4/11/22 (c) | | 250,000 | 247,253 |
| 5.125% 3/31/27 (c) | | 205,000 | 189,730 |
| iHeartCommunications, Inc. 11.25% 3/1/21 (c)(d) | | 630,000 | 403,200 |
| Liberty Media Corp.: | | | |
| 8.25% 2/1/30 | | 1,610,000 | 1,569,750 |
| 8.5% 7/15/29 | | 270,000 | 271,350 |
| Nielsen Finance LLC/Nielsen Finance Co. 5% 4/15/22 (c) | | 295,000 | 281,725 |
| Quebecor Media, Inc. 5.75% 1/15/23 | | 790,000 | 793,950 |
| Sirius XM Radio, Inc.: | | | |
| 4.625% 5/15/23 (c) | | 260,000 | 248,950 |
| 5% 8/1/27 (c) | | 735,000 | 671,606 |
| 5.375% 4/15/25 (c) | | 620,000 | 587,450 |
| 5.375% 7/15/26 (c) | | 620,000 | 579,700 |
| Tegna, Inc. 5.5% 9/15/24 (c) | | 110,000 | 106,563 |
| TV Azteca SA de CV 8.25% 8/9/24 (Reg. S) | | 1,900,000 | 1,824,019 |
| Videotron Ltd. 5.125% 4/15/27 (c) | | 615,000 | 581,175 |
| VTR Finance BV 6.875% 1/15/24 (c) | | 859,000 | 859,000 |
| Ziggo Bond Finance BV 6% 1/15/27 (c) | | 635,000 | 555,625 |
| Ziggo Secured Finance BV 5.5% 1/15/27 (c) | | 1,270,000 | 1,136,650 |
| | | | 33,117,910 |
| Wireless Telecommunication Services - 1.0% | | | |
| America Movil S.A.B. de CV 6.45% 12/5/22 | MXN | 12,930,000 | 580,647 |
| Comcel Trust 6.875% 2/6/24 (c) | | 855,000 | 870,595 |
| Digicel Group Ltd. 6.75% 3/1/23 (c) | | 350,000 | 276,938 |
| Intelsat Jackson Holdings SA 5.5% 8/1/23 | | 1,395,000 | 1,213,650 |
| Millicom International Cellular SA 6% 3/15/25 (c) | | 360,000 | 355,687 |
| MTN (Mauritius) Investments Ltd.: | | | |
| 5.373% 2/13/22 (c) | | 100,000 | 96,979 |
| 6.5% 10/13/26 (c) | | 230,000 | 223,761 |
| MTS International Funding Ltd. 5% 5/30/23 (c) | | 240,000 | 233,592 |
| Sprint Communications, Inc. 6% 11/15/22 | | 1,410,000 | 1,383,675 |
| Sprint Corp.: | | | |
| 7.125% 6/15/24 | | 2,940,000 | 2,913,716 |
| 7.625% 2/15/25 | | 1,655,000 | 1,655,000 |
| 7.625% 3/1/26 | | 2,150,000 | 2,123,125 |
| 7.875% 9/15/23 | | 1,505,000 | 1,544,506 |
| TBG Global Pte. Ltd. 5.25% 2/10/22 (Reg. S) | | 400,000 | 391,346 |
| | | | 13,863,217 |
| TOTAL COMMUNICATION SERVICES | | | 75,753,460 |
| CONSUMER DISCRETIONARY - 3.2% | | | |
| Auto Components - 0.3% | | | |
| Allison Transmission, Inc. 5% 10/1/24 (c) | | 635,000 | 609,600 |
| Delphi Technologies PLC 5% 10/1/25 (c) | | 680,000 | 571,200 |
| Exide Technologies 11% 4/30/22 pay-in-kind (b)(c) | | 607,440 | 485,952 |
| Metalsa SA de CV 4.9% 4/24/23 (c) | | 1,640,000 | 1,559,902 |
| Tenneco, Inc. 5% 7/15/26 | | 450,000 | 346,163 |
| | | | 3,572,817 |
| Automobiles - 0.2% | | | |
| Renault SA 2% 9/28/26 (Reg. S) | EUR | 2,000,000 | 2,264,286 |
| Distributors - 0.0% | | | |
| LKQ Corp. 4.75% 5/15/23 | | 115,000 | 109,250 |
| Hotels, Restaurants & Leisure - 2.1% | | | |
| 1011778 BC Unlimited Liability Co./New Red Finance, Inc. 5% 10/15/25 (c) | | 3,296,000 | 3,032,320 |
| Boyd Gaming Corp.: | | | |
| 6% 8/15/26 | | 325,000 | 303,875 |
| 6.375% 4/1/26 | | 202,000 | 195,435 |
| Cedar Fair LP/Canada's Wonderland Co. 5.375% 4/15/27 | | 345,000 | 326,025 |
| Choice Hotels International, Inc. 5.75% 7/1/22 | | 145,000 | 147,900 |
| Churchill Downs, Inc. 4.75% 1/15/28 (c) | | 465,000 | 420,686 |
| Delta Merger Sub, Inc. 6% 9/15/26 (c) | | 400,000 | 378,000 |
| Eldorado Resorts, Inc. 6% 4/1/25 | | 1,125,000 | 1,085,220 |
| FelCor Lodging LP 6% 6/1/25 | | 565,000 | 577,713 |
| GLP Capital LP/GLP Financing II, Inc.: | | | |
| 5.25% 6/1/25 | | 615,000 | 610,646 |
| 5.75% 6/1/28 | | 485,000 | 489,850 |
| Golden Nugget, Inc.: | | | |
| 6.75% 10/15/24 (c) | | 1,200,000 | 1,131,000 |
| 8.75% 10/1/25 (c) | | 1,235,000 | 1,188,688 |
| Hilton Domestic Operating Co., Inc. 5.125% 5/1/26 (c) | | 925,000 | 888,000 |
| Hilton Worldwide Finance LLC/Hilton Worldwide Finance Corp.: | | | |
| 4.625% 4/1/25 | | 925,000 | 876,438 |
| 4.875% 4/1/27 | | 435,000 | 407,813 |
| International Game Technology PLC 6.25% 1/15/27 (c) | | 830,000 | 796,800 |
| Jacobs Entertainment, Inc. 7.875% 2/1/24 (c) | | 150,000 | 154,500 |
| KFC Holding Co./Pizza Hut Holding LLC: | | | |
| 4.75% 6/1/27 (c) | | 475,000 | 441,750 |
| 5% 6/1/24 (c) | | 475,000 | 458,375 |
| 5.25% 6/1/26 (c) | | 3,225,000 | 3,120,284 |
| LHMC Finco SARL 7.875% 12/20/23 (c) | | 600,000 | 592,680 |
| LTF Merger Sub, Inc. 8.5% 6/15/23 (c) | | 380,000 | 384,750 |
| Marriott Ownership Resorts, Inc. 6.5% 9/15/26 (c) | | 460,000 | 443,900 |
| MCE Finance Ltd. 4.875% 6/6/25 (c) | | 1,502,000 | 1,379,270 |
| Merlin Entertainments PLC 5.75% 6/15/26 (c) | | 615,000 | 607,313 |
| MGM Growth Properties Operating Partnership LP 5.625% 5/1/24 | | 365,000 | 361,350 |
| MGM Mirage, Inc.: | | | |
| 4.625% 9/1/26 | | 460,000 | 412,850 |
| 5.75% 6/15/25 | | 1,265,000 | 1,203,774 |
| Penn National Gaming, Inc. 5.625% 1/15/27 (c) | | 120,000 | 107,400 |
| Silversea Cruises 7.25% 2/1/25 (c) | | 255,000 | 269,586 |
| Six Flags Entertainment Corp.: | | | |
| 4.875% 7/31/24 (c) | | 715,000 | 673,888 |
| 5.5% 4/15/27(c) | | 380,000 | 358,150 |
| Stars Group Holdings BV 7% 7/15/26 (c) | | 785,000 | 763,413 |
| Station Casinos LLC 5% 10/1/25 (c) | | 620,000 | 561,100 |
| Studio City Co. Ltd.: | | | |
| 5.875% 11/30/19 (c) | | 420,000 | 423,150 |
| 7.25% 11/30/21 (c) | | 1,085,000 | 1,105,214 |
| Viking Cruises Ltd. 5.875% 9/15/27 (c) | | 595,000 | 554,838 |
| Voc Escrow Ltd. 5% 2/15/28 (c) | | 545,000 | 502,763 |
| Wynn Las Vegas LLC/Wynn Las Vegas Capital Corp. 5.25% 5/15/27 (c) | | 480,000 | 422,400 |
| Wynn Macau Ltd.: | | | |
| 4.875% 10/1/24 (c) | | 725,000 | 645,250 |
| 5.5% 10/1/27 (c) | | 1,170,000 | 1,017,900 |
| | | | 29,822,257 |
| Household Durables - 0.3% | | | |
| Lennar Corp. 4.75% 11/29/27 | | 620,000 | 559,550 |
| LGI Homes, Inc. 6.875% 7/15/26 (c) | | 605,000 | 542,988 |
| Reynolds Group Issuer, Inc./Reynolds Group Issuer LLC/Reynolds Group Issuer (Luxembourg) SA: | | | |
| 5.125% 7/15/23 (c) | | 285,000 | 271,463 |
| 7% 7/15/24 (c) | | 360,000 | 342,900 |
| Taylor Morrison Communities, Inc./Monarch Communities, Inc. 5.875% 4/15/23 (c) | | 435,000 | 419,775 |
| Toll Brothers Finance Corp. 4.375% 4/15/23 | | 281,000 | 263,438 |
| TRI Pointe Homes, Inc.: | | | |
| 4.375% 6/15/19 | | 320,000 | 317,600 |
| 5.875% 6/15/24 | | 780,000 | 696,150 |
| William Lyon Homes, Inc.: | | | |
| 5.875% 1/31/25 | | 380,000 | 323,000 |
| 6% 9/1/23 | | 375,000 | 337,500 |
| | | | 4,074,364 |
| Internet & Direct Marketing Retail - 0.3% | | | |
| Netflix, Inc. 4.875% 4/15/28 | | 1,465,000 | 1,336,520 |
| Zayo Group LLC/Zayo Capital, Inc.: | | | |
| 5.75% 1/15/27 (c) | | 1,605,000 | 1,432,463 |
| 6% 4/1/23 | | 580,000 | 548,825 |
| 6.375% 5/15/25 | | 120,000 | 111,600 |
| | | | 3,429,408 |
| Specialty Retail - 0.0% | | | |
| Penske Automotive Group, Inc. 5.5% 5/15/26 | | 460,000 | 427,800 |
| Sonic Automotive, Inc. 6.125% 3/15/27 | | 160,000 | 140,000 |
| | | | 567,800 |
| TOTAL CONSUMER DISCRETIONARY | | | 43,840,182 |
| CONSUMER STAPLES - 1.2% | | | |
| Beverages - 0.0% | | | |
| Central American Bottling Corp. 5.75% 1/31/27 (c) | | 105,000 | 102,769 |
| Food & Staples Retailing - 0.1% | | | |
| ESAL GmbH 6.25% 2/5/23 (c) | | 1,770,000 | 1,752,318 |
| Food Products - 1.0% | | | |
| B&G Foods, Inc. 4.625% 6/1/21 | | 565,000 | 550,875 |
| CF Industries Holdings, Inc.: | | | |
| 4.95% 6/1/43 | | 610,000 | 472,750 |
| 5.15% 3/15/34 | | 615,000 | 516,600 |
| 5.375% 3/15/44 | | 615,000 | 498,150 |
| JBS Investments GmbH 7.25% 4/3/24 (c) | | 2,205,000 | 2,222,662 |
| JBS Investments II GmbH 7% 1/15/26 (c) | | 760,000 | 744,800 |
| JBS U.S.A. LLC/JBS U.S.A. Finance, Inc.: | | | |
| 5.75% 6/15/25 (c) | | 1,030,000 | 983,650 |
| 5.875% 7/15/24 (c) | | 1,812,000 | 1,775,760 |
| 6.75% 2/15/28 (c) | | 925,000 | 901,875 |
| Lamb Weston Holdings, Inc.: | | | |
| 4.625% 11/1/24 (c) | | 425,000 | 413,313 |
| 4.875% 11/1/26 (c) | | 430,000 | 412,800 |
| Pilgrim's Pride Corp. 5.75% 3/15/25 (c) | | 925,000 | 867,188 |
| Post Holdings, Inc.: | | | |
| 5% 8/15/26 (c) | | 2,440,000 | 2,220,400 |
| 5.5% 3/1/25 (c) | | 530,000 | 508,699 |
| 5.75% 3/1/27 (c) | | 405,000 | 379,688 |
| | | | 13,469,210 |
| Personal Products - 0.1% | | | |
| First Quality Finance Co., Inc. 5% 7/1/25 (c) | | 490,000 | 438,550 |
| Prestige Brands, Inc. 5.375% 12/15/21 (c) | | 725,000 | 708,688 |
| | | | 1,147,238 |
| TOTAL CONSUMER STAPLES | | | 16,471,535 |
| ENERGY - 6.4% | | | |
| Energy Equipment & Services - 0.8% | | | |
| Borets Finance DAC 6.5% 4/7/22 (c) | | 635,000 | 622,008 |
| Compressco Partners LP/Compressco Finance, Inc. 7.5% 4/1/25 (c) | | 615,000 | 571,950 |
| Ensco PLC: | | | |
| 4.5% 10/1/24 | | 665,000 | 432,250 |
| 5.2% 3/15/25 | | 275,000 | 182,875 |
| 5.75% 10/1/44 | | 600,000 | 335,328 |
| 7.75% 2/1/26 | | 375,000 | 277,500 |
| Exterran Energy Solutions LP 8.125% 5/1/25 | | 575,000 | 552,000 |
| Exterran Partners LP/EXLP Finance Corp. 6% 10/1/22 | | 385,000 | 361,900 |
| Forum Energy Technologies, Inc. 6.25% 10/1/21 | | 715,000 | 629,200 |
| Jonah Energy LLC 7.25% 10/15/25 (c) | | 725,000 | 464,000 |
| Noble Holding International Ltd. 8.95% 4/1/45 (b) | | 120,000 | 91,200 |
| SESI LLC 7.75% 9/15/24 | | 365,000 | 290,175 |
| Southern Gas Corridor CJSC 6.875% 3/24/26 (c) | | 535,000 | 577,821 |
| Summit Midstream Holdings LLC 5.75% 4/15/25 | | 440,000 | 404,800 |
| The Oil and Gas Holding Co.: | | | |
| 7.5% 10/25/27 (c) | | 515,000 | 507,275 |
| 7.625% 11/7/24 (c) | | 200,000 | 205,100 |
| Transocean Guardian Ltd. 5.875% 1/15/24 (c) | | 860,000 | 823,450 |
| Transocean Pontus Ltd. 6.125% 8/1/25 (c) | | 535,000 | 516,275 |
| Transocean, Inc.: | | | |
| 7.25% 11/1/25 (c) | | 590,000 | 514,775 |
| 7.5% 1/15/26 (c) | | 645,000 | 565,988 |
| 9% 7/15/23 (c) | | 1,330,000 | 1,323,350 |
| Trinidad Drilling Ltd. 6.625% 2/15/25 (c) | | 250,000 | 252,125 |
| Unit Corp. 6.625% 5/15/21 | | 120,000 | 109,200 |
| Weatherford International, Inc. 9.875% 3/1/25 (c) | | 250,000 | 151,875 |
| | | | 10,762,420 |
| Oil, Gas & Consumable Fuels - 5.6% | | | |
| American Energy-Permian Basin LLC/AEPB Finance Corp. 13% 11/30/20 (c) | | 940,000 | 977,600 |
| Antero Midstream Partners LP/Antero Midstream Finance Corp. 5.375% 9/15/24 | | 245,000 | 228,463 |
| Antero Resources Corp.: | | | |
| 5.125% 12/1/22 | | 45,000 | 42,300 |
| 5.625% 6/1/23 (Reg. S) | | 560,000 | 532,000 |
| Antero Resources Finance Corp. 5.375% 11/1/21 | | 295,000 | 284,675 |
| Callon Petroleum Co. 6.125% 10/1/24 | | 225,000 | 209,250 |
| Carrizo Oil & Gas, Inc. 6.25% 4/15/23 | | 380,000 | 351,500 |
| Cheniere Corpus Christi Holdings LLC: | | | |
| 5.125% 6/30/27 | | 630,000 | 594,752 |
| 5.875% 3/31/25 | | 790,000 | 786,050 |
| 7% 6/30/24 | | 710,000 | 749,050 |
| Cheniere Energy Partners LP 5.625% 10/1/26 (c) | | 590,000 | 551,650 |
| Chesapeake Energy Corp. 8% 1/15/25 | | 345,000 | 304,463 |
| Citgo Holding, Inc. 10.75% 2/15/20 (c) | | 3,212,000 | 3,276,240 |
| CNX Midstream Partners LP 6.5% 3/15/26 (c) | | 335,000 | 318,250 |
| Comstock Escrow Corp. 9.75% 8/15/26 (c) | | 2,230,000 | 1,884,350 |
| Consolidated Energy Finance SA: | | | |
| 3 month U.S. LIBOR + 3.750% 6.5382% 6/15/22 (b)(c)(e) | | 155,000 | 154,612 |
| 6.5% 5/15/26 (c) | | 615,000 | 588,863 |
| 6.875% 6/15/25 (c) | | 310,000 | 295,185 |
| Crestwood Midstream Partners LP/Crestwood Midstream Finance Corp.: | | | |
| 5.75% 4/1/25 | | 465,000 | 431,288 |
| 6.25% 4/1/23 | | 1,975,000 | 1,900,938 |
| CVR Refining LLC/Coffeyville Finance, Inc. 6.5% 11/1/22 | | 1,070,000 | 1,053,950 |
| DCP Midstream LLC 5.85% 5/21/43 (b)(c) | | 885,000 | 708,000 |
| Denbury Resources, Inc.: | | | |
| 4.625% 7/15/23 | | 705,000 | 414,188 |
| 5.5% 5/1/22 | | 1,945,000 | 1,283,700 |
| 6.375% 8/15/21 | | 1,050,000 | 763,875 |
| 7.5% 2/15/24 (c) | | 1,350,000 | 1,086,750 |
| 9% 5/15/21 (c) | | 2,250,000 | 2,103,750 |
| 9.25% 3/31/22 (c) | | 270,000 | 249,075 |
| Diamondback Energy, Inc.: | | | |
| 4.75% 11/1/24 | | 540,000 | 521,100 |
| 5.375% 5/31/25 | | 255,000 | 248,625 |
| DTEK Finance PLC 10.75% 12/31/24 pay-in-kind (b) | | 1,465,000 | 1,345,749 |
| Endeavor Energy Resources LP/EER Finance, Inc.: | | | |
| 5.5% 1/30/26 (c) | | 265,000 | 271,625 |
| 5.75% 1/30/28 (c) | | 265,000 | 270,353 |
| Energy Transfer Equity LP 5.5% 6/1/27 | | 860,000 | 838,500 |
| EnLink Midstream Partners LP: | | | |
| 4.15% 6/1/25 | | 465,000 | 419,395 |
| 4.4% 4/1/24 | | 460,000 | 433,466 |
| EP Energy LLC/Everest Acquisition Finance, Inc.: | | | |
| 7.75% 5/15/26 (c) | | 2,990,000 | 2,646,150 |
| 8% 11/29/24 (c) | | 475,000 | 353,875 |
| Extraction Oil & Gas, Inc. 7.375% 5/15/24 (c) | | 365,000 | 301,125 |
| Frontera Energy Corp. 9.7% 6/25/23 (c) | | 485,000 | 478,331 |
| Genesis Energy LP/Genesis Energy Finance Corp. 6.25% 5/15/26 | | 465,000 | 398,738 |
| Georgian Oil & Gas Corp. 6.75% 4/26/21 (c) | | 465,000 | 465,167 |
| Global Partners LP/GLP Finance Corp.: | | | |
| 6.25% 7/15/22 | | 130,000 | 122,850 |
| 7% 6/15/23 | | 580,000 | 551,000 |
| Gran Tierra Energy International Holdings Ltd. 6.25% 2/15/25 (c) | | 225,000 | 208,969 |
| Hess Infrastructure Partners LP 5.625% 2/15/26 (c) | | 795,000 | 769,163 |
| Hilcorp Energy I LP/Hilcorp Finance Co.: | | | |
| 5% 12/1/24 (c) | | 510,000 | 451,350 |
| 5.75% 10/1/25 (c) | | 580,000 | 516,200 |
| 6.25% 11/1/28 (c) | | 590,000 | 519,200 |
| Holly Energy Partners LP/Holly Finance Corp. 6% 8/1/24 (c) | | 390,000 | 382,200 |
| Indigo Natural Resources LLC 6.875% 2/15/26 (c) | | 710,000 | 610,600 |
| Indika Energy Capital II Pte. Ltd. 6.875% 4/10/22 (c) | | 880,000 | 881,609 |
| KazMunaiGaz Finance Sub BV 4.75% 4/24/25 (c) | | 225,000 | 222,750 |
| Kosmos Energy Ltd.: | | | |
| 7.875% 8/1/21 (c) | | 1,140,000 | 1,128,600 |
| 7.875% 8/1/21 (c) | | 1,020,000 | 1,014,900 |
| Magnolia Oil & Gas Operating LLC 6% 8/1/26 (c) | | 300,000 | 289,500 |
| Medco Strait Services Pte. Ltd. 8.5% 8/17/22 (c) | | 205,000 | 199,702 |
| Murphy Oil U.S.A., Inc. 5.625% 5/1/27 | | 305,000 | 292,800 |
| Newfield Exploration Co.: | | | |
| 5.375% 1/1/26 | | 475,000 | 465,500 |
| 5.625% 7/1/24 | | 75,000 | 75,938 |
| NGL Energy Partners LP/NGL Energy Finance Corp. 6.125% 3/1/25 | | 625,000 | 537,500 |
| NGPL PipeCo LLC: | | | |
| 4.375% 8/15/22 (c) | | 150,000 | 147,000 |
| 4.875% 8/15/27 (c) | | 150,000 | 141,375 |
| Nine Energy Service, Inc. 8.75% 11/1/23 (c) | | 300,000 | 285,000 |
| Nostrum Oil & Gas Finance BV 8% 7/25/22 (c) | | 2,080,000 | 1,395,722 |
| Pan American Energy LLC 7.875% 5/7/21 (c) | | 815,000 | 816,019 |
| Parsley Energy LLC/Parsley: | | | |
| 5.25% 8/15/25 (c) | | 380,000 | 343,900 |
| 5.625% 10/15/27 (c) | | 300,000 | 272,625 |
| 6.25% 6/1/24 (c) | | 420,000 | 407,400 |
| PBF Holding Co. LLC/PBF Finance Corp.: | | | |
| 7% 11/15/23 | | 1,695,000 | 1,618,725 |
| 7.25% 6/15/25 | | 1,145,000 | 1,076,300 |
| PBF Logistics LP/PBF Logistics Finance, Inc. 6.875% 5/15/23 | | 435,000 | 427,388 |
| PDC Energy, Inc. 6.125% 9/15/24 | | 200,000 | 185,000 |
| Pemex Project Funding Master Trust: | | | |
| 6.625% 6/15/35 | | 1,640,000 | 1,431,720 |
| 8.625% 12/1/23 (b) | | 250,000 | 264,958 |
| Petrobras Energia SA 7.375% 7/21/23 (c) | | 315,000 | 282,933 |
| Petrobras Global Finance BV: | | | |
| 5.999% 1/27/28 | | 321,000 | 302,225 |
| 6.125% 1/17/22 | | 100,000 | 102,625 |
| 6.25% 3/17/24 | | 620,000 | 628,990 |
| 8.75% 5/23/26 | | 2,855,000 | 3,201,883 |
| Petrobras International Finance Co. Ltd. 6.875% 1/20/40 | | 119,000 | 113,230 |
| Petroleos de Venezuela SA: | | | |
| 5.375% 4/12/27 (d) | | 480,000 | 69,552 |
| 6% 5/16/24 (c)(d) | | 385,000 | 56,788 |
| 6% 11/15/26 (c)(d) | | 930,000 | 137,175 |
| 12.75% 2/17/22 (c)(d) | | 110,000 | 20,911 |
| Petroleos Mexicanos: | | | |
| 4.875% 1/18/24 | | 220,000 | 205,040 |
| 6.375% 1/23/45 | | 815,000 | 656,075 |
| 6.5% 3/13/27 | | 440,000 | 413,600 |
| 6.5% 6/2/41 | | 2,705,000 | 2,239,740 |
| 6.625% (c)(f) | | 575,000 | 472,938 |
| 6.75% 9/21/47 | | 1,853,000 | 1,532,227 |
| PT Pertamina Persero 6.5% 5/27/41 (c) | | 175,000 | 183,345 |
| QEP Resources, Inc. 5.25% 5/1/23 | | 610,000 | 539,850 |
| Range Resources Corp. 5% 3/15/23 | | 960,000 | 844,800 |
| Sabine Pass Liquefaction LLC 5% 3/15/27 | | 480,000 | 481,842 |
| Sanchez Energy Corp.: | | | |
| 6.125% 1/15/23 | | 1,675,000 | 301,500 |
| 7.25% 2/15/23 (c) | | 1,185,000 | 965,775 |
| SemGroup Corp.: | | | |
| 6.375% 3/15/25 | | 310,000 | 285,975 |
| 7.25% 3/15/26 | | 580,000 | 542,300 |
| SM Energy Co.: | | | |
| 5.625% 6/1/25 | | 280,000 | 243,600 |
| 6.625% 1/15/27 | | 465,000 | 413,850 |
| 6.75% 9/15/26 | | 250,000 | 223,750 |
| Southern Star Central Corp. 5.125% 7/15/22 (c) | | 320,000 | 307,200 |
| Southwestern Energy Co.: | | | |
| 4.1% 3/15/22 | | 820,000 | 746,200 |
| 7.5% 4/1/26 | | 470,000 | 444,150 |
| 7.75% 10/1/27 | | 420,000 | 399,000 |
| SRC Energy, Inc. 6.25% 12/1/25 | | 380,000 | 315,400 |
| Sunoco LP/Sunoco Finance Corp.: | | | |
| 4.875% 1/15/23 | | 465,000 | 453,375 |
| 5.5% 2/15/26 | | 595,000 | 563,763 |
| Targa Resources Partners LP/Targa Resources Partners Finance Corp.: | | | |
| 5% 1/15/28 | | 620,000 | 561,100 |
| 5.125% 2/1/25 | | 320,000 | 300,000 |
| 5.375% 2/1/27 | | 320,000 | 300,000 |
| 5.875% 4/15/26 (c) | | 925,000 | 899,563 |
| Teine Energy Ltd. 6.875% 9/30/22 (c) | | 590,000 | 572,300 |
| Tennessee Gas Pipeline Co. 7.625% 4/1/37 | | 50,000 | 59,141 |
| Tesoro Logistics LP/Tesoro Logistics Finance Corp. 6.375% 5/1/24 | | 245,000 | 252,963 |
| Transportadora de Gas del Sur SA 6.75% 5/2/25 (c) | | 540,000 | 490,730 |
| Tullow Oil PLC 7% 3/1/25 (c) | | 280,000 | 260,316 |
| Ultra Resources, Inc. 11% 7/12/24 pay-in-kind | | 532,000 | 399,000 |
| W&T Offshore, Inc. 9.75% 11/1/23 (c) | | 2,005,000 | 1,754,375 |
| Whiting Petroleum Corp. 6.625% 1/15/26 | | 425,000 | 364,438 |
| WPX Energy, Inc.: | | | |
| 5.25% 9/15/24 | | 490,000 | 443,450 |
| 5.75% 6/1/26 | | 465,000 | 420,825 |
| 6% 1/15/22 | | 730,000 | 709,925 |
| YPF SA: | | | |
| 8.5% 3/23/21 (c) | | 245,000 | 241,938 |
| 8.75% 4/4/24 (c) | | 2,320,000 | 2,180,800 |
| | | | 78,072,900 |
| TOTAL ENERGY | | | 88,835,320 |
| FINANCIALS - 7.8% | | | |
| Banks - 2.3% | | | |
| Access Bank PLC 9.25% 6/24/21 (b)(c) | | 545,000 | 540,913 |
| Akbank TAS/Ak Finansal Kiralama A/S: | | | |
| 4% 1/24/20 (c) | | 505,000 | 495,910 |
| 7.2% 3/16/27 (b)(c) | | 330,000 | 289,645 |
| Banco de Bogota SA 6.25% 5/12/26 (c) | | 270,000 | 273,040 |
| Banco de Reservas de La Republica Dominicana 7% 2/1/23 (c) | | 300,000 | 300,000 |
| Banco Do Brasil SA: | | | |
| 4.625% 1/15/25 (c) | | 170,000 | 161,288 |
| 4.875% 4/19/23 (c) | | 280,000 | 275,576 |
| Banco Hipotecario SA 9.75% 11/30/20 (c) | | 1,805,000 | 1,764,388 |
| Banco Macro SA 6.75% 11/4/26 (b)(c) | | 1,170,000 | 944,775 |
| Banque Centrale de Tunisie 5.75% 1/30/25 (c) | | 250,000 | 209,710 |
| Barclays PLC 2% 2/7/28 (Reg. S) (b) | EUR | 2,850,000 | 3,019,047 |
| BBVA Bancomer SA 7.25% 4/22/20 (c) | | 475,000 | 491,863 |
| Biz Finance PLC 9.625% 4/27/22 (c) | | 1,010,000 | 987,982 |
| BTA Bank JSC 5.5% 12/21/22 (c) | | 227,000 | 222,455 |
| CaixaBank SA 2.75% 7/14/28 (Reg. S) (b) | EUR | 1,700,000 | 1,910,810 |
| CBOM Finance PLC 5.55% 2/14/23 (c) | | 300,000 | 280,742 |
| CIT Group, Inc. 5% 8/15/22 | | 341,000 | 336,311 |
| Development Bank of Mongolia 7.25% 10/23/23 (c) | | 200,000 | 196,308 |
| Export Credit Bank of Turkey 5.875% 4/24/19 (c) | | 210,000 | 209,303 |
| Export-Import Bank of Korea 6.2% 8/7/21 (c) | INR | 21,900,000 | 303,696 |
| Fidelity Bank PLC 10.5% 10/16/22 (c) | | 510,000 | 510,714 |
| HBOS PLC 4.5% 3/18/30 (b) | EUR | 1,350,000 | 1,612,115 |
| Intesa Sanpaolo SpA 3.928% 9/15/26 (Reg. S) | EUR | 400,000 | 458,014 |
| Itau Unibanco Holding SA: | | | |
| 5.125% 5/13/23 (Reg. S) | | 530,000 | 531,860 |
| 5.5% 8/6/22 (c) | | 490,000 | 501,025 |
| JSC BGEO Group 6% 7/26/23 (c) | | 800,000 | 776,128 |
| Lloyds Banking Group PLC 0.625% 1/15/24 (b) | EUR | 1,750,000 | 1,908,826 |
| Oschadbank Via SSB #1 PLC 9.375% 3/10/23 (c) | | 200,000 | 196,841 |
| SB Capital SA 5.5% 2/26/24 (b)(c) | | 435,000 | 435,000 |
| T.C. Ziraat Bankasi A/S: | | | |
| 4.25% 7/3/19 (c) | | 20,000 | 19,745 |
| 4.75% 4/29/21 (c) | | 115,000 | 108,398 |
| Trade and Development Bank of Mongolia LLC 9.375% 5/19/20 (c) | | 580,000 | 603,792 |
| Turkiye Garanti Bankasi A/S: | | | |
| 4.75% 10/17/19 (c) | | 185,000 | 182,484 |
| 6.125% 5/24/27 (b)(c) | | 360,000 | 307,397 |
| 6.25% 4/20/21 (c) | | 250,000 | 247,705 |
| Turkiye Is Bankasi A/S 5.5% 4/21/22 (c) | | 360,000 | 325,469 |
| Turkiye Vakiflar Bankasi TAO: | | | |
| 5.75% 1/30/23 (c) | | 935,000 | 820,694 |
| 6.875% 2/3/25 (Reg. S) (b) | | 350,000 | 296,111 |
| UniCredit SpA: | | | |
| 3 month EURIBOR + 2.750% 2.432% 5/3/25 (b)(e) | EUR | 610,000 | 666,104 |
| 6.95% 10/31/22 (Reg. S) | EUR | 4,300,000 | 5,513,725 |
| Zenith Bank PLC: | | | |
| 6.25% 4/22/19 (c) | | 1,705,000 | 1,700,512 |
| 7.375% 5/30/22 (c) | | 1,135,000 | 1,125,346 |
| | | | 32,061,767 |
| Capital Markets - 0.2% | | | |
| AssuredPartners, Inc. 7% 8/15/25 (c) | | 245,000 | 220,814 |
| Balboa Merger Sub, Inc. 11.375% 12/1/21 (c) | | 1,260,000 | 1,319,850 |
| CyrusOne LP/CyrusOne Finance Corp.: | | | |
| 5% 3/15/24 | | 165,000 | 161,700 |
| 5.375% 3/15/27 | | 140,000 | 135,800 |
| MSCI, Inc.: | | | |
| 5.25% 11/15/24 (c) | | 345,000 | 343,275 |
| 5.75% 8/15/25 (c) | | 365,000 | 367,738 |
| | | | 2,549,177 |
| Consumer Finance - 2.7% | | | |
| Ally Financial, Inc.: | | | |
| 4.125% 2/13/22 | | 1,075,000 | 1,044,094 |
| 4.625% 3/30/25 | | 1,915,000 | 1,855,156 |
| 5.125% 9/30/24 | | 2,750,000 | 2,729,375 |
| 8% 11/1/31 | | 823,000 | 911,473 |
| 8% 11/1/31 | | 16,143,000 | 17,918,730 |
| Credito Real S.A.B. de CV 7.5% 3/13/19 (c) | | 100,000 | 99,625 |
| Navient Corp.: | | | |
| 5.875% 10/25/24 | | 2,745,000 | 2,292,075 |
| 6.5% 6/15/22 | | 470,000 | 430,464 |
| 7.25% 9/25/23 | | 285,000 | 261,488 |
| SLM Corp.: | | | |
| 5.5% 1/25/23 | | 1,685,000 | 1,474,375 |
| 6.125% 3/25/24 | | 830,000 | 711,725 |
| 7.25% 1/25/22 | | 2,650,000 | 2,557,250 |
| Springleaf Financial Corp.: | | | |
| 6.875% 3/15/25 | | 2,580,000 | 2,309,100 |
| 7.125% 3/15/26 | | 3,405,000 | 2,998,784 |
| | | | 37,593,714 |
| Diversified Financial Services - 1.4% | | | |
| 1MDB Global Investments Ltd. 4.4% 3/9/23 | | 1,000,000 | 895,250 |
| Cimpor Financial Operations BV 5.75% 7/17/24 (c) | | 890,000 | 738,700 |
| Eagle Intermediate Global Holding BV 7.5% 5/1/25 (c) | | 235,000 | 219,843 |
| Grinding Media, Inc./MC Grinding Media Canada, Inc. 7.375% 12/15/23 (c) | | 390,000 | 377,325 |
| Icahn Enterprises LP/Icahn Enterprises Finance Corp.: | | | |
| 5.875% 2/1/22 | | 3,370,000 | 3,302,600 |
| 6% 8/1/20 | | 995,000 | 993,756 |
| 6.25% 2/1/22 | | 1,050,000 | 1,036,875 |
| 6.375% 12/15/25 | | 2,785,000 | 2,680,563 |
| 6.75% 2/1/24 | | 535,000 | 529,650 |
| j2 Cloud Services LLC/j2 Global Communications, Inc. 6% 7/15/25 (c) | | 410,000 | 400,775 |
| James Hardie International Finance Ltd.: | | | |
| 4.75% 1/15/25 (c) | | 450,000 | 409,500 |
| 5% 1/15/28 (c) | | 455,000 | 389,025 |
| PT Bukit Makmur Mandiri Utama 7.75% 2/13/22 (c) | | 700,000 | 697,456 |
| Sistema International Funding SA 6.95% 5/17/19 (c) | | 840,000 | 843,494 |
| Solera LLC/Solera Finance, Inc. 10.5% 3/1/24 (c) | | 1,590,000 | 1,693,350 |
| Sparc Em Spc 0% 12/5/22 (c) | | 170,833 | 154,819 |
| Starfruit Finco BV / Starfruit U.S. Holdco LLC 8% 10/1/26 (c) | | 1,185,000 | 1,096,125 |
| TMK Capital SA: | | | |
| 6.75% 4/3/20 (c) | | 40,000 | 40,566 |
| 6.75% 4/3/20 (Reg. S) | | 200,000 | 202,832 |
| Valvoline, Inc. 5.5% 7/15/24 | | 230,000 | 224,825 |
| Venator Finance SARL/Venator Capital Management Ltd. 5.75% 7/15/25 (c) | | 525,000 | 420,000 |
| Wendel SA 2.75% 10/2/24 (Reg. S) | EUR | 1,600,000 | 1,884,718 |
| | | | 19,232,047 |
| Insurance - 0.9% | | | |
| Acrisure LLC / Acrisure Finance, Inc. 7% 11/15/25 (c) | | 910,000 | 775,775 |
| Alliant Holdings Co.-Issuer, Inc./Wayne Merger Sub LLC 8.25% 8/1/23 (c) | | 695,000 | 689,350 |
| AmWINS Group, Inc. 7.75% 7/1/26 (c) | | 300,000 | 283,500 |
| Assicurazioni Generali SpA 7.75% 12/12/42 (b) | EUR | 3,200,000 | 4,262,168 |
| Aviva PLC 6.125% 7/5/43 (b) | EUR | 817,000 | 1,040,216 |
| Centene Escrow Corp. 5.375% 6/1/26 (c) | | 1,545,000 | 1,502,513 |
| Credit Agricole Assurances SA 2.625% 1/29/48 (b) | EUR | 3,100,000 | 3,083,510 |
| HUB International Ltd. 7% 5/1/26 (c) | | 595,000 | 539,963 |
| USIS Merger Sub, Inc. 6.875% 5/1/25 (c) | | 615,000 | 565,160 |
| | | | 12,742,155 |
| Mortgage Real Estate Investment Trusts - 0.0% | | | |
| Starwood Property Trust, Inc. 4.75% 3/15/25 | | 595,000 | 535,500 |
| Thrifts & Mortgage Finance - 0.3% | | | |
| Nationwide Building Society 2% 7/25/29 (Reg. S) (b) | EUR | 3,571,000 | 3,788,500 |
| TOTAL FINANCIALS | | | 108,502,860 |
| HEALTH CARE - 2.9% | | | |
| Health Care Equipment & Supplies - 0.1% | | | |
| Hill-Rom Holdings, Inc. 5.75% 9/1/23 (c) | | 290,000 | 290,000 |
| Hologic, Inc.: | | | |
| 4.375% 10/15/25 (c) | | 320,000 | 297,600 |
| 4.625% 2/1/28 (c) | | 215,000 | 193,500 |
| Teleflex, Inc. 4.625% 11/15/27 | | 255,000 | 235,393 |
| | | | 1,016,493 |
| Health Care Providers & Services - 1.9% | | | |
| Community Health Systems, Inc.: | | | |
| 6.875% 2/1/22 | | 2,265,000 | 1,030,575 |
| 8.125% 6/30/24 (c) | | 2,377,000 | 1,735,210 |
| 8.625% 1/15/24 (c) | | 2,400,000 | 2,370,000 |
| 11% 6/30/23 (c)(g) | | 1,030,000 | 793,100 |
| Encompass Health Corp.: | | | |
| 5.125% 3/15/23 | | 330,000 | 323,400 |
| 5.75% 11/1/24 | | 1,135,000 | 1,123,650 |
| Enterprise Merger Sub, Inc. 8.75% 10/15/26 (c) | | 1,775,000 | 1,535,375 |
| HCA Holdings, Inc.: | | | |
| 4.75% 5/1/23 | | 630,000 | 620,550 |
| 5.25% 6/15/26 | | 750,000 | 744,375 |
| 5.375% 2/1/25 | | 1,010,000 | 984,750 |
| 5.375% 9/1/26 | | 635,000 | 605,727 |
| 5.625% 9/1/28 | | 775,000 | 736,405 |
| 5.875% 3/15/22 | | 1,915,000 | 1,962,875 |
| 5.875% 5/1/23 | | 1,925,000 | 1,949,063 |
| 5.875% 2/15/26 | | 2,635,000 | 2,621,825 |
| 6.5% 2/15/20 | | 2,410,000 | 2,470,250 |
| MPH Acquisition Holdings LLC 7.125% 6/1/24 (c) | | 335,000 | 312,388 |
| Polaris Intermediate Corp. 8.5% 12/1/22 pay-in-kind (b)(c) | | 1,105,000 | 1,007,893 |
| Quintiles Transnational Corp. 4.875% 5/15/23 (c) | | 445,000 | 436,100 |
| Sabra Health Care LP/Sabra Capital Corp. 5.375% 6/1/23 | | 260,000 | 256,100 |
| Tenet Healthcare Corp.: | | | |
| 4.625% 7/15/24 | | 305,000 | 283,650 |
| 5.125% 5/1/25 | | 305,000 | 284,413 |
| 7.5% 1/1/22 (c) | | 365,000 | 370,475 |
| Vizient, Inc. 10.375% 3/1/24 (c) | | 660,000 | 699,600 |
| Wellcare Health Plans, Inc.: | | | |
| 5.25% 4/1/25 | | 475,000 | 457,188 |
| 5.375% 8/15/26 (c) | | 385,000 | 371,525 |
| West Street Merger Sub, Inc. 6.375% 9/1/25 (c) | | 305,000 | 269,925 |
| | | | 26,356,387 |
| Pharmaceuticals - 0.9% | | | |
| Catalent Pharma Solutions 4.875% 1/15/26 (c) | | 205,000 | 194,238 |
| Inventiv Group Holdings, Inc. / Investment 7.5% 10/1/24 (c) | | 228,000 | 237,120 |
| NVA Holdings, Inc. 6.875% 4/1/26 (c) | | 330,000 | 295,350 |
| Teva Pharmaceutical Finance Co. BV: | | | |
| 2.95% 12/18/22 | | 250,000 | 221,090 |
| 3.65% 11/10/21 | | 175,000 | 165,799 |
| Teva Pharmaceutical Finance IV BV 3.65% 11/10/21 | | 760,000 | 720,040 |
| Teva Pharmaceutical Finance IV LLC 2.25% 3/18/20 | | 310,000 | 301,674 |
| Valeant Pharmaceuticals International, Inc.: | | | |
| 5.5% 11/1/25 (c) | | 4,578,000 | 4,268,985 |
| 5.875% 5/15/23 (c) | | 2,165,000 | 2,002,625 |
| 6.5% 3/15/22 (c) | | 620,000 | 624,080 |
| 7% 3/15/24 (c) | | 925,000 | 934,250 |
| 8.5% 1/31/27 (c) | | 620,000 | 601,400 |
| 9% 12/15/25 (c) | | 2,415,000 | 2,402,925 |
| | | | 12,969,576 |
| TOTAL HEALTH CARE | | | 40,342,456 |
| INDUSTRIALS - 1.4% | | | |
| Aerospace & Defense - 0.4% | | | |
| BBA U.S. Holdings, Inc. 5.375% 5/1/26 (c) | | 225,000 | 213,185 |
| BWX Technologies, Inc. 5.375% 7/15/26 (c) | | 430,000 | 413,746 |
| DAE Funding LLC 4% 8/1/20 (c) | | 260,000 | 253,500 |
| TransDigm UK Holdings PLC 6.875% 5/15/26 (c) | | 1,805,000 | 1,719,263 |
| TransDigm, Inc.: | | | |
| 6.375% 6/15/26 | | 2,825,000 | 2,627,250 |
| 6.5% 5/15/25 | | 835,000 | 797,425 |
| | | | 6,024,369 |
| Air Freight & Logistics - 0.1% | | | |
| Rumo Luxembourg Sarl 7.375% 2/9/24 (c) | | 955,000 | 995,492 |
| XPO Logistics, Inc. 6.125% 9/1/23 (c) | | 490,000 | 471,625 |
| | | | 1,467,117 |
| Airlines - 0.1% | | | |
| Air Canada 2013-1 Pass Through Trust 5.375% 11/15/22 (c) | | 113,937 | 115,167 |
| Allegiant Travel Co. 5.5% 7/15/19 | | 160,000 | 160,000 |
| Azul Investments LLP 5.875% 10/26/24 (c) | | 300,000 | 280,128 |
| Continental Airlines, Inc. pass-thru trust certificates 6.903% 4/19/22 | | 10,814 | 11,112 |
| Delta Air Lines, Inc. pass-thru trust certificates 8.021% 2/10/24 | | 100,105 | 108,924 |
| Hawaiian Airlines pass-thru certificates Series 2013-1 Class B, 4.95% 7/15/23 | | 201,937 | 201,412 |
| Mexico City Airport Trust 5.5% 10/31/46 (c) | | 225,000 | 198,000 |
| U.S. Airways pass-thru certificates: | | | |
| Series 2011-1 Class A, 7.125% 10/22/23 | | 272,894 | 297,809 |
| Series 2012-2 Class B, 6.75% 6/3/21 | | 140,889 | 146,242 |
| Series 2013-1 Class B, 5.375% 11/15/21 | | 188,282 | 193,993 |
| | | | 1,712,787 |
| Building Products - 0.0% | | | |
| USG Corp. 4.875% 6/1/27 (c) | | 160,000 | 161,200 |
| Commercial Services & Supplies - 0.4% | | | |
| ADS Waste Holdings, Inc. 5.625% 11/15/24 (c) | | 565,000 | 552,288 |
| CD&R Waterworks Merger Sub LLC 6.125% 8/15/25 (c) | | 240,000 | 213,000 |
| Covanta Holding Corp.: | | | |
| 5.875% 3/1/24 | | 1,870,000 | 1,757,800 |
| 5.875% 7/1/25 | | 165,000 | 151,800 |
| 6% 1/1/27 | | 585,000 | 523,575 |
| KAR Auction Services, Inc. 5.125% 6/1/25 (c) | | 525,000 | 473,813 |
| Kissner Holdings LP/Kissner Milling Co. Ltd./BSC Holding, Inc./Kissner U.S.A. 8.375% 12/1/22 (c) | | 530,000 | 527,350 |
| Ritchie Brothers Auctioneers, Inc. 5.375% 1/15/25 (c) | | 190,000 | 184,300 |
| Tervita Escrow Corp. 7.625% 12/1/21 (c) | | 280,000 | 266,700 |
| The Brink's Co. 4.625% 10/15/27 (c) | | 620,000 | 565,893 |
| | | | 5,216,519 |
| Construction & Engineering - 0.1% | | | |
| AECOM 5.125% 3/15/27 | | 625,000 | 534,375 |
| Cementos Progreso Trust 7.125% 11/6/23 (c) | | 390,000 | 400,725 |
| Odebrecht Finance Ltd.: | | | |
| 4.375% 4/25/25 (c)(d) | | 1,530,000 | 200,813 |
| 5.25% 6/27/29 (c)(d) | | 580,000 | 78,880 |
| 7.125% 6/26/42 (c)(d) | | 1,406,000 | 196,840 |
| | | | 1,411,633 |
| Electrical Equipment - 0.0% | | | |
| Sensata Technologies BV 5% 10/1/25 (c) | | 575,000 | 540,500 |
| Industrial Conglomerates - 0.0% | | | |
| Turk Sise ve Cam Fabrikalari A/S 4.25% 5/9/20 (c) | | 110,000 | 106,565 |
| Machinery - 0.0% | | | |
| Stevens Holding Co., Inc. 6.125% 10/1/26 (c) | | 155,000 | 152,675 |
| Marine - 0.1% | | | |
| Navios Maritime Acquisition Corp./Navios Acquisition Finance U.S., Inc. 8.125% 11/15/21 (c) | | 150,000 | 112,500 |
| Navios South American Logistics, Inc./Navios Logistics Finance U.S., Inc. 7.25% 5/1/22 (c) | | 490,000 | 443,450 |
| | | | 555,950 |
| Professional Services - 0.0% | | | |
| IHS Markit Ltd.: | | | |
| 4% 3/1/26 (c) | | 275,000 | 255,750 |
| 4.75% 2/15/25 (c) | | 225,000 | 221,344 |
| | | | 477,094 |
| Road & Rail - 0.0% | | | |
| JSC Georgian Railway 7.75% 7/11/22 (c) | | 180,000 | 185,864 |
| Trading Companies & Distributors - 0.1% | | | |
| Avantor, Inc. 6% 10/1/24 (c) | | 625,000 | 614,063 |
| FLY Leasing Ltd. 5.25% 10/15/24 | | 490,000 | 442,225 |
| United Rentals North America, Inc. 5.5% 5/15/27 | | 405,000 | 375,638 |
| | | | 1,431,926 |
| Transportation Infrastructure - 0.1% | | | |
| Aeropuertos Argentina 2000 SA 6.875% 2/1/27 (c) | | 590,000 | 544,275 |
| TOTAL INDUSTRIALS | | | 19,988,474 |
| INFORMATION TECHNOLOGY - 0.7% | | | |
| Communications Equipment - 0.2% | | | |
| Banglalink Digital Communications Ltd.: | | | |
| 8.625% 5/6/19 (c) | | 1,835,000 | 1,844,359 |
| 8.625% 5/6/19 (Reg. S) | | 200,000 | 201,020 |
| | | | 2,045,379 |
| Electronic Equipment & Components - 0.0% | | | |
| TTM Technologies, Inc. 5.625% 10/1/25 (c) | | 210,000 | 195,300 |
| Internet Software & Services - 0.0% | | | |
| Camelot Finance SA 7.875% 10/15/24 (c) | | 280,000 | 270,200 |
| IT Services - 0.1% | | | |
| CDW LLC/CDW Finance Corp.: | | | |
| 5% 9/1/23 | | 565,000 | 555,113 |
| 5% 9/1/25 | | 335,000 | 320,763 |
| GTT Communications, Inc. 7.875% 12/31/24 (c) | | 300,000 | 259,500 |
| | | | 1,135,376 |
| Semiconductors & Semiconductor Equipment - 0.1% | | | |
| Qorvo, Inc. 5.5% 7/15/26(c) | | 300,000 | 286,500 |
| Sensata Technologies UK Financing Co. PLC 6.25% 2/15/26 (c) | | 585,000 | 587,925 |
| Versum Materials, Inc. 5.5% 9/30/24 (c) | | 330,000 | 326,700 |
| | | | 1,201,125 |
| Software - 0.3% | | | |
| Ascend Learning LLC 6.875% 8/1/25 (c) | | 210,000 | 201,075 |
| CDK Global, Inc. 5.875% 6/15/26 | | 225,000 | 225,911 |
| Ensemble S Merger Sub, Inc. 9% 9/30/23 (c) | | 970,000 | 970,000 |
| JDA Escrow LLC/JDA Bond Finance, Inc. 7.375% 10/15/24 (c) | | 225,000 | 226,688 |
| Open Text Corp. 5.875% 6/1/26 (c) | | 465,000 | 455,700 |
| Parametric Technology Corp. 6% 5/15/24 | | 190,000 | 190,950 |
| Symantec Corp. 5% 4/15/25 (c) | | 530,000 | 494,523 |
| Uber Technologies, Inc.: | | | |
| 7.5% 11/1/23 (c) | | 830,000 | 803,025 |
| 8% 11/1/26 (c) | | 1,180,000 | 1,138,700 |
| | | | 4,706,572 |
| TOTAL INFORMATION TECHNOLOGY | | | 9,553,952 |
| MATERIALS - 2.5% | | | |
| Chemicals - 0.6% | | | |
| Braskem Finance Ltd. 5.375% 5/2/22 (c) | | 315,000 | 320,516 |
| Hexion, Inc. 10.375% 2/1/22 (c) | | 235,000 | 187,413 |
| LSB Industries, Inc. 9.625% 5/1/23 (c) | | 310,000 | 314,650 |
| NOVA Chemicals Corp.: | | | |
| 4.875% 6/1/24 (c) | | 770,000 | 694,925 |
| 5.25% 6/1/27 (c) | | 660,000 | 584,100 |
| OCI NV 6.625% 4/15/23 (c) | | 270,000 | 265,275 |
| OCP SA 5.625% 4/25/24 (c) | | 200,000 | 204,500 |
| Petkim Petrokimya Holding A/S 5.875% 1/26/23 (c) | | 740,000 | 671,526 |
| Platform Specialty Products Corp.: | | | |
| 5.875% 12/1/25 (c) | | 945,000 | 883,575 |
| 6.5% 2/1/22 (c) | | 555,000 | 555,000 |
| SABIC Capital II BV 4% 10/10/23 (c) | | 320,000 | 318,400 |
| Sasol Financing U.S.A. LLC 5.875% 3/27/24 | | 305,000 | 304,336 |
| SunCoke Energy Partners LP/SunCoke Energy Partners Finance Corp. 7.5% 6/15/25 (c) | | 495,000 | 469,013 |
| The Chemours Co. LLC 5.375% 5/15/27 | | 910,000 | 819,000 |
| TPC Group, Inc. 8.75% 12/15/20 (c) | | 765,000 | 726,750 |
| Tronox Finance PLC 5.75% 10/1/25 (c) | | 285,000 | 230,850 |
| | | | 7,549,829 |
| Construction Materials - 0.2% | | | |
| CEMEX Finance LLC 6% 4/1/24 (c) | | 200,000 | 198,748 |
| CEMEX S.A.B. de CV 7.75% 4/16/26 (c) | | 480,000 | 504,605 |
| Holcim Finance Luxembourg SA 2.25% 5/26/28 (Reg. S) | EUR | 1,372,000 | 1,535,921 |
| Summit Materials LLC/Summit Materials Finance Corp. 5.125% 6/1/25 (c) | | 260,000 | 236,600 |
| U.S. Concrete, Inc. 6.375% 6/1/24 | | 300,000 | 276,000 |
| Union Andina de Cementos SAA 5.875% 10/30/21 (c) | | 150,000 | 152,438 |
| | | | 2,904,312 |
| Containers & Packaging - 0.1% | | | |
| Crown Cork & Seal, Inc.: | | | |
| 7.375% 12/15/26 | | 1,210,000 | 1,288,650 |
| 7.5% 12/15/96 | | 160,000 | 156,800 |
| Flex Acquisition Co., Inc. 6.875% 1/15/25 (c) | | 280,000 | 249,200 |
| Plastipak Holdings, Inc. 6.25% 10/15/25 (c) | | 180,000 | 159,300 |
| | | | 1,853,950 |
| Metals & Mining - 1.6% | | | |
| Alcoa Nederland Holding BV: | | | |
| 6.125% 5/15/28 (c) | | 200,000 | 191,500 |
| 6.75% 9/30/24 (c) | | 430,000 | 436,450 |
| 7% 9/30/26 (c) | | 355,000 | 362,100 |
| Aleris International, Inc. 6% 6/1/20 (c)(h) | | 1,759 | 1,759 |
| Algoma Steel SCA 0% 12/31/23 (h) | | 102,200 | 102,200 |
| ArcelorMittal SA 0.95% 1/17/23 (Reg. S) | EUR | 1,775,000 | 1,967,940 |
| Big River Steel LLC/BRS Finance Corp. 7.25% 9/1/25 (c) | | 475,000 | 471,438 |
| Cleveland-Cliffs, Inc.: | | | |
| 4.875% 1/15/24 (c) | | 620,000 | 576,600 |
| 5.75% 3/1/25 | | 615,000 | 553,500 |
| Commercial Metals Co. 5.75% 4/15/26 (c) | | 460,000 | 426,650 |
| Constellium NV 5.875% 2/15/26 (c) | | 255,000 | 226,950 |
| CSN Islands XI Corp. 6.875% 9/21/19 (c) | | 1,155,000 | 1,149,271 |
| CSN Resources SA 6.5% 7/21/20 (c) | | 1,050,000 | 1,012,725 |
| EVRAZ Group SA 8.25% 1/28/21 (Reg. S) | | 200,000 | 212,000 |
| Ferrexpo Finance PLC: | | | |
| 10.375% 4/7/19 (c) | | 129,000 | 129,671 |
| 10.375% 4/7/19 (c) | | 262,500 | 263,865 |
| 10.375% 4/7/19 (Reg. S) | | 75,000 | 75,390 |
| 10.375% 4/7/19 (Reg. S) | | 222,500 | 223,657 |
| First Quantum Minerals Ltd.: | | | |
| 6.5% 3/1/24 (c) | | 460,000 | 381,800 |
| 6.875% 3/1/26 (c) | | 1,165,000 | 934,913 |
| 7% 2/15/21 (c) | | 745,000 | 715,200 |
| 7.25% 5/15/22 (c) | | 615,000 | 570,413 |
| 7.25% 4/1/23 (c) | | 1,360,000 | 1,196,800 |
| 7.5% 4/1/25 (c) | | 955,000 | 787,875 |
| FMG Resources (August 2006) Pty Ltd.: | | | |
| 4.75% 5/15/22 (c) | | 405,000 | 384,750 |
| 5.125% 3/15/23 (c) | | 650,000 | 611,000 |
| 5.125% 5/15/24 (c) | | 495,000 | 455,400 |
| Freeport-McMoRan, Inc. 5.45% 3/15/43 | | 280,000 | 213,150 |
| Gold Fields Orogen Holding BVI Ltd. 4.875% 10/7/20 (c) | | 640,000 | 632,832 |
| JMC Steel Group, Inc. 9.875% 6/15/23 (c) | | 405,000 | 426,263 |
| Joseph T Ryerson & Son, Inc. 11% 5/15/22 (c) | | 350,000 | 352,625 |
| Metinvest BV 7.75% 4/23/23 (c) | | 1,980,000 | 1,801,618 |
| Murray Energy Corp. 11.25% 4/15/21 (c) | | 660,000 | 411,675 |
| Polyus Finance PLC 5.25% 2/7/23 (c) | | 825,000 | 800,291 |
| POSCO 4% 8/1/23 (c) | | 270,000 | 272,355 |
| Stillwater Mining Co. 6.125% 6/27/22 (c) | | 1,395,000 | 1,289,343 |
| United States Steel Corp. 6.25% 3/15/26 | | 615,000 | 538,125 |
| Vedanta Resources PLC: | | | |
| 6.375% 7/30/22 (c) | | 930,000 | 831,420 |
| 8.25% 6/7/21 (c) | | 580,000 | 574,490 |
| VM Holding SA 5.375% 5/4/27(c) | | 135,000 | 130,613 |
| | | | 22,696,617 |
| Paper & Forest Products - 0.0% | | | |
| Boise Cascade Co. 5.625% 9/1/24 (c) | | 225,000 | 210,938 |
| NewPage Corp.: | | | |
| 3 month U.S. LIBOR + 6.250% 6.7159% 5/1/12 (b)(d)(e)(h) | | 90,000 | 0 |
| 11.375% 12/31/2014 (d)(h) | | 317,581 | 0 |
| | | | 210,938 |
| TOTAL MATERIALS | | | 35,215,646 |
| REAL ESTATE - 0.7% | | | |
| Equity Real Estate Investment Trusts (REITs) - 0.3% | | | |
| Crown Castle International Corp. 5.25% 1/15/23 | | 1,530,000 | 1,588,789 |
| Equinix, Inc. 5.375% 5/15/27 | | 480,000 | 469,200 |
| MPT Operating Partnership LP/MPT Finance Corp.: | | | |
| 5% 10/15/27 | | 1,295,000 | 1,184,116 |
| 5.25% 8/1/26 | | 390,000 | 367,575 |
| 6.375% 3/1/24 | | 195,000 | 199,875 |
| | | | 3,809,555 |
| Real Estate Management & Development - 0.4% | | | |
| Deutsche Annington Finance BV 2.75% 3/22/38 | EUR | 700,000 | 768,791 |
| Grand City Properties SA 1.375% 8/3/26 (Reg. S) | EUR | 1,600,000 | 1,698,447 |
| Howard Hughes Corp. 5.375% 3/15/25 (c) | | 665,000 | 625,100 |
| Inversiones y Representaciones SA 11.5% 7/20/20 (Reg. S) | | 85,000 | 85,850 |
| IRSA Propiedades Comerciales SA 8.75% 3/23/23 (c) | | 635,000 | 608,197 |
| Mattamy Group Corp. 6.875% 12/15/23 (c) | | 470,000 | 438,863 |
| Shimao Property Holdings Ltd. 4.75% 7/3/22 | | 655,000 | 616,174 |
| Taylor Morrison Communities, Inc./Monarch Communities, Inc.: | | | |
| 5.25% 4/15/21 (c) | | 785,000 | 777,150 |
| 5.625% 3/1/24 (c) | | 65,000 | 61,750 |
| | | | 5,680,322 |
| TOTAL REAL ESTATE | | | 9,489,877 |
| UTILITIES - 1.0% | | | |
| Electric Utilities - 0.2% | | | |
| Enel SpA 3.375% 11/24/81 (Reg. S) (b) | EUR | 1,375,000 | 1,436,991 |
| Eskom Holdings SOC Ltd. 5.75% 1/26/21 (Reg. S) | | 200,000 | 188,410 |
| Israel Electric Corp. Ltd. 7.75% 12/15/27 (Reg. S) | | 250,000 | 296,285 |
| Pampa Holding SA 7.5% 1/24/27 (c) | | 195,000 | 163,352 |
| Vistra Operations Co. LLC 5.5% 9/1/26 (c) | | 820,000 | 789,250 |
| | | | 2,874,288 |
| Gas Utilities - 0.0% | | | |
| Southern Natural Gas Co.: | | | |
| 7.35% 2/15/31 | | 175,000 | 205,314 |
| 8% 3/1/32 | | 335,000 | 427,044 |
| | | | 632,358 |
| Independent Power and Renewable Electricity Producers - 0.8% | | | |
| Calpine Corp. 5.25% 6/1/26 (c) | | 955,000 | 871,438 |
| Dynegy, Inc. 7.625% 11/1/24 | | 3,573,000 | 3,769,515 |
| NextEra Energy Partners LP: | | | |
| 4.25% 9/15/24 (c) | | 415,000 | 383,875 |
| 4.5% 9/15/27 (c) | | 290,000 | 258,100 |
| NRG Energy, Inc.: | | | |
| 5.75% 1/15/28 | | 1,740,000 | 1,670,400 |
| 6.625% 1/15/27 | | 1,345,000 | 1,355,088 |
| Pattern Energy Group, Inc. 5.875% 2/1/24 (c) | | 295,000 | 284,675 |
| Talen Energy Supply LLC: | | | |
| 6.5% 6/1/25 | | 460,000 | 326,600 |
| 10.5% 1/15/26 (c) | | 435,000 | 369,750 |
| TerraForm Power Operating LLC: | | | |
| 4.25% 1/31/23 (c) | | 320,000 | 298,400 |
| 5% 1/31/28 (c) | | 320,000 | 281,600 |
| 6.625% 6/15/25 (b)(c) | | 418,000 | 422,180 |
| The AES Corp. 4.5% 3/15/23 | | 260,000 | 253,500 |
| | | | 10,545,121 |
| Multi-Utilities - 0.0% | | | |
| RWE AG 5.75% 2/14/33 (Reg. S) | EUR | 300,000 | 478,756 |
| TOTAL UTILITIES | | | 14,530,523 |
|
| TOTAL NONCONVERTIBLE BONDS | | | 462,524,285 |
|
| TOTAL CORPORATE BONDS | | | |
| (Cost $491,744,361) | | | 462,865,508 |
|
| U.S. Government and Government Agency Obligations - 16.4% | | | |
| U.S. Government Agency Obligations - 0.0% | | | |
| Tennessee Valley Authority: | | | |
| 5.25% 9/15/39 | | $126,000 | $158,376 |
| 5.375% 4/1/56 | | 302,000 | 412,716 |
|
| TOTAL U.S. GOVERNMENT AGENCY OBLIGATIONS | | | 571,092 |
|
| U.S. Treasury Obligations - 16.1% | | | |
| U.S. Treasury Bills, yield at date of purchase 2.19% to 2.36% 1/3/19 to 3/21/19 (i) | | 460,000 | 458,880 |
| U.S. Treasury Bonds: | | | |
| stripped coupon 2/15/34 | | 2,020,000 | 1,301,861 |
| 2.5% 2/15/46 | | 3,344,000 | 3,024,653 |
| 2.75% 8/15/47 | | 12,922,000 | 12,260,044 |
| 2.75% 11/15/47 | | 2,450,000 | 2,322,363 |
| 2.875% 8/15/45 | | 6,384,000 | 6,229,268 |
| 3% 11/15/44 | | 582,000 | 582,166 |
| 3% 5/15/47 | | 900,000 | 897,724 |
| 3% 2/15/48 | | 1,992,000 | 1,984,804 |
| 3.375% 11/15/48 | | 2,754,000 | 2,949,998 |
| 3.625% 2/15/44 | | 9,514,000 | 10,557,278 |
| 4.25% 5/15/39 | | 1,838,000 | 2,220,287 |
| 4.75% 2/15/37 | | 6,752,000 | 8,613,944 |
| 6.25% 8/15/23 (i)(j) | | 2,249,000 | 2,612,301 |
| 7.875% 2/15/21 | | 200,000 | 221,973 |
| U.S. Treasury Notes: | | | |
| 1.125% 9/30/21 | | 9,774,000 | 9,426,020 |
| 1.375% 4/30/20 | | 2,787,000 | 2,743,973 |
| 1.375% 8/31/23 | | 500,000 | 475,280 |
| 1.5% 10/31/19 | | 3,630,000 | 3,596,096 |
| 1.5% 7/15/20 | | 1,668,000 | 1,641,724 |
| 1.625% 7/31/20 | | 1,500,000 | 1,478,582 |
| 1.625% 8/31/22 | | 4,833,000 | 4,688,079 |
| 1.625% 5/31/23 | | 760,000 | 732,185 |
| 1.75% 12/31/20 | | 2,634,000 | 2,595,895 |
| 1.75% 5/31/22 | | 100,000 | 97,624 |
| 1.75% 6/30/22 | | 3,913,000 | 3,818,229 |
| 1.875% 1/31/22 | | 3,691,000 | 3,625,138 |
| 1.875% 3/31/22 | | 14,114,000 | 13,849,075 |
| 1.875% 7/31/22 | | 6,969,000 | 6,824,494 |
| 1.875% 10/31/22 | | 3,546,000 | 3,466,877 |
| 2% 9/30/20 | | 3,047,000 | 3,019,555 |
| 2% 1/15/21 | | 2,831,000 | 2,801,886 |
| 2% 12/31/21 | | 10,021,000 | 9,883,623 |
| 2% 10/31/22 | | 3,100,000 | 3,045,118 |
| 2% 8/15/25 | | 768,000 | 740,656 |
| 2% 11/15/26 | | 5,745,000 | 5,487,941 |
| 2.125% 12/31/22 | | 553,000 | 545,225 |
| 2.125% 7/31/24 | | 13,264,000 | 12,975,737 |
| 2.125% 5/15/25 | | 1,911,000 | 1,860,096 |
| 2.25% 2/29/20 | | 1,000,000 | 995,955 |
| 2.25% 7/31/21 | | 5,379,000 | 5,348,459 |
| 2.25% 12/31/24 | | 8,414,000 | 8,267,649 |
| 2.25% 2/15/27 | | 4,691,000 | 4,558,434 |
| 2.25% 8/15/27 | | 746,000 | 722,508 |
| 2.375% 4/15/21 | | 9,090,000 | 9,065,648 |
| 2.375% 5/15/27 | | 211,000 | 206,737 |
| 2.625% 8/31/20 | | 5,000,000 | 5,006,042 |
| 2.625% 6/30/23 | | 1,393,000 | 1,400,228 |
| 2.625% 12/31/23 | | 5,017,000 | 5,042,908 |
| 2.75% 9/30/20 | | 9,640,000 | 9,674,789 |
| 2.75% 8/15/21 | | 5,568,000 | 5,604,937 |
| 2.75% 6/30/25 | | 6,174,000 | 6,238,023 |
| 2.75% 2/15/28 | | 60,000 | 60,354 |
| 2.875% 11/30/25 | | 5,592,000 | 5,694,877 |
|
| TOTAL U.S. TREASURY OBLIGATIONS | | | 223,544,200 |
|
| Other Government Related - 0.3% | | | |
| National Credit Union Administration Guaranteed Notes: | | | |
| Series 2010-A1 Class A, 1 month U.S. LIBOR + 0.350% 2.7369% 12/7/20 (NCUA Guaranteed) (b)(e) | | 80,630 | 80,702 |
| Series 2011-R1 Class 1A, 1 month U.S. LIBOR + 0.450% 2.8295% 1/8/20 (NCUA Guaranteed) (b)(e) | | 131,573 | 131,749 |
| National Credit Union Administration Guaranteed Notes Master Trust 3.45% 6/12/21 (NCUA Guaranteed) | | 3,400,000 | 3,457,465 |
|
| TOTAL OTHER GOVERNMENT RELATED | | | 3,669,916 |
|
| TOTAL U.S. GOVERNMENT AND GOVERNMENT AGENCY OBLIGATIONS | | | |
| (Cost $229,246,424) | | | 227,785,208 |
|
| U.S. Government Agency - Mortgage Securities - 2.3% | | | |
| Fannie Mae - 1.8% | | | |
| 12 month U.S. LIBOR + 1.365% 4.115% 10/1/35 (b)(e) | | 784 | 808 |
| 12 month U.S. LIBOR + 1.495% 3.819% 1/1/35 (b)(e) | | 3,573 | 3,670 |
| 12 month U.S. LIBOR + 1.553% 4.276% 6/1/36 (b)(e) | | 767 | 798 |
| 12 month U.S. LIBOR + 1.565% 3.565% 3/1/37 (b)(e) | | 1,444 | 1,503 |
| 12 month U.S. LIBOR + 1.617% 4.117% 3/1/33 (b)(e) | | 2,675 | 2,780 |
| 12 month U.S. LIBOR + 1.643% 4.315% 9/1/36 (b)(e) | | 1,143 | 1,189 |
| 12 month U.S. LIBOR + 1.645% 4.355% 6/1/47 (b)(e) | | 2,734 | 2,872 |
| 12 month U.S. LIBOR + 1.725% 2.586% 6/1/42 (b)(e) | | 15,541 | 16,140 |
| 12 month U.S. LIBOR + 1.728% 4.138% 11/1/36 (b)(e) | | 1,207 | 1,262 |
| 12 month U.S. LIBOR + 1.745% 3.808% 7/1/35 (b)(e) | | 8,094 | 8,465 |
| 12 month U.S. LIBOR + 1.760% 3.822% 2/1/37 (b)(e) | | 10,925 | 11,483 |
| 12 month U.S. LIBOR + 1.800% 2.987% 1/1/42 (b)(e) | | 50,829 | 53,618 |
| 12 month U.S. LIBOR + 1.800% 4.547% 7/1/41 (b)(e) | | 13,211 | 13,924 |
| 12 month U.S. LIBOR + 1.818% 2.728% 2/1/42 (b)(e) | | 76,819 | 80,498 |
| 12 month U.S. LIBOR + 1.818% 4.546% 7/1/41 (b)(e) | | 8,654 | 8,949 |
| 12 month U.S. LIBOR + 1.818% 4.568% 9/1/41 (b)(e) | | 5,974 | 6,296 |
| 12 month U.S. LIBOR + 1.830% 4.662% 10/1/41 (b)(e) | | 5,987 | 6,316 |
| 12 month U.S. LIBOR + 1.851% 4.271% 5/1/36 (b)(e) | | 492 | 515 |
| 12 month U.S. LIBOR + 1.885% 3.972% 4/1/36 (b)(e) | | 7,814 | 8,242 |
| 12 month U.S. LIBOR + 2.176% 4.353% 8/1/35 (b)(e) | | 5,020 | 5,266 |
| 6 month U.S. LIBOR + 1.550% 4.05% 9/1/33 (b)(e) | | 10,811 | 11,014 |
| 6 month U.S. LIBOR + 1.550% 4.083% 11/1/35 (b)(e) | | 4,828 | 4,967 |
| 3% 10/1/46 | | 198,930 | 194,323 |
| 3% 1/1/49 (k) | | 1,300,000 | 1,268,422 |
| 3% 1/1/49 (k) | | 800,000 | 780,567 |
| 3% 1/1/49 (k) | | 1,300,000 | 1,268,422 |
| 3% 1/1/49 (k) | | 590,000 | 575,668 |
| 3% 3/1/49 (k) | | 1,245,000 | 1,213,348 |
| 3% 3/1/49 (k) | | 1,245,000 | 1,213,347 |
| 3.5% 7/1/32 to 4/1/48 | | 1,905,217 | 1,922,686 |
| 3.5% 1/1/34 (k) | | 575,000 | 582,126 |
| 3.5% 1/1/34 (k) | | 200,000 | 202,479 |
| 3.5% 1/1/34 (k) | | 225,000 | 227,788 |
| 3.5% 1/1/34 (k) | | 250,000 | 253,098 |
| 3.5% 1/1/34 (k) | | 325,000 | 329,028 |
| 3.5% 1/1/34 (k) | | 325,000 | 329,028 |
| 3.5% 1/1/49 (k) | | 2,650,000 | 2,648,986 |
| 3.5% 1/1/49 (k) | | 2,650,000 | 2,648,986 |
| 3.5% 2/1/49 (k) | | 3,550,000 | 3,546,285 |
| 4.5% 11/1/25 to 4/1/48 | | 2,829,253 | 2,935,564 |
| 4.5% 1/1/49 (k) | | 150,000 | 155,281 |
| 4.5% 1/1/49 (k) | | 50,000 | 51,760 |
| 5.5% 12/1/39 to 5/1/44 | | 2,125,085 | 2,284,469 |
| 6% 1/1/34 to 6/1/36 | | 246,516 | 274,120 |
| 6.5% 5/1/26 to 8/1/36 | | 243,588 | 272,225 |
|
| TOTAL FANNIE MAE | | | 25,428,581 |
|
| Freddie Mac - 0.4% | | | |
| 12 month U.S. LIBOR + 1.325% 3.075% 3/1/37 (b)(e) | | 935 | 964 |
| 12 month U.S. LIBOR + 1.325% 3.784% 1/1/36 (b)(e) | | 2,222 | 2,286 |
| 12 month U.S. LIBOR + 1.600% 4.35% 7/1/35 (b)(e) | | 1,747 | 1,814 |
| 12 month U.S. LIBOR + 1.665% 3.54% 7/1/36 (b)(e) | | 126,480 | 131,786 |
| 12 month U.S. LIBOR + 1.754% 4.5% 9/1/41 (b)(e) | | 81,858 | 85,869 |
| 12 month U.S. LIBOR + 1.793% 4.421% 4/1/37 (b)(e) | | 1,998 | 2,094 |
| 12 month U.S. LIBOR + 1.877% 4.202% 4/1/41 (b)(e) | | 6,266 | 6,592 |
| 12 month U.S. LIBOR + 1.880% 4.63% 9/1/41 (b)(e) | | 7,255 | 7,635 |
| 12 month U.S. LIBOR + 1.880% 4.711% 10/1/41 (b)(e) | | 58,501 | 60,303 |
| 12 month U.S. LIBOR + 1.883% 4.496% 10/1/42 (b)(e) | | 49,810 | 51,506 |
| 12 month U.S. LIBOR + 1.910% 4.358% 5/1/41 (b)(e) | | 12,860 | 13,289 |
| 12 month U.S. LIBOR + 1.910% 4.477% 5/1/41 (b)(e) | | 9,161 | 9,655 |
| 12 month U.S. LIBOR + 1.910% 4.583% 6/1/41 (b)(e) | | 12,094 | 12,494 |
| 12 month U.S. LIBOR + 1.910% 4.66% 6/1/41 (b)(e) | | 7,340 | 7,571 |
| 12 month U.S. LIBOR + 2.045% 4.778% 7/1/36 (b)(e) | | 3,158 | 3,333 |
| 6 month U.S. LIBOR + 1.445% 3.945% 3/1/35 (b)(e) | | 1,986 | 2,030 |
| 6 month U.S. LIBOR + 1.647% 4.152% 2/1/37 (b)(e) | | 2,027 | 2,092 |
| 6 month U.S. LIBOR + 1.685% 4.243% 1/1/37 (b)(e) | | 10,265 | 10,595 |
| 6 month U.S. LIBOR + 1.720% 4.22% 8/1/37 (b)(e) | | 2,809 | 2,908 |
| 6 month U.S. LIBOR + 1.746% 4.33% 5/1/37 (b)(e) | | 753 | 782 |
| 6 month U.S. LIBOR + 1.844% 4.352% 10/1/36 (b)(e) | | 7,971 | 8,270 |
| 6 month U.S. LIBOR + 1.913% 4.427% 10/1/35 (b)(e) | | 4,989 | 5,177 |
| 6 month U.S. LIBOR + 2.010% 4.51% 5/1/37 (b)(e) | | 2,850 | 2,976 |
| 6 month U.S. LIBOR + 2.010% 4.531% 5/1/37 (b)(e) | | 8,833 | 9,225 |
| 6 month U.S. LIBOR + 2.029% 4.621% 6/1/37 (b)(e) | | 1,614 | 1,686 |
| 6 month U.S. LIBOR + 2.040% 4.603% 6/1/37 (b)(e) | | 2,192 | 2,293 |
| 6 month U.S. LIBOR + 2.590% 5.09% 10/1/35 (b)(e) | | 1,010 | 1,060 |
| U.S. TREASURY 1 YEAR INDEX + 2.035% 3.926% 6/1/33 (b)(e) | | 7,877 | 8,210 |
| U.S. TREASURY 1 YEAR INDEX + 2.548% 4.639% 7/1/35 (b)(e) | | 4,544 | 4,805 |
| 3% 11/1/33 | | 730,664 | 731,782 |
| 3.5% 7/1/32 | | 397,810 | 403,702 |
| 3.5% 1/1/49 (k) | | 800,000 | 799,507 |
| 4% 9/1/42 | | 3,080,748 | 3,169,205 |
| 4.5% 1/1/49 (k) | | 300,000 | 310,421 |
| 6% 1/1/24 | | 44,025 | 45,991 |
| 6.5% 9/1/21 to 3/1/22 | | 6,824 | 7,077 |
|
| TOTAL FREDDIE MAC | | | 5,926,985 |
|
| Ginnie Mae - 0.1% | | | |
| 6% 6/15/36 | | 208,574 | 233,868 |
| 4.422% 8/20/61 (b)(l) | | 16,706 | 16,746 |
| 4.572% 2/20/62 (b)(l) | | 63,822 | 64,360 |
| 4.661% 2/20/62 (b)(l) | | 60,546 | 60,765 |
| 4.737% 1/20/62 (b)(l) | | 235,237 | 236,137 |
| 5.47% 8/20/59 (b)(l) | | 397 | 424 |
|
| TOTAL GINNIE MAE | | | 612,300 |
|
| TOTAL U.S. GOVERNMENT AGENCY - MORTGAGE SECURITIES | | | |
| (Cost $31,745,122) | | | 31,967,866 |
|
| Asset-Backed Securities - 0.8% | | | |
| ALG Student Loan Trust Series 2017-1A Class A3, 3 month U.S. LIBOR + 0.090% 2.4289% 6/28/23 (b)(c)(e) | | $1,372,684 | $1,366,824 |
| Goal Capital Funding Trust Series 2005-2 Class A3, 3 month U.S. LIBOR + 0.170% 2.8469% 5/28/30 (b)(e) | | 101,890 | 101,742 |
| Higher Education Funding Series 2005-1 Class A5, 3 month U.S. LIBOR + 0.160% 2.8369% 2/25/32 (b)(e) | | 112,057 | 111,970 |
| Navient Student Loan Trust: | | | |
| Series 2017-3A: | | | |
| Class A1, 1 month U.S. LIBOR + 0.300% 2.8063% 7/26/66 (b)(c)(e) | | 321,179 | 321,276 |
| Class A2, 1 month U.S. LIBOR + 0.600% 3.1063% 7/26/66 (b)(c)(e) | | 980,000 | 981,259 |
| Series 2018-1A Class A1, 1 month U.S. LIBOR + 0.190% 2.6963% 3/25/67 (b)(c)(e) | | 561,930 | 561,930 |
| Northstar Education Finance, Inc., Delaware Series 2004-2 Class A4, 3 month U.S. LIBOR + 0.230% 2.7393% 7/28/21 (b)(e) | | 1,866,952 | 1,867,300 |
| SLM Student Loan Trust Series 2007-8 Class A4, 3 month U.S. LIBOR + 0.470% 2.9599% 1/26/26 (b)(e) | | 5,202,565 | 5,218,845 |
| TOTAL ASSET-BACKED SECURITIES | | | |
| (Cost $10,523,720) | | | 10,531,146 |
|
| Collateralized Mortgage Obligations - 3.3% | | | |
| U.S. Government Agency - 3.3% | | | |
| Fannie Mae: | | | |
| floater Series 2010-15 Class FJ, 1 month U.S. LIBOR + 0.930% 3.4363% 6/25/36 (b)(e) | | 213,091 | 216,401 |
| planned amortization class: | | | |
| Series 2003-70 Class BJ, 5% 7/25/33 | | 11,308 | 12,053 |
| Series 2005-19 Class PA, 5.5% 7/25/34 | | 30,086 | 30,463 |
| Series 2005-64 Class PX, 5.5% 6/25/35 | | 50,877 | 53,374 |
| Series 2005-68 Class CZ, 5.5% 8/25/35 | | 279,092 | 304,951 |
| Series 2010-118 Class PB, 4.5% 10/25/40 | | 191,474 | 200,688 |
| Series 2012-149: | | | |
| Class DA, 1.75% 1/25/43 | | 91,005 | 87,241 |
| Class GA, 1.75% 6/25/42 | | 92,931 | 88,893 |
| sequential payer: | | | |
| Series 2003-117 Class MD, 5% 12/25/23 | | 36,955 | 38,202 |
| Series 2004-52 Class KZ, 5.5% 7/25/34 | | 504,117 | 549,273 |
| Series 2004-91 Class Z, 5% 12/25/34 | | 182,597 | 194,720 |
| Series 2005-117 Class JN, 4.5% 1/25/36 | | 16,421 | 17,066 |
| Series 2005-14 Class ZB, 5% 3/25/35 | | 74,834 | 79,816 |
| Series 2006-72 Class CY, 6% 8/25/26 | | 31,095 | 32,908 |
| Series 2009-59 Class HB, 5% 8/25/39 | | 106,917 | 114,016 |
| Series 2009-85 Class IB, 4.5% 8/25/24 (m) | | 3,134 | 53 |
| Series 2009-93 Class IC, 4.5% 9/25/24 (m) | | 3,693 | 50 |
| Series 2010-139 Class NI, 4.5% 2/25/40 (m) | | 91,527 | 8,204 |
| Series 2010-39 Class FG, 1 month U.S. LIBOR + 0.920% 3.4263% 3/25/36 (b)(e) | | 131,481 | 134,358 |
| Series 2010-97 Class CI, 4.5% 8/25/25 (m) | | 15,502 | 467 |
| Series 2011-67 Class AI, 4% 7/25/26 (m) | | 29,267 | 2,372 |
| Series 2012-27 Class EZ, 4.25% 3/25/42 | | 395,053 | 413,460 |
| Series 2016-26 Class CG, 3% 5/25/46 | | 680,574 | 677,315 |
| Freddie Mac: | | | |
| floater Series 2711 Class FC, 1 month U.S. LIBOR + 0.900% 3.3551% 2/15/33 (b)(e) | | 64,530 | 65,749 |
| floater planned amortization class Series 2770 Class FH, 1 month U.S. LIBOR + 0.400% 2.8551% 3/15/34 (b)(e) | | 88,823 | 89,079 |
| planned amortization class: | | | |
| Series 2101 Class PD, 6% 11/15/28 | | 1,311 | 1,415 |
| Series 2996 Class MK, 5.5% 6/15/35 | | 2,848 | 3,040 |
| Series 3415 Class PC, 5% 12/15/37 | | 30,222 | 32,133 |
| Series 3840 Class VA, 4.5% 9/15/27 | | 72,400 | 72,658 |
| Series 3857 Class ZP, 5% 5/15/41 | | 186,869 | 212,350 |
| Series 4135 Class AB, 1.75% 6/15/42 | | 68,800 | 65,979 |
| sequential payer: | | | |
| Series 2004-2802 Class ZG, 5.5% 5/15/34 | | 410,507 | 448,626 |
| Series 2303 Class ZV, 6% 4/15/31 | | 3,817 | 4,128 |
| Series 2877 Class ZD, 5% 10/15/34 | | 225,053 | 240,144 |
| Series 3745 Class KV, 4.5% 12/15/26 | | 334,606 | 348,835 |
| Series 3843 Class PZ, 5% 4/15/41 | | 164,283 | 184,450 |
| Freddie Mac Multi-family Structured pass-thru certificates sequential payer: | | | |
| Series 4335 Class AL, 4.25% 3/15/40 | | 243,680 | 249,592 |
| Series 4341 Class ML, 3.5% 11/15/31 | | 373,975 | 380,738 |
| Freddie Mac Seasoned Credit Risk Transfer Trust sequential payer: | | | |
| Series 2018-3 Class MA, 3.5% 8/25/57 | | 4,456,885 | 4,483,020 |
| Series 2018-4 Class MA, 3.5% 11/25/57 | | 2,934,407 | 2,922,351 |
| Freddie Mac SLST sequential payer Series 2018-1: | | | |
| Class A1, 3.5% 6/25/28 | | 598,797 | 596,299 |
| Class A2, 3.5% 6/25/28 | | 150,000 | 147,540 |
| Ginnie Mae guaranteed REMIC pass-thru certificates: | | | |
| floater: | | | |
| Series 2007-59 Class FC, 1 month U.S. LIBOR + 0.500% 2.9701% 7/20/37 (b)(e) | | 45,019 | 45,224 |
| Series 2008-2 Class FD, 1 month U.S. LIBOR + 0.480% 2.9501% 1/20/38 (b)(e) | | 11,401 | 11,452 |
| Series 2008-73 Class FA, 1 month U.S. LIBOR + 0.860% 3.3301% 8/20/38 (b)(e) | | 78,209 | 79,534 |
| Series 2008-83 Class FB, 1 month U.S. LIBOR + 0.900% 3.3701% 9/20/38 (b)(e) | | 64,915 | 66,351 |
| Series 2009-108 Class CF, 1 month U.S. LIBOR + 0.600% 3.0551% 11/16/39 (b)(e) | | 48,585 | 48,956 |
| Series 2009-116 Class KF, 1 month U.S. LIBOR + 0.530% 2.9851% 12/16/39 (b)(e) | | 38,354 | 38,593 |
| Series 2010-H17 Class FA, 1 month U.S. LIBOR + 0.330% 2.6519% 7/20/60 (b)(e)(l) | | 349,289 | 348,609 |
| Series 2010-H18 Class AF, 1 month U.S. LIBOR + 0.300% 2.6136% 9/20/60 (b)(e)(l) | | 439,925 | 438,802 |
| Series 2010-H19 Class FG, 1 month U.S. LIBOR + 0.300% 2.6136% 8/20/60 (b)(e)(l) | | 445,267 | 444,109 |
| Series 2010-H27 Series FA, 1 month U.S. LIBOR + 0.380% 2.6936% 12/20/60 (b)(e)(l) | | 196,100 | 195,996 |
| Series 2011-H05 Class FA, 1 month U.S. LIBOR + 0.500% 2.8136% 12/20/60 (b)(e)(l) | | 258,582 | 259,157 |
| Series 2011-H07 Class FA, 1 month U.S. LIBOR + 0.500% 2.8136% 2/20/61 (b)(e)(l) | | 455,937 | 456,756 |
| Series 2011-H12 Class FA, 1 month U.S. LIBOR + 0.490% 2.8036% 2/20/61 (b)(e)(l) | | 648,603 | 649,665 |
| Series 2011-H13 Class FA, 1 month U.S. LIBOR + 0.500% 2.8136% 4/20/61 (b)(e)(l) | | 205,204 | 205,681 |
| Series 2011-H14: | | | |
| Class FB, 1 month U.S. LIBOR + 0.500% 2.8136% 5/20/61 (b)(e)(l) | | 257,525 | 258,214 |
| Class FC, 1 month U.S. LIBOR + 0.500% 2.8136% 5/20/61 (b)(e)(l) | | 234,100 | 234,665 |
| Series 2011-H17 Class FA, 1 month U.S. LIBOR + 0.530% 2.8436% 6/20/61 (b)(e)(l) | | 289,933 | 290,756 |
| Series 2011-H21 Class FA, 1 month U.S. LIBOR + 0.600% 2.9136% 10/20/61 (b)(e)(l) | | 324,492 | 326,004 |
| Series 2012-H01 Class FA, 1 month U.S. LIBOR + 0.700% 3.0136% 11/20/61 (b)(e)(l) | | 286,562 | 288,645 |
| Series 2012-H03 Class FA, 1 month U.S. LIBOR + 0.700% 3.0136% 1/20/62 (b)(e)(l) | | 187,577 | 188,863 |
| Series 2012-H06 Class FA, 1 month U.S. LIBOR + 0.630% 2.9436% 1/20/62 (b)(e)(l) | | 272,893 | 274,409 |
| Series 2012-H07 Class FA, 1 month U.S. LIBOR + 0.630% 2.9436% 3/20/62 (b)(e)(l) | | 160,449 | 161,129 |
| Series 2012-H21 Class DF, 1 month U.S. LIBOR + 0.650% 2.9636% 5/20/61 (b)(e)(l) | | 19,094 | 19,139 |
| Series 2013-H19 Class FD, 1 month U.S. LIBOR + 0.600% 2.9136% 8/20/63 (b)(e)(l) | | 165,602 | 166,197 |
| Series 2014-H11 Class BA, 1 month U.S. LIBOR + 0.500% 2.8136% 6/20/64 (b)(e)(l) | | 1,374,802 | 1,378,237 |
| Series 2015-H13 Class FL, 1 month U.S. LIBOR + 0.280% 2.5936% 5/20/63 (b)(e)(l) | | 197,201 | 197,036 |
| Series 2015-H19 Class FA, 1 month U.S. LIBOR + 0.200% 2.5136% 4/20/63 (b)(e)(l) | | 200,370 | 200,097 |
| Series 2016-H20 Class FM, 1 month U.S. LIBOR + 0.400% 2.7136% 12/20/62 (b)(e)(l) | | 155,384 | 155,364 |
| Series 2017-161 Class DF, 1 month U.S. LIBOR + 0.250% 2.7201% 10/20/47 (b)(e) | | 432,790 | 429,108 |
| Series 2018-65 Class DF, 1 month U.S. LIBOR + 0.300% 2.7701% 5/20/48 (b)(e) | | 535,988 | 532,294 |
| Series 2018-77 Class FA, 1 month U.S. LIBOR + 0.300% 2.7701% 6/20/48 (b)(e) | | 608,270 | 604,030 |
| planned amortization class: | | | |
| Series 2010-31 Class BP, 5% 3/20/40 | | 620,000 | 688,169 |
| Series 2011-136 Class WI, 4.5% 5/20/40 (m) | | 59,957 | 6,766 |
| Series 2017-134 Class BA, 2.5% 11/20/46 | | 86,986 | 84,447 |
| sequential payer: | | | |
| Series 2011-69 Class GX, 4.5% 5/16/40 | | 470,000 | 492,686 |
| Series 2013-H06 Class HA, 1.65% 1/20/63 (l) | | 135,338 | 133,619 |
| Series 2013-H26 Class HA, 3.5% 9/20/63 (l) | | 755,518 | 757,549 |
| Series 2014-H04 Class HA, 2.75% 2/20/64 (l) | | 1,645,985 | 1,635,084 |
| Series 2014-H12 Class KA, 2.75% 5/20/64 (l) | | 259,396 | 256,498 |
| Series 2016-H02 Class FM, 1 month U.S. LIBOR + 0.500% 2.8136% 9/20/62 (b)(e)(l) | | 658,528 | 658,879 |
| Series 2016-H04 Class FE, 1 month U.S. LIBOR + 0.650% 2.9636% 11/20/65 (b)(e)(l) | | 94,422 | 94,550 |
| Series 2018-H12 Class HA, 3.25% 8/20/68 (l) | | 1,656,363 | 1,673,739 |
| Series 2004-22 Class M1, 5.5% 4/20/34 | | 51,435 | 62,728 |
| Series 2010-169 Class Z, 4.5% 12/20/40 | | 413,155 | 436,842 |
| Series 2010-H15 Class TP, 5.15% 8/20/60 (l) | | 364,380 | 367,301 |
| Series 2010-H16 Class BA, 3.55% 7/20/60 (l) | | 1,507,107 | 1,507,605 |
| Series 2010-H17 Class XP, 5.2967% 7/20/60 (b)(l) | | 351,836 | 354,994 |
| Series 2010-H18 Class PL, 5.01% 9/20/60 (b)(l) | | 341,461 | 343,702 |
| Series 2010-H22 Class LA, 3.75% 10/20/60 (l) | | 374,122 | 374,742 |
| Series 2010-H28 Class KA, 3.75% 12/20/60 (l) | | 808,329 | 810,211 |
| Series 2012-64 Class KI, 3.5% 11/20/36 (m) | | 43,974 | 2,763 |
| Series 2013-124: | | | |
| Class ES, 8.667% - 1 month U.S. LIBOR 5.3732% 4/20/39 (b)(n) | | 184,806 | 187,803 |
| Class ST, 8.800% - 1 month U.S. LIBOR 5.5065% 8/20/39 (b)(n) | | 598,644 | 614,821 |
| Series 2013-H01 Class FA, 1.65% 1/20/63 (l) | | 757,100 | 746,166 |
| Series 2013-H07 Class JA, 1.75% 3/20/63 (l) | | 1,241,864 | 1,225,500 |
| Series 2013-H08 Class MA, 3% 3/20/63 (l) | | 1,612,895 | 1,608,983 |
| Series 2015-H17 Class HA, 2.5% 5/20/65 (l) | | 664,628 | 660,805 |
| Series 2015-H21: | | | |
| Class HA, 2.5% 6/20/63 (l) | | 1,180,114 | 1,174,695 |
| Class JA, 2.5% 6/20/65 (l) | | 141,819 | 140,974 |
| Series 2015-H30 Class HA, 1.75% 9/20/62 (b)(l) | | 1,433,745 | 1,418,588 |
| Series 2016-H13 Class FB, U.S. TREASURY 1 YEAR INDEX + 0.500% 3.16% 5/20/66 (b)(e)(l) | | 1,097,341 | 1,102,020 |
| Series 2017-186 Class HK, 3% 11/16/45 | | 750,832 | 741,565 |
| Series 2017-H06 Class FA, U.S. TREASURY 1 YEAR INDEX + 0.350% 3.01% 8/20/66 (b)(e)(l) | | 1,261,611 | 1,263,923 |
| Series 2090-118 Class XZ, 5% 12/20/39 | | 822,595 | 902,568 |
|
| TOTAL U.S. GOVERNMENT AGENCY | | | 45,328,827 |
|
| TOTAL COLLATERALIZED MORTGAGE OBLIGATIONS | | | |
| (Cost $45,557,115) | | | 45,328,827 |
|
| Commercial Mortgage Securities - 2.3% | | | |
| Fannie Mae Series 2017-T1 Class A, 2.898% 6/25/27 | | 2,688,633 | 2,551,078 |
| Freddie Mac: | | | |
| floater Series KP04 Class AG1, 1 month U.S. LIBOR + 0.220% 2.5669% 7/25/20 (b)(e) | | 900,000 | 899,458 |
| pass-thru certificates sequential payer Series K011 Class A2, 4.084% 11/25/20 | | 256,847 | 260,391 |
| sequential payer: | | | |
| Series 2017-SR01 Class A2, 2.75% 11/25/22 | | 1,600,000 | 1,576,966 |
| Series K006 Class A2, 4.251% 1/25/20 | | 1,042,000 | 1,051,280 |
| Series K069 Class A2, 3.187% 9/25/27 | | 600,000 | 594,228 |
| Series K071 Class A2, 3.286% 11/25/27 | | 800,000 | 797,366 |
| Series K072 Class A2, 3.444% 12/25/27 | | 2,173,000 | 2,191,791 |
| Series K073 Class A2, 3.35% 1/25/28 | | 3,500,000 | 3,504,664 |
| Series K080 Class A2, 3.926% 7/25/28 | | 2,800,000 | 2,926,178 |
| Series K155: | | | |
| Class A1, 3.75% 11/25/29 | | 68,893 | 71,596 |
| Class A2, 3.75% 11/25/32 | | 1,100,000 | 1,135,442 |
| Series K158 Class A2, 3.9% 12/25/30 | | 800,000 | 829,433 |
| Series K708 Class A2, 2.13% 1/25/19 | | 526,502 | 525,362 |
| Series K709 Class A2, 2.086% 3/25/19 | | 773,227 | 771,228 |
| Series K710 Class A2, 1.883% 5/25/19 | | 842,551 | 839,493 |
| Series K712 Class A2, 1.869% 11/25/19 | | 1,251,422 | 1,240,911 |
| Series K076 Class A2, 3.9% 6/25/51 | | 900,000 | 938,938 |
| Series K077 Class A2, 3.85% 5/25/28 | | 1,612,000 | 1,675,596 |
| Series K079 Class A2, 3.926% 6/25/28 | | 1,631,000 | 1,704,271 |
| Series K084 Class A2, 3.78% 10/25/28 | | 700,000 | 722,759 |
| Series K157 Class A2, 3.99% 5/25/33 | | 1,320,000 | 1,392,764 |
| Freddie Mac Multi-family floater Series 2017-KT01 Class A, 1 month U.S. LIBOR + 0.320% 2.8238% 2/25/20 (b)(e) | | 2,634,000 | 2,630,743 |
| Freddie Mac Multi-family Structured pass-thru certificates Series K078 Class A2, 3.854% 6/25/28 | | 1,000,000 | 1,039,812 |
| TOTAL COMMERCIAL MORTGAGE SECURITIES | | | |
| (Cost $31,868,178) | | | 31,871,748 |
|
| Foreign Government and Government Agency Obligations - 14.7% | | | |
| Arab Republic of Egypt: | | | |
| 5.577% 2/21/23 (c) | | 585,000 | 554,381 |
| 5.875% 6/11/25 | | 200,000 | 181,915 |
| 5.875% 6/11/25 (c) | | 135,000 | 122,792 |
| 6.125% 1/31/22 (c) | | 2,530,000 | 2,482,132 |
| 7.5% 1/31/27 (c) | | 215,000 | 204,822 |
| 7.903% 2/21/48 (c) | | 360,000 | 309,701 |
| 8.5% 1/31/47 (c) | | 685,000 | 617,393 |
| Argentine Republic: | | | |
| 5.625% 1/26/22 | | 975,000 | 822,656 |
| 6.875% 4/22/21 | | 4,370,000 | 3,948,339 |
| 7.5% 4/22/26 | | 4,135,000 | 3,313,169 |
| 7.625% 4/22/46 | | 965,000 | 699,143 |
| Australian Commonwealth: | | | |
| 2.25% 11/21/22 | AUD | 5,650,000 | 4,035,113 |
| 2.25% 5/21/28 (Reg. S) | AUD | 2,775,000 | 1,942,226 |
| 2.75% 10/21/19 | AUD | 2,700,000 | 1,913,743 |
| Azerbaijan Republic 4.75% 3/18/24 (c) | | 245,000 | 243,725 |
| Bahamian Republic 6% 11/21/28 (c) | | 180,000 | 182,700 |
| Barbados Government: | | | |
| 7% 8/4/22 (c)(d) | | 330,000 | 181,088 |
| 7.25% 12/15/21 (c)(d) | | 35,000 | 19,206 |
| Belarus Republic: | | | |
| 6.875% 2/28/23 (c) | | 1,100,000 | 1,120,614 |
| 7.625% 6/29/27 (c) | | 345,000 | 352,836 |
| Brazilian Federative Republic: | | | |
| 5.625% 1/7/41 | | 495,000 | 475,200 |
| 5.625% 2/21/47 | | 300,000 | 283,053 |
| 8.25% 1/20/34 | | 1,640,000 | 2,009,000 |
| 10% 1/1/21 | BRL | 1,165,000 | 314,415 |
| Buenos Aires Province: | | | |
| 6.5% 2/15/23 (c) | | 115,000 | 92,575 |
| 9.95% 6/9/21 (c) | | 785,000 | 737,900 |
| 10.875% 1/26/21(c) | | 1,250,000 | 1,231,250 |
| 10.875% 1/26/21 (Reg. S) | | 3,590,000 | 3,536,150 |
| Buoni del Tesoro Poliennali: | | | |
| 0.95% 3/1/23 | EUR | 3,350,000 | 3,740,356 |
| 2.5% 11/15/25 | EUR | 1,500,000 | 1,739,420 |
| 2.7% 3/1/47 (c) | EUR | 1,300,000 | 1,321,221 |
| 2.8% 12/1/28 | EUR | 2,800,000 | 3,227,990 |
| Cameroon Republic 9.5% 11/19/25 (c) | | 670,000 | 682,435 |
| Canadian Government: | | | |
| 1.25% 11/1/19 | CAD | 8,500,000 | 6,197,803 |
| 2% 9/1/23 | CAD | 1,250,000 | 920,122 |
| 2% 6/1/28 | CAD | 1,250,000 | 918,345 |
| 3.5% 12/1/45 | CAD | 1,500,000 | 1,389,247 |
| City of Buenos Aires 8.95% 2/19/21 (c) | | 475,000 | 472,008 |
| Colombian Republic: | | | |
| 7.375% 9/18/37 | | 155,000 | 187,473 |
| 10.375% 1/28/33 | | 570,000 | 846,932 |
| Danish Kingdom 1.75% 11/15/25 | DKK | 9,000,000 | 1,548,563 |
| Democratic Socialist Republic of Sri Lanka: | | | |
| 5.125% 4/11/19 (c) | | 195,000 | 193,050 |
| 5.75% 4/18/23 (c) | | 235,000 | 216,245 |
| 6% 1/14/19 (c) | | 775,000 | 771,125 |
| 6.2% 5/11/27 (c) | | 100,000 | 88,015 |
| 6.25% 10/4/20 (c) | | 100,000 | 97,005 |
| 6.25% 7/27/21 (c) | | 120,000 | 115,457 |
| Dominican Republic: | | | |
| 5.95% 1/25/27 (c) | | 255,000 | 254,044 |
| 6% 7/19/28 (c) | | 290,000 | 289,275 |
| 6.6% 1/28/24 (c) | | 25,000 | 26,063 |
| 6.85% 1/27/45 (c) | | 140,000 | 137,900 |
| 6.875% 1/29/26 (c) | | 460,000 | 482,425 |
| 7.45% 4/30/44 (c) | | 370,000 | 384,800 |
| Ecuador Republic: | | | |
| 8.875% 10/23/27 (c) | | 445,000 | 382,700 |
| 9.65% 12/13/26 (c) | | 400,000 | 364,000 |
| El Salvador Republic: | | | |
| 7.375% 12/1/19 (c) | | 1,205,000 | 1,209,519 |
| 7.75% 1/24/23 (c) | | 310,000 | 318,913 |
| French Government 2% 5/25/48 (c) | EUR | 450,000 | 559,987 |
| Gabonese Republic 6.375% 12/12/24 (c) | | 460,000 | 412,832 |
| Georgia Republic 6.875% 4/12/21 (c) | | 125,000 | 131,013 |
| German Federal Republic 0% 6/12/20 | EUR | 14,985,308 | 17,333,058 |
| Ghana Republic 8.627% 6/16/49 (c) | | 115,000 | 100,114 |
| Hong Kong Government SAR 1.32% 12/23/19 | HKD | 2,700,000 | 343,415 |
| Indonesian Republic: | | | |
| 7.75% 1/17/38 (c) | | 690,000 | 886,348 |
| 8.5% 10/12/35 (Reg. S) | | 700,000 | 941,483 |
| Irish Republic 2% 2/18/45 (Reg.S) | EUR | 750,000 | 906,566 |
| Islamic Republic of Pakistan: | | | |
| 6.75% 12/3/19 (c) | | 650,000 | 643,542 |
| 7.25% 4/15/19 (c) | | 1,595,000 | 1,591,332 |
| 8.25% 4/15/24 (c) | | 220,000 | 221,597 |
| Israeli State (guaranteed by U.S. Government through Agency for International Development): | | | |
| 5.5% 9/18/23 | | 5,659,000 | 6,361,931 |
| 5.5% 12/4/23 | | 1,628,000 | 1,831,378 |
| Ivory Coast 5.75% 12/31/32 | | 333,000 | 293,413 |
| Japan Government: | | | |
| 0.1% 6/20/28 | JPY | 100,000,000 | 922,303 |
| 0.4% 3/20/56 | JPY | 313,000,000 | 2,468,875 |
| 0.9% 6/20/22 | JPY | 2,960,000,000 | 27,977,682 |
| Jordanian Kingdom 3% 6/30/25 | | 1,179,000 | 1,178,764 |
| Kingdom of Norway 3.75% 5/25/21 | NOK | 5,000,000 | 613,663 |
| Kingdom of Saudi Arabia 3.625% 3/4/28 (c) | | 285,000 | 269,527 |
| Lebanese Republic: | | | |
| 5.45% 11/28/19 | | 735,000 | 710,289 |
| 5.5% 4/23/19 | | 955,000 | 944,738 |
| 5.8% 4/14/20 | | 340,000 | 323,646 |
| 6% 5/20/19 | | 1,515,000 | 1,501,365 |
| 6.15% 6/19/20 | | 170,000 | 160,647 |
| 6.375% 3/9/20 | | 425,000 | 409,046 |
| Malaysian Government 3.955% 9/15/25 | MYR | 2,040,000 | 491,187 |
| Ministry of Finance of the Russian Federation: | | | |
| 5.25% 6/23/47 (c) | | 1,400,000 | 1,305,620 |
| 5.625% 4/4/42 (c) | | 400,000 | 408,918 |
| 7.6% 7/20/22 | RUB | 35,430,000 | 502,392 |
| 12.75% 6/24/28 (Reg. S) | | 965,000 | 1,525,358 |
| Mongolian People's Republic 8.75% 3/9/24 (c) | | 545,000 | 582,686 |
| Moroccan Kingdom 4.25% 12/11/22 (c) | | 800,000 | 802,000 |
| New Zealand Government 6% 5/15/21 | NZD | 1,000,000 | 737,641 |
| Panamanian Republic 9.375% 4/1/29 | | 80,000 | 111,600 |
| Peruvian Republic 4% 3/7/27 (g) | | 570,000 | 563,576 |
| Plurinational State of Bolivia 5.95% 8/22/23 (c) | | 100,000 | 98,622 |
| Portuguese Republic 2.25% 4/18/34 (c) | EUR | 1,950,000 | 2,224,494 |
| Province of Santa Fe 7% 3/23/23 (c) | | 1,230,000 | 1,040,900 |
| Provincia de Cordoba: | | | |
| 7.125% 6/10/21 (c) | | 1,940,000 | 1,707,200 |
| 7.45% 9/1/24 (c) | | 695,000 | 564,688 |
| Republic of Angola 7% 8/17/19 (Issued by Northern Lights III BV for Republic of Angola) (Reg. S) | | 140,625 | 141,002 |
| Republic of Armenia: | | | |
| 6% 9/30/20 (c) | | 635,000 | 640,453 |
| 7.15% 3/26/25 (c) | | 90,000 | 94,345 |
| Republic of Iraq: | | | |
| 5.8% 1/15/28 (Reg. S) | | 2,300,000 | 2,056,706 |
| 6.752% 3/9/23 (c) | | 215,000 | 204,214 |
| Republic of Kenya 6.875% 6/24/24 (c) | | 100,000 | 93,875 |
| Republic of Nigeria: | | | |
| 6.75% 1/28/21 (c) | | 90,000 | 90,946 |
| 7.625% 11/28/47 (c) | | 120,000 | 100,895 |
| Republic of Serbia 7.25% 9/28/21 (c) | | 285,000 | 306,748 |
| Republic of Singapore 3.25% 9/1/20 | SGD | 4,100,000 | 3,074,692 |
| Romanian Republic 3.25% 4/29/24 | RON | 915,000 | 212,567 |
| Rwanda Republic 6.625% 5/2/23 (c) | | 210,000 | 207,900 |
| South African Republic 10.5% 12/21/26 | ZAR | 10,760,000 | 813,553 |
| Spanish Kingdom: | | | |
| 1.4% 7/30/28 (Reg. S) (c) | EUR | 1,850,000 | 2,115,280 |
| 2.7% 10/31/48 (c) | EUR | 1,550,000 | 1,807,561 |
| State of Qatar: | | | |
| 3.875% 4/23/23 (c) | | 530,000 | 536,005 |
| 4.5% 4/23/28 (c) | | 1,170,000 | 1,221,188 |
| 9.75% 6/15/30 (c) | | 375,000 | 569,170 |
| Sultanate of Oman 6.75% 1/17/48 (c) | | 320,000 | 264,000 |
| Sweden Kingdom 4.25% 3/12/19 | SEK | 21,700,000 | 2,471,067 |
| Switzerland Confederation 3% 5/12/19 | CHF | 3,200,000 | 3,301,577 |
| Turkish Republic: | | | |
| 5.125% 3/25/22 | | 175,000 | 170,274 |
| 5.625% 3/30/21 | | 805,000 | 804,940 |
| 5.75% 5/11/47 | | 140,000 | 113,924 |
| 6% 3/25/27 | | 125,000 | 117,538 |
| 6.25% 9/26/22 | | 3,745,000 | 3,766,489 |
| 6.75% 5/30/40 | | 250,000 | 228,690 |
| 6.875% 3/17/36 | | 530,000 | 496,170 |
| 7% 3/11/19 | | 900,000 | 902,988 |
| 7% 6/5/20 | | 420,000 | 428,083 |
| 7.25% 12/23/23 | | 445,000 | 456,807 |
| 7.25% 3/5/38 | | 205,000 | 198,207 |
| 7.375% 2/5/25 | | 475,000 | 489,393 |
| Turkiye Ihracat Kredi Bankasi A/S 5.375% 2/8/21 (c) | | 265,000 | 255,646 |
| Ukraine Government: | | | |
| 1.471% 9/29/21 | | 1,600,000 | 1,546,514 |
| 7.75% 9/1/19 (c) | | 900,000 | 889,738 |
| 7.75% 9/1/20 (c) | | 1,955,000 | 1,883,236 |
| 7.75% 9/1/21 (c) | | 4,473,000 | 4,204,620 |
| 7.75% 9/1/22 (c) | | 2,586,000 | 2,369,707 |
| 9.75% 11/1/28 (c) | | 445,000 | 417,001 |
| United Kingdom, Great Britain and Northern Ireland: | | | |
| 1.75% 7/22/19 (Reg.S) | GBP | 6,750,000 | 8,650,095 |
| 4.25% 12/7/27 | GBP | 3,650,000 | 5,866,463 |
| United Kingdom, Great Britain and Northern Ireland Treasury GILT 2.5% 7/22/65 (Reg. S) | GBP | 1,750,000 | 2,781,527 |
| United Mexican States 6.5% 6/9/22 | MXN | 16,155,000 | 771,491 |
| Uruguay Republic 7.875% 1/15/33 pay-in-kind | | 105,000 | 138,001 |
| Venezuelan Republic: | | | |
| oil recovery warrants 4/15/20 (h)(o) | | 1,251 | 1,251 |
| 9.25% 9/15/27 (d) | | 2,200,000 | 511,500 |
| 11.95% 8/5/31 (Reg. S) (d) | | 840,000 | 197,400 |
| 12.75% 8/23/22 (d) | | 190,000 | 44,650 |
| Vietnamese Socialist Republic: | | | |
| 6 month U.S. LIBOR + 0.813% 3.375% 3/13/28 (b)(e)(h) | | 75,000 | 68,356 |
| 5.5% 3/12/28 | | 2,064,000 | 2,055,302 |
| TOTAL FOREIGN GOVERNMENT AND GOVERNMENT AGENCY OBLIGATIONS | | | |
| (Cost $206,754,512) | | | 204,304,869 |
|
| Supranational Obligations - 0.0% | | | |
European Bank for Reconstruction & Development 6% 5/4/20 (Reg. S)
(Cost $548,184) | INR | 35,500,000 | 499,648 |
| | | Shares | Value |
|
| Common Stocks - 4.4% | | | |
| COMMUNICATION SERVICES - 0.7% | | | |
| Entertainment - 0.1% | | | |
| Activision Blizzard, Inc. | | 7,700 | 358,589 |
| Electronic Arts, Inc. (p) | | 7,200 | 568,152 |
| Take-Two Interactive Software, Inc. (p) | | 6,600 | 679,404 |
| | | | 1,606,145 |
| Interactive Media & Services - 0.3% | | | |
| Alphabet, Inc. Class A (p) | | 2,600 | 2,716,896 |
| Facebook, Inc. Class A (p) | | 7,700 | 1,009,393 |
| | | | 3,726,289 |
| Media - 0.1% | | | |
| Altice U.S.A., Inc. Class A | | 56,000 | 925,120 |
| Comcast Corp. Class A | | 30,300 | 1,031,715 |
| | | | 1,956,835 |
| Wireless Telecommunication Services - 0.2% | | | |
| T-Mobile U.S., Inc. (p) | | 34,700 | 2,207,267 |
|
| TOTAL COMMUNICATION SERVICES | | | 9,496,536 |
|
| CONSUMER DISCRETIONARY - 0.7% | | | |
| Auto Components - 0.0% | | | |
| Chassix Holdings, Inc. warrants 7/29/20 (h)(p) | | 1,921 | 9,855 |
| Exide Technologies (h)(p) | | 2,115 | 2,115 |
| Exide Technologies (h)(p) | | 7,052 | 4,936 |
| UC Holdings, Inc. (h) | | 33,750 | 659,813 |
| | | | 676,719 |
| Diversified Consumer Services - 0.0% | | | |
| Houghton Mifflin Harcourt Co. warrants 6/22/19 (p)(q) | | 2,218 | 43 |
| Hotels, Restaurants & Leisure - 0.3% | | | |
| Boyd Gaming Corp. | | 50,200 | 1,043,156 |
| Eldorado Resorts, Inc. (p) | | 7,600 | 275,196 |
| MGM Mirage, Inc. | | 19,100 | 463,366 |
| Penn National Gaming, Inc. (p) | | 27,600 | 519,708 |
| Red Rock Resorts, Inc. | | 31,200 | 633,672 |
| Royal Caribbean Cruises Ltd. | | 6,000 | 586,740 |
| Scientific Games Corp. Class A (p) | | 10,700 | 191,316 |
| Wyndham Hotels & Resorts, Inc. | | 6,300 | 285,831 |
| Wynn Resorts Ltd. | | 182 | 18,002 |
| | | | 4,016,987 |
| Household Durables - 0.0% | | | |
| Lennar Corp. Class B | | 349 | 10,934 |
| Internet & Direct Marketing Retail - 0.3% | | | |
| Alibaba Group Holding Ltd. sponsored ADR (p) | | 22,300 | 3,056,661 |
| Amazon.com, Inc. (p) | | 700 | 1,051,379 |
| | | | 4,108,040 |
| Media - 0.0% | | | |
| Studio City International Holdings Ltd. ADR | | 11,100 | 185,592 |
| Textiles, Apparel & Luxury Goods - 0.1% | | | |
| adidas AG | | 5,102 | 1,066,240 |
|
| TOTAL CONSUMER DISCRETIONARY | | | 10,064,555 |
|
| CONSUMER STAPLES - 0.2% | | | |
| Food & Staples Retailing - 0.0% | | | |
| Southeastern Grocers, Inc. (h)(p) | | 10,231 | 323,504 |
| Food Products - 0.2% | | | |
| Darling International, Inc. (p) | | 71,600 | 1,377,584 |
| JBS SA | | 288,600 | 863,026 |
| Reddy Ice Holdings, Inc. (p) | | 5,683 | 2,842 |
| | | | 2,243,452 |
|
| TOTAL CONSUMER STAPLES | | | 2,566,956 |
|
| ENERGY - 0.1% | | | |
| Energy Equipment & Services - 0.0% | | | |
| Forbes Energy Services Ltd. (p) | | 6,562 | 19,686 |
| Oil, Gas & Consumable Fuels - 0.1% | | | |
| Chaparral Energy, Inc. Class A (p) | | 5,029 | 24,743 |
| Diamondback Energy, Inc. | | 9,300 | 862,110 |
| Goodrich Petroleum Corp. (p) | | 4,211 | 56,849 |
| Harvest Oil & Gas Corp. (p) | | 13,350 | 240,033 |
| Parsley Energy, Inc. Class A (p) | | 23,000 | 367,540 |
| Ultra Petroleum Corp. warrants 7/14/25 (p) | | 10,710 | 0 |
| VNR Finance Corp. (p) | | 4,091 | 5,932 |
| VNR Finance Corp. (c)(p) | | 19,701 | 28,566 |
| | | | 1,585,773 |
|
| TOTAL ENERGY | | | 1,605,459 |
|
| FINANCIALS - 0.2% | | | |
| Banks - 0.1% | | | |
| Bank of America Corp. | | 36,200 | 891,968 |
| JPMorgan Chase & Co. | | 10,000 | 976,200 |
| | | | 1,868,168 |
| Capital Markets - 0.0% | | | |
| Penson Worldwide, Inc. Class A (h)(p) | | 314,563 | 3 |
| Consumer Finance - 0.0% | | | |
| OneMain Holdings, Inc. (p) | | 21,400 | 519,806 |
| Mortgage Real Estate Investment Trusts - 0.1% | | | |
| Starwood Property Trust, Inc. | | 26,600 | 524,286 |
|
| TOTAL FINANCIALS | | | 2,912,263 |
|
| HEALTH CARE - 0.3% | | | |
| Health Care Providers & Services - 0.1% | | | |
| Humana, Inc. | | 3,200 | 916,736 |
| Rotech Healthcare, Inc. (h)(p) | | 6,069 | 9,710 |
| UnitedHealth Group, Inc. | | 4,100 | 1,021,392 |
| | | | 1,947,838 |
| Life Sciences Tools & Services - 0.1% | | | |
| IQVIA Holdings, Inc. (p) | | 11,500 | 1,335,955 |
| Pharmaceuticals - 0.1% | | | |
| Jazz Pharmaceuticals PLC (p) | | 4,700 | 582,612 |
|
| TOTAL HEALTH CARE | | | 3,866,405 |
|
| INDUSTRIALS - 0.5% | | | |
| Aerospace & Defense - 0.1% | | | |
| TransDigm Group, Inc. (p) | | 2,100 | 714,126 |
| Airlines - 0.2% | | | |
| Air Canada (p) | | 106,500 | 2,025,154 |
| Commercial Services & Supplies - 0.0% | | | |
| Novus Holdings Ltd. | | 3,285 | 925 |
| Machinery - 0.0% | | | |
| Allison Transmission Holdings, Inc. | | 12,900 | 566,439 |
| Marine - 0.0% | | | |
| U.S. Shipping Partners Corp. (h)(p) | | 644 | 0 |
| U.S. Shipping Partners Corp. warrants 12/31/29 (h)(p) | | 6,028 | 0 |
| | | | 0 |
| Trading Companies & Distributors - 0.2% | | | |
| HD Supply Holdings, Inc. (p) | | 37,300 | 1,399,496 |
| Penhall Acquisition Co.: | | | |
| Class A (h)(p) | | 321 | 29,532 |
| Class B (h)(p) | | 107 | 9,844 |
| United Rentals, Inc. (p) | | 14,763 | 1,513,650 |
| | | | 2,952,522 |
| Transportation Infrastructure - 0.0% | | | |
| Tricer Holdco SCA: | | | |
| Class A1 (h)(p)(q) | | 16,755 | 19 |
| Class A2 (h)(p)(q) | | 16,755 | 19 |
| Class A3 (h)(p)(q) | | 16,755 | 19 |
| Class A4 (h)(p)(q) | | 16,755 | 19 |
| Class A5 (h)(p)(q) | | 16,755 | 19 |
| Class A6 (h)(p)(q) | | 16,755 | 19 |
| Class A7 (h)(p)(q) | | 16,755 | 19 |
| Class A8 (h)(p)(q) | | 16,755 | 19 |
| Class A9 (h)(p)(q) | | 16,755 | 19 |
| | | | 171 |
|
| TOTAL INDUSTRIALS | | | 6,259,337 |
|
| INFORMATION TECHNOLOGY - 1.3% | | | |
| Electronic Equipment & Components - 0.0% | | | |
| CDW Corp. | | 8,600 | 697,030 |
| IT Services - 0.6% | | | |
| EPAM Systems, Inc. (p) | | 8,700 | 1,009,287 |
| First Data Corp. Class A (p) | | 35,400 | 598,614 |
| Global Payments, Inc. | | 14,600 | 1,505,698 |
| MasterCard, Inc. Class A | | 8,900 | 1,678,985 |
| PayPal Holdings, Inc. (p) | | 19,200 | 1,614,528 |
| Visa, Inc. Class A | | 13,700 | 1,807,578 |
| | | | 8,214,690 |
| Semiconductors & Semiconductor Equipment - 0.3% | | | |
| Microchip Technology, Inc. (r) | | 20,900 | 1,503,128 |
| NVIDIA Corp. | | 9,700 | 1,294,950 |
| NXP Semiconductors NV | | 14,700 | 1,077,216 |
| ON Semiconductor Corp. (p) | | 51,200 | 845,312 |
| | | | 4,720,606 |
| Software - 0.4% | | | |
| Adobe, Inc. (p) | | 7,700 | 1,742,048 |
| Microsoft Corp. | | 18,300 | 1,858,731 |
| SS&C Technologies Holdings, Inc. | | 29,700 | 1,339,767 |
| | | | 4,940,546 |
|
| TOTAL INFORMATION TECHNOLOGY | | | 18,572,872 |
|
| MATERIALS - 0.2% | | | |
| Chemicals - 0.2% | | | |
| DowDuPont, Inc. | | 17,300 | 925,204 |
| The Chemours Co. LLC | | 30,200 | 852,244 |
| Westlake Chemical Corp. | | 8,500 | 562,445 |
| | | | 2,339,893 |
| Containers & Packaging - 0.0% | | | |
| Crown Holdings, Inc. (p) | | 14,300 | 594,451 |
| Metals & Mining - 0.0% | | | |
| Aleris Corp. (h)(p) | | 2,037 | 0 |
| Algoma Steel GP (h) | | 10,220 | 54,483 |
| Algoma Steel SCA (h) | | 10,220 | 54,484 |
| Elah Holdings, Inc. (p) | | 14 | 840 |
| First Quantum Minerals Ltd. | | 32,700 | 264,436 |
| | | | 374,243 |
|
| TOTAL MATERIALS | | | 3,308,587 |
|
| UTILITIES - 0.2% | | | |
| Electric Utilities - 0.1% | | | |
| Portland General Electric Co. | | 140 | 6,419 |
| Vistra Energy Corp. (p) | | 85,300 | 1,952,517 |
| | | | 1,958,936 |
| Independent Power and Renewable Electricity Producers - 0.1% | | | |
| NRG Energy, Inc. | | 18,800 | 744,480 |
|
| TOTAL UTILITIES | | | 2,703,416 |
|
| TOTAL COMMON STOCKS | | | |
| (Cost $60,947,187) | | | 61,356,386 |
|
| Preferred Stocks - 0.0% | | | |
| Convertible Preferred Stocks - 0.0% | | | |
| CONSUMER STAPLES - 0.0% | | | |
| Food Products - 0.0% | | | |
| Reddy Ice Holdings, Inc. 7.00% pay-in-kind (h)(p) | | 2,286 | 19,820 |
| Nonconvertible Preferred Stocks - 0.0% | | | |
| INDUSTRIALS - 0.0% | | | |
| Transportation Infrastructure - 0.0% | | | |
| Tricer Holdco SCA (h)(p)(q) | | 8,042,141 | 2,716 |
| TOTAL PREFERRED STOCKS | | | |
| (Cost $303,071) | | | 22,536 |
| | | Principal Amount(a) | Value |
|
| Bank Loan Obligations - 1.6% | | | |
| CONSUMER DISCRETIONARY - 0.0% | | | |
| Diversified Consumer Services - 0.0% | | | |
| KUEHG Corp. Tranche B 2LN, term loan 3 month U.S. LIBOR + 8.250% 11.053% 8/22/25 (a)(b)(e) | | 305,000 | 304,238 |
| ENERGY - 0.6% | | | |
| Energy Equipment & Services - 0.0% | | | |
| BCP Raptor II LLC Tranche B, term loan 3 month U.S. LIBOR + 4.750% 7.1434% 11/3/25 (b)(e) | | 290,000 | 267,888 |
| Forbes Energy Services LLC Tranche B, term loan 14% 4/13/21 (b)(h) | | 69,952 | 70,476 |
| | | | 338,364 |
| Oil, Gas & Consumable Fuels - 0.6% | | | |
| BCP Raptor LLC Tranche B, term loan 3 month U.S. LIBOR + 4.250% 6.869% 6/22/24 (b)(e) | | 453,100 | 421,949 |
| California Resources Corp.: | | | |
| Tranche 1LN, term loan 3 month U.S. LIBOR + 10.375% 12.8974% 12/31/21 (b)(e) | | 5,345,000 | 5,224,738 |
| Tranche B, term loan 3 month U.S. LIBOR + 4.750% 7.2563% 12/31/22 (b)(e) | | 2,090,000 | 2,020,340 |
| | | | 7,667,027 |
|
| TOTAL ENERGY | | | 8,005,391 |
|
| FINANCIALS - 0.1% | | | |
| Diversified Financial Services - 0.1% | | | |
| RegionalCare Hospital Partners Holdings, Inc. Tranche B, term loan 3 month U.S. LIBOR + 4.500% 7.129% 11/16/25 (b)(e) | | 1,495,000 | 1,414,644 |
| Insurance - 0.0% | | | |
| HUB International Ltd. Tranche B, term loan 3 month U.S. LIBOR + 2.750% 5.2399% 4/25/25 (b)(e) | | 273,625 | 257,807 |
|
| TOTAL FINANCIALS | | | 1,672,451 |
|
| HEALTH CARE - 0.0% | | | |
| Pharmaceuticals - 0.0% | | | |
| Valeant Pharmaceuticals International, Inc. Tranche B, term loan 3 month U.S. LIBOR + 3.000% 5.3789% 6/1/25 (b)(e) | | 115,500 | 110,078 |
| INDUSTRIALS - 0.0% | | | |
| Construction & Engineering - 0.0% | | | |
| Traverse Midstream Partners Ll Tranche B, term loan 3 month U.S. LIBOR + 4.000% 6.6% 9/27/24 (b)(e) | | 155,000 | 148,413 |
| INFORMATION TECHNOLOGY - 0.7% | | | |
| Internet Software & Services - 0.1% | | | |
| McAfee LLC Tranche B, term loan: | | | |
| 3 month U.S. LIBOR + 3.750% 6.2724% 9/29/24 (b)(e) | | 239,234 | 232,157 |
| 3 month U.S. LIBOR + 8.500% 11.0056% 9/29/25 (b)(e) | | 1,324,583 | 1,311,338 |
| | | | 1,543,495 |
| IT Services - 0.1% | | | |
| Web.com Group, Inc.: | | | |
| 2LN, term loan 3 month U.S. LIBOR + 7.750% 10.1704% 10/11/26 (b)(e) | | 526,667 | 520,083 |
| Tranche B 1LN, term loan 3 month U.S. LIBOR + 3.750% 6.1704% 10/11/25 (b)(e) | | 600,000 | 576,000 |
| | | | 1,096,083 |
| Software - 0.5% | | | |
| Almonde, Inc.: | | | |
| Tranche 2LN, term loan 3 month U.S. LIBOR + 7.250% 10.053% 6/13/25 (b)(e) | | 1,744,344 | 1,601,063 |
| Tranche B 1LN, term loan 3 month U.S. LIBOR + 3.500% 6.303% 6/13/24 (b)(e) | | 721,780 | 670,743 |
| Boxer Parent Co., Inc. Tranche B, term loan 3 month U.S. LIBOR + 4.250% 7.053% 10/2/25 (b)(e) | | 1,040,000 | 1,000,678 |
| Digicert Holdings, Inc. Tranche B, term loan: | | | |
| 3 month U.S. LIBOR + 4.000% 6.5224% 10/31/24 (b)(e) | | 872,314 | 851,963 |
| 3 month U.S. LIBOR + 8.000% 10.5224% 10/31/25 (b)(e) | | 676,000 | 653,469 |
| Kronos, Inc. 2LN, term loan 3 month U.S. LIBOR + 8.250% 10.791% 11/1/24 (b)(e) | | 1,090,000 | 1,074,337 |
| Landesk Group, Inc. term loan: | | | |
| 3 month U.S. LIBOR + 4.250% 6.6% 1/20/24 (b)(e) | | 167,188 | 161,963 |
| 3 month U.S. LIBOR + 9.000% 11.35% 1/20/25(b)(e) | | 535,000 | 508,250 |
| Vertafore, Inc. Tranche B 1LN, term loan 3 month U.S. LIBOR + 3.250% 6.053% 7/2/25 (b)(e) | | 180,000 | 170,606 |
| | | | 6,693,072 |
|
| TOTAL INFORMATION TECHNOLOGY | | | 9,332,650 |
|
| MATERIALS - 0.2% | | | |
| Containers & Packaging - 0.1% | | | |
| Flex Acquisition Co., Inc. Tranche B 1LN, term loan 3 month U.S. LIBOR + 3.250% 5.5992% 6/29/25 (b)(e) | | 857,850 | 810,239 |
| Metals & Mining - 0.1% | | | |
| Murray Energy Corp. Tranche B 2LN, term loan 3 month U.S. LIBOR + 7.250% 9.7766% 10/17/22 (b)(e) | | 1,226,659 | 1,033,460 |
|
| TOTAL MATERIALS | | | 1,843,699 |
|
| TOTAL BANK LOAN OBLIGATIONS | | | |
| (Cost $22,457,549) | | | 21,416,920 |
| | | Shares | Value |
|
| Fixed-Income Funds - 8.9% | | | |
| Fidelity Floating Rate Central Fund (s) | | 1,231,195 | 121,211,148 |
| iShares JPMorgan USD Emerging Markets Bond ETF | | 22,347 | 2,322,077 |
| TOTAL FIXED-INCOME FUNDS | | | |
| (Cost $130,493,234) | | | 123,533,225 |
| | | Principal Amount(a) | Value |
|
| Preferred Securities - 4.7% | | | |
| COMMUNICATION SERVICES - 0.0% | | | |
| Diversified Telecommunication Services - 0.0% | | | |
| Colombia Telecomunicaciones SA 8.5% (a)(b)(c)(f) | | 445,000 | 466,959 |
| CONSUMER DISCRETIONARY - 0.2% | | | |
| Automobiles - 0.2% | | | |
| Volkswagen International Finance NV 4.625% (Reg. S) (b)(e)(f) | EUR | 1,900,000 | 2,087,205 |
| CONSUMER STAPLES - 0.1% | | | |
| Food Products - 0.1% | | | |
| Cosan Overseas Ltd. 8.25% (f) | | 1,685,000 | 1,719,169 |
| ENERGY - 0.5% | | | |
| Oil, Gas & Consumable Fuels - 0.5% | | | |
| Andeavor Logistics LP 6.875% (b)(f) | | 1,550,000 | 1,412,605 |
| DCP Midstream Partners LP 7.375% (b)(f) | | 775,000 | 692,419 |
| Energy Transfer Partners LP: | | | |
| 6.25% (b)(f) | | 3,540,000 | 3,046,107 |
| 6.625% (b)(f) | | 1,370,000 | 1,164,533 |
| Summit Midstream Partners LP 9.5% (b)(f) | | 775,000 | 731,939 |
| | | | 7,047,603 |
| FINANCIALS - 3.7% | | | |
| Banks - 3.0% | | | |
| Alfa Bond Issuance PLC 8% (Reg. S) (b)(f) | | 875,000 | 789,973 |
| Banco Do Brasil SA 9% (b)(c)(f) | | 1,615,000 | 1,647,044 |
| Banco Mercantil del Norte SA 7.625% (b)(c)(f) | | 495,000 | 487,841 |
| Bank of America Corp.: | | | |
| 5.125% (b)(f) | | 1,345,000 | 1,317,578 |
| 5.2% (b)(f) | | 3,067,000 | 2,966,797 |
| 5.875% (b)(f) | | 5,125,000 | 4,755,732 |
| 6.25% (b)(f) | | 1,410,000 | 1,421,806 |
| Barclays PLC 7.75% (b)(f) | | 1,485,000 | 1,433,886 |
| Citigroup, Inc.: | | | |
| 5.8% (b)(f) | | 1,130,000 | 1,107,480 |
| 5.9% (b)(f) | | 1,455,000 | 1,388,485 |
| 5.95% (b)(f) | | 2,675,000 | 2,508,244 |
| 6.25% (b)(f) | | 920,000 | 902,803 |
| 6.3% (b)(f) | | 270,000 | 251,283 |
| Credit Agricole SA 7.875% (b)(c)(f) | | 420,000 | 420,278 |
| Huntington Bancshares, Inc. 5.7% (b)(f) | | 650,000 | 584,728 |
| Itau Unibanco Holding SA 6.125% (b)(c)(f) | | 650,000 | 611,563 |
| JPMorgan Chase & Co.: | | | |
| 5% (b)(f) | | 1,615,000 | 1,598,850 |
| 5.3% (b)(f) | | 865,000 | 861,913 |
| 6% (b)(f) | | 6,524,000 | 6,539,956 |
| 6.125% (b)(f) | | 850,000 | 852,636 |
| 6.75% (b)(f) | | 400,000 | 424,526 |
| Royal Bank of Scotland Group PLC 8.625% (b)(f) | | 2,190,000 | 2,267,699 |
| Tinkoff Credit Systems 9.25% (Reg. S) (b)(f) | | 605,000 | 597,963 |
| Wells Fargo & Co.: | | | |
| 5.875% (b)(f) | | 2,600,000 | 2,577,104 |
| 5.9% (b)(f) | | 3,065,000 | 2,928,624 |
| | | | 41,244,792 |
| Capital Markets - 0.6% | | | |
| Credit Suisse Group AG 7.5% (b)(c)(f) | | 1,880,000 | 1,897,760 |
| Goldman Sachs Group, Inc.: | | | |
| 5% (b)(f) | | 2,731,000 | 2,322,189 |
| 5.375% (b)(f) | | 1,665,000 | 1,621,695 |
| 5.7% (b)(f) | | 1,701,000 | 1,672,573 |
| | | | 7,514,217 |
| Insurance - 0.1% | | | |
| MAPFRE SA 4.375% 3/31/47 (Reg. S) (b) | EUR | 1,600,000 | 1,931,449 |
|
| TOTAL FINANCIALS | | | 50,690,458 |
|
| INDUSTRIALS - 0.0% | | | |
| Construction & Engineering - 0.0% | | | |
| Odebrecht Finance Ltd.: | | | |
| 7.5% (c)(f) | | 1,875,000 | 278,906 |
| 7.5% (Reg. S) (f) | | 100,000 | 14,875 |
| | | | 293,781 |
| REAL ESTATE - 0.2% | | | |
| Equity Real Estate Investment Trusts (REITs) - 0.2% | | | |
| Unibail-Rodamco 2.125% (Reg. S) (b)(f) | EUR | 3,000,000 | 3,260,950 |
| TOTAL PREFERRED SECURITIES | | | |
| (Cost $70,268,804) | | | 65,566,125 |
| | | Shares | Value |
|
| Money Market Funds - 7.9% | | | |
| Fidelity Cash Central Fund, 2.42% (t) | | 108,511,568 | 108,533,270 |
| Fidelity Securities Lending Cash Central Fund 2.41% (t)(u) | | 1,184,802 | 1,184,920 |
| TOTAL MONEY MARKET FUNDS | | | |
| (Cost $109,709,637) | | | 109,718,190 |
| Purchased Swaptions - 0.0% | | | | |
| | | Expiration Date | Notional Amount | Value |
| Put Options - 0.0% | | | | |
| Option on an interest rate swap with Goldman Sachs Bank U.S.A. to pay semi-annually a fixed rate of 2.495% and receive quarterly a floating rate based on 3-month LIBOR, expiring October 2027 | | 10/5/20 | 3,300,000 | $104,523 |
| Option on an interest rate swap with JPMorgan Chase Bank NA to pay semi-annually a fixed rate of 2.5340% and receive quarterly a floating rate based on 3-month LIBOR, expiring December 2027 | | 12/8/20 | 3,900,000 | 124,606 |
| Option on an interest rate swap with JPMorgan Chase Bank NA to pay semi-annually a fixed rate of 2.5575% and receive quarterly a floating rate based on 3-month LIBOR, expiring October 2027 | | 10/6/20 | 1,100,000 | 32,452 |
|
| TOTAL PUT OPTIONS | | | | 261,581 |
|
| Call Options - 0.0% | | | | |
| Option on an interest rate swap with Goldman Sachs Bank U.S.A. to receive semi-annually a fixed rate of 2.495% and pay quarterly a floating rate based on 3-month LIBOR, expiring October 2027 | | 10/5/20 | 3,300,000 | 68,928 |
| Option on an interest rate swap with JPMorgan Chase Bank NA to receive semi-annually a fixed rate of 2.5340% and pay quarterly a floating rate based on 3-month LIBOR, expiring December 2027 | | 12/8/20 | 3,900,000 | 89,078 |
| Option on an interest rate swap with JPMorgan Chase Bank NA to receive semi-annually a fixed rate of 2.5575% and pay quarterly a floating rate based on 3-month LIBOR, expiring October 2027 | | 10/6/20 | 1,100,000 | 24,811 |
|
| TOTAL CALL OPTIONS | | | | 182,817 |
|
| TOTAL PURCHASED SWAPTIONS | | | | |
| (Cost $531,730) | | | | 444,398 |
| TOTAL INVESTMENT IN SECURITIES - 100.6% | | | | |
| (Cost $1,442,698,828) | | | | 1,397,212,600 |
| NET OTHER ASSETS (LIABILITIES) - (0.6)% | | | | (7,698,041) |
| NET ASSETS - 100% | | | | $1,389,514,559 |
| TBA Sale Commitments | | |
| | Principal Amount | Value |
| Fannie Mae | | |
| 3% 1/1/49 | $(1,500,000) | $(1,463,564) |
| 3% 1/1/49 | (1,245,000) | (1,214,758) |
| 3% 1/1/49 | (1,245,000) | (1,214,758) |
| 3.5% 1/1/49 | (800,000) | (799,694) |
| 3.5% 1/1/49 | (300,000) | (299,885) |
| 3.5% 1/1/49 | (100,000) | (99,962) |
| 3.5% 1/1/49 | (275,000) | (274,895) |
| 3.5% 1/1/49 | (275,000) | (274,895) |
| 3.5% 1/1/49 | (3,550,000) | (3,548,642) |
| 4.5% 1/1/49 | (300,000) | (310,562) |
| 4.5% 1/1/49 | (375,000) | (388,202) |
| 4.5% 1/1/49 | (375,000) | (388,202) |
| 4.5% 1/1/49 | (250,000) | (258,801) |
| TOTAL TBA SALE COMMITMENTS | | |
| (Proceeds $10,485,926) | | $(10,536,820) |
| Futures Contracts | | | | | |
| | Number of contracts | Expiration Date | Notional Amount | Value | Unrealized Appreciation/(Depreciation) |
| Purchased | | | | | |
| Treasury Contracts | | | | | |
| CBOT 10-Year U.S. Treasury Note Contracts (United States) | 271 | March 2019 | $33,066,234 | $780,670 | $780,670 |
| CBOT 2-Year U.S. Treasury Note Contracts (United States) | 36 | March 2019 | 7,643,250 | 51,693 | 51,693 |
| CBOT 5-Year U.S. Treasury Note Contracts (United States) | 102 | March 2019 | 11,698,125 | 199,014 | 199,014 |
| CBOT Long Term U.S. Treasury Bond Contracts (United States) | 91 | March 2019 | 13,286,000 | 601,257 | 601,257 |
| CBOT Ultra Long Term U.S. Treasury Bond Contracts (United States) | 15 | March 2019 | 2,409,844 | 123,014 | 123,014 |
|
| TOTAL PURCHASED | | | | | 1,755,648 |
|
| Sold | | | | | |
| Treasury Contracts | | | | | |
| CBOT Long Term U.S. Treasury Bond Contracts (United States) | 2 | March 2019 | 292,000 | (14,144) | (14,144) |
| CBOT Ultra 10-Year U.S. Treasury Note Contracts (United States) | 53 | March 2019 | 6,894,141 | (224,588) | (224,588) |
|
| TOTAL SOLD | | | | | (238,732) |
|
| TOTAL FUTURES CONTRACTS | | | | | $1,516,916 |
The notional amount of futures purchased as a percentage of Net Assets is 4.9%
The notional amount of futures sold as a percentage of Net Assets is 0.5%
Swaps
| Payment Received | Payment Frequency | Payment Paid | Payment Frequency | Clearinghouse / Counterparty(1) | Maturity Date | Notional Amount | Value | Upfront Premium Received/(Paid)(2) | Unrealized Appreciation/(Depreciation) |
| Interest Rate Swaps | | | | | | | | | |
| 2.75% | Semi - annual | 3-month LIBOR(3) | Quarterly | LCH | Mar. 2026 | $2,680,000 | $28,088 | $0 | $28,088 |
(1) Swaps with LCH Clearnet Group (LCH) are centrally cleared over-the-counter (OTC) swaps.
(2) Any premiums for centrally cleared over-the-counter (OTC) swaps are recorded periodically throughout the term of the swap to variation margin and included in unrealized appreciation (depreciation).
(3) Represents floating rate.
Currency Abbreviations
AUD – Australian dollar
BRL – Brazilian real
CAD – Canadian dollar
CHF – Swiss franc
DKK – Danish krone
EUR – European Monetary Unit
GBP – British pound
HKD – Hong Kong dollar
INR – Indian rupee
JPY – Japanese yen
MXN – Mexican peso
MYR – Malyasian ringgit
NOK – Norwegian krone
NZD – New Zealand dollar
RON – Romanian leu
RUB – Russian ruble
SEK – Swedish krona
SGD – Singapore dollar
ZAR – South African rand
Security Type Abbreviations
ETF – Exchange-Traded Fund
Legend
(a) Amount is stated in United States dollars unless otherwise noted.
(b) Coupon rates for floating and adjustable rate securities reflect the rates in effect at period end.
(c) Security exempt from registration under Rule 144A of the Securities Act of 1933. These securities may be resold in transactions exempt from registration, normally to qualified institutional buyers. At the end of the period, the value of these securities amounted to $296,095,959 or 21.3% of net assets.
(d) Non-income producing - Security is in default.
(e) Coupon is indexed to a floating interest rate which may be multiplied by a specified factor and/or subject to caps or floors.
(f) Security is perpetual in nature with no stated maturity date.
(g) Security initially issued at one coupon which converts to a higher coupon at a specified date. The rate shown is the rate at period end.
(h) Level 3 security
(i) Security or a portion of the security was pledged to cover margin requirements for futures contracts. At period end, the value of securities pledged amounted to $501,817.
(j) Security or a portion of the security was pledged to cover margin requirements for centrally cleared OTC swaps. At period end, the value of securities pledged amounted to $90,601.
(k) Security or a portion of the security purchased on a delayed delivery or when-issued basis.
(l) Represents an investment in an underlying pool of reverse mortgages which typically do not require regular principal and interest payments as repayment is deferred until a maturity event.
(m) Security represents right to receive monthly interest payments on an underlying pool of mortgages or assets. Principal shown is the outstanding par amount of the pool as of the end of the period.
(n) Coupon is inversely indexed to a floating interest rate multiplied by a specified factor. The price may be considerably more volatile than the price of a comparable fixed rate security.
(o) Quantity represents share amount.
(p) Non-income producing
(q) Restricted securities - Investment in securities not registered under the Securities Act of 1933 (excluding 144A issues). At the end of the period, the value of restricted securities (excluding 144A issues) amounted to $2,930 or 0.0% of net assets.
(r) Security or a portion of the security is on loan at period end.
(s) Affiliated fund that is generally available only to investment companies and other accounts managed by Fidelity Investments. A complete unaudited schedule of portfolio holdings for each Fidelity Central Fund is filed with the SEC for the first and third quarters of each fiscal year on Form N-Q and is available upon request or at the SEC's website at www.sec.gov. An unaudited holdings listing for the Fund, which presents direct holdings as well as the pro-rata share of securities and other investments held indirectly through its investment in underlying non-money market Fidelity Central Funds, is available at fidelity.com and/or institutional.fidelity.com, as applicable. In addition, each Fidelity Central Fund's financial statements, which are not covered by the Fund's Report of Independent Registered Public Accounting Firm, are available on the SEC's website or upon request.
(t) Affiliated fund that is generally available only to investment companies and other accounts managed by Fidelity Investments. The rate quoted is the annualized seven-day yield of the fund at period end. A complete unaudited listing of the fund's holdings as of its most recent quarter end is available upon request. In addition, each Fidelity Central Fund's financial statements, which are not covered by the Fund's Report of Independent Registered Public Accounting Firm, are available on the SEC's website or upon request.
(u) Investment made with cash collateral received from securities on loan.
Additional information on each restricted holding is as follows:
| Security | Acquisition Date | Acquisition Cost |
| Houghton Mifflin Harcourt Co. warrants 6/22/19 | 6/22/12 | $4,281 |
| Tricer Holdco SCA | 10/16/09 - 12/30/17 | $286,754 |
| Tricer Holdco SCA Class A1 | 10/16/09 - 10/29/09 | $45,666 |
| Tricer Holdco SCA Class A2 | 10/16/09 - 10/29/09 | $45,666 |
| Tricer Holdco SCA Class A3 | 10/16/09 - 10/29/09 | $45,666 |
| Tricer Holdco SCA Class A4 | 10/16/09 - 10/29/09 | $45,666 |
| Tricer Holdco SCA Class A5 | 10/16/09 - 10/29/09 | $45,666 |
| Tricer Holdco SCA Class A6 | 10/16/09 - 10/29/09 | $45,666 |
| Tricer Holdco SCA Class A7 | 10/16/09 - 10/29/09 | $45,666 |
| Tricer Holdco SCA Class A8 | 10/16/09 - 10/29/09 | $45,666 |
| Tricer Holdco SCA Class A9 | 10/16/09 - 10/29/09 | $45,706 |
Affiliated Central Funds
Information regarding fiscal year to date income earned by the Fund from investments in Fidelity Central Funds is as follows:
| Fund | Income earned |
| Fidelity Cash Central Fund | $1,830,426 |
| Fidelity Floating Rate Central Fund | 7,154,516 |
| Fidelity Securities Lending Cash Central Fund | 2,979 |
| Total | $8,987,921 |
Amounts in the income column in the above table include any capital gain distributions from underlying funds, which are presented in the corresponding line-item in the Statement of Operations if applicable.
Fiscal year to date information regarding the Fund’s investments in non-Money Market Central Funds, including the ownership percentage, is presented below.
| Fund | Value, beginning of period | Purchases | Sales Proceeds | Realized Gain/Loss | Change in Unrealized appreciation (depreciation) | Value, end of period | % ownership, end of period |
| Fidelity Floating Rate Central Fund | $107,568,078 | $36,008,100 | $16,695,882 | $(132,996) | $(5,536,152) | $121,211,148 | 6.1% |
| Total | $107,568,078 | $36,008,100 | $16,695,882 | $(132,996) | $(5,536,152) | $121,211,148 | |
Investment Valuation
The following is a summary of the inputs used, as of December 31, 2018, involving the Fund's assets and liabilities carried at fair value. The inputs or methodology used for valuing securities may not be an indication of the risk associated with investing in those securities. For more information on valuation inputs, and their aggregation into the levels used below, please refer to the Investment Valuation section in the accompanying Notes to Financial Statements.
| | Valuation Inputs at Reporting Date: |
| Description | Total | Level 1 | Level 2 | Level 3 |
| Investments in Securities: | | | | |
| Equities: | | | | |
| Communication Services | $9,496,536 | $9,496,536 | $-- | $-- |
| Consumer Discretionary | 10,064,555 | 9,387,793 | 43 | 676,719 |
| Consumer Staples | 2,586,776 | 2,243,452 | -- | 343,324 |
| Energy | 1,605,459 | 1,605,459 | -- | -- |
| Financials | 2,912,263 | 2,912,260 | -- | 3 |
| Health Care | 3,866,405 | 3,856,695 | -- | 9,710 |
| Industrials | 6,262,053 | 6,218,865 | 925 | 42,263 |
| Information Technology | 18,572,872 | 18,572,872 | -- | -- |
| Materials | 3,308,587 | 3,199,620 | -- | 108,967 |
| Utilities | 2,703,416 | 2,703,416 | -- | -- |
| Corporate Bonds | 462,865,508 | -- | 462,761,549 | 103,959 |
| U.S. Government and Government Agency Obligations | 227,785,208 | -- | 227,785,208 | -- |
| U.S. Government Agency - Mortgage Securities | 31,967,866 | -- | 31,967,866 | -- |
| Asset-Backed Securities | 10,531,146 | -- | 10,531,146 | -- |
| Collateralized Mortgage Obligations | 45,328,827 | -- | 45,328,827 | -- |
| Commercial Mortgage Securities | 31,871,748 | -- | 31,871,748 | -- |
| Foreign Government and Government Agency Obligations | 204,304,869 | -- | 204,235,262 | 69,607 |
| Supranational Obligations | 499,648 | -- | 499,648 | -- |
| Bank Loan Obligations | 21,416,920 | -- | 21,346,444 | 70,476 |
| Fixed-Income Funds | 123,533,225 | 123,533,225 | -- | -- |
| Preferred Securities | 65,566,125 | -- | 65,566,125 | -- |
| Money Market Funds | 109,718,190 | 109,718,190 | -- | -- |
| Purchased Swaptions | 444,398 | -- | 444,398 | -- |
| Total Investments in Securities: | $1,397,212,600 | $293,448,383 | $1,102,339,189 | $1,425,028 |
| Derivative Instruments: | | | | |
| Assets | | | | |
| Futures Contracts | $1,755,648 | $1,755,648 | $-- | $-- |
| Swaps | 28,088 | -- | 28,088 | -- |
| Total Assets | $1,783,736 | $1,755,648 | $28,088 | $-- |
| Liabilities | | | | |
| Futures Contracts | $(238,732) | $(238,732) | $-- | $-- |
| Total Liabilities | $(238,732) | $(238,732) | $-- | $-- |
| Total Derivative Instruments: | $1,545,004 | $1,516,916 | $28,088 | $-- |
| Other Financial Instruments: | | | | |
| TBA Sale Commitments | $(10,536,820) | $-- | $(10,536,820) | $-- |
| Total Other Financial Instruments: | $(10,536,820) | $-- | $(10,536,820) | $-- |
Value of Derivative Instruments
The following table is a summary of the Fund's value of derivative instruments by primary risk exposure as of December 31, 2018. For additional information on derivative instruments, please refer to the Derivative Instruments section in the accompanying Notes to Financial Statements.
| Primary Risk Exposure / Derivative Type | Value |
| | Asset | Liability |
| Interest Rate Risk | | |
| Futures Contracts(a) | $1,755,648 | $(238,732) |
| Purchased Swaptions(b) | 444,398 | 0 |
| Swaps(c) | 28,088 | 0 |
| Total Value of Derivatives | $2,228,134 | $(238,732) |
(a) Reflects gross cumulative appreciation (depreciation) on futures contracts as presented in the Schedule of Investments. In the Statement of Assets and Liabilities, the period end daily variation margin is included in receivable or payable for daily variation margin on futures contracts, and the net cumulative appreciation (depreciation) is included in net unrealized appreciation (depreciation).
(b) Gross value is included in the Statement of Assets and Liabilities in the investments, at value line-item.
(c) For centrally cleared over-the-counter (OTC) swaps, reflects gross cumulative appreciation (depreciation) as presented in the Schedule of Investments. In the Statement of Assets and Liabilities, the period end daily variation margin for centrally cleared OTC swaps is included in receivable or payable for daily variation margin on centrally cleared OTC swaps, and the net cumulative appreciation (depreciation) for centrally cleared OTC swaps is included in net unrealized appreciation (depreciation).
Other Information
Distribution of investments by country or territory of incorporation, as a percentage of Total Net Assets, is as follows (Unaudited):
| United States of America | 68.3% |
| United Kingdom | 3.4% |
| Canada | 3.1% |
| Japan | 2.3% |
| Argentina | 1.9% |
| Luxembourg | 1.8% |
| Italy | 1.6% |
| Cayman Islands | 1.5% |
| Netherlands | 1.5% |
| Germany | 1.5% |
| France | 1.0% |
| Mexico | 1.0% |
| Others (Individually Less Than 1%) | 11.1% |
| | 100.0% |
The information in the above tables is based on the combined investments of the fund and its pro-rata share of the investments of Fidelity's Fixed-Income Central Funds
See accompanying notes which are an integral part of the financial statements.
Financial Statements
Statement of Assets and Liabilities
| | | December 31, 2018 |
| Assets | | |
Investment in securities, at value (including securities loaned of $1,165,248) — See accompanying schedule:
Unaffiliated issuers (cost $1,204,859,560) | $1,166,283,262 | |
| Fidelity Central Funds (cost $237,839,268) | 230,929,338 | |
| Total Investment in Securities (cost $1,442,698,828) | | $1,397,212,600 |
| Cash | | 395,189 |
| Foreign currency held at value (cost $16,886) | | 16,377 |
| Receivable for investments sold | | 647,713 |
| Receivable for TBA sale commitments | | 10,485,926 |
| Receivable for fund shares sold | | 308,531 |
| Dividends receivable | | 59,247 |
| Interest receivable | | 12,152,932 |
| Distributions receivable from Fidelity Central Funds | | 819,569 |
| Receivable for daily variation margin on futures contracts | | 162,203 |
| Receivable for daily variation margin on centrally cleared OTC swaps | | 2,505 |
| Prepaid expenses | | 2,190 |
| Other receivables | | 15,272 |
| Total assets | | 1,422,280,254 |
| Liabilities | | |
| Payable for investments purchased | | |
| Regular delivery | $1,245,142 | |
| Delayed delivery | 18,209,827 | |
| TBA sale commitments, at value | 10,536,820 | |
| Payable for fund shares redeemed | 589,141 | |
| Accrued management fee | 647,949 | |
| Distribution and service plan fees payable | 83,369 | |
| Other affiliated payables | 145,083 | |
| Other payables and accrued expenses | 123,337 | |
| Collateral on securities loaned | 1,185,027 | |
| Total liabilities | | 32,765,695 |
| Net Assets | | $1,389,514,559 |
| Net Assets consist of: | | |
| Paid in capital | | $1,435,083,483 |
| Total distributable earnings (loss) | | (45,568,924) |
| Net Assets | | $1,389,514,559 |
| Net Asset Value and Maximum Offering Price | | |
| Initial Class: | | |
| Net Asset Value, offering price and redemption price per share ($82,528,899 ÷ 7,677,164 shares) | | $10.75 |
| Service Class: | | |
| Net Asset Value, offering price and redemption price per share ($1,745,178 ÷ 162,790 shares) | | $10.72 |
| Service Class 2: | | |
| Net Asset Value, offering price and redemption price per share ($397,784,591 ÷ 37,361,351 shares) | | $10.65 |
| Investor Class: | | |
| Net Asset Value, offering price and redemption price per share ($907,455,891 ÷ 84,708,466 shares) | | $10.71 |
See accompanying notes which are an integral part of the financial statements.
Statement of Operations
| | | Year ended December 31, 2018 |
| Investment Income | | |
| Dividends | | $4,180,985 |
| Interest | | 51,388,559 |
| Income from Fidelity Central Funds | | 8,987,921 |
| Total income | | 64,557,465 |
| Expenses | | |
| Management fee | $8,285,663 | |
| Transfer agent fees | 1,356,765 | |
| Distribution and service plan fees | 983,625 | |
| Accounting and security lending fees | 506,215 | |
| Custodian fees and expenses | 78,657 | |
| Independent trustees' fees and expenses | 6,943 | |
| Registration fees | 182 | |
| Audit | 111,812 | |
| Legal | (99,964) | |
| Miscellaneous | 11,198 | |
| Total expenses before reductions | 11,241,096 | |
| Expense reductions | (27,780) | |
| Total expenses after reductions | | 11,213,316 |
| Net investment income (loss) | | 53,344,149 |
| Realized and Unrealized Gain (Loss) | | |
| Net realized gain (loss) on: | | |
| Investment securities: | | |
| Unaffiliated issuers | (2,341,635) | |
| Fidelity Central Funds | (134,695) | |
| Foreign currency transactions | (1,493,543) | |
| Futures contracts | (111,594) | |
| Swaps | (53,242) | |
| Written options | 28,151 | |
| Total net realized gain (loss) | | (4,106,558) |
| Change in net unrealized appreciation (depreciation) on: | | |
| Investment securities: | | |
| Unaffiliated issuers | (84,668,370) | |
| Fidelity Central Funds | (5,534,633) | |
| Assets and liabilities in foreign currencies | (17,803) | |
| Futures contracts | 1,521,092 | |
| Swaps | 30,297 | |
| Delayed delivery commitments | (50,894) | |
| Total change in net unrealized appreciation (depreciation) | | (88,720,311) |
| Net gain (loss) | | (92,826,869) |
| Net increase (decrease) in net assets resulting from operations | | $(39,482,720) |
See accompanying notes which are an integral part of the financial statements.
Statement of Changes in Net Assets
| | Year ended December 31, 2018 | Year ended December 31, 2017 |
| Increase (Decrease) in Net Assets | | |
| Operations | | |
| Net investment income (loss) | $53,344,149 | $48,290,503 |
| Net realized gain (loss) | (4,106,558) | 15,785,344 |
| Change in net unrealized appreciation (depreciation) | (88,720,311) | 40,260,354 |
| Net increase (decrease) in net assets resulting from operations | (39,482,720) | 104,336,201 |
| Distributions to shareholders | (55,455,091) | – |
| Distributions to shareholders from net investment income | – | (47,218,735) |
| Distributions to shareholders from net realized gain | – | (7,817,967) |
| Total distributions | (55,455,091) | (55,036,702) |
| Share transactions - net increase (decrease) | (61,326,077) | 198,447,298 |
| Total increase (decrease) in net assets | (156,263,888) | 247,746,797 |
| Net Assets | | |
| Beginning of period | 1,545,778,447 | 1,298,031,650 |
| End of period | $1,389,514,559 | $1,545,778,447 |
| Other Information | | |
| Undistributed net investment income end of period | | $4,228,368 |
See accompanying notes which are an integral part of the financial statements.
Financial Highlights
VIP Strategic Income Portfolio Initial Class
| Years ended December 31, | 2018 | 2017 | 2016 | 2015 | 2014 |
| Selected Per–Share Data | | | | | |
| Net asset value, beginning of period | $11.50 | $11.07 | $10.60 | $11.12 | $11.20 |
| Income from Investment Operations | | | | | |
| Net investment income (loss)A | .418 | .399 | .429 | .413 | .413 |
| Net realized and unrealized gain (loss) | (.716) | .462 | .446 | (.593) | (.010) |
| Total from investment operations | (.298) | .861 | .875 | (.180) | .403 |
| Distributions from net investment income | (.444)B | (.371) | (.405) | (.306) | (.350) |
| Distributions from net realized gain | (.008)B | (.060) | – | – | (.133) |
| Tax return of capital | – | – | – | (.034) | – |
| Total distributions | (.452) | (.431) | (.405) | (.340) | (.483) |
| Net asset value, end of period | $10.75 | $11.50 | $11.07 | $10.60 | $11.12 |
| Total ReturnC,D | (2.57)% | 7.79% | 8.27% | (1.63)% | 3.60% |
| Ratios to Average Net AssetsE,F | | | | | |
| Expenses before reductions | .66% | .67% | .68% | .69% | .68% |
| Expenses net of fee waivers, if any | .66% | .67% | .68% | .69% | .68% |
| Expenses net of all reductions | .66% | .67% | .68% | .69% | .68% |
| Net investment income (loss) | 3.66% | 3.45% | 3.84% | 3.69% | 3.56% |
| Supplemental Data | | | | | |
| Net assets, end of period (000 omitted) | $82,529 | $96,952 | $91,630 | $91,714 | $107,847 |
| Portfolio turnover rateG | 118% | 124% | 81% | 92% | 119% |
A Calculated based on average shares outstanding during the period.
B The amounts shown reflect certain reclassifications related to book to tax differences that were made in the year shown.
C Total returns do not reflect charges attributable to your insurance company's separate account. Inclusion of these charges would reduce the total returns shown.
D Total returns would have been lower if certain expenses had not been reduced during the applicable periods shown.
E Fees and expenses of any underlying Fidelity Central Funds are not included in the Fund's expense ratio. The Fund indirectly bears its proportionate share of the expenses of any underlying Fidelity Central Funds. Based on their most recent shareholder report date, the expenses of any underlying non-money market Fidelity Central Funds were less than .005%.
F Expense ratios reflect operating expenses of the class. Expenses before reductions do not reflect amounts reimbursed by the investment adviser or reductions from brokerage service arrangements or reductions from other expense offset arrangements and do not represent the amount paid by the class during periods when reimbursements or reductions occur. Expenses net of fee waivers reflect expenses after reimbursement by the investment adviser but prior to reductions from brokerage service arrangements or other expense offset arrangements. Expenses net of all reductions represent the net expenses paid by the class.
G Amount does not include the portfolio activity of any underlying Fidelity Central Funds.
See accompanying notes which are an integral part of the financial statements.
VIP Strategic Income Portfolio Service Class
| Years ended December 31, | 2018 | 2017 | 2016 | 2015 | 2014 |
| Selected Per–Share Data | | | | | |
| Net asset value, beginning of period | $11.47 | $11.05 | $10.59 | $11.11 | $11.19 |
| Income from Investment Operations | | | | | |
| Net investment income (loss)A | .406 | .389 | .417 | .401 | .401 |
| Net realized and unrealized gain (loss) | (.715) | .461 | .444 | (.592) | (.009) |
| Total from investment operations | (.309) | .850 | .861 | (.191) | .392 |
| Distributions from net investment income | (.433)B | (.370) | (.401) | (.295) | (.339) |
| Distributions from net realized gain | (.008)B | (.060) | – | – | (.133) |
| Tax return of capital | – | – | – | (.034) | – |
| Total distributions | (.441) | (.430) | (.401) | (.329) | (.472) |
| Net asset value, end of period | $10.72 | $11.47 | $11.05 | $10.59 | $11.11 |
| Total ReturnC,D | (2.68)% | 7.71% | 8.14% | (1.73)% | 3.51% |
| Ratios to Average Net AssetsE,F | | | | | |
| Expenses before reductions | .76% | .77% | .78% | .79% | .78% |
| Expenses net of fee waivers, if any | .76% | .77% | .78% | .79% | .78% |
| Expenses net of all reductions | .76% | .77% | .78% | .79% | .78% |
| Net investment income (loss) | 3.56% | 3.35% | 3.75% | 3.59% | 3.46% |
| Supplemental Data | | | | | |
| Net assets, end of period (000 omitted) | $1,745 | $1,899 | $526 | $753 | $831 |
| Portfolio turnover rateG | 118% | 124% | 81% | 92% | 119% |
A Calculated based on average shares outstanding during the period.
B The amounts shown reflect certain reclassifications related to book to tax differences that were made in the year shown.
C Total returns do not reflect charges attributable to your insurance company's separate account. Inclusion of these charges would reduce the total returns shown.
D Total returns would have been lower if certain expenses had not been reduced during the applicable periods shown.
E Fees and expenses of any underlying Fidelity Central Funds are not included in the Fund's expense ratio. The Fund indirectly bears its proportionate share of the expenses of any underlying Fidelity Central Funds. Based on their most recent shareholder report date, the expenses of any underlying non-money market Fidelity Central Funds were less than .005%.
F Expense ratios reflect operating expenses of the class. Expenses before reductions do not reflect amounts reimbursed by the investment adviser or reductions from brokerage service arrangements or reductions from other expense offset arrangements and do not represent the amount paid by the class during periods when reimbursements or reductions occur. Expenses net of fee waivers reflect expenses after reimbursement by the investment adviser but prior to reductions from brokerage service arrangements or other expense offset arrangements. Expenses net of all reductions represent the net expenses paid by the class.
G Amount does not include the portfolio activity of any underlying Fidelity Central Funds.
See accompanying notes which are an integral part of the financial statements.
VIP Strategic Income Portfolio Service Class 2
| Years ended December 31, | 2018 | 2017 | 2016 | 2015 | 2014 |
| Selected Per–Share Data | | | | | |
| Net asset value, beginning of period | $11.40 | $10.98 | $10.52 | $11.05 | $11.14 |
| Income from Investment Operations | | | | | |
| Net investment income (loss)A | .385 | .368 | .398 | .380 | .380 |
| Net realized and unrealized gain (loss) | (.709) | .459 | .444 | (.593) | (.005) |
| Total from investment operations | (.324) | .827 | .842 | (.213) | .375 |
| Distributions from net investment income | (.418)B | (.347) | (.382) | (.283) | (.332) |
| Distributions from net realized gain | (.008)B | (.060) | – | – | (.133) |
| Tax return of capital | – | – | – | (.034) | – |
| Total distributions | (.426) | (.407) | (.382) | (.317) | (.465) |
| Net asset value, end of period | $10.65 | $11.40 | $10.98 | $10.52 | $11.05 |
| Total ReturnC,D | (2.82)% | 7.54% | 8.02% | (1.94)% | 3.37% |
| Ratios to Average Net AssetsE,F | | | | | |
| Expenses before reductions | .91% | .92% | .93% | .94% | .93% |
| Expenses net of fee waivers, if any | .91% | .92% | .93% | .94% | .93% |
| Expenses net of all reductions | .91% | .92% | .93% | .94% | .93% |
| Net investment income (loss) | 3.41% | 3.20% | 3.59% | 3.44% | 3.31% |
| Supplemental Data | | | | | |
| Net assets, end of period (000 omitted) | $397,785 | $374,227 | $260,789 | $185,925 | $137,892 |
| Portfolio turnover rateG | 118% | 124% | 81% | 92% | 119% |
A Calculated based on average shares outstanding during the period.
B The amounts shown reflect certain reclassifications related to book to tax differences that were made in the year shown.
C Total returns do not reflect charges attributable to your insurance company's separate account. Inclusion of these charges would reduce the total returns shown.
D Total returns would have been lower if certain expenses had not been reduced during the applicable periods shown.
E Fees and expenses of any underlying Fidelity Central Funds are not included in the Fund's expense ratio. The Fund indirectly bears its proportionate share of the expenses of any underlying Fidelity Central Funds. Based on their most recent shareholder report date, the expenses of any underlying non-money market Fidelity Central Funds were less than .005%.
F Expense ratios reflect operating expenses of the class. Expenses before reductions do not reflect amounts reimbursed by the investment adviser or reductions from brokerage service arrangements or reductions from other expense offset arrangements and do not represent the amount paid by the class during periods when reimbursements or reductions occur. Expenses net of fee waivers reflect expenses after reimbursement by the investment adviser but prior to reductions from brokerage service arrangements or other expense offset arrangements. Expenses net of all reductions represent the net expenses paid by the class.
G Amount does not include the portfolio activity of any underlying Fidelity Central Funds.
See accompanying notes which are an integral part of the financial statements.
VIP Strategic Income Portfolio Investor Class
| Years ended December 31, | 2018 | 2017 | 2016 | 2015 | 2014 |
| Selected Per–Share Data | | | | | |
| Net asset value, beginning of period | $11.46 | $11.03 | $10.57 | $11.09 | $11.17 |
| Income from Investment Operations | | | | | |
| Net investment income (loss)A | .413 | .394 | .424 | .408 | .408 |
| Net realized and unrealized gain (loss) | (.715) | .463 | .438 | (.591) | (.008) |
| Total from investment operations | (.302) | .857 | .862 | (.183) | .400 |
| Distributions from net investment income | (.440)B | (.367) | (.402) | (.303) | (.347) |
| Distributions from net realized gain | (.008)B | (.060) | – | – | (.133) |
| Tax return of capital | – | – | – | (.034) | – |
| Total distributions | (.448) | (.427) | (.402) | (.337) | (.480) |
| Net asset value, end of period | $10.71 | $11.46 | $11.03 | $10.57 | $11.09 |
| Total ReturnC,D | (2.62)% | 7.78% | 8.17% | (1.66)% | 3.58% |
| Ratios to Average Net AssetsE,F | | | | | |
| Expenses before reductions | .70% | .71% | .72% | .72% | .71% |
| Expenses net of fee waivers, if any | .70% | .71% | .72% | .72% | .71% |
| Expenses net of all reductions | .70% | .71% | .72% | .72% | .71% |
| Net investment income (loss) | 3.63% | 3.41% | 3.81% | 3.65% | 3.52% |
| Supplemental Data | | | | | |
| Net assets, end of period (000 omitted) | $907,456 | $1,072,701 | $945,087 | $907,266 | $981,928 |
| Portfolio turnover rateG | 118% | 124% | 81% | 92% | 119% |
A Calculated based on average shares outstanding during the period.
B The amounts shown reflect certain reclassifications related to book to tax differences that were made in the year shown.
C Total returns do not reflect charges attributable to your insurance company's separate account. Inclusion of these charges would reduce the total returns shown.
D Total returns would have been lower if certain expenses had not been reduced during the applicable periods shown.
E Fees and expenses of any underlying Fidelity Central Funds are not included in the Fund's expense ratio. The Fund indirectly bears its proportionate share of the expenses of any underlying Fidelity Central Funds. Based on their most recent shareholder report date, the expenses of any underlying non-money market Fidelity Central Funds were less than .005%.
F Expense ratios reflect operating expenses of the class. Expenses before reductions do not reflect amounts reimbursed by the investment adviser or reductions from brokerage service arrangements or reductions from other expense offset arrangements and do not represent the amount paid by the class during periods when reimbursements or reductions occur. Expenses net of fee waivers reflect expenses after reimbursement by the investment adviser but prior to reductions from brokerage service arrangements or other expense offset arrangements. Expenses net of all reductions represent the net expenses paid by the class.
G Amount does not include the portfolio activity of any underlying Fidelity Central Funds.
See accompanying notes which are an integral part of the financial statements.
Notes to Financial Statements
For the period ended December 31, 2018
1. Organization.
VIP Strategic Income Portfolio (the Fund) is a fund of Variable Insurance Products Fund V (the Trust) and is authorized to issue an unlimited number of shares. The Trust is registered under the Investment Company Act of 1940, as amended (the 1940 Act), as an open-end management investment company organized as a Massachusetts business trust. Shares of the Fund may only be purchased by insurance companies for the purpose of funding variable annuity or variable life insurance contracts. The Fund offers the following classes of shares: Initial Class shares, Service Class shares, Service Class 2 shares and Investor Class shares. All classes have equal rights and voting privileges, except for matters affecting a single class.
2. Investments in Fidelity Central Funds.
The Fund invests in Fidelity Central Funds, which are open-end investment companies generally available only to other investment companies and accounts managed by the investment adviser and its affiliates. The Fund's Schedule of Investments lists each of the Fidelity Central Funds held as of period end, if any, as an investment of the Fund, but does not include the underlying holdings of each Fidelity Central Fund. As an Investing Fund, the Fund indirectly bears its proportionate share of the expenses of the underlying Fidelity Central Funds.
Based on its investment objective, each Fidelity Central Fund may invest or participate in various investment vehicles or strategies that are similar to those of the Fund. These strategies are consistent with the investment objectives of the Fund and may involve certain economic risks which may cause a decline in value of each of the Fidelity Central Funds and thus a decline in the value of the Fund. The Money Market Central Funds seek preservation of capital and current income and are managed by Fidelity Investments Money Management, Inc. (FIMM), an affiliate of the investment adviser. Annualized expenses of the Money Market Central Funds as of their most recent shareholder report date are less than .005%. The following summarizes the Fund's investment in each non-money market Fidelity Central Fund.
| Fidelity Central Fund | Investment Manager | Investment Objective | Investment Practices | Expense Ratio(a) |
| Fidelity Floating Rate Central Fund | FMR Co., Inc. (FMRC) | Seeks a high level of income by normally investing in floating rate loans and other floating rate securities. | Loans & Direct Debt Instruments
Restricted Securities | Less than .005% |
(a) Expenses expressed as a percentage of average net assets and are as of each underlying Central Fund's most recent annual or semi-annual shareholder report.
An unaudited holdings listing for the Fund, which presents direct holdings as well as the pro-rata share of any securities and other investments held indirectly through its investment in underlying non-money market Fidelity Central Funds, is available at institutional.fidelity.com. A complete unaudited list of holdings for each Fidelity Central Fund is available upon request or at the Securities and Exchange Commission (the SEC) website at www.sec.gov. In addition, the financial statements of the Fidelity Central Funds which contain the significant accounting policies (including investment valuation policies) of those funds, which are not covered by the Fund's Report of Independent Registered Public Accounting Firm, are available on the SEC website or upon request.
3. Significant Accounting Policies.
The Fund is an investment company and applies the accounting and reporting guidance of the Financial Accounting Standards Board (FASB) Accounting Standards Codification Topic 946 Financial Services – Investments Companies. The financial statements have been prepared in conformity with accounting principles generally accepted in the United States of America (GAAP), which require management to make certain estimates and assumptions at the date of the financial statements. Actual results could differ from those estimates. Subsequent events, if any, through the date that the financial statements were issued have been evaluated in the preparation of the financial statements. The following summarizes the significant accounting policies of the Fund:
Investment Valuation. Investments are valued as of 4:00 p.m. Eastern time on the last calendar day of the period. The Board of Trustees (the Board) has delegated the day to day responsibility for the valuation of the Fund's investments to the Fair Value Committee (the Committee) established by the Fund's investment adviser. In accordance with valuation policies and procedures approved by the Board, the Fund attempts to obtain prices from one or more third party pricing vendors or brokers to value its investments. When current market prices, quotations or currency exchange rates are not readily available or reliable, investments will be fair valued in good faith by the Committee, in accordance with procedures adopted by the Board. Factors used in determining fair value vary by investment type and may include market or investment specific events, changes in interest rates and credit quality. The frequency with which these procedures are used cannot be predicted and they may be utilized to a significant extent. The Committee oversees the Fund's valuation policies and procedures and reports to the Board on the Committee's activities and fair value determinations. The Board monitors the appropriateness of the procedures used in valuing the Fund's investments and ratifies the fair value determinations of the Committee.
The Fund categorizes the inputs to valuation techniques used to value its investments into a disclosure hierarchy consisting of three levels as shown below:
- Level 1 – quoted prices in active markets for identical investments
- Level 2 – other significant observable inputs (including quoted prices for similar investments, interest rates, prepayment speeds, etc.)
- Level 3 – unobservable inputs (including the Fund's own assumptions based on the best information available)
Valuation techniques used to value the Fund's investments by major category are as follows:
Debt securities, including restricted securities, are valued based on evaluated prices received from third party pricing vendors or from brokers who make markets in such securities. Corporate bonds, bank loan obligations, foreign government and government agency obligations, preferred securities, supranational obligations and U.S. government and government agency obligations are valued by pricing vendors who utilize matrix pricing which considers yield or price of bonds of comparable quality, coupon, maturity and type or by broker-supplied prices. Asset backed securities, collateralized mortgage obligations, commercial mortgage securities and U.S. government agency mortgage securities are valued by pricing vendors who utilize matrix pricing which considers prepayment speed assumptions, attributes of the collateral, yield or price of bonds of comparable quality, coupon, maturity and type or by broker-supplied prices. Swaps are marked-to-market daily based on valuations from third party pricing vendors, registered derivatives clearing organizations (clearinghouses) or broker-supplied valuations. These pricing sources may utilize inputs such as interest rate curves, credit spread curves, default possibilities and recovery rates. When independent prices are unavailable or unreliable, debt securities and swaps may be valued utilizing pricing methodologies which consider similar factors that would be used by third party pricing vendors. For foreign debt securities, when significant market or security specific events arise, valuations may be determined in good faith in accordance with procedures adopted by the Board. Debt securities and swaps are generally categorized as Level 2 in the hierarchy but may be Level 3 depending on the circumstances. The Fund invests a significant portion of its assets in below investment grade securities. The value of these securities can be more volatile due to changes in the credit quality of the issuer and is sensitive to changes in economic, market and regulatory conditions.
Equity securities, including restricted securities, for which market quotations are readily available, are valued at the last reported sale price or official closing price as reported by a third party pricing vendor on the primary market or exchange on which they are traded and are categorized as Level 1 in the hierarchy. In the event there were no sales during the day or closing prices are not available, securities are valued at the last quoted bid price or may be valued using the last available price and are generally categorized as Level 2 in the hierarchy. For foreign equity securities, when market or security specific events arise, comparisons to the valuation of American Depositary Receipts (ADRs), futures contracts, Exchange-Traded Funds (ETFs) and certain indexes as well as quoted prices for similar securities may be used and would be categorized as Level 2 in the hierarchy. Utilizing these techniques may result in transfers between Level 1 and Level 2. For equity securities, including restricted securities, where observable inputs are limited, assumptions about market activity and risk are used and these securities may be categorized as Level 3 in the hierarchy.
ETFs are valued at their last sale price or official closing price as reported by a third party pricing vendor on the primary market or exchange on which they are traded and are categorized as Level 1 in the hierarchy. In the event there were no sales during the day but the exchange reports a closing bid level, ETFs are valued at the closing bid and would be categorized as Level 1 in the hierarchy. In the event there was no closing bid, ETFs may be valued by another method that the Board believes reflects fair value in accordance with the Board's fair value pricing policies and may be categorized as Level 2 in the hierarchy.
Futures contracts are valued at the settlement price established each day by the board of trade or exchange on which they are traded and are categorized as Level 1 in the hierarchy. Options traded over-the-counter are valued using vendor or broker-supplied valuations and are categorized as Level 2 in the hierarchy. Investments in open-end mutual funds, including the Fidelity Central Funds, are valued at their closing net asset value (NAV) each business day and are categorized as Level 1 in the hierarchy.
Changes in valuation techniques may result in transfers in or out of an assigned level within the disclosure hierarchy. The aggregate value of investments by input level as of December 31, 2018 is included at the end of the Fund's Schedule of Investments.
Foreign Currency. The Fund may use foreign currency contracts to facilitate transactions in foreign-denominated securities. Gains and losses from these transactions may arise from changes in the value of the foreign currency or if the counterparties do not perform under the contracts' terms.
Foreign-denominated assets, including investment securities, and liabilities are translated into U.S. dollars at the exchange rates at period end. Purchases and sales of investment securities, income and dividends received and expenses denominated in foreign currencies are translated into U.S. dollars at the exchange rate in effect on the transaction date.
The effects of exchange rate fluctuations on investments are included with the net realized and unrealized gain (loss) on investment securities. Other foreign currency transactions resulting in realized and unrealized gain (loss) are disclosed separately.
Investment Transactions and Income. For financial reporting purposes, the Fund's investment holdings and NAV include trades executed through the end of the last business day of the period. The NAV per share for processing shareholder transactions is calculated as of the close of business of the New York Stock Exchange (NYSE), normally 4:00 p.m. Eastern time and includes trades executed through the end of the prior business day. Gains and losses on securities sold are determined on the basis of identified cost and include proceeds received from litigation. Dividend income is recorded on the ex-dividend date, except for certain dividends from foreign securities where the ex-dividend date may have passed, which are recorded as soon as the Fund is informed of the ex-dividend date. Non-cash dividends included in dividend income, if any, are recorded at the fair market value of the securities received. Income and capital gain distributions from Fidelity Central Funds, if any, are recorded on the ex-dividend date. Certain distributions received by the Fund represent a return of capital or capital gain. The Fund determines the components of these distributions subsequent to the ex-dividend date, based upon receipt of tax filings or other correspondence relating to the underlying investment. These distributions are recorded as a reduction of cost of investments and/or as a realized gain. Interest income is accrued as earned and includes coupon interest and amortization of premium and accretion of discount on debt securities as applicable. Paid in Kind (PIK) income is recorded at the fair market value of the securities received. Investment income is recorded net of foreign taxes withheld where recovery of such taxes is uncertain. Debt obligations may be placed on non-accrual status and related interest income may be reduced by ceasing current accruals and writing off interest receivables when the collection of all or a portion of interest has become doubtful based on consistently applied procedures. A debt obligation is removed from non-accrual status when the issuer resumes interest payments or when collectability of interest is reasonably assured.
Class Allocations and Expenses. Investment income, realized and unrealized capital gains and losses, common expenses of the Fund, and certain fund-level expense reductions, if any, are allocated daily on a pro-rata basis to each class based on the relative net assets of each class to the total net assets of the Fund. Each class differs with respect to transfer agent and distribution and service plan fees incurred. Certain expense reductions may also differ by class. For the reporting period, the allocated portion of income and expenses to each class as a percent of its average net assets may vary due to the timing of recording these transactions in relation to fluctuating net assets of the classes. Expenses directly attributable to a fund are charged to that fund. Expenses attributable to more than one fund are allocated among the respective funds on the basis of relative net assets or other appropriate methods. Expense estimates are accrued in the period to which they relate and adjustments are made when actual amounts are known.
Income Tax Information and Distributions to Shareholders. Each year, the Fund intends to qualify as a regulated investment company under Subchapter M of the Internal Revenue Code, including distributing substantially all of its taxable income and realized gains. As a result, no provision for U.S. Federal income taxes is required. As of December 31, 2018, the Fund did not have any unrecognized tax benefits in the financial statements; nor is the Fund aware of any tax positions for which it is reasonably possible that the total amounts of unrecognized tax benefits will significantly change in the next twelve months. The Fund files a U.S. federal tax return, in addition to state and local tax returns as required. The Fund's federal income tax returns are subject to examination by the Internal Revenue Service (IRS) for a period of three fiscal years after they are filed. State and local tax returns may be subject to examination for an additional fiscal year depending on the jurisdiction. Foreign taxes are provided for based on the Fund's understanding of the tax rules and rates that exist in the foreign markets in which it invests.
Distributions are declared and recorded on the ex-dividend date. Income and capital gain distributions are declared separately for each class. Income and capital gain distributions are determined in accordance with income tax regulations, which may differ from GAAP. These differences resulted in distribution reclassifications.
Capital accounts within the financial statements are adjusted for permanent book-tax differences. These adjustments have no impact on net assets or the results of operations. Capital accounts are not adjusted for temporary book-tax differences which will reverse in a subsequent period.
Book-tax differences are primarily due to futures contracts, foreign currency transactions, swaps, market discount, partnerships, capital loss carryforwards and losses deferred due to wash sales and excise tax regulations.
As of period end, the cost and unrealized appreciation (depreciation) in securities, and derivatives if applicable, for federal income tax purposes were as follows:
| Gross unrealized appreciation | $24,971,319 |
| Gross unrealized depreciation | (67,041,106) |
| Net unrealized appreciation (depreciation) | $(42,069,787) |
| Tax Cost | $1,439,259,581 |
The tax-based components of distributable earnings as of period end were as follows:
| Capital loss carryforward | $(2,332,373) |
| Net unrealized appreciation (depreciation) on securities and other investments | $(42,089,594) |
Capital loss carryforwards are only available to offset future capital gains of the Fund to the extent provided by regulations and may be limited. Under the Regulated Investment Company Modernization Act of 2010 (the Act), the Fund is permitted to carry forward capital losses incurred in taxable years beginning after December 22, 2010 for an unlimited period and such capital losses are required to be used prior to any losses that expire. The capital loss carryforward information presented below, including any applicable limitation, is estimated as of fiscal period end and is subject to adjustment.
The Fund intends to elect to defer to its next fiscal year $1,146,955 of ordinary losses recognized during the period November 1, 2018 to December 31, 2018.
The tax character of distributions paid was as follows:
| | December 31, 2018 | December 31, 2017 |
| Ordinary Income | $55,455,091 | $ 55,036,702 |
Delayed Delivery Transactions and When-Issued Securities. During the period, the Fund transacted in securities on a delayed delivery or when-issued basis. Payment and delivery may take place after the customary settlement period for that security. The price of the underlying securities and the date when the securities will be delivered and paid for are fixed at the time the transaction is negotiated. The securities purchased on a delayed delivery or when-issued basis are identified as such in the Fund's Schedule of Investments. The Fund may receive compensation for interest forgone in the purchase of a delayed delivery or when-issued security. With respect to purchase commitments, the Fund identifies securities as segregated in its records with a value at least equal to the amount of the commitment. Losses may arise due to changes in the value of the underlying securities or if the counterparty does not perform under the contract's terms, or if the issuer does not issue the securities due to political, economic, or other factors.
To-Be-Announced (TBA) Securities and Mortgage Dollar Rolls. During the period, the Fund transacted in TBA securities that involved buying or selling mortgage-backed securities (MBS) on a forward commitment basis. A TBA transaction typically does not designate the actual security to be delivered and only includes an approximate principal amount; however delivered securities must meet specified terms defined by industry guidelines, including issuer, rate and current principal amount outstanding on underlying mortgage pools. The Fund may enter into a TBA transaction with the intent to take possession of or deliver the underlying MBS, or the Fund may elect to extend the settlement by entering into either a mortgage or reverse mortgage dollar roll. Mortgage dollar rolls are transactions where a fund sells TBA securities and simultaneously agrees to repurchase MBS on a later date at a lower price and with the same counterparty. Reverse mortgage dollar rolls involve the purchase and simultaneous agreement to sell TBA securities on a later date at a lower price. Transactions in mortgage dollar rolls and reverse mortgage dollar rolls are accounted for as purchases and sales and may result in an increase to the Fund's portfolio turnover rate.
Purchases and sales of TBA securities involve risks similar to those discussed above for delayed delivery and when-issued securities. Also, if the counterparty in a mortgage dollar roll or a reverse mortgage dollar roll transaction files for bankruptcy or becomes insolvent, the Fund's right to repurchase or sell securities may be limited. Additionally, when a fund sells TBA securities without already owning or having the right to obtain the deliverable securities (an uncovered forward commitment to sell), it incurs a risk of loss because it could have to purchase the securities at a price that is higher than the price at which it sold them. A fund may be unable to purchase the deliverable securities if the corresponding market is illiquid.
TBA securities subject to a forward commitment to sell at period end are included at the end of the Fund's Schedule of Investments under the caption "TBA Sale Commitments." The proceeds and value of these commitments are reflected in the Fund's Statement of Assets and Liabilities as Receivable for TBA sale commitments and TBA sale commitments, at value, respectively.
Restricted Securities. The Fund may invest in securities that are subject to legal or contractual restrictions on resale. These securities generally may be resold in transactions exempt from registration or to the public if the securities are registered. Disposal of these securities may involve time-consuming negotiations and expense, and prompt sale at an acceptable price may be difficult. Information regarding restricted securities is included at the end of the Fund's Schedule of Investments.
Loans and Other Direct Debt Instruments. The Fund invests in direct debt instruments which are interests in amounts owed to lenders by corporate or other borrowers. These instruments may be in the form of loans, trade claims or other receivables and may include standby financing commitments such as revolving credit facilities that obligate the Fund to supply additional cash to the borrower on demand. Loans may be acquired through assignment or participation. The Fund did not have any unfunded loan commitments, which are contractual obligations for future funding, at period end.
New Rule Issuance. During August 2018, the U.S. Securities and Exchange Commission issued Final Rule Release No. 33-10532, Disclosure Update and Simplification. This Final Rule includes amendments specific to registered investment companies that are intended to eliminate overlap in disclosure requirements between Regulation S-X and GAAP. In accordance with these amendments, certain line-items in the Fund's financial statements have been combined or removed for the current period as outlined in the table below.
| Financial Statement | Current Line-Item Presentation | Prior Line-Item Presentation |
| Statement of Assets and Liabilities | Total distributable earnings (loss) | Undistributed/Distributions in excess of/Accumulated net investment income (loss)
Accumulated/Undistributed net realized gain (loss)
Net unrealized appreciation (depreciation) |
| Statement of Changes in Net Assets | N/A - removed | Undistributed/Distributions in excess of/Accumulated net investment income (loss) end of period |
| Statement of Changes in Net Assets | Distributions to shareholders | Distributions to shareholders from net investment income
Distributions to shareholders from net realized gain |
| Distributions to Shareholders Note to Financial Statements | Distributions to shareholders | Distributions to shareholders from net investment income
Distributions to shareholders from net realized gain |
4. Derivative Instruments.
Risk Exposures and the Use of Derivative Instruments. The Fund's investment objective allows the Fund to enter into various types of derivative contracts, including futures contracts, options and swaps. Derivatives are investments whose value is primarily derived from underlying assets, indices or reference rates and may be transacted on an exchange or over-the-counter (OTC). Derivatives may involve a future commitment to buy or sell a specified asset based on specified terms, to exchange future cash flows at periodic intervals based on a notional principal amount, or for one party to make one or more payments upon the occurrence of specified events in exchange for periodic payments from the other party.
The Fund used derivatives to increase returns, to gain exposure to certain types of assets and to manage exposure to certain risks as defined below. The success of any strategy involving derivatives depends on analysis of numerous economic factors, and if the strategies for investment do not work as intended, the Fund may not achieve its objectives.
The Fund's use of derivatives increased or decreased its exposure to the following risks:
| Interest Rate Risk | Interest rate risk relates to the fluctuations in the value of interest-bearing securities due to changes in the prevailing levels of market interest rates. |
The Fund is also exposed to additional risks from investing in derivatives, such as liquidity risk and counterparty credit risk. Liquidity risk is the risk that the Fund will be unable to close out the derivative in the open market in a timely manner. Counterparty credit risk is the risk that the counterparty will not be able to fulfill its obligation to the Fund. Derivative counterparty credit risk is managed through formal evaluation of the creditworthiness of all potential counterparties. On certain OTC derivatives such as options, the Fund attempts to reduce its exposure to counterparty credit risk by entering into an International Swaps and Derivatives Association, Inc. (ISDA) Master Agreement with each of its counterparties. The ISDA Master Agreement gives the Fund the right to terminate all transactions traded under such agreement upon the deterioration in the credit quality of the counterparty beyond specified levels. The ISDA Master Agreement gives each party the right, upon an event of default by the other party or a termination of the agreement, to close out all transactions traded under such agreement and to net amounts owed under each transaction to one net payable by one party to the other. To mitigate counterparty credit risk on bi-lateral OTC derivatives, the Fund receives collateral in the form of cash or securities once the Fund's net unrealized appreciation on outstanding derivative contracts under an ISDA Master Agreement exceeds certain applicable thresholds, subject to certain minimum transfer provisions. The collateral received is held in segregated accounts with the Fund's custodian bank in accordance with the collateral agreements entered into between the Fund, the counterparty and the Fund's custodian bank. The Fund could experience delays and costs in gaining access to the collateral even though it is held by the Fund's custodian bank. The Fund's maximum risk of loss from counterparty credit risk related to bi-lateral OTC derivatives is generally the aggregate unrealized appreciation and unpaid counterparty payments in excess of any collateral pledged by the counterparty to the Fund. For OTC written options with upfront premiums received, the Fund is obligated to perform and therefore does not have counterparty risk. For OTC written options with premiums to be received at a future date, the maximum risk of loss from counterparty credit risk is the amount of the premium in excess of any collateral pledged by the counterparty. The Fund may be required to pledge collateral for the benefit of the counterparties on bi-lateral OTC derivatives in an amount not less than each counterparty's unrealized appreciation on outstanding derivative contracts, subject to certain minimum transfer provisions, and any such pledged collateral is identified in the Schedule of Investments. Exchange-traded futures contracts are not covered by the ISDA Master Agreement; however counterparty credit risk related to exchange-traded futures contracts may be mitigated by the protection provided by the exchange on which they trade. Counterparty credit risk related to centrally cleared OTC swaps may be mitigated by the protection provided by the clearinghouse.
Investing in derivatives may involve greater risks than investing in the underlying assets directly and, to varying degrees, may involve risk of loss in excess of any initial investment and collateral received and amounts recognized in the Statement of Assets and Liabilities. In addition, there may be the risk that the change in value of the derivative contract does not correspond to the change in value of the underlying instrument.
Net Realized Gain (Loss) and Change in Net Unrealized Appreciation (Depreciation) on Derivatives. The table below, which reflects the impacts of derivatives on the financial performance of the Fund, summarizes the net realized gain (loss) and change in net unrealized appreciation (depreciation) for derivatives during the period as presented in the Statement of Operations.
| Primary Risk Exposure / Derivative Type | Net Realized Gain (Loss) | Change in Net Unrealized Appreciation (Depreciation) |
| Interest Rate Risk | | |
| Purchased Options | $24,450 | $(2,587) |
| Written Options | 28,151 | – |
| Futures Contracts | (111,594) | 1,521,092 |
| Swaps | (53,242) | 30,297 |
| Totals | $(112,235) | $1,548,802 |
A summary of the value of derivatives by primary risk exposure as of period end, if any, is included at the end of the Schedule of Investments.
Futures Contracts. A futures contract is an agreement between two parties to buy or sell a specified underlying instrument for a fixed price at a specified future date. The Fund used futures contracts to manage its exposure to the bond market and fluctuations in interest rates.
Upon entering into a futures contract, a fund is required to deposit either cash or securities (initial margin) with a clearing broker in an amount equal to a certain percentage of the face value of the contract. Futures contracts are marked-to-market daily and subsequent daily payments (variation margin) are made or received by a fund depending on the daily fluctuations in the value of the futures contracts and are recorded as unrealized appreciation or (depreciation). This receivable and/or payable, if any, is included in daily variation margin on futures contracts in the Statement of Assets and Liabilities. Realized gain or (loss) is recorded upon the expiration or closing of a futures contract. The net realized gain (loss) and change in net unrealized appreciation (depreciation) on futures contracts during the period is presented in the Statement of Operations.
Any open futures contracts at period end are presented in the Schedule of Investments under the caption "Futures Contracts". The notional amount at value reflects each contract's exposure to the underlying instrument or index at period end and is representative of volume of activity during the period. Securities deposited to meet initial margin requirements are identified in the Schedule of Investments.
Options. Options give the purchaser the right, but not the obligation, to buy (call) or sell (put) an underlying security or financial instrument at an agreed exercise or strike price between or on certain dates. Options obligate the seller (writer) to buy (put) or sell (call) an underlying instrument at the exercise or strike price or cash settle an underlying derivative instrument if the holder exercises the option on or before the expiration date. The Fund uses OTC options, such as swaptions, which are options where the underlying instrument is a swap, to manage its exposure to fluctuations in interest rates.
Upon entering into an options contract, a fund will pay or receive a premium. Premiums paid on purchased options are reflected as cost of investments and premiums received on written options are reflected as a liability on the Statement of Assets and Liabilities. Certain options may be purchased or written with premiums to be paid or received on a future date. Options are valued daily and any unrealized appreciation (depreciation) is reflected on the Statement of Assets and Liabilities. When an option is exercised, the cost or proceeds of the underlying instrument purchased or sold is adjusted by the amount of the premium. When an option is closed the Fund will realize a gain or loss depending on whether the proceeds or amount paid for the closing sale transaction is greater or less than the premium received or paid. When an option expires, gains and losses are realized to the extent of premiums received and paid, respectively. The net realized and unrealized gains (losses) on purchased options are included in the Statement of Operations in net realized gain (loss) and change in net unrealized appreciation (depreciation) on investment securities. The net realized gain (loss) and change in net unrealized appreciation (depreciation) on written options are presented in the Statement of Operations.
Any open options at period end are presented in the Schedule of Investments under the captions "Purchased Options," "Purchased Swaptions," "Written Options" and "Written Swaptions," as applicable, and are representative of volume of activity during the period.
Writing puts and buying calls tend to increase exposure to the underlying instrument while buying puts and writing calls tend to decrease exposure to the underlying instrument. For purchased options, risk of loss is limited to the premium paid, and for written options, risk of loss is the change in value in excess of the premium received.
Swaps. A swap is a contract between two parties to exchange future cash flows at periodic intervals based on a notional principal amount. A centrally cleared OTC swap is a transaction executed between a fund and a dealer counterparty, then cleared by a futures commission merchant (FCM) through a clearinghouse. Once cleared, the clearinghouse serves as a central counterparty, with whom a fund exchanges cash flows for the life of the transaction, similar to transactions in futures contracts.
Centrally cleared OTC swaps require a fund to deposit either cash or securities (initial margin) with the FCM, at the instruction of and for the benefit of the clearinghouse. Securities deposited to meet initial margin requirements are identified in the Schedule of Investments. Centrally cleared OTC swaps are marked-to-market daily and subsequent payments (variation margin) are made or received depending on the daily fluctuations in the value of the swaps and are recorded as unrealized appreciation or (depreciation). These daily payments, if any, are included in receivable or payable for daily variation margin on centrally cleared OTC swaps in the Statement of Assets and Liabilities. Any premiums for centrally cleared OTC swaps are recorded periodically throughout the term of the swap to variation margin and included in unrealized appreciation (depreciation) in the Statement of Assets and Liabilities. Any premiums are recognized as realized gain (loss) upon termination or maturity of the swap.
Payments are exchanged at specified intervals, accrued daily commencing with the effective date of the contract and recorded as realized gain or (loss). Some swaps may be terminated prior to the effective date and realize a gain or loss upon termination. The net realized gain (loss) and change in net unrealized appreciation (depreciation) on swaps during the period is presented in the Statement of Operations.
Any open swaps at period end are included in the Schedule of Investments under the caption "Swaps" and are representative of volume of activity during the period.
Interest Rate Swaps. Interest rate swaps are agreements between counterparties to exchange cash flows, one based on a fixed rate, and the other on a floating rate. The Fund entered into interest rate swaps to manage its exposure to interest rate changes. Changes in interest rates can have an effect on both the value of bond holdings as well as the amount of interest income earned. In general, the value of bonds can fall when interest rates rise and can rise when interest rates fall.
5. Purchases and Sales of Investments.
Purchases and sales of securities (including the Fixed-Income Central Funds), other than short-term securities and U.S. government securities, aggregated $1,073,278,694 and $1,145,837,513, respectively.
6. Fees and Other Transactions with Affiliates.
Management Fee. Fidelity Management & Research Company (the investment adviser) and its affiliates provide the Fund with investment management related services for which the Fund pays a monthly management fee. The management fee is the sum of an individual fund fee rate that is based on an annual rate of .45% of the Fund's average net assets and an annualized group fee rate that averaged .11% during the period. The group fee rate is based upon the average net assets of all the mutual funds advised by the investment adviser, including any mutual funds previously advised by the investment adviser that are currently advised by Fidelity SelectCo, LLC, an affiliate of the investment adviser. The group fee rate decreases as assets under management increase and increases as assets under management decrease. For the reporting period, the total annual management fee rate was .56% of the Fund's average net assets.
Distribution and Service Plan Fees. In accordance with Rule 12b-1 of the 1940 Act, the Fund has adopted separate 12b-1 Plans for each Service Class of shares. Each Service Class pays Fidelity Distributors Corporation (FDC), an affiliate of the investment adviser, a service fee. For the period, the service fee is based on an annual rate of .10% of Service Class' average net assets and .25% of Service Class 2's average net assets.
For the period, total fees, all of which were re-allowed to insurance companies for the distribution of shares and providing shareholder support services, were as follows:
| Service Class | $1,778 |
| Service Class 2 | 981,847 |
| | $983,625 |
Transfer Agent Fees. Fidelity Investments Institutional Operations Company, Inc. (FIIOC), an affiliate of the investment adviser, is the Fund's transfer, dividend disbursing, and shareholder servicing agent. FIIOC receives an asset-based fee with respect to each class. Each class pays a fee for transfer agent services, typesetting and printing and mailing of shareholder reports, excluding mailing of proxy statements, equal to an annual rate of class-level average net assets. The annual rate for Investor Class is .10% and the annual rate for all other classes is .07%. For the period, transfer agent fees for each class were as follows:
| Initial Class | $61,722 |
| Service Class | 1,209 |
| Service Class 2 | 267,063 |
| Investor Class | 1,026,771 |
| | $1,356,765 |
Accounting and Security Lending Fees. Fidelity Service Company, Inc. (FSC), an affiliate of the investment adviser, maintains the Fund's accounting records. The accounting fee is based on the level of average net assets for each month. Under a separate contract, FSC administers the security lending program. The security lending fee is based on the number and duration of lending transactions. For the period, the fees were equivalent to an annual rate of .03%.
Brokerage Commissions. The Fund placed a portion of its portfolio transactions with brokerage firms which are affiliates of the investment adviser. Brokerage commissions are included in net realized gain (loss) and change in net unrealized appreciation (depreciation) in the Statement of Operations. The commissions paid to these affiliated firms were $1,509 for the period.
Interfund Trades. The Fund may purchase from or sell securities to other Fidelity Funds under procedures adopted by the Board. The procedures have been designed to ensure these interfund trades are executed in accordance with Rule 17a-7 of the 1940 Act. Interfund trades are included within the respective purchases and sales amounts shown in the Purchases and Sales of Investments note.
Other. During the period, the investment adviser reimbursed the Fund for certain losses in the amount of $8,852.
7. Committed Line of Credit.
The Fund participates with other funds managed by the investment adviser or an affiliate in a $4.25 billion credit facility (the "line of credit") to be utilized for temporary or emergency purposes to fund shareholder redemptions or for other short-term liquidity purposes. The Fund has agreed to pay commitment fees on its pro-rata portion of the line of credit, which amounted to $4,140 and is reflected in Miscellaneous expenses on the Statement of Operations. During the period, the Fund did not borrow on this line of credit.
8. Security Lending.
The Fund lends portfolio securities through a lending agent from time to time in order to earn additional income. For equity securities, a lending agent is used and may loan securities to certain qualified borrowers, including Fidelity Capital Markets (FCM), a broker-dealer affiliated with the Fund. On the settlement date of the loan, the Fund receives collateral (in the form of U.S. Treasury obligations, letters of credit and/or cash) against the loaned securities and maintains collateral in an amount not less than 100% of the market value of the loaned securities during the period of the loan. The market value of the loaned securities is determined at the close of business of the Fund and any additional required collateral is delivered to the Fund on the next business day. The Fund or borrower may terminate the loan at any time, and if the borrower defaults on its obligation to return the securities loaned because of insolvency or other reasons, the Fund may apply collateral received from the borrower against the obligation. The Fund may experience delays and costs in recovering the securities loaned. Any cash collateral received is invested in the Fidelity Securities Lending Cash Central Fund. The value of loaned securities and cash collateral at period end are disclosed on the Fund's Statement of Assets and Liabilities. Security lending income represents the income earned on investing cash collateral, less rebates paid to borrowers and any lending agent fees associated with the loan, plus any premium payments received for lending certain types of securities. Security lending income is presented in the Statement of Operations as a component of income from Fidelity Central Funds. Total security lending income during the period amounted to $2,979. During the period, there were no securities loaned to FCM.
9. Expense Reductions.
Commissions paid to certain brokers with whom the investment adviser, or its affiliates, places trades on behalf of the Fund include an amount in addition to trade execution, which may be rebated back to the Fund to offset certain expenses. This amount totaled $6,053 for the period. In addition, through arrangements with the Fund's custodian, credits realized as a result of certain uninvested cash balances were used to reduce the Fund's expenses. During the period, these credits reduced the Fund's custody expenses by $12,499.
In addition, during the period the investment adviser reimbursed and/or waived a portion of fund-level operating expenses in the amount of $9,228.
10. Distributions to Shareholders.
Distributions to shareholders of each class were as follows:
| | Year ended
December 31, 2018 | Year ended
December 31, 2017 |
| Distributions to shareholders | | |
| Initial Class | $3,356,613 | $– |
| Service Class | 69,600 | – |
| Service Class 2 | 15,340,307 | – |
| Investor Class | 36,688,571 | – |
| Total | $55,455,091 | $– |
| From net investment income | | |
| Initial Class | $– | $3,029,902 |
| Service Class | – | 59,576 |
| Service Class 2 | – | 11,005,331 |
| Investor Class | – | 33,123,926 |
| Total | $– | $47,218,735 |
| From net realized gain | | |
| Initial Class | $– | $490,011 |
| Service Class | – | 9,661 |
| Service Class 2 | – | 1,902,939 |
| Investor Class | – | 5,415,356 |
| Total | $– | $7,817,967 |
11. Share Transactions.
Transactions for each class of shares were as follows:
| | Shares | Shares | Dollars | Dollars |
| | Year ended December 31, 2018 | Year ended December 31, 2017 | Year ended December 31, 2018 | Year ended December 31, 2017 |
| Initial Class | | | | |
| Shares sold | 592,997 | 1,069,761 | $6,794,755 | $12,377,067 |
| Reinvestment of distributions | 313,672 | 307,148 | 3,356,613 | 3,519,913 |
| Shares redeemed | (1,659,111) | (1,225,267) | (18,937,825) | (14,213,181) |
| Net increase (decrease) | (752,442) | 151,642 | $(8,786,457) | $1,683,799 |
| Service Class | | | | |
| Shares sold | 17,757 | 118,271 | $202,094 | $1,401,470 |
| Reinvestment of distributions | 5,053 | 6,058 | 53,967 | 69,237 |
| Shares redeemed | (25,591) | (6,343) | (291,279) | (73,173) |
| Net increase (decrease) | (2,781) | 117,986 | $(35,218) | $1,397,534 |
| Service Class 2 | | | | |
| Shares sold | 7,905,416 | 11,423,463 | $89,561,267 | $131,276,350 |
| Reinvestment of distributions | 1,447,286 | 1,136,291 | 15,340,307 | 12,908,270 |
| Shares redeemed | (4,825,862) | (3,479,579) | (54,454,958) | (39,915,663) |
| Net increase (decrease) | 4,526,840 | 9,080,175 | $50,446,616 | $104,268,957 |
| Investor Class | | | | |
| Shares sold | 3,166,574 | 7,944,671 | $36,185,576 | $91,654,283 |
| Reinvestment of distributions | 3,438,162 | 3,374,718 | 36,688,571 | 38,539,282 |
| Shares redeemed | (15,476,914) | (3,392,440) | (175,825,165) | (39,096,557) |
| Net increase (decrease) | (8,872,178) | 7,926,949 | $(102,951,018) | $91,097,008 |
12. Other.
The Fund's organizational documents provide former and current trustees and officers with a limited indemnification against liabilities arising in connection with the performance of their duties to the Fund. In the normal course of business, the Fund may also enter into contracts that provide general indemnifications. The Fund's maximum exposure under these arrangements is unknown as this would be dependent on future claims that may be made against the Fund. The risk of material loss from such claims is considered remote.
At the end of the period, the investment adviser or its affiliates were the owners of record of 70% of the total outstanding shares of the Fund.
13. Credit Risk.
The Fund's relatively large investment in countries with limited or developing capital markets may involve greater risks than investments in more developed markets and the prices of such investments may be volatile. The yields of emerging market debt obligations reflect, among other things, perceived credit risk. The consequences of political, social or economic changes in these markets may have disruptive effects on the market prices of the Fund's investments and the income they generate, as well as the Fund's ability to repatriate such amounts.
14. Litigation.
The Fund and other entities managed by FMR or its affiliates were named as defendants in a lawsuit filed in the United States Bankruptcy Court for the Southern District of New York in 2009. The lawsuit was brought by creditors of Motors Liquidation Company (f/k/a General Motors), which went through Chapter 11 bankruptcy proceedings in 2009, and is captioned Official Committee of Unsecured Creditors of Motors Liquidation Company v. JPMorgan Chase Bank, N.A., et al., Adversary No. 09-00504 (REG). The plaintiffs are seeking an order that the Fund and other defendants return proceeds received in 2009 in full payment of the principal and interest on General Motors secured debt. The plaintiffs contend that the Fund and the other defendants were not secured creditors at the time of the 2009 payments and, thus, were not entitled to payment in full. In January 2015, the Court of Appeals ruled that JPMorgan, as administrative agent for all of the debtholders, released the security interest on certain collateral securing the debt prior to the 2009 payments. In September 2017, an opinion was issued in a trial intended to help determine the value of any remaining, unreleased collateral. In February 2019, the parties reached a preliminary settlement that remains subject to negotiation and final approval by the Bankruptcy Court. Given these contingencies, Management cannot determine at this time the amount of loss that may be realized, but expects the amount to be less than the $1,208,199 received in 2009. The Fund is also incurring legal costs in defending the case.
Report of Independent Registered Public Accounting Firm
To the Board of Trustees of Variable Insurance Products Fund V and Shareholders of VIP Strategic Income Portfolio:
Opinion on the Financial Statements
We have audited the accompanying statement of assets and liabilities, including the schedule of investments, of VIP Strategic Income Portfolio (one of the funds constituting Variable Insurance Products Fund V, referred to hereafter as the "Fund") as of December 31, 2018, the related statement of operations for the year ended December 31, 2018, the statement of changes in net assets for each of the two years in the period ended December 31, 2018, including the related notes, and the financial highlights for each of the five years in the period ended December 31, 2018 (collectively referred to as the “financial statements”). In our opinion, the financial statements present fairly, in all material respects, the financial position of the Fund as of December 31, 2018, the results of its operations for the year then ended, the changes in its net assets for each of the two years in the period ended December 31, 2018 and the financial highlights for each of the five years in the period ended December 31, 2018 in conformity with accounting principles generally accepted in the United States of America.
Basis for Opinion
These financial statements are the responsibility of the Fund’s management. Our responsibility is to express an opinion on the Fund’s financial statements based on our audits. We are a public accounting firm registered with the Public Company Accounting Oversight Board (United States) (PCAOB) and are required to be independent with respect to the Fund in accordance with the U.S. federal securities laws and the applicable rules and regulations of the Securities and Exchange Commission and the PCAOB.
We conducted our audits of these financial statements in accordance with the standards of the PCAOB. Those standards require that we plan and perform the audit to obtain reasonable assurance about whether the financial statements are free of material misstatement, whether due to error or fraud.
Our audits included performing procedures to assess the risks of material misstatement of the financial statements, whether due to error or fraud, and performing procedures that respond to those risks. Such procedures included examining, on a test basis, evidence regarding the amounts and disclosures in the financial statements. Our audits also included evaluating the accounting principles used and significant estimates made by management, as well as evaluating the overall presentation of the financial statements. Our procedures included confirmation of securities owned as of December 31, 2018 by correspondence with the custodian, agent banks and brokers; when replies were not received from brokers, we performed other auditing procedures. We believe that our audits provide a reasonable basis for our opinion.
PricewaterhouseCoopers LLP
Boston, Massachusetts
February 19, 2019
We have served as the auditor of one or more investment companies in the Fidelity group of funds since 1932.
Trustees and Officers
The Trustees, Members of the Advisory Board (if any), and officers of the trust and fund, as applicable, are listed below. The Board of Trustees governs the fund and is responsible for protecting the interests of shareholders. The Trustees are experienced executives who meet periodically throughout the year to oversee the fund's activities, review contractual arrangements with companies that provide services to the fund, oversee management of the risks associated with such activities and contractual arrangements, and review the fund's performance. Each of the Trustees oversees 260 funds.
The Trustees hold office without limit in time except that (a) any Trustee may resign; (b) any Trustee may be removed by written instrument, signed by at least two-thirds of the number of Trustees prior to such removal; (c) any Trustee who requests to be retired or who has become incapacitated by illness or injury may be retired by written instrument signed by a majority of the other Trustees; and (d) any Trustee may be removed at any special meeting of shareholders by a two-thirds vote of the outstanding voting securities of the trust. Each Trustee who is not an interested person (as defined in the 1940 Act) of the trust and the fund is referred to herein as an Independent Trustee. Each Independent Trustee shall retire not later than the last day of the calendar year in which his or her 75th birthday occurs. The Independent Trustees may waive this mandatory retirement age policy with respect to individual Trustees. Officers and Advisory Board Members hold office without limit in time, except that any officer or Advisory Board Member may resign or may be removed by a vote of a majority of the Trustees at any regular meeting or any special meeting of the Trustees. Except as indicated, each individual has held the office shown or other offices in the same company for the past five years.
The fund’s Statement of Additional Information (SAI) includes more information about the Trustees. To request a free copy, call Fidelity at 1-877-208-0098.
Experience, Skills, Attributes, and Qualifications of the Trustees. The Governance and Nominating Committee has adopted a statement of policy that describes the experience, qualifications, attributes, and skills that are necessary and desirable for potential Independent Trustee candidates (Statement of Policy). The Board believes that each Trustee satisfied at the time he or she was initially elected or appointed a Trustee, and continues to satisfy, the standards contemplated by the Statement of Policy. The Governance and Nominating Committee also engages professional search firms to help identify potential Independent Trustee candidates who have the experience, qualifications, attributes, and skills consistent with the Statement of Policy. From time to time, additional criteria based on the composition and skills of the current Independent Trustees, as well as experience or skills that may be appropriate in light of future changes to board composition, business conditions, and regulatory or other developments, have also been considered by the professional search firms and the Governance and Nominating Committee. In addition, the Board takes into account the Trustees' commitment and participation in Board and committee meetings, as well as their leadership of standing and ad hoc committees throughout their tenure.
In determining that a particular Trustee was and continues to be qualified to serve as a Trustee, the Board has considered a variety of criteria, none of which, in isolation, was controlling. The Board believes that, collectively, the Trustees have balanced and diverse experience, qualifications, attributes, and skills, which allow the Board to operate effectively in governing the fund and protecting the interests of shareholders. Information about the specific experience, skills, attributes, and qualifications of each Trustee, which in each case led to the Board's conclusion that the Trustee should serve (or continue to serve) as a trustee of the fund, is provided below.
Board Structure and Oversight Function. Abigail P. Johnson is an interested person and currently serves as Chairman. The Trustees have determined that an interested Chairman is appropriate and benefits shareholders because an interested Chairman has a personal and professional stake in the quality and continuity of services provided to the fund. Independent Trustees exercise their informed business judgment to appoint an individual of their choosing to serve as Chairman, regardless of whether the Trustee happens to be independent or a member of management. The Independent Trustees have determined that they can act independently and effectively without having an Independent Trustee serve as Chairman and that a key structural component for assuring that they are in a position to do so is for the Independent Trustees to constitute a substantial majority for the Board. The Independent Trustees also regularly meet in executive session. Arthur E. Johnson serves as Chairman of the Independent Trustees and as such (i) acts as a liaison between the Independent Trustees and management with respect to matters important to the Independent Trustees and (ii) with management prepares agendas for Board meetings.
Fidelity® funds are overseen by different Boards of Trustees. The fund's Board oversees Fidelity's investment-grade bond, money market, asset allocation and certain equity funds, and other Boards oversee Fidelity's high income and other equity funds. The asset allocation funds may invest in Fidelity® funds that are overseen by such other Boards. The use of separate Boards, each with its own committee structure, allows the Trustees of each group of Fidelity® funds to focus on the unique issues of the funds they oversee, including common research, investment, and operational issues. On occasion, the separate Boards establish joint committees to address issues of overlapping consequences for the Fidelity® funds overseen by each Board.
The Trustees operate using a system of committees to facilitate the timely and efficient consideration of all matters of importance to the Trustees, the fund, and fund shareholders and to facilitate compliance with legal and regulatory requirements and oversight of the fund's activities and associated risks. The Board, acting through its committees, has charged FMR and its affiliates with (i) identifying events or circumstances the occurrence of which could have demonstrably adverse effects on the fund's business and/or reputation; (ii) implementing processes and controls to lessen the possibility that such events or circumstances occur or to mitigate the effects of such events or circumstances if they do occur; and (iii) creating and maintaining a system designed to evaluate continuously business and market conditions in order to facilitate the identification and implementation processes described in (i) and (ii) above. Because the day-to-day operations and activities of the fund are carried out by or through FMR, its affiliates, and other service providers, the fund's exposure to risks is mitigated but not eliminated by the processes overseen by the Trustees. While each of the Board's committees has responsibility for overseeing different aspects of the fund's activities, oversight is exercised primarily through the Operations and Audit Committees. In addition, an ad hoc Board committee of Independent Trustees has worked with FMR to enhance the Board's oversight of investment and financial risks, legal and regulatory risks, technology risks, and operational risks, including the development of additional risk reporting to the Board. Appropriate personnel, including but not limited to the fund's Chief Compliance Officer (CCO), FMR's internal auditor, the independent accountants, the fund's Treasurer and portfolio management personnel, make periodic reports to the Board's committees, as appropriate, including an annual review of Fidelity's risk management program for the Fidelity® funds. The responsibilities of each standing committee, including their oversight responsibilities, are described further under "Standing Committees of the Trustees."
Interested Trustees*:
Correspondence intended for a Trustee who is an interested person may be sent to Fidelity Investments, 245 Summer Street, Boston, Massachusetts 02210.
Name, Year of Birth; Principal Occupations and Other Relevant Experience+
Abigail P. Johnson (1961)
Year of Election or Appointment: 2009
Trustee
Chairman of the Board of Trustees
Ms. Johnson also serves as Trustee of other Fidelity® funds. Ms. Johnson serves as Chairman (2016-present), Chief Executive Officer (2014-present), and Director (2007-present) of FMR LLC (diversified financial services company), President of Fidelity Financial Services (2012-present) and President of Personal, Workplace and Institutional Services (2005-present). Ms. Johnson is Chairman and Director of FMR Co., Inc. (investment adviser firm, 2011-present) and Chairman and Director of FMR (investment adviser firm, 2011-present). Previously, Ms. Johnson served as Vice Chairman (2007-2016) and President (2013-2016) of FMR LLC, President and a Director of FMR (2001-2005), a Trustee of other investment companies advised by FMR, Fidelity Investments Money Management, Inc. (investment adviser firm), and FMR Co., Inc. (2001-2005), Senior Vice President of the Fidelity® funds (2001-2005), and managed a number of Fidelity® funds. Ms. Abigail P. Johnson and Mr. Arthur E. Johnson are not related.
Jennifer Toolin McAuliffe (1959)
Year of Election or Appointment: 2016
Trustee
Ms. McAuliffe also serves as Trustee of other Fidelity® funds. Ms. McAuliffe previously served as a Member of the Advisory Board of certain Fidelity® funds (2016) and as Co-Head of Fixed Income of Fidelity Investments Limited (now known as FIL Limited (FIL)) (diversified financial services company). Earlier roles at FIL included Director of Research for FIL’s credit and quantitative teams in London, Hong Kong and Tokyo. Ms. McAuliffe also was the Director of Research for taxable and municipal bonds at Fidelity Investments Money Management, Inc. Ms. McAuliffe is also a director or trustee of several not-for-profit entities.
* Determined to be an “Interested Trustee” by virtue of, among other things, his or her affiliation with the trust or various entities under common control with FMR.
+ The information includes the Trustee's principal occupation during the last five years and other information relating to the experience, attributes, and skills relevant to the Trustee's qualifications to serve as a Trustee, which led to the conclusion that the Trustee should serve as a Trustee for the fund.
Independent Trustees:
Correspondence intended for an Independent Trustee may be sent to Fidelity Investments, P.O. Box 55235, Boston, Massachusetts 02205-5235.
Name, Year of Birth; Principal Occupations and Other Relevant Experience+
Elizabeth S. Acton (1951)
Year of Election or Appointment: 2013
Trustee
Ms. Acton also serves as Trustee of other Fidelity® funds. Prior to her retirement in April 2012, Ms. Acton was Executive Vice President, Finance (2011-2012), Executive Vice President, Chief Financial Officer (2002-2011), and Treasurer (2004-2005) of Comerica Incorporated (financial services). Prior to joining Comerica, Ms. Acton held a variety of positions at Ford Motor Company (1983-2002), including Vice President and Treasurer (2000-2002) and Executive Vice President and Chief Financial Officer of Ford Motor Credit Company (1998-2000). Ms. Acton currently serves as a member of the Board of Directors and Audit and Finance Committees of Beazer Homes USA, Inc. (homebuilding, 2012-present). Previously, Ms. Acton served as a Member of the Advisory Board of certain Fidelity® funds (2013-2016).
Ann E. Dunwoody (1953)
Year of Election or Appointment: 2018
Trustee
General Dunwoody also serves as Trustee of other Fidelity® funds. General Dunwoody (United States Army, Retired) was the first woman in U.S. military history to achieve the rank of four-star general and prior to her retirement in 2012 held a variety of positions within the U.S. Army, including Commanding General, U.S. Army Material Command (2008-2012). She is the President of First to Four LLC (leadership and mentoring services, 2012-present). She also serves as a member of the Board of Directors and Nominating and Corporate Governance Committee of L3 Technologies, Inc. (communication, electronic, sensor, and aerospace systems, 2013-present), Board of Directors and Nomination and Corporate Governance Committees of Kforce Inc. (professional staffing services, 2016-present) and Board of Directors of Automattic Inc. (software engineering, 2018-present). Previously, General Dunwoody served as a Member of the Advisory Board of certain Fidelity® funds (2018), a member of the Board of Directors and Audit and Sustainability and Corporate Responsibility Committees of Republic Services, Inc. (waste collection, disposal and recycling, 2013-2016). Ms. Dunwoody also serves on several boards for non-profit organizations, including as a member of the Board of Directors, Chair of the Nomination and Governance Committee and member of the Audit Committee of Logistics Management Institute (consulting non-profit, 2012-present), a member of the Board of Directors of the Army Historical Foundation (2015-present), a member of the Council of Trustees for the Association of the United States Army (advocacy non-profit, 2013-present) and a member of the Board of Trustees of Florida Institute of Technology (2015-present) and ThanksUSA (military family education non-profit, 2014-present).
John Engler (1948)
Year of Election or Appointment: 2014
Trustee
Mr. Engler also serves as Trustee of other Fidelity® funds. He serves on the board of directors for Universal Forest Products (manufacturer and distributor of wood and wood-alternative products, 2003-present) and K12 Inc. (technology-based education company, 2012-present). Previously, Mr. Engler served as interim president of Michigan State University (2018-2019), a Member of the Advisory Board of certain Fidelity® funds (2014-2016), president of the Business Roundtable (2011-2017), a trustee of The Munder Funds (2003-2014), president and CEO of the National Association of Manufacturers (2004-2011), member of the Board of Trustees of the Annie E. Casey Foundation (2004-2015), and as governor of Michigan (1991-2003). He is a past chairman of the National Governors Association.
Robert F. Gartland (1951)
Year of Election or Appointment: 2010
Trustee
Mr. Gartland also serves as Trustee of other Fidelity® funds. Mr. Gartland is Chairman and an investor in Gartland & Mellina Group Corp. (consulting, 2009-present). Previously, Mr. Gartland served as a partner and investor of Vietnam Partners LLC (investments and consulting, 2008-2011). Prior to his retirement, Mr. Gartland held a variety of positions at Morgan Stanley (financial services, 1979-2007), including Managing Director (1987-2007), and Chase Manhattan Bank (1975-1978).
Arthur E. Johnson (1947)
Year of Election or Appointment: 2008
Trustee
Chairman of the Independent Trustees
Mr. Johnson also serves as Trustee of other Fidelity® funds. Mr. Johnson serves as a member of the Board of Directors of Eaton Corporation plc (diversified power management, 2009-present) and Booz Allen Hamilton (management consulting, 2011-present). Prior to his retirement, Mr. Johnson served as Senior Vice President of Corporate Strategic Development of Lockheed Martin Corporation (defense contractor, 1999-2009). He previously served on the Board of Directors of IKON Office Solutions, Inc. (1999-2008), AGL Resources, Inc. (holding company, 2002-2016), and Delta Airlines (2005-2007). Mr. Arthur E. Johnson is not related to Ms. Abigail P. Johnson.
Michael E. Kenneally (1954)
Year of Election or Appointment: 2009
Trustee
Vice Chairman of the Independent Trustees
Mr. Kenneally also serves as Trustee of other Fidelity® funds. Prior to his retirement, Mr. Kenneally served as Chairman and Global Chief Executive Officer of Credit Suisse Asset Management. Before joining Credit Suisse, he was an Executive Vice President and Chief Investment Officer for Bank of America Corporation. Earlier roles at Bank of America included Director of Research, Senior Portfolio Manager and Research Analyst, and Mr. Kenneally was awarded the Chartered Financial Analyst (CFA) designation in 1991.
Marie L. Knowles (1946)
Year of Election or Appointment: 2001
Trustee
Ms. Knowles also serves as Trustee of other Fidelity® funds. Prior to Ms. Knowles' retirement in June 2000, she served as Executive Vice President and Chief Financial Officer of Atlantic Richfield Company (ARCO) (diversified energy, 1996-2000). From 1993 to 1996, she was a Senior Vice President of ARCO and President of ARCO Transportation Company (pipeline and tanker operations). Ms. Knowles currently serves as a Director and Chairman of the Audit Committee of McKesson Corporation (healthcare service, since 2002). Ms. Knowles is a member of the Board of the Santa Catalina Island Company (real estate, 2009-present). Ms. Knowles is a Member of the Investment Company Institute Board of Governors and a Member of the Governing Council of the Independent Directors Council (2014-present). She also serves as a member of the Advisory Board for the School of Engineering of the University of Southern California. Previously, Ms. Knowles served as a Director of Phelps Dodge Corporation (copper mining and manufacturing, 1994-2007), URS Corporation (engineering and construction, 2000-2003) and America West (airline, 1999-2002). Ms. Knowles previously served as Chairman (2015-2018) and Vice Chairman (2012-2015) of the Independent Trustees of certain Fidelity® funds.
Mark A. Murray (1954)
Year of Election or Appointment: 2016
Trustee
Mr. Murray also serves as Trustee of other Fidelity® funds. Mr. Murray is Vice Chairman (2013-present) of Meijer, Inc. (regional retail chain). Previously, Mr. Murray served as a Member of the Advisory Board of certain Fidelity® funds (2016) and as Co-Chief Executive Officer (2013-2016) and President (2006-2013) of Meijer, Inc. Mr. Murray serves as a member of the Board of Directors and Nuclear Review and Public Policy and Responsibility Committees of DTE Energy Company (diversified energy company, 2009-present). Mr. Murray also serves as a member of the Board of Directors of Spectrum Health (not-for-profit health system, 2015-present). Mr. Murray previously served as President of Grand Valley State University (2001-2006), Treasurer for the State of Michigan (1999-2001), Vice President of Finance and Administration for Michigan State University (1998-1999), and a member of the Board of Directors and Audit Committee and Chairman of the Nominating and Corporate Governance Committee of Universal Forest Products, Inc. (manufacturer and distributor of wood and wood-alternative products, 2004-2016). Mr. Murray is also a director or trustee of many community and professional organizations.
+ The information includes the Trustee's principal occupation during the last five years and other information relating to the experience, attributes, and skills relevant to the Trustee's qualifications to serve as a Trustee, which led to the conclusion that the Trustee should serve as a Trustee for the fund.
Advisory Board Members and Officers:
Correspondence intended for an officer may be sent to Fidelity Investments, 245 Summer Street, Boston, Massachusetts 02210. Officers appear below in alphabetical order.
Name, Year of Birth; Principal Occupation
Elizabeth Paige Baumann (1968)
Year of Election or Appointment: 2017
Anti-Money Laundering (AML) Officer
Ms. Baumann also serves as AML Officer of other funds. She is Chief AML Officer (2012-present) and Senior Vice President (2014-present) of FMR LLC (diversified financial services company) and is an employee of Fidelity Investments. Previously, Ms. Baumann served as AML Officer of the funds (2012-2016), and Vice President (2007-2014) and Deputy Anti-Money Laundering Officer (2007-2012) of FMR LLC.
Craig S. Brown (1977)
Year of Election or Appointment: 2019
Assistant Treasurer
Mr. Brown also serves as Assistant Treasurer of other funds. Mr. Brown is an employee of Fidelity Investments (2013-present).
John J. Burke III (1964)
Year of Election or Appointment: 2018
Chief Financial Officer
Mr. Burke also serves as Chief Financial Officer of other funds. Mr. Burke serves as Head of Investment Operations for Fidelity Fund and Investment Operations (2018-present) and is an employee of Fidelity Investments (1998-present). Previously Mr. Burke served as head of Asset Management Investment Operations (2012-2018).
William C. Coffey (1969)
Year of Election or Appointment: 2018
Secretary and Chief Legal Officer (CLO)
Mr. Coffey also serves as Secretary and CLO of other funds. Mr. Coffey serves as CLO, Secretary, and Senior Vice President of Fidelity Management & Research Company and FMR Co., Inc. (investment adviser firms, 2018-present); Secretary of Fidelity SelectCo, LLC and Fidelity Investments Money Management, Inc. (investment adviser firms, 2018-present); and CLO of Fidelity Management & Research (Hong Kong) Limited, FMR Investment Management (UK) Limited, and Fidelity Management & Research (Japan) Limited (investment adviser firms, 2018-present). He is Senior Vice President and Deputy General Counsel of FMR LLC (diversified financial services company, 2010-present), and is an employee of Fidelity Investments. Previously, Mr. Coffey served as Assistant Secretary of certain funds (2009-2018) and as Vice President and Associate General Counsel of FMR LLC (2005-2009).
Jonathan Davis (1968)
Year of Election or Appointment: 2010
Assistant Treasurer
Mr. Davis also serves as Assistant Treasurer of other funds. Mr. Davis serves as Assistant Treasurer of FMR Capital, Inc. (2017-present) and is an employee of Fidelity Investments. Previously, Mr. Davis served as Vice President and Associate General Counsel of FMR LLC (diversified financial services company, 2003-2010).
Adrien E. Deberghes (1967)
Year of Election or Appointment: 2010
Assistant Treasurer
Mr. Deberghes also serves as an officer of other funds. He serves as Assistant Treasurer of FMR Capital, Inc. (2017-present), Executive Vice President of Fidelity Investments Money Management, Inc. (FIMM) (investment adviser firm, 2016-present), and is an employee of Fidelity Investments (2008-present). Previously, Mr. Deberghes served as President and Treasurer of certain Fidelity® funds (2013-2018). Prior to joining Fidelity Investments, Mr. Deberghes was Senior Vice President of Mutual Fund Administration at State Street Corporation (2007-2008), Senior Director of Mutual Fund Administration at Investors Bank & Trust (2005-2007), and Director of Finance for Dunkin' Brands (2000-2005). Previously, Mr. Deberghes served in other fund officer roles.
Laura M. Del Prato (1964)
Year of Election or Appointment: 2018
President and Treasurer
Ms. Del Prato also serves as an officer of other funds. Ms. Del Prato is an employee of Fidelity Investments (2017-present). Prior to joining Fidelity Investments, Ms. Del Prato served as a Managing Director and Treasurer of the JPMorgan Mutual Funds (2014-2017). Prior to JPMorgan, Ms. Del Prato served as a partner at Cohen Fund Audit Services (accounting firm, 2012-2013) and KPMG LLP (accounting firm, 2004-2012).
Colm A. Hogan (1973)
Year of Election or Appointment: 2016
Assistant Treasurer
Mr. Hogan also serves as an officer of other funds. Mr. Hogan serves as Assistant Treasurer of FMR Capital, Inc. (2017-present) and is an employee of Fidelity Investments (2005-present). Previously, Mr. Hogan served as Assistant Treasurer of certain Fidelity® funds (2016-2018).
Chris Maher (1972)
Year of Election or Appointment: 2013
Assistant Treasurer
Mr. Maher serves as Assistant Treasurer of other funds. Mr. Maher is Vice President of Valuation Oversight, serves as Assistant Treasurer of FMR Capital, Inc. (2017-present), and is an employee of Fidelity Investments. Previously, Mr. Maher served as Vice President of Asset Management Compliance (2013), Vice President of the Program Management Group of FMR (investment adviser firm, 2010-2013), and Vice President of Valuation Oversight (2008-2010).
John B. McGinty, Jr. (1962)
Year of Election or Appointment: 2016
Chief Compliance Officer
Mr. McGinty also serves as Chief Compliance Officer of other funds. Mr. McGinty is Senior Vice President of Asset Management Compliance for Fidelity Investments and is an employee of Fidelity Investments (2016-present). Mr. McGinty previously served as Vice President, Senior Attorney at Eaton Vance Management (investment management firm, 2015-2016), and prior to Eaton Vance as global CCO for all firm operations and registered investment companies at GMO LLC (investment management firm, 2009-2015). Before joining GMO LLC, Mr. McGinty served as Senior Vice President, Deputy General Counsel for Fidelity Investments (2007-2009).
Jason P. Pogorelec (1975)
Year of Election or Appointment: 2015
Assistant Secretary
Mr. Pogorelec also serves as Assistant Secretary of other funds. Mr. Pogorelec serves as Vice President, Associate General Counsel (2010-present) and is an employee of Fidelity Investments (2006-present).
Nancy D. Prior (1967)
Year of Election or Appointment: 2014
Vice President
Ms. Prior also serves as Vice President of other funds. Ms. Prior serves as President Fixed Income, High Income/Emerging Market Debt and Multi Asset Class Strategies of FIAM LLC (2018-present), President (2016-present) and Director (2014-present) of Fidelity Investments Money Management, Inc. (FIMM) (investment adviser firm), President, Fixed Income (2014-present), and is an employee of Fidelity Investments (2002-present). Previously, Ms. Prior served as Vice Chairman of FIAM LLC (investment adviser firm, 2014-2018), a Director of FMR Investment Management (UK) Limited (investment adviser firm, 2015-2018), President Multi-Asset Class Strategies of FMR's Global Asset Allocation Division (2017-2018), Vice President of Fidelity's Money Market Funds (2012-2014), President, Money Market and Short Duration Bond Group of Fidelity Management & Research (FMR) (investment adviser firm, 2013-2014), President, Money Market Group of FMR (2011-2013), Managing Director of Research (2009-2011), Senior Vice President and Deputy General Counsel (2007-2009), and Assistant Secretary of certain Fidelity® funds (2008-2009).
Stacie M. Smith (1974)
Year of Election or Appointment: 2013
Assistant Treasurer
Ms. Smith also serves as an officer of other funds. Ms. Smith serves as Assistant Treasurer of FMR Capital, Inc. (2017-present), is an employee of Fidelity Investments (2009-present), and has served in other fund officer roles. Prior to joining Fidelity Investments, Ms. Smith served as Senior Audit Manager of Ernst & Young LLP (accounting firm, 1996-2009). Previously, Ms. Smith served as Assistant Treasurer (2013-2018) and Deputy Treasurer (2013-2016) of certain Fidelity® funds.
Marc L. Spector (1972)
Year of Election or Appointment: 2016
Deputy Treasurer
Mr. Spector also serves as an officer of other funds. Mr. Spector serves as Assistant Treasurer of FMR Capital, Inc. (2017-present) and is an employee of Fidelity Investments (2016-present). Prior to joining Fidelity Investments, Mr. Spector served as Director at the Siegfried Group (accounting firm, 2013-2016), and prior to Siegfried Group as audit senior manager at Deloitte & Touche (accounting firm, 2005-2013).
Jim Wegmann (1979)
Year of Election or Appointment: 2019
Assistant Treasurer
Mr. Wegmann also serves as Assistant Treasurer of other funds. Mr. Wegmann is an employee of Fidelity Investments (2011-present).
Shareholder Expense Example
As a shareholder of the Fund, you incur two types of costs: (1) transaction costs and (2) ongoing costs, including management fees, distribution and/or service (12b-1) fees and other Fund expenses. This Example is intended to help you understand your ongoing costs (in dollars) of investing in the Fund and to compare these costs with the ongoing costs of investing in other mutual funds.
The Example is based on an investment of $1,000 invested at the beginning of the period and held for the entire period (July 1, 2018 to December 31, 2018).
Actual Expenses
The first line of the accompanying table for each class of the Fund provides information about actual account values and actual expenses. You may use the information in this line, together with the amount you invested, to estimate the expenses that you paid over the period. Simply divide your account value by $1,000.00 (for example, an $8,600 account value divided by $1,000.00 = 8.6), then multiply the result by the number in the first line for a class of the Fund under the heading entitled "Expenses Paid During Period" to estimate the expenses you paid on your account during this period. The estimate of expenses does not include any fees or other expenses of any variable annuity or variable life insurance product. If they were, the estimate of expenses you paid during the period would be higher, and your ending account value would be lower. In addition, the Fund, as a shareholder in the underlying Fidelity Central Funds, will indirectly bear its pro-rata share of the fees and expenses incurred by the underlying Fidelity Central Funds. These fees and expenses are not included in the Fund's annualized expense ratio used to calculate the expense estimate in the table below.
Hypothetical Example for Comparison Purposes
The second line of the accompanying table for each class of the Fund provides information about hypothetical account values and hypothetical expenses based on a Class' actual expense ratio and an assumed rate of return of 5% per year before expenses, which is not the Class' actual return. The hypothetical account values and expenses may not be used to estimate the actual ending account balance or expenses you paid for the period. You may use this information to compare the ongoing costs of investing in the Fund and other funds. To do so, compare this 5% hypothetical example with the 5% hypothetical examples that appear in the shareholder reports of the other funds. The estimate of expenses does not include any fees or other expenses of any variable annuity or variable life insurance product. If they were, the estimate of expenses you paid during the period would be higher, and your ending account value would be lower. In addition, the Fund, as a shareholder in the underlying Fidelity Central Funds, will indirectly bear its pro-rata share of the fees and expenses incurred by the underlying Fidelity Central Funds. These fees and expenses are not included in the Fund's annualized expense ratio used to calculate the expense estimate in the table below.
Please note that the expenses shown in the table are meant to highlight your ongoing costs only and do not reflect any transaction costs. Therefore, the second line of the table is useful in comparing ongoing costs only, and will not help you determine the relative total costs of owning different funds.
| | Annualized Expense Ratio-A | Beginning
Account Value
July 1, 2018 | Ending
Account Value
December 31, 2018 | Expenses Paid
During Period-B
July 1, 2018
to December 31, 2018 |
| Initial Class | .67% | | | |
| Actual | | $1,000.00 | $983.20 | $3.35 |
| Hypothetical-C | | $1,000.00 | $1,021.83 | $3.41 |
| Service Class | .77% | | | |
| Actual | | $1,000.00 | $982.10 | $3.85 |
| Hypothetical-C | | $1,000.00 | $1,021.32 | $3.92 |
| Service Class 2 | .91% | | | |
| Actual | | $1,000.00 | $981.60 | $4.55 |
| Hypothetical-C | | $1,000.00 | $1,020.62 | $4.63 |
| Investor Class | .70% | | | |
| Actual | | $1,000.00 | $982.70 | $3.50 |
| Hypothetical-C | | $1,000.00 | $1,021.68 | $3.57 |
A Annualized expense ratio reflects expenses net of applicable fee waivers.
B Expenses are equal to each Class' annualized expense ratio, multiplied by the average account value over the period, multiplied by 184/365 (to reflect the one-half year period). The fees and expenses of the underlying Fidelity Central Funds in which the Fund invests are not included in each Class' annualized expense ratio. In addition to the expenses noted above, the Fund also indirectly bears its proportional share of the expenses of the underlying Fidelity Central Funds. Annualized expenses of the underlying non-money market Fidelity Central Funds as of their most recent fiscal half year were .01%.
C 5% return per year before expenses
Distributions (Unaudited)
A total of 8.97% of the dividends distributed during the fiscal year was derived from interest on U.S. Government securities which is generally exempt from state income tax.
Initial Class, Service Class, Service Class 2, and Investor Class designate 1% of the dividend distributed in December 2018, during the fiscal year as qualifying for the dividends–received deduction for corporate shareholders.
Board Approval of Investment Advisory Contracts and Management Fees
VIP Strategic Income Portfolio
Each year, the Board of Trustees, including the Independent Trustees (together, the Board), votes on the renewal of the management contract with Fidelity Management & Research Company (FMR) and the sub-advisory agreements (together, the Advisory Contracts) for the fund. FMR and the sub-advisers are referred to herein as the Investment Advisers. The Board, assisted by the advice of fund counsel and Independent Trustees' counsel, requests and considers a broad range of information relevant to the renewal of the Advisory Contracts throughout the year.
The Board meets regularly and, at each of its meetings, covers an extensive agenda of topics and materials and considers factors that are relevant to its annual consideration of the renewal of the fund's Advisory Contracts, including the services and support provided to the fund and its shareholders. The Board has established four standing committees (Committees) — Operations, Audit, Fair Valuation, and Governance and Nominating — each composed of and chaired by Independent Trustees with varying backgrounds, to which the Board has assigned specific subject matter responsibilities in order to enhance effective decision-making by the Board. The Operations Committee, of which all of the Independent Trustees are members, meets regularly throughout the year and considers, among other matters, information specifically related to the annual consideration of the renewal of the fund's Advisory Contracts. The Board, acting directly and through its Committees, requests and receives information concerning the annual consideration of the renewal of the fund's Advisory Contracts. The Board also meets as needed to review matters specifically related to the Board's annual consideration of the renewal of the Advisory Contracts. Members of the Board may also meet with trustees of other Fidelity funds through joint ad hoc committees to discuss certain matters relevant to all of the Fidelity funds.
At its September 2018 meeting, the Board unanimously determined to renew the fund's Advisory Contracts. In reaching its determination, the Board considered all factors it believed relevant, including (i) the nature, extent, and quality of the services to be provided to the fund and its shareholders (including the investment performance of the fund); (ii) the competitiveness of the fund's management fee and total expense ratio relative to peer funds; (iii) the total costs of the services to be provided by and the profits to be realized by Fidelity from its relationships with the fund; and (iv) the extent to which, if any, economies of scale exist and would be realized as the fund grows, and whether any economies of scale are appropriately shared with fund shareholders.
In considering whether to renew the Advisory Contracts for the fund, the Board reached a determination, with the assistance of fund counsel and Independent Trustees' counsel and through the exercise of its business judgment, that the renewal of the Advisory Contracts was in the best interests of the fund and its shareholders and that the compensation payable under the Advisory Contracts was fair and reasonable. The Board's decision to renew the Advisory Contracts was not based on any single factor, but rather was based on a comprehensive consideration of all the information provided to the Board at its meetings throughout the year. The Board, in reaching its determination to renew the Advisory Contracts, was aware that shareholders of the fund have a broad range of investment choices available to them, including a wide choice among funds offered by Fidelity's competitors, and that the fund's shareholders, who have the opportunity to review and weigh the disclosure provided by the fund in its prospectus and other public disclosures, have chosen to invest in this fund, which is part of the Fidelity family of funds.
Nature, Extent, and Quality of Services Provided. The Board considered Fidelity's staffing as it relates to the fund, including the backgrounds of investment personnel of Fidelity, and also considered the fund's investment objective, strategies, and related investment philosophy. The Independent Trustees also had discussions with senior management of Fidelity's investment operations and investment groups. The Board considered the structure of the investment personnel compensation program and whether this structure provides appropriate incentives to act in the best interests of the fund. Additionally, the Board considered the portfolio managers' investments, if any, in the funds that they manage.
Resources Dedicated to Investment Management and Support Services. The Board reviewed the general qualifications and capabilities of Fidelity's investment staff, including its size, education, experience, and resources, as well as Fidelity's approach to recruiting, managing, and compensating investment personnel. The Board noted that Fidelity has continued to increase the resources devoted to non-U.S. offices, including expansion of Fidelity's global investment organization. The Board also noted that Fidelity's analysts have extensive resources, tools and capabilities that allow them to conduct sophisticated quantitative and fundamental analysis, as well as credit analysis of issuers, counterparties and guarantors. Further, the Board considered that Fidelity's investment professionals have sufficient access to global information and data so as to provide competitive investment results over time, and that those professionals also have access to sophisticated tools that permit them to assess portfolio construction and risk and performance attribution characteristics continuously, as well as to transmit new information and research conclusions rapidly around the world. Additionally, in its deliberations, the Board considered Fidelity's trading, risk management, compliance, and technology and operations capabilities and resources, which are integral parts of the investment management process.
Shareholder and Administrative Services. The Board considered (i) the nature, extent, quality, and cost of advisory, administrative, and shareholder services performed by the Investment Advisers and their affiliates under the Advisory Contracts and under separate agreements covering transfer agency, pricing and bookkeeping, and securities lending services for the fund; (ii) the nature and extent of the supervision of third party service providers, principally custodians, subcustodians, and pricing vendors; and (iii) the resources devoted to, and the record of compliance with, the fund's compliance policies and procedures. The Board also reviewed the allocation of fund brokerage, including allocations to brokers affiliated with the Investment Advisers, the use of brokerage commissions to pay fund expenses, and the use of "soft" commission dollars to pay for research services.
The Board noted that the growth of fund assets over time across the complex allows Fidelity to reinvest in the development of services designed to enhance the value and convenience of the Fidelity funds as investment vehicles. These services include 24-hour access to account information and market information through telephone representatives and over the Internet, investor education materials and asset allocation tools, and the expanded availability of Fidelity Investor Centers.
Investment in a Large Fund Family. The Board considered the benefits to shareholders of investing in a Fidelity fund, including the benefits of investing in a fund that is part of a large family of funds offering a variety of investment disciplines and providing a large variety of mutual fund investor services. The Board noted that Fidelity had taken, or had made recommendations that resulted in the Fidelity funds taking, a number of actions over the previous year that benefited particular funds, including: (i) continuing to dedicate additional resources to Fidelity's investment research process, which includes meetings with management of issuers of securities in which the funds invest, and to the support of the senior management team that oversees asset management; (ii) continuing efforts to enhance Fidelity's global research capabilities; (iii) launching new funds and making other enhancements to meet client needs; (iv) launching new share classes of existing funds; (v) eliminating purchase minimums and broadening eligibility requirements for certain funds and share classes; (vi) reducing management fees and total expenses for certain growth equity funds and index funds; (vii) lowering expense caps for certain existing funds and classes, and converting certain voluntary expense caps to contractual caps, to reduce expenses borne by shareholders; (viii) eliminating short-term redemption fees for funds that had such fees; (ix) rationalizing product lines and gaining increased efficiencies from fund mergers and share class consolidations; (x) continuing to develop, acquire and implement systems and technology to improve services to the funds and shareholders, strengthen information security, and increase efficiency; and (xi) continuing to implement enhancements to further strengthen Fidelity's product line to increase investors' probability of success in achieving their investment goals, including retirement income goals.
Investment Performance. The Board considered whether the fund has operated in accordance with its investment objective, as well as its record of compliance with its investment restrictions and its performance history. The Board noted that there was a portfolio management change for the fund in December 2017.
The Board took into account discussions that occur at Board meetings throughout the year with representatives of the Investment Advisers about fund investment performance. In this regard the Board noted that as part of regularly scheduled fund reviews and other reports to the Board on fund performance, the Board considers annualized return information for the fund for different time periods, measured against one or more appropriate securities market indices, including a customized blended index that reflects the respective weights of the fund's asset classes (each a "benchmark index") and a peer group of funds with similar objectives ("peer group"), if any. In its evaluation of fund investment performance at meetings throughout the year, the Board gave particular attention to information indicating underperformance of certain Fidelity funds for specific time periods and discussed with the Investment Advisers the reasons for such underperformance.
In addition to reviewing absolute and relative fund performance, the Independent Trustees periodically consider the appropriateness of fund performance metrics in evaluating the results achieved. In general, the Independent Trustees believe that fund performance should be evaluated based on gross performance (before fees and expenses but after transaction costs) compared to appropriate benchmark indices, over appropriate time periods that may include full market cycles, and on net performance (after fees and expenses) compared to peer groups, as applicable, over the same periods, taking into account relevant factors including the following: general market conditions; expectations for interest rate levels and credit conditions; issuer-specific information including credit quality; and fund cash flows and other factors. Depending on the circumstances, the Independent Trustees may be satisfied with a fund's performance notwithstanding that it lags its benchmark index or peer group for certain periods.
The Independent Trustees recognize that shareholders evaluate performance on a net basis over their own holding periods, for which one-, three-, and five-year periods are often used as a proxy. For this reason, the performance information reviewed by the Board also included net cumulative calendar year total return information for the fund and an appropriate benchmark index and peer group for the most recent one-, three-, and five-year periods.
Based on its review, the Board concluded that the nature, extent, and quality of services provided to the fund under the Advisory Contracts should continue to benefit the shareholders of the fund.
Competitiveness of Management Fee and Total Expense Ratio. The Board considered the fund's management fee and total expense ratio compared to "mapped groups" of competitive funds and classes created for the purpose of facilitating the Trustees' competitive analysis of management fees and total expenses. Fidelity creates "mapped groups" by combining similar Lipper investment objective categories that have comparable investment mandates. Combining Lipper investment objective categories aids the Board's management fee and total expense ratio comparisons by broadening the competitive group used for comparison.
Management Fee. The Board considered two proprietary management fee comparisons for the 12-month periods shown in basis points (BP) in the chart below. The group of Lipper funds used by the Board for management fee comparisons is referred to below as the "Total Mapped Group." The Total Mapped Group comparison focuses on a fund's standing in terms of gross management fees before expense reimbursements or caps relative to the total universe of funds with comparable investment mandates, regardless of whether their management fee structures also are comparable. Funds with comparable investment mandates offer exposure to similar types of securities. Funds with comparable management fee structures have similar management fee contractual arrangements (
e.g., flat rate charged for advisory services, all-inclusive fee rate,
etc.). "TMG %" represents the percentage of funds in the Total Mapped Group that had management fees that were lower than the fund's. For example, a hypothetical TMG % of 20% would mean that 80% of the funds in the Total Mapped Group had higher, and 20% had lower, management fees than the fund. The fund's actual TMG %s and the number of funds in the Total Mapped Group are in the chart below. The "Asset-Size Peer Group" (ASPG) comparison focuses on a fund's standing relative to a subset of non-Fidelity funds within the Total Mapped Group that are similar in size and management fee structure. For example, if a fund is in the first quartile of the ASPG, the fund's management fee ranks in the least expensive or lowest 25% of funds in the ASPG. The ASPG represents at least 15% of the funds in the Total Mapped Group with comparable asset size and management fee structures, subject to a minimum of 50 funds (or all funds in the Total Mapped Group if fewer than 50). Additional information, such as the ASPG quartile in which the fund's management fee rate ranked, is also included in the chart and was considered by the Board.
VIP Strategic Income Portfolio

The Board noted that the fund's management fee rate ranked below the median of its Total Mapped Group and below the median of its ASPG for 2017.
The Board noted that it and the boards of other Fidelity funds formed an ad hoc Committee on Group Fee, which meets periodically, to conduct an in-depth review of the "group fee" component of the management fee of funds with such management fee structures. The Committee's focus included the mechanics of the group fee, the competitive landscape of group fee structures, Fidelity funds with no group fee component and investment products not included in group fee assets. The Board also considered that, for funds subject to the group fee, FMR agreed to voluntarily waive fees over a specified period of time in amounts designed to account for assets converted from certain funds to certain collective investment trusts.
Based on its review, the Board concluded that the fund's management fee is fair and reasonable in light of the services that the fund receives and the other factors considered.
Total Expense Ratio. In its review of each class's total expense ratio, the Board considered the fund's management fee rate as well as other fund or class expenses, as applicable, such as transfer agent fees, pricing and bookkeeping fees, fund-paid 12b-1 fees, and custodial, legal, and audit fees. The Board also noted that Fidelity may agree to waive fees and expenses from time to time, and the extent to which, if any, it has done so for the fund. As part of its review, the Board also considered the current and historical total expense ratios of each class of the fund compared to competitive fund median expenses. Each class of the fund is compared to those funds and classes in the Total Mapped Group (used by the Board for management fee comparisons) that have a similar sales load structure.
The Board noted that the total expense ratio of each of Initial Class, Investor Class, and Service Class ranked below the competitive median for 2017 and the total expense ratio of Service Class 2 ranked above the competitive median for 2017. The Board considered that, in general, various factors can affect total expense ratios. The Board noted that the total expense ratio of Service Class 2 was above the competitive median because of its 12b-1 fees and that excluding 12b-1 fees of both the class and competitor classes, the total expense ratio of Service Class 2 ranked below the median. The Board noted that the fund offers multiple classes, each of which has a different 12b-1 fee structure, and that the multiple structures are intended to offer a range of pricing options for the intermediary market. The Board also noted that the total expense ratios of the classes vary primarily by the level of their 12b-1 fees, although differences in transfer agent fees may also cause expenses to vary from class to class.
Fees Charged to Other Fidelity Clients. The Board also considered Fidelity fee structures and other information with respect to clients of Fidelity, such as other funds advised or subadvised by Fidelity, pension plan clients, and other institutional clients with similar mandates. The Board noted that a joint ad hoc committee created by it and the boards of other Fidelity funds periodically reviews and compares Fidelity's institutional investment advisory business with its business of providing services to the Fidelity funds and also noted the most recent findings of the committee. The Board noted that the committee's review included a consideration of the differences in services provided, fees charged, and costs incurred, as well as competition in the markets serving the different categories of clients.
Based on its review of total expense ratios and fees charged to other Fidelity clients, the Board concluded that the total expense ratio of each class of the fund was reasonable in light of the services that the fund and its shareholders receive and the other factors considered.
Costs of the Services and Profitability. The Board considered the revenues earned and the expenses incurred by Fidelity in conducting the business of developing, marketing, distributing, managing, administering and servicing the fund and servicing the fund's shareholders. The Board also considered the level of Fidelity's profits in respect of all the Fidelity funds.
On an annual basis, Fidelity presents to the Board information about the profitability of its relationships with the fund. Fidelity calculates profitability information for each fund, as well as aggregate profitability information for groups of Fidelity funds and all Fidelity funds, using a series of detailed revenue and cost allocation methodologies which originate with the books and records of Fidelity on which Fidelity's audited financial statements are based. The Audit Committee of the Board reviews any significant changes from the prior year's methodologies.
PricewaterhouseCoopers LLP (PwC), auditor to Fidelity and certain Fidelity funds, has been engaged annually by the Board as part of the Board's assessment of Fidelity's profitability analysis. PwC's engagement includes the review and assessment of the methodologies used by Fidelity in determining the revenues and expenses attributable to Fidelity's mutual fund business, and completion of agreed-upon procedures in respect of the mathematical accuracy of the fund profitability information and its conformity to established allocation methodologies. After considering PwC's reports issued under the engagement and information provided by Fidelity, the Board concluded that while other allocation methods may also be reasonable, Fidelity's profitability methodologies are reasonable in all material respects.
The Board also reviewed Fidelity's non-fund businesses and potential indirect benefits such businesses may have received as a result of their association with Fidelity's mutual fund business (i.e., fall-out benefits) as well as cases where Fidelity's affiliates may benefit from the fund's business. The Board noted that changes to fall-out benefits year-over-year reflect business developments at Fidelity's various businesses.
The Board considered the costs of the services provided by and the profits realized by Fidelity in connection with the operation of the fund and was satisfied that the profitability was not excessive.
Economies of Scale. The Board considered whether there have been economies of scale in respect of the management of the Fidelity funds, whether the Fidelity funds (including the fund) have appropriately benefited from any such economies of scale, and whether there is potential for realization of any further economies of scale. The Board considered the extent to which the fund will benefit from economies of scale as assets grow through increased services to the fund, through waivers or reimbursements, or through fee or expense ratio reductions. The Board also noted that a committee (the Economies of Scale Committee) created by it and the boards of other Fidelity funds periodically analyzes whether Fidelity attains economies of scale in respect of the management and servicing of the Fidelity funds, whether the Fidelity funds have appropriately benefited from such economies of scale, and whether there is potential for realization of any further economies of scale.
The Board recognized that the fund's management contract incorporates a "group fee" structure, which provides for lower group fee rates as total group assets increase, and for higher group fee rates as total group assets decrease (with "group assets" defined to include fund assets under FMR's management plus the assets of sector funds previously under FMR's management). FMR calculates the group fee rates based on a tiered asset "breakpoint" schedule that varies based on asset class. The Board considered that the group fee is designed to deliver the benefits of economies of scale to fund shareholders when total Fidelity fund assets increase, even if assets of any particular fund are unchanged or have declined, because some portion of Fidelity's costs are attributable to services provided to all Fidelity funds, and all funds benefit if those costs can be allocated among more assets. The Board concluded that, given the group fee structure, fund shareholders will benefit from lower management fees as group assets increase at the fund complex level, regardless of whether Fidelity achieves any such economies of scale.
The Board concluded, taking into account the analysis of the Economies of Scale Committee, that economies of scale, if any, are being appropriately shared between fund shareholders and Fidelity.
Additional Information Requested by the Board. In order to develop fully the factual basis for consideration of the Fidelity funds' advisory contracts, the Board requested and received additional information on certain topics, including: (i) Fidelity's fund profitability methodology, profitability trends for certain funds, the allocation of various costs to different funds, and the impact of certain factors on fund profitability results; (ii) portfolio manager changes that have occurred during the past year and the amount of the investment that each portfolio manager has made in the Fidelity fund(s) that he or she manages; (iii) Fidelity's compensation structure for portfolio managers, research analysts, and other key personnel, including its effects on fund profitability, the rationale for the compensation structure, and the extent to which current market conditions have affected retention and recruitment; (iv) the arrangements with and compensation paid to certain fund sub-advisers on behalf of the Fidelity funds and the treatment of such compensation within Fidelity's fund profitability methodology; (v) the terms of Fidelity's voluntary expense limitation agreements; (vi) the methodology with respect to competitive fund data and peer group classifications; (vii) Fidelity's transfer agent fee, expense, and service structures for different funds and classes relative to competitive trends, and the impact of the increased use of omnibus accounts; (viii) new developments in the retail and institutional marketplaces and the competitive positioning of the funds relative to other investment products and services; (ix) the impact of recent changes to the money market fund landscape, including the full implementation of money market fund reform and rising interest rates, on Fidelity's money market funds; (x) the funds' share class structures and distribution channels; and (xi) explanations regarding the relative total expense ratios of certain funds and classes, total expense competitive trends and methodologies for total expense competitive comparisons, and actions that might be taken by Fidelity to reduce total expense ratios for certain classes. In addition, the Board considered its discussions with Fidelity throughout the year regarding enhanced information security initiatives and the funds' fair valuation policies.
Based on its evaluation of all of the conclusions noted above, and after considering all factors it believed relevant, the Board concluded that the advisory fee arrangements are fair and reasonable, and that the fund's Advisory Contracts should be renewed.
VIPSI-ANN-0219
1.796350.116
Fidelity® Variable Insurance Products:
Freedom Funds - Income, 2005, 2010, 2015, 2020, 2025, 2030, 2035, 2040, 2045, 2050
Annual Report December 31, 2018 |
|
Beginning on January 1, 2021, as permitted by regulations adopted by the Securities and Exchange Commission, and if your insurance carrier elects to participate, you may not be receiving paper copies of the Fund’s shareholder reports from the insurance company that offers your variable insurance product unless you specifically request paper copies from your financial professional or the administrator of your variable insurance product. Instead, the reports will be made available on a website, and you will be notified by mail each time a report is posted and provided with a website link to access the report.
If you already elected to receive shareholder reports electronically, you will not be affected by this change and you need not take any action. You may elect to receive shareholder reports and other communications from the Fund electronically, by contacting your financial professional or the administrator of your variable insurance product. If you own a Fidelity-administered variable insurance product, please visit fidelity.com/mailpreferences to make your election or call 1-800-343-3548.
You may elect to receive all future reports in paper free of charge. If you wish to continue receiving paper copies of your shareholder reports, you may contact your financial professional or the administrator of your variable insurance product. If you own a Fidelity-administered variable insurance product, please visit fidelity.com/mailpreferences to make your election or call 1-800-343-3548. Your election to receive reports in paper will apply to all funds available under your variable insurance product.
Contents
To view a fund's proxy voting guidelines and proxy voting record for the 12-month period ended June 30, visit http://www.fidelity.com/proxyvotingresults or visit the Securities and Exchange Commission's (SEC) web site at http://www.sec.gov.
You may also call 1-877-208-0098 to request a free copy of the proxy voting guidelines.
Fidelity® Variable Insurance Products are separate account options which are purchased through a variable insurance contract.
Standard & Poor's, S&P and S&P 500 are registered service marks of The McGraw-Hill Companies, Inc. and have been licensed for use by Fidelity Distributors Corporation.
Other third-party marks appearing herein are the property of their respective owners.
All other marks appearing herein are registered or unregistered trademarks or service marks of FMR LLC or an affiliated company. © 2019 FMR LLC. All rights reserved.
This report and the financial statements contained herein are submitted for the general information of the shareholders of the Funds. This report is not authorized for distribution to prospective investors in the Funds unless preceded or accompanied by an effective prospectus.
A fund files its complete schedule of portfolio holdings with the SEC for the first and third quarters of each fiscal year on Form N-Q. Forms N-Q are available on the SEC’s web site at http://www.sec.gov. A fund's Forms N-Q may be reviewed and copied at the SEC’s Public Reference Room in Washington, DC. Information regarding the operation of the SEC's Public Reference Room may be obtained by calling 1-800-SEC-0330.
For a complete list of a fund's portfolio holdings, view the most recent holdings listing, semiannual report, or annual report on Fidelity's web site at http://www.fidelity.com, http://www.institutional.fidelity.com, or http://www.401k.com, as applicable.
NOT FDIC INSURED •MAY LOSE VALUE •NO BANK GUARANTEE
Neither the Funds nor Fidelity Distributors Corporation is a bank.
VIP Freedom Income Portfolio℠
Performance: The Bottom Line
Performance numbers are net of all underlying fund operating expenses, but do not include any insurance charges imposed by your insurance company’s separate account. If performance information included the effect of these additional charges, the total returns would have been lower.
Average annual total return reflects the change in the value of an investment, assuming reinvestment of distributions from dividend income and capital gains (the profits earned upon the sale of securities that have grown in value, if any) and assuming a constant rate of performance each year. During periods of reimbursement by Fidelity, a fund’s total return will be greater than it would be had the reimbursement not occurred. Performance numbers are net of all underlying fund operating expenses, but do not include any insurance charges imposed by your insurance company’s separate account. If performance information included the effect of these additional charges, the total returns would have been lower. How a fund did yesterday is no guarantee of how it will do tomorrow.
Average Annual Total Returns
| Periods ended December 31, 2018 | Past 1 year | Past 5 years | Past 10 years |
| Initial Class | (1.96)% | 2.83% | 4.96% |
| Service Class | (2.12)% | 2.72% | 4.86% |
| Service Class 2 | (2.27)% | 2.58% | 4.70% |
$10,000 Over 10 Years
Let's say hypothetically that $10,000 was invested in VIP Freedom Income Portfolio℠ - Initial Class on December 31, 2008.
The chart shows how the value of your investment would have changed, and also shows how the Bloomberg Barclays U.S. Aggregate Bond Index performed over the same period.
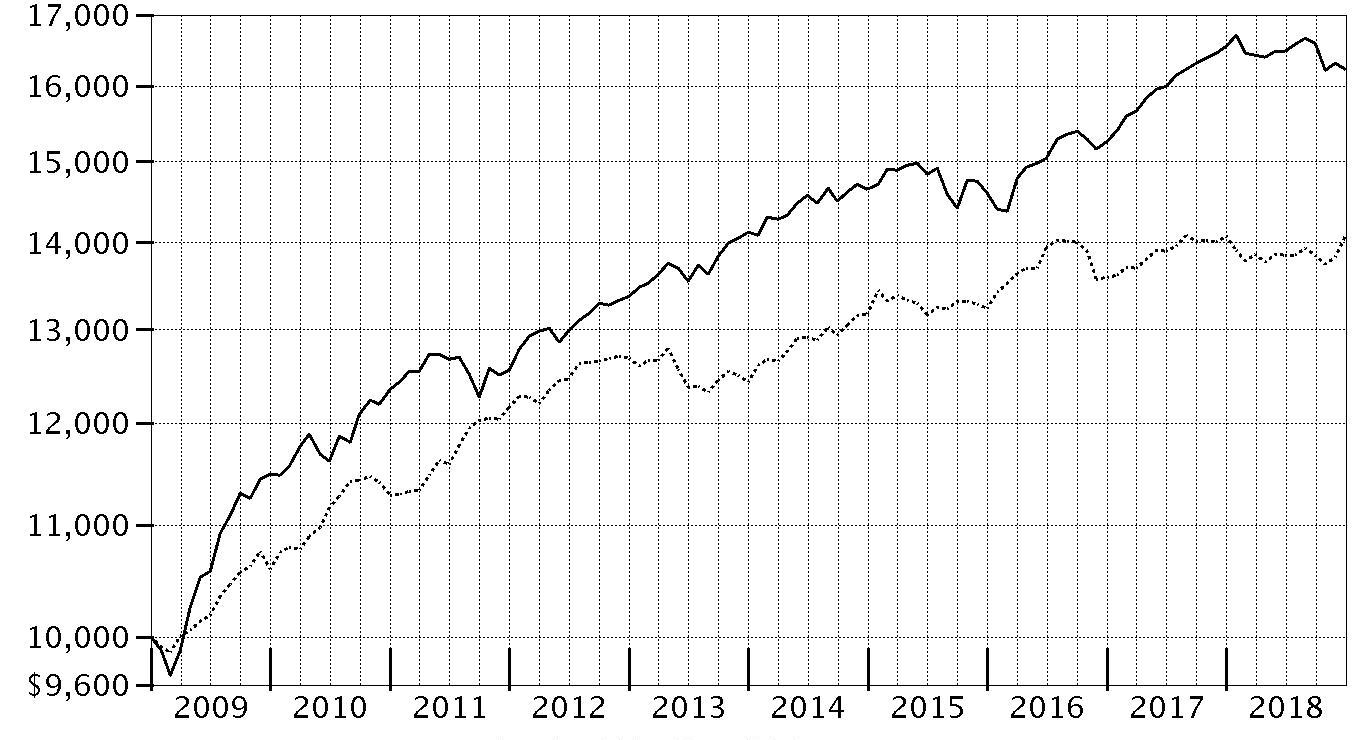
| Period Ending Values |
| $16,230 | VIP Freedom Income Portfolio℠ - Initial Class |
| $14,075 | Bloomberg Barclays U.S. Aggregate Bond Index |
VIP Freedom 2005 Portfolio℠
Performance: The Bottom Line
Performance numbers are net of all underlying fund operating expenses, but do not include any insurance charges imposed by your insurance company’s separate account. If performance information included the effect of these additional charges, the total returns would have been lower.
Average annual total return reflects the change in the value of an investment, assuming reinvestment of distributions from dividend income and capital gains (the profits earned upon the sale of securities that have grown in value, if any) and assuming a constant rate of performance each year. During periods of reimbursement by Fidelity, a fund’s total return will be greater than it would be had the reimbursement not occurred. Performance numbers are net of all underlying fund operating expenses, but do not include any insurance charges imposed by your insurance company’s separate account. If performance information included the effect of these additional charges, the total returns would have been lower. How a fund did yesterday is no guarantee of how it will do tomorrow.
Average Annual Total Returns
| Periods ended December 31, 2018 | Past 1 year | Past 5 years | Past 10 years |
| Initial Class | (2.95)% | 3.32% | 6.87% |
| Service Class | (3.01)% | 3.21% | 6.76% |
| Service Class 2 | (3.24)% | 3.06% | 6.60% |
$10,000 Over 10 Years
Let's say hypothetically that $10,000 was invested in VIP Freedom 2005 Portfolio℠ - Initial Class on December 31, 2008.
The chart shows how the value of your investment would have changed, and also shows how the Bloomberg Barclays U.S. Aggregate Bond Index performed over the same period.
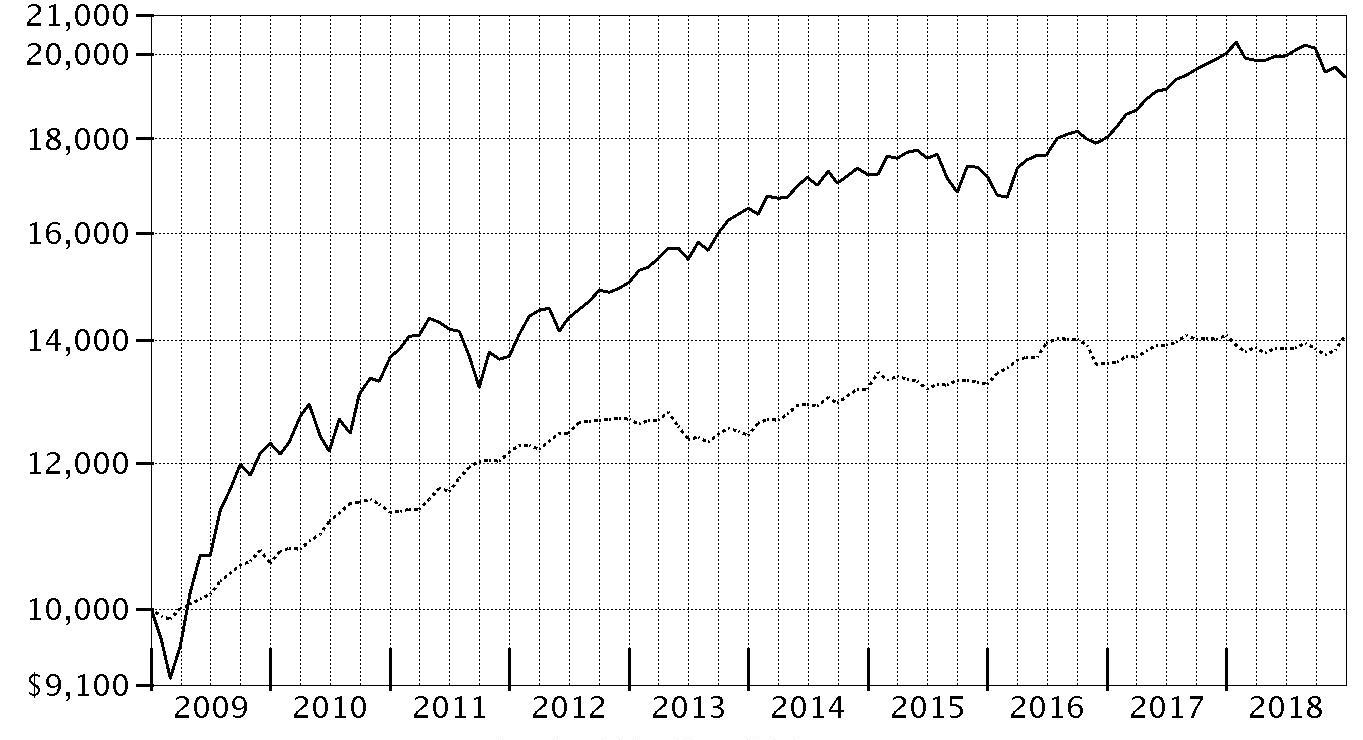
| Period Ending Values |
| $19,425 | VIP Freedom 2005 Portfolio℠ - Initial Class |
| $14,075 | Bloomberg Barclays U.S. Aggregate Bond Index |
VIP Freedom 2010 Portfolio℠
Performance: The Bottom Line
Performance numbers are net of all underlying fund operating expenses, but do not include any insurance charges imposed by your insurance company’s separate account. If performance information included the effect of these additional charges, the total returns would have been lower.
Average annual total return reflects the change in the value of an investment, assuming reinvestment of distributions from dividend income and capital gains (the profits earned upon the sale of securities that have grown in value, if any) and assuming a constant rate of performance each year. During periods of reimbursement by Fidelity, a fund’s total return will be greater than it would be had the reimbursement not occurred. Performance numbers are net of all underlying fund operating expenses, but do not include any insurance charges imposed by your insurance company’s separate account. If performance information included the effect of these additional charges, the total returns would have been lower. How a fund did yesterday is no guarantee of how it will do tomorrow.
Average Annual Total Returns
| Periods ended December 31, 2018 | Past 1 year | Past 5 years | Past 10 years |
| Initial Class | (4.00)% | 3.59% | 7.81% |
| Service Class | (4.10)% | 3.48% | 7.69% |
| Service Class 2 | (4.26)% | 3.33% | 7.53% |
$10,000 Over 10 Years
Let's say hypothetically that $10,000 was invested in VIP Freedom 2010 Portfolio℠ - Initial Class on December 31, 2008.
The chart shows how the value of your investment would have changed, and also shows how the Bloomberg Barclays U.S. Aggregate Bond Index performed over the same period.

| Period Ending Values |
| $21,204 | VIP Freedom 2010 Portfolio℠ - Initial Class |
| $14,075 | Bloomberg Barclays U.S. Aggregate Bond Index |
VIP Freedom 2015 Portfolio℠
Performance: The Bottom Line
Performance numbers are net of all underlying fund operating expenses, but do not include any insurance charges imposed by your insurance company’s separate account. If performance information included the effect of these additional charges, the total returns would have been lower.
Average annual total return reflects the change in the value of an investment, assuming reinvestment of distributions from dividend income and capital gains (the profits earned upon the sale of securities that have grown in value, if any) and assuming a constant rate of performance each year. During periods of reimbursement by Fidelity, a fund’s total return will be greater than it would be had the reimbursement not occurred. Performance numbers are net of all underlying fund operating expenses, but do not include any insurance charges imposed by your insurance company’s separate account. If performance information included the effect of these additional charges, the total returns would have been lower. How a fund did yesterday is no guarantee of how it will do tomorrow.
Average Annual Total Returns
| Periods ended December 31, 2018 | Past 1 year | Past 5 years | Past 10 years |
| Initial Class | (5.07)% | 3.85% | 8.15% |
| Service Class | (5.11)% | 3.75% | 8.04% |
| Service Class 2 | (5.28)% | 3.59% | 7.89% |
$10,000 Over 10 Years
Let's say hypothetically that $10,000 was invested in VIP Freedom 2015 Portfolio℠ - Initial Class on December 31, 2008.
The chart shows how the value of your investment would have changed, and also shows how the S&P 500® Index performed over the same period.

| Period Ending Values |
| $21,891 | VIP Freedom 2015 Portfolio℠ - Initial Class |
| $14,075 | Bloomberg Barclays U.S. Aggregate Bond Index |
| $34,303 | S&P 500® Index |
Going forward, the fund’s performance will be compared to the Bloomberg Barclays U.S. Aggregate Bond Index, rather than the S&P 500® Index. The Bloomberg Barclays U.S. Aggregate Bond Index more closely represents the fund’s investment strategy, as fixed-income and short-term funds currently represent the majority of the fund’s assets.
VIP Freedom 2020 Portfolio℠
Performance: The Bottom Line
Performance numbers are net of all underlying fund operating expenses, but do not include any insurance charges imposed by your insurance company’s separate account. If performance information included the effect of these additional charges, the total returns would have been lower.
Average annual total return reflects the change in the value of an investment, assuming reinvestment of distributions from dividend income and capital gains (the profits earned upon the sale of securities that have grown in value, if any) and assuming a constant rate of performance each year. During periods of reimbursement by Fidelity, a fund’s total return will be greater than it would be had the reimbursement not occurred. Performance numbers are net of all underlying fund operating expenses, but do not include any insurance charges imposed by your insurance company’s separate account. If performance information included the effect of these additional charges, the total returns would have been lower. How a fund did yesterday is no guarantee of how it will do tomorrow.
Average Annual Total Returns
| Periods ended December 31, 2018 | Past 1 year | Past 5 years | Past 10 years |
| Initial Class | (5.86)% | 4.02% | 8.88% |
| Service Class | (5.98)% | 3.90% | 8.77% |
| Service Class 2 | (6.08)% | 3.76% | 8.60% |
$10,000 Over 10 Years
Let's say hypothetically that $10,000 was invested in VIP Freedom 2020 Portfolio℠ - Initial Class on December 31, 2008.
The chart shows how the value of your investment would have changed, and also shows how the S&P 500® Index performed over the same period.
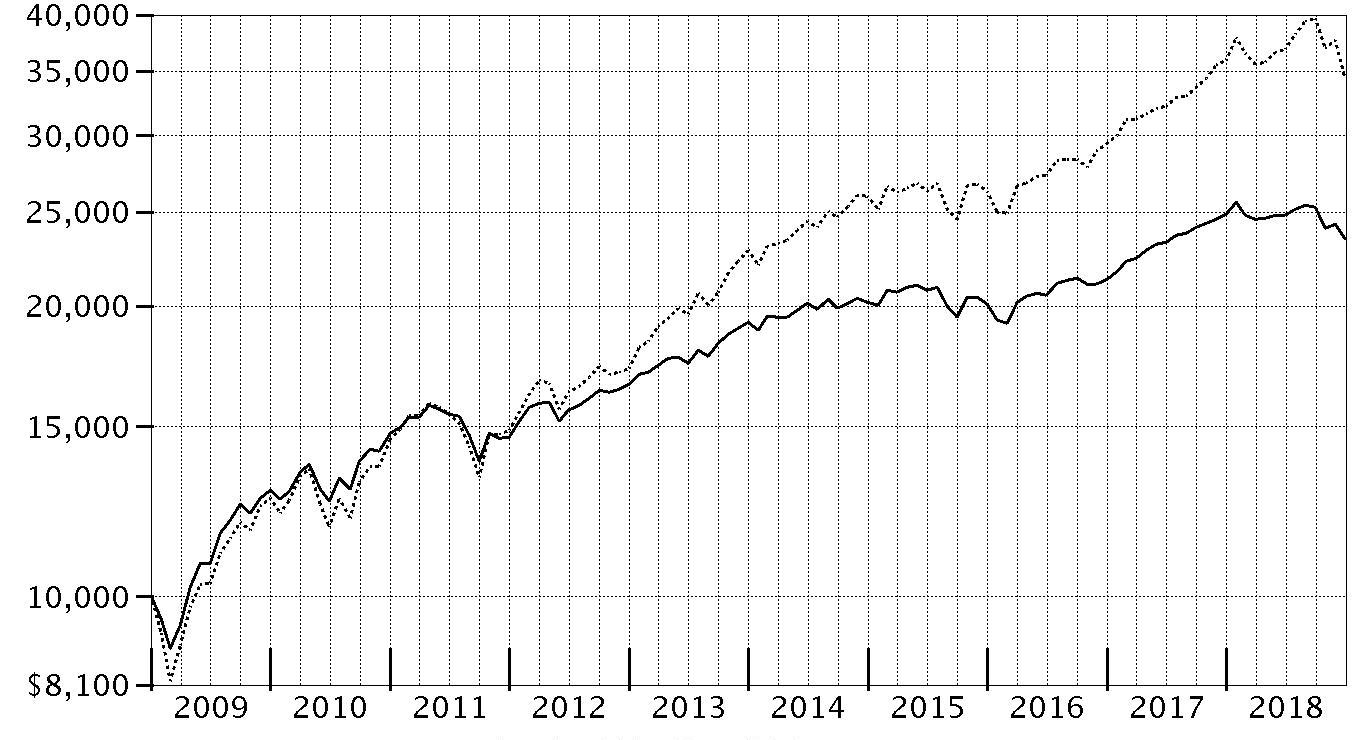
| Period Ending Values |
| $23,411 | VIP Freedom 2020 Portfolio℠ - Initial Class |
| $34,303 | S&P 500® Index |
VIP Freedom 2025 Portfolio℠
Performance: The Bottom Line
Performance numbers are net of all underlying fund operating expenses, but do not include any insurance charges imposed by your insurance company’s separate account. If performance information included the effect of these additional charges, the total returns would have been lower.
Average annual total return reflects the change in the value of an investment, assuming reinvestment of distributions from dividend income and capital gains (the profits earned upon the sale of securities that have grown in value, if any) and assuming a constant rate of performance each year. During periods of reimbursement by Fidelity, a fund’s total return will be greater than it would be had the reimbursement not occurred. Performance numbers are net of all underlying fund operating expenses, but do not include any insurance charges imposed by your insurance company’s separate account. If performance information included the effect of these additional charges, the total returns would have been lower. How a fund did yesterday is no guarantee of how it will do tomorrow.
Average Annual Total Returns
| Periods ended December 31, 2018 | Past 1 year | Past 5 years | Past 10 years |
| Initial Class | (6.52)% | 4.18% | 9.59% |
| Service Class | (6.61)% | 4.08% | 9.48% |
| Service Class 2 | (6.78)% | 3.92% | 9.32% |
$10,000 Over 10 Years
Let's say hypothetically that $10,000 was invested in VIP Freedom 2025 Portfolio℠ - Initial Class on December 31, 2008.
The chart shows how the value of your investment would have changed, and also shows how the S&P 500® Index performed over the same period.

| Period Ending Values |
| $24,979 | VIP Freedom 2025 Portfolio℠ - Initial Class |
| $34,303 | S&P 500® Index |
VIP Freedom 2030 Portfolio℠
Performance: The Bottom Line
Performance numbers are net of all underlying fund operating expenses, but do not include any insurance charges imposed by your insurance company’s separate account. If performance information included the effect of these additional charges, the total returns would have been lower.
Average annual total return reflects the change in the value of an investment, assuming reinvestment of distributions from dividend income and capital gains (the profits earned upon the sale of securities that have grown in value, if any) and assuming a constant rate of performance each year. During periods of reimbursement by Fidelity, a fund’s total return will be greater than it would be had the reimbursement not occurred. Performance numbers are net of all underlying fund operating expenses, but do not include any insurance charges imposed by your insurance company’s separate account. If performance information included the effect of these additional charges, the total returns would have been lower. How a fund did yesterday is no guarantee of how it will do tomorrow.
Average Annual Total Returns
| Periods ended December 31, 2018 | Past 1 year | Past 5 years | Past 10 years |
| Initial Class | (7.78)% | 4.48% | 10.05% |
| Service Class | (7.88)% | 4.38% | 9.93% |
| Service Class 2 | (8.05)% | 4.23% | 9.77% |
$10,000 Over 10 Years
Let's say hypothetically that $10,000 was invested in VIP Freedom 2030 Portfolio℠ - Initial Class on December 31, 2008.
The chart shows how the value of your investment would have changed, and also shows how the S&P 500® Index performed over the same period.
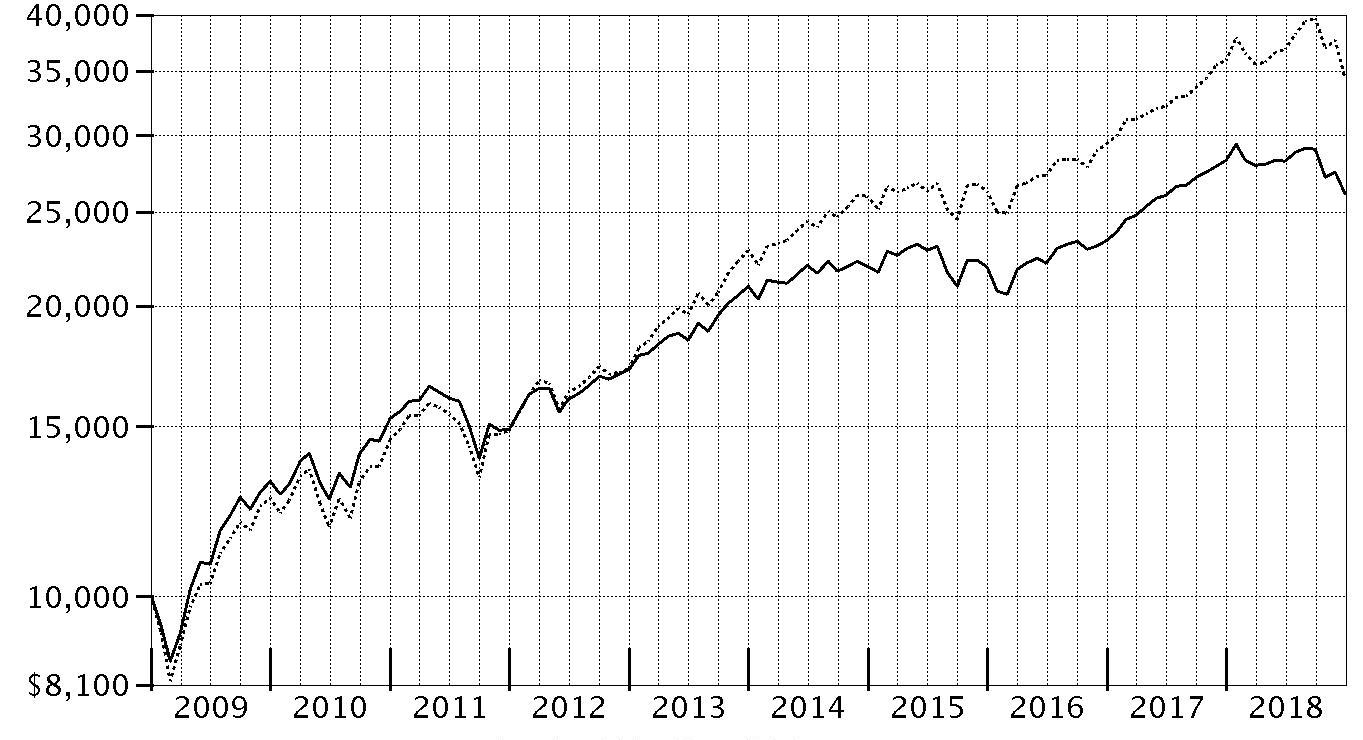
| Period Ending Values |
| $26,066 | VIP Freedom 2030 Portfolio℠ - Initial Class |
| $34,303 | S&P 500® Index |
VIP Freedom 2035 Portfolio℠
Performance: The Bottom Line
Performance numbers are net of all underlying fund operating expenses, but do not include any insurance charges imposed by your insurance company’s separate account. If performance information included the effect of these additional charges, the total returns would have been lower.
Average annual total return reflects the change in the value of an investment, assuming reinvestment of distributions from dividend income and capital gains (the profits earned upon the sale of securities that have grown in value, if any) and assuming a constant rate of performance each year. During periods of reimbursement by Fidelity, a fund’s total return will be greater than it would be had the reimbursement not occurred. Performance numbers are net of all underlying fund operating expenses, but do not include any insurance charges imposed by your insurance company’s separate account. If performance information included the effect of these additional charges, the total returns would have been lower. How a fund did yesterday is no guarantee of how it will do tomorrow.
Average Annual Total Returns
| Periods ended December 31, 2018 | Past 1 year | Past 5 years | Life of Portfolio |
| Initial Class | (9.30)% | 4.57% | 11.43% |
| Service Class | (9.36)% | 4.48% | 11.33% |
| Service Class 2 | (9.50)% | 4.32% | 11.16% |
$10,000 Over Life of Fund
Let's say hypothetically that $10,000 was invested in VIP Freedom 2035 Portfolio℠ - Initial Class on April 8, 2009, when the fund started.
The chart shows how the value of your investment would have changed, and also shows how the S&P 500® Index performed over the same period.

| Period Ending Values |
| $28,697 | VIP Freedom 2035 Portfolio℠ - Initial Class |
| $37,236 | S&P 500® Index |
VIP Freedom 2040 Portfolio℠
Performance: The Bottom Line
Performance numbers are net of all underlying fund operating expenses, but do not include any insurance charges imposed by your insurance company’s separate account. If performance information included the effect of these additional charges, the total returns would have been lower.
Average annual total return reflects the change in the value of an investment, assuming reinvestment of distributions from dividend income and capital gains (the profits earned upon the sale of securities that have grown in value, if any) and assuming a constant rate of performance each year. During periods of reimbursement by Fidelity, a fund’s total return will be greater than it would be had the reimbursement not occurred. Performance numbers are net of all underlying fund operating expenses, but do not include any insurance charges imposed by your insurance company’s separate account. If performance information included the effect of these additional charges, the total returns would have been lower. How a fund did yesterday is no guarantee of how it will do tomorrow.
Average Annual Total Returns
| Periods ended December 31, 2018 | Past 1 year | Past 5 years | Life of Portfolio |
| Initial Class | (9.88)% | 4.48% | 11.52% |
| Service Class | (9.94)% | 4.39% | 11.41% |
| Service Class 2 | (10.12)% | 4.22% | 11.24% |
$10,000 Over Life of Fund
Let's say hypothetically that $10,000 was invested in VIP Freedom 2040 Portfolio℠ - Initial Class on April 8, 2009, when the fund started.
The chart shows how the value of your investment would have changed, and also shows how the S&P 500® Index performed over the same period.

| Period Ending Values |
| $28,912 | VIP Freedom 2040 Portfolio℠ - Initial Class |
| $37,236 | S&P 500® Index |
VIP Freedom 2045 Portfolio℠
Performance: The Bottom Line
Performance numbers are net of all underlying fund operating expenses, but do not include any insurance charges imposed by your insurance company’s separate account. If performance information included the effect of these additional charges, the total returns would have been lower.
Average annual total return reflects the change in the value of an investment, assuming reinvestment of distributions from dividend income and capital gains (the profits earned upon the sale of securities that have grown in value, if any) and assuming a constant rate of performance each year. During periods of reimbursement by Fidelity, a fund’s total return will be greater than it would be had the reimbursement not occurred. Performance numbers are net of all underlying fund operating expenses, but do not include any insurance charges imposed by your insurance company’s separate account. If performance information included the effect of these additional charges, the total returns would have been lower. How a fund did yesterday is no guarantee of how it will do tomorrow.
Average Annual Total Returns
| Periods ended December 31, 2018 | Past 1 year | Past 5 years | Life of Portfolio |
| Initial Class | (9.89)% | 4.48% | 11.63% |
| Service Class | (9.97)% | 4.38% | 11.52% |
| Service Class 2 | (10.13)% | 4.22% | 11.35% |
$10,000 Over Life of Fund
Let's say hypothetically that $10,000 was invested in VIP Freedom 2045 Portfolio℠ - Initial Class on April 8, 2009, when the fund started.
The chart shows how the value of your investment would have changed, and also shows how the S&P 500® Index performed over the same period.
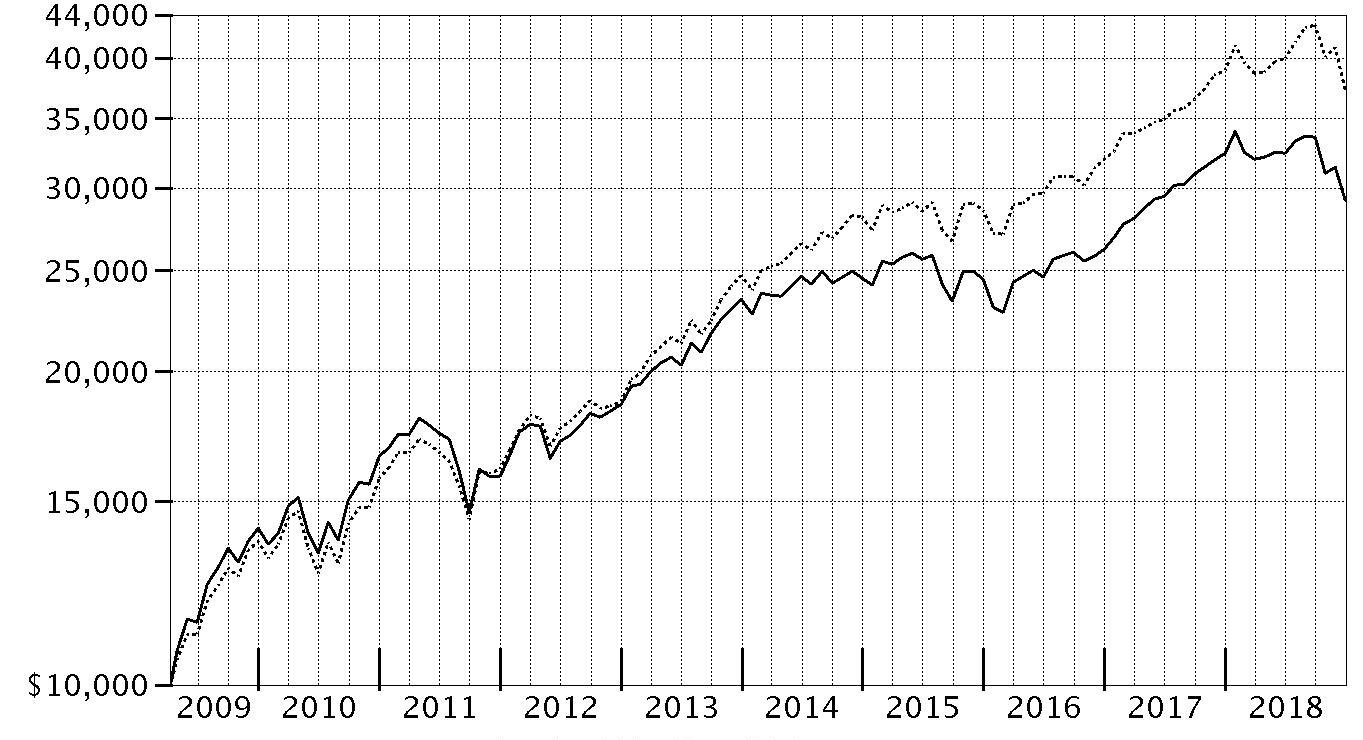
| Period Ending Values |
| $29,192 | VIP Freedom 2045 Portfolio℠ - Initial Class |
| $37,236 | S&P 500® Index |
VIP Freedom 2050 Portfolio℠
Performance: The Bottom Line
Performance numbers are net of all underlying fund operating expenses, but do not include any insurance charges imposed by your insurance company’s separate account. If performance information included the effect of these additional charges, the total returns would have been lower.
Average annual total return reflects the change in the value of an investment, assuming reinvestment of distributions from dividend income and capital gains (the profits earned upon the sale of securities that have grown in value, if any) and assuming a constant rate of performance each year. During periods of reimbursement by Fidelity, a fund’s total return will be greater than it would be had the reimbursement not occurred. Performance numbers are net of all underlying fund operating expenses, but do not include any insurance charges imposed by your insurance company’s separate account. If performance information included the effect of these additional charges, the total returns would have been lower. How a fund did yesterday is no guarantee of how it will do tomorrow.
Average Annual Total Returns
| Periods ended December 31, 2018 | Past 1 year | Past 5 years | Life of Portfolio |
| Initial Class | (9.89)% | 4.48% | 11.77% |
| Service Class | (10.03)% | 4.36% | 11.65% |
| Service Class 2 | (10.13)% | 4.22% | 11.49% |
$10,000 Over Life of Fund
Let's say hypothetically that $10,000 was invested in VIP Freedom 2050 Portfolio℠ - Initial Class on April 8, 2009, when the fund started.
The chart shows how the value of your investment would have changed, and also shows how the S&P 500® Index performed over the same period.
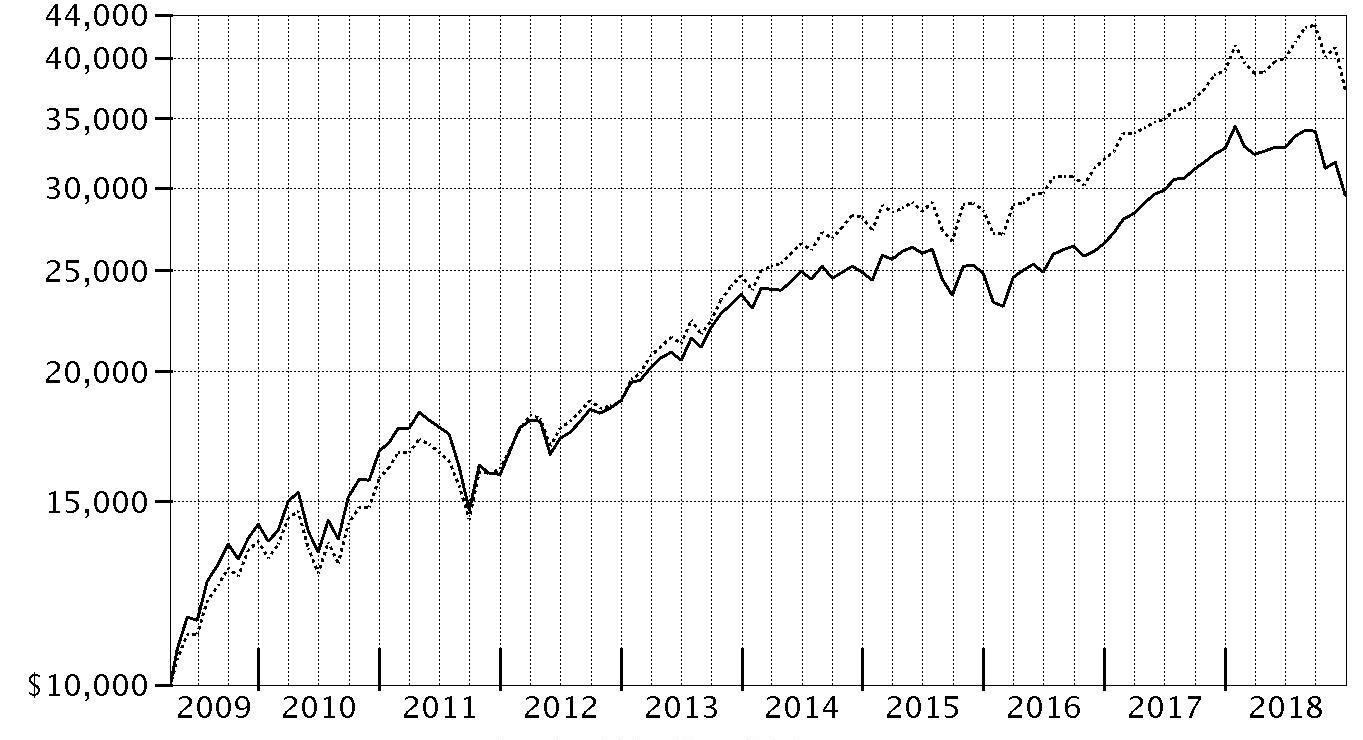
| Period Ending Values |
| $29,539 | VIP Freedom 2050 Portfolio℠ - Initial Class |
| $37,236 | S&P 500® Index |
Management's Discussion of Fund Performance
Market Recap: The global economy remained in expansion in 2018, but growth became less synchronous and more uneven. Meanwhile, global monetary policy became a headwind, and this uncertainty spurred an increase in volatility among risk assets. China entered a growth recession in the latter part of the year, and this slowdown, along with global monetary tightening and trade-policy uncertainty between China and the U.S., weighed on the industrial sectors in Europe and elsewhere. Looking at global assets, the year marked a reversal of sorts, with the positive trajectory of equities seen earlier in the period turning decidedly negative later in the second half. Several factors served to dim the outlook for risk assets, including the pace of the U.S. Federal Reserve’s interest rate increases, emerging late-cycle conditions, slowing economic growth in China, falling commodity prices and the U.K.’s planned “Brexit” from the European Union. Against this backdrop, non-U.S. equities suffered a pronounced, broad-based correction, returning -14.04% for the year, according to the MSCI ACWI ex USA Index. Among regions in the index, Asia-Pacific (-11%) and Japan (-13%) held up best, whereas resource-rich Canada (-17%), Europe (-14%) and emerging markets (-14%) lagged. In a turnaround from prior quarters in 2018, the value segment of equity markets outpaced growth across the globe amid the fourth-quarter downturn. Results at home, albeit negative, were comparatively strong globally, with the U.S. bellwether S&P 500
® index returning -4.38%. Sector-wise, seven of the 11 major sectors in the S&P 500
® lost ground this period. Falling crude-oil prices caused energy stocks (-18%) to suffer most, while concerns about slowing global growth felled the materials (-15%), industrials (-13%) and financials (-13%) sectors. Conversely, health care (+6%) led the way, followed by the utilities (+4%), information technology (+3%) and consumer discretionary (+2%) sectors. The small-cap-oriented Russell 2000
® Index had a return of -11.01% for the year. Commodities also struggled, as reflected in the -11.25% result of the Bloomberg Barclays Commodity Index Total Return. U.S. investment-grade bonds were roughly flat (+0.01%) for the 12 months, according to the Bloomberg Barclays U.S. Aggregate Bond Index. In the latter half of the period, concerns about global growth pushed Treasury yields lower and credit spreads wider. Short-term debt, as shown by the Bloomberg Barclays U.S. 3-Month Treasury Bellwether Index, led most U.S. investment-grade sectors with a return of 1.9%, followed by asset-backed securities (+1.8%) and agency bonds (+1.3%), while corporate credit returned -2.1%. Elsewhere, international bonds faced a similar struggle, while other non-core, more-credit-sensitive fixed-income segments, including U.S. high-yield corporates and emerging-markets debt also had a difficult year.
Comments from Co-Portfolio Managers Andrew Dierdorf and Brett Sumsion: For the year, VIP Freedom Funds posted returns ranging from -2% for VIP Freedom Income Portfolio to -8% for VIP Freedom 2030 Portfolio. Each VIP Freedom Portfolio underperformed its respective Composite benchmark by roughly 1 to 3 percentage points. Versus Composites, underlying investment performance was the primary reason for the Portfolios’ underperformance the past year, with asset allocation detracting to a lesser extent. In terms of investment performance, our underlying U.S. equity positions hurt most. Here, a handful of underlying investments, including Fidelity
® VIP Growth & Income Portfolio and Fidelity VIP Value Portfolio, each lagged their respective benchmarks by roughly 5 percentage points for the 12 months. Non-U.S. equity investments notably detracted, as investments in Fidelity VIP Emerging Markets Portfolio and Fidelity VIP Overseas Portfolio trailed their benchmarks by about 3 and 1 percentage points, respectively. In terms of asset allocation, underweighting investment-grade bonds held back the Portfolios’ relative performance. Intra-asset class allocation decisions within U.S. equities also notably detracted, especially allocations to value-oriented strategies, which lagged growth in 2018. An overweighting in emerging-markets stocks – the worst-performing asset class this year – also hurt. Conversely, higher allocations to long-term U.S. Treasury bonds, short-term debt and inflation-protected securities added value relative to Composites.
The views expressed above reflect those of the portfolio manager(s) only through the end of the period as stated on the cover of this report and do not necessarily represent the views of Fidelity or any other person in the Fidelity organization. Any such views are subject to change at any time based upon market or other conditions and Fidelity disclaims any responsibility to update such views. These views may not be relied on as investment advice and, because investment decisions for a Fidelity fund are based on numerous factors, may not be relied on as an indication of trading intent on behalf of any Fidelity fund.
Note to Shareholders: In May, the Board of Trustees for Fidelity VIP Freedom Funds approved some enhancements to the glide path for Fidelity's target-date portfolios, adding inflation-protected debt and long-term U.S. Treasury bonds. These adjustments were implemented by the end of 2018.
VIP Freedom Income Portfolio℠
Investment Summary (Unaudited)
The information in the following tables is based on the direct investments of the Fund.
Top Holdings as of December 31, 2018
| | % of fund's net assets |
| VIP Investment Grade Bond Portfolio Initial Class | 36.4 |
| VIP Government Money Market Portfolio Initial Class 2.19% | 24.2 |
| Fidelity Inflation-Protected Bond Index Fund Institutional Premium Class | 12.4 |
| Fidelity Long Term Treasury Bond Index Fund | 5.4 |
| VIP Overseas Portfolio Initial Class | 5.4 |
| VIP Emerging Markets Portfolio Initial Class | 4.3 |
| VIP Growth & Income Portfolio Initial Class | 2.1 |
| VIP High Income Portfolio Initial Class | 2.0 |
| VIP Equity-Income Portfolio Initial Class | 1.8 |
| VIP Growth Portfolio Initial Class | 1.8 |
| | 95.8 |
Asset Allocation (% of fund's net assets)
| Period end |
| | Domestic Equity Funds | 9.9% |
| | International Equity Funds | 9.7% |
| | Bond Funds | 56.2% |
| | Short-Term Funds | 24.2% |

VIP Freedom Income Portfolio℠
Schedule of Investments December 31, 2018
Showing Percentage of Net Assets
| Domestic Equity Funds - 9.9% | | | |
| | | Shares | Value |
| VIP Contrafund Portfolio Initial Class (a) | | 24,195 | $777,375 |
| VIP Equity-Income Portfolio Initial Class (a) | | 40,035 | 815,517 |
| VIP Growth & Income Portfolio Initial Class (a) | | 47,978 | 929,808 |
| VIP Growth Portfolio Initial Class (a) | | 12,585 | 794,386 |
| VIP Mid Cap Portfolio Initial Class (a) | | 7,455 | 225,069 |
| VIP Value Portfolio Initial Class (a) | | 45,736 | 598,228 |
| VIP Value Strategies Portfolio Initial Class (a) | | 26,234 | 291,463 |
| TOTAL DOMESTIC EQUITY FUNDS | | | |
| (Cost $3,721,695) | | | 4,431,846 |
|
| International Equity Funds - 9.7% | | | |
| VIP Emerging Markets Portfolio Initial Class (a) | | 193,400 | 1,924,333 |
| VIP Overseas Portfolio Initial Class (a) | | 125,225 | 2,395,553 |
| TOTAL INTERNATIONAL EQUITY FUNDS | | | |
| (Cost $3,786,850) | | | 4,319,886 |
|
| Bond Funds - 56.2% | | | |
| Fidelity Inflation-Protected Bond Index Fund Institutional Premium Class (a) | | 585,763 | 5,558,889 |
| Fidelity Long Term Treasury Bond Index Fund (a) | | 190,570 | 2,416,430 |
| VIP High Income Portfolio Initial Class (a) | | 176,831 | 878,850 |
| VIP Investment Grade Bond Portfolio Initial Class (a) | | 1,315,615 | 16,234,694 |
| TOTAL BOND FUNDS | | | |
| (Cost $25,671,474) | | | 25,088,863 |
|
| Short-Term Funds - 24.2% | | | |
| VIP Government Money Market Portfolio Initial Class 2.19% (a)(b) | | | |
| (Cost $10,796,712) | | 10,796,712 | 10,796,712 |
| TOTAL INVESTMENT IN SECURITIES - 100.0% | | | |
| (Cost $43,976,731) | | | 44,637,307 |
| NET OTHER ASSETS (LIABILITIES) - 0.0% | | | (4,520) |
| NET ASSETS - 100% | | | $44,632,787 |
Legend
(a) Affiliated Fund
(b) The rate quoted is the annualized seven-day yield of the fund at period end.
Affiliated Central Funds
Information regarding fiscal year to date income earned by the Fund from investments in Fidelity Central Funds is as follows:
| Fund | Income earned |
| Fidelity Cash Central Fund | $3 |
| Total | $3 |
Amounts in the income column in the above table include any capital gain distributions from underlying funds, which are presented in the corresponding line-item in the Statement of Operations if applicable.
Affiliated Underlying Funds
Fiscal year to date information regarding the Fund's investments in affiliated Underlying Funds, excluding any Money Market Central Funds, is presented below. Exchanges between classes of the same affiliated Underlying Funds may occur.
| Affiliate | Value, beginning of period | Purchases | Sales Proceeds | Dividend Income | Realized Gain (loss) | Change in Unrealized appreciation (depreciation) | Value, end of period |
| Fidelity Inflation-Protected Bond Index Fund Institutional Class | $- | $5,935,032 | $241,874 | $5,560 | $(2,185) | $- | $- |
| Fidelity Inflation-Protected Bond Index Fund Institutional Premium Class | - | 337,741 | 288,177 | 110,171 | (4,644) | (177,004) | 5,558,889 |
| Fidelity Long Term Treasury Bond Index Fund | - | 179,390 | 299,009 | 12,093 | (9,721) | 17,891 | 2,416,430 |
| Fidelity Long-Term Treasury Bond Index Fund Premium Class | 907,985 | 1,895,545 | 268,939 | 33,193 | (9,943) | 3,231 | - |
| VIP Contrafund Portfolio Initial Class | 1,030,804 | 530,454 | 663,155 | 88,844 | 38,652 | (159,380) | 777,375 |
| VIP Emerging Markets Portfolio Initial Class | 1,607,941 | 1,350,770 | 718,322 | 14,042 | 32,916 | (348,972) | 1,924,333 |
| VIP Equity-Income Portfolio Initial Class | 1,086,849 | 544,255 | 688,106 | 65,504 | 10,630 | (138,111) | 815,517 |
| VIP Government Money Market Portfolio Initial Class 2.19% | 13,710,985 | 4,858,740 | 7,773,013 | 202,723 | - | - | 10,796,712 |
| VIP Growth & Income Portfolio Initial Class | 1,246,930 | 617,257 | 795,217 | 69,170 | 72,259 | (211,421) | 929,808 |
| VIP Growth Portfolio Initial Class | 1,049,451 | 584,058 | 734,335 | 141,107 | 103,337 | (208,125) | 794,386 |
| VIP High Income Portfolio Initial Class | 841,795 | 380,393 | 261,370 | 51,660 | (2,826) | (79,142) | 878,850 |
| VIP Investment Grade Bond Portfolio Initial Class | 16,519,556 | 6,448,586 | 6,135,372 | 515,765 | (57,494) | (540,582) | 16,234,694 |
| VIP Mid Cap Portfolio Initial Class | 302,048 | 161,635 | 181,935 | 25,122 | 8,703 | (65,382) | 225,069 |
| VIP Overseas Portfolio Initial Class | 2,734,339 | 1,363,082 | 1,284,070 | 42,287 | 44,907 | (462,705) | 2,395,553 |
| VIP Value Portfolio Initial Class | 798,503 | 417,698 | 487,265 | 47,452 | 17,866 | (148,574) | 598,228 |
| VIP Value Strategies Portfolio Initial Class | 389,937 | 207,112 | 232,040 | 18,994 | 2,403 | (75,949) | 291,463 |
| Total | $42,227,123 | $25,811,748 | $21,052,199 | $1,443,687 | $244,860 | $(2,594,225) | $44,637,307 |
Amounts in the income column in the above table include any capital gain distributions from underlying funds, which are presented in the corresponding line-item in the Statement of Operations if applicable.
Investment Valuation
All investments are categorized as Level 1 under the Fair Value Hierarchy. The inputs or methodology used for valuing securities may not be an indication of the risk associated with investing in those securities. For more information on valuation inputs please refer to the Investment Valuation section in the accompanying Notes to Financial Statements.
See accompanying notes which are an integral part of the financial statements.
VIP Freedom Income Portfolio℠
Financial Statements
Statement of Assets and Liabilities
| | | December 31, 2018 |
| Assets | | |
Investment in securities, at value — See accompanying schedule:
| | |
| Affiliated issuers (cost $43,976,731) | $44,637,307 | |
| Total Investment in Securities (cost $43,976,731) | | $44,637,307 |
| Cash | | 4 |
| Receivable for investments sold | | 762,411 |
| Receivable for fund shares sold | | 34,146 |
| Total assets | | 45,433,868 |
| Liabilities | | |
| Payable for investments purchased | $575,405 | |
| Payable for fund shares redeemed | 221,152 | |
| Distribution and service plan fees payable | 4,524 | |
| Total liabilities | | 801,081 |
| Net Assets | | $44,632,787 |
| Net Assets consist of: | | |
| Paid in capital | | $43,259,286 |
| Total distributable earnings (loss) | | 1,373,501 |
| Net Assets | | $44,632,787 |
| Net Asset Value and Maximum Offering Price | | |
| Initial Class: | | |
| Net Asset Value, offering price and redemption price per share ($14,582,476 ÷ 1,316,305 shares) | | $11.08 |
| Service Class: | | |
| Net Asset Value, offering price and redemption price per share ($14,591,252 ÷ 1,317,911 shares) | | $11.07 |
| Service Class 2: | | |
| Net Asset Value, offering price and redemption price per share ($15,459,059 ÷ 1,401,717 shares) | | $11.03 |
See accompanying notes which are an integral part of the financial statements.
Statement of Operations
| | | Year ended December 31, 2018 |
| Investment Income | | |
| Dividends: | | |
| Affiliated issuers | | $826,510 |
| Income from Fidelity Central Funds | | 3 |
| Total income | | 826,513 |
| Expenses | | |
| Distribution and service plan fees | $51,151 | |
| Independent trustees' fees and expenses | 240 | |
| Total expenses | | 51,391 |
| Net investment income (loss) | | 775,122 |
| Realized and Unrealized Gain (Loss) | | |
| Net realized gain (loss) on: | | |
| Investment securities: | | |
| Affiliated issuers | 244,860 | |
| Capital gain distributions from underlying funds: | | |
| Affiliated issuers | 617,177 | |
| Total net realized gain (loss) | | 862,037 |
| Change in net unrealized appreciation (depreciation) on: | | |
| Investment securities: | | |
| Affiliated issuers | (2,594,225) | |
| Total change in net unrealized appreciation (depreciation) | | (2,594,225) |
| Net gain (loss) | | (1,732,188) |
| Net increase (decrease) in net assets resulting from operations | | $(957,066) |
See accompanying notes which are an integral part of the financial statements.
Statement of Changes in Net Assets
| | Year ended December 31, 2018 | Year ended December 31, 2017 |
| Increase (Decrease) in Net Assets | | |
| Operations | | |
| Net investment income (loss) | $775,122 | $629,213 |
| Net realized gain (loss) | 862,037 | 565,101 |
| Change in net unrealized appreciation (depreciation) | (2,594,225) | 2,039,401 |
| Net increase (decrease) in net assets resulting from operations | (957,066) | 3,233,715 |
| Distributions to shareholders | (1,201,731) | – |
| Distributions to shareholders from net investment income | – | (619,471) |
| Distributions to shareholders from net realized gain | – | (345,560) |
| Total distributions | (1,201,731) | (965,031) |
| Share transactions - net increase (decrease) | 4,567,736 | 1,706,894 |
| Total increase (decrease) in net assets | 2,408,939 | 3,975,578 |
| Net Assets | | |
| Beginning of period | 42,223,848 | 38,248,270 |
| End of period | $44,632,787 | $42,223,848 |
| Other Information | | |
| Undistributed net investment income end of period | | $6,629 |
See accompanying notes which are an integral part of the financial statements.
Financial Highlights
VIP Freedom Income Portfolio Initial Class
| Years ended December 31, | 2018 | 2017 | 2016 | 2015 | 2014 |
| Selected Per–Share Data | | | | | |
| Net asset value, beginning of period | $11.63 | $10.98 | $10.78 | $11.03 | $10.89 |
| Income from Investment Operations | | | | | |
| Net investment income (loss)A | .22 | .19 | .16 | .21 | .18 |
| Net realized and unrealized gain (loss) | (.45) | .74 | .32 | (.25) | .23 |
| Total from investment operations | (.23) | .93 | .48 | (.04) | .41 |
| Distributions from net investment income | (.20) | (.18) | (.16) | (.20) | (.17) |
| Distributions from net realized gain | (.13) | (.10) | (.11) | (.02) | (.10) |
| Total distributions | (.32)B | (.28) | (.28)C | (.21)D | (.27) |
| Net asset value, end of period | $11.08 | $11.63 | $10.98 | $10.78 | $11.03 |
| Total ReturnE,F | (1.96)% | 8.48% | 4.50% | (.34)% | 3.78% |
| Ratios to Average Net AssetsG,H | | | | | |
| Expenses before reductionsI | -% | -% | -% | -% | -% |
| Expenses net of fee waivers, if any | - %I | -% | -% | -% | -% |
| Expenses net of all reductions | - %I | -% | -% | -% | -% |
| Net investment income (loss) | 1.90% | 1.67% | 1.48% | 1.85% | 1.62% |
| Supplemental Data | | | | | |
| Net assets, end of period (000 omitted) | $14,582 | $16,086 | $14,956 | $14,548 | $17,386 |
| Portfolio turnover rateG | 48% | 35% | 38% | 36% | 32% |
A Calculated based on average shares outstanding during the period.
B Total distributions of $.32 per share is comprised of distributions from net investment income of $.197 and distributions from net realized gain of $.125 per share.
C Total distributions of $.28 per share is comprised of distributions from net investment income of $.164 and distributions from net realized gain of $.113 per share.
D Total distributions of $.21 per share is comprised of distributions from net investment income of $.198 and distributions from net realized gain of $.015 per share.
E Total returns do not reflect charges attributable to your insurance company's separate account. Inclusion of these charges would reduce the total returns shown.
F Total returns would have been lower if certain expenses had not been reduced during the applicable periods shown.
G Amounts do not include the activity of the Underlying Funds.
H Expense ratios reflect operating expenses of the class. Expenses before reductions do not reflect amounts reimbursed by the investment adviser or reductions from expense offset arrangements and do not represent the amount paid by the class during periods when reimbursements or reductions occur. Expenses net of fee waivers reflect expenses after reimbursement by the investment adviser but prior to reductions from expense offset arrangements. Expenses net of all reductions represent the net expenses paid by the class but do not include expenses of the underlying funds in which the Fund invests.
I Amount represents less than .005%.
See accompanying notes which are an integral part of the financial statements.
VIP Freedom Income Portfolio Service Class
| Years ended December 31, | 2018 | 2017 | 2016 | 2015 | 2014 |
| Selected Per–Share Data | | | | | |
| Net asset value, beginning of period | $11.63 | $10.97 | $10.78 | $11.03 | $10.89 |
| Income from Investment Operations | | | | | |
| Net investment income (loss)A | .21 | .18 | .15 | .19 | .17 |
| Net realized and unrealized gain (loss) | (.46) | .75 | .31 | (.24) | .23 |
| Total from investment operations | (.25) | .93 | .46 | (.05) | .40 |
| Distributions from net investment income | (.19) | (.17) | (.15) | (.19) | (.16) |
| Distributions from net realized gain | (.13) | (.10) | (.11) | (.02) | (.10) |
| Total distributions | (.31)B | (.27) | (.27)C | (.20)D | (.26) |
| Net asset value, end of period | $11.07 | $11.63 | $10.97 | $10.78 | $11.03 |
| Total ReturnE,F | (2.12)% | 8.49% | 4.32% | (.42)% | 3.69% |
| Ratios to Average Net AssetsG,H | | | | | |
| Expenses before reductions | .10% | .10% | .10% | .10% | .10% |
| Expenses net of fee waivers, if any | .10% | .10% | .10% | .10% | .10% |
| Expenses net of all reductions | .10% | .10% | .10% | .10% | .10% |
| Net investment income (loss) | 1.80% | 1.57% | 1.38% | 1.75% | 1.52% |
| Supplemental Data | | | | | |
| Net assets, end of period (000 omitted) | $14,591 | $11,227 | $9,286 | $9,825 | $6,193 |
| Portfolio turnover rateG | 48% | 35% | 38% | 36% | 32% |
A Calculated based on average shares outstanding during the period.
B Total distributions of $.31 per share is comprised of distributions from net investment income of $.189 and distributions from net realized gain of $.125 per share.
C Total distributions of $.27 per share is comprised of distributions from net investment income of $.154 and distributions from net realized gain of $.113 per share.
D Total distributions of $.20 per share is comprised of distributions from net investment income of $.189 and distributions from net realized gain of $.015 per share.
E Total returns do not reflect charges attributable to your insurance company's separate account. Inclusion of these charges would reduce the total returns shown.
F Total returns would have been lower if certain expenses had not been reduced during the applicable periods shown.
G Amounts do not include the activity of the Underlying Funds.
H Expense ratios reflect operating expenses of the class. Expenses before reductions do not reflect amounts reimbursed by the investment adviser or reductions from expense offset arrangements and do not represent the amount paid by the class during periods when reimbursements or reductions occur. Expenses net of fee waivers reflect expenses after reimbursement by the investment adviser but prior to reductions from expense offset arrangements. Expenses net of all reductions represent the net expenses paid by the class but do not include expenses of the underlying funds in which the Fund invests.
See accompanying notes which are an integral part of the financial statements.
VIP Freedom Income Portfolio Service Class 2
| Years ended December 31, | 2018 | 2017 | 2016 | 2015 | 2014 |
| Selected Per–Share Data | | | | | |
| Net asset value, beginning of period | $11.59 | $10.93 | $10.74 | $10.99 | $10.85 |
| Income from Investment Operations | | | | | |
| Net investment income (loss)A | .19 | .16 | .13 | .18 | .15 |
| Net realized and unrealized gain (loss) | (.45) | .75 | .31 | (.24) | .23 |
| Total from investment operations | (.26) | .91 | .44 | (.06) | .38 |
| Distributions from net investment income | (.17) | (.15) | (.14) | (.17) | (.14) |
| Distributions from net realized gain | (.13) | (.10) | (.11) | (.02) | (.10) |
| Total distributions | (.30) | (.25) | (.25) | (.19) | (.24) |
| Net asset value, end of period | $11.03 | $11.59 | $10.93 | $10.74 | $10.99 |
| Total ReturnB,C | (2.27)% | 8.36% | 4.17% | (.57)% | 3.54% |
| Ratios to Average Net AssetsD,E | | | | | |
| Expenses before reductions | .25% | .25% | .25% | .25% | .25% |
| Expenses net of fee waivers, if any | .25% | .25% | .25% | .25% | .25% |
| Expenses net of all reductions | .25% | .25% | .25% | .25% | .25% |
| Net investment income (loss) | 1.65% | 1.42% | 1.23% | 1.60% | 1.37% |
| Supplemental Data | | | | | |
| Net assets, end of period (000 omitted) | $15,459 | $14,911 | $14,007 | $13,375 | $8,860 |
| Portfolio turnover rateD | 48% | 35% | 38% | 36% | 32% |
A Calculated based on average shares outstanding during the period.
B Total returns do not reflect charges attributable to your insurance company's separate account. Inclusion of these charges would reduce the total returns shown.
C Total returns would have been lower if certain expenses had not been reduced during the applicable periods shown.
D Amounts do not include the activity of the Underlying Funds.
E Expense ratios reflect operating expenses of the class. Expenses before reductions do not reflect amounts reimbursed by the investment adviser or reductions from expense offset arrangements and do not represent the amount paid by the class during periods when reimbursements or reductions occur. Expenses net of fee waivers reflect expenses after reimbursement by the investment adviser but prior to reductions from expense offset arrangements. Expenses net of all reductions represent the net expenses paid by the class but do not include expenses of the underlying funds in which the Fund invests.
See accompanying notes which are an integral part of the financial statements.
VIP Freedom 2005 Portfolio℠
Investment Summary (Unaudited)
The information in the following tables is based on the direct investments of the Fund.
Top Holdings as of December 31, 2018
| | % of fund's net assets |
| VIP Investment Grade Bond Portfolio Initial Class | 32.9 |
| VIP Government Money Market Portfolio Initial Class 2.19% | 19.9 |
| Fidelity Inflation-Protected Bond Index Fund Institutional Premium Class | 11.0 |
| VIP Overseas Portfolio Initial Class | 7.2 |
| Fidelity Long Term Treasury Bond Index Fund | 5.7 |
| VIP Emerging Markets Portfolio Initial Class | 5.3 |
| VIP Growth & Income Portfolio Initial Class | 3.3 |
| VIP Equity-Income Portfolio Initial Class | 2.9 |
| VIP Growth Portfolio Initial Class | 2.9 |
| VIP Contrafund Portfolio Initial Class | 2.8 |
| | 93.9 |
Asset Allocation (% of fund's net assets)
| Period end |
| | Domestic Equity Funds | 16.0% |
| | International Equity Funds | 12.5% |
| | Bond Funds | 51.6% |
| | Short-Term Funds | 19.9% |

VIP Freedom 2005 Portfolio℠
Schedule of Investments December 31, 2018
Showing Percentage of Net Assets
| Domestic Equity Funds - 16.0% | | | |
| | | Shares | Value |
| VIP Contrafund Portfolio Initial Class (a) | | 9,212 | $295,967 |
| VIP Equity-Income Portfolio Initial Class (a) | | 15,241 | 310,461 |
| VIP Growth & Income Portfolio Initial Class (a) | | 18,263 | 353,946 |
| VIP Growth Portfolio Initial Class (a) | | 4,791 | 302,425 |
| VIP Mid Cap Portfolio Initial Class (a) | | 2,848 | 85,985 |
| VIP Value Portfolio Initial Class (a) | | 17,421 | 227,869 |
| VIP Value Strategies Portfolio Initial Class (a) | | 10,011 | 111,217 |
| TOTAL DOMESTIC EQUITY FUNDS | | | |
| (Cost $1,477,371) | | | 1,687,870 |
|
| International Equity Funds - 12.5% | | | |
| VIP Emerging Markets Portfolio Initial Class (a) | | 56,474 | 561,918 |
| VIP Overseas Portfolio Initial Class (a) | | 39,956 | 764,364 |
| TOTAL INTERNATIONAL EQUITY FUNDS | | | |
| (Cost $1,254,494) | | | 1,326,282 |
|
| Bond Funds - 51.6% | | | |
| Fidelity Inflation-Protected Bond Index Fund Institutional Premium Class (a) | | 123,078 | 1,168,011 |
| Fidelity Long Term Treasury Bond Index Fund (a) | | 47,525 | 602,614 |
| VIP High Income Portfolio Initial Class (a) | | 42,303 | 210,244 |
| VIP Investment Grade Bond Portfolio Initial Class (a) | | 282,448 | 3,485,414 |
| TOTAL BOND FUNDS | | | |
| (Cost $5,579,700) | | | 5,466,283 |
|
| Short-Term Funds - 19.9% | | | |
| Fidelity Cash Central Fund, 2.42% (b) | | 3 | 3 |
| VIP Government Money Market Portfolio Initial Class 2.19% (a)(c) | | 2,110,882 | 2,110,882 |
| TOTAL SHORT-TERM FUNDS | | | |
| (Cost $2,110,885) | | | 2,110,885 |
| TOTAL INVESTMENT IN SECURITIES - 100.0% | | | |
| (Cost $10,422,450) | | | 10,591,320 |
| NET OTHER ASSETS (LIABILITIES) - 0.0% | | | (168) |
| NET ASSETS - 100% | | | $10,591,152 |
Legend
(a) Affiliated Fund
(b) Affiliated fund that is generally available only to investment companies and other accounts managed by Fidelity Investments. The rate quoted is the annualized seven-day yield of the fund at period end. A complete unaudited listing of the fund's holdings as of its most recent quarter end is available upon request. In addition, each Fidelity Central Fund's financial statements, which are not covered by the Fund's Report of Independent Registered Public Accounting Firm, are available on the SEC's website or upon request.
(c) The rate quoted is the annualized seven-day yield of the fund at period end.
Affiliated Central Funds
Information regarding fiscal year to date income earned by the Fund from investments in Fidelity Central Funds is as follows:
| Fund | Income earned |
| Fidelity Cash Central Fund | $11 |
| Total | $11 |
Amounts in the income column in the above table include any capital gain distributions from underlying funds, which are presented in the corresponding line-item in the Statement of Operations if applicable.
Affiliated Underlying Funds
Fiscal year to date information regarding the Fund's investments in affiliated Underlying Funds, excluding any Money Market Central Funds, is presented below. Exchanges between classes of the same affiliated Underlying Funds may occur.
| Affiliate | Value, beginning of period | Purchases | Sales Proceeds | Dividend Income | Realized Gain (loss) | Change in Unrealized appreciation (depreciation) | Value, end of period |
| Fidelity Inflation-Protected Bond Index Fund Institutional Premium Class | $- | $126,743 | $11,088 | $22,519 | $(215) | $(36,296) | $1,168,011 |
| Fidelity Inflation-Protected Bond Index Fund Premium Class | - | 1,136,246 | 46,496 | 1,068 | (883) | - | - |
| Fidelity Long Term Treasury Bond Index Fund | - | 67,819 | 35,731 | 2,972 | (1,802) | 3,126 | 602,614 |
| Fidelity Long-Term Treasury Bond Index Fund Premium Class | 195,344 | 408,583 | 33,608 | 7,772 | (1,790) | 673 | - |
| VIP Contrafund Portfolio Initial Class | 335,492 | 158,938 | 154,229 | 31,269 | 4,434 | (48,668) | 295,967 |
| VIP Emerging Markets Portfolio Initial Class | 441,488 | 332,409 | 117,711 | 3,934 | (4,418) | (89,850) | 561,918 |
| VIP Equity-Income Portfolio Initial Class | 353,732 | 152,438 | 148,784 | 23,274 | (2,494) | (44,431) | 310,461 |
| VIP Government Money Market Portfolio Initial Class 2.19% | 2,404,539 | 764,120 | 1,057,777 | 38,496 | - | - | 2,110,882 |
| VIP Growth & Income Portfolio Initial Class | 405,682 | 175,736 | 176,242 | 24,361 | 8,883 | (60,113) | 353,946 |
| VIP Growth Portfolio Initial Class | 341,649 | 178,427 | 178,417 | 49,579 | 15,229 | (54,463) | 302,425 |
| VIP High Income Portfolio Initial Class | 184,319 | 74,240 | 29,675 | 11,824 | (786) | (17,854) | 210,244 |
| VIP Investment Grade Bond Portfolio Initial Class | 3,307,006 | 1,129,674 | 824,783 | 108,462 | (21,911) | (104,572) | 3,485,414 |
| VIP Mid Cap Portfolio Initial Class | 98,300 | 47,945 | 39,632 | 8,842 | 774 | (21,402) | 85,985 |
| VIP Overseas Portfolio Initial Class | 803,667 | 329,066 | 238,265 | 12,954 | (1,875) | (128,229) | 764,364 |
| VIP Value Portfolio Initial Class | 259,879 | 117,806 | 102,076 | 16,961 | 693 | (48,433) | 227,869 |
| VIP Value Strategies Portfolio Initial Class | 126,922 | 56,849 | 45,967 | 6,774 | 26 | (26,613) | 111,217 |
| Total | $9,258,019 | $5,257,039 | $3,240,481 | $371,061 | $(6,135) | $(677,125) | $10,591,317 |
Amounts in the income column in the above table include any capital gain distributions from underlying funds, which are presented in the corresponding line-item in the Statement of Operations if applicable.
Investment Valuation
All investments are categorized as Level 1 under the Fair Value Hierarchy. The inputs or methodology used for valuing securities may not be an indication of the risk associated with investing in those securities. For more information on valuation inputs please refer to the Investment Valuation section in the accompanying Notes to Financial Statements.
See accompanying notes which are an integral part of the financial statements.
VIP Freedom 2005 Portfolio℠
Financial Statements
Statement of Assets and Liabilities
| | | December 31, 2018 |
| Assets | | |
Investment in securities, at value — See accompanying schedule:
| | |
| Fidelity Central Funds (cost $3) | $3 | |
| Other affiliated issuers (cost $10,422,447) | 10,591,317 | |
| Total Investment in Securities (cost $10,422,450) | | $10,591,320 |
| Receivable for investments sold | | 26,830 |
| Receivable for fund shares sold | | 253,696 |
| Distributions receivable from Fidelity Central Funds | | 11 |
| Total assets | | 10,871,857 |
| Liabilities | | |
| Payable to custodian bank | $1 | |
| Payable for investments purchased | 279,982 | |
| Payable for fund shares redeemed | 530 | |
| Distribution and service plan fees payable | 192 | |
| Total liabilities | | 280,705 |
| Net Assets | | $10,591,152 |
| Net Assets consist of: | | |
| Paid in capital | | $10,282,969 |
| Total distributable earnings (loss) | | 308,183 |
| Net Assets | | $10,591,152 |
| Net Asset Value and Maximum Offering Price | | |
| Initial Class: | | |
| Net Asset Value, offering price and redemption price per share ($8,191,479 ÷ 703,328 shares) | | $11.65 |
| Service Class: | | |
| Net Asset Value, offering price and redemption price per share ($2,279,015 ÷ 194,519 shares) | | $11.72 |
| Service Class 2: | | |
| Net Asset Value, offering price and redemption price per share ($120,658 ÷ 10,384 shares) | | $11.62 |
See accompanying notes which are an integral part of the financial statements.
Statement of Operations
| | | Year ended December 31, 2018 |
| Investment Income | | |
| Dividends: | | |
| Affiliated issuers | | $182,612 |
| Income from Fidelity Central Funds | | 11 |
| Total income | | 182,623 |
| Expenses | | |
| Distribution and service plan fees | $2,014 | |
| Independent trustees' fees and expenses | 54 | |
| Total expenses | | 2,068 |
| Net investment income (loss) | | 180,555 |
| Realized and Unrealized Gain (Loss) | | |
| Net realized gain (loss) on: | | |
| Investment securities: | | |
| Affiliated issuers | (6,135) | |
| Capital gain distributions from underlying funds: | | |
| Affiliated issuers | 188,449 | |
| Total net realized gain (loss) | | 182,314 |
| Change in net unrealized appreciation (depreciation) on: | | |
| Investment securities: | | |
| Affiliated issuers | (677,125) | |
| Total change in net unrealized appreciation (depreciation) | | (677,125) |
| Net gain (loss) | | (494,811) |
| Net increase (decrease) in net assets resulting from operations | | $(314,256) |
See accompanying notes which are an integral part of the financial statements.
Statement of Changes in Net Assets
| | Year ended December 31, 2018 | Year ended December 31, 2017 |
| Increase (Decrease) in Net Assets | | |
| Operations | | |
| Net investment income (loss) | $180,555 | $134,097 |
| Net realized gain (loss) | 182,314 | 181,413 |
| Change in net unrealized appreciation (depreciation) | (677,125) | 520,533 |
| Net increase (decrease) in net assets resulting from operations | (314,256) | 836,043 |
| Distributions to shareholders | (312,530) | – |
| Distributions to shareholders from net investment income | – | (132,399) |
| Distributions to shareholders from net realized gain | – | (127,656) |
| Total distributions | (312,530) | (260,055) |
| Share transactions - net increase (decrease) | 1,959,854 | 1,678,577 |
| Total increase (decrease) in net assets | 1,333,068 | 2,254,565 |
| Net Assets | | |
| Beginning of period | 9,258,084 | 7,003,519 |
| End of period | $10,591,152 | $9,258,084 |
| Other Information | | |
| Undistributed net investment income end of period | | $1,697 |
See accompanying notes which are an integral part of the financial statements.
Financial Highlights
VIP Freedom 2005 Portfolio Initial Class
| Years ended December 31, | 2018 | 2017 | 2016 | 2015 | 2014 |
| Selected Per–Share Data | | | | | |
| Net asset value, beginning of period | $12.39 | $11.51 | $11.29 | $11.56 | $11.37 |
| Income from Investment Operations | | | | | |
| Net investment income (loss)A | .22 | .20 | .17 | .19 | .20 |
| Net realized and unrealized gain (loss) | (.58) | 1.06 | .38 | (.22) | .29 |
| Total from investment operations | (.36) | 1.26 | .55 | (.03) | .49 |
| Distributions from net investment income | (.20) | (.19) | (.18) | (.22) | (.19) |
| Distributions from net realized gain | (.17) | (.19) | (.15) | (.03) | (.11) |
| Total distributions | (.38)B | (.38) | (.33) | (.24)C | (.30) |
| Net asset value, end of period | $11.65 | $12.39 | $11.51 | $11.29 | $11.56 |
| Total ReturnD,E | (2.95)% | 11.06% | 5.00% | (.25)% | 4.30% |
| Ratios to Average Net AssetsF,G | | | | | |
| Expenses before reductionsH | -% | -% | -% | -% | -% |
| Expenses net of fee waivers, if any | - %H | -% | -% | -% | -% |
| Expenses net of all reductions | - %H | -% | -% | -% | -% |
| Net investment income (loss) | 1.80% | 1.65% | 1.50% | 1.64% | 1.71% |
| Supplemental Data | | | | | |
| Net assets, end of period (000 omitted) | $8,191 | $7,931 | $6,363 | $6,657 | $8,047 |
| Portfolio turnover rateF | 32% | 33% | 24% | 23% | 21% |
A Calculated based on average shares outstanding during the period.
B Total distributions of $.38 per share is comprised of distributions from net investment income of $.204 and distributions from net realized gain of $.172 per share.
C Total distributions of $.24 per share is comprised of distributions from net investment income of $.217 and distributions from net realized gain of $.025 per share.
D Total returns do not reflect charges attributable to your insurance company's separate account. Inclusion of these charges would reduce the total returns shown.
E Total returns would have been lower if certain expenses had not been reduced during the applicable periods shown.
F Amounts do not include the activity of the Underlying Funds.
G Expense ratios reflect operating expenses of the class. Expenses before reductions do not reflect amounts reimbursed by the investment adviser or reductions from expense offset arrangements and do not represent the amount paid by the class during periods when reimbursements or reductions occur. Expenses net of fee waivers reflect expenses after reimbursement by the investment adviser but prior to reductions from expense offset arrangements. Expenses net of all reductions represent the net expenses paid by the class but do not include expenses of the underlying funds in which the Fund invests.
H Amount represents less than .005%.
See accompanying notes which are an integral part of the financial statements.
VIP Freedom 2005 Portfolio Service Class
| Years ended December 31, | 2018 | 2017 | 2016 | 2015 | 2014 |
| Selected Per–Share Data | | | | | |
| Net asset value, beginning of period | $12.46 | $11.58 | $11.36 | $11.63 | $11.44 |
| Income from Investment Operations | | | | | |
| Net investment income (loss)A | .21 | .19 | .16 | .18 | .19 |
| Net realized and unrealized gain (loss) | (.58) | 1.06 | .38 | (.22) | .29 |
| Total from investment operations | (.37) | 1.25 | .54 | (.04) | .48 |
| Distributions from net investment income | (.20) | (.18) | (.17) | (.21) | (.18) |
| Distributions from net realized gain | (.17) | (.19) | (.15) | (.03) | (.11) |
| Total distributions | (.37) | (.37) | (.32) | (.23)B | (.29) |
| Net asset value, end of period | $11.72 | $12.46 | $11.58 | $11.36 | $11.63 |
| Total ReturnC,D | (3.01)% | 10.90% | 4.89% | (.35)% | 4.18% |
| Ratios to Average Net AssetsE,F | | | | | |
| Expenses before reductions | .10% | .10% | .10% | .10% | .10% |
| Expenses net of fee waivers, if any | .10% | .10% | .10% | .10% | .10% |
| Expenses net of all reductions | .10% | .10% | .10% | .10% | .10% |
| Net investment income (loss) | 1.70% | 1.55% | 1.40% | 1.54% | 1.61% |
| Supplemental Data | | | | | |
| Net assets, end of period (000 omitted) | $2,279 | $1,222 | $558 | $484 | $408 |
| Portfolio turnover rateE | 32% | 33% | 24% | 23% | 21% |
A Calculated based on average shares outstanding during the period.
B Total distributions of $.23 per share is comprised of distributions from net investment income of $.206 and distributions from net realized gain of $.025 per share.
C Total returns do not reflect charges attributable to your insurance company's separate account. Inclusion of these charges would reduce the total returns shown.
D Total returns would have been lower if certain expenses had not been reduced during the applicable periods shown.
E Amounts do not include the activity of the Underlying Funds.
F Expense ratios reflect operating expenses of the class. Expenses before reductions do not reflect amounts reimbursed by the investment adviser or reductions from expense offset arrangements and do not represent the amount paid by the class during periods when reimbursements or reductions occur. Expenses net of fee waivers reflect expenses after reimbursement by the investment adviser but prior to reductions from expense offset arrangements. Expenses net of all reductions represent the net expenses paid by the class but do not include expenses of the underlying funds in which the Fund invests.
See accompanying notes which are an integral part of the financial statements.
VIP Freedom 2005 Portfolio Service Class 2
| Years ended December 31, | 2018 | 2017 | 2016 | 2015 | 2014 |
| Selected Per–Share Data | | | | | |
| Net asset value, beginning of period | $12.37 | $11.50 | $11.28 | $11.55 | $11.36 |
| Income from Investment Operations | | | | | |
| Net investment income (loss)A | .19 | .17 | .14 | .16 | .17 |
| Net realized and unrealized gain (loss) | (.59) | 1.05 | .39 | (.21) | .29 |
| Total from investment operations | (.40) | 1.22 | .53 | (.05) | .46 |
| Distributions from net investment income | (.18) | (.16) | (.15) | (.19) | (.16) |
| Distributions from net realized gain | (.17) | (.19) | (.15) | (.03) | (.11) |
| Total distributions | (.35) | (.35) | (.31)B | (.22) | (.27) |
| Net asset value, end of period | $11.62 | $12.37 | $11.50 | $11.28 | $11.55 |
| Total ReturnC,D | (3.24)% | 10.74% | 4.78% | (.49)% | 4.04% |
| Ratios to Average Net AssetsE,F | | | | | |
| Expenses before reductions | .25% | .25% | .25% | .25% | .25% |
| Expenses net of fee waivers, if any | .25% | .25% | .25% | .25% | .25% |
| Expenses net of all reductions | .25% | .25% | .25% | .25% | .25% |
| Net investment income (loss) | 1.55% | 1.40% | 1.25% | 1.39% | 1.46% |
| Supplemental Data | | | | | |
| Net assets, end of period (000 omitted) | $121 | $104 | $83 | $92 | $79 |
| Portfolio turnover rateE | 32% | 33% | 24% | 23% | 21% |
A Calculated based on average shares outstanding during the period.
B Total distributions of $.31 per share is comprised of distributions from net investment income of $.152 and distributions from net realized gain of $.153 per share.
C Total returns do not reflect charges attributable to your insurance company's separate account. Inclusion of these charges would reduce the total returns shown.
D Total returns would have been lower if certain expenses had not been reduced during the applicable periods shown.
E Amounts do not include the activity of the Underlying Funds.
F Expense ratios reflect operating expenses of the class. Expenses before reductions do not reflect amounts reimbursed by the investment adviser or reductions from expense offset arrangements and do not represent the amount paid by the class during periods when reimbursements or reductions occur. Expenses net of fee waivers reflect expenses after reimbursement by the investment adviser but prior to reductions from expense offset arrangements. Expenses net of all reductions represent the net expenses paid by the class but do not include expenses of the underlying funds in which the Fund invests.
See accompanying notes which are an integral part of the financial statements.
VIP Freedom 2010 Portfolio℠
Investment Summary (Unaudited)
The information in the following tables is based on the direct investments of the Fund.
Top Holdings as of December 31, 2018
| | % of fund's net assets |
| VIP Investment Grade Bond Portfolio Initial Class | 29.5 |
| VIP Government Money Market Portfolio Initial Class 2.19% | 15.6 |
| Fidelity Inflation-Protected Bond Index Fund Institutional Premium Class | 9.5 |
| VIP Overseas Portfolio Initial Class | 9.2 |
| VIP Emerging Markets Portfolio Initial Class | 6.3 |
| Fidelity Long Term Treasury Bond Index Fund | 5.6 |
| VIP Growth & Income Portfolio Initial Class | 4.7 |
| VIP Equity-Income Portfolio Initial Class | 4.1 |
| VIP Growth Portfolio Initial Class | 4.0 |
| VIP Contrafund Portfolio Initial Class | 3.9 |
| | 92.4 |
Asset Allocation (% of fund's net assets)
| Period end |
| | Domestic Equity Funds | 22.3% |
| | International Equity Funds | 15.5% |
| | Bond Funds | 46.6% |
| | Short-Term Funds | 15.6% |

VIP Freedom 2010 Portfolio℠
Schedule of Investments December 31, 2018
Showing Percentage of Net Assets
| Domestic Equity Funds - 22.3% | | | |
| | | Shares | Value |
| VIP Contrafund Portfolio Initial Class (a) | | 346,820 | $11,143,332 |
| VIP Equity-Income Portfolio Initial Class (a) | | 573,831 | 11,688,933 |
| VIP Growth & Income Portfolio Initial Class (a) | | 687,547 | 13,324,664 |
| VIP Growth Portfolio Initial Class (a) | | 180,397 | 11,386,681 |
| VIP Mid Cap Portfolio Initial Class (a) | | 107,302 | 3,239,460 |
| VIP Value Portfolio Initial Class (a) | | 655,936 | 8,579,645 |
| VIP Value Strategies Portfolio Initial Class (a) | | 377,094 | 4,189,520 |
| TOTAL DOMESTIC EQUITY FUNDS | | | |
| (Cost $48,751,720) | | | 63,552,235 |
|
| International Equity Funds - 15.5% | | | |
| VIP Emerging Markets Portfolio Initial Class (a) | | 1,796,047 | 17,870,664 |
| VIP Overseas Portfolio Initial Class (a) | | 1,371,602 | 26,238,744 |
| TOTAL INTERNATIONAL EQUITY FUNDS | | | |
| (Cost $37,434,720) | | | 44,109,408 |
|
| Bond Funds - 46.6% | | | |
| Fidelity Inflation-Protected Bond Index Fund Institutional Premium Class (a) | | 2,839,250 | 26,944,479 |
| Fidelity Long Term Treasury Bond Index Fund (a) | | 1,266,942 | 16,064,831 |
| VIP High Income Portfolio Initial Class (a) | | 1,157,921 | 5,754,870 |
| VIP Investment Grade Bond Portfolio Initial Class (a) | | 6,804,808 | 83,971,336 |
| TOTAL BOND FUNDS | | | |
| (Cost $135,744,085) | | | 132,735,516 |
|
| Short-Term Funds - 15.6% | | | |
| Fidelity Cash Central Fund, 2.42% (b) | | 4 | 4 |
| VIP Government Money Market Portfolio Initial Class 2.19% (a)(c) | | 44,438,615 | 44,438,615 |
| TOTAL SHORT-TERM FUNDS | | | |
| (Cost $44,438,619) | | | 44,438,619 |
| TOTAL INVESTMENT IN SECURITIES - 100.0% | | | |
| (Cost $266,369,144) | | | 284,835,778 |
| NET OTHER ASSETS (LIABILITIES) - 0.0% | | | (54,172) |
| NET ASSETS - 100% | | | $284,781,606 |
Legend
(a) Affiliated Fund
(b) Affiliated fund that is generally available only to investment companies and other accounts managed by Fidelity Investments. The rate quoted is the annualized seven-day yield of the fund at period end. A complete unaudited listing of the fund's holdings as of its most recent quarter end is available upon request. In addition, each Fidelity Central Fund's financial statements, which are not covered by the Fund's Report of Independent Registered Public Accounting Firm, are available on the SEC's website or upon request.
(c) The rate quoted is the annualized seven-day yield of the fund at period end.
Affiliated Central Funds
Information regarding fiscal year to date income earned by the Fund from investments in Fidelity Central Funds is as follows:
| Fund | Income earned |
| Fidelity Cash Central Fund | $4 |
| Total | $4 |
Amounts in the income column in the above table include any capital gain distributions from underlying funds, which are presented in the corresponding line-item in the Statement of Operations if applicable.
Affiliated Underlying Funds
Fiscal year to date information regarding the Fund's investments in affiliated Underlying Funds, excluding any Money Market Central Funds, is presented below. Exchanges between classes of the same affiliated Underlying Funds may occur.
| Affiliate | Value, beginning of period | Purchases | Sales Proceeds | Dividend Income | Realized Gain (loss) | Change in Unrealized appreciation (depreciation) | Value, end of period |
| Fidelity Inflation-Protected Bond Index Fund Institutional Premium Class | $- | $29,870,865 | $2,014,644 | $566,954 | $(45,383) | $(866,359) | $26,944,479 |
| Fidelity Long Term Treasury Bond Index Fund | - | 1,383,056 | 1,895,131 | 79,382 | (82,535) | (15,710) | 16,064,831 |
| Fidelity Long-Term Treasury Bond Index Fund Institutional Class | 6,748,543 | 10,794,490 | 874,948 | 242,329 | (18,192) | 25,258 | - |
| VIP Contrafund Portfolio Initial Class | 14,831,156 | 3,345,769 | 5,285,320 | 1,299,083 | 841,180 | (2,589,453) | 11,143,332 |
| VIP Emerging Markets Portfolio Initial Class | 17,944,758 | 8,474,100 | 5,343,898 | 130,591 | 367,677 | (3,571,973) | 17,870,664 |
| VIP Equity-Income Portfolio Initial Class | 15,636,506 | 2,963,243 | 5,042,425 | 951,147 | 151,369 | (2,019,760) | 11,688,933 |
| VIP Government Money Market Portfolio Initial Class 2.19% | 64,233,154 | 6,846,421 | 26,640,960 | 897,255 | - | - | 44,438,615 |
| VIP Growth & Income Portfolio Initial Class | 17,936,671 | 3,391,184 | 5,960,731 | 1,013,060 | 1,352,619 | (3,395,079) | 13,324,664 |
| VIP Growth Portfolio Initial Class | 15,102,658 | 4,082,632 | 6,233,070 | 2,064,970 | 1,722,426 | (3,287,965) | 11,386,681 |
| VIP High Income Portfolio Initial Class | 6,276,464 | 935,685 | 924,847 | 338,526 | (38,207) | (494,225) | 5,754,870 |
| VIP Investment Grade Bond Portfolio Initial Class | 101,851,657 | 13,348,284 | 27,629,923 | 2,852,034 | (765,352) | (2,833,330) | 83,971,336 |
| VIP Mid Cap Portfolio Initial Class | 4,345,428 | 1,074,003 | 1,363,899 | 369,575 | 130,358 | (946,430) | 3,239,460 |
| VIP Overseas Portfolio Initial Class | 33,672,209 | 5,255,116 | 8,014,541 | 460,734 | 1,021,333 | (5,695,373) | 26,238,744 |
| VIP Value Portfolio Initial Class | 11,487,777 | 2,374,989 | 3,391,657 | 685,395 | 399,958 | (2,291,422) | 8,579,645 |
| VIP Value Strategies Portfolio Initial Class | 5,610,145 | 1,160,157 | 1,523,495 | 274,582 | 59,595 | (1,116,882) | 4,189,520 |
| Total | $315,677,126 | $95,299,994 | $102,139,489 | $12,225,617 | $5,096,846 | $(29,098,703) | $284,835,774 |
Amounts in the income column in the above table include any capital gain distributions from underlying funds, which are presented in the corresponding line-item in the Statement of Operations if applicable.
Investment Valuation
All investments are categorized as Level 1 under the Fair Value Hierarchy. The inputs or methodology used for valuing securities may not be an indication of the risk associated with investing in those securities. For more information on valuation inputs please refer to the Investment Valuation section in the accompanying Notes to Financial Statements.
See accompanying notes which are an integral part of the financial statements.
VIP Freedom 2010 Portfolio℠
Financial Statements
Statement of Assets and Liabilities
| | | December 31, 2018 |
| Assets | | |
Investment in securities, at value — See accompanying schedule:
| | |
| Fidelity Central Funds (cost $4) | $4 | |
| Other affiliated issuers (cost $266,369,140) | 284,835,774 | |
| Total Investment in Securities (cost $266,369,144) | | $284,835,778 |
| Cash | | 1 |
| Receivable for investments sold | | 5,421,623 |
| Receivable for fund shares sold | | 362,797 |
| Distributions receivable from Fidelity Central Funds | | 4 |
| Total assets | | 290,620,203 |
| Liabilities | | |
| Payable for investments purchased | $5,774,258 | |
| Payable for fund shares redeemed | 11,421 | |
| Distribution and service plan fees payable | 52,918 | |
| Total liabilities | | 5,838,597 |
| Net Assets | | $284,781,606 |
| Net Assets consist of: | | |
| Paid in capital | | $255,362,958 |
| Total distributable earnings (loss) | | 29,418,648 |
| Net Assets | | $284,781,606 |
| Net Asset Value and Maximum Offering Price | | |
| Initial Class: | | |
| Net Asset Value, offering price and redemption price per share ($16,990,632 ÷ 1,379,172 shares) | | $12.32 |
| Service Class: | | |
| Net Asset Value, offering price and redemption price per share ($23,851,457 ÷ 1,938,879 shares) | | $12.30 |
| Service Class 2: | | |
| Net Asset Value, offering price and redemption price per share ($243,939,517 ÷ 19,932,551 shares) | | $12.24 |
See accompanying notes which are an integral part of the financial statements.
Statement of Operations
| | | Year ended December 31, 2018 |
| Investment Income | | |
| Dividends: | | |
| Affiliated issuers | | $5,041,525 |
| Income from Fidelity Central Funds | | 4 |
| Total income | | 5,041,529 |
| Expenses | | |
| Distribution and service plan fees | $674,879 | |
| Independent trustees' fees and expenses | 1,699 | |
| Total expenses | | 676,578 |
| Net investment income (loss) | | 4,364,951 |
| Realized and Unrealized Gain (Loss) | | |
| Net realized gain (loss) on: | | |
| Investment securities: | | |
| Affiliated issuers | 5,096,846 | |
| Capital gain distributions from underlying funds: | | |
| Affiliated issuers | 7,184,092 | |
| Total net realized gain (loss) | | 12,280,938 |
| Change in net unrealized appreciation (depreciation) on: | | |
| Investment securities: | | |
| Affiliated issuers | (29,098,703) | |
| Total change in net unrealized appreciation (depreciation) | | (29,098,703) |
| Net gain (loss) | | (16,817,765) |
| Net increase (decrease) in net assets resulting from operations | | $(12,452,814) |
See accompanying notes which are an integral part of the financial statements.
Statement of Changes in Net Assets
| | Year ended December 31, 2018 | Year ended December 31, 2017 |
| Increase (Decrease) in Net Assets | | |
| Operations | | |
| Net investment income (loss) | $4,364,951 | $4,119,804 |
| Net realized gain (loss) | 12,280,938 | 10,286,083 |
| Change in net unrealized appreciation (depreciation) | (29,098,703) | 22,636,461 |
| Net increase (decrease) in net assets resulting from operations | (12,452,814) | 37,042,348 |
| Distributions to shareholders | (12,948,073) | – |
| Distributions to shareholders from net investment income | – | (4,061,300) |
| Distributions to shareholders from net realized gain | – | (6,289,111) |
| Total distributions | (12,948,073) | (10,350,411) |
| Share transactions - net increase (decrease) | (5,440,382) | (7,792,831) |
| Total increase (decrease) in net assets | (30,841,269) | 18,899,106 |
| Net Assets | | |
| Beginning of period | 315,622,875 | 296,723,769 |
| End of period | $284,781,606 | $315,622,875 |
| Other Information | | |
| Undistributed net investment income end of period | | $55,112 |
See accompanying notes which are an integral part of the financial statements.
Financial Highlights
VIP Freedom 2010 Portfolio Initial Class
| Years ended December 31, | 2018 | 2017 | 2016 | 2015 | 2014 |
| Selected Per–Share Data | | | | | |
| Net asset value, beginning of period | $13.43 | $12.31 | $12.15 | $12.45 | $12.30 |
| Income from Investment Operations | | | | | |
| Net investment income (loss)A | .22 | .20 | .18 | .23 | .21 |
| Net realized and unrealized gain (loss) | (.75) | 1.39 | .45 | (.26) | .34 |
| Total from investment operations | (.53) | 1.59 | .63 | (.03) | .55 |
| Distributions from net investment income | (.22) | (.21) | (.19) | (.23) | (.21) |
| Distributions from net realized gain | (.37) | (.26) | (.28) | (.04) | (.20) |
| Total distributions | (.58)B | (.47) | (.47) | (.27) | (.40)C |
| Net asset value, end of period | $12.32 | $13.43 | $12.31 | $12.15 | $12.45 |
| Total ReturnD,E | (4.00)% | 13.08% | 5.45% | (.29)% | 4.53% |
| Ratios to Average Net AssetsF,G | | | | | |
| Expenses before reductionsH | -% | -% | -% | -% | -% |
| Expenses net of fee waivers, if any | - %H | -% | -% | -% | -% |
| Expenses net of all reductions | - %H | -% | -% | -% | -% |
| Net investment income (loss) | 1.66% | 1.56% | 1.51% | 1.84% | 1.67% |
| Supplemental Data | | | | | |
| Net assets, end of period (000 omitted) | $16,991 | $18,519 | $19,569 | $31,048 | $43,381 |
| Portfolio turnover rateF | 31% | 22% | 23% | 19% | 19% |
A Calculated based on average shares outstanding during the period.
B Total distributions of $.58 per share is comprised of distributions from net investment income of $.216 and distributions from net realized gain of $.367 per share.
C Total distributions of $.40 per share is comprised of distributions from net investment income of $.206 and distributions from net realized gain of $.196 per share.
D Total returns do not reflect charges attributable to your insurance company's separate account. Inclusion of these charges would reduce the total returns shown.
E Total returns would have been lower if certain expenses had not been reduced during the applicable periods shown.
F Amounts do not include the activity of the Underlying Funds.
G Expense ratios reflect operating expenses of the class. Expenses before reductions do not reflect amounts reimbursed by the investment adviser or reductions from expense offset arrangements and do not represent the amount paid by the class during periods when reimbursements or reductions occur. Expenses net of fee waivers reflect expenses after reimbursement by the investment adviser but prior to reductions from expense offset arrangements. Expenses net of all reductions represent the net expenses paid by the class but do not include expenses of the underlying funds in which the Fund invests.
H Amount represents less than .005%.
See accompanying notes which are an integral part of the financial statements.
VIP Freedom 2010 Portfolio Service Class
| Years ended December 31, | 2018 | 2017 | 2016 | 2015 | 2014 |
| Selected Per–Share Data | | | | | |
| Net asset value, beginning of period | $13.41 | $12.30 | $12.14 | $12.43 | $12.29 |
| Income from Investment Operations | | | | | |
| Net investment income (loss)A | .20 | .19 | .17 | .22 | .20 |
| Net realized and unrealized gain (loss) | (.74) | 1.38 | .45 | (.26) | .33 |
| Total from investment operations | (.54) | 1.57 | .62 | (.04) | .53 |
| Distributions from net investment income | (.20) | (.19) | (.18) | (.22) | (.19) |
| Distributions from net realized gain | (.37) | (.26) | (.28) | (.04) | (.20) |
| Total distributions | (.57) | (.46)B | (.46) | (.25)C | (.39) |
| Net asset value, end of period | $12.30 | $13.41 | $12.30 | $12.14 | $12.43 |
| Total ReturnD,E | (4.10)% | 12.90% | 5.36% | (.31)% | 4.35% |
| Ratios to Average Net AssetsF,G | | | | | |
| Expenses before reductions | .10% | .10% | .10% | .10% | .10% |
| Expenses net of fee waivers, if any | .10% | .10% | .10% | .10% | .10% |
| Expenses net of all reductions | .10% | .10% | .10% | .10% | .10% |
| Net investment income (loss) | 1.56% | 1.46% | 1.41% | 1.74% | 1.57% |
| Supplemental Data | | | | | |
| Net assets, end of period (000 omitted) | $23,851 | $27,597 | $25,360 | $23,770 | $28,049 |
| Portfolio turnover rateF | 31% | 22% | 23% | 19% | 19% |
A Calculated based on average shares outstanding during the period.
B Total distributions of $.46 per share is comprised of distributions from net investment income of $.192 and distributions from net realized gain of $.264 per share.
C Total distributions of $.25 per share is comprised of distributions from net investment income of $.217 and distributions from net realized gain of $.036 per share.
D Total returns do not reflect charges attributable to your insurance company's separate account. Inclusion of these charges would reduce the total returns shown.
E Total returns would have been lower if certain expenses had not been reduced during the applicable periods shown.
F Amounts do not include the activity of the Underlying Funds.
G Expense ratios reflect operating expenses of the class. Expenses before reductions do not reflect amounts reimbursed by the investment adviser or reductions from expense offset arrangements and do not represent the amount paid by the class during periods when reimbursements or reductions occur. Expenses net of fee waivers reflect expenses after reimbursement by the investment adviser but prior to reductions from expense offset arrangements. Expenses net of all reductions represent the net expenses paid by the class but do not include expenses of the underlying funds in which the Fund invests.
See accompanying notes which are an integral part of the financial statements.
VIP Freedom 2010 Portfolio Service Class 2
| Years ended December 31, | 2018 | 2017 | 2016 | 2015 | 2014 |
| Selected Per–Share Data | | | | | |
| Net asset value, beginning of period | $13.35 | $12.24 | $12.08 | $12.38 | $12.24 |
| Income from Investment Operations | | | | | |
| Net investment income (loss)A | .18 | .17 | .15 | .20 | .18 |
| Net realized and unrealized gain (loss) | (.74) | 1.38 | .45 | (.26) | .33 |
| Total from investment operations | (.56) | 1.55 | .60 | (.06) | .51 |
| Distributions from net investment income | (.19) | (.17) | (.16) | (.20) | (.18) |
| Distributions from net realized gain | (.37) | (.26) | (.28) | (.04) | (.20) |
| Total distributions | (.55)B | (.44)C | (.44) | (.24) | (.37)D |
| Net asset value, end of period | $12.24 | $13.35 | $12.24 | $12.08 | $12.38 |
| Total ReturnE,F | (4.26)% | 12.80% | 5.23% | (.53)% | 4.21% |
| Ratios to Average Net AssetsG,H | | | | | |
| Expenses before reductions | .25% | .25% | .25% | .25% | .25% |
| Expenses net of fee waivers, if any | .25% | .25% | .25% | .25% | .25% |
| Expenses net of all reductions | .25% | .25% | .25% | .25% | .25% |
| Net investment income (loss) | 1.41% | 1.31% | 1.26% | 1.59% | 1.42% |
| Supplemental Data | | | | | |
| Net assets, end of period (000 omitted) | $243,940 | $269,507 | $251,795 | $237,969 | $224,300 |
| Portfolio turnover rateG | 31% | 22% | 23% | 19% | 19% |
A Calculated based on average shares outstanding during the period.
B Total distributions of $.55 per share is comprised of distributions from net investment income of $.186 and distributions from net realized gain of $.367 per share.
C Total distributions of $.44 per share is comprised of distributions from net investment income of $.172 and distributions from net realized gain of $.264 per share.
D Total distributions of $.37 per share is comprised of distributions from net investment income of $.175 and distributions from net realized gain of $.196 per share.
E Total returns do not reflect charges attributable to your insurance company's separate account. Inclusion of these charges would reduce the total returns shown.
F Total returns would have been lower if certain expenses had not been reduced during the applicable periods shown.
G Amounts do not include the activity of the Underlying Funds.
H Expense ratios reflect operating expenses of the class. Expenses before reductions do not reflect amounts reimbursed by the investment adviser or reductions from expense offset arrangements and do not represent the amount paid by the class during periods when reimbursements or reductions occur. Expenses net of fee waivers reflect expenses after reimbursement by the investment adviser but prior to reductions from expense offset arrangements. Expenses net of all reductions represent the net expenses paid by the class but do not include expenses of the underlying funds in which the Fund invests.
See accompanying notes which are an integral part of the financial statements.
VIP Freedom 2015 Portfolio℠
Investment Summary (Unaudited)
The information in the following tables is based on the direct investments of the Fund.
Top Holdings as of December 31, 2018
| | % of fund's net assets |
| VIP Investment Grade Bond Portfolio Initial Class | 25.9 |
| VIP Government Money Market Portfolio Initial Class 2.19% | 11.6 |
| VIP Overseas Portfolio Initial Class | 11.2 |
| Fidelity Inflation-Protected Bond Index Fund Institutional Premium Class | 8.1 |
| VIP Emerging Markets Portfolio Initial Class | 7.0 |
| VIP Growth & Income Portfolio Initial Class | 6.0 |
| Fidelity Long Term Treasury Bond Index Fund | 5.5 |
| VIP Equity-Income Portfolio Initial Class | 5.3 |
| VIP Growth Portfolio Initial Class | 5.1 |
| VIP Contrafund Portfolio Initial Class | 5.0 |
| | 90.7 |
Asset Allocation (% of fund's net assets)
| Period end |
| | Domestic Equity Funds | 28.7% |
| | International Equity Funds | 18.2% |
| | Bond Funds | 41.5% |
| | Short-Term Funds | 11.6% |

VIP Freedom 2015 Portfolio℠
Schedule of Investments December 31, 2018
Showing Percentage of Net Assets
| Domestic Equity Funds - 28.7% | | | |
| | | Shares | Value |
| VIP Contrafund Portfolio Initial Class (a) | | 119,426 | $3,837,163 |
| VIP Equity-Income Portfolio Initial Class (a) | | 197,597 | 4,025,054 |
| VIP Growth & Income Portfolio Initial Class (a) | | 236,762 | 4,588,440 |
| VIP Growth Portfolio Initial Class (a) | | 62,119 | 3,920,972 |
| VIP Mid Cap Portfolio Initial Class (a) | | 36,922 | 1,114,665 |
| VIP Value Portfolio Initial Class (a) | | 225,846 | 2,954,070 |
| VIP Value Strategies Portfolio Initial Class (a) | | 129,784 | 1,441,899 |
| TOTAL DOMESTIC EQUITY FUNDS | | | |
| (Cost $13,716,385) | | | 21,882,263 |
|
| International Equity Funds - 18.2% | | | |
| VIP Emerging Markets Portfolio Initial Class (a) | | 537,280 | 5,345,935 |
| VIP Overseas Portfolio Initial Class (a) | | 447,942 | 8,569,131 |
| TOTAL INTERNATIONAL EQUITY FUNDS | | | |
| (Cost $10,987,300) | | | 13,915,066 |
|
| Bond Funds - 41.5% | | | |
| Fidelity Inflation-Protected Bond Index Fund Institutional Premium Class (a) | | 650,821 | 6,176,291 |
| Fidelity Long Term Treasury Bond Index Fund (a) | | 331,013 | 4,197,239 |
| VIP High Income Portfolio Initial Class (a) | | 313,059 | 1,555,904 |
| VIP Investment Grade Bond Portfolio Initial Class (a) | | 1,601,893 | 19,767,364 |
| TOTAL BOND FUNDS | | | |
| (Cost $31,878,262) | | | 31,696,798 |
|
| Short-Term Funds - 11.6% | | | |
| VIP Government Money Market Portfolio Initial Class 2.19% (a)(b) | | | |
| (Cost $8,875,763) | | 8,875,763 | 8,875,763 |
| TOTAL INVESTMENT IN SECURITIES - 100.0% | | | |
| (Cost $65,457,710) | | | 76,369,890 |
| NET OTHER ASSETS (LIABILITIES) - 0.0% | | | (10,679) |
| NET ASSETS - 100% | | | $76,359,211 |
Legend
(a) Affiliated Fund
(b) The rate quoted is the annualized seven-day yield of the fund at period end.
Affiliated Underlying Funds
Fiscal year to date information regarding the Fund's investments in affiliated Underlying Funds, excluding any Money Market Central Funds, is presented below. Exchanges between classes of the same affiliated Underlying Funds may occur.
| Affiliate | Value, beginning of period | Purchases | Sales Proceeds | Dividend Income | Realized Gain (loss) | Change in Unrealized appreciation (depreciation) | Value, end of period |
| Fidelity Inflation-Protected Bond Index Fund Institutional Class | $- | $6,921,070 | $335,347 | $6,682 | $(4,943) | $- | $- |
| Fidelity Inflation-Protected Bond Index Fund Institutional Premium Class | - | 264,090 | 454,150 | 125,076 | (11,030) | (203,399) | 6,176,291 |
| Fidelity Long Term Treasury Bond Index Fund | - | 269,802 | 585,718 | 22,620 | (14,291) | (27,974) | 4,197,239 |
| Fidelity Long-Term Treasury Bond Index Fund Premium Class | 2,120,635 | 3,110,670 | 657,234 | 69,485 | (26,501) | 7,850 | - |
| VIP Contrafund Portfolio Initial Class | 5,794,662 | 1,304,759 | 2,626,334 | 505,715 | 409,273 | (1,045,197) | 3,837,163 |
| VIP Emerging Markets Portfolio Initial Class | 6,382,076 | 2,335,683 | 2,345,275 | 40,172 | 287,913 | (1,314,462) | 5,345,935 |
| VIP Equity-Income Portfolio Initial Class | 6,109,403 | 1,173,868 | 2,572,551 | 360,091 | 6,764 | (692,430) | 4,025,054 |
| VIP Government Money Market Portfolio Initial Class 2.19% | 14,959,255 | 2,016,015 | 8,099,507 | 195,756 | - | - | 8,875,763 |
| VIP Growth & Income Portfolio Initial Class | 7,008,599 | 1,351,009 | 3,027,891 | 392,966 | 804,424 | (1,547,701) | 4,588,440 |
| VIP Growth Portfolio Initial Class | 5,900,626 | 1,598,309 | 3,005,875 | 808,145 | 972,508 | (1,544,596) | 3,920,972 |
| VIP High Income Portfolio Initial Class | 1,985,779 | 344,906 | 627,310 | 94,630 | (3,794) | (143,677) | 1,555,904 |
| VIP Investment Grade Bond Portfolio Initial Class | 28,656,794 | 4,665,694 | 12,579,545 | 721,592 | (210,549) | (765,030) | 19,767,364 |
| VIP Mid Cap Portfolio Initial Class | 1,698,024 | 422,728 | 710,855 | 143,092 | 68,299 | (363,531) | 1,114,665 |
| VIP Overseas Portfolio Initial Class | 12,708,972 | 1,958,233 | 4,519,731 | 153,541 | 551,675 | (2,130,018) | 8,569,131 |
| VIP Value Portfolio Initial Class | 4,488,546 | 925,527 | 1,779,105 | 254,965 | 221,032 | (901,930) | 2,954,070 |
| VIP Value Strategies Portfolio Initial Class | 2,192,051 | 452,855 | 820,952 | 102,883 | 34,139 | (416,194) | 1,441,899 |
| Total | $100,005,422 | $29,115,218 | $44,747,380 | $3,997,411 | $3,084,919 | $(11,088,289) | $76,369,890 |
Amounts in the income column in the above table include any capital gain distributions from underlying funds, which are presented in the corresponding line-item in the Statement of Operations if applicable.
Investment Valuation
All investments are categorized as Level 1 under the Fair Value Hierarchy. The inputs or methodology used for valuing securities may not be an indication of the risk associated with investing in those securities. For more information on valuation inputs please refer to the Investment Valuation section in the accompanying Notes to Financial Statements.
See accompanying notes which are an integral part of the financial statements.
VIP Freedom 2015 Portfolio℠
Financial Statements
Statement of Assets and Liabilities
| | | December 31, 2018 |
| Assets | | |
Investment in securities, at value — See accompanying schedule:
| | |
| Affiliated issuers (cost $65,457,710) | $76,369,890 | |
| Total Investment in Securities (cost $65,457,710) | | $76,369,890 |
| Receivable for investments sold | | 1,652,516 |
| Receivable for fund shares sold | | 54,973 |
| Total assets | | 78,077,379 |
| Liabilities | | |
| Payable to custodian bank | $25 | |
| Payable for investments purchased | 1,680,425 | |
| Payable for fund shares redeemed | 29,315 | |
| Distribution and service plan fees payable | 8,403 | |
| Total liabilities | | 1,718,168 |
| Net Assets | | $76,359,211 |
| Net Assets consist of: | | |
| Paid in capital | | $60,195,148 |
| Total distributable earnings (loss) | | 16,164,063 |
| Net Assets | | $76,359,211 |
| Net Asset Value and Maximum Offering Price | | |
| Initial Class: | | |
| Net Asset Value, offering price and redemption price per share ($29,360,682 ÷ 2,394,372 shares) | | $12.26 |
| Service Class: | | |
| Net Asset Value, offering price and redemption price per share ($11,776,521 ÷ 962,037 shares) | | $12.24 |
| Service Class 2: | | |
| Net Asset Value, offering price and redemption price per share ($35,222,008 ÷ 2,886,691 shares) | | $12.20 |
See accompanying notes which are an integral part of the financial statements.
Statement of Operations
| | | Year ended December 31, 2018 |
| Investment Income | | |
| Dividends: | | |
| Affiliated issuers | | $1,357,775 |
| Expenses | | |
| Distribution and service plan fees | $121,000 | |
| Independent trustees' fees and expenses | 514 | |
| Total expenses before reductions | 121,514 | |
| Expense reductions | (1) | |
| Total expenses after reductions | | 121,513 |
| Net investment income (loss) | | 1,236,262 |
| Realized and Unrealized Gain (Loss) | | |
| Net realized gain (loss) on: | | |
| Investment securities: | | |
| Affiliated issuers | 3,084,919 | |
| Capital gain distributions from underlying funds: | | |
| Affiliated issuers | 2,639,636 | |
| Total net realized gain (loss) | | 5,724,555 |
| Change in net unrealized appreciation (depreciation) on: | | |
| Investment securities: | | |
| Affiliated issuers | (11,088,289) | |
| Total change in net unrealized appreciation (depreciation) | | (11,088,289) |
| Net gain (loss) | | (5,363,734) |
| Net increase (decrease) in net assets resulting from operations | | $(4,127,472) |
See accompanying notes which are an integral part of the financial statements.
Statement of Changes in Net Assets
| | Year ended December 31, 2018 | Year ended December 31, 2017 |
| Increase (Decrease) in Net Assets | | |
| Operations | | |
| Net investment income (loss) | $1,236,262 | $1,369,663 |
| Net realized gain (loss) | 5,724,555 | 4,312,903 |
| Change in net unrealized appreciation (depreciation) | (11,088,289) | 8,280,832 |
| Net increase (decrease) in net assets resulting from operations | (4,127,472) | 13,963,398 |
| Distributions to shareholders | (5,006,805) | – |
| Distributions to shareholders from net investment income | – | (1,353,095) |
| Distributions to shareholders from net realized gain | – | (2,668,129) |
| Total distributions | (5,006,805) | (4,021,224) |
| Share transactions - net increase (decrease) | (14,501,118) | (7,289,087) |
| Total increase (decrease) in net assets | (23,635,395) | 2,653,087 |
| Net Assets | | |
| Beginning of period | 99,994,606 | 97,341,519 |
| End of period | $76,359,211 | $99,994,606 |
| Other Information | | |
| Undistributed net investment income end of period | | $16,569 |
See accompanying notes which are an integral part of the financial statements.
Financial Highlights
VIP Freedom 2015 Portfolio Initial Class
| Years ended December 31, | 2018 | 2017 | 2016 | 2015 | 2014 |
| Selected Per–Share Data | | | | | |
| Net asset value, beginning of period | $13.68 | $12.39 | $12.24 | $12.58 | $12.43 |
| Income from Investment Operations | | | | | |
| Net investment income (loss)A | .20 | .20 | .18 | .23 | .21 |
| Net realized and unrealized gain (loss) | (.87) | 1.64 | .50 | (.27) | .37 |
| Total from investment operations | (.67) | 1.84 | .68 | (.04) | .58 |
| Distributions from net investment income | (.22) | (.21) | (.19) | (.24) | (.21) |
| Distributions from net realized gain | (.53) | (.34) | (.34) | (.07) | (.22) |
| Total distributions | (.75) | (.55) | (.53) | (.30)B | (.43) |
| Net asset value, end of period | $12.26 | $13.68 | $12.39 | $12.24 | $12.58 |
| Total ReturnC,D | (5.07)% | 15.10% | 5.91% | (.33)% | 4.70% |
| Ratios to Average Net AssetsE,F | | | | | |
| Expenses before reductionsG | -% | -% | -% | -% | -% |
| Expenses net of fee waivers, if any | - %G | -% | -% | -% | -% |
| Expenses net of all reductions | - %G | -% | -% | -% | -% |
| Net investment income (loss) | 1.52% | 1.51% | 1.46% | 1.82% | 1.68% |
| Supplemental Data | | | | | |
| Net assets, end of period (000 omitted) | $29,361 | $33,249 | $32,720 | $35,352 | $39,455 |
| Portfolio turnover rateE | 33% | 27% | 24% | 27% | 29% |
A Calculated based on average shares outstanding during the period.
B Total distributions of $.30 per share is comprised of distributions from net investment income of $.236 and distributions from net realized gain of $.065 per share.
C Total returns do not reflect charges attributable to your insurance company's separate account. Inclusion of these charges would reduce the total returns shown.
D Total returns would have been lower if certain expenses had not been reduced during the applicable periods shown.
E Amounts do not include the activity of the Underlying Funds.
F Expense ratios reflect operating expenses of the class. Expenses before reductions do not reflect amounts reimbursed by the investment adviser or reductions from expense offset arrangements and do not represent the amount paid by the class during periods when reimbursements or reductions occur. Expenses net of fee waivers reflect expenses after reimbursement by the investment adviser but prior to reductions from expense offset arrangements. Expenses net of all reductions represent the net expenses paid by the class but do not include expenses of the underlying funds in which the Fund invests.
G Amount represents less than .005%.
See accompanying notes which are an integral part of the financial statements.
VIP Freedom 2015 Portfolio Service Class
| Years ended December 31, | 2018 | 2017 | 2016 | 2015 | 2014 |
| Selected Per–Share Data | | | | | |
| Net asset value, beginning of period | $13.65 | $12.37 | $12.22 | $12.56 | $12.41 |
| Income from Investment Operations | | | | | |
| Net investment income (loss)A | .19 | .18 | .17 | .22 | .20 |
| Net realized and unrealized gain (loss) | (.86) | 1.64 | .50 | (.27) | .37 |
| Total from investment operations | (.67) | 1.82 | .67 | (.05) | .57 |
| Distributions from net investment income | (.20) | (.19) | (.18) | (.22) | (.20) |
| Distributions from net realized gain | (.53) | (.34) | (.34) | (.07) | (.22) |
| Total distributions | (.74)B | (.54)C | (.52) | (.29) | (.42) |
| Net asset value, end of period | $12.24 | $13.65 | $12.37 | $12.22 | $12.56 |
| Total ReturnD,E | (5.11)% | 14.93% | 5.81% | (.44)% | 4.63% |
| Ratios to Average Net AssetsF,G | | | | | |
| Expenses before reductions | .10% | .10% | .10% | .10% | .10% |
| Expenses net of fee waivers, if any | .10% | .10% | .10% | .10% | .10% |
| Expenses net of all reductions | .10% | .10% | .10% | .10% | .10% |
| Net investment income (loss) | 1.42% | 1.41% | 1.36% | 1.72% | 1.58% |
| Supplemental Data | | | | | |
| Net assets, end of period (000 omitted) | $11,777 | $17,058 | $14,384 | $16,378 | $15,842 |
| Portfolio turnover rateF | 33% | 27% | 24% | 27% | 29% |
A Calculated based on average shares outstanding during the period.
B Total distributions of $.74 per share is comprised of distributions from net investment income of $.203 and distributions from net realized gain of $.532 per share.
C Total distributions of $.54 per share is comprised of distributions from net investment income of $.193 and distributions from net realized gain of $.343 per share.
D Total returns do not reflect charges attributable to your insurance company's separate account. Inclusion of these charges would reduce the total returns shown.
E Total returns would have been lower if certain expenses had not been reduced during the applicable periods shown.
F Amounts do not include the activity of the Underlying Funds.
G Expense ratios reflect operating expenses of the class. Expenses before reductions do not reflect amounts reimbursed by the investment adviser or reductions from expense offset arrangements and do not represent the amount paid by the class during periods when reimbursements or reductions occur. Expenses net of fee waivers reflect expenses after reimbursement by the investment adviser but prior to reductions from expense offset arrangements. Expenses net of all reductions represent the net expenses paid by the class but do not include expenses of the underlying funds in which the Fund invests.
See accompanying notes which are an integral part of the financial statements.
VIP Freedom 2015 Portfolio Service Class 2
| Years ended December 31, | 2018 | 2017 | 2016 | 2015 | 2014 |
| Selected Per–Share Data | | | | | |
| Net asset value, beginning of period | $13.61 | $12.33 | $12.19 | $12.52 | $12.37 |
| Income from Investment Operations | | | | | |
| Net investment income (loss)A | .17 | .16 | .15 | .20 | .18 |
| Net realized and unrealized gain (loss) | (.86) | 1.63 | .49 | (.26) | .37 |
| Total from investment operations | (.69) | 1.79 | .64 | (.06) | .55 |
| Distributions from net investment income | (.18) | (.17) | (.16) | (.20) | (.18) |
| Distributions from net realized gain | (.53) | (.34) | (.34) | (.07) | (.22) |
| Total distributions | (.72)B | (.51) | (.50) | (.27) | (.40) |
| Net asset value, end of period | $12.20 | $13.61 | $12.33 | $12.19 | $12.52 |
| Total ReturnC,D | (5.28)% | 14.80% | 5.58% | (.51)% | 4.45% |
| Ratios to Average Net AssetsE,F | | | | | |
| Expenses before reductions | .25% | .25% | .25% | .25% | .25% |
| Expenses net of fee waivers, if any | .25% | .25% | .25% | .25% | .25% |
| Expenses net of all reductions | .25% | .25% | .25% | .25% | .25% |
| Net investment income (loss) | 1.27% | 1.26% | 1.21% | 1.57% | 1.43% |
| Supplemental Data | | | | | |
| Net assets, end of period (000 omitted) | $35,222 | $49,688 | $50,238 | $57,679 | $63,321 |
| Portfolio turnover rateE | 33% | 27% | 24% | 27% | 29% |
A Calculated based on average shares outstanding during the period.
B Total distributions of $.72 per share is comprised of distributions from net investment income of $.183 and distributions from net realized gain of $.532 per share
C Total returns do not reflect charges attributable to your insurance company's separate account. Inclusion of these charges would reduce the total returns shown.
D Total returns would have been lower if certain expenses had not been reduced during the applicable periods shown.
E Amounts do not include the activity of the Underlying Funds.
F Expense ratios reflect operating expenses of the class. Expenses before reductions do not reflect amounts reimbursed by the investment adviser or reductions from expense offset arrangements and do not represent the amount paid by the class during periods when reimbursements or reductions occur. Expenses net of fee waivers reflect expenses after reimbursement by the investment adviser but prior to reductions from expense offset arrangements. Expenses net of all reductions represent the net expenses paid by the class but do not include expenses of the underlying funds in which the Fund invests.
See accompanying notes which are an integral part of the financial statements.
VIP Freedom 2020 Portfolio℠
Investment Summary (Unaudited)
The information in the following tables is based on the direct investments of the Fund.
Top Holdings as of December 31, 2018
| | % of fund's net assets |
| VIP Investment Grade Bond Portfolio Initial Class | 23.1 |
| VIP Overseas Portfolio Initial Class | 12.9 |
| VIP Government Money Market Portfolio Initial Class 2.19% | 8.1 |
| VIP Emerging Markets Portfolio Initial Class | 7.6 |
| VIP Growth & Income Portfolio Initial Class | 7.1 |
| Fidelity Inflation-Protected Bond Index Fund Institutional Premium Class | 7.1 |
| VIP Equity-Income Portfolio Initial Class | 6.2 |
| VIP Growth Portfolio Initial Class | 6.1 |
| VIP Contrafund Portfolio Initial Class | 6.0 |
| Fidelity Long Term Treasury Bond Index Fund | 5.3 |
| | 89.5 |
Asset Allocation (% of fund's net assets)
| Period end |
| | Domestic Equity Funds | 33.9% |
| | International Equity Funds | 20.5% |
| | Bond Funds | 37.5% |
| | Short-Term Funds | 8.1% |

VIP Freedom 2020 Portfolio℠
Schedule of Investments December 31, 2018
Showing Percentage of Net Assets
| Domestic Equity Funds - 33.9% | | | |
| | | Shares | Value |
| VIP Contrafund Portfolio Initial Class (a) | | 1,220,030 | $39,199,577 |
| VIP Equity-Income Portfolio Initial Class (a) | | 2,018,608 | 41,119,044 |
| VIP Growth & Income Portfolio Initial Class (a) | | 2,418,779 | 46,875,944 |
| VIP Growth Portfolio Initial Class (a) | | 634,598 | 40,055,816 |
| VIP Mid Cap Portfolio Initial Class (a) | | 376,895 | 11,378,471 |
| VIP Value Portfolio Initial Class (a) | | 2,306,958 | 30,175,011 |
| VIP Value Strategies Portfolio Initial Class (a) | | 1,325,148 | 14,722,394 |
| TOTAL DOMESTIC EQUITY FUNDS | | | |
| (Cost $156,756,667) | | | 223,526,257 |
|
| International Equity Funds - 20.5% | | | |
| VIP Emerging Markets Portfolio Initial Class (a) | | 5,054,807 | 50,295,333 |
| VIP Overseas Portfolio Initial Class (a) | | 4,440,753 | 84,951,612 |
| TOTAL INTERNATIONAL EQUITY FUNDS | | | |
| (Cost $112,315,869) | | | 135,246,945 |
|
| Bond Funds - 37.5% | | | |
| Fidelity Inflation-Protected Bond Index Fund Institutional Premium Class (a) | | 4,914,121 | 46,635,006 |
| Fidelity Long Term Treasury Bond Index Fund (a) | | 2,759,950 | 34,996,167 |
| VIP High Income Portfolio Initial Class (a) | | 2,682,666 | 13,332,850 |
| VIP Investment Grade Bond Portfolio Initial Class (a) | | 12,342,631 | 152,308,072 |
| TOTAL BOND FUNDS | | | |
| (Cost $254,074,289) | | | 247,272,095 |
|
| Short-Term Funds - 8.1% | | | |
| VIP Government Money Market Portfolio Initial Class 2.19% (a)(b) | | | |
| (Cost $53,825,731) | | 53,825,731 | 53,825,731 |
| TOTAL INVESTMENT IN SECURITIES - 100.0% | | | |
| (Cost $576,972,556) | | | 659,871,028 |
| NET OTHER ASSETS (LIABILITIES) - 0.0% | | | (116,538) |
| NET ASSETS - 100% | | | $659,754,490 |
Legend
(a) Affiliated Fund
(b) The rate quoted is the annualized seven-day yield of the fund at period end.
Affiliated Underlying Funds
Fiscal year to date information regarding the Fund's investments in affiliated Underlying Funds, excluding any Money Market Central Funds, is presented below. Exchanges between classes of the same affiliated Underlying Funds may occur.
| Affiliate | Value, beginning of period | Purchases | Sales Proceeds | Dividend Income | Realized Gain (loss) | Change in Unrealized appreciation (depreciation) | Value, end of period |
| Fidelity Inflation-Protected Bond Index Fund Institutional Class | $- | $51,857,246 | $1,677,691 | $52,920 | $(33,743) | $- | $- |
| Fidelity Inflation-Protected Bond Index Fund Institutional Premium Class | - | 1,443,214 | 3,336,100 | 943,020 | (96,242) | (1,521,678) | 46,635,006 |
| Fidelity Long Term Treasury Bond Index Fund | - | 1,550,167 | 4,478,603 | 176,211 | (189,390) | (235,970) | 34,996,167 |
| Fidelity Long-Term Treasury Bond Index Fund Institutional Class | 16,414,453 | 24,596,168 | 2,654,697 | 582,530 | (67,658) | 61,697 | - |
| VIP Contrafund Portfolio Initial Class | 51,180,559 | 9,872,061 | 15,421,106 | 4,572,552 | 2,210,768 | (8,642,705) | 39,199,577 |
| VIP Emerging Markets Portfolio Initial Class | 53,405,909 | 19,088,155 | 12,576,656 | 377,403 | 983,095 | (10,605,170) | 50,295,333 |
| VIP Equity-Income Portfolio Initial Class | 53,960,420 | 9,549,082 | 15,641,225 | 3,354,850 | 406,086 | (7,155,319) | 41,119,044 |
| VIP Government Money Market Portfolio Initial Class 2.19% | 83,819,484 | 9,125,641 | 39,119,394 | 1,152,184 | - | - | 53,825,731 |
| VIP Growth & Income Portfolio Initial Class | 61,900,208 | 10,659,996 | 18,258,088 | 3,566,580 | 4,363,742 | (11,789,914) | 46,875,944 |
| VIP Growth Portfolio Initial Class | 52,116,402 | 12,588,342 | 18,851,647 | 7,259,316 | 4,546,776 | (10,344,057) | 40,055,816 |
| VIP High Income Portfolio Initial Class | 15,320,487 | 2,392,777 | 3,132,694 | 794,549 | (47,468) | (1,200,252) | 13,332,850 |
| VIP Investment Grade Bond Portfolio Initial Class | 200,510,616 | 27,583,762 | 68,766,273 | 5,413,605 | (2,235,260) | (4,784,773) | 152,308,072 |
| VIP Mid Cap Portfolio Initial Class | 14,996,962 | 3,211,799 | 3,867,739 | 1,301,395 | 323,296 | (3,285,847) | 11,378,471 |
| VIP Overseas Portfolio Initial Class | 109,627,518 | 14,197,496 | 23,090,488 | 1,519,789 | 2,706,494 | (18,489,408) | 84,951,612 |
| VIP Value Portfolio Initial Class | 39,644,129 | 7,068,873 | 9,668,908 | 2,419,114 | 970,496 | (7,839,579) | 30,175,011 |
| VIP Value Strategies Portfolio Initial Class | 19,360,794 | 3,480,436 | 4,293,502 | 967,812 | 75,020 | (3,900,354) | 14,722,394 |
| Total | $772,257,941 | $208,265,215 | $244,834,811 | $34,453,830 | $13,916,012 | $(89,733,329) | $659,871,028 |
Amounts in the income column in the above table include any capital gain distributions from underlying funds, which are presented in the corresponding line-item in the Statement of Operations if applicable.
Investment Valuation
All investments are categorized as Level 1 under the Fair Value Hierarchy. The inputs or methodology used for valuing securities may not be an indication of the risk associated with investing in those securities. For more information on valuation inputs please refer to the Investment Valuation section in the accompanying Notes to Financial Statements.
See accompanying notes which are an integral part of the financial statements.
VIP Freedom 2020 Portfolio℠
Financial Statements
Statement of Assets and Liabilities
| | | December 31, 2018 |
| Assets | | |
Investment in securities, at value — See accompanying schedule:
| | |
| Affiliated issuers (cost $576,972,556) | $659,871,028 | |
| Total Investment in Securities (cost $576,972,556) | | $659,871,028 |
| Cash | | 167 |
| Receivable for investments sold | | 15,560,010 |
| Receivable for fund shares sold | | 104,922 |
| Distributions receivable from Fidelity Central Funds | | 16 |
| Total assets | | 675,536,143 |
| Liabilities | | |
| Payable for investments purchased | $14,562,016 | |
| Payable for fund shares redeemed | 1,111,064 | |
| Distribution and service plan fees payable | 108,573 | |
| Total liabilities | | 15,781,653 |
| Net Assets | | $659,754,490 |
| Net Assets consist of: | | |
| Paid in capital | | $543,250,118 |
| Total distributable earnings (loss) | | 116,504,372 |
| Net Assets | | $659,754,490 |
| Net Asset Value and Maximum Offering Price | | |
| Initial Class: | | |
| Net Asset Value, offering price and redemption price per share ($63,490,000 ÷ 5,048,676 shares) | | $12.58 |
| Service Class: | | |
| Net Asset Value, offering price and redemption price per share ($132,086,470 ÷ 10,533,771 shares) | | $12.54 |
| Service Class 2: | | |
| Net Asset Value, offering price and redemption price per share ($464,178,020 ÷ 37,139,581 shares) | | $12.50 |
See accompanying notes which are an integral part of the financial statements.
Statement of Operations
| | | Year ended December 31, 2018 |
| Investment Income | | |
| Dividends: | | |
| Affiliated issuers | | $11,071,087 |
| Expenses | | |
| Distribution and service plan fees | $1,449,448 | |
| Independent trustees' fees and expenses | 4,146 | |
| Total expenses before reductions | 1,453,594 | |
| Expense reductions | (5) | |
| Total expenses after reductions | | 1,453,589 |
| Net investment income (loss) | | 9,617,498 |
| Realized and Unrealized Gain (Loss) | | |
| Net realized gain (loss) on: | | |
| Investment securities: | | |
| Affiliated issuers | 13,916,012 | |
| Capital gain distributions from underlying funds: | | |
| Affiliated issuers | 23,382,743 | |
| Total net realized gain (loss) | | 37,298,755 |
| Change in net unrealized appreciation (depreciation) on: | | |
| Investment securities: | | |
| Affiliated issuers | (89,733,329) | |
| Total change in net unrealized appreciation (depreciation) | | (89,733,329) |
| Net gain (loss) | | (52,434,574) |
| Net increase (decrease) in net assets resulting from operations | | $(42,817,076) |
See accompanying notes which are an integral part of the financial statements.
Statement of Changes in Net Assets
| | Year ended December 31, 2018 | Year ended December 31, 2017 |
| Increase (Decrease) in Net Assets | | |
| Operations | | |
| Net investment income (loss) | $9,617,498 | $9,965,308 |
| Net realized gain (loss) | 37,298,755 | 27,977,499 |
| Change in net unrealized appreciation (depreciation) | (89,733,329) | 74,412,671 |
| Net increase (decrease) in net assets resulting from operations | (42,817,076) | 112,355,478 |
| Distributions to shareholders | (33,509,898) | – |
| Distributions to shareholders from net investment income | – | (9,886,534) |
| Distributions to shareholders from net realized gain | – | (20,593,383) |
| Total distributions | (33,509,898) | (30,479,917) |
| Share transactions - net increase (decrease) | (36,054,272) | (13,668,503) |
| Total increase (decrease) in net assets | (112,381,246) | 68,207,058 |
| Net Assets | | |
| Beginning of period | 772,135,736 | 703,928,678 |
| End of period | $659,754,490 | $772,135,736 |
| Other Information | | |
| Undistributed net investment income end of period | | $33,445 |
See accompanying notes which are an integral part of the financial statements.
Financial Highlights
VIP Freedom 2020 Portfolio Initial Class
| Years ended December 31, | 2018 | 2017 | 2016 | 2015 | 2014 |
| Selected Per–Share Data | | | | | |
| Net asset value, beginning of period | $14.03 | $12.56 | $12.44 | $12.77 | $12.61 |
| Income from Investment Operations | | | | | |
| Net investment income (loss)A | .21 | .21 | .18 | .24 | .22 |
| Net realized and unrealized gain (loss) | (1.01) | 1.84 | .53 | (.27) | .38 |
| Total from investment operations | (.80) | 2.05 | .71 | (.03) | .60 |
| Distributions from net investment income | (.21) | (.21) | (.19) | (.24) | (.22) |
| Distributions from net realized gain | (.44) | (.37) | (.39) | (.06) | (.23) |
| Total distributions | (.65) | (.58) | (.59)B | (.30) | (.44)C |
| Net asset value, end of period | $12.58 | $14.03 | $12.56 | $12.44 | $12.77 |
| Total ReturnD,E | (5.86)% | 16.62% | 6.12% | (.27)% | 4.82% |
| Ratios to Average Net AssetsF,G | | | | | |
| Expenses before reductionsH | -% | -% | -% | -% | -% |
| Expenses net of fee waivers, if any | - %H | -% | -% | -% | -% |
| Expenses net of all reductions | - %H | -% | -% | -% | -% |
| Net investment income (loss) | 1.50% | 1.54% | 1.50% | 1.84% | 1.70% |
| Supplemental Data | | | | | |
| Net assets, end of period (000 omitted) | $63,490 | $75,021 | $63,131 | $87,496 | $101,533 |
| Portfolio turnover rateF | 28% | 21% | 19% | 17% | 15% |
A Calculated based on average shares outstanding during the period.
B Total distributions of $.59 per share is comprised of distributions from net investment income of $.193 and distributions from net realized gain of $.393 per share.
C Total distributions of $.44 per share is comprised of distributions from net investment income of $.216 and distributions from net realized gain of $.227 per share.
D Total returns do not reflect charges attributable to your insurance company's separate account. Inclusion of these charges would reduce the total returns shown.
E Total returns would have been lower if certain expenses had not been reduced during the applicable periods shown.
F Amounts do not include the activity of the Underlying Funds.
G Expense ratios reflect operating expenses of the class. Expenses before reductions do not reflect amounts reimbursed by the investment adviser or reductions from expense offset arrangements and do not represent the amount paid by the class during periods when reimbursements or reductions occur. Expenses net of fee waivers reflect expenses after reimbursement by the investment adviser but prior to reductions from expense offset arrangements. Expenses net of all reductions represent the net expenses paid by the class but do not include expenses of the underlying funds in which the Fund invests.
H Amount represents less than .005%.
See accompanying notes which are an integral part of the financial statements.
VIP Freedom 2020 Portfolio Service Class
| Years ended December 31, | 2018 | 2017 | 2016 | 2015 | 2014 |
| Selected Per–Share Data | | | | | |
| Net asset value, beginning of period | $13.99 | $12.53 | $12.41 | $12.74 | $12.59 |
| Income from Investment Operations | | | | | |
| Net investment income (loss)A | .19 | .19 | .17 | .23 | .20 |
| Net realized and unrealized gain (loss) | (1.00) | 1.84 | .53 | (.27) | .38 |
| Total from investment operations | (.81) | 2.03 | .70 | (.04) | .58 |
| Distributions from net investment income | (.20) | (.20) | (.18) | (.23) | (.21) |
| Distributions from net realized gain | (.44) | (.37) | (.39) | (.06) | (.23) |
| Total distributions | (.64) | (.57) | (.58)B | (.29) | (.43)C |
| Net asset value, end of period | $12.54 | $13.99 | $12.53 | $12.41 | $12.74 |
| Total ReturnD,E | (5.98)% | 16.47% | 6.04% | (.37)% | 4.66% |
| Ratios to Average Net AssetsF,G | | | | | |
| Expenses before reductions | .10% | .10% | .10% | .10% | .10% |
| Expenses net of fee waivers, if any | .10% | .10% | .10% | .10% | .10% |
| Expenses net of all reductions | .10% | .10% | .10% | .10% | .10% |
| Net investment income (loss) | 1.40% | 1.44% | 1.40% | 1.74% | 1.60% |
| Supplemental Data | | | | | |
| Net assets, end of period (000 omitted) | $132,086 | $140,686 | $109,279 | $94,022 | $76,679 |
| Portfolio turnover rateF | 28% | 21% | 19% | 17% | 15% |
A Calculated based on average shares outstanding during the period.
B Total distributions of $.58 per share is comprised of distributions from net investment income of $.182 and distributions from net realized gain of $.393 per share.
C Total distributions of $.43 per share is comprised of distributions from net investment income of $.205 and distributions from net realized gain of $.227 per share.
D Total returns do not reflect charges attributable to your insurance company's separate account. Inclusion of these charges would reduce the total returns shown.
E Total returns would have been lower if certain expenses had not been reduced during the applicable periods shown.
F Amounts do not include the activity of the Underlying Funds.
G Expense ratios reflect operating expenses of the class. Expenses before reductions do not reflect amounts reimbursed by the investment adviser or reductions from expense offset arrangements and do not represent the amount paid by the class during periods when reimbursements or reductions occur. Expenses net of fee waivers reflect expenses after reimbursement by the investment adviser but prior to reductions from expense offset arrangements. Expenses net of all reductions represent the net expenses paid by the class but do not include expenses of the underlying funds in which the Fund invests.
See accompanying notes which are an integral part of the financial statements.
VIP Freedom 2020 Portfolio Service Class 2
| Years ended December 31, | 2018 | 2017 | 2016 | 2015 | 2014 |
| Selected Per–Share Data | | | | | |
| Net asset value, beginning of period | $13.94 | $12.49 | $12.38 | $12.70 | $12.54 |
| Income from Investment Operations | | | | | |
| Net investment income (loss)A | .17 | .17 | .15 | .21 | .18 |
| Net realized and unrealized gain (loss) | (.99) | 1.83 | .51 | (.27) | .39 |
| Total from investment operations | (.82) | 2.00 | .66 | (.06) | .57 |
| Distributions from net investment income | (.18) | (.17) | (.16) | (.21) | (.18) |
| Distributions from net realized gain | (.44) | (.37) | (.39) | (.06) | (.23) |
| Total distributions | (.62) | (.55)B | (.55) | (.26)C | (.41) |
| Net asset value, end of period | $12.50 | $13.94 | $12.49 | $12.38 | $12.70 |
| Total ReturnD,E | (6.08)% | 16.26% | 5.80% | (.46)% | 4.60% |
| Ratios to Average Net AssetsF,G | | | | | |
| Expenses before reductions | .25% | .25% | .25% | .25% | .25% |
| Expenses net of fee waivers, if any | .25% | .25% | .25% | .25% | .25% |
| Expenses net of all reductions | .25% | .25% | .25% | .25% | .25% |
| Net investment income (loss) | 1.25% | 1.29% | 1.25% | 1.59% | 1.45% |
| Supplemental Data | | | | | |
| Net assets, end of period (000 omitted) | $464,178 | $556,429 | $531,518 | $549,528 | $583,496 |
| Portfolio turnover rateF | 28% | 21% | 19% | 17% | 15% |
A Calculated based on average shares outstanding during the period.
B Total distributions of $.55 per share is comprised of distributions from net investment income of $.174 and distributions from net realized gain of $.371 per share.
C Total distributions of $.26 per share is comprised of distributions from net investment income of $.208 and distributions from net realized gain of $.056 per share.
D Total returns do not reflect charges attributable to your insurance company's separate account. Inclusion of these charges would reduce the total returns shown.
E Total returns would have been lower if certain expenses had not been reduced during the applicable periods shown.
F Amounts do not include the activity of the Underlying Funds.
G Expense ratios reflect operating expenses of the class. Expenses before reductions do not reflect amounts reimbursed by the investment adviser or reductions from expense offset arrangements and do not represent the amount paid by the class during periods when reimbursements or reductions occur. Expenses net of fee waivers reflect expenses after reimbursement by the investment adviser but prior to reductions from expense offset arrangements. Expenses net of all reductions represent the net expenses paid by the class but do not include expenses of the underlying funds in which the Fund invests.
See accompanying notes which are an integral part of the financial statements.
VIP Freedom 2025 Portfolio℠
Investment Summary (Unaudited)
The information in the following tables is based on the direct investments of the Fund.
Top Holdings as of December 31, 2018
| | % of fund's net assets |
| VIP Investment Grade Bond Portfolio Initial Class | 19.8 |
| VIP Overseas Portfolio Initial Class | 14.3 |
| VIP Emerging Markets Portfolio Initial Class | 8.1 |
| VIP Growth & Income Portfolio Initial Class | 8.1 |
| VIP Equity-Income Portfolio Initial Class | 7.1 |
| VIP Growth Portfolio Initial Class | 6.9 |
| VIP Contrafund Portfolio Initial Class | 6.8 |
| Fidelity Inflation-Protected Bond Index Fund Institutional Premium Class | 6.0 |
| Fidelity Long Term Treasury Bond Index Fund | 5.8 |
| VIP Government Money Market Portfolio Initial Class 2.19% | 5.5 |
| | 88.4 |
Asset Allocation (% of fund's net assets)
| Period end |
| | Domestic Equity Funds | 38.6% |
| | International Equity Funds | 22.4% |
| | Bond Funds | 33.5% |
| | Short-Term Funds | 5.5% |

VIP Freedom 2025 Portfolio℠
Schedule of Investments December 31, 2018
Showing Percentage of Net Assets
| Domestic Equity Funds - 38.6% | | | |
| | | Shares | Value |
| VIP Contrafund Portfolio Initial Class (a) | | 392,128 | $12,599,083 |
| VIP Equity-Income Portfolio Initial Class (a) | | 648,800 | 13,216,056 |
| VIP Growth & Income Portfolio Initial Class (a) | | 777,393 | 15,065,873 |
| VIP Growth Portfolio Initial Class (a) | | 203,965 | 12,874,256 |
| VIP Mid Cap Portfolio Initial Class (a) | | 121,247 | 3,660,458 |
| VIP Value Portfolio Initial Class (a) | | 741,569 | 9,699,719 |
| VIP Value Strategies Portfolio Initial Class (a) | | 426,181 | 4,734,870 |
| TOTAL DOMESTIC EQUITY FUNDS | | | |
| (Cost $63,580,270) | | | 71,850,315 |
|
| International Equity Funds - 22.4% | | | |
| VIP Emerging Markets Portfolio Initial Class (a) | | 1,527,122 | 15,194,863 |
| VIP Overseas Portfolio Initial Class (a) | | 1,392,892 | 26,646,015 |
| TOTAL INTERNATIONAL EQUITY FUNDS | | | |
| (Cost $38,869,048) | | | 41,840,878 |
|
| Bond Funds - 33.5% | | | |
| Fidelity Inflation-Protected Bond Index Fund Institutional Premium Class (a) | | 1,186,003 | 11,255,169 |
| Fidelity Long Term Treasury Bond Index Fund (a) | | 851,641 | 10,798,802 |
| VIP High Income Portfolio Initial Class (a) | | 727,242 | 3,614,393 |
| VIP Investment Grade Bond Portfolio Initial Class (a) | | 2,986,883 | 36,858,138 |
| TOTAL BOND FUNDS | | | |
| (Cost $64,092,655) | | | 62,526,502 |
|
| Short-Term Funds - 5.5% | | | |
| VIP Government Money Market Portfolio Initial Class 2.19% (a)(b) | | | |
| (Cost $10,181,722) | | 10,181,722 | 10,181,722 |
| TOTAL INVESTMENT IN SECURITIES - 100.0% | | | |
| (Cost $176,723,695) | | | 186,399,417 |
| NET OTHER ASSETS (LIABILITIES) - 0.0% | | | (35,952) |
| NET ASSETS - 100% | | | $186,363,465 |
Legend
(a) Affiliated Fund
(b) The rate quoted is the annualized seven-day yield of the fund at period end.
Affiliated Central Funds
Information regarding fiscal year to date income earned by the Fund from investments in Fidelity Central Funds is as follows:
| Fund | Income earned |
| Fidelity Cash Central Fund | $18 |
| Total | $18 |
Amounts in the income column in the above table include any capital gain distributions from underlying funds, which are presented in the corresponding line-item in the Statement of Operations if applicable.
Affiliated Underlying Funds
Fiscal year to date information regarding the Fund's investments in affiliated Underlying Funds, excluding any Money Market Central Funds, is presented below. Exchanges between classes of the same affiliated Underlying Funds may occur.
| Affiliate | Value, beginning of period | Purchases | Sales Proceeds | Dividend Income | Realized Gain (loss) | Change in Unrealized appreciation (depreciation) | Value, end of period |
| Fidelity Inflation-Protected Bond Index Fund Institutional Class | $- | $12,281,597 | $218,639 | $12,140 | $(2,778) | $- | $- |
| Fidelity Inflation-Protected Bond Index Fund Institutional Premium Class | - | 627,811 | 1,043,993 | 226,933 | (22,171) | (366,658) | 11,255,169 |
| Fidelity Long Term Treasury Bond Index Fund | - | 1,610,404 | 2,291,453 | 57,230 | 126 | 342,409 | 10,798,802 |
| Fidelity Long-Term Treasury Bond Index Fund Institutional Class | - | 11,442,738 | 298,089 | 114,796 | (7,333) | - | - |
| Fidelity Long-Term Treasury Bond Index Fund Premium Class | 3,650,639 | 685,363 | 4,035,282 | 42,284 | (314,111) | 13,391 | - |
| VIP Contrafund Portfolio Initial Class | 12,529,525 | 5,496,016 | 3,495,958 | 1,158,466 | 42,383 | (1,972,883) | 12,599,083 |
| VIP Emerging Markets Portfolio Initial Class | 12,602,774 | 8,228,927 | 2,868,168 | 115,787 | 25,392 | (2,794,062) | 15,194,863 |
| VIP Equity-Income Portfolio Initial Class | 13,210,302 | 5,603,395 | 3,622,634 | 899,883 | 11,157 | (1,986,164) | 13,216,056 |
| VIP Government Money Market Portfolio Initial Class 2.19% | 14,325,459 | 4,644,703 | 8,788,440 | 208,615 | - | - | 10,181,722 |
| VIP Growth & Income Portfolio Initial Class | 15,154,989 | 6,349,343 | 4,218,470 | 904,918 | 71,925 | (2,291,914) | 15,065,873 |
| VIP Growth Portfolio Initial Class | 12,758,175 | 6,137,835 | 4,268,192 | 1,822,325 | 195,344 | (1,948,906) | 12,874,256 |
| VIP High Income Portfolio Initial Class | 3,385,124 | 1,461,275 | 901,105 | 208,541 | (9,912) | (320,989) | 3,614,393 |
| VIP Investment Grade Bond Portfolio Initial Class | 38,578,058 | 14,497,339 | 14,766,405 | 1,218,709 | (274,278) | (1,176,576) | 36,858,138 |
| VIP Mid Cap Portfolio Initial Class | 3,671,517 | 1,706,402 | 825,679 | 327,427 | 12,616 | (904,398) | 3,660,458 |
| VIP Overseas Portfolio Initial Class | 26,477,607 | 9,900,087 | 4,921,595 | 476,154 | 5,160 | (4,815,244) | 26,646,015 |
| VIP Value Portfolio Initial Class | 9,705,542 | 4,138,232 | 2,048,813 | 672,878 | (15,807) | (2,079,435) | 9,699,719 |
| VIP Value Strategies Portfolio Initial Class | 4,739,668 | 2,037,220 | 881,594 | 266,378 | (13,355) | (1,147,069) | 4,734,870 |
| Total | $170,789,379 | $96,848,687 | $59,494,509 | $8,733,464 | $(295,642) | $(21,448,498) | $186,399,417 |
Amounts in the income column in the above table include any capital gain distributions from underlying funds, which are presented in the corresponding line-item in the Statement of Operations if applicable.
Investment Valuation
All investments are categorized as Level 1 under the Fair Value Hierarchy. The inputs or methodology used for valuing securities may not be an indication of the risk associated with investing in those securities. For more information on valuation inputs please refer to the Investment Valuation section in the accompanying Notes to Financial Statements.
See accompanying notes which are an integral part of the financial statements.
VIP Freedom 2025 Portfolio℠
Financial Statements
Statement of Assets and Liabilities
| | | December 31, 2018 |
| Assets | | |
Investment in securities, at value — See accompanying schedule:
| | |
| Affiliated issuers (cost $176,723,695) | $186,399,417 | |
| Total Investment in Securities (cost $176,723,695) | | $186,399,417 |
| Cash | | 196 |
| Receivable for investments sold | | 4,525,491 |
| Receivable for fund shares sold | | 187,386 |
| Total assets | | 191,112,490 |
| Liabilities | | |
| Payable for investments purchased | $4,430,938 | |
| Payable for fund shares redeemed | 297,030 | |
| Distribution and service plan fees payable | 21,057 | |
| Total liabilities | | 4,749,025 |
| Net Assets | | $186,363,465 |
| Net Assets consist of: | | |
| Paid in capital | | $172,204,179 |
| Total distributable earnings (loss) | | 14,159,286 |
| Net Assets | | $186,363,465 |
| Net Asset Value and Maximum Offering Price | | |
| Initial Class: | | |
| Net Asset Value, offering price and redemption price per share ($38,096,474 ÷ 2,883,721 shares) | | $13.21 |
| Service Class: | | |
| Net Asset Value, offering price and redemption price per share ($79,033,052 ÷ 5,998,176 shares) | | $13.18 |
| Service Class 2: | | |
| Net Asset Value, offering price and redemption price per share ($69,233,939 ÷ 5,280,439 shares) | | $13.11 |
See accompanying notes which are an integral part of the financial statements.
Statement of Operations
| | | Year ended December 31, 2018 |
| Investment Income | | |
| Dividends: | | |
| Affiliated issuers | | $2,887,718 |
| Income from Fidelity Central Funds | | 18 |
| Total income | | 2,887,736 |
| Expenses | | |
| Distribution and service plan fees | $246,238 | |
| Independent trustees' fees and expenses | 998 | |
| Total expenses before reductions | 247,236 | |
| Expense reductions | (3) | |
| Total expenses after reductions | | 247,233 |
| Net investment income (loss) | | 2,640,503 |
| Realized and Unrealized Gain (Loss) | | |
| Net realized gain (loss) on: | | |
| Investment securities: | | |
| Affiliated issuers | (295,642) | |
| Capital gain distributions from underlying funds: | | |
| Affiliated issuers | 5,845,746 | |
| Total net realized gain (loss) | | 5,550,104 |
| Change in net unrealized appreciation (depreciation) on: | | |
| Investment securities: | | |
| Affiliated issuers | (21,448,498) | |
| Total change in net unrealized appreciation (depreciation) | | (21,448,498) |
| Net gain (loss) | | (15,898,394) |
| Net increase (decrease) in net assets resulting from operations | | $(13,257,891) |
See accompanying notes which are an integral part of the financial statements.
Statement of Changes in Net Assets
| | Year ended December 31, 2018 | Year ended December 31, 2017 |
| Increase (Decrease) in Net Assets | | |
| Operations | | |
| Net investment income (loss) | $2,640,503 | $2,257,138 |
| Net realized gain (loss) | 5,550,104 | 4,502,309 |
| Change in net unrealized appreciation (depreciation) | (21,448,498) | 18,457,939 |
| Net increase (decrease) in net assets resulting from operations | (13,257,891) | 25,217,386 |
| Distributions to shareholders | (6,054,958) | – |
| Distributions to shareholders from net investment income | – | (2,239,558) |
| Distributions to shareholders from net realized gain | – | (4,161,373) |
| Total distributions | (6,054,958) | (6,400,931) |
| Share transactions - net increase (decrease) | 34,905,331 | 16,381,610 |
| Total increase (decrease) in net assets | 15,592,482 | 35,198,065 |
| Net Assets | | |
| Beginning of period | 170,770,983 | 135,572,918 |
| End of period | $186,363,465 | $170,770,983 |
| Other Information | | |
| Undistributed net investment income end of period | | $17,579 |
See accompanying notes which are an integral part of the financial statements.
Financial Highlights
VIP Freedom 2025 Portfolio Initial Class
| Years ended December 31, | 2018 | 2017 | 2016 | 2015 | 2014 |
| Selected Per–Share Data | | | | | |
| Net asset value, beginning of period | $14.64 | $12.95 | $12.82 | $13.16 | $12.99 |
| Income from Investment Operations | | | | | |
| Net investment income (loss)A | .23 | .22 | .21 | .26 | .24 |
| Net realized and unrealized gain (loss) | (1.17) | 2.06 | .52 | (.28) | .41 |
| Total from investment operations | (.94) | 2.28 | .73 | (.02) | .65 |
| Distributions from net investment income | (.21) | (.21) | (.20) | (.25) | (.22) |
| Distributions from net realized gain | (.28) | (.38) | (.41) | (.07) | (.26) |
| Total distributions | (.49) | (.59) | (.60)B | (.32) | (.48) |
| Net asset value, end of period | $13.21 | $14.64 | $12.95 | $12.82 | $13.16 |
| Total ReturnC,D | (6.52)% | 17.89% | 6.18% | (.18)% | 5.06% |
| Ratios to Average Net AssetsE,F | | | | | |
| Expenses before reductionsG | -% | -% | -% | -% | -% |
| Expenses net of fee waivers, if any | - %G | -% | -% | -% | -% |
| Expenses net of all reductions | - %G | -% | -% | -% | -% |
| Net investment income (loss) | 1.57% | 1.58% | 1.65% | 1.91% | 1.78% |
| Supplemental Data | | | | | |
| Net assets, end of period (000 omitted) | $38,096 | $37,773 | $27,359 | $25,152 | $26,137 |
| Portfolio turnover rateE | 32% | 29% | 24% | 20% | 29% |
A Calculated based on average shares outstanding during the period.
B Total distributions of $.60 per share is comprised of distributions from net investment income of $.196 and distributions from net realized gain of $.405 per share.
C Total returns do not reflect charges attributable to your insurance company's separate account. Inclusion of these charges would reduce the total returns shown.
D Total returns would have been lower if certain expenses had not been reduced during the applicable periods shown.
E Amounts do not include the activity of the Underlying Funds.
F Expense ratios reflect operating expenses of the class. Expenses before reductions do not reflect amounts reimbursed by the investment adviser or reductions from expense offset arrangements and do not represent the amount paid by the class during periods when reimbursements or reductions occur. Expenses net of fee waivers reflect expenses after reimbursement by the investment adviser but prior to reductions from expense offset arrangements. Expenses net of all reductions represent the net expenses paid by the class but do not include expenses of the underlying funds in which the Fund invests.
G Amount represents less than .005%.
See accompanying notes which are an integral part of the financial statements.
VIP Freedom 2025 Portfolio Service Class
| Years ended December 31, | 2018 | 2017 | 2016 | 2015 | 2014 |
| Selected Per–Share Data | | | | | |
| Net asset value, beginning of period | $14.61 | $12.92 | $12.79 | $13.14 | $12.97 |
| Income from Investment Operations | | | | | |
| Net investment income (loss)A | .21 | .21 | .20 | .24 | .22 |
| Net realized and unrealized gain (loss) | (1.16) | 2.06 | .52 | (.28) | .42 |
| Total from investment operations | (.95) | 2.27 | .72 | (.04) | .64 |
| Distributions from net investment income | (.19) | (.20) | (.19) | (.23) | (.21) |
| Distributions from net realized gain | (.28) | (.38) | (.41) | (.07) | (.26) |
| Total distributions | (.48)B | (.58) | (.59)C | (.31)D | (.47) |
| Net asset value, end of period | $13.18 | $14.61 | $12.92 | $12.79 | $13.14 |
| Total ReturnE,F | (6.61)% | 17.84% | 6.11% | (.36)% | 4.98% |
| Ratios to Average Net AssetsG,H | | | | | |
| Expenses before reductions | .10% | .10% | .10% | .10% | .10% |
| Expenses net of fee waivers, if any | .10% | .10% | .10% | .10% | .10% |
| Expenses net of all reductions | .10% | .10% | .10% | .10% | .10% |
| Net investment income (loss) | 1.47% | 1.48% | 1.55% | 1.81% | 1.68% |
| Supplemental Data | | | | | |
| Net assets, end of period (000 omitted) | $79,033 | $69,430 | $48,319 | $36,677 | $30,291 |
| Portfolio turnover rateG | 32% | 29% | 24% | 20% | 29% |
A Calculated based on average shares outstanding during the period.
B Total distributions of $.48 per share is comprised of distributions from net investment income of $.193 and distributions from net realized gain of $.284 per share.
C Total distributions of $.59 per share is comprised of distributions from net investment income of $.185 and distributions from net realized gain of $.405 per share.
D Total distributions of $.31 per share is comprised of distributions from net investment income of $.234 and distributions from net realized gain of $.072 per share.
E Total returns do not reflect charges attributable to your insurance company's separate account. Inclusion of these charges would reduce the total returns shown.
F Total returns would have been lower if certain expenses had not been reduced during the applicable periods shown.
G Amounts do not include the activity of the Underlying Funds.
H Expense ratios reflect operating expenses of the class. Expenses before reductions do not reflect amounts reimbursed by the investment adviser or reductions from expense offset arrangements and do not represent the amount paid by the class during periods when reimbursements or reductions occur. Expenses net of fee waivers reflect expenses after reimbursement by the investment adviser but prior to reductions from expense offset arrangements. Expenses net of all reductions represent the net expenses paid by the class but do not include expenses of the underlying funds in which the Fund invests.
See accompanying notes which are an integral part of the financial statements.
VIP Freedom 2025 Portfolio Service Class 2
| Years ended December 31, | 2018 | 2017 | 2016 | 2015 | 2014 |
| Selected Per–Share Data | | | | | |
| Net asset value, beginning of period | $14.54 | $12.87 | $12.74 | $13.09 | $12.92 |
| Income from Investment Operations | | | | | |
| Net investment income (loss)A | .19 | .18 | .18 | .22 | .20 |
| Net realized and unrealized gain (loss) | (1.16) | 2.04 | .52 | (.28) | .42 |
| Total from investment operations | (.97) | 2.22 | .70 | (.06) | .62 |
| Distributions from net investment income | (.18) | (.18) | (.17) | (.22) | (.19) |
| Distributions from net realized gain | (.28) | (.38) | (.41) | (.07) | (.26) |
| Total distributions | (.46) | (.55)B | (.57)C | (.29) | (.45) |
| Net asset value, end of period | $13.11 | $14.54 | $12.87 | $12.74 | $13.09 |
| Total ReturnD,E | (6.78)% | 17.57% | 5.98% | (.50)% | 4.85% |
| Ratios to Average Net AssetsF,G | | | | | |
| Expenses before reductions | .25% | .25% | .25% | .25% | .25% |
| Expenses net of fee waivers, if any | .25% | .25% | .25% | .25% | .25% |
| Expenses net of all reductions | .25% | .25% | .25% | .25% | .25% |
| Net investment income (loss) | 1.32% | 1.33% | 1.40% | 1.66% | 1.53% |
| Supplemental Data | | | | | |
| Net assets, end of period (000 omitted) | $69,234 | $63,568 | $59,895 | $52,321 | $49,366 |
| Portfolio turnover rateF | 32% | 29% | 24% | 20% | 29% |
A Calculated based on average shares outstanding during the period.
B Total distributions of $.55 per share is comprised of distributions from net investment income of $.175 and distributions from net realized gain of $.378 per share.
C Total distributions of $.57 per share is comprised of distributions from net investment income of $.166 and distributions from net realized gain of $.405 per share.
D Total returns do not reflect charges attributable to your insurance company's separate account. Inclusion of these charges would reduce the total returns shown.
E Total returns would have been lower if certain expenses had not been reduced during the applicable periods shown.
F Amounts do not include the activity of the Underlying Funds.
G Expense ratios reflect operating expenses of the class. Expenses before reductions do not reflect amounts reimbursed by the investment adviser or reductions from expense offset arrangements and do not represent the amount paid by the class during periods when reimbursements or reductions occur. Expenses net of fee waivers reflect expenses after reimbursement by the investment adviser but prior to reductions from expense offset arrangements. Expenses net of all reductions represent the net expenses paid by the class but do not include expenses of the underlying funds in which the Fund invests.
See accompanying notes which are an integral part of the financial statements.
VIP Freedom 2030 Portfolio℠
Investment Summary (Unaudited)
The information in the following tables is based on the direct investments of the Fund.
Top Holdings as of December 31, 2018
| | % of fund's net assets |
| VIP Overseas Portfolio Initial Class | 16.9 |
| VIP Investment Grade Bond Portfolio Initial Class | 15.0 |
| VIP Growth & Income Portfolio Initial Class | 9.8 |
| VIP Emerging Markets Portfolio Initial Class | 9.1 |
| VIP Equity-Income Portfolio Initial Class | 8.6 |
| VIP Growth Portfolio Initial Class | 8.4 |
| VIP Contrafund Portfolio Initial Class | 8.2 |
| VIP Value Portfolio Initial Class | 6.3 |
| Fidelity Long Term Treasury Bond Index Fund | 5.8 |
| VIP Value Strategies Portfolio Initial Class | 3.1 |
| | 91.2 |
Asset Allocation (% of fund's net assets)
| Period end |
| | Domestic Equity Funds | 46.8% |
| | International Equity Funds | 26.0% |
| | Bond Funds | 25.6% |
| | Short-Term Funds | 1.6% |

VIP Freedom 2030 Portfolio℠
Schedule of Investments December 31, 2018
Showing Percentage of Net Assets
| Domestic Equity Funds - 46.8% | | | |
| | | Shares | Value |
| VIP Contrafund Portfolio Initial Class (a) | | 824,045 | $26,476,567 |
| VIP Equity-Income Portfolio Initial Class (a) | | 1,363,354 | 27,771,525 |
| VIP Growth & Income Portfolio Initial Class (a) | | 1,633,527 | 31,657,753 |
| VIP Growth Portfolio Initial Class (a) | | 428,615 | 27,054,161 |
| VIP Mid Cap Portfolio Initial Class (a) | | 254,763 | 7,691,303 |
| VIP Value Portfolio Initial Class (a) | | 1,558,291 | 20,382,444 |
| VIP Value Strategies Portfolio Initial Class (a) | | 895,487 | 9,948,865 |
| TOTAL DOMESTIC EQUITY FUNDS | | | |
| (Cost $127,817,545) | | | 150,982,618 |
|
| International Equity Funds - 26.0% | | | |
| VIP Emerging Markets Portfolio Initial Class (a) | | 2,961,506 | 29,466,989 |
| VIP Overseas Portfolio Initial Class (a) | | 2,847,584 | 54,474,278 |
| TOTAL INTERNATIONAL EQUITY FUNDS | | | |
| (Cost $75,689,252) | | | 83,941,267 |
|
| Bond Funds - 25.6% | | | |
| Fidelity Inflation-Protected Bond Index Fund Institutional Premium Class (a) | | 986,970 | 9,366,342 |
| Fidelity Long Term Treasury Bond Index Fund (a) | | 1,473,413 | 18,682,874 |
| VIP High Income Portfolio Initial Class (a) | | 1,247,293 | 6,199,045 |
| VIP Investment Grade Bond Portfolio Initial Class (a) | | 3,928,311 | 48,475,361 |
| TOTAL BOND FUNDS | | | |
| (Cost $84,801,126) | | | 82,723,622 |
|
| Short-Term Funds - 1.6% | | | |
| VIP Government Money Market Portfolio Initial Class 2.19% (a)(b) | | | |
| (Cost $5,112,251) | | 5,112,251 | 5,112,251 |
| TOTAL INVESTMENT IN SECURITIES - 100.0% | | | |
| (Cost $293,420,174) | | | 322,759,758 |
| NET OTHER ASSETS (LIABILITIES) - 0.0% | | | (33,904) |
| NET ASSETS - 100% | | | $322,725,854 |
Legend
(a) Affiliated Fund
(b) The rate quoted is the annualized seven-day yield of the fund at period end.
Affiliated Central Funds
Information regarding fiscal year to date income earned by the Fund from investments in Fidelity Central Funds is as follows:
| Fund | Income earned |
| Fidelity Cash Central Fund | $39 |
| Total | $39 |
Amounts in the income column in the above table include any capital gain distributions from underlying funds, which are presented in the corresponding line-item in the Statement of Operations if applicable.
Affiliated Underlying Funds
Fiscal year to date information regarding the Fund's investments in affiliated Underlying Funds, excluding any Money Market Central Funds, is presented below. Exchanges between classes of the same affiliated Underlying Funds may occur.
| Affiliate | Value, beginning of period | Purchases | Sales Proceeds | Dividend Income | Realized Gain (loss) | Change in Unrealized appreciation (depreciation) | Value, end of period |
| Fidelity Inflation-Protected Bond Index Institutional Premium Class | $-- | $950,459 | $487,520 | $9,757 | $(9,039) | $(289,290) | $9,366,342 |
| Fidelity Inflation-Protected Bond Index Fund Premium Class | -- | 9,341,410 | 137,973 | 180,163 | (1,705) | -- | -- |
| Fidelity Long Term Treasury Bond Index Fund | -- | 1,217,842 | 4,240,862 | 99,744 | (171,435) | 125,148 | 18,682,874 |
| Fidelity Long-Term Treasury Bond Index Fund Institutional Class | 6,931,994 | 15,726,148 | 906,180 | 301,962 | (24,994) | 25,213 | -- |
| VIP Contrafund Portfolio Initial Class | 29,317,748 | 10,021,129 | 8,540,522 | 2,726,452 | 148,418 | (4,470,206) | 26,476,567 |
| VIP Emerging Markets Portfolio Initial Class | 27,716,095 | 13,969,883 | 6,403,666 | 226,954 | (138,479) | (5,676,844) | 29,466,989 |
| VIP Equity-Income Portfolio Initial Class | 30,909,026 | 9,860,673 | 8,534,049 | 2,076,359 | (89,579) | (4,374,546) | 27,771,525 |
| VIP Government Money Market Portfolio Initial Class 2.19% | 8,479,638 | 2,053,003 | 5,420,390 | 107,354 | -- | -- | 5,112,251 |
| VIP Growth & Income Portfolio Initial Class | 35,453,755 | 11,398,325 | 10,209,563 | 2,131,801 | 137,655 | (5,122,419) | 31,657,753 |
| VIP Growth Portfolio Initial Class | 29,857,823 | 11,532,039 | 10,406,223 | 4,303,827 | 378,113 | (4,307,591) | 27,054,161 |
| VIP High Income Portfolio Initial Class | 6,529,336 | 2,292,589 | 2,042,848 | 368,138 | (26,575) | (553,457) | 6,199,045 |
| VIP Investment Grade Bond Portfolio Initial Class | 51,771,229 | 20,140,433 | 21,470,403 | 1,656,169 | (521,357) | (1,444,541) | 48,475,361 |
| VIP Mid Cap Portfolio Initial Class | 8,590,580 | 3,122,715 | 2,025,167 | 774,406 | (9,649) | (1,987,176) | 7,691,303 |
| VIP Overseas Portfolio Initial Class | 60,533,247 | 16,305,891 | 12,004,267 | 994,898 | (256,073) | (10,104,520) | 54,474,278 |
| VIP Value Portfolio Initial Class | 22,709,068 | 7,166,297 | 4,827,407 | 1,531,744 | (93,583) | (4,571,931) | 20,382,444 |
| VIP Value Strategies Portfolio Initial Class | 11,091,130 | 3,587,649 | 2,142,836 | 608,530 | (57,805) | (2,529,273) | 9,948,865 |
| Total | $329,890,669 | $138,686,485 | $99,799,876 | $18,098,258 | $(736,087) | $(45,281,433) | $322,759,758 |
Amounts in the income column in the above table include any capital gain distributions from underlying funds, which are presented in the corresponding line-item in the Statement of Operations if applicable.
Investment Valuation
All investments are categorized as Level 1 under the Fair Value Hierarchy. The inputs or methodology used for valuing securities may not be an indication of the risk associated with investing in those securities. For more information on valuation inputs please refer to the Investment Valuation section in the accompanying Notes to Financial Statements.
See accompanying notes which are an integral part of the financial statements.
VIP Freedom 2030 Portfolio℠
Financial Statements
Statement of Assets and Liabilities
| | | December 31, 2018 |
| Assets | | |
Investment in securities, at value — See accompanying schedule:
| | |
| Affiliated issuers (cost $293,420,174) | $322,759,758 | |
| Total Investment in Securities (cost $293,420,174) | | $322,759,758 |
| Cash | | 126 |
| Receivable for investments sold | | 7,333,953 |
| Receivable for fund shares sold | | 213,431 |
| Distributions receivable from Fidelity Central Funds | | 17 |
| Total assets | | 330,307,285 |
| Liabilities | | |
| Payable for investments purchased | $6,220,030 | |
| Payable for fund shares redeemed | 1,323,426 | |
| Distribution and service plan fees payable | 37,975 | |
| Total liabilities | | 7,581,431 |
| Net Assets | | $322,725,854 |
| Net Assets consist of: | | |
| Paid in capital | | $285,037,552 |
| Total distributable earnings (loss) | | 37,688,302 |
| Net Assets | | $322,725,854 |
| Net Asset Value and Maximum Offering Price | | |
| Initial Class: | | |
| Net Asset Value, offering price and redemption price per share ($71,003,792 ÷ 5,472,095 shares) | | $12.98 |
| Service Class: | | |
| Net Asset Value, offering price and redemption price per share ($121,154,607 ÷ 9,356,096 shares) | | $12.95 |
| Service Class 2: | | |
| Net Asset Value, offering price and redemption price per share ($130,567,455 ÷ 10,116,362 shares) | | $12.91 |
See accompanying notes which are an integral part of the financial statements.
Statement of Operations
| | | Year ended December 31, 2018 |
| Investment Income | | |
| Dividends: | | |
| Affiliated issuers | | $4,912,143 |
| Income from Fidelity Central Funds | | 39 |
| Total income | | 4,912,182 |
| Expenses | | |
| Distribution and service plan fees | $485,770 | |
| Independent trustees' fees and expenses | 1,877 | |
| Total expenses before reductions | 487,647 | |
| Expense reductions | (6) | |
| Total expenses after reductions | | 487,641 |
| Net investment income (loss) | | 4,424,541 |
| Realized and Unrealized Gain (Loss) | | |
| Net realized gain (loss) on: | | |
| Investment securities: | | |
| Affiliated issuers | (736,087) | |
| Capital gain distributions from underlying funds: | | |
| Affiliated issuers | 13,186,115 | |
| Total net realized gain (loss) | | 12,450,028 |
| Change in net unrealized appreciation (depreciation) on: | | |
| Investment securities: | | |
| Affiliated issuers | (45,281,433) | |
| Total change in net unrealized appreciation (depreciation) | | (45,281,433) |
| Net gain (loss) | | (32,831,405) |
| Net increase (decrease) in net assets resulting from operations | | $(28,406,864) |
See accompanying notes which are an integral part of the financial statements.
Statement of Changes in Net Assets
| | Year ended December 31, 2018 | Year ended December 31, 2017 |
| Increase (Decrease) in Net Assets | | |
| Operations | | |
| Net investment income (loss) | $4,424,541 | $3,915,464 |
| Net realized gain (loss) | 12,450,028 | 10,046,374 |
| Change in net unrealized appreciation (depreciation) | (45,281,433) | 41,102,303 |
| Net increase (decrease) in net assets resulting from operations | (28,406,864) | 55,064,141 |
| Distributions to shareholders | (13,079,327) | – |
| Distributions to shareholders from net investment income | – | (3,887,127) |
| Distributions to shareholders from net realized gain | – | (10,287,699) |
| Total distributions | (13,079,327) | (14,174,826) |
| Share transactions - net increase (decrease) | 34,359,326 | 28,000,979 |
| Total increase (decrease) in net assets | (7,126,865) | 68,890,294 |
| Net Assets | | |
| Beginning of period | 329,852,719 | 260,962,425 |
| End of period | $322,725,854 | $329,852,719 |
| Other Information | | |
| Undistributed net investment income end of period | | $28,337 |
See accompanying notes which are an integral part of the financial statements.
Financial Highlights
VIP Freedom 2030 Portfolio Initial Class
| Years ended December 31, | 2018 | 2017 | 2016 | 2015 | 2014 |
| Selected Per–Share Data | | | | | |
| Net asset value, beginning of period | $14.67 | $12.75 | $12.68 | $13.01 | $12.84 |
| Income from Investment Operations | | | | | |
| Net investment income (loss)A | .20 | .20 | .18 | .22 | .22 |
| Net realized and unrealized gain (loss) | (1.32) | 2.41 | .57 | (.25) | .41 |
| Total from investment operations | (1.12) | 2.61 | .75 | (.03) | .63 |
| Distributions from net investment income | (.20) | (.20) | (.19) | (.23) | (.21) |
| Distributions from net realized gain | (.37) | (.49) | (.49) | (.07) | (.25) |
| Total distributions | (.57) | (.69) | (.68) | (.30) | (.46) |
| Net asset value, end of period | $12.98 | $14.67 | $12.75 | $12.68 | $13.01 |
| Total ReturnB,C | (7.78)% | 20.96% | 6.61% | (.24)% | 4.96% |
| Ratios to Average Net AssetsD,E | | | | | |
| Expenses before reductionsF | -% | -% | -% | -% | -% |
| Expenses net of fee waivers, if any | - %F | -% | -% | -% | -% |
| Expenses net of all reductions | - %F | -% | -% | -% | -% |
| Net investment income (loss) | 1.42% | 1.48% | 1.42% | 1.66% | 1.70% |
| Supplemental Data | | | | | |
| Net assets, end of period (000 omitted) | $71,004 | $74,247 | $57,779 | $68,661 | $72,243 |
| Portfolio turnover rateE | 29% | 26% | 25% | 26% | 18% |
A Calculated based on average shares outstanding during the period.
B Total returns do not reflect charges attributable to your insurance company's separate account. Inclusion of these charges would reduce the total returns shown.
C Total returns would have been lower if certain expenses had not been reduced during the applicable periods shown.
D Expense ratios reflect operating expenses of the class. Expenses before reductions do not reflect amounts reimbursed by the investment adviser or reductions from expense offset arrangements and do not represent the amount paid by the class during periods when reimbursements or reductions occur. Expenses net of fee waivers reflect expenses after reimbursement by the investment adviser but prior to reductions from expense offset arrangements. Expenses net of all reductions represent the net expenses paid by the class but do not include expenses of the underlying funds in which the Fund invests.
E Amount does not include the portfolio activity of any underlying Fidelity Central Funds.
F Amount represents less than .005%.
See accompanying notes which are an integral part of the financial statements.
VIP Freedom 2030 Portfolio Service Class
| Years ended December 31, | 2018 | 2017 | 2016 | 2015 | 2014 |
| Selected Per–Share Data | | | | | |
| Net asset value, beginning of period | $14.64 | $12.73 | $12.66 | $12.99 | $12.82 |
| Income from Investment Operations | | | | | |
| Net investment income (loss)A | .19 | .19 | .16 | .21 | .21 |
| Net realized and unrealized gain (loss) | (1.32) | 2.40 | .58 | (.25) | .41 |
| Total from investment operations | (1.13) | 2.59 | .74 | (.04) | .62 |
| Distributions from net investment income | (.19) | (.19) | (.17) | (.22) | (.19) |
| Distributions from net realized gain | (.37) | (.49) | (.49) | (.07) | (.25) |
| Total distributions | (.56) | (.68) | (.67)B | (.29) | (.45)C |
| Net asset value, end of period | $12.95 | $14.64 | $12.73 | $12.66 | $12.99 |
| Total ReturnD,E | (7.88)% | 20.82% | 6.52% | (.34)% | 4.86% |
| Ratios to Average Net AssetsF,G | | | | | |
| Expenses before reductions | .10% | .10% | .10% | .10% | .10% |
| Expenses net of fee waivers, if any | .10% | .10% | .10% | .10% | .10% |
| Expenses net of all reductions | .10% | .10% | .10% | .10% | .10% |
| Net investment income (loss) | 1.32% | 1.38% | 1.32% | 1.56% | 1.60% |
| Supplemental Data | | | | | |
| Net assets, end of period (000 omitted) | $121,155 | $111,029 | $70,501 | $59,096 | $53,484 |
| Portfolio turnover rateG | 29% | 26% | 25% | 26% | 18% |
A Calculated based on average shares outstanding during the period.
B Total distributions of $.67 per share is comprised of distributions from net investment income of $.173 and distributions from net realized gain of $.494 per share.
C Total distributions of $.45 per share is comprised of distributions from net investment income of $.194 and distributions from net realized gain of $.254 per share.
D Total returns do not reflect charges attributable to your insurance company's separate account. Inclusion of these charges would reduce the total returns shown.
E Total returns would have been lower if certain expenses had not been reduced during the applicable periods shown.
F Expense ratios reflect operating expenses of the class. Expenses before reductions do not reflect amounts reimbursed by the investment adviser or reductions from expense offset arrangements and do not represent the amount paid by the class during periods when reimbursements or reductions occur. Expenses net of fee waivers reflect expenses after reimbursement by the investment adviser but prior to reductions from expense offset arrangements. Expenses net of all reductions represent the net expenses paid by the class but do not include expenses of the underlying funds in which the Fund invests.
G Amount does not include the portfolio activity of any underlying Fidelity Central Funds.
See accompanying notes which are an integral part of the financial statements.
VIP Freedom 2030 Portfolio Service Class 2
| Years ended December 31, | 2018 | 2017 | 2016 | 2015 | 2014 |
| Selected Per–Share Data | | | | | |
| Net asset value, beginning of period | $14.60 | $12.69 | $12.62 | $12.95 | $12.78 |
| Income from Investment Operations | | | | | |
| Net investment income (loss)A | .17 | .17 | .14 | .19 | .19 |
| Net realized and unrealized gain (loss) | (1.32) | 2.40 | .58 | (.25) | .41 |
| Total from investment operations | (1.15) | 2.57 | .72 | (.06) | .60 |
| Distributions from net investment income | (.17) | (.16) | (.15) | (.20) | (.18) |
| Distributions from net realized gain | (.37) | (.49) | (.49) | (.07) | (.25) |
| Total distributions | (.54) | (.66)B | (.65)C | (.27) | (.43) |
| Net asset value, end of period | $12.91 | $14.60 | $12.69 | $12.62 | $12.95 |
| Total ReturnD,E | (8.05)% | 20.69% | 6.37% | (.53)% | 4.74% |
| Ratios to Average Net AssetsF,G | | | | | |
| Expenses before reductions | .25% | .25% | .25% | .25% | .25% |
| Expenses net of fee waivers, if any | .25% | .25% | .25% | .25% | .25% |
| Expenses net of all reductions | .25% | .25% | .25% | .25% | .25% |
| Net investment income (loss) | 1.17% | 1.23% | 1.17% | 1.41% | 1.45% |
| Supplemental Data | | | | | |
| Net assets, end of period (000 omitted) | $130,567 | $144,577 | $132,682 | $133,978 | $151,268 |
| Portfolio turnover rateG | 29% | 26% | 25% | 26% | 18% |
A Calculated based on average shares outstanding during the period.
B Total distributions of $.66 per share is comprised of distributions from net investment income of $.162 and distributions from net realized gain of $.494 per share.
C Total distributions of $.65 per share is comprised of distributions from net investment income of $.153 and distributions from net realized gain of $.494 per share.
D Total returns do not reflect charges attributable to your insurance company's separate account. Inclusion of these charges would reduce the total returns shown.
E Total returns would have been lower if certain expenses had not been reduced during the applicable periods shown.
F Expense ratios reflect operating expenses of the class. Expenses before reductions do not reflect amounts reimbursed by the investment adviser or reductions from expense offset arrangements and do not represent the amount paid by the class during periods when reimbursements or reductions occur. Expenses net of fee waivers reflect expenses after reimbursement by the investment adviser but prior to reductions from expense offset arrangements. Expenses net of all reductions represent the net expenses paid by the class but do not include expenses of the underlying funds in which the Fund invests.
G Amount does not include the portfolio activity of any underlying Fidelity Central Funds.
See accompanying notes which are an integral part of the financial statements.
VIP Freedom 2035 Portfolio℠
Investment Summary (Unaudited)
The information in the following tables is based on the direct investments of the Fund.
Top Holdings as of December 31, 2018
| | % of fund's net assets |
| VIP Overseas Portfolio Initial Class | 19.9 |
| VIP Growth & Income Portfolio Initial Class | 11.8 |
| VIP Equity-Income Portfolio Initial Class | 10.4 |
| VIP Emerging Markets Portfolio Initial Class | 10.2 |
| VIP Growth Portfolio Initial Class | 10.1 |
| VIP Contrafund Portfolio Initial Class | 9.9 |
| VIP Value Portfolio Initial Class | 7.6 |
| Fidelity Long Term Treasury Bond Index Fund | 5.8 |
| VIP Value Strategies Portfolio Initial Class | 3.7 |
| VIP Mid Cap Portfolio Initial Class | 2.9 |
| | 92.3 |
Asset Allocation (% of fund's net assets)
| Period end |
| | Domestic Equity Funds | 56.4% |
| | International Equity Funds | 30.1% |
| | Bond Funds | 11.9% |
| | Short-Term Funds | 1.6% |

VIP Freedom 2035 Portfolio℠
Schedule of Investments December 31, 2018
Showing Percentage of Net Assets
| Domestic Equity Funds - 56.4% | | | |
| | | Shares | Value |
| VIP Contrafund Portfolio Initial Class (a) | | 200,929 | $6,455,849 |
| VIP Equity-Income Portfolio Initial Class (a) | | 332,429 | 6,771,588 |
| VIP Growth & Income Portfolio Initial Class (a) | | 398,321 | 7,719,464 |
| VIP Growth Portfolio Initial Class (a) | | 104,510 | 6,596,682 |
| VIP Mid Cap Portfolio Initial Class (a) | | 62,058 | 1,873,529 |
| VIP Value Portfolio Initial Class (a) | | 379,912 | 4,969,245 |
| VIP Value Strategies Portfolio Initial Class (a) | | 218,200 | 2,424,204 |
| TOTAL DOMESTIC EQUITY FUNDS | | | |
| (Cost $38,712,650) | | | 36,810,561 |
|
| International Equity Funds - 30.1% | | | |
| VIP Emerging Markets Portfolio Initial Class (a) | | 670,250 | 6,668,984 |
| VIP Overseas Portfolio Initial Class (a) | | 679,864 | 13,005,806 |
| TOTAL INTERNATIONAL EQUITY FUNDS | | | |
| (Cost $19,934,044) | | | 19,674,790 |
|
| Bond Funds - 11.9% | | | |
| Fidelity Inflation-Protected Bond Index Fund Institutional Premium Class (a) | | 140,325 | 1,331,683 |
| Fidelity Long Term Treasury Bond Index Fund (a) | | 297,927 | 3,777,714 |
| VIP High Income Portfolio Initial Class (a) | | 255,610 | 1,270,383 |
| VIP Investment Grade Bond Portfolio Initial Class (a) | | 113,841 | 1,404,797 |
| TOTAL BOND FUNDS | | | |
| (Cost $7,901,535) | | | 7,784,577 |
|
| Short-Term Funds - 1.6% | | | |
| Fidelity Cash Central Fund, 2.42% (b) | | 4 | 4 |
| VIP Government Money Market Portfolio Initial Class 2.19% (a)(c) | | 1,033,239 | 1,033,239 |
| TOTAL SHORT-TERM FUNDS | | | |
| (Cost $1,033,243) | | | 1,033,243 |
| TOTAL INVESTMENT IN SECURITIES - 100.0% | | | |
| (Cost $67,581,472) | | | 65,303,171 |
| NET OTHER ASSETS (LIABILITIES) - 0.0% | | | (10,491) |
| NET ASSETS - 100% | | | $65,292,680 |
Legend
(a) Affiliated Fund
(b) Affiliated fund that is generally available only to investment companies and other accounts managed by Fidelity Investments. The rate quoted is the annualized seven-day yield of the fund at period end. A complete unaudited listing of the fund's holdings as of its most recent quarter end is available upon request. In addition, each Fidelity Central Fund's financial statements, which are not covered by the Fund's Report of Independent Registered Public Accounting Firm, are available on the SEC's website or upon request.
(c) The rate quoted is the annualized seven-day yield of the fund at period end.
Affiliated Central Funds
Information regarding fiscal year to date income earned by the Fund from investments in Fidelity Central Funds is as follows:
| Fund | Income earned |
| Fidelity Cash Central Fund | $9 |
| Total | $9 |
Amounts in the income column in the above table include any capital gain distributions from underlying funds, which are presented in the corresponding line-item in the Statement of Operations if applicable.
Affiliated Underlying Funds
Fiscal year to date information regarding the Fund's investments in affiliated Underlying Funds, excluding any Money Market Central Funds, is presented below. Exchanges between classes of the same affiliated Underlying Funds may occur.
| Affiliate | Value, beginning of period | Purchases | Sales Proceeds | Dividend Income | Realized Gain (loss) | Change in Unrealized appreciation (depreciation) | Value, end of period |
| Fidelity Inflation-Protected Bond Index Fund Institutional Premium Class | $-- | $92,040 | $94,378 | $26,741 | $(897) | $(44,748) | $1,331,683 |
| Fidelity Inflation-Protected Bond Index Fund Premium Class | -- | 1,520,103 | 137,407 | 1,754 | (3,030) | -- | -- |
| Fidelity Long Term Treasury Bond Index Fund | -- | 318,708 | 737,722 | 20,007 | (29,370) | 38,003 | 3,777,714 |
| Fidelity Long-Term Treasury Bond Index Fund Premium Class | 1,177,241 | 3,239,049 | 221,362 | 57,901 | (10,856) | 4,023 | -- |
| VIP Contrafund Portfolio Initial Class | 5,802,256 | 3,244,879 | 1,604,544 | 558,767 | (18,922) | (967,820) | 6,455,849 |
| VIP Emerging Markets Portfolio Initial Class | 5,212,454 | 3,800,779 | 1,054,211 | 50,932 | (40,066) | (1,249,972) | 6,668,984 |
| VIP Equity-Income Portfolio Initial Class | 6,117,469 | 3,333,411 | 1,674,912 | 446,282 | (22,508) | (981,872) | 6,771,588 |
| VIP Government Money Market Portfolio Initial Class 2.19% | 1,444,288 | 612,081 | 1,023,130 | 20,345 | -- | -- | 1,033,239 |
| VIP Growth & Income Portfolio Initial Class | 7,016,521 | 3,866,180 | 2,024,917 | 437,270 | (14,017) | (1,124,303) | 7,719,464 |
| VIP Growth Portfolio Initial Class | 5,909,386 | 3,575,780 | 1,995,440 | 874,223 | (15,141) | (877,903) | 6,596,682 |
| VIP High Income Portfolio Initial Class | 1,112,102 | 656,819 | 383,121 | 72,910 | (6,449) | (108,968) | 1,270,383 |
| VIP Investment Grade Bond Portfolio Initial Class | 2,265,710 | 1,955,783 | 2,744,935 | 55,779 | (48,812) | (22,949) | 1,404,797 |
| VIP Mid Cap Portfolio Initial Class | 1,700,145 | 1,020,985 | 384,678 | 157,880 | (12,357) | (450,566) | 1,873,529 |
| VIP Overseas Portfolio Initial Class | 11,820,636 | 5,955,867 | 2,332,214 | 237,619 | (88,282) | (2,350,201) | 13,005,806 |
| VIP Value Portfolio Initial Class | 4,494,560 | 2,491,264 | 926,009 | 339,028 | (24,635) | (1,065,935) | 4,969,245 |
| VIP Value Strategies Portfolio Initial Class | 2,195,286 | 1,225,272 | 394,345 | 133,482 | (12,850) | (589,159) | 2,424,204 |
| Total | $56,268,054 | $36,909,000 | $17,733,325 | $3,490,920 | $(348,192) | $(9,792,370) | $65,303,167 |
Amounts in the income column in the above table include any capital gain distributions from underlying funds, which are presented in the corresponding line-item in the Statement of Operations if applicable.
Investment Valuation
All investments are categorized as Level 1 under the Fair Value Hierarchy. The inputs or methodology used for valuing securities may not be an indication of the risk associated with investing in those securities. For more information on valuation inputs please refer to the Investment Valuation section in the accompanying Notes to Financial Statements.
See accompanying notes which are an integral part of the financial statements.
VIP Freedom 2035 Portfolio℠
Financial Statements
Statement of Assets and Liabilities
| | | December 31, 2018 |
| Assets | | |
Investment in securities, at value — See accompanying schedule:
| | |
| Fidelity Central Funds (cost $4) | $4 | |
| Other affiliated issuers (cost $67,581,468) | 65,303,167 | |
| Total Investment in Securities (cost $67,581,472) | | $65,303,171 |
| Cash | | 4 |
| Receivable for investments sold | | 901,703 |
| Receivable for fund shares sold | | 163,535 |
| Total assets | | 66,368,413 |
| Liabilities | | |
| Payable for investments purchased | $1,000,852 | |
| Payable for fund shares redeemed | 64,382 | |
| Distribution and service plan fees payable | 10,499 | |
| Total liabilities | | 1,075,733 |
| Net Assets | | $65,292,680 |
| Net Assets consist of: | | |
| Paid in capital | | $65,772,228 |
| Total distributable earnings (loss) | | (479,548) |
| Net Assets | | $65,292,680 |
| Net Asset Value and Maximum Offering Price | | |
| Initial Class: | | |
| Net Asset Value, offering price and redemption price per share ($7,977,249 ÷ 397,378 shares) | | $20.07 |
| Service Class: | | |
| Net Asset Value, offering price and redemption price per share ($12,302,536 ÷ 613,964 shares) | | $20.04 |
| Service Class 2: | | |
| Net Asset Value, offering price and redemption price per share ($45,012,895 ÷ 2,257,534 shares) | | $19.94 |
See accompanying notes which are an integral part of the financial statements.
Statement of Operations
| | | Year ended December 31, 2018 |
| Investment Income | | |
| Dividends: | | |
| Affiliated issuers | | $852,859 |
| Income from Fidelity Central Funds | | 9 |
| Total income | | 852,868 |
| Expenses | | |
| Distribution and service plan fees | $126,231 | |
| Independent trustees' fees and expenses | 345 | |
| Total expenses before reductions | 126,576 | |
| Expense reductions | (1) | |
| Total expenses after reductions | | 126,575 |
| Net investment income (loss) | | 726,293 |
| Realized and Unrealized Gain (Loss) | | |
| Net realized gain (loss) on: | | |
| Investment securities: | | |
| Affiliated issuers | (348,192) | |
| Capital gain distributions from underlying funds: | | |
| Affiliated issuers | 2,638,061 | |
| Total net realized gain (loss) | | 2,289,869 |
| Change in net unrealized appreciation (depreciation) on: | | |
| Investment securities: | | |
| Affiliated issuers | (9,792,370) | |
| Total change in net unrealized appreciation (depreciation) | | (9,792,370) |
| Net gain (loss) | | (7,502,501) |
| Net increase (decrease) in net assets resulting from operations | | $(6,776,208) |
See accompanying notes which are an integral part of the financial statements.
Statement of Changes in Net Assets
| | Year ended December 31, 2018 | Year ended December 31, 2017 |
| Increase (Decrease) in Net Assets | | |
| Operations | | |
| Net investment income (loss) | $726,293 | $546,226 |
| Net realized gain (loss) | 2,289,869 | 1,505,660 |
| Change in net unrealized appreciation (depreciation) | (9,792,370) | 7,128,449 |
| Net increase (decrease) in net assets resulting from operations | (6,776,208) | 9,180,335 |
| Distributions to shareholders | (1,917,705) | – |
| Distributions to shareholders from net investment income | – | (542,643) |
| Distributions to shareholders from net realized gain | – | (1,421,671) |
| Total distributions | (1,917,705) | (1,964,314) |
| Share transactions - net increase (decrease) | 17,727,522 | 12,393,101 |
| Total increase (decrease) in net assets | 9,033,609 | 19,609,122 |
| Net Assets | | |
| Beginning of period | 56,259,071 | 36,649,949 |
| End of period | $65,292,680 | $56,259,071 |
See accompanying notes which are an integral part of the financial statements.
Financial Highlights
VIP Freedom 2035 Portfolio Initial Class
| Years ended December 31, | 2018 | 2017 | 2016 | 2015 | 2014 |
| Selected Per–Share Data | | | | | |
| Net asset value, beginning of period | $22.88 | $19.39 | $19.05 | $19.52 | $19.16 |
| Income from Investment Operations | | | | | |
| Net investment income (loss)A | .29 | .30 | .31 | .39 | .39 |
| Net realized and unrealized gain (loss) | (2.39) | 4.14 | .88 | (.44) | .55 |
| Total from investment operations | (2.10) | 4.44 | 1.19 | (.05) | .94 |
| Distributions from net investment income | (.26) | (.27) | (.26) | (.32) | (.29) |
| Distributions from net realized gain | (.45) | (.69) | (.60) | (.10) | (.29) |
| Total distributions | (.71) | (.95)B | (.85)C | (.42) | (.58) |
| Net asset value, end of period | $20.07 | $22.88 | $19.39 | $19.05 | $19.52 |
| Total ReturnD,E | (9.30)% | 23.35% | 6.87% | (.31)% | 4.93% |
| Ratios to Average Net AssetsF,G | | | | | |
| Expenses before reductionsH | -% | -% | -% | -% | -% |
| Expenses net of fee waivers, if any | - %H | -% | -% | -% | -% |
| Expenses net of all reductions | - %H | -% | -% | -% | -% |
| Net investment income (loss) | 1.30% | 1.42% | 1.65% | 1.98% | 2.02% |
| Supplemental Data | | | | | |
| Net assets, end of period (000 omitted) | $7,977 | $6,197 | $3,522 | $1,545 | $539 |
| Portfolio turnover rateG | 27% | 25% | 18% | 22% | 26% |
A Calculated based on average shares outstanding during the period.
B Total distributions of $.95 per share is comprised of distributions from net investment income of $.266 and distributions from net realized gain of $.685 per share.
C Total distributions of $.85 per share is comprised of distributions from net investment income of $.255 and distributions from net realized gain of $.599 per share.
D Total returns do not reflect charges attributable to your insurance company's separate account. Inclusion of these charges would reduce the total returns shown.
E Total returns would have been lower if certain expenses had not been reduced during the applicable periods shown.
F Expense ratios reflect operating expenses of the class. Expenses before reductions do not reflect amounts reimbursed by the investment adviser or reductions from expense offset arrangements and do not represent the amount paid by the class during periods when reimbursements or reductions occur. Expenses net of fee waivers reflect expenses after reimbursement by the investment adviser but prior to reductions from expense offset arrangements. Expenses net of all reductions represent the net expenses paid by the class but do not include expenses of the underlying funds in which the Fund invests.
G Amount does not include the portfolio activity of any underlying Fidelity Central Funds.
H Amount represents less than .005%.
See accompanying notes which are an integral part of the financial statements.
VIP Freedom 2035 Portfolio Service Class
| Years ended December 31, | 2018 | 2017 | 2016 | 2015 | 2014 |
| Selected Per–Share Data | | | | | |
| Net asset value, beginning of period | $22.84 | $19.36 | $19.04 | $19.51 | $19.15 |
| Income from Investment Operations | | | | | |
| Net investment income (loss)A | .27 | .28 | .29 | .37 | .38 |
| Net realized and unrealized gain (loss) | (2.38) | 4.13 | .87 | (.44) | .55 |
| Total from investment operations | (2.11) | 4.41 | 1.16 | (.07) | .93 |
| Distributions from net investment income | (.25) | (.25) | (.24) | (.30) | (.28) |
| Distributions from net realized gain | (.45) | (.69) | (.60) | (.10) | (.29) |
| Total distributions | (.69)B | (.93)C | (.84) | (.40) | (.57) |
| Net asset value, end of period | $20.04 | $22.84 | $19.36 | $19.04 | $19.51 |
| Total ReturnD,E | (9.36)% | 23.24% | 6.70% | (.40)% | 4.87% |
| Ratios to Average Net AssetsF,G | | | | | |
| Expenses before reductions | .10% | .10% | .10% | .10% | .10% |
| Expenses net of fee waivers, if any | .10% | .10% | .10% | .10% | .10% |
| Expenses net of all reductions | .10% | .10% | .10% | .10% | .10% |
| Net investment income (loss) | 1.20% | 1.32% | 1.55% | 1.88% | 1.92% |
| Supplemental Data | | | | | |
| Net assets, end of period (000 omitted) | $12,303 | $8,385 | $4,661 | $2,010 | $1,639 |
| Portfolio turnover rateG | 27% | 25% | 18% | 22% | 26% |
A Calculated based on average shares outstanding during the period.
B Total distributions of $.69 per share is comprised of distributions from net investment income of $.245 and distributions from net realized gain of $.447 per share.
C Total distributions of $.93 per share is comprised of distributions from net investment income of $.248 and distributions from net realized gain of $.685 per share.
D Total returns do not reflect charges attributable to your insurance company's separate account. Inclusion of these charges would reduce the total returns shown.
E Total returns would have been lower if certain expenses had not been reduced during the applicable periods shown.
F Expense ratios reflect operating expenses of the class. Expenses before reductions do not reflect amounts reimbursed by the investment adviser or reductions from expense offset arrangements and do not represent the amount paid by the class during periods when reimbursements or reductions occur. Expenses net of fee waivers reflect expenses after reimbursement by the investment adviser but prior to reductions from expense offset arrangements. Expenses net of all reductions represent the net expenses paid by the class but do not include expenses of the underlying funds in which the Fund invests.
G Amount does not include the portfolio activity of any underlying Fidelity Central Funds.
See accompanying notes which are an integral part of the financial statements.
VIP Freedom 2035 Portfolio Service Class 2
| Years ended December 31, | 2018 | 2017 | 2016 | 2015 | 2014 |
| Selected Per–Share Data | | | | | |
| Net asset value, beginning of period | $22.73 | $19.27 | $18.96 | $19.43 | $19.09 |
| Income from Investment Operations | | | | | |
| Net investment income (loss)A | .24 | .25 | .26 | .34 | .34 |
| Net realized and unrealized gain (loss) | (2.37) | 4.11 | .86 | (.43) | .54 |
| Total from investment operations | (2.13) | 4.36 | 1.12 | (.09) | .88 |
| Distributions from net investment income | (.22) | (.22) | (.22) | (.28) | (.26) |
| Distributions from net realized gain | (.45) | (.69) | (.60) | (.10) | (.29) |
| Total distributions | (.66)B | (.90)C | (.81)D | (.38) | (.54)E |
| Net asset value, end of period | $19.94 | $22.73 | $19.27 | $18.96 | $19.43 |
| Total ReturnF,G | (9.50)% | 23.07% | 6.52% | (.51)% | 4.65% |
| Ratios to Average Net AssetsH,I | | | | | |
| Expenses before reductions | .25% | .25% | .25% | .25% | .25% |
| Expenses net of fee waivers, if any | .25% | .25% | .25% | .25% | .25% |
| Expenses net of all reductions | .25% | .25% | .25% | .25% | .25% |
| Net investment income (loss) | 1.05% | 1.17% | 1.40% | 1.73% | 1.77% |
| Supplemental Data | | | | | |
| Net assets, end of period (000 omitted) | $45,013 | $41,677 | $28,467 | $20,005 | $13,035 |
| Portfolio turnover rateI | 27% | 25% | 18% | 22% | 26% |
A Calculated based on average shares outstanding during the period.
B Total distributions of $.66 per share is comprised of distributions from net investment income of $.215 and distributions from net realized gain of $.447 per share.
C Total distributions of $.90 per share is comprised of distributions from net investment income of $.217 and distributions from net realized gain of $.685 per share.
D Total distributions of $.81 per share is comprised of distributions from net investment income of $.215 and distributions from net realized gain of $.599 per share.
E Total distributions of $.54 per share is comprised of distributions from net investment income of $.257 and distributions from net realized gain of $.287 per share.
F Total returns do not reflect charges attributable to your insurance company's separate account. Inclusion of these charges would reduce the total returns shown.
G Total returns would have been lower if certain expenses had not been reduced during the applicable periods shown.
H Expense ratios reflect operating expenses of the class. Expenses before reductions do not reflect amounts reimbursed by the investment adviser or reductions from expense offset arrangements and do not represent the amount paid by the class during periods when reimbursements or reductions occur. Expenses net of fee waivers reflect expenses after reimbursement by the investment adviser but prior to reductions from expense offset arrangements. Expenses net of all reductions represent the net expenses paid by the class but do not include expenses of the underlying funds in which the Fund invests.
I Amount does not include the portfolio activity of any underlying Fidelity Central Funds.
See accompanying notes which are an integral part of the financial statements.
VIP Freedom 2040 Portfolio℠
Investment Summary (Unaudited)
The information in the following tables is based on the direct investments of the Fund.
Top Holdings as of December 31, 2018
| | % of fund's net assets |
| VIP Overseas Portfolio Initial Class | 20.9 |
| VIP Growth & Income Portfolio Initial Class | 12.6 |
| VIP Equity-Income Portfolio Initial Class | 11.0 |
| VIP Emerging Markets Portfolio Initial Class | 10.8 |
| VIP Growth Portfolio Initial Class | 10.7 |
| VIP Contrafund Portfolio Initial Class | 10.5 |
| VIP Value Portfolio Initial Class | 8.1 |
| Fidelity Long Term Treasury Bond Index Fund | 4.4 |
| VIP Value Strategies Portfolio Initial Class | 3.9 |
| VIP Mid Cap Portfolio Initial Class | 3.0 |
| | 95.9 |
Asset Allocation (% of fund's net assets)
| Period end |
| | Domestic Equity Funds | 59.8% |
| | International Equity Funds | 31.7% |
| | Bond Funds | 7.7% |
| | Short-Term Funds | 0.8% |

VIP Freedom 2040 Portfolio℠
Schedule of Investments December 31, 2018
Showing Percentage of Net Assets
| Domestic Equity Funds - 59.8% | | | |
| | | Shares | Value |
| VIP Contrafund Portfolio Initial Class (a) | | 272,503 | $8,755,524 |
| VIP Equity-Income Portfolio Initial Class (a) | | 450,840 | 9,183,603 |
| VIP Growth & Income Portfolio Initial Class (a) | | 540,209 | 10,469,252 |
| VIP Growth Portfolio Initial Class (a) | | 141,738 | 8,946,473 |
| VIP Mid Cap Portfolio Initial Class (a) | | 84,113 | 2,539,360 |
| VIP Value Portfolio Initial Class (a) | | 515,194 | 6,738,731 |
| VIP Value Strategies Portfolio Initial Class (a) | | 295,802 | 3,286,361 |
| TOTAL DOMESTIC EQUITY FUNDS | | | |
| (Cost $50,716,300) | | | 49,919,304 |
|
| International Equity Funds - 31.7% | | | |
| VIP Emerging Markets Portfolio Initial Class (a) | | 903,665 | 8,991,467 |
| VIP Overseas Portfolio Initial Class (a) | | 914,532 | 17,494,999 |
| TOTAL INTERNATIONAL EQUITY FUNDS | | | |
| (Cost $25,982,055) | | | 26,486,466 |
|
| Bond Funds - 7.7% | | | |
| Fidelity Inflation-Protected Bond Index Fund Institutional Premium Class (a) | | 89,246 | 846,949 |
| Fidelity Long Term Treasury Bond Index Fund (a) | | 287,295 | 3,642,903 |
| VIP High Income Portfolio Initial Class (a) | | 302,058 | 1,501,228 |
| VIP Investment Grade Bond Portfolio Initial Class (a) | | 33,650 | 415,244 |
| TOTAL BOND FUNDS | | | |
| (Cost $6,504,494) | | | 6,406,324 |
|
| Short-Term Funds - 0.8% | | | |
| Fidelity Cash Central Fund, 2.42% (b) | | 2,076 | 2,077 |
| VIP Government Money Market Portfolio Initial Class 2.19% (a)(c) | | 664,513 | 664,513 |
| TOTAL SHORT-TERM FUNDS | | | |
| (Cost $666,589) | | | 666,590 |
| TOTAL INVESTMENT IN SECURITIES - 100.0% | | | |
| (Cost $83,869,438) | | | 83,478,684 |
| NET OTHER ASSETS (LIABILITIES) - 0.0% | | | (7,289) |
| NET ASSETS - 100% | | | $83,471,395 |
Legend
(a) Affiliated Fund
(b) Affiliated fund that is generally available only to investment companies and other accounts managed by Fidelity Investments. The rate quoted is the annualized seven-day yield of the fund at period end. A complete unaudited listing of the fund's holdings as of its most recent quarter end is available upon request. In addition, each Fidelity Central Fund's financial statements, which are not covered by the Fund's Report of Independent Registered Public Accounting Firm, are available on the SEC's website or upon request.
(c) The rate quoted is the annualized seven-day yield of the fund at period end.
Affiliated Central Funds
Information regarding fiscal year to date income earned by the Fund from investments in Fidelity Central Funds is as follows:
| Fund | Income earned |
| Fidelity Cash Central Fund | $15 |
| Total | $15 |
Amounts in the income column in the above table include any capital gain distributions from underlying funds, which are presented in the corresponding line-item in the Statement of Operations if applicable.
Affiliated Underlying Funds
Fiscal year to date information regarding the Fund's investments in affiliated Underlying Funds, excluding any Money Market Central Funds, is presented below. Exchanges between classes of the same affiliated Underlying Funds may occur.
| Affiliate | Value, beginning of period | Purchases | Sales Proceeds | Dividend Income | Realized Gain (loss) | Change in Unrealized appreciation (depreciation) | Value, end of period |
| Fidelity Inflation-Protected Bond Index Fund Institutional Premium Class | $-- | $59,034 | $185,613 | $17,607 | $(4,530) | $(25,641) | $846,949 |
| Fidelity Inflation-Protected Bond Index Fund Premium Class | -- | 1,853,579 | 849,400 | 1,159 | (480) | -- | -- |
| Fidelity Long Term Treasury Bond Index Fund | -- | 222,752 | 1,081,624 | 18,955 | (67,303) | 50,004 | 3,642,903 |
| Fidelity Long-Term Treasury Bond Index Fund Premium Class | 1,649,863 | 3,500,253 | 596,234 | 66,415 | (39,970) | 5,162 | -- |
| VIP Contrafund Portfolio Initial Class | 8,268,140 | 4,725,476 | 2,860,862 | 777,059 | (69,720) | (1,307,510) | 8,755,524 |
| VIP Emerging Markets Portfolio Initial Class | 7,375,970 | 5,967,214 | 2,645,508 | 68,956 | (189,228) | (1,516,981) | 8,991,467 |
| VIP Equity-Income Portfolio Initial Class | 8,717,213 | 5,028,715 | 3,175,240 | 616,535 | (40,067) | (1,347,018) | 9,183,603 |
| VIP Government Money Market Portfolio Initial Class 2.19% | 2,012,872 | 926,952 | 2,275,311 | 22,810 | -- | -- | 664,513 |
| VIP Growth & Income Portfolio Initial Class | 9,998,142 | 5,741,515 | 3,697,170 | 607,852 | (2,576) | (1,570,659) | 10,469,252 |
| VIP Growth Portfolio Initial Class | 8,420,941 | 5,230,644 | 3,451,463 | 1,217,341 | (30,215) | (1,223,434) | 8,946,473 |
| VIP High Income Portfolio Initial Class | 1,549,948 | 957,477 | 868,372 | 87,997 | (12,554) | (125,271) | 1,501,228 |
| VIP Investment Grade Bond Portfolio Initial Class | 1,685,150 | 1,136,049 | 2,354,009 | 26,880 | (38,897) | (13,049) | 415,244 |
| VIP Mid Cap Portfolio Initial Class | 2,422,433 | 1,532,276 | 784,256 | 219,585 | (29,343) | (601,750) | 2,539,360 |
| VIP Overseas Portfolio Initial Class | 16,805,546 | 9,342,095 | 5,372,908 | 320,909 | (240,900) | (3,038,834) | 17,494,999 |
| VIP Value Portfolio Initial Class | 6,405,011 | 3,741,631 | 1,915,491 | 466,637 | (67,454) | (1,424,966) | 6,738,731 |
| VIP Value Strategies Portfolio Initial Class | 3,128,405 | 1,931,814 | 949,550 | 183,955 | (66,367) | (757,941) | 3,286,361 |
| Total | $78,439,634 | $51,897,476 | $33,063,011 | $4,720,652 | $(899,604) | $(12,897,888) | $83,476,607 |
Amounts in the income column in the above table include any capital gain distributions from underlying funds, which are presented in the corresponding line-item in the Statement of Operations if applicable.
Investment Valuation
All investments are categorized as Level 1 under the Fair Value Hierarchy. The inputs or methodology used for valuing securities may not be an indication of the risk associated with investing in those securities. For more information on valuation inputs please refer to the Investment Valuation section in the accompanying Notes to Financial Statements.
See accompanying notes which are an integral part of the financial statements.
VIP Freedom 2040 Portfolio℠
Financial Statements
Statement of Assets and Liabilities
| | | December 31, 2018 |
| Assets | | |
Investment in securities, at value — See accompanying schedule:
| | |
| Fidelity Central Funds (cost $2,077) | $2,077 | |
| Other affiliated issuers (cost $83,867,361) | 83,476,607 | |
| Total Investment in Securities (cost $83,869,438) | | $83,478,684 |
| Receivable for investments sold | | 1,398,379 |
| Receivable for fund shares sold | | 196,482 |
| Distributions receivable from Fidelity Central Funds | | 12 |
| Total assets | | 85,073,557 |
| Liabilities | | |
| Payable for investments purchased | $913,858 | |
| Payable for fund shares redeemed | 681,008 | |
| Distribution and service plan fees payable | 7,296 | |
| Total liabilities | | 1,602,162 |
| Net Assets | | $83,471,395 |
| Net Assets consist of: | | |
| Paid in capital | | $81,970,020 |
| Total distributable earnings (loss) | | 1,501,375 |
| Net Assets | | $83,471,395 |
| Net Asset Value and Maximum Offering Price | | |
| Initial Class: | | |
| Net Asset Value, offering price and redemption price per share ($19,652,156 ÷ 1,037,596 shares) | | $18.94 |
| Service Class: | | |
| Net Asset Value, offering price and redemption price per share ($48,428,565 ÷ 2,561,467 shares) | | $18.91 |
| Service Class 2: | | |
| Net Asset Value, offering price and redemption price per share ($15,390,674 ÷ 816,767 shares) | | $18.84 |
See accompanying notes which are an integral part of the financial statements.
Statement of Operations
| | | Year ended December 31, 2018 |
| Investment Income | | |
| Dividends: | | |
| Affiliated issuers | | $1,083,469 |
| Income from Fidelity Central Funds | | 15 |
| Total income | | 1,083,484 |
| Expenses | | |
| Distribution and service plan fees | $91,153 | |
| Independent trustees' fees and expenses | 458 | |
| Total expenses before reductions | 91,611 | |
| Expense reductions | (2) | |
| Total expenses after reductions | | 91,609 |
| Net investment income (loss) | | 991,875 |
| Realized and Unrealized Gain (Loss) | | |
| Net realized gain (loss) on: | | |
| Investment securities: | | |
| Affiliated issuers | (897,532) | |
| Capital gain distributions from underlying funds: | | |
| Affiliated issuers | 3,637,183 | |
| Total net realized gain (loss) | | 2,739,651 |
| Change in net unrealized appreciation (depreciation) on: | | |
| Investment securities: | | |
| Affiliated issuers | (12,897,888) | |
| Total change in net unrealized appreciation (depreciation) | | (12,897,888) |
| Net gain (loss) | | (10,158,237) |
| Net increase (decrease) in net assets resulting from operations | | $(9,166,362) |
See accompanying notes which are an integral part of the financial statements.
Statement of Changes in Net Assets
| | Year ended December 31, 2018 | Year ended December 31, 2017 |
| Increase (Decrease) in Net Assets | | |
| Operations | | |
| Net investment income (loss) | $991,875 | $808,261 |
| Net realized gain (loss) | 2,739,651 | 2,237,051 |
| Change in net unrealized appreciation (depreciation) | (12,897,888) | 10,038,009 |
| Net increase (decrease) in net assets resulting from operations | (9,166,362) | 13,083,321 |
| Distributions to shareholders | (2,691,387) | – |
| Distributions to shareholders from net investment income | – | (803,474) |
| Distributions to shareholders from net realized gain | – | (1,932,423) |
| Total distributions | (2,691,387) | (2,735,897) |
| Share transactions - net increase (decrease) | 16,896,290 | 18,498,572 |
| Total increase (decrease) in net assets | 5,038,541 | 28,845,996 |
| Net Assets | | |
| Beginning of period | 78,432,854 | 49,586,858 |
| End of period | $83,471,395 | $78,432,854 |
See accompanying notes which are an integral part of the financial statements.
Financial Highlights
VIP Freedom 2040 Portfolio Initial Class
| Years ended December 31, | 2018 | 2017�� | 2016 | 2015 | 2014 |
| Selected Per–Share Data | | | | | |
| Net asset value, beginning of period | $21.76 | $18.39 | $18.19 | $18.66 | $18.35 |
| Income from Investment Operations | | | | | |
| Net investment income (loss)A | .27 | .28 | .23 | .34 | .34 |
| Net realized and unrealized gain (loss) | (2.39) | 3.98 | .88 | (.38) | .56 |
| Total from investment operations | (2.12) | 4.26 | 1.11 | (.04) | .90 |
| Distributions from net investment income | (.25) | (.25) | (.24) | (.31) | (.28) |
| Distributions from net realized gain | (.45) | (.64) | (.67) | (.12) | (.31) |
| Total distributions | (.70) | (.89) | (.91) | (.43) | (.59) |
| Net asset value, end of period | $18.94 | $21.76 | $18.39 | $18.19 | $18.66 |
| Total ReturnB,C | (9.88)% | 23.60% | 6.83% | (.26)% | 4.91% |
| Ratios to Average Net AssetsD,E | | | | | |
| Expenses before reductionsF | -% | -% | -% | -% | -% |
| Expenses net of fee waivers, if any | - %F | -% | -% | -% | -% |
| Expenses net of all reductions | - %F | -% | -% | -% | -% |
| Net investment income (loss) | 1.26% | 1.39% | 1.29% | 1.80% | 1.82% |
| Supplemental Data | | | | | |
| Net assets, end of period (000 omitted) | $19,652 | $16,561 | $11,515 | $15,388 | $15,234 |
| Portfolio turnover rateE | 39% | 26% | 36% | 23% | 19% |
A Calculated based on average shares outstanding during the period.
B Total returns do not reflect charges attributable to your insurance company's separate account. Inclusion of these charges would reduce the total returns shown.
C Total returns would have been lower if certain expenses had not been reduced during the applicable periods shown.
D Expense ratios reflect operating expenses of the class. Expenses before reductions do not reflect amounts reimbursed by the investment adviser or reductions from expense offset arrangements and do not represent the amount paid by the class during periods when reimbursements or reductions occur. Expenses net of fee waivers reflect expenses after reimbursement by the investment adviser but prior to reductions from expense offset arrangements. Expenses net of all reductions represent the net expenses paid by the class but do not include expenses of the underlying funds in which the Fund invests.
E Amount does not include the portfolio activity of any underlying Fidelity Central Funds.
F Amount represents less than .005%.
See accompanying notes which are an integral part of the financial statements.
VIP Freedom 2040 Portfolio Service Class
| Years ended December 31, | 2018 | 2017 | 2016 | 2015 | 2014 |
| Selected Per–Share Data | | | | | |
| Net asset value, beginning of period | $21.72 | $18.37 | $18.17 | $18.64 | $18.33 |
| Income from Investment Operations | | | | | |
| Net investment income (loss)A | .25 | .26 | .21 | .32 | .32 |
| Net realized and unrealized gain (loss) | (2.38) | 3.96 | .89 | (.38) | .56 |
| Total from investment operations | (2.13) | 4.22 | 1.10 | (.06) | .88 |
| Distributions from net investment income | (.23) | (.23) | (.23) | (.29) | (.27) |
| Distributions from net realized gain | (.45) | (.64) | (.67) | (.12) | (.31) |
| Total distributions | (.68) | (.87) | (.90) | (.41) | (.57)B |
| Net asset value, end of period | $18.91 | $21.72 | $18.37 | $18.17 | $18.64 |
| Total ReturnC,D | (9.94)% | 23.42% | 6.75% | (.35)% | 4.83% |
| Ratios to Average Net AssetsE,F | | | | | |
| Expenses before reductions | .10% | .10% | .10% | .10% | .10% |
| Expenses net of fee waivers, if any | .10% | .10% | .10% | .10% | .10% |
| Expenses net of all reductions | .10% | .10% | .10% | .10% | .10% |
| Net investment income (loss) | 1.16% | 1.29% | 1.19% | 1.70% | 1.72% |
| Supplemental Data | | | | | |
| Net assets, end of period (000 omitted) | $48,429 | $45,492 | $22,986 | $18,401 | $12,905 |
| Portfolio turnover rateF | 39% | 26% | 36% | 23% | 19% |
A Calculated based on average shares outstanding during the period.
B Total distributions of $.57 per share is comprised of distributions from net investment income of $.266 and distributions from net realized gain of $.305 per share.
C Total returns do not reflect charges attributable to your insurance company's separate account. Inclusion of these charges would reduce the total returns shown.
D Total returns would have been lower if certain expenses had not been reduced during the applicable periods shown.
E Expense ratios reflect operating expenses of the class. Expenses before reductions do not reflect amounts reimbursed by the investment adviser or reductions from expense offset arrangements and do not represent the amount paid by the class during periods when reimbursements or reductions occur. Expenses net of fee waivers reflect expenses after reimbursement by the investment adviser but prior to reductions from expense offset arrangements. Expenses net of all reductions represent the net expenses paid by the class but do not include expenses of the underlying funds in which the Fund invests.
F Amount does not include the portfolio activity of any underlying Fidelity Central Funds.
See accompanying notes which are an integral part of the financial statements.
VIP Freedom 2040 Portfolio Service Class 2
| Years ended December 31, | 2018 | 2017 | 2016 | 2015 | 2014 |
| Selected Per–Share Data | | | | | |
| Net asset value, beginning of period | $21.65 | $18.30 | $18.12 | $18.59 | $18.29 |
| Income from Investment Operations | | | | | |
| Net investment income (loss)A | .22 | .23 | .18 | .29 | .29 |
| Net realized and unrealized gain (loss) | (2.38) | 3.95 | .87 | (.38) | .56 |
| Total from investment operations | (2.16) | 4.18 | 1.05 | (.09) | .85 |
| Distributions from net investment income | (.20) | (.19) | (.20) | (.27) | (.25) |
| Distributions from net realized gain | (.45) | (.64) | (.67) | (.12) | (.31) |
| Total distributions | (.65) | (.83) | (.87) | (.38)B | (.55)C |
| Net asset value, end of period | $18.84 | $21.65 | $18.30 | $18.12 | $18.59 |
| Total ReturnD,E | (10.12)% | 23.30% | 6.53% | (.49)% | 4.70% |
| Ratios to Average Net AssetsF,G | | | | | |
| Expenses before reductions | .25% | .25% | .25% | .25% | .25% |
| Expenses net of fee waivers, if any | .25% | .25% | .25% | .25% | .25% |
| Expenses net of all reductions | .25% | .25% | .25% | .25% | .25% |
| Net investment income (loss) | 1.01% | 1.14% | 1.04% | 1.55% | 1.57% |
| Supplemental Data | | | | | |
| Net assets, end of period (000 omitted) | $15,391 | $16,380 | $15,086 | $12,468 | $8,341 |
| Portfolio turnover rateG | 39% | 26% | 36% | 23% | 19% |
A Calculated based on average shares outstanding during the period.
B Total distributions of $.38 per share is comprised of distributions from net investment income of $.268 and distributions from net realized gain of $.116 per share.
C Total distributions of $.55 per share is comprised of distributions from net investment income of $.249 and distributions from net realized gain of $.305 per share.
D Total returns do not reflect charges attributable to your insurance company's separate account. Inclusion of these charges would reduce the total returns shown.
E Total returns would have been lower if certain expenses had not been reduced during the applicable periods shown.
F Expense ratios reflect operating expenses of the class. Expenses before reductions do not reflect amounts reimbursed by the investment adviser or reductions from expense offset arrangements and do not represent the amount paid by the class during periods when reimbursements or reductions occur. Expenses net of fee waivers reflect expenses after reimbursement by the investment adviser but prior to reductions from expense offset arrangements. Expenses net of all reductions represent the net expenses paid by the class but do not include expenses of the underlying funds in which the Fund invests.
G Amount does not include the portfolio activity of any underlying Fidelity Central Funds.
See accompanying notes which are an integral part of the financial statements.
VIP Freedom 2045 Portfolio℠
Investment Summary (Unaudited)
The information in the following tables is based on the direct investments of the Fund.
Top Holdings as of December 31, 2018
| | % of fund's net assets |
| VIP Overseas Portfolio Initial Class | 20.9 |
| VIP Growth & Income Portfolio Initial Class | 12.6 |
| VIP Equity-Income Portfolio Initial Class | 11.0 |
| VIP Emerging Markets Portfolio Initial Class | 10.8 |
| VIP Growth Portfolio Initial Class | 10.7 |
| VIP Contrafund Portfolio Initial Class | 10.5 |
| VIP Value Portfolio Initial Class | 8.1 |
| Fidelity Long Term Treasury Bond Index Fund | 4.4 |
| VIP Value Strategies Portfolio Initial Class | 3.9 |
| VIP Mid Cap Portfolio Initial Class | 3.0 |
| | 95.9 |
Asset Allocation (% of fund's net assets)
| Period end |
| | Domestic Equity Funds | 59.8% |
| | International Equity Funds | 31.7% |
| | Bond Funds | 7.7% |
| | Short-Term Funds | 0.8% |

VIP Freedom 2045 Portfolio℠
Schedule of Investments December 31, 2018
Showing Percentage of Net Assets
| Domestic Equity Funds - 59.8% | | | |
| | | Shares | Value |
| VIP Contrafund Portfolio Initial Class (a) | | 113,558 | $3,648,605 |
| VIP Equity-Income Portfolio Initial Class (a) | | 187,877 | 3,827,063 |
| VIP Growth & Income Portfolio Initial Class (a) | | 225,122 | 4,362,874 |
| VIP Growth Portfolio Initial Class (a) | | 59,065 | 3,728,207 |
| VIP Mid Cap Portfolio Initial Class (a) | | 35,053 | 1,058,265 |
| VIP Value Portfolio Initial Class (a) | | 214,697 | 2,808,230 |
| VIP Value Strategies Portfolio Initial Class (a) | | 123,271 | 1,369,542 |
| TOTAL DOMESTIC EQUITY FUNDS | | | |
| (Cost $21,979,178) | | | 20,802,786 |
|
| International Equity Funds - 31.7% | | | |
| VIP Emerging Markets Portfolio Initial Class (a) | | 376,446 | 3,745,635 |
| VIP Overseas Portfolio Initial Class (a) | | 381,168 | 7,291,740 |
| TOTAL INTERNATIONAL EQUITY FUNDS | | | |
| (Cost $11,199,804) | | | 11,037,375 |
|
| Bond Funds - 7.7% | | | |
| Fidelity Inflation-Protected Bond Index Fund Institutional Premium Class (a) | | 37,187 | 352,900 |
| Fidelity Long Term Treasury Bond Index Fund (a) | | 119,728 | 1,518,153 |
| VIP High Income Portfolio Initial Class (a) | | 125,816 | 625,306 |
| VIP Investment Grade Bond Portfolio Initial Class (a) | | 14,023 | 173,048 |
| TOTAL BOND FUNDS | | | |
| (Cost $2,710,468) | | | 2,669,407 |
|
| Short-Term Funds - 0.8% | | | |
| VIP Government Money Market Portfolio Initial Class 2.19% (a)(b) | | | |
| (Cost $276,899) | | 276,899 | 276,899 |
| TOTAL INVESTMENT IN SECURITIES - 100.0% | | | |
| (Cost $36,166,349) | | | 34,786,467 |
| NET OTHER ASSETS (LIABILITIES) - 0.0% | | | (5,344) |
| NET ASSETS - 100% | | | $34,781,123 |
Legend
(a) Affiliated Fund
(b) The rate quoted is the annualized seven-day yield of the fund at period end.
Affiliated Underlying Funds
Fiscal year to date information regarding the Fund's investments in affiliated Underlying Funds, excluding any Money Market Central Funds, is presented below. Exchanges between classes of the same affiliated Underlying Funds may occur.
| Affiliate | Value, beginning of period | Purchases | Sales Proceeds | Dividend Income | Realized Gain (loss) | Change in Unrealized appreciation (depreciation) | Value, end of period |
| Fidelity Inflation-Protected Bond Index Fund Institutional Premium Class | $-- | $31,478 | $69,960 | $7,304 | $(1,628) | $(10,563) | $352,900 |
| Fidelity Inflation-Protected Bond Index Fund Premium Class | -- | 800,332 | 396,397 | 488 | (362) | -- | -- |
| Fidelity Long Term Treasury Bond Index Fund | -- | 121,452 | 417,036 | 7,844 | (15,373) | 16,094 | 1,518,153 |
| Fidelity Long-Term Treasury Bond Index Fund Premium Class | 627,220 | 1,549,932 | 344,733 | 27,998 | (21,620) | 2,217 | -- |
| VIP Contrafund Portfolio Initial Class | 3,248,457 | 2,311,659 | 1,357,569 | 329,845 | (27,896) | (526,046) | 3,648,605 |
| VIP Emerging Markets Portfolio Initial Class | 2,898,390 | 2,774,742 | 1,205,027 | 28,575 | (88,098) | (634,372) | 3,745,635 |
| VIP Equity-Income Portfolio Initial Class | 3,424,784 | 2,396,282 | 1,425,442 | 259,729 | (25,624) | (542,937) | 3,827,063 |
| VIP Government Money Market Portfolio Initial Class 2.19% | 790,864 | 443,555 | 957,520 | 9,663 | -- | -- | 276,899 |
| VIP Growth & Income Portfolio Initial Class | 3,928,070 | 2,666,963 | 1,591,888 | 257,899 | (4,189) | (636,082) | 4,362,874 |
| VIP Growth Portfolio Initial Class | 3,308,459 | 2,540,831 | 1,615,677 | 517,439 | (26,960) | (478,446) | 3,728,207 |
| VIP High Income Portfolio Initial Class | 608,966 | 440,261 | 367,694 | 36,568 | (6,125) | (50,102) | 625,306 |
| VIP Investment Grade Bond Portfolio Initial Class | 682,629 | 504,537 | 992,664 | 11,300 | (16,357) | (5,097) | 173,048 |
| VIP Mid Cap Portfolio Initial Class | 951,854 | 729,979 | 364,419 | 93,216 | (13,008) | (246,141) | 1,058,265 |
| VIP Overseas Portfolio Initial Class | 6,602,357 | 4,472,215 | 2,442,639 | 132,795 | (96,807) | (1,243,386) | 7,291,740 |
| VIP Value Portfolio Initial Class | 2,516,540 | 1,826,160 | 926,437 | 195,737 | (22,941) | (585,092) | 2,808,230 |
| VIP Value Strategies Portfolio Initial Class | 1,229,177 | 931,191 | 455,443 | 77,274 | (33,492) | (301,891) | 1,369,542 |
| Total | $30,817,767 | $24,541,569 | $14,930,545 | $1,993,674 | $(400,480) | $(5,241,844) | $34,786,467 |
Amounts in the income column in the above table include any capital gain distributions from underlying funds, which are presented in the corresponding line-item in the Statement of Operations if applicable.
Investment Valuation
All investments are categorized as Level 1 under the Fair Value Hierarchy. The inputs or methodology used for valuing securities may not be an indication of the risk associated with investing in those securities. For more information on valuation inputs please refer to the Investment Valuation section in the accompanying Notes to Financial Statements.
See accompanying notes which are an integral part of the financial statements.
VIP Freedom 2045 Portfolio℠
Financial Statements
Statement of Assets and Liabilities
| | | December 31, 2018 |
| Assets | | |
Investment in securities, at value — See accompanying schedule:
| | |
| Affiliated issuers (cost $36,166,349) | $34,786,467 | |
| Total Investment in Securities (cost $36,166,349) | | $34,786,467 |
| Cash | | 900 |
| Receivable for investments sold | | 438,277 |
| Receivable for fund shares sold | | 81,624 |
| Total assets | | 35,307,268 |
| Liabilities | | |
| Payable for investments purchased | $508,426 | |
| Payable for fund shares redeemed | 11,478 | |
| Distribution and service plan fees payable | 6,241 | |
| Total liabilities | | 526,145 |
| Net Assets | | $34,781,123 |
| Net Assets consist of: | | |
| Paid in capital | | $35,279,891 |
| Total distributable earnings (loss) | | (498,768) |
| Net Assets | | $34,781,123 |
| Net Asset Value and Maximum Offering Price | | |
| Initial Class: | | |
| Net Asset Value, offering price and redemption price per share ($2,582,972 ÷ 136,561 shares) | | $18.91 |
| Service Class: | | |
| Net Asset Value, offering price and redemption price per share ($3,900,092 ÷ 206,544 shares) | | $18.88 |
| Service Class 2: | | |
| Net Asset Value, offering price and redemption price per share ($28,298,059 ÷ 1,504,835 shares) | | $18.80 |
See accompanying notes which are an integral part of the financial statements.
Statement of Operations
| | | Year ended December 31, 2018 |
| Investment Income | | |
| Dividends: | | |
| Affiliated issuers | | $450,305 |
| Expenses | | |
| Distribution and service plan fees | $80,090 | |
| Independent trustees' fees and expenses | 189 | |
| Total expenses | | 80,279 |
| Net investment income (loss) | | 370,026 |
| Realized and Unrealized Gain (Loss) | | |
| Net realized gain (loss) on: | | |
| Investment securities: | | |
| Affiliated issuers | (399,581) | |
| Capital gain distributions from underlying funds: | | |
| Affiliated issuers | 1,543,369 | |
| Total net realized gain (loss) | | 1,143,788 |
| Change in net unrealized appreciation (depreciation) on: | | |
| Investment securities: | | |
| Affiliated issuers | (5,241,844) | |
| Total change in net unrealized appreciation (depreciation) | | (5,241,844) |
| Net gain (loss) | | (4,098,056) |
| Net increase (decrease) in net assets resulting from operations | | $(3,728,030) |
See accompanying notes which are an integral part of the financial statements.
Statement of Changes in Net Assets
| | Year ended December 31, 2018 | Year ended December 31, 2017 |
| Increase (Decrease) in Net Assets | | |
| Operations | | |
| Net investment income (loss) | $370,026 | $283,321 |
| Net realized gain (loss) | 1,143,788 | 781,248 |
| Change in net unrealized appreciation (depreciation) | (5,241,844) | 3,645,899 |
| Net increase (decrease) in net assets resulting from operations | (3,728,030) | 4,710,468 |
| Distributions to shareholders | (958,451) | – |
| Distributions to shareholders from net investment income | – | (281,848) |
| Distributions to shareholders from net realized gain | – | (750,257) |
| Total distributions | (958,451) | (1,032,105) |
| Share transactions - net increase (decrease) | 8,655,380 | 9,278,407 |
| Total increase (decrease) in net assets | 3,968,899 | 12,956,770 |
| Net Assets | | |
| Beginning of period | 30,812,224 | 17,855,454 |
| End of period | $34,781,123 | $30,812,224 |
See accompanying notes which are an integral part of the financial statements.
Financial Highlights
VIP Freedom 2045 Portfolio Initial Class
| Years ended December 31, | 2018 | 2017 | 2016 | 2015 | 2014 |
| Selected Per–Share Data | | | | | |
| Net asset value, beginning of period | $21.64 | $18.31 | $18.03 | $18.50 | $18.18 |
| Income from Investment Operations | | | | | |
| Net investment income (loss)A | .27 | .30 | .28 | .38 | .40 |
| Net realized and unrealized gain (loss) | (2.39) | 3.93 | .83 | (.42) | .50 |
| Total from investment operations | (2.12) | 4.23 | 1.11 | (.04) | .90 |
| Distributions from net investment income | (.25) | (.24) | (.24) | (.33) | (.28) |
| Distributions from net realized gain | (.37) | (.66) | (.59) | (.10) | (.30) |
| Total distributions | (.61)B | (.90) | (.83) | (.43) | (.58) |
| Net asset value, end of period | $18.91 | $21.64 | $18.31 | $18.03 | $18.50 |
| Total ReturnC,D | (9.89)% | 23.59% | 6.80% | (.26)% | 4.95% |
| Ratios to Average Net AssetsE,F | | | | | |
| Expenses before reductionsG | -% | -% | -% | -% | -% |
| Expenses net of fee waivers, if any | - %G | -% | -% | -% | -% |
| Expenses net of all reductions | - %G | -% | -% | -% | -% |
| Net investment income (loss) | 1.25% | 1.46% | 1.57% | 2.01% | 2.14% |
| Supplemental Data | | | | | |
| Net assets, end of period (000 omitted) | $2,583 | $1,491 | $789 | $542 | $342 |
| Portfolio turnover rateF | 42% | 23% | 19% | 26% | 19% |
A Calculated based on average shares outstanding during the period.
B Total distributions of $.61 per share is comprised of distributions from net investment income of $.246 and distributions from net realized gain of $.366 per share.
C Total returns do not reflect charges attributable to your insurance company's separate account. Inclusion of these charges would reduce the total returns shown.
D Total returns would have been lower if certain expenses had not been reduced during the applicable periods shown.
E Expense ratios reflect operating expenses of the class. Expenses before reductions do not reflect amounts reimbursed by the investment adviser or reductions from expense offset arrangements and do not represent the amount paid by the class during periods when reimbursements or reductions occur. Expenses net of fee waivers reflect expenses after reimbursement by the investment adviser but prior to reductions from expense offset arrangements. Expenses net of all reductions represent the net expenses paid by the class but do not include expenses of the underlying funds in which the Fund invests.
F Amounts do not include the activity of the Underlying Funds.
G Amount represents less than .005%.
See accompanying notes which are an integral part of the financial statements.
VIP Freedom 2045 Portfolio Service Class
| Years ended December 31, | 2018 | 2017 | 2016 | 2015 | 2014 |
| Selected Per–Share Data | | | | | |
| Net asset value, beginning of period | $21.61 | $18.30 | $18.02 | $18.49 | $18.18 |
| Income from Investment Operations | | | | | |
| Net investment income (loss)A | .24 | .28 | .26 | .36 | .38 |
| Net realized and unrealized gain (loss) | (2.37) | 3.92 | .84 | (.42) | .49 |
| Total from investment operations | (2.13) | 4.20 | 1.10 | (.06) | .87 |
| Distributions from net investment income | (.23) | (.23) | (.23) | (.31) | (.27) |
| Distributions from net realized gain | (.37) | (.66) | (.59) | (.10) | (.30) |
| Total distributions | (.60) | (.89) | (.82) | (.41) | (.56)B |
| Net asset value, end of period | $18.88 | $21.61 | $18.30 | $18.02 | $18.49 |
| Total ReturnC,D | (9.97)% | 23.42% | 6.73% | (.37)% | 4.83% |
| Ratios to Average Net AssetsE,F | | | | | |
| Expenses before reductions | .10% | .10% | .10% | .10% | .10% |
| Expenses net of fee waivers, if any | .10% | .10% | .10% | .10% | .10% |
| Expenses net of all reductions | .10% | .10% | .10% | .10% | .10% |
| Net investment income (loss) | 1.15% | 1.36% | 1.47% | 1.91% | 2.04% |
| Supplemental Data | | | | | |
| Net assets, end of period (000 omitted) | $3,900 | $1,923 | $396 | $343 | $364 |
| Portfolio turnover rateF | 42% | 23% | 19% | 26% | 19% |
A Calculated based on average shares outstanding during the period.
B Total distributions of $.56 per share is comprised of distributions from net investment income of $.266 and distributions from net realized gain of $.298 per share.
C Total returns do not reflect charges attributable to your insurance company's separate account. Inclusion of these charges would reduce the total returns shown.
D Total returns would have been lower if certain expenses had not been reduced during the applicable periods shown.
E Expense ratios reflect operating expenses of the class. Expenses before reductions do not reflect amounts reimbursed by the investment adviser or reductions from expense offset arrangements and do not represent the amount paid by the class during periods when reimbursements or reductions occur. Expenses net of fee waivers reflect expenses after reimbursement by the investment adviser but prior to reductions from expense offset arrangements. Expenses net of all reductions represent the net expenses paid by the class but do not include expenses of the underlying funds in which the Fund invests.
F Amounts do not include the activity of the Underlying Funds.
See accompanying notes which are an integral part of the financial statements.
VIP Freedom 2045 Portfolio Service Class 2
| Years ended December 31, | 2018 | 2017 | 2016 | 2015 | 2014 |
| Selected Per–Share Data | | | | | |
| Net asset value, beginning of period | $21.52 | $18.22 | $17.95 | $18.43 | $18.13 |
| Income from Investment Operations | | | | | |
| Net investment income (loss)A | .21 | .24 | .23 | .33 | .35 |
| Net realized and unrealized gain (loss) | (2.37) | 3.92 | .84 | (.42) | .49 |
| Total from investment operations | (2.16) | 4.16 | 1.07 | (.09) | .84 |
| Distributions from net investment income | (.20) | (.20) | (.20) | (.29) | (.25) |
| Distributions from net realized gain | (.37) | (.66) | (.59) | (.10) | (.30) |
| Total distributions | (.56)B | (.86) | (.80)C | (.39) | (.54)D |
| Net asset value, end of period | $18.80 | $21.52 | $18.22 | $17.95 | $18.43 |
| Total ReturnE,F | (10.13)% | 23.30% | 6.56% | (.53)% | 4.68% |
| Ratios to Average Net AssetsG,H | | | | | |
| Expenses before reductions | .25% | .25% | .25% | .25% | .25% |
| Expenses net of fee waivers, if any | .25% | .25% | .25% | .25% | .25% |
| Expenses net of all reductions | .25% | .25% | .25% | .25% | .25% |
| Net investment income (loss) | 1.00% | 1.21% | 1.32% | 1.76% | 1.89% |
| Supplemental Data | | | | | |
| Net assets, end of period (000 omitted) | $28,298 | $27,399 | $16,671 | $11,398 | $7,363 |
| Portfolio turnover rateH | 42% | 23% | 19% | 26% | 19% |
A Calculated based on average shares outstanding during the period.
B Total distributions of $.56 per share is comprised of distributions from net investment income of $.198 and distributions from net realized gain of $.366 per share.
C Total distributions of $.80 per share is comprised of distributions from net investment income of $.202 and distributions from net realized gain of $.594 per share.
D Total distributions of $.54 per share is comprised of distributions from net investment income of $.245 and distributions from net realized gain of $.298 per share.
E Total returns do not reflect charges attributable to your insurance company's separate account. Inclusion of these charges would reduce the total returns shown.
F Total returns would have been lower if certain expenses had not been reduced during the applicable periods shown.
G Expense ratios reflect operating expenses of the class. Expenses before reductions do not reflect amounts reimbursed by the investment adviser or reductions from expense offset arrangements and do not represent the amount paid by the class during periods when reimbursements or reductions occur. Expenses net of fee waivers reflect expenses after reimbursement by the investment adviser but prior to reductions from expense offset arrangements. Expenses net of all reductions represent the net expenses paid by the class but do not include expenses of the underlying funds in which the Fund invests.
H Amounts do not include the activity of the Underlying Funds.
See accompanying notes which are an integral part of the financial statements.
VIP Freedom 2050 Portfolio℠
Investment Summary (Unaudited)
The information in the following tables is based on the direct investments of the Fund.
Top Holdings as of December 31, 2018
| | % of fund's net assets |
| VIP Overseas Portfolio Initial Class | 21.0 |
| VIP Growth & Income Portfolio Initial Class | 12.6 |
| VIP Equity-Income Portfolio Initial Class | 11.0 |
| VIP Emerging Markets Portfolio Initial Class | 10.7 |
| VIP Growth Portfolio Initial Class | 10.7 |
| VIP Contrafund Portfolio Initial Class | 10.5 |
| VIP Value Portfolio Initial Class | 8.1 |
| Fidelity Long Term Treasury Bond Index Fund | 4.4 |
| VIP Value Strategies Portfolio Initial Class | 3.9 |
| VIP Mid Cap Portfolio Initial Class | 3.0 |
| | 95.9 |
Asset Allocation (% of fund's net assets)
| Period end |
| | Domestic Equity Funds | 59.8% |
| | International Equity Funds | 31.7% |
| | Bond Funds | 7.7% |
| | Short-Term Funds | 0.8% |

VIP Freedom 2050 Portfolio℠
Schedule of Investments December 31, 2018
Showing Percentage of Net Assets
| Domestic Equity Funds - 59.8% | | | |
| | | Shares | Value |
| VIP Contrafund Portfolio Initial Class (a) | | 89,861 | $2,887,236 |
| VIP Equity-Income Portfolio Initial Class (a) | | 148,670 | 3,028,406 |
| VIP Growth & Income Portfolio Initial Class (a) | | 178,138 | 3,452,313 |
| VIP Growth Portfolio Initial Class (a) | | 46,740 | 2,950,203 |
| VIP Mid Cap Portfolio Initial Class (a) | | 27,750 | 837,767 |
| VIP Value Portfolio Initial Class(a) | | 169,902 | 2,222,322 |
| VIP Value Strategies Portfolio Initial Class (a) | | 97,574 | 1,084,047 |
| TOTAL DOMESTIC EQUITY FUNDS | | | |
| (Cost $16,882,838) | | | 16,462,294 |
|
| International Equity Funds - 31.7% | | | |
| VIP Emerging Markets Portfolio Initial Class (a) | | 297,845 | 2,963,555 |
| VIP Overseas Portfolio Initial Class (a) | | 301,704 | 5,771,597 |
| TOTAL INTERNATIONAL EQUITY FUNDS | | | |
| (Cost $8,599,101) | | | 8,735,152 |
|
| Bond Funds - 7.7% | | | |
| Fidelity Inflation-Protected Bond Index Fund Institutional Premium Class (a) | | 29,421 | 279,207 |
| Fidelity Long Term Treasury Bond Index Fund (a) | | 94,939 | 1,203,830 |
| VIP High Income Portfolio Initial Class (a) | | 101,275 | 503,336 |
| VIP Investment Grade Bond Portfolio Initial Class (a) | | 9,890 | 122,044 |
| TOTAL BOND FUNDS | | | |
| (Cost $2,070,838) | | | 2,108,417 |
|
| Short-Term Funds - 0.8% | | | |
| VIP Government Money Market Portfolio Initial Class 2.19% (a)(b) | | | |
| (Cost $216,345) | | 216,345 | 216,345 |
| TOTAL INVESTMENT IN SECURITIES - 100.0% | | | |
| (Cost $27,769,122) | | | 27,522,208 |
| NET OTHER ASSETS (LIABILITIES) - 0.0% | | | (2,376) |
| NET ASSETS - 100% | | | $27,519,832 |
Legend
(a) Affiliated Fund
(b) The rate quoted is the annualized seven-day yield of the fund at period end.
Affiliated Underlying Funds
Fiscal year to date information regarding the Fund's investments in affiliated Underlying Funds, excluding any Money Market Central Funds, is presented below. Exchanges between classes of the same affiliated Underlying Funds may occur.
| Affiliate | Value, beginning of period | Purchases | Sales Proceeds | Dividend Income | Realized Gain (loss) | Change in Unrealized appreciation (depreciation) | Value, end of period |
| Fidelity Inflation-Protected Bond Index Fund Institutional Premium Class | $-- | $30,973 | $255,982 | $5,810 | $(6,502) | $(3,371) | $279,207 |
| Fidelity Inflation-Protected Bond Index Fund Premium Class | -- | 762,960 | 248,861 | 353 | (10) | -- | -- |
| Fidelity Long Term Treasury Bond Index Fund | -- | 117,109 | 1,184,563 | 6,231 | (78,621) | 71,696 | 1,203,830 |
| Fidelity Long-Term Treasury Bond Index Fund Premium Class | 446,878 | 1,988,235 | 147,465 | 19,922 | (11,060) | 1,621 | -- |
| VIP Contrafund Portfolio Initial Class | 2,199,150 | 3,964,152 | 2,825,613 | 221,178 | (52,113) | (398,340) | 2,887,236 |
| VIP Emerging Markets Portfolio Initial Class | 1,961,713 | 4,189,159 | 2,673,963 | 22,603 | (112,074) | (401,280) | 2,963,555 |
| VIP Equity-Income Portfolio Initial Class | 2,318,618 | 4,170,244 | 3,031,130 | 184,189 | (23,889) | (405,437) | 3,028,406 |
| VIP Government Money Market Portfolio Initial Class 2.19% | 535,216 | 504,892 | 823,763 | 6,849 | -- | -- | 216,345 |
| VIP Growth & Income Portfolio Initial Class | 2,659,604 | 4,738,479 | 3,451,020 | 173,558 | (13,682) | (481,068) | 3,452,313 |
| VIP Growth Portfolio Initial Class | 2,239,463 | 4,164,708 | 3,040,428 | 343,164 | (40,888) | (372,652) | 2,950,203 |
| VIP High Income Portfolio Initial Class | 412,135 | 755,594 | 620,166 | 28,809 | (6,551) | (37,676) | 503,336 |
| VIP Investment Grade Bond Portfolio Initial Class | 439,955 | 521,133 | 824,375 | 6,978 | (12,602) | (2,067) | 122,044 |
| VIP Mid Cap Portfolio Initial Class | 644,349 | 1,195,917 | 801,556 | 62,460 | (23,336) | (177,607) | 837,767 |
| VIP Overseas Portfolio Initial Class | 4,469,313 | 7,870,666 | 5,524,356 | 105,988 | (165,262) | (878,764) | 5,771,597 |
| VIP Value Portfolio Initial Class | 1,703,449 | 3,079,524 | 2,082,982 | 143,139 | (50,288) | (427,381) | 2,222,322 |
| VIP Value Strategies Portfolio Initial Class | 831,927 | 1,531,563 | 1,016,469 | 55,928 | (94,231) | (168,743) | 1,084,047 |
| Total | $20,861,770 | $39,585,308 | $28,552,692 | $1,387,159 | $(691,109) | $(3,681,069) | $27,522,208 |
Amounts in the income column in the above table include any capital gain distributions from underlying funds, which are presented in the corresponding line-item in the Statement of Operations if applicable.
Investment Valuation
All investments are categorized as Level 1 under the Fair Value Hierarchy. The inputs or methodology used for valuing securities may not be an indication of the risk associated with investing in those securities. For more information on valuation inputs please refer to the Investment Valuation section in the accompanying Notes to Financial Statements.
See accompanying notes which are an integral part of the financial statements.
VIP Freedom 2050 Portfolio℠
Financial Statements
Statement of Assets and Liabilities
| | | December 31, 2018 |
| Assets | | |
Investment in securities, at value — See accompanying schedule:
| | |
| Affiliated issuers (cost $27,769,122) | $27,522,208 | |
| Total Investment in Securities (cost $27,769,122) | | $27,522,208 |
| Cash | | 616 |
| Receivable for investments sold | | 339,837 |
| Receivable for fund shares sold | | 39,270 |
| Total assets | | 27,901,931 |
| Liabilities | | |
| Payable for investments purchased | $354,774 | |
| Payable for fund shares redeemed | 24,335 | |
| Distribution and service plan fees payable | 2,990 | |
| Total liabilities | | 382,099 |
| Net Assets | | $27,519,832 |
| Net Assets consist of: | | |
| Paid in capital | | $27,720,833 |
| Total distributable earnings (loss) | | (201,001) |
| Net Assets | | $27,519,832 |
| Net Asset Value and Maximum Offering Price | | |
| Initial Class: | | |
| Net Asset Value, offering price and redemption price per share ($7,055,523 ÷ 418,030 shares) | | $16.88 |
| Service Class: | | |
| Net Asset Value, offering price and redemption price per share ($10,202,626 ÷ 605,811 shares) | | $16.84 |
| Service Class 2: | | |
| Net Asset Value, offering price and redemption price per share ($10,261,683 ÷ 610,912 shares) | | $16.80 |
See accompanying notes which are an integral part of the financial statements.
Statement of Operations
| | | Year ended December 31, 2018 |
| Investment Income | | |
| Dividends: | | |
| Affiliated issuers | | $349,684 |
| Expenses | | |
| Distribution and service plan fees | $33,188 | |
| Independent trustees' fees and expenses | 136 | |
| Total expenses before reductions | 33,324 | |
| Expense reductions | (1) | |
| Total expenses after reductions | | 33,323 |
| Net investment income (loss) | | 316,361 |
| Realized and Unrealized Gain (Loss) | | |
| Net realized gain (loss) on: | | |
| Investment securities: | | |
| Affiliated issuers | (690,494) | |
| Capital gain distributions from underlying funds: | | |
| Affiliated issuers | 1,037,475 | |
| Total net realized gain (loss) | | 346,981 |
| Change in net unrealized appreciation (depreciation) on: | | |
| Investment securities: | | |
| Affiliated issuers | (3,681,069) | |
| Total change in net unrealized appreciation (depreciation) | | (3,681,069) |
| Net gain (loss) | | (3,334,088) |
| Net increase (decrease) in net assets resulting from operations | | $(3,017,727) |
See accompanying notes which are an integral part of the financial statements.
Statement of Changes in Net Assets
| | Year ended December 31, 2018 | Year ended December 31, 2017 |
| Increase (Decrease) in Net Assets | | |
| Operations | | |
| Net investment income (loss) | $316,361 | $221,405 |
| Net realized gain (loss) | 346,981 | 815,033 |
| Change in net unrealized appreciation (depreciation) | (3,681,069) | 3,036,282 |
| Net increase (decrease) in net assets resulting from operations | (3,017,727) | 4,072,720 |
| Distributions to shareholders | (939,841) | – |
| Distributions to shareholders from net investment income | – | (219,958) |
| Distributions to shareholders from net realized gain | – | (674,377) |
| Total distributions | (939,841) | (894,335) |
| Share transactions - net increase (decrease) | 10,617,841 | (166,904) |
| Total increase (decrease) in net assets | 6,660,273 | 3,011,481 |
| Net Assets | | |
| Beginning of period | 20,859,559 | 17,848,078 |
| End of period | $27,519,832 | $20,859,559 |
See accompanying notes which are an integral part of the financial statements.
Financial Highlights
VIP Freedom 2050 Portfolio Initial Class
| Years ended December 31, | 2018 | 2017 | 2016 | 2015 | 2014 |
| Selected Per–Share Data | | | | | |
| Net asset value, beginning of period | $19.50 | $16.55 | $16.42 | $16.86 | $16.55 |
| Income from Investment Operations | | | | | |
| Net investment income (loss)A | .26 | .23 | .25 | .32 | .35 |
| Net realized and unrealized gain (loss) | (2.15) | 3.58 | .75 | (.36) | .47 |
| Total from investment operations | (1.89) | 3.81 | 1.00 | (.04) | .82 |
| Distributions from net investment income | (.21) | (.24) | (.25) | (.29) | (.25) |
| Distributions from net realized gain | (.52) | (.63) | (.62) | (.11) | (.27) |
| Total distributions | (.73) | (.86)B | (.87) | (.40) | (.51)C |
| Net asset value, end of period | $16.88 | $19.50 | $16.55 | $16.42 | $16.86 |
| Total ReturnD,E | (9.89)% | 23.52% | 6.84% | (.29)% | 5.01% |
| Ratios to Average Net AssetsF,G | | | | | |
| Expenses before reductionsH | -% | -% | -% | -% | -% |
| Expenses net of fee waivers, if any | - %H | -% | -% | -% | -% |
| Expenses net of all reductions | - %H | -% | -% | -% | -% |
| Net investment income (loss) | 1.35% | 1.27% | 1.59% | 1.89% | 2.06% |
| Supplemental Data | | | | | |
| Net assets, end of period (000 omitted) | $7,056 | $5,826 | $4,171 | $2,266 | $1,684 |
| Portfolio turnover rateG | 111% | 46% | 26% | 37% | 22% |
A Calculated based on average shares outstanding during the period.
B Total distributions of $.86 per share is comprised of distributions from net investment income of $.237 and distributions from net realized gain of $.625 per share.
C Total distributions of $.51 per share is comprised of distributions from net investment income of $.248 and distributions from net realized gain of $.266 per share.
D Total returns do not reflect charges attributable to your insurance company's separate account. Inclusion of these charges would reduce the total returns shown.
E Total returns would have been lower if certain expenses had not been reduced during the applicable periods shown.
F Expense ratios reflect operating expenses of the class. Expenses before reductions do not reflect amounts reimbursed by the investment adviser or reductions from expense offset arrangements and do not represent the amount paid by the class during periods when reimbursements or reductions occur. Expenses net of fee waivers reflect expenses after reimbursement by the investment adviser but prior to reductions from expense offset arrangements. Expenses net of all reductions represent the net expenses paid by the class but do not include expenses of the underlying funds in which the Fund invests.
G Amounts do not include the activity of the Underlying Funds.
H Amount represents less than .005%.
See accompanying notes which are an integral part of the financial statements.
VIP Freedom 2050 Portfolio Service Class
| Years ended December 31, | 2018 | 2017 | 2016 | 2015 | 2014 |
| Selected Per–Share Data | | | | | |
| Net asset value, beginning of period | $19.47 | $16.52 | $16.39 | $16.83 | $16.54 |
| Income from Investment Operations | | | | | |
| Net investment income (loss)A | .24 | .21 | .24 | .31 | .33 |
| Net realized and unrealized gain (loss) | (2.15) | 3.59 | .74 | (.37) | .46 |
| Total from investment operations | (1.91) | 3.80 | .98 | (.06) | .79 |
| Distributions from net investment income | (.20) | (.22) | (.23) | (.27) | (.24) |
| Distributions from net realized gain | (.52) | (.63) | (.62) | (.11) | (.27) |
| Total distributions | (.72) | (.85) | (.85) | (.38) | (.50)B |
| Net asset value, end of period | $16.84 | $19.47 | $16.52 | $16.39 | $16.83 |
| Total ReturnC,D | (10.03)% | 23.46% | 6.75% | (.38)% | 4.81% |
| Ratios to Average Net AssetsE,F | | | | | |
| Expenses before reductions | .10% | .10% | .10% | .10% | .10% |
| Expenses net of fee waivers, if any | .10% | .10% | .10% | .10% | .10% |
| Expenses net of all reductions | .10% | .10% | .10% | .10% | .10% |
| Net investment income (loss) | 1.25% | 1.17% | 1.49% | 1.79% | 1.96% |
| Supplemental Data | | | | | |
| Net assets, end of period (000 omitted) | $10,203 | $6,748 | $4,205 | $3,004 | $2,878 |
| Portfolio turnover rateF | 111% | 46% | 26% | 37% | 22% |
A Calculated based on average shares outstanding during the period.
B Total distributions of $.50 per share is comprised of distributions from net investment income of $.236 and distributions from net realized gain of $.266 per share.
C Total returns do not reflect charges attributable to your insurance company's separate account. Inclusion of these charges would reduce the total returns shown.
D Total returns would have been lower if certain expenses had not been reduced during the applicable periods shown.
E Expense ratios reflect operating expenses of the class. Expenses before reductions do not reflect amounts reimbursed by the investment adviser or reductions from expense offset arrangements and do not represent the amount paid by the class during periods when reimbursements or reductions occur. Expenses net of fee waivers reflect expenses after reimbursement by the investment adviser but prior to reductions from expense offset arrangements. Expenses net of all reductions represent the net expenses paid by the class but do not include expenses of the underlying funds in which the Fund invests.
F Amounts do not include the activity of the Underlying Funds.
See accompanying notes which are an integral part of the financial statements.
VIP Freedom 2050 Portfolio Service Class 2
| Years ended December 31, | 2018 | 2017 | 2016 | 2015 | 2014 |
| Selected Per–Share Data | | | | | |
| Net asset value, beginning of period | $19.42 | $16.47 | $16.35 | $16.80 | $16.51 |
| Income from Investment Operations | | | | | |
| Net investment income (loss)A | .21 | .18 | .21 | .28 | .30 |
| Net realized and unrealized gain (loss) | (2.13) | 3.58 | .74 | (.37) | .47 |
| Total from investment operations | (1.92) | 3.76 | .95 | (.09) | .77 |
| Distributions from net investment income | (.18) | (.18) | (.21) | (.25) | (.22) |
| Distributions from net realized gain | (.52) | (.63) | (.62) | (.11) | (.27) |
| Total distributions | (.70) | (.81) | (.83) | (.36) | (.48)B |
| Net asset value, end of period | $16.80 | $19.42 | $16.47 | $16.35 | $16.80 |
| Total ReturnC,D | (10.13)% | 23.30% | 6.56% | (.58)% | 4.71% |
| Ratios to Average Net AssetsE,F | | | | | |
| Expenses before reductions | .25% | .25% | .25% | .25% | .25% |
| Expenses net of fee waivers, if any | .25% | .25% | .25% | .25% | .25% |
| Expenses net of all reductions | .25% | .25% | .25% | .25% | .25% |
| Net investment income (loss) | 1.10% | 1.02% | 1.34% | 1.64% | 1.81% |
| Supplemental Data | | | | | |
| Net assets, end of period (000 omitted) | $10,262 | $8,285 | $9,472 | $7,649 | $6,436 |
| Portfolio turnover rateF | 111% | 46% | 26% | 37% | 22% |
A Calculated based on average shares outstanding during the period.
B Total distributions of $.48 per share is comprised of distributions from net investment income of $.218 and distributions from net realized gain of $.266 per share.
C Total returns do not reflect charges attributable to your insurance company's separate account. Inclusion of these charges would reduce the total returns shown.
D Total returns would have been lower if certain expenses had not been reduced during the applicable periods shown.
E Expense ratios reflect operating expenses of the class. Expenses before reductions do not reflect amounts reimbursed by the investment adviser or reductions from expense offset arrangements and do not represent the amount paid by the class during periods when reimbursements or reductions occur. Expenses net of fee waivers reflect expenses after reimbursement by the investment adviser but prior to reductions from expense offset arrangements. Expenses net of all reductions represent the net expenses paid by the class but do not include expenses of the underlying funds in which the Fund invests.
F Amounts do not include the activity of the Underlying Funds.
See accompanying notes which are an integral part of the financial statements.
Notes to Financial Statements
For the period ended December 31, 2018
1. Organization.
VIP Freedom Income Portfolio, VIP Freedom 2005 Portfolio, VIP Freedom 2010 Portfolio, VIP Freedom 2015 Portfolio, VIP Freedom 2020 Portfolio, VIP Freedom 2025 Portfolio, VIP Freedom 2030 Portfolio, VIP Freedom 2035 Portfolio, VIP Freedom 2040 Portfolio, VIP Freedom 2045 Portfolio and VIP Freedom 2050 Portfolio (the Funds) are funds of Variable Insurance Products Fund V (the Trust). The Trust is registered under the Investment Company Act of 1940, as amended (the 1940 Act), as an open-end management investment company organized as a Massachusetts business trust. Each Fund is authorized to issue an unlimited number of shares. The Funds invest primarily in a combination of other VIP equity, bond, and short-term funds (the Underlying Funds) managed by Fidelity Management & Research Company (FMR). Shares of each Fund may only be purchased by insurance companies for the purpose of funding variable annuity or variable life insurance contracts. Each Fund offers three classes of shares: Initial Class shares, Service Class shares and Service Class 2 shares. All classes have equal rights and voting privileges, except for matters affecting a single class.
2. Investments in Fidelity Central Funds.
The Funds invest in Fidelity Central Funds, which are open-end investment companies generally available only to other investment companies and accounts managed by the investment adviser and its affiliates. The Funds' Schedules of Investments list each of the Fidelity Central Funds held as of period end, if any, as an investment of each Fund, but does not include the underlying holdings of each Fidelity Central Fund. As an Investing Fund, each Fund indirectly bears its proportionate share of the expenses of the underlying Fidelity Central Funds.
The Money Market Central Funds seek preservation of capital and current income and are managed by Fidelity Investments Money Management, Inc. (FIMM), an affiliate of the investment adviser. Annualized expenses of the Money Market Central Funds as of their most recent shareholder report date are less than .005%.
A complete unaudited list of holdings for each Fidelity Central Fund is available upon request or at the Securities and Exchange Commission (the SEC) website at www.sec.gov. In addition, the financial statements of the Fidelity Central Funds, which are not covered by the Funds' Report of Independent Registered Public Accounting Firm, are available on the SEC website or upon request.
3. Significant Accounting Policies.
Each Fund is an investment company and applies the accounting and reporting guidance of the Financial Accounting Standards Board (FASB) Accounting Standards Codification Topic 946 Financial Services – Investments Companies. The financial statements have been prepared in conformity with accounting principles generally accepted in the United States of America (GAAP), which require management to make certain estimates and assumptions at the date of the financial statements. Actual results could differ from those estimates. Subsequent events, if any, through the date that the financial statements were issued have been evaluated in the preparation of the financial statements. The following summarizes the significant accounting policies of the Funds:
Investment Valuation. Investments are valued as of 4:00 p.m. Eastern time on the last calendar day of the period. Each Fund categorizes the inputs to valuation techniques used to value its investments into a disclosure hierarchy consisting of three levels as shown below:
- Level 1 – quoted prices in active markets for identical investments
- Level 2 – other significant observable inputs (including quoted prices for similar investments, interest rates, prepayment speeds, etc.)
- Level 3 – unobservable inputs (including the Fund's own assumptions based on the best information available)
Valuation techniques used to value each Fund's investments by major category are as follows. Investments in the Underlying Funds are valued at their closing net asset value (NAV) each business day and are categorized as Level 1 in the hierarchy.
Investment Transactions and Income. For financial reporting purposes, the Funds' investment holdings and NAV include trades executed through the end of the last business day of the period. The NAV per share for processing shareholder transactions is calculated as of the close of business of the New York Stock Exchange (NYSE), normally 4:00 p.m. Eastern time and includes trades executed through the end of the prior business day. Gains and losses on securities sold are determined on the basis of identified cost. Income and capital gain distributions from the Underlying Funds, if any, are recorded on the ex-dividend date.
Class Allocations and Expenses. Investment income, realized and unrealized capital gains and losses, common expenses of each Fund, and certain fund-level expense reductions, if any, are allocated daily on a pro-rata basis to each class based on the relative net assets of each class to the total net assets of each Fund. Each class differs with respect to distribution and service plan fees incurred. Certain expense reductions may also differ by class. For the reporting period, the allocated portion of income and expenses to each class as a percent of its average net assets may vary due to the timing of recording these transactions in relation to fluctuating net assets of the classes. Expenses directly attributable to a fund are charged to that fund. Expenses attributable to more than one fund are allocated among the respective funds on the basis of relative net assets or other appropriate methods. Expenses included in the accompanying financial statements reflect the expenses of each Fund and do not include any expenses associated with the Underlying Funds. Although not included in each Fund's expenses, each Fund indirectly bears its proportionate share of the Underlying Funds' expenses through the impact of these expenses on each Underlying Fund's NAV. Expense estimates are accrued in the period to which they relate and adjustments are made when actual amounts are known.
Income Tax Information and Distributions to Shareholders. Each year, each Fund intends to qualify as a regulated investment company under Subchapter M of the Internal Revenue Code, including distributing substantially all of its taxable income and realized gains. As a result, no provision for U.S. Federal income taxes is required. As of December 31, 2018, each Fund did not have any unrecognized tax benefits in the financial statements; nor is each Fund aware of any tax positions for which it is reasonably possible that the total amounts of unrecognized tax benefits will significantly change in the next twelve months. Each Fund files a U.S. federal tax return, in addition to state and local tax returns as required. Each Fund's federal income tax returns are subject to examination by the Internal Revenue Service (IRS) for a period of three fiscal years after they are filed. State and local tax returns may be subject to examination for an additional fiscal year depending on the jurisdiction.
Distributions are declared and recorded on the ex-dividend date. Income and capital gain distributions are declared separately for each class. Income and capital gain distributions are determined in accordance with income tax regulations, which may differ from GAAP.
Capital accounts within the financial statements are adjusted for permanent book-tax differences. These adjustments have no impact on net assets or the results of operations. Capital accounts are not adjusted for temporary book-tax differences which will reverse in a subsequent period.
Book-tax differences are primarily due to the short-term gain distributions from the Underlying Funds and losses deferred due to wash sales.
As of period end, the cost and unrealized appreciation (depreciation) in securities, and derivatives if applicable, for federal income tax purposes were as follows for each Fund:
| | Tax cost | Gross unrealized appreciation | Gross unrealized depreciation | Net unrealized appreciation (depreciation) |
| VIP Freedom Income | $44,201,560 | $1,419,134 | $(983,387) | $435,747 |
| VIP Freedom 2005 | 10,469,939 | 367,317 | (245,936) | 121,381 |
| VIP Freedom 2010 | 267,256,204 | 22,184,760 | (4,605,186) | 17,579,574 |
| VIP Freedom 2015 | 65,705,411 | 11,411,910 | (747,431) | 10,664,479 |
| VIP Freedom 2020 | 578,774,638 | 90,432,181 | (9,335,791) | 81,096,390 |
| VIP Freedom 2025 | 177,666,578 | 14,791,130 | (6,058,291) | 8,732,839 |
| VIP Freedom 2030 | 296,893,687 | 35,258,070 | (9,391,999) | 25,866,071 |
| VIP Freedom 2035 | 68,067,538 | 1,823,260 | (4,587,627) | (2,764,367) |
| VIP Freedom 2040 | 85,142,111 | 3,718,639 | (5,382,066) | (1,663,427) |
| VIP Freedom 2045 | 36,579,811 | 948,856 | (2,742,200) | (1,793,344) |
| VIP Freedom 2050 | 28,565,341 | 984,851 | (2,027,984) | (1,043,133) |
The tax-based components of distributable earnings as of period end were as follows for each Fund:
| | Undistributed ordinary income | Undistributed long-term capital gain | Net unrealized appreciation (depreciation) on securities and other investments |
| VIP Freedom Income | $156,375 | $781,379 | $435,747 |
| VIP Freedom 2005 | 32,660 | 154,143 | 121,381 |
| VIP Freedom 2010 | 695,740 | 11,143,334 | 17,579,574 |
| VIP Freedom 2015 | 163,550 | 5,336,033 | 10,664,479 |
| VIP Freedom 2020 | 1,217,759 | 34,190,222 | 81,096,390 |
| VIP Freedom 2025 | 273,256 | 5,153,191 | 8,732,839 |
| VIP Freedom 2030 | 347,774 | 11,474,457 | 25,866,071 |
| VIP Freedom 2035 | 55,713 | 2,229,106 | (2,764,367) |
| VIP Freedom 2040 | 8,675 | 3,156,127 | (1,663,427) |
| VIP Freedom 2045 | 7,026 | 1,287,548 | (1,793,344) |
| VIP Freedom 2050 | 953 | 841,178 | (1,043,133) |
The tax character of distributions paid was as follows:
| December 31, 2018 | | | |
| | Ordinary Income | Long-term Capital Gains | Total |
| VIP Freedom Income | $813,309 | $388,422 | $1,201,731 |
| VIP Freedom 2005 | 191,068 | 121,462 | 312,530 |
| VIP Freedom 2010 | 4,888,545 | 8,059,528 | 12,948,073 |
| VIP Freedom 2015 | 1,473,506 | 3,533,299 | 5,006,805 |
| VIP Freedom 2020 | 11,438,663 | 22,071,235 | 33,509,898 |
| VIP Freedom 2025 | 3,110,330 | 2,944,628 | 6,054,958 |
| VIP Freedom 2030 | 5,947,027 | 7,132,300 | 13,079,327 |
| VIP Freedom 2035 | 986,313 | 931,392 | 1,917,705 |
| VIP Freedom 2040 | 1,373,584 | 1,317,803 | 2,691,387 |
| VIP Freedom 2045 | 508,279 | 450,172 | 958,451 |
| VIP Freedom 2050 | 426,823 | 513,018 | 939,841 |
| December 31, 2017 | | | |
| | Ordinary Income | Long-term Capital Gains | Total |
| VIP Freedom Income | $763,674 | $201,357 | $965,031 |
| VIP Freedom 2005 | 175,944 | 84,111 | 260,055 |
| VIP Freedom 2010 | 5,680,207 | 4,670,205 | 10,350,411 |
| VIP Freedom 2015 | 1,977,451 | 2,043,773 | 4,021,224 |
| VIP Freedom 2020 | 15,172,840 | 15,307,077 | 30,479,917 |
| VIP Freedom 2025 | 3,532,316 | 2,868,615 | 6,400,931 |
| VIP Freedom 2030 | 6,767,841 | 7,406,985 | 14,174,826 |
| VIP Freedom 2035 | 1,067,053 | 897,261 | 1,964,314 |
| VIP Freedom 2040 | 1,556,542 | 1,179,355 | 2,735,897 |
| VIP Freedom 2045 | 565,328 | 466,777 | 1,032,105 |
| VIP Freedom 2050 | 423,738 | 470,597 | 894,335 |
New Rule Issuance. During August 2018, the U.S. Securities and Exchange Commission issued Final Rule Release No. 33-10532, Disclosure Update and Simplification. This Final Rule includes amendments specific to registered investment companies that are intended to eliminate overlap in disclosure requirements between Regulation S-X and GAAP. In accordance with these amendments, certain line-items in the Funds' financial statements have been combined or removed for the current period as outlined in the table below.
| Financial Statement | Current Line-Item Presentation | Prior Line-Item Presentation |
| Statement of Assets and Liabilities | Total distributable earnings (loss) | Undistributed/Distributions in excess of/Accumulated net investment income (loss)
Accumulated/Undistributed net realized gain (loss)
Net unrealized appreciation (depreciation) |
| Statement of Changes in Net Assets | N/A - removed | Undistributed/Distributions in excess of/Accumulated net investment income (loss) end of period |
| Statement of Changes in Net Assets | Distributions to shareholders | Distributions to shareholders from net investment income
Distributions to shareholders from net realized gain |
| Distributions to Shareholders Note to Financial Statements | Distributions to shareholders | Distributions to shareholders from net investment income
Distributions to shareholders from net realized gain |
4. Purchases and Sales of Investments.
Purchases and sales of securities, other than short-term securities, are noted in the table below.
| | Purchases ($) | Sales ($) |
| VIP Freedom Income | 25,811,748 | 21,052,199 |
| VIP Freedom 2005 | 5,257,039 | 3,240,481 |
| VIP Freedom 2010 | 95,299,994 | 102,139,489 |
| VIP Freedom 2015 | 29,115,218 | 44,747,380 |
| VIP Freedom 2020 | 208,265,215 | 244,834,811 |
| VIP Freedom 2025 | 96,848,687 | 59,494,509 |
| VIP Freedom 2030 | 138,686,485 | 99,799,876 |
| VIP Freedom 2035 | 36,909,000 | 17,733,325 |
| VIP Freedom 2040 | 51,897,476 | 33,063,011 |
| VIP Freedom 2045 | 24,541,569 | 14,930,545 |
| VIP Freedom 2050 | 39,585,308 | 28,552,692 |
5. Fees and Other Transactions with Affiliates.
Management Fee. FMR Co., Inc. (the investment adviser), an affiliate of FMR, provides the Funds with investment management related services. The Funds do not pay any fees for these services.
Distribution and Service Plan Fees. In accordance with Rule 12b-1 of the 1940 Act, the Funds have adopted separate 12b-1 Plans for each Service Class of shares. Each Service Class pays Fidelity Distributors Corporation (FDC), an affiliate of the investment adviser, a service fee. For the period, the service fee is based on an annual rate of .10% of Service Class' average net assets and .25% of Service Class 2's average net assets.
For the period, total fees, all of which were reallowed to insurance companies for the distribution of shares and providing shareholder support services were as follows:
| | Service Class | Service Class 2 | Total |
| VIP Freedom Income | $12,701 | $38,450 | $51,151 |
| VIP Freedom 2005 | 1,735 | 279 | 2,014 |
| VIP Freedom 2010 | 25,598 | 649,281 | 674,879 |
| VIP Freedom 2015 | 14,926 | 106,074 | 121,000 |
| VIP Freedom 2020 | 140,444 | 1,309,004 | 1,449,448 |
| VIP Freedom 2025 | 76,708 | 169,530 | 246,238 |
| VIP Freedom 2030 | 122,203 | 363,567 | 485,770 |
| VIP Freedom 2035 | 12,032 | 114,199 | 126,231 |
| VIP Freedom 2040 | 49,381 | 41,772 | 91,153 |
| VIP Freedom 2045 | 2,941 | 77,149 | 80,090 |
| VIP Freedom 2050 | 9,511 | 23,677 | 33,188 |
Interfund Trades. The Funds may purchase from or sell securities to other Fidelity Funds under procedures adopted by the Board. The procedures have been designed to ensure these interfund trades are executed in accordance with Rule 17a-7 of the 1940 Act. Interfund trades are included within the respective purchases and sales amounts shown in the Purchases and Sales of Investments note.
Other. During the period, the investment adviser reimbursed the Funds for certain losses, which are included in Net Realized Gain (Loss) in each Fund's accompanying Statement of Operations, as follows:
| VIP Freedom 2040 | $2,072 |
| VIP Freedom 2045 | 899 |
| VIP Freedom 2050 | 615 |
6. Expense Reductions.
Through arrangements with each applicable Fund's custodian, credits realized as a result of certain uninvested cash balances were used to reduce each applicable Fund's expenses. During the period, these credits reduced each applicable Fund's expenses by the following amounts:
| VIP Freedom Income | $– |
| VIP Freedom 2005 | – |
| VIP Freedom 2010 | – |
| VIP Freedom 2015 | 1 |
| VIP Freedom 2020 | 5 |
| VIP Freedom 2025 | 3 |
| VIP Freedom 2030 | 6 |
| VIP Freedom 2035 | 1 |
| VIP Freedom 2040 | 2 |
| VIP Freedom 2045 | – |
| VIP Freedom 2050 | 1 |
7. Distributions to Shareholders.
Distributions to shareholders of each class were as follows:
| | Year ended
December 31, 2018 | Year ended
December 31, 2017 |
| VIP Freedom Income | | |
| Distributions to shareholders | | |
| Initial Class | $420,878 | $– |
| Service Class | 385,427 | – |
| Service Class 2 | 395,426 | – |
| Total | $1,201,731 | $– |
| From net investment income | | |
| Initial Class | $– | $245,249 |
| Service Class | – | 182,242 |
| Service Class 2 | – | 191,980 |
| Total | $– | $619,471 |
| From net realized gain | | |
| Initial Class | $– | $130,464 |
| Service Class | – | 91,120 |
| Service Class 2 | – | 123,976 |
| Total | $– | $345,560 |
| VIP Freedom 2005 | | |
| Distributions to shareholders | | |
| Initial Class | $258,157 | $– |
| Service Class | 51,048 | – |
| Service Class 2 | 3,325 | – |
| Total | $312,530 | $– |
| From net investment income | | |
| Initial Class | $– | $117,398 |
| Service Class | – | 13,679 |
| Service Class 2 | – | 1,322 |
| Total | $– | $132,399 |
| From net realized gain | | |
| Initial Class | $– | $111,476 |
| Service Class | – | 14,672 |
| Service Class 2 | – | 1,508 |
| Total | $– | $127,656 |
| VIP Freedom 2010 | | |
| Distributions to shareholders | | |
| Initial Class | $758,703 | $– |
| Service Class | 1,137,110 | – |
| Service Class 2 | 11,052,260 | – |
| Total | $12,948,073 | $– |
| From net investment income | | |
| Initial Class | $– | $277,746 |
| Service Class | – | 371,542 |
| Service Class 2 | – | 3,412,012 |
| Total | $– | $4,061,300 |
| From net realized gain | | |
| Initial Class | $– | $389,757 |
| Service Class | – | 563,752 |
| Service Class 2 | – | 5,335,602 |
| Total | $– | $6,289,111 |
| VIP Freedom 2015 | | |
| Distributions to shareholders | | |
| Initial Class | $1,802,834 | $– |
| Service Class | 832,792 | – |
| Service Class 2 | 2,371,179 | – |
| Total | $5,006,805 | $– |
| From net investment income | | |
| Initial Class | $– | $491,317 |
| Service Class | – | 247,128 |
| Service Class 2 | – | 614,650 |
| Total | $– | $1,353,095 |
| From net realized gain | | |
| Initial Class | $– | $867,181 |
| Service Class | – | 447,160 |
| Service Class 2 | – | 1,353,788 |
| Total | $– | $2,668,129 |
| VIP Freedom 2020 | | |
| Distributions to shareholders | | |
| Initial Class | $3,352,052 | $– |
| Service Class | 6,513,520 | – |
| Service Class 2 | 23,644,326 | – |
| Total | $33,509,898 | $– |
| From net investment income | | |
| Initial Class | $– | $1,093,675 |
| Service Class | – | 1,966,503 |
| Service Class 2 | – | 6,826,356 |
| Total | $– | $9,886,534 |
| From net realized gain | | |
| Initial Class | $– | $1,906,359 |
| Service Class | – | 3,390,053 |
| Service Class 2 | – | 15,296,971 |
| Total | $– | $20,593,383 |
| VIP Freedom 2025 | | |
| Distributions to shareholders | | |
| Initial Class | $1,349,128 | $– |
| Service Class | 2,547,973 | – |
| Service Class 2 | 2,157,857 | – |
| Total | $6,054,958 | $– |
| From net investment income | | |
| Initial Class | $– | $527,487 |
| Service Class | – | 959,236 |
| Service Class 2 | – | 752,835 |
| Total | $– | $2,239,558 |
| From net realized gain | | |
| Initial Class | $– | $868,126 |
| Service Class | – | 1,583,861 |
| Service Class 2 | – | 1,709,386 |
| Total | $– | $4,161,373 |
| VIP Freedom 2030 | | |
| Distributions to shareholders | | |
| Initial Class | $3,042,550 | $– |
| Service Class | 4,696,349 | – |
| Service Class 2 | 5,340,428 | – |
| Total | $13,079,327 | $– |
| From net investment income | | |
| Initial Class | $– | $978,373 |
| Service Class | – | 1,347,092 |
| Service Class 2 | – | 1,561,662 |
| Total | $– | $3,887,127 |
| From net realized gain | | |
| Initial Class | $– | $2,303,629 |
| Service Class | – | 2,973,121 |
| Service Class 2 | – | 5,010,949 |
| Total | $– | $10,287,699 |
| VIP Freedom 2035 | | |
| Distributions to shareholders | | |
| Initial Class | $247,192 | $– |
| Service Class | 343,755 | – |
| Service Class 2 | 1,326,758 | – |
| Total | $1,917,705 | $– |
| From net investment income | | |
| Initial Class | $– | $70,187 |
| Service Class | – | 88,032 |
| Service Class 2 | – | 384,424 |
| Total | $– | $542,643 |
| From net realized gain | | |
| Initial Class | $– | $140,451 |
| Service Class | – | 204,558 |
| Service Class 2 | – | 1,076,662 |
| Total | $– | $1,421,671 |
| VIP Freedom 2040 | | |
| Distributions to shareholders | | |
| Initial Class | $634,494 | $– |
| Service Class | 1,550,658 | – |
| Service Class 2 | 506,235 | – |
| Total | $2,691,387 | $– |
| From net investment income | | |
| Initial Class | $– | $184,505 |
| Service Class | – | 478,145 |
| Service Class 2 | – | 140,824 |
| Total | $– | $803,474 |
| From net realized gain | | |
| Initial Class | $– | $430,744 |
| Service Class | – | 997,542 |
| Service Class 2 | – | 504,137 |
| Total | $– | $1,932,423 |
| VIP Freedom 2045 | | |
| Distributions to shareholders | | |
| Initial Class | $69,896 | $– |
| Service Class | 90,779 | – |
| Service Class 2 | 797,776 | – |
| Total | $958,451 | $– |
| From net investment income | | |
| Initial Class | $– | $16,172 |
| Service Class | – | 19,063 |
| Service Class 2 | – | 246,613 |
| Total | $– | $281,848 |
| From net realized gain | | |
| Initial Class | $– | $33,609 |
| Service Class | – | 31,431 |
| Service Class 2 | – | 685,217 |
| Total | $– | $750,257 |
| VIP Freedom 2050 | | |
| Distributions to shareholders | | |
| Initial Class | $255,154 | $– |
| Service Class | 346,833 | – |
| Service Class 2 | 337,854 | – |
| Total | $939,841 | $– |
| From net investment income | | |
| Initial Class | $– | $69,125 |
| Service Class | – | 75,422 |
| Service Class 2 | – | 75,411 |
| Total | $– | $219,958 |
| From net realized gain | | |
| Initial Class | $– | $167,295 |
| Service Class | – | 177,468 |
| Service Class 2 | – | 329,614 |
| Total | $– | $674,377 |
8. Share Transactions.
Transactions for each class of shares were as follows:
| | Shares | Shares | Dollars | Dollars |
| | Year ended December 31, 2018 | Year ended December 31, 2017 | Year ended December 31, 2018 | Year ended December 31, 2017 |
| VIP Freedom Income | | | | |
| Initial Class | | | | |
| Shares sold | 143,533 | 293,531 | $1,648,762 | $3,367,839 |
| Reinvestment of distributions | 37,714 | 32,689 | 420,878 | 375,713 |
| Shares redeemed | (247,649) | (306,177) | (2,847,333) | (3,513,364) |
| Net increase (decrease) | (66,402) | 20,043 | $(777,693) | $230,188 |
| Service Class | | | | |
| Shares sold | 973,224 | 508,631 | $11,152,634 | $5,845,958 |
| Reinvestment of distributions | 34,689 | 23,774 | 385,427 | 273,362 |
| Shares redeemed | (655,380) | (413,202) | (7,481,128) | (4,752,400) |
| Net increase (decrease) | 352,533 | 119,203 | $4,056,933 | $1,366,920 |
| Service Class 2 | | | | |
| Shares sold | 528,012 | 385,129 | $6,016,466 | $4,396,219 |
| Reinvestment of distributions | 35,599 | 27,648 | 395,426 | 315,956 |
| Shares redeemed | (448,837) | (407,047) | (5,123,396) | (4,602,389) |
| Net increase (decrease) | 114,774 | 5,730 | $1,288,496 | $109,786 |
| VIP Freedom 2005 | | | | |
| Initial Class | | | | |
| Shares sold | 105,064 | 147,674 | $1,288,409 | $1,796,599 |
| Reinvestment of distributions | 21,872 | 18,899 | 258,157 | 228,874 |
| Shares redeemed | (63,864) | (78,937) | (773,489) | (965,531) |
| Net increase (decrease) | 63,072 | 87,636 | $773,077 | $1,059,942 |
| Service Class | | | | |
| Shares sold | 132,554 | 110,712 | $1,608,380 | $1,346,116 |
| Reinvestment of distributions | 4,326 | 2,332 | 51,048 | 28,351 |
| Shares redeemed | (40,454) | (63,106) | (496,286) | (770,786) |
| Net increase (decrease) | 96,426 | 49,938 | $1,163,142 | $603,681 |
| Service Class 2 | | | | |
| Shares sold | 2,704 | 2,646 | $32,853 | $32,004 |
| Reinvestment of distributions | 282 | 235 | 3,325 | 2,830 |
| Shares redeemed | (1,026) | (1,659) | (12,543) | (19,880) |
| Net increase (decrease) | 1,960 | 1,222 | $23,635 | $14,954 |
| VIP Freedom 2010 | | | | |
| Initial Class | | | | |
| Shares sold | 228,818 | 355,606 | $2,956,785 | $4,619,619 |
| Reinvestment of distributions | 59,765 | 51,552 | 758,703 | 667,503 |
| Shares redeemed | (288,295) | (617,919) | (3,812,474) | (8,096,481) |
| Net increase (decrease) | 288 | (210,761) | $(96,986) | $(2,809,359) |
| Service Class | | | | |
| Shares sold | 462,369 | 613,852 | $6,024,668 | $7,896,480 |
| Reinvestment of distributions | 89,500 | 72,433 | 1,137,110 | 935,294 |
| Shares redeemed | (670,599) | (691,276) | (8,760,414) | (8,862,469) |
| Net increase (decrease) | (118,730) | (4,991) | $(1,598,636) | $(30,695) |
| Service Class 2 | | | | |
| Shares sold | 1,155,394 | 923,947 | $14,913,352 | $11,906,015 |
| Reinvestment of distributions | 873,942 | 680,272 | 11,052,260 | 8,747,614 |
| Shares redeemed | (2,289,615) | (1,987,454) | (29,710,372) | (25,606,406) |
| Net increase (decrease) | (260,279) | (383,235) | $(3,744,760) | $(4,952,777) |
| VIP Freedom 2015 | | | | |
| Initial Class | | | | |
| Shares sold | 207,456 | 119,565 | $2,757,979 | $1,582,374 |
| Reinvestment of distributions | 140,633 | 104,146 | 1,802,834 | 1,358,498 |
| Shares redeemed | (384,791) | (434,408) | (5,062,235) | (5,715,907) |
| Net increase (decrease) | (36,702) | (210,697) | $(501,422) | $(2,775,035) |
| Service Class | | | | |
| Shares sold | 319,457 | 525,227 | $4,207,645 | $6,789,935 |
| Reinvestment of distributions | 64,742 | 53,299 | 832,792 | 694,288 |
| Shares redeemed | (671,589) | (492,331) | (8,843,274) | (6,446,194) |
| Net increase (decrease) | (287,390) | 86,195 | $(3,802,837) | $1,038,029 |
| Service Class 2 | | | | |
| Shares sold | 322,638 | 642,081 | $4,231,239 | $8,345,564 |
| Reinvestment of distributions | 184,861 | 152,186 | 2,371,179 | 1,968,438 |
| Shares redeemed | (1,271,963) | (1,218,651) | (16,799,277) | (15,866,083) |
| Net increase (decrease) | (764,464) | (424,384) | $(10,196,859) | $(5,552,081) |
| VIP Freedom 2020 | | | | |
| Initial Class | | | | |
| Shares sold | 633,516 | 1,055,267 | $8,668,718 | $14,118,345 |
| Reinvestment of distributions | 254,642 | 224,853 | 3,352,052 | 3,000,034 |
| Shares redeemed | (1,188,252) | (957,719) | (16,225,986) | (12,901,746) |
| Net increase (decrease) | (300,094) | 322,401 | $(4,205,216) | $4,216,633 |
| Service Class | | | | |
| Shares sold | 3,465,754 | 3,660,093 | $46,904,393 | $48,649,057 |
| Reinvestment of distributions | 496,300 | 402,089 | 6,513,520 | 5,356,556 |
| Shares redeemed | (3,486,809) | (2,726,653) | (47,311,839) | (36,633,358) |
| Net increase (decrease) | 475,245 | 1,335,529 | $6,106,074 | $17,372,255 |
| Service Class 2 | | | | |
| Shares sold | 1,497,510 | 1,175,113 | $20,212,007 | $15,699,528 |
| Reinvestment of distributions | 1,800,230 | 1,676,903 | 23,644,326 | 22,123,327 |
| Shares redeemed | (6,069,131) | (5,501,937) | (81,811,463) | (73,080,246) |
| Net increase (decrease) | (2,771,391) | (2,649,921) | $(37,955,130) | $(35,257,391) |
| VIP Freedom 2025 | | | | |
| Initial Class | | | | |
| Shares sold | 723,469 | 595,839 | $10,454,088 | $8,237,329 |
| Reinvestment of distributions | 98,699 | 100,153 | 1,349,128 | 1,395,613 |
| Shares redeemed | (518,162) | (228,576) | (7,396,670) | (3,190,637) |
| Net increase (decrease) | 304,006 | 467,416 | $4,406,546 | $6,442,305 |
| Service Class | | | | |
| Shares sold | 2,326,774 | 1,823,019 | $33,257,110 | $25,287,132 |
| Reinvestment of distributions | 187,306 | 182,732 | 2,547,973 | 2,543,097 |
| Shares redeemed | (1,269,343) | (991,180) | (18,184,694) | (13,974,658) |
| Net increase (decrease) | 1,244,737 | 1,014,571 | $17,620,389 | $13,855,571 |
| Service Class 2 | | | | |
| Shares sold | 1,516,737 | 1,292,225 | $21,697,707 | $17,812,495 |
| Reinvestment of distributions | 158,995 | 179,466 | 2,157,857 | 2,462,221 |
| Shares redeemed | (767,638) | (1,754,914) | (10,977,168) | (24,190,982) |
| Net increase (decrease) | 908,094 | (283,223) | $12,878,396 | $(3,916,266) |
| VIP Freedom 2030 | | | | |
| Initial Class | | | | |
| Shares sold | 1,209,298 | 1,092,781 | $17,482,887 | $15,118,240 |
| Reinvestment of distributions | 223,670 | 239,670 | 3,042,550 | 3,282,002 |
| Shares redeemed | (1,021,468) | (804,646) | (14,616,765) | (11,216,758) |
| Net increase (decrease) | 411,500 | 527,805 | $5,908,672 | $7,183,484 |
| Service Class | | | | |
| Shares sold | 4,045,164 | 2,991,525 | $58,000,154 | $41,438,157 |
| Reinvestment of distributions | 347,245 | 314,598 | 4,696,349 | 4,320,213 |
| Shares redeemed | (2,618,163) | (1,263,919) | (37,091,461) | (17,341,408) |
| Net increase (decrease) | 1,774,246 | 2,042,204 | $25,605,042 | $28,416,962 |
| Service Class 2 | | | | |
| Shares sold | 1,728,723 | 1,854,818 | $24,708,299 | $25,505,152 |
| Reinvestment of distributions | 393,082 | 486,626 | 5,340,428 | 6,572,611 |
| Shares redeemed | (1,910,887) | (2,895,582) | (27,203,115) | (39,677,230) |
| Net increase (decrease) | 210,918 | (554,138) | $2,845,612 | $(7,599,467) |
| VIP Freedom 2035 | | | | |
| Initial Class | | | | |
| Shares sold | 151,159 | 124,799 | $3,409,052 | $2,780,437 |
| Reinvestment of distributions | 11,820 | 9,786 | 247,192 | 210,638 |
| Shares redeemed | (36,448) | (45,395) | (826,262) | (980,553) |
| Net increase (decrease) | 126,531 | 89,190 | $2,829,982 | $2,010,522 |
| Service Class | | | | |
| Shares sold | 386,324 | 169,721 | $8,712,756 | $3,619,279 |
| Reinvestment of distributions | 16,571 | 13,698 | 343,755 | 292,590 |
| Shares redeemed | (156,030) | (57,075) | (3,501,172) | (1,180,081) |
| Net increase (decrease) | 246,865 | 126,344 | $5,555,339 | $2,731,788 |
| Service Class 2 | | | | |
| Shares sold | 770,320 | 735,396 | $17,199,008 | $15,625,496 |
| Reinvestment of distributions | 63,442 | 69,106 | 1,326,758 | 1,461,086 |
| Shares redeemed | (409,592) | (448,068) | (9,183,565) | (9,435,791) |
| Net increase (decrease) | 424,170 | 356,434 | $9,342,201 | $7,650,791 |
| VIP Freedom 2040 | | | | |
| Initial Class | | | | |
| Shares sold | 364,491 | 265,813 | $7,871,098 | $5,363,355 |
| Reinvestment of distributions | 32,084 | 30,326 | 634,494 | 615,249 |
| Shares redeemed | (120,197) | (161,045) | (2,620,656) | (3,233,889) |
| Net increase (decrease) | 276,378 | 135,094 | $5,884,936 | $2,744,715 |
| Service Class | | | | |
| Shares sold | 1,417,373 | 1,108,841 | $29,755,656 | $22,535,004 |
| Reinvestment of distributions | 78,325 | 72,159 | 1,550,658 | 1,475,687 |
| Shares redeemed | (1,028,697) | (338,036) | (21,529,509) | (6,876,084) |
| Net increase (decrease) | 467,001 | 842,964 | $9,776,805 | $17,134,607 |
| Service Class 2 | | | | |
| Shares sold | 254,502 | 224,919 | $5,419,677 | $4,501,983 |
| Reinvestment of distributions | 25,385 | 32,420 | 506,235 | 644,961 |
| Shares redeemed | (219,778) | (324,956) | (4,691,363) | (6,527,694) |
| Net increase (decrease) | 60,109 | (67,617) | $1,234,549 | $(1,380,750) |
| VIP Freedom 2045 | | | | |
| Initial Class | | | | |
| Shares sold | 74,448 | 32,752 | $1,585,912 | $676,065 |
| Reinvestment of distributions | 3,584 | 2,452 | 69,896 | 49,781 |
| Shares redeemed | (10,357) | (9,404) | (221,735) | (190,642) |
| Net increase (decrease) | 67,675 | 25,800 | $1,434,073 | $535,204 |
| Service Class | | | | |
| Shares sold | 328,346 | 77,197 | $6,850,686 | $1,573,429 |
| Reinvestment of distributions | 4,723 | 2,448 | 90,779 | 50,494 |
| Shares redeemed | (215,482) | (12,312) | (4,468,647) | (243,713) |
| Net increase (decrease) | 117,587 | 67,333 | $2,472,818 | $1,380,210 |
| Service Class 2 | | | | |
| Shares sold | 561,056 | 585,284 | $11,973,883 | $11,866,438 |
| Reinvestment of distributions | 40,445 | 46,595 | 797,776 | 931,830 |
| Shares redeemed | (369,991) | (273,338) | (8,023,170) | (5,435,275) |
| Net increase (decrease) | 231,510 | 358,541 | $4,748,489 | $7,362,993 |
| VIP Freedom 2050 | | | | |
| Initial Class | | | | |
| Shares sold | 156,786 | 87,242 | $3,003,153 | $1,592,168 |
| Reinvestment of distributions | 14,287 | 13,043 | 255,154 | 236,420 |
| Shares redeemed | (51,792) | (53,636) | (998,792) | (983,739) |
| Net increase (decrease) | 119,281 | 46,649 | $2,259,515 | $844,849 |
| Service Class | | | | |
| Shares sold | 1,543,438 | 183,141 | $28,607,576 | $3,380,759 |
| Reinvestment of distributions | 19,518 | 13,917 | 346,833 | 252,890 |
| Shares redeemed | (1,303,804) | (104,937) | (24,048,031) | (1,983,735) |
| Net increase (decrease) | 259,152 | 92,121 | $4,906,378 | $1,649,914 |
| Service Class 2 | | | | |
| Shares sold | 295,752 | 170,001 | $5,607,175 | $3,050,110 |
| Reinvestment of distributions | 18,935 | 22,932 | 337,854 | 405,025 |
| Shares redeemed | (130,418) | (341,246) | (2,493,081) | (6,116,802) |
| Net increase (decrease) | 184,269 | (148,313) | $3,451,948 | $(2,661,667) |
9. Other.
The Funds' organizational documents provide former and current trustees and officers with a limited indemnification against liabilities arising in connection with the performance of their duties to the Funds. In the normal course of business, the Funds may also enter into contracts that provide general indemnifications. The Funds' maximum exposure under these arrangements is unknown as this would be dependent on future claims that may be made against the Funds. The risk of material loss from such claims is considered remote.
The Funds do not invest in the Underlying Funds for the purpose of exercising management or control; however, investments by the Funds within their principal investment strategies may represent a significant portion of the Underlying Fund's net assets. At the end of the period, the following Funds were the owners of record of 10% or more of the total outstanding shares of the Underlying Funds.
| Fund | VIP Freedom 2020 Portfolio |
| VIP Emerging Markets Portfolio | 14% |
| VIP Value Portfolio | 10% |
The Funds, in aggregate, were the owners of record of more than 20% of the total outstanding shares of the following Underlying Funds.
| Fund | % of shares held |
| VIP Emerging Markets Portfolio | 41% |
| VIP Value Portfolio | 31% |
In addition, at the end of the period the investment adviser or its affiliates were owners of record of more than 10% and certain otherwise unaffiliated shareholders each were owners of record of more than 10%, respectively, of the outstanding shares of the following Funds:
| | Affiliated % | Number of
Unaffiliated Shareholders | Unaffiliated Shareholders % |
| VIP Freedom Income | 26% | 2 | 37% |
| VIP Freedom 2005 | 78% | 1 | 18% |
| VIP Freedom 2010 | –% | 1 | 88% |
| VIP Freedom 2015 | 30% | 3 | 40% |
| VIP Freedom 2020 | –% | 1 | 71% |
| VIP Freedom 2025 | –% | 1 | 37% |
| VIP Freedom 2030 | –% | 1 | 44% |
| VIP Freedom 2035 | –% | 5 | 81% |
| VIP Freedom 2040 | –% | 3 | 66% |
| VIP Freedom 2045 | –% | 3 | 74% |
| VIP Freedom 2050 | –% | 5 | 85% |
Report of Independent Registered Public Accounting Firm
To the Trustees of Variable Insurance Products Fund V and the Shareholders of VIP Freedom Income Portfolio, VIP Freedom 2005 Portfolio, VIP Freedom 2010 Portfolio, VIP Freedom 2015 Portfolio, VIP Freedom 2020 Portfolio, VIP Freedom 2025 Portfolio, VIP Freedom 2030 Portfolio, VIP Freedom 2035 Portfolio, VIP Freedom 2040 Portfolio, VIP Freedom 2045 Portfolio and VIP Freedom 2050 Portfolio:
Opinion on the Financial Statements and Financial Highlights
We have audited the accompanying statements of assets and liabilities of VIP Freedom Income Portfolio, VIP Freedom 2005 Portfolio, VIP Freedom 2010 Portfolio, VIP Freedom 2015 Portfolio, VIP Freedom 2020 Portfolio, VIP Freedom 2025 Portfolio, VIP Freedom 2030 Portfolio, VIP Freedom 2035 Portfolio, VIP Freedom 2040 Portfolio, VIP Freedom 2045 Portfolio and VIP Freedom 2050 Portfolio (the "Funds"), each a fund of Variable Insurance Products Fund V, including the schedules of investments, as of December 31, 2018, and the related statements of operations for the year then ended, the statements of changes in net assets for each of the two years in the period then ended, the financial highlights for each of the five years in the period then ended, and the related notes. In our opinion, the financial statements and financial highlights present fairly, in all material respects, the financial position of each of the Funds as of December 31, 2018, and the results of their operations for the year then ended, the changes in their net assets for each of the two years in the period then ended, and the financial highlights for each of the five years in the period then ended, in conformity with accounting principles generally accepted in the United States of America.
Basis for Opinion
These financial statements and financial highlights are the responsibility of the Funds' management. Our responsibility is to express an opinion on the Funds' financial statements and financial highlights based on our audits. We are a public accounting firm registered with the Public Company Accounting Oversight Board (United States) (PCAOB) and are required to be independent with respect to the Funds in accordance with the U.S. federal securities laws and the applicable rules and regulations of the Securities and Exchange Commission and the PCAOB.
We conducted our audits in accordance with the standards of the PCAOB. Those standards require that we plan and perform the audit to obtain reasonable assurance about whether the financial statements and financial highlights are free of material misstatement, whether due to error or fraud. The Funds are not required to have, nor were we engaged to perform, an audit of their internal control over financial reporting. As part of our audits we are required to obtain an understanding of internal control over financial reporting but not for the purpose of expressing an opinion on the effectiveness of the Funds' internal control over financial reporting. Accordingly, we express no such opinion.
Our audits included performing procedures to assess the risks of material misstatement of the financial statements and financial highlights, whether due to error or fraud, and performing procedures that respond to those risks. Such procedures included examining, on a test basis, evidence regarding the amounts and disclosures in the financial statements and financial highlights. Our audits also included evaluating the accounting principles used and significant estimates made by management, as well as evaluating the overall presentation of the financial statements and financial highlights. Our procedures included confirmation of securities owned as of December 31, 2018, by correspondence with the custodians and brokers; when replies were not received from brokers, we performed other auditing procedures. We believe that our audits provide a reasonable basis for our opinion.
/s/ Deloitte & Touche LLP
Boston, Massachusetts
February 19, 2019
We have served as the auditor of one or more of the Fidelity investment companies since 1999.
Trustees and Officers
The Trustees, Members of the Advisory Board (if any), and officers of the trust and funds, as applicable, are listed below. The Board of Trustees governs each fund and is responsible for protecting the interests of shareholders. The Trustees are experienced executives who meet periodically throughout the year to oversee each fund's activities, review contractual arrangements with companies that provide services to each fund, oversee management of the risks associated with such activities and contractual arrangements, and review each fund's performance. If the interests of a fund and an underlying Fidelity® fund were to diverge, a conflict of interest could arise and affect how the Trustees and Members of the Advisory Board fulfill their fiduciary duties to the affected funds. FMRC has structured the funds to avoid these potential conflicts, although there may be situations where a conflict of interest is unavoidable. In such instances, FMRC, the Trustees, and Members of the Advisory Board would take reasonable steps to minimize and, if possible, eliminate the conflict. Each of the Trustees oversees 283 funds.
The Trustees hold office without limit in time except that (a) any Trustee may resign; (b) any Trustee may be removed by written instrument, signed by at least two-thirds of the number of Trustees prior to such removal; (c) any Trustee who requests to be retired or who has become incapacitated by illness or injury may be retired by written instrument signed by a majority of the other Trustees; and (d) any Trustee may be removed at any special meeting of shareholders by a two-thirds vote of the outstanding voting securities of the trust. Each Trustee who is not an interested person (as defined in the 1940 Act) of the trust and the funds is referred to herein as an Independent Trustee. Each Independent Trustee shall retire not later than the last day of the calendar year in which his or her 75th birthday occurs. The Independent Trustees may waive this mandatory retirement age policy with respect to individual Trustees. Officers and Advisory Board Members hold office without limit in time, except that any officer or Advisory Board Member may resign or may be removed by a vote of a majority of the Trustees at any regular meeting or any special meeting of the Trustees. Except as indicated, each individual has held the office shown or other offices in the same company for the past five years.
Each fund’s Statement of Additional Information (SAI) includes more information about the Trustees. To request a free copy, call Fidelity at 1-877-208-0098.
Experience, Skills, Attributes, and Qualifications of the Trustees. The Governance and Nominating Committee has adopted a statement of policy that describes the experience, qualifications, attributes, and skills that are necessary and desirable for potential Independent Trustee candidates (Statement of Policy). The Board believes that each Trustee satisfied at the time he or she was initially elected or appointed a Trustee, and continues to satisfy, the standards contemplated by the Statement of Policy. The Governance and Nominating Committee also engages professional search firms to help identify potential Independent Trustee candidates who have the experience, qualifications, attributes, and skills consistent with the Statement of Policy. From time to time, additional criteria based on the composition and skills of the current Independent Trustees, as well as experience or skills that may be appropriate in light of future changes to board composition, business conditions, and regulatory or other developments, have also been considered by the professional search firms and the Governance and Nominating Committee. In addition, the Board takes into account the Trustees' commitment and participation in Board and committee meetings, as well as their leadership of standing and ad hoc committees throughout their tenure.
In determining that a particular Trustee was and continues to be qualified to serve as a Trustee, the Board has considered a variety of criteria, none of which, in isolation, was controlling. The Board believes that, collectively, the Trustees have balanced and diverse experience, qualifications, attributes, and skills, which allow the Board to operate effectively in governing each fund and protecting the interests of shareholders. Information about the specific experience, skills, attributes, and qualifications of each Trustee, which in each case led to the Board's conclusion that the Trustee should serve (or continue to serve) as a trustee of the funds, is provided below.
Board Structure and Oversight Function. Abigail P. Johnson is an interested person and currently serves as Chairman. The Trustees have determined that an interested Chairman is appropriate and benefits shareholders because an interested Chairman has a personal and professional stake in the quality and continuity of services provided to the funds. Independent Trustees exercise their informed business judgment to appoint an individual of their choosing to serve as Chairman, regardless of whether the Trustee happens to be independent or a member of management. The Independent Trustees have determined that they can act independently and effectively without having an Independent Trustee serve as Chairman and that a key structural component for assuring that they are in a position to do so is for the Independent Trustees to constitute a substantial majority for the Board. The Independent Trustees also regularly meet in executive session. Arthur E. Johnson serves as Chairman of the Independent Trustees and as such (i) acts as a liaison between the Independent Trustees and management with respect to matters important to the Independent Trustees and (ii) with management prepares agendas for Board meetings.
Fidelity® funds are overseen by different Boards of Trustees. The funds' Board oversees Fidelity's investment-grade bond, money market, asset allocation and certain equity funds, and other Boards oversee Fidelity's high income and other equity funds. The asset allocation funds may invest in Fidelity® funds that are overseen by such other Boards. The use of separate Boards, each with its own committee structure, allows the Trustees of each group of Fidelity® funds to focus on the unique issues of the funds they oversee, including common research, investment, and operational issues. On occasion, the separate Boards establish joint committees to address issues of overlapping consequences for the Fidelity® funds overseen by each Board.
The Trustees operate using a system of committees to facilitate the timely and efficient consideration of all matters of importance to the Trustees, each fund, and fund shareholders and to facilitate compliance with legal and regulatory requirements and oversight of the funds' activities and associated risks. The Board, acting through its committees, has charged FMR and its affiliates with (i) identifying events or circumstances the occurrence of which could have demonstrably adverse effects on the funds' business and/or reputation; (ii) implementing processes and controls to lessen the possibility that such events or circumstances occur or to mitigate the effects of such events or circumstances if they do occur; and (iii) creating and maintaining a system designed to evaluate continuously business and market conditions in order to facilitate the identification and implementation processes described in (i) and (ii) above. Because the day-to-day operations and activities of the funds are carried out by or through FMR, its affiliates, and other service providers, the funds' exposure to risks is mitigated but not eliminated by the processes overseen by the Trustees. While each of the Board's committees has responsibility for overseeing different aspects of the funds' activities, oversight is exercised primarily through the Operations and Audit Committees. In addition, an ad hoc Board committee of Independent Trustees has worked with FMR to enhance the Board's oversight of investment and financial risks, legal and regulatory risks, technology risks, and operational risks, including the development of additional risk reporting to the Board. Appropriate personnel, including but not limited to the funds' Chief Compliance Officer (CCO), FMR's internal auditor, the independent accountants, the funds' Treasurer and portfolio management personnel, make periodic reports to the Board's committees, as appropriate, including an annual review of Fidelity's risk management program for the Fidelity® funds. The responsibilities of each standing committee, including their oversight responsibilities, are described further under "Standing Committees of the Trustees."
Interested Trustees*:
Correspondence intended for a Trustee who is an interested person may be sent to Fidelity Investments, 245 Summer Street, Boston, Massachusetts 02210.
Name, Year of Birth; Principal Occupations and Other Relevant Experience+
Abigail P. Johnson (1961)
Year of Election or Appointment: 2009
Trustee
Chairman of the Board of Trustees
Ms. Johnson also serves as Trustee of other Fidelity® funds. Ms. Johnson serves as Chairman (2016-present), Chief Executive Officer (2014-present), and Director (2007-present) of FMR LLC (diversified financial services company), President of Fidelity Financial Services (2012-present) and President of Personal, Workplace and Institutional Services (2005-present). Ms. Johnson is Chairman and Director of FMR Co., Inc. (investment adviser firm, 2011-present) and Chairman and Director of FMR (investment adviser firm, 2011-present). Previously, Ms. Johnson served as Vice Chairman (2007-2016) and President (2013-2016) of FMR LLC, President and a Director of FMR (2001-2005), a Trustee of other investment companies advised by FMR, Fidelity Investments Money Management, Inc. (investment adviser firm), and FMR Co., Inc. (2001-2005), Senior Vice President of the Fidelity® funds (2001-2005), and managed a number of Fidelity® funds. Ms. Abigail P. Johnson and Mr. Arthur E. Johnson are not related.
Jennifer Toolin McAuliffe (1959)
Year of Election or Appointment: 2016
Trustee
Ms. McAuliffe also serves as Trustee of other Fidelity® funds. Ms. McAuliffe previously served as a Member of the Advisory Board of certain Fidelity® funds (2016) and as Co-Head of Fixed Income of Fidelity Investments Limited (now known as FIL Limited (FIL)) (diversified financial services company). Earlier roles at FIL included Director of Research for FIL’s credit and quantitative teams in London, Hong Kong and Tokyo. Ms. McAuliffe also was the Director of Research for taxable and municipal bonds at Fidelity Investments Money Management, Inc. Ms. McAuliffe is also a director or trustee of several not-for-profit entities.
* Determined to be an “Interested Trustee” by virtue of, among other things, his or her affiliation with the trust or various entities under common control with FMR.
+ The information includes the Trustee's principal occupation during the last five years and other information relating to the experience, attributes, and skills relevant to the Trustee's qualifications to serve as a Trustee, which led to the conclusion that the Trustee should serve as a Trustee for each fund.
Independent Trustees:
Correspondence intended for an Independent Trustee may be sent to Fidelity Investments, P.O. Box 55235, Boston, Massachusetts 02205-5235.
Name, Year of Birth; Principal Occupations and Other Relevant Experience+
Elizabeth S. Acton (1951)
Year of Election or Appointment: 2013
Trustee
Ms. Acton also serves as Trustee of other Fidelity® funds. Prior to her retirement in April 2012, Ms. Acton was Executive Vice President, Finance (2011-2012), Executive Vice President, Chief Financial Officer (2002-2011), and Treasurer (2004-2005) of Comerica Incorporated (financial services). Prior to joining Comerica, Ms. Acton held a variety of positions at Ford Motor Company (1983-2002), including Vice President and Treasurer (2000-2002) and Executive Vice President and Chief Financial Officer of Ford Motor Credit Company (1998-2000). Ms. Acton currently serves as a member of the Board of Directors and Audit and Finance Committees of Beazer Homes USA, Inc. (homebuilding, 2012-present). Previously, Ms. Acton served as a Member of the Advisory Board of certain Fidelity® funds (2013-2016).
Ann E. Dunwoody (1953)
Year of Election or Appointment: 2018
Trustee
General Dunwoody also serves as Trustee of other Fidelity® funds. General Dunwoody (United States Army, Retired) was the first woman in U.S. military history to achieve the rank of four-star general and prior to her retirement in 2012 held a variety of positions within the U.S. Army, including Commanding General, U.S. Army Material Command (2008-2012). She is the President of First to Four LLC (leadership and mentoring services, 2012-present). She also serves as a member of the Board of Directors and Nominating and Corporate Governance Committee of L3 Technologies, Inc. (communication, electronic, sensor, and aerospace systems, 2013-present), Board of Directors and Nomination and Corporate Governance Committees of Kforce Inc. (professional staffing services, 2016-present) and Board of Directors of Automattic Inc. (software engineering, 2018-present). Previously, General Dunwoody served as a Member of the Advisory Board of certain Fidelity® funds (2018), a member of the Board of Directors and Audit and Sustainability and Corporate Responsibility Committees of Republic Services, Inc. (waste collection, disposal and recycling, 2013-2016). Ms. Dunwoody also serves on several boards for non-profit organizations, including as a member of the Board of Directors, Chair of the Nomination and Governance Committee and member of the Audit Committee of Logistics Management Institute (consulting non-profit, 2012-present), a member of the Board of Directors of the Army Historical Foundation (2015-present), a member of the Council of Trustees for the Association of the United States Army (advocacy non-profit, 2013-present) and a member of the Board of Trustees of Florida Institute of Technology (2015-present) and ThanksUSA (military family education non-profit, 2014-present).
John Engler (1948)
Year of Election or Appointment: 2014
Trustee
Mr. Engler also serves as Trustee of other Fidelity® funds. He serves on the board of directors for Universal Forest Products (manufacturer and distributor of wood and wood-alternative products, 2003-present) and K12 Inc. (technology-based education company, 2012-present). Previously, Mr. Engler served as interim president of Michigan State University (2018-2019), a Member of the Advisory Board of certain Fidelity® funds (2014-2016), president of the Business Roundtable (2011-2017), a trustee of The Munder Funds (2003-2014), president and CEO of the National Association of Manufacturers (2004-2011), member of the Board of Trustees of the Annie E. Casey Foundation (2004-2015), and as governor of Michigan (1991-2003). He is a past chairman of the National Governors Association.
Robert F. Gartland (1951)
Year of Election or Appointment: 2010
Trustee
Mr. Gartland also serves as Trustee of other Fidelity® funds. Mr. Gartland is Chairman and an investor in Gartland & Mellina Group Corp. (consulting, 2009-present). Previously, Mr. Gartland served as a partner and investor of Vietnam Partners LLC (investments and consulting, 2008-2011). Prior to his retirement, Mr. Gartland held a variety of positions at Morgan Stanley (financial services, 1979-2007), including Managing Director (1987-2007), and Chase Manhattan Bank (1975-1978).
Arthur E. Johnson (1947)
Year of Election or Appointment: 2008
Trustee
Chairman of the Independent Trustees
Mr. Johnson also serves as Trustee of other Fidelity® funds. Mr. Johnson serves as a member of the Board of Directors of Eaton Corporation plc (diversified power management, 2009-present) and Booz Allen Hamilton (management consulting, 2011-present). Prior to his retirement, Mr. Johnson served as Senior Vice President of Corporate Strategic Development of Lockheed Martin Corporation (defense contractor, 1999-2009). He previously served on the Board of Directors of IKON Office Solutions, Inc. (1999-2008), AGL Resources, Inc. (holding company, 2002-2016), and Delta Airlines (2005-2007). Mr. Arthur E. Johnson is not related to Ms. Abigail P. Johnson.
Michael E. Kenneally (1954)
Year of Election or Appointment: 2009
Trustee
Vice Chairman of the Independent Trustees
Mr. Kenneally also serves as Trustee of other Fidelity® funds. Prior to his retirement, Mr. Kenneally served as Chairman and Global Chief Executive Officer of Credit Suisse Asset Management. Before joining Credit Suisse, he was an Executive Vice President and Chief Investment Officer for Bank of America Corporation. Earlier roles at Bank of America included Director of Research, Senior Portfolio Manager and Research Analyst, and Mr. Kenneally was awarded the Chartered Financial Analyst (CFA) designation in 1991.
Marie L. Knowles (1946)
Year of Election or Appointment: 2001
Trustee
Ms. Knowles also serves as Trustee of other Fidelity® funds. Prior to Ms. Knowles' retirement in June 2000, she served as Executive Vice President and Chief Financial Officer of Atlantic Richfield Company (ARCO) (diversified energy, 1996-2000). From 1993 to 1996, she was a Senior Vice President of ARCO and President of ARCO Transportation Company (pipeline and tanker operations). Ms. Knowles currently serves as a Director and Chairman of the Audit Committee of McKesson Corporation (healthcare service, since 2002). Ms. Knowles is a member of the Board of the Santa Catalina Island Company (real estate, 2009-present). Ms. Knowles is a Member of the Investment Company Institute Board of Governors and a Member of the Governing Council of the Independent Directors Council (2014-present). She also serves as a member of the Advisory Board for the School of Engineering of the University of Southern California. Previously, Ms. Knowles served as a Director of Phelps Dodge Corporation (copper mining and manufacturing, 1994-2007), URS Corporation (engineering and construction, 2000-2003) and America West (airline, 1999-2002). Ms. Knowles previously served as Chairman (2015-2018) and Vice Chairman (2012-2015) of the Independent Trustees of certain Fidelity® funds.
Mark A. Murray (1954)
Year of Election or Appointment: 2016
Trustee
Mr. Murray also serves as Trustee of other Fidelity® funds. Mr. Murray is Vice Chairman (2013-present) of Meijer, Inc. (regional retail chain). Previously, Mr. Murray served as a Member of the Advisory Board of certain Fidelity® funds (2016) and as Co-Chief Executive Officer (2013-2016) and President (2006-2013) of Meijer, Inc. Mr. Murray serves as a member of the Board of Directors and Nuclear Review and Public Policy and Responsibility Committees of DTE Energy Company (diversified energy company, 2009-present). Mr. Murray also serves as a member of the Board of Directors of Spectrum Health (not-for-profit health system, 2015-present). Mr. Murray previously served as President of Grand Valley State University (2001-2006), Treasurer for the State of Michigan (1999-2001), Vice President of Finance and Administration for Michigan State University (1998-1999), and a member of the Board of Directors and Audit Committee and Chairman of the Nominating and Corporate Governance Committee of Universal Forest Products, Inc. (manufacturer and distributor of wood and wood-alternative products, 2004-2016). Mr. Murray is also a director or trustee of many community and professional organizations.
+ The information includes the Trustee's principal occupation during the last five years and other information relating to the experience, attributes, and skills relevant to the Trustee's qualifications to serve as a Trustee, which led to the conclusion that the Trustee should serve as a Trustee for each fund.
Advisory Board Members and Officers:
Correspondence intended for an officer may be sent to Fidelity Investments, 245 Summer Street, Boston, Massachusetts 02210. Officers appear below in alphabetical order.
Name, Year of Birth; Principal Occupation
Elizabeth Paige Baumann (1968)
Year of Election or Appointment: 2017
Anti-Money Laundering (AML) Officer
Ms. Baumann also serves as AML Officer of other funds. She is Chief AML Officer (2012-present) and Senior Vice President (2014-present) of FMR LLC (diversified financial services company) and is an employee of Fidelity Investments. Previously, Ms. Baumann served as AML Officer of the funds (2012-2016), and Vice President (2007-2014) and Deputy Anti-Money Laundering Officer (2007-2012) of FMR LLC.
Craig S. Brown (1977)
Year of Election or Appointment: 2019
Assistant Treasurer
Mr. Brown also serves as Assistant Treasurer of other funds. Mr. Brown is an employee of Fidelity Investments (2013-present).
John J. Burke III (1964)
Year of Election or Appointment: 2018
Chief Financial Officer
Mr. Burke also serves as Chief Financial Officer of other funds. Mr. Burke serves as Head of Investment Operations for Fidelity Fund and Investment Operations (2018-present) and is an employee of Fidelity Investments (1998-present). Previously Mr. Burke served as head of Asset Management Investment Operations (2012-2018).
William C. Coffey (1969)
Year of Election or Appointment: 2018
Secretary and Chief Legal Officer (CLO)
Mr. Coffey also serves as Secretary and CLO of other funds. Mr. Coffey serves as CLO, Secretary, and Senior Vice President of Fidelity Management & Research Company and FMR Co., Inc. (investment adviser firms, 2018-present); Secretary of Fidelity SelectCo, LLC and Fidelity Investments Money Management, Inc. (investment adviser firms, 2018-present); and CLO of Fidelity Management & Research (Hong Kong) Limited, FMR Investment Management (UK) Limited, and Fidelity Management & Research (Japan) Limited (investment adviser firms, 2018-present). He is Senior Vice President and Deputy General Counsel of FMR LLC (diversified financial services company, 2010-present), and is an employee of Fidelity Investments. Previously, Mr. Coffey served as Assistant Secretary of certain funds (2009-2018) and as Vice President and Associate General Counsel of FMR LLC (2005-2009).
Jonathan Davis (1968)
Year of Election or Appointment: 2010
Assistant Treasurer
Mr. Davis also serves as Assistant Treasurer of other funds. Mr. Davis serves as Assistant Treasurer of FMR Capital, Inc. (2017-present) and is an employee of Fidelity Investments. Previously, Mr. Davis served as Vice President and Associate General Counsel of FMR LLC (diversified financial services company, 2003-2010).
Adrien E. Deberghes (1967)
Year of Election or Appointment: 2010
Assistant Treasurer
Mr. Deberghes also serves as an officer of other funds. He serves as Assistant Treasurer of FMR Capital, Inc. (2017-present), Executive Vice President of Fidelity Investments Money Management, Inc. (FIMM) (investment adviser firm, 2016-present), and is an employee of Fidelity Investments (2008-present). Previously, Mr. Deberghes served as President and Treasurer of certain Fidelity® funds (2013-2018). Prior to joining Fidelity Investments, Mr. Deberghes was Senior Vice President of Mutual Fund Administration at State Street Corporation (2007-2008), Senior Director of Mutual Fund Administration at Investors Bank & Trust (2005-2007), and Director of Finance for Dunkin' Brands (2000-2005). Previously, Mr. Deberghes served in other fund officer roles.
Laura M. Del Prato (1964)
Year of Election or Appointment: 2018
President and Treasurer
Ms. Del Prato also serves as an officer of other funds. Ms. Del Prato is an employee of Fidelity Investments (2017-present). Prior to joining Fidelity Investments, Ms. Del Prato served as a Managing Director and Treasurer of the JPMorgan Mutual Funds (2014-2017). Prior to JPMorgan, Ms. Del Prato served as a partner at Cohen Fund Audit Services (accounting firm, 2012-2013) and KPMG LLP (accounting firm, 2004-2012).
Colm A. Hogan (1973)
Year of Election or Appointment: 2016
Assistant Treasurer
Mr. Hogan also serves as an officer of other funds. Mr. Hogan serves as Assistant Treasurer of FMR Capital, Inc. (2017-present) and is an employee of Fidelity Investments (2005-present). Previously, Mr. Hogan served as Assistant Treasurer of certain Fidelity® funds (2016-2018).
Chris Maher (1972)
Year of Election or Appointment: 2013
Assistant Treasurer
Mr. Maher serves as Assistant Treasurer of other funds. Mr. Maher is Vice President of Valuation Oversight, serves as Assistant Treasurer of FMR Capital, Inc. (2017-present), and is an employee of Fidelity Investments. Previously, Mr. Maher served as Vice President of Asset Management Compliance (2013), Vice President of the Program Management Group of FMR (investment adviser firm, 2010-2013), and Vice President of Valuation Oversight (2008-2010).
John B. McGinty, Jr. (1962)
Year of Election or Appointment: 2016
Chief Compliance Officer
Mr. McGinty also serves as Chief Compliance Officer of other funds. Mr. McGinty is Senior Vice President of Asset Management Compliance for Fidelity Investments and is an employee of Fidelity Investments (2016-present). Mr. McGinty previously served as Vice President, Senior Attorney at Eaton Vance Management (investment management firm, 2015-2016), and prior to Eaton Vance as global CCO for all firm operations and registered investment companies at GMO LLC (investment management firm, 2009-2015). Before joining GMO LLC, Mr. McGinty served as Senior Vice President, Deputy General Counsel for Fidelity Investments (2007-2009).
Jason P. Pogorelec (1975)
Year of Election or Appointment: 2015
Assistant Secretary
Mr. Pogorelec also serves as Assistant Secretary of other funds. Mr. Pogorelec serves as Vice President, Associate General Counsel (2010-present) and is an employee of Fidelity Investments (2006-present).
Nancy D. Prior (1967)
Year of Election or Appointment: 2014
Vice President
Ms. Prior also serves as Vice President of other funds. Ms. Prior serves as President Fixed Income, High Income/Emerging Market Debt and Multi Asset Class Strategies of FIAM LLC (2018-present), President (2016-present) and Director (2014-present) of Fidelity Investments Money Management, Inc. (FIMM) (investment adviser firm), President, Fixed Income (2014-present), and is an employee of Fidelity Investments (2002-present). Previously, Ms. Prior served as Vice Chairman of FIAM LLC (investment adviser firm, 2014-2018), a Director of FMR Investment Management (UK) Limited (investment adviser firm, 2015-2018), President Multi-Asset Class Strategies of FMR's Global Asset Allocation Division (2017-2018), Vice President of Fidelity's Money Market Funds (2012-2014), President, Money Market and Short Duration Bond Group of Fidelity Management & Research (FMR) (investment adviser firm, 2013-2014), President, Money Market Group of FMR (2011-2013), Managing Director of Research (2009-2011), Senior Vice President and Deputy General Counsel (2007-2009), and Assistant Secretary of certain Fidelity® funds (2008-2009).
Stacie M. Smith (1974)
Year of Election or Appointment: 2013
Assistant Treasurer
Ms. Smith also serves as an officer of other funds. Ms. Smith serves as Assistant Treasurer of FMR Capital, Inc. (2017-present), is an employee of Fidelity Investments (2009-present), and has served in other fund officer roles. Prior to joining Fidelity Investments, Ms. Smith served as Senior Audit Manager of Ernst & Young LLP (accounting firm, 1996-2009). Previously, Ms. Smith served as Assistant Treasurer (2013-2018) and Deputy Treasurer (2013-2016) of certain Fidelity® funds.
Marc L. Spector (1972)
Year of Election or Appointment: 2016
Deputy Treasurer
Mr. Spector also serves as an officer of other funds. Mr. Spector serves as Assistant Treasurer of FMR Capital, Inc. (2017-present) and is an employee of Fidelity Investments (2016-present). Prior to joining Fidelity Investments, Mr. Spector served as Director at the Siegfried Group (accounting firm, 2013-2016), and prior to Siegfried Group as audit senior manager at Deloitte & Touche (accounting firm, 2005-2013).
Jim Wegmann (1979)
Year of Election or Appointment: 2019
Assistant Treasurer
Mr. Wegmann also serves as Assistant Treasurer of other funds. Mr. Wegmann is an employee of Fidelity Investments (2011-present).
Shareholder Expense Example
As a shareholder of a Fund, you incur two types of costs: (1) transaction costs, and (2) ongoing costs, including distribution and/or service (12b-1) fees and other Fund expenses. This Example is intended to help you understand your ongoing costs (in dollars) of investing in the Funds and to compare these costs with the ongoing costs of investing in other mutual funds.
The Example is based on an investment of $1,000 invested at the beginning of the period and held for the entire period (July 1, 2018 to December 31, 2018).
Actual Expenses
The first line of the accompanying table for each Class of each fund provides information about actual account values and actual expenses. You may use the information in this line, together with the amount you invested, to estimate the expenses that you paid over the period. Simply divide your account value by $1,000.00 (for example, an $8,600 account value divided by $1,000.00 = 8.6), then multiply the result by the number in the first line for a Class of the fund under the heading entitled "Expenses Paid During Period" to estimate the expenses you paid on your account during this period. The estimate of expenses does not include any fees or other expenses of any variable annuity or variable life insurance product. If they were, the estimate of expenses you paid during the period would be higher, and your ending account value would be lower. In addition, each Fund, as a shareholder in underlying Fidelity Funds, will indirectly bear its pro-rata share of the fees and expenses incurred by the underlying Fidelity Funds. These fees and expenses are not included in each Fund's annualized expense ratio used to calculate the expense estimates in the table below.
Hypothetical Example for Comparison Purposes
The second line of the accompanying table for each Class of each fund provides information about hypothetical account values and hypothetical expenses based on a Class' actual expense ratio and an assumed rate of return of 5% per year before expenses, which is not the Class' actual return. The hypothetical account values and expenses may not be used to estimate the actual ending account balance or expenses you paid for the period. You may use this information to compare the ongoing costs of investing in the Fund and other funds. To do so, compare this 5% hypothetical example with the 5% hypothetical examples that appear in the shareholder reports of the other funds. The estimate of expenses does not include any fees or other expenses of any variable annuity or variable life insurance product. If they were, the estimate of expenses you paid during the period would be higher, and your ending account value would be lower. In addition, each Fund, as a shareholder in underlying Fidelity Funds, will indirectly bear its pro-rata share of the fees and expenses incurred by the underlying Fidelity Funds. These fees and expenses are not included in each Fund's annualized expense ratio used to calculate the expense estimates in the table below.
Please note that the expenses shown in the table are meant to highlight your ongoing costs only and do not reflect any transaction costs. Therefore, the second line of the table is useful in comparing ongoing costs only, and will not help you determine the relative total costs of owning different funds.
| | Annualized Expense RatioA | Beginning
Account Value
July 1, 2018 | Ending
Account Value
December 31, 2018 | Expenses Paid
During Period-B
July 1, 2018
to December 31, 2018 |
| VIP Freedom Income | | | | |
| Initial Class | - %-C | | | |
| Actual | | $1,000.00 | $984.50 | $--D |
| Hypothetical-E | | $1,000.00 | $1,025.21 | $--D |
| Service Class | .10% | | | |
| Actual | | $1,000.00 | $983.70 | $.50 |
| Hypothetical-E | | $1,000.00 | $1,024.70 | $.51 |
| Service Class 2 | .25% | | | |
| Actual | | $1,000.00 | $983.90 | $1.25 |
| Hypothetical-E | | $1,000.00 | $1,023.95 | $1.28 |
| VIP Freedom 2005 | | | | |
| Initial Class | - %-C | | | |
| Actual | | $1,000.00 | $974.30 | $--D |
| Hypothetical-E | | $1,000.00 | $1,025.21 | $--D |
| Service Class | .10% | | | |
| Actual | | $1,000.00 | $974.50 | $.50 |
| Hypothetical-E | | $1,000.00 | $1,024.70 | $.51 |
| Service Class 2 | .25% | | | |
| Actual | | $1,000.00 | $973.10 | $1.24 |
| Hypothetical-E | | $1,000.00 | $1,023.95 | $1.28 |
| VIP Freedom 2010 | | | | |
| Initial Class | - %-C | | | |
| Actual | | $1,000.00 | $963.30 | $--D |
| Hypothetical-E | | $1,000.00 | $1,025.21 | $--D |
| Service Class | .10% | | | |
| Actual | | $1,000.00 | $963.00 | $.49 |
| Hypothetical-E | | $1,000.00 | $1,024.70 | $.51 |
| Service Class 2 | .25% | | | |
| Actual | | $1,000.00 | $962.20 | $1.24 |
| Hypothetical-E | | $1,000.00 | $1,023.95 | $1.28 |
| VIP Freedom 2015 | | | | |
| Initial Class | - %-C | | | |
| Actual | | $1,000.00 | $952.60 | $--D |
| Hypothetical-E | | $1,000.00 | $1,025.21 | $--D |
| Service Class | .10% | | | |
| Actual | | $1,000.00 | $952.20 | $.49 |
| Hypothetical-E | | $1,000.00 | $1,024.70 | $.51 |
| Service Class 2 | .25% | | | |
| Actual | | $1,000.00 | $951.20 | $1.23 |
| Hypothetical-E | | $1,000.00 | $1,023.95 | $1.28 |
| VIP Freedom 2020 | | | | |
| Initial Class | - %-C | | | |
| Actual | | $1,000.00 | $944.10 | $--D |
| Hypothetical-E | | $1,000.00 | $1,025.21 | $--D |
| Service Class | .10% | | | |
| Actual | | $1,000.00 | $943.70 | $.49 |
| Hypothetical-E | | $1,000.00 | $1,024.70 | $.51 |
| Service Class 2 | .25% | | | |
| Actual | | $1,000.00 | $942.70 | $1.22 |
| Hypothetical-E | | $1,000.00 | $1,023.95 | $1.28 |
| VIP Freedom 2025 | | | | |
| Initial Class | - %-C | | | |
| Actual | | $1,000.00 | $936.80 | $--D |
| Hypothetical-E | | $1,000.00 | $1,025.21 | $--D |
| Service Class | .10% | | | |
| Actual | | $1,000.00 | $936.40 | $.49 |
| Hypothetical-E | | $1,000.00 | $1,024.70 | $.51 |
| Service Class 2 | .25% | | | |
| Actual | | $1,000.00 | $935.50 | $1.22 |
| Hypothetical-E | | $1,000.00 | $1,023.95 | $1.28 |
| VIP Freedom 2030 | | | | |
| Initial Class | - %-C | | | |
| Actual | | $1,000.00 | $923.00 | $--D |
| Hypothetical-E | | $1,000.00 | $1,025.21 | $--D |
| Service Class | .10% | | | |
| Actual | | $1,000.00 | $921.90 | $.48 |
| Hypothetical-E | | $1,000.00 | $1,024.70 | $.51 |
| Service Class 2 | .25% | | | |
| Actual | | $1,000.00 | $921.50 | $1.21 |
| Hypothetical-E | | $1,000.00 | $1,023.95 | $1.28 |
| VIP Freedom 2035 | | | | |
| Initial Class | - %-C | | | |
| Actual | | $1,000.00 | $905.80 | $--D |
| Hypothetical-E | | $1,000.00 | $1,025.21 | $--D |
| Service Class | .10% | | | |
| Actual | | $1,000.00 | $905.70 | $.48 |
| Hypothetical-E | | $1,000.00 | $1,024.70 | $.51 |
| Service Class 2 | .25% | | | |
| Actual | | $1,000.00 | $905.10 | $1.20 |
| Hypothetical-E | | $1,000.00 | $1,023.95 | $1.28 |
| VIP Freedom 2040 | | | | |
| Initial Class | - %-C | | | |
| Actual | | $1,000.00 | $900.00 | $--D |
| Hypothetical-E | | $1,000.00 | $1,025.21 | $--D |
| Service Class | .10% | | | |
| Actual | | $1,000.00 | $899.80 | $.48 |
| Hypothetical-E | | $1,000.00 | $1,024.70 | $.51 |
| Service Class 2 | .25% | | | |
| Actual | | $1,000.00 | $898.90 | $1.20 |
| Hypothetical-E | | $1,000.00 | $1,023.95 | $1.28 |
| VIP Freedom 2045 | | | | |
| Initial Class | - %-C | | | |
| Actual | | $1,000.00 | $900.00 | $--D |
| Hypothetical-E | | $1,000.00 | $1,025.21 | $--D |
| Service Class | .10% | | | |
| Actual | | $1,000.00 | $899.70 | $.48 |
| Hypothetical-E | | $1,000.00 | $1,024.70 | $.51 |
| Service Class 2 | .25% | | | |
| Actual | | $1,000.00 | $898.90 | $1.20 |
| Hypothetical-E | | $1,000.00 | $1,023.95 | $1.28 |
| VIP Freedom 2050 | | | | |
| Initial Class | - %-C | | | |
| Actual | | $1,000.00 | $899.60 | $--D |
| Hypothetical-E | | $1,000.00 | $1,025.21 | $--D |
| Service Class | .10% | | | |
| Actual | | $1,000.00 | $899.10 | $.48 |
| Hypothetical-E | | $1,000.00 | $1,024.70 | $.51 |
| Service Class 2 | .25% | | | |
| Actual | | $1,000.00 | $898.60 | $1.20 |
| Hypothetical-E | | $1,000.00 | $1,023.95 | $1.28 |
A Annualized expense ratio reflects expenses net of applicable fee waivers.
B Expenses are equal to each Class' annualized expense ratio, multiplied by the average account value over the period, multiplied by 184/ 365 (to reflect the one-half year period). The fees and expenses of the underlying Fidelity Funds in which each Fund invests are not included in each Class' annualized expense ratio.
C Amount represents less than .005%.
D Amount represents less than $.005.
E 5% return per year before expenses
Distributions (Unaudited)
The Board of Trustees of each fund voted to pay to shareholders of record at the opening of business on record date, the following distributions per share derived from capital gains realized from sales of portfolio securities and dividends derived from net investment income:
| | Pay Date | Record Date | Dividends | Capital Gains |
| VIP Freedom Income Portfolio | | | | |
| Initial Class | 02/15/19 | 02/15/19 | $0.009 | $0.230 |
| Service Class | 02/15/19 | 02/15/19 | $0.008 | $0.230 |
| Service Class 2 | 02/15/19 | 02/15/19 | $0.006 | $0.230 |
| VIP Freedom 2005 Portfolio | | | | |
| Initial Class | 02/15/19 | 02/15/19 | $0.007 | $0.200 |
| Service Class | 02/15/19 | 02/15/19 | $0.006 | $0.200 |
| Service Class 2 | 02/15/19 | 02/15/19 | $0.005 | $0.200 |
| VIP Freedom 2010 Portfolio | | | | |
| Initial Class | 02/15/19 | 02/15/19 | $0.007 | $0.511 |
| Service Class | 02/15/19 | 02/15/19 | $0.006 | $0.511 |
| Service Class 2 | 02/15/19 | 02/15/19 | $0.004 | $0.511 |
| VIP Freedom 2015 Portfolio | | | | |
| Initial Class | 02/15/19 | 02/15/19 | $0.006 | $0.887 |
| Service Class | 02/15/19 | 02/15/19 | $0.005 | $0.887 |
| Service Class 2 | 02/15/19 | 02/15/19 | $0.003 | $0.887 |
| VIP Freedom 2020 Portfolio | | | | |
| Initial Class | 02/15/19 | 02/15/19 | $0.005 | $0.676 |
| Service Class | 02/15/19 | 02/15/19 | $0.004 | $0.676 |
| Service Class 2 | 02/15/19 | 02/15/19 | $0.002 | $0.676 |
| VIP Freedom 2025 Portfolio | | | | |
| Initial Class | 02/15/19 | 02/15/19 | $0.005 | $0.377 |
| Service Class | 02/15/19 | 02/15/19 | $0.003 | $0.377 |
| Service Class 2 | 02/15/19 | 02/15/19 | $0.001 | $0.377 |
| VIP Freedom 2030 Portfolio | | | | |
| Initial Class | 02/15/19 | 02/15/19 | $0.003 | $0.473 |
| Service Class | 02/15/19 | 02/15/19 | $0.002 | $0.473 |
| Service Class 2 | 02/15/19 | 02/15/19 | $0.000 | $0.472 |
| VIP Freedom 2035 Portfolio | | | | |
| Initial Class | 02/15/19 | 02/15/19 | $0.005 | $0.677 |
| Service Class | 02/15/19 | 02/15/19 | $0.003 | $0.677 |
| Service Class 2 | 02/15/19 | 02/15/19 | $0.000 | $0.677 |
| VIP Freedom 2040 Portfolio | | | | |
| Initial Class | 02/15/19 | 02/15/19 | $0.006 | $0.712 |
| Service Class | 02/15/19 | 02/15/19 | $0.004 | $0.712 |
| Service Class 2 | 02/15/19 | 02/15/19 | $0.000 | $0.712 |
| VIP Freedom 2045 Portfolio | | | | |
| Initial Class | 02/15/19 | 02/15/19 | $0.000 | $0.702 |
| Service Class | 02/15/19 | 02/15/19 | $0.000 | $0.700 |
| Service Class 2 | 02/15/19 | 02/15/19 | $0.000 | $0.697 |
| VIP Freedom 2050 Portfolio | | | | |
| Initial Class | 02/15/19 | 02/15/19 | $0.004 | $0.493 |
| Service Class | 02/15/19 | 02/15/19 | $0.002 | $0.493 |
| Service Class 2 | 02/15/19 | 02/15/19 | $0.000 | $0.493 |
|
The funds hereby designate as capital gain dividend the amounts noted below for the taxable year ended December 31, 2018, or, if subsequently determined to be different, the net capital gain of such year.
| VIP Freedom Income Portfolio | $785,490 |
| VIP Freedom 2005 Portfolio | $154,508 |
| VIP Freedom 2010 Portfolio | $11,169,543 |
| VIP Freedom 2015 Portfolio | $5,342,497 |
| VIP Freedom 2020 Portfolio | $34,258,000 |
| VIP Freedom 2025 Portfolio | $5,164,359 |
| VIP Freedom 2030 Portfolio | $11,492,922 |
| VIP Freedom 2035 Portfolio | $2,232,995 |
| VIP Freedom 2040 Portfolio | $3,164,035 |
| VIP Freedom 2045 Portfolio | $1,289,140 |
| VIP Freedom 2050 Portfolio | $843,367 |
|
A percentage of the dividends distributed during the fiscal year for the following funds were derived from interest on U.S. Government securities which is generally exempt from state income tax
| VIP Freedom Income Portfolio | 28.45% |
| VIP Freedom 2005 Portfolio | 22.79% |
| VIP Freedom 2010 Portfolio | 17.46% |
| VIP Freedom 2015 Portfolio | 12.86% |
| VIP Freedom 2020 Portfolio | 10.96% |
| VIP Freedom 2025 Portfolio | 10.03% |
| VIP Freedom 2030 Portfolio | 5.77% |
| VIP Freedom 2035 Portfolio | 3.58% |
| VIP Freedom 2040 Portfolio | 2.45% |
| VIP Freedom 2045 Portfolio | 2.46% |
| VIP Freedom 2050 Portfolio | 2.55% |
| | |
A percentage of the dividends distributed during the fiscal year for the following funds qualify for the dividends–received deduction for corporate shareholders:
| | February 2018 | December 2018 |
| VIP Freedom Income Portfolio | | |
| Initial Class | – | 5% |
| Service Class | – | 5% |
| Service Class 2 | – | 6% |
| VIP Freedom 2005 Portfolio | | |
| Initial Class | 1% | 8% |
| Service Class | 1% | 9% |
| Service Class 2 | 1% | 9% |
| VIP Freedom 2010 Portfolio | | |
| Initial Class | 3% | 11% |
| Service Class | 3% | 11% |
| Service Class 2 | 3% | 12% |
| VIP Freedom 2015 Portfolio | | |
| Initial Class | 4% | 13% |
| Service Class | 4% | 14% |
| Service Class 2 | 4% | 15% |
| VIP Freedom 2020 Portfolio | | |
| Initial Class | 7% | 16% |
| Service Class | 7% | 17% |
| Service Class 2 | 7% | 19% |
| VIP Freedom 2025 Portfolio | | |
| Initial Class | 3% | 20% |
| Service Class | 3% | 21% |
| Service Class 2 | 3% | 22% |
| VIP Freedom 2030 Portfolio | | |
| Initial Class | 4% | 22% |
| Service Class | 4% | 23% |
| Service Class 2 | 4% | 25% |
| VIP Freedom 2035 Portfolio | | |
| Initial Class | – | 31% |
| Service Class | – | 32% |
| Service Class 2 | – | 35% |
| VIP Freedom 2040 Portfolio | | |
| Initial Class | – | 32% |
| Service Class | – | 33% |
| Service Class 2 | – | 37% |
| VIP Freedom 2045 Portfolio | | |
| Initial Class | – | 33% |
| Service Class | – | 34% |
| Service Class 2 | – | 38% |
| VIP Freedom 2050 Portfolio | | |
| Initial Class | – | 33% |
| Service Class | – | 35% |
| Service Class 2 | – | 38% |
|
The amounts per share which represent income derived from sources within, and taxes paid to, foreign countries or possessions of the United States are as follows:
| | Pay Date | Income | Taxes |
| VIP Freedom Income Portfolio | | | |
| Initial Class | 12/21/18 | $0.0167 | $0.0019 |
| Service Class | 12/21/18 | $0.0160 | $0.0019 |
| Service Class 2 | 12/21/18 | $0.0147 | $0.0019 |
| VIP Freedom 2005 Portfolio | | | |
| Initial Class | 12/21/18 | $0.0222 | $0.0026 |
| Service Class | 12/21/18 | $0.0213 | $0.0026 |
| Service Class 2 | 12/21/18 | $0.0197 | $0.0026 |
| VIP Freedom 2010 Portfolio | | | |
| Initial Class | 12/21/18 | $0.0330 | $0.0034 |
| Service Class | 12/21/18 | $0.0314 | $0.0034 |
| Service Class 2 | 12/21/18 | $0.0289 | $0.0034 |
| VIP Freedom 2015 Portfolio | | | |
| Initial Class | 12/21/18 | $0.0382 | $0.0041 |
| Service Class | 12/21/18 | $0.0362 | $0.0041 |
| Service Class 2 | 12/21/18 | $0.0332 | $0.0041 |
| VIP Freedom 2020 Portfolio | | | |
| Initial Class | 12/21/18 | $0.0461 | $0.0047 |
| Service Class | 12/21/18 | $0.0437 | $0.0047 |
| Service Class 2 | 12/21/18 | $0.0401 | $0.0047 |
| VIP Freedom 2025 Portfolio | | | |
| Initial Class | 12/21/18 | $0.0516 | $0.0055 |
| Service Class | 12/21/18 | $0.0491 | $0.0055 |
| Service Class 2 | 12/21/18 | $0.0452 | $0.0055 |
| VIP Freedom 2030 Portfolio | | | |
| Initial Class | 12/21/18 | $0.0601 | $0.0063 |
| Service Class | 12/21/18 | $0.0573 | $0.0063 |
| Service Class 2 | 12/21/18 | $0.0526 | $0.0063 |
| VIP Freedom 2035 Portfolio | | | |
| Initial Class | 12/21/18 | $0.1135 | $0.0114 |
| Service Class | 12/21/18 | $0.1078 | $0.0114 |
| Service Class 2 | 12/21/18 | $0.0983 | $0.0114 |
| VIP Freedom 2040 Portfolio | | | |
| Initial Class | 12/21/18 | $0.1071 | $0.0113 |
| Service Class | 12/21/18 | $0.1016 | $0.0113 |
| Service Class 2 | 12/21/18 | $0.0923 | $0.0113 |
| VIP Freedom 2045 Portfolio | | | |
| Initial Class | 12/21/18 | $0.1145 | $0.0112 |
| Service Class | 12/21/18 | $0.1100 | $0.0112 |
| Service Class 2 | 12/21/18 | $0.0980 | $0.0112 |
| VIP Freedom 2050 Portfolio | | | |
| Initial Class | 12/21/18 | $0.0961 | $0.0101 |
| Service Class | 12/21/18 | $0.0916 | $0.0101 |
| Service Class 2 | 12/21/18 | $0.0844 | $0.0101 |
|
Board Approval of Investment Advisory Contracts and Management Fees
VIP Freedom Funds
Each year, the Board of Trustees, including the Independent Trustees (together, the Board), votes on the renewal of the management contract (the Advisory Contract) with FMR Co., Inc. (FMRC), an affiliate of Fidelity Management & Research Company (FMR), for each fund. The Board, assisted by the advice of fund counsel and Independent Trustees' counsel, requests and considers a broad range of information relevant to the renewal of the Advisory Contracts throughout the year.
The Board meets regularly and, at each of its meetings, covers an extensive agenda of topics and materials and considers factors that are relevant to its annual consideration of the renewal of each fund's Advisory Contract, including the services and support provided to each fund and its shareholders. The Board has established four standing committees (Committees) — Operations, Audit, Fair Valuation, and Governance and Nominating — each composed of and chaired by Independent Trustees with varying backgrounds, to which the Board has assigned specific subject matter responsibilities in order to enhance effective decision-making by the Board. The Operations Committee, of which all of the Independent Trustees are members, meets regularly throughout the year and considers, among other matters, information specifically related to the annual consideration of the renewal of each fund's Advisory Contract. The Board, acting directly and through its Committees, requests and receives information concerning the annual consideration of the renewal of each fund's Advisory Contract. The Board also meets as needed to review matters specifically related to the Board's annual consideration of the renewal of the Advisory Contracts. Members of the Board may also meet with trustees of other Fidelity funds through joint ad hoc committees to discuss certain matters relevant to all of the Fidelity funds.
At its September 2018 meeting, the Board unanimously determined to renew each fund's Advisory Contract. In reaching its determination, the Board considered all factors it believed relevant and reached a determination, with the assistance of fund counsel and Independent Trustees' counsel and through the exercise of its business judgment, that the renewal of the Advisory Contract was in the best interests of each fund and its shareholders and that the fact that no fees are payable under the Advisory Contracts was fair and reasonable. The Board's decision to renew the Advisory Contracts was not based on any single factor, but rather was based on a comprehensive consideration of all the information provided to the Board at its meetings throughout the year. In reaching its determination, the Board was aware that shareholders of each fund have a broad range of investment choices available to them, including a wide choice among funds offered by Fidelity's competitors, and that each fund's shareholders, who have the opportunity to review and weigh the disclosure provided by the fund in its prospectus and other public disclosures, have chosen to invest in that fund, which is part of the Fidelity family of funds.
Nature, Extent, and Quality of Services Provided. The Board considered Fidelity's staffing as it relates to the funds, including the backgrounds of investment personnel of FMRC, and also considered the funds' investment objectives, strategies, and related investment philosophies. The Independent Trustees also had discussions with senior management of Fidelity's investment operations and investment groups with responsibility for the underlying Fidelity funds in which each fund invests. The Board considered the structure of the investment personnel compensation program and whether this structure provides appropriate incentives to act in the best interests of each fund. Additionally, the Board considered the portfolio managers' investments, if any, in the funds that they manage.
Resources Dedicated to Investment Management and Support Services. The Board reviewed the general qualifications and capabilities of Fidelity's investment staff, including its size, education, experience, and resources, as well as Fidelity's approach to recruiting, managing, and compensating investment personnel. The Board noted that Fidelity has continued to increase the resources devoted to non-U.S. offices, including expansion of Fidelity's global investment organization. The Board also noted that Fidelity's analysts have extensive resources, tools and capabilities that allow them to conduct sophisticated quantitative and fundamental analysis, as well as credit analysis of issuers, counterparties and guarantors. Further, the Board considered that Fidelity's investment professionals have sufficient access to global information and data so as to provide competitive investment results over time, and that those professionals also have access to sophisticated tools that permit them to assess portfolio construction and risk and performance attribution characteristics continuously, as well as to transmit new information and research conclusions rapidly around the world. Additionally, in its deliberations, the Board considered Fidelity's risk management, compliance, and technology and operations capabilities and resources, which are integral parts of the investment management process.
Shareholder and Administrative Services. The Board considered (i) the nature, extent, quality, and cost of advisory, administrative, and shareholder services performed by Fidelity under the Advisory Contract and under separate agreements covering transfer agency, and pricing and bookkeeping services for each fund; (ii) the nature and extent of the supervision of third party service providers, principally custodians, subcustodians, and pricing vendors; and (iii) the resources devoted to, and the record of compliance with, each fund's compliance policies and procedures.
The Board noted that the growth of fund assets over time across the complex allows Fidelity to reinvest in the development of services designed to enhance the value and convenience of the Fidelity funds as investment vehicles. These services include 24-hour access to account information and market information through telephone representatives and over the Internet, investor education materials and asset allocation tools, and the expanded availability of Fidelity Investor Centers.
Investment in a Large Fund Family. The Board considered the benefits to shareholders of investing in a Fidelity fund, including the benefits of investing in a fund that is part of a large family of funds offering a variety of investment disciplines and providing a large variety of mutual fund investor services. The Board noted that Fidelity had taken, or had made recommendations that resulted in the Fidelity funds taking, a number of actions over the previous year that benefited particular funds, including: (i) continuing to dedicate additional resources to Fidelity's investment research process, which includes meetings with management of issuers of securities in which the funds invest, and to the support of the senior management team that oversees asset management; (ii) continuing efforts to enhance Fidelity's global research capabilities; (iii) launching new funds and making other enhancements to meet client needs; (iv) launching new share classes of existing funds; (v) eliminating purchase minimums and broadening eligibility requirements for certain funds and share classes; (vi) reducing management fees and total expenses for certain growth equity funds and index funds; (vii) lowering expense caps for certain existing funds and classes, and converting certain voluntary expense caps to contractual caps, to reduce expenses borne by shareholders; (viii) eliminating short-term redemption fees for funds that had such fees; (ix) rationalizing product lines and gaining increased efficiencies from fund mergers and share class consolidations; (x) continuing to develop, acquire and implement systems and technology to improve services to the funds and shareholders, strengthen information security, and increase efficiency; and (xi) continuing to implement enhancements to further strengthen Fidelity's product line to increase investors' probability of success in achieving their investment goals, including retirement income goals.
Investment Performance. The Board considered whether each fund has operated in accordance with its investment objective, as well as its record of compliance with its investment restrictions and its performance history.
The Board took into account discussions that occur at Board meetings throughout the year with representatives of the investment adviser about fund investment performance. In this regard the Board noted that as part of regularly scheduled fund reviews and other reports to the Board on fund performance, the Board considers annualized return information for each fund for different time periods, measured against one or more appropriate securities market indices, including a customized blended index that reflects the respective weights of the fund's asset classes (each a "benchmark index") and a peer group of funds with similar objectives ("peer group"), if any. In its evaluation of fund investment performance at meetings throughout the year, the Board gave particular attention to information indicating underperformance of certain Fidelity funds for specific time periods and discussed with the investment adviser the reasons for such underperformance.
In addition to reviewing absolute and relative fund performance, the Independent Trustees periodically consider the appropriateness of fund performance metrics in evaluating the results achieved. In general, the Independent Trustees believe that fund performance should be evaluated based on gross performance (before fees and expenses, including acquired fund fees and expenses, but after transaction costs, if any) compared to appropriate benchmark indices, over appropriate time periods that may include full market cycles, and on net performance (after fees and expenses, including acquired fund fees and expenses) compared to peer groups, as applicable, over the same periods, taking into account relevant factors including the following: general market conditions; the extent to which particular underlying funds affected performance; and fund cash flows and other factors. Depending on the circumstances, the Independent Trustees may be satisfied with a fund's performance notwithstanding that it lags its benchmark index or peer group for certain periods.
The Independent Trustees recognize that shareholders evaluate performance on a net basis over their own holding periods, for which one-, three-, and five-year periods are often used as a proxy. For this reason, the performance information reviewed by the Board also included net cumulative calendar year total return information for each fund and an appropriate benchmark index for the most recent one-, three-, and five-year periods.
Based on its review, the Board concluded that the nature, extent, and quality of services provided to each fund under the Advisory Contracts should continue to benefit the shareholders of each fund.
Competitiveness of Management Fee and Total Expense Ratio. The Board noted that the funds do not pay FMRC a management fee for investment advisory services, and that each fund bears indirectly the fees and expenses, including the management fees, paid by the underlying Fidelity funds in which it invests. The Board considered each fund's management fee and total expense ratio compared to "mapped groups" of competitive funds and classes created for the purpose of facilitating the Trustees' competitive analysis of management fees and total expenses. Fidelity creates "mapped groups" by combining similar Lipper investment objective categories that have comparable investment mandates. Combining Lipper investment objective categories aids the Board's management fee and total expense ratio comparisons by broadening the competitive group used for comparison.
Management Fee. The Board considered two proprietary management fee comparisons for the 12-month periods shown in basis points (BP) in the charts below. The group of Lipper funds used by the Board for management fee comparisons is referred to below as the "Total Mapped Group." The Total Mapped Group comparison focuses on a fund's standing in terms of gross management fees before expense reimbursements or caps relative to the total universe of funds with comparable investment mandates, regardless of whether their management fee structures also are comparable. Funds with comparable investment mandates offer exposure to similar types of securities. Funds with comparable management fee structures have similar management fee contractual arrangements (
e.g., flat rate charged for advisory services, all-inclusive fee rate,
etc.). "TMG %" represents the percentage of funds in the Total Mapped Group that had management fees that were lower than a fund's. For example, a hypothetical TMG % of 20% would mean that 80% of the funds in the Total Mapped Group had higher, and 20% had lower, management fees than a fund. The funds' actual TMG %s and the number of funds in the Total Mapped Group are in the charts below. The "Asset-Size Peer Group" (ASPG) comparison focuses on a fund's standing relative to a subset of non-Fidelity funds within the Total Mapped Group that are similar in size and management fee structure. For example, if a fund is in the first quartile of the ASPG, the fund's management fee ranks in the least expensive or lowest 25% of funds in the ASPG. The ASPG represents at least 15% of the funds in the Total Mapped Group with comparable asset size and management fee structures, subject to a minimum of 50 funds (or all funds in the Total Mapped Group if fewer than 50). Additional information, such as the ASPG quartile in which a fund's management fee rate ranked, is also included in the charts and was considered by the Board.
VIP Freedom 2005 Portfolio

VIP Freedom 2010 Portfolio

VIP Freedom 2015 Portfolio
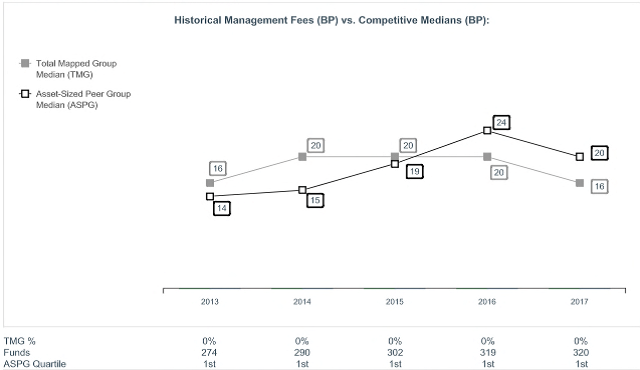
VIP Freedom 2020 Portfolio

VIP Freedom 2025 Portfolio

VIP Freedom 2030 Portfolio
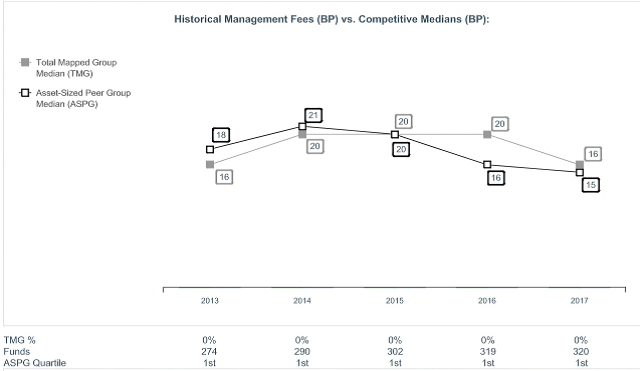
VIP Freedom 2035 Portfolio

VIP Freedom 2040 Portfolio

VIP Freedom 2045 Portfolio

VIP Freedom 2050 Portfolio

VIP Freedom Income Portfolio
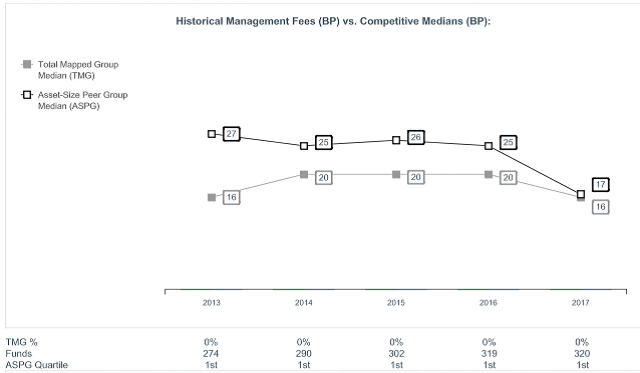
The Board noted that each fund's management fee rate of 0.00% ranked below the median of its Total Mapped Group and below the median of its ASPG for 2017. The Board further noted that many peer funds pay fund-level expenses, including management fees, to which the funds are not subject.
The Board noted that it and the boards of other Fidelity funds formed an ad hoc Committee on Group Fee, which meets periodically, to conduct an in-depth review of the "group fee" component of the management fee of funds with such management fee structures, and that while the funds do not pay a management fee, they indirectly bear a portion of the management fees paid by the Fidelity funds in which they invest, some of which are subject to the group fee. The Committee's focus included the mechanics of the group fee, the competitive landscape of group fee structures, Fidelity funds with no group fee component (such as the funds) and investment products not included in group fee assets. The Board also considered that, for funds subject to the group fee, FMR agreed to voluntarily waive fees over a specified period of time in amounts designed to account for assets converted from certain funds to certain collective investment trusts.
Based on its review, the Board concluded that each fund's management fee is fair and reasonable in light of the services that the fund receives and the other factors considered.
Total Expense Ratio. In its review of the total expense ratio of each class of each fund, the Board considered fund-paid 12b-1 fees and noted that each fund invests in a class of shares of the underlying Fidelity fund that does not charge a 12b-1 fee to avoid charging fund-paid 12b-1 fees at both fund levels. The Board considered that the funds do not pay transfer agent fees. Instead, the applicable class of each underlying Fidelity fund bears its pro rata portion of each fund's transfer agent fee according to the percentage of each fund's assets invested in that underlying fund. The Board further noted that FMR pays all other expenses of each fund, with limited exceptions.
The Board noted that each fund offers multiple classes, each of which has a different 12b-1 fee structure, and that the multiple structures are intended to offer a range of pricing options for the intermediary market. The Board also noted that the total expense ratios of the classes of each fund vary primarily by the level of their 12b-1 fees.
The Board noted that the total expense ratio of each class of each fund ranked below the competitive median for 2017.
In considering the total expense ratio of each class of each fund, the Board also considered an alternative competitive analysis that included both top level (
i.e., direct) fund fees and acquired fund fees and expenses for the class and the other funds and classes to which it is compared. The Board noted that, under this alternative competitive analysis, the total expense ratio of each of Initial Class and Service Class of each fund ranked below the competitive median for 2017. The Board noted that the total expense ratio of Service Class 2 of each of VIP Freedom 2005 Portfolio, VIP Freedom 2010 Portfolio, VIP Freedom 2015 Portfolio, VIP Freedom 2020 Portfolio, VIP Freedom 2025 Portfolio, and VIP Freedom Income Portfolio ranked below the competitive median for 2017, the total expense ratio of Service Class 2 of VIP Freedom 2030 Portfolio ranked equal to the competitive median for 2017, and the total expense ratio of Service Class 2 of VIP Freedom 2035 Portfolio, VIP Freedom 2040 Portfolio, VIP Freedom 2045 Portfolio, and VIP Freedom 2050 Portfolio ranked above the competitive median for 2017. The Board considered that, in general, various factors can affect total expense ratios. The Board noted that, for each fund for which Service Class 2 was above the competitive median, the class was above median because of its 12b-1 fees.
Fees Charged to Other Fidelity Clients. The Board also considered Fidelity fee structures and other information with respect to clients of Fidelity, such as other funds advised or subadvised by Fidelity, pension plan clients, and other institutional clients with similar mandates. The Board noted that a joint ad hoc committee created by it and the boards of other Fidelity funds periodically reviews and compares Fidelity's institutional investment advisory business with its business of providing services to the Fidelity funds and also noted the most recent findings of the committee. The Board noted that the committee's review included a consideration of the differences in services provided, fees charged, and costs incurred, as well as competition in the markets serving the different categories of clients.
Based on its review of total expense ratios and fees charged to other Fidelity clients, the Board concluded that the total expense ratio of each class of each fund was reasonable in light of the services that the fund and its shareholders receive and the other factors considered.
Costs of the Services and Profitability. The Board considered the level of Fidelity's profits in respect of all the Fidelity funds, including the Fidelity funds in which the funds invest.
PricewaterhouseCoopers LLP (PwC), auditor to Fidelity and certain Fidelity funds, has been engaged annually by the Board as part of the Board's assessment of Fidelity's profitability analysis. PwC's engagement includes the review and assessment of the methodologies used by Fidelity in determining the revenues and expenses attributable to Fidelity's mutual fund business, and completion of agreed-upon procedures in respect of the mathematical accuracy of the fund profitability information and its conformity to established allocation methodologies. After considering PwC's reports issued under the engagement and information provided by Fidelity, the Board concluded that while other allocation methods may also be reasonable, Fidelity's profitability methodologies are reasonable in all material respects.
The Board also reviewed Fidelity's non-fund businesses and potential indirect benefits such businesses may have received as a result of their association with Fidelity's mutual fund business (i.e., fall-out benefits) as well as cases where Fidelity's affiliates may benefit from the funds' business. The Board noted that changes to fall-out benefits year-over-year reflect business developments at Fidelity's various businesses.
The Board concluded that the costs of the services provided by and the profits realized by Fidelity in connection with the operation of each fund were not relevant to the renewal of each fund's Advisory Contract because the funds do not pay management fees and FMR pays all other expenses of each fund, with limited exceptions.
Economies of Scale. The Board concluded that because the funds do not pay management fees and FMR pays all other expenses of each fund, with limited exceptions, economies of scale cannot be realized by the funds, but may be realized by the other Fidelity funds in which each fund invests, many of which may benefit from breakpoints under the group fee arrangement.
Additional Information Requested by the Board. In order to develop fully the factual basis for consideration of the Fidelity funds' advisory contracts, the Board requested and received additional information on certain topics, including: (i) Fidelity's fund profitability methodology, profitability trends for certain funds, the allocation of various costs to different funds, and the impact of certain factors on fund profitability results; (ii) portfolio manager changes that have occurred during the past year and the amount of the investment that each portfolio manager has made in the Fidelity fund(s) that he or she manages; (iii) Fidelity's compensation structure for portfolio managers, research analysts, and other key personnel, including its effects on fund profitability, the rationale for the compensation structure, and the extent to which current market conditions have affected retention and recruitment; (iv) the arrangements with and compensation paid to certain fund sub-advisers on behalf of the Fidelity funds and the treatment of such compensation within Fidelity's fund profitability methodology; (v) the terms of Fidelity's voluntary expense limitation agreements; (vi) the methodology with respect to competitive fund data and peer group classifications; (vii) Fidelity's transfer agent fee, expense, and service structures for different funds and classes relative to competitive trends, and the impact of the increased use of omnibus accounts; (viii) new developments in the retail and institutional marketplaces and the competitive positioning of the funds relative to other investment products and services; (ix) the impact of recent changes to the money market fund landscape, including the full implementation of money market fund reform and rising interest rates, on Fidelity's money market funds; (x) the funds' share class structures and distribution channels; and (xi) explanations regarding the relative total expense ratios of certain funds and classes, total expense competitive trends and methodologies for total expense competitive comparisons, and actions that might be taken by Fidelity to reduce total expense ratios for certain classes. In addition, the Board considered its discussions with Fidelity throughout the year regarding enhanced information security initiatives and the funds' fair valuation policies.
Based on its evaluation of all of the conclusions noted above, and after considering all factors it believed relevant, the Board concluded that the advisory fee arrangements are fair and reasonable, and that each fund's Advisory Contract should be renewed.
VIPFF2K-ANN-0219
1.826371.114
Fidelity® Variable Insurance Products:
Freedom Lifetime Income Funds - Portfolios I, II & III
Annual Report December 31, 2018 |
|
Beginning on January 1, 2021, as permitted by regulations adopted by the Securities and Exchange Commission, and if your insurance carrier elects to participate, you may not be receiving paper copies of the Fund’s shareholder reports from the insurance company that offers your variable insurance product unless you specifically request paper copies from your financial professional or the administrator of your variable insurance product. Instead, the reports will be made available on a website, and you will be notified by mail each time a report is posted and provided with a website link to access the report.
If you already elected to receive shareholder reports electronically, you will not be affected by this change and you need not take any action. You may elect to receive shareholder reports and other communications from the Fund electronically, by contacting your financial professional or the administrator of your variable insurance product. If you own a Fidelity-administered variable insurance product, please visit fidelity.com/mailpreferences to make your election or call 1-800-343-3548.
You may elect to receive all future reports in paper free of charge. If you wish to continue receiving paper copies of your shareholder reports, you may contact your financial professional or the administrator of your variable insurance product. If you own a Fidelity-administered variable insurance product, please visit fidelity.com/mailpreferences to make your election or call 1-800-343-3548. Your election to receive reports in paper will apply to all funds available under your variable insurance product.
Contents
To view a fund's proxy voting guidelines and proxy voting record for the 12-month period ended June 30, visit http://www.fidelity.com/proxyvotingresults or visit the Securities and Exchange Commission's (SEC) web site at http://www.sec.gov.
You may also call 1-877-208-0098 to request a free copy of the proxy voting guidelines.
Fidelity® Variable Insurance Products are separate account options which are purchased through a variable insurance contract.
Standard & Poor's, S&P and S&P 500 are registered service marks of The McGraw-Hill Companies, Inc. and have been licensed for use by Fidelity Distributors Corporation.
Other third-party marks appearing herein are the property of their respective owners.
All other marks appearing herein are registered or unregistered trademarks or service marks of FMR LLC or an affiliated company. © 2019 FMR LLC. All rights reserved.
This report and the financial statements contained herein are submitted for the general information of the shareholders of the Funds. This report is not authorized for distribution to prospective investors in the Funds unless preceded or accompanied by an effective prospectus.
A fund files its complete schedule of portfolio holdings with the SEC for the first and third quarters of each fiscal year on Form N-Q. Forms N-Q are available on the SEC’s web site at http://www.sec.gov. A fund's Forms N-Q may be reviewed and copied at the SEC’s Public Reference Room in Washington, DC. Information regarding the operation of the SEC's Public Reference Room may be obtained by calling 1-800-SEC-0330.
For a complete list of a fund's portfolio holdings, view the most recent holdings listing, semiannual report, or annual report on Fidelity's web site at http://www.fidelity.com, http://www.institutional.fidelity.com, or http://www.401k.com, as applicable.
NOT FDIC INSURED •MAY LOSE VALUE •NO BANK GUARANTEE
Neither the Funds nor Fidelity Distributors Corporation is a bank.
VIP Freedom Lifetime Income® I Portfolio
Performance: The Bottom Line
Average annual total return reflects the change in the value of an investment, assuming reinvestment of distributions from dividend income and capital gains (the profits earned upon the sale of securities that have grown in value, if any) and assuming a constant rate of performance each year. During periods of reimbursement by Fidelity, a fund’s total return will be greater than it would be had the reimbursement not occurred. Performance numbers are net of all underlying fund operating expenses, but do not include any insurance charges imposed by your insurance company’s separate account. If performance information included the effect of these additional charges, the total returns would have been lower. How a fund did yesterday is no guarantee of how it will do tomorrow.
Average Annual Total Returns
| Periods ended December 31, 2018 | Past 1 year | Past 5 years | Past 10 years |
| VIP Freedom Lifetime Income® I Portfolio | (2.58)% | 2.82% | 6.77% |
$10,000 Over 10 Years
Let's say hypothetically that $10,000 was invested in VIP Freedom Lifetime Income® I Portfolio on December 31, 2008.
The chart shows how the value of your investment would have changed, and also shows how the Bloomberg Barclays U.S. Aggregate Bond Index performed over the same period.

| Period Ending Values |
| $19,245 | VIP Freedom Lifetime Income® I Portfolio |
| $14,075 | Bloomberg Barclays U.S. Aggregate Bond Index |
VIP Freedom Lifetime Income® II Portfolio
Performance: The Bottom Line
Average annual total return reflects the change in the value of an investment, assuming reinvestment of distributions from dividend income and capital gains (the profits earned upon the sale of securities that have grown in value, if any) and assuming a constant rate of performance each year. During periods of reimbursement by Fidelity, a fund’s total return will be greater than it would be had the reimbursement not occurred. Performance numbers are net of all underlying fund operating expenses, but do not include any insurance charges imposed by your insurance company’s separate account. If performance information included the effect of these additional charges, the total returns would have been lower. How a fund did yesterday is no guarantee of how it will do tomorrow.
Average Annual Total Returns
| Periods ended December 31, 2018 | Past 1 year | Past 5 years | Past 10 years |
| VIP Freedom Lifetime Income® II Portfolio | (3.96)% | 3.66% | 7.99% |
$10,000 Over 10 Years
Let's say hypothetically that $10,000 was invested in VIP Freedom Lifetime Income® II Portfolio on December 31, 2008.
The chart shows how the value of your investment would have changed, and also shows how the Bloomberg Barclays U.S. Aggregate Bond Index performed over the same period.

| Period Ending Values |
| $21,575 | VIP Freedom Lifetime Income® II Portfolio |
| $14,075 | Bloomberg Barclays U.S. Aggregate Bond Index |
VIP Freedom Lifetime Income® III Portfolio
Performance: The Bottom Line
Average annual total return reflects the change in the value of an investment, assuming reinvestment of distributions from dividend income and capital gains (the profits earned upon the sale of securities that have grown in value, if any) and assuming a constant rate of performance each year. During periods of reimbursement by Fidelity, a fund’s total return will be greater than it would be had the reimbursement not occurred. Performance numbers are net of all underlying fund operating expenses, but do not include any insurance charges imposed by your insurance company’s separate account. If performance information included the effect of these additional charges, the total returns would have been lower. How a fund did yesterday is no guarantee of how it will do tomorrow.
Average Annual Total Returns
| Periods ended December 31, 2018 | Past 1 year | Past 5 years | Past 10 years |
| VIP Freedom Lifetime Income® III Portfolio | (5.68)% | 4.16% | 9.64% |
$10,000 Over 10 Years
Let's say hypothetically that $10,000 was invested in VIP Freedom Lifetime Income® III Portfolio on December 31, 2008.
The chart shows how the value of your investment would have changed, and also shows how the S&P 500® Index performed over the same period.

| Period Ending Values |
| $25,100 | VIP Freedom Lifetime Income® III Portfolio |
| $34,303 | S&P 500® Index |
Management's Discussion of Fund Performance
Market Recap: The global economy remained in expansion in 2018, but growth became less synchronous and more uneven. Meanwhile, global monetary policy became a headwind, and this uncertainty spurred an increase in volatility among risk assets. China entered a growth recession in the latter part of the year, and this slowdown, along with global monetary tightening and trade-policy uncertainty between China and the U.S., weighed on the industrial sectors in Europe and elsewhere. Looking at global assets, the year marked a reversal of sorts, with the positive trajectory of equities seen earlier in the period turning decidedly negative later in the second half. Several factors served to dim the outlook for risk assets, including the pace of the U.S. Federal Reserve’s interest rate increases, emerging late-cycle conditions, slowing economic growth in China, falling commodity prices and the U.K.’s planned “Brexit” from the European Union. Against this backdrop, non-U.S. equities suffered a pronounced, broad-based correction, returning -14.04% for the year, according to the MSCI ACWI ex USA Index. Among regions in the index, Asia-Pacific (-11%) and Japan (-13%) held up best, whereas resource-rich Canada (-17%), Europe (-14%) and emerging markets (-14%) lagged. In a turnaround from prior quarters in 2018, the value segment of equity markets outpaced growth across the globe amid the fourth-quarter downturn. Results at home, albeit negative, were comparatively strong globally, with the U.S. bellwether S&P 500
® index returning -4.38%. Sector-wise, seven of the 11 major sectors in the S&P 500
® lost ground this period. Falling crude-oil prices caused energy stocks (-18%) to suffer most, while concerns about slowing global growth felled the materials (-15%), industrials (-13%) and financials (-13%) sectors. Conversely, health care (+6%) led the way, followed by the utilities (+4%), information technology (+3%) and consumer discretionary (+2%) sectors. The small-cap-oriented Russell 2000
® Index had a return of -11.01% for the year. Commodities also struggled, as reflected in the -11.25% result of the Bloomberg Barclays Commodity Index Total Return. U.S. investment-grade bonds were roughly flat (+0.01%) for the 12 months, according to the Bloomberg Barclays U.S. Aggregate Bond Index. In the latter half of the period, concerns about global growth pushed Treasury yields lower and credit spreads wider. Short-term debt, as shown by the Bloomberg Barclays U.S. 3-Month Treasury Bellwether Index, led most U.S. investment-grade sectors with a return of 1.9%, followed by asset-backed securities (+1.8%) and agency bonds (+1.3%), while corporate credit returned -2.1%. Elsewhere, international bonds faced a similar struggle, while other non-core, more-credit-sensitive fixed-income segments, including U.S. high-yield corporates and emerging-markets debt also had a difficult year.
Comments from Co-Portfolio Managers Andrew Dierdorf and Brett Sumsion: For the year, VIP Freedom Lifetime Income Funds posted returns ranging from -2.58% for VIP Freedom Lifetime Income I Portfolio to -5.68% for VIP Freedom Lifetime Income III Portfolio. Each VIP Freedom Lifetime Income Portfolio underperformed its respective Composite benchmark by roughly 1 to 2 percentage points. Versus Composites, underlying investment performance was the primary reason for the Portfolios’ underperformance the past year, with asset allocation detracting to a lesser extent. In terms of investment performance, our underlying U.S. equity and non-U.S. equity positions hurt most. Here, a handful of underlying U.S. equity investments, including Fidelity
® VIP Growth & Income Portfolio and Fidelity
® VIP Value Portfolio, each lagged their respective benchmarks by roughly 5 percentage points for the 12 months. Among non-U.S. equity investments, positions in Fidelity
® VIP Emerging Markets Portfolio and Fidelity
® VIP Overseas Portfolio trailed their benchmarks by about 3 and 1 percentage points, respectively. In terms of asset allocation, overweighting non-U.S. equities held back the Portfolios’ relative performance, as did our underweighting in investment-grade bonds. Intra-asset class allocation decisions within U.S. equities also notably detracted, especially allocations to value-oriented strategies, which lagged growth in 2018. Conversely, an underweighting to U.S. equities, along with a higher allocations to long-term U.S. Treasury bonds, added value relative to Composites.
The views expressed above reflect those of the portfolio manager(s) only through the end of the period as stated on the cover of this report and do not necessarily represent the views of Fidelity or any other person in the Fidelity organization. Any such views are subject to change at any time based upon market or other conditions and Fidelity disclaims any responsibility to update such views. These views may not be relied on as investment advice and, because investment decisions for a Fidelity fund are based on numerous factors, may not be relied on as an indication of trading intent on behalf of any Fidelity fund.
Note to Shareholders: In May, the Board of Trustees for Fidelity VIP Freedom Lifetime Income Funds approved some updates to the glide path for Fidelity's target-date portfolios, adding inflation-protected debt and long-term U.S. Treasury bonds. These adjustments were implemented by the end of 2018.
VIP Freedom Lifetime Income® I Portfolio
Investment Summary (Unaudited)
The information in the following tables is based on the direct investments of the Fund.
Top Holdings as of December 31, 2018
| | % of fund's net assets |
| VIP Investment Grade Bond Portfolio Investor Class | 35.4 |
| VIP Government Money Market Portfolio Investor Class 2.16% | 23.3 |
| Fidelity Inflation-Protected Bond Index Fund Institutional Premium Class | 12.2 |
| VIP Overseas Portfolio Investor Class | 5.7 |
| Fidelity Long Term Treasury Bond Index Fund | 5.5 |
| VIP Emerging Markets Portfolio Investor Class | 4.6 |
| VIP Growth & Income Portfolio Investor Class | 2.4 |
| VIP Equity-Income Portfolio Investor Class | 2.1 |
| VIP High Income Portfolio Investor Class | 2.0 |
| VIP Growth Portfolio Investor Class | 2.0 |
| | 95.2 |
Asset Allocation (% of fund's net assets)
| Period end |
| | Domestic Equity Funds | 11.3% |
| | International Equity Funds | 10.3% |
| | Bond Funds | 55.1% |
| | Short-Term Funds | 23.3% |

VIP Freedom Lifetime Income® I Portfolio
Schedule of Investments December 31, 2018
Showing Percentage of Net Assets
| Domestic Equity Funds - 11.3% | | | |
| | | Shares | Value |
| VIP Contrafund Portfolio Investor Class (a) | | 7,557 | $241,292 |
| VIP Equity-Income Portfolio Investor Class (a) | | 12,497 | 253,181 |
| VIP Growth & Income Portfolio Investor Class (a) | | 14,954 | 288,609 |
| VIP Growth Portfolio Investor Class (a) | | 3,927 | 246,633 |
| VIP Mid Cap Portfolio Investor Class (a) | | 2,338 | 70,167 |
| VIP Value Portfolio Investor Class (a) | | 14,239 | 185,960 |
| VIP Value Strategies Portfolio Investor Class (a) | | 8,220 | 90,745 |
| TOTAL DOMESTIC EQUITY FUNDS | | | |
| (Cost $1,175,436) | | | 1,376,587 |
|
| International Equity Funds - 10.3% | | | |
| VIP Emerging Markets Portfolio Investor Class (a) | | 56,047 | 555,428 |
| VIP Overseas Portfolio Investor Class (a) | | 36,735 | 700,163 |
| TOTAL INTERNATIONAL EQUITY FUNDS | | | |
| (Cost $1,283,042) | | | 1,255,591 |
|
| Bond Funds - 55.1% | | | |
| Fidelity Inflation-Protected Bond Index Fund Institutional Premium Class (a) | | 157,025 | 1,490,170 |
| Fidelity Long Term Treasury Bond Index Fund (a) | | 52,731 | 668,624 |
| VIP High Income Portfolio Investor Class (a) | | 50,444 | 249,193 |
| VIP Investment Grade Bond Portfolio Investor Class (a) | | 351,257 | 4,316,950 |
| TOTAL BOND FUNDS | | | |
| (Cost $6,859,006) | | | 6,724,937 |
|
| Short-Term Funds - 23.3% | | | |
| VIP Government Money Market Portfolio Investor Class 2.16% (a)(b) | | | |
| (Cost $2,850,429) | | 2,850,429 | 2,850,429 |
| TOTAL INVESTMENT IN SECURITIES - 100.0% | | | |
| (Cost $12,167,913) | | | 12,207,544 |
| NET OTHER ASSETS (LIABILITIES) - 0.0% | | | 1 |
| NET ASSETS - 100% | | | $12,207,545 |
Legend
(a) Affiliated Fund
(b) The rate quoted is the annualized seven-day yield of the fund at period end.
Affiliated Underlying Funds
Fiscal year to date information regarding the Fund's investments in affiliated Underlying Funds, excluding any Money Market Central Funds, is presented below. Exchanges between classes of the same affiliated Underlying Funds may occur.
| Affiliate | Value, beginning of period | Purchases | Sales Proceeds | Dividend Income | Realized Gain (loss) | Change in Unrealized appreciation (depreciation) | Value, end of period |
| Fidelity Inflation-Protected Bond Index Fund Institutional Premium Class | $-- | $40,860 | $29,618 | $29,467 | $(770) | $(48,591) | $1,490,170 |
| Fidelity Inflation-Protected Bond Index Fund Premium Class | -- | 1,548,811 | 20,117 | 1,451 | (405) | -- | -- |
| Fidelity Long Term Treasury Bond Index Fund | -- | 23,674 | 57,747 | 3,504 | (821) | 9,009 | 668,624 |
| Fidelity Long-Term Treasury Bond Index Fund Premium Class | -- | 701,762 | 7,016 | 5,442 | (237) | -- | -- |
| VIP Contrafund Portfolio Investor Class | 357,908 | 57,023 | 132,966 | 29,907 | 15,050 | (55,723) | 241,292 |
| VIP Emerging Markets Portfolio Investor Class | 157,262 | 515,832 | 47,264 | 3,208 | 6,931 | (77,333) | 555,428 |
| VIP Equity-Income Portfolio Investor Class | 376,040 | 61,730 | 141,873 | 21,410 | (9,645) | (33,071) | 253,181 |
| VIP Government Money Market Portfolio Investor Class 2.16% | 2,031,025 | 1,081,302 | 261,898 | 38,656 | -- | -- | 2,850,429 |
| VIP Growth & Income Portfolio Investor Class | 436,501 | 64,324 | 166,063 | 23,123 | 43,654 | (89,807) | 288,609 |
| VIP Growth Portfolio Investor Class | 364,765 | 72,775 | 154,834 | 47,775 | 53,242 | (89,315) | 246,633 |
| VIP High Income Portfolio Investor Class | 676,798 | 72,117 | 474,491 | 18,278 | (54,632) | 29,401 | 249,193 |
| VIP Investment Grade Bond Portfolio Investor Class | 8,169,760 | 406,948 | 4,007,353 | 171,038 | (132,310) | (120,095) | 4,316,950 |
| VIP Mid Cap Portfolio Investor Class | 105,369 | 19,518 | 36,624 | 8,456 | 3,841 | (21,937) | 70,167 |
| VIP Overseas Portfolio Investor Class | 600,411 | 321,712 | 102,945 | 11,482 | 7,025 | (126,040) | 700,163 |
| VIP Value Portfolio Investor Class | 277,982 | 47,382 | 97,519 | 15,208 | 12,085 | (53,970) | 185,960 |
| VIP Value Strategies Portfolio Investor Class | 136,359 | 22,715 | 44,959 | 6,122 | 1,963 | (25,333) | 90,745 |
| | $13,690,180 | $5,058,485 | $5,783,287 | $434,527 | $(55,029) | $(702,805) | $12,207,544 |
Amounts in the income column in the above table include any capital gain distributions from underlying funds, which are presented in the corresponding line-item in the Statement of Operations if applicable.
Investment Valuation
All investments are categorized as Level 1 under the Fair Value Hierarchy. The inputs or methodology used for valuing securities may not be an indication of the risk associated with investing in those securities. For more information on valuation inputs please refer to the Investment Valuation section in the accompanying Notes to Financial Statements.
See accompanying notes which are an integral part of the financial statements.
VIP Freedom Lifetime Income® I Portfolio
Financial Statements
Statement of Assets and Liabilities
| | | December 31, 2018 |
| Assets | | |
Investment in securities, at value — See accompanying schedule:
| | |
| Affiliated issuers (cost $12,167,913) | $12,207,544 | |
| Total Investment in Securities (cost $12,167,913) | | $12,207,544 |
| Receivable for investments sold | | 168,596 |
| Total assets | | 12,376,140 |
| Liabilities | | |
| Payable for investments purchased | $167,995 | |
| Payable for fund shares redeemed | 600 | |
| Total liabilities | | 168,595 |
| Net Assets | | $12,207,545 |
| Net Assets consist of: | | |
| Paid in capital | | $12,060,295 |
| Total distributable earnings (loss) | | 147,250 |
| Net Assets, for 1,154,771 shares outstanding | | $12,207,545 |
| Net Asset Value, offering price and redemption price per share ($12,207,545 ÷ 1,154,771 shares) | | $10.57 |
See accompanying notes which are an integral part of the financial statements.
Statement of Operations
| | | Year ended December 31, 2018 |
| Investment Income | | |
| Dividends: | | |
| Affiliated issuers | | $217,688 |
| Expenses | | |
| Independent trustees' fees and expenses | $73 | |
| Total expenses | | 73 |
| Net investment income (loss) | | 217,615 |
| Realized and Unrealized Gain (Loss) | | |
| Net realized gain (loss) on: | | |
| Investment securities: | | |
| Affiliated issuers | (55,029) | |
| Capital gain distributions from underlying funds: | | |
| Affiliated issuers | 216,839 | |
| Total net realized gain (loss) | | 161,810 |
| Change in net unrealized appreciation (depreciation) on: | | |
| Investment securities: | | |
| Affiliated issuers | (702,805) | |
| Total change in net unrealized appreciation (depreciation) | | (702,805) |
| Net gain (loss) | | (540,995) |
| Net increase (decrease) in net assets resulting from operations | | $(323,380) |
See accompanying notes which are an integral part of the financial statements.
Statement of Changes in Net Assets
| | Year ended December 31, 2018 | Year ended December 31, 2017 |
| Increase (Decrease) in Net Assets | | |
| Operations | | |
| Net investment income (loss) | $217,615 | $274,731 |
| Net realized gain (loss) | 161,810 | 254,637 |
| Change in net unrealized appreciation (depreciation) | (702,805) | 500,520 |
| Net increase (decrease) in net assets resulting from operations | (323,380) | 1,029,888 |
| Distributions to shareholders | (407,480) | – |
| Distributions to shareholders from net investment income | – | (273,176) |
| Distributions to shareholders from net realized gain | – | (170,356) |
| Total distributions | (407,480) | (443,532) |
| Share transactions | | |
| Proceeds from sales of shares | 122,823 | 112,904 |
| Reinvestment of distributions | 407,480 | 443,532 |
| Cost of shares redeemed | (1,282,198) | (1,630,553) |
| Net increase (decrease) in net assets resulting from share transactions | (751,895) | (1,074,117) |
| Total increase (decrease) in net assets | (1,482,755) | (487,761) |
| Net Assets | | |
| Beginning of period | 13,690,300 | 14,178,061 |
| End of period | $12,207,545 | $13,690,300 |
| Other Information | | |
| Undistributed net investment income end of period | | $1,555 |
| Shares | | |
| Sold | 11,285 | 9,946 |
| Issued in reinvestment of distributions | 38,126 | 40,052 |
| Redeemed | (116,115) | (146,477) |
| Net increase (decrease) | (66,704) | (96,479) |
See accompanying notes which are an integral part of the financial statements.
Financial Highlights
VIP Freedom Lifetime Income I Portfolio
| | | | | | |
| Years ended December 31, | 2018 | 2017 | 2016 | 2015 | 2014 |
| Selected Per–Share Data | | | | | |
| Net asset value, beginning of period | $11.21 | $10.76 | $10.65 | $11.01 | $10.95 |
| Income from Investment Operations | | | | | |
| Net investment income (loss)A | .19 | .22 | .21 | .23 | .21 |
| Net realized and unrealized gain (loss) | (.48) | .59 | .31 | (.27) | .29 |
| Total from investment operations | (.29) | .81 | .52 | (.04) | .50 |
| Distributions from net investment income | (.19) | (.23) | (.21) | (.24) | (.20) |
| Distributions from net realized gain | (.17) | (.13) | (.20) | (.09) | (.25) |
| Total distributions | (.35)B | (.36) | (.41) | (.32)C | (.44)D |
| Net asset value, end of period | $10.57 | $11.21 | $10.76 | $10.65 | $11.01 |
| Total ReturnE,F | (2.58)% | 7.62% | 5.05% | (.35)% | 4.68% |
| Ratios to Average Net AssetsG | | | | | |
| Expenses before reductionsH | -% | -% | -% | -% | -% |
| Expenses net of fee waivers, if any | - %H | -% | -% | -% | -% |
| Expenses net of all reductions | - %H | -% | -% | -% | -% |
| Net investment income (loss) | 1.69% | 1.97% | 1.90% | 2.05% | 1.89% |
| Supplemental Data | | | | | |
| Net assets, end of period (000 omitted) | $12,208 | $13,690 | $14,178 | $13,635 | $14,663 |
| Portfolio turnover rateI | 39% | 9% | 18% | 12% | 12% |
A Calculated based on average shares outstanding during the period.
B Total distributions of $.35 per share is comprised of distributions from net investment income of $.186 and distributions from net realized gain of $.166 per share.
C Total distributions of $.32 per share is comprised of distributions from net investment income of $.235 and distributions from net realized gain of $.088 per share.
D Total distributions of $.44 per share is comprised of distributions from net investment income of $.196 and distributions from net realized gain of $.248 per share.
E Total returns do not reflect charges attributable to your insurance company's separate account. Inclusion of these charges would reduce the total returns shown.
F Total returns would have been lower if certain expenses had not been reduced during the applicable periods shown.
G Expense ratios reflect operating expenses of the Fund. Expenses before reductions do not reflect amounts reimbursed by the investment adviser or reductions from expense offset arrangements and do not represent the amount paid by the Fund during periods when reimbursements or reductions occur. Expenses net of fee waivers reflect expenses after reimbursement by the investment adviser but prior to reductions from expense offset arrangements. Expenses net of all reductions represent the net expenses paid by the Fund but do not include expenses of the underlying funds in which the Fund invests.
H Amount represents less than .005%.
I Amount does not include the portfolio activity of any Underlying Funds.
See accompanying notes which are an integral part of the financial statements.
VIP Freedom Lifetime Income® II Portfolio
Investment Summary (Unaudited)
The information in the following tables is based on the direct investments of the Fund.
Top Holdings as of December 31, 2018
| | % of fund's net assets |
| VIP Investment Grade Bond Portfolio Investor Class | 28.7 |
| VIP Government Money Market Portfolio Investor Class 2.16% | 14.7 |
| VIP Overseas Portfolio Investor Class | 9.7 |
| Fidelity Inflation-Protected Bond Index Fund Institutional Premium Class | 9.1 |
| VIP Emerging Markets Portfolio Investor Class | 6.4 |
| Fidelity Long Term Treasury Bond Index Fund | 5.5 |
| VIP Growth & Income Portfolio Investor Class | 5.0 |
| VIP Equity-Income Portfolio Investor Class | 4.4 |
| VIP Growth Portfolio Investor Class | 4.3 |
| VIP Contrafund Portfolio Investor Class | 4.2 |
| | 92.0 |
Asset Allocation (% of fund's net assets)
| Period end |
| | Domestic Equity Funds | 23.8% |
| | International Equity Funds | 16.1% |
| | Bond Funds | 45.4% |
| | Short-Term Funds | 14.7% |

VIP Freedom Lifetime Income® II Portfolio
Schedule of Investments December 31, 2018
Showing Percentage of Net Assets
| Domestic Equity Funds - 23.8% | | | |
| | | Shares | Value |
| VIP Contrafund Portfolio Investor Class (a) | | 40,640 | $1,297,650 |
| VIP Equity-Income Portfolio Investor Class (a) | | 67,206 | 1,361,598 |
| VIP Growth & Income Portfolio Investor Class (a) | | 80,426 | 1,552,214 |
| VIP Growth Portfolio Investor Class (a) | | 21,117 | 1,326,379 |
| VIP Mid Cap Portfolio Investor Class (a) | | 12,557 | 376,845 |
| VIP Value Portfolio Investor Class (a) | | 76,563 | 999,910 |
| VIP Value Strategies Portfolio Investor Class (a) | | 44,164 | 487,570 |
| TOTAL DOMESTIC EQUITY FUNDS | | | |
| (Cost $6,602,071) | | | 7,402,166 |
|
| International Equity Funds - 16.1% | | | |
| VIP Emerging Markets Portfolio Investor Class (a) | | 200,843 | 1,990,354 |
| VIP Overseas Portfolio Investor Class (a) | | 157,934 | 3,010,218 |
| TOTAL INTERNATIONAL EQUITY FUNDS | | | |
| (Cost $4,965,904) | | | 5,000,572 |
|
| Bond Funds - 45.4% | | | |
| Fidelity Inflation-Protected Bond Index Fund Institutional Premium Class (a) | | 297,454 | 2,822,838 |
| Fidelity Long Term Treasury Bond Index Fund (a) | | 135,165 | 1,713,886 |
| VIP High Income Portfolio Investor Class (a) | | 129,779 | 641,108 |
| VIP Investment Grade Bond Portfolio Investor Class (a) | | 726,049 | 8,923,139 |
| TOTAL BOND FUNDS | | | |
| (Cost $14,402,042) | | | 14,100,971 |
|
| Short-Term Funds - 14.7% | | | |
| VIP Government Money Market Portfolio Investor Class 2.16% (a)(b) | | | |
| (Cost $4,556,649) | | 4,556,649 | 4,556,649 |
| TOTAL INVESTMENT IN SECURITIES - 100.0% | | | |
| (Cost $30,526,666) | | | 31,060,358 |
| NET OTHER ASSETS (LIABILITIES) - 0.0% | | | 0 |
| NET ASSETS - 100% | | | $31,060,358 |
Legend
(a) Affiliated Fund
(b) The rate quoted is the annualized seven-day yield of the fund at period end.
Affiliated Underlying Funds
Fiscal year to date information regarding the Fund's investments in affiliated Underlying Funds, excluding any Money Market Central Funds, is presented below. Exchanges between classes of the same affiliated Underlying Funds may occur.
| Affiliate | Value, beginning of period | Purchases | Sales Proceeds | Dividend Income | Realized Gain (loss) | Change in Unrealized appreciation (depreciation) | Value, end of period |
| Fidelity Inflation-Protected Bond Index Fund Institutional Premium Class | $-- | $84,182 | $99,689 | $56,723 | $(3,191) | $(91,930) | $2,822,838 |
| Fidelity Inflation-Protected Bond Index Fund Premium Class | -- | 3,030,463 | 94,780 | 2,882 | (2,217) | -- | -- |
| Fidelity Long Term Treasury Bond Index Fund | -- | 64,942 | 175,835 | 9,119 | (2,144) | 15,296 | 1,713,886 |
| Fidelity Long-Term Treasury Bond Index Fund Premium Class | -- | 1,831,914 | 19,542 | 14,953 | (745) | -- | -- |
| VIP Contrafund Portfolio Investor Class | 2,033,226 | 322,753 | 839,828 | 175,405 | 86,391 | (304,892) | 1,297,650 |
| VIP Emerging Markets Portfolio Investor Class | 880,044 | 1,641,334 | 239,906 | 11,980 | 27,333 | (318,451) | 1,990,354 |
| VIP Equity-Income Portfolio Investor Class | 2,136,266 | 308,286 | 848,343 | 123,475 | (63,189) | (171,422) | 1,361,598 |
| VIP Government Money Market Portfolio Investor Class 2.16% | 4,169,506 | 1,040,349 | 653,206 | 74,525 | -- | -- | 4,556,649 |
| VIP Growth & Income Portfolio Investor Class | 2,479,792 | 331,446 | 1,008,738 | 135,522 | 191,794 | (442,080) | 1,552,214 |
| VIP Growth Portfolio Investor Class | 2,071,970 | 422,623 | 974,389 | 280,973 | 242,945 | (436,770) | 1,326,379 |
| VIP High Income Portfolio Investor Class | 1,707,134 | 216,676 | 1,219,682 | 47,279 | (138,334) | 75,314 | 641,108 |
| VIP Investment Grade Bond Portfolio Investor Class | 13,027,669 | 1,124,277 | 4,790,957 | 321,722 | (168,797) | (269,053) | 8,923,139 |
| VIP Mid Cap Portfolio Investor Class | 598,516 | 98,897 | 220,373 | 49,605 | 20,574 | (120,769) | 376,845 |
| VIP Overseas Portfolio Investor Class | 3,359,858 | 650,824 | 459,918 | 50,412 | 9,289 | (549,835) | 3,010,218 |
| VIP Value Portfolio Investor Class | 1,579,165 | 238,742 | 589,756 | 86,704 | 46,971 | (275,212) | 999,910 |
| VIP Value Strategies Portfolio Investor Class | 774,587 | 107,895 | 266,129 | 35,054 | 6,158 | (134,941) | 487,570 |
| | $34,817,733 | $11,515,603 | $12,501,071 | $1,476,333 | $252,838 | $(3,024,745) | $31,060,358 |
Amounts in the income column in the above table include any capital gain distributions from underlying funds, which are presented in the corresponding line-item in the Statement of Operations if applicable.
Investment Valuation
All investments are categorized as Level 1 under the Fair Value Hierarchy. The inputs or methodology used for valuing securities may not be an indication of the risk associated with investing in those securities. For more information on valuation inputs please refer to the Investment Valuation section in the accompanying Notes to Financial Statements.
See accompanying notes which are an integral part of the financial statements.
VIP Freedom Lifetime Income® II Portfolio
Financial Statements
Statement of Assets and Liabilities
| | | December 31, 2018 |
| Assets | | |
Investment in securities, at value — See accompanying schedule:
| | |
| Affiliated issuers (cost $30,526,666) | $31,060,358 | |
| Total Investment in Securities (cost $30,526,666) | | $31,060,358 |
| Cash | | 4 |
| Receivable for investments sold | | 631,027 |
| Total assets | | 31,691,389 |
| Liabilities | | |
| Payable for investments purchased | $629,499 | |
| Payable for fund shares redeemed | 1,532 | |
| Total liabilities | | 631,031 |
| Net Assets | | $31,060,358 |
| Net Assets consist of: | | |
| Paid in capital | | $29,518,377 |
| Total distributable earnings (loss) | | 1,541,981 |
| Net Assets, for 2,637,054 shares outstanding | | $31,060,358 |
| Net Asset Value, offering price and redemption price per share ($31,060,358 ÷ 2,637,054 shares) | | $11.78 |
See accompanying notes which are an integral part of the financial statements.
Statement of Operations
| | | Year ended December 31, 2018 |
| Investment Income | | |
| Dividends: | | |
| Affiliated issuers | | $524,925 |
| Expenses | | |
| Independent trustees' fees and expenses | $188 | |
| Total expenses | | 188 |
| Net investment income (loss) | | 524,737 |
| Realized and Unrealized Gain (Loss) | | |
| Net realized gain (loss) on: | | |
| Investment securities: | | |
| Affiliated issuers | 252,838 | |
| Capital gain distributions from underlying funds: | | |
| Affiliated issuers | 951,408 | |
| Total net realized gain (loss) | | 1,204,246 |
| Change in net unrealized appreciation (depreciation) on: | | |
| Investment securities: | | |
| Affiliated issuers | (3,024,745) | |
| Total change in net unrealized appreciation (depreciation) | | (3,024,745) |
| Net gain (loss) | | (1,820,499) |
| Net increase (decrease) in net assets resulting from operations | | $(1,295,762) |
See accompanying notes which are an integral part of the financial statements.
Statement of Changes in Net Assets
| | Year ended December 31, 2018 | Year ended December 31, 2017 |
| Increase (Decrease) in Net Assets | | |
| Operations | | |
| Net investment income (loss) | $524,737 | $594,293 |
| Net realized gain (loss) | 1,204,246 | 827,617 |
| Change in net unrealized appreciation (depreciation) | (3,024,745) | 2,630,906 |
| Net increase (decrease) in net assets resulting from operations | (1,295,762) | 4,052,816 |
| Distributions to shareholders | (1,113,788) | – |
| Distributions to shareholders from net investment income | – | (591,734) |
| Distributions to shareholders from net realized gain | – | (628,990) |
| Total distributions | (1,113,788) | (1,220,724) |
| Share transactions | | |
| Proceeds from sales of shares | 129,007 | 1,177,281 |
| Reinvestment of distributions | 1,113,788 | 1,220,724 |
| Cost of shares redeemed | (2,590,868) | (4,308,811) |
| Net increase (decrease) in net assets resulting from share transactions | (1,348,073) | (1,910,806) |
| Total increase (decrease) in net assets | (3,757,623) | 921,286 |
| Net Assets | | |
| Beginning of period | 34,817,981 | 33,896,695 |
| End of period | $31,060,358 | $34,817,981 |
| Other Information | | |
| Undistributed net investment income end of period | | $2,558 |
| Shares | | |
| Sold | 10,479 | 97,365 |
| Issued in reinvestment of distributions | 92,701 | 98,613 |
| Redeemed | (206,903) | (348,172) |
| Net increase (decrease) | (103,723) | (152,194) |
See accompanying notes which are an integral part of the financial statements.
Financial Highlights
VIP Freedom Lifetime Income II Portfolio
| | | | | | |
| Years ended December 31, | 2018 | 2017 | 2016 | 2015 | 2014 |
| Selected Per–Share Data | | | | | |
| Net asset value, beginning of period | $12.70 | $11.72 | $11.47 | $11.76 | $11.43 |
| Income from Investment Operations | | | | | |
| Net investment income (loss)A | .20 | .21 | .21 | .24 | .23 |
| Net realized and unrealized gain (loss) | (.70) | 1.22 | .44 | (.27) | .35 |
| Total from investment operations | (.50) | 1.43 | .65 | (.03) | .58 |
| Distributions from net investment income | (.20) | (.22) | (.20) | (.24) | (.21) |
| Distributions from net realized gain | (.22) | (.23) | (.20) | (.03) | (.04) |
| Total distributions | (.42) | (.45) | (.40) | (.26)B | (.25) |
| Net asset value, end of period | $11.78 | $12.70 | $11.72 | $11.47 | $11.76 |
| Total ReturnC,D | (3.96)% | 12.29% | 5.90% | (.23)% | 5.06% |
| Ratios to Average Net AssetsE | | | | | |
| Expenses before reductionsF | -% | -% | -% | -% | -% |
| Expenses net of fee waivers, if any | - %F | -% | -% | -% | -% |
| Expenses net of all reductions | - %F | -% | -% | -% | -% |
| Net investment income (loss) | 1.57% | 1.71% | 1.84% | 2.06% | 1.97% |
| Supplemental Data | | | | | |
| Net assets, end of period (000 omitted) | $31,060 | $34,818 | $33,897 | $30,348 | $29,531 |
| Portfolio turnover rateG | 34% | 12% | 16% | 14% | 9% |
A Calculated based on average shares outstanding during the period.
B Total distributions of $.26 per share is comprised of distributions from net investment income of $.238 and distributions from net realized gain of $.026 per share.
C Total returns do not reflect charges attributable to your insurance company's separate account. Inclusion of these charges would reduce the total returns shown.
D Total returns would have been lower if certain expenses had not been reduced during the applicable periods shown.
E Expense ratios reflect operating expenses of the Fund. Expenses before reductions do not reflect amounts reimbursed by the investment adviser or reductions from expense offset arrangements and do not represent the amount paid by the Fund during periods when reimbursements or reductions occur. Expenses net of fee waivers reflect expenses after reimbursement by the investment adviser but prior to reductions from expense offset arrangements. Expenses net of all reductions represent the net expenses paid by the Fund but do not include expenses of the underlying funds in which the Fund invests.
F Amount represents less than .005%.
G Amount does not include the portfolio activity of any Underlying Funds.
See accompanying notes which are an integral part of the financial statements.
VIP Freedom Lifetime Income® III Portfolio
Investment Summary (Unaudited)
The information in the following tables is based on the direct investments of the Fund.
Top Holdings as of December 31, 2018
| | % of fund's net assets |
| VIP Investment Grade Bond Portfolio Investor Class | 22.7 |
| VIP Overseas Portfolio Investor Class | 13.2 |
| VIP Emerging Markets Portfolio Investor Class | 7.7 |
| VIP Government Money Market Portfolio Investor Class 2.16% | 7.4 |
| VIP Growth & Income Portfolio Investor Class | 7.3 |
| Fidelity Inflation-Protected Bond Index Fund Institutional Premium Class | 6.8 |
| VIP Equity-Income Portfolio Investor Class | 6.4 |
| VIP Growth Portfolio Investor Class | 6.3 |
| VIP Contrafund Portfolio Investor Class | 6.1 |
| Fidelity Long Term Treasury Bond Index Fund | 5.2 |
| | 89.1 |
Asset Allocation (% of fund's net assets)
| Period end |
| | Domestic Equity Funds | 34.9% |
| | International Equity Funds | 20.9% |
| | Bond Funds | 36.8% |
| | Short-Term Funds | 7.4% |

VIP Freedom Lifetime Income® III Portfolio
Schedule of Investments December 31, 2018
Showing Percentage of Net Assets
| Domestic Equity Funds - 34.9% | | | |
| | | Shares | Value |
| VIP Contrafund Portfolio Investor Class (a) | | 54,592 | $1,743,110 |
| VIP Equity-Income Portfolio Investor Class (a) | | 90,279 | 1,829,047 |
| VIP Growth & Income Portfolio Investor Class (a) | | 108,044 | 2,085,255 |
| VIP Growth Portfolio Investor Class (a) | | 28,367 | 1,781,720 |
| VIP Mid Cap Portfolio Investor Class (a) | | 16,839 | 505,352 |
| VIP Value Portfolio Investor Class (a) | | 102,824 | 1,342,879 |
| VIP Value Strategies Portfolio Investor Class (a) | | 59,256 | 654,186 |
| TOTAL DOMESTIC EQUITY FUNDS | | | |
| (Cost $9,186,555) | | | 9,941,549 |
|
| International Equity Funds - 20.9% | | | |
| VIP Emerging Markets Portfolio Investor Class (a) | | 220,440 | 2,184,562 |
| VIP Overseas Portfolio Investor Class (a) | | 197,164 | 3,757,947 |
| TOTAL INTERNATIONAL EQUITY FUNDS | | | |
| (Cost $5,883,780) | | | 5,942,509 |
|
| Bond Funds - 36.8% | | | |
| Fidelity Inflation-Protected Bond Index Fund Institutional Premium Class (a) | | 206,019 | 1,955,119 |
| Fidelity Long Term Treasury Bond Index Fund (a) | | 117,050 | 1,484,199 |
| VIP High Income Portfolio Investor Class (a) | | 120,062 | 593,106 |
| VIP Investment Grade Bond Portfolio Investor Class (a) | | 525,173 | 6,454,380 |
| TOTAL BOND FUNDS | | | |
| (Cost $10,724,122) | | | 10,486,804 |
|
| Short-Term Funds - 7.4% | | | |
| VIP Government Money Market Portfolio Investor Class 2.16% (a)(b) | | | |
| (Cost $2,097,777) | | 2,097,777 | 2,097,777 |
| TOTAL INVESTMENT IN SECURITIES - 100.0% | | | |
| (Cost $27,892,234) | | | 28,468,639 |
| NET OTHER ASSETS (LIABILITIES) - 0.0% | | | (3) |
| NET ASSETS - 100% | | | $28,468,636 |
Legend
(a) Affiliated Fund
(b) The rate quoted is the annualized seven-day yield of the fund at period end.
Affiliated Underlying Funds
Fiscal year to date information regarding the Fund's investments in affiliated Underlying Funds, excluding any Money Market Central Funds, is presented below. Exchanges between classes of the same affiliated Underlying Funds may occur.
| Affiliate | Value, beginning of period | Purchases | Sales Proceeds | Dividend Income | Realized Gain (loss) | Change in Unrealized appreciation (depreciation) | Value, end of period |
| Fidelity Inflation-Protected Bond Index Fund Institutional Premium Class | $-- | $42,744 | $120,835 | $39,885 | $(3,854) | $(64,347) | $1,955,119 |
| Fidelity Inflation-Protected Bond Index Fund Premium Class | -- | 2,141,501 | 39,188 | 2,088 | (902) | -- | -- |
| Fidelity Long Term Treasury Bond Index Fund | -- | 44,542 | 184,288 | 8,064 | (1,821) | 8,562 | 1,484,199 |
| Fidelity Long-Term Treasury Bond Index Fund Premium Class | -- | 1,636,429 | 18,334 | 13,492 | (891) | -- | -- |
| VIP Contrafund Portfolio Investor Class | 2,489,286 | 335,951 | 788,501 | 215,648 | 62,507 | (356,133) | 1,743,110 |
| VIP Emerging Markets Portfolio Investor Class | 1,077,469 | 1,678,353 | 239,072 | 13,536 | 36,654 | (368,842) | 2,184,562 |
| VIP Equity-Income Portfolio Investor Class | 2,615,358 | 309,197 | 787,728 | 154,982 | (51,426) | (256,354) | 1,829,047 |
| VIP Government Money Market Portfolio Investor Class 2.16% | 1,093,268 | 1,186,135 | 181,626 | 28,376 | -- | -- | 2,097,777 |
| VIP Growth & Income Portfolio Investor Class | 3,035,821 | 344,299 | 960,869 | 166,766 | 101,787 | (435,783) | 2,085,255 |
| VIP Growth Portfolio Investor Class | 2,536,867 | 462,905 | 954,823 | 344,245 | 143,339 | (406,568) | 1,781,720 |
| VIP High Income Portfolio Investor Class | 2,120,198 | 131,064 | 1,596,439 | 48,743 | (109,720) | 48,003 | 593,106 |
| VIP Investment Grade Bond Portfolio Investor Class | 9,686,654 | 1,289,490 | 4,188,256 | 242,331 | (157,780) | (175,728) | 6,454,380 |
| VIP Mid Cap Portfolio Investor Class | 732,753 | 114,218 | 208,411 | 60,967 | 18,106 | (151,314) | 505,352 |
| VIP Overseas Portfolio Investor Class | 4,113,938 | 863,599 | 530,341 | 63,884 | 22,045 | (711,294) | 3,757,947 |
| VIP Value Portfolio Investor Class | 1,933,329 | 208,294 | 491,441 | 110,369 | 25,857 | (333,160) | 1,342,879 |
| VIP Value Strategies Portfolio Investor Class | 948,299 | 104,423 | 226,466 | 44,394 | (11,133) | (160,937) | 654,186 |
| | $32,383,240 | $10,893,144 | $11,516,618 | $1,557,770 | $72,768 | $(3,363,895) | $28,468,639 |
Amounts in the income column in the above table include any capital gain distributions from underlying funds, which are presented in the corresponding line-item in the Statement of Operations if applicable.
Investment Valuation
All investments are categorized as Level 1 under the Fair Value Hierarchy. The inputs or methodology used for valuing securities may not be an indication of the risk associated with investing in those securities. For more information on valuation inputs please refer to the Investment Valuation section in the accompanying Notes to Financial Statements.
See accompanying notes which are an integral part of the financial statements.
VIP Freedom Lifetime Income® III Portfolio
Financial Statements
Statement of Assets and Liabilities
| | | December 31, 2018 |
| Assets | | |
Investment in securities, at value — See accompanying schedule:
| | |
| Affiliated issuers (cost $27,892,234) | $28,468,639 | |
| Total Investment in Securities (cost $27,892,234) | | $28,468,639 |
| Cash | | 2 |
| Receivable for investments sold | | 639,972 |
| Total assets | | 29,108,613 |
| Liabilities | | |
| Payable for investments purchased | $638,573 | |
| Payable for fund shares redeemed | 1,404 | |
| Total liabilities | | 639,977 |
| Net Assets | | $28,468,636 |
| Net Assets consist of: | | |
| Paid in capital | | $26,907,869 |
| Total distributable earnings (loss) | | 1,560,767 |
| Net Assets, for 2,394,941 shares outstanding | | $28,468,636 |
| Net Asset Value, offering price and redemption price per share ($28,468,636 ÷ 2,394,941 shares) | | $11.89 |
See accompanying notes which are an integral part of the financial statements.
Statement of Operations
| | | Year ended December 31, 2018 |
| Investment Income | | |
| Dividends: | | |
| Affiliated issuers | | $451,837 |
| Expenses | | |
| Independent trustees' fees and expenses | $175 | |
| Total expenses | | 175 |
| Net investment income (loss) | | 451,662 |
| Realized and Unrealized Gain (Loss) | | |
| Net realized gain (loss) on: | | |
| Investment securities: | | |
| Affiliated issuers | 72,768 | |
| Capital gain distributions from underlying funds: | | |
| Affiliated issuers | 1,105,933 | |
| Total net realized gain (loss) | | 1,178,701 |
| Change in net unrealized appreciation (depreciation) on: | | |
| Investment securities: | | |
| Affiliated issuers | (3,363,895) | |
| Total change in net unrealized appreciation (depreciation) | | (3,363,895) |
| Net gain (loss) | | (2,185,194) |
| Net increase (decrease) in net assets resulting from operations | | $(1,733,532) |
See accompanying notes which are an integral part of the financial statements.
Statement of Changes in Net Assets
| | Year ended December 31, 2018 | Year ended December 31, 2017 |
| Increase (Decrease) in Net Assets | | |
| Operations | | |
| Net investment income (loss) | $451,662 | $544,485 |
| Net realized gain (loss) | 1,178,701 | 895,739 |
| Change in net unrealized appreciation (depreciation) | (3,363,895) | 3,124,101 |
| Net increase (decrease) in net assets resulting from operations | (1,733,532) | 4,564,325 |
| Distributions to shareholders | (1,072,881) | – |
| Distributions to shareholders from net investment income | – | (543,806) |
| Distributions to shareholders from net realized gain | – | (812,703) |
| Total distributions | (1,072,881) | (1,356,509) |
| Share transactions | | |
| Proceeds from sales of shares | 37,402 | 1,985,174 |
| Reinvestment of distributions | 1,072,881 | 1,356,509 |
| Cost of shares redeemed | (2,218,539) | (2,247,094) |
| Net increase (decrease) in net assets resulting from share transactions | (1,108,256) | 1,094,589 |
| Total increase (decrease) in net assets | (3,914,669) | 4,302,405 |
| Net Assets | | |
| Beginning of period | 32,383,305 | 28,080,900 |
| End of period | $28,468,636 | $32,383,305 |
| Other Information | | |
| Undistributed net investment income end of period | | $1 |
| Shares | | |
| Sold | 2,966 | 164,920 |
| Issued in reinvestment of distributions | 87,419 | 108,141 |
| Redeemed | (172,271) | (177,878) |
| Net increase (decrease) | (81,886) | 95,183 |
See accompanying notes which are an integral part of the financial statements.
Financial Highlights
VIP Freedom Lifetime Income III Portfolio
| | | | | | |
| Years ended December 31, | 2018 | 2017 | 2016 | 2015 | 2014 |
| Selected Per–Share Data | | | | | |
| Net asset value, beginning of period | $13.07 | $11.79 | $11.59 | $11.91 | $11.74 |
| Income from Investment Operations | | | | | |
| Net investment income (loss)A | .19 | .22 | .23 | .27 | .25 |
| Net realized and unrealized gain (loss) | (.92) | 1.62 | .51 | (.30) | .37 |
| Total from investment operations | (.73) | 1.84 | .74 | (.03) | .62 |
| Distributions from net investment income | (.19) | (.23) | (.21) | (.24) | (.22) |
| Distributions from net realized gain | (.26) | (.33) | (.33) | (.05) | (.23) |
| Total distributions | (.45) | (.56) | (.54) | (.29) | (.45) |
| Net asset value, end of period | $11.89 | $13.07 | $11.79 | $11.59 | $11.91 |
| Total ReturnB,C | (5.68)% | 15.85% | 6.83% | (.27)% | 5.30% |
| Ratios to Average Net AssetsD | | | | | |
| Expenses before reductionsE | -% | -% | -% | -% | -% |
| Expenses net of fee waivers, if any | - %E | -% | -% | -% | -% |
| Expenses net of all reductions | - %E | -% | -% | -% | -% |
| Net investment income (loss) | 1.45% | 1.74% | 1.95% | 2.23% | 2.07% |
| Supplemental Data | | | | | |
| Net assets, end of period (000 omitted) | $28,469 | $32,383 | $28,081 | $21,180 | $17,037 |
| Portfolio turnover rateF | 35% | 15% | 15% | 12% | 18% |
A Calculated based on average shares outstanding during the period.
B Total returns do not reflect charges attributable to your insurance company's separate account. Inclusion of these charges would reduce the total returns shown.
C Total returns would have been lower if certain expenses had not been reduced during the applicable periods shown.
D Expense ratios reflect operating expenses of the Fund. Expenses before reductions do not reflect amounts reimbursed by the investment adviser or reductions from expense offset arrangements and do not represent the amount paid by the Fund during periods when reimbursements or reductions occur. Expenses net of fee waivers reflect expenses after reimbursement by the investment adviser but prior to reductions from expense offset arrangements. Expenses net of all reductions represent the net expenses paid by the Fund but do not include expenses of the underlying funds in which the Fund invests.
E Amount represents less than .005%.
F Amount does not include the portfolio activity of any Underlying Funds.
See accompanying notes which are an integral part of the financial statements.
Notes to Financial Statements
For the period ended December 31, 2018
1. Organization.
VIP Freedom Lifetime Income I Portfolio, VIP Freedom Lifetime Income II Portfolio, and VIP Freedom Lifetime Income III Portfolio (the Funds) are funds of Variable Insurance Products Fund V (the Trust). The Trust is registered under the Investment Company Act of 1940, as amended (the 1940 Act), as an open-end management investment company organized as a Massachusetts business trust. Each Fund is authorized to issue an unlimited number of shares. The Funds invest primarily in a combination of other VIP equity, bond, and short-term funds (the Underlying Funds) managed by Fidelity Management & Research Company (FMR). Shares of each Fund may only be purchased by insurance companies for the purpose of funding variable annuity or variable life insurance contracts.
2. Significant Accounting Policies.
Each Fund is an investment company and applies the accounting and reporting guidance of the Financial Accounting Standards Board (FASB) Accounting Standards Codification Topic 946 Financial Services – Investments Companies. The financial statements have been prepared in conformity with accounting principles generally accepted in the United States of America (GAAP), which require management to make certain estimates and assumptions at the date of the financial statements. Actual results could differ from those estimates. Subsequent events, if any, through the date that the financial statements were issued have been evaluated in the preparation of the financial statements. The following summarizes the significant accounting policies of the Funds:
Investment Valuation. Investments are valued as of 4:00 p.m. Eastern time on the last calendar day of the period. Each Fund categorizes the inputs to valuation techniques used to value its investments into a disclosure hierarchy consisting of three levels as shown below:
- Level 1 – quoted prices in active markets for identical investments
- Level 2 – other significant observable inputs (including quoted prices for similar investments, interest rates, prepayment speeds, etc.)
- Level 3 – unobservable inputs (including the Fund's own assumptions based on the best information available)
Valuation techniques used to value each Fund's investments by major category are as follows. Investments in the Underlying Funds are valued at their closing net asset value (NAV) each business day and are categorized as Level 1 in the hierarchy.
Investment Transactions and Income. For financial reporting purposes, the Funds' investment holdings and NAV include trades executed through the end of the last business day of the period. The NAV per share for processing shareholder transactions is calculated as of the close of business of the New York Stock Exchange (NYSE), normally 4:00 p.m. Eastern time and includes trades executed through the end of the prior business day. Gains and losses on securities sold are determined on the basis of identified cost. Income and capital gain distributions from the Underlying Funds, if any, are recorded on the ex-dividend date.
Expenses. Expenses directly attributable to a fund are charged to that fund. Expenses attributable to more than one fund are allocated among the respective funds on the basis of relative net assets or other appropriate methods. Expenses included in the accompanying financial statements reflect the expenses of each Fund and do not include any expenses associated with the Underlying Funds. Although not included in each Fund's expenses, each Fund indirectly bears its proportionate share of the Underlying Funds' expenses through the impact of these expenses on each Underlying Fund's NAV. Expense estimates are accrued in the period to which they relate and adjustments are made when actual amounts are known.
Income Tax Information and Distributions to Shareholders. Each year, each Fund intends to qualify as a regulated investment company under Subchapter M of the Internal Revenue Code, including distributing substantially all of its taxable income and realized gains. As a result, no provision for U.S. Federal income taxes is required. As of December 31, 2018, each Fund did not have any unrecognized tax benefits in the financial statements; nor is each Fund aware of any tax positions for which it is reasonably possible that the total amounts of unrecognized tax benefits will significantly change in the next twelve months. Each Fund files a U.S. federal tax return, in addition to state and local tax returns as required. Each Fund's federal income tax returns are subject to examination by the Internal Revenue Service (IRS) for a period of three fiscal years after they are filed. State and local tax returns may be subject to examination for an additional fiscal year depending on the jurisdiction.
Distributions are declared and recorded on the ex-dividend date. Income and capital gain distributions are determined in accordance with income tax regulations, which may differ from GAAP.
Capital accounts within the financial statements are adjusted for permanent book-tax differences. These adjustments have no impact on net assets or the results of operations. Capital accounts are not adjusted for temporary book-tax differences which will reverse in a subsequent period.
Book-tax differences are primarily due to the short-term gain distributions from the Underlying Funds and losses deferred due to wash sales.
As of period end, the cost and unrealized appreciation (depreciation) in securities, and derivatives if applicable, for federal income tax purposes were as follows for each Fund:
| | Tax cost | Gross unrealized appreciation | Gross unrealized depreciation | Net unrealized appreciation (depreciation) |
| VIP Freedom Lifetime Income I | $12,192,133 | $294,772 | $(279,361) | $15,411 |
| VIP Freedom Lifetime Income II | 30,608,634 | 1,306,435 | (854,711) | 451,724 |
| VIP Freedom Lifetime Income III | 27,954,192 | 1,390,422 | (875,975) | 514,447 |
The tax-based components of distributable earnings as of period end were as follows for each Fund:
| | Undistributed ordinary income | Undistributed long-term capital gain | Net unrealized appreciation (depreciation) on securities and other investments |
| VIP Freedom Lifetime Income I | $37,098 | $94,741 | $15,411 |
| VIP Freedom Lifetime Income II | 68,859 | 1,021,400 | 451,724 |
| VIP Freedom Lifetime Income III | 45,741 | 1,000,579 | 514,447 |
The tax character of distributions paid was as follows:
| December 31, 2018 | | | |
| | Ordinary Income | Long-term Capital Gains | Total |
| VIP Freedom Lifetime Income I | $230,239 | $177,241 | $407,480 |
| VIP Freedom Lifetime Income II | 602,791 | 510,997 | 1,113,788 |
| VIP Freedom Lifetime Income III | 519,531 | 553,350 | 1,072,881 |
| December 31, 2017 | | | |
| | Ordinary Income | Long-term Capital Gains | Total |
| VIP Freedom Lifetime Income I | $320,892 | $122,640 | $443,532 |
| VIP Freedom Lifetime Income II | 805,936 | 414,788 | 1,220,724 |
| VIP Freedom Lifetime Income III | 785,498 | 571,011 | 1,356,509 |
New Rule Issuance. During August 2018, the U.S. Securities and Exchange Commission issued Final Rule Release No. 33-10532, Disclosure Update and Simplification. This Final Rule includes amendments specific to registered investment companies that are intended to eliminate overlap in disclosure requirements between Regulation S-X and GAAP. In accordance with these amendments, certain line-items in the Funds' financial statements have been combined or removed for the current period as outlined in the table below.
| Financial Statement | Current Line-Item Presentation | Prior Line-Item Presentation |
| Statement of Assets and Liabilities | Total distributable earnings (loss) | Undistributed/Distributions in excess of/Accumulated net investment income (loss)
Accumulated/Undistributed net realized gain (loss)
Net unrealized appreciation (depreciation) |
| Statement of Changes in Net Assets | N/A - removed | Undistributed/Distributions in excess of/Accumulated net investment income (loss) end of period |
| Statement of Changes in Net Assets | Distributions to shareholders | Distributions to shareholders from net investment income
Distributions to shareholders from net realized gain |
3. Purchases and Redemptions of Underlying Fund Shares.
Purchases and redemptions of the Underlying Fund shares are noted in the table below.
| | Purchases ($) | Redemptions ($) |
| VIP Freedom Lifetime Income I | 5,058,485 | 5,783,287 |
| VIP Freedom Lifetime Income II | 11,515,603 | 12,501,071 |
| VIP Freedom Lifetime Income III | 10,893,144 | 11,516,618 |
4. Fees and Other Transactions with Affiliates.
Management Fee. FMR Co., Inc. (the investment adviser), an affiliate of FMR, provides the Funds with investment management related services. The Funds do not pay any fees for these services.
Interfund Trades. The Funds may purchase from or sell securities to other Fidelity Funds under procedures adopted by the Board. The procedures have been designed to ensure these interfund trades are executed in accordance with Rule 17a-7 of the 1940 Act. Interfund trades are included within the respective purchases and sales amounts shown in the Purchases and Sales of Investments note.
5. Other.
The Funds' organizational documents provide former and current trustees and officers with a limited indemnification against liabilities arising in connection with the performance of their duties to the Funds. In the normal course of business, the Funds may also enter into contracts that provide general indemnifications. The Funds' maximum exposure under these arrangements is unknown as this would be dependent on future claims that may be made against the Funds. The risk of material loss from such claims is considered remote.
At the end of the period, the investment adviser or its affiliates were owners of record of all of the outstanding shares of the Funds.
Report of Independent Registered Public Accounting Firm
To the Trustees of Variable Insurance Products Fund V and the Shareholders of VIP Freedom Lifetime Income I Portfolio, VIP Freedom Lifetime Income II Portfolio and VIP Freedom Lifetime Income III Portfolio:
Opinion on the Financial Statements and Financial Highlights
We have audited the accompanying statements of assets and liabilities of VIP Freedom Lifetime Income I Portfolio, VIP Freedom Lifetime Income II Portfolio and VIP Freedom Lifetime Income III Portfolio (the "Funds"), each a fund of Variable Insurance Products Fund V, including the schedules of investments, as of December 31, 2018, and the related statements of operations for the year then ended, the statements of changes in net assets for each of the two years in the period then ended, the financial highlights for each of the five years in the period then ended, and the related notes. In our opinion, the financial statements and financial highlights present fairly, in all material respects, the financial position of each of the Funds as of December 31, 2018, and the results of their operations for the year then ended, the changes in their net assets for each of the two years in the period then ended, and the financial highlights for each of the five years in the period then ended, in conformity with accounting principles generally accepted in the United States of America.
Basis for Opinion
These financial statements and financial highlights are the responsibility of the Funds' management. Our responsibility is to express an opinion on the Funds' financial statements and financial highlights based on our audits. We are a public accounting firm registered with the Public Company Accounting Oversight Board (United States) (PCAOB) and are required to be independent with respect to the Funds in accordance with the U.S. federal securities laws and the applicable rules and regulations of the Securities and Exchange Commission and the PCAOB.
We conducted our audits in accordance with the standards of the PCAOB. Those standards require that we plan and perform the audit to obtain reasonable assurance about whether the financial statements and financial highlights are free of material misstatement, whether due to error or fraud. The Funds are not required to have, nor were we engaged to perform, an audit of their internal control over financial reporting. As part of our audits we are required to obtain an understanding of internal control over financial reporting but not for the purpose of expressing an opinion on the effectiveness of the Funds' internal control over financial reporting. Accordingly, we express no such opinion.
Our audits included performing procedures to assess the risks of material misstatement of the financial statements and financial highlights, whether due to error or fraud, and performing procedures that respond to those risks. Such procedures included examining, on a test basis, evidence regarding the amounts and disclosures in the financial statements and financial highlights. Our audits also included evaluating the accounting principles used and significant estimates made by management, as well as evaluating the overall presentation of the financial statements and financial highlights. Our procedures included confirmation of securities owned as of December 31, 2018, by correspondence with the custodians and brokers. We believe that our audits provide a reasonable basis for our opinion.
/s/ Deloitte & Touche LLP
Boston, Massachusetts
February 15, 2019
We have served as the auditor of one or more of the Fidelity investment companies since 1999.
Trustees and Officers
The Trustees, Members of the Advisory Board (if any), and officers of the trusts and funds, as applicable, are listed below. The Board of Trustees governs each fund and is responsible for protecting the interests of shareholders. The Trustees are experienced executives who meet periodically throughout the year to oversee each fund's activities, review contractual arrangements with companies that provide services to each fund, oversee management of the risks associated with such activities and contractual arrangements, and review each fund's performance. If the interests of a fund and an underlying Fidelity® fund were to diverge, a conflict of interest could arise and affect how the Trustees and Members of the Advisory Board fulfill their fiduciary duties to the affected funds. FMRC has structured the funds to avoid these potential conflicts, although there may be situations where a conflict of interest is unavoidable. In such instances, FMRC, the Trustees, and Members of the Advisory Board would take reasonable steps to minimize and, if possible, eliminate the conflict. Each of the Trustees oversees 260 funds.
The Trustees hold office without limit in time except that (a) any Trustee may resign; (b) any Trustee may be removed by written instrument, signed by at least two-thirds of the number of Trustees prior to such removal; (c) any Trustee who requests to be retired or who has become incapacitated by illness or injury may be retired by written instrument signed by a majority of the other Trustees; and (d) any Trustee may be removed at any special meeting of shareholders by a two-thirds vote of the outstanding voting securities of the trust. Each Trustee who is not an interested person (as defined in the 1940 Act) of the trust and the funds is referred to herein as an Independent Trustee. Each Independent Trustee shall retire not later than the last day of the calendar year in which his or her 75th birthday occurs. The Independent Trustees may waive this mandatory retirement age policy with respect to individual Trustees. Officers and Advisory Board Members hold office without limit in time, except that any officer or Advisory Board Member may resign or may be removed by a vote of a majority of the Trustees at any regular meeting or any special meeting of the Trustees. Except as indicated, each individual has held the office shown or other offices in the same company for the past five years.
Each fund’s Statement of Additional Information (SAI) includes more information about the Trustees. To request a free copy, call Fidelity at 1-877-208-0098.
Experience, Skills, Attributes, and Qualifications of the Trustees. The Governance and Nominating Committee has adopted a statement of policy that describes the experience, qualifications, attributes, and skills that are necessary and desirable for potential Independent Trustee candidates (Statement of Policy). The Board believes that each Trustee satisfied at the time he or she was initially elected or appointed a Trustee, and continues to satisfy, the standards contemplated by the Statement of Policy. The Governance and Nominating Committee also engages professional search firms to help identify potential Independent Trustee candidates who have the experience, qualifications, attributes, and skills consistent with the Statement of Policy. From time to time, additional criteria based on the composition and skills of the current Independent Trustees, as well as experience or skills that may be appropriate in light of future changes to board composition, business conditions, and regulatory or other developments, have also been considered by the professional search firms and the Governance and Nominating Committee. In addition, the Board takes into account the Trustees' commitment and participation in Board and committee meetings, as well as their leadership of standing and ad hoc committees throughout their tenure.
In determining that a particular Trustee was and continues to be qualified to serve as a Trustee, the Board has considered a variety of criteria, none of which, in isolation, was controlling. The Board believes that, collectively, the Trustees have balanced and diverse experience, qualifications, attributes, and skills, which allow the Board to operate effectively in governing each fund and protecting the interests of shareholders. Information about the specific experience, skills, attributes, and qualifications of each Trustee, which in each case led to the Board's conclusion that the Trustee should serve (or continue to serve) as a trustee of the funds, is provided below.
Board Structure and Oversight Function. Abigail P. Johnson is an interested person and currently serves as Chairman. The Trustees have determined that an interested Chairman is appropriate and benefits shareholders because an interested Chairman has a personal and professional stake in the quality and continuity of services provided to the funds. Independent Trustees exercise their informed business judgment to appoint an individual of their choosing to serve as Chairman, regardless of whether the Trustee happens to be independent or a member of management. The Independent Trustees have determined that they can act independently and effectively without having an Independent Trustee serve as Chairman and that a key structural component for assuring that they are in a position to do so is for the Independent Trustees to constitute a substantial majority for the Board. The Independent Trustees also regularly meet in executive session. Arthur E. Johnson serves as Chairman of the Independent Trustees and as such (i) acts as a liaison between the Independent Trustees and management with respect to matters important to the Independent Trustees and (ii) with management prepares agendas for Board meetings.
Fidelity® funds are overseen by different Boards of Trustees. The funds' Board oversees Fidelity's investment-grade bond, money market, asset allocation and certain equity funds, and other Boards oversee Fidelity's high income and other equity funds. The asset allocation funds may invest in Fidelity® funds that are overseen by such other Boards. The use of separate Boards, each with its own committee structure, allows the Trustees of each group of Fidelity® funds to focus on the unique issues of the funds they oversee, including common research, investment, and operational issues. On occasion, the separate Boards establish joint committees to address issues of overlapping consequences for the Fidelity® funds overseen by each Board.
The Trustees operate using a system of committees to facilitate the timely and efficient consideration of all matters of importance to the Trustees, each fund, and fund shareholders and to facilitate compliance with legal and regulatory requirements and oversight of the funds' activities and associated risks. The Board, acting through its committees, has charged FMR and its affiliates with (i) identifying events or circumstances the occurrence of which could have demonstrably adverse effects on the funds' business and/or reputation; (ii) implementing processes and controls to lessen the possibility that such events or circumstances occur or to mitigate the effects of such events or circumstances if they do occur; and (iii) creating and maintaining a system designed to evaluate continuously business and market conditions in order to facilitate the identification and implementation processes described in (i) and (ii) above. Because the day-to-day operations and activities of the funds are carried out by or through FMR, its affiliates, and other service providers, the funds' exposure to risks is mitigated but not eliminated by the processes overseen by the Trustees. While each of the Board's committees has responsibility for overseeing different aspects of the funds' activities, oversight is exercised primarily through the Operations and Audit Committees. In addition, an ad hoc Board committee of Independent Trustees has worked with FMR to enhance the Board's oversight of investment and financial risks, legal and regulatory risks, technology risks, and operational risks, including the development of additional risk reporting to the Board. Appropriate personnel, including but not limited to the funds' Chief Compliance Officer (CCO), FMR's internal auditor, the independent accountants, the funds' Treasurer and portfolio management personnel, make periodic reports to the Board's committees, as appropriate, including an annual review of Fidelity's risk management program for the Fidelity® funds. The responsibilities of each standing committee, including their oversight responsibilities, are described further under "Standing Committees of the Trustees."
Interested Trustees*:
Correspondence intended for a Trustee who is an interested person may be sent to Fidelity Investments, 245 Summer Street, Boston, Massachusetts 02210.
Name, Year of Birth; Principal Occupations and Other Relevant Experience+
Abigail P. Johnson (1961)
Year of Election or Appointment: 2009
Trustee
Chairman of the Board of Trustees
Ms. Johnson also serves as Trustee of other Fidelity® funds. Ms. Johnson serves as Chairman (2016-present), Chief Executive Officer (2014-present), and Director (2007-present) of FMR LLC (diversified financial services company), President of Fidelity Financial Services (2012-present) and President of Personal, Workplace and Institutional Services (2005-present). Ms. Johnson is Chairman and Director of FMR Co., Inc. (investment adviser firm, 2011-present) and Chairman and Director of FMR (investment adviser firm, 2011-present). Previously, Ms. Johnson served as Vice Chairman (2007-2016) and President (2013-2016) of FMR LLC, President and a Director of FMR (2001-2005), a Trustee of other investment companies advised by FMR, Fidelity Investments Money Management, Inc. (investment adviser firm), and FMR Co., Inc. (2001-2005), Senior Vice President of the Fidelity® funds (2001-2005), and managed a number of Fidelity® funds. Ms. Abigail P. Johnson and Mr. Arthur E. Johnson are not related.
Jennifer Toolin McAuliffe (1959)
Year of Election or Appointment: 2016
Trustee
Ms. McAuliffe also serves as Trustee of other Fidelity® funds. Ms. McAuliffe previously served as a Member of the Advisory Board of certain Fidelity® funds (2016) and as Co-Head of Fixed Income of Fidelity Investments Limited (now known as FIL Limited (FIL)) (diversified financial services company). Earlier roles at FIL included Director of Research for FIL’s credit and quantitative teams in London, Hong Kong and Tokyo. Ms. McAuliffe also was the Director of Research for taxable and municipal bonds at Fidelity Investments Money Management, Inc. Ms. McAuliffe is also a director or trustee of several not-for-profit entities.
* Determined to be an “Interested Trustee” by virtue of, among other things, his or her affiliation with the trusts or various entities under common control with FMR.
+ The information includes the Trustee's principal occupation during the last five years and other information relating to the experience, attributes, and skills relevant to the Trustee's qualifications to serve as a Trustee, which led to the conclusion that the Trustee should serve as a Trustee for each fund.
Independent Trustees:
Correspondence intended for an Independent Trustee may be sent to Fidelity Investments, P.O. Box 55235, Boston, Massachusetts 02205-5235.
Name, Year of Birth; Principal Occupations and Other Relevant Experience+
Elizabeth S. Acton (1951)
Year of Election or Appointment: 2013
Trustee
Ms. Acton also serves as Trustee of other Fidelity® funds. Prior to her retirement in April 2012, Ms. Acton was Executive Vice President, Finance (2011-2012), Executive Vice President, Chief Financial Officer (2002-2011), and Treasurer (2004-2005) of Comerica Incorporated (financial services). Prior to joining Comerica, Ms. Acton held a variety of positions at Ford Motor Company (1983-2002), including Vice President and Treasurer (2000-2002) and Executive Vice President and Chief Financial Officer of Ford Motor Credit Company (1998-2000). Ms. Acton currently serves as a member of the Board of Directors and Audit and Finance Committees of Beazer Homes USA, Inc. (homebuilding, 2012-present). Previously, Ms. Acton served as a Member of the Advisory Board of certain Fidelity® funds (2013-2016).
Ann E. Dunwoody (1953)
Year of Election or Appointment: 2018
Trustee
General Dunwoody also serves as Trustee of other Fidelity® funds. General Dunwoody (United States Army, Retired) was the first woman in U.S. military history to achieve the rank of four-star general and prior to her retirement in 2012 held a variety of positions within the U.S. Army, including Commanding General, U.S. Army Material Command (2008-2012). She is the President of First to Four LLC (leadership and mentoring services, 2012-present). She also serves as a member of the Board of Directors and Nominating and Corporate Governance Committee of L3 Technologies, Inc. (communication, electronic, sensor, and aerospace systems, 2013-present), Board of Directors and Nomination and Corporate Governance Committees of Kforce Inc. (professional staffing services, 2016-present) and Board of Directors of Automattic Inc. (software engineering, 2018-present). Previously, General Dunwoody served as a Member of the Advisory Board of certain Fidelity® funds (2018), a member of the Board of Directors and Audit and Sustainability and Corporate Responsibility Committees of Republic Services, Inc. (waste collection, disposal and recycling, 2013-2016). Ms. Dunwoody also serves on several boards for non-profit organizations, including as a member of the Board of Directors, Chair of the Nomination and Governance Committee and member of the Audit Committee of Logistics Management Institute (consulting non-profit, 2012-present), a member of the Board of Directors of the Army Historical Foundation (2015-present), a member of the Council of Trustees for the Association of the United States Army (advocacy non-profit, 2013-present) and a member of the Board of Trustees of Florida Institute of Technology (2015-present) and ThanksUSA (military family education non-profit, 2014-present).
John Engler (1948)
Year of Election or Appointment: 2014
Trustee
Mr. Engler also serves as Trustee of other Fidelity® funds. He serves on the board of directors for Universal Forest Products (manufacturer and distributor of wood and wood-alternative products, 2003-present) and K12 Inc. (technology-based education company, 2012-present). Previously, Mr. Engler served as interim president of Michigan State University (2018-2019), a Member of the Advisory Board of certain Fidelity® funds (2014-2016), president of the Business Roundtable (2011-2017), a trustee of The Munder Funds (2003-2014), president and CEO of the National Association of Manufacturers (2004-2011), member of the Board of Trustees of the Annie E. Casey Foundation (2004-2015), and as governor of Michigan (1991-2003). He is a past chairman of the National Governors Association.
Robert F. Gartland (1951)
Year of Election or Appointment: 2010
Trustee
Mr. Gartland also serves as Trustee of other Fidelity® funds. Mr. Gartland is Chairman and an investor in Gartland & Mellina Group Corp. (consulting, 2009-present). Previously, Mr. Gartland served as a partner and investor of Vietnam Partners LLC (investments and consulting, 2008-2011). Prior to his retirement, Mr. Gartland held a variety of positions at Morgan Stanley (financial services, 1979-2007), including Managing Director (1987-2007), and Chase Manhattan Bank (1975-1978).
Arthur E. Johnson (1947)
Year of Election or Appointment: 2008
Trustee
Chairman of the Independent Trustees
Mr. Johnson also serves as Trustee of other Fidelity® funds. Mr. Johnson serves as a member of the Board of Directors of Eaton Corporation plc (diversified power management, 2009-present) and Booz Allen Hamilton (management consulting, 2011-present). Prior to his retirement, Mr. Johnson served as Senior Vice President of Corporate Strategic Development of Lockheed Martin Corporation (defense contractor, 1999-2009). He previously served on the Board of Directors of IKON Office Solutions, Inc. (1999-2008), AGL Resources, Inc. (holding company, 2002-2016), and Delta Airlines (2005-2007). Mr. Arthur E. Johnson is not related to Ms. Abigail P. Johnson.
Michael E. Kenneally (1954)
Year of Election or Appointment: 2009
Trustee
Vice Chairman of the Independent Trustees
Mr. Kenneally also serves as Trustee of other Fidelity® funds. Prior to his retirement, Mr. Kenneally served as Chairman and Global Chief Executive Officer of Credit Suisse Asset Management. Before joining Credit Suisse, he was an Executive Vice President and Chief Investment Officer for Bank of America Corporation. Earlier roles at Bank of America included Director of Research, Senior Portfolio Manager and Research Analyst, and Mr. Kenneally was awarded the Chartered Financial Analyst (CFA) designation in 1991.
Marie L. Knowles (1946)
Year of Election or Appointment: 2001
Trustee
Ms. Knowles also serves as Trustee of other Fidelity® funds. Prior to Ms. Knowles' retirement in June 2000, she served as Executive Vice President and Chief Financial Officer of Atlantic Richfield Company (ARCO) (diversified energy, 1996-2000). From 1993 to 1996, she was a Senior Vice President of ARCO and President of ARCO Transportation Company (pipeline and tanker operations). Ms. Knowles currently serves as a Director and Chairman of the Audit Committee of McKesson Corporation (healthcare service, since 2002). Ms. Knowles is a member of the Board of the Santa Catalina Island Company (real estate, 2009-present). Ms. Knowles is a Member of the Investment Company Institute Board of Governors and a Member of the Governing Council of the Independent Directors Council (2014-present). She also serves as a member of the Advisory Board for the School of Engineering of the University of Southern California. Previously, Ms. Knowles served as a Director of Phelps Dodge Corporation (copper mining and manufacturing, 1994-2007), URS Corporation (engineering and construction, 2000-2003) and America West (airline, 1999-2002). Ms. Knowles previously served as Chairman (2015-2018) and Vice Chairman (2012-2015) of the Independent Trustees of certain Fidelity® funds.
Mark A. Murray (1954)
Year of Election or Appointment: 2016
Trustee
Mr. Murray also serves as Trustee of other Fidelity® funds. Mr. Murray is Vice Chairman (2013-present) of Meijer, Inc. (regional retail chain). Previously, Mr. Murray served as a Member of the Advisory Board of certain Fidelity® funds (2016) and as Co-Chief Executive Officer (2013-2016) and President (2006-2013) of Meijer, Inc. Mr. Murray serves as a member of the Board of Directors and Nuclear Review and Public Policy and Responsibility Committees of DTE Energy Company (diversified energy company, 2009-present). Mr. Murray also serves as a member of the Board of Directors of Spectrum Health (not-for-profit health system, 2015-present). Mr. Murray previously served as President of Grand Valley State University (2001-2006), Treasurer for the State of Michigan (1999-2001), Vice President of Finance and Administration for Michigan State University (1998-1999), and a member of the Board of Directors and Audit Committee and Chairman of the Nominating and Corporate Governance Committee of Universal Forest Products, Inc. (manufacturer and distributor of wood and wood-alternative products, 2004-2016). Mr. Murray is also a director or trustee of many community and professional organizations.
+ The information includes the Trustee's principal occupation during the last five years and other information relating to the experience, attributes, and skills relevant to the Trustee's qualifications to serve as a Trustee, which led to the conclusion that the Trustee should serve as a Trustee for each fund.
Advisory Board Members and Officers:
Correspondence intended for an officer may be sent to Fidelity Investments, 245 Summer Street, Boston, Massachusetts 02210. Officers appear below in alphabetical order.
Name, Year of Birth; Principal Occupation
Elizabeth Paige Baumann (1968)
Year of Election or Appointment: 2017
Anti-Money Laundering (AML) Officer
Ms. Baumann also serves as AML Officer of other funds. She is Chief AML Officer (2012-present) and Senior Vice President (2014-present) of FMR LLC (diversified financial services company) and is an employee of Fidelity Investments. Previously, Ms. Baumann served as AML Officer of the funds (2012-2016), and Vice President (2007-2014) and Deputy Anti-Money Laundering Officer (2007-2012) of FMR LLC.
Craig S. Brown (1977)
Year of Election or Appointment: 2019
Assistant Treasurer
Mr. Brown also serves as Assistant Treasurer of other funds. Mr. Brown is an employee of Fidelity Investments (2013-present).
John J. Burke III (1964)
Year of Election or Appointment: 2018
Chief Financial Officer
Mr. Burke also serves as Chief Financial Officer of other funds. Mr. Burke serves as Head of Investment Operations for Fidelity Fund and Investment Operations (2018-present) and is an employee of Fidelity Investments (1998-present). Previously Mr. Burke served as head of Asset Management Investment Operations (2012-2018).
William C. Coffey (1969)
Year of Election or Appointment: 2018
Secretary and Chief Legal Officer (CLO)
Mr. Coffey also serves as Secretary and CLO of other funds. Mr. Coffey serves as CLO, Secretary, and Senior Vice President of Fidelity Management & Research Company and FMR Co., Inc. (investment adviser firms, 2018-present); Secretary of Fidelity SelectCo, LLC and Fidelity Investments Money Management, Inc. (investment adviser firms, 2018-present); and CLO of Fidelity Management & Research (Hong Kong) Limited, FMR Investment Management (UK) Limited, and Fidelity Management & Research (Japan) Limited (investment adviser firms, 2018-present). He is Senior Vice President and Deputy General Counsel of FMR LLC (diversified financial services company, 2010-present), and is an employee of Fidelity Investments. Previously, Mr. Coffey served as Assistant Secretary of certain funds (2009-2018) and as Vice President and Associate General Counsel of FMR LLC (2005-2009).
Jonathan Davis (1968)
Year of Election or Appointment: 2010
Assistant Treasurer
Mr. Davis also serves as Assistant Treasurer of other funds. Mr. Davis serves as Assistant Treasurer of FMR Capital, Inc. (2017-present) and is an employee of Fidelity Investments. Previously, Mr. Davis served as Vice President and Associate General Counsel of FMR LLC (diversified financial services company, 2003-2010).
Adrien E. Deberghes (1967)
Year of Election or Appointment: 2010
Assistant Treasurer
Mr. Deberghes also serves as an officer of other funds. He serves as Assistant Treasurer of FMR Capital, Inc. (2017-present), Executive Vice President of Fidelity Investments Money Management, Inc. (FIMM) (investment adviser firm, 2016-present), and is an employee of Fidelity Investments (2008-present). Previously, Mr. Deberghes served as President and Treasurer of certain Fidelity® funds (2013-2018). Prior to joining Fidelity Investments, Mr. Deberghes was Senior Vice President of Mutual Fund Administration at State Street Corporation (2007-2008), Senior Director of Mutual Fund Administration at Investors Bank & Trust (2005-2007), and Director of Finance for Dunkin' Brands (2000-2005). Previously, Mr. Deberghes served in other fund officer roles.
Laura M. Del Prato (1964)
Year of Election or Appointment: 2018
President and Treasurer
Ms. Del Prato also serves as an officer of other funds. Ms. Del Prato is an employee of Fidelity Investments (2017-present). Prior to joining Fidelity Investments, Ms. Del Prato served as a Managing Director and Treasurer of the JPMorgan Mutual Funds (2014-2017). Prior to JPMorgan, Ms. Del Prato served as a partner at Cohen Fund Audit Services (accounting firm, 2012-2013) and KPMG LLP (accounting firm, 2004-2012).
Colm A. Hogan (1973)
Year of Election or Appointment: 2016
Assistant Treasurer
Mr. Hogan also serves as an officer of other funds. Mr. Hogan serves as Assistant Treasurer of FMR Capital, Inc. (2017-present) and is an employee of Fidelity Investments (2005-present). Previously, Mr. Hogan served as Assistant Treasurer of certain Fidelity® funds (2016-2018).
Chris Maher (1972)
Year of Election or Appointment: 2013
Assistant Treasurer
Mr. Maher serves as Assistant Treasurer of other funds. Mr. Maher is Vice President of Valuation Oversight, serves as Assistant Treasurer of FMR Capital, Inc. (2017-present), and is an employee of Fidelity Investments. Previously, Mr. Maher served as Vice President of Asset Management Compliance (2013), Vice President of the Program Management Group of FMR (investment adviser firm, 2010-2013), and Vice President of Valuation Oversight (2008-2010).
John B. McGinty, Jr. (1962)
Year of Election or Appointment: 2016
Chief Compliance Officer
Mr. McGinty also serves as Chief Compliance Officer of other funds. Mr. McGinty is Senior Vice President of Asset Management Compliance for Fidelity Investments and is an employee of Fidelity Investments (2016-present). Mr. McGinty previously served as Vice President, Senior Attorney at Eaton Vance Management (investment management firm, 2015-2016), and prior to Eaton Vance as global CCO for all firm operations and registered investment companies at GMO LLC (investment management firm, 2009-2015). Before joining GMO LLC, Mr. McGinty served as Senior Vice President, Deputy General Counsel for Fidelity Investments (2007-2009).
Jason P. Pogorelec (1975)
Year of Election or Appointment: 2015
Assistant Secretary
Mr. Pogorelec also serves as Assistant Secretary of other funds. Mr. Pogorelec serves as Vice President, Associate General Counsel (2010-present) and is an employee of Fidelity Investments (2006-present).
Nancy D. Prior (1967)
Year of Election or Appointment: 2014
Vice President
Ms. Prior also serves as Vice President of other funds. Ms. Prior serves as President Fixed Income, High Income/Emerging Market Debt and Multi Asset Class Strategies of FIAM LLC (2018-present), President (2016-present) and Director (2014-present) of Fidelity Investments Money Management, Inc. (FIMM) (investment adviser firm), President, Fixed Income (2014-present), and is an employee of Fidelity Investments (2002-present). Previously, Ms. Prior served as Vice Chairman of FIAM LLC (investment adviser firm, 2014-2018), a Director of FMR Investment Management (UK) Limited (investment adviser firm, 2015-2018), President Multi-Asset Class Strategies of FMR's Global Asset Allocation Division (2017-2018), Vice President of Fidelity's Money Market Funds (2012-2014), President, Money Market and Short Duration Bond Group of Fidelity Management & Research (FMR) (investment adviser firm, 2013-2014), President, Money Market Group of FMR (2011-2013), Managing Director of Research (2009-2011), Senior Vice President and Deputy General Counsel (2007-2009), and Assistant Secretary of certain Fidelity® funds (2008-2009).
Stacie M. Smith (1974)
Year of Election or Appointment: 2013
Assistant Treasurer
Ms. Smith also serves as an officer of other funds. Ms. Smith serves as Assistant Treasurer of FMR Capital, Inc. (2017-present), is an employee of Fidelity Investments (2009-present), and has served in other fund officer roles. Prior to joining Fidelity Investments, Ms. Smith served as Senior Audit Manager of Ernst & Young LLP (accounting firm, 1996-2009). Previously, Ms. Smith served as Assistant Treasurer (2013-2018) and Deputy Treasurer (2013-2016) of certain Fidelity® funds.
Marc L. Spector (1972)
Year of Election or Appointment: 2016
Deputy Treasurer
Mr. Spector also serves as an officer of other funds. Mr. Spector serves as Assistant Treasurer of FMR Capital, Inc. (2017-present) and is an employee of Fidelity Investments (2016-present). Prior to joining Fidelity Investments, Mr. Spector served as Director at the Siegfried Group (accounting firm, 2013-2016), and prior to Siegfried Group as audit senior manager at Deloitte & Touche (accounting firm, 2005-2013).
Jim Wegmann (1979)
Year of Election or Appointment: 2019
Assistant Treasurer
Mr. Wegmann also serves as Assistant Treasurer of other funds. Mr. Wegmann is an employee of Fidelity Investments (2011-present).
Shareholder Expense Example
As a shareholder of a Fund, you incur two types of costs: (1) transaction costs and (2) ongoing costs, including other Fund expenses. This Example is intended to help you understand your ongoing costs (in dollars) of investing in the Funds and to compare these costs with the ongoing costs of investing in other mutual funds.
The Example is based on an investment of $1,000 invested at the beginning of the period and held for the entire period (July 1, 2018 to December 31, 2018).
Actual Expenses
The first line of the accompanying table for each fund provides information about actual account values and actual expenses. You may use the information in this line, together with the amount you invested, to estimate the expenses that you paid over the period. Simply divide your account value by $1,000.00 (for example, an $8,600 account value divided by $1,000.00 = 8.6), then multiply the result by the number in the first line for a fund under the heading entitled "Expenses Paid During Period" to estimate the expenses you paid on your account during this period. The estimate of expenses does not include any fees or other expenses of any variable annuity or variable life insurance product. If they were, the estimate of expenses you paid during the period would be higher, and your ending account value would be lower. In addition, each Fund, as a shareholder in underlying Fidelity Funds, will indirectly bear its pro-rata share of the fees and expenses incurred by the underlying Fidelity Funds. These fees and expenses are not included in each Fund's annualized expense ratio used to calculate the expense estimates in the table below.
Hypothetical Example for Comparison Purposes
The second line of the accompanying table for each fund provides information about hypothetical account values and hypothetical expenses based on a fund's actual expense ratio and an assumed rate of return of 5% per year before expenses, which is not the Fund's actual return. The hypothetical account values and expenses may not be used to estimate the actual ending account balance or expenses you paid for the period. You may use this information to compare the ongoing costs of investing in the Fund and other funds. To do so, compare this 5% hypothetical example with the 5% hypothetical examples that appear in the shareholder reports of the other funds. The estimate of expenses does not include any fees or other expenses of any variable annuity or variable life insurance product. If they were, the estimate of expenses you paid during the period would be higher, and your ending account value would be lower. In addition, each Fund, as a shareholder in underlying Fidelity Funds, will indirectly bear its pro-rata share of the fees and expenses incurred by the underlying Fidelity Funds. These fees and expenses are not included in each Fund's annualized expense ratio used to calculate the expense estimates in the table below.
Please note that the expenses shown in the table are meant to highlight your ongoing costs only and do not reflect any transaction costs. Therefore, the second line of the table is useful in comparing ongoing costs only, and will not help you determine the relative total costs of owning different funds.
| | Annualized Expense Ratio-A | Beginning
Account Value
July 1, 2018 | Ending
Account Value
December 31, 2018 | Expenses Paid
During Period-B
July 1, 2018
to December 31, 2018 |
| VIP Freedom Lifetime Income I | - %-C | | | |
| Actual | | $1,000.00 | $981.00 | $--D |
| Hypothetical-E | | $1,000.00 | $1,025.21 | $--D |
| VIP Freedom Lifetime Income II | - %-C | | | |
| Actual | | $1,000.00 | $961.20 | $--D |
| Hypothetical-E | | $1,000.00 | $1,025.21 | $--D |
| VIP Freedom Lifetime Income III | - %-C | | | |
| Actual | | $1,000.00 | $942.80 | $--D |
| Hypothetical-E | | $1,000.00 | $1,025.21 | $--D |
A Annualized expense ratio reflects expenses net of applicable fee waivers.
B Expenses are equal to each Fund's annualized expense ratio, multiplied by the average account value over the period, multiplied by 184/ 365 (to reflect the one-half year period). The fees and expenses of the underlying Fidelity Funds in which each Fund invests are not included in each Fund's annualized expense ratio.
C Amount represents less than .005%.
D Amount represents less than $.01
E 5% return per year before expenses
Distributions (Unaudited)
The Board of Trustees of each fund voted to pay to shareholders of record at the opening of business on record date, the following distributions per share derived from capital gains realized from sales of portfolio securities, and dividends derived from net investment income:
| | Pay Date | Record Date | Dividends | Capital Gains |
| VIP Freedom Lifetime Income I | 02/15/2019 | 02/15/2019 | $0.008 | $0.109 |
| VIP Freedom Lifetime Income II | 02/15/2019 | 02/15/2019 | $0.006 | $0.412 |
| VIP Freedom Lifetime Income III | 02/15/2019 | 02/15/2019 | $0.005 | $0.436 |
|
The funds hereby designate as capital gain dividend the amounts noted below for the taxable year ended December 31, 2018, or, if subsequently determined to be different, the net capital gain of such year.
| VIP Freedom Lifetime Income I | $95,483 |
| VIP Freedom Lifetime Income II | $1,024,023 |
| VIP Freedom Lifetime Income III | $1,004,194 |
|
A percentage of the dividends distributed during the fiscal year for the following funds were derived from interest on U.S. Government securities which is generally exempt from state income tax:
| VIP Freedom Lifetime Income I | 24.62% |
| VIP Freedom Lifetime Income II | 14.04% |
| VIP Freedom Lifetime Income III | 9.17% |
|
A percentage of the dividends distributed during the fiscal year for the following funds qualify for the dividends–received deduction for corporate shareholders:
| VIP Freedom Lifetime Income I | |
| February 2018 | 1% |
| December 2018 | 5% |
| VIP Freedom Lifetime Income II | |
| February 2018 | 1% |
| December 2018 | 11% |
| VIP Freedom Lifetime Income III | |
| February 2018 | – |
| December 2018 | 17% |
|
The amounts per share which represent income derived from sources within, and taxes paid to, foreign countries or possessions of the United States are as follows:
| | Pay Date | Income | Taxes |
| VIP Freedom Lifetime Income I | 12/21/2018 | $0.0149 | $0.0019 |
| VIP Freedom Lifetime Income II | 12/21/2018 | $0.0276 | $0.0035 |
| VIP Freedom Lifetime Income III | 12/21/2018 | $0.0375 | $0.0046 |
|
Board Approval of Investment Advisory Contracts and Management Fees
VIP Freedom Lifetime Income Funds
Each year, the Board of Trustees, including the Independent Trustees (together, the Board), votes on the renewal of the management contract (the Advisory Contract) with FMR Co., Inc. (FMRC), an affiliate of Fidelity Management & Research Company (FMR), for each fund. The Board, assisted by the advice of fund counsel and Independent Trustees' counsel, requests and considers a broad range of information relevant to the renewal of the Advisory Contracts throughout the year.
The Board meets regularly and, at each of its meetings, covers an extensive agenda of topics and materials and considers factors that are relevant to its annual consideration of the renewal of each fund's Advisory Contract, including the services and support provided to each fund and its shareholders. The Board has established four standing committees (Committees) — Operations, Audit, Fair Valuation, and Governance and Nominating — each composed of and chaired by Independent Trustees with varying backgrounds, to which the Board has assigned specific subject matter responsibilities in order to enhance effective decision-making by the Board. The Operations Committee, of which all of the Independent Trustees are members, meets regularly throughout the year and considers, among other matters, information specifically related to the annual consideration of the renewal of each fund's Advisory Contract. The Board, acting directly and through its Committees, requests and receives information concerning the annual consideration of the renewal of each fund's Advisory Contract. The Board also meets as needed to review matters specifically related to the Board's annual consideration of the renewal of the Advisory Contracts. Members of the Board may also meet with trustees of other Fidelity funds through joint ad hoc committees to discuss certain matters relevant to all of the Fidelity funds.
At its September 2018 meeting, the Board unanimously determined to renew each fund's Advisory Contract. In reaching its determination, the Board considered all factors it believed relevant and reached a determination, with the assistance of fund counsel and Independent Trustees' counsel and through the exercise of its business judgment, that the renewal of the Advisory Contract was in the best interests of each fund and its shareholders and that the fact that no fees are payable under the Advisory Contracts was fair and reasonable. The Board's decision to renew the Advisory Contracts was not based on any single factor, but rather was based on a comprehensive consideration of all the information provided to the Board at its meetings throughout the year. In reaching its determination, the Board was aware that shareholders of each fund have a broad range of investment choices available to them, including a wide choice among funds offered by Fidelity's competitors, and that each fund's shareholders, who have the opportunity to review and weigh the disclosure provided by the fund in its prospectus and other public disclosures, have chosen to invest in that fund, which is part of the Fidelity family of funds.
Nature, Extent, and Quality of Services Provided. The Board considered Fidelity's staffing as it relates to the funds, including the backgrounds of investment personnel of FMRC, and also considered the funds' investment objectives, strategies, and related investment philosophies. The Independent Trustees also had discussions with senior management of Fidelity's investment operations and investment groups with responsibility for the underlying Fidelity funds in which each fund invests. The Board considered the structure of the investment personnel compensation program and whether this structure provides appropriate incentives to act in the best interests of each fund. Additionally, the Board considered the portfolio managers' investments, if any, in the funds that they manage.
Resources Dedicated to Investment Management and Support Services. The Board reviewed the general qualifications and capabilities of Fidelity's investment staff, including its size, education, experience, and resources, as well as Fidelity's approach to recruiting, managing, and compensating investment personnel. The Board noted that Fidelity has continued to increase the resources devoted to non-U.S. offices, including expansion of Fidelity's global investment organization. The Board also noted that Fidelity's analysts have extensive resources, tools and capabilities that allow them to conduct sophisticated quantitative and fundamental analysis, as well as credit analysis of issuers, counterparties and guarantors. Further, the Board considered that Fidelity's investment professionals have sufficient access to global information and data so as to provide competitive investment results over time, and that those professionals also have access to sophisticated tools that permit them to assess portfolio construction and risk and performance attribution characteristics continuously, as well as to transmit new information and research conclusions rapidly around the world. Additionally, in its deliberations, the Board considered Fidelity's risk management, compliance, and technology and operations capabilities and resources, which are integral parts of the investment management process.
Shareholder and Administrative Services. The Board considered (i) the nature, extent, quality, and cost of advisory, administrative, and shareholder services performed by Fidelity under the Advisory Contract and under separate agreements covering transfer agency, and pricing and bookkeeping services for each fund; (ii) the nature and extent of the supervision of third party service providers, principally custodians, subcustodians, and pricing vendors; and (iii) the resources devoted to, and the record of compliance with, each fund's compliance policies and procedures.
The Board noted that the growth of fund assets over time across the complex allows Fidelity to reinvest in the development of services designed to enhance the value and convenience of the Fidelity funds as investment vehicles. These services include 24-hour access to account information and market information through telephone representatives and over the Internet, investor education materials and asset allocation tools, and the expanded availability of Fidelity Investor Centers.
Investment in a Large Fund Family. The Board considered the benefits to shareholders of investing in a Fidelity fund, including the benefits of investing in a fund that is part of a large family of funds offering a variety of investment disciplines and providing a large variety of mutual fund investor services. The Board noted that Fidelity had taken, or had made recommendations that resulted in the Fidelity funds taking, a number of actions over the previous year that benefited particular funds, including: (i) continuing to dedicate additional resources to Fidelity's investment research process, which includes meetings with management of issuers of securities in which the funds invest, and to the support of the senior management team that oversees asset management; (ii) continuing efforts to enhance Fidelity's global research capabilities; (iii) launching new funds and making other enhancements to meet client needs; (iv) launching new share classes of existing funds; (v) eliminating purchase minimums and broadening eligibility requirements for certain funds and share classes; (vi) reducing management fees and total expenses for certain growth equity funds and index funds; (vii) lowering expense caps for certain existing funds and classes, and converting certain voluntary expense caps to contractual caps, to reduce expenses borne by shareholders; (viii) eliminating short-term redemption fees for funds that had such fees; (ix) rationalizing product lines and gaining increased efficiencies from fund mergers and share class consolidations; (x) continuing to develop, acquire and implement systems and technology to improve services to the funds and shareholders, strengthen information security, and increase efficiency; and (xi) continuing to implement enhancements to further strengthen Fidelity's product line to increase investors' probability of success in achieving their investment goals, including retirement income goals.
Investment Performance. The Board considered whether each fund has operated in accordance with its investment objective, as well as its record of compliance with its investment restrictions and its performance history.
The Board took into account discussions that occur at Board meetings throughout the year with representatives of the investment adviser about fund investment performance. In this regard the Board noted that as part of regularly scheduled fund reviews and other reports to the Board on fund performance, the Board considers annualized return information for each fund for different time periods, measured against one or more appropriate securities market indices, including a customized blended index that reflects the respective weights of the fund's asset classes (each a "benchmark index") and a peer group of funds with similar objectives ("peer group"), if any. In its evaluation of fund investment performance at meetings throughout the year, the Board gave particular attention to information indicating underperformance of certain Fidelity funds for specific time periods and discussed with the investment adviser the reasons for such underperformance.
In addition to reviewing absolute and relative fund performance, the Independent Trustees periodically consider the appropriateness of fund performance metrics in evaluating the results achieved. In general, the Independent Trustees believe that fund performance should be evaluated based on gross performance (before fees and expenses, including acquired fund fees and expenses, but after transaction costs, if any) compared to appropriate benchmark indices, over appropriate time periods that may include full market cycles, and on net performance (after fees and expenses, including acquired fund fees and expenses) compared to peer groups, as applicable, over the same periods, taking into account relevant factors including the following: general market conditions; the extent to which particular underlying funds affected performance; and fund cash flows and other factors. Depending on the circumstances, the Independent Trustees may be satisfied with a fund's performance notwithstanding that it lags its benchmark index or peer group for certain periods.
The Independent Trustees recognize that shareholders evaluate performance on a net basis over their own holding periods, for which one-, three-, and five-year periods are often used as a proxy. For this reason, the performance information reviewed by the Board also included net cumulative calendar year total return information for each fund and an appropriate benchmark index for the most recent one-, three-, and five-year periods.
Based on its review, the Board concluded that the nature, extent, and quality of services provided to each fund under the Advisory Contracts should continue to benefit the shareholders of each fund.
Competitiveness of Management Fee and Total Expense Ratio. The Board noted that the funds do not pay FMRC a management fee for investment advisory services, and that each fund bears indirectly the fees and expenses, including the management fees, paid by the underlying Fidelity funds in which it invests. The Board considered each fund's management fee and total expense ratio compared to "mapped groups" of competitive funds and classes created for the purpose of facilitating the Trustees' competitive analysis of management fees and total expenses. Fidelity creates "mapped groups" by combining similar Lipper investment objective categories that have comparable investment mandates. Combining Lipper investment objective categories aids the Board's management fee and total expense ratio comparisons by broadening the competitive group used for comparison.
Management Fee. The Board considered two proprietary management fee comparisons for the 12-month periods shown in basis points (BP) in the charts below. The group of Lipper funds used by the Board for management fee comparisons is referred to below as the "Total Mapped Group." The Total Mapped Group comparison focuses on a fund's standing in terms of gross management fees before expense reimbursements or caps relative to the total universe of funds with comparable investment mandates, regardless of whether their management fee structures also are comparable. Funds with comparable investment mandates offer exposure to similar types of securities. Funds with comparable management fee structures have similar management fee contractual arrangements (
e.g., flat rate charged for advisory services, all-inclusive fee rate,
etc.). "TMG %" represents the percentage of funds in the Total Mapped Group that had management fees that were lower than a fund's. For example, a hypothetical TMG % of 20% would mean that 80% of the funds in the Total Mapped Group had higher, and 20% had lower, management fees than a fund. The funds' actual TMG %s and the number of funds in the Total Mapped Group are in the charts below. The "Asset-Size Peer Group" (ASPG) comparison focuses on a fund's standing relative to a subset of non-Fidelity funds within the Total Mapped Group that are similar in size and management fee structure. For example, if a fund is in the first quartile of the ASPG, the fund's management fee ranks in the least expensive or lowest 25% of funds in the ASPG. The ASPG represents at least 15% of the funds in the Total Mapped Group with comparable asset size and management fee structures, subject to a minimum of 50 funds (or all funds in the Total Mapped Group if fewer than 50). Additional information, such as the ASPG quartile in which a fund's management fee rate ranked, is also included in the charts and was considered by the Board.
VIP Freedom Lifetime Income I Portfolio

VIP Freedom Lifetime Income II Portfolio
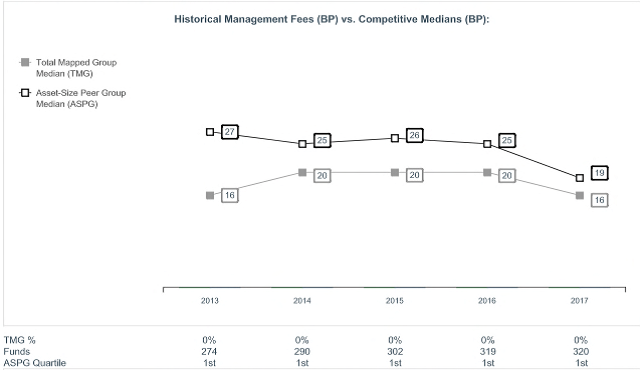
VIP Freedom Lifetime Income III Portfolio
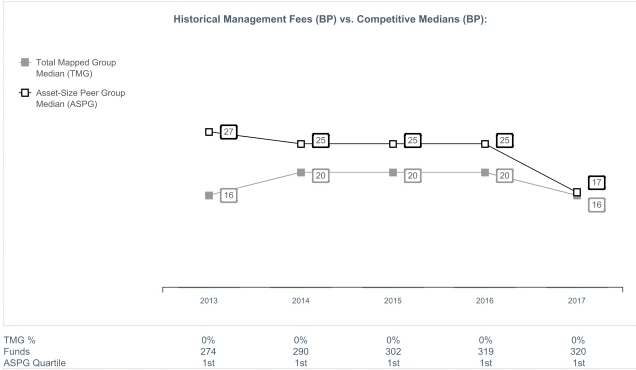
The Board noted that each fund's management fee rate of 0.00% ranked below the median of its Total Mapped Group and below the median of its ASPG for 2017. The Board further noted that many peer funds pay fund-level expenses, including management fees, to which the funds are not subject.
The Board noted that it and the boards of other Fidelity funds formed an ad hoc Committee on Group Fee, which meets periodically, to conduct an in-depth review of the "group fee" component of the management fee of funds with such management fee structures, and that while the funds do not pay a management fee, they indirectly bear a portion of the management fees paid by the Fidelity funds in which they invest, some of which are subject to the group fee. The Committee's focus included the mechanics of the group fee, the competitive landscape of group fee structures, Fidelity funds with no group fee component (such as the funds) and investment products not included in group fee assets. The Board also considered that, for funds subject to the group fee, FMR agreed to voluntarily waive fees over a specified period of time in amounts designed to account for assets converted from certain funds to certain collective investment trusts.
Based on its review, the Board concluded that each fund's management fee is fair and reasonable in light of the services that the fund receives and the other factors considered.
Total Expense Ratio. In its review of each fund's total expense ratio, the Board considered that the funds do not pay transfer agent fees. Instead, the applicable class of each underlying Fidelity fund bears its pro rata portion of each fund's transfer agent fee according to the percentage of each fund's assets invested in that underlying fund. The Board further noted that FMR pays all other expenses of each fund, with limited exceptions.
The Board noted that each fund's total expense ratio ranked below the competitive median for 2017.
In considering each fund's total expense ratio, the Board also considered an alternative competitive analysis that included both top level (
i.e., direct) fund fees and acquired fund fees and expenses for the fund and the other funds and classes to which it is compared. The Board noted that, under this alternative competitive analysis, each fund's total expense ratio ranked below the competitive median for 2017.
Fees Charged to Other Fidelity Clients. The Board also considered Fidelity fee structures and other information with respect to clients of Fidelity, such as other funds advised or subadvised by Fidelity, pension plan clients, and other institutional clients with similar mandates. The Board noted that a joint ad hoc committee created by it and the boards of other Fidelity funds periodically reviews and compares Fidelity's institutional investment advisory business with its business of providing services to the Fidelity funds and also noted the most recent findings of the committee. The Board noted that the committee's review included a consideration of the differences in services provided, fees charged, and costs incurred, as well as competition in the markets serving the different categories of clients.
Based on its review of total expense ratios and fees charged to other Fidelity clients, the Board concluded that each fund's total expense ratio was reasonable in light of the services that the fund and its shareholders receive and the other factors considered.
Costs of the Services and Profitability. The Board considered the level of Fidelity's profits in respect of all the Fidelity funds, including the Fidelity funds in which the funds invest.
PricewaterhouseCoopers LLP (PwC), auditor to Fidelity and certain Fidelity funds, has been engaged annually by the Board as part of the Board's assessment of Fidelity's profitability analysis. PwC's engagement includes the review and assessment of the methodologies used by Fidelity in determining the revenues and expenses attributable to Fidelity's mutual fund business, and completion of agreed-upon procedures in respect of the mathematical accuracy of the fund profitability information and its conformity to established allocation methodologies. After considering PwC's reports issued under the engagement and information provided by Fidelity, the Board concluded that while other allocation methods may also be reasonable, Fidelity's profitability methodologies are reasonable in all material respects.
The Board also reviewed Fidelity's non-fund businesses and potential indirect benefits such businesses may have received as a result of their association with Fidelity's mutual fund business (i.e., fall-out benefits) as well as cases where Fidelity's affiliates may benefit from the funds' business. The Board noted that changes to fall-out benefits year-over-year reflect business developments at Fidelity's various businesses.
The Board concluded that the costs of the services provided by and the profits realized by Fidelity in connection with the operation of each fund were not relevant to the renewal of each fund's Advisory Contract because the funds do not pay management fees and FMR pays all other expenses of each fund, with limited exceptions.
Economies of Scale. The Board concluded that because the funds do not pay management fees and FMR pays all other expenses of each fund, with limited exceptions, economies of scale cannot be realized by the funds, but may be realized by the other Fidelity funds in which each fund invests, many of which may benefit from breakpoints under the group fee arrangement.
Additional Information Requested by the Board. In order to develop fully the factual basis for consideration of the Fidelity funds' advisory contracts, the Board requested and received additional information on certain topics, including: (i) Fidelity's fund profitability methodology, profitability trends for certain funds, the allocation of various costs to different funds, and the impact of certain factors on fund profitability results; (ii) portfolio manager changes that have occurred during the past year and the amount of the investment that each portfolio manager has made in the Fidelity fund(s) that he or she manages; (iii) Fidelity's compensation structure for portfolio managers, research analysts, and other key personnel, including its effects on fund profitability, the rationale for the compensation structure, and the extent to which current market conditions have affected retention and recruitment; (iv) the arrangements with and compensation paid to certain fund sub-advisers on behalf of the Fidelity funds and the treatment of such compensation within Fidelity's fund profitability methodology; (v) the terms of Fidelity's voluntary expense limitation agreements; (vi) the methodology with respect to competitive fund data and peer group classifications; (vii) Fidelity's transfer agent fee, expense, and service structures for different funds and classes relative to competitive trends, and the impact of the increased use of omnibus accounts; (viii) new developments in the retail and institutional marketplaces and the competitive positioning of the funds relative to other investment products and services; (ix) the impact of recent changes to the money market fund landscape, including the full implementation of money market fund reform and rising interest rates, on Fidelity's money market funds; (x) the funds' share class structures and distribution channels; and (xi) explanations regarding the relative total expense ratios of certain funds and classes, total expense competitive trends and methodologies for total expense competitive comparisons, and actions that might be taken by Fidelity to reduce total expense ratios for certain classes. In addition, the Board considered its discussions with Fidelity throughout the year regarding enhanced information security initiatives and the funds' fair valuation policies.
Based on its evaluation of all of the conclusions noted above, and after considering all factors it believed relevant, the Board concluded that the advisory fee arrangements are fair and reasonable, and that each fund's Advisory Contract should be renewed.
VIPFLI-ANN-0219
1.816199.113
Fidelity® Variable Insurance Products:
Investor Freedom® Funds - Income, 2005, 2010, 2015, 2020, 2025, 2030 Investor Freedom Income® Portfolio
Investor Freedom® 2005 Portfolio
Investor Freedom® 2010 Portfolio
Investor Freedom® 2015 Portfolio
Investor Freedom® 2020 Portfolio
Investor Freedom® 2025 Portfolio
Investor Freedom® 2030 Portfolio
Annual Report December 31, 2018 |
|
Beginning on January 1, 2021, as permitted by regulations adopted by the Securities and Exchange Commission, and if your insurance carrier elects to participate, you may not be receiving paper copies of the Fund’s shareholder reports from the insurance company that offers your variable insurance product unless you specifically request paper copies from your financial professional or the administrator of your variable insurance product. Instead, the reports will be made available on a website, and you will be notified by mail each time a report is posted and provided with a website link to access the report.
If you already elected to receive shareholder reports electronically, you will not be affected by this change and you need not take any action. You may elect to receive shareholder reports and other communications from the Fund electronically, by contacting your financial professional or the administrator of your variable insurance product. If you own a Fidelity-administered variable insurance product, please visit fidelity.com/mailpreferences to make your election or call 1-800-343-3548.
You may elect to receive all future reports in paper free of charge. If you wish to continue receiving paper copies of your shareholder reports, you may contact your financial professional or the administrator of your variable insurance product. If you own a Fidelity-administered variable insurance product, please visit fidelity.com/mailpreferences to make your election or call 1-800-343-3548. Your election to receive reports in paper will apply to all funds available under your variable insurance product.
Contents
To view a fund's proxy voting guidelines and proxy voting record for the 12-month period ended June 30, visit http://www.fidelity.com/proxyvotingresults or visit the Securities and Exchange Commission's (SEC) web site at http://www.sec.gov.
You may also call 1-877-208-0098 to request a free copy of the proxy voting guidelines.
Fidelity® Variable Insurance Products are separate account options which are purchased through a variable insurance contract.
Standard & Poor's, S&P and S&P 500 are registered service marks of The McGraw-Hill Companies, Inc. and have been licensed for use by Fidelity Distributors Corporation.
Other third-party marks appearing herein are the property of their respective owners.
All other marks appearing herein are registered or unregistered trademarks or service marks of FMR LLC or an affiliated company. © 2019 FMR LLC. All rights reserved.
This report and the financial statements contained herein are submitted for the general information of the shareholders of the Funds. This report is not authorized for distribution to prospective investors in the Funds unless preceded or accompanied by an effective prospectus.
A fund files its complete schedule of portfolio holdings with the SEC for the first and third quarters of each fiscal year on Form N-Q. Forms N-Q are available on the SEC’s web site at http://www.sec.gov. A fund's Forms N-Q may be reviewed and copied at the SEC’s Public Reference Room in Washington, DC. Information regarding the operation of the SEC's Public Reference Room may be obtained by calling 1-800-SEC-0330.
For a complete list of a fund's portfolio holdings, view the most recent holdings listing, semiannual report, or annual report on Fidelity's web site at http://www.fidelity.com, http://www.institutional.fidelity.com, or http://www.401k.com, as applicable.
NOT FDIC INSURED •MAY LOSE VALUE •NO BANK GUARANTEE
Neither the Funds nor Fidelity Distributors Corporation is a bank.
VIP Investor Freedom Income Portfolio℠
Performance: The Bottom Line
Performance numbers are net of all underlying fund operating expenses, but do not include any insurance charges imposed by your insurance company’s separate account. If performance information included the effect of these additional charges, the total returns would have been lower.
Average annual total return reflects the change in the value of an investment, assuming reinvestment of distributions from dividend income and capital gains (the profits earned upon the sale of securities that have grown in value, if any) and assuming a constant rate of performance each year. During periods of reimbursement by Fidelity, a fund’s total return will be greater than it would be had the reimbursement not occurred. Performance numbers are net of all underlying fund operating expenses, but do not include any insurance charges imposed by your insurance company’s separate account. If performance information included the effect of these additional charges, the total returns would have been lower. How a fund did yesterday is no guarantee of how it will do tomorrow.
Average Annual Total Returns
| Periods ended December 31, 2018 | Past 1 year | Past 5 years | Past 10 years |
| VIP Investor Freedom Income Portfolio℠ | (2.03)% | 2.79% | 4.92% |
$10,000 Over 10 Years
Let's say hypothetically that $10,000 was invested in VIP Investor Freedom Income Portfolio℠ on December 31, 2008.
The chart shows how the value of your investment would have changed, and also shows how the Bloomberg Barclays U.S. Aggregate Bond Index performed over the same period.

| Period Ending Values |
| $16,159 | VIP Investor Freedom Income Portfolio℠ |
| $14,075 | Bloomberg Barclays U.S. Aggregate Bond Index |
VIP Investor Freedom 2005 Portfolio℠
Performance: The Bottom Line
Performance numbers are net of all underlying fund operating expenses, but do not include any insurance charges imposed by your insurance company’s separate account. If performance information included the effect of these additional charges, the total returns would have been lower.
Average annual total return reflects the change in the value of an investment, assuming reinvestment of distributions from dividend income and capital gains (the profits earned upon the sale of securities that have grown in value, if any) and assuming a constant rate of performance each year. During periods of reimbursement by Fidelity, a fund’s total return will be greater than it would be had the reimbursement not occurred. Performance numbers are net of all underlying fund operating expenses, but do not include any insurance charges imposed by your insurance company’s separate account. If performance information included the effect of these additional charges, the total returns would have been lower. How a fund did yesterday is no guarantee of how it will do tomorrow.
Average Annual Total Returns
| Periods ended December 31, 2018 | Past 1 year | Past 5 years | Past 10 years |
| VIP Investor Freedom 2005 Portfolio℠ | (3.04)% | 3.25% | 6.79% |
$10,000 Over 10 Years
Let's say hypothetically that $10,000 was invested in VIP Investor Freedom 2005 Portfolio℠ on December 31, 2008.
The chart shows how the value of your investment would have changed, and also shows how the Bloomberg Barclays U.S. Aggregate Bond Index performed over the same period.

| Period Ending Values |
| $19,298 | VIP Investor Freedom 2005 Portfolio℠ |
| $14,075 | Bloomberg Barclays U.S. Aggregate Bond Index |
VIP Investor Freedom 2010 Portfolio℠
Performance: The Bottom Line
Performance numbers are net of all underlying fund operating expenses, but do not include any insurance charges imposed by your insurance company’s separate account. If performance information included the effect of these additional charges, the total returns would have been lower.
Average annual total return reflects the change in the value of an investment, assuming reinvestment of distributions from dividend income and capital gains (the profits earned upon the sale of securities that have grown in value, if any) and assuming a constant rate of performance each year. During periods of reimbursement by Fidelity, a fund’s total return will be greater than it would be had the reimbursement not occurred. Performance numbers are net of all underlying fund operating expenses, but do not include any insurance charges imposed by your insurance company’s separate account. If performance information included the effect of these additional charges, the total returns would have been lower. How a fund did yesterday is no guarantee of how it will do tomorrow.
Average Annual Total Returns
| Periods ended December 31, 2018 | Past 1 year | Past 5 years | Past 10 years |
| VIP Investor Freedom 2010 Portfolio℠ | (4.06)% | 3.55% | 7.74% |
$10,000 Over 10 Years
Let's say hypothetically that $10,000 was invested in VIP Investor Freedom 2010 Portfolio℠ on December 31, 2008.
The chart shows how the value of your investment would have changed, and also shows how the Bloomberg Barclays U.S. Aggregate Bond Index performed over the same period.
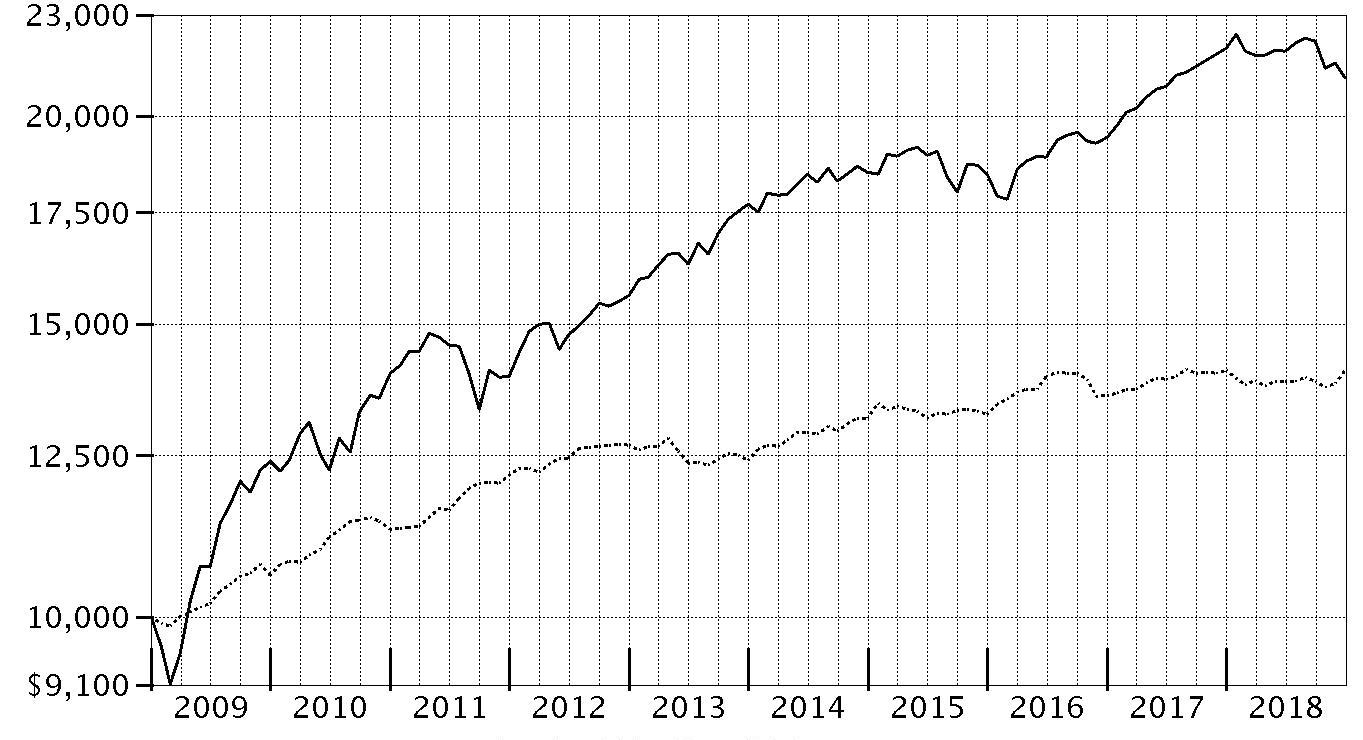
| Period Ending Values |
| $21,072 | VIP Investor Freedom 2010 Portfolio℠ |
| $14,075 | Bloomberg Barclays U.S. Aggregate Bond Index |
VIP Investor Freedom 2015 Portfolio℠
Performance: The Bottom Line
Performance numbers are net of all underlying fund operating expenses, but do not include any insurance charges imposed by your insurance company’s separate account. If performance information included the effect of these additional charges, the total returns would have been lower.
Average annual total return reflects the change in the value of an investment, assuming reinvestment of distributions from dividend income and capital gains (the profits earned upon the sale of securities that have grown in value, if any) and assuming a constant rate of performance each year. During periods of reimbursement by Fidelity, a fund’s total return will be greater than it would be had the reimbursement not occurred. Performance numbers are net of all underlying fund operating expenses, but do not include any insurance charges imposed by your insurance company’s separate account. If performance information included the effect of these additional charges, the total returns would have been lower. How a fund did yesterday is no guarantee of how it will do tomorrow.
Average Annual Total Returns
| Periods ended December 31, 2018 | Past 1 year | Past 5 years | Past 10 years |
| VIP Investor Freedom 2015 Portfolio℠ | (5.02)% | 3.81% | 8.11% |
$10,000 Over 10 Years
Let's say hypothetically that $10,000 was invested in VIP Investor Freedom 2015 Portfolio℠ on December 31, 2008.
The chart shows how the value of your investment would have changed, and also shows how the S&P 500® Index performed over the same period.
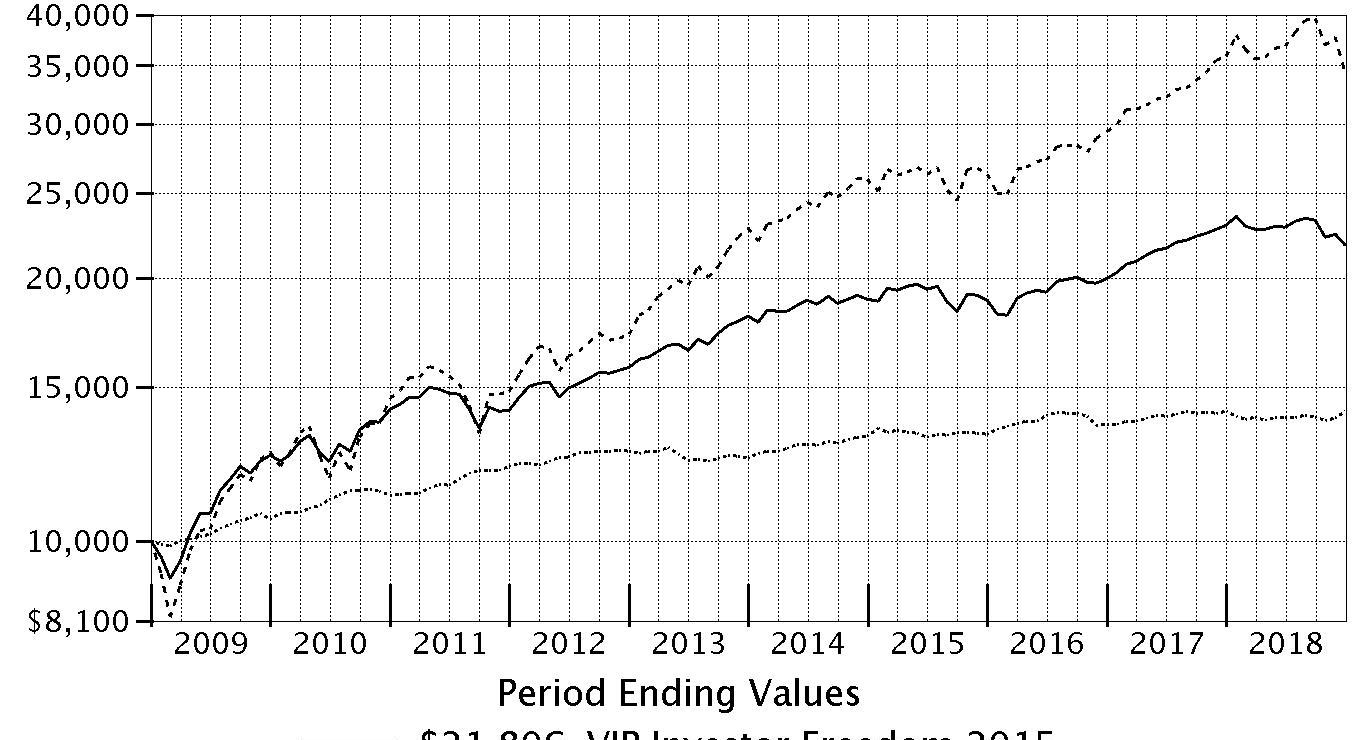
| Period Ending Values |
| $21,806 | VIP Investor Freedom 2015 Portfolio℠ |
| $14,075 | Bloomberg Barclays U.S. Aggregate Bond Index |
| $34,303 | S&P 500® Index |
Going forward, the fund’s performance will be compared to the Bloomberg Barclays U.S. Aggregate Bond Index, rather than the S&P 500® Index. The Bloomberg Barclays U.S. Aggregate Bond Index more closely represents the fund’s investment strategy, as fixed-income and short-term funds currently represent the majority of the fund’s assets.
VIP Investor Freedom 2020 Portfolio℠
Performance: The Bottom Line
Performance numbers are net of all underlying fund operating expenses, but do not include any insurance charges imposed by your insurance company’s separate account. If performance information included the effect of these additional charges, the total returns would have been lower.
Average annual total return reflects the change in the value of an investment, assuming reinvestment of distributions from dividend income and capital gains (the profits earned upon the sale of securities that have grown in value, if any) and assuming a constant rate of performance each year. During periods of reimbursement by Fidelity, a fund’s total return will be greater than it would be had the reimbursement not occurred. Performance numbers are net of all underlying fund operating expenses, but do not include any insurance charges imposed by your insurance company’s separate account. If performance information included the effect of these additional charges, the total returns would have been lower. How a fund did yesterday is no guarantee of how it will do tomorrow.
Average Annual Total Returns
| Periods ended December 31, 2018 | Past 1 year | Past 5 years | Past 10 years |
| VIP Investor Freedom 2020 Portfolio℠ | (5.94)% | 3.94% | 8.80% |
$10,000 Over 10 Years
Let's say hypothetically that $10,000 was invested in VIP Investor Freedom 2020 Portfolio℠ on December 31, 2008.
The chart shows how the value of your investment would have changed, and also shows how the S&P 500® Index performed over the same period.

| Period Ending Values |
| $23,233 | VIP Investor Freedom 2020 Portfolio℠ |
| $34,303 | S&P 500® Index |
VIP Investor Freedom 2025 Portfolio℠
Performance: The Bottom Line
Performance numbers are net of all underlying fund operating expenses, but do not include any insurance charges imposed by your insurance company’s separate account. If performance information included the effect of these additional charges, the total returns would have been lower.
Average annual total return reflects the change in the value of an investment, assuming reinvestment of distributions from dividend income and capital gains (the profits earned upon the sale of securities that have grown in value, if any) and assuming a constant rate of performance each year. During periods of reimbursement by Fidelity, a fund’s total return will be greater than it would be had the reimbursement not occurred. Performance numbers are net of all underlying fund operating expenses, but do not include any insurance charges imposed by your insurance company’s separate account. If performance information included the effect of these additional charges, the total returns would have been lower. How a fund did yesterday is no guarantee of how it will do tomorrow.
Average Annual Total Returns
| Periods ended December 31, 2018 | Past 1 year | Past 5 years | Past 10 years |
| VIP Investor Freedom 2025 Portfolio℠ | (6.56)% | 4.11% | 9.52% |
$10,000 Over 10 Years
Let's say hypothetically that $10,000 was invested in VIP Investor Freedom 2025 Portfolio℠ on December 31, 2008.
The chart shows how the value of your investment would have changed, and also shows how the S&P 500® Index performed over the same period.

| Period Ending Values |
| $24,823 | VIP Investor Freedom 2025 Portfolio℠ |
| $34,303 | S&P 500® Index |
VIP Investor Freedom 2030 Portfolio℠
Performance: The Bottom Line
Performance numbers are net of all underlying fund operating expenses, but do not include any insurance charges imposed by your insurance company’s separate account. If performance information included the effect of these additional charges, the total returns would have been lower.
Average annual total return reflects the change in the value of an investment, assuming reinvestment of distributions from dividend income and capital gains (the profits earned upon the sale of securities that have grown in value, if any) and assuming a constant rate of performance each year. During periods of reimbursement by Fidelity, a fund’s total return will be greater than it would be had the reimbursement not occurred. Performance numbers are net of all underlying fund operating expenses, but do not include any insurance charges imposed by your insurance company’s separate account. If performance information included the effect of these additional charges, the total returns would have been lower. How a fund did yesterday is no guarantee of how it will do tomorrow.
Average Annual Total Returns
| Periods ended December 31, 2018 | Past 1 year | Past 5 years | Past 10 years |
| VIP Investor Freedom 2030 Portfolio℠ | (7.87)% | 4.39% | 9.98% |
$10,000 Over 10 Years
Let's say hypothetically that $10,000 was invested in VIP Investor Freedom 2030 Portfolio℠ on December 31, 2008.
The chart shows how the value of your investment would have changed, and also shows how the S&P 500® Index performed over the same period.

| Period Ending Values |
| $25,890 | VIP Investor Freedom 2030 Portfolio℠ |
| $34,303 | S&P 500® Index |
Management's Discussion of Fund Performance
Market Recap: The global economy remained in expansion in 2018, but growth became less synchronous and more uneven. Meanwhile, global monetary policy became a headwind, and this uncertainty spurred an increase in volatility among risk assets. China entered a growth recession in the latter part of the year, and this slowdown, along with global monetary tightening and trade-policy uncertainty between China and the U.S., weighed on the industrial sectors in Europe and elsewhere. Looking at global assets, the year marked a reversal of sorts, with the positive trajectory of equities seen earlier in the period turning decidedly negative later in the second half. Several factors served to dim the outlook for risk assets, including the pace of the U.S. Federal Reserve’s interest rate increases, emerging late-cycle conditions, slowing economic growth in China, falling commodity prices and the U.K.’s planned “Brexit” from the European Union. Against this backdrop, non-U.S. equities suffered a pronounced, broad-based correction, returning -14.04% for the year, according to the MSCI ACWI ex USA Index. Among regions in the index, Asia-Pacific (-11%) and Japan (-13%) held up best, whereas resource-rich Canada (-17%), Europe (-14%) and emerging markets (-14%) lagged. In a turnaround from prior quarters in 2018, the value segment of equity markets outpaced growth across the globe amid the fourth-quarter downturn. Results at home, albeit negative, were comparatively strong globally, with the U.S. bellwether S&P 500
® index returning -4.38%. Sector-wise, seven of the 11 major sectors in the S&P 500
® lost ground this period. Falling crude-oil prices caused energy stocks (-18%) to suffer most, while concerns about slowing global growth felled the materials (-15%), industrials (-13%) and financials (-13%) sectors. Conversely, health care (+6%) led the way, followed by the utilities (+4%), information technology (+3%) and consumer discretionary (+2%) sectors. The small-cap-oriented Russell 2000
® Index had a return of -11.01% for the year. Commodities also struggled, as reflected in the -11.25% result of the Bloomberg Barclays Commodity Index Total Return. U.S. investment-grade bonds were roughly flat (+0.01%) for the 12 months, according to the Bloomberg Barclays U.S. Aggregate Bond Index. In the latter half of the period, concerns about global growth pushed Treasury yields lower and credit spreads wider. Short-term debt, as shown by the Bloomberg Barclays U.S. 3-Month Treasury Bellwether Index, led most U.S. investment-grade sectors with a return of 1.9%, followed by asset-backed securities (+1.8%) and agency bonds (+1.3%), while corporate credit returned -2.1%. Elsewhere, international bonds faced a similar struggle, while other non-core, more-credit-sensitive fixed-income segments, including U.S. high-yield corporates and emerging-markets debt also had a difficult year.
Comments from Co-Portfolio Managers Andrew Dierdorf and Brett Sumsion: For the year, VIP Investor Freedom Funds posted returns ranging from -2.03% for VIP Investor Freedom Income Portfolio to -7.87% for VIP Investor Freedom 2030 Portfolio. Each VIP Investor Freedom Portfolio underperformed its respective Composite benchmark by roughly 1 to 3 percentage points. Versus Composites, underlying investment performance was the primary reason for the Portfolios’ underperformance the past year, with asset allocation detracting to a lesser extent. In terms of investment performance, our underlying U.S. equity positions hurt most. Here, a handful of underlying investments, including Fidelity
® VIP Growth & Income Portfolio and Fidelity
® VIP Value Portfolio, each lagged their respective benchmarks by roughly 5 percentage points for the 12 months. Non-U.S. equity investments notably detracted, as investments in Fidelity
® VIP Emerging Markets Portfolio and Fidelity
® VIP Overseas Portfolio trailed their benchmarks by about 3 and 1 percentage points, respectively. In terms of asset allocation, underweighting investment-grade bonds held back the Portfolios’ relative performance. Intra-asset class allocation decisions within U.S. equities also notably detracted, especially allocations to value-oriented strategies, which lagged growth in 2018. An overweighting in emerging-markets stocks – the worst-performing asset class this year – also hurt. Conversely, higher allocations to long-term U.S. Treasury bonds, short-term debt and inflation-protected securities added value relative to Composites.
The views expressed above reflect those of the portfolio manager(s) only through the end of the period as stated on the cover of this report and do not necessarily represent the views of Fidelity or any other person in the Fidelity organization. Any such views are subject to change at any time based upon market or other conditions and Fidelity disclaims any responsibility to update such views. These views may not be relied on as investment advice and, because investment decisions for a Fidelity fund are based on numerous factors, may not be relied on as an indication of trading intent on behalf of any Fidelity fund.
Note to Shareholders: In May, the Board of Trustees for Fidelity VIP Investor Freedom Funds approved some enhancements to the glide path for Fidelity's target-date portfolios, adding inflation-protected debt and long-term U.S. Treasury bonds. These adjustments were implemented by the end of 2018.
VIP Investor Freedom Income Portfolio℠
Investment Summary (Unaudited)
The information in the following tables is based on the direct investments of the Fund.
Top Holdings as of December 31, 2018
| | % of fund's net assets |
| VIP Investment Grade Bond Portfolio Investor Class | 36.2 |
| VIP Government Money Market Portfolio Investor Class 2.16% | 24.1 |
| Fidelity Inflation-Protected Bond Index Fund Institutional Premium Class | 12.4 |
| Fidelity Long Term Treasury Bond Index Fund | 5.5 |
| VIP Overseas Portfolio Investor Class | 5.4 |
| VIP Emerging Markets Portfolio Investor Class | 4.2 |
| VIP Growth & Income Portfolio Investor Class | 2.1 |
| VIP High Income Portfolio Investor Class | 2.0 |
| VIP Equity-Income Portfolio Investor Class | 1.9 |
| VIP Growth Portfolio Investor Class | 1.8 |
| | 95.6 |
Asset Allocation (% of fund's net assets)
| Period end |
| | Domestic Equity Funds | 10.2% |
| | International Equity Funds | 9.6% |
| | Bond Funds | 56.1% |
| | Short-Term Funds | 24.1% |

VIP Investor Freedom Income Portfolio℠
Schedule of Investments December 31, 2018
Showing Percentage of Net Assets
| Domestic Equity Funds - 10.2% | | | |
| | | Shares | Value |
| VIP Contrafund Portfolio Investor Class (a) | | 41,775 | $1,333,876 |
| VIP Equity-Income Portfolio Investor Class (a) | | 69,084 | 1,399,645 |
| VIP Growth & Income Portfolio Investor Class (a) | | 82,668 | 1,595,493 |
| VIP Growth Portfolio Investor Class (a) | | 21,707 | 1,363,415 |
| VIP Mid Cap Portfolio Investor Class (a) | | 12,925 | 387,877 |
| VIP Value Portfolio Investor Class (a) | | 78,713 | 1,027,990 |
| VIP Value Strategies Portfolio Investor Class (a) | | 45,440 | 501,654 |
| TOTAL DOMESTIC EQUITY FUNDS | | | |
| (Cost $6,195,057) | | | 7,609,950 |
|
| International Equity Funds - 9.6% | | | |
| VIP Emerging Markets Portfolio Investor Class (a) | | 316,144 | 3,132,987 |
| VIP Overseas Portfolio Investor Class (a) | | 210,376 | 4,009,769 |
| TOTAL INTERNATIONAL EQUITY FUNDS | | | |
| (Cost $6,155,067) | | | 7,142,756 |
|
| Bond Funds - 56.1% | | | |
| Fidelity Inflation-Protected Bond Index Fund Institutional Premium Class (a) | | 978,534 | 9,286,291 |
| Fidelity Long Term Treasury Bond Index Fund (a) | | 323,236 | 4,098,628 |
| VIP High Income Portfolio Investor Class (a) | | 297,959 | 1,471,917 |
| VIP Investment Grade Bond Portfolio Investor Class (a) | | 2,204,187 | 27,089,462 |
| TOTAL BOND FUNDS | | | |
| (Cost $42,947,364) | | | 41,946,298 |
|
| Short-Term Funds - 24.1% | | | |
| VIP Government Money Market Portfolio Investor Class 2.16% (a)(b) | | | |
| (Cost $18,049,119) | | 18,049,119 | 18,049,119 |
| TOTAL INVESTMENT IN SECURITIES - 100.0% | | | |
| (Cost $73,346,607) | | | 74,748,123 |
| NET OTHER ASSETS (LIABILITIES) - 0.0% | | | 2 |
| NET ASSETS - 100% | | | $74,748,125 |
Legend
(a) Affiliated Fund
(b) The rate quoted is the annualized seven-day yield of the fund at period end.
Affiliated Central Funds
Information regarding fiscal year to date income earned by the Fund from investments in Fidelity Central Funds is as follows:
| Fund | Income earned |
| Fidelity Cash Central Fund | 3 |
| Total | $3 |
Amounts in the income column in the above table include any capital gain distributions from underlying funds, which are presented in the corresponding line-item in the Statement of Operations if applicable.
Affiliated Underlying Funds
Fiscal year to date information regarding the Fund's investments in affiliated Underlying Funds, excluding any Money Market Central Funds, is presented below. Exchanges between classes of the same affiliated Underlying Funds may occur.
| Affiliate | Value, beginning of period | Purchases | Sales Proceeds | Dividend Income | Realized Gain (loss) | Change in Unrealized appreciation (depreciation) | Value, end of period |
| Fidelity Inflation-Protected Bond Index Fund Institutional Premium Class | $-- | $10,349,393 | $750,373 | $193,489 | $(12,724) | $(300,005) | $9,286,291 |
| Fidelity Long Term Treasury Bond Index Fund | -- | 274,693 | 419,547 | 19,961 | (12,624) | 4,403 | 4,098,628 |
| Fidelity Long-Term Treasury Bond Index Fund Premium Class | 1,613,407 | 3,015,576 | 372,084 | 58,891 | (10,638) | 5,442 | -- |
| VIP Contrafund Portfolio Investor Class | 1,841,127 | 734,325 | 1,035,531 | 163,572 | 77,773 | (283,818) | 1,333,876 |
| VIP Emerging Markets Portfolio Investor Class | 2,868,422 | 1,823,285 | 1,010,914 | 19,655 | 33,296 | (581,102) | 3,132,987 |
| VIP Equity-Income Portfolio Investor Class | 1,941,109 | 751,773 | 1,075,047 | 116,751 | 13,189 | (231,379) | 1,399,645 |
| VIP Government Money Market Portfolio Investor Class 2.16% | 24,499,469 | 5,682,991 | 12,133,341 | 352,616 | -- | -- | 18,049,119 |
| VIP Growth & Income Portfolio Investor Class | 2,226,546 | 832,869 | 1,229,137 | 126,459 | 156,206 | (390,991) | 1,595,493 |
| VIP Growth Portfolio Investor Class | 1,874,934 | 834,779 | 1,167,026 | 261,414 | 205,104 | (384,376) | 1,363,415 |
| VIP High Income Portfolio Investor Class | 1,506,782 | 444,277 | 340,867 | 86,039 | (3,786) | (134,489) | 1,471,917 |
| VIP Investment Grade Bond Portfolio Investor Class | 29,526,046 | 7,834,480 | 9,210,735 | 874,144 | (134,709) | (925,620) | 27,089,462 |
| VIP Mid Cap Portfolio Investor Class | 539,310 | 223,861 | 278,904 | 46,249 | 16,486 | (112,876) | 387,877 |
| VIP Overseas Portfolio Investor Class | 4,883,906 | 1,691,762 | 1,858,042 | 65,639 | 103,750 | (811,607) | 4,009,769 |
| VIP Value Portfolio Investor Class | 1,426,078 | 569,908 | 749,792 | 82,759 | 37,093 | (255,297) | 1,027,990 |
| VIP Value Strategies Portfolio Investor Class | 696,511 | 270,771 | 342,235 | 33,344 | 5,862 | (129,255) | 501,654 |
| | 75,443,647 | 35,334,743 | 31,973,575 | 2,500,982 | 474,278 | (4,530,970) | 74,748,123 |
Amounts in the income column in the above table include any capital gain distributions from underlying funds, which are presented in the corresponding line-item in the Statement of Operations if applicable.
Investment Valuation
All investments are categorized as Level 1 under the Fair Value Hierarchy. The inputs or methodology used for valuing securities may not be an indication of the risk associated with investing in those securities. For more information on valuation inputs please refer to the Investment Valuation section in the accompanying Notes to Financial Statements.
See accompanying notes which are an integral part of the financial statements.
VIP Investor Freedom Income Portfolio℠
Financial Statements
Statement of Assets and Liabilities
| | | December 31, 2018 |
| Assets | | |
Investment in securities, at value — See accompanying schedule:
| | |
| Affiliated issuers (cost $73,346,607) | $74,748,123 | |
| Total Investment in Securities (cost $73,346,607) | | $74,748,123 |
| Cash | | 6 |
| Receivable for investments sold | | 1,531,238 |
| Total assets | | 76,279,367 |
| Liabilities | | |
| Payable for investments purchased | $1,012,447 | |
| Payable for fund shares redeemed | 518,795 | |
| Total liabilities | | 1,531,242 |
| Net Assets | | $74,748,125 |
| Net Assets consist of: | | |
| Paid in capital | | $71,965,428 |
| Total distributable earnings (loss) | | 2,782,697 |
| Net Assets, for 6,732,701 shares outstanding | | $74,748,125 |
| Net Asset Value, offering price and redemption price per share ($74,748,125 ÷ 6,732,701 shares) | | $11.10 |
See accompanying notes which are an integral part of the financial statements.
Statement of Operations
| | | Year ended December 31, 2018 |
| Investment Income | | |
| Dividends: | | |
| Affiliated issuers | | $1,373,866 |
| Income from Fidelity Central Funds | | 3 |
| Total income | | 1,373,869 |
| Expenses | | |
| Independent trustees' fees and expenses | $423 | |
| Total expenses | | 423 |
| Net investment income (loss) | | 1,373,446 |
| Realized and Unrealized Gain (Loss) | | |
| Net realized gain (loss) on: | | |
| Investment securities: | | |
| Affiliated issuers | 474,278 | |
| Capital gain distributions from underlying funds: | | |
| Affiliated issuers | 1,127,116 | |
| Total net realized gain (loss) | | 1,601,394 |
| Change in net unrealized appreciation (depreciation) on: | | |
| Investment securities: | | |
| Affiliated issuers | (4,530,970) | |
| Total change in net unrealized appreciation (depreciation) | | (4,530,970) |
| Net gain (loss) | | (2,929,576) |
| Net increase (decrease) in net assets resulting from operations | | $(1,556,130) |
See accompanying notes which are an integral part of the financial statements.
Statement of Changes in Net Assets
| | Year ended December 31, 2018 | Year ended December 31, 2017 |
| Increase (Decrease) in Net Assets | | |
| Operations | | |
| Net investment income (loss) | $1,373,446 | $1,134,659 |
| Net realized gain (loss) | 1,601,394 | 1,086,038 |
| Change in net unrealized appreciation (depreciation) | (4,530,970) | 3,552,258 |
| Net increase (decrease) in net assets resulting from operations | (1,556,130) | 5,772,955 |
| Distributions to shareholders | (2,200,376) | – |
| Distributions to shareholders from net investment income | – | (1,118,100) |
| Distributions to shareholders from net realized gain | – | (669,886) |
| Total distributions | (2,200,376) | (1,787,986) |
| Share transactions | | |
| Proceeds from sales of shares | 16,526,354 | 13,236,976 |
| Reinvestment of distributions | 2,200,376 | 1,787,986 |
| Cost of shares redeemed | (15,667,188) | (10,654,992) |
| Net increase (decrease) in net assets resulting from share transactions | 3,059,542 | 4,369,970 |
| Total increase (decrease) in net assets | (696,964) | 8,354,939 |
| Net Assets | | |
| Beginning of period | 75,445,089 | 67,090,150 |
| End of period | $74,748,125 | $75,445,089 |
| Other Information | | |
| Undistributed net investment income end of period | | $16,559 |
| Shares | | |
| Sold | 1,436,706 | 1,145,861 |
| Issued in reinvestment of distributions | 196,661 | 155,245 |
| Redeemed | (1,363,220) | (923,119) |
| Net increase (decrease) | 270,147 | 377,987 |
See accompanying notes which are an integral part of the financial statements.
Financial Highlights
VIP Investor Freedom Income Portfolio
| | | | | | |
| Years ended December 31, | 2018 | 2017 | 2016 | 2015 | 2014 |
| Selected Per–Share Data | | | | | |
| Net asset value, beginning of period | $11.67 | $11.03 | $10.86 | $11.11 | $10.97 |
| Income from Investment Operations | | | | | |
| Net investment income (loss)A | .21 | .18 | .16 | .19 | .17 |
| Net realized and unrealized gain (loss) | (.45) | .75 | .31 | (.23) | .25 |
| Total from investment operations | (.24) | .93 | .47 | (.04) | .42 |
| Distributions from net investment income | (.20) | (.18) | (.16) | (.19) | (.17) |
| Distributions from net realized gain | (.13) | (.11) | (.14) | (.01) | (.10) |
| Total distributions | (.33) | (.29) | (.30) | (.21)B | (.28)C |
| Net asset value, end of period | $11.10 | $11.67 | $11.03 | $10.86 | $11.11 |
| Total ReturnD,E | (2.03)% | 8.45% | 4.43% | (.37)% | 3.80% |
| Ratios to Average Net AssetsF,G | | | | | |
| Expenses before reductionsH | -% | -% | -% | -% | -% |
| Expenses net of fee waivers, if any | - %H | -% | -% | -% | -% |
| Expenses net of all reductions | - %H | -% | -% | -% | -% |
| Net investment income (loss) | 1.79% | 1.59% | 1.47% | 1.68% | 1.57% |
| Supplemental Data | | | | | |
| Net assets, end of period (000 omitted) | $74,748 | $75,445 | $67,090 | $64,031 | $66,121 |
| Portfolio turnover rateF | 42% | 25% | 25% | 33% | 26% |
A Calculated based on average shares outstanding during the period.
B Total distributions of $.21 per share is comprised of distributions from net investment income of $.194 and distributions from net realized gain of $.015 per share.
C Total distributions of $.28 per share is comprised of distributions from net investment income of $.170 and distributions from net realized gain of $.105 per share.
D Total returns do not reflect charges attributable to your insurance company's separate account. Inclusion of these charges would reduce the total returns shown.
E Total returns would have been lower if certain expenses had not been reduced during the applicable periods shown.
F Amounts do not include the activity of the Underlying Funds.
G Expense ratios reflect operating expenses of the Fund. Expenses before reductions do not reflect amounts reimbursed by the investment adviser or reductions from expense offset arrangements and do not represent the amount paid by the Fund during periods when reimbursements or reductions occur. Expenses net of fee waivers reflect expenses after reimbursement by the investment adviser but prior to reductions from expense offset arrangements. Expenses net of all reductions represent the net expenses paid by the Fund but do not include expenses of the underlying funds in which the Fund invests.
H Amount represents less than .005%.
See accompanying notes which are an integral part of the financial statements.
VIP Investor Freedom 2005 Portfolio℠
Investment Summary (Unaudited)
The information in the following tables is based on the direct investments of the Fund.
Top Holdings as of December 31, 2018
| | % of fund's net assets |
| VIP Investment Grade Bond Portfolio Investor Class | 32.9 |
| VIP Government Money Market Portfolio Investor Class 2.16% | 20.0 |
| Fidelity Inflation-Protected Bond Index Fund Institutional Premium Class | 10.9 |
| VIP Overseas Portfolio Investor Class | 7.2 |
| Fidelity Long Term Treasury Bond Index Fund | 5.7 |
| VIP Emerging Markets Portfolio Investor Class | 5.1 |
| VIP Growth & Income Portfolio Investor Class | 3.4 |
| VIP Equity-Income Portfolio Investor Class | 3.0 |
| VIP Growth Portfolio Investor Class | 2.9 |
| VIP Contrafund Portfolio Investor Class | 2.8 |
| | 93.9 |
Asset Allocation (% of fund's net assets)
| Period end |
| | Domestic Equity Funds | 16.2% |
| | International Equity Funds | 12.3% |
| | Bond Funds | 51.5% |
| | Short-Term Funds | 20.0% |

VIP Investor Freedom 2005 Portfolio℠
Schedule of Investments December 31, 2018
Showing Percentage of Net Assets
| Domestic Equity Funds - 16.2% | | | |
| | | Shares | Value |
| VIP Contrafund Portfolio Investor Class (a) | | 25,491 | $813,919 |
| VIP Equity-Income Portfolio Investor Class (a) | | 42,154 | 854,035 |
| VIP Growth & Income Portfolio Investor Class (a) | | 50,443 | 973,548 |
| VIP Growth Portfolio Investor Class (a) | | 13,245 | 831,938 |
| VIP Mid Cap Portfolio Investor Class (a) | | 7,887 | 236,688 |
| VIP Value Portfolio Investor Class (a) | | 48,031 | 627,279 |
| VIP Value Strategies Portfolio Investor Class (a) | | 27,727 | 306,107 |
| TOTAL DOMESTIC EQUITY FUNDS | | | |
| (Cost $4,091,358) | | | 4,643,514 |
|
| International Equity Funds - 12.3% | | | |
| VIP Emerging Markets Portfolio Investor Class (a) | | 148,318 | 1,469,835 |
| VIP Overseas Portfolio Investor Class (a) | | 107,700 | 2,052,764 |
| TOTAL INTERNATIONAL EQUITY FUNDS | | | |
| (Cost $3,231,363) | | | 3,522,599 |
|
| Bond Funds - 51.5% | | | |
| Fidelity Inflation-Protected Bond Index Fund Institutional Premium Class (a) | | 330,225 | 3,133,834 |
| Fidelity Long Term Treasury Bond Index Fund (a) | | 127,610 | 1,618,090 |
| VIP High Income Portfolio Investor Class (a) | | 114,880 | 567,506 |
| VIP Investment Grade Bond Portfolio Investor Class (a) | | 766,051 | 9,414,760 |
| TOTAL BOND FUNDS | | | |
| (Cost $15,084,158) | | | 14,734,190 |
|
| Short-Term Funds - 20.0% | | | |
| VIP Government Money Market Portfolio Investor Class 2.16% (a)(b) | | | |
| (Cost $5,702,655) | | 5,702,655 | 5,702,655 |
| TOTAL INVESTMENT IN SECURITIES - 100.0% | | | |
| (Cost $28,109,534) | | | 28,602,958 |
| NET OTHER ASSETS (LIABILITIES) - 0.0% | | | (6) |
| NET ASSETS - 100% | | | $28,602,952 |
Legend
(a) Affiliated Fund
(b) The rate quoted is the annualized seven-day yield of the fund at period end.
Affiliated Underlying Funds
Fiscal year to date information regarding the Fund's investments in affiliated Underlying Funds, excluding any Money Market Central Funds, is presented below. Exchanges between classes of the same affiliated Underlying Funds may occur.
| Affiliate | Value, beginning of period | Purchases | Sales Proceeds | Dividend Income | Realized Gain (loss) | Change in Unrealized appreciation (depreciation) | Value, end of period |
| Fidelity Inflation-Protected Bond Index Fund Institutional Premium Class | $-- | $335,457 | $187,429 | $62,417 | $(4,371) | $(97,294) | $3,133,834 |
| Fidelity Inflation-Protected Bond Index Fund Premium Class | -- | 3,295,752 | 203,437 | 3,236 | (4,844) | -- | -- |
| Fidelity Long Term Treasury Bond Index Fund | -- | 205,236 | 202,648 | 7,779 | (12,984) | 11,799 | 1,618,090 |
| Fidelity Long-Term Treasury Bond Index Fund Premium Class | 618,743 | 1,140,273 | 138,378 | 23,135 | (6,038) | 2,087 | -- |
| VIP Contrafund Portfolio Investor Class | 1,047,027 | 417,652 | 529,625 | 92,362 | 22,704 | (143,839) | 813,919 |
| VIP Emerging Markets Portfolio Investor Class | 1,377,196 | 825,179 | 471,796 | 9,189 | 8,069 | (268,813) | 1,469,835 |
| VIP Equity-Income Portfolio Investor Class | 1,103,928 | 401,210 | 521,262 | 67,111 | 7,648 | (137,489) | 854,035 |
| VIP Government Money Market Portfolio Investor Class 2.16% | 7,501,026 | 1,907,705 | 3,706,076 | 109,542 | -- | -- | 5,702,655 |
| VIP Growth & Income Portfolio Investor Class | 1,266,284 | 458,511 | 610,446 | 71,456 | 42,060 | (182,861) | 973,548 |
| VIP Growth Portfolio Investor Class | 1,066,201 | 474,639 | 602,959 | 147,171 | 49,568 | (155,511) | 831,938 |
| VIP High Income Portfolio Investor Class | 576,160 | 178,976 | 135,058 | 32,749 | (4,285) | (48,287) | 567,506 |
| VIP Investment Grade Bond Portfolio Investor Class | 10,309,697 | 2,975,377 | 3,497,543 | 303,221 | (75,130) | (297,641) | 9,414,760 |
| VIP Mid Cap Portfolio Investor Class | 306,705 | 126,169 | 138,691 | 26,104 | 5,828 | (63,323) | 236,688 |
| VIP Overseas Portfolio Investor Class | 2,508,357 | 803,359 | 899,213 | 33,570 | 12,433 | (372,172) | 2,052,764 |
| VIP Value Portfolio Investor Class | 811,018 | 309,734 | 361,650 | 48,144 | 6,312 | (138,135) | 627,279 |
| VIP Value Strategies Portfolio Investor Class | 396,111 | 149,251 | 165,004 | 19,312 | (608) | (73,643) | 306,107 |
| | $28,888,453 | $14,004,480 | $12,371,215 | $1,056,498 | $46,362 | $(1,965,122) | $28,602,958 |
Amounts in the income column in the above table include any capital gain distributions from underlying funds, which are presented in the corresponding line-item in the Statement of Operations if applicable.
Investment Valuation
All investments are categorized as Level 1 under the Fair Value Hierarchy. The inputs or methodology used for valuing securities may not be an indication of the risk associated with investing in those securities. For more information on valuation inputs please refer to the Investment Valuation section in the accompanying Notes to Financial Statements.
See accompanying notes which are an integral part of the financial statements.
VIP Investor Freedom 2005 Portfolio℠
Financial Statements
Statement of Assets and Liabilities
| | | December 31, 2018 |
| Assets | | |
Investment in securities, at value — See accompanying schedule:
| | |
| Affiliated issuers (cost $28,109,534) | $28,602,958 | |
| Total Investment in Securities (cost $28,109,534) | | $28,602,958 |
| Receivable for investments sold | | 472,269 |
| Total assets | | 29,075,227 |
| Liabilities | | |
| Payable for investments purchased | $471,797 | |
| Payable for fund shares redeemed | 478 | |
| Total liabilities | | 472,275 |
| Net Assets | | $28,602,952 |
| Net Assets consist of: | | |
| Paid in capital | | $27,634,031 |
| Total distributable earnings (loss) | | 968,921 |
| Net Assets, for 2,560,875 shares outstanding | | $28,602,952 |
| Net Asset Value, offering price and redemption price per share ($28,602,952 ÷ 2,560,875 shares) | | $11.17 |
See accompanying notes which are an integral part of the financial statements.
Statement of Operations
| | | Year ended December 31, 2018 |
| Investment Income | | |
| Dividends: | | |
| Affiliated issuers | | $499,737 |
| Expenses | | |
| Independent trustees' fees and expenses | $161 | |
| Total expenses | | 161 |
| Net investment income (loss) | | 499,576 |
| Realized and Unrealized Gain (Loss) | | |
| Net realized gain (loss) on: | | |
| Investment securities: | | |
| Affiliated issuers | 46,362 | |
| Capital gain distributions from underlying funds: | | |
| Affiliated issuers | 556,761 | |
| Total net realized gain (loss) | | 603,123 |
| Change in net unrealized appreciation (depreciation) on: | | |
| Investment securities: | | |
| Affiliated issuers | (1,965,122) | |
| Total change in net unrealized appreciation (depreciation) | | (1,965,122) |
| Net gain (loss) | | (1,361,999) |
| Net increase (decrease) in net assets resulting from operations | | $(862,423) |
See accompanying notes which are an integral part of the financial statements.
Statement of Changes in Net Assets
| | Year ended December 31, 2018 | Year ended December 31, 2017 |
| Increase (Decrease) in Net Assets | | |
| Operations | | |
| Net investment income (loss) | $499,576 | $414,006 |
| Net realized gain (loss) | 603,123 | 390,123 |
| Change in net unrealized appreciation (depreciation) | (1,965,122) | 1,623,402 |
| Net increase (decrease) in net assets resulting from operations | (862,423) | 2,427,531 |
| Distributions to shareholders | (802,075) | – |
| Distributions to shareholders from net investment income | – | (408,797) |
| Distributions to shareholders from net realized gain | – | (299,063) |
| Total distributions | (802,075) | (707,860) |
| Share transactions | | |
| Proceeds from sales of shares | 6,573,311 | 9,434,626 |
| Reinvestment of distributions | 802,075 | 707,860 |
| Cost of shares redeemed | (5,996,830) | (3,744,680) |
| Net increase (decrease) in net assets resulting from share transactions | 1,378,556 | 6,397,806 |
| Total increase (decrease) in net assets | (285,942) | 8,117,477 |
| Net Assets | | |
| Beginning of period | 28,888,894 | 20,771,417 |
| End of period | $28,602,952 | $28,888,894 |
| Other Information | | |
| Undistributed net investment income end of period | | $5,209 |
| Shares | | |
| Sold | 563,917 | 808,825 |
| Issued in reinvestment of distributions | 71,230 | 60,793 |
| Redeemed | (512,846) | (325,020) |
| Net increase (decrease) | 122,301 | 544,598 |
See accompanying notes which are an integral part of the financial statements.
Financial Highlights
VIP Investor Freedom 2005 Portfolio
| | | | | | |
| Years ended December 31, | 2018 | 2017 | 2016 | 2015 | 2014 |
| Selected Per–Share Data | | | | | |
| Net asset value, beginning of period | $11.85 | $10.97 | $10.79 | $11.05 | $10.90 |
| Income from Investment Operations | | | | | |
| Net investment income (loss)A | .20 | .20 | .17 | .19 | .19 |
| Net realized and unrealized gain (loss) | (.56) | 1.00 | .35 | (.22) | .27 |
| Total from investment operations | (.36) | 1.20 | .52 | (.03) | .46 |
| Distributions from net investment income | (.20) | (.17) | (.16) | (.20) | (.18) |
| Distributions from net realized gain | (.13) | (.14) | (.17) | (.03) | (.14) |
| Total distributions | (.32)B | (.32)C | (.34)D | (.23) | (.31)E |
| Net asset value, end of period | $11.17 | $11.85 | $10.97 | $10.79 | $11.05 |
| Total ReturnF,G | (3.04)% | 10.97% | 4.94% | (.31)% | 4.25% |
| Ratios to Average Net AssetsH,I | | | | | |
| Expenses before reductionsJ | -% | -% | -% | -% | -% |
| Expenses net of fee waivers, if any | - %J | -% | -% | -% | -% |
| Expenses net of all reductions | - %J | -% | -% | -% | -% |
| Net investment income (loss) | 1.70% | 1.74% | 1.52% | 1.70% | 1.71% |
| Supplemental Data | | | | | |
| Net assets, end of period (000 omitted) | $28,603 | $28,889 | $20,771 | $20,408 | $22,437 |
| Portfolio turnover rateH | 42% | 28% | 35% | 25% | 30% |
A Calculated based on average shares outstanding during the period.
B Total distributions of $.32 per share is comprised of distributions from net investment income of $.196 and distributions from net realized gain of $.125 per share.
C Total distributions of $.32 per share is comprised of distributions from net investment income of $.171 and distributions from net realized gain of $.144 per share.
D Total distributions of $.34 per share is comprised of distributions from net investment income of $.163 and distributions from net realized gain of $.173 per share.
E Total distributions of $.31 per share is comprised of distributions from net investment income of $.175 and distributions from net realized gain of $.135 per share.
F Total returns do not reflect charges attributable to your insurance company's separate account. Inclusion of these charges would reduce the total returns shown.
G Total returns would have been lower if certain expenses had not been reduced during the applicable periods shown.
H Amounts do not include the activity of the Underlying Funds.
I Expense ratios reflect operating expenses of the Fund. Expenses before reductions do not reflect amounts reimbursed by the investment adviser or reductions from expense offset arrangements and do not represent the amount paid by the Fund during periods when reimbursements or reductions occur. Expenses net of fee waivers reflect expenses after reimbursement by the investment adviser but prior to reductions from expense offset arrangements. Expenses net of all reductions represent the net expenses paid by the Fund but do not include expenses of the underlying funds in which the Fund invests.
J Amount represents less than .005%.
See accompanying notes which are an integral part of the financial statements.
VIP Investor Freedom 2010 Portfolio℠
Investment Summary (Unaudited)
The information in the following tables is based on the direct investments of the Fund.
Top Holdings as of December 31, 2018
| | % of fund's net assets |
| VIP Investment Grade Bond Portfolio Investor Class | 29.5 |
| VIP Government Money Market Portfolio Investor Class 2.16% | 15.6 |
| Fidelity Inflation-Protected Bond Index Fund Institutional Premium Class | 9.4 |
| VIP Overseas Portfolio Investor Class | 9.2 |
| VIP Emerging Markets Portfolio Investor Class | 6.1 |
| Fidelity Long Term Treasury Bond Index Fund | 5.6 |
| VIP Growth & Income Portfolio Investor Class | 4.7 |
| VIP Equity-Income Portfolio Investor Class | 4.2 |
| VIP Growth Portfolio Investor Class | 4.0 |
| VIP Contrafund Portfolio Investor Class | 4.0 |
| | 92.3 |
Asset Allocation (% of fund's net assets)
| Period end |
| | Domestic Equity Funds | 22.6% |
| | International Equity Funds | 15.3% |
| | Bond Funds | 46.5% |
| | Short-Term Funds | 15.6% |

VIP Investor Freedom 2010 Portfolio℠
Schedule of Investments December 31, 2018
Showing Percentage of Net Assets
| Domestic Equity Funds - 22.6% | | | |
| | | Shares | Value |
| VIP Contrafund Portfolio Investor Class (a) | | 69,891 | $2,231,630 |
| VIP Equity-Income Portfolio Investor Class (a) | | 115,577 | 2,341,596 |
| VIP Growth & Income Portfolio Investor Class (a) | | 138,304 | 2,669,264 |
| VIP Growth Portfolio Investor Class (a) | | 36,316 | 2,281,026 |
| VIP Mid Cap Portfolio Investor Class (a) | | 21,625 | 648,952 |
| VIP Value Portfolio Investor Class (a) | | 131,691 | 1,719,885 |
| VIP Value Strategies Portfolio Investor Class (a) | | 76,021 | 839,277 |
| TOTAL DOMESTIC EQUITY FUNDS | | | |
| (Cost $11,211,438) | | | 12,731,630 |
|
| International Equity Funds - 15.3% | | | |
| VIP Emerging Markets Portfolio Investor Class (a) | | 347,228 | 3,441,030 |
| VIP Overseas Portfolio Investor Class (a) | | 272,407 | 5,192,080 |
| TOTAL INTERNATIONAL EQUITY FUNDS | | | |
| (Cost $7,935,872) | | | 8,633,110 |
|
| Bond Funds - 46.5% | | | |
| Fidelity Inflation-Protected Bond Index Fund Institutional Premium Class (a) | | 562,150 | 5,334,804 |
| Fidelity Long Term Treasury Bond Index Fund (a) | | 250,670 | 3,178,496 |
| VIP High Income Portfolio Investor Class (a) | | 230,843 | 1,140,366 |
| VIP Investment Grade Bond Portfolio Investor Class (a) | | 1,352,828 | 16,626,255 |
| TOTAL BOND FUNDS | | | |
| (Cost $26,821,191) | | | 26,279,921 |
|
| Short-Term Funds - 15.6% | | | |
| Fidelity Cash Central Fund, 2.42% (b) | | 6 | 5 |
| VIP Government Money Market Portfolio Investor Class 2.16% (a)(c) | | 8,807,628 | 8,807,628 |
| TOTAL SHORT-TERM FUNDS | | | |
| (Cost $8,807,633) | | | 8,807,633 |
| TOTAL INVESTMENT IN SECURITIES - 100.0% | | | |
| (Cost $54,776,134) | | | 56,452,294 |
| NET OTHER ASSETS (LIABILITIES) - 0.0% | | | 47 |
| NET ASSETS - 100% | | | $56,452,341 |
Legend
(a) Affiliated Fund
(b) Affiliated fund that is generally available only to investment companies and other accounts managed by Fidelity Investments. The rate quoted is the annualized seven-day yield of the fund at period end. A complete unaudited listing of the fund's holdings as of its most recent quarter end is available upon request. In addition, each Fidelity Central Fund's financial statements, which are not covered by the Fund's Report of Independent Registered Public Accounting Firm, are available on the SEC's website or upon request.
(c) The rate quoted is the annualized seven-day yield of the fund at period end.
Affiliated Central Funds
Information regarding fiscal year to date income earned by the Fund from investments in Fidelity Central Funds is as follows:
| Fund | Income earned |
| Fidelity Cash Central Fund | 5 |
| Total | $5 |
Amounts in the income column in the above table include any capital gain distributions from underlying funds, which are presented in the corresponding line-item in the Statement of Operations if applicable.
Affiliated Underlying Funds
Fiscal year to date information regarding the Fund's investments in affiliated Underlying Funds, excluding any Money Market Central Funds, is presented below. Exchanges between classes of the same affiliated Underlying Funds may occur.
| Affiliate | Value, beginning of period | Purchases | Sales Proceeds | Dividend Income | Realized Gain (loss) | Change in Unrealized appreciation (depreciation) | Value, end of period |
| Fidelity Inflation-Protected Bond Index Fund Institutional Class | $-- | $5,897,025 | $400,248 | $5,970 | $(9,030) | $-- | $-- |
| Fidelity Inflation-Protected Bond Index Fund Institutional Premium Class | -- | 237,554 | 212,692 | 106,955 | (6,046) | (171,759) | 5,334,804 |
| Fidelity Long Term Treasury Bond Index Fund | -- | 202,626 | 347,957 | 15,835 | (5,097) | (16,819) | 3,178,496 |
| Fidelity Long-Term Treasury Bond Index Fund Premium Class | 1,428,916 | 2,333,583 | 408,341 | 50,875 | (13,788) | 5,373 | -- |
| VIP Contrafund Portfolio Investor Class | 3,147,693 | 859,059 | 1,420,967 | 277,583 | 141,368 | (495,523) | 2,231,630 |
| VIP Emerging Markets Portfolio Investor Class | 3,806,001 | 1,578,766 | 1,282,489 | 22,345 | 87,781 | (749,029) | 3,441,030 |
| VIP Equity-Income Portfolio Investor Class | 3,318,666 | 791,014 | 1,390,569 | 198,742 | (75,990) | (301,525) | 2,341,596 |
| VIP Government Money Market Portfolio Investor Class 2.16% | 13,630,209 | 2,064,845 | 6,887,426 | 185,016 | -- | -- | 8,807,628 |
| VIP Growth & Income Portfolio Investor Class | 3,807,071 | 899,148 | 1,628,758 | 214,626 | 332,385 | (740,582) | 2,669,264 |
| VIP Growth Portfolio Investor Class | 3,205,196 | 1,022,564 | 1,630,579 | 443,395 | 449,212 | (765,367) | 2,281,026 |
| VIP High Income Portfolio Investor Class | 1,334,382 | 249,752 | 334,894 | 68,590 | (12,266) | (96,608) | 1,140,366 |
| VIP Investment Grade Bond Portfolio Investor Class | 21,617,518 | 3,753,903 | 7,982,916 | 578,070 | (180,670) | (581,580) | 16,626,255 |
| VIP Mid Cap Portfolio Investor Class | 922,105 | 267,171 | 374,935 | 78,475 | 27,371 | (192,760) | 648,952 |
| VIP Overseas Portfolio Investor Class | 7,146,681 | 1,368,493 | 2,379,460 | 87,505 | 141,330 | (1,084,964) | 5,192,080 |
| VIP Value Portfolio Investor Class | 2,438,081 | 618,420 | 957,453 | 141,178 | 90,606 | (469,769) | 1,719,885 |
| VIP Value Strategies Portfolio Investor Class | 1,190,716 | 298,175 | 435,544 | 56,835 | 8,298 | (222,368) | 839,277 |
| | $66,993,235 | $22,442,098 | $28,075,228 | $2,531,995 | $975,464 | $(5,883,280) | $56,452,289 |
Amounts in the income column in the above table include any capital gain distributions from underlying funds, which are presented in the corresponding line-item in the Statement of Operations if applicable.
Investment Valuation
All investments are categorized as Level 1 under the Fair Value Hierarchy. The inputs or methodology used for valuing securities may not be an indication of the risk associated with investing in those securities. For more information on valuation inputs please refer to the Investment Valuation section in the accompanying Notes to Financial Statements.
See accompanying notes which are an integral part of the financial statements.
VIP Investor Freedom 2010 Portfolio℠
Financial Statements
Statement of Assets and Liabilities
| | | December 31, 2018 |
| Assets | | |
Investment in securities, at value — See accompanying schedule:
| | |
| Fidelity Central Funds (cost $5) | $5 | |
| Other affiliated issuers (cost $54,776,129) | 56,452,289 | |
| Total Investment in Securities (cost $54,776,134) | | $56,452,294 |
| Receivable for investments sold | | 1,153,181 |
| Distributions receivable from Fidelity Central Funds | | 5 |
| Total assets | | 57,605,480 |
| Liabilities | | |
| Payable for investments purchased | $1,152,042 | |
| Payable for fund shares redeemed | 1,097 | |
| Total liabilities | | 1,153,139 |
| Net Assets | | $56,452,341 |
| Net Assets consist of: | | |
| Paid in capital | | $52,547,794 |
| Total distributable earnings (loss) | | 3,904,547 |
| Net Assets, for 4,788,274 shares outstanding | | $56,452,341 |
| Net Asset Value, offering price and redemption price per share ($56,452,341 ÷ 4,788,274 shares) | | $11.79 |
See accompanying notes which are an integral part of the financial statements.
Statement of Operations
| | | Year ended December 31, 2018 |
| Investment Income | | |
| Dividends: | | |
| Affiliated issuers | | $999,707 |
| Income from Fidelity Central Funds | | 5 |
| Total income | | 999,712 |
| Expenses | | |
| Independent trustees' fees and expenses | $358 | |
| Total expenses | | 358 |
| Net investment income (loss) | | 999,354 |
| Realized and Unrealized Gain (Loss) | | |
| Net realized gain (loss) on: | | |
| Investment securities: | | |
| Affiliated issuers | 975,464 | |
| Capital gain distributions from underlying funds: | | |
| Affiliated issuers | 1,532,288 | |
| Total net realized gain (loss) | | 2,507,752 |
| Change in net unrealized appreciation (depreciation) on: | | |
| Investment securities: | | |
| Affiliated issuers | (5,883,280) | |
| Total change in net unrealized appreciation (depreciation) | | (5,883,280) |
| Net gain (loss) | | (3,375,528) |
| Net increase (decrease) in net assets resulting from operations | | $(2,376,174) |
See accompanying notes which are an integral part of the financial statements.
Statement of Changes in Net Assets
| | Year ended December 31, 2018 | Year ended December 31, 2017 |
| Increase (Decrease) in Net Assets | | |
| Operations | | |
| Net investment income (loss) | $999,354 | $992,334 |
| Net realized gain (loss) | 2,507,752 | 1,772,099 |
| Change in net unrealized appreciation (depreciation) | (5,883,280) | 5,029,085 |
| Net increase (decrease) in net assets resulting from operations | (2,376,174) | 7,793,518 |
| Distributions to shareholders | (2,387,666) | – |
| Distributions to shareholders from net investment income | – | (983,630) |
| Distributions to shareholders from net realized gain | – | (1,113,146) |
| Total distributions | (2,387,666) | (2,096,776) |
| Share transactions | | |
| Proceeds from sales of shares | 6,494,790 | 7,828,054 |
| Reinvestment of distributions | 2,387,666 | 2,096,776 |
| Cost of shares redeemed | (14,659,514) | (8,132,199) |
| Net increase (decrease) in net assets resulting from share transactions | (5,777,058) | 1,792,631 |
| Total increase (decrease) in net assets | (10,540,898) | 7,489,373 |
| Net Assets | | |
| Beginning of period | 66,993,239 | 59,503,866 |
| End of period | $56,452,341 | $66,993,239 |
| Other Information | | |
| Shares | | |
| Sold | 517,467 | 636,783 |
| Issued in reinvestment of distributions | 197,092 | 169,127 |
| Redeemed | (1,168,511) | (657,418) |
| Net increase (decrease) | (453,952) | 148,492 |
See accompanying notes which are an integral part of the financial statements.
Financial Highlights
VIP Investor Freedom 2010 Portfolio
| | | | | | |
| Years ended December 31, | 2018 | 2017 | 2016 | 2015 | 2014 |
| Selected Per–Share Data | | | | | |
| Net asset value, beginning of period | $12.78 | $11.68 | $11.49 | $11.77 | $11.64 |
| Income from Investment Operations | | | | | |
| Net investment income (loss)A | .20 | .19 | .17 | .21 | .20 |
| Net realized and unrealized gain (loss) | (.71) | 1.32 | .42 | (.25) | .33 |
| Total from investment operations | (.51) | 1.51 | .59 | (.04) | .53 |
| Distributions from net investment income | (.21) | (.19) | (.18) | (.21) | (.19) |
| Distributions from net realized gain | (.27) | (.22) | (.22) | (.03) | (.20) |
| Total distributions | (.48) | (.41) | (.40) | (.24) | (.40)B |
| Net asset value, end of period | $11.79 | $12.78 | $11.68 | $11.49 | $11.77 |
| Total ReturnC,D | (4.06)% | 13.05% | 5.33% | (.34)% | 4.56% |
| Ratios to Average Net AssetsE,F | | | | | |
| Expenses before reductionsG | -% | -% | -% | -% | -% |
| Expenses net of fee waivers, if any | - %G | -% | -% | -% | -% |
| Expenses net of all reductions | - %G | -% | -% | -% | -% |
| Net investment income (loss) | 1.57% | 1.55% | 1.47% | 1.76% | 1.66% |
| Supplemental Data | | | | | |
| Net assets, end of period (000 omitted) | $56,452 | $66,993 | $59,504 | $59,469 | $62,339 |
| Portfolio turnover rateE | 35% | 25% | 24% | 21% | 27% |
A Calculated based on average shares outstanding during the period.
B Total distributions of $.40 per share is comprised of distributions from net investment income of $.192 and distributions from net realized gain of $.204 per share.
C Total returns do not reflect charges attributable to your insurance company's separate account. Inclusion of these charges would reduce the total returns shown.
D Total returns would have been lower if certain expenses had not been reduced during the applicable periods shown.
E Amounts do not include the activity of the Underlying Funds.
F Expense ratios reflect operating expenses of the Fund. Expenses before reductions do not reflect amounts reimbursed by the investment adviser or reductions from expense offset arrangements and do not represent the amount paid by the Fund during periods when reimbursements or reductions occur. Expenses net of fee waivers reflect expenses after reimbursement by the investment adviser but prior to reductions from expense offset arrangements. Expenses net of all reductions represent the net expenses paid by the Fund but do not include expenses of the underlying funds in which the Fund invests.
G Amount represents less than .005%.
See accompanying notes which are an integral part of the financial statements.
VIP Investor Freedom 2015 Portfolio℠
Investment Summary (Unaudited)
The information in the following tables is based on the direct investments of the Fund.
Top Holdings as of December 31, 2018
| | % of fund's net assets |
| VIP Investment Grade Bond Portfolio Investor Class | 25.8 |
| VIP Government Money Market Portfolio Investor Class 2.16% | 11.6 |
| VIP Overseas Portfolio Investor Class | 11.2 |
| Fidelity Inflation-Protected Bond Index Fund Institutional Premium Class | 8.1 |
| VIP Emerging Markets Portfolio Investor Class | 6.8 |
| VIP Growth & Income Portfolio Investor Class | 6.0 |
| Fidelity Long Term Treasury Bond Index Fund | 5.5 |
| VIP Equity-Income Portfolio Investor Class | 5.3 |
| VIP Growth Portfolio Investor Class | 5.2 |
| VIP Contrafund Portfolio Investor Class | 5.1 |
| | 90.6 |
Asset Allocation (% of fund's net assets)
| Period end |
| | Domestic Equity Funds | 28.9% |
| | International Equity Funds | 18.0% |
| | Bond Funds | 41.5% |
| | Short-Term Funds | 11.6% |

VIP Investor Freedom 2015 Portfolio℠
Schedule of Investments December 31, 2018
Showing Percentage of Net Assets
| Domestic Equity Funds - 28.9% | | | |
| | | Shares | Value |
| VIP Contrafund Portfolio Investor Class (a) | | 153,507 | $4,901,480 |
| VIP Equity-Income Portfolio Investor Class (a) | | 253,846 | 5,142,912 |
| VIP Growth & Income Portfolio Investor Class (a) | | 303,761 | 5,862,583 |
| VIP Growth Portfolio Investor Class (a) | | 79,764 | 5,009,972 |
| VIP Mid Cap Portfolio Investor Class (a) | | 47,482 | 1,424,940 |
| VIP Value Portfolio Investor Class (a) | | 289,231 | 3,777,351 |
| VIP Value Strategies Portfolio Investor Class (a) | | 166,935 | 1,842,963 |
| TOTAL DOMESTIC EQUITY FUNDS | | | |
| (Cost $24,049,339) | | | 27,962,201 |
|
| International Equity Funds - 18.0% | | | |
| VIP Emerging Markets Portfolio Investor Class (a) | | 665,873 | 6,598,806 |
| VIP Overseas Portfolio Investor Class (a) | | 569,793 | 10,860,253 |
| TOTAL INTERNATIONAL EQUITY FUNDS | | | |
| (Cost $15,710,682) | | | 17,459,059 |
|
| Bond Funds - 41.5% | | | |
| Fidelity Inflation-Protected Bond Index Fund Institutional Premium Class (a) | | 823,771 | 7,817,585 |
| Fidelity Long Term Treasury Bond Index Fund (a) | | 419,502 | 5,319,291 |
| VIP High Income Portfolio Investor Class (a) | | 399,096 | 1,971,533 |
| VIP Investment Grade Bond Portfolio Investor Class (a) | | 2,034,430 | 25,003,143 |
| TOTAL BOND FUNDS | | | |
| (Cost $41,009,292) | | | 40,111,552 |
|
| Short-Term Funds - 11.6% | | | |
| Fidelity Cash Central Fund, 2.42% (b) | | 1 | 1 |
| VIP Government Money Market Portfolio Investor Class 2.16% (a)(c) | | 11,248,273 | 11,248,273 |
| TOTAL SHORT-TERM FUNDS | | | |
| (Cost $11,248,274) | | | 11,248,274 |
| TOTAL INVESTMENT IN SECURITIES - 100.0% | | | |
| (Cost $92,017,587) | | | 96,781,086 |
| NET OTHER ASSETS (LIABILITIES) - 0.0% | | | (7) |
| NET ASSETS - 100% | | | $96,781,079 |
Legend
(a) Affiliated Fund
(b) Affiliated fund that is generally available only to investment companies and other accounts managed by Fidelity Investments. The rate quoted is the annualized seven-day yield of the fund at period end. A complete unaudited listing of the fund's holdings as of its most recent quarter end is available upon request. In addition, each Fidelity Central Fund's financial statements, which are not covered by the Fund's Report of Independent Registered Public Accounting Firm, are available on the SEC's website or upon request.
(c) The rate quoted is the annualized seven-day yield of the fund at period end.
Affiliated Central Funds
Information regarding fiscal year to date income earned by the Fund from investments in Fidelity Central Funds is as follows:
| Fund | Income earned |
| Fidelity Cash Central Fund | 8 |
| Total | $8 |
Amounts in the income column in the above table include any capital gain distributions from underlying funds, which are presented in the corresponding line-item in the Statement of Operations if applicable.
Affiliated Underlying Funds
Fiscal year to date information regarding the Fund's investments in affiliated Underlying Funds, excluding any Money Market Central Funds, is presented below. Exchanges between classes of the same affiliated Underlying Funds may occur.
| Affiliate | Value, beginning of period | Purchases | Sales Proceeds | Dividend Income | Realized Gain (loss) | Change in Unrealized appreciation (depreciation) | Value, end of period |
| Fidelity Inflation-Protected Bond Index Fund Institutional Class | $-- | $8,660,063 | $307,213 | $8,723 | $(6,048) | $-- | $-- |
| Fidelity Inflation-Protected Bond Index Fund Institutional Premium Class | -- | 254,451 | 512,214 | 159,772 | (12,697) | (258,757) | 7,817,585 |
| Fidelity Long Term Treasury Bond Index Fund | -- | 315,863 | 724,600 | 27,109 | (29,844) | (23,937) | 5,319,291 |
| Fidelity Long-Term Treasury Bond Index Fund Premium Class | 2,371,814 | 3,811,917 | 399,978 | 85,432 | (10,825) | 8,881 | -- |
| VIP Contrafund Portfolio Investor Class | 6,414,612 | 1,602,871 | 2,316,617 | 566,839 | 192,216 | (991,602) | 4,901,480 |
| VIP Emerging Markets Portfolio Investor Class | 7,059,060 | 2,701,130 | 1,875,546 | 43,275 | 96,592 | (1,382,430) | 6,598,806 |
| VIP Equity-Income Portfolio Investor Class | 6,763,168 | 1,442,383 | 2,222,356 | 414,121 | (85,111) | (755,172) | 5,142,912 |
| VIP Government Money Market Portfolio Investor Class 2.16% | 16,559,889 | 2,346,413 | 7,658,029 | 231,438 | -- | -- | 11,248,273 |
| VIP Growth & Income Portfolio Investor Class | 7,758,398 | 1,632,995 | 2,605,628 | 438,655 | 472,124 | (1,395,306) | 5,862,583 |
| VIP Growth Portfolio Investor Class | 6,531,800 | 1,927,685 | 2,731,393 | 902,336 | 599,327 | (1,317,447) | 5,009,972 |
| VIP High Income Portfolio Investor Class | 2,202,312 | 397,141 | 436,636 | 118,305 | (14,743) | (176,541) | 1,971,533 |
| VIP Investment Grade Bond Portfolio Investor Class | 31,699,720 | 5,264,690 | 10,830,213 | 870,053 | (288,156) | (842,898) | 25,003,143 |
| VIP Mid Cap Portfolio Investor Class | 1,879,117 | 515,651 | 602,424 | 160,201 | 43,785 | (411,189) | 1,424,940 |
| VIP Overseas Portfolio Investor Class | 14,068,103 | 2,357,219 | 3,539,697 | 185,780 | 221,839 | (2,247,211) | 10,860,253 |
| VIP Value Portfolio Investor Class | 4,968,700 | 1,156,822 | 1,495,829 | 298,113 | 103,371 | (955,713) | 3,777,351 |
| VIP Value Strategies Portfolio Investor Class | 2,426,589 | 564,014 | 670,917 | 119,428 | 8,637 | (485,360) | 1,842,963 |
| | $110,703,282 | $34,951,308 | $38,929,290 | $4,629,580 | $1,290,467 | $(11,234,682) | $96,781,085 |
Amounts in the income column in the above table include any capital gain distributions from underlying funds, which are presented in the corresponding line-item in the Statement of Operations if applicable.
Investment Valuation
All investments are categorized as Level 1 under the Fair Value Hierarchy. The inputs or methodology used for valuing securities may not be an indication of the risk associated with investing in those securities. For more information on valuation inputs please refer to the Investment Valuation section in the accompanying Notes to Financial Statements.
See accompanying notes which are an integral part of the financial statements.
VIP Investor Freedom 2015 Portfolio℠
Financial Statements
Statement of Assets and Liabilities
| | | December 31, 2018 |
| Assets | | |
Investment in securities, at value — See accompanying schedule:
| | |
| Fidelity Central Funds (cost $1) | $1 | |
| Other affiliated issuers (cost $92,017,586) | 96,781,085 | |
| Total Investment in Securities (cost $92,017,587) | | $96,781,086 |
| Receivable for investments sold | | 2,569,102 |
| Distributions receivable from Fidelity Central Funds | | 8 |
| Total assets | | 99,350,196 |
| Liabilities | | |
| Payable for investments purchased | $2,184,694 | |
| Payable for fund shares redeemed | 384,423 | |
| Total liabilities | | 2,569,117 |
| Net Assets | | $96,781,079 |
| Net Assets consist of: | | |
| Paid in capital | | $88,260,755 |
| Total distributable earnings (loss) | | 8,520,324 |
| Net Assets, for 8,353,335 shares outstanding | | $96,781,079 |
| Net Asset Value, offering price and redemption price per share ($96,781,079 ÷ 8,353,335 shares) | | $11.59 |
See accompanying notes which are an integral part of the financial statements.
Statement of Operations
| | | Year ended December 31, 2018 |
| Investment Income | | |
| Dividends: | | |
| Affiliated issuers | | 1,631,645 |
| Income from Fidelity Central Funds | | $8 |
| Total income | | 1,631,653 |
| Expenses | | |
| Independent trustees' fees and expenses | $599 | |
| Total expenses | | 599 |
| Net investment income (loss) | | 1,631,054 |
| Realized and Unrealized Gain (Loss) | | |
| Net realized gain (loss) on: | | |
| Investment securities: | | |
| Affiliated issuers | 1,290,467 | |
| Capital gain distributions from underlying funds: | | |
| Affiliated issuers | 2,997,935 | |
| Total net realized gain (loss) | | 4,288,402 |
| Change in net unrealized appreciation (depreciation) on: | | |
| Investment securities: | | |
| Affiliated issuers | (11,234,682) | |
| Total change in net unrealized appreciation (depreciation) | | (11,234,682) |
| Net gain (loss) | | (6,946,280) |
| Net increase (decrease) in net assets resulting from operations | | $(5,315,226) |
See accompanying notes which are an integral part of the financial statements.
Statement of Changes in Net Assets
| | Year ended December 31, 2018 | Year ended December 31, 2017 |
| Increase (Decrease) in Net Assets | | |
| Operations | | |
| Net investment income (loss) | $1,631,054 | $1,605,912 |
| Net realized gain (loss) | 4,288,402 | 3,274,702 |
| Change in net unrealized appreciation (depreciation) | (11,234,682) | 9,824,411 |
| Net increase (decrease) in net assets resulting from operations | (5,315,226) | 14,705,025 |
| Distributions to shareholders | (4,274,043) | – |
| Distributions to shareholders from net investment income | – | (1,590,867) |
| Distributions to shareholders from net realized gain | – | (2,315,095) |
| Total distributions | (4,274,043) | (3,905,962) |
| Share transactions | | |
| Proceeds from sales of shares | 8,909,312 | 9,716,733 |
| Reinvestment of distributions | 4,274,043 | 3,905,962 |
| Cost of shares redeemed | (17,517,259) | (11,389,269) |
| Net increase (decrease) in net assets resulting from share transactions | (4,333,904) | 2,233,426 |
| Total increase (decrease) in net assets | (13,923,173) | 13,032,489 |
| Net Assets | | |
| Beginning of period | 110,704,252 | 97,671,763 |
| End of period | $96,781,079 | $110,704,252 |
| Other Information | | |
| Undistributed net investment income end of period | | $7,318 |
| Shares | | |
| Sold | 707,025 | 798,660 |
| Issued in reinvestment of distributions | 356,487 | 319,835 |
| Redeemed | (1,411,157) | (928,642) |
| Net increase (decrease) | (347,645) | 189,853 |
See accompanying notes which are an integral part of the financial statements.
Financial Highlights
VIP Investor Freedom 2015 Portfolio
| | | | | | |
| Years ended December 31, | 2018 | 2017 | 2016 | 2015 | 2014 |
| Selected Per–Share Data | | | | | |
| Net asset value, beginning of period | $12.72 | $11.48 | $11.34 | $11.63 | $11.48 |
| Income from Investment Operations | | | | | |
| Net investment income (loss)A | .19 | .19 | .17 | .21 | .19 |
| Net realized and unrealized gain (loss) | (.82) | 1.51 | .45 | (.25) | .34 |
| Total from investment operations | (.63) | 1.70 | .62 | (.04) | .53 |
| Distributions from net investment income | (.19) | (.19) | (.18) | (.22) | (.19) |
| Distributions from net realized gain | (.31) | (.27) | (.31) | (.04) | (.19) |
| Total distributions | (.50) | (.46) | (.48)B | (.25)C | (.38) |
| Net asset value, end of period | $11.59 | $12.72 | $11.48 | $11.34 | $11.63 |
| Total ReturnD,E | (5.02)% | 14.99% | 5.82% | (.34)% | 4.65% |
| Ratios to Average Net AssetsF,G | | | | | |
| Expenses before reductionsH | -% | -% | -% | -% | -% |
| Expenses net of fee waivers, if any | - %H | -% | -% | -% | -% |
| Expenses net of all reductions | - %H | -% | -% | -% | -% |
| Net investment income (loss) | 1.53% | 1.52% | 1.53% | 1.77% | 1.67% |
| Supplemental Data | | | | | |
| Net assets, end of period (000 omitted) | $96,781 | $110,704 | $97,672 | $95,761 | $101,740 |
| Portfolio turnover rateF | 33% | 23% | 23% | 21% | 20% |
A Calculated based on average shares outstanding during the period.
B Total distributions of $.48 per share is comprised of distributions from net investment income of $.175 and distributions from net realized gain of $.306 per share.
C Total distributions of $.25 per share is comprised of distributions from net investment income of $.215 and distributions from net realized gain of $.037 per share.
D Total returns do not reflect charges attributable to your insurance company's separate account. Inclusion of these charges would reduce the total returns shown.
E Total returns would have been lower if certain expenses had not been reduced during the applicable periods shown.
F Amounts do not include the activity of the Underlying Funds.
G Expense ratios reflect operating expenses of the Fund. Expenses before reductions do not reflect amounts reimbursed by the investment adviser or reductions from expense offset arrangements and do not represent the amount paid by the Fund during periods when reimbursements or reductions occur. Expenses net of fee waivers reflect expenses after reimbursement by the investment adviser but prior to reductions from expense offset arrangements. Expenses net of all reductions represent the net expenses paid by the Fund but do not include expenses of the underlying funds in which the Fund invests.
H Amount represents less than .005%.
See accompanying notes which are an integral part of the financial statements.
VIP Investor Freedom 2020 Portfolio℠
Investment Summary (Unaudited)
The information in the following tables is based on the direct investments of the Fund.
Top Holdings as of December 31, 2018
| | % of fund's net assets |
| VIP Investment Grade Bond Portfolio Investor Class | 23.1 |
| VIP Overseas Portfolio Investor Class | 12.8 |
| VIP Government Money Market Portfolio Investor Class 2.16% | 8.2 |
| VIP Emerging Markets Portfolio Investor Class | 7.5 |
| VIP Growth & Income Portfolio Investor Class | 7.2 |
| Fidelity Inflation-Protected Bond Index Fund Institutional Premium Class | 7.0 |
| VIP Equity-Income Portfolio Investor Class | 6.3 |
| VIP Growth Portfolio Investor Class | 6.1 |
| VIP Contrafund Portfolio Investor Class | 6.0 |
| Fidelity Long Term Treasury Bond Index Fund | 5.3 |
| | 89.5 |
Asset Allocation (% of fund's net assets)
| Period end |
| | Domestic Equity Funds | 34.1% |
| | International Equity Funds | 20.3% |
| | Bond Funds | 37.4% |
| | Short-Term Funds | 8.2% |

VIP Investor Freedom 2020 Portfolio℠
Schedule of Investments December 31, 2018
Showing Percentage of Net Assets
| Domestic Equity Funds - 34.1% | | | |
| | | Shares | Value |
| VIP Contrafund Portfolio Investor Class (a) | | 367,741 | $11,741,959 |
| VIP Equity-Income Portfolio Investor Class (a) | | 608,109 | 12,320,288 |
| VIP Growth & Income Portfolio Investor Class (a) | | 727,691 | 14,044,444 |
| VIP Growth Portfolio Investor Class (a) | | 191,082 | 12,001,835 |
| VIP Mid Cap Portfolio Investor Class (a) | | 113,718 | 3,412,665 |
| VIP Value Portfolio Investor Class (a) | | 692,853 | 9,048,663 |
| VIP Value Strategies Portfolio Investor Class (a) | | 399,840 | 4,414,230 |
| TOTAL DOMESTIC EQUITY FUNDS | | | |
| (Cost $58,424,988) | | | 66,984,084 |
|
| International Equity Funds - 20.3% | | | |
| VIP Emerging Markets Portfolio Investor Class (a) | | 1,481,267 | 14,679,352 |
| VIP Overseas Portfolio Investor Class (a) | | 1,326,449 | 25,282,123 |
| TOTAL INTERNATIONAL EQUITY FUNDS | | | |
| (Cost $36,600,125) | | | 39,961,475 |
|
| Bond Funds - 37.4% | | | |
| Fidelity Inflation-Protected Bond Index Fund Institutional Premium Class (a) | | 1,457,415 | 13,830,873 |
| Fidelity Long Term Treasury Bond Index Fund (a) | | 815,857 | 10,345,069 |
| VIP High Income Portfolio Investor Class (a) | | 803,999 | 3,971,755 |
| VIP Investment Grade Bond Portfolio Investor Class (a) | | 3,692,664 | 45,382,844 |
| TOTAL BOND FUNDS | | | |
| (Cost $75,113,178) | | | 73,530,541 |
|
| Short-Term Funds - 8.2% | | | |
| VIP Government Money Market Portfolio Investor Class 2.16% (a)(b) | | | |
| (Cost $16,050,848) | | 16,050,848 | 16,050,848 |
| TOTAL INVESTMENT IN SECURITIES - 100.0% | | | |
| (Cost $186,189,139) | | | 196,526,948 |
| NET OTHER ASSETS (LIABILITIES) - 0.0% | | | (19) |
| NET ASSETS - 100% | | | $196,526,929 |
Legend
(a) Affiliated Fund
(b) The rate quoted is the annualized seven-day yield of the fund at period end.
Affiliated Central Funds
Information regarding fiscal year to date income earned by the Fund from investments in Fidelity Central Funds is as follows:
| Fund | Income earned |
| Fidelity Cash Central Fund | 10 |
| Total | $10 |
Amounts in the income column in the above table include any capital gain distributions from underlying funds, which are presented in the corresponding line-item in the Statement of Operations if applicable.
Affiliated Underlying Funds
Fiscal year to date information regarding the Fund's investments in affiliated Underlying Funds, excluding any Money Market Central Funds, is presented below. Exchanges between classes of the same affiliated Underlying Funds may occur.
| Affiliate | Value, beginning of period | Purchases | Sales Proceeds | Dividend Income | Realized Gain (loss) | Change in Unrealized appreciation (depreciation) | Value, end of period |
| Fidelity Inflation-Protected Bond Index Fund Institutional Premium Class | $-- | $15,881,209 | $1,556,805 | $298,380 | $(40,894) | $(452,637) | $13,830,873 |
| Fidelity Long Term Treasury Bond Index Fund | -- | 437,525 | 1,589,247 | 53,210 | (6,636) | 275,865 | 10,345,069 |
| Fidelity Long-Term Treasury Bond Index Fund Institutional Class | -- | 11,616,720 | 386,105 | 119,379 | (3,053) | -- | -- |
| Fidelity Long-Term Treasury Bond Index Fund Premium Class | 4,715,362 | 598,236 | 4,929,626 | 53,567 | (401,413) | 17,441 | -- |
| VIP Contrafund Portfolio Investor Class | 14,766,318 | 3,265,749 | 4,353,216 | 1,326,713 | 272,911 | (2,209,803) | 11,741,959 |
| VIP Emerging Markets Portfolio Investor Class | 15,396,349 | 5,707,074 | 3,537,581 | 96,051 | 122,424 | (3,008,914) | 14,679,352 |
| VIP Equity-Income Portfolio Investor Class | 15,568,306 | 3,201,777 | 4,446,915 | 973,904 | (261,609) | (1,741,271) | 12,320,288 |
| VIP Government Money Market Portfolio Investor Class 2.16% | 24,186,331 | 3,201,665 | 11,337,148 | 337,835 | -- | -- | 16,050,848 |
| VIP Growth & Income Portfolio Investor Class | 17,858,626 | 3,562,078 | 5,162,083 | 1,026,895 | 633,882 | (2,848,059) | 14,044,444 |
| VIP Growth Portfolio Investor Class | 15,036,930 | 4,051,519 | 5,344,195 | 2,110,221 | 857,146 | (2,599,565) | 12,001,835 |
| VIP High Income Portfolio Investor Class | 4,428,784 | 780,355 | 853,807 | 237,111 | (32,113) | (351,464) | 3,971,755 |
| VIP Investment Grade Bond Portfolio Investor Class | 57,879,888 | 9,316,686 | 19,758,136 | 1,586,902 | (574,091) | (1,481,503) | 45,382,844 |
| VIP Mid Cap Portfolio Investor Class | 4,325,718 | 1,052,280 | 1,077,860 | 374,931 | 48,373 | (935,846) | 3,412,665 |
| VIP Overseas Portfolio Investor Class | 31,631,103 | 4,861,890 | 6,434,212 | 431,620 | 223,423 | (5,000,081) | 25,282,123 |
| VIP Value Portfolio Investor Class | 11,437,629 | 2,388,533 | 2,723,029 | 703,241 | 81,087 | (2,135,557) | 9,048,663 |
| VIP Value Strategies Portfolio Investor Class | 5,586,196 | 1,155,895 | 1,180,509 | 281,411 | (2,467) | (1,144,885) | 4,414,230 |
| | $222,817,540 | $71,079,191 | $74,670,474 | $10,011,371 | $916,970 | $(23,616,279) | $196,526,948 |
Amounts in the income column in the above table include any capital gain distributions from underlying funds, which are presented in the corresponding line-item in the Statement of Operations if applicable.
Investment Valuation
All investments are categorized as Level 1 under the Fair Value Hierarchy. The inputs or methodology used for valuing securities may not be an indication of the risk associated with investing in those securities. For more information on valuation inputs please refer to the Investment Valuation section in the accompanying Notes to Financial Statements.
See accompanying notes which are an integral part of the financial statements.
VIP Investor Freedom 2020 Portfolio℠
Financial Statements
Statement of Assets and Liabilities
| | | December 31, 2018 |
| Assets | | |
Investment in securities, at value — See accompanying schedule:
| | |
| Affiliated issuers (cost $186,189,139) | $196,526,948 | |
| Total Investment in Securities (cost $186,189,139) | | $196,526,948 |
| Cash | | 10 |
| Receivable for investments sold | | 4,877,228 |
| Total assets | | 201,404,186 |
| Liabilities | | |
| Payable for investments purchased | $4,554,103 | |
| Payable for fund shares redeemed | 323,154 | |
| Total liabilities | | 4,877,257 |
| Net Assets | | $196,526,929 |
| Net Assets consist of: | | |
| Paid in capital | | $179,488,970 |
| Total distributable earnings (loss) | | 17,037,959 |
| Net Assets, for 16,752,154 shares outstanding | | $196,526,929 |
| Net Asset Value, offering price and redemption price per share ($196,526,929 ÷ 16,752,154 shares) | | $11.73 |
See accompanying notes which are an integral part of the financial statements.
Statement of Operations
| | | Year ended December 31, 2018 |
| Investment Income | | |
| Dividends: | | |
| Affiliated issuers | | $3,181,478 |
| Income from Fidelity Central Funds | | 10 |
| Total income | | 3,181,488 |
| Expenses | | |
| Independent trustees' fees and expenses | $1,215 | |
| Total expenses | | 1,215 |
| Net investment income (loss) | | 3,180,273 |
| Realized and Unrealized Gain (Loss) | | |
| Net realized gain (loss) on: | | |
| Investment securities: | | |
| Affiliated issuers | 916,970 | |
| Capital gain distributions from underlying funds: | | |
| Affiliated issuers | 6,829,893 | |
| Total net realized gain (loss) | | 7,746,863 |
| Change in net unrealized appreciation (depreciation) on: | | |
| Investment securities: | | |
| Affiliated issuers | (23,616,279) | |
| Total change in net unrealized appreciation (depreciation) | | (23,616,279) |
| Net gain (loss) | | (15,869,416) |
| Net increase (decrease) in net assets resulting from operations�� | | $(12,689,143) |
See accompanying notes which are an integral part of the financial statements.
Statement of Changes in Net Assets
| | Year ended December 31, 2018 | Year ended December 31, 2017 |
| Increase (Decrease) in Net Assets | | |
| Operations | | |
| Net investment income (loss) | $3,180,273 | $3,128,617 |
| Net realized gain (loss) | 7,746,863 | 5,709,147 |
| Change in net unrealized appreciation (depreciation) | (23,616,279) | 22,317,401 |
| Net increase (decrease) in net assets resulting from operations | (12,689,143) | 31,155,165 |
| Distributions to shareholders | (7,620,061) | – |
| Distributions to shareholders from net investment income | – | (3,096,357) |
| Distributions to shareholders from net realized gain | – | (4,378,420) |
| Total distributions | (7,620,061) | (7,474,777) |
| Share transactions | | |
| Proceeds from sales of shares | 15,428,542 | 20,373,146 |
| Reinvestment of distributions | 7,620,061 | 7,474,777 |
| Cost of shares redeemed | (29,031,427) | (18,523,125) |
| Net increase (decrease) in net assets resulting from share transactions | (5,982,824) | 9,324,798 |
| Total increase (decrease) in net assets | (26,292,028) | 33,005,186 |
| Net Assets | | |
| Beginning of period | 222,818,957 | 189,813,771 |
| End of period | $196,526,929 | $222,818,957 |
| Other Information | | |
| Undistributed net investment income end of period | | $14,315 |
| Shares | | |
| Sold | 1,207,536 | 1,650,223 |
| Issued in reinvestment of distributions | 627,536 | 602,555 |
| Redeemed | (2,303,495) | (1,520,761) |
| Net increase (decrease) | (468,423) | 732,017 |
See accompanying notes which are an integral part of the financial statements.
Financial Highlights
VIP Investor Freedom 2020 Portfolio
| | | | | | |
| Years ended December 31, | 2018 | 2017 | 2016 | 2015 | 2014 |
| Selected Per–Share Data | | | | | |
| Net asset value, beginning of period | $12.94 | $11.51 | $11.34 | $11.63 | $11.47 |
| Income from Investment Operations | | | | | |
| Net investment income (loss)A | .18 | .19 | .17 | .21 | .20 |
| Net realized and unrealized gain (loss) | (.94) | 1.69 | .47 | (.25) | .34 |
| Total from investment operations | (.76) | 1.88 | .64 | (.04) | .54 |
| Distributions from net investment income | (.19) | (.18) | (.17) | (.21) | (.19) |
| Distributions from net realized gain | (.26) | (.27) | (.30) | (.04) | (.19) |
| Total distributions | (.45) | (.45) | (.47) | (.25) | (.38) |
| Net asset value, end of period | $11.73 | $12.94 | $11.51 | $11.34 | $11.63 |
| Total ReturnB,C | (5.94)% | 16.55% | 6.04% | (.35)% | 4.75% |
| Ratios to Average Net AssetsD,E | | | | | |
| Expenses before reductionsF | -% | -% | -% | -% | -% |
| Expenses net of fee waivers, if any | - %F | -% | -% | -% | -% |
| Expenses net of all reductions | - %F | -% | -% | -% | -% |
| Net investment income (loss) | 1.46% | 1.52% | 1.52% | 1.79% | 1.74% |
| Supplemental Data | | | | | |
| Net assets, end of period (000 omitted) | $196,527 | $222,819 | $189,814 | $187,438 | $191,764 |
| Portfolio turnover rateD | 33% | 21% | 23% | 17% | 13% |
A Calculated based on average shares outstanding during the period.
B Total returns do not reflect charges attributable to your insurance company's separate account. Inclusion of these charges would reduce the total returns shown.
C Total returns would have been lower if certain expenses had not been reduced during the applicable periods shown.
D Amounts do not include the activity of the Underlying Funds.
E Expense ratios reflect operating expenses of the Fund. Expenses before reductions do not reflect amounts reimbursed by the investment adviser or reductions from expense offset arrangements and do not represent the amount paid by the Fund during periods when reimbursements or reductions occur. Expenses net of fee waivers reflect expenses after reimbursement by the investment adviser but prior to reductions from expense offset arrangements. Expenses net of all reductions represent the net expenses paid by the Fund but do not include expenses of the underlying funds in which the Fund invests.
F Amount represents less than .005%.
See accompanying notes which are an integral part of the financial statements.
VIP Investor Freedom 2025 Portfolio℠
Investment Summary (Unaudited)
The information in the following tables is based on the direct investments of the Fund.
Top Holdings as of December 31, 2018
| | % of fund's net assets |
| VIP Investment Grade Bond Portfolio Investor Class | 19.8 |
| VIP Overseas Portfolio Investor Class | 14.3 |
| VIP Emerging Markets Portfolio Investor Class | 8.2 |
| VIP Growth & Income Portfolio Investor Class | 8.0 |
| VIP Equity-Income Portfolio Investor Class | 7.0 |
| VIP Growth Portfolio Investor Class | 6.9 |
| VIP Contrafund Portfolio Investor Class | 6.7 |
| Fidelity Long Term Treasury Bond Index Fund | 6.1 |
| Fidelity Inflation-Protected Bond Index Fund Institutional Premium Class | 6.0 |
| VIP Government Money Market Portfolio Investor Class 2.16% | 5.4 |
| | 88.4 |
Asset Allocation (% of fund's net assets)
| Period end |
| | Domestic Equity Funds | 38.3% |
| | International Equity Funds | 22.5% |
| | Bond Funds | 33.8% |
| | Short-Term Funds | 5.4% |

VIP Investor Freedom 2025 Portfolio℠
Schedule of Investments December 31, 2018
Showing Percentage of Net Assets
| Domestic Equity Funds - 38.3% | | | |
| | | Shares | Value |
| VIP Contrafund Portfolio Investor Class (a) | | 427,617 | $13,653,819 |
| VIP Equity-Income Portfolio Investor Class (a) | | 707,119 | 14,326,232 |
| VIP Growth & Income Portfolio Investor Class (a) | | 846,170 | 16,331,074 |
| VIP Growth Portfolio Investor Class (a) | | 222,193 | 13,955,937 |
| VIP Mid Cap Portfolio Investor Class (a) | | 132,219 | 3,967,900 |
| VIP Value Portfolio Investor Class (a) | | 805,653 | 10,521,830 |
| VIP Value Strategies Portfolio Investor Class (a) | | 464,905 | 5,132,548 |
| TOTAL DOMESTIC EQUITY FUNDS | | | |
| (Cost $68,699,855) | | | 77,889,340 |
|
| International Equity Funds - 22.5% | | | |
| VIP Emerging Markets Portfolio Investor Class (a) | | 1,690,054 | 16,748,437 |
| VIP Overseas Portfolio Investor Class (a) | | 1,525,254 | 29,071,336 |
| TOTAL INTERNATIONAL EQUITY FUNDS | | | |
| (Cost $42,355,535) | | | 45,819,773 |
|
| Bond Funds - 33.8% | | | |
| Fidelity Inflation-Protected Bond Index Fund Institutional Premium Class (a) | | 1,281,823 | 12,164,496 |
| Fidelity Long Term Treasury Bond Index Fund (a) | | 982,388 | 12,456,679 |
| VIP High Income Portfolio Investor Class (a) | | 798,886 | 3,946,494 |
| VIP Investment Grade Bond Portfolio Investor Class (a) | | 3,273,725 | 40,234,077 |
| TOTAL BOND FUNDS | | | |
| (Cost $70,541,544) | | | 68,801,746 |
|
| Short-Term Funds - 5.4% | | | |
| VIP Government Money Market Portfolio Investor Class 2.16% (a)(b) | | | |
| (Cost $10,952,186) | | 10,952,186 | 10,952,186 |
| TOTAL INVESTMENT IN SECURITIES - 100.0% | | | |
| (Cost $192,549,120) | | | 203,463,045 |
| NET OTHER ASSETS (LIABILITIES) - 0.0% | | | (21) |
| NET ASSETS - 100% | | | $203,463,024 |
Legend
(a) Affiliated Fund
(b) The rate quoted is the annualized seven-day yield of the fund at period end.
Affiliated Central Funds
Information regarding fiscal year to date income earned by the Fund from investments in Fidelity Central Funds is as follows:
| Fund | Income earned |
| Fidelity Cash Central Fund | 13 |
| Total | $13 |
Amounts in the income column in the above table include any capital gain distributions from underlying funds, which are presented in the corresponding line-item in the Statement of Operations if applicable.
Affiliated Underlying Funds
Fiscal year to date information regarding the Fund's investments in affiliated Underlying Funds, excluding any Money Market Central Funds, is presented below. Exchanges between classes of the same affiliated Underlying Funds may occur.
| Affiliate | Value, beginning of period | Purchases | Sales Proceeds | Dividend Income | Realized Gain (loss) | Change in Unrealized appreciation (depreciation) | Value, end of period |
| Fidelity Inflation-Protected Bond Index Fund Institutional Premium Class | $-- | $14,184,851 | $1,582,751 | $263,327 | $(40,460) | $(397,144) | $12,164,496 |
| Fidelity Long Term Treasury Bond Index Fund | -- | 1,353,233 | 1,694,373 | 63,495 | 1,542 | 377,410 | 12,456,679 |
| Fidelity Long-Term Treasury Bond Index Fund Institutional Class | -- | 12,761,750 | 334,062 | 132,638 | (8,821) | -- | -- |
| Fidelity Long-Term Treasury Bond Index Fund Premium Class | 4,558,600 | 615,729 | 4,802,189 | 52,153 | (389,131) | 16,991 | -- |
| VIP Contrafund Portfolio Investor Class | 15,860,487 | 3,715,232 | 3,701,675 | 1,437,023 | 118,983 | (2,339,208) | 13,653,819 |
| VIP Emerging Markets Portfolio Investor Class | 15,939,402 | 6,837,325 | 2,872,649 | 109,302 | 63,511 | (3,219,152) | 16,748,437 |
| VIP Equity-Income Portfolio Investor Class | 16,721,864 | 3,858,704 | 3,974,868 | 1,075,113 | (48,713) | (2,230,755) | 14,326,232 |
| VIP Government Money Market Portfolio Investor Class 2.16% | 18,139,153 | 2,915,633 | 10,102,600 | 242,538 | -- | -- | 10,952,186 |
| VIP Growth & Income Portfolio Investor Class | 19,181,934 | 4,310,353 | 4,624,933 | 1,113,243 | 186,383 | (2,722,663) | 16,331,074 |
| VIP Growth Portfolio Investor Class | 16,150,971 | 4,472,106 | 4,653,980 | 2,278,119 | 372,709 | (2,385,869) | 13,955,937 |
| VIP High Income Portfolio Investor Class | 4,293,787 | 923,598 | 892,291 | 234,657 | (24,144) | (354,456) | 3,946,494 |
| VIP Investment Grade Bond Portfolio Investor Class | 48,904,422 | 9,222,127 | 16,130,739 | 1,388,458 | (437,290) | (1,324,443) | 40,234,077 |
| VIP Mid Cap Portfolio Investor Class | 4,646,419 | 1,200,063 | 860,058 | 405,992 | 23,965 | (1,042,489) | 3,967,900 |
| VIP Overseas Portfolio Investor Class | 33,516,401 | 5,886,863 | 4,912,026 | 498,285 | 3,900 | (5,423,802) | 29,071,336 |
| VIP Value Portfolio Investor Class | 12,285,151 | 2,694,007 | 2,088,715 | 785,748 | (8,024) | (2,360,589) | 10,521,830 |
| VIP Value Strategies Portfolio Investor Class | 6,000,118 | 1,320,672 | 868,522 | 313,052 | (14,522) | (1,305,198) | 5,132,548 |
| | $216,198,709 | $76,272,246 | $64,096,431 | $10,393,143 | $(200,112) | $(24,711,367) | $203,463,045 |
Amounts in the income column in the above table include any capital gain distributions from underlying funds, which are presented in the corresponding line-item in the Statement of Operations if applicable.
Investment Valuation
All investments are categorized as Level 1 under the Fair Value Hierarchy. The inputs or methodology used for valuing securities may not be an indication of the risk associated with investing in those securities. For more information on valuation inputs please refer to the Investment Valuation section in the accompanying Notes to Financial Statements.
See accompanying notes which are an integral part of the financial statements.
VIP Investor Freedom 2025 Portfolio℠
Financial Statements
Statement of Assets and Liabilities
| | | December 31, 2018 |
| Assets | | |
Investment in securities, at value — See accompanying schedule:
| | |
| Affiliated issuers (cost $192,549,120) | $203,463,045 | |
| Total Investment in Securities (cost $192,549,120) | | $203,463,045 |
| Cash | | 13 |
| Receivable for investments sold | | 4,729,354 |
| Total assets | | 208,192,412 |
| Liabilities | | |
| Payable for investments purchased | $4,586,793 | |
| Payable for fund shares redeemed | 142,595 | |
| Total liabilities | | 4,729,388 |
| Net Assets | | $203,463,024 |
| Net Assets consist of: | | |
| Paid in capital | | $186,733,737 |
| Total distributable earnings (loss) | | 16,729,287 |
| Net Assets, for 16,343,821 shares outstanding | | $203,463,024 |
| Net Asset Value, offering price and redemption price per share ($203,463,024 ÷ 16,343,821 shares) | | $12.45 |
See accompanying notes which are an integral part of the financial statements.
Statement of Operations
| | | Year ended December 31, 2018 |
| Investment Income | | |
| Dividends: | | |
| Affiliated issuers | | $3,129,001 |
| Income from Fidelity Central Funds | | 13 |
| Total income | | 3,129,014 |
| Expenses | | |
| Independent trustees' fees and expenses | $1,195 | |
| Total expenses | | 1,195 |
| Net investment income (loss) | | 3,127,819 |
| Realized and Unrealized Gain (Loss) | | |
| Net realized gain (loss) on: | | |
| Investment securities: | | |
| Affiliated issuers | (200,112) | |
| Capital gain distributions from underlying funds: | | |
| Affiliated issuers | 7,264,142 | |
| Total net realized gain (loss) | | 7,064,030 |
| Change in net unrealized appreciation (depreciation) on: | | |
| Investment securities: | | |
| Affiliated issuers | (24,711,367) | |
| Total change in net unrealized appreciation (depreciation) | | (24,711,367) |
| Net gain (loss) | | (17,647,337) |
| Net increase (decrease) in net assets resulting from operations | | $(14,519,518) |
See accompanying notes which are an integral part of the financial statements.
Statement of Changes in Net Assets
| | Year ended December 31, 2018 | Year ended December 31, 2017 |
| Increase (Decrease) in Net Assets | | |
| Operations | | |
| Net investment income (loss) | $3,127,819 | $2,919,062 |
| Net realized gain (loss) | 7,064,030 | 5,108,636 |
| Change in net unrealized appreciation (depreciation) | (24,711,367) | 22,727,036 |
| Net increase (decrease) in net assets resulting from operations | (14,519,518) | 30,754,734 |
| Distributions to shareholders | (6,951,203) | – |
| Distributions to shareholders from net investment income | – | (2,897,796) |
| Distributions to shareholders from net realized gain | – | (4,478,683) |
| Total distributions | (6,951,203) | (7,376,479) |
| Share transactions | | |
| Proceeds from sales of shares | 20,745,247 | 31,904,091 |
| Reinvestment of distributions | 6,951,203 | 7,376,479 |
| Cost of shares redeemed | (18,962,480) | (10,391,673) |
| Net increase (decrease) in net assets resulting from share transactions | 8,733,970 | 28,888,897 |
| Total increase (decrease) in net assets | (12,736,751) | 52,267,152 |
| Net Assets | | |
| Beginning of period | 216,199,775 | 163,932,623 |
| End of period | $203,463,024 | $216,199,775 |
| Other Information | | |
| Undistributed net investment income end of period | | $11,701 |
| Shares | | |
| Sold | 1,524,182 | 2,422,167 |
| Issued in reinvestment of distributions | 540,861 | 560,738 |
| Redeemed | (1,406,532) | (787,220) |
| Net increase (decrease) | 658,511 | 2,195,685 |
See accompanying notes which are an integral part of the financial statements.
Financial Highlights
VIP Investor Freedom 2025 Portfolio
| | | | | | |
| Years ended December 31, | 2018 | 2017 | 2016 | 2015 | 2014 |
| Selected Per–Share Data | | | | | |
| Net asset value, beginning of period | $13.78 | $12.15 | $12.04 | $12.35 | $12.16 |
| Income from Investment Operations | | | | | |
| Net investment income (loss)A | .20 | .20 | .18 | .24 | .21 |
| Net realized and unrealized gain (loss) | (1.09) | 1.94 | .50 | (.28) | .40 |
| Total from investment operations | (.89) | 2.14 | .68 | (.04) | .61 |
| Distributions from net investment income | (.19) | (.19) | (.18) | (.23) | (.20) |
| Distributions from net realized gain | (.25) | (.32) | (.39) | (.04) | (.22) |
| Total distributions | (.44) | (.51) | (.57) | (.27) | (.42) |
| Net asset value, end of period | $12.45 | $13.78 | $12.15 | $12.04 | $12.35 |
| Total ReturnB,C | (6.56)% | 17.82% | 6.10% | (.32)% | 5.04% |
| Ratios to Average Net AssetsD,E | | | | | |
| Expenses before reductionsF | -% | -% | -% | -% | -% |
| Expenses net of fee waivers, if any | - %F | -% | -% | -% | -% |
| Expenses net of all reductions | - %F | -% | -% | -% | -% |
| Net investment income (loss) | 1.44% | 1.53% | 1.54% | 1.89% | 1.71% |
| Supplemental Data | | | | | |
| Net assets, end of period (000 omitted) | $203,463 | $216,200 | $163,933 | $156,218 | $139,907 |
| Portfolio turnover rateD | 30% | 17% | 23% | 16% | 13% |
A Calculated based on average shares outstanding during the period.
B Total returns do not reflect charges attributable to your insurance company's separate account. Inclusion of these charges would reduce the total returns shown.
C Total returns would have been lower if certain expenses had not been reduced during the applicable periods shown.
D Amounts do not include the activity of the Underlying Funds.
E Expense ratios reflect operating expenses of the Fund. Expenses before reductions do not reflect amounts reimbursed by the investment adviser or reductions from expense offset arrangements and do not represent the amount paid by the Fund during periods when reimbursements or reductions occur. Expenses net of fee waivers reflect expenses after reimbursement by the investment adviser but prior to reductions from expense offset arrangements. Expenses net of all reductions represent the net expenses paid by the Fund but do not include expenses of the underlying funds in which the Fund invests.
F Amount represents less than .005%.
See accompanying notes which are an integral part of the financial statements.
VIP Investor Freedom 2030 Portfolio℠
Investment Summary (Unaudited)
The information in the following tables is based on the direct investments of the Fund.
Top Holdings as of December 31, 2018
| | % of fund's net assets |
| VIP Overseas Portfolio Investor Class | 16.8 |
| VIP Investment Grade Bond Portfolio Investor Class | 15.0 |
| VIP Growth & Income Portfolio Investor Class | 9.8 |
| VIP Emerging Markets Portfolio Investor Class | 9.1 |
| VIP Equity-Income Portfolio Investor Class | 8.6 |
| VIP Growth Portfolio Investor Class | 8.4 |
| VIP Contrafund Portfolio Investor Class | 8.2 |
| VIP Value Portfolio Investor Class | 6.3 |
| Fidelity Long Term Treasury Bond Index Fund | 6.0 |
| VIP Value Strategies Portfolio Investor Class | 3.1 |
| | 91.3 |
Asset Allocation (% of fund's net assets)
| Period end |
| | Domestic Equity Funds | 46.8% |
| | International Equity Funds | 25.9% |
| | Bond Funds | 25.8% |
| | Short-Term Funds | 1.5% |

VIP Investor Freedom 2030 Portfolio℠
Schedule of Investments December 31, 2018
Showing Percentage of Net Assets
| Domestic Equity Funds - 46.8% | | | |
| | | Shares | Value |
| VIP Contrafund Portfolio Investor Class (a) | | 550,103 | $17,564,794 |
| VIP Equity-Income Portfolio Investor Class (a) | | 909,663 | 18,429,766 |
| VIP Growth & Income Portfolio Investor Class (a) | | 1,088,597 | 21,009,916 |
| VIP Growth Portfolio Investor Class (a) | | 285,838 | 17,953,464 |
| VIP Mid Cap Portfolio Investor Class (a) | | 169,851 | 5,097,231 |
| VIP Value Portfolio Investor Class (a) | | 1,036,235 | 13,533,236 |
| VIP Value Strategies Portfolio Investor Class (a) | | 597,484 | 6,596,221 |
| TOTAL DOMESTIC EQUITY FUNDS | | | |
| (Cost $94,385,115) | | | 100,184,628 |
|
| International Equity Funds - 25.9% | | | |
| VIP Emerging Markets Portfolio Investor Class (a) | | 1,954,468 | 19,368,781 |
| VIP Overseas Portfolio Investor Class (a) | | 1,890,822 | 36,039,068 |
| TOTAL INTERNATIONAL EQUITY FUNDS | | | |
| (Cost $53,034,809) | | | 55,407,849 |
|
| Bond Funds - 25.8% | | | |
| Fidelity Inflation-Protected Bond Index Fund Institutional Premium Class (a) | | 637,297 | 6,047,950 |
| Fidelity Long Term Treasury Bond Index Fund (a) | | 1,008,323 | 12,785,537 |
| VIP High Income Portfolio Investor Class (a) | | 831,083 | 4,105,549 |
| VIP Investment Grade Bond Portfolio Investor Class (a) | | 2,613,738 | 32,122,841 |
| TOTAL BOND FUNDS | | | |
| (Cost $56,307,712) | | | 55,061,877 |
|
| Short-Term Funds - 1.5% | | | |
| VIP Government Money Market Portfolio Investor Class 2.16% (a)(b) | | | |
| (Cost $3,216,944) | | 3,216,944 | 3,216,944 |
| TOTAL INVESTMENT IN SECURITIES - 100.0% | | | |
| (Cost $206,944,580) | | | 213,871,298 |
| NET OTHER ASSETS (LIABILITIES) - 0.0% | | | (26) |
| NET ASSETS - 100% | | | $213,871,272 |
Legend
(a) Affiliated Fund
(b) The rate quoted is the annualized seven-day yield of the fund at period end.
Affiliated Underlying Funds
Fiscal year to date information regarding the Fund's investments in affiliated Underlying Funds, excluding any Money Market Central Funds, is presented below. Exchanges between classes of the same affiliated Underlying Funds may occur.
| Affiliate | Value, beginning of period | Purchases | Sales Proceeds | Dividend Income | Realized Gain (loss) | Change in Unrealized appreciation (depreciation) | Value, end of period |
| Fidelity Inflation-Protected Bond Index Fund Institutional Premium Class | $-- | $514,299 | $154,977 | $118,151 | $(1,778) | $(194,734) | $6,047,950 |
| Fidelity Inflation-Protected Bond Index Fund Premium Class | -- | 5,971,319 | 84,900 | 6,439 | (1,279) | -- | -- |
| Fidelity Long Term Treasury Bond Index Fund | -- | 774,608 | 1,858,835 | 65,342 | 4,878 | 345,918 | 12,785,537 |
| Fidelity Long-Term Treasury Bond Index Fund Institutional Class | -- | 13,859,464 | 329,431 | 144,514 | (11,065) | -- | -- |
| Fidelity Long-Term Treasury Bond Index Fund Premium Class | 4,496,919 | 842,704 | 4,960,774 | 53,644 | (395,705) | 16,856 | -- |
| VIP Contrafund Portfolio Investor Class | 19,073,221 | 5,609,647 | 4,273,506 | 1,772,517 | 26,639 | (2,871,207) | 17,564,794 |
| VIP Emerging Markets Portfolio Investor Class | 18,019,994 | 8,100,563 | 2,928,226 | 126,784 | (72,233) | (3,751,317) | 19,368,781 |
| VIP Equity-Income Portfolio Investor Class | 20,109,451 | 5,539,893 | 4,308,654 | 1,343,107 | (82,345) | (2,828,579) | 18,429,766 |
| VIP Government Money Market Portfolio Investor Class 2.16% | 5,515,093 | 1,141,398 | 3,439,547 | 69,327 | -- | -- | 3,216,944 |
| VIP Growth & Income Portfolio Investor Class | 23,068,344 | 6,367,897 | 5,177,483 | 1,374,008 | 99,182 | (3,348,024) | 21,009,916 |
| VIP Growth Portfolio Investor Class | 19,422,535 | 6,602,408 | 5,482,996 | 2,803,538 | 266,110 | (2,854,593) | 17,953,464 |
| VIP High Income Portfolio Investor Class | 4,254,597 | 1,277,402 | 1,035,711 | 241,680 | (25,971) | (364,768) | 4,105,549 |
| VIP Investment Grade Bond Portfolio Investor Class | 33,678,873 | 11,506,427 | 11,771,779 | 1,072,171 | (294,023) | (996,657) | 32,122,841 |
| VIP Mid Cap Portfolio Investor Class | 5,587,812 | 1,760,147 | 941,566 | 500,677 | (6,723) | (1,302,439) | 5,097,231 |
| VIP Overseas Portfolio Investor Class | 39,379,726 | 8,725,967 | 5,254,992 | 620,103 | (72,503) | (6,739,130) | 36,039,068 |
| VIP Value Portfolio Investor Class | 14,774,188 | 4,002,743 | 2,196,159 | 989,379 | (31,389) | (3,016,147) | 13,533,236 |
| VIP Value Strategies Portfolio Investor Class | 7,215,746 | 1,968,703 | 891,367 | 393,054 | (15,649) | (1,681,212) | 6,596,221 |
| | $214,596,499 | $84,565,589 | $55,090,903 | $11,694,435 | $(613,854) | $(29,586,033) | $213,871,298 |
Amounts in the income column in the above table include any capital gain distributions from underlying funds, which are presented in the corresponding line-item in the Statement of Operations if applicable.
Investment Valuation
All investments are categorized as Level 1 under the Fair Value Hierarchy. The inputs or methodology used for valuing securities may not be an indication of the risk associated with investing in those securities. For more information on valuation inputs please refer to the Investment Valuation section in the accompanying Notes to Financial Statements.
See accompanying notes which are an integral part of the financial statements.
VIP Investor Freedom 2030 Portfolio℠
Financial Statements
Statement of Assets and Liabilities
| | | December 31, 2018 |
| Assets | | |
Investment in securities, at value — See accompanying schedule:
| | |
| Affiliated issuers (cost $206,944,580) | $213,871,298 | |
| Total Investment in Securities (cost $206,944,580) | | $213,871,298 |
| Cash | | 1 |
| Receivable for investments sold | | 4,064,763 |
| Total assets | | 217,936,062 |
| Liabilities | | |
| Payable for investments purchased | $3,940,527 | |
| Payable for fund shares redeemed | 124,263 | |
| Total liabilities | | 4,064,790 |
| Net Assets | | $213,871,272 |
| Net Assets consist of: | | |
| Paid in capital | | $200,325,042 |
| Total distributable earnings (loss) | | 13,546,230 |
| Net Assets, for 17,674,274 shares outstanding | | $213,871,272 |
| Net Asset Value, offering price and redemption price per share ($213,871,272 ÷ 17,674,274 shares) | | $12.10 |
See accompanying notes which are an integral part of the financial statements.
Statement of Operations
| | | Year ended December 31, 2018 |
| Investment Income | | |
| Dividends: | | |
| Affiliated issuers | | $3,069,807 |
| Expenses | | |
| Independent trustees' fees and expenses | $1,228 | |
| Total expenses | | 1,228 |
| Net investment income (loss) | | 3,068,579 |
| Realized and Unrealized Gain (Loss) | | |
| Net realized gain (loss) on: | | |
| Investment securities: | | |
| Affiliated issuers | (613,854) | |
| Capital gain distributions from underlying funds: | | |
| Affiliated issuers | 8,624,628 | |
| Total net realized gain (loss) | | 8,010,774 |
| Change in net unrealized appreciation (depreciation) on: | | |
| Investment securities: | | |
| Affiliated issuers | (29,586,033) | |
| Total change in net unrealized appreciation (depreciation) | | (29,586,033) |
| Net gain (loss) | | (21,575,259) |
| Net increase (decrease) in net assets resulting from operations | | $(18,506,680) |
See accompanying notes which are an integral part of the financial statements.
Statement of Changes in Net Assets
| | Year ended December 31, 2018 | Year ended December 31, 2017 |
| Increase (Decrease) in Net Assets | | |
| Operations | | |
| Net investment income (loss) | $3,068,579 | $2,711,747 |
| Net realized gain (loss) | 8,010,774 | 5,755,764 |
| Change in net unrealized appreciation (depreciation) | (29,586,033) | 26,146,448 |
| Net increase (decrease) in net assets resulting from operations | (18,506,680) | 34,613,959 |
| Distributions to shareholders | (7,556,870) | – |
| Distributions to shareholders from net investment income | – | (2,691,438) |
| Distributions to shareholders from net realized gain | – | (5,515,531) |
| Total distributions | (7,556,870) | (8,206,969) |
| Share transactions | | |
| Proceeds from sales of shares | 35,664,187 | 36,781,109 |
| Reinvestment of distributions | 7,556,870 | 8,206,969 |
| Cost of shares redeemed | (17,883,056) | (12,331,255) |
| Net increase (decrease) in net assets resulting from share transactions | 25,338,001 | 32,656,823 |
| Total increase (decrease) in net assets | (725,549) | 59,063,813 |
| Net Assets | | |
| Beginning of period | 214,596,821 | 155,533,008 |
| End of period | $213,871,272 | $214,596,821 |
| Other Information | | |
| Undistributed net investment income end of period | | $20,306 |
| Shares | | |
| Sold | 2,653,286 | 2,871,550 |
| Issued in reinvestment of distributions | 599,010 | 641,654 |
| Redeemed | (1,342,744) | (972,690) |
| Net increase (decrease) | 1,909,552 | 2,540,514 |
See accompanying notes which are an integral part of the financial statements.
Financial Highlights
VIP Investor Freedom 2030 Portfolio
| | | | | | |
| Years ended December 31, | 2018 | 2017 | 2016 | 2015 | 2014 |
| Selected Per–Share Data | | | | | |
| Net asset value, beginning of period | $13.61 | $11.76 | $11.68 | $11.97 | $11.81 |
| Income from Investment Operations | | | | | |
| Net investment income (loss)A | .18 | .19 | .17 | .21 | .19 |
| Net realized and unrealized gain (loss) | (1.24) | 2.23 | .51 | (.24) | .38 |
| Total from investment operations | (1.06) | 2.42 | .68 | (.03) | .57 |
| Distributions from net investment income | (.18) | (.17) | (.17) | (.20) | (.18) |
| Distributions from net realized gain | (.28) | (.39) | (.44) | (.05) | (.22) |
| Total distributions | (.45)B | (.57)C | (.60)D | (.26)E | (.41)F |
| Net asset value, end of period | $12.10 | $13.61 | $11.76 | $11.68 | $11.97 |
| Total ReturnG,H | (7.87)% | 20.92% | 6.50% | (.32)% | 4.83% |
| Ratios to Average Net AssetsI,J | | | | | |
| Expenses before reductionsK | -% | -% | -% | -% | -% |
| Expenses net of fee waivers, if any | - %K | -% | -% | -% | -% |
| Expenses net of all reductions | - %K | -% | -% | -% | -% |
| Net investment income (loss) | 1.36% | 1.46% | 1.48% | 1.73% | 1.58% |
| Supplemental Data | | | | | |
| Net assets, end of period (000 omitted) | $213,871 | $214,597 | $155,533 | $144,692 | $131,425 |
| Portfolio turnover rateI | 24% | 19% | 19% | 12% | 13% |
A Calculated based on average shares outstanding during the period.
B Total distributions of $.45 per share is comprised of distributions from net investment income of $.176 and distributions from net realized gain of $.278 per share.
C Total distributions of $.57 per share is comprised of distributions from net investment income of $.174 and distributions from net realized gain of $.391 per share.
D Total distributions of $.60 per share is comprised of distributions from net investment income of $.167 and distributions from net realized gain of $.435 per share.
E Total distributions of $.26 per share is comprised of distributions from net investment income of $.202 and distributions from net realized gain of $.053 per share.
F Total distributions of $.41 per share is comprised of distributions from net investment income of $.182 and distributions from net realized gain of $.224 per share.
G Total returns do not reflect charges attributable to your insurance company's separate account. Inclusion of these charges would reduce the total returns shown.
H Total returns would have been lower if certain expenses had not been reduced during the applicable periods shown.
I Amounts do not include the activity of the Underlying Funds.
J Expense ratios reflect operating expenses of the Fund. Expenses before reductions do not reflect amounts reimbursed by the investment adviser or reductions from expense offset arrangements and do not represent the amount paid by the Fund during periods when reimbursements or reductions occur. Expenses net of fee waivers reflect expenses after reimbursement by the investment adviser but prior to reductions from expense offset arrangements. Expenses net of all reductions represent the net expenses paid by the Fund but do not include expenses of the underlying funds in which the Fund invests.
K Amount represents less than .005%.
See accompanying notes which are an integral part of the financial statements.
Notes to Financial Statements
For the period ended December 31, 2018
1. Organization.
VIP Investor Freedom Income Portfolio, VIP Investor Freedom 2005 Portfolio, VIP Investor Freedom 2010 Portfolio, VIP Investor Freedom 2015 Portfolio, VIP Investor Freedom 2020 Portfolio, VIP Investor Freedom 2025 Portfolio and VIP Investor Freedom 2030 Portfolio (the Funds) are funds of Variable Insurance Products Fund V (the Trust). The Trust is registered under the Investment Company Act of 1940, as amended (the 1940 Act), as an open-end management investment company organized as a Massachusetts business trust. Each Fund is authorized to issue an unlimited number of shares. The Funds invest primarily in a combination of other VIP equity, bond, and short-term funds (the Underlying Funds) managed by Fidelity Management & Research Company (FMR). Shares of each Fund may only be purchased by insurance companies for the purpose of funding variable annuity or variable life insurance contracts.
2. Investments in Fidelity Central Funds.
The Funds may invest in Fidelity Central Funds, which are open-end investment companies generally available only to other investment companies and accounts managed by the investment adviser and its affiliates. The Funds' Schedules of Investments list each of the Fidelity Central Funds held as of period end, if any, as an investment of each Fund, but do not include the underlying holdings of each Fidelity Central Fund. As an Investing Fund, each Fund indirectly bears its proportionate share of the expenses of the underlying Fidelity Central Funds.
The Money Market Central Funds seek preservation of capital and current income and are managed by Fidelity Investments Money Management, Inc. (FIMM), an affiliate of the investment adviser. Annualized expenses of the Money Market Central Funds as of their most recent shareholder report date are less than .005%.
A complete unaudited list of holdings for each Fidelity Central Fund is available upon request or at the Securities and Exchange Commission (the SEC) website at www.sec.gov. In addition, the financial statements of the Fidelity Central Funds, which are not covered by the Funds' Report of Independent Registered Public Accounting Firm, are available on the SEC website or upon request.
3. Significant Accounting Policies.
Each Fund is an investment company and applies the accounting and reporting guidance of the Financial Accounting Standards Board (FASB) Accounting Standards Codification Topic 946 Financial Services – Investments Companies. The financial statements have been prepared in conformity with accounting principles generally accepted in the United States of America (GAAP), which require management to make certain estimates and assumptions at the date of the financial statements. Actual results could differ from those estimates. Subsequent events, if any, through the date that the financial statements were issued have been evaluated in the preparation of the financial statements. The following summarizes the significant accounting policies of the Funds:
Investment Valuation. Investments are valued as of 4:00 p.m. Eastern time on the last calendar day of the period. Each Fund categorizes the inputs to valuation techniques used to value its investments into a disclosure hierarchy consisting of three levels as shown below:
- Level 1 – quoted prices in active markets for identical investments
- Level 2 – other significant observable inputs (including quoted prices for similar investments, interest rates, prepayment speeds, etc.)
- Level 3 – unobservable inputs (including the Fund's own assumptions based on the best information available)
Valuation techniques used to value each Fund's investments by major category are as follows. Investments in the Underlying Funds are valued at their closing net asset value (NAV) each business day and are categorized as Level 1 in the hierarchy.
Investment Transactions and Income. For financial reporting purposes, the Funds' investment holdings and NAV include trades executed through the end of the last business day of the period. The NAV per share for processing shareholder transactions is calculated as of the close of business of the New York Stock Exchange (NYSE), normally 4:00 p.m. Eastern time and includes trades executed through the end of the prior business day. Gains and losses on securities sold are determined on the basis of identified cost. Income and capital gain distributions from the Underlying Funds, if any, are recorded on the ex-dividend date.
Expenses. Expenses directly attributable to a fund are charged to that fund. Expenses attributable to more than one fund are allocated among the respective funds on the basis of relative net assets or other appropriate methods. Expenses included in the accompanying financial statements reflect the expenses of each Fund and do not include any expenses associated with the Underlying Funds. Although not included in each Fund's expenses, each Fund indirectly bears its proportionate share of the Underlying Funds' expenses through the impact of these expenses on each Underlying Fund's NAV. Expense estimates are accrued in the period to which they relate and adjustments are made when actual amounts are known.
Income Tax Information and Distributions to Shareholders. Each year, each Fund intends to qualify as a regulated investment company under Subchapter M of the Internal Revenue Code, including distributing substantially all of its taxable income and realized gains. As a result, no provision for U.S. Federal income taxes is required. As of December 31, 2018, each Fund did not have any unrecognized tax benefits in the financial statements; nor is each Fund aware of any tax positions for which it is reasonably possible that the total amounts of unrecognized tax benefits will significantly change in the next twelve months. Each Fund files a U.S. federal tax return, in addition to state and local tax returns as required. Each Fund's federal income tax returns are subject to examination by the Internal Revenue Service (IRS) for a period of three fiscal years after they are filed. State and local tax returns may be subject to examination for an additional fiscal year depending on the jurisdiction.
Distributions are declared and recorded on the ex-dividend date. Income and capital gain distributions are determined in accordance with income tax regulations, which may differ from GAAP.
Capital accounts within the financial statements are adjusted for permanent book-tax differences. These adjustments have no impact on net assets or the results of operations. Capital accounts are not adjusted for temporary book-tax differences which will reverse in a subsequent period.
Book-tax differences are primarily due to the short-term gain distributions from the Underlying Funds and losses deferred due to wash sales.
As of period end, the cost and unrealized appreciation (depreciation) in securities, and derivatives if applicable, for federal income tax purposes were as follows for each Fund:
| | Tax cost | Gross unrealized appreciation | Gross unrealized depreciation | Net unrealized appreciation (depreciation) |
| VIP Investor Freedom Income | $73,578,246 | $2,595,523 | $(1,425,646) | $1,169,877 |
| VIP Investor Freedom 2005 | 28,217,807 | 1,019,528 | (634,377) | 385,151 |
| VIP Investor Freedom 2010 | 54,972,085 | 2,681,841 | (1,201,632) | 1,480,209 |
| VIP Investor Freedom 2015 | 92,350,278 | 6,426,206 | (1,995,398) | 4,430,808 |
| VIP Investor Freedom 2020 | 186,941,622 | 14,453,240 | (4,867,914) | 9,585,326 |
| VIP Investor Freedom 2025 | 193,383,860 | 16,037,192 | (5,958,007) | 10,079,185 |
| VIP Investor Freedom 2030 | 207,967,511 | 14,680,031 | (8,776,244) | 5,903,787 |
The tax-based components of distributable earnings as of period end were as follows for each Fund:
| | Undistributed ordinary income | Undistributed long-term capital gain | Net unrealized appreciation (depreciation) on securities and other investments |
| VIP Investor Freedom Income | $240,761 | $1,372,059 | $1,169,877 |
| VIP Investor Freedom 2005 | 78,575 | 505,194 | 385,151 |
| VIP Investor Freedom 2010 | 152,750 | 2,271,589 | 1,480,209 |
| VIP Investor Freedom 2015 | 214,869 | 3,874,648 | 4,430,808 |
| VIP Investor Freedom 2020 | 346,180 | 7,106,453 | 9,585,326 |
| VIP Investor Freedom 2025 | 295,343 | 6,354,759 | 10,079,185 |
| VIP Investor Freedom 2030 | 169,718 | 7,472,724 | 5,903,787 |
The tax character of distributions paid was as follows:
| December 31, 2018 | | | |
| | Ordinary Income | Long-term Capital Gains | Total |
| VIP Investor Freedom Income | $1,411,354 | $789,022 | $2,200,376 |
| VIP Investor Freedom 2005 | 555,989 | 246,086 | 802,075 |
| VIP Investor Freedom 2010 | 1,071,825 | 1,315,841 | 2,387,666 |
| VIP Investor Freedom 2015 | 1,836,407 | 2,437,636 | 4,274,043 |
| VIP Investor Freedom 2020 | 3,612,421 | 4,007,640 | 7,620,061 |
| VIP Investor Freedom 2025 | 3,639,137 | 3,312,066 | 6,951,203 |
| VIP Investor Freedom 2030 | 3,745,259 | 3,811,611 | 7,556,870 |
| December 31, 2017 | | | |
| | Ordinary Income | Long-term Capital Gains | Total |
| VIP Investor Freedom Income | $1,363,077 | $424,909 | $1,787,986 |
| VIP Investor Freedom 2005 | 545,062 | 162,798 | 707,860 |
| VIP Investor Freedom 2010 | 1,344,123 | 752,653 | 2,096,776 |
| VIP Investor Freedom 2015 | 2,266,558 | 1,639,404 | 3,905,962 |
| VIP Investor Freedom 2020 | 4,594,052 | 2,880,725 | 7,474,777 |
| VIP Investor Freedom 2025 | 4,461,686 | 2,914,793 | 7,376,479 |
| VIP Investor Freedom 2030 | 4,516,666 | 3,690,303 | 8,206,969 |
New Rule Issuance. During August 2018, the U.S. Securities and Exchange Commission issued Final Rule Release No. 33-10532, Disclosure Update and Simplification. This Final Rule includes amendments specific to registered investment companies that are intended to eliminate overlap in disclosure requirements between Regulation S-X and GAAP. In accordance with these amendments, certain line-items in the Funds' financial statements have been combined or removed for the current period as outlined in the table below.
| Financial Statement | Current Line-Item Presentation | Prior Line-Item Presentation |
| Statement of Assets and Liabilities | Total distributable earnings (loss) | Undistributed/Distributions in excess of/Accumulated net investment income (loss)
Accumulated/Undistributed net realized gain (loss)
Net unrealized appreciation (depreciation) |
| Statement of Changes in Net Assets | N/A - removed | Undistributed/Distributions in excess of/Accumulated net investment income (loss) end of period |
| Statement of Changes in Net Assets | Distributions to shareholders | Distributions to shareholders from net investment income
Distributions to shareholders from net realized gain |
4. Purchases and Sales of Investments.
Purchases and sales of securities, other than short-term securities, are noted in the table below.
| | Purchases ($) | Sales ($) |
| VIP Investor Freedom Income | 35,334,743 | 31,973,575 |
| VIP Investor Freedom 2005 | 14,004,480 | 12,371,215 |
| VIP Investor Freedom 2010 | 22,442,098 | 28,075,228 |
| VIP Investor Freedom 2015 | 34,951,308 | 38,929,290 |
| VIP Investor Freedom 2020 | 71,079,191 | 74,670,474 |
| VIP Investor Freedom 2025 | 76,272,246 | 64,096,431 |
| VIP Investor Freedom 2030 | 84,565,589 | 55,090,903 |
5. Fees and Other Transactions with Affiliates.
Management Fee. FMR Co., Inc. (the investment adviser), an affiliate of FMR, provides the Funds with investment management related services. The Funds do not pay any fees for these services.
Interfund Trades. The Funds may purchase from or sell securities to other Fidelity Funds under procedures adopted by the Board. The procedures have been designed to ensure these interfund trades are executed in accordance with Rule 17a-7 of the 1940 Act.
6. Other.
The Funds' organizational documents provide former and current trustees and officers with a limited indemnification against liabilities arising in connection with the performance of their duties to the Funds. In the normal course of business, the Funds may also enter into contracts that provide general indemnifications. The Funds' maximum exposure under these arrangements is unknown as this would be dependent on future claims that may be made against the Funds. The risk of material loss from such claims is considered remote.
At the end of the period, the investment adviser or its affiliates were owners of record of all of the outstanding shares of the Funds.
Report of Independent Registered Public Accounting Firm
To the Board of Trustees of Variable Insurance Products Fund V and Shareholders of VIP Investor Freedom Income Portfolio, VIP Investor Freedom 2005 Portfolio, VIP Investor Freedom 2010 Portfolio, VIP Investor Freedom 2015 Portfolio, VIP Investor Freedom 2020 Portfolio, VIP Investor Freedom 2025 Portfolio and VIP Investor Freedom 2030 Portfolio:
Opinions on the Financial Statements
We have audited the accompanying statements of assets and liabilities, including the schedules of investments, of VIP Investor Freedom Income Portfolio, VIP Investor Freedom 2005 Portfolio, VIP Investor Freedom 2010 Portfolio, VIP Investor Freedom 2015 Portfolio, VIP Investor Freedom 2020 Portfolio, VIP Investor Freedom 2025 Portfolio and VIP Investor Freedom 2030 Portfolio (seven of the funds constituting Variable Insurance Products Fund V, hereafter collectively referred to as the "Funds") as of December 31, 2018, the related statements of operations for the year ended December 31, 2018, the statements of changes in net assets for each of the two years in the period ended December 31, 2018, including the related notes, and the financial highlights for each of the five years in the period ended December 31, 2018 (collectively referred to as the “financial statements”). In our opinion, the financial statements present fairly, in all material respects, the financial position of each of the Funds as of December 31, 2018, the results of each of their operations for the year then ended, the changes in each of their net assets for each of the two years in the period ended December 31, 2018 and each of the financial highlights for each of the five years in the period ended December 31, 2018 in conformity with accounting principles generally accepted in the United States of America.
Basis for Opinions
These financial statements are the responsibility of the Funds' management. Our responsibility is to express an opinion on the Funds' financial statements based on our audits. We are a public accounting firm registered with the Public Company Accounting Oversight Board (United States) (PCAOB) and are required to be independent with respect to the Funds in accordance with the U.S. federal securities laws and the applicable rules and regulations of the Securities and Exchange Commission and the PCAOB.
We conducted our audits of these financial statements in accordance with the standards of the PCAOB. Those standards require that we plan and perform the audit to obtain reasonable assurance about whether the financial statements are free of material misstatement, whether due to error or fraud.
Our audits included performing procedures to assess the risks of material misstatement of the financial statements, whether due to error or fraud, and performing procedures that respond to those risks. Such procedures included examining, on a test basis, evidence regarding the amounts and disclosures in the financial statements. Our audits also included evaluating the accounting principles used and significant estimates made by management, as well as evaluating the overall presentation of the financial statements. Our procedures included confirmation of securities owned as of December 31, 2018 by correspondence with the custodian. We believe that our audits provide a reasonable basis for our opinions.
PricewaterhouseCoopers LLP
Boston, Massachusetts
February 19, 2019
We have served as the auditor of one or more investment companies in the Fidelity group of funds since 1932.
Trustees and Officers
The Trustees, Members of the Advisory Board (if any), and officers of the trust and funds, as applicable, are listed below. The Board of Trustees governs each fund and is responsible for protecting the interests of shareholders. The Trustees are experienced executives who meet periodically throughout the year to oversee each fund's activities, review contractual arrangements with companies that provide services to each fund, oversee management of the risks associated with such activities and contractual arrangements, and review each fund's performance. If the interests of a fund and an underlying Fidelity® fund were to diverge, a conflict of interest could arise and affect how the Trustees and Members of the Advisory Board fulfill their fiduciary duties to the affected funds. FMRC has structured the funds to avoid these potential conflicts, although there may be situations where a conflict of interest is unavoidable. In such instances, FMRC, the Trustees, and Members of the Advisory Board would take reasonable steps to minimize and, if possible, eliminate the conflict. Each of the Trustees oversees 260 funds.
The Trustees hold office without limit in time except that (a) any Trustee may resign; (b) any Trustee may be removed by written instrument, signed by at least two-thirds of the number of Trustees prior to such removal; (c) any Trustee who requests to be retired or who has become incapacitated by illness or injury may be retired by written instrument signed by a majority of the other Trustees; and (d) any Trustee may be removed at any special meeting of shareholders by a two-thirds vote of the outstanding voting securities of the trust. Each Trustee who is not an interested person (as defined in the 1940 Act) of the trust and the funds is referred to herein as an Independent Trustee. Each Independent Trustee shall retire not later than the last day of the calendar year in which his or her 75th birthday occurs. The Independent Trustees may waive this mandatory retirement age policy with respect to individual Trustees. Officers and Advisory Board Members hold office without limit in time, except that any officer or Advisory Board Member may resign or may be removed by a vote of a majority of the Trustees at any regular meeting or any special meeting of the Trustees. Except as indicated, each individual has held the office shown or other offices in the same company for the past five years.
Each fund’s Statement of Additional Information (SAI) includes more information about the Trustees. To request a free copy, call Fidelity at 1-877-208-0098.
Experience, Skills, Attributes, and Qualifications of the Trustees. The Governance and Nominating Committee has adopted a statement of policy that describes the experience, qualifications, attributes, and skills that are necessary and desirable for potential Independent Trustee candidates (Statement of Policy). The Board believes that each Trustee satisfied at the time he or she was initially elected or appointed a Trustee, and continues to satisfy, the standards contemplated by the Statement of Policy. The Governance and Nominating Committee also engages professional search firms to help identify potential Independent Trustee candidates who have the experience, qualifications, attributes, and skills consistent with the Statement of Policy. From time to time, additional criteria based on the composition and skills of the current Independent Trustees, as well as experience or skills that may be appropriate in light of future changes to board composition, business conditions, and regulatory or other developments, have also been considered by the professional search firms and the Governance and Nominating Committee. In addition, the Board takes into account the Trustees' commitment and participation in Board and committee meetings, as well as their leadership of standing and ad hoc committees throughout their tenure.
In determining that a particular Trustee was and continues to be qualified to serve as a Trustee, the Board has considered a variety of criteria, none of which, in isolation, was controlling. The Board believes that, collectively, the Trustees have balanced and diverse experience, qualifications, attributes, and skills, which allow the Board to operate effectively in governing each fund and protecting the interests of shareholders. Information about the specific experience, skills, attributes, and qualifications of each Trustee, which in each case led to the Board's conclusion that the Trustee should serve (or continue to serve) as a trustee of the funds, is provided below.
Board Structure and Oversight Function. Abigail P. Johnson is an interested person and currently serves as Chairman. The Trustees have determined that an interested Chairman is appropriate and benefits shareholders because an interested Chairman has a personal and professional stake in the quality and continuity of services provided to the funds. Independent Trustees exercise their informed business judgment to appoint an individual of their choosing to serve as Chairman, regardless of whether the Trustee happens to be independent or a member of management. The Independent Trustees have determined that they can act independently and effectively without having an Independent Trustee serve as Chairman and that a key structural component for assuring that they are in a position to do so is for the Independent Trustees to constitute a substantial majority for the Board. The Independent Trustees also regularly meet in executive session. Arthur E. Johnson serves as Chairman of the Independent Trustees and as such (i) acts as a liaison between the Independent Trustees and management with respect to matters important to the Independent Trustees and (ii) with management prepares agendas for Board meetings.
Fidelity® funds are overseen by different Boards of Trustees. The funds' Board oversees Fidelity's investment-grade bond, money market, asset allocation and certain equity funds, and other Boards oversee Fidelity's high income and other equity funds. The asset allocation funds may invest in Fidelity® funds that are overseen by such other Boards. The use of separate Boards, each with its own committee structure, allows the Trustees of each group of Fidelity® funds to focus on the unique issues of the funds they oversee, including common research, investment, and operational issues. On occasion, the separate Boards establish joint committees to address issues of overlapping consequences for the Fidelity® funds overseen by each Board.
The Trustees operate using a system of committees to facilitate the timely and efficient consideration of all matters of importance to the Trustees, each fund, and fund shareholders and to facilitate compliance with legal and regulatory requirements and oversight of the funds' activities and associated risks. The Board, acting through its committees, has charged FMR and its affiliates with (i) identifying events or circumstances the occurrence of which could have demonstrably adverse effects on the funds' business and/or reputation; (ii) implementing processes and controls to lessen the possibility that such events or circumstances occur or to mitigate the effects of such events or circumstances if they do occur; and (iii) creating and maintaining a system designed to evaluate continuously business and market conditions in order to facilitate the identification and implementation processes described in (i) and (ii) above. Because the day-to-day operations and activities of the funds are carried out by or through FMR, its affiliates, and other service providers, the funds' exposure to risks is mitigated but not eliminated by the processes overseen by the Trustees. While each of the Board's committees has responsibility for overseeing different aspects of the funds' activities, oversight is exercised primarily through the Operations and Audit Committees. In addition, an ad hoc Board committee of Independent Trustees has worked with FMR to enhance the Board's oversight of investment and financial risks, legal and regulatory risks, technology risks, and operational risks, including the development of additional risk reporting to the Board. Appropriate personnel, including but not limited to the funds' Chief Compliance Officer (CCO), FMR's internal auditor, the independent accountants, the funds' Treasurer and portfolio management personnel, make periodic reports to the Board's committees, as appropriate, including an annual review of Fidelity's risk management program for the Fidelity® funds. The responsibilities of each standing committee, including their oversight responsibilities, are described further under "Standing Committees of the Trustees."
Interested Trustees*:
Correspondence intended for a Trustee who is an interested person may be sent to Fidelity Investments, 245 Summer Street, Boston, Massachusetts 02210.
Name, Year of Birth; Principal Occupations and Other Relevant Experience+
Abigail P. Johnson (1961)
Year of Election or Appointment: 2009
Trustee
Chairman of the Board of Trustees
Ms. Johnson also serves as Trustee of other Fidelity® funds. Ms. Johnson serves as Chairman (2016-present), Chief Executive Officer (2014-present), and Director (2007-present) of FMR LLC (diversified financial services company), President of Fidelity Financial Services (2012-present) and President of Personal, Workplace and Institutional Services (2005-present). Ms. Johnson is Chairman and Director of FMR Co., Inc. (investment adviser firm, 2011-present) and Chairman and Director of FMR (investment adviser firm, 2011-present). Previously, Ms. Johnson served as Vice Chairman (2007-2016) and President (2013-2016) of FMR LLC, President and a Director of FMR (2001-2005), a Trustee of other investment companies advised by FMR, Fidelity Investments Money Management, Inc. (investment adviser firm), and FMR Co., Inc. (2001-2005), Senior Vice President of the Fidelity® funds (2001-2005), and managed a number of Fidelity® funds. Ms. Abigail P. Johnson and Mr. Arthur E. Johnson are not related.
Jennifer Toolin McAuliffe (1959)
Year of Election or Appointment: 2016
Trustee
Ms. McAuliffe also serves as Trustee of other Fidelity® funds. Ms. McAuliffe previously served as a Member of the Advisory Board of certain Fidelity® funds (2016) and as Co-Head of Fixed Income of Fidelity Investments Limited (now known as FIL Limited (FIL)) (diversified financial services company). Earlier roles at FIL included Director of Research for FIL’s credit and quantitative teams in London, Hong Kong and Tokyo. Ms. McAuliffe also was the Director of Research for taxable and municipal bonds at Fidelity Investments Money Management, Inc. Ms. McAuliffe is also a director or trustee of several not-for-profit entities.
* Determined to be an “Interested Trustee” by virtue of, among other things, his or her affiliation with the trust or various entities under common control with FMR.
+ The information includes the Trustee's principal occupation during the last five years and other information relating to the experience, attributes, and skills relevant to the Trustee's qualifications to serve as a Trustee, which led to the conclusion that the Trustee should serve as a Trustee for each fund.
Independent Trustees:
Correspondence intended for an Independent Trustee may be sent to Fidelity Investments, P.O. Box 55235, Boston, Massachusetts 02205-5235.
Name, Year of Birth; Principal Occupations and Other Relevant Experience+
Elizabeth S. Acton (1951)
Year of Election or Appointment: 2013
Trustee
Ms. Acton also serves as Trustee of other Fidelity® funds. Prior to her retirement in April 2012, Ms. Acton was Executive Vice President, Finance (2011-2012), Executive Vice President, Chief Financial Officer (2002-2011), and Treasurer (2004-2005) of Comerica Incorporated (financial services). Prior to joining Comerica, Ms. Acton held a variety of positions at Ford Motor Company (1983-2002), including Vice President and Treasurer (2000-2002) and Executive Vice President and Chief Financial Officer of Ford Motor Credit Company (1998-2000). Ms. Acton currently serves as a member of the Board of Directors and Audit and Finance Committees of Beazer Homes USA, Inc. (homebuilding, 2012-present). Previously, Ms. Acton served as a Member of the Advisory Board of certain Fidelity® funds (2013-2016).
Ann E. Dunwoody (1953)
Year of Election or Appointment: 2018
Trustee
General Dunwoody also serves as Trustee of other Fidelity® funds. General Dunwoody (United States Army, Retired) was the first woman in U.S. military history to achieve the rank of four-star general and prior to her retirement in 2012 held a variety of positions within the U.S. Army, including Commanding General, U.S. Army Material Command (2008-2012). She is the President of First to Four LLC (leadership and mentoring services, 2012-present). She also serves as a member of the Board of Directors and Nominating and Corporate Governance Committee of L3 Technologies, Inc. (communication, electronic, sensor, and aerospace systems, 2013-present), Board of Directors and Nomination and Corporate Governance Committees of Kforce Inc. (professional staffing services, 2016-present) and Board of Directors of Automattic Inc. (software engineering, 2018-present). Previously, General Dunwoody served as a Member of the Advisory Board of certain Fidelity® funds (2018), a member of the Board of Directors and Audit and Sustainability and Corporate Responsibility Committees of Republic Services, Inc. (waste collection, disposal and recycling, 2013-2016). Ms. Dunwoody also serves on several boards for non-profit organizations, including as a member of the Board of Directors, Chair of the Nomination and Governance Committee and member of the Audit Committee of Logistics Management Institute (consulting non-profit, 2012-present), a member of the Board of Directors of the Army Historical Foundation (2015-present), a member of the Council of Trustees for the Association of the United States Army (advocacy non-profit, 2013-present) and a member of the Board of Trustees of Florida Institute of Technology (2015-present) and ThanksUSA (military family education non-profit, 2014-present).
John Engler (1948)
Year of Election or Appointment: 2014
Trustee
Mr. Engler also serves as Trustee of other Fidelity® funds. He serves on the board of directors for Universal Forest Products (manufacturer and distributor of wood and wood-alternative products, 2003-present) and K12 Inc. (technology-based education company, 2012-present). Previously, Mr. Engler served as interim president of Michigan State University (2018-2019), a Member of the Advisory Board of certain Fidelity® funds (2014-2016), president of the Business Roundtable (2011-2017), a trustee of The Munder Funds (2003-2014), president and CEO of the National Association of Manufacturers (2004-2011), member of the Board of Trustees of the Annie E. Casey Foundation (2004-2015), and as governor of Michigan (1991-2003). He is a past chairman of the National Governors Association.
Robert F. Gartland (1951)
Year of Election or Appointment: 2010
Trustee
Mr. Gartland also serves as Trustee of other Fidelity® funds. Mr. Gartland is Chairman and an investor in Gartland & Mellina Group Corp. (consulting, 2009-present). Previously, Mr. Gartland served as a partner and investor of Vietnam Partners LLC (investments and consulting, 2008-2011). Prior to his retirement, Mr. Gartland held a variety of positions at Morgan Stanley (financial services, 1979-2007), including Managing Director (1987-2007), and Chase Manhattan Bank (1975-1978).
Arthur E. Johnson (1947)
Year of Election or Appointment: 2008
Trustee
Chairman of the Independent Trustees
Mr. Johnson also serves as Trustee of other Fidelity® funds. Mr. Johnson serves as a member of the Board of Directors of Eaton Corporation plc (diversified power management, 2009-present) and Booz Allen Hamilton (management consulting, 2011-present). Prior to his retirement, Mr. Johnson served as Senior Vice President of Corporate Strategic Development of Lockheed Martin Corporation (defense contractor, 1999-2009). He previously served on the Board of Directors of IKON Office Solutions, Inc. (1999-2008), AGL Resources, Inc. (holding company, 2002-2016), and Delta Airlines (2005-2007). Mr. Arthur E. Johnson is not related to Ms. Abigail P. Johnson.
Michael E. Kenneally (1954)
Year of Election or Appointment: 2009
Trustee
Vice Chairman of the Independent Trustees
Mr. Kenneally also serves as Trustee of other Fidelity® funds. Prior to his retirement, Mr. Kenneally served as Chairman and Global Chief Executive Officer of Credit Suisse Asset Management. Before joining Credit Suisse, he was an Executive Vice President and Chief Investment Officer for Bank of America Corporation. Earlier roles at Bank of America included Director of Research, Senior Portfolio Manager and Research Analyst, and Mr. Kenneally was awarded the Chartered Financial Analyst (CFA) designation in 1991.
Marie L. Knowles (1946)
Year of Election or Appointment: 2001
Trustee
Ms. Knowles also serves as Trustee of other Fidelity® funds. Prior to Ms. Knowles' retirement in June 2000, she served as Executive Vice President and Chief Financial Officer of Atlantic Richfield Company (ARCO) (diversified energy, 1996-2000). From 1993 to 1996, she was a Senior Vice President of ARCO and President of ARCO Transportation Company (pipeline and tanker operations). Ms. Knowles currently serves as a Director and Chairman of the Audit Committee of McKesson Corporation (healthcare service, since 2002). Ms. Knowles is a member of the Board of the Santa Catalina Island Company (real estate, 2009-present). Ms. Knowles is a Member of the Investment Company Institute Board of Governors and a Member of the Governing Council of the Independent Directors Council (2014-present). She also serves as a member of the Advisory Board for the School of Engineering of the University of Southern California. Previously, Ms. Knowles served as a Director of Phelps Dodge Corporation (copper mining and manufacturing, 1994-2007), URS Corporation (engineering and construction, 2000-2003) and America West (airline, 1999-2002). Ms. Knowles previously served as Chairman (2015-2018) and Vice Chairman (2012-2015) of the Independent Trustees of certain Fidelity® funds.
Mark A. Murray (1954)
Year of Election or Appointment: 2016
Trustee
Mr. Murray also serves as Trustee of other Fidelity® funds. Mr. Murray is Vice Chairman (2013-present) of Meijer, Inc. (regional retail chain). Previously, Mr. Murray served as a Member of the Advisory Board of certain Fidelity® funds (2016) and as Co-Chief Executive Officer (2013-2016) and President (2006-2013) of Meijer, Inc. Mr. Murray serves as a member of the Board of Directors and Nuclear Review and Public Policy and Responsibility Committees of DTE Energy Company (diversified energy company, 2009-present). Mr. Murray also serves as a member of the Board of Directors of Spectrum Health (not-for-profit health system, 2015-present). Mr. Murray previously served as President of Grand Valley State University (2001-2006), Treasurer for the State of Michigan (1999-2001), Vice President of Finance and Administration for Michigan State University (1998-1999), and a member of the Board of Directors and Audit Committee and Chairman of the Nominating and Corporate Governance Committee of Universal Forest Products, Inc. (manufacturer and distributor of wood and wood-alternative products, 2004-2016). Mr. Murray is also a director or trustee of many community and professional organizations.
+ The information includes the Trustee's principal occupation during the last five years and other information relating to the experience, attributes, and skills relevant to the Trustee's qualifications to serve as a Trustee, which led to the conclusion that the Trustee should serve as a Trustee for each fund.
Advisory Board Members and Officers:
Correspondence intended for an officer may be sent to Fidelity Investments, 245 Summer Street, Boston, Massachusetts 02210. Officers appear below in alphabetical order.
Name, Year of Birth; Principal Occupation
Elizabeth Paige Baumann (1968)
Year of Election or Appointment: 2017
Anti-Money Laundering (AML) Officer
Ms. Baumann also serves as AML Officer of other funds. She is Chief AML Officer (2012-present) and Senior Vice President (2014-present) of FMR LLC (diversified financial services company) and is an employee of Fidelity Investments. Previously, Ms. Baumann served as AML Officer of the funds (2012-2016), and Vice President (2007-2014) and Deputy Anti-Money Laundering Officer (2007-2012) of FMR LLC.
Craig S. Brown (1977)
Year of Election or Appointment: 2019
Assistant Treasurer
Mr. Brown also serves as Assistant Treasurer of other funds. Mr. Brown is an employee of Fidelity Investments (2013-present).
John J. Burke III (1964)
Year of Election or Appointment: 2018
Chief Financial Officer
Mr. Burke also serves as Chief Financial Officer of other funds. Mr. Burke serves as Head of Investment Operations for Fidelity Fund and Investment Operations (2018-present) and is an employee of Fidelity Investments (1998-present). Previously Mr. Burke served as head of Asset Management Investment Operations (2012-2018).
William C. Coffey (1969)
Year of Election or Appointment: 2018
Secretary and Chief Legal Officer (CLO)
Mr. Coffey also serves as Secretary and CLO of other funds. Mr. Coffey serves as CLO, Secretary, and Senior Vice President of Fidelity Management & Research Company and FMR Co., Inc. (investment adviser firms, 2018-present); Secretary of Fidelity SelectCo, LLC and Fidelity Investments Money Management, Inc. (investment adviser firms, 2018-present); and CLO of Fidelity Management & Research (Hong Kong) Limited, FMR Investment Management (UK) Limited, and Fidelity Management & Research (Japan) Limited (investment adviser firms, 2018-present). He is Senior Vice President and Deputy General Counsel of FMR LLC (diversified financial services company, 2010-present), and is an employee of Fidelity Investments. Previously, Mr. Coffey served as Assistant Secretary of certain funds (2009-2018) and as Vice President and Associate General Counsel of FMR LLC (2005-2009).
Jonathan Davis (1968)
Year of Election or Appointment: 2010
Assistant Treasurer
Mr. Davis also serves as Assistant Treasurer of other funds. Mr. Davis serves as Assistant Treasurer of FMR Capital, Inc. (2017-present) and is an employee of Fidelity Investments. Previously, Mr. Davis served as Vice President and Associate General Counsel of FMR LLC (diversified financial services company, 2003-2010).
Adrien E. Deberghes (1967)
Year of Election or Appointment: 2010
Assistant Treasurer
Mr. Deberghes also serves as an officer of other funds. He serves as Assistant Treasurer of FMR Capital, Inc. (2017-present), Executive Vice President of Fidelity Investments Money Management, Inc. (FIMM) (investment adviser firm, 2016-present), and is an employee of Fidelity Investments (2008-present). Previously, Mr. Deberghes served as President and Treasurer of certain Fidelity® funds (2013-2018). Prior to joining Fidelity Investments, Mr. Deberghes was Senior Vice President of Mutual Fund Administration at State Street Corporation (2007-2008), Senior Director of Mutual Fund Administration at Investors Bank & Trust (2005-2007), and Director of Finance for Dunkin' Brands (2000-2005). Previously, Mr. Deberghes served in other fund officer roles.
Laura M. Del Prato (1964)
Year of Election or Appointment: 2018
President and Treasurer
Ms. Del Prato also serves as an officer of other funds. Ms. Del Prato is an employee of Fidelity Investments (2017-present). Prior to joining Fidelity Investments, Ms. Del Prato served as a Managing Director and Treasurer of the JPMorgan Mutual Funds (2014-2017). Prior to JPMorgan, Ms. Del Prato served as a partner at Cohen Fund Audit Services (accounting firm, 2012-2013) and KPMG LLP (accounting firm, 2004-2012).
Colm A. Hogan (1973)
Year of Election or Appointment: 2016
Assistant Treasurer
Mr. Hogan also serves as an officer of other funds. Mr. Hogan serves as Assistant Treasurer of FMR Capital, Inc. (2017-present) and is an employee of Fidelity Investments (2005-present). Previously, Mr. Hogan served as Assistant Treasurer of certain Fidelity® funds (2016-2018).
Chris Maher (1972)
Year of Election or Appointment: 2013
Assistant Treasurer
Mr. Maher serves as Assistant Treasurer of other funds. Mr. Maher is Vice President of Valuation Oversight, serves as Assistant Treasurer of FMR Capital, Inc. (2017-present), and is an employee of Fidelity Investments. Previously, Mr. Maher served as Vice President of Asset Management Compliance (2013), Vice President of the Program Management Group of FMR (investment adviser firm, 2010-2013), and Vice President of Valuation Oversight (2008-2010).
John B. McGinty, Jr. (1962)
Year of Election or Appointment: 2016
Chief Compliance Officer
Mr. McGinty also serves as Chief Compliance Officer of other funds. Mr. McGinty is Senior Vice President of Asset Management Compliance for Fidelity Investments and is an employee of Fidelity Investments (2016-present). Mr. McGinty previously served as Vice President, Senior Attorney at Eaton Vance Management (investment management firm, 2015-2016), and prior to Eaton Vance as global CCO for all firm operations and registered investment companies at GMO LLC (investment management firm, 2009-2015). Before joining GMO LLC, Mr. McGinty served as Senior Vice President, Deputy General Counsel for Fidelity Investments (2007-2009).
Jason P. Pogorelec (1975)
Year of Election or Appointment: 2015
Assistant Secretary
Mr. Pogorelec also serves as Assistant Secretary of other funds. Mr. Pogorelec serves as Vice President, Associate General Counsel (2010-present) and is an employee of Fidelity Investments (2006-present).
Nancy D. Prior (1967)
Year of Election or Appointment: 2014
Vice President
Ms. Prior also serves as Vice President of other funds. Ms. Prior serves as President Fixed Income, High Income/Emerging Market Debt and Multi Asset Class Strategies of FIAM LLC (2018-present), President (2016-present) and Director (2014-present) of Fidelity Investments Money Management, Inc. (FIMM) (investment adviser firm), President, Fixed Income (2014-present), and is an employee of Fidelity Investments (2002-present). Previously, Ms. Prior served as Vice Chairman of FIAM LLC (investment adviser firm, 2014-2018), a Director of FMR Investment Management (UK) Limited (investment adviser firm, 2015-2018), President Multi-Asset Class Strategies of FMR's Global Asset Allocation Division (2017-2018), Vice President of Fidelity's Money Market Funds (2012-2014), President, Money Market and Short Duration Bond Group of Fidelity Management & Research (FMR) (investment adviser firm, 2013-2014), President, Money Market Group of FMR (2011-2013), Managing Director of Research (2009-2011), Senior Vice President and Deputy General Counsel (2007-2009), and Assistant Secretary of certain Fidelity® funds (2008-2009).
Stacie M. Smith (1974)
Year of Election or Appointment: 2013
Assistant Treasurer
Ms. Smith also serves as an officer of other funds. Ms. Smith serves as Assistant Treasurer of FMR Capital, Inc. (2017-present), is an employee of Fidelity Investments (2009-present), and has served in other fund officer roles. Prior to joining Fidelity Investments, Ms. Smith served as Senior Audit Manager of Ernst & Young LLP (accounting firm, 1996-2009). Previously, Ms. Smith served as Assistant Treasurer (2013-2018) and Deputy Treasurer (2013-2016) of certain Fidelity® funds.
Marc L. Spector (1972)
Year of Election or Appointment: 2016
Deputy Treasurer
Mr. Spector also serves as an officer of other funds. Mr. Spector serves as Assistant Treasurer of FMR Capital, Inc. (2017-present) and is an employee of Fidelity Investments (2016-present). Prior to joining Fidelity Investments, Mr. Spector served as Director at the Siegfried Group (accounting firm, 2013-2016), and prior to Siegfried Group as audit senior manager at Deloitte & Touche (accounting firm, 2005-2013).
Jim Wegmann (1979)
Year of Election or Appointment: 2019
Assistant Treasurer
Mr. Wegmann also serves as Assistant Treasurer of other funds. Mr. Wegmann is an employee of Fidelity Investments (2011-present).
Shareholder Expense Example
As a shareholder of a Fund, you incur two types of costs: (1) transaction costs, and (2) ongoing costs, including other Fund expenses. This Example is intended to help you understand your ongoing costs (in dollars) of investing in the Funds and to compare these costs with the ongoing costs of investing in other mutual funds.
The Example is based on an investment of $1,000 invested at the beginning of the period and held for the entire period (July 1, 2018 to December 31, 2018).
Actual Expenses
The first line of the accompanying table for each fund provides information about actual account values and actual expenses. You may use the information in this line, together with the amount you invested, to estimate the expenses that you paid over the period. Simply divide your account value by $1,000.00 (for example, an $8,600 account value divided by $1,000.00 = 8.6), then multiply the result by the number in the first line for a fund under the heading entitled "Expenses Paid During Period" to estimate the expenses you paid on your account during this period. The estimate of expenses does not include any fees or other expenses of any variable annuity or variable life insurance product. If they were, the estimate of expenses you paid during the period would be higher, and your ending account value would be lower. In addition, each Fund, as a shareholder in underlying Fidelity Funds, will indirectly bear its pro-rata share of the fees and expenses incurred by the underlying Fidelity Funds. These fees and expenses are not included in each Fund's annualized expense ratio used to calculate the expense estimates in the table below.
Hypothetical Example for Comparison Purposes
The second line of the accompanying table for each fund provides information about hypothetical account values and hypothetical expenses based on a fund's actual expense ratio and an assumed rate of return of 5% per year before expenses, which is not the Fund's actual return. The hypothetical account values and expenses may not be used to estimate the actual ending account balance or expenses you paid for the period. You may use this information to compare the ongoing costs of investing in the Fund and other funds. To do so, compare this 5% hypothetical example with the 5% hypothetical examples that appear in the shareholder reports of the other funds. The estimate of expenses does not include any fees or other expenses of any variable annuity or variable life insurance product. If they were, the estimate of expenses you paid during the period would be higher, and your ending account value would be lower. In addition, each Fund, as a shareholder in underlying Fidelity Funds, will indirectly bear its pro-rata share of the fees and expenses incurred by the underlying Fidelity Funds. These fees and expenses are not included in each Fund's annualized expense ratio used to calculate the expense estimates in the table below.
Please note that the expenses shown in the table are meant to highlight your ongoing costs only and do not reflect any transaction costs. Therefore, the second line of the table is useful in comparing ongoing costs only, and will not help you determine the relative total costs of owning different funds.
| | Annualized Expense Ratio-A | Beginning
Account Value
July 1, 2018 | Ending
Account Value
December 31, 2018 | Expenses Paid
During Period-B
July 1, 2018
to December 31, 2018 |
| VIP Investor Freedom Income | - % | | | |
| Actual | | $1,000.00 | $984.60 | $- |
| Hypothetical-C | | $1,000.00 | $1,025.21 | $- |
| VIP Investor Freedom 2005 | - % | | | |
| Actual | | $1,000.00 | $974.30 | $- |
| Hypothetical-C | | $1,000.00 | $1,025.21 | $- |
| VIP Investor Freedom 2010 | - % | | | |
| Actual | | $1,000.00 | $963.20 | $- |
| Hypothetical-C | | $1,000.00 | $1,025.21 | $- |
| VIP Investor Freedom 2015 | - % | | | |
| Actual | | $1,000.00 | $952.70 | $- |
| Hypothetical-C | | $1,000.00 | $1,025.21 | $- |
| VIP Investor Freedom 2020 | - % | | | |
| Actual | | $1,000.00 | $943.30 | $- |
| Hypothetical-C | | $1,000.00 | $1,025.21 | $- |
| VIP Investor Freedom 2025 | - % | | | |
| Actual | | $1,000.00 | $936.50 | $- |
| Hypothetical-C | | $1,000.00 | $1,025.21 | $- |
| VIP Investor Freedom 2030 | - % | | | |
| Actual | | $1,000.00 | $922.10 | $- |
| Hypothetical-C | | $1,000.00 | $1,025.21 | $- |
A Annualized expense ratio reflects expenses net of applicable fee waivers.
B Expenses are equal to each Fund's annualized expense ratio, multiplied by the average account value over the period, multiplied by 184/ 365 (to reflect the one-half year period). The fees and expenses of the underlying Fidelity Funds in which each Fund invests are not included in each Fund's annualized expense ratio.
C 5% return per year before expenses
Distributions (Unaudited)
The Board of Trustees of each fund voted to pay to shareholders of record at the opening of business on record date, the following distributions per share derived from capital gains realized from sales of portfolio securities, and dividends derived from net investment income:
| | Pay Date | Record Date | Dividends | Capital Gains |
| VIP Investor Freedom Income Portfolio | 02/15/19 | 02/15/19 | $0.008 | $0.235 |
| VIP Investor Freedom 2005 Portfolio | 02/15/19 | 02/15/19 | $0.006 | $0.225 |
| VIP Investor Freedom 2010 Portfolio | 02/15/19 | 02/15/19 | $0.006 | $0.505 |
| VIP Investor Freedom 2015 Portfolio | 02/15/19 | 02/15/19 | $0.006 | $0.495 |
| VIP Investor Freedom 2020 Portfolio | 02/15/19 | 02/15/19 | $0.004 | $0.448 |
| VIP Investor Freedom 2025 Portfolio | 02/15/19 | 02/15/19 | $0.003 | $0.410 |
| VIP Investor Freedom 2030 Portfolio | 02/15/19 | 02/15/19 | $0.003 | $0.431 |
The funds hereby designate as capital gain dividend the amounts noted below for the taxable year ended December 31, 2018, or, if subsequently determined to be different, the net capital gain of such year.
| VIP Investor Freedom Income Portfolio | $1,376,772 |
| VIP Investor Freedom 2005 Portfolio | $505,372 |
| VIP Investor Freedom 2010 Portfolio | $2,281,591 |
| VIP Investor Freedom 2015 Portfolio | $3,882,401 |
| VIP Investor Freedom 2020 Portfolio | $7,128,042 |
| VIP Investor Freedom 2025 Portfolio | $6,380,453 |
| VIP Investor Freedom 2030 Portfolio | $7,487,436 |
A percentage of the dividends distributed during the fiscal year for the following funds were derived from interest on U.S. Government securities which is generally exempt from state income tax:
| VIP Investor Freedom Income Portfolio | 28.37% |
| VIP Investor Freedom 2005 Portfolio | 22.10% |
| VIP Investor Freedom 2010 Portfolio | 17.26% |
| VIP Investor Freedom 2015 Portfolio | 13.69% |
| VIP Investor Freedom 2020 Portfolio | 11.24% |
| VIP Investor Freedom 2025 Portfolio | 9.63% |
| VIP Investor Freedom 2030 Portfolio | 5.95% |
A percentage of the dividends distributed during the fiscal year for the following funds qualify for the dividends–received deduction for corporate shareholders:
| VIP Investor Freedom Income Portfolio | |
| February 2018 | 0% |
| December 2018 | 5% |
| VIP Investor Freedom 2005 Portfolio | |
| February 2018 | 3% |
| December 2018 | 7% |
| VIP Investor Freedom 2010 Portfolio | |
| February 2018 | – |
| December 2018 | 11% |
| VIP Investor Freedom 2015 Portfolio | |
| February 2018 | 2% |
| December 2018 | 14% |
| VIP Investor Freedom 2020 Portfolio | |
| February 2018 | 3% |
| December 2018 | 17% |
| VIP Investor Freedom 2025 Portfolio | |
| February 2018 | 5% |
| December 2018 | 19% |
| VIP Investor Freedom 2030 Portfolio | |
| February 2018 | 7% |
| December 2018 | 24% |
The amounts per share which represent income derived from sources within, and taxes paid to, foreign countries or possessions of the United States are as follows:
| | Pay Date | Income | Taxes |
| VIP Investor Freedom Income Portfolio | 12/21/18 | $0.0149 | $0.0019 |
| VIP Investor Freedom 2005 Portfolio | 12/21/18 | $0.0196 | $0.0025 |
| VIP Investor Freedom 2010 Portfolio | 12/21/18 | $0.0266 | $0.0033 |
| VIP Investor Freedom 2015 Portfolio | 12/21/18 | $0.0314 | $0.0039 |
| VIP Investor Freedom 2020 Portfolio | 12/21/18 | $0.0364 | $0.0044 |
| VIP Investor Freedom 2025 Portfolio | 12/21/18 | $0.0429 | $0.0052 |
| VIP Investor Freedom 2030 Portfolio | 12/21/18 | $0.0491 | $0.0059 |
Board Approval of Investment Advisory Contracts and Management Fees
VIP Investor Freedom Funds
Each year, the Board of Trustees, including the Independent Trustees (together, the Board), votes on the renewal of the management contract (the Advisory Contract) with FMR Co., Inc. (FMRC), an affiliate of Fidelity Management & Research Company (FMR), for each fund. The Board, assisted by the advice of fund counsel and Independent Trustees' counsel, requests and considers a broad range of information relevant to the renewal of the Advisory Contracts throughout the year.
The Board meets regularly and, at each of its meetings, covers an extensive agenda of topics and materials and considers factors that are relevant to its annual consideration of the renewal of each fund's Advisory Contract, including the services and support provided to each fund and its shareholders. The Board has established four standing committees (Committees) — Operations, Audit, Fair Valuation, and Governance and Nominating — each composed of and chaired by Independent Trustees with varying backgrounds, to which the Board has assigned specific subject matter responsibilities in order to enhance effective decision-making by the Board. The Operations Committee, of which all of the Independent Trustees are members, meets regularly throughout the year and considers, among other matters, information specifically related to the annual consideration of the renewal of each fund's Advisory Contract. The Board, acting directly and through its Committees, requests and receives information concerning the annual consideration of the renewal of each fund's Advisory Contract. The Board also meets as needed to review matters specifically related to the Board's annual consideration of the renewal of the Advisory Contracts. Members of the Board may also meet with trustees of other Fidelity funds through joint ad hoc committees to discuss certain matters relevant to all of the Fidelity funds.
At its September 2018 meeting, the Board unanimously determined to renew each fund's Advisory Contract. In reaching its determination, the Board considered all factors it believed relevant and reached a determination, with the assistance of fund counsel and Independent Trustees' counsel and through the exercise of its business judgment, that the renewal of the Advisory Contract was in the best interests of each fund and its shareholders and that the fact that no fees are payable under the Advisory Contracts was fair and reasonable. The Board's decision to renew the Advisory Contracts was not based on any single factor, but rather was based on a comprehensive consideration of all the information provided to the Board at its meetings throughout the year. In reaching its determination, the Board was aware that shareholders of each fund have a broad range of investment choices available to them, including a wide choice among funds offered by Fidelity's competitors, and that each fund's shareholders, who have the opportunity to review and weigh the disclosure provided by the fund in its prospectus and other public disclosures, have chosen to invest in that fund, which is part of the Fidelity family of funds.
Nature, Extent, and Quality of Services Provided. The Board considered Fidelity's staffing as it relates to the funds, including the backgrounds of investment personnel of FMRC, and also considered the funds' investment objectives, strategies, and related investment philosophies. The Independent Trustees also had discussions with senior management of Fidelity's investment operations and investment groups with responsibility for the underlying Fidelity funds in which each fund invests. The Board considered the structure of the investment personnel compensation program and whether this structure provides appropriate incentives to act in the best interests of each fund. Additionally, the Board considered the portfolio managers' investments, if any, in the funds that they manage.
Resources Dedicated to Investment Management and Support Services. The Board reviewed the general qualifications and capabilities of Fidelity's investment staff, including its size, education, experience, and resources, as well as Fidelity's approach to recruiting, managing, and compensating investment personnel. The Board noted that Fidelity has continued to increase the resources devoted to non-U.S. offices, including expansion of Fidelity's global investment organization. The Board also noted that Fidelity's analysts have extensive resources, tools and capabilities that allow them to conduct sophisticated quantitative and fundamental analysis, as well as credit analysis of issuers, counterparties and guarantors. Further, the Board considered that Fidelity's investment professionals have sufficient access to global information and data so as to provide competitive investment results over time, and that those professionals also have access to sophisticated tools that permit them to assess portfolio construction and risk and performance attribution characteristics continuously, as well as to transmit new information and research conclusions rapidly around the world. Additionally, in its deliberations, the Board considered Fidelity's risk management, compliance, and technology and operations capabilities and resources, which are integral parts of the investment management process.
Shareholder and Administrative Services. The Board considered (i) the nature, extent, quality, and cost of advisory, administrative, and shareholder services performed by Fidelity under the Advisory Contract and under separate agreements covering transfer agency, and pricing and bookkeeping services for each fund; (ii) the nature and extent of the supervision of third party service providers, principally custodians, subcustodians, and pricing vendors; and (iii) the resources devoted to, and the record of compliance with, each fund's compliance policies and procedures.
The Board noted that the growth of fund assets over time across the complex allows Fidelity to reinvest in the development of services designed to enhance the value and convenience of the Fidelity funds as investment vehicles. These services include 24-hour access to account information and market information through telephone representatives and over the Internet, investor education materials and asset allocation tools, and the expanded availability of Fidelity Investor Centers.
Investment in a Large Fund Family. The Board considered the benefits to shareholders of investing in a Fidelity fund, including the benefits of investing in a fund that is part of a large family of funds offering a variety of investment disciplines and providing a large variety of mutual fund investor services. The Board noted that Fidelity had taken, or had made recommendations that resulted in the Fidelity funds taking, a number of actions over the previous year that benefited particular funds, including: (i) continuing to dedicate additional resources to Fidelity's investment research process, which includes meetings with management of issuers of securities in which the funds invest, and to the support of the senior management team that oversees asset management; (ii) continuing efforts to enhance Fidelity's global research capabilities; (iii) launching new funds and making other enhancements to meet client needs; (iv) launching new share classes of existing funds; (v) eliminating purchase minimums and broadening eligibility requirements for certain funds and share classes; (vi) reducing management fees and total expenses for certain growth equity funds and index funds; (vii) lowering expense caps for certain existing funds and classes, and converting certain voluntary expense caps to contractual caps, to reduce expenses borne by shareholders; (viii) eliminating short-term redemption fees for funds that had such fees; (ix) rationalizing product lines and gaining increased efficiencies from fund mergers and share class consolidations; (x) continuing to develop, acquire and implement systems and technology to improve services to the funds and shareholders, strengthen information security, and increase efficiency; and (xi) continuing to implement enhancements to further strengthen Fidelity's product line to increase investors' probability of success in achieving their investment goals, including retirement income goals.
Investment Performance. The Board considered whether each fund has operated in accordance with its investment objective, as well as its record of compliance with its investment restrictions and its performance history.
The Board took into account discussions that occur at Board meetings throughout the year with representatives of the investment adviser about fund investment performance. In this regard the Board noted that as part of regularly scheduled fund reviews and other reports to the Board on fund performance, the Board considers annualized return information for each fund for different time periods, measured against one or more appropriate securities market indices, including a customized blended index that reflects the respective weights of the fund's asset classes (each a "benchmark index") and a peer group of funds with similar objectives ("peer group"), if any. In its evaluation of fund investment performance at meetings throughout the year, the Board gave particular attention to information indicating underperformance of certain Fidelity funds for specific time periods and discussed with the investment adviser the reasons for such underperformance.
In addition to reviewing absolute and relative fund performance, the Independent Trustees periodically consider the appropriateness of fund performance metrics in evaluating the results achieved. In general, the Independent Trustees believe that fund performance should be evaluated based on gross performance (before fees and expenses, including acquired fund fees and expenses, but after transaction costs, if any) compared to appropriate benchmark indices, over appropriate time periods that may include full market cycles, and on net performance (after fees and expenses, including acquired fund fees and expenses) compared to peer groups, as applicable, over the same periods, taking into account relevant factors including the following: general market conditions; the extent to which particular underlying funds affected performance; and fund cash flows and other factors. Depending on the circumstances, the Independent Trustees may be satisfied with a fund's performance notwithstanding that it lags its benchmark index or peer group for certain periods.
The Independent Trustees recognize that shareholders evaluate performance on a net basis over their own holding periods, for which one-, three-, and five-year periods are often used as a proxy. For this reason, the performance information reviewed by the Board also included net cumulative calendar year total return information for each fund and an appropriate benchmark index for the most recent one-, three-, and five-year periods.
Based on its review, the Board concluded that the nature, extent, and quality of services provided to each fund under the Advisory Contracts should continue to benefit the shareholders of each fund.
Competitiveness of Management Fee and Total Expense Ratio. The Board noted that the funds do not pay FMRC a management fee for investment advisory services, and that each fund bears indirectly the fees and expenses, including the management fees, paid by the underlying Fidelity funds in which it invests. The Board considered each fund's management fee and total expense ratio compared to "mapped groups" of competitive funds and classes created for the purpose of facilitating the Trustees' competitive analysis of management fees and total expenses. Fidelity creates "mapped groups" by combining similar Lipper investment objective categories that have comparable investment mandates. Combining Lipper investment objective categories aids the Board's management fee and total expense ratio comparisons by broadening the competitive group used for comparison.
Management Fee. The Board considered two proprietary management fee comparisons for the 12-month periods shown in basis points (BP) in the charts below. The group of Lipper funds used by the Board for management fee comparisons is referred to below as the "Total Mapped Group." The Total Mapped Group comparison focuses on a fund's standing in terms of gross management fees before expense reimbursements or caps relative to the total universe of funds with comparable investment mandates, regardless of whether their management fee structures also are comparable. Funds with comparable investment mandates offer exposure to similar types of securities. Funds with comparable management fee structures have similar management fee contractual arrangements (
e.g., flat rate charged for advisory services, all-inclusive fee rate,
etc.). "TMG %" represents the percentage of funds in the Total Mapped Group that had management fees that were lower than a fund's. For example, a hypothetical TMG % of 20% would mean that 80% of the funds in the Total Mapped Group had higher, and 20% had lower, management fees than a fund. The funds' actual TMG %s and the number of funds in the Total Mapped Group are in the charts below. The "Asset-Size Peer Group" (ASPG) comparison focuses on a fund's standing relative to a subset of non-Fidelity funds within the Total Mapped Group that are similar in size and management fee structure. For example, if a fund is in the first quartile of the ASPG, the fund's management fee ranks in the least expensive or lowest 25% of funds in the ASPG. The ASPG represents at least 15% of the funds in the Total Mapped Group with comparable asset size and management fee structures, subject to a minimum of 50 funds (or all funds in the Total Mapped Group if fewer than 50). Additional information, such as the ASPG quartile in which a fund's management fee rate ranked, is also included in the charts and was considered by the Board.
VIP Investor Freedom 2005 Portfolio
VIP Investor Freedom 2010 Portfolio
VIP Investor Freedom 2015 Portfolio

VIP Investor Freedom 2020 Portfolio

VIP Investor Freedom 2025 Portfolio
VIP Investor Freedom 2030 Portfolio
VIP Investor Freedom Income Portfolio

The Board noted that each fund's management fee rate of 0.00% ranked below the median of its Total Mapped Group and below the median of its ASPG for 2017. The Board further noted that many peer funds pay fund-level expenses, including management fees, to which the funds are not subject.
The Board noted that it and the boards of other Fidelity funds formed an ad hoc Committee on Group Fee, which meets periodically, to conduct an in-depth review of the "group fee" component of the management fee of funds with such management fee structures, and that while the funds do not pay a management fee, they indirectly bear a portion of the management fees paid by the Fidelity funds in which they invest, some of which are subject to the group fee. The Committee's focus included the mechanics of the group fee, the competitive landscape of group fee structures, Fidelity funds with no group fee component (such as the funds) and investment products not included in group fee assets. The Board also considered that, for funds subject to the group fee, FMR agreed to voluntarily waive fees over a specified period of time in amounts designed to account for assets converted from certain funds to certain collective investment trusts.
Based on its review, the Board concluded that each fund's management fee is fair and reasonable in light of the services that the fund receives and the other factors considered.
Total Expense Ratio. In its review of each fund's total expense ratio, the Board considered that the funds do not pay transfer agent fees. Instead, the applicable class of each underlying Fidelity fund bears its pro rata portion of each fund's transfer agent fee according to the percentage of each fund's assets invested in that underlying fund. The Board further noted that FMR pays all other expenses of each fund, with limited exceptions.
The Board noted that each fund's total expense ratio ranked below the competitive median for 2017.
In considering each fund's total expense ratio, the Board also considered an alternative competitive analysis that included both top level (
i.e., direct) fund fees and acquired fund fees and expenses for the fund and the other funds and classes to which it is compared. The Board noted that, under this alternative competitive analysis, each fund's total expense ratio ranked below the competitive median for 2017.
Fees Charged to Other Fidelity Clients. The Board also considered Fidelity fee structures and other information with respect to clients of Fidelity, such as other funds advised or subadvised by Fidelity, pension plan clients, and other institutional clients with similar mandates. The Board noted that a joint ad hoc committee created by it and the boards of other Fidelity funds periodically reviews and compares Fidelity's institutional investment advisory business with its business of providing services to the Fidelity funds and also noted the most recent findings of the committee. The Board noted that the committee's review included a consideration of the differences in services provided, fees charged, and costs incurred, as well as competition in the markets serving the different categories of clients.
Based on its review of total expense ratios and fees charged to other Fidelity clients, the Board concluded that each fund's total expense ratio was reasonable in light of the services that the fund and its shareholders receive and the other factors considered.
Costs of the Services and Profitability. The Board considered the level of Fidelity's profits in respect of all the Fidelity funds, including the Fidelity funds in which the funds invest.
PricewaterhouseCoopers LLP (PwC), auditor to Fidelity and certain Fidelity funds, has been engaged annually by the Board as part of the Board's assessment of Fidelity's profitability analysis. PwC's engagement includes the review and assessment of the methodologies used by Fidelity in determining the revenues and expenses attributable to Fidelity's mutual fund business, and completion of agreed-upon procedures in respect of the mathematical accuracy of the fund profitability information and its conformity to established allocation methodologies. After considering PwC's reports issued under the engagement and information provided by Fidelity, the Board concluded that while other allocation methods may also be reasonable, Fidelity's profitability methodologies are reasonable in all material respects.
The Board also reviewed Fidelity's non-fund businesses and potential indirect benefits such businesses may have received as a result of their association with Fidelity's mutual fund business (i.e., fall-out benefits) as well as cases where Fidelity's affiliates may benefit from the funds' business. The Board noted that changes to fall-out benefits year-over-year reflect business developments at Fidelity's various businesses.
The Board concluded that the costs of the services provided by and the profits realized by Fidelity in connection with the operation of each fund were not relevant to the renewal of each fund's Advisory Contract because the funds do not pay management fees and FMR pays all other expenses of each fund, with limited exceptions.
Economies of Scale. The Board concluded that because the funds do not pay management fees and FMR pays all other expenses of each fund, with limited exceptions, economies of scale cannot be realized by the funds, but may be realized by the other Fidelity funds in which each fund invests, many of which may benefit from breakpoints under the group fee arrangement.
Additional Information Requested by the Board. In order to develop fully the factual basis for consideration of the Fidelity funds' advisory contracts, the Board requested and received additional information on certain topics, including: (i) Fidelity's fund profitability methodology, profitability trends for certain funds, the allocation of various costs to different funds, and the impact of certain factors on fund profitability results; (ii) portfolio manager changes that have occurred during the past year and the amount of the investment that each portfolio manager has made in the Fidelity fund(s) that he or she manages; (iii) Fidelity's compensation structure for portfolio managers, research analysts, and other key personnel, including its effects on fund profitability, the rationale for the compensation structure, and the extent to which current market conditions have affected retention and recruitment; (iv) the arrangements with and compensation paid to certain fund sub-advisers on behalf of the Fidelity funds and the treatment of such compensation within Fidelity's fund profitability methodology; (v) the terms of Fidelity's voluntary expense limitation agreements; (vi) the methodology with respect to competitive fund data and peer group classifications; (vii) Fidelity's transfer agent fee, expense, and service structures for different funds and classes relative to competitive trends, and the impact of the increased use of omnibus accounts; (viii) new developments in the retail and institutional marketplaces and the competitive positioning of the funds relative to other investment products and services; (ix) the impact of recent changes to the money market fund landscape, including the full implementation of money market fund reform and rising interest rates, on Fidelity's money market funds; (x) the funds' share class structures and distribution channels; and (xi) explanations regarding the relative total expense ratios of certain funds and classes, total expense competitive trends and methodologies for total expense competitive comparisons, and actions that might be taken by Fidelity to reduce total expense ratios for certain classes. In addition, the Board considered its discussions with Fidelity throughout the year regarding enhanced information security initiatives and the funds' fair valuation policies.
Based on its evaluation of all of the conclusions noted above, and after considering all factors it believed relevant, the Board concluded that the advisory fee arrangements are fair and reasonable, and that each fund's Advisory Contract should be renewed.
VIPIFF-ANN-0219
1.814507.113
Fidelity® Variable Insurance Products:
FundsManager - 20%, 50%, 60%, 70%, 85% Portfolio FundsManager 20% Portfolio
FundsManager 50% Portfolio
FundsManager 60% Portfolio
FundsManager 70% Portfolio
FundsManager 85% Portfolio
Annual Report December 31, 2018 |
|
Beginning on January 1, 2021, as permitted by regulations adopted by the Securities and Exchange Commission, and if your insurance carrier elects to participate, you may not be receiving paper copies of the Fund’s shareholder reports from the insurance company that offers your variable insurance product unless you specifically request paper copies from your financial professional or the administrator of your variable insurance product. Instead, the reports will be made available on a website, and you will be notified by mail each time a report is posted and provided with a website link to access the report.
If you already elected to receive shareholder reports electronically, you will not be affected by this change and you need not take any action. You may elect to receive shareholder reports and other communications from the Fund electronically, by contacting your financial professional or the administrator of your variable insurance product. If you own a Fidelity-administered variable insurance product, please visit fidelity.com/mailpreferences to make your election or call 1-800-343-3548.
You may elect to receive all future reports in paper free of charge. If you wish to continue receiving paper copies of your shareholder reports, you may contact your financial professional or the administrator of your variable insurance product. If you own a Fidelity-administered variable insurance product, please visit fidelity.com/mailpreferences to make your election or call 1-800-343-3548. Your election to receive reports in paper will apply to all funds available under your variable insurance product.
Contents
To view a fund's proxy voting guidelines and proxy voting record for the 12-month period ended June 30, visit http://www.fidelity.com/proxyvotingresults or visit the Securities and Exchange Commission's (SEC) web site at http://www.sec.gov.
You may also call 1-877-208-0098 to request a free copy of the proxy voting guidelines.
Fidelity® Variable Insurance Products are separate account options which are purchased through a variable insurance contract.
Standard & Poor's, S&P and S&P 500 are registered service marks of The McGraw-Hill Companies, Inc. and have been licensed for use by Fidelity Distributors Corporation.
Other third-party marks appearing herein are the property of their respective owners.
All other marks appearing herein are registered or unregistered trademarks or service marks of FMR LLC or an affiliated company. © 2019 FMR LLC. All rights reserved.
This report and the financial statements contained herein are submitted for the general information of the shareholders of the Funds. This report is not authorized for distribution to prospective investors in the Funds unless preceded or accompanied by an effective prospectus.
A fund files its complete schedule of portfolio holdings with the SEC for the first and third quarters of each fiscal year on Form N-Q. Forms N-Q are available on the SEC’s web site at http://www.sec.gov. A fund's Forms N-Q may be reviewed and copied at the SEC’s Public Reference Room in Washington, DC. Information regarding the operation of the SEC's Public Reference Room may be obtained by calling 1-800-SEC-0330.
For a complete list of a fund's portfolio holdings, view the most recent holdings listing, semiannual report, or annual report on Fidelity's web site at http://www.fidelity.com, http://www.institutional.fidelity.com, or http://www.401k.com, as applicable.
NOT FDIC INSURED •MAY LOSE VALUE •NO BANK GUARANTEE
Neither the Funds nor Fidelity Distributors Corporation is a bank.
VIP FundsManager® 20% Portfolio
Performance: The Bottom Line
Average annual total return reflects the change in the value of an investment, assuming reinvestment of distributions from dividend income and capital gains (the profits earned upon the sale of securities that have grown in value, if any) and assuming a constant rate of performance each year. During periods of reimbursement by Fidelity, a fund’s total return will be greater than it would be had the reimbursement not occurred. Performance numbers are net of all underlying fund operating expenses, but do not include any insurance charges imposed by your insurance company’s separate account. If performance information included the effect of these additional charges, the total returns would have been lower. How a fund did yesterday is no guarantee of how it will do tomorrow.
Average Annual Total Returns
| For the periods ended December 31, 2018 | Past 1 year | Past 5 years | Past 10 years |
| Service Class | (1.67)% | 2.49% | 4.34% |
| Service Class 2 | (1.82)% | 2.32% | 4.17% |
| Investor Class | (1.67)% | 2.47% | 4.33% |
$10,000 Over 10 Years
Let's say hypothetically that $10,000 was invested in VIP FundsManager® 20% Portfolio - Investor Class on December 31, 2008.
The chart shows how the value of your investment would have changed, and also shows how the Bloomberg Barclays U.S. Aggregate Bond Index performed over the same period.
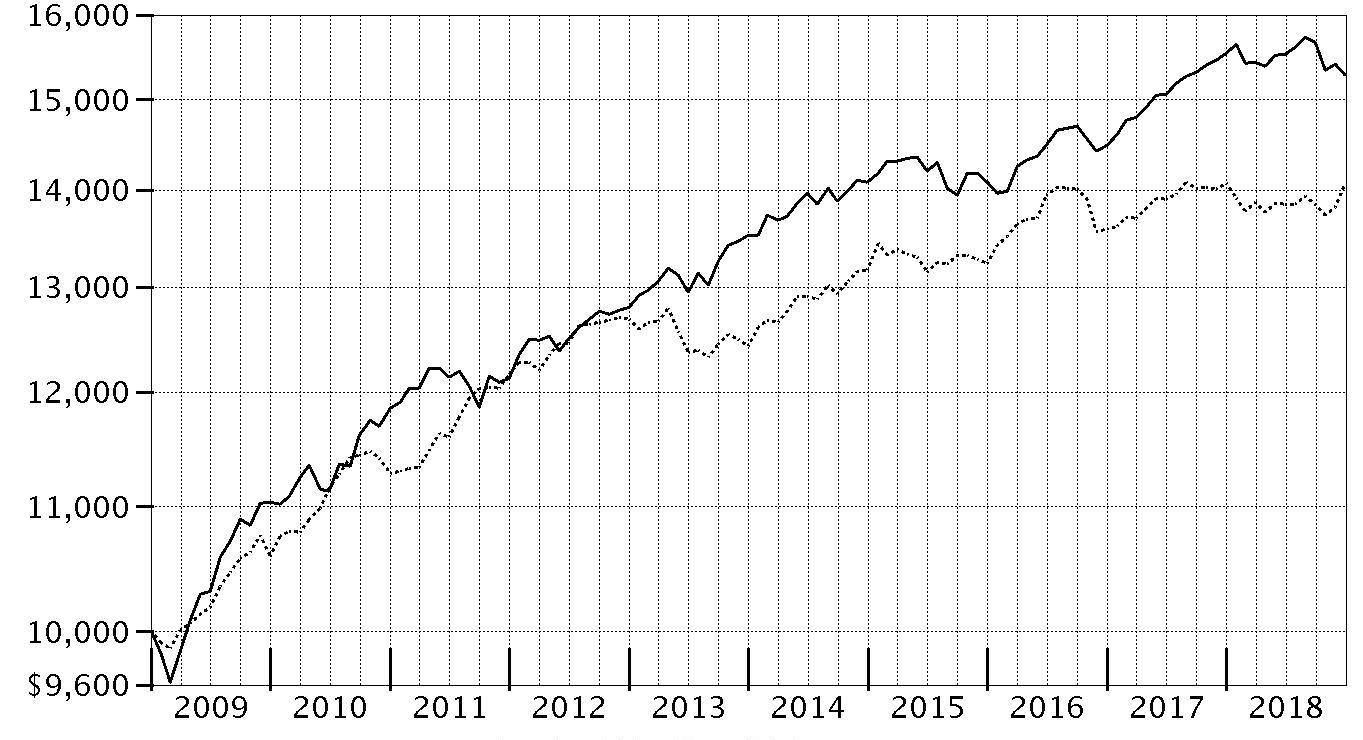
| Period Ending Values |
| $15,283 | VIP FundsManager® 20% Portfolio - Investor Class |
| $14,075 | Bloomberg Barclays U.S. Aggregate Bond Index |
VIP FundsManager® 50% Portfolio
Performance: The Bottom Line
Average annual total return reflects the change in the value of an investment, assuming reinvestment of distributions from dividend income and capital gains (the profits earned upon the sale of securities that have grown in value, if any) and assuming a constant rate of performance each year. During periods of reimbursement by Fidelity, a fund’s total return will be greater than it would be had the reimbursement not occurred. Performance numbers are net of all underlying fund operating expenses, but do not include any insurance charges imposed by your insurance company’s separate account. If performance information included the effect of these additional charges, the total returns would have been lower. How a fund did yesterday is no guarantee of how it will do tomorrow.
Average Annual Total Returns
| For the periods ended December 31, 2018 | Past 1 year | Past 5 years | Past 10 years |
| Service Class | (5.28)% | 3.54% | 7.14% |
| Service Class 2 | (5.38)% | 3.38% | 6.99% |
| Investor Class | (5.20)% | 3.54% | 7.16% |
$10,000 Over 10 Years
Let's say hypothetically that $10,000 was invested in VIP FundsManager® 50% Portfolio - Investor Class on December 31, 2008.
The chart shows how the value of your investment would have changed, and also shows how the S&P 500® Index performed over the same period.

| Period Ending Values |
| $19,965 | VIP FundsManager® 50% Portfolio - Investor Class |
| $34,303 | S&P 500® Index |
VIP FundsManager® 60% Portfolio
Performance: The Bottom Line
Average annual total return reflects the change in the value of an investment, assuming reinvestment of distributions from dividend income and capital gains (the profits earned upon the sale of securities that have grown in value, if any) and assuming a constant rate of performance each year. During periods of reimbursement by Fidelity, a fund’s total return will be greater than it would be had the reimbursement not occurred. Performance numbers are net of all underlying fund operating expenses, but do not include any insurance charges imposed by your insurance company’s separate account. If performance information included the effect of these additional charges, the total returns would have been lower. How a fund did yesterday is no guarantee of how it will do tomorrow.
Average Annual Total Returns
| For the periods ended December 31, 2018 | Past 1 year | Past 5 years | Past 10 years |
| Service Class | (6.44)% | 3.95% | 8.16% |
| Service Class 2 | (6.51)% | 3.81% | 7.99% |
| Investor Class | (6.44)% | 3.95% | 8.16% |
$10,000 Over 10 Years
Let's say hypothetically that $10,000 was invested in VIP FundsManager® 60% Portfolio - Investor Class on December 31, 2008.
The chart shows how the value of your investment would have changed, and also shows how the S&P 500® Index performed over the same period.

| Period Ending Values |
| $21,909 | VIP FundsManager® 60% Portfolio - Investor Class |
| $34,303 | S&P 500® Index |
VIP FundsManager® 70% Portfolio
Performance: The Bottom Line
Average annual total return reflects the change in the value of an investment, assuming reinvestment of distributions from dividend income and capital gains (the profits earned upon the sale of securities that have grown in value, if any) and assuming a constant rate of performance each year. During periods of reimbursement by Fidelity, a fund’s total return will be greater than it would be had the reimbursement not occurred. Performance numbers are net of all underlying fund operating expenses, but do not include any insurance charges imposed by your insurance company’s separate account. If performance information included the effect of these additional charges, the total returns would have been lower. How a fund did yesterday is no guarantee of how it will do tomorrow.
Average Annual Total Returns
| For the periods ended December 31, 2018 | Past 1 year | Past 5 years | Past 10 years |
| Service Class | (7.50)% | 4.11% | 8.82% |
| Service Class 2 | (7.60)% | 3.97% | 8.67% |
| Investor Class | (7.49)% | 4.11% | 8.82% |
$10,000 Over 10 Years
Let's say hypothetically that $10,000 was invested in VIP FundsManager® 70% Portfolio - Investor Class on December 31, 2008.
The chart shows how the value of your investment would have changed, and also shows how the S&P 500® Index performed over the same period.
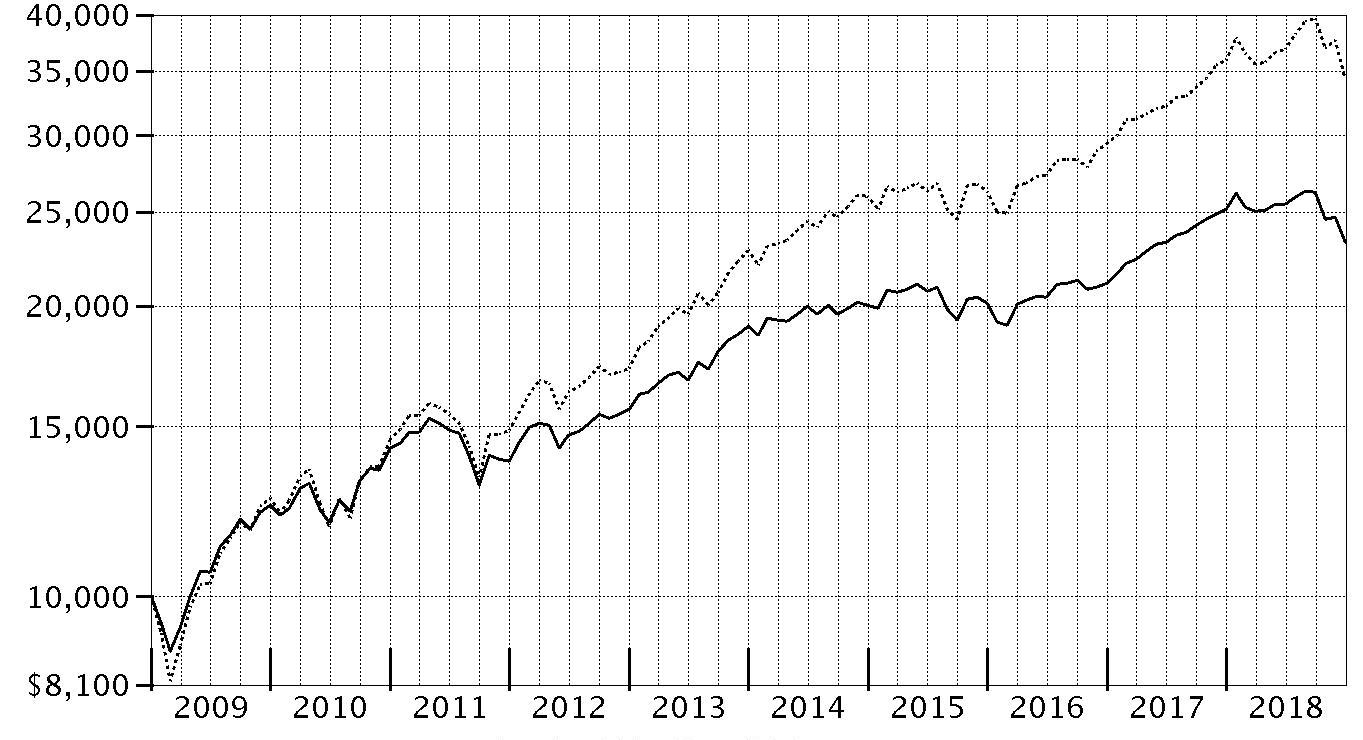
| Period Ending Values |
| $23,291 | VIP FundsManager® 70% Portfolio - Investor Class |
| $34,303 | S&P 500® Index |
VIP FundsManager® 85% Portfolio
Performance: The Bottom Line
Average annual total return reflects the change in the value of an investment, assuming reinvestment of distributions from dividend income and capital gains (the profits earned upon the sale of securities that have grown in value, if any) and assuming a constant rate of performance each year. During periods of reimbursement by Fidelity, a fund’s total return will be greater than it would be had the reimbursement not occurred. Performance numbers are net of all underlying fund operating expenses, but do not include any insurance charges imposed by your insurance company’s separate account. If performance information included the effect of these additional charges, the total returns would have been lower. How a fund did yesterday is no guarantee of how it will do tomorrow.
Average Annual Total Returns
| For the periods ended December 31, 2018 | Past 1 year | Past 5 years | Past 10 years |
| Service Class | (8.90)% | 4.60% | 9.95% |
| Service Class 2 | (9.08)% | 4.44% | 9.77% |
| Investor Class | (8.89)% | 4.61% | 9.96% |
$10,000 Over 10 Years
Let's say hypothetically that $10,000 was invested in VIP FundsManager® 85% Portfolio - Investor Class on December 31, 2008.
The chart shows how the value of your investment would have changed, and also shows how the S&P 500® Index performed over the same period.
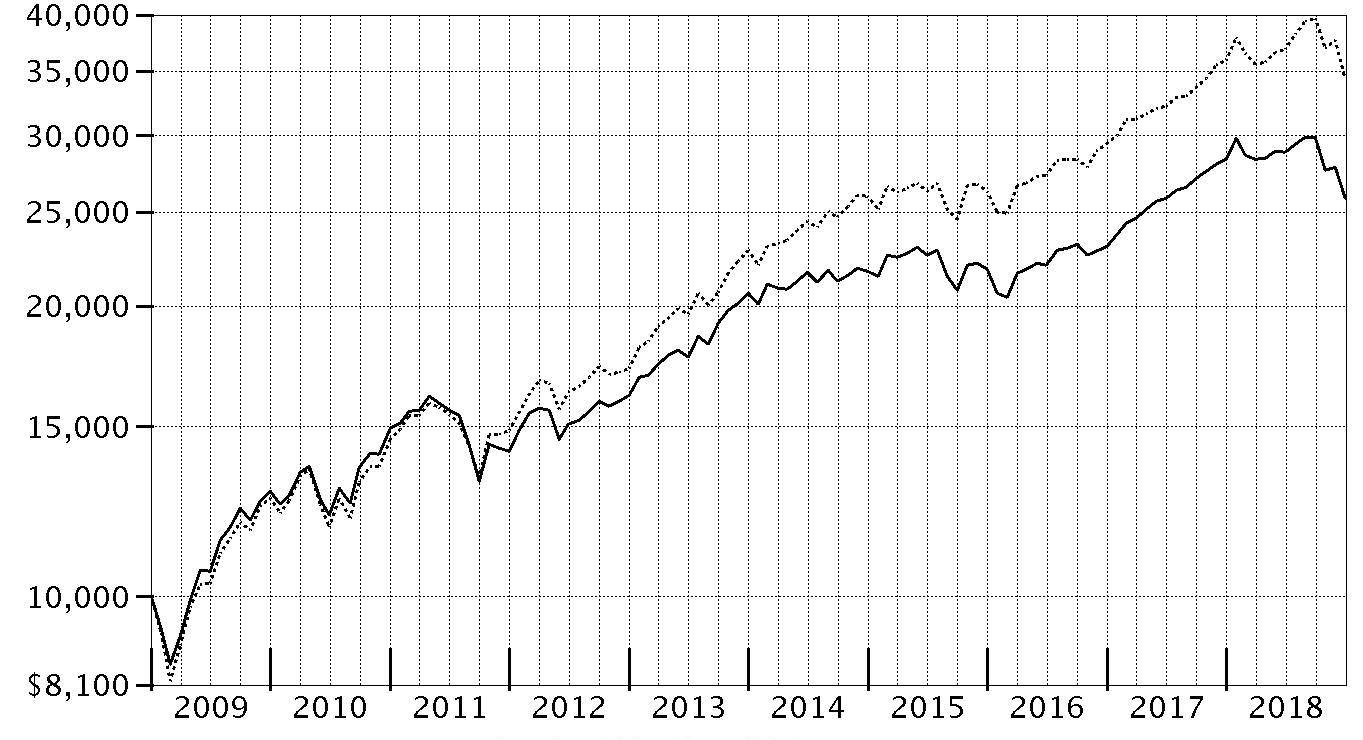
| Period Ending Values |
| $25,836 | VIP FundsManager® 85% Portfolio - Investor Class |
| $34,303 | S&P 500® Index |
Management's Discussion of Fund Performance
Market Recap: The global economy remained in expansion in 2018, but growth became less synchronous and more uneven. Meanwhile, global monetary policy became a headwind, and this uncertainty spurred an increase in volatility among risk assets. This was particularly true in the latter part of the year due to several factors including China entering a growth recession, emerging late-cycle conditions in the U.S., falling commodity prices, China-U.S trade-policy uncertainty and the U.K.’s planned “Brexit” from the European Union.
Against this backdrop, U.S. equities, as measured by the S&P 500
® index returned -4.38% in 2018. Sector-wise, seven of the 11 major sectors in the S&P 500
® lost ground this period. Falling crude-oil prices caused energy stocks (-18%) to suffer most, while slowing global growth concerns felled the materials (-15%), industrials (-13%) and financials (-13%) sectors. Conversely, health care (+6%) led the way, followed by the utilities (+4%), information technology (+3%) and consumer discretionary (+2%) sectors. Overseas, equities suffered a pronounced, broad-based correction, returning -14.04% for the year, according to the MSCI ACWI ex USA Index. Among regions in the index, Asia-Pacific (-11%) and Japan (-13%) held up best, whereas resource-rich Canada (-17%), Europe (-14%) and emerging markets (-14%) lagged.
In terms of fixed income, investment-grade bonds were roughly flat for the 12 months, according to the Bloomberg Barclays U.S. Aggregate Bond Index. Late in the year, concerns about global growth pushed Treasury yields lower and credit spreads wider. Short-term debt led most U.S. investment-grade sectors, followed by asset-backed securities and agency bonds while corporate credit produced negative returns according to Bloomberg Barclays.
Comments from Portfolio Manager Geoff Stein: For the year, the Portfolios' share classes posted returns ranging from roughly -2% to -9%, trailing their respective Composite benchmarks. The Portfolios underperformed primarily because of weak U.S. stock selection during the final quarter of 2018. The majority of the domestic equity subportfolio was allocated to Fidelity
® Stock Selector All Cap Fund, which substantially lagged the broader U.S. equity market. Security selection in information technology had the greatest negative impact on results. Picks among foreign developed-markets (DM) equities also notably detracted from relative performance. Overall, asset allocation added value from a relative performance standpoint, driven by equity positioning. Underweighted exposure to international DM stocks fueled the Portfolios' positive equity allocation results, as this asset class lagged U.S. equities, primarily due to a strengthening U.S. dollar. An average overweighting in U.S. stocks also meaningfully contributed, bolstered by tax reform, strong corporate profit growth and better economic growth in the United States versus Europe and other regions. Conversely, a small, out-of-benchmark allocation to commodities hampered the Portfolios' equity strategy, largely due to falling oil prices. My fixed-income allocation strategy – underweighting cash and investment-grade bonds to help fund various out-of-benchmark positions – detracted versus the Composite benchmarks and partially offset the benefit of my equity positioning. Underweighting investment-grade debt worked against my strategy, primarily because some of the alternative bond sectors I invested in didn’t perform as well as expected. Looking ahead, I have a broadly neutral view toward stocks, but believe international equities – particularly in emerging markets – may offer more attractive opportunities than the U.S.
The views expressed above reflect those of the portfolio manager(s) only through the end of the period as stated on the cover of this report and do not necessarily represent the views of Fidelity or any other person in the Fidelity organization. Any such views are subject to change at any time based upon market or other conditions and Fidelity disclaims any responsibility to update such views. These views may not be relied on as investment advice and, because investment decisions for a Fidelity fund are based on numerous factors, may not be relied on as an indication of trading intent on behalf of any Fidelity fund.
VIP FundsManager® 20% Portfolio
Investment Summary (Unaudited)
The information in the following tables is based on the direct investments of the Fund.
Top Holdings as of December 31, 2018
| | % of fund's net assets |
| Fidelity U.S. Bond Index Fund Institutional Premium Class | 43.6 |
| Fidelity Investments Money Market Prime Reserves Portfolio - Institutional Class 2.49% | 16.8 |
| Fidelity Investments Money Market Government Portfolio Institutional Class 2.29% | 11.4 |
| Fidelity Stock Selector All Cap Fund | 11.2 |
| Fidelity Inflation-Protected Bond Index Fund Institutional Premium Class | 4.2 |
| Fidelity Long Term Treasury Bond Index Fund Institutional Premium | 2.9 |
| Fidelity Floating Rate High Income Fund | 1.0 |
| Fidelity Mega Cap Stock Fund | 0.8 |
| Fidelity Japan Fund | 0.8 |
| Fidelity Overseas Fund | 0.7 |
| | 93.4 |
Asset Allocation (% of fund's net assets)
| Period end* |
| | Domestic Equity Funds | 14.7% |
| | International Equity Funds | 4.6% |
| | Bond Funds | 52.2% |
| | Short-Term Funds | 28.4% |
| | Short-Term Investments | 0.1% |

* Futures - 0.7%
VIP FundsManager® 20% Portfolio
Schedule of Investments December 31, 2018
Showing Percentage of Net Assets
| Equity Funds - 19.3% | | | |
| | | Shares | Value |
| Fidelity Contrafund (a) | | 384,449 | $4,232,782 |
| Fidelity Diversified International Fund (a) | | 139,996 | 4,430,870 |
| Fidelity Equity-Income Fund (a) | | 82,584 | 4,206,824 |
| Fidelity Europe Fund (a) | | 52,762 | 1,656,737 |
| Fidelity Global Commodity Stock Fund (a) | | 305,831 | 3,425,312 |
| Fidelity International Capital Appreciation Fund (a) | | 59,320 | 1,057,683 |
| Fidelity International Discovery Fund (a) | | 100,340 | 3,659,396 |
| Fidelity International Enhanced Index Fund (a) | | 406,266 | 3,432,947 |
| Fidelity International Small Cap Fund (a) | | 60,683 | 1,437,579 |
| Fidelity International Small Cap Opportunities Fund (a) | | 112,326 | 1,812,941 |
| Fidelity International Value Fund (a) | | 318,165 | 2,313,061 |
| Fidelity Japan Fund (a) | | 439,843 | 5,766,339 |
| Fidelity Japan Smaller Companies Fund (a) | | 182,710 | 2,766,230 |
| Fidelity Low-Priced Stock Fund (a) | | 95,790 | 4,156,325 |
| Fidelity Mega Cap Stock Fund (a) | | 451,840 | 6,104,354 |
| Fidelity Overseas Fund (a) | | 123,227 | 5,037,536 |
| Fidelity Pacific Basin Fund (a) | | 32,291 | 849,900 |
| Fidelity Real Estate Investment Portfolio (a) | | 19,379 | 744,366 |
| Fidelity Stock Selector All Cap Fund (a) | | 2,123,226 | 81,595,573 |
| Fidelity Value Discovery Fund (a) | | 83,075 | 2,090,155 |
| TOTAL EQUITY FUNDS | | | |
| (Cost $160,935,422) | | | 140,776,910 |
|
| Fixed-Income Funds - 52.2% | | | |
| Fidelity Floating Rate High Income Fund (a) | | 800,604 | 7,365,560 |
| Fidelity Inflation-Protected Bond Index Fund Institutional Premium Class (a) | | 3,239,942 | 30,747,046 |
| Fidelity Long Term Treasury Bond Index Fund Institutional Premium (a) | | 1,653,165 | 20,962,126 |
| Fidelity New Markets Income Fund (a) | | 241,602 | 3,447,653 |
| Fidelity U.S. Bond Index Fund Institutional Premium Class (a) | | 28,126,296 | 317,264,615 |
| TOTAL FIXED-INCOME FUNDS | | | |
| (Cost $379,797,235) | | | 379,787,000 |
|
| Money Market Funds - 28.4% | | | |
| Fidelity Cash Central Fund, 2.42% (b) | | 1,192,708 | 1,192,947 |
| Fidelity Investments Money Market Government Portfolio Institutional Class 2.29% (a)(c) | | 83,379,133 | 83,379,133 |
| Fidelity Investments Money Market Prime Reserves Portfolio - Institutional Class 2.49% (a)(c) | | 122,616,503 | 122,641,026 |
| TOTAL MONEY MARKET FUNDS | | | |
| (Cost $207,212,825) | | | 207,213,106 |
| | | Principal Amount | Value |
|
| U.S. Treasury Obligations - 0.1% | | | |
| U.S. Treasury Bills, yield at date of purchase 2.34% to 2.41% 2/14/19 to 3/28/19 (d) | | | |
| (Cost $507,732) | | 510,000 | 507,715 |
| TOTAL INVESTMENT IN SECURITIES - 100.0% | | | |
| (Cost $748,453,214) | | | 728,284,731 |
| NET OTHER ASSETS (LIABILITIES) - 0.0% | | | (159,659) |
| NET ASSETS - 100% | | | $728,125,072 |
| Futures Contracts | | | | | |
| | Number of contracts | Expiration Date | Notional Amount | Value | Unrealized Appreciation/(Depreciation) |
| Purchased | | | | | |
| Equity Index Contracts | | | | | |
| ICE E-mini MSCI Emerging Markets Index Contracts (United States) | 151 | March 2019 | $7,299,340 | $(43,203) | $(43,203) |
| Sold | | | | | |
| Equity Index Contracts | | | | | |
| CME E-mini S&P 500 Index Contracts (United States) | 17 | March 2019 | 2,129,420 | 122,358 | 122,358 |
| TOTAL FUTURES CONTRACTS | | | | | $79,155 |
The notional amount of futures purchased as a percentage of Net Assets is 1.0%
The notional amount of futures sold as a percentage of Net Assets is 0.3%
For the period, the average monthly underlying face amount at value for futures contracts in the aggregate was $6,066,722.
Legend
(a) Affiliated Fund
(b) Affiliated fund that is generally available only to investment companies and other accounts managed by Fidelity Investments. The rate quoted is the annualized seven-day yield of the fund at period end. A complete unaudited listing of the fund's holdings as of its most recent quarter end is available upon request. In addition, each Fidelity Central Fund's financial statements, which are not covered by the Fund's Report of Independent Registered Public Accounting Firm, are available on the SEC's website or upon request.
(c) The rate quoted is the annualized seven-day yield of the fund at period end.
(d) Security or a portion of the security was pledged to cover margin requirements for futures contracts. At period end, the value of securities pledged amounted to $179,420.
Affiliated Central Funds
Information regarding fiscal year to date income earned by the Fund from investments in Fidelity Central Funds is as follows:
| Fund | Income earned |
| Fidelity Cash Central Fund | $15,134 |
| Total | $15,134 |
Amounts in the income column in the above table include any capital gain distributions from underlying funds, which are presented in the corresponding line-item in the Statement of Operations if applicable.
Fiscal year to date information regarding the Fund’s investments in non-Money Market Central Funds, including the ownership percentage, is presented below.
| Affiliate | Value, beginning of period | Purchases(a) | Sales Proceeds(a) | Realized Gain (loss) | Change in Unrealized appreciation (depreciation) | Value, end of period | % ownership, end of period |
| Fidelity Consumer Discretionary Central Fund | $-- | $8,953,396 | $9,027,548 | $74,152 | $-- | $-- | 0.0% |
| Fidelity Consumer Staples Central Fund | -- | 4,816,241 | 4,856,996 | 40,755 | -- | -- | 0.0% |
| Fidelity Energy Central Fund | -- | 4,301,390 | 4,345,882 | 44,492 | -- | -- | 0.0% |
| Fidelity Financials Central Fund | -- | 12,918,479 | 12,983,948 | 65,469 | -- | -- | 0.0% |
| Fidelity Health Care Central Fund | -- | 11,314,305 | 11,351,684 | 37,379 | -- | -- | 0.0% |
| Fidelity Industrials Central Fund | -- | 8,410,818 | 8,495,300 | 84,482 | -- | -- | 0.0% |
| Fidelity Information Technology Central Fund | -- | 20,550,696 | 20,625,411 | 74,715 | -- | -- | 0.0% |
| Fidelity Materials Central Fund | -- | 2,544,166 | 2,570,338 | 26,172 | -- | -- | 0.0% |
| Fidelity Telecom Services Central Fund | -- | 1,315,216 | 1,334,397 | 19,181 | -- | -- | 0.0% |
| Fidelity Utilities Central Fund | -- | 2,158,269 | 2,185,539 | 27,270 | -- | -- | 0.0% |
| | $-- | $77,282,976 | $77,777,043 | $494,067 | $-- | $-- | |
(a) Includes the value of shares purchased or redeemed through in-kind transactions, if applicable. See the Notes to Financial Statements for additional details.
Amounts in the income column in the above table include any capital gain distributions from underlying funds, which are presented in the corresponding line-item in the Statement of Operations if applicable.
Affiliated Underlying Funds
Fiscal year to date information regarding the Fund's investments in affiliated Underlying Funds, excluding any Money Market Central Funds, is presented below. Exchanges between classes of the same affiliated Underlying Funds may occur.
| Affiliate | Value, beginning of period | Purchases(a) | Sales Proceeds(a) | Dividend Income | Realized Gain (loss) | Change in Unrealized appreciation (depreciation) | Value, end of period |
| Fidelity Air Transportation Portfolio | $545,347 | $38,495 | $526,059 | $28,339 | $125 | $(57,908) | $-- |
| Fidelity Banking Portfolio | 1,290,495 | 121,924 | 1,313,647 | 95,719 | 602,081 | (700,853) | -- |
| Fidelity Biotechnology Portfolio | 648,913 | 41,351 | 686,045 | 25,901 | 127,802 | (132,021) | -- |
| Fidelity Brokerage and Investment Management Portfolio | 284,833 | 19,686 | 292,087 | 13,626 | 30,625 | (43,057) | -- |
| Fidelity Chemicals Portfolio | 288,919 | 21,974 | 278,973 | 16,683 | 119,225 | (151,145) | -- |
| Fidelity Commodity Strategy Fund | 6,280,442 | 861,811 | 7,089,260 | -- | 158,949 | (211,942) | -- |
| Fidelity Communication Services Portfolio | 473,209 | 34,497 | 460,099 | 25,707 | (25,833) | (21,774) | -- |
| Fidelity Construction and Housing Portfolio | 409,106 | 25,964 | 385,039 | 18,538 | (62,102) | 12,071 | -- |
| Fidelity Consumer Discretionary Portfolio | 5,710,919 | 2,143,257 | 7,877,116 | 124,491 | 3,160,325 | (3,137,385) | -- |
| Fidelity Consumer Staples Portfolio | 4,194,088 | 1,276,565 | 4,913,097 | 297,520 | 1,283,059 | (1,840,615) | -- |
| Fidelity Contrafund | 3,044,565 | 2,490,293 | 806,461 | 362,937 | (7,306) | (488,309) | 4,232,782 |
| Fidelity Defense and Aerospace Portfolio | 1,903,687 | 95,117 | 2,084,246 | 58,324 | 656,965 | (571,523) | -- |
| Fidelity Diversified International Fund | 6,779,012 | 484,161 | 1,730,273 | 303,721 | (59,729) | (1,042,301) | 4,430,870 |
| Fidelity Emerging Asia Fund | 791,868 | 7,658 | 810,698 | -- | 284,555 | (273,383) | -- |
| Fidelity Emerging Markets Discovery Fund | 1,418,774 | 13,785 | 1,491,466 | -- | 80,132 | (21,225) | -- |
| Fidelity Emerging Markets Fund | 5,855,111 | 55,906 | 6,001,938 | -- | 1,539,412 | (1,448,491) | -- |
| Fidelity Energy Portfolio | 3,352,628 | 963,161 | 4,378,928 | -- | 652,355 | (589,216) | -- |
| Fidelity Equity-Income Fund | 5,038,472 | 1,527,286 | 1,566,620 | 399,772 | (51,621) | (740,693) | 4,206,824 |
| Fidelity Europe Fund | 2,594,533 | 262,054 | 675,421 | 178,223 | 27,932 | (552,361) | 1,656,737 |
| Fidelity Extended Market Index Fund Premium Class | 22,360 | 21 | 23,957 | 21 | 9,164 | (7,588) | -- |
| Fidelity Financial Services Portfolio | 6,667,195 | 2,546,105 | 8,896,507 | 210,192 | 2,337,899 | (2,654,692) | -- |
| Fidelity Floating Rate High Income Fund | 7,814,907 | 736,527 | 848,520 | 352,117 | (3,880) | (333,474) | 7,365,560 |
| Fidelity Focused High Income Fund | 272 | 5 | 268 | 6 | (2) | (7) | -- |
| Fidelity Global Commodity Stock Fund | 6,485,492 | 952,777 | 3,557,356 | 75,282 | 193,259 | (648,860) | 3,425,312 |
| Fidelity Health Care Portfolio | 7,117,118 | 2,790,576 | 10,169,261 | 343,576 | 1,260,422 | (998,855) | -- |
| Fidelity Industrial Equipment Portfolio | 1,351,273 | 177,012 | 4,234 | 170,990 | (13) | (275,682) | -- |
| Fidelity Industrials Portfolio | 2,606,708 | 1,902,951 | 5,570,757 | 227,698 | (115,134) | (72,124) | -- |
| Fidelity Inflation-Protected Bond Index Fund Institutional Class | 29,469,230 | 5,310,291 | 3,074,255 | 80,819 | (35,629) | 21,883 | -- |
| Fidelity Inflation-Protected Bond Index Fund Institutional Premium Class | -- | 826,611 | 703,299 | 603,136 | (11,123) | (1,056,663) | 30,747,046 |
| Fidelity Insurance Portfolio | 693,241 | 94,723 | 685,566 | 81,238 | 288,263 | (390,661) | -- |
| Fidelity International Capital Appreciation Fund | 1,565,433 | 80,289 | 402,427 | 31,106 | 60,487 | (246,099) | 1,057,683 |
| Fidelity International Discovery Fund | 5,646,974 | 289,331 | 1,386,938 | 136,291 | (36,218) | (853,753) | 3,659,396 |
| Fidelity International Enhanced Index Fund | 5,228,217 | 211,766 | 1,330,946 | 79,554 | (12,332) | (663,758) | 3,432,947 |
| Fidelity International Small Cap Fund | 3,013,116 | 180,208 | 1,401,846 | 84,120 | 268,230 | (622,129) | 1,437,579 |
| Fidelity International Small Cap Opportunities Fund | 2,794,621 | 140,717 | 783,846 | 53,103 | 170,322 | (508,873) | 1,812,941 |
| Fidelity International Value Fund | 3,699,827 | 182,265 | 1,010,191 | 74,957 | (8,393) | (550,447) | 2,313,061 |
| Fidelity Investments Money Market Government Portfolio Institutional Class 2.29% | 77,831,034 | 42,062,347 | 36,514,248 | 1,286,961 | -- | -- | 83,379,133 |
| Fidelity Investments Money Market Prime Reserves Portfolio - Institutional Class 2.49% | 138,479,547 | 19,077,491 | 34,916,307 | 2,586,173 | 111 | 184 | 122,641,026 |
| Fidelity Japan Fund | -- | 6,251,912 | -- | 21,912 | -- | (485,573) | 5,766,339 |
| Fidelity Japan Smaller Companies Fund | 3,758,756 | 809,609 | 1,148,311 | 145,972 | 15,318 | (669,142) | 2,766,230 |
| Fidelity Leisure Portfolio | 399,725 | 28,793 | 404,940 | 21,369 | (3,840) | (19,738) | -- |
| Fidelity Long Term Treasury Bond Index Fund Institutional Premium | -- | 246,337 | 452,120 | 96,795 | (9,301) | (284,677) | 20,962,126 |
| Fidelity Long-Term Treasury Bond Index Fund Institutional Class | 14,139,803 | 9,101,256 | 1,577,808 | 432,172 | (26,315) | (175,049) | -- |
| Fidelity Low-Priced Stock Fund | 5,084,008 | 1,564,351 | 1,426,416 | 537,041 | (32,610) | (1,033,008) | 4,156,325 |
| Fidelity Materials Portfolio | 1,864,826 | 648,623 | 2,316,677 | 111,831 | (173,136) | (23,636) | -- |
| Fidelity Medical Equipment and Systems Portfolio | 617,066 | 39,579 | 673,391 | 26,860 | 133,334 | (116,588) | -- |
| Fidelity Mega Cap Stock Fund | 7,599,940 | 2,807,049 | 2,572,510 | 1,263,968 | (91,911) | (1,638,214) | 6,104,354 |
| Fidelity Natural Gas Portfolio | 3,887 | 19 | 4,097 | 19 | (561) | 752 | -- |
| Fidelity New Markets Income Fund | 3,984,659 | 366,644 | 424,251 | 174,444 | (13,284) | (466,115) | 3,447,653 |
| Fidelity Overseas Fund | 17,819,753 | 1,999,516 | 13,560,761 | 283,972 | 2,510,764 | (3,731,736) | 5,037,536 |
| Fidelity Pacific Basin Fund | 1,385,939 | 128,109 | 391,951 | 84,274 | 63,154 | (335,351) | 849,900 |
| Fidelity Real Estate Investment Portfolio | 2,065,589 | 897,170 | 2,060,711 | 38,022 | (61,340) | (96,342) | 744,366 |
| Fidelity Stock Selector All Cap Fund | -- | 105,912,506 | 10,877,605 | 3,489,438 | (97,768) | (13,341,560) | 81,595,573 |
| Fidelity Technology Portfolio | 15,749,249 | 5,889,137 | 20,947,968 | 1,964,669 | 3,880,826 | (4,571,244) | -- |
| Fidelity Telecommunications Portfolio | 973,395 | 439,981 | 1,340,290 | 19,404 | (65,973) | (7,113) | -- |
| Fidelity Transportation Portfolio | 402,893 | 26,023 | 391,490 | 18,598 | 44,804 | (82,230) | -- |
| Fidelity U.S. Bond Index Fund Institutional Premium Class | 341,502,115 | 57,342,235 | 72,019,614 | 9,170,028 | (2,100,370) | (7,459,751) | 317,264,615 |
| Fidelity Utilities Portfolio | 1,634,310 | 544,130 | 2,199,932 | 10,067 | 144,837 | (123,345) | -- |
| Fidelity Value Discovery Fund | 2,587,016 | 712,388 | 883,834 | 98,551 | (14,196) | (311,219) | 2,090,155 |
| | $772,964,415 | $283,802,325 | $290,322,879 | $26,436,247 | $16,984,816 | $(56,844,608) | $726,584,069 |
(a) Includes the value of shares purchased or redeemed through in-kind transactions, if applicable. See the Notes to Financial Statements for additional details.
Amounts in the income column in the above table include any capital gain distributions from underlying funds, which are presented in the corresponding line-item in the Statement of Operations if applicable.
Investment Valuation
The following is a summary of the inputs used, as of December 31, 2018, involving the Fund's assets and liabilities carried at fair value. The inputs or methodology used for valuing securities may not be an indication of the risk associated with investing in those securities. For more information on valuation inputs, and their aggregation into the levels used below, please refer to the Investment Valuation section in the accompanying Notes to Financial Statements.
| | Valuation Inputs at Reporting Date: |
| Description | Total | Level 1 | Level 2 | Level 3 |
| Investments in Securities: | | | | |
| Equity Funds | $140,776,910 | $140,776,910 | $-- | $-- |
| Fixed-Income Funds | 379,787,000 | 379,787,000 | -- | -- |
| Money Market Funds | 207,213,106 | 207,213,106 | -- | -- |
| Other Short-Term Investments | 507,715 | -- | 507,715 | -- |
| Total Investments in Securities: | $728,284,731 | $727,777,016 | $507,715 | $-- |
| Derivative Instruments: | | | | |
| Assets | | | | |
| Futures Contracts | $122,358 | $122,358 | $-- | $-- |
| Total Assets | $122,358 | $122,358 | $-- | $-- |
| Liabilities | | | | |
| Futures Contracts | $(43,203) | $(43,203) | $-- | $-- |
| Total Liabilities | $(43,203) | $(43,203) | $-- | $-- |
| Total Derivative Instruments: | $79,155 | $79,155 | $-- | $-- |
Value of Derivative Instruments
The following table is a summary of the Fund's value of derivative instruments by primary risk exposure as of December 31, 2018. For additional information on derivative instruments, please refer to the Derivative Instruments section in the accompanying Notes to Financial Statements.
| Primary Risk Exposure / Derivative Type | Value |
| | Asset | Liability |
| Equity Risk | | |
| Futures Contracts(a) | $122,358 | $(43,203) |
| Total Equity Risk | 122,358 | (43,203) |
| Total Value of Derivatives | $122,358 | $(43,203) |
(a) Reflects gross cumulative appreciation (depreciation) on futures contracts as presented in the Schedule of Investments. In the Statement of Assets and Liabilities, the period end daily variation margin is included in receivable or payable for daily variation margin on futures contracts, and the net cumulative appreciation (depreciation) is included in net unrealized appreciation (depreciation).
See accompanying notes which are an integral part of the financial statements.
VIP FundsManager® 20% Portfolio
Financial Statements
Statement of Assets and Liabilities
| | | December 31, 2018 |
| Assets | | |
Investment in securities, at value — See accompanying schedule:
Unaffiliated issuers (cost $507,732) | $507,715 | |
| Fidelity Central Funds (cost $1,192,858) | 1,192,947 | |
| Other affiliated issuers (cost $746,752,624) | 726,584,069 | |
| Total Investment in Securities (cost $748,453,214) | | $728,284,731 |
| Segregated cash with brokers for derivative instruments | | 316,989 |
| Cash | | 11,053 |
| Receivable for investments sold | | 344,841 |
| Receivable for fund shares sold | | 11,151 |
| Distributions receivable from Fidelity Central Funds | | 2,467 |
| Other receivables | | 97 |
| Total assets | | 728,971,329 |
| Liabilities | | |
| Payable for investments purchased | $328,061 | |
| Payable for fund shares redeemed | 352,361 | |
| Accrued management fee | 122,073 | |
| Distribution and service plan fees payable | 1,032 | |
| Payable for daily variation margin on futures contracts | 42,730 | |
| Total liabilities | | 846,257 |
| Net Assets | | $728,125,072 |
| Net Assets consist of: | | |
| Paid in capital | | $719,380,710 |
| Total distributable earnings (loss) | | 8,744,362 |
| Net Assets | | $728,125,072 |
| Net Asset Value and Maximum Offering Price | | |
| Service Class: | | |
| Net Asset Value, offering price and redemption price per share ($54,853 ÷ 5,104 shares) | | $10.75 |
| Service Class 2: | | |
| Net Asset Value, offering price and redemption price per share ($8,285,900 ÷ 772,920 shares) | | $10.72 |
| Investor Class: | | |
| Net Asset Value, offering price and redemption price per share ($719,784,319 ÷ 67,003,494 shares) | | $10.74 |
See accompanying notes which are an integral part of the financial statements.
Statement of Operations
| | | Year ended December 31, 2018 |
| Investment Income | | |
| Dividends: | | |
| Unaffiliated issuers | | $28,666 |
| Affiliated issuers | | 15,831,227 |
| Interest | | 5,926 |
| Income from Fidelity Central Funds | | 15,134 |
| Total income | | 15,880,953 |
| Expenses | | |
| Management fee | $1,914,634 | |
| Distribution and service plan fees | 21,129 | |
| Independent trustees' fees and expenses | 3,563 | |
| Total expenses before reductions | 1,939,326 | |
| Expense reductions | (393,219) | |
| Total expenses after reductions | | 1,546,107 |
| Net investment income (loss) | | 14,334,846 |
| Realized and Unrealized Gain (Loss) | | |
| Net realized gain (loss) on: | | |
| Investment securities: | | |
| Unaffiliated issuers | 536,327 | |
| Fidelity Central Funds | 493,969 | |
| Other affiliated issuers | 16,984,816 | |
| Futures contracts | 1,621,498 | |
| Capital gain distributions from underlying funds: | | |
| Affiliated issuers | 10,605,020 | |
| Total net realized gain (loss) | | 30,241,630 |
| Change in net unrealized appreciation (depreciation) on: | | |
| Investment securities: | | |
| Unaffiliated issuers | (367,005) | |
| Fidelity Central Funds | 89 | |
| Other affiliated issuers | (56,844,608) | |
| Futures contracts | 79,155 | |
| Total change in net unrealized appreciation (depreciation) | | (57,132,369) |
| Net gain (loss) | | (26,890,739) |
| Net increase (decrease) in net assets resulting from operations | | $(12,555,893) |
See accompanying notes which are an integral part of the financial statements.
Statement of Changes in Net Assets
| | Year ended December 31, 2018 | Year ended December 31, 2017 |
| Increase (Decrease) in Net Assets | | |
| Operations | | |
| Net investment income (loss) | $14,334,846 | $10,609,958 |
| Net realized gain (loss) | 30,241,630 | 32,992,467 |
| Change in net unrealized appreciation (depreciation) | (57,132,369) | 9,275,256 |
| Net increase (decrease) in net assets resulting from operations | (12,555,893) | 52,877,681 |
| Distributions to shareholders | (46,235,998) | – |
| Distributions to shareholders from net investment income | – | (10,031,370) |
| Distributions to shareholders from net realized gain | – | (4,376,254) |
| Total distributions | (46,235,998) | (14,407,624) |
| Share transactions - net increase (decrease) | 1,378,738 | 405,746 |
| Total increase (decrease) in net assets | (57,413,153) | 38,875,803 |
| Net Assets | | |
| Beginning of period | 785,538,225 | 746,662,422 |
| End of period | $728,125,072 | $785,538,225 |
| Other Information | | |
| Undistributed net investment income end of period | | $594,616 |
See accompanying notes which are an integral part of the financial statements.
Financial Highlights
VIP FundsManager 20% Portfolio Service Class
| Years ended December 31, | 2018 | 2017 | 2016 | 2015 | 2014 |
| Selected Per–Share Data | | | | | |
| Net asset value, beginning of period | $11.63 | $11.04 | $11.02 | $11.51 | $11.33 |
| Income from Investment Operations | | | | | |
| Net investment income (loss)A | .21 | .16 | .14 | .13 | .15 |
| Net realized and unrealized gain (loss) | (.40) | .65 | .17 | (.13) | .32 |
| Total from investment operations | (.19) | .81 | .31 | –B | .47 |
| Distributions from net investment income | (.21) | (.15) | (.14) | (.13) | (.15) |
| Distributions from net realized gain | (.48) | (.07) | (.15) | (.36) | (.15) |
| Total distributions | (.69) | (.22) | (.29) | (.49) | (.29)C |
| Net asset value, end of period | $10.75 | $11.63 | $11.04 | $11.02 | $11.51 |
| Total ReturnD,E | (1.67)% | 7.33% | 2.83% | (.03)% | 4.21% |
| Ratios to Average Net AssetsF,G,H | | | | | |
| Expenses before reductions | .35% | .35% | .35% | .35% | .35% |
| Expenses net of fee waivers, if any | .20% | .20% | .20% | .20% | .20% |
| Expenses net of all reductions | .20% | .20% | .20% | .20% | .20% |
| Net investment income (loss) | 1.87% | 1.41% | 1.25% | 1.16% | 1.31% |
| Supplemental Data | | | | | |
| Net assets, end of period (000 omitted) | $55 | $59 | $60 | $62 | $68 |
| Portfolio turnover rateF,I | 47% | 61% | 58% | 44% | 28% |
A Calculated based on average shares outstanding during the period.
B Amount represents less than $.005 per share.
C Total distributions of $.29 per share is comprised of distributions from net investment income of $.147 and distributions from net realized gain of $.147 per share.
D Total returns do not reflect charges attributable to your insurance company's separate account. Inclusion of these charges would reduce the total returns shown.
E Total returns would have been lower if certain expenses had not been reduced during the applicable periods shown.
F Amounts do not include the activity of the Underlying Funds.
G Fees and expenses of any underlying Fidelity Central Funds are not included in the Fund's expense ratio. The Fund indirectly bears its proportionate share of the expenses of any underlying Fidelity Central Funds.
H Expense ratios reflect operating expenses of the class. Expenses before reductions do not reflect amounts reimbursed by the investment adviser or reductions from brokerage service arrangements or reductions from other expense offset arrangements and do not represent the amount paid by the class during periods when reimbursements or reductions occur. Expenses net of fee waivers reflect expenses after reimbursement by the investment adviser but prior to reductions from brokerage service arrangements or other expense offset arrangements. Expenses net of all reductions represent the net expenses paid by the class but do not include expenses of the underlying funds in which the Fund invests.
I Amount does not include the portfolio activity of any underlying Fidelity Central Funds.
See accompanying notes which are an integral part of the financial statements.
VIP FundsManager 20% Portfolio Service Class 2
| Years ended December 31, | 2018 | 2017 | 2016 | 2015 | 2014 |
| Selected Per–Share Data | | | | | |
| Net asset value, beginning of period | $11.60 | $11.01 | $11.00 | $11.49 | $11.32 |
| Income from Investment Operations | | | | | |
| Net investment income (loss)A | .19 | .14 | .12 | .11 | .13 |
| Net realized and unrealized gain (loss) | (.40) | .65 | .17 | (.12) | .32 |
| Total from investment operations | (.21) | .79 | .29 | (.01) | .45 |
| Distributions from net investment income | (.19) | (.13) | (.13) | (.12) | (.13) |
| Distributions from net realized gain | (.48) | (.07) | (.15) | (.36) | (.15) |
| Total distributions | (.67) | (.20) | (.28) | (.48) | (.28) |
| Net asset value, end of period | $10.72 | $11.60 | $11.01 | $11.00 | $11.49 |
| Total ReturnB,C | (1.82)% | 7.19% | 2.66% | (.17)% | 3.98% |
| Ratios to Average Net AssetsD,E,F | | | | | |
| Expenses before reductions | .50% | .50% | .50% | .50% | .50% |
| Expenses net of fee waivers, if any | .35% | .35% | .35% | .35% | .35% |
| Expenses net of all reductions | .35% | .35% | .35% | .35% | .35% |
| Net investment income (loss) | 1.72% | 1.26% | 1.10% | 1.01% | 1.16% |
| Supplemental Data | | | | | |
| Net assets, end of period (000 omitted) | $8,286 | $8,188 | $7,529 | $1,454 | $1,426 |
| Portfolio turnover rateD,G | 47% | 61% | 58% | 44% | 28% |
A Calculated based on average shares outstanding during the period.
B Total returns do not reflect charges attributable to your insurance company's separate account. Inclusion of these charges would reduce the total returns shown.
C Total returns would have been lower if certain expenses had not been reduced during the applicable periods shown.
D Amounts do not include the activity of the Underlying Funds.
E Fees and expenses of any underlying Fidelity Central Funds are not included in the Fund's expense ratio. The Fund indirectly bears its proportionate share of the expenses of any underlying Fidelity Central Funds.
F Expense ratios reflect operating expenses of the class. Expenses before reductions do not reflect amounts reimbursed by the investment adviser or reductions from brokerage service arrangements or reductions from other expense offset arrangements and do not represent the amount paid by the class during periods when reimbursements or reductions occur. Expenses net of fee waivers reflect expenses after reimbursement by the investment adviser but prior to reductions from brokerage service arrangements or other expense offset arrangements. Expenses net of all reductions represent the net expenses paid by the class but do not include expenses of the underlying funds in which the Fund invests.
G Amount does not include the portfolio activity of any underlying Fidelity Central Funds.
See accompanying notes which are an integral part of the financial statements.
VIP FundsManager 20% Portfolio Investor Class
| Years ended December 31, | 2018 | 2017 | 2016 | 2015 | 2014 |
| Selected Per–Share Data | | | | | |
| Net asset value, beginning of period | $11.62 | $11.04 | $11.01 | $11.50 | $11.33 |
| Income from Investment Operations | | | | | |
| Net investment income (loss)A | .21 | .16 | .14 | .13 | .15 |
| Net realized and unrealized gain (loss) | (.40) | .64 | .18 | (.13) | .31 |
| Total from investment operations | (.19) | .80 | .32 | –B | .46 |
| Distributions from net investment income | (.21) | (.15) | (.14) | (.13) | (.15) |
| Distributions from net realized gain | (.48) | (.07) | (.15) | (.36) | (.15) |
| Total distributions | (.69) | (.22) | (.29) | (.49) | (.29)C |
| Net asset value, end of period | $10.74 | $11.62 | $11.04 | $11.01 | $11.50 |
| Total ReturnD,E | (1.67)% | 7.24% | 2.93% | (.03)% | 4.12% |
| Ratios to Average Net AssetsF,G,H | | | | | |
| Expenses before reductions | .25% | .25% | .25% | .25% | .25% |
| Expenses net of fee waivers, if any | .20% | .20% | .20% | .20% | .20% |
| Expenses net of all reductions | .20% | .20% | .20% | .20% | .20% |
| Net investment income (loss) | 1.87% | 1.41% | 1.25% | 1.16% | 1.31% |
| Supplemental Data | | | | | |
| Net assets, end of period (000 omitted) | $719,784 | $777,291 | $739,074 | $732,911 | $760,583 |
| Portfolio turnover rateF,I | 47% | 61% | 58% | 44% | 28% |
A Calculated based on average shares outstanding during the period.
B Amount represents less than $.005 per share.
C Total distributions of $.29 per share is comprised of distributions from net investment income of $.147 and distributions from net realized gain of $.147 per share.
D Total returns do not reflect charges attributable to your insurance company's separate account. Inclusion of these charges would reduce the total returns shown.
E Total returns would have been lower if certain expenses had not been reduced during the applicable periods shown.
F Amounts do not include the activity of the Underlying Funds.
G Fees and expenses of any underlying Fidelity Central Funds are not included in the Fund's expense ratio. The Fund indirectly bears its proportionate share of the expenses of any underlying Fidelity Central Funds.
H Expense ratios reflect operating expenses of the class. Expenses before reductions do not reflect amounts reimbursed by the investment adviser or reductions from brokerage service arrangements or reductions from other expense offset arrangements and do not represent the amount paid by the class during periods when reimbursements or reductions occur. Expenses net of fee waivers reflect expenses after reimbursement by the investment adviser but prior to reductions from brokerage service arrangements or other expense offset arrangements. Expenses net of all reductions represent the net expenses paid by the class but do not include expenses of the underlying funds in which the Fund invests.
I Amount does not include the portfolio activity of any underlying Fidelity Central Funds.
See accompanying notes which are an integral part of the financial statements.
VIP FundsManager® 50% Portfolio
Investment Summary (Unaudited)
The information in the following tables is based on the direct investments of the Fund.
Top Holdings as of December 31, 2018
| | % of fund's net assets |
| Fidelity U.S. Bond Index Fund Institutional Premium Class | 32.9 |
| Fidelity Stock Selector All Cap Fund | 26.7 |
| Fidelity Investments Money Market Government Portfolio Institutional Class 2.29% | 4.9 |
| Fidelity Inflation-Protected Bond Index Fund Institutional Premium Class | 4.1 |
| Fidelity Overseas Fund | 4.1 |
| Fidelity Investments Money Market Prime Reserves Portfolio - Institutional Class 2.49% | 3.4 |
| Fidelity Long Term Treasury Bond Index Fund Institutional Premium | 2.6 |
| Fidelity Mega Cap Stock Fund | 2.2 |
| Fidelity Japan Fund | 1.9 |
| Fidelity Equity-Income Fund | 1.5 |
| | 84.3 |
Asset Allocation (% of fund's net assets)
| Period end* |
| | Domestic Equity Funds | 35.4% |
| | International Equity Funds | 14.7% |
| | Bond Funds | 41.2% |
| | Short-Term Funds | 8.7% |

* Futures - (0.4)%
VIP FundsManager® 50% Portfolio
Schedule of Investments December 31, 2018
Showing Percentage of Net Assets
| Equity Funds - 50.1% | | | |
| | | Shares | Value |
| Fidelity Contrafund (a) | | 7,395,497 | $81,424,422 |
| Fidelity Diversified International Fund (a) | | 2,660,843 | 84,215,670 |
| Fidelity Emerging Asia Fund (a) | | 131,169 | 4,851,952 |
| Fidelity Emerging Markets Discovery Fund (a) | | 698,627 | 8,544,213 |
| Fidelity Emerging Markets Fund (a) | | 463,733 | 12,349,217 |
| Fidelity Equity-Income Fund (a) | | 1,657,232 | 84,419,412 |
| Fidelity Europe Fund (a) | | 1,002,100 | 31,465,933 |
| Fidelity Global Commodity Stock Fund (a) | | 4,830,064 | 54,096,716 |
| Fidelity International Capital Appreciation Fund (a) | | 1,127,876 | 20,110,027 |
| Fidelity International Discovery Fund (a) | | 1,880,156 | 68,569,273 |
| Fidelity International Enhanced Index Fund (a) | | 7,706,527 | 65,120,150 |
| Fidelity International Small Cap Fund (a) | | 1,270,711 | 30,103,155 |
| Fidelity International Small Cap Opportunities Fund (a) | | 2,030,229 | 32,767,889 |
| Fidelity International Value Fund (a) | | 6,135,394 | 44,604,317 |
| Fidelity Japan Fund (a) | | 8,093,963 | 106,111,858 |
| Fidelity Japan Smaller Companies Fund (a) | | 4,421,975 | 66,948,708 |
| Fidelity Large Cap Value Enhanced Index Fund (a) | | 1,436,088 | 16,385,760 |
| Fidelity Low-Priced Stock Fund (a) | | 1,818,437 | 78,901,999 |
| Fidelity Mega Cap Stock Fund (a) | | 9,138,351 | 123,459,126 |
| Fidelity Overseas Fund (a) | | 5,646,611 | 230,833,465 |
| Fidelity Pacific Basin Fund (a) | | 632,131 | 16,637,686 |
| Fidelity Real Estate Investment Portfolio (a) | | 358,620 | 13,774,581 |
| Fidelity Stock Selector All Cap Fund (a) | | 39,081,516 | 1,501,902,653 |
| Fidelity Value Discovery Fund (a) | | 1,640,146 | 41,266,067 |
| TOTAL EQUITY FUNDS | | | |
| (Cost $3,159,379,718) | | | 2,818,864,249 |
|
| Fixed-Income Funds - 41.2% | | | |
| Fidelity Floating Rate High Income Fund (a) | | 6,383,460 | 58,727,834 |
| Fidelity Inflation-Protected Bond Index Fund Institutional Premium Class (a) | | 24,329,795 | 230,889,750 |
| Fidelity Long Term Treasury Bond Index Fund Institutional Premium (a) | | 11,586,362 | 146,915,068 |
| Fidelity New Markets Income Fund (a) | | 1,901,672 | 27,136,859 |
| Fidelity U.S. Bond Index Fund Institutional Premium Class (a) | | 164,252,949 | 1,852,773,265 |
| TOTAL FIXED-INCOME FUNDS | | | |
| (Cost $2,355,901,284) | | | 2,316,442,776 |
|
| Money Market Funds - 8.7% | | | |
| Fidelity Cash Central Fund, 2.42% (b) | | 24,683,261 | 24,688,197 |
| Fidelity Investments Money Market Government Portfolio Institutional Class 2.29% (a)(c) | | 272,552,553 | 272,552,553 |
| Fidelity Investments Money Market Prime Reserves Portfolio - Institutional Class 2.49% (a)(c) | | 190,645,786 | 190,683,915 |
| TOTAL MONEY MARKET FUNDS | | | |
| (Cost $487,923,784) | | | 487,924,665 |
| | | Principal Amount | Value |
|
| U.S. Treasury Obligations - 0.0% | | | |
| U.S. Treasury Bills, yield at date of purchase 2.34% to 2.36% 2/14/19 to 3/21/19 (d) | | | |
| (Cost $4,074,970) | | 4,090,000 | 4,074,757 |
| TOTAL INVESTMENT IN SECURITIES - 100.0% | | | |
| (Cost $6,007,279,756) | | | 5,627,306,447 |
| NET OTHER ASSETS (LIABILITIES) - 0.0% | | | (1,369,214) |
| NET ASSETS - 100% | | | $5,625,937,233 |
| Futures Contracts | | | | | |
| | Number of contracts | Expiration Date | Notional Amount | Value | Unrealized Appreciation/(Depreciation) |
| Purchased | | | | | |
| Equity Index Contracts | | | | | |
| ICE E-mini MSCI Emerging Markets Index Contracts (United States) | 640 | March 2019 | $30,937,600 | $(183,046) | $(183,046) |
| Sold | | | | | |
| Equity Index Contracts | | | | | |
| CME E-mini S&P 500 Index Contracts (United States) | 391 | March 2019 | 48,976,660 | 2,814,231 | 2,814,231 |
| TOTAL FUTURES CONTRACTS | | | | | $2,631,185 |
The notional amount of futures purchased as a percentage of Net Assets is 0.5%
The notional amount of futures sold as a percentage of Net Assets is 0.9%
For the period, the average monthly underlying face amount at value for futures contracts in the aggregate was $88,295,898.
Legend
(a) Affiliated Fund
(b) Affiliated fund that is generally available only to investment companies and other accounts managed by Fidelity Investments. The rate quoted is the annualized seven-day yield of the fund at period end. A complete unaudited listing of the fund's holdings as of its most recent quarter end is available upon request. In addition, each Fidelity Central Fund's financial statements, which are not covered by the Fund's Report of Independent Registered Public Accounting Firm, are available on the SEC's website or upon request.
(c) The rate quoted is the annualized seven-day yield of the fund at period end.
(d) Security or a portion of the security was pledged to cover margin requirements for futures contracts. At period end, the value of securities pledged amounted to $2,602,408.
Affiliated Central Funds
Information regarding fiscal year to date income earned by the Fund from investments in Fidelity Central Funds is as follows:
| Fund | Income earned |
| Fidelity Cash Central Fund | $178,982 |
| Total | $178,982 |
Amounts in the income column in the above table include any capital gain distributions from underlying funds, which are presented in the corresponding line-item in the Statement of Operations if applicable.
Fiscal year to date information regarding the Fund’s investments in non-Money Market Central Funds, including the ownership percentage, is presented below.
| Affiliate | Value, beginning of period | Purchases(a) | Sales Proceeds(a) | Realized Gain (loss) | Change in Unrealized appreciation (depreciation) | Value, end of period | % ownership, end of period |
| Fidelity Consumer Discretionary Central Fund | $-- | $189,203,265 | $190,770,242 | $1,566,977 | $-- | $-- | 0.0% |
| Fidelity Consumer Staples Central Fund | -- | 104,325,190 | 105,207,984 | 882,794 | -- | -- | 0.0% |
| Fidelity Energy Central Fund | -- | 89,827,001 | 90,756,150 | 929,149 | -- | -- | 0.0% |
| Fidelity Financials Central Fund | -- | 274,408,628 | 275,799,301 | 1,390,673 | -- | -- | 0.0% |
| Fidelity Health Care Central Fund | -- | 239,542,218 | 240,333,599 | 791,381 | -- | -- | 0.0% |
| Fidelity Industrials Central Fund | -- | 181,252,381 | 183,072,913 | 1,820,532 | -- | -- | 0.0% |
| Fidelity Information Technology Central Fund | -- | 444,657,410 | 446,274,025 | 1,616,615 | -- | -- | 0.0% |
| Fidelity Materials Central Fund | -- | 54,198,352 | 54,755,890 | 557,538 | -- | -- | 0.0% |
| Fidelity Telecom Services Central Fund | -- | 25,256,683 | 25,625,022 | 368,339 | -- | -- | 0.0% |
| Fidelity Utilities Central Fund | -- | 43,898,700 | 44,453,359 | 554,659 | -- | -- | 0.0% |
| | $-- | $1,646,569,828 | $1,657,048,485 | $10,478,657 | $-- | $-- | |
(a) Includes the value of shares purchased or redeemed through in-kind transactions, if applicable. See the Notes to Financial Statements for additional details.
Amounts in the income column in the above table include any capital gain distributions from underlying funds, which are presented in the corresponding line-item in the Statement of Operations if applicable.
Affiliated Underlying Funds
Fiscal year to date information regarding the Fund's investments in affiliated Underlying Funds, excluding any Money Market Central Funds, is presented below. Exchanges between classes of the same affiliated Underlying Funds may occur.
| Affiliate | Value, beginning of period | Purchases(a) | Sales Proceeds(a) | Dividend Income | Realized Gain (loss) | Change in Unrealized appreciation (depreciation) | Value, end of period |
| Fidelity Air Transportation Portfolio | $14,747,470 | $751,251 | $13,969,681 | $750,313 | $55,704 | $(1,584,744) | $-- |
| Fidelity Banking Portfolio | 34,638,556 | 2,514,773 | 34,599,047 | 2,512,353 | 15,286,931 | (17,841,213) | -- |
| Fidelity Biotechnology Portfolio | 19,549,696 | 764,331 | 20,219,680 | 762,909 | 3,525,188 | (3,619,535) | -- |
| Fidelity Brokerage and Investment Management Portfolio | 7,804,487 | 366,055 | 7,843,927 | 365,540 | 855,351 | (1,181,966) | -- |
| Fidelity Chemicals Portfolio | 7,337,432 | 414,799 | 6,959,082 | 414,329 | 3,131,282 | (3,924,431) | -- |
| Fidelity Commodity Strategy Fund | 66,593,972 | 7,540,626 | 73,164,179 | -- | 924,600 | (1,895,019) | -- |
| Fidelity Communication Services Portfolio | 12,580,033 | 670,194 | 12,017,202 | 669,392 | (646,345) | (586,680) | -- |
| Fidelity Construction and Housing Portfolio | 11,092,599 | 492,810 | 10,251,085 | 492,129 | 3,790,902 | (5,125,226) | -- |
| Fidelity Consumer Discretionary Portfolio | 153,712,647 | 6,143,735 | 161,668,800 | 2,533,150 | 44,083,902 | (42,271,484) | -- |
| Fidelity Consumer Staples Portfolio | 112,465,179 | 7,651,857 | 107,231,720 | 6,444,629 | 4,271,866 | (17,157,182) | -- |
| Fidelity Contrafund | 81,685,393 | 22,611,268 | 14,376,537 | 7,108,787 | 216,290 | (8,711,992) | 81,424,422 |
| Fidelity Defense and Aerospace Portfolio | 50,734,762 | 1,525,354 | 54,572,294 | 1,521,965 | 16,156,114 | (13,843,936) | -- |
| Fidelity Diversified International Fund | 119,653,990 | 8,625,679 | 23,015,437 | 5,815,544 | 1,768,156 | (22,816,718) | 84,215,670 |
| Fidelity Emerging Asia Fund | 10,085,110 | 162,844 | 4,437,124 | 161,175 | 1,492,763 | (2,451,641) | 4,851,952 |
| Fidelity Emerging Markets Discovery Fund | 18,037,291 | 160,686 | 7,816,815 | 157,713 | 416,557 | (2,253,506) | 8,544,213 |
| Fidelity Emerging Markets Fund | 74,534,500 | 712,909 | 61,116,976 | 101,193 | 4,552,192 | (6,333,408) | 12,349,217 |
| Fidelity Energy Portfolio | 90,149,858 | 1,605,856 | 92,162,070 | -- | 8,103,954 | (7,697,598) | -- |
| Fidelity Equity-Income Fund | 94,272,283 | 17,971,883 | 12,172,395 | 7,973,545 | (283,557) | (15,368,802) | 84,419,412 |
| Fidelity Europe Fund | 45,709,460 | 4,460,810 | 8,771,480 | 3,381,282 | 970,065 | (10,902,922) | 31,465,933 |
| Fidelity Financial Services Portfolio | 179,831,845 | 8,169,736 | 181,813,452 | 4,257,473 | 52,131,482 | (58,319,611) | -- |
| Fidelity Floating Rate High Income Fund | 66,515,556 | 3,139,509 | 8,240,212 | 2,885,177 | 60,243 | (2,747,262) | 58,727,834 |
| Fidelity Global Commodity Stock Fund | 68,904,073 | 8,213,876 | 14,049,183 | 1,190,788 | 556,997 | (9,529,047) | 54,096,716 |
| Fidelity Health Care Portfolio | 190,274,554 | 11,183,736 | 208,074,825 | 6,970,311 | 44,110,297 | (37,493,762) | -- |
| Fidelity Industrial Equipment Portfolio | 36,202,251 | 4,548,434 | 213,665 | 4,546,758 | 7,106 | (7,917,047) | -- |
| Fidelity Industrials Portfolio | 69,739,946 | 7,135,281 | 106,836,133 | 4,328,229 | 19,789,434 | (22,455,607) | -- |
| Fidelity Inflation-Protected Bond Index Fund Institutional Premium Class | 230,269,258 | 50,088,283 | 41,252,765 | 5,173,296 | (876,748) | (7,338,278) | 230,889,750 |
| Fidelity Insurance Portfolio | 18,878,213 | 2,163,836 | 18,318,298 | 2,162,550 | 6,184,139 | (8,907,890) | -- |
| Fidelity International Capital Appreciation Fund | 27,646,304 | 1,231,801 | 5,243,719 | 593,248 | 845,971 | (4,370,330) | 20,110,027 |
| Fidelity International Discovery Fund | 99,518,789 | 4,894,570 | 19,032,148 | 2,571,385 | (26,600) | (16,785,338) | 68,569,273 |
| Fidelity International Enhanced Index Fund | 92,140,913 | 3,687,337 | 17,837,186 | 1,522,018 | (302,107) | (12,568,807) | 65,120,150 |
| Fidelity International Small Cap Fund | 53,335,370 | 2,991,389 | 18,774,721 | 1,765,694 | 3,465,195 | (10,914,078) | 30,103,155 |
| Fidelity International Small Cap Opportunities Fund | 49,520,645 | 2,082,305 | 12,749,099 | 962,974 | 2,966,612 | (9,052,574) | 32,767,889 |
| Fidelity International Value Fund | 65,028,668 | 2,981,220 | 12,594,477 | 1,453,443 | (240,560) | (10,570,534) | 44,604,317 |
| Fidelity Investments Money Market Government Portfolio - Institutional Class 2.29% | 153,462,044 | 413,774,646 | 294,684,137 | 2,746,881 | -- | -- | 272,552,553 |
| Fidelity Investments Money Market Prime Reserves Portfolio - Institutional Class 2.49% | 273,777,011 | 87,979,786 | 171,073,808 | 4,647,248 | 872 | 54 | 190,683,915 |
| Fidelity Japan Fund | -- | 115,073,223 | -- | 403,223 | -- | (8,961,365) | 106,111,858 |
| Fidelity Japan Smaller Companies Fund | 61,436,651 | 22,981,176 | 1,021,899 | 3,532,838 | 23,083 | (16,470,303) | 66,948,708 |
| Fidelity Large Cap Value Enhanced Index Fund | -- | 19,240,234 | -- | 1,130,235 | -- | (2,854,474) | 16,385,760 |
| Fidelity Leisure Portfolio | 10,502,583 | 550,622 | 10,450,420 | 549,958 | (174,800) | (427,985) | -- |
| Fidelity Long Term Treasury Bond Index Fund Institutional Premium | -- | 754,506 | 3,636,710 | 680,576 | (128,166) | (1,772,817) | 146,915,068 |
| Fidelity Long-Term Treasury Bond Index Fund Institutional Class | 120,234,118 | 51,212,287 | 16,647,862 | 3,250,709 | (1,054,799) | (2,045,489) | -- |
| Fidelity Low-Priced Stock Fund | 95,296,782 | 16,250,919 | 12,973,010 | 10,051,965 | (250,540) | (19,422,152) | 78,901,999 |
| Fidelity Materials Portfolio | 50,059,868 | 3,238,276 | 48,786,422 | 2,334,900 | (4,621,715) | 109,993 | -- |
| Fidelity Medical Equipment and Systems Portfolio | 16,529,722 | 704,819 | 17,694,832 | 703,670 | 4,075,657 | (3,615,366) | -- |
| Fidelity Mega Cap Stock Fund | 141,648,822 | 34,358,046 | 18,997,665 | 24,249,690 | (352,146) | (33,197,931) | 123,459,126 |
| Fidelity New Markets Income Fund | 33,617,791 | 1,544,576 | 4,120,111 | 1,417,366 | (349,753) | (3,555,644) | 27,136,859 |
| Fidelity Overseas Fund | 414,602,655 | 23,644,541 | 154,627,410 | 13,007,232 | 14,024,600 | (66,810,921) | 230,833,465 |
| Fidelity Pacific Basin Fund | 24,346,923 | 2,213,604 | 4,611,690 | 1,647,667 | (157,770) | (5,153,381) | 16,637,686 |
| Fidelity Real Estate Investment Portfolio | 55,213,638 | 4,272,245 | 41,346,462 | 715,588 | (4,379,532) | 14,692 | 13,774,581 |
| Fidelity Stock Selector All Cap Fund | -- | 1,946,280,564 | 198,051,937 | 64,184,505 | (616,691) | (245,709,283) | 1,501,902,653 |
| Fidelity Technology Portfolio | 421,603,033 | 48,039,443 | 456,610,906 | 42,509,726 | 115,669,419 | (128,700,989) | -- |
| Fidelity Telecommunications Portfolio | 26,241,468 | 1,374,406 | 25,991,496 | 372,619 | (1,854,857) | 230,479 | -- |
| Fidelity Transportation Portfolio | 11,140,085 | 504,449 | 10,629,017 | 503,768 | 762,213 | (1,777,730) | -- |
| Fidelity U.S. Bond Index Fund Institutional Premium Class | 2,245,883,377 | 408,325,373 | 734,951,489 | 58,410,296 | (31,903,481) | (34,580,515) | 1,852,773,265 |
| Fidelity Utilities Portfolio | 43,697,149 | 1,407,877 | 45,155,455 | 204,758 | 1,814,139 | (1,763,710) | -- |
| Fidelity Value Discovery Fund | 47,348,530 | 6,189,756 | 6,121,642 | 1,891,494 | (46,500) | (6,104,077) | 41,266,067 |
| | $6,519,833,353 | $3,407,574,407 | $3,669,579,794 | $320,696,204 | $327,822,609 | $(987,107,082) | $5,598,543,493 |
(a) Includes the value of shares purchased or redeemed through in-kind transactions, if applicable. See the Notes to Financial Statements for additional details.
Amounts in the income column in the above table include any capital gain distributions from underlying funds, which are presented in the corresponding line-item in the Statement of Operations if applicable.
Investment Valuation
The following is a summary of the inputs used, as of December 31, 2018, involving the Fund's assets and liabilities carried at fair value. The inputs or methodology used for valuing securities may not be an indication of the risk associated with investing in those securities. For more information on valuation inputs, and their aggregation into the levels used below, please refer to the Investment Valuation section in the accompanying Notes to Financial Statements.
| | Valuation Inputs at Reporting Date: |
| Description | Total | Level 1 | Level 2 | Level 3 |
| Investments in Securities: | | | | |
| Equity Funds | $2,818,864,249 | $2,818,864,249 | $-- | $-- |
| Fixed-Income Funds | 2,316,442,776 | 2,316,442,776 | -- | -- |
| Money Market Funds | 487,924,665 | 487,924,665 | -- | -- |
| Other Short-Term Investments | 4,074,757 | -- | 4,074,757 | -- |
| Total Investments in Securities: | $5,627,306,447 | $5,623,231,690 | $4,074,757 | $-- |
| Derivative Instruments: | | | | |
| Assets | | | | |
| Futures Contracts | $2,814,231 | $2,814,231 | $-- | $-- |
| Total Assets | $2,814,231 | $2,814,231 | $-- | $-- |
| Liabilities | | | | |
| Futures Contracts | $(183,046) | $(183,046) | $-- | $-- |
| Total Liabilities | $(183,046) | $(183,046) | $-- | $-- |
| Total Derivative Instruments: | $2,631,185 | $2,631,185 | $-- | $-- |
Value of Derivative Instruments
The following table is a summary of the Fund's value of derivative instruments by primary risk exposure as of December 31, 2018. For additional information on derivative instruments, please refer to the Derivative Instruments section in the accompanying Notes to Financial Statements.
| Primary Risk Exposure / Derivative Type | Value |
| | Asset | Liability |
| Equity Risk | | |
| Futures Contracts(a) | $2,814,231 | $(183,046) |
| Total Equity Risk | 2,814,231 | (183,046) |
| Total Value of Derivatives | $2,814,231 | $(183,046) |
(a) Reflects gross cumulative appreciation (depreciation) on futures contracts as presented in the Schedule of Investments. In the Statement of Assets and Liabilities, the period end daily variation margin is included in receivable or payable for daily variation margin on futures contracts, and the net cumulative appreciation (depreciation) is included in net unrealized appreciation (depreciation).
See accompanying notes which are an integral part of the financial statements.
VIP FundsManager® 50% Portfolio
Financial Statements
Statement of Assets and Liabilities
| | | December 31, 2018 |
| Assets | | |
Investment in securities, at value — See accompanying schedule:
Unaffiliated issuers (cost $4,074,970) | $4,074,757 | |
| Fidelity Central Funds (cost $24,687,370) | 24,688,197 | |
| Other affiliated issuers (cost $5,978,517,416) | 5,598,543,493 | |
| Total Investment in Securities (cost $6,007,279,756) | | $5,627,306,447 |
| Segregated cash with brokers for derivative instruments | | 1,433,852 |
| Cash | | 1,754,070 |
| Receivable for investments sold | | 1,632,844 |
| Receivable for fund shares sold | | 498,603 |
| Distributions receivable from Fidelity Central Funds | | 43,950 |
| Total assets | | 5,632,669,766 |
| Liabilities | | |
| Payable for investments purchased | $1,471,298 | |
| Payable for fund shares redeemed | 4,258,226 | |
| Accrued management fee | 950,254 | |
| Distribution and service plan fees payable | 11,390 | |
| Payable for daily variation margin on futures contracts | 41,365 | |
| Total liabilities | | 6,732,533 |
| Net Assets | | $5,625,937,233 |
| Net Assets consist of: | | |
| Paid in capital | | $5,454,195,647 |
| Total distributable earnings (loss) | | 171,741,586 |
| Net Assets | | $5,625,937,233 |
| Net Asset Value and Maximum Offering Price | | |
| Service Class: | | |
| Net Asset Value, offering price and redemption price per share ($55,232 ÷ 4,728 shares) | | $11.68 |
| Service Class 2: | | |
| Net Asset Value, offering price and redemption price per share ($90,233,741 ÷ 7,752,930 shares) | | $11.64 |
| Investor Class: | | |
| Net Asset Value, offering price and redemption price per share ($5,535,648,260 ÷ 474,114,493 shares) | | $11.68 |
See accompanying notes which are an integral part of the financial statements.
Statement of Operations
| | | Year ended December 31, 2018 |
| Investment Income | | |
| Dividends: | | |
| Unaffiliated issuers | | $959,833 |
| Affiliated issuers | | 108,582,443 |
| Interest | | 85,253 |
| Income from Fidelity Central Funds | | 178,982 |
| Total income | | 109,806,511 |
| Expenses | | |
| Management fee | $15,893,740 | |
| Distribution and service plan fees | 246,306 | |
| Independent trustees' fees and expenses | 29,812 | |
| Total expenses before reductions | 16,169,858 | |
| Expense reductions | (3,295,017) | |
| Total expenses after reductions | | 12,874,841 |
| Net investment income (loss) | | 96,931,670 |
| Realized and Unrealized Gain (Loss) | | |
| Net realized gain (loss) on: | | |
| Investment securities: | | |
| Unaffiliated issuers | 8,639,890 | |
| Fidelity Central Funds | 10,477,729 | |
| Other affiliated issuers | 327,822,609 | |
| Futures contracts | 22,075,137 | |
| Capital gain distributions from underlying funds: | | |
| Affiliated issuers | 212,113,761 | |
| Total net realized gain (loss) | | 581,129,126 |
| Change in net unrealized appreciation (depreciation) on: | | |
| Investment securities: | | |
| Unaffiliated issuers | (6,157,385) | |
| Fidelity Central Funds | 827 | |
| Other affiliated issuers | (987,107,082) | |
| Futures contracts | 2,631,185 | |
| Total change in net unrealized appreciation (depreciation) | | (990,632,455) |
| Net gain (loss) | | (409,503,329) |
| Net increase (decrease) in net assets resulting from operations | | $(312,571,659) |
See accompanying notes which are an integral part of the financial statements.
Statement of Changes in Net Assets
| | Year ended December 31, 2018 | Year ended December 31, 2017 |
| Increase (Decrease) in Net Assets | | |
| Operations | | |
| Net investment income (loss) | $96,931,670 | $79,301,919 |
| Net realized gain (loss) | 581,129,126 | 495,314,605 |
| Change in net unrealized appreciation (depreciation) | (990,632,455) | 304,741,713 |
| Net increase (decrease) in net assets resulting from operations | (312,571,659) | 879,358,237 |
| Distributions to shareholders | (574,970,718) | – |
| Distributions to shareholders from net investment income | – | (75,263,279) |
| Distributions to shareholders from net realized gain | – | (40,613,695) |
| Total distributions | (574,970,718) | (115,876,974) |
| Share transactions - net increase (decrease) | (210,578,783) | (310,047,364) |
| Total increase (decrease) in net assets | (1,098,121,160) | 453,433,899 |
| Net Assets | | |
| Beginning of period | 6,724,058,393 | 6,270,624,494 |
| End of period | $5,625,937,233 | $6,724,058,393 |
| Other Information | | |
| Undistributed net investment income end of period | | $4,157,131 |
See accompanying notes which are an integral part of the financial statements.
Financial Highlights
VIP FundsManager 50% Portfolio Service Class
| Years ended December 31, | 2018 | 2017 | 2016 | 2015 | 2014 |
| Selected Per–Share Data | | | | | |
| Net asset value, beginning of period | $13.53 | $12.03 | $11.85 | $12.39 | $12.01 |
| Income from Investment Operations | | | | | |
| Net investment income (loss)A | .19 | .16 | .15 | .15 | .17 |
| Net realized and unrealized gain (loss) | (.86) | 1.58 | .35 | (.13) | .45 |
| Total from investment operations | (.67) | 1.74 | .50 | .02 | .62 |
| Distributions from net investment income | (.18) | (.15) | (.15) | (.14) | (.14) |
| Distributions from net realized gain | (1.00) | (.08) | (.16) | (.42) | (.10) |
| Total distributions | (1.18) | (.24)B | (.32)C | (.56) | (.24) |
| Net asset value, end of period | $11.68 | $13.53 | $12.03 | $11.85 | $12.39 |
| Total ReturnD,E | (5.28)% | 14.45% | 4.31% | .06% | 5.18% |
| Ratios to Average Net AssetsF,G,H | | | | | |
| Expenses before reductions | .35% | .35% | .35% | .35% | .35% |
| Expenses net of fee waivers, if any | .20% | .20% | .20% | .20% | .20% |
| Expenses net of all reductions | .20% | .20% | .20% | .20% | .20% |
| Net investment income (loss) | 1.52% | 1.21% | 1.26% | 1.19% | 1.38% |
| Supplemental Data | | | | | |
| Net assets, end of period (000 omitted) | $55 | $64 | $62 | $64 | $73 |
| Portfolio turnover rateF,I | 80% | 47% | 40% | 24% | 25% |
A Calculated based on average shares outstanding during the period.
B Total distributions of $.24 per share is comprised of distributions from net investment income of $.154 and distributions from net realized gain of $.083 per share.
C Total distributions of $.32 per share is comprised of distributions from net investment income of $.152 and distributions from net realized gain of $.164 per share.
D Total returns do not reflect charges attributable to your insurance company's separate account. Inclusion of these charges would reduce the total returns shown.
E Total returns would have been lower if certain expenses had not been reduced during the applicable periods shown.
F Amounts do not include the activity of the Underlying Funds.
G Fees and expenses of any underlying Fidelity Central Funds are not included in the Fund's expense ratio. The Fund indirectly bears its proportionate share of the expenses of any underlying Fidelity Central Funds.
H Expense ratios reflect operating expenses of the class. Expenses before reductions do not reflect amounts reimbursed by the investment adviser or reductions from brokerage service arrangements or reductions from other expense offset arrangements and do not represent the amount paid by the class during periods when reimbursements or reductions occur. Expenses net of fee waivers reflect expenses after reimbursement by the investment adviser but prior to reductions from brokerage service arrangements or other expense offset arrangements. Expenses net of all reductions represent the net expenses paid by the class but do not include expenses of the underlying funds in which the Fund invests.
I Amount does not include the portfolio activity of any underlying Fidelity Central Funds.
See accompanying notes which are an integral part of the financial statements.
VIP FundsManager 50% Portfolio Service Class 2
| Years ended December 31, | 2018 | 2017 | 2016 | 2015 | 2014 |
| Selected Per–Share Data | | | | | |
| Net asset value, beginning of period | $13.48 | $11.99 | $11.82 | $12.35 | $11.98 |
| Income from Investment Operations | | | | | |
| Net investment income (loss)A | .17 | .14 | .13 | .13 | .15 |
| Net realized and unrealized gain (loss) | (.85) | 1.57 | .34 | (.12) | .44 |
| Total from investment operations | (.68) | 1.71 | .47 | .01 | .59 |
| Distributions from net investment income | (.16) | (.13) | (.13) | (.12) | (.12) |
| Distributions from net realized gain | (1.00) | (.08) | (.16) | (.42) | (.10) |
| Total distributions | (1.16) | (.22)B | (.30)C | (.54) | (.22) |
| Net asset value, end of period | $11.64 | $13.48 | $11.99 | $11.82 | $12.35 |
| Total ReturnD,E | (5.38)% | 14.24% | 4.08% | (.02)% | 4.95% |
| Ratios to Average Net AssetsF,G,H | | | | | |
| Expenses before reductions | .50% | .50% | .50% | .50% | .50% |
| Expenses net of fee waivers, if any | .35% | .35% | .35% | .35% | .35% |
| Expenses net of all reductions | .35% | .35% | .35% | .35% | .35% |
| Net investment income (loss) | 1.37% | 1.06% | 1.11% | 1.04% | 1.23% |
| Supplemental Data | | | | | |
| Net assets, end of period (000 omitted) | $90,234 | $100,867 | $90,983 | $83,447 | $88,771 |
| Portfolio turnover rateF,I | 80% | 47% | 40% | 24% | 25% |
A Calculated based on average shares outstanding during the period.
B Total distributions of $.22 per share is comprised of distributions from net investment income of $.134 and distributions from net realized gain of $.083 per share.
C Total distributions of $.30 per share is comprised of distributions from net investment income of $.134 and distributions from net realized gain of $.164 per share.
D Total returns do not reflect charges attributable to your insurance company's separate account. Inclusion of these charges would reduce the total returns shown.
E Total returns would have been lower if certain expenses had not been reduced during the applicable periods shown.
F Amounts do not include the activity of the Underlying Funds.
G Fees and expenses of any underlying Fidelity Central Funds are not included in the Fund's expense ratio. The Fund indirectly bears its proportionate share of the expenses of any underlying Fidelity Central Funds.
H Expense ratios reflect operating expenses of the class. Expenses before reductions do not reflect amounts reimbursed by the investment adviser or reductions from brokerage service arrangements or reductions from other expense offset arrangements and do not represent the amount paid by the class during periods when reimbursements or reductions occur. Expenses net of fee waivers reflect expenses after reimbursement by the investment adviser but prior to reductions from brokerage service arrangements or other expense offset arrangements. Expenses net of all reductions represent the net expenses paid by the class but do not include expenses of the underlying funds in which the Fund invests.
I Amount does not include the portfolio activity of any underlying Fidelity Central Funds.
See accompanying notes which are an integral part of the financial statements.
VIP FundsManager 50% Portfolio Investor Class
| Years ended December 31, | 2018 | 2017 | 2016 | 2015 | 2014 |
| Selected Per–Share Data | | | | | |
| Net asset value, beginning of period | $13.52 | $12.02 | $11.85 | $12.38 | $12.01 |
| Income from Investment Operations | | | | | |
| Net investment income (loss)A | .19 | .16 | .15 | .15 | .17 |
| Net realized and unrealized gain (loss) | (.85) | 1.58 | .34 | (.12) | .44 |
| Total from investment operations | (.66) | 1.74 | .49 | .03 | .61 |
| Distributions from net investment income | (.18) | (.15) | (.15) | (.14) | (.14) |
| Distributions from net realized gain | (1.00) | (.08) | (.16) | (.42) | (.10) |
| Total distributions | (1.18) | (.24)B | (.32)C | (.56) | (.24) |
| Net asset value, end of period | $11.68 | $13.52 | $12.02 | $11.85 | $12.38 |
| Total ReturnD,E | (5.20)% | 14.46% | 4.22% | .14% | 5.10% |
| Ratios to Average Net AssetsF,G,H | | | | | |
| Expenses before reductions | .25% | .25% | .25% | .25% | .25% |
| Expenses net of fee waivers, if any | .20% | .20% | .20% | .20% | .20% |
| Expenses net of all reductions | .20% | .20% | .20% | .20% | .20% |
| Net investment income (loss) | 1.52% | 1.21% | 1.26% | 1.19% | 1.38% |
| Supplemental Data | | | | | |
| Net assets, end of period (000 omitted) | $5,535,648 | $6,623,127 | $6,179,579 | $6,046,146 | $5,085,755 |
| Portfolio turnover rateF,I | 80% | 47% | 40% | 24% | 25% |
A Calculated based on average shares outstanding during the period.
B Total distributions of $.24 per share is comprised of distributions from net investment income of $.154 and distributions from net realized gain of $.083 per share.
C Total distributions of $.32 per share is comprised of distributions from net investment income of $.152 and distributions from net realized gain of $.164 per share.
D Total returns do not reflect charges attributable to your insurance company's separate account. Inclusion of these charges would reduce the total returns shown.
E Total returns would have been lower if certain expenses had not been reduced during the applicable periods shown.
F Amounts do not include the activity of the Underlying Funds.
G Fees and expenses of any underlying Fidelity Central Funds are not included in the Fund's expense ratio. The Fund indirectly bears its proportionate share of the expenses of any underlying Fidelity Central Funds.
H Expense ratios reflect operating expenses of the class. Expenses before reductions do not reflect amounts reimbursed by the investment adviser or reductions from brokerage service arrangements or reductions from other expense offset arrangements and do not represent the amount paid by the class during periods when reimbursements or reductions occur. Expenses net of fee waivers reflect expenses after reimbursement by the investment adviser but prior to reductions from brokerage service arrangements or other expense offset arrangements. Expenses net of all reductions represent the net expenses paid by the class but do not include expenses of the underlying funds in which the Fund invests.
I Amount does not include the portfolio activity of any underlying Fidelity Central Funds.
See accompanying notes which are an integral part of the financial statements.
VIP FundsManager® 60% Portfolio
Investment Summary (Unaudited)
The information in the following tables is based on the direct investments of the Fund.
Top Holdings as of December 31, 2018
| | % of fund's net assets |
| Fidelity Stock Selector All Cap Fund | 32.3 |
| Fidelity U.S. Bond Index Fund Institutional Premium Class | 26.8 |
| Fidelity Overseas Fund | 5.3 |
| Fidelity Inflation-Protected Bond Index Fund Institutional Premium Class | 3.7 |
| Fidelity Investments Money Market Government Portfolio Institutional Class 2.29% | 3.3 |
| Fidelity Mega Cap Stock Fund | 2.5 |
| Fidelity Long Term Treasury Bond Index Fund Institutional Premium | 2.3 |
| Fidelity Japan Fund | 2.0 |
| Fidelity Diversified International Fund | 1.9 |
| Fidelity Equity-Income Fund | 1.7 |
| | 81.8 |
Asset Allocation (% of fund's net assets)
| Period end* |
| | Domestic Equity Funds | 42.4% |
| | International Equity Funds | 18.1% |
| | Bond Funds | 34.3% |
| | Short-Term Funds | 5.1% |
| | Short-Term Investments | 0.1% |

* Futures - (0.5)%
VIP FundsManager® 60% Portfolio
Schedule of Investments December 31, 2018
Showing Percentage of Net Assets
| Equity Funds - 60.5% | | | |
| | | Shares | Value |
| Fidelity Contrafund (a) | | 7,997,357 | $88,050,901 |
| Fidelity Diversified International Fund (a) | | 3,127,089 | 98,972,374 |
| Fidelity Emerging Asia Fund (a) | | 127,491 | 4,715,904 |
| Fidelity Emerging Markets Discovery Fund (a) | | 676,940 | 8,278,973 |
| Fidelity Emerging Markets Fund (a) | | 780,874 | 20,794,682 |
| Fidelity Equity-Income Fund (a) | | 1,793,914 | 91,381,985 |
| Fidelity Europe Fund (a) | | 1,179,791 | 37,045,442 |
| Fidelity Global Commodity Stock Fund (a) | | 4,592,217 | 51,432,835 |
| Fidelity International Capital Appreciation Fund (a) | | 1,322,426 | 23,578,856 |
| Fidelity International Discovery Fund (a) | | 2,208,900 | 80,558,575 |
| Fidelity International Enhanced Index Fund (a) | | 9,087,983 | 76,793,458 |
| Fidelity International Small Cap Fund (a) | | 1,513,719 | 35,860,014 |
| Fidelity International Small Cap Opportunities Fund (a) | | 2,334,560 | 37,679,803 |
| Fidelity International Value Fund (a) | | 7,219,255 | 52,483,982 |
| Fidelity Japan Fund (a) | | 8,257,506 | 108,255,908 |
| Fidelity Japan Smaller Companies Fund (a) | | 5,055,826 | 76,545,198 |
| Fidelity Large Cap Value Enhanced Index Fund (a) | | 2,383,268 | 27,193,093 |
| Fidelity Low-Priced Stock Fund (a) | | 1,964,563 | 85,242,387 |
| Fidelity Mega Cap Stock Fund (a) | | 9,900,363 | 133,753,904 |
| Fidelity Overseas Fund (a) | | 6,907,046 | 282,360,057 |
| Fidelity Pacific Basin Fund (a) | | 747,646 | 19,678,051 |
| Fidelity Real Estate Investment Portfolio (a) | | 406,044 | 15,596,157 |
| Fidelity Stock Selector All Cap Fund (a) | | 44,566,397 | 1,712,686,646 |
| Fidelity Value Discovery Fund (a) | | 1,773,995 | 44,633,718 |
| TOTAL EQUITY FUNDS | | | |
| (Cost $3,588,211,944) | | | 3,213,572,903 |
|
| Fixed-Income Funds - 34.3% | | | |
| Fidelity Floating Rate High Income Fund (a) | | 6,077,843 | 55,916,157 |
| Fidelity Inflation-Protected Bond Index Fund Institutional Premium Class (a) | | 20,521,531 | 194,749,331 |
| Fidelity Long Term Treasury Bond Index Fund Institutional Premium (a) | | 9,862,231 | 125,053,091 |
| Fidelity New Markets Income Fund (a) | | 1,815,974 | 25,913,953 |
| Fidelity U.S. Bond Index Fund Institutional Premium Class (a) | | 125,987,035 | 1,421,133,755 |
| TOTAL FIXED-INCOME FUNDS | | | |
| (Cost $1,829,998,852) | | | 1,822,766,287 |
|
| Money Market Funds - 5.1% | | | |
| Fidelity Cash Central Fund, 2.42% (b) | | 13,355,937 | 13,358,608 |
| Fidelity Investments Money Market Government Portfolio Institutional Class 2.29% (a)(c) | | 175,947,358 | 175,947,358 |
| Fidelity Investments Money Market Prime Reserves Portfolio - Institutional Class 2.49% (a)(c) | | 82,770,145 | 82,786,699 |
| TOTAL MONEY MARKET FUNDS | | | |
| (Cost $272,092,634) | | | 272,092,665 |
| | | Principal Amount | Value |
|
| U.S. Treasury Obligations - 0.1% | | | |
| U.S. Treasury Bills, yield at date of purchase 2.34% to 2.37% 2/14/19 to 3/14/19 (d) | | | |
| (Cost $3,568,203) | | 3,580,000 | 3,567,951 |
| TOTAL INVESTMENT IN SECURITIES - 100.0% | | | |
| (Cost $5,693,871,633) | | | 5,311,999,806 |
| NET OTHER ASSETS (LIABILITIES) - 0.0% | | | (1,346,213) |
| NET ASSETS - 100% | | | $5,310,653,593 |
| Futures Contracts | | | | | |
| | Number of contracts | Expiration Date | Notional Amount | Value | Unrealized Appreciation/(Depreciation) |
| Purchased | | | | | |
| Equity Index Contracts | | | | | |
| ICE E-mini MSCI Emerging Markets Index Contracts (United States) | 413 | March 2019 | $19,964,420 | $(118,077) | $(118,077) |
| Sold | | | | | |
| Equity Index Contracts | | | | | |
| CME E-mini S&P 500 Index Contracts (United States) | 367 | March 2019 | 45,970,420 | 2,641,491 | 2,641,491 |
| TOTAL FUTURES CONTRACTS | | | | | $2,523,414 |
The notional amount of futures purchased as a percentage of Net Assets is 0.4%
The notional amount of futures sold as a percentage of Net Assets is 0.9%
For the period, the average monthly underlying face amount at value for futures contracts in the aggregate was $83,668,373.
Legend
(a) Affiliated Fund
(b) Affiliated fund that is generally available only to investment companies and other accounts managed by Fidelity Investments. The rate quoted is the annualized seven-day yield of the fund at period end. A complete unaudited listing of the fund's holdings as of its most recent quarter end is available upon request. In addition, each Fidelity Central Fund's financial statements, which are not covered by the Fund's Report of Independent Registered Public Accounting Firm, are available on the SEC's website or upon request.
(c) The rate quoted is the annualized seven-day yield of the fund at period end.
(d) Security or a portion of the security was pledged to cover margin requirements for futures contracts. At period end, the value of securities pledged amounted to $3,328,649.
Affiliated Central Funds
Information regarding fiscal year to date income earned by the Fund from investments in Fidelity Central Funds is as follows:
| Fund | Income earned |
| Fidelity Cash Central Fund | $116,084 |
| Total | $116,084 |
Amounts in the income column in the above table include any capital gain distributions from underlying funds, which are presented in the corresponding line-item in the Statement of Operations if applicable.
Fiscal year to date information regarding the Fund’s investments in non-Money Market Central Funds, including the ownership percentage, is presented below.
| Affiliate | Value, beginning of period | Purchases(a) | Sales Proceeds(a) | Realized Gain (loss) | Change in Unrealized appreciation (depreciation) | Value, end of period | % ownership, end of period |
| Fidelity Consumer Discretionary Central Fund | $-- | $218,396,936 | $220,205,695 | $1,808,759 | $-- | $-- | 0.0% |
| Fidelity Consumer Staples Central Fund | -- | 120,259,490 | 121,277,119 | 1,017,629 | -- | -- | 0.0% |
| Fidelity Energy Central Fund | -- | 103,608,782 | 104,680,486 | 1,071,704 | -- | -- | 0.0% |
| Fidelity Financials Central Fund | -- | 316,169,389 | 317,771,701 | 1,602,312 | -- | -- | 0.0% |
| Fidelity Health Care Central Fund | -- | 276,430,194 | 277,343,443 | 913,249 | -- | -- | 0.0% |
| Fidelity Industrials Central Fund | -- | 209,101,483 | 211,201,736 | 2,100,253 | -- | -- | 0.0% |
| Fidelity Information Technology Central Fund�� | -- | 512,782,056 | 514,646,348 | 1,864,292 | -- | -- | 0.0% |
| Fidelity Materials Central Fund | -- | 62,547,233 | 63,190,656 | 643,423 | -- | -- | 0.0% |
| Fidelity Telecom Services Central Fund | -- | 29,243,667 | 29,670,151 | 426,484 | -- | -- | 0.0% |
| Fidelity Utilities Central Fund | -- | 50,874,242 | 51,517,036 | 642,794 | -- | -- | 0.0% |
| | $-- | $1,899,413,472 | $1,911,504,371 | $12,090,899 | $-- | $-- | |
(a) Includes the value of shares purchased or redeemed through in-kind transactions, if applicable. See the Notes to Financial Statements for additional details.
Amounts in the income column in the above table include any capital gain distributions from underlying funds, which are presented in the corresponding line-item in the Statement of Operations if applicable.
Affiliated Underlying Funds
Fiscal year to date information regarding the Fund's investments in affiliated Underlying Funds, excluding any Money Market Central Funds, is presented below. Exchanges between classes of the same affiliated Underlying Funds may occur.
| Affiliate | Value, beginning of period | Purchases(a) | Sales Proceeds(a) | Dividend Income | Realized Gain (loss) | Change in Unrealized appreciation (depreciation) | Value, end of period |
| Fidelity Air Transportation Portfolio | $17,065,030 | $907,927 | $16,208,639 | $865,807 | $129,248 | $(1,893,566) | $-- |
| Fidelity Banking Portfolio | 38,833,828 | 2,914,917 | 38,903,834 | 2,804,494 | 22,211,439 | (25,056,350) | -- |
| Fidelity Biotechnology Portfolio | 22,793,392 | 952,490 | 23,640,886 | 885,894 | 3,856,816 | (3,961,812) | -- |
| Fidelity Brokerage and Investment Management Portfolio | 8,995,032 | 443,667 | 9,064,764 | 419,760 | 989,828 | (1,363,763) | -- |
| Fidelity Chemicals Portfolio | 8,507,109 | 500,663 | 8,092,132 | 478,467 | 5,176,143 | (6,091,783) | -- |
| Fidelity Commodity Strategy Fund | 62,581,079 | 7,918,036 | 69,495,117 | -- | 855,176 | (1,859,174) | -- |
| Fidelity Communication Services Portfolio | 14,598,427 | 811,615 | 13,985,502 | 774,048 | (744,280) | (680,260) | -- |
| Fidelity Construction and Housing Portfolio | 12,720,366 | 593,806 | 11,788,485 | 562,500 | 6,347,812 | (7,873,499) | -- |
| Fidelity Consumer Discretionary Portfolio | 177,742,463 | 8,006,935 | 187,852,468 | 2,925,963 | 82,414,033 | (80,310,963) | -- |
| Fidelity Consumer Staples Portfolio | 130,079,825 | 9,158,902 | 124,377,264 | 7,428,955 | 34,733,218 | (49,594,681) | -- |
| Fidelity Contrafund | 94,504,663 | 23,200,414 | 20,751,950 | 7,727,040 | 263,326 | (9,165,552) | 88,050,901 |
| Fidelity Defense and Aerospace Portfolio | 58,700,862 | 1,910,453 | 63,286,706 | 1,755,066 | 18,041,054 | (15,365,663) | -- |
| Fidelity Diversified International Fund | 133,146,732 | 13,834,091 | 23,767,752 | 6,804,403 | (200,089) | (24,040,608) | 98,972,374 |
| Fidelity Emerging Asia Fund | 9,493,333 | 185,128 | 4,025,000 | 156,656 | 1,434,526 | (2,372,083) | 4,715,904 |
| Fidelity Emerging Markets Discovery Fund | 16,855,779 | 202,597 | 6,968,291 | 152,818 | 363,411 | (2,174,523) | 8,278,973 |
| Fidelity Emerging Markets Fund | 70,162,222 | 977,995 | 46,470,380 | 170,398 | 2,124,791 | (5,999,946) | 20,794,682 |
| Fidelity Energy Portfolio | 104,068,551 | 2,366,633 | 106,913,543 | -- | 15,925,701 | (15,447,342) | -- |
| Fidelity Equity-Income Fund | 107,052,709 | 19,442,674 | 17,953,379 | 8,767,872 | (594,075) | (16,565,944) | 91,381,985 |
| Fidelity Europe Fund | 50,969,904 | 6,651,783 | 9,085,549 | 3,969,470 | 576,715 | (12,067,411) | 37,045,442 |
| Fidelity Financial Services Portfolio | 208,293,961 | 10,586,394 | 211,732,523 | 4,928,082 | 101,680,852 | (108,828,684) | -- |
| Fidelity Floating Rate High Income Fund | 62,457,906 | 3,707,121 | 7,699,899 | 2,713,749 | 18,202 | (2,567,173) | 55,916,157 |
| Fidelity Global Commodity Stock Fund | 64,730,477 | 8,390,497 | 13,182,199 | 1,126,863 | 521,930 | (9,027,870) | 51,432,835 |
| Fidelity Health Care Portfolio | 219,824,598 | 14,054,946 | 241,541,183 | 8,044,149 | 106,672,075 | (99,010,436) | -- |
| Fidelity Industrial Equipment Portfolio | 41,888,749 | 5,296,521 | 373,830 | 5,250,930 | 11,856 | (16,038,159) | -- |
| Fidelity Industrials Portfolio | 80,646,819 | 8,683,142 | 123,940,410 | 4,995,148 | 49,974,989 | (46,149,677) | -- |
| Fidelity Inflation-Protected Bond Index Fund Institutional Premium Class | 216,326,281 | 50,690,965 | 65,196,272 | 4,401,584 | (1,213,613) | (5,858,030) | 194,749,331 |
| Fidelity Insurance Portfolio | 21,811,401 | 2,548,870 | 21,222,939 | 2,490,812 | 9,054,817 | (12,192,149) | -- |
| Fidelity International Capital Appreciation Fund | 30,788,374 | 2,289,203 | 5,463,585 | 692,512 | 727,532 | (4,762,668) | 23,578,856 |
| Fidelity International Discovery Fund | 110,711,503 | 8,829,757 | 19,665,048 | 3,007,604 | (767,926) | (18,549,711) | 80,558,575 |
| Fidelity International Enhanced Index Fund | 102,707,287 | 7,213,615 | 18,306,937 | 1,786,747 | (298,194) | (14,522,313) | 76,793,458 |
| Fidelity International Small Cap Fund | 59,491,088 | 5,156,993 | 20,139,398 | 2,092,019 | 3,549,603 | (12,198,272) | 35,860,014 |
| Fidelity International Small Cap Opportunities Fund | 55,147,039 | 3,919,748 | 14,559,304 | 1,102,503 | 3,417,029 | (10,244,709) | 37,679,803 |
| Fidelity International Value Fund | 72,391,124 | 5,539,041 | 12,997,412 | 1,702,435 | (232,335) | (12,216,436) | 52,483,982 |
| Fidelity Investments Money Market Government Portfolio Institutional Class 2.29% | 43,179,157 | 319,567,111 | 186,798,910 | 1,217,330 | -- | -- | 175,947,358 |
| Fidelity Investments Money Market Prime Reserves - Institutional Class 2.49% | 77,188,157 | 104,976,239 | 99,379,523 | 1,487,806 | 1,794 | 32 | 82,786,699 |
| Fidelity Japan Fund | -- | 117,411,371 | -- | 411,371 | -- | (9,155,463) | 108,255,908 |
| Fidelity Japan Smaller Companies Fund | 67,756,712 | 29,065,493 | 1,415,948 | 4,039,238 | 29,370 | (18,890,429) | 76,545,198 |
| Fidelity Large Cap Value Enhanced Index Fund | -- | 33,132,788 | 1,170,000 | 1,875,688 | (32,079) | (4,737,616) | 27,193,093 |
| Fidelity Leisure Portfolio | 12,137,474 | 664,367 | 12,108,289 | 633,061 | (252,258) | (441,294) | -- |
| Fidelity Long Term Treasury Bond Index Fund Institutional Premium | -- | 1,145,359 | 2,672,141 | 577,002 | (95,378) | (2,147,482) | 125,053,091 |
| Fidelity Long-Term Treasury Bond Index Fund Institutional Class | 112,926,633 | 33,802,338 | 15,235,105 | 2,796,570 | (1,023,764) | (1,647,369) | -- |
| Fidelity Low-Priced Stock Fund | 108,316,039 | 17,459,394 | 18,956,331 | 11,081,641 | (445,825) | (21,130,890) | 85,242,387 |
| Fidelity Materials Portfolio | 57,905,087 | 3,948,003 | 56,650,386 | 2,694,325 | (5,378,274) | 175,570 | -- |
| Fidelity Medical Equipment and Systems Portfolio | 18,997,921 | 858,639 | 20,387,158 | 805,705 | 4,830,574 | (4,299,976) | -- |
| Fidelity Mega Cap Stock Fund | 161,014,872 | 37,280,069 | 27,924,292 | 26,708,668 | (799,563) | (35,817,182) | 133,753,904 |
| Fidelity New Markets Income Fund | 31,606,024 | 1,831,495 | 3,849,994 | 1,334,729 | (236,735) | (3,436,837) | 25,913,953 |
| Fidelity Overseas Fund | 467,435,604 | 41,704,423 | 163,382,937 | 15,883,594 | 28,404,873 | (91,801,906) | 282,360,057 |
| Fidelity Pacific Basin Fund | 27,229,545 | 3,352,861 | 4,780,628 | 1,943,265 | 886,316 | (7,010,043) | 19,678,051 |
| Fidelity Real Estate Investment Portfolio | 63,760,160 | 5,094,236 | 48,218,973 | 806,669 | (5,113,541) | 74,275 | 15,596,157 |
| Fidelity Stock Selector All Cap Fund | -- | 2,197,248,661 | 204,654,485 | 73,186,488 | 474,264 | (280,381,794) | 1,712,686,646 |
| Fidelity Technology Portfolio | 487,638,801 | 56,974,005 | 529,681,468 | 49,022,523 | 168,423,083 | (183,354,421) | -- |
| Fidelity Telecommunications Portfolio | 30,354,838 | 1,813,398 | 30,289,088 | 431,440 | (1,925,113) | 45,965 | -- |
| Fidelity Transportation Portfolio | 12,874,248 | 611,912 | 12,316,978 | 580,038 | 1,386,397 | (2,555,579) | -- |
| Fidelity U.S. Bond Index Fund Institutional Premium Class | 1,766,660,900 | 320,864,430 | 613,662,687 | 45,644,196 | (21,150,975) | (31,577,913) | 1,421,133,755 |
| Fidelity Utilities Portfolio | 50,613,596 | 1,979,677 | 52,656,269 | 237,294 | 4,223,760 | (4,160,764) | -- |
| Fidelity Value Discovery Fund | 54,185,632 | 6,253,944 | 9,076,463 | 2,067,041 | (97,148) | (6,632,247) | 44,633,718 |
| | $6,137,869,313 | $3,574,927,752 | $3,693,920,633 | $336,450,430 | $639,131,388 | $(1,362,934,573) | $5,295,073,247 |
(a) Includes the value of shares purchased or redeemed through in-kind transactions, if applicable. See the Notes to Financial Statements for additional details.
Amounts in the income column in the above table include any capital gain distributions from underlying funds, which are presented in the corresponding line-item in the Statement of Operations if applicable.
Investment Valuation
The following is a summary of the inputs used, as of December 31, 2018, involving the Fund's assets and liabilities carried at fair value. The inputs or methodology used for valuing securities may not be an indication of the risk associated with investing in those securities. For more information on valuation inputs, and their aggregation into the levels used below, please refer to the Investment Valuation section in the accompanying Notes to Financial Statements.
| | Valuation Inputs at Reporting Date: |
| Description | Total | Level 1 | Level 2 | Level 3 |
| Investments in Securities: | | | | |
| Equity Funds | $3,213,572,903 | $3,213,572,903 | $-- | $-- |
| Fixed-Income Funds | 1,822,766,287 | 1,822,766,287 | -- | -- |
| Money Market Funds | 272,092,665 | 272,092,665 | -- | -- |
| Other Short-Term Investments | 3,567,951 | -- | 3,567,951 | -- |
| Total Investments in Securities: | $5,311,999,806 | $5,308,431,855 | $3,567,951 | $-- |
| Derivative Instruments: | | | | |
| Assets | | | | |
| Futures Contracts | $2,641,491 | $2,641,491 | $-- | $-- |
| Total Assets | $2,641,491 | $2,641,491 | $-- | $-- |
| Liabilities | | | | |
| Futures Contracts | $(118,077) | $(118,077) | $-- | $-- |
| Total Liabilities | $(118,077) | $(118,077) | $-- | $-- |
| Total Derivative Instruments: | $2,523,414 | $2,523,414 | $-- | $-- |
Value of Derivative Instruments
The following table is a summary of the Fund's value of derivative instruments by primary risk exposure as of December 31, 2018. For additional information on derivative instruments, please refer to the Derivative Instruments section in the accompanying Notes to Financial Statements.
| Primary Risk Exposure / Derivative Type | Value |
| | Asset | Liability |
| Equity Risk | | |
| Futures Contracts(a) | $2,641,491 | $(118,077) |
| Total Equity Risk | 2,641,491 | (118,077) |
| Total Value of Derivatives | $2,641,491 | $(118,077) |
(a) Reflects gross cumulative appreciation (depreciation) on futures contracts as presented in the Schedule of Investments. In the Statement of Assets and Liabilities, the period end daily variation margin is included in receivable or payable for daily variation margin on futures contracts, and the net cumulative appreciation (depreciation) is included in net unrealized appreciation (depreciation).
See accompanying notes which are an integral part of the financial statements.
VIP FundsManager® 60% Portfolio
Financial Statements
Statement of Assets and Liabilities
| | | December 31, 2018 |
| Assets | | |
Investment in securities, at value — See accompanying schedule:
Unaffiliated issuers (cost $3,568,203) | $3,567,951 | |
| Fidelity Central Funds (cost $13,358,608) | 13,358,608 | |
| Other affiliated issuers (cost $5,676,944,822) | 5,295,073,247 | |
| Total Investment in Securities (cost $5,693,871,633) | | $5,311,999,806 |
| Receivable for investments sold | | 2,140,349 |
| Receivable for fund shares sold | | 707,456 |
| Distributions receivable from Fidelity Central Funds | | 20,640 |
| Total assets | | 5,314,868,251 |
| Liabilities | | |
| Payable for investments purchased | $390,039 | |
| Payable for fund shares redeemed | 2,435,481 | |
| Accrued management fee | 897,320 | |
| Distribution and service plan fees payable | 67,223 | |
| Payable for daily variation margin on futures contracts | 424,595 | |
| Total liabilities | | 4,214,658 |
| Net Assets | | $5,310,653,593 |
| Net Assets consist of: | | |
| Paid in capital | | $4,798,354,075 |
| Total distributable earnings (loss) | | 512,299,518 |
| Net Assets | | $5,310,653,593 |
| Net Asset Value and Maximum Offering Price | | |
| Service Class: | | |
| Net Asset Value, offering price and redemption price per share ($49,869 ÷ 4,878 shares) | | $10.22 |
| Service Class 2: | | |
| Net Asset Value, offering price and redemption price per share ($533,023,748 ÷ 52,266,463 shares) | | $10.20 |
| Investor Class: | | |
| Net Asset Value, offering price and redemption price per share ($4,777,579,976 ÷ 467,341,710 shares) | | $10.22 |
See accompanying notes which are an integral part of the financial statements.
Statement of Operations
| | | Year ended December 31, 2018 |
| Investment Income | | |
| Dividends: | | |
| Unaffiliated issuers | | $910,712 |
| Affiliated issuers | | 95,161,895 |
| Interest | | 80,800 |
| Income from Fidelity Central Funds | | 116,084 |
| Total income | | 96,269,491 |
| Expenses | | |
| Management fee | $15,013,330 | |
| Distribution and service plan fees | 1,457,946 | |
| Independent trustees' fees and expenses | 28,162 | |
| Total expenses before reductions | 16,499,438 | |
| Expense reductions | (3,602,642) | |
| Total expenses after reductions | | 12,896,796 |
| Net investment income (loss) | | 83,372,695 |
| Realized and Unrealized Gain (Loss) | | |
| Net realized gain (loss) on: | | |
| Investment securities: | | |
| Unaffiliated issuers | 8,194,205 | |
| Fidelity Central Funds | 12,089,711 | |
| Other affiliated issuers | 639,131,388 | |
| Futures contracts | 20,481,284 | |
| Capital gain distributions from underlying funds: | | |
| Affiliated issuers | 241,288,535 | |
| Total net realized gain (loss) | | 921,185,123 |
| Change in net unrealized appreciation (depreciation) on: | | |
| Investment securities: | | |
| Unaffiliated issuers | (5,837,486) | |
| Affiliated issuers | (1,362,934,573) | |
| Futures contracts | 2,523,414 | |
| Total change in net unrealized appreciation (depreciation) | | (1,366,248,645) |
| Net gain (loss) | | (445,063,522) |
| Net increase (decrease) in net assets resulting from operations | | $(361,690,827) |
See accompanying notes which are an integral part of the financial statements.
Statement of Changes in Net Assets
| | Year ended December 31, 2018 | Year ended December 31, 2017 |
| Increase (Decrease) in Net Assets | | |
| Operations | | |
| Net investment income (loss) | $83,372,695 | $69,528,865 |
| Net realized gain (loss) | 921,185,123 | 728,591,827 |
| Change in net unrealized appreciation (depreciation) | (1,366,248,645) | 198,428,497 |
| Net increase (decrease) in net assets resulting from operations | (361,690,827) | 996,549,189 |
| Distributions to shareholders | (782,439,317) | – |
| Distributions to shareholders from net investment income | – | (65,831,245) |
| Distributions to shareholders from net realized gain | – | (134,172,261) |
| Total distributions | (782,439,317) | (200,003,506) |
| Share transactions - net increase (decrease) | 123,840,689 | (847,339,302) |
| Total increase (decrease) in net assets | (1,020,289,455) | (50,793,619) |
| Net Assets | | |
| Beginning of period | 6,330,943,048 | 6,381,736,667 |
| End of period | $5,310,653,593 | $6,330,943,048 |
| Other Information | | |
| Undistributed net investment income end of period | | $3,921,430 |
See accompanying notes which are an integral part of the financial statements.
Financial Highlights
VIP FundsManager 60% Portfolio Service Class
| Years ended December 31, | 2018 | 2017 | 2016 | 2015 | 2014 |
| Selected Per–Share Data | | | | | |
| Net asset value, beginning of period | $12.50 | $11.03 | $11.06 | $11.97 | $11.81 |
| Income from Investment Operations | | | | | |
| Net investment income (loss)A | .16 | .13 | .13 | .13 | .15 |
| Net realized and unrealized gain (loss) | (.87) | 1.73 | .36 | (.07) | .48 |
| Total from investment operations | (.71) | 1.86 | .49 | .06 | .63 |
| Distributions from net investment income | (.14) | (.13) | (.14) | (.13) | (.15) |
| Distributions from net realized gain | (1.42) | (.25) | (.38) | (.84) | (.32) |
| Total distributions | (1.57)B | (.39)C | (.52) | (.97) | (.47) |
| Net asset value, end of period | $10.22 | $12.50 | $11.03 | $11.06 | $11.97 |
| Total ReturnD,E | (6.44)% | 16.99% | 4.79% | .41% | 5.40% |
| Ratios to Average Net AssetsF,G,H | | | | | |
| Expenses before reductions | .35% | .35% | .35% | .35% | .35% |
| Expenses net of fee waivers, if any | .20% | .20% | .20% | .20% | .20% |
| Expenses net of all reductions | .20% | .20% | .20% | .20% | .20% |
| Net investment income (loss) | 1.40% | 1.11% | 1.19% | 1.11% | 1.26% |
| Supplemental Data | | | | | |
| Net assets, end of period (000 omitted) | $50 | $61 | $59 | $60 | $69 |
| Portfolio turnover rateF,I | 91% | 47% | 35% | 30% | 36% |
A Calculated based on average shares outstanding during the period.
B Total distributions of $1.57 per share is comprised of distributions from net investment income of $.142 and distributions from net realized gain of $1.424 per share.
C Total distributions of $.39 per share is comprised of distributions from net investment income of $.134 and distributions from net realized gain of $.251 per share.
D Total returns do not reflect charges attributable to your insurance company's separate account. Inclusion of these charges would reduce the total returns shown.
E Total returns would have been lower if certain expenses had not been reduced during the applicable periods shown.
F Amounts do not include the activity of the Underlying Funds.
G Fees and expenses of any underlying Fidelity Central Funds are not included in the Fund's expense ratio. The Fund indirectly bears its proportionate share of the expenses of any underlying Fidelity Central Funds.
H Expense ratios reflect operating expenses of the class. Expenses before reductions do not reflect amounts reimbursed by the investment adviser or reductions from brokerage service arrangements or reductions from other expense offset arrangements and do not represent the amount paid by the class during periods when reimbursements or reductions occur. Expenses net of fee waivers reflect expenses after reimbursement by the investment adviser but prior to reductions from brokerage service arrangements or other expense offset arrangements. Expenses net of all reductions represent the net expenses paid by the class but do not include expenses of the underlying funds in which the Fund invests.
I Amount does not include the portfolio activity of any underlying Fidelity Central Funds.
See accompanying notes which are an integral part of the financial statements.
VIP FundsManager 60% Portfolio Service Class 2
| Years ended December 31, | 2018 | 2017 | 2016 | 2015 | 2014 |
| Selected Per–Share Data | | | | | |
| Net asset value, beginning of period | $12.47 | $11.01 | $11.04 | $11.95 | $11.79 |
| Income from Investment Operations | | | | | |
| Net investment income (loss)A | .14 | .11 | .11 | .11 | .13 |
| Net realized and unrealized gain (loss) | (.86) | 1.72 | .36 | (.07) | .48 |
| Total from investment operations | (.72) | 1.83 | .47 | .04 | .61 |
| Distributions from net investment income | (.13) | (.12) | (.12) | (.11) | (.13) |
| Distributions from net realized gain | (1.42) | (.25) | (.38) | (.84) | (.32) |
| Total distributions | (1.55) | (.37) | (.50) | (.95) | (.45) |
| Net asset value, end of period | $10.20 | $12.47 | $11.01 | $11.04 | $11.95 |
| Total ReturnB,C | (6.51)% | 16.76% | 4.65% | .27% | 5.26% |
| Ratios to Average Net AssetsD,E,F | | | | | |
| Expenses before reductions | .50% | .50% | .50% | .50% | .50% |
| Expenses net of fee waivers, if any | .35% | .35% | .35% | .35% | .35% |
| Expenses net of all reductions | .35% | .35% | .35% | .35% | .35% |
| Net investment income (loss) | 1.25% | .96% | 1.04% | .96% | 1.11% |
| Supplemental Data | | | | | |
| Net assets, end of period (000 omitted) | $533,024 | $585,346 | $507,162 | $497,768 | $425,719 |
| Portfolio turnover rateD,G | 91% | 47% | 35% | 30% | 36% |
A Calculated based on average shares outstanding during the period.
B Total returns do not reflect charges attributable to your insurance company's separate account. Inclusion of these charges would reduce the total returns shown.
C Total returns would have been lower if certain expenses had not been reduced during the applicable periods shown.
D Amounts do not include the activity of the Underlying Funds.
E Fees and expenses of any underlying Fidelity Central Funds are not included in the Fund's expense ratio. The Fund indirectly bears its proportionate share of the expenses of any underlying Fidelity Central Funds.
F Expense ratios reflect operating expenses of the class. Expenses before reductions do not reflect amounts reimbursed by the investment adviser or reductions from brokerage service arrangements or reductions from other expense offset arrangements and do not represent the amount paid by the class during periods when reimbursements or reductions occur. Expenses net of fee waivers reflect expenses after reimbursement by the investment adviser but prior to reductions from brokerage service arrangements or other expense offset arrangements. Expenses net of all reductions represent the net expenses paid by the class but do not include expenses of the underlying funds in which the Fund invests.
G Amount does not include the portfolio activity of any underlying Fidelity Central Funds.
See accompanying notes which are an integral part of the financial statements.
VIP FundsManager 60% Portfolio Investor Class
| Years ended December 31, | 2018 | 2017 | 2016 | 2015 | 2014 |
| Selected Per–Share Data | | | | | |
| Net asset value, beginning of period | $12.50 | $11.03 | $11.06 | $11.97 | $11.81 |
| Income from Investment Operations | | | | | |
| Net investment income (loss)A | .16 | .13 | .13 | .13 | .15 |
| Net realized and unrealized gain (loss) | (.87) | 1.73 | .36 | (.07) | .48 |
| Total from investment operations | (.71) | 1.86 | .49 | .06 | .63 |
| Distributions from net investment income | (.14) | (.13) | (.14) | (.13) | (.15) |
| Distributions from net realized gain | (1.42) | (.25) | (.38) | (.84) | (.32) |
| Total distributions | (1.57)B | (.39)C | (.52) | (.97) | (.47) |
| Net asset value, end of period | $10.22 | $12.50 | $11.03 | $11.06 | $11.97 |
| Total ReturnD,E | (6.44)% | 16.99% | 4.79% | .41% | 5.40% |
| Ratios to Average Net AssetsF,G,H | | | | | |
| Expenses before reductions | .25% | .25% | .25% | .25% | .25% |
| Expenses net of fee waivers, if any | .20% | .20% | .20% | .20% | .20% |
| Expenses net of all reductions | .20% | .20% | .20% | .20% | .20% |
| Net investment income (loss) | 1.40% | 1.11% | 1.19% | 1.11% | 1.26% |
| Supplemental Data | | | | | |
| Net assets, end of period (000 omitted) | $4,777,580 | $5,745,537 | $5,874,515 | $6,378,497 | $6,172,435 |
| Portfolio turnover rateF,I | 91% | 47% | 35% | 30% | 36% |
A Calculated based on average shares outstanding during the period.
B Total distributions of $1.57 per share is comprised of distributions from net investment income of $.142 and distributions from net realized gain of $1.424 per share.
C Total distributions of $.39 per share is comprised of distributions from net investment income of $.134 and distributions from net realized gain of $.251 per share.
D Total returns do not reflect charges attributable to your insurance company's separate account. Inclusion of these charges would reduce the total returns shown.
E Total returns would have been lower if certain expenses had not been reduced during the applicable periods shown.
F Amounts do not include the activity of the Underlying Funds.
G Fees and expenses of any underlying Fidelity Central Funds are not included in the Fund's expense ratio. The Fund indirectly bears its proportionate share of the expenses of any underlying Fidelity Central Funds.
H Expense ratios reflect operating expenses of the class. Expenses before reductions do not reflect amounts reimbursed by the investment adviser or reductions from brokerage service arrangements or reductions from other expense offset arrangements and do not represent the amount paid by the class during periods when reimbursements or reductions occur. Expenses net of fee waivers reflect expenses after reimbursement by the investment adviser but prior to reductions from brokerage service arrangements or other expense offset arrangements. Expenses net of all reductions represent the net expenses paid by the class but do not include expenses of the underlying funds in which the Fund invests.
I Amount does not include the portfolio activity of any underlying Fidelity Central Funds.
See accompanying notes which are an integral part of the financial statements.
VIP FundsManager® 70% Portfolio
Investment Summary (Unaudited)
The information in the following tables is based on the direct investments of the Fund.
Top Holdings as of December 31, 2018
| | % of fund's net assets |
| Fidelity Stock Selector All Cap Fund | 37.7 |
| Fidelity U.S. Bond Index Fund Institutional Premium Class | 16.3 |
| Fidelity Overseas Fund | 7.0 |
| Fidelity Investments Money Market Government Portfolio Institutional Class 2.29% | 3.5 |
| Fidelity Inflation-Protected Bond Index Fund Institutional Premium Class | 3.5 |
| Fidelity Mega Cap Stock Fund | 2.9 |
| Fidelity Long Term Treasury Bond Index Fund Institutional Premium | 2.2 |
| Fidelity Diversified International Fund | 2.2 |
| Fidelity Japan Fund | 2.1 |
| Fidelity Equity-Income Fund | 2.0 |
| | 79.4 |
Asset Allocation (% of fund's net assets)
| Period end* |
| | Domestic Equity Funds | 49.4% |
| | International Equity Funds | 21.7% |
| | Bond Funds | 23.6% |
| | Short-Term Funds | 5.2% |
| | Short-Term Investments | 0.1% |

* Futures - (0.5)%
VIP FundsManager® 70% Portfolio
Schedule of Investments December 31, 2018
Showing Percentage of Net Assets
| Equity Funds - 71.1% | | | |
| | | Shares | Value |
| Fidelity Contrafund (a) | | 2,377,518 | $26,176,473 |
| Fidelity Diversified International Fund (a) | | 956,682 | 30,278,992 |
| Fidelity Emerging Asia Fund (a) | | 44,911 | 1,661,240 |
| Fidelity Emerging Markets Discovery Fund (a) | | 241,524 | 2,953,842 |
| Fidelity Emerging Markets Fund (a) | | 277,821 | 7,398,374 |
| Fidelity Equity-Income Fund (a) | | 533,654 | 27,184,323 |
| Fidelity Europe Fund (a) | | 361,739 | 11,358,592 |
| Fidelity Global Commodity Stock Fund (a) | | 1,202,079 | 13,463,284 |
| Fidelity International Capital Appreciation Fund (a) | | 401,458 | 7,157,990 |
| Fidelity International Discovery Fund (a) | | 675,631 | 24,640,244 |
| Fidelity International Enhanced Index Fund (a) | | 2,776,274 | 23,459,518 |
| Fidelity International Small Cap Fund (a) | | 464,896 | 11,013,386 |
| Fidelity International Small Cap Opportunities Fund (a) | | 697,684 | 11,260,626 |
| Fidelity International Value Fund (a) | | 2,224,025 | 16,168,659 |
| Fidelity Japan Fund (a) | | 2,235,771 | 29,310,956 |
| Fidelity Japan Smaller Companies Fund (a) | | 1,422,479 | 21,536,336 |
| Fidelity Large Cap Value Enhanced Index Fund (a) | | 956,510 | 10,913,775 |
| Fidelity Low-Priced Stock Fund (a) | | 586,127 | 25,432,068 |
| Fidelity Mega Cap Stock Fund (a) | | 2,946,295 | 39,804,444 |
| Fidelity Overseas Fund (a) | | 2,380,582 | 97,318,194 |
| Fidelity Pacific Basin Fund (a) | | 228,221 | 6,006,789 |
| Fidelity Real Estate Investment Portfolio (a) | | 123,012 | 4,724,873 |
| Fidelity Stock Selector All Cap Fund (a) | | 13,547,748 | 520,639,968 |
| Fidelity Value Discovery Fund (a) | | 531,080 | 13,361,982 |
| TOTAL EQUITY FUNDS | | | |
| (Cost $1,111,435,180) | | | 983,224,928 |
|
| Fixed-Income Funds - 23.6% | | | |
| Fidelity Floating Rate High Income Fund (a) | | 1,595,881 | 14,682,106 |
| Fidelity Inflation-Protected Bond Index Fund Institutional Premium Class (a) | | 5,146,332 | 48,838,691 |
| Fidelity Long Term Treasury Bond Index Fund Institutional Premium (a) | | 2,402,513 | 30,463,870 |
| Fidelity New Markets Income Fund (a) | | 481,100 | 6,865,297 |
| Fidelity U.S. Bond Index Fund Institutional Premium Class (a) | | 19,934,441 | 224,860,498 |
| TOTAL FIXED-INCOME FUNDS | | | |
| (Cost $325,985,861) | | | 325,710,462 |
|
| Money Market Funds - 5.2% | | | |
| Fidelity Cash Central Fund, 2.42% (b) | | 1,706,177 | 1,706,518 |
| Fidelity Institutional Money Market Funds Prime Reserves Portfolio Class I (a) | | 21,325,842 | 21,330,108 |
| Fidelity Investments Money Market Government Portfolio Institutional Class 2.29% (a)(c) | | 48,850,295 | 48,850,295 |
| TOTAL MONEY MARKET FUNDS | | | |
| (Cost $71,886,906) | | | 71,886,921 |
| | | Principal Amount | Value |
|
| U.S. Treasury Obligations - 0.1% | | | |
| U.S. Treasury Bills, yield at date of purchase 2.31% to 2.37% 2/7/19 to 3/14/19 (d) | | | |
| (Cost $1,046,508) | | 1,050,000 | 1,046,439 |
| TOTAL INVESTMENT IN SECURITIES - 100.0% | | | |
| (Cost $1,510,354,455) | | | 1,381,868,750 |
| NET OTHER ASSETS (LIABILITIES) - 0.0% | | | (323,665) |
| NET ASSETS - 100% | | | $1,381,545,085 |
| Futures Contracts | | | | | |
| | Number of contracts | Expiration Date | Notional Amount | Value | Unrealized Appreciation/(Depreciation) |
| Purchased | | | | | |
| Equity Index Contracts | | | | | |
| ICE E-mini MSCI Emerging Markets Index Contracts (United States) | 43 | March 2019 | $2,078,620 | $(12,272) | $(12,272) |
| Sold | | | | | |
| Equity Index Contracts | | | | | |
| CME E-mini S&P 500 Index Contracts (United States) | 82 | March 2019 | 10,271,320 | 590,197 | 590,197 |
| TOTAL FUTURES CONTRACTS | | | | | $577,925 |
The notional amount of futures purchased as a percentage of Net Assets is 0.2%
The notional amount of futures sold as a percentage of Net Assets is 0.7%
Legend
(a) Affiliated Fund
(b) Affiliated fund that is generally available only to investment companies and other accounts managed by Fidelity Investments. The rate quoted is the annualized seven-day yield of the fund at period end. A complete unaudited listing of the fund's holdings as of its most recent quarter end is available upon request. In addition, each Fidelity Central Fund's financial statements, which are not covered by the Fund's Report of Independent Registered Public Accounting Firm, are available on the SEC's website or upon request.
(c) The rate quoted is the annualized seven-day yield of the fund at period end.
(d) Security or a portion of the security was pledged to cover margin requirements for futures contracts. At period end, the value of securities pledged amounted to $622,675.
Affiliated Central Funds
Information regarding fiscal year to date income earned by the Fund from investments in Fidelity Central Funds is as follows:
| Fund | Income earned |
| Fidelity Cash Central Fund | $29,895 |
| Total | $29,895 |
Amounts in the income column in the above table include any capital gain distributions from underlying funds, which are presented in the corresponding line-item in the Statement of Operations if applicable.
Fiscal year to date information regarding the Fund’s investments in non-Money Market Central Funds, including the ownership percentage, is presented below.
| Affiliate | Value, beginning of period | Purchases(a) | Sales Proceeds(a) | Realized Gain (loss) | Change in Unrealized appreciation (depreciation) | Value, end of period | % ownership, end of period |
| Fidelity Consumer Discretionary Central Fund | $-- | $60,733,440 | $61,236,433 | $502,993 | $-- | $-- | 0.0% |
| Fidelity Consumer Staples Central Fund | -- | 33,629,099 | 33,913,667 | 284,568 | -- | -- | 0.0% |
| Fidelity Energy Central Fund | -- | 29,013,937 | 29,314,050 | 300,113 | -- | -- | 0.0% |
| Fidelity Financials Central Fund | -- | 88,396,207 | 88,844,189 | 447,982 | -- | -- | 0.0% |
| Fidelity Health Care Central Fund | -- | 77,015,902 | 77,270,341 | 254,439 | -- | -- | 0.0% |
| Fidelity Industrials Central Fund | -- | 58,579,667 | 59,168,052 | 588,385 | -- | -- | 0.0% |
| Fidelity Information Technology Central Fund | -- | 143,385,996 | 143,907,296 | 521,300 | -- | -- | 0.0% |
| Fidelity Materials Central Fund | -- | 17,529,562 | 17,709,889 | 180,327 | -- | -- | 0.0% |
| Fidelity Telecom Services Central Fund | -- | 7,877,583 | 7,992,468 | 114,885 | -- | -- | 0.0% |
| Fidelity Utilities Central Fund | -- | 13,940,381 | 14,116,517 | 176,136 | -- | -- | 0.0% |
| | $-- | $530,101,774 | $533,472,902 | $3,371,128 | $-- | $-- | |
(a) Includes the value of shares purchased or redeemed through in-kind transactions, if applicable. See the Notes to Financial Statements for additional details.
Amounts in the income column in the above table include any capital gain distributions from underlying funds, which are presented in the corresponding line-item in the Statement of Operations if applicable.
Affiliated Underlying Funds
Fiscal year to date information regarding the Fund's investments in affiliated Underlying Funds, excluding any Money Market Central Funds, is presented below. Exchanges between classes of the same affiliated Underlying Funds may occur.
| Affiliate | Value, beginning of period | Purchases(a) | Sales Proceeds(a) | Dividend Income | Realized Gain (loss) | Change in Unrealized appreciation (depreciation) | Value, end of period |
| Fidelity Air Transportation Portfolio | $4,740,075 | $320,483 | $4,557,137 | $247,945 | $2,831 | $(506,252) | $-- |
| Fidelity Banking Portfolio | 11,006,567 | 1,013,712 | 11,171,210 | 821,767 | 6,018,484 | (6,867,553) | -- |
| Fidelity Biotechnology Portfolio | 6,354,617 | 370,364 | 6,679,877 | 255,422 | 1,085,477 | (1,130,581) | -- |
| Fidelity Brokerage and Investment Management Portfolio | 2,563,433 | 163,789 | 2,614,429 | 123,449 | 273,735 | (386,528) | -- |
| Fidelity Chemicals Portfolio | 2,515,918 | 184,994 | 2,421,986 | 146,153 | 1,494,848 | (1,773,774) | -- |
| Fidelity Commodity Strategy Fund | 14,661,971 | 2,319,760 | 16,690,430 | -- | 92,216 | (383,517) | -- |
| Fidelity Communication Services Portfolio | 4,055,925 | 286,723 | 3,932,748 | 221,748 | (237,375) | (172,525) | -- |
| Fidelity Construction and Housing Portfolio | 3,508,428 | 214,897 | 3,292,924 | 160,007 | 1,650,519 | (2,080,920) | -- |
| Fidelity Consumer Discretionary Portfolio | 48,924,798 | 1,660,084 | 51,133,483 | 807,936 | 15,321,814 | (14,773,213) | -- |
| Fidelity Consumer Staples Portfolio | 35,726,421 | 2,654,657 | 34,238,293 | 2,077,417 | 6,857,616 | (11,000,401) | -- |
| Fidelity Contrafund | 25,982,868 | 7,666,496 | 4,621,142 | 2,262,455 | (43,785) | (2,807,964) | 26,176,473 |
| Fidelity Defense and Aerospace Portfolio | 16,230,339 | 770,448 | 17,727,788 | 500,221 | 4,221,605 | (3,494,604) | -- |
| Fidelity Diversified International Fund | 34,964,806 | 6,676,731 | 4,133,491 | 2,079,491 | (154,862) | (7,074,192) | 30,278,992 |
| Fidelity Emerging Asia Fund | 2,927,113 | 116,667 | 1,046,844 | 55,184 | 261,707 | (597,403) | 1,661,240 |
| Fidelity Emerging Markets Discovery Fund | 5,247,601 | 163,705 | 1,782,991 | 54,524 | 90,468 | (764,941) | 2,953,842 |
| Fidelity Emerging Markets Fund | 21,698,337 | 806,702 | 13,639,940 | 60,624 | 592,156 | (2,058,881) | 7,398,374 |
| Fidelity Energy Portfolio | 28,932,517 | 465,130 | 29,524,424 | -- | 4,023,593 | (3,896,816) | -- |
| Fidelity Equity-Income Fund | 28,181,266 | 7,848,710 | 3,820,672 | 2,545,139 | (198,126) | (4,826,855) | 27,184,323 |
| Fidelity Europe Fund | 13,454,199 | 2,972,239 | 1,624,368 | 1,216,466 | 77,354 | (3,520,832) | 11,358,592 |
| Fidelity Financial Services Portfolio | 57,607,418 | 2,353,187 | 57,933,761 | 1,369,089 | 16,931,172 | (18,958,016) | -- |
| Fidelity Floating Rate High Income Fund | 14,510,876 | 1,754,344 | 913,036 | 675,646 | (4,001) | (666,077) | 14,682,106 |
| Fidelity Global Commodity Stock Fund | 15,082,990 | 2,801,985 | 2,163,962 | 294,630 | 57,311 | (2,315,040) | 13,463,284 |
| Fidelity Health Care Portfolio | 60,650,947 | 3,299,865 | 65,998,126 | 2,227,086 | 12,399,977 | (10,352,663) | -- |
| Fidelity Industrial Equipment Portfolio | 11,598,859 | 1,505,639 | 64,968 | 1,460,154 | 2,792 | (1,562,177) | -- |
| Fidelity Industrials Portfolio | 22,278,587 | 1,919,559 | 33,828,201 | 1,379,612 | 9,648,352 | (11,498,442) | -- |
| Fidelity Inflation-Protected Bond Index Fund Institutional Class | 50,113,381 | 14,246,131 | 14,408,319 | 140,907 | (252,893) | (11,809) | -- |
| Fidelity Inflation-Protected Bond Index Fund Institutional Class | -- | 1,496,800 | 871,436 | 955,118 | (4,218) | (1,468,946) | 48,838,691 |
| Fidelity Institutional Money Market Funds | 8,522,203 | 21,687,338 | 8,879,407 | 350,893 | (41) | 15 | 21,330,108 |
| Fidelity Insurance Portfolio | 6,086,712 | 819,706 | 6,001,998 | 717,946 | 2,473,516 | (3,377,936) | -- |
| Fidelity International Capital Appreciation Fund | 8,063,346 | 1,256,435 | 968,867 | 209,962 | (3,862) | (1,189,062) | 7,157,990 |
| Fidelity International Discovery Fund | 29,098,951 | 4,725,524 | 3,451,915 | 918,948 | (108,631) | (5,623,685) | 24,640,244 |
| Fidelity International Enhanced Index Fund | 26,910,815 | 4,104,039 | 3,162,783 | 545,271 | (49,823) | (4,342,730) | 23,459,518 |
| Fidelity International Small Cap Fund | 15,637,038 | 2,653,959 | 4,712,351 | 641,664 | 654,250 | (3,219,510) | 11,013,386 |
| Fidelity International Small Cap Opportunities Fund | 14,448,234 | 2,172,355 | 3,355,169 | 329,155 | 355,775 | (2,360,569) | 11,260,626 |
| Fidelity International Value Fund | 19,144,694 | 3,030,365 | 2,289,338 | 523,868 | (32,577) | (3,684,485) | 16,168,659 |
| Fidelity Investments Money Market Government Portfolio Institutional Class 2.29% | 5,017,733 | 83,253,662 | 39,421,100 | 309,199 | -- | -- | 48,850,295 |
| Fidelity Japan Fund | -- | 31,791,381 | -- | 111,381 | -- | (2,480,425) | 29,310,956 |
| Fidelity Japan Smaller Companies Fund | 17,538,787 | 9,515,434 | 184,755 | 1,136,458 | 842 | (5,333,972) | 21,536,336 |
| Fidelity Large Cap Value Enhanced Index Fund | -- | 13,688,492 | 850,000 | 752,795 | (23,305) | (1,901,412) | 10,913,775 |
| Fidelity Leisure Portfolio | 3,443,734 | 237,603 | 3,477,157 | 185,234 | (74,262) | (129,918) | -- |
| Fidelity Long Term Treasury Bond Index Fund Institutional Premium | -- | 466,799 | 512,227 | 140,079 | 3,745 | (647,663) | 30,463,870 |
| Fidelity Long-Term Treasury Bond Index Fund Institutional Class | 26,182,740 | 7,830,803 | 2,375,139 | 672,018 | (180,063) | (305,125) | -- |
| Fidelity Low-Priced Stock Fund | 28,413,564 | 7,290,106 | 3,821,045 | 3,286,162 | (271,756) | (6,178,801) | 25,432,068 |
| Fidelity Materials Portfolio | 15,916,471 | 1,014,928 | 15,479,553 | 745,425 | (1,459,942) | 8,096 | -- |
| Fidelity Medical Equipment and Systems Portfolio | 5,299,173 | 322,914 | 5,765,441 | 232,150 | 1,271,429 | (1,128,075) | -- |
| Fidelity Mega Cap Stock Fund | 42,150,387 | 14,659,979 | 6,120,824 | 7,860,148 | (300,555) | (10,584,543) | 39,804,444 |
| Fidelity New Markets Income Fund | 7,358,800 | 872,093 | 456,531 | 332,720 | (16,499) | (892,566) | 6,865,297 |
| Fidelity Overseas Fund | 128,232,790 | 22,086,497 | 31,606,731 | 5,471,422 | 4,258,367 | (25,652,729) | 97,318,194 |
| Fidelity Pacific Basin Fund | 7,115,823 | 1,519,834 | 827,926 | 592,883 | (11,324) | (1,789,618) | 6,006,789 |
| Fidelity Real Estate Investment Portfolio | 17,600,677 | 1,273,019 | 12,708,072 | 236,805 | (1,369,726) | (71,025) | 4,724,873 |
| Fidelity Stock Selector All Cap Fund | -- | 636,428,957 | 29,187,694 | 22,242,504 | (859,580) | (85,741,715) | 520,639,968 |
| Fidelity Technology Portfolio | 134,135,816 | 16,079,137 | 145,777,505 | 13,707,859 | 36,287,258 | (40,724,706) | -- |
| Fidelity Telecommunications Portfolio | 8,355,094 | 261,074 | 8,105,171 | 116,220 | (624,186) | 113,189 | -- |
| Fidelity Transportation Portfolio | 3,580,542 | 221,246 | 3,468,514 | 166,356 | 197,734 | (531,008) | -- |
| Fidelity U.S. Bond Index Fund Institutional Premium Class | 265,768,692 | 81,312,355 | 113,984,193 | 7,304,763 | (3,843,967) | (4,392,389) | 224,860,498 |
| Fidelity Utilities Portfolio | 13,942,184 | 315,409 | 14,261,220 | 65,022 | 235,144 | (231,517) | -- |
| Fidelity Value Discovery Fund | 14,148,254 | 3,116,902 | 1,905,076 | 615,935 | (50,350) | (1,947,748) | 13,361,982 |
| | $1,415,633,511 | $1,040,062,146 | $863,953,688 | $92,659,435 | $116,666,378 | $(329,292,554) | $1,379,115,793 |
(a) Includes the value of shares purchased or redeemed through in-kind transactions, if applicable. See the Notes to Financial Statements for additional details.
Amounts in the income column in the above table include any capital gain distributions from underlying funds, which are presented in the corresponding line-item in the Statement of Operations if applicable.
Investment Valuation
The following is a summary of the inputs used, as of December 31, 2018, involving the Fund's assets and liabilities carried at fair value. The inputs or methodology used for valuing securities may not be an indication of the risk associated with investing in those securities. For more information on valuation inputs, and their aggregation into the levels used below, please refer to the Investment Valuation section in the accompanying Notes to Financial Statements.
| | Valuation Inputs at Reporting Date: |
| Description | Total | Level 1 | Level 2 | Level 3 |
| Investments in Securities: | | | | |
| Equity Funds | $983,224,928 | $983,224,928 | $-- | $-- |
| Fixed-Income Funds | 325,710,462 | 325,710,462 | -- | -- |
| Money Market Funds | 71,886,921 | 71,886,921 | -- | -- |
| Other Short-Term Investments | 1,046,439 | -- | 1,046,439 | -- |
| Total Investments in Securities: | $1,381,868,750 | $1,380,822,311 | $1,046,439 | $-- |
| Derivative Instruments: | | | | |
| Assets | | | | |
| Futures Contracts | $590,197 | $590,197 | $-- | $-- |
| Total Assets | $590,197 | $590,197 | $-- | $-- |
| Liabilities | | | | |
| Futures Contracts | $(12,272) | $(12,272) | $-- | $-- |
| Total Liabilities | $(12,272) | $(12,272) | $-- | $-- |
| Total Derivative Instruments: | $577,925 | $577,925 | $-- | $-- |
Value of Derivative Instruments
The following table is a summary of the Fund's value of derivative instruments by primary risk exposure as of December 31, 2018. For additional information on derivative instruments, please refer to the Derivative Instruments section in the accompanying Notes to Financial Statements.
| Primary Risk Exposure / Derivative Type | Value |
| | Asset | Liability |
| Equity Risk | | |
| Futures Contracts(a) | $590,197 | $(12,272) |
| Total Equity Risk | 590,197 | (12,272) |
| Total Value of Derivatives | $590,197 | $(12,272) |
(a) Reflects gross cumulative appreciation (depreciation) on futures contracts as presented in the Schedule of Investments. In the Statement of Assets and Liabilities, the period end daily variation margin is included in receivable or payable for daily variation margin on futures contracts, and the net cumulative appreciation (depreciation) is included in net unrealized appreciation (depreciation).
See accompanying notes which are an integral part of the financial statements.
VIP FundsManager® 70% Portfolio
Financial Statements
Statement of Assets and Liabilities
| | | December 31, 2018 |
| Assets | | |
Investment in securities, at value — See accompanying schedule:
Unaffiliated issuers (cost $1,046,508) | $1,046,439 | |
| Fidelity Central Funds (cost $1,706,518) | 1,706,518 | |
| Other affiliated issuers (cost $1,507,601,429) | 1,379,115,793 | |
| Total Investment in Securities (cost $1,510,354,455) | | $1,381,868,750 |
| Receivable for investments sold | | 585,243 |
| Receivable for fund shares sold | | 55,292 |
| Distributions receivable from Fidelity Central Funds | | 2,073 |
| Total assets | | 1,382,511,358 |
| Liabilities | | |
| Payable for investments purchased | $11 | |
| Payable for fund shares redeemed | 640,177 | |
| Accrued management fee | 233,977 | |
| Distribution and service plan fees payable | 5,863 | |
| Payable for daily variation margin on futures contracts | 86,245 | |
| Total liabilities | | 966,273 |
| Net Assets | | $1,381,545,085 |
| Net Assets consist of: | | |
| Paid in capital | | $1,319,354,392 |
| Total distributable earnings (loss) | | 62,190,693 |
| Net Assets | | $1,381,545,085 |
| Net Asset Value and Maximum Offering Price | | |
| Service Class: | | |
| Net Asset Value, offering price and redemption price per share ($63,030 ÷ 5,382 shares) | | $11.71 |
| Service Class 2: | | |
| Net Asset Value, offering price and redemption price per share ($46,406,036 ÷ 3,978,211 shares) | | $11.67 |
| Investor Class: | | |
| Net Asset Value, offering price and redemption price per share ($1,335,076,019 ÷ 114,024,428 shares) | | $11.71 |
See accompanying notes which are an integral part of the financial statements.
Statement of Operations
| | | Year ended December 31, 2018 |
| Investment Income | | |
| Dividends: | | |
| Unaffiliated issuers | | $279,398 |
| Affiliated issuers | | 21,798,086 |
| Interest | | 19,318 |
| Income from Fidelity Central Funds | | 29,895 |
| Total income | | 22,126,697 |
| Expenses | | |
| Management fee | $3,740,903 | |
| Distribution and service plan fees | 125,618 | |
| Independent trustees' fees and expenses | 6,953 | |
| Total expenses before reductions | 3,873,474 | |
| Expense reductions | (803,311) | |
| Total expenses after reductions | | 3,070,163 |
| Net investment income (loss) | | 19,056,534 |
| Realized and Unrealized Gain (Loss) | | |
| Net realized gain (loss) on: | | |
| Investment securities: | | |
| Unaffiliated issuers | 2,580,127 | |
| Fidelity Central Funds | 3,371,100 | |
| Other affiliated issuers | 116,666,378 | |
| Futures contracts | 4,741,612 | |
| Capital gain distributions from underlying funds: | | |
| Affiliated issuers | 70,861,349 | |
| Total net realized gain (loss) | | 198,220,566 |
| Change in net unrealized appreciation (depreciation) on: | | |
| Investment securities: | | |
| Unaffiliated issuers | (1,782,403) | |
| Affiliated issuers | (329,292,554) | |
| Futures contracts | 577,925 | |
| Total change in net unrealized appreciation (depreciation) | | (330,497,032) |
| Net gain (loss) | | (132,276,466) |
| Net increase (decrease) in net assets resulting from operations | | $(113,219,932) |
See accompanying notes which are an integral part of the financial statements.
Statement of Changes in Net Assets
| | Year ended December 31, 2018 | Year ended December 31, 2017 |
| Increase (Decrease) in Net Assets | | |
| Operations | | |
| Net investment income (loss) | $19,056,534 | $13,321,959 |
| Net realized gain (loss) | 198,220,566 | 132,697,043 |
| Change in net unrealized appreciation (depreciation) | (330,497,032) | 84,272,124 |
| Net increase (decrease) in net assets resulting from operations | (113,219,932) | 230,291,126 |
| Distributions to shareholders | (146,548,936) | – |
| Distributions to shareholders from net investment income | – | (12,662,563) |
| Distributions to shareholders from net realized gain | – | (9,720,946) |
| Total distributions | (146,548,936) | (22,383,509) |
| Share transactions - net increase (decrease) | 166,190,308 | 90,530,791 |
| Total increase (decrease) in net assets | (93,578,560) | 298,438,408 |
| Net Assets | | |
| Beginning of period | 1,475,123,645 | 1,176,685,237 |
| End of period | $1,381,545,085 | $1,475,123,645 |
| Other Information | | |
| Undistributed net investment income end of period | | $753,546 |
See accompanying notes which are an integral part of the financial statements.
Financial Highlights
VIP FundsManager 70% Portfolio Service Class
| Years ended December 31, | 2018 | 2017 | 2016 | 2015 | 2014 |
| Selected Per–Share Data | | | | | |
| Net asset value, beginning of period | $14.04 | $11.97 | $12.05 | $12.40 | $12.01 |
| Income from Investment Operations | | | | | |
| Net investment income (loss)A | .17 | .13 | .13 | .12 | .15 |
| Net realized and unrealized gain (loss) | (1.13) | 2.16 | .41 | (.06) | .48 |
| Total from investment operations | (.96) | 2.29 | .54 | .06 | .63 |
| Distributions from net investment income | (.13) | (.12) | (.13) | (.12) | (.14) |
| Distributions from net realized gain | (1.24) | (.09) | (.49) | (.29) | (.10) |
| Total distributions | (1.37) | (.22)B | (.62) | (.41) | (.24) |
| Net asset value, end of period | $11.71 | $14.04 | $11.97 | $12.05 | $12.40 |
| Total ReturnC,D | (7.50)% | 19.11% | 5.04% | .41% | 5.24% |
| Ratios to Average Net AssetsE,F,G | | | | | |
| Expenses before reductions | .35% | .35% | .35% | .35% | .35% |
| Expenses net of fee waivers, if any | .20% | .20% | .20% | .20% | .20% |
| Expenses net of all reductions | .20% | .20% | .20% | .20% | .20% |
| Net investment income (loss) | 1.27% | 1.01% | 1.11% | .97% | 1.23% |
| Supplemental Data | | | | | |
| Net assets, end of period (000 omitted) | $63 | $76 | $71 | $72 | $78 |
| Portfolio turnover rateE,H | 98% | 57% | 45% | 44% | 49% |
A Calculated based on average shares outstanding during the period.
B Total distributions of $.22 per share is comprised of distributions from net investment income of $.123 and distributions from net realized gain of $.094 per share.
C Total returns do not reflect charges attributable to your insurance company's separate account. Inclusion of these charges would reduce the total returns shown.
D Total returns would have been lower if certain expenses had not been reduced during the applicable periods shown.
E Amounts do not include the activity of the Underlying Funds.
F Fees and expenses of any underlying Fidelity Central Funds are not included in the Fund's expense ratio. The Fund indirectly bears its proportionate share of the expenses of any underlying Fidelity Central Funds.
G Expense ratios reflect operating expenses of the class. Expenses before reductions do not reflect amounts reimbursed by the investment adviser or reductions from brokerage service arrangements or reductions from other expense offset arrangements and do not represent the amount paid by the class during periods when reimbursements or reductions occur. Expenses net of fee waivers reflect expenses after reimbursement by the investment adviser but prior to reductions from brokerage service arrangements or other expense offset arrangements. Expenses net of all reductions represent the net expenses paid by the class but do not include expenses of the underlying funds in which the Fund invests.
H Amount does not include the portfolio activity of any underlying Fidelity Central Funds.
See accompanying notes which are an integral part of the financial statements.
VIP FundsManager 70% Portfolio Service Class 2
| Years ended December 31, | 2018 | 2017 | 2016 | 2015 | 2014 |
| Selected Per–Share Data | | | | | |
| Net asset value, beginning of period | $13.99 | $11.93 | $12.02 | $12.37 | $11.98 |
| Income from Investment Operations | | | | | |
| Net investment income (loss)A | .15 | .11 | .11 | .10 | .13 |
| Net realized and unrealized gain (loss) | (1.12) | 2.15 | .41 | (.06) | .48 |
| Total from investment operations | (.97) | 2.26 | .52 | .04 | .61 |
| Distributions from net investment income | (.11) | (.10) | (.12) | (.10) | (.13) |
| Distributions from net realized gain | (1.24) | (.09) | (.49) | (.29) | (.10) |
| Total distributions | (1.35) | (.20)B | (.61) | (.39) | (.22)C |
| Net asset value, end of period | $11.67 | $13.99 | $11.93 | $12.02 | $12.37 |
| Total ReturnD,E | (7.60)% | 18.94% | 4.86% | .29% | 5.10% |
| Ratios to Average Net AssetsF,G,H | | | | | |
| Expenses before reductions | .50% | .50% | .50% | .50% | .50% |
| Expenses net of fee waivers, if any | .35% | .35% | .35% | .35% | .35% |
| Expenses net of all reductions | .35% | .35% | .35% | .35% | .35% |
| Net investment income (loss) | 1.13% | .86% | .96% | .82% | 1.08% |
| Supplemental Data | | | | | |
| Net assets, end of period (000 omitted) | $46,406 | $48,977 | $38,443 | $12,028 | $7,610 |
| Portfolio turnover rateF,I | 98% | 57% | 45% | 44% | 49% |
A Calculated based on average shares outstanding during the period.
B Total distributions of $.20 per share is comprised of distributions from net investment income of $.104 and distributions from net realized gain of $.094 per share.
C Total distributions of $.22 per share is comprised of distributions from net investment income of $.126 and distributions from net realized gain of $.097 per share.
D Total returns do not reflect charges attributable to your insurance company's separate account. Inclusion of these charges would reduce the total returns shown.
E Total returns would have been lower if certain expenses had not been reduced during the applicable periods shown.
F Amounts do not include the activity of the Underlying Funds.
G Fees and expenses of any underlying Fidelity Central Funds are not included in the Fund's expense ratio. The Fund indirectly bears its proportionate share of the expenses of any underlying Fidelity Central Funds.
H Expense ratios reflect operating expenses of the class. Expenses before reductions do not reflect amounts reimbursed by the investment adviser or reductions from brokerage service arrangements or reductions from other expense offset arrangements and do not represent the amount paid by the class during periods when reimbursements or reductions occur. Expenses net of fee waivers reflect expenses after reimbursement by the investment adviser but prior to reductions from brokerage service arrangements or other expense offset arrangements. Expenses net of all reductions represent the net expenses paid by the class but do not include expenses of the underlying funds in which the Fund invests.
I Amount does not include the portfolio activity of any underlying Fidelity Central Funds.
See accompanying notes which are an integral part of the financial statements.
VIP FundsManager 70% Portfolio Investor Class
| Years ended December 31, | 2018 | 2017 | 2016 | 2015 | 2014 |
| Selected Per–Share Data | | | | | |
| Net asset value, beginning of period | $14.04 | $11.96 | $12.05 | $12.39 | $12.01 |
| Income from Investment Operations | | | | | |
| Net investment income (loss)A | .17 | .13 | .13 | .12 | .15 |
| Net realized and unrealized gain (loss) | (1.13) | 2.17 | .40 | (.05) | .47 |
| Total from investment operations | (.96) | 2.30 | .53 | .07 | .62 |
| Distributions from net investment income | (.13) | (.12) | (.13) | (.12) | (.14) |
| Distributions from net realized gain | (1.24) | (.09) | (.49) | (.29) | (.10) |
| Total distributions | (1.37) | (.22)B | (.62) | (.41) | (.24) |
| Net asset value, end of period | $11.71 | $14.04 | $11.96 | $12.05 | $12.39 |
| Total ReturnC,D | (7.49)% | 19.21% | 4.96% | .49% | 5.15% |
| Ratios to Average Net AssetsE,F,G | | | | | |
| Expenses before reductions | .25% | .25% | .25% | .25% | .25% |
| Expenses net of fee waivers, if any | .20% | .20% | .20% | .20% | .20% |
| Expenses net of all reductions | .20% | .20% | .20% | .20% | .20% |
| Net investment income (loss) | 1.28% | 1.01% | 1.11% | .97% | 1.23% |
| Supplemental Data | | | | | |
| Net assets, end of period (000 omitted) | $1,335,076 | $1,426,071 | $1,138,172 | $1,096,702 | $1,019,291 |
| Portfolio turnover rateE,H | 98% | 57% | 45% | 44% | 49% |
A Calculated based on average shares outstanding during the period.
B Total distributions of $.22 per share is comprised of distributions from net investment income of $.123 and distributions from net realized gain of $.094 per share.
C Total returns do not reflect charges attributable to your insurance company's separate account. Inclusion of these charges would reduce the total returns shown.
D Total returns would have been lower if certain expenses had not been reduced during the applicable periods shown.
E Amounts do not include the activity of the Underlying Funds.
F Fees and expenses of any underlying Fidelity Central Funds are not included in the Fund's expense ratio. The Fund indirectly bears its proportionate share of the expenses of any underlying Fidelity Central Funds.
G Expense ratios reflect operating expenses of the class. Expenses before reductions do not reflect amounts reimbursed by the investment adviser or reductions from brokerage service arrangements or reductions from other expense offset arrangements and do not represent the amount paid by the class during periods when reimbursements or reductions occur. Expenses net of fee waivers reflect expenses after reimbursement by the investment adviser but prior to reductions from brokerage service arrangements or other expense offset arrangements. Expenses net of all reductions represent the net expenses paid by the class but do not include expenses of the underlying funds in which the Fund invests.
H Amount does not include the portfolio activity of any underlying Fidelity Central Funds.
See accompanying notes which are an integral part of the financial statements.
VIP FundsManager® 85% Portfolio
Investment Summary (Unaudited)
The information in the following tables is based on the direct investments of the Fund.
Top Holdings as of December 31, 2018
| | % of fund's net assets |
| Fidelity Stock Selector All Cap Fund | 46.6 |
| Fidelity Overseas Fund | 8.7 |
| Fidelity U.S. Bond Index Fund Institutional Premium Class | 5.5 |
| Fidelity Mega Cap Stock Fund | 3.4 |
| Fidelity Inflation-Protected Bond Index Fund Institutional Premium Class | 3.2 |
| Fidelity Japan Fund | 3.0 |
| Fidelity Diversified International Fund | 2.7 |
| Fidelity Equity-Income Fund | 2.3 |
| Fidelity Long Term Treasury Bond Index Fund Institutional Premium | 2.2 |
| Fidelity Contrafund | 2.2 |
| | 79.8 |
Asset Allocation (% of fund's net assets)
| Period end* |
| | Domestic Equity Funds | 60.7% |
| | International Equity Funds | 26.8% |
| | Bond Funds | 12.0% |
| | Short-Term Funds | 0.4% |
| | Short-Term Investments | 0.1% |

* Futures - (1.1)%
VIP FundsManager® 85% Portfolio
Schedule of Investments December 31, 2018
Showing Percentage of Net Assets
| Equity Funds - 87.5% | | | |
| | | Shares | Value |
| Fidelity Contrafund (a) | | 991,040 | $10,911,353 |
| Fidelity Diversified International Fund (a) | | 424,096 | 13,422,645 |
| Fidelity Emerging Asia Fund (a) | | 21,697 | 802,584 |
| Fidelity Emerging Markets Discovery Fund (a) | | 49,865 | 609,850 |
| Fidelity Emerging Markets Fund (a) | | 39,021 | 1,039,125 |
| Fidelity Equity-Income Fund (a) | | 222,778 | 11,348,316 |
| Fidelity Europe Fund (a) | | 169,317 | 5,316,539 |
| Fidelity Global Commodity Stock Fund (a) | | 432,394 | 4,842,808 |
| Fidelity International Capital Appreciation Fund (a) | | 178,370 | 3,180,337 |
| Fidelity International Discovery Fund (a) | | 298,116 | 10,872,288 |
| Fidelity International Enhanced Index Fund (a) | | 1,218,531 | 10,296,585 |
| Fidelity International Small Cap Fund (a) | | 208,617 | 4,942,145 |
| Fidelity International Small Cap Opportunities Fund (a) | | 307,310 | 4,959,991 |
| Fidelity International Value Fund (a) | | 967,874 | 7,036,441 |
| Fidelity Japan Fund (a) | | 1,106,718 | 14,509,068 |
| Fidelity Japan Smaller Companies Fund (a) | | 617,478 | 9,348,619 |
| Fidelity Large Cap Value Enhanced Index Fund (a) | | 627,095 | 7,155,153 |
| Fidelity Low-Priced Stock Fund (a) | | 243,933 | 10,584,251 |
| Fidelity Mega Cap Stock Fund (a) | | 1,227,589 | 16,584,723 |
| Fidelity Overseas Fund (a) | | 1,045,487 | 42,739,512 |
| Fidelity Pacific Basin Fund (a) | | 106,478 | 2,802,500 |
| Fidelity Real Estate Investment Portfolio (a) | | 53,240 | 2,044,945 |
| Fidelity Stock Selector All Cap Fund (a) | | 5,954,795 | 228,842,766 |
| Fidelity Value Discovery Fund (a) | | 220,395 | 5,545,150 |
| TOTAL EQUITY FUNDS | | | |
| (Cost $488,131,513) | | | 429,737,694 |
|
| Fixed-Income Funds - 12.0% | | | |
| Fidelity Floating Rate High Income Fund (a) | | 585,402 | 5,385,696 |
| Fidelity Inflation-Protected Bond Index Fund Institutional Premium Class (a) | | 1,631,529 | 15,483,207 |
| Fidelity Long Term Treasury Bond Index Fund Institutional Premium (a) | | 862,539 | 10,936,994 |
| Fidelity U.S. Bond Index Fund Institutional Premium Class (a) | | 2,402,553 | 27,100,800 |
| TOTAL FIXED-INCOME FUNDS | | | |
| (Cost $58,842,949) | | | 58,906,697 |
|
| Money Market Funds - 0.4% | | | |
| Fidelity Cash Central Fund, 2.42% (b) | | 1,736,679 | 1,737,026 |
| Fidelity Investments Money Market Government Portfolio Institutional Class 2.29% (a)(c) | | 166,257 | 166,257 |
| TOTAL MONEY MARKET FUNDS | | | |
| (Cost $1,903,224) | | | 1,903,283 |
| | | Principal Amount | Value |
|
| U.S. Treasury Obligations - 0.1% | | | |
| U.S. Treasury Bills, yield at date of purchase 2.31% to 2.37% 2/7/19 to 3/21/19 (d) | | | |
| (Cost $517,961) | | 520,000 | 517,944 |
| TOTAL INVESTMENT IN SECURITIES - 100.0% | | | |
| (Cost $549,395,647) | | | 491,065,618 |
| NET OTHER ASSETS (LIABILITIES) - 0.0% | | | (155,599) |
| NET ASSETS - 100% | | | $490,910,019 |
| Futures Contracts | | | | | |
| | Number of contracts | Expiration Date | Notional Amount | Value | Unrealized Appreciation/(Depreciation) |
| Purchased | | | | | |
| Equity Index Contracts | | | | | |
| ICE E-mini MSCI Emerging Markets Index Contracts (United States) | 54 | March 2019 | $2,610,360 | $(15,444) | $(15,444) |
| Sold | | | | | |
| Equity Index Contracts | | | | | |
| CME E-mini S&P 500 Index Contracts (United States) | 61 | March 2019 | 7,640,860 | 439,049 | 439,049 |
| TOTAL FUTURES CONTRACTS | | | | | $423,605 |
The notional amount of futures purchased as a percentage of Net Assets is 0.5%
The notional amount of futures sold as a percentage of Net Assets is 1.6%
For the period, the average monthly underlying face amount at value for futures contracts in the aggregate was $6,082,616.
Legend
(a) Affiliated Fund
(b) Affiliated fund that is generally available only to investment companies and other accounts managed by Fidelity Investments. The rate quoted is the annualized seven-day yield of the fund at period end. A complete unaudited listing of the fund's holdings as of its most recent quarter end is available upon request. In addition, each Fidelity Central Fund's financial statements, which are not covered by the Fund's Report of Independent Registered Public Accounting Firm, are available on the SEC's website or upon request.
(c) The rate quoted is the annualized seven-day yield of the fund at period end.
(d) Security or a portion of the security was pledged to cover margin requirements for futures contracts. At period end, the value of securities pledged amounted to $279,184.
Affiliated Central Funds
Information regarding fiscal year to date income earned by the Fund from investments in Fidelity Central Funds is as follows:
| Fund | Income earned |
| Fidelity Cash Central Fund | $21,989 |
| Total | $21,989 |
Amounts in the income column in the above table include any capital gain distributions from underlying funds, which are presented in the corresponding line-item in the Statement of Operations if applicable.
Fiscal year to date information regarding the Fund’s investments in non-Money Market Central Funds, including the ownership percentage, is presented below.
| Affiliate | Value, beginning of period | Purchases(a) | Sales Proceeds(a) | Realized Gain (loss) | Change in Unrealized appreciation (depreciation) | Value, end of period | % ownership, end of period |
| Fidelity Consumer Discretionary Central Fund | $-- | $27,692,943 | $27,922,295 | $229,352 | $-- | $-- | 0.0% |
| Fidelity Consumer Staples Central Fund | -- | 15,299,989 | 15,429,457 | 129,468 | -- | -- | 0.0% |
| Fidelity Energy Central Fund | -- | 13,209,918 | 13,346,558 | 136,640 | -- | -- | 0.0% |
| Fidelity Financials Central Fund | -- | 40,267,335 | 40,471,405 | 204,070 | -- | -- | 0.0% |
| Fidelity Health Care Central Fund | -- | 35,171,979 | 35,288,177 | 116,198 | -- | -- | 0.0% |
| Fidelity Industrials Central Fund | -- | 26,520,581 | 26,786,958 | 266,377 | -- | -- | 0.0% |
| Fidelity Information Technology Central Fund | -- | 65,165,061 | 65,401,978 | 236,917 | -- | -- | 0.0% |
| Fidelity Materials Central Fund | -- | 7,976,736 | 8,058,793 | 82,057 | -- | -- | 0.0% |
| Fidelity Telecom Services Central Fund | -- | 3,705,101 | 3,759,136 | 54,035 | -- | -- | 0.0% |
| Fidelity Utilities Central Fund | -- | 6,416,927 | 6,498,005 | 81,078 | -- | -- | 0.0% |
| | $-- | $241,426,570 | $242,962,762 | $1,536,192 | $-- | $-- | |
(a) Includes the value of shares purchased or redeemed through in-kind transactions, if applicable. See the Notes to Financial Statements for additional details.
Amounts in the income column in the above table include any capital gain distributions from underlying funds, which are presented in the corresponding line-item in the Statement of Operations if applicable.
Affiliated Underlying Funds
Fiscal year to date information regarding the Fund's investments in affiliated Underlying Funds, excluding any Money Market Central Funds, is presented below. Exchanges between classes of the same affiliated Underlying Funds may occur.
| Affiliate | Value, beginning of period | Purchases(a) | Sales Proceeds(a) | Dividend Income | Realized Gain (loss) | Change in Unrealized appreciation (depreciation) | Value, end of period |
| Fidelity Air Transportation Portfolio | $2,070,849 | $173,013 | $2,020,421 | $110,174 | $(471) | $(222,970) | $-- |
| Fidelity Banking Portfolio | 4,912,947 | 540,522 | 5,063,228 | 373,452 | 2,570,062 | (2,960,303) | -- |
| Fidelity Biotechnology Portfolio | 2,749,582 | 212,842 | 2,939,380 | 112,671 | 442,671 | (465,715) | -- |
| Fidelity Brokerage and Investment management Portfolio | 1,092,950 | 89,865 | 1,133,020 | 53,596 | 114,835 | (164,630) | -- |
| Fidelity Chemicals Portfolio | 1,038,722 | 95,949 | 1,017,440 | 61,495 | 340,854 | (458,085) | -- |
| Fidelity Commodity Strategy Fund | 5,177,087 | 1,895,135 | 6,937,847 | -- | (6,402) | (127,973) | -- |
| Fidelity Communication Services Portfolio | 1,774,584 | 154,277 | 1,746,010 | 98,691 | (103,320) | (79,531) | -- |
| Fidelity Construction and Housing Portfolio | 1,541,447 | 118,051 | 1,468,365 | 71,533 | (236,270) | 45,137 | -- |
| Fidelity Consumer Discretionary Portfolio | 21,631,752 | 1,440,713 | 23,291,655 | 370,571 | 7,523,616 | (7,304,426) | -- |
| Fidelity Consumer Staples Portfolio | 15,802,762 | 1,552,390 | 15,488,896 | 945,147 | 1,801,483 | (3,667,739) | -- |
| Fidelity Contrafund | 11,487,804 | 3,370,335 | 2,773,207 | 956,072 | (25,803) | (1,147,776) | 10,911,353 |
| Fidelity Defense and Aerospace Portfolio | 7,146,864 | 461,846 | 7,926,425 | 224,171 | 1,779,393 | (1,461,678) | -- |
| Fidelity Diversified International Fund | 14,697,502 | 4,570,521 | 2,755,767 | 923,587 | (107,583) | (2,982,028) | 13,422,645 |
| Fidelity Emerging Asia Fund | 1,305,968 | 84,192 | 424,323 | 26,661 | 120,535 | (283,788) | 802,584 |
| Fidelity Emerging Markets Discovery Fund | 2,339,352 | 112,222 | 1,642,775 | 11,257 | (23,596) | (175,353) | 609,850 |
| Fidelity Emerging Markets Fund | 9,654,078 | 526,430 | 8,776,574 | 8,515 | 567,771 | (932,580) | 1,039,125 |
| Fidelity Energy Portfolio | 12,678,515 | 604,551 | 13,363,233 | -- | 1,706,635 | (1,626,468) | -- |
| Fidelity Equity-Income Fund | 12,252,712 | 3,710,416 | 2,473,326 | 1,096,032 | (121,361) | (2,020,125) | 11,348,316 |
| Fidelity Europe Fund | 5,584,434 | 1,965,771 | 664,754 | 570,632 | 7,630 | (1,576,542) | 5,316,539 |
| Fidelity Financial Services Portfolio | 25,342,798 | 1,801,790 | 26,209,229 | 623,314 | 5,601,829 | (6,537,188) | -- |
| Fidelity Floating Rate High Income Fund | 7,552,468 | 3,481,125 | 5,410,759 | 252,858 | 124,571 | (361,709) | 5,385,696 |
| Fidelity Focused High Income Fund | 3,788 | 67 | 3,737 | 78 | 138 | (256) | -- |
| Fidelity Global Commodity Stock Fund | 5,378,234 | 1,863,699 | 1,611,648 | 106,301 | 53,003 | (840,480) | 4,842,808 |
| Fidelity Health Care Portfolio | 26,796,811 | 2,371,140 | 30,066,931 | 1,022,096 | 7,969,544 | (7,070,564) | -- |
| Fidelity Industrial Equipment Portfolio | 5,092,739 | 683,420 | 15,447 | 646,483 | (769) | (337,637) | -- |
| Fidelity Industrials Portfolio | 9,805,105 | 1,319,064 | 15,349,169 | 631,020 | 4,289,358 | (5,486,664) | -- |
| Fidelity Inflation-Protected Bond Index Fund Institutional Class | 2,591,763 | 15,098,854 | 1,714,284 | 29,957 | (23,805) | (33,478) | -- |
| Fidelity Inflation-Protected Bond Index Fund Premium Class | -- | 396,658 | 492,427 | 302,562 | (5,757) | (334,317) | 15,483,207 |
| Fidelity Insurance Portfolio | 2,663,128 | 407,874 | 2,668,373 | 319,963 | 1,048,913 | (1,451,542) | -- |
| Fidelity International Capital Appreciation Fund | 3,383,963 | 917,864 | 617,637 | 93,442 | (3,276) | (500,577) | 3,180,337 |
| Fidelity International Discovery Fund | 12,176,860 | 3,420,548 | 2,292,051 | 406,271 | (93,291) | (2,339,778) | 10,872,288 |
| Fidelity International Enhanced Index Fund | 11,318,749 | 3,061,940 | 2,239,816 | 239,800 | (30,996) | (1,813,292) | 10,296,585 |
| Fidelity International Small Cap Fund | 6,577,820 | 1,883,740 | 2,415,982 | 288,560 | 75,407 | (1,178,840) | 4,942,145 |
| Fidelity International Small Cap Opportunities Fund | 6,083,243 | 1,603,343 | 1,881,485 | 145,282 | 133,421 | (978,531) | 4,959,991 |
| Fidelity International Value Fund | 8,010,399 | 2,216,192 | 1,622,194 | 228,460 | (35,139) | (1,532,817) | 7,036,441 |
| Fidelity Investments Money Market Government Portfolio Institutional Class 2.29% | -- | 7,806,503 | 7,640,246 | 23,207 | -- | -- | 166,257 |
| Fidelity Japan Fund | -- | 15,735,135 | -- | 55,134 | -- | (1,226,067) | 14,509,068 |
| Fidelity Japan Smaller Companies Fund | 7,341,195 | 4,394,081 | 65,376 | 493,320 | (55) | (2,321,226) | 9,348,619 |
| Fidelity Large Cap Value Enhanced Index Fund | -- | 9,593,538 | 1,160,000 | 493,538 | (31,805) | (1,246,580) | 7,155,153 |
| Fidelity Leisure Portfolio | 1,481,606 | 125,730 | 1,517,973 | 81,025 | (21,170) | (68,193) | -- |
| Fidelity Long Term Treasury Bond Index Fund Institutional Premium | -- | 116,304 | 328,215 | 50,540 | (10,521) | (84,068) | 10,936,994 |
| Fidelity Long-Term Treasury Bond Index Fund Institutional Class | 8,820,548 | 3,707,176 | 992,941 | 237,289 | (57,468) | (233,821) | -- |
| Fidelity Low-Priced Stock Fund | 12,393,825 | 3,551,960 | 2,573,333 | 1,437,570 | (199,443) | (2,588,758) | 10,584,251 |
| Fidelity Materials Portfolio | 7,040,928 | 680,469 | 7,059,976 | 343,229 | (697,971) | 36,550 | -- |
| Fidelity Medical Equipment and Systems Portfolio | 2,335,897 | 184,781 | 2,582,821 | 104,242 | 585,083 | (522,940) | -- |
| Fidelity Mega Cap Stock Fund | 18,458,585 | 6,878,708 | 4,113,319 | 3,408,812 | (218,819) | (4,420,432) | 16,584,723 |
| Fidelity Overseas Fund | 54,118,389 | 16,291,878 | 18,687,332 | 2,412,015 | 2,228,538 | (11,211,961) | 42,739,512 |
| Fidelity Pacific Basin Fund | 2,990,711 | 1,007,206 | 392,205 | 277,226 | (10,902) | (792,310) | 2,802,500 |
| Fidelity Real Estate Investment Portfolio | 7,727,591 | 786,767 | 5,843,625 | 104,271 | (629,198) | 3,410 | 2,044,945 |
| Fidelity Stock Selector All Cap Fund | -- | 285,638,481 | 18,582,593 | 9,767,861 | (620,418) | (37,592,704) | 228,842,766 |
| Fidelity Technology Portfolio | 59,231,269 | 8,819,692 | 65,939,940 | 6,229,852 | 16,280,622 | (18,391,643) | -- |
| Fidelity Telecommunications Portfolio | 3,698,240 | 287,118 | 3,751,862 | 54,662 | (299,467) | 65,971 | -- |
| Fidelity Transportation Portfolio | 1,555,377 | 121,101 | 1,529,528 | 73,518 | 181,085 | (328,035) | -- |
| Fidelity U.S. Bond Index Fund Institutional Class | 37,856,867 | 10,991,580 | 19,292,155 | 959,518 | (951,429) | (986,433) | -- |
| Fidelity U.S. Bond Index Fund Institutional Premium Class | -- | 426,594 | 1,559,019 | 122,218 | (34,726) | 649,521 | 27,100,800 |
| Fidelity Utilities Portfolio | 6,137,965 | 351,167 | 6,498,617 | 29,931 | 61,575 | (52,090) | -- |
| Fidelity Value Discovery Fund | 6,214,544 | 1,420,064 | 1,240,259 | 263,789 | (34,808) | (814,391) | 5,545,150 |
| | $505,121,316 | $441,122,392 | $367,869,150 | $38,373,471 | $50,972,533 | $(140,536,443) | $488,810,648 |
(a) Includes the value of shares purchased or redeemed through in-kind transactions, if applicable. See the Notes to Financial Statements for additional details.
Amounts in the income column in the above table include any capital gain distributions from underlying funds, which are presented in the corresponding line-item in the Statement of Operations if applicable.
Investment Valuation
The following is a summary of the inputs used, as of December 31, 2018, involving the Fund's assets and liabilities carried at fair value. The inputs or methodology used for valuing securities may not be an indication of the risk associated with investing in those securities. For more information on valuation inputs, and their aggregation into the levels used below, please refer to the Investment Valuation section in the accompanying Notes to Financial Statements.
| | Valuation Inputs at Reporting Date: |
| Description | Total | Level 1 | Level 2 | Level 3 |
| Investments in Securities: | | | | |
| Equity Funds | $429,737,694 | $429,737,694 | $-- | $-- |
| Fixed-Income Funds | 58,906,697 | 58,906,697 | -- | -- |
| Money Market Funds | 1,903,283 | 1,903,283 | -- | -- |
| Other Short-Term Investments | 517,944 | -- | 517,944 | -- |
| Total Investments in Securities: | $491,065,618 | $490,547,674 | $517,944 | $-- |
| Derivative Instruments: | | | | |
| Assets | | | | |
| Futures Contracts | $439,049 | $439,049 | $-- | $-- |
| Total Assets | $439,049 | $439,049 | $-- | $-- |
| Liabilities | | | | |
| Futures Contracts | $(15,444) | $(15,444) | $-- | $-- |
| Total Liabilities | $(15,444) | $(15,444) | $-- | $-- |
| Total Derivative Instruments: | $423,605 | $423,605 | $-- | $-- |
Value of Derivative Instruments
The following table is a summary of the Fund's value of derivative instruments by primary risk exposure as of December 31, 2018. For additional information on derivative instruments, please refer to the Derivative Instruments section in the accompanying Notes to Financial Statements.
| Primary Risk Exposure / Derivative Type | Value |
| | Asset | Liability |
| Equity Risk | | |
| Futures Contracts(a) | $439,049 | $(15,444) |
| Total Equity Risk | 439,049 | (15,444) |
| Total Value of Derivatives | $439,049 | $(15,444) |
(a) Reflects gross cumulative appreciation (depreciation) on futures contracts as presented in the Schedule of Investments. In the Statement of Assets and Liabilities, the period end daily variation margin is included in receivable or payable for daily variation margin on futures contracts, and the net cumulative appreciation (depreciation) is included in net unrealized appreciation (depreciation).
See accompanying notes which are an integral part of the financial statements.
VIP FundsManager® 85% Portfolio
Financial Statements
Statement of Assets and Liabilities
| | | December 31, 2018 |
| Assets | | |
Investment in securities, at value — See accompanying schedule:
Unaffiliated issuers (cost $517,961) | $517,944 | |
| Fidelity Central Funds (cost $1,736,967) | 1,737,026 | |
| Other affiliated issuers (cost $547,140,719) | 488,810,648 | |
| Total Investment in Securities (cost $549,395,647) | | $491,065,618 |
| Segregated cash with brokers for derivative instruments | | 230,113 |
| Cash | | 105,625 |
| Receivable for investments sold | | 21,240 |
| Receivable for fund shares sold | | 41,259 |
| Distributions receivable from Fidelity Central Funds | | 2,634 |
| Total assets | | 491,466,489 |
| Liabilities | | |
| Payable for investments purchased | $261,717 | |
| Payable for fund shares redeemed | 139,104 | |
| Accrued management fee | 83,639 | |
| Distribution and service plan fees payable | 4,000 | |
| Payable for daily variation margin on futures contracts | 68,010 | |
| Total liabilities | | 556,470 |
| Net Assets | | $490,910,019 |
| Net Assets consist of: | | |
| Paid in capital | | $465,450,573 |
| Total distributable earnings (loss) | | 25,459,446 |
| Net Assets | | $490,910,019 |
| Net Asset Value and Maximum Offering Price | | |
| Service Class: | | |
| Net Asset Value, offering price and redemption price per share ($276 ÷ 23.7 shares) | | $11.65 |
| Service Class 2: | | |
| Net Asset Value, offering price and redemption price per share ($31,555,392 ÷ 2,722,192.3 shares) | | $11.59 |
| Investor Class: | | |
| Net Asset Value, offering price and redemption price per share ($459,354,351 ÷ 39,409,888.5 shares) | | $11.66 |
See accompanying notes which are an integral part of the financial statements.
Statement of Operations
| | | Year ended December 31, 2018 |
| Investment Income | | |
| Dividends: | | |
| Unaffiliated issuers | | $104,693 |
| Affiliated issuers | | 6,914,641 |
| Interest | | 5,804 |
| Income from Fidelity Central Funds | | 21,989 |
| Total income | | 7,047,127 |
| Expenses | | |
| Management fee | $1,370,055 | |
| Distribution and service plan fees | 85,506 | |
| Independent trustees' fees and expenses | 2,546 | |
| Total expenses before reductions | 1,458,107 | |
| Expense reductions | (310,084) | |
| Total expenses after reductions | | 1,148,023 |
| Net investment income (loss) | | 5,899,104 |
| Realized and Unrealized Gain (Loss) | | |
| Net realized gain (loss) on: | | |
| Investment securities: | | |
| Unaffiliated issuers | 918,032 | |
| Fidelity Central Funds | 1,536,124 | |
| Other affiliated issuers | 50,972,533 | |
| Futures contracts | 732,396 | |
| Capital gain distributions from underlying funds: | | |
| Affiliated issuers | 31,458,830 | |
| Total net realized gain (loss) | | 85,617,915 |
| Change in net unrealized appreciation (depreciation) on: | | |
| Investment securities: | | |
| Unaffiliated issuers | (635,144) | |
| Fidelity Central Funds | 59 | |
| Other affiliated issuers | (140,536,443) | |
| Futures contracts | 423,605 | |
| Total change in net unrealized appreciation (depreciation) | | (140,747,923) |
| Net gain (loss) | | (55,130,008) |
| Net increase (decrease) in net assets resulting from operations | | $(49,230,904) |
See accompanying notes which are an integral part of the financial statements.
Statement of Changes in Net Assets
| | Year ended December 31, 2018 | Year ended December 31, 2017 |
| Increase (Decrease) in Net Assets | | |
| Operations | | |
| Net investment income (loss) | $5,899,104 | $3,835,244 |
| Net realized gain (loss) | 85,617,915 | 55,274,276 |
| Change in net unrealized appreciation (depreciation) | (140,747,923) | 38,870,529 |
| Net increase (decrease) in net assets resulting from operations | (49,230,904) | 97,980,049 |
| Distributions to shareholders | (56,714,400) | – |
| Distributions to shareholders from net investment income | – | (3,643,445) |
| Distributions to shareholders from net realized gain | – | (4,663,732) |
| Total distributions | (56,714,400) | (8,307,177) |
| Share transactions - net increase (decrease) | 70,482,604 | 4,657,475 |
| Total increase (decrease) in net assets | (35,462,700) | 94,330,347 |
| Net Assets | | |
| Beginning of period | 526,372,719 | 432,042,372 |
| End of period | $490,910,019 | $526,372,719 |
| Other Information | | |
| Undistributed net investment income end of period | | $191,799 |
See accompanying notes which are an integral part of the financial statements.
Financial Highlights
VIP FundsManager 85% Portfolio Service Class
| Years ended December 31, | 2018 | 2017 | 2016 | 2015 | 2014 |
| Selected Per–Share Data | | | | | |
| Net asset value, beginning of period | $14.30 | $11.81 | $11.87 | $12.46 | $12.07 |
| Income from Investment Operations | | | | | |
| Net investment income (loss)A | .15 | .11 | .11 | .09 | .13 |
| Net realized and unrealized gain (loss) | (1.29) | 2.61 | .48 | (.03) | .51 |
| Total from investment operations | (1.14) | 2.72 | .59 | .06 | .64 |
| Distributions from net investment income | (.10) | (.10) | (.11) | (.16)B | (.13) |
| Distributions from net realized gain | (1.41) | (.13) | (.54) | (.49)B | (.13) |
| Total distributions | (1.51) | (.23) | (.65) | (.65) | (.25)C |
| Net asset value, end of period | $11.65 | $14.30 | $11.81 | $11.87 | $12.46 |
| Total ReturnD,E | (8.90)% | 23.05% | 5.66% | .39% | 5.29% |
| Ratios to Average Net AssetsF,G,H | | | | | |
| Expenses before reductions | .33%I | .35% | .35% | .35% | .35% |
| Expenses net of fee waivers, if any | .17%I | .20% | .20% | .20% | .20% |
| Expenses net of all reductions | .17%I | .20% | .20% | .20% | .20% |
| Net investment income (loss) | 1.11% | .81% | .96% | .74% | 1.04% |
| Supplemental Data | | | | | |
| Net assets, end of period (000 omitted) | $– | $2 | $8 | $8 | $8 |
| Portfolio turnover rateF,J | 116% | 70% | 59% | 67% | 72% |
A Calculated based on average shares outstanding during the period.
B The amounts shown reflect certain reclassifications related to book to tax differences that were made in the year shown.
C Total distributions of $.25 per share is comprised of distributions from net investment income of $.125 and distributions from net realized gain of $.126 per share.
D Total returns do not reflect charges attributable to your insurance company's separate account. Inclusion of these charges would reduce the total returns shown.
E Total returns would have been lower if certain expenses had not been reduced during the applicable periods shown.
F Amounts do not include the activity of the Underlying Funds.
G Fees and expenses of any underlying Fidelity Central Funds are not included in the Fund's expense ratio. The Fund indirectly bears its proportionate share of the expenses of any underlying Fidelity Central Funds.
H Expense ratios reflect operating expenses of the class. Expenses before reductions do not reflect amounts reimbursed by the investment adviser or reductions from brokerage service arrangements or reductions from other expense offset arrangements and do not represent the amount paid by the class during periods when reimbursements or reductions occur. Expenses net of fee waivers reflect expenses after reimbursement by the investment adviser but prior to reductions from brokerage service arrangements or other expense offset arrangements. Expenses net of all reductions represent the net expenses paid by the class but do not include expenses of the underlying funds in which the Fund invests.
I On certain classes, the size and fluctuation of net assets and expense amounts may cause ratios to differ from contractual rates.
J Amount does not include the portfolio activity of any underlying Fidelity Central Funds.
See accompanying notes which are an integral part of the financial statements.
VIP FundsManager 85% Portfolio Service Class 2
| Years ended December 31, | 2018 | 2017 | 2016 | 2015 | 2014 |
| Selected Per–Share Data | | | | | |
| Net asset value, beginning of period | $14.24 | $11.76 | $11.83 | $12.41 | $12.03 |
| Income from Investment Operations | | | | | |
| Net investment income (loss)A | .12 | .09 | .09 | .07 | .11 |
| Net realized and unrealized gain (loss) | (1.28) | 2.60 | .47 | (.01) | .50 |
| Total from investment operations | (1.16) | 2.69 | .56 | .06 | .61 |
| Distributions from net investment income | (.09) | (.08) | (.09) | (.15)B | (.11) |
| Distributions from net realized gain | (1.41) | (.13) | (.54) | (.49)B | (.13) |
| Total distributions | (1.49)C | (.21) | (.63) | (.64) | (.23)D |
| Net asset value, end of period | $11.59 | $14.24 | $11.76 | $11.83 | $12.41 |
| Total ReturnE,F | (9.08)% | 22.90% | 5.47% | .35% | 5.08% |
| Ratios to Average Net AssetsG,H,I | | | | | |
| Expenses before reductions | .50% | .50% | .50% | .50% | .50% |
| Expenses net of fee waivers, if any | .35% | .35% | .35% | .35% | .35% |
| Expenses net of all reductions | .35% | .35% | .35% | .35% | .35% |
| Net investment income (loss) | .93% | .66% | .81% | .59% | .89% |
| Supplemental Data | | | | | |
| Net assets, end of period (000 omitted) | $31,555 | $33,540 | $24,790 | $10,346 | $8,207 |
| Portfolio turnover rateG,J | 116% | 70% | 59% | 67% | 72% |
A Calculated based on average shares outstanding during the period.
B The amounts shown reflect certain reclassifications related to book to tax differences that were made in the year shown.
C Total distributions of $1.49 per share is comprised of distributions from net investment income of $.085 and distributions from net realized gain of $1.409 per share.
D Total distributions of $.23 per share is comprised of distributions from net investment income of $.107 and distributions from net realized gain of $.126 per share.
E Total returns do not reflect charges attributable to your insurance company's separate account. Inclusion of these charges would reduce the total returns shown.
F Total returns would have been lower if certain expenses had not been reduced during the applicable periods shown.
G Amounts do not include the activity of the Underlying Funds.
H Fees and expenses of any underlying Fidelity Central Funds are not included in the Fund's expense ratio. The Fund indirectly bears its proportionate share of the expenses of any underlying Fidelity Central Funds.
I Expense ratios reflect operating expenses of the class. Expenses before reductions do not reflect amounts reimbursed by the investment adviser or reductions from brokerage service arrangements or reductions from other expense offset arrangements and do not represent the amount paid by the class during periods when reimbursements or reductions occur. Expenses net of fee waivers reflect expenses after reimbursement by the investment adviser but prior to reductions from brokerage service arrangements or other expense offset arrangements. Expenses net of all reductions represent the net expenses paid by the class but do not include expenses of the underlying funds in which the Fund invests.
J Amount does not include the portfolio activity of any underlying Fidelity Central Funds.
See accompanying notes which are an integral part of the financial statements.
VIP FundsManager 85% Portfolio Investor Class
| Years ended December 31, | 2018 | 2017 | 2016 | 2015 | 2014 |
| Selected Per–Share Data | | | | | |
| Net asset value, beginning of period | $14.31 | $11.81 | $11.87 | $12.46 | $12.07 |
| Income from Investment Operations | | | | | |
| Net investment income (loss)A | .14 | .11 | .11 | .09 | .13 |
| Net realized and unrealized gain (loss) | (1.28) | 2.62 | .48 | (.03) | .51 |
| Total from investment operations | (1.14) | 2.73 | .59 | .06 | .64 |
| Distributions from net investment income | (.10) | (.10) | (.11) | (.16)B | (.13) |
| Distributions from net realized gain | (1.41) | (.13) | (.54) | (.49)B | (.13) |
| Total distributions | (1.51) | (.23) | (.65) | (.65) | (.25)C |
| Net asset value, end of period | $11.66 | $14.31 | $11.81 | $11.87 | $12.46 |
| Total ReturnD,E | (8.89)% | 23.13% | 5.66% | .39% | 5.29% |
| Ratios to Average Net AssetsF,G,H | | | | | |
| Expenses before reductions | .25% | .25% | .25% | .25% | .25% |
| Expenses net of fee waivers, if any | .20% | .20% | .20% | .20% | .20% |
| Expenses net of all reductions | .20% | .20% | .20% | .20% | .20% |
| Net investment income (loss) | 1.08% | .81% | .96% | .74% | 1.04% |
| Supplemental Data | | | | | |
| Net assets, end of period (000 omitted) | $459,354 | $492,831 | $407,244 | $399,068 | $376,927 |
| Portfolio turnover rateF,I | 116% | 70% | 59% | 67% | 72% |
A Calculated based on average shares outstanding during the period.
B The amounts shown reflect certain reclassifications related to book to tax differences that were made in the year shown.
C Total distributions of $.25 per share is comprised of distributions from net investment income of $.125 and distributions from net realized gain of $.126 per share.
D Total returns do not reflect charges attributable to your insurance company's separate account. Inclusion of these charges would reduce the total returns shown.
E Total returns would have been lower if certain expenses had not been reduced during the applicable periods shown.
F Amounts do not include the activity of the Underlying Funds.
G Fees and expenses of any underlying Fidelity Central Funds are not included in the Fund's expense ratio. The Fund indirectly bears its proportionate share of the expenses of any underlying Fidelity Central Funds.
H Expense ratios reflect operating expenses of the class. Expenses before reductions do not reflect amounts reimbursed by the investment adviser or reductions from brokerage service arrangements or reductions from other expense offset arrangements and do not represent the amount paid by the class during periods when reimbursements or reductions occur. Expenses net of fee waivers reflect expenses after reimbursement by the investment adviser but prior to reductions from brokerage service arrangements or other expense offset arrangements. Expenses net of all reductions represent the net expenses paid by the class but do not include expenses of the underlying funds in which the Fund invests.
I Amount does not include the portfolio activity of any underlying Fidelity Central Funds.
See accompanying notes which are an integral part of the financial statements.
Notes to Financial Statements
For the period ended December 31, 2018
1. Organization.
VIP FundsManager 20% Portfolio, VIP FundsManager 50% Portfolio, VIP FundsManager 60% Portfolio, VIP FundsManager 70% Portfolio, and VIP FundsManager 85% Portfolio (the Funds) are funds of Variable Insurance Products Fund V (the Trust). The Trust is registered under the Investment Company Act of 1940, as amended (the 1940 Act), as an open-end management investment company organized as a Massachusetts business trust. Each Fund is authorized to issue an unlimited number of shares. The Funds invest primarily in a combination of other Fidelity equity, fixed income, and short-term funds (the Underlying Funds) managed by Fidelity Management & Research Company (FMR). Shares of each Fund may only be purchased by insurance companies for the purpose of funding variable annuity or variable life insurance contracts. Each Fund offers three classes of shares: Service Class shares, Service Class 2 shares, and Investor Class shares. All classes have equal rights and voting privileges, except for matters affecting a single class. Certain Underlying Funds incurred name changes since their most recent shareholder report. The names of the Underlying Funds are those in effect at period end.
2. Investments in Fidelity Central Funds.
The Funds invest in Fidelity Central Funds, which are open-end investment companies generally available only to other investment companies and accounts managed by the investment adviser and its affiliates. The Funds' Schedules of Investments list each of the Fidelity Central Funds held as of period end, if any, as an investment of each Fund, but does not include the underlying holdings of each Fidelity Central Fund. As an Investing Fund, each Fund indirectly bears its proportionate share of the expenses of the underlying Fidelity Central Funds.
The Money Market Central Funds seek preservation of capital and current income and are managed by Fidelity Investments Money Management, Inc. (FIMM), an affiliate of the investment adviser. Annualized expenses of the Money Market Central Funds as of their most recent shareholder report date are less than .005%.
A complete unaudited list of holdings for each Fidelity Central Fund is available upon request or at the Securities and Exchange Commission (the SEC) website at www.sec.gov. In addition, the financial statements of the Fidelity Central Funds, which are not covered by the Funds' Report of Independent Registered Public Accounting Firm, are available on the SEC website or upon request.
3. Significant Accounting Policies.
Each Fund is an investment company and applies the accounting and reporting guidance of the Financial Accounting Standards Board (FASB) Accounting Standards Codification Topic 946 Financial Services – Investments Companies. The financial statements have been prepared in conformity with accounting principles generally accepted in the United States of America (GAAP), which require management to make certain estimates and assumptions at the date of the financial statements. Actual results could differ from those estimates. Subsequent events, if any, through the date that the financial statements were issued have been evaluated in the preparation of the financial statements. The following summarizes the significant accounting policies of the Funds:
Investment Valuation. Investments are valued as of 4:00 p.m. Eastern time on the last calendar day of the period. Each Fund uses a third party pricing vendor approved by the Board of Trustees (the Board) to value its investments. The Board of Trustees (the Board) has delegated the day to day responsibility for the valuation of each Fund's investments to the Fair Value Committee (the Committee) established by the each Fund's investment adviser. In accordance with valuation policies and procedures approved by the Board, each Fund attempts to obtain prices from one or more third party pricing vendors or brokers to value its investments. When current market prices, quotations or currency exchange rates are not readily available or reliable, investments will be fair valued in good faith by the Committee, in accordance with procedures adopted by the Board. Factors used in determining fair value vary by investment type and may include market or investment specific events, changes in interest rates and credit quality. The frequency with which these procedures are used cannot be predicted and they may be utilized to a significant extent. The Committee oversees each Fund's valuation policies and procedures and reports to the Board on the Committee's activities and fair value determinations. The Board monitors the appropriateness of the procedures used in valuing each Fund's investments and ratifies the fair value determinations of the Committee. Each Fund categorizes the inputs to valuation techniques used to value its investments into a disclosure hierarchy consisting of three levels as shown below:
- Level 1 – quoted prices in active markets for identical investments
- Level 2 – other significant observable inputs (including quoted prices for similar investments, interest rates, prepayment speeds, etc.)
- Level 3 – unobservable inputs (including the Fund's own assumptions based on the best information available)
Valuation techniques used to value each Fund's investments by major category are as follows. Investments in the Underlying Funds are valued at their closing net asset value (NAV) each business day and are categorized as Level 1 in the hierarchy. Debt securities, including restricted securities, are valued based on evaluated prices received from third party pricing vendors or from brokers who make markets in such securities. U.S. government and government agency obligations are valued by pricing vendors who utilize matrix pricing which considers yield or price of bonds of comparable quality, coupon, maturity and type or by broker-supplied prices. When independent prices are unavailable or unreliable, debt securities may be valued utilizing pricing methodologies which consider similar factors that would be used by third party pricing vendors. Debt securities are generally categorized as Level 2 in the hierarchy but may be Level 3 depending on the circumstances.
Futures contracts are valued at the settlement price established each day by the board of trade or exchange on which they are traded and are categorized as Level 1 in the hierarchy.
Investment Transactions and Income. For financial reporting purposes, the Funds' investment holdings and NAV include trades executed through the end of the last business day of the period. The NAV per share for processing shareholder transactions is calculated as of the close of business of the New York Stock Exchange (NYSE), normally 4:00 p.m. Eastern time and includes trades executed through the end of the prior business day. Gains and losses on securities sold are determined on the basis of identified cost. Income and capital gain distributions from the Underlying Funds, if any, are recorded on the ex-dividend date. Interest income is accrued as earned. Interest income includes coupon interest and amortization of premium and accretion of discount on debt securities as applicable.
Class Allocations and Expenses. Investment income, realized and unrealized capital gains and losses, common expenses of each Fund, and certain fund-level expense reductions, if any, are allocated daily on a pro-rata basis to each class based on the relative net assets of each class to the total net assets of each Fund. Each class differs with respect to distribution and service plan fees incurred. Certain expense reductions may also differ by class. For the reporting period, the allocated portion of income and expenses to each class as a percent of its average net assets may vary due to the timing of recording these transactions in relation to fluctuating net assets of the classes. Expenses directly attributable to a fund are charged to that fund. Expenses attributable to more than one fund are allocated among the respective funds on the basis of relative net assets or other appropriate methods. Expenses included in the accompanying financial statements reflect the expenses of each Fund and do not include any expenses associated with the Underlying Funds. Although not included in each Fund's expenses, each Fund indirectly bears its proportionate share of the Underlying Funds' expenses through the impact of these expenses on each Underlying Fund's NAV. Expense estimates are accrued in the period to which they relate and adjustments are made when actual amounts are known.
Income Tax Information and Distributions to Shareholders. Each year, each Fund intends to qualify as a regulated investment company under Subchapter M of the Internal Revenue Code, including distributing substantially all of its taxable income and realized gains. As a result, no provision for U.S. Federal income taxes is required. As of December 31, 2018, each Fund did not have any unrecognized tax benefits in the financial statements; nor is each Fund aware of any tax positions for which it is reasonably possible that the total amounts of unrecognized tax benefits will significantly change in the next twelve months. Each Fund files a U.S. federal tax return, in addition to state and local tax returns as required. Each Fund's federal income tax returns are subject to examination by the Internal Revenue Service (IRS) for a period of three fiscal years after they are filed. State and local tax returns may be subject to examination for an additional fiscal year depending on the jurisdiction.
Distributions are declared and recorded on the ex-dividend date. Income and capital gain distributions are declared separately for each class. Income and capital gain distributions are determined in accordance with income tax regulations, which may differ from GAAP.
Capital accounts within the financial statements are adjusted for permanent book-tax differences. These adjustments have no impact on net assets or the results of operations. Capital accounts are not adjusted for temporary book-tax differences which will reverse in a subsequent period.
Book-tax differences are primarily due to the short-term gain distributions from the Underlying Funds, futures contracts, market discount and losses deferred due to wash sales.
As of period end, the cost and unrealized appreciation (depreciation) in securities, and derivatives if applicable, for federal income tax purposes were as follows for each Fund:
| | Tax cost | Gross unrealized appreciation | Gross unrealized depreciation | Net unrealized appreciation (depreciation) |
| VIP FundsManager 20% Portfolio | $749,326,345 | $6,548,234 | $(27,589,848) | $(21,041,614) |
| VIP FundsManager 50% Portfolio | 6,013,598,874 | 48,651,930 | (434,944,357) | (386,292,427) |
| VIP FundsManager 60% Portfolio | 5,699,729,282 | 86,588,228 | (474,317,704) | (387,729,476) |
| VIP FundsManager 70% Portfolio | 1,512,323,955 | 14,141,822 | (144,597,027) | (130,455,205) |
| VIP FundsManager 85% Portfolio | 550,334,596 | 4,579,244 | (63,848,222) | (59,268,978) |
The tax-based components of distributable earnings as of period end were as follows for each Fund:
| | Undistributed ordinary income | Undistributed long-term capital gain | Net unrealized appreciation (depreciation) on securities and other investments |
| VIP FundsManager 20% Portfolio | $1,905,937 | $27,880,038 | $(21,041,614) |
| VIP FundsManager 50% Portfolio | 21,607,798 | 536,426,213 | (386,292,427) |
| VIP FundsManager 60% Portfolio | 23,184,190 | 876,844,805 | (387,729,476) |
| VIP FundsManager 70% Portfolio | 6,534,672 | 186,111,225 | (130,455,205) |
| VIP FundsManager 85% Portfolio | 2,589,831 | 82,138,594 | (59,268,978) |
The tax character of distributions paid was as follows:
| December 31, 2018 | | | |
| | Ordinary Income | Long-term Capital Gains | Total |
| VIP FundsManager 20% Portfolio | $18,418,143 | $27,817,855 | $46,235,998 |
| VIP FundsManager 50% Portfolio | 153,079,849 | 421,890,869 | 574,970,718 |
| VIP FundsManager 60% Portfolio | 136,267,099 | 646,172,218 | 782,439,317 |
| VIP FundsManager 70% Portfolio | 34,974,259 | 111,574,677 | 146,548,936 |
| VIP FundsManager 85% Portfolio | 12,602,923 | 44,111,477 | 56,714,400 |
| December 31, 2017 | | | |
| | Ordinary Income | Long-term Capital Gains | Total |
| VIP FundsManager 20% Portfolio | $12,425,940 | $1,981,684 | $14,407,624 |
| VIP FundsManager 50% Portfolio | 115,876,974 | – | 115,876,974 |
| VIP FundsManager 60% Portfolio | 124,172,340 | 75,831,166 | 200,003,506 |
| VIP FundsManager 70% Portfolio | 22,383,509 | – | 22,383,509 |
| VIP FundsManager 85% Portfolio | 8,307,177 | – | 8,307,177 |
New Rule Issuance. During August 2018, the U.S. Securities and Exchange Commission issued Final Rule Release No. 33-10532, Disclosure Update and Simplification. This Final Rule includes amendments specific to registered investment companies that are intended to eliminate overlap in disclosure requirements between Regulation S-X and GAAP. In accordance with these amendments, certain line-items in the Funds' financial statements have been combined or removed for the current period as outlined in the table below.
| Financial Statement | Current Line-Item Presentation | Prior Line-Item Presentation |
| Statement of Assets and Liabilities | Total distributable earnings (loss) | Undistributed/Distributions in excess of/Accumulated net investment income (loss)
Accumulated/Undistributed net realized gain (loss)
Net unrealized appreciation (depreciation) |
| Statement of Changes in Net Assets | N/A - removed | Undistributed/Distributions in excess of/Accumulated net investment income (loss) end of period |
| Statement of Changes in Net Assets | Distributions to shareholders | Distributions to shareholders from net investment income
Distributions to shareholders from net realized gain |
| Distributions to Shareholders Note to Financial Statements | Distributions to shareholders | Distributions to shareholders from net investment income
Distributions to shareholders from net realized gain |
4. Derivative Instruments.
Risk Exposures and the Use of Derivative Instruments. The Funds' investment objective allows the Funds to enter into various types of derivative contracts, including futures contracts. Derivatives are investments whose value is primarily derived from underlying assets, indices or reference rates and may be transacted on an exchange or over-the-counter (OTC). Derivatives may involve a future commitment to buy or sell a specified asset based on specified terms, to exchange future cash flows at periodic intervals based on a notional principal amount, or for one party to make one or more payments upon the occurrence of specified events in exchange for periodic payments from the other party.
The Funds used derivatives to increase returns and to manage exposure to certain risks as defined below. The success of any strategy involving derivatives depends on analysis of numerous economic factors, and if the strategies for investment do not work as intended, the Funds may not achieve their objectives.
The Funds' use of derivatives increased or decreased their exposure to the following risk:
| Equity Risk | Equity risk relates to the fluctuations in the value of financial instruments as a result of changes in market prices (other than those arising from interest rate risk or foreign exchange risk), whether caused by factors specific to an individual investment, its issuer, or all factors affecting all instruments traded in a market or market segment.
|
The Funds are also exposed to additional risks from investing in derivatives, such as liquidity risk and counterparty credit risk. Liquidity risk is the risk that the Funds will be unable to close out the derivative in the open market in a timely manner. Counterparty credit risk is the risk that the counterparty will not be able to fulfill its obligation to the Funds. Counterparty credit risk related to exchange-traded futures contracts may be mitigated by the protection provided by the exchange on which they trade.
Investing in derivatives may involve greater risks than investing in the underlying assets directly and, to varying degrees, may involve risk of loss in excess of any initial investment and collateral received and amounts recognized in the Statement of Assets and Liabilities. In addition, there may be the risk that the change in value of the derivative contract does not correspond to the change in value of the underlying instrument.
Futures Contracts. A futures contract is an agreement between two parties to buy or sell a specified underlying instrument for a fixed price at a specified future date. The Funds used futures contracts to manage their exposure to the stock market.
Upon entering into a futures contract, a fund is required to deposit either cash or securities (initial margin) with a clearing broker in an amount equal to a certain percentage of the face value of the contract. Futures contracts are marked-to-market daily and subsequent daily payments (variation margin) are made or received by a fund depending on the daily fluctuations in the value of the futures contracts and are recorded as unrealized appreciation or (depreciation). This receivable and/or payable, if any, is included in daily variation margin on futures contracts in the Statement of Assets and Liabilities. Realized gain or (loss) is recorded upon the expiration or closing of a futures contract. The net realized gain (loss) and change in net unrealized appreciation (depreciation) on futures contracts during the period is presented in the Statement of Operations.
Any open futures contracts at period end are presented in the Schedule of Investments under the caption "Futures Contracts". The notional amount at value reflects each contract's exposure to the underlying instrument or index at period end and, for VIP FundsManager 70% Portfolio, is representative of volume of activity during the period. Securities deposited to meet initial margin requirements are identified in the Schedule of Investments. Cash deposited to meet initial margin requirements is presented as segregated cash with brokers for derivative instruments in the Statement of Assets and Liabilities.
5. Purchases and Redemptions of Underlying Fund Shares.
Purchases and sales of securities, including in-kind transactions, other than short term securities and U.S. government securities, are noted in the table below.
| | Purchases ($) | Redemptions ($) |
| VIP FundsManager 20% Portfolio | 361,085,301 | 380,190,330 |
| VIP FundsManager 50% Portfolio | 5,054,144,235 | 5,528,893,376 |
| VIP FundsManager 60% Portfolio | 5,474,341,224 | 5,797,190,062 |
| VIP FundsManager 70% Portfolio | 1,570,163,920 | 1,456,068,789 |
| VIP FundsManager 85% Portfolio | 682,548,962 | 631,735,656 |
6. Fees and Other Transactions with Affiliates.
Management Fee. FMR Co., Inc. (the investment adviser), an affiliate of FMR, provides the Funds with investment management related services. For these services each Fund pays a monthly management fee to the investment adviser. The management fee is based on an annual rate of .25% of each fund's average net assets. The management fee is reduced by an amount equal to the fees and expenses paid by the Funds to the independent Trustees.
The investment adviser has contractually agreed to waive 0.05% of its management fee, thereby limiting each Fund's management fee to an annual rate of 0.20% of average net assets, until April 30, 2019.
Other Transactions. The investment adviser has entered into an administration agreement with FMR under which FMR provides management and administrative services (other than investment advisory services) necessary for the operation of each Fund. Pursuant to this agreement, FMR pays all expenses of each Fund, excluding distribution and service plan fees, compensation of the independent Trustees and certain other expenses such as interest expense. FMR also contracts with other Fidelity companies to perform the services necessary for the operation of each Fund.
Distribution and Service Plan Fees. In accordance with Rule 12b-1 of the 1940 Act, the Funds have adopted separate 12b-1 Plans for each Service Class of shares. Each Service Class pays Fidelity Distributors Corporation (FDC), an affiliate of the investment adviser, a service fee. For the period, the service fee is based on an annual rate of .10% of Service Class' average net assets and .25% of Service Class 2's average net assets.
For the period, total fees, all of which were reallowed to insurance companies for the distribution of shares and providing shareholder support services were as follows:
| | Service Class | Service Class 2 | Total |
| VIP FundsManager 20% Portfolio | $57 | $21,072 | $21,129 |
| VIP FundsManager 50% Portfolio | 60 | 246,246 | 246,306 |
| VIP FundsManager 60% Portfolio | 55 | 1,457,891 | 1,457,946 |
| VIP FundsManager 70% Portfolio | 71 | 125,547 | 125,618 |
| VIP FundsManager 85% Portfolio | 1 | 85,505 | 85,506 |
Brokerage Commissions. Certain Funds placed a portion of their portfolio transactions with brokerage firms which are affiliates of the investment adviser. Brokerage commissions are included in net realized gain (loss) and change in net unrealized appreciation (depreciation) in the Statement of Operations. The commissions paid to these affiliated firms were as follows:
| | Amount |
| VIP FundsManager 50% Portfolio | $307 |
| VIP FundsManager 60% Portfolio | 292 |
| VIP FundsManager 70% Portfolio | 89 |
| VIP FundsManager 85% Portfolio | 34 |
Interfund Trades. The Funds may purchase from or sell securities to other Fidelity Funds under procedures adopted by the Board. The procedures have been designed to ensure these interfund trades are executed in accordance with Rule 17a-7 of the 1940 Act. Interfund trades are included within the respective purchases and sales amounts shown in the Purchases and Sales of Investments note.
Reallocation of Underlying Fund Investments. During the period, the investment adviser reallocated investments of the Funds. This involved taxable redemptions of the Funds' interest in Fidelity Consumer Discretionary Portfolio, Fidelity Consumer Staples Portfolio, Fidelity Energy Portfolio, Fidelity Financial Services Portfolio, Fidelity Health Care Portfolio, Fidelity Industrials Portfolio, Fidelity Materials Portfolio, Fidelity Real Estate Investment Portfolio, Fidelity Technology Portfolio, Fidelity Telecommunications Portfolio and Fidelity Utilities Portfolio (selected Underlying Funds) for investments and cash and non-taxable exchanges of those investments and cash for shares of Fidelity Consumer Discretionary Central Fund, Fidelity Consumer Staples Central Fund, Fidelity Energy Central Fund, Fidelity Financials Central Fund, Fidelity Health Care Central Fund, Fidelity Industrials Central Fund, Fidelity Information Technology Central Fund, Fidelity Materials Central Fund, Fidelity Telecom Services Central Fund and Fidelity Utilities Central Fund (selected Affiliated Central Funds) which are affiliated investment companies managed by FMR.
In addition, the investment adviser reallocated investments of the Funds. This involved taxable redemptions of the Funds' interest in the selected Affiliated Central Funds for investments and non-taxable exchanges of those investments for shares of Fidelity Stock Selector All Cap. Net realized gain (loss) on the redemptions of the selected Underlying Funds and Affiliated Central Funds in connection with the reallocation is included in the accompanying Statements of Operations as "Net realized gain (loss) on: Fidelity Central Funds and Other Affiliated issuers".
Details of these transactions with the related net gain (loss) for the Funds are presented in the accompanying table:
| | Value of Investments and Cash reallocated | Net realized Gain (Loss) on redemptions of selected Underlying Funds and Affiliated Central Funds |
| VIP FundsManager 20% Portfolio | $ 147,071,445 | $ 12,809,582 |
| VIP FundsManager 50% Portfolio | 3,091,857,292 | 289,073,621 |
| VIP FundsManager 60% Portfolio | 3,568,089,514 | 562,952,084 |
| VIP FundsManager 70% Portfolio | 993,477,105 | 101,761,955 |
| VIP FundsManager 85% Portfolio | 453,153,954 | 45,157,797 |
7. Expense Reductions.
The investment adviser contractually agreed to limit each Funds' management fee to an annual rate of 0.20% of each Funds' average net assets until April 30, 2019. For the period, each Fund's management fees were reduced by the following amounts:
| | Management Fee Waiver |
| VIP FundsManager 20% Portfolio | $386,639 |
| VIP FundsManager 50% Portfolio | 3,184,711 |
| VIP FundsManager 60% Portfolio | 3,008,299 |
| VIP FundsManager 70% Portfolio | 749,571 |
| VIP FundsManager 85% Portfolio | 274,521 |
In addition, FMR has contractually agreed to reimburse 0.10% of class-level expenses for each Fund's Service Class and Service Class 2. During the period, this reimbursement reduced each Fund's Service Class and Service Class 2's expenses by the following amounts:
| | Reimbursement
|
| VIP FundsManager 20% Portfolio | |
| Service Class | $57 |
| Service Class 2 | 8,429 |
| VIP FundsManager 50% Portfolio | |
| Service Class | 60 |
| Service Class 2 | 98,498 |
| VIP FundsManager 60% Portfolio | |
| Service Class | 55 |
| Service Class 2 | 583,156 |
| VIP FundsManager 70% Portfolio | |
| Service Class | 70 |
| Service Class 2 | 50,219 |
| VIP FundsManager 85% Portfolio | |
| Service Class | 1 |
| Service Class 2 | 34,202 |
Commissions paid to certain brokers with whom the investment adviser, or its affiliates, places trades on behalf of Certain Funds and certain Central Funds include an amount in addition to trade execution, which may be rebated back to the Funds to offset certain expenses. Through arrangements with each applicable Fund's custodian, credits realized as a result of certain uninvested cash balances were used to reduce the Fund's expenses. All of the applicable expense reductions are noted in the table below.
| | Brokerage Service reduction | Custody expense reduction |
| VIP FundsManager 20% Portfolio | $928 | $166 |
| VIP FundsManager 50% Portfolio | 11,711 | 37 |
| VIP FundsManager 60% Portfolio | 11,101 | 31 |
| VIP FundsManager 70% Portfolio | 3,387 | 64 |
| VIP FundsManager 85% Portfolio | 1,195 | 165 |
8. Distributions to Shareholders.
Distributions to shareholders of each class were as follows:
| | Year ended
December 31, 2018 | Year ended
December 31, 2017 |
| VIP FundsManager 20% Portfolio | | |
| Distributions to shareholders | | |
| Service Class | $3,503 | $– |
| Service Class 2 | 502,761 | – |
| Investor Class | 45,729,734 | – |
| Total | $46,235,998 | $– |
| From net investment income | | |
| Service Class | $– | $766 |
| Service Class 2 | – | 92,500 |
| Investor Class | – | 9,938,104 |
| Total | $– | $10,031,370 |
| From net realized gain | | |
| Service Class | $– | $346 |
| Service Class 2 | – | 45,931 |
| Investor Class | – | 4,329,977 |
| Total | $– | $4,376,254 |
| VIP FundsManager 50% Portfolio | | |
| Distributions to shareholders | | |
| Service Class | $5,597 | $– |
| Service Class 2 | 8,613,442 | – |
| Investor Class | 566,351,679 | – |
| Total | $574,970,718 | $– |
| From net investment income | | |
| Service Class | $– | $731 |
| Service Class 2 | – | 989,026 |
| Investor Class | – | 74,273,522 |
| Total | $– | $75,263,279 |
| From net realized gain | | |
| Service Class | $– | $393 |
| Service Class 2 | – | 612,425 |
| Investor Class | – | 40,000,877 |
| Total | $– | $40,613,695 |
| VIP FundsManager 60% Portfolio | | |
| Distributions to shareholders | | |
| Service Class | $7,614 | $– |
| Service Class 2 | 73,545,828 | – |
| Investor Class | 708,885,875 | – |
| Total | $782,439,317 | $– |
| From net investment income | | |
| Service Class | $– | $649 |
| Service Class 2 | – | 5,348,956 |
| Investor Class | – | 60,481,640 |
| Total | $– | $65,831,245 |
| From net realized gain | | |
| Service Class | $– | $1,287 |
| Service Class 2 | – | 11,583,334 |
| Investor Class | – | 122,587,640 |
| Total | $– | $134,172,261 |
| VIP FundsManager 70% Portfolio | | |
| Distributions to shareholders | | |
| Service Class | $7,360 | $– |
| Service Class 2 | 4,845,803 | – |
| Investor Class | 141,695,773 | – |
| Total | $146,548,936 | $– |
| From net investment income | | |
| Service Class | $– | $662 |
| Service Class 2 | – | 359,186 |
| Investor Class | – | 12,302,715 |
| Total | $– | $12,662,563 |
| From net realized gain | | |
| Service Class | $– | $506 |
| Service Class 2 | – | 324,459 |
| Investor Class | – | 9,395,981 |
| Total | $– | $9,720,946 |
| VIP FundsManager 85% Portfolio | | |
| Distributions to shareholders | | |
| Service Class | $189 | $– |
| Service Class 2 | 3,582,347 | – |
| Investor Class | 53,131,864 | – |
| Total | $56,714,400 | $– |
| From net investment income | | |
| Service Class | $– | $13 |
| Service Class 2 | – | 192,253 |
| Investor Class | – | 3,451,179 |
| Total | $– | $3,643,445 |
| From net realized gain | | |
| Service Class | $– | $18 |
| Service Class 2 | – | 298,443 |
| Investor Class | – | 4,365,271 |
| Total | $– | $4,663,732 |
9. Share Transactions.
Transactions for each class of shares were as follows:
| | Shares | Shares | Dollars | Dollars |
| | Year ended
December 31, 2018 | Year ended
December 31, 2017 | Year ended
December 31, 2018 | Year ended
December 31, 2017 |
| VIP FundsManager 20% Portfolio | | | | |
| Service Class | | | | |
| Shares sold | 334 | 282 | $3,729 | $3,244 |
| Reinvestment of distributions | 6 | 96 | 68 | 1,112 |
| Shares redeemed | (316)(a) | (724) | (3,544)(a) | (8,404) |
| Net increase (decrease) | 24 | (346) | $253 | $(4,048) |
| Service Class 2 | | | | |
| Shares sold | 138,319 | 118,495 | $1,564,823 | $1,345,436 |
| Reinvestment of distributions | 46,031 | 12,043 | 502,761 | 138,431 |
| Shares redeemed | (117,406)(a) | (108,177) | (1,316,347)(a) | (1,232,660) |
| Net increase (decrease) | 66,944 | 22,361 | $751,237 | $251,207 |
| Investor Class | | | | |
| Shares sold | 3,903,632 | 5,096,986 | $43,753,843 | $58,749,629 |
| Reinvestment of distributions | 4,181,062 | 1,238,346 | 45,729,734 | 14,268,081 |
| Shares redeemed | (7,963,696)(a) | (6,426,351) | (88,856,329)(a) | (72,859,123) |
| Net increase (decrease) | 120,998 | (91,019) | $627,248 | $158,587 |
| VIP FundsManager 50% Portfolio | | | | |
| Service Class | | | | |
| Shares sold | 56 | 64 | $720 | $833 |
| Reinvestment of distributions | 6 | 83 | 77 | 1,124 |
| Shares redeemed | (74)(a) | (584) | (944)(a) | (7,870) |
| Net increase (decrease) | (12) | (437) | $(147) | $(5,913) |
| Service Class 2 | | | | |
| Shares sold | 1,211,481 | 1,289,799 | $15,423,342 | $16,633,568 |
| Reinvestment of distributions | 698,544 | 119,256 | 8,613,442 | 1,601,451 |
| Shares redeemed | (1,638,938)(a) | (1,515,620) | (20,874,932)(a) | (19,679,465) |
| Net increase (decrease) | 271,087 | (106,565) | $3,161,852 | $(1,444,446) |
| Investor Class | | | | |
| Shares sold | 6,174,967 | 6,677,690 | $79,048,025 | $86,961,201 |
| Reinvestment of distributions | 45,791,933 | 8,484,112 | 566,351,679 | 114,274,399 |
| Shares redeemed | (67,644,697)(a) | (39,276,673) | (859,140,192)(a) | (509,832,605) |
| Net increase (decrease) | (15,677,797) | (24,114,871) | $(213,740,488) | $(308,597,005) |
| VIP FundsManager 60% Portfolio | | | | |
| Service Class | | | | |
| Shares sold | 189 | 171 | $2,180 | $2,030 |
| Reinvestment of distributions | 14 | 162 | 152 | 1,936 |
| Shares redeemed | (170)(a) | (838) | (1,941)(a) | (10,318) |
| Net increase (decrease) | 33 | (505) | $391 | $(6,352) |
| Service Class 2 | | | | |
| Shares sold | 5,419,475 | 5,455,249 | $61,883,322 | $64,794,478 |
| Reinvestment of distributions | 6,675,535 | 1,415,209 | 73,545,828 | 16,932,290 |
| Shares redeemed | (6,763,203)(a) | (6,007,106) | (77,091,178)(a) | (71,637,670) |
| Net increase (decrease) | 5,331,807 | 863,352 | $58,337,972 | $10,089,098 |
| Investor Class | | | | |
| Shares sold | 6,235,842 | 5,362,355 | $71,295,270 | $64,258,948 |
| Reinvestment of distributions | 64,171,254 | 15,291,539 | 708,885,875 | 183,069,280 |
| Shares redeemed | (62,771,042)(a) | (93,531,178) | (714,678,819)(a) | (1,104,750,276) |
| Net increase (decrease) | 7,636,054 | (72,877,284) | $65,502,326 | $(857,422,048) |
| VIP FundsManager 70% Portfolio | | | | |
| Service Class | | | | |
| Shares sold | 145 | 130 | $1,914 | $1,718 |
| Reinvestment of distributions | 3 | 84 | 42 | 1,168 |
| Shares redeemed | (145)(a) | (736) | (1,915)(a) | (10,148) |
| Net increase (decrease) | 3 | (522) | $41 | $(7,262) |
| Service Class 2 | | | | |
| Shares sold | 438,715 | 458,084 | $5,751,035 | $5,964,434 |
| Reinvestment of distributions | 381,426 | 49,096 | 4,845,803 | 683,645 |
| Shares redeemed | (343,103)(a) | (229,488) | (4,500,104)(a) | (2,995,288) |
| Net increase (decrease) | 477,038 | 277,692 | $6,096,734 | $3,652,791 |
| Investor Class | | | | |
| Shares sold | 6,685,015 | 9,314,585 | $88,731,097 | $123,018,642 |
| Reinvestment of distributions | 11,129,997 | 1,552,500 | 141,695,773 | 21,698,696 |
| Shares redeemed | (5,379,869)(a) | (4,403,710) | (70,333,337)(a) | (57,832,076) |
| Net increase (decrease) | 12,435,143 | 6,463,375 | $160,093,533 | $86,885,262 |
| VIP FundsManager 85% Portfolio | | | | |
| Service Class | | | | |
| Shares sold | 92 | 109 | $1,234 | $1,463 |
| Reinvestment of distributions | 14 | 2 | 189 | 31 |
| Shares redeemed | (215)(a) | (680) | (2,802)(a) | (9,519) |
| Net increase (decrease) | (109) | (569) | $(1,379) | $(8,025) |
| Service Class 2 | | | | |
| Shares sold | 305,628 | 418,848 | $4,020,661 | $5,497,731 |
| Reinvestment of distributions | 277,618 | 34,579 | 3,582,347 | 490,696 |
| Shares redeemed | (216,908)(a) | (205,975) | (2,863,246)(a) | (2,696,501) |
| Net increase (decrease) | 366,338 | 247,452 | $4,739,762 | $3,291,926 |
| Investor Class | | | | |
| Shares sold | 3,997,486 | 2,659,836 | $53,742,128 | $35,473,379 |
| Reinvestment of distributions | 4,102,344 | 548,117 | 53,131,864 | 7,816,450 |
| Shares redeemed | (3,134,984)(a) | (3,236,201) | (41,129,771)(a) | (41,916,255) |
| Net increase (decrease) | 4,964,846 | (28,248) | $65,744,221 | $1,373,574 |
(a) Amount includes in-kind redemptions (see the Reallocation of Underlying Fund Investments note for additional details)
10. Other.
The Funds' organizational documents provide former and current trustees and officers with a limited indemnification against liabilities arising in connection with the performance of their duties to the Funds. In the normal course of business, the Funds may also enter into contracts that provide general indemnifications. The Funds' maximum exposure under these arrangements is unknown as this would be dependent on future claims that may be made against the Funds. The risk of material loss from such claims is considered remote.
The Funds do not invest in the Underlying Funds for the purpose of exercising management or control; however, investments by the Funds within their principal investment strategies may represent a significant portion of the Underlying Fund's net assets. At the end of the period, the following Funds were the owners of record of 10% or more of the total outstanding shares of the Underlying Funds.
| Fund | VIP FundsManager 50% Portfolio | VIP FundsManager 60% Portfolio |
| Fidelity Global Commodity Stock Fund | 11% | 10% |
| Fidelity Japan Smaller Companies Fund | 10% | 12% |
| Fidelity International Value Fund | 11% | 13% |
| Fidelity Stock Selector All Cap Fund | 18% | 21% |
| Fidelity Japan Fund | 17% | 17% |
The Funds, in aggregate, were the owners of record of more than 20% of the total outstanding shares of the following Underlying Funds.
| Fund | % of shares held |
| Fidelity Global Commodity Stock Fund | 25% |
| Fidelity Japan Smaller Companies Fund | 28% |
| Fidelity International Value Fund | 29% |
| Fidelity Stock Selector All Cap Fund | 48% |
| Fidelity Japan Fund | 42% |
In addition, at the end of the period the investment adviser or its affiliates were owners of record of more than 10% and certain otherwise unaffiliated shareholders each were owners of record of more than 10%, respectively, of the outstanding shares of the following Funds:
| | Affiliated % | Number of
Unaffiliated Shareholders | Unaffiliated Shareholders % |
| VIP FundsManager 20% Portfolio | 99% | – | –% |
| VIP FundsManager 50% Portfolio | 26% | 1 | 67% |
| VIP FundsManager 60% Portfolio | 34% | 2 | 51% |
| VIP FundsManager 70% Portfolio | 97% | – | –% |
| VIP FundsManager 85% Portfolio | 94% | – | –% |
Report of Independent Registered Public Accounting Firm
To the Board of Trustees of Variable Insurance Products Fund V and Shareholders of VIP FundsManager 20% Portfolio, VIP FundsManager 50% Portfolio, VIP FundsManager 60% Portfolio, VIP FundsManager 70% Portfolio and VIP FundsManager 85% Portfolio:
Opinions on the Financial Statements
We have audited the accompanying statements of assets and liabilities, including the schedules of investments, of VIP FundsManager 20% Portfolio, VIP FundsManager 50% Portfolio, VIP FundsManager 60% Portfolio, VIP FundsManager 70% Portfolio and VIP FundsManager 85% Portfolio (five of the funds constituting Variable Insurance Products Fund V, hereafter collectively referred to as the "Funds") as of December 31, 2018, the related statements of operations for the year ended December 31, 2018, the statements of changes in net assets for each of the two years in the period ended December 31, 2018, including the related notes, and the financial highlights for each of the five years in the period ended December 31, 2018 (collectively referred to as the “financial statements”). In our opinion, the financial statements present fairly, in all material respects, the financial position of each of the Funds as of December 31, 2018, the results of each of their operations for the year then ended, the changes in each of their net assets for each of the two years in the period ended December 31, 2018 and each of the financial highlights for each of the five years in the period ended December 31, 2018 in conformity with accounting principles generally accepted in the United States of America.
Basis for Opinions
These financial statements are the responsibility of the Funds' management. Our responsibility is to express an opinion on the Funds' financial statements based on our audits. We are a public accounting firm registered with the Public Company Accounting Oversight Board (United States) (PCAOB) and are required to be independent with respect to the Funds in accordance with the U.S. federal securities laws and the applicable rules and regulations of the Securities and Exchange Commission and the PCAOB.
We conducted our audits of these financial statements in accordance with the standards of the PCAOB. Those standards require that we plan and perform the audit to obtain reasonable assurance about whether the financial statements are free of material misstatement, whether due to error or fraud.
Our audits included performing procedures to assess the risks of material misstatement of the financial statements, whether due to error or fraud, and performing procedures that respond to those risks. Such procedures included examining, on a test basis, evidence regarding the amounts and disclosures in the financial statements. Our audits also included evaluating the accounting principles used and significant estimates made by management, as well as evaluating the overall presentation of the financial statements. Our procedures included confirmation of securities owned as of December 31, 2018 by correspondence with the custodian. We believe that our audits provide a reasonable basis for our opinions.
PricewaterhouseCoopers LLP
Boston, Massachusetts
February 19, 2019
We have served as the auditor of one or more investment companies in the Fidelity group of funds since 1932.
Trustees and Officers
The Trustees, Members of the Advisory Board (if any), and officers of the trust and funds, as applicable, are listed below. The Board of Trustees governs each fund and is responsible for protecting the interests of shareholders. The Trustees are experienced executives who meet periodically throughout the year to oversee each fund's activities, review contractual arrangements with companies that provide services to each fund, oversee management of the risks associated with such activities and contractual arrangements, and review each fund's performance. If the interests of a fund and an underlying Fidelity® fund were to diverge, a conflict of interest could arise and affect how the Trustees and Members of the Advisory Board fulfill their fiduciary duties to the affected funds. FMRC has structured the funds to avoid these potential conflicts, although there may be situations where a conflict of interest is unavoidable. In such instances, FMRC, the Trustees, and Members of the Advisory Board would take reasonable steps to minimize and, if possible, eliminate the conflict. Each of the Trustees oversees 260 funds.
The Trustees hold office without limit in time except that (a) any Trustee may resign; (b) any Trustee may be removed by written instrument, signed by at least two-thirds of the number of Trustees prior to such removal; (c) any Trustee who requests to be retired or who has become incapacitated by illness or injury may be retired by written instrument signed by a majority of the other Trustees; and (d) any Trustee may be removed at any special meeting of shareholders by a two-thirds vote of the outstanding voting securities of the trust. Each Trustee who is not an interested person (as defined in the 1940 Act) of the trust and the funds is referred to herein as an Independent Trustee. Each Independent Trustee shall retire not later than the last day of the calendar year in which his or her 75th birthday occurs. The Independent Trustees may waive this mandatory retirement age policy with respect to individual Trustees. Officers and Advisory Board Members hold office without limit in time, except that any officer or Advisory Board Member may resign or may be removed by a vote of a majority of the Trustees at any regular meeting or any special meeting of the Trustees. Except as indicated, each individual has held the office shown or other offices in the same company for the past five years.
Each fund’s Statement of Additional Information (SAI) includes more information about the Trustees. To request a free copy, call Fidelity at 1-877-208-0098.
Experience, Skills, Attributes, and Qualifications of the Trustees. The Governance and Nominating Committee has adopted a statement of policy that describes the experience, qualifications, attributes, and skills that are necessary and desirable for potential Independent Trustee candidates (Statement of Policy). The Board believes that each Trustee satisfied at the time he or she was initially elected or appointed a Trustee, and continues to satisfy, the standards contemplated by the Statement of Policy. The Governance and Nominating Committee also engages professional search firms to help identify potential Independent Trustee candidates who have the experience, qualifications, attributes, and skills consistent with the Statement of Policy. From time to time, additional criteria based on the composition and skills of the current Independent Trustees, as well as experience or skills that may be appropriate in light of future changes to board composition, business conditions, and regulatory or other developments, have also been considered by the professional search firms and the Governance and Nominating Committee. In addition, the Board takes into account the Trustees' commitment and participation in Board and committee meetings, as well as their leadership of standing and ad hoc committees throughout their tenure.
In determining that a particular Trustee was and continues to be qualified to serve as a Trustee, the Board has considered a variety of criteria, none of which, in isolation, was controlling. The Board believes that, collectively, the Trustees have balanced and diverse experience, qualifications, attributes, and skills, which allow the Board to operate effectively in governing each fund and protecting the interests of shareholders. Information about the specific experience, skills, attributes, and qualifications of each Trustee, which in each case led to the Board's conclusion that the Trustee should serve (or continue to serve) as a trustee of the funds, is provided below.
Board Structure and Oversight Function. Abigail P. Johnson is an interested person and currently serves as Chairman. The Trustees have determined that an interested Chairman is appropriate and benefits shareholders because an interested Chairman has a personal and professional stake in the quality and continuity of services provided to the funds. Independent Trustees exercise their informed business judgment to appoint an individual of their choosing to serve as Chairman, regardless of whether the Trustee happens to be independent or a member of management. The Independent Trustees have determined that they can act independently and effectively without having an Independent Trustee serve as Chairman and that a key structural component for assuring that they are in a position to do so is for the Independent Trustees to constitute a substantial majority for the Board. The Independent Trustees also regularly meet in executive session. Arthur E. Johnson serves as Chairman of the Independent Trustees and as such (i) acts as a liaison between the Independent Trustees and management with respect to matters important to the Independent Trustees and (ii) with management prepares agendas for Board meetings.
Fidelity® funds are overseen by different Boards of Trustees. The funds' Board oversees Fidelity's investment-grade bond, money market, asset allocation and certain equity funds, and other Boards oversee Fidelity's high income and other equity funds. The asset allocation funds may invest in Fidelity® funds that are overseen by such other Boards. The use of separate Boards, each with its own committee structure, allows the Trustees of each group of Fidelity® funds to focus on the unique issues of the funds they oversee, including common research, investment, and operational issues. On occasion, the separate Boards establish joint committees to address issues of overlapping consequences for the Fidelity® funds overseen by each Board.
The Trustees operate using a system of committees to facilitate the timely and efficient consideration of all matters of importance to the Trustees, each fund, and fund shareholders and to facilitate compliance with legal and regulatory requirements and oversight of the funds' activities and associated risks. The Board, acting through its committees, has charged FMR and its affiliates with (i) identifying events or circumstances the occurrence of which could have demonstrably adverse effects on the funds' business and/or reputation; (ii) implementing processes and controls to lessen the possibility that such events or circumstances occur or to mitigate the effects of such events or circumstances if they do occur; and (iii) creating and maintaining a system designed to evaluate continuously business and market conditions in order to facilitate the identification and implementation processes described in (i) and (ii) above. Because the day-to-day operations and activities of the funds are carried out by or through FMR, its affiliates, and other service providers, the funds' exposure to risks is mitigated but not eliminated by the processes overseen by the Trustees. While each of the Board's committees has responsibility for overseeing different aspects of the funds' activities, oversight is exercised primarily through the Operations and Audit Committees. In addition, an ad hoc Board committee of Independent Trustees has worked with FMR to enhance the Board's oversight of investment and financial risks, legal and regulatory risks, technology risks, and operational risks, including the development of additional risk reporting to the Board. Appropriate personnel, including but not limited to the funds' Chief Compliance Officer (CCO), FMR's internal auditor, the independent accountants, the funds' Treasurer and portfolio management personnel, make periodic reports to the Board's committees, as appropriate, including an annual review of Fidelity's risk management program for the Fidelity® funds. The responsibilities of each standing committee, including their oversight responsibilities, are described further under "Standing Committees of the Trustees."
Interested Trustees*:
Correspondence intended for a Trustee who is an interested person may be sent to Fidelity Investments, 245 Summer Street, Boston, Massachusetts 02210.
Name, Year of Birth; Principal Occupations and Other Relevant Experience+
Abigail P. Johnson (1961)
Year of Election or Appointment: 2009
Trustee
Chairman of the Board of Trustees
Ms. Johnson also serves as Trustee of other Fidelity® funds. Ms. Johnson serves as Chairman (2016-present), Chief Executive Officer (2014-present), and Director (2007-present) of FMR LLC (diversified financial services company), President of Fidelity Financial Services (2012-present) and President of Personal, Workplace and Institutional Services (2005-present). Ms. Johnson is Chairman and Director of FMR Co., Inc. (investment adviser firm, 2011-present) and Chairman and Director of FMR (investment adviser firm, 2011-present). Previously, Ms. Johnson served as Vice Chairman (2007-2016) and President (2013-2016) of FMR LLC, President and a Director of FMR (2001-2005), a Trustee of other investment companies advised by FMR, Fidelity Investments Money Management, Inc. (investment adviser firm), and FMR Co., Inc. (2001-2005), Senior Vice President of the Fidelity® funds (2001-2005), and managed a number of Fidelity® funds. Ms. Abigail P. Johnson and Mr. Arthur E. Johnson are not related.
Jennifer Toolin McAuliffe (1959)
Year of Election or Appointment: 2016
Trustee
Ms. McAuliffe also serves as Trustee of other Fidelity® funds. Ms. McAuliffe previously served as a Member of the Advisory Board of certain Fidelity® funds (2016) and as Co-Head of Fixed Income of Fidelity Investments Limited (now known as FIL Limited (FIL)) (diversified financial services company). Earlier roles at FIL included Director of Research for FIL’s credit and quantitative teams in London, Hong Kong and Tokyo. Ms. McAuliffe also was the Director of Research for taxable and municipal bonds at Fidelity Investments Money Management, Inc. Ms. McAuliffe is also a director or trustee of several not-for-profit entities.
* Determined to be an “Interested Trustee” by virtue of, among other things, his or her affiliation with the trust or various entities under common control with FMR.
+ The information includes the Trustee's principal occupation during the last five years and other information relating to the experience, attributes, and skills relevant to the Trustee's qualifications to serve as a Trustee, which led to the conclusion that the Trustee should serve as a Trustee for each fund.
Independent Trustees:
Correspondence intended for an Independent Trustee may be sent to Fidelity Investments, P.O. Box 55235, Boston, Massachusetts 02205-5235.
Name, Year of Birth; Principal Occupations and Other Relevant Experience+
Elizabeth S. Acton (1951)
Year of Election or Appointment: 2013
Trustee
Ms. Acton also serves as Trustee of other Fidelity® funds. Prior to her retirement in April 2012, Ms. Acton was Executive Vice President, Finance (2011-2012), Executive Vice President, Chief Financial Officer (2002-2011), and Treasurer (2004-2005) of Comerica Incorporated (financial services). Prior to joining Comerica, Ms. Acton held a variety of positions at Ford Motor Company (1983-2002), including Vice President and Treasurer (2000-2002) and Executive Vice President and Chief Financial Officer of Ford Motor Credit Company (1998-2000). Ms. Acton currently serves as a member of the Board of Directors and Audit and Finance Committees of Beazer Homes USA, Inc. (homebuilding, 2012-present). Previously, Ms. Acton served as a Member of the Advisory Board of certain Fidelity® funds (2013-2016).
Ann E. Dunwoody (1953)
Year of Election or Appointment: 2018
Trustee
General Dunwoody also serves as Trustee of other Fidelity® funds. General Dunwoody (United States Army, Retired) was the first woman in U.S. military history to achieve the rank of four-star general and prior to her retirement in 2012 held a variety of positions within the U.S. Army, including Commanding General, U.S. Army Material Command (2008-2012). She is the President of First to Four LLC (leadership and mentoring services, 2012-present). She also serves as a member of the Board of Directors and Nominating and Corporate Governance Committee of L3 Technologies, Inc. (communication, electronic, sensor, and aerospace systems, 2013-present), Board of Directors and Nomination and Corporate Governance Committees of Kforce Inc. (professional staffing services, 2016-present) and Board of Directors of Automattic Inc. (software engineering, 2018-present). Previously, General Dunwoody served as a Member of the Advisory Board of certain Fidelity® funds (2018), a member of the Board of Directors and Audit and Sustainability and Corporate Responsibility Committees of Republic Services, Inc. (waste collection, disposal and recycling, 2013-2016). Ms. Dunwoody also serves on several boards for non-profit organizations, including as a member of the Board of Directors, Chair of the Nomination and Governance Committee and member of the Audit Committee of Logistics Management Institute (consulting non-profit, 2012-present), a member of the Board of Directors of the Army Historical Foundation (2015-present), a member of the Council of Trustees for the Association of the United States Army (advocacy non-profit, 2013-present) and a member of the Board of Trustees of Florida Institute of Technology (2015-present) and ThanksUSA (military family education non-profit, 2014-present).
John Engler (1948)
Year of Election or Appointment: 2014
Trustee
Mr. Engler also serves as Trustee of other Fidelity® funds. He serves on the board of directors for Universal Forest Products (manufacturer and distributor of wood and wood-alternative products, 2003-present) and K12 Inc. (technology-based education company, 2012-present). Previously, Mr. Engler served as interim president of Michigan State University (2018-2019), a Member of the Advisory Board of certain Fidelity® funds (2014-2016), president of the Business Roundtable (2011-2017), a trustee of The Munder Funds (2003-2014), president and CEO of the National Association of Manufacturers (2004-2011), member of the Board of Trustees of the Annie E. Casey Foundation (2004-2015), and as governor of Michigan (1991-2003). He is a past chairman of the National Governors Association.
Robert F. Gartland (1951)
Year of Election or Appointment: 2010
Trustee
Mr. Gartland also serves as Trustee of other Fidelity® funds. Mr. Gartland is Chairman and an investor in Gartland & Mellina Group Corp. (consulting, 2009-present). Previously, Mr. Gartland served as a partner and investor of Vietnam Partners LLC (investments and consulting, 2008-2011). Prior to his retirement, Mr. Gartland held a variety of positions at Morgan Stanley (financial services, 1979-2007), including Managing Director (1987-2007), and Chase Manhattan Bank (1975-1978).
Arthur E. Johnson (1947)
Year of Election or Appointment: 2008
Trustee
Chairman of the Independent Trustees
Mr. Johnson also serves as Trustee of other Fidelity® funds. Mr. Johnson serves as a member of the Board of Directors of Eaton Corporation plc (diversified power management, 2009-present) and Booz Allen Hamilton (management consulting, 2011-present). Prior to his retirement, Mr. Johnson served as Senior Vice President of Corporate Strategic Development of Lockheed Martin Corporation (defense contractor, 1999-2009). He previously served on the Board of Directors of IKON Office Solutions, Inc. (1999-2008), AGL Resources, Inc. (holding company, 2002-2016), and Delta Airlines (2005-2007). Mr. Arthur E. Johnson is not related to Ms. Abigail P. Johnson.
Michael E. Kenneally (1954)
Year of Election or Appointment: 2009
Trustee
Vice Chairman of the Independent Trustees
Mr. Kenneally also serves as Trustee of other Fidelity® funds. Prior to his retirement, Mr. Kenneally served as Chairman and Global Chief Executive Officer of Credit Suisse Asset Management. Before joining Credit Suisse, he was an Executive Vice President and Chief Investment Officer for Bank of America Corporation. Earlier roles at Bank of America included Director of Research, Senior Portfolio Manager and Research Analyst, and Mr. Kenneally was awarded the Chartered Financial Analyst (CFA) designation in 1991.
Marie L. Knowles (1946)
Year of Election or Appointment: 2001
Trustee
Ms. Knowles also serves as Trustee of other Fidelity® funds. Prior to Ms. Knowles' retirement in June 2000, she served as Executive Vice President and Chief Financial Officer of Atlantic Richfield Company (ARCO) (diversified energy, 1996-2000). From 1993 to 1996, she was a Senior Vice President of ARCO and President of ARCO Transportation Company (pipeline and tanker operations). Ms. Knowles currently serves as a Director and Chairman of the Audit Committee of McKesson Corporation (healthcare service, since 2002). Ms. Knowles is a member of the Board of the Santa Catalina Island Company (real estate, 2009-present). Ms. Knowles is a Member of the Investment Company Institute Board of Governors and a Member of the Governing Council of the Independent Directors Council (2014-present). She also serves as a member of the Advisory Board for the School of Engineering of the University of Southern California. Previously, Ms. Knowles served as a Director of Phelps Dodge Corporation (copper mining and manufacturing, 1994-2007), URS Corporation (engineering and construction, 2000-2003) and America West (airline, 1999-2002). Ms. Knowles previously served as Chairman (2015-2018) and Vice Chairman (2012-2015) of the Independent Trustees of certain Fidelity® funds.
Mark A. Murray (1954)
Year of Election or Appointment: 2016
Trustee
Mr. Murray also serves as Trustee of other Fidelity® funds. Mr. Murray is Vice Chairman (2013-present) of Meijer, Inc. (regional retail chain). Previously, Mr. Murray served as a Member of the Advisory Board of certain Fidelity® funds (2016) and as Co-Chief Executive Officer (2013-2016) and President (2006-2013) of Meijer, Inc. Mr. Murray serves as a member of the Board of Directors and Nuclear Review and Public Policy and Responsibility Committees of DTE Energy Company (diversified energy company, 2009-present). Mr. Murray also serves as a member of the Board of Directors of Spectrum Health (not-for-profit health system, 2015-present). Mr. Murray previously served as President of Grand Valley State University (2001-2006), Treasurer for the State of Michigan (1999-2001), Vice President of Finance and Administration for Michigan State University (1998-1999), and a member of the Board of Directors and Audit Committee and Chairman of the Nominating and Corporate Governance Committee of Universal Forest Products, Inc. (manufacturer and distributor of wood and wood-alternative products, 2004-2016). Mr. Murray is also a director or trustee of many community and professional organizations.
+ The information includes the Trustee's principal occupation during the last five years and other information relating to the experience, attributes, and skills relevant to the Trustee's qualifications to serve as a Trustee, which led to the conclusion that the Trustee should serve as a Trustee for each fund.
Advisory Board Members and Officers:
Correspondence intended for an officer may be sent to Fidelity Investments, 245 Summer Street, Boston, Massachusetts 02210. Officers appear below in alphabetical order.
Name, Year of Birth; Principal Occupation
Elizabeth Paige Baumann (1968)
Year of Election or Appointment: 2017
Anti-Money Laundering (AML) Officer
Ms. Baumann also serves as AML Officer of other funds. She is Chief AML Officer (2012-present) and Senior Vice President (2014-present) of FMR LLC (diversified financial services company) and is an employee of Fidelity Investments. Previously, Ms. Baumann served as AML Officer of the funds (2012-2016), and Vice President (2007-2014) and Deputy Anti-Money Laundering Officer (2007-2012) of FMR LLC.
Craig S. Brown (1977)
Year of Election or Appointment: 2019
Assistant Treasurer
Mr. Brown also serves as Assistant Treasurer of other funds. Mr. Brown is an employee of Fidelity Investments (2013-present).
John J. Burke III (1964)
Year of Election or Appointment: 2018
Chief Financial Officer
Mr. Burke also serves as Chief Financial Officer of other funds. Mr. Burke serves as Head of Investment Operations for Fidelity Fund and Investment Operations (2018-present) and is an employee of Fidelity Investments (1998-present). Previously Mr. Burke served as head of Asset Management Investment Operations (2012-2018).
William C. Coffey (1969)
Year of Election or Appointment: 2018
Secretary and Chief Legal Officer (CLO)
Mr. Coffey also serves as Secretary and CLO of other funds. Mr. Coffey serves as CLO, Secretary, and Senior Vice President of Fidelity Management & Research Company and FMR Co., Inc. (investment adviser firms, 2018-present); Secretary of Fidelity SelectCo, LLC and Fidelity Investments Money Management, Inc. (investment adviser firms, 2018-present); and CLO of Fidelity Management & Research (Hong Kong) Limited, FMR Investment Management (UK) Limited, and Fidelity Management & Research (Japan) Limited (investment adviser firms, 2018-present). He is Senior Vice President and Deputy General Counsel of FMR LLC (diversified financial services company, 2010-present), and is an employee of Fidelity Investments. Previously, Mr. Coffey served as Assistant Secretary of certain funds (2009-2018) and as Vice President and Associate General Counsel of FMR LLC (2005-2009).
Jonathan Davis (1968)
Year of Election or Appointment: 2010
Assistant Treasurer
Mr. Davis also serves as Assistant Treasurer of other funds. Mr. Davis serves as Assistant Treasurer of FMR Capital, Inc. (2017-present) and is an employee of Fidelity Investments. Previously, Mr. Davis served as Vice President and Associate General Counsel of FMR LLC (diversified financial services company, 2003-2010).
Adrien E. Deberghes (1967)
Year of Election or Appointment: 2010
Assistant Treasurer
Mr. Deberghes also serves as an officer of other funds. He serves as Assistant Treasurer of FMR Capital, Inc. (2017-present), Executive Vice President of Fidelity Investments Money Management, Inc. (FIMM) (investment adviser firm, 2016-present), and is an employee of Fidelity Investments (2008-present). Previously, Mr. Deberghes served as President and Treasurer of certain Fidelity® funds (2013-2018). Prior to joining Fidelity Investments, Mr. Deberghes was Senior Vice President of Mutual Fund Administration at State Street Corporation (2007-2008), Senior Director of Mutual Fund Administration at Investors Bank & Trust (2005-2007), and Director of Finance for Dunkin' Brands (2000-2005). Previously, Mr. Deberghes served in other fund officer roles.
Laura M. Del Prato (1964)
Year of Election or Appointment: 2018
President and Treasurer
Ms. Del Prato also serves as an officer of other funds. Ms. Del Prato is an employee of Fidelity Investments (2017-present). Prior to joining Fidelity Investments, Ms. Del Prato served as a Managing Director and Treasurer of the JPMorgan Mutual Funds (2014-2017). Prior to JPMorgan, Ms. Del Prato served as a partner at Cohen Fund Audit Services (accounting firm, 2012-2013) and KPMG LLP (accounting firm, 2004-2012).
Colm A. Hogan (1973)
Year of Election or Appointment: 2016
Assistant Treasurer
Mr. Hogan also serves as an officer of other funds. Mr. Hogan serves as Assistant Treasurer of FMR Capital, Inc. (2017-present) and is an employee of Fidelity Investments (2005-present). Previously, Mr. Hogan served as Assistant Treasurer of certain Fidelity® funds (2016-2018).
Chris Maher (1972)
Year of Election or Appointment: 2013
Assistant Treasurer
Mr. Maher serves as Assistant Treasurer of other funds. Mr. Maher is Vice President of Valuation Oversight, serves as Assistant Treasurer of FMR Capital, Inc. (2017-present), and is an employee of Fidelity Investments. Previously, Mr. Maher served as Vice President of Asset Management Compliance (2013), Vice President of the Program Management Group of FMR (investment adviser firm, 2010-2013), and Vice President of Valuation Oversight (2008-2010).
John B. McGinty, Jr. (1962)
Year of Election or Appointment: 2016
Chief Compliance Officer
Mr. McGinty also serves as Chief Compliance Officer of other funds. Mr. McGinty is Senior Vice President of Asset Management Compliance for Fidelity Investments and is an employee of Fidelity Investments (2016-present). Mr. McGinty previously served as Vice President, Senior Attorney at Eaton Vance Management (investment management firm, 2015-2016), and prior to Eaton Vance as global CCO for all firm operations and registered investment companies at GMO LLC (investment management firm, 2009-2015). Before joining GMO LLC, Mr. McGinty served as Senior Vice President, Deputy General Counsel for Fidelity Investments (2007-2009).
Jason P. Pogorelec (1975)
Year of Election or Appointment: 2015
Assistant Secretary
Mr. Pogorelec also serves as Assistant Secretary of other funds. Mr. Pogorelec serves as Vice President, Associate General Counsel (2010-present) and is an employee of Fidelity Investments (2006-present).
Nancy D. Prior (1967)
Year of Election or Appointment: 2014
Vice President
Ms. Prior also serves as Vice President of other funds. Ms. Prior serves as President Fixed Income, High Income/Emerging Market Debt and Multi Asset Class Strategies of FIAM LLC (2018-present), President (2016-present) and Director (2014-present) of Fidelity Investments Money Management, Inc. (FIMM) (investment adviser firm), President, Fixed Income (2014-present), and is an employee of Fidelity Investments (2002-present). Previously, Ms. Prior served as Vice Chairman of FIAM LLC (investment adviser firm, 2014-2018), a Director of FMR Investment Management (UK) Limited (investment adviser firm, 2015-2018), President Multi-Asset Class Strategies of FMR's Global Asset Allocation Division (2017-2018), Vice President of Fidelity's Money Market Funds (2012-2014), President, Money Market and Short Duration Bond Group of Fidelity Management & Research (FMR) (investment adviser firm, 2013-2014), President, Money Market Group of FMR (2011-2013), Managing Director of Research (2009-2011), Senior Vice President and Deputy General Counsel (2007-2009), and Assistant Secretary of certain Fidelity® funds (2008-2009).
Stacie M. Smith (1974)
Year of Election or Appointment: 2013
Assistant Treasurer
Ms. Smith also serves as an officer of other funds. Ms. Smith serves as Assistant Treasurer of FMR Capital, Inc. (2017-present), is an employee of Fidelity Investments (2009-present), and has served in other fund officer roles. Prior to joining Fidelity Investments, Ms. Smith served as Senior Audit Manager of Ernst & Young LLP (accounting firm, 1996-2009). Previously, Ms. Smith served as Assistant Treasurer (2013-2018) and Deputy Treasurer (2013-2016) of certain Fidelity® funds.
Marc L. Spector (1972)
Year of Election or Appointment: 2016
Deputy Treasurer
Mr. Spector also serves as an officer of other funds. Mr. Spector serves as Assistant Treasurer of FMR Capital, Inc. (2017-present) and is an employee of Fidelity Investments (2016-present). Prior to joining Fidelity Investments, Mr. Spector served as Director at the Siegfried Group (accounting firm, 2013-2016), and prior to Siegfried Group as audit senior manager at Deloitte & Touche (accounting firm, 2005-2013).
Jim Wegmann (1979)
Year of Election or Appointment: 2019
Assistant Treasurer
Mr. Wegmann also serves as Assistant Treasurer of other funds. Mr. Wegmann is an employee of Fidelity Investments (2011-present).
Shareholder Expense Example
As a shareholder of a Fund, you incur two types of costs: (1) transaction costs and (2) ongoing costs, including management fees, distribution and/or service (12b-1) fees and other Fund expenses. This Example is intended to help you understand your ongoing costs (in dollars) of investing in the Funds and to compare these costs with the ongoing costs of investing in other mutual funds.
The Example is based on an investment of $1,000 invested at the beginning of the period and held for the entire period (July 1, 2018 to December 31, 2018).
Actual Expenses
The first line of the accompanying table for each class of the Fund provides information about actual account values and actual expenses. You may use the information in this line, together with the amount you invested, to estimate the expenses that you paid over the period. Simply divide your account value by $1,000.00 (for example, an $8,600 account value divided by $1,000.00 = 8.6), then multiply the result by the number in the first line for a class of the Fund under the heading entitled "Expenses Paid During Period" to estimate the expenses you paid on your account during this period. The estimate of expenses does not include any fees or other expenses of any variable annuity or variable life insurance product. If they were, the estimate of expenses you paid during the period would be higher, and your ending account value would be lower. In addition, the Fund, as a shareholder in the underlying Fidelity Central Funds, will indirectly bear its pro-rata share of the fees and expenses incurred by the underlying Fidelity Central Funds. These fees and expenses are not included in the Fund's annualized expense ratio used to calculate the expense estimate in the table below.
The first line of the accompanying table for each Class of each fund provides information about actual account values and actual expenses. You may use the information in this line, together with the amount you invested, to estimate the expenses that you paid over the period. Simply divide your account value by $1,000.00 (for example, an $8,600 account value divided by $1,000.00 = 8.6), then multiply the result by the number in the first line for a Class of the fund under the heading entitled "Expenses Paid During Period" to estimate the expenses you paid on your account during this period. The estimate of expenses does not include any fees or other expenses of any variable annuity or variable life insurance product. If they were, the estimate of expenses you paid during the period would be higher, and your ending account value would be lower. In addition, each Fund, as a shareholder in underlying Fidelity Funds, will indirectly bear its pro-rata share of the fees and expenses incurred by the underlying Fidelity Funds. These fees and expenses are not included in each Fund's annualized expense ratio used to calculate the expense estimates in the table below.
Hypothetical Example for Comparison Purposes
The second line of the accompanying table for each class of the Fund provides information about hypothetical account values and hypothetical expenses based on a Class' actual expense ratio and an assumed rate of return of 5% per year before expenses, which is not the Class' actual return. The hypothetical account values and expenses may not be used to estimate the actual ending account balance or expenses you paid for the period. You may use this information to compare the ongoing costs of investing in the Fund and other funds. To do so, compare this 5% hypothetical example with the 5% hypothetical examples that appear in the shareholder reports of the other funds. The estimate of expenses does not include any fees or other expenses of any variable annuity or variable life insurance product. If they were, the estimate of expenses you paid during the period would be higher, and your ending account value would be lower. In addition, the Fund, as a shareholder in the underlying Fidelity Central Funds, will indirectly bear its pro-rata share of the fees and expenses incurred by the underlying Fidelity Central Funds. These fees and expenses are not included in the Fund's annualized expense ratio used to calculate the expense estimate in the table below.
The second line of the accompanying table for each Class of each fund provides information about hypothetical account values and hypothetical expenses based on a Class' actual expense ratio and an assumed rate of return of 5% per year before expenses, which is not the Class' actual return. The hypothetical account values and expenses may not be used to estimate the actual ending account balance or expenses you paid for the period. You may use this information to compare the ongoing costs of investing in the Fund and other funds. To do so, compare this 5% hypothetical example with the 5% hypothetical examples that appear in the shareholder reports of the other funds. The estimate of expenses does not include any fees or other expenses of any variable annuity or variable life insurance product. If they were, the estimate of expenses you paid during the period would be higher, and your ending account value would be lower. In addition, each Fund, as a shareholder in underlying Fidelity Funds, will indirectly bear its pro-rata share of the fees and expenses incurred by the underlying Fidelity Funds. These fees and expenses are not included in each Fund's annualized expense ratio used to calculate the expense estimates in the table below.
Please note that the expenses shown in the table are meant to highlight your ongoing costs only and do not reflect any transaction costs. Therefore, the second line of the table is useful in comparing ongoing costs only, and will not help you determine the relative total costs of owning different funds.
| | Annualized Expense Ratio-A | Beginning
Account Value
July 1, 2018 | Ending
Account Value
December 31, 2018 | Expenses Paid
During Period-B
July 1, 2018
to December 31, 2018 |
| VIP FundsManager 20% Portfolio | | | | |
| Service Class | .20% | | | |
| Actual | | $1,000.00 | $984.90 | $1.00 |
| Hypothetical-C | | $1,000.00 | $1,024.20 | $1.02 |
| Service Class 2 | .35% | | | |
| Actual | | $1,000.00 | $984.20 | $1.75 |
| Hypothetical-C | | $1,000.00 | $1,023.44 | $1.79 |
| Investor Class | .20% | | | |
| Actual | | $1,000.00 | $984.00 | $1.00 |
| Hypothetical-C | | $1,000.00 | $1,024.20 | $1.02 |
| VIP FundsManager 50% Portfolio | | | | |
| Service Class | .20% | | | |
| Actual | | $1,000.00 | $943.20 | $.98 |
| Hypothetical-C | | $1,000.00 | $1,024.20 | $1.02 |
| Service Class 2 | .35% | | | |
| Actual | | $1,000.00 | $942.20 | $1.71 |
| Hypothetical-C | | $1,000.00 | $1,023.44 | $1.79 |
| Investor Class | .20% | | | |
| Actual | | $1,000.00 | $943.20 | $.98 |
| Hypothetical-C | | $1,000.00 | $1,024.20 | $1.02 |
| VIP FundsManager 60% Portfolio | | | | |
| Service Class | .20% | | | |
| Actual | | $1,000.00 | $928.20 | $.97 |
| Hypothetical-C | | $1,000.00 | $1,024.20 | $1.02 |
| Service Class 2 | .35% | | | |
| Actual | | $1,000.00 | $928.30 | $1.70 |
| Hypothetical-C | | $1,000.00 | $1,023.44 | $1.79 |
| Investor Class | .20% | | | |
| Actual | | $1,000.00 | $929.10 | $.97 |
| Hypothetical-C | | $1,000.00 | $1,024.20 | $1.02 |
| VIP FundsManager 70% Portfolio | | | | |
| Service Class | .20% | | | |
| Actual | | $1,000.00 | $914.40 | $.97 |
| Hypothetical-C | | $1,000.00 | $1,024.20 | $1.02 |
| Service Class 2 | .35% | | | |
| Actual | | $1,000.00 | $914.70 | $1.69 |
| Hypothetical-C | | $1,000.00 | $1,023.44 | $1.79 |
| Investor Class | .20% | | | |
| Actual | | $1,000.00 | $915.10 | $.97 |
| Hypothetical-C | | $1,000.00 | $1,024.20 | $1.02 |
| VIP FundsManager 85% Portfolio | | | | |
| Service Class | - % | | | |
| Actual | | $1,000.00 | $896.00 | $- |
| Hypothetical-C | | $1,000.00 | $1,025.21 | $- |
| Service Class 2 | .35% | | | |
| Actual | | $1,000.00 | $894.80 | $1.67 |
| Hypothetical-C | | $1,000.00 | $1,023.44 | $1.79 |
| Investor Class | .20% | | | |
| Actual | | $1,000.00 | $896.10 | $.96 |
| Hypothetical-C | | $1,000.00 | $1,024.20 | $1.02 |
A Annualized expense ratio reflects expenses net of applicable fee waivers.
B Expenses are equal to each Class' annualized expense ratio, multiplied by the average account value over the period, multiplied by 184/ 365 (to reflect the one-half year period). The fees and expenses of the underlying Fidelity Funds in which each Fund invests are not included in each Class' annualized expense ratio.
C 5% return per year before expenses
Distributions (Unaudited)
The Board of Trustees of each fund voted to pay to shareholders of record at the opening of business on record date, the following distributions per share derived from capital gains realized from sales of portfolio securities and dividends derived from net investment income:
| | Pay Date | Record Date | Dividends | Capital Gains |
| VIP FundsManager 20% | | | | |
| Investor Class | 02/15/19 | 02/15/19 | $0.018 | $0.432 |
| Service Class | 02/15/19 | 02/15/19 | $0.018 | $0.432 |
| Service Class 2 | 02/15/19 | 02/15/19 | $0.017 | $0.432 |
| VIP FundsManager 50% | | | | |
| Investor Class | 02/15/19 | 02/15/19 | $0.031 | $1.150 |
| Service Class | 02/15/19 | 02/15/19 | $0.031 | $1.150 |
| Service Class 2 | 02/15/19 | 02/15/19 | $0.030 | $1.150 |
| VIP FundsManager 60% | | | | |
| Investor Class | 02/15/19 | 02/15/19 | $0.031 | $1.737 |
| Service Class | 02/15/19 | 02/15/19 | $0.031 | $1.737 |
| Service Class 2 | 02/15/19 | 02/15/19 | $0.030 | $1.737 |
| VIP FundsManager 70% | | | | |
| Investor Class | 02/15/19 | 02/15/19 | $0.039 | $1.605 |
| Service Class | 02/15/19 | 02/15/19 | $0.039 | $1.605 |
| Service Class 2 | 02/15/19 | 02/15/19 | $0.038 | $1.605 |
| VIP FundsManager 85% | | | | |
| Investor Class | 02/15/19 | 02/15/19 | $0.045 | $1.985 |
| Service Class | 02/15/19 | 02/15/19 | $0.045 | $1.985 |
| Service Class 2 | 02/15/19 | 02/15/19 | $0.045 | $1.985 |
|
The funds hereby designate as capital gain dividend the amounts noted below for the taxable year ended December 31, 2018, or, if subsequently determined to be different, the net capital gain of such year.
| VIP FundsManager 20% | $27,893,593 |
| VIP FundsManager 50% | $536,550,412 |
| VIP FundsManager 60% | $877,427,062 |
| VIP FundsManager 70% | $186,205,156 |
| VIP FundsManager 85% | $82,143,459 |
|
A percentage of the dividends distributed during the fiscal year for the following funds were derived from interest on U.S. Government securities which is generally exempt from state income tax
| VIP FundsManager 20% | 15.34% |
| VIP FundsManager 50% | 7.44% |
| VIP FundsManager 60% | 5.66% |
| VIP FundsManager 70% | 3.90% |
| VIP FundsManager 85% | 2.12% |
|
A percentage of the dividends distributed during the fiscal year for the following funds qualify for the dividends–received deduction for corporate shareholders:
| | Investor Class | Service Class | Service Class 2 |
| VIP FundsManager 20% | | | |
| December 2018 | 7% | 7% | 8% |
| VIP FundsManager 50% | | | |
| December 2018 | 17% | 17% | 18% |
| VIP FundsManager 60% | | | |
| December 2018 | 22% | 22% | 23% |
| VIP FundsManager 70% | | | |
| December 2018 | 27% | 27% | 30% |
| VIP FundsManager 85% | | | |
| February 2018 | 1% | 1% | 1% |
| December 2018 | 40% | 40% | 44% |
|
The amounts per share which represent income derived from sources within, and taxes paid to, foreign countries or possessions of the United States are as follows:
| | Pay Date | Income | Taxes |
| VIP FundsManager 20% | | | |
| Investor Class | 12/21/18 | $0.0094 | $0.0010 |
| Service Class | 12/21/18 | $0.0094 | $0.0010 |
| Service Class 2 | 12/21/18 | $0.0087 | $0.0010 |
| VIP FundsManager 50% | | | |
| Investor Class | 12/21/18 | $0.0308 | $0.0034 |
| Service Class | 12/21/18 | $0.0308 | $0.0034 |
| Service Class 2 | 12/21/18 | $0.0286 | $0.0034 |
| VIP FundsManager 60% | | | |
| Investor Class | 12/21/18 | $0.0333 | $0.0037 |
| Service Class | 12/21/18 | $0.0333 | $0.0037 |
| Service Class 2 | 12/21/18 | $0.0309 | $0.0037 |
| VIP FundsManager 70% | | | |
| Investor Class | 12/21/18 | $0.0457 | $0.0051 |
| Service Class | 12/21/18 | $0.0457 | $0.0051 |
| Service Class 2 | 12/21/18 | $0.0419 | $0.0051 |
| VIP FundsManager 85% | | | |
| Investor Class | 12/21/18 | $0.0553 | $0.0061 |
| Service Class | 12/21/18 | $0.0553 | $0.0061 |
| Service Class 2 | 12/21/18 | $0.0502 | $0.0061 |
|
Board Approval of Investment Advisory Contracts and Management Fees
VIP FundsManager Funds
Each year, the Board of Trustees, including the Independent Trustees (together, the Board), votes on the renewal of the management contract (the Advisory Contract) with FMR Co., Inc. (FMRC), an affiliate of Fidelity Management & Research Company (FMR), for each fund. The Board, assisted by the advice of fund counsel and Independent Trustees' counsel, requests and considers a broad range of information relevant to the renewal of the Advisory Contracts throughout the year.
The Board meets regularly and, at each of its meetings, covers an extensive agenda of topics and materials and considers factors that are relevant to its annual consideration of the renewal of each fund's Advisory Contract, including the services and support provided to each fund and its shareholders. The Board has established four standing committees (Committees) — Operations, Audit, Fair Valuation, and Governance and Nominating — each composed of and chaired by Independent Trustees with varying backgrounds, to which the Board has assigned specific subject matter responsibilities in order to enhance effective decision-making by the Board. The Operations Committee, of which all of the Independent Trustees are members, meets regularly throughout the year and considers, among other matters, information specifically related to the annual consideration of the renewal of each fund's Advisory Contract. The Board, acting directly and through its Committees, requests and receives information concerning the annual consideration of the renewal of each fund's Advisory Contract. The Board also meets as needed to review matters specifically related to the Board's annual consideration of the renewal of the Advisory Contracts. Members of the Board may also meet with trustees of other Fidelity funds through joint ad hoc committees to discuss certain matters relevant to all of the Fidelity funds.
At its September 2018 meeting, the Board unanimously determined to renew each fund's Advisory Contract. In reaching its determination, the Board considered all factors it believed relevant, including (i) the nature, extent, and quality of the services to be provided to each fund and its shareholders (including the investment performance of each fund); (ii) the competitiveness of each fund's management fee and total expense ratio relative to peer funds; (iii) the total costs of the services to be provided by and the profits to be realized by Fidelity from its relationships with each fund; and (iv) the extent to which, if any, economies of scale exist and would be realized as each fund grows, and whether any economies of scale are appropriately shared with fund shareholders.
In considering whether to renew the Advisory Contract for each fund, the Board reached a determination, with the assistance of fund counsel and Independent Trustees' counsel and through the exercise of its business judgment, that the renewal of the Advisory Contract was in the best interests of each fund and its shareholders and that the compensation payable under the Advisory Contracts was fair and reasonable. The Board's decision to renew the Advisory Contracts was not based on any single factor, but rather was based on a comprehensive consideration of all the information provided to the Board at its meetings throughout the year. The Board, in reaching its determination to renew the Advisory Contracts, was aware that shareholders of each fund have a broad range of investment choices available to them, including a wide choice among funds offered by Fidelity's competitors, and that each fund's shareholders, who have the opportunity to review and weigh the disclosure provided by the fund in its prospectus and other public disclosures, have chosen to invest in that fund, which is part of the Fidelity family of funds.
Nature, Extent, and Quality of Services Provided. The Board considered Fidelity's staffing as it relates to the funds, including the backgrounds of investment personnel of FMRC, and also considered the funds' investment objectives, strategies, and related investment philosophies. The Independent Trustees also had discussions with senior management of Fidelity's investment operations and investment groups with responsibility for the underlying Fidelity funds in which each fund invests. The Board considered the structure of the investment personnel compensation program and whether this structure provides appropriate incentives to act in the best interests of each fund. Additionally, the Board considered the portfolio managers' investments, if any, in the funds that they manage.
Resources Dedicated to Investment Management and Support Services. The Board reviewed the general qualifications and capabilities of Fidelity's investment staff, including its size, education, experience, and resources, as well as Fidelity's approach to recruiting, managing, and compensating investment personnel. The Board noted that Fidelity has continued to increase the resources devoted to non-U.S. offices, including expansion of Fidelity's global investment organization. The Board also noted that Fidelity's analysts have extensive resources, tools and capabilities that allow them to conduct sophisticated quantitative and fundamental analysis, as well as credit analysis of issuers, counterparties and guarantors. Further, the Board considered that Fidelity's investment professionals have sufficient access to global information and data so as to provide competitive investment results over time, and that those professionals also have access to sophisticated tools that permit them to assess portfolio construction and risk and performance attribution characteristics continuously, as well as to transmit new information and research conclusions rapidly around the world. Additionally, in its deliberations, the Board considered Fidelity's risk management, compliance, and technology and operations capabilities and resources, which are integral parts of the investment management process.
Shareholder and Administrative Services. The Board considered (i) the nature, extent, quality, and cost of advisory, administrative, and shareholder services performed by Fidelity under the Advisory Contract and under separate agreements covering transfer agency, and pricing and bookkeeping services for each fund; (ii) the nature and extent of the supervision of third party service providers, principally custodians, subcustodians, and pricing vendors; and (iii) the resources devoted to, and the record of compliance with, each fund's compliance policies and procedures.
The Board noted that the growth of fund assets over time across the complex allows Fidelity to reinvest in the development of services designed to enhance the value and convenience of the Fidelity funds as investment vehicles. These services include 24-hour access to account information and market information through telephone representatives and over the Internet, investor education materials and asset allocation tools, and the expanded availability of Fidelity Investor Centers.
Investment in a Large Fund Family. The Board considered the benefits to shareholders of investing in a Fidelity fund, including the benefits of investing in a fund that is part of a large family of funds offering a variety of investment disciplines and providing a large variety of mutual fund investor services. The Board noted that Fidelity had taken, or had made recommendations that resulted in the Fidelity funds taking, a number of actions over the previous year that benefited particular funds, including: (i) continuing to dedicate additional resources to Fidelity's investment research process, which includes meetings with management of issuers of securities in which the funds invest, and to the support of the senior management team that oversees asset management; (ii) continuing efforts to enhance Fidelity's global research capabilities; (iii) launching new funds and making other enhancements to meet client needs; (iv) launching new share classes of existing funds; (v) eliminating purchase minimums and broadening eligibility requirements for certain funds and share classes; (vi) reducing management fees and total expenses for certain growth equity funds and index funds; (vii) lowering expense caps for certain existing funds and classes, and converting certain voluntary expense caps to contractual caps, to reduce expenses borne by shareholders; (viii) eliminating short-term redemption fees for funds that had such fees; (ix) rationalizing product lines and gaining increased efficiencies from fund mergers and share class consolidations; (x) continuing to develop, acquire and implement systems and technology to improve services to the funds and shareholders, strengthen information security, and increase efficiency; and (xi) continuing to implement enhancements to further strengthen Fidelity's product line to increase investors' probability of success in achieving their investment goals, including retirement income goals.
Investment Performance. The Board considered whether each fund has operated in accordance with its investment objective, as well as its record of compliance with its investment restrictions and its performance history. The Board noted that there was a portfolio management change for each fund in January 2018.
The Board took into account discussions that occur at Board meetings throughout the year with representatives of the investment adviser about fund investment performance. In this regard the Board noted that as part of regularly scheduled fund reviews and other reports to the Board on fund performance, the Board considers annualized return information for each fund for different time periods, measured against one or more appropriate securities market indices, including a customized blended index that reflects the respective weights of the fund's asset classes (each a "benchmark index") and a peer group of funds with similar objectives ("peer group"), if any. In its evaluation of fund investment performance at meetings throughout the year, the Board gave particular attention to information indicating underperformance of certain Fidelity funds for specific time periods and discussed with the investment adviser the reasons for such underperformance.
In addition to reviewing absolute and relative fund performance, the Independent Trustees periodically consider the appropriateness of fund performance metrics in evaluating the results achieved. In general, the Independent Trustees believe that fund performance should be evaluated based on gross performance (before fees and expenses, including acquired fund fees and expenses, but after transaction costs, if any) compared to appropriate benchmark indices, over appropriate time periods that may include full market cycles, and on net performance (after fees and expenses, including acquired fund fees and expenses) compared to peer groups, as applicable, over the same periods, taking into account relevant factors including the following: general market conditions; the extent to which particular underlying funds affected performance; and fund cash flows and other factors. Depending on the circumstances, the Independent Trustees may be satisfied with a fund's performance notwithstanding that it lags its benchmark index or peer group for certain periods.
The Independent Trustees recognize that shareholders evaluate performance on a net basis over their own holding periods, for which one-, three-, and five-year periods are often used as a proxy. For this reason, the performance information reviewed by the Board also included net cumulative calendar year total return information for each fund and an appropriate benchmark index for the most recent one-, three-, and five-year periods.
Based on its review, the Board concluded that the nature, extent, and quality of services provided to each fund under the Advisory Contracts should continue to benefit the shareholders of each fund.
Competitiveness of Management Fee and Total Expense Ratio. The Board considered each fund's management fee and total expense ratio compared to "mapped groups" of competitive funds and classes created for the purpose of facilitating the Trustees' competitive analysis of management fees and total expenses, and also considered that each fund bears indirectly the fees and expenses, including the management fees, paid by the underlying Fidelity funds in which it invests. Fidelity creates "mapped groups" by combining similar Lipper investment objective categories that have comparable investment mandates. Combining Lipper investment objective categories aids the Board's management fee and total expense ratio comparisons by broadening the competitive group used for comparison.
Management Fee. The Board considered two proprietary management fee comparisons for the 12-month periods shown in basis points (BP) in the charts below. The group of Lipper funds used by the Board for management fee comparisons is referred to below as the "Total Mapped Group." The Total Mapped Group comparison focuses on a fund's standing in terms of gross management fees before expense reimbursements or caps relative to the total universe of funds with comparable investment mandates, regardless of whether their management fee structures also are comparable. Funds with comparable investment mandates offer exposure to similar types of securities. Funds with comparable management fee structures have similar management fee contractual arrangements (e.g., flat rate charged for advisory services, all-inclusive fee rate, etc.). "TMG %" represents the percentage of funds in the Total Mapped Group that had management fees that were lower than a fund's. For example, a hypothetical TMG % of 20% would mean that 80% of the funds in the Total Mapped Group had higher, and 20% had lower, management fees than a fund. The funds' actual TMG %s and the number of funds in the Total Mapped Group are in the charts below. The "Asset-Size Peer Group" (ASPG) comparison focuses on a fund's standing relative to a subset of non-Fidelity funds within the Total Mapped Group that are similar in size and management fee structure. For example, if a fund is in the first quartile of the ASPG, the fund's management fee ranks in the least expensive or lowest 25% of funds in the ASPG. The ASPG represents at least 15% of the funds in the Total Mapped Group with comparable asset size and management fee structures, subject to a minimum of 50 funds (or all funds in the Total Mapped Group if fewer than 50). Additional information, such as the ASPG quartile in which a fund's management fee rate ranked, is also included in the charts and was considered by the Board. Because the vast majority of competitor funds' management fees do not cover non-management expenses, in prior years, each fund was compared on the basis of a hypothetical "net management fee," which was derived by subtracting payments made by FMR for non-management expenses (including pricing and bookkeeping fees and fees paid to non-affiliated custodians) from the fund's all-inclusive fee. Fidelity no longer calculates hypothetical net management fees for the funds and, as a result, the charts do not include hypothetical net management fees for 2017.
VIP FundsManager 20%
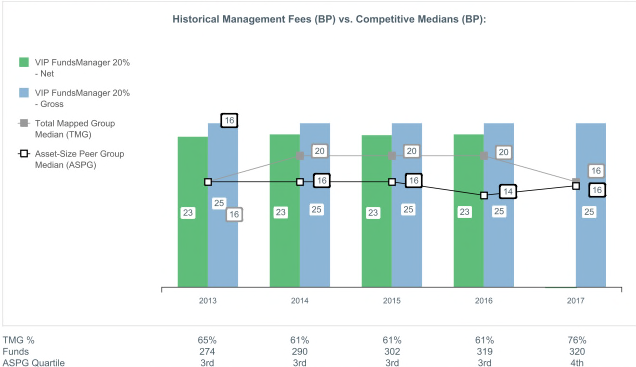
VIP FundsManager 50%

VIP FundsManager 60%
VIP FundsManager 70%

VIP FundsManager 85%
The Board noted that each fund's management fee rate ranked above the median of its Total Mapped Group and above the median of its ASPG for 2017. The Board considered that the funds are more actively managed than most funds in their Total Mapped Group and ASPG and have a larger universe of funds in which to invest.
The Board considered that FMRC has contractually agreed to waive 0.05% of each fund's management fee through April 30, 2019.
The Board noted that it and the boards of other Fidelity funds formed an ad hoc Committee on Group Fee, which meets periodically, to conduct an in-depth review of the "group fee" component of the management fee of funds with such management fee structures, and that while the funds do not pay a management fee with a group fee component, they indirectly bear a portion of the management fees paid by the Fidelity funds in which they invest, some of which are subject to the group fee. The Committee's focus included the mechanics of the group fee, the competitive landscape of group fee structures, Fidelity funds with no group fee component (such as the funds) and investment products not included in group fee assets. The Board also considered that, for funds subject to the group fee, FMR agreed to voluntarily waive fees over a specified period of time in amounts designed to account for assets converted from certain funds to certain collective investment trusts.
Based on its review, the Board concluded that each fund's management fee is fair and reasonable in light of the services that the fund receives and the other factors considered.
Total Expense Ratio. In its review of the total expense ratio of each class of each fund, the Board considered the fund's all-inclusive fee rate. The Board also considered other expenses, such as pricing and bookkeeping fees and custodial, legal, and audit fees, paid by FMR under the all-inclusive arrangement. The Board also considered fund-paid 12b-1 fees. The Board also noted that Fidelity may agree to waive fees and expenses from time to time, and the extent to which, if any, it has done so for each fund. As part of its review, the Board also considered the current and historical total expense ratios of each class of each fund compared to competitive fund median expenses. Each class of each fund is compared to those funds and classes in the Total Mapped Group (used by the Board for management fee comparisons) that have a similar sales load structure.
The Board noted that each fund offers multiple classes, each of which has a different 12b-1 fee structure, and that the multiple structures are intended to offer a range of pricing options for the intermediary market. The Board also noted that the total expense ratios of the classes of each fund vary primarily by the level of their 12b-1 fees.
The Board noted that the total expense ratio of each of Investor Class and Service Class of each fund ranked below the competitive median for 2017 and the total expense ratio of Service Class 2 of each fund ranked above the competitive median for 2017. The Board considered that, in general, various factors can affect total expense ratios. The Board noted that the total expense ratio of Service Class 2 was above the competitive median because of its 12b-1 fees and that excluding 12b-1 fees of both the class and competitor classes, the total expense ratio of Service Class 2 ranked below the median.
In considering the total expense ratio of each class of each fund, the Board also considered an alternative competitive analysis that included both top level (
i.e., direct) fund fees and acquired fund fees and expenses for the class and the other funds and classes to which it is compared. The Board noted that, under this alternative competitive analysis, the total expense ratio of each of Investor Class and Service Class of each fund, except VIP FundsManager 85%, ranked below the competitive median for 2017 and the total expense ratio of each of Investor Class and Service Class of VIP FundsManager 85% ranked above the competitive median for 2017 because of its 12b-1 fees and higher acquired fund fees and expenses compared to competitor funds. The Board noted that the total expense ratio of Service Class 2 of VIP FundsManager 20% and VIP FundsManager 50% ranked below the competitive median for 2017, the total expense ratio of Service Class 2 of VIP FundsManager 60% ranked equal to the competitive median for 2017, and the total expense ratio of Service Class 2 of VIP FundsManager 70% and VIP FundsManager 85% ranked above the competitive median for 2017. The Board noted that, for each fund for which Service Class 2 was above the competitive median, the class was above the median because of its 12b-1 fees and, in the case of VIP FundsManager 85%, because of its higher acquired fund fees and expenses compared to competitor funds.
The Board further considered that FMR contractually agreed to reimburse 0.10% of "class-level" expenses for Service Class and Service Class 2 as long as these classes continue to be sold to unaffiliated insurance companies.
Fees Charged to Other Fidelity Clients. The Board also considered Fidelity fee structures and other information with respect to clients of Fidelity, such as other funds advised or subadvised by Fidelity, pension plan clients, and other institutional clients with similar mandates. The Board noted that a joint ad hoc committee created by it and the boards of other Fidelity funds periodically reviews and compares Fidelity's institutional investment advisory business with its business of providing services to the Fidelity funds and also noted the most recent findings of the committee. The Board noted that the committee's review included a consideration of the differences in services provided, fees charged, and costs incurred, as well as competition in the markets serving the different categories of clients.
Based on its review of total expense ratios and fees charged to other Fidelity clients, the Board concluded that the total expense ratio of each class of each fund was reasonable in light of the services that the fund and its shareholders receive and the other factors considered.
Costs of the Services and Profitability. The Board considered the revenues earned and the expenses incurred by Fidelity in conducting the business of developing, marketing, distributing, managing, administering and servicing each fund and servicing each fund's shareholders. The Board also considered the level of Fidelity's profits in respect of all the Fidelity funds, including the Fidelity funds in which the funds invest.
On an annual basis, Fidelity presents to the Board information about the profitability of its relationships with each fund. Fidelity calculates profitability information for each fund, as well as aggregate profitability information for groups of Fidelity funds and all Fidelity funds, using a series of detailed revenue and cost allocation methodologies which originate with the books and records of Fidelity on which Fidelity's audited financial statements are based. The Audit Committee of the Board reviews any significant changes from the prior year's methodologies.
PricewaterhouseCoopers LLP (PwC), auditor to Fidelity and certain Fidelity funds, has been engaged annually by the Board as part of the Board's assessment of Fidelity's profitability analysis. PwC's engagement includes the review and assessment of the methodologies used by Fidelity in determining the revenues and expenses attributable to Fidelity's mutual fund business, and completion of agreed-upon procedures in respect of the mathematical accuracy of the fund profitability information and its conformity to established allocation methodologies. After considering PwC's reports issued under the engagement and information provided by Fidelity, the Board concluded that while other allocation methods may also be reasonable, Fidelity's profitability methodologies are reasonable in all material respects.
The Board also reviewed Fidelity's non-fund businesses and potential indirect benefits such businesses may have received as a result of their association with Fidelity's mutual fund business (i.e., fall-out benefits) as well as cases where Fidelity's affiliates may benefit from the funds' business. The Board noted that changes to fall-out benefits year-over-year reflect business developments at Fidelity's various businesses.
The Board considered the costs of the services provided by and the profits realized by Fidelity in connection with the operation of each fund and was satisfied that the profitability was not excessive.
Economies of Scale. The Board considered whether there have been economies of scale in respect of the management of the Fidelity funds, whether the Fidelity funds (including each fund) have appropriately benefited from any such economies of scale, and whether there is potential for realization of any further economies of scale. The Board considered the extent to which each fund will benefit from economies of scale as assets grow through increased services to the fund, through waivers or reimbursements, or through fee or expense ratio reductions. The Board recognized that, due to each fund's current contractual arrangements, its expense ratio will not decline if the fund's operating costs decrease as assets grow, or rise as assets decrease. The Board also noted that a committee (the Economies of Scale Committee) created by it and the boards of other Fidelity funds periodically analyzes whether Fidelity attains economies of scale in respect of the management and servicing of the Fidelity funds, whether the Fidelity funds have appropriately benefited from such economies of scale, and whether there is potential for realization of any further economies of scale.
The Board concluded, taking into account the analysis of the Economies of Scale Committee, that economies of scale, if any, are being appropriately shared between fund shareholders and Fidelity.
Additional Information Requested by the Board. In order to develop fully the factual basis for consideration of the Fidelity funds' advisory contracts, the Board requested and received additional information on certain topics, including: (i) Fidelity's fund profitability methodology, profitability trends for certain funds, the allocation of various costs to different funds, and the impact of certain factors on fund profitability results; (ii) portfolio manager changes that have occurred during the past year and the amount of the investment that each portfolio manager has made in the Fidelity fund(s) that he or she manages; (iii) Fidelity's compensation structure for portfolio managers, research analysts, and other key personnel, including its effects on fund profitability, the rationale for the compensation structure, and the extent to which current market conditions have affected retention and recruitment; (iv) the arrangements with and compensation paid to certain fund sub-advisers on behalf of the Fidelity funds and the treatment of such compensation within Fidelity's fund profitability methodology; (v) the terms of Fidelity's voluntary expense limitation agreements; (vi) the methodology with respect to competitive fund data and peer group classifications; (vii) Fidelity's transfer agent fee, expense, and service structures for different funds and classes relative to competitive trends, and the impact of the increased use of omnibus accounts; (viii) new developments in the retail and institutional marketplaces and the competitive positioning of the funds relative to other investment products and services; (ix) the impact of recent changes to the money market fund landscape, including the full implementation of money market fund reform and rising interest rates, on Fidelity's money market funds; (x) the funds' share class structures and distribution channels; and (xi) explanations regarding the relative total expense ratios of certain funds and classes, total expense competitive trends and methodologies for total expense competitive comparisons, and actions that might be taken by Fidelity to reduce total expense ratios for certain classes. In addition, the Board considered its discussions with Fidelity throughout the year regarding enhanced information security initiatives and the funds' fair valuation policies.
Based on its evaluation of all of the conclusions noted above, and after considering all factors it believed relevant, the Board concluded that the advisory fee arrangements are fair and reasonable, and that each fund's Advisory Contract should be renewed.
VIPFM-ANN-0219
1.843208.112
Fidelity® Variable Insurance Products: Target Volatility Portfolio
Annual Report December 31, 2018 |
|
Beginning on January 1, 2021, as permitted by regulations adopted by the Securities and Exchange Commission, and if your insurance carrier elects to participate, you may not be receiving paper copies of the Fund’s shareholder reports from the insurance company that offers your variable insurance product unless you specifically request paper copies from your financial professional or the administrator of your variable insurance product. Instead, the reports will be made available on a website, and you will be notified by mail each time a report is posted and provided with a website link to access the report.
If you already elected to receive shareholder reports electronically, you will not be affected by this change and you need not take any action. You may elect to receive shareholder reports and other communications from the Fund electronically, by contacting your financial professional or the administrator of your variable insurance product. If you own a Fidelity-administered variable insurance product, please visit fidelity.com/mailpreferences to make your election or call 1-800-343-3548.
You may elect to receive all future reports in paper free of charge. If you wish to continue receiving paper copies of your shareholder reports, you may contact your financial professional or the administrator of your variable insurance product. If you own a Fidelity-administered variable insurance product, please visit fidelity.com/mailpreferences to make your election or call 1-800-343-3548. Your election to receive reports in paper will apply to all funds available under your variable insurance product.
Contents
To view a fund's proxy voting guidelines and proxy voting record for the 12-month period ended June 30, visit http://www.fidelity.com/proxyvotingresults or visit the Securities and Exchange Commission's (SEC) web site at http://www.sec.gov.
You may also call 1-877-208-0098 to request a free copy of the proxy voting guidelines.
Fidelity® Variable Insurance Products are separate account options which are purchased through a variable insurance contract.
Standard & Poor's, S&P and S&P 500 are registered service marks of The McGraw-Hill Companies, Inc. and have been licensed for use by Fidelity Distributors Corporation.
Other third-party marks appearing herein are the property of their respective owners.
All other marks appearing herein are registered or unregistered trademarks or service marks of FMR LLC or an affiliated company. © 2019 FMR LLC. All rights reserved.
This report and the financial statements contained herein are submitted for the general information of the shareholders of the Fund. This report is not authorized for distribution to prospective investors in the Fund unless preceded or accompanied by an effective prospectus.
A fund files its complete schedule of portfolio holdings with the SEC for the first and third quarters of each fiscal year on Form N-Q. Forms N-Q are available on the SEC’s web site at http://www.sec.gov. A fund's Forms N-Q may be reviewed and copied at the SEC’s Public Reference Room in Washington, DC. Information regarding the operation of the SEC's Public Reference Room may be obtained by calling 1-800-SEC-0330.
For a complete list of a fund's portfolio holdings, view the most recent holdings listing, semiannual report, or annual report on Fidelity's web site at http://www.fidelity.com, http://www.institutional.fidelity.com, or http://www.401k.com, as applicable.
NOT FDIC INSURED •MAY LOSE VALUE •NO BANK GUARANTEE
Neither the Fund nor Fidelity Distributors Corporation is a bank.
Performance: The Bottom Line
Performance numbers are net of all underlying fund operating expenses, but do not include any insurance charges imposed by your insurance company’s separate account. If performance information included the effect of these additional charges, the total returns would have been lower.
Average annual total return reflects the change in the value of an investment, assuming reinvestment of distributions from dividend income and capital gains (the profits earned upon the sale of securities that have grown in value, if any) and assuming a constant rate of performance each year. During periods of reimbursement by Fidelity, a fund’s total return will be greater than it would be had the reimbursement not occurred. Performance numbers are net of all underlying fund operating expenses, but do not include any insurance charges imposed by your insurance company’s separate account. If performance information included the effect of these additional charges, the total returns would have been lower. How a fund did yesterday is no guarantee of how it will do tomorrow.
Average Annual Total Returns
| For the periods ended December 31, 2018 | Past 1 year | Past 5 years | Life of fundA |
| Service Class | (5.81)% | 3.85% | 5.66% |
| Service Class 2 | (5.99)% | 3.68% | 5.50% |
A From February 13, 2013
$10,000 Over Life of Fund
Let's say hypothetically that $10,000 was invested in VIP Target Volatility Portfolio - Service Class on February 13, 2013, when the fund started.
The chart shows how the value of your investment would have changed, and also shows how the S&P 500® Index performed over the same period.
| Period Ending Values |
| $13,826 | VIP Target Volatility Portfolio - Service Class |
| $18,621 | S&P 500® Index |
Management's Discussion of Fund Performance
Market Recap: The global economy remained in expansion in 2018, but growth became less synchronous and more uneven. Meanwhile, global monetary policy became a headwind, and this uncertainty spurred an increase in volatility among risk assets. This was particularly true in the latter part of the year due to several factors, including China entering a growth recession, emerging late-cycle conditions in the U.S., falling commodity prices, China-U.S. trade-policy uncertainty and the U.K.’s planned “Brexit” from the European Union. Against this backdrop, U.S. equities, as measured by the S&P 500
® index returned -4.38% in 2018. Sector-wise, seven of the 11 major sectors in the S&P 500
® lost ground this period. Falling crude-oil prices caused energy stocks (-18%) to suffer most, while slowing global growth concerns felled the materials (-15%), industrials (-13%) and financials (-13%) sectors. Conversely, health care (+6%) led the way, followed by the utilities (+4%), information technology (+3%) and consumer discretionary (+2%) sectors. Overseas, equities suffered a pronounced, broad-based correction, returning -14.04% for the year, according to the MSCI ACWI ex USA Index. Among regions in the index, Asia-Pacific (-11%) and Japan (-13%) held up best, whereas resource-rich Canada (-17%), Europe (-14%) and emerging markets (-14%) lagged. In terms of fixed income, investment-grade bonds were roughly flat for the 12 months, according to the Bloomberg Barclays U.S. Aggregate Bond Index. Late in the year, concerns about global growth pushed Treasury yields lower and credit spreads wider. Short-term debt led most U.S. investment-grade sectors, followed by asset-backed securities and agency bonds, while corporate credit produced negative returns, according to Bloomberg Barclays.
Comments from Portfolio Manager Geoff Stein: For the year, the fund’s share classes returned roughly -6%, trailing the -4.40% result of its multi-asset-class benchmark, the Fidelity VIP Target Volatility Composite Index. The fund underperformed the Composite benchmark primarily because of weak underlying U.S. stock selection during the final quarter of 2018. Security selection in information technology had the greatest negative impact on the fund's relative result. Picks in foreign developed-markets (DM) equities also notably detracted from performance, while selections among emerging-markets (EM) stocks and investment-grade bonds produced moderately negative relative results. Overall, asset allocation added value from a relative performance standpoint, driven by equity positioning. Underweighted exposure to international DM stocks fueled the fund’s positive equity allocation results, as this asset class lagged U.S. equities, primarily due to a strengthening U.S. dollar. Conversely, our small allocation to commodities hampered our equity strategy, largely due to falling oil prices. Within the fixed-income allocation strategy – where cash and investment-grade bonds were underweighted to help fund various non-core, out-of-benchmark positions – also modestly contributed versus the Composite benchmark. During the fourth quarter, as risk-aversion rose and stocks declined, I tried to reduce risk by selling equities. As a result, the fund’s increasing cash balance acted as a shock absorber during the market’s December decline. A small, out-of-index allocation to long-term U.S. Treasuries – which I held as a partial hedge against market volatility – also added value.
The views expressed above reflect those of the portfolio manager(s) only through the end of the period as stated on the cover of this report and do not necessarily represent the views of Fidelity or any other person in the Fidelity organization. Any such views are subject to change at any time based upon market or other conditions and Fidelity disclaims any responsibility to update such views. These views may not be relied on as investment advice and, because investment decisions for a Fidelity fund are based on numerous factors, may not be relied on as an indication of trading intent on behalf of any Fidelity fund.
Investment Summary (Unaudited)
The information in the following tables is based on the direct investments of the Fund.
Top Holdings as of December 31, 2018
| | % of fund's net assets |
| Fidelity Stock Selector All Cap Fund | 23.6 |
| Fidelity Total Bond Fund | 18.8 |
| Fidelity Cash Central Fund, 2.42% | 11.0 |
| iShares Core U.S. Aggregate Bond ETF | 8.4 |
| Fidelity U.S. Bond Index Fund Institutional Premium Class | 6.4 |
| Fidelity Overseas Fund | 4.3 |
| iShares S&P 500 Index ETF | 4.1 |
| Fidelity Conservative Income Bond Fund | 3.6 |
| Fidelity Long Term Treasury Bond Index Fund | 3.5 |
| Fidelity International Enhanced Index Fund | 2.6 |
| | 86.3 |
Asset Allocation (% of fund's net assets)
| As of December 31, 2018 |
| | Domestic Equity Funds | 35.4% |
| | International Equity Funds | 12.3% |
| | Fixed-Income Funds | 43.3% |
| | Cash Equivalents | 11.0% |
| | Net Other Assets (Liabilities)* | (2.0)% |

* Net Other Assets (Liabilities) are not included in the pie chart
Schedule of Investments December 31, 2018
Showing Percentage of Net Assets
| Equity Funds - 47.7% | | | |
| | | Shares | Value |
| Domestic Equity Funds - 35.4% | | | |
| Fidelity Contrafund (a) | | 309,735 | $3,410,181 |
| Fidelity Equity-Income Fund (a) | | 66,064 | 3,365,281 |
| Fidelity Global Commodity Stock Fund (a) | | 355,021 | 3,976,231 |
| Fidelity Large Cap Value Enhanced Index Fund (a) | | 79,196 | 903,622 |
| Fidelity Low-Priced Stock Fund (a) | | 77,427 | 3,359,556 |
| Fidelity Mega Cap Stock Fund (a) | | 259,311 | 3,503,286 |
| Fidelity Real Estate Investment Portfolio (a) | | 35,139 | 1,349,697 |
| Fidelity Stock Selector All Cap Fund (a) | | 1,711,661 | 65,779,119 |
| Fidelity Value Discovery Fund (a) | | 66,874 | 1,682,557 |
| iShares S&P 500 Index ETF | | 45,062 | 11,338,050 |
|
| TOTAL DOMESTIC EQUITY FUNDS | | | 98,667,580 |
|
| International Equity Funds - 12.3% | | | |
| Fidelity International Enhanced Index Fund (a) | | 854,052 | 7,216,740 |
| Fidelity International Value Fund (a) | | 975,527 | 7,092,083 |
| Fidelity Japan Smaller Companies Fund (a) | | 108,941 | 1,649,368 |
| Fidelity Overseas Fund (a) | | 296,222 | 12,109,567 |
| iShares Core MSCI Emerging Markets ETF | | 44,525 | 2,099,354 |
| iShares MSCI EAFE Index ETF | | 72,825 | 4,280,654 |
|
| TOTAL INTERNATIONAL EQUITY FUNDS | | | 34,447,766 |
|
| TOTAL EQUITY FUNDS | | | |
| (Cost $146,765,737) | | | 133,115,346 |
|
| Fixed-Income Funds - 43.3% | | | |
| Fidelity Conservative Income Bond Fund (a) | | 994,018 | 9,940,178 |
| Fidelity Inflation-Protected Bond Index Fund Institutional Premium Class (a) | | 615,119 | 5,837,482 |
| Fidelity Long Term Treasury Bond Index Fund (a) | | 765,469 | 9,706,148 |
| Fidelity New Markets Income Fund (a) | | 102,071 | 1,456,559 |
| Fidelity Total Bond Fund (a) | | 5,128,310 | 52,513,895 |
| Fidelity U.S. Bond Index Fund Institutional Premium Class (a) | | 1,573,109 | 17,744,674 |
| iShares Core U.S. Aggregate Bond ETF | | 220,551 | 23,486,476 |
| TOTAL FIXED-INCOME FUNDS | | | |
| (Cost $122,967,165) | | | 120,685,412 |
|
| Cash Equivalents - 11.0% | | | |
| Fidelity Cash Central Fund, 2.42% (b) | | | |
| (Cost $30,759,390) | | 30,754,527 | 30,760,678 |
| TOTAL INVESTMENT IN SECURITIES - 102.0% | | | |
| (Cost $300,492,292) | | | 284,561,436 |
| NET OTHER ASSETS (LIABILITIES) - (2.0)% | | | (5,609,612) |
| NET ASSETS - 100% | | | $278,951,824 |
Security Type Abbreviations
ETF – Exchange-Traded Fund
Legend
(a) Affiliated Fund
(b) Affiliated fund that is generally available only to investment companies and other accounts managed by Fidelity Investments. The rate quoted is the annualized seven-day yield of the fund at period end. A complete unaudited listing of the fund's holdings as of its most recent quarter end is available upon request. In addition, each Fidelity Central Fund's financial statements, which are not covered by the Fund's Report of Independent Registered Public Accounting Firm, are available on the SEC's website or upon request.
Affiliated Central Funds
Information regarding fiscal year to date income earned by the Fund from investments in Fidelity Central Funds is as follows:
| Fund | Income earned |
| Fidelity Cash Central Fund | $127,549 |
| Total | $127,549 |
Amounts in the income column in the above table include any capital gain distributions from underlying funds, which are presented in the corresponding line-item in the Statement of Operations if applicable.
Affiliated Underlying Funds
Fiscal year to date information regarding the Fund's investments in affiliated Underlying Funds, excluding any Money Market Central Funds, is presented below. Exchanges between classes of the same affiliated Underlying Funds may occur.
| Affiliate | Value, beginning of period | Purchases | Sales Proceeds | Dividend Income | Realized Gain (loss) | Change in Unrealized appreciation (depreciation) | Value, end of period |
| Fidelity Commodity Strategy Fund | $2,961,457 | $202,082 | $2,988,327 | $-- | $(110,278) | $(64,934) | $-- |
| Fidelity Conservative Income Bond Fund | 1,281,303 | 18,241,606 | 9,541,826 | 126,714 | (2,334) | (38,571) | 9,940,178 |
| Fidelity Consumer Discretionary Portfolio | 8,574,573 | 2,055,621 | 10,811,078 | 126,309 | 1,465,162 | (1,284,278) | -- |
| Fidelity Consumer Staples Portfolio | 5,274,662 | 1,664,124 | 6,339,605 | 309,784 | (583,291) | (15,890) | -- |
| Fidelity Contrafund | 4,901,862 | 1,116,266 | 2,224,438 | 314,407 | (70,874) | (312,635) | 3,410,181 |
| Fidelity Diversified International Fund | 3,942,059 | 1,021,011 | 4,501,695 | -- | (438,242) | (23,133) | -- |
| Fidelity Emerging Markets Fund | 10,041,660 | 86,502 | 10,125,655 | -- | 492,314 | (494,821) | -- |
| Fidelity Energy Portfolio | 4,948,991 | 629,476 | 4,997,826 | -- | (89,146) | (491,495) | -- |
| Fidelity Equity-Income Fund | 5,056,201 | 1,473,893 | 2,472,825 | 373,759 | (122,920) | (569,068) | 3,365,281 |
| Fidelity Europe Fund | 1,532,815 | 44,328 | 1,560,023 | -- | 137,082 | (154,202) | -- |
| Fidelity Financial Services Portfolio | 12,810,727 | 2,368,670 | 14,029,553 | 291,587 | (255,362) | (894,482) | -- |
| Fidelity Floating Rate High Income Fund | 2,910,934 | 323,518 | 3,225,006 | 110,540 | 73,182 | (82,628) | -- |
| Fidelity Global Commodity Stock Fund | 3,128,217 | 1,853,897 | 360,303 | 87,403 | (7,707) | (637,873) | 3,976,231 |
| Fidelity Health Care Portfolio | 11,408,189 | 1,450,986 | 14,002,663 | 409,978 | 1,250,727 | (107,239) | -- |
| Fidelity High Income Fund | 5,800,259 | 66,874 | 5,801,677 | 36,117 | (106,875) | 41,419 | -- |
| Fidelity Industrials Portfolio | 8,559,787 | 1,769,061 | 9,409,673 | 337,299 | (482,060) | (437,115) | -- |
| Fidelity Inflation-Protected Bond Index Institutional Class | 10,063,487 | 2,948,483 | 6,799,815 | 25,790 | (30,435) | (6,911) | -- |
| Fidelity Inflation-Protected Bond Index Institutional Premium Class | -- | 119,143 | 302,030 | 114,284 | (4,808) | (149,632) | 5,837,482 |
| Fidelity International Capital Appreciation | 907,700 | 101,249 | 906,243 | 93 | (90,056) | (12,650) | -- |
| Fidelity International Discovery Fund | 3,279,937 | 819,441 | 3,683,441 | -- | (333,239) | (82,698) | -- |
| Fidelity International Enhanced Index Fund | 2,949,764 | 5,894,617 | 775,670 | 168,524 | (12,036) | (839,935) | 7,216,740 |
| Fidelity International Small Cap Fund | 1,773,116 | 358,922 | 1,920,647 | -- | 209,252 | (420,643) | -- |
| Fidelity International Small Cap | 1,673,261 | 266,184 | 1,767,267 | 1 | 178,603 | (350,781) | -- |
| Fidelity International Value Fund | 2,136,870 | 6,504,186 | 569,428 | 230,868 | (17,409) | (962,136) | 7,092,083 |
| Fidelity Japan Smaller Companies Fund | 1,906,594 | 156,117 | 13,133 | 87,036 | (25) | (400,185) | 1,649,368 |
| Fidelity Large Cap Value Enhanced Index Fund | -- | 1,046,912 | -- | 62,305 | -- | (143,290) | 903,622 |
| Fidelity Long Term Treasury Bond Index Fund I | -- | 1,529,924 | 218,441 | 41,172 | (3,330) | 58,713 | 9,706,148 |
| Fidelity Long-Term Treasury Bond Index Fund Premium Class | 5,366,736 | 7,716,496 | 4,468,181 | 149,525 | (156,418) | (119,351) | -- |
| Fidelity Low-Priced Stock Fund | 5,073,415 | 1,515,254 | 2,192,780 | 545,166 | (169,302) | (867,031) | 3,359,556 |
| Fidelity Materials Portfolio | 2,494,334 | 522,090 | 2,404,760 | 119,915 | (655,017) | 43,353 | -- |
| Fidelity Mega Cap Stock Fund | 7,562,015 | 2,685,477 | 5,252,988 | 1,220,426 | (511,252) | (979,966) | 3,503,286 |
| Fidelity Mid Cap Value Fund | 289 | 13 | 278 | 13 | 4 | (28) | -- |
| Fidelity New Markets Income Fund | 1,466,582 | 285,301 | 111,250 | 67,814 | (7,165) | (176,909) | 1,456,559 |
| Fidelity Overseas Fund | 15,397,464 | 4,752,558 | 5,124,733 | 689,494 | (49,321) | (2,866,401) | 12,109,567 |
| Fidelity Pacific Basin Fund | 804,359 | 82,210 | 755,400 | -- | (131,796) | 627 | -- |
| Fidelity Real Estate Investment Portfolio | 3,039,348 | 566,729 | 2,170,106 | 115,535 | 16,624 | (102,898) | 1,349,697 |
| Fidelity Stock Selector All Cap Fund | -- | 79,613,653 | 5,550,000 | 3,046,356 | (728,453) | (7,556,081) | 65,779,119 |
| Fidelity Technology Portfolio | 20,218,973 | 5,802,478 | 22,738,034 | 1,983,339 | 1,841,156 | (5,124,573) | -- |
| Fidelity Telecommunications Portfolio | 1,546,446 | 410,897 | 1,979,895 | 22,273 | (95,106) | 117,658 | -- |
| Fidelity Total Bond Fund | 48,308,494 | 18,210,591 | 12,002,761 | 1,664,545 | (416,919) | (1,585,510) | 52,513,895 |
| Fidelity U.S. Bond Index Fund Institutional Institutional Class | 16,348,663 | 2,856,092 | 1,812,967 | 395,202 | (60,134) | 6,703 | -- |
| Fidelity U.S. Bond Index Fund Institutional Premium Class | -- | 1,473,567 | 687,532 | 78,790 | (19,904) | (359,814) | 17,744,674 |
| Fidelity Utilities Portfolio | 2,306,243 | 361,517 | 2,952,250 | 11,518 | 339,553 | (55,063) | -- |
| Fidelity Value Discovery Fund | 2,497,953 | 611,947 | 1,146,067 | 92,066 | (14,395) | (266,881) | 1,682,557 |
| | $250,255,739 | $181,579,963 | $190,698,270 | $13,455,947 | $228,050 | $(28,769,258) | $212,596,224 |
Amounts in the income column in the above table include any capital gain distributions from underlying funds, which are presented in the corresponding line-item in the Statement of Operations if applicable.
Investment Valuation
All investments are categorized as Level 1 under the Fair Value Hierarchy. The inputs or methodology used for valuing securities may not be an indication of the risk associated with investing in those securities. For more information on valuation inputs please refer to the Investment Valuation section in the accompanying Notes to Financial Statements.
See accompanying notes which are an integral part of the financial statements.
Financial Statements
Statement of Assets and Liabilities
| | | December 31, 2018 |
| Assets | | |
Investment in securities, at value — See accompanying schedule:
Unaffiliated issuers (cost $42,403,341) | $41,204,534 | |
| Fidelity Central Funds (cost $30,759,390) | 30,760,678 | |
| Other affiliated issuers (cost $227,329,561) | 212,596,224 | |
| Total Investment in Securities (cost $300,492,292) | | $284,561,436 |
| Receivable for investments sold | | 47,591 |
| Receivable for fund shares sold | | 102,317 |
| Dividends receivable | | 257,823 |
| Distributions receivable from Fidelity Central Funds | | 37,497 |
| Other receivables | | 3,718 |
| Total assets | | 285,010,382 |
| Liabilities | | |
| Payable for investments purchased | $5,794,295 | |
| Payable for fund shares redeemed | 159,530 | |
| Distributions payable | 4,164 | |
| Accrued management fee | 58,952 | |
| Distribution and service plan fees payable | 35,207 | |
| Other affiliated payables | 6,410 | |
| Total liabilities | | 6,058,558 |
| Net Assets | | $278,951,824 |
| Net Assets consist of: | | |
| Paid in capital | | $291,783,884 |
| Total distributable earnings (loss) | | (12,832,060) |
| Net Assets | | $278,951,824 |
| Net Asset Value and Maximum Offering Price | | |
| Service Class: | | |
| Net Asset Value, offering price and redemption price per share ($1,255,735 ÷ 115,679 shares) | | $10.86 |
| Service Class 2: | | |
| Net Asset Value, offering price and redemption price per share ($277,696,089 ÷ 25,641,304 shares) | | $10.83 |
See accompanying notes which are an integral part of the financial statements.
Statement of Operations
| | | Year ended December 31, 2018 |
| Investment Income | | |
| Dividends: | | |
| Unaffiliated issuers | | $1,074,848 |
| Affiliated issuers | | 4,460,776 |
| Income from Fidelity Central Funds | | 127,549 |
| Total income | | 5,663,173 |
| Expenses | | |
| Management fee | $912,120 | |
| Transfer agent fees | 69,940 | |
| Distribution and service plan fees | 751,930 | |
| Independent trustees' fees and expenses | 1,409 | |
| Commitment fees | 818 | |
| Total expenses before reductions | 1,736,217 | |
| Expense reductions | (475,359) | |
| Total expenses after reductions | | 1,260,858 |
| Net investment income (loss) | | 4,402,315 |
| Realized and Unrealized Gain (Loss) | | |
| Net realized gain (loss) on: | | |
| Investment securities: | | |
| Unaffiliated issuers | (13,070) | |
| Fidelity Central Funds | (1,205) | |
| Other affiliated issuers | 228,050 | |
| Capital gain distributions from underlying funds: | | |
| Affiliated issuers | 8,995,171 | |
| Total net realized gain (loss) | | 9,208,946 |
| Change in net unrealized appreciation (depreciation) on: | | |
| Investment securities: | | |
| Unaffiliated issuers | (3,090,426) | |
| Fidelity Central Funds | 1,205 | |
| Other affiliated issuers | (28,769,258) | |
| Total change in net unrealized appreciation (depreciation) | | (31,858,479) |
| Net gain (loss) | | (22,649,533) |
| Net increase (decrease) in net assets resulting from operations | | $(18,247,218) |
See accompanying notes which are an integral part of the financial statements.
Statement of Changes in Net Assets
| | Year ended December 31, 2018 | Year ended December 31, 2017 |
| Increase (Decrease) in Net Assets | | |
| Operations | | |
| Net investment income (loss) | $4,402,315 | $3,321,049 |
| Net realized gain (loss) | 9,208,946 | 25,115,499 |
| Change in net unrealized appreciation (depreciation) | (31,858,479) | 10,079,993 |
| Net increase (decrease) in net assets resulting from operations | (18,247,218) | 38,516,541 |
| Distributions to shareholders | (13,746,477) | – |
| Distributions to shareholders from net investment income | – | (3,201,834) |
| Distributions to shareholders from net realized gain | – | (17,462,503) |
| Total distributions | (13,746,477) | (20,664,337) |
| Share transactions - net increase (decrease) | 13,645,175 | 56,380,347 |
| Total increase (decrease) in net assets | (18,348,520) | 74,232,551 |
| Net Assets | | |
| Beginning of period | 297,300,344 | 223,067,793 |
| End of period | $278,951,824 | $297,300,344 |
| Other Information | | |
| Undistributed net investment income end of period | | $119,217 |
See accompanying notes which are an integral part of the financial statements.
Financial Highlights
VIP Target Volatility Portfolio Service Class
| Years ended December 31, | 2018 | 2017 | 2016 | 2015 | 2014 |
| Selected Per–Share Data | | | | | |
| Net asset value, beginning of period | $12.14 | $11.22 | $10.87 | $11.34 | $11.19 |
| Income from Investment Operations | | | | | |
| Net investment income (loss)A | .19 | .17 | .15 | .16 | .17 |
| Net realized and unrealized gain (loss) | (.90) | 1.67 | .42 | (.29) | .49 |
| Total from investment operations | (.71) | 1.84 | .57 | (.13) | .66 |
| Distributions from net investment income | (.20)B | (.16) | (.16)B | (.13) | (.13) |
| Distributions from net realized gain | (.37)B | (.76) | (.07)B | (.21) | (.38) |
| Total distributions | (.57) | (.92) | (.22)C | (.34) | (.51) |
| Net asset value, end of period | $10.86 | $12.14 | $11.22 | $10.87 | $11.34 |
| Total ReturnD,E | (5.81)% | 16.39% | 5.30% | (1.22)% | 5.94% |
| Ratios to Average Net AssetsF,G | | | | | |
| Expenses before reductions | .42% | .42% | .42% | .42% | .41% |
| Expenses net of fee waivers, if any | .27% | .27% | .27% | .27% | .26% |
| Expenses net of all reductions | .27% | .27% | .26% | .26% | .26% |
| Net investment income (loss) | 1.60% | 1.43% | 1.38% | 1.39% | 1.49% |
| Supplemental Data | | | | | |
| Net assets, end of period (000 omitted) | $1,256 | $1,444 | $1,477 | $2,143 | $2,880 |
| Portfolio turnover rateH | 85% | 91% | 91% | 119% | 80% |
A Calculated based on average shares outstanding during the period.
B The amounts shown reflect certain reclassifications related to book to tax differences that were made in the year shown.
C Total distributions of $.22 per share is comprised of distributions from net investment income of $.156 and distributions from net realized gain of $.065 per share.
D Total returns do not reflect charges attributable to your insurance company's separate account. Inclusion of these charges would reduce the total returns shown.
E Total returns would have been lower if certain expenses had not been reduced during the applicable periods shown.
F Fees and expenses of any underlying Fidelity Central Funds are not included in the Fund's expense ratio. The Fund indirectly bears its proportionate share of the expenses of any underlying Fidelity Central Funds.
G Expense ratios reflect operating expenses of the class. Expenses before reductions do not reflect amounts reimbursed by the investment adviser or reductions from brokerage service arrangements or reductions from other expense offset arrangements and do not represent the amount paid by the class during periods when reimbursements or reductions occur. Expenses net of fee waivers reflect expenses after reimbursement by the investment adviser but prior to reductions from brokerage service arrangements or other expense offset arrangements. Expenses net of all reductions represent the net expenses paid by the class.
H Amount does not include the portfolio activity of any underlying Fidelity Central Funds.
See accompanying notes which are an integral part of the financial statements.
VIP Target Volatility Portfolio Service Class 2
| Years ended December 31, | 2018 | 2017 | 2016 | 2015 | 2014 |
| Selected Per–Share Data | | | | | |
| Net asset value, beginning of period | $12.11 | $11.19 | $10.85 | $11.32 | $11.18 |
| Income from Investment Operations | | | | | |
| Net investment income (loss)A | .17 | .16 | .13 | .14 | .15 |
| Net realized and unrealized gain (loss) | (.90) | 1.66 | .41 | (.28) | .49 |
| Total from investment operations | (.73) | 1.82 | .54 | (.14) | .64 |
| Distributions from net investment income | (.18)B | (.14) | (.14)B | (.11) | (.12) |
| Distributions from net realized gain | (.37)B | (.76) | (.07)B | (.21) | (.38) |
| Total distributions | (.55) | (.90) | (.20)C | (.33)D | (.50) |
| Net asset value, end of period | $10.83 | $12.11 | $11.19 | $10.85 | $11.32 |
| Total ReturnE,F | (5.99)% | 16.29% | 5.06% | (1.34)% | 5.74% |
| Ratios to Average Net AssetsG,H | | | | | |
| Expenses before reductions | .57% | .57% | .57% | .57% | .56% |
| Expenses net of fee waivers, if any | .42% | .42% | .42% | .42% | .41% |
| Expenses net of all reductions | .42% | .42% | .41% | .41% | .41% |
| Net investment income (loss) | 1.45% | 1.28% | 1.22% | 1.24% | 1.34% |
| Supplemental Data | | | | | |
| Net assets, end of period (000 omitted) | $277,696 | $295,856 | $221,591 | $209,108 | $131,419 |
| Portfolio turnover rateI | 85% | 91% | 91% | 119% | 80% |
A Calculated based on average shares outstanding during the period.
B The amounts shown reflect certain reclassifications related to book to tax differences that were made in the year shown.
C Total distributions of $.20 per share is comprised of distributions from net investment income of $.139 and distributions from net realized gain of $.065 per share.
D Total distributions of $.33 per share is comprised of distributions from net investment income of $.114 and distributions from net realized gain of $.212 per share.
E Total returns do not reflect charges attributable to your insurance company's separate account. Inclusion of these charges would reduce the total returns shown.
F Total returns would have been lower if certain expenses had not been reduced during the applicable periods shown.
G Fees and expenses of any underlying Fidelity Central Funds are not included in the Fund's expense ratio. The Fund indirectly bears its proportionate share of the expenses of any underlying Fidelity Central Funds.
H Expense ratios reflect operating expenses of the class. Expenses before reductions do not reflect amounts reimbursed by the investment adviser or reductions from brokerage service arrangements or reductions from other expense offset arrangements and do not represent the amount paid by the class during periods when reimbursements or reductions occur. Expenses net of fee waivers reflect expenses after reimbursement by the investment adviser but prior to reductions from brokerage service arrangements or other expense offset arrangements. Expenses net of all reductions represent the net expenses paid by the class.
I Amount does not include the portfolio activity of any underlying Fidelity Central Funds.
See accompanying notes which are an integral part of the financial statements.
Notes to Financial Statements
For the period ended December 31, 2018
1. Organization.
VIP Target Volatility Portfolio (the Fund) is a fund of Variable Insurance Products Fund V (the Trust) and is authorized to issue an unlimited number of shares. The Trust is registered under the Investment Company Act of 1940, as amended (the 1940 Act), as an open-end management investment company organized as a Massachusetts business trust. Shares of the Fund may only be purchased by insurance companies for the purpose of funding variable annuity or variable life insurance contracts. The Fund offers the following classes of shares: Service Class shares and Service Class 2 shares. All classes have equal rights and voting privileges, except for matters affecting a single class. Certain Underlying Funds incurred name changes since their most recent shareholder report. The names of the Underlying Funds are those in effect at period end.
2. Investments in Fidelity Central Funds.
The Fund invests in Fidelity Central Funds, which are open-end investment companies generally available only to other investment companies and accounts managed by the investment adviser and its affiliates. The Fund's Schedule of Investments lists each of the Fidelity Central Funds held as of period end, if any, as an investment of the Fund, but does not include the underlying holdings of each Fidelity Central Fund. As an Investing Fund, the Fund indirectly bears its proportionate share of the expenses of the underlying Fidelity Central Funds.
The Money Market Central Funds seek preservation of capital and current income and are managed by Fidelity Investments Money Management, Inc. (FIMM), an affiliate of the investment adviser. Annualized expenses of the Money Market Central Funds as of their most recent shareholder report date are less than .005%.
A complete unaudited list of holdings for each Fidelity Central Fund is available upon request or at the Securities and Exchange Commission (the SEC) website at www.sec.gov. In addition, the financial statements of the Fidelity Central Funds, which are not covered by the Fund's Report of Independent Registered Public Accounting Firm, are available on the SEC website or upon request.
3. Significant Accounting Policies.
The Fund is an investment company and applies the accounting and reporting guidance of the Financial Accounting Standards Board (FASB) Accounting Standards Codification Topic 946 Financial Services – Investments Companies. The financial statements have been prepared in conformity with accounting principles generally accepted in the United States of America (GAAP), which require management to make certain estimates and assumptions at the date of the financial statements. Actual results could differ from those estimates. Subsequent events, if any, through the date that the financial statements were issued have been evaluated in the preparation of the financial statements. The Fund's Schedule of Investments lists each of the Underlying Funds as an investment of the Fund but does not include the underlying holdings of each Underlying Fund. The following summarizes the significant accounting policies of the Fund:
Investment Valuation. Investments are valued as of 4:00 p.m. Eastern time on the last calendar day of the period. The Board of Trustees (the Board) has delegated the day to day responsibility for the valuation of the Fund's investments to the Fair Value Committee (the Committee) established by the Fund's investment adviser. In accordance with valuation policies and procedures approved by the Board, the Fund attempts to obtain prices from one or more third party pricing vendors or brokers to value its investments. When current market prices, quotations or currency exchange rates are not readily available or reliable, investments will be fair valued in good faith by the Committee, in accordance with procedures adopted by the Board. Factors used in determining fair value vary by investment type and may include market or investment specific events. The frequency with which these procedures are used cannot be predicted and they may be utilized to a significant extent. The Committee oversees the Fund's valuation policies and procedures and reports to the Board on the Committee's activities and fair value determinations. The Board monitors the appropriateness of the procedures used in valuing the Fund's investments and ratifies the fair value determinations of the Committee. The Fund categorizes the inputs to valuation techniques used to value its investments into a disclosure hierarchy consisting of three levels as shown below:
- Level 1 – quoted prices in active markets for identical investments
- Level 2 – other significant observable inputs (including quoted prices for similar investments, interest rates, prepayment speeds, etc.)
- Level 3 – unobservable inputs (including the Fund's own assumptions based on the best information available)
Valuation techniques used to value the Fund's investments by major category are as follows. Investments in open-end mutual funds are valued at their closing net asset value (NAV) each business day and are categorized as Level 1 in the hierarchy. Exchange-Traded Funds (ETFs) are valued at their last sale price or official closing price as reported by a third party pricing vendor on the primary market or exchange on which they are traded and are categorized as Level 1 in the hierarchy. In the event there were no sales during the day but the exchange reports a closing bid level, ETFs are valued at the closing bid and would be categorized as Level 1 in the hierarchy. In the event there was no closing bid, ETFs may be valued by another method that the Board believes reflects fair value in accordance with the Board's fair value pricing policies and may be categorized as Level 2 in the hierarchy.
Investment Transactions and Income. For financial reporting purposes, the Fund's investment holdings and NAV include trades executed through the end of the last business day of the period. The NAV per share for processing shareholder transactions is calculated as of the close of business of the New York Stock Exchange (NYSE), normally 4:00 p.m. Eastern time and includes trades executed through the end of the prior business day. Gains and losses on securities sold are determined on the basis of identified cost. Income and capital gain distributions from the Underlying Funds, if any, are recorded on the ex-dividend date.
Class Allocations and Expenses. Investment income, realized and unrealized capital gains and losses, common expenses of the Fund, and certain fund-level expense reductions, if any, are allocated daily on a pro-rata basis to each class based on the relative net assets of each class to the total net assets of the Fund. Each class differs with respect to transfer agent and distribution and service plan fees incurred. Certain expense reductions may also differ by class. For the reporting period, the allocated portion of income and expenses to each class as a percent of its average net assets may vary due to the timing of recording these transactions in relation to fluctuating net assets of the classes. Expenses directly attributable to a fund are charged to that fund. Expenses attributable to more than one fund are allocated among the respective funds on the basis of relative net assets or other appropriate methods. Expenses included in the accompanying financial statements reflect the expenses of the Fund and do not include any expenses associated with the Underlying Funds. Although not included in the Fund's expenses, the Fund indirectly bears its proportionate share of the Underlying Funds' expenses through the impact of these expenses on each Underlying Fund's NAV. Expense estimates are accrued in the period to which they relate and adjustments are made when actual amounts are known.
Income Tax Information and Distributions to Shareholders. Each year, the Fund intends to qualify as a regulated investment company under Subchapter M of the Internal Revenue Code, including distributing substantially all of its taxable income and realized gains. As a result, no provision for U.S. Federal income taxes is required. As of December 31, 2018, the Fund did not have any unrecognized tax benefits in the financial statements; nor is the Fund aware of any tax positions for which it is reasonably possible that the total amounts of unrecognized tax benefits will significantly change in the next twelve months. The Fund files a U.S. federal tax return, in addition to state and local tax returns as required. The Fund's federal income tax returns are subject to examination by the Internal Revenue Service (IRS) for a period of three fiscal years after they are filed. State and local tax returns may be subject to examination for an additional fiscal year depending on the jurisdiction.
Distributions are declared and recorded on the ex-dividend date. Income and capital gain distributions are declared separately for each class. Income and capital gain distributions are determined in accordance with income tax regulations, which may differ from GAAP. These differences resulted in distribution reclassifications.
Capital accounts within the financial statements are adjusted for permanent book-tax differences. These adjustments have no impact on net assets or the results of operations. Capital accounts are not adjusted for temporary book-tax differences which will reverse in a subsequent period.
Book-tax differences are primarily due to the short-term gain distributions from the Underlying Fund, losses deferred due to wash sales, and excise tax regulations.
As of period end, the cost and unrealized appreciation (depreciation) in securities, and derivatives if applicable, for federal income tax purposes ere as follows:
| Gross unrealized appreciation | $647,854 |
| Gross unrealized depreciation | (17,512,532) |
| Net unrealized appreciation (depreciation) | $(16,864,678) |
| Tax Cost | $301,426,114 |
The tax-based components of distributable earnings as of period end were as follows:
| Undistributed long-term capital gain | $6,826,012 |
| Net unrealized appreciation (depreciation) on securities and other investments | $(16,864,678) |
The Fund intends to elect to defer to its next fiscal year $2,793,394 of capital losses recognized during the period November 1, 2018 to December 31, 2018.
The tax character of distributions paid was as follows:
| | December 31, 2018 | December 31, 2017 |
| Ordinary Income | $6,491,822 | $ 4,733,232 |
| Long-term Capital Gains | 7,254,655 | 15,931,105 |
| Total | $13,746,477 | $ 20,664,337 |
New Rule Issuance. During August 2018, the U.S. Securities and Exchange Commission issued Final Rule Release No. 33-10532, Disclosure Update and Simplification. This Final Rule includes amendments specific to registered investment companies that are intended to eliminate overlap in disclosure requirements between Regulation S-X and GAAP. In accordance with these amendments, certain line-items in the Fund's financial statements have been combined or removed for the current period as outlined in the table below.
| Financial Statement | Current Line-Item Presentation | Prior Line-Item Presentation |
| Statement of Assets and Liabilities | Total distributable earnings (loss) | Undistributed/Distributions in excess of/Accumulated net investment income (loss)
Accumulated/Undistributed net realized gain (loss)
Net unrealized appreciation (depreciation) |
| Statement of Changes in Net Assets | N/A - removed | Undistributed/Distributions in excess of/Accumulated net investment income (loss) end of period |
| Statement of Changes in Net Assets | Distributions to shareholders | Distributions to shareholders from net investment income
Distributions to shareholders from net realized gain |
| Distributions to Shareholders Note to Financial Statements | Distributions to shareholders | Distributions to shareholders from net investment income
Distributions to shareholders from net realized gain |
4. Purchases and Redemptions of Underlying Fund Shares.
Purchases and redemptions of the Underlying Fund shares, aggregated $251,145,750 and $262,056,225, respectively.
5. Fees and Other Transactions with Affiliates.
Management Fee. FMR Co., Inc. (the investment adviser), an affiliate of Fidelity Management & Research Company (FMR), provides the Fund with investment management related services. For these services the Fund pays a monthly management fee to the investment adviser. The management fee is computed at an annual rate of .30% of the Fund's average net assets.
During the period, the investment adviser waived a portion of its management fee as described in the Expense Reductions note.
Distribution and Service Plan Fees. In accordance with Rule 12b-1 of the 1940 Act, the Fund has adopted separate 12b-1 Plans for each Service Class of shares. Each Service Class pays Fidelity Distributors Corporation (FDC), an affiliate of the investment adviser, a service fee. For the period, the service fee is based on an annual rate of .10% of Service Class' average net assets and .25% of Service Class 2's average net assets.
For the period, total fees, all of which were re-allowed to insurance companies for the distribution of shares and providing shareholder support services, were as follows:
| Service Class | $1,367 |
| Service Class 2 | 750,563 |
| | $751,930 |
Transfer Agent Fees. Fidelity Investments Institutional Operations Company, Inc. (FIIOC), an affiliate of the investment adviser, is the Fund's transfer, dividend disbursing, and shareholder servicing agent. FIIOC receives an asset-based fee with respect to each class. Each class pays a fee for transfer agent services, typesetting and printing and mailing of shareholder reports, excluding mailing of proxy statements, equal to an annual rate of .15% of class-level average net assets invested in Underlying Funds that are not managed by the investment adviser or its affiliates. For the period, transfer agent fees for each class were as follows:
| Service Class | $320 |
| Service Class 2 | 69,620 |
| | $69,940 |
Brokerage Commissions. The Fund placed a portion of its portfolio transactions with brokerage firms which are affiliates of the investment adviser. Brokerage commissions are included in net realized gain (loss) and change in net unrealized appreciation (depreciation) in the Statement of Operations. The commissions paid to these affiliated firms were $826 for the period.
Interfund Trades. The Fund may purchase from or sell securities to other Fidelity Funds under procedures adopted by the Board. The procedures have been designed to ensure these interfund trades are executed in accordance with Rule 17a-7 of the 1940 Act.
6. Committed Line of Credit.
The Fund participates with other funds managed by the investment adviser or an affiliate in a $4.25 billion credit facility (the "line of credit") to be utilized for temporary or emergency purposes to fund shareholder redemptions or for other short-term liquidity purposes. The Fund has agreed to pay commitment fees on its pro-rata portion of the line of credit, which amounted to $818 and is reflected in Commitment fees on the Statement of Operations. During the period, the Fund did not borrow on this line of credit.
7. Expense Reductions.
The investment adviser contractually agreed to waive the Fund's management fee in an amount equal to .05% of the Funds' average net assets until April 30, 2019. During the period, the Fund's management fee was reduced by $153,078.
In addition, FMR has contractually agreed to reimburse .10% of class-level expenses for Service Class and Service Class 2. During the period, this reimbursement reduced the Fund's Service Class and Service Class 2's expenses by the following amounts:
| | Reimbursement |
| Service Class | $1,395 |
| Service Class 2 | 302,645 |
Commissions paid to certain brokers with whom the investment adviser, or its affiliates, places trades on behalf of the Fund include an amount in addition to trade execution, which may be rebated back to the Fund to offset certain expenses. This amount totaled $18,086 for the period. In addition, through arrangements with the Fund's custodian, credits realized as a result of certain uninvested cash balances were used to reduce the Fund's expenses. During the period, these credits reduced the Fund's custody expenses by $155.
8. Distributions to Shareholders.
Distributions to shareholders of each class were as follows:
| | Year ended
December 31, 2018 | Year ended
December 31, 2017 |
| Distributions to shareholders | | |
| Service Class | $66,169 | $– |
| Service Class 2 | 13,680,308 | – |
| Total | $13,746,477 | $– |
| From net investment income | | |
| Service Class | $– | $18,515 |
| Service Class 2 | – | 3,183,319 |
| Total | $– | $3,201,834 |
| From net realized gain | | |
| Service Class | $– | $90,675 |
| Service Class 2 | – | 17,371,828 |
| Total | $– | $17,462,503 |
9. Share Transactions.
Transactions for each class of shares were as follows:
| | Shares | Shares | Dollars | Dollars |
| | Year ended December 31, 2018 | Year ended December 31, 2017 | Year ended December 31, 2018 | Year ended December 31, 2017 |
| Service Class | | | | |
| Reinvestment of distributions | 1 | 229 | 12 | 2,784 |
| Shares redeemed | (3,236) | (12,992) | (39,954) | (157,252) |
| Net increase (decrease) | (3,235) | (12,763) | $(39,942) | $(154,468) |
| Service Class 2 | | | | |
| Shares sold | 4,379,242 | 6,196,371 | $52,972,408 | $75,448,510 |
| Reinvestment of distributions | 1,252,156 | 1,695,969 | 13,680,308 | 20,555,147 |
| Shares redeemed | (4,415,618) | (3,265,117) | (52,967,599) | (39,468,842) |
| Net increase (decrease) | 1,215,780 | 4,627,223 | $13,685,117 | $56,534,815 |
10. Other.
The Fund's organizational documents provide former and current trustees and officers with a limited indemnification against liabilities arising in connection with the performance of their duties to the Fund. In the normal course of business, the Fund may also enter into contracts that provide general indemnifications. The Fund's maximum exposure under these arrangements is unknown as this would be dependent on future claims that may be made against the Fund. The risk of material loss from such claims is considered remote.
At the end of the period, one otherwise unaffiliated shareholder was the owner of record of 96% of the total outstanding shares of the Fund.
Report of Independent Registered Public Accounting Firm
To the Board of Trustees of Variable Insurance Products Fund V and Shareholders of VIP Target Volatility Portfolio:
Opinion on the Financial Statements
We have audited the accompanying statement of assets and liabilities, including the schedule of investments, of VIP Target Volatility Portfolio (one of the funds constituting Variable Insurance Products Fund V, referred to hereafter as the "Fund") as of December 31, 2018, the related statement of operations for the year ended December 31, 2018, the statement of changes in net assets for each of the two years in the period ended December 31, 2018, including the related notes, and the financial highlights for each of the five years in the period ended December 31, 2018 (collectively referred to as the “financial statements”). In our opinion, the financial statements present fairly, in all material respects, the financial position of the Fund as of December 31, 2018, the results of its operations for the year then ended, the changes in its net assets for each of the two years in the period ended December 31, 2018 and the financial highlights for each of the five years in the period ended December 31, 2018 in conformity with accounting principles generally accepted in the United States of America.
Basis for Opinion
These financial statements are the responsibility of the Fund’s management. Our responsibility is to express an opinion on the Fund’s financial statements based on our audits. We are a public accounting firm registered with the Public Company Accounting Oversight Board (United States) (PCAOB) and are required to be independent with respect to the Fund in accordance with the U.S. federal securities laws and the applicable rules and regulations of the Securities and Exchange Commission and the PCAOB.
We conducted our audits of these financial statements in accordance with the standards of the PCAOB. Those standards require that we plan and perform the audit to obtain reasonable assurance about whether the financial statements are free of material misstatement, whether due to error or fraud.
Our audits included performing procedures to assess the risks of material misstatement of the financial statements, whether due to error or fraud, and performing procedures that respond to those risks. Such procedures included examining, on a test basis, evidence regarding the amounts and disclosures in the financial statements. Our audits also included evaluating the accounting principles used and significant estimates made by management, as well as evaluating the overall presentation of the financial statements. Our procedures included confirmation of securities owned as of December 31, 2018 by correspondence with the custodian and brokers; when replies were not received from brokers, we performed other auditing procedures. We believe that our audits provide a reasonable basis for our opinion.
PricewaterhouseCoopers LLP
Boston, Massachusetts
February 15, 2019
We have served as the auditor of one or more investment companies in the Fidelity group of funds since 1932.
Trustees and Officers
The Trustees, Members of the Advisory Board (if any), and officers of the trust and fund, as applicable, are listed below. The Board of Trustees governs the fund and is responsible for protecting the interests of shareholders. The Trustees are experienced executives who meet periodically throughout the year to oversee the fund's activities, review contractual arrangements with companies that provide services to the fund, oversee management of the risks associated with such activities and contractual arrangements, and review the fund's performance. If the interests of the fund and an underlying Fidelity® fund were to diverge, a conflict of interest could arise and affect how the Trustees and Members of the Advisory Board fulfill their fiduciary duties to the affected funds. FMRC has structured the fund to avoid these potential conflicts, although there may be situations where a conflict of interest is unavoidable. In such instances, FMRC, the Trustees, and Members of the Advisory Board would take reasonable steps to minimize and, if possible, eliminate the conflict. Each of the Trustees oversees 260 funds.
The Trustees hold office without limit in time except that (a) any Trustee may resign; (b) any Trustee may be removed by written instrument, signed by at least two-thirds of the number of Trustees prior to such removal; (c) any Trustee who requests to be retired or who has become incapacitated by illness or injury may be retired by written instrument signed by a majority of the other Trustees; and (d) any Trustee may be removed at any special meeting of shareholders by a two-thirds vote of the outstanding voting securities of the trust. Each Trustee who is not an interested person (as defined in the 1940 Act) of the trust and the fund is referred to herein as an Independent Trustee. Each Independent Trustee shall retire not later than the last day of the calendar year in which his or her 75th birthday occurs. The Independent Trustees may waive this mandatory retirement age policy with respect to individual Trustees. Officers and Advisory Board Members hold office without limit in time, except that any officer or Advisory Board Member may resign or may be removed by a vote of a majority of the Trustees at any regular meeting or any special meeting of the Trustees. Except as indicated, each individual has held the office shown or other offices in the same company for the past five years.
The fund’s Statement of Additional Information (SAI) includes more information about the Trustees. To request a free copy, call Fidelity at 1-877-208-0098.
Experience, Skills, Attributes, and Qualifications of the Trustees. The Governance and Nominating Committee has adopted a statement of policy that describes the experience, qualifications, attributes, and skills that are necessary and desirable for potential Independent Trustee candidates (Statement of Policy). The Board believes that each Trustee satisfied at the time he or she was initially elected or appointed a Trustee, and continues to satisfy, the standards contemplated by the Statement of Policy. The Governance and Nominating Committee also engages professional search firms to help identify potential Independent Trustee candidates who have the experience, qualifications, attributes, and skills consistent with the Statement of Policy. From time to time, additional criteria based on the composition and skills of the current Independent Trustees, as well as experience or skills that may be appropriate in light of future changes to board composition, business conditions, and regulatory or other developments, have also been considered by the professional search firms and the Governance and Nominating Committee. In addition, the Board takes into account the Trustees' commitment and participation in Board and committee meetings, as well as their leadership of standing and ad hoc committees throughout their tenure.
In determining that a particular Trustee was and continues to be qualified to serve as a Trustee, the Board has considered a variety of criteria, none of which, in isolation, was controlling. The Board believes that, collectively, the Trustees have balanced and diverse experience, qualifications, attributes, and skills, which allow the Board to operate effectively in governing the fund and protecting the interests of shareholders. Information about the specific experience, skills, attributes, and qualifications of each Trustee, which in each case led to the Board's conclusion that the Trustee should serve (or continue to serve) as a trustee of the fund, is provided below.
Board Structure and Oversight Function. Abigail P. Johnson is an interested person and currently serves as Chairman. The Trustees have determined that an interested Chairman is appropriate and benefits shareholders because an interested Chairman has a personal and professional stake in the quality and continuity of services provided to the fund. Independent Trustees exercise their informed business judgment to appoint an individual of their choosing to serve as Chairman, regardless of whether the Trustee happens to be independent or a member of management. The Independent Trustees have determined that they can act independently and effectively without having an Independent Trustee serve as Chairman and that a key structural component for assuring that they are in a position to do so is for the Independent Trustees to constitute a substantial majority for the Board. The Independent Trustees also regularly meet in executive session. Arthur E. Johnson serves as Chairman of the Independent Trustees and as such (i) acts as a liaison between the Independent Trustees and management with respect to matters important to the Independent Trustees and (ii) with management prepares agendas for Board meetings.
Fidelity® funds are overseen by different Boards of Trustees. The fund's Board oversees Fidelity's investment-grade bond, money market, asset allocation and certain equity funds, and other Boards oversee Fidelity's high income and other equity funds. The asset allocation funds may invest in Fidelity® funds that are overseen by such other Boards. The use of separate Boards, each with its own committee structure, allows the Trustees of each group of Fidelity® funds to focus on the unique issues of the funds they oversee, including common research, investment, and operational issues. On occasion, the separate Boards establish joint committees to address issues of overlapping consequences for the Fidelity® funds overseen by each Board.
The Trustees operate using a system of committees to facilitate the timely and efficient consideration of all matters of importance to the Trustees, the fund, and fund shareholders and to facilitate compliance with legal and regulatory requirements and oversight of the fund's activities and associated risks. The Board, acting through its committees, has charged FMR and its affiliates with (i) identifying events or circumstances the occurrence of which could have demonstrably adverse effects on the fund's business and/or reputation; (ii) implementing processes and controls to lessen the possibility that such events or circumstances occur or to mitigate the effects of such events or circumstances if they do occur; and (iii) creating and maintaining a system designed to evaluate continuously business and market conditions in order to facilitate the identification and implementation processes described in (i) and (ii) above. Because the day-to-day operations and activities of the fund are carried out by or through FMR, its affiliates, and other service providers, the fund's exposure to risks is mitigated but not eliminated by the processes overseen by the Trustees. While each of the Board's committees has responsibility for overseeing different aspects of the fund's activities, oversight is exercised primarily through the Operations and Audit Committees. In addition, an ad hoc Board committee of Independent Trustees has worked with FMR to enhance the Board's oversight of investment and financial risks, legal and regulatory risks, technology risks, and operational risks, including the development of additional risk reporting to the Board. Appropriate personnel, including but not limited to the fund's Chief Compliance Officer (CCO), FMR's internal auditor, the independent accountants, the fund's Treasurer and portfolio management personnel, make periodic reports to the Board's committees, as appropriate, including an annual review of Fidelity's risk management program for the Fidelity® funds. The responsibilities of each standing committee, including their oversight responsibilities, are described further under "Standing Committees of the Trustees."
Interested Trustees*:
Correspondence intended for a Trustee who is an interested person may be sent to Fidelity Investments, 245 Summer Street, Boston, Massachusetts 02210.
Name, Year of Birth; Principal Occupations and Other Relevant Experience+
Abigail P. Johnson (1961)
Year of Election or Appointment: 2009
Trustee
Chairman of the Board of Trustees
Ms. Johnson also serves as Trustee of other Fidelity® funds. Ms. Johnson serves as Chairman (2016-present), Chief Executive Officer (2014-present), and Director (2007-present) of FMR LLC (diversified financial services company), President of Fidelity Financial Services (2012-present) and President of Personal, Workplace and Institutional Services (2005-present). Ms. Johnson is Chairman and Director of FMR Co., Inc. (investment adviser firm, 2011-present) and Chairman and Director of FMR (investment adviser firm, 2011-present). Previously, Ms. Johnson served as Vice Chairman (2007-2016) and President (2013-2016) of FMR LLC, President and a Director of FMR (2001-2005), a Trustee of other investment companies advised by FMR, Fidelity Investments Money Management, Inc. (investment adviser firm), and FMR Co., Inc. (2001-2005), Senior Vice President of the Fidelity® funds (2001-2005), and managed a number of Fidelity® funds. Ms. Abigail P. Johnson and Mr. Arthur E. Johnson are not related.
Jennifer Toolin McAuliffe (1959)
Year of Election or Appointment: 2016
Trustee
Ms. McAuliffe also serves as Trustee of other Fidelity® funds. Ms. McAuliffe previously served as a Member of the Advisory Board of certain Fidelity® funds (2016) and as Co-Head of Fixed Income of Fidelity Investments Limited (now known as FIL Limited (FIL)) (diversified financial services company). Earlier roles at FIL included Director of Research for FIL’s credit and quantitative teams in London, Hong Kong and Tokyo. Ms. McAuliffe also was the Director of Research for taxable and municipal bonds at Fidelity Investments Money Management, Inc. Ms. McAuliffe is also a director or trustee of several not-for-profit entities.
* Determined to be an “Interested Trustee” by virtue of, among other things, his or her affiliation with the trust or various entities under common control with FMR.
+ The information includes the Trustee's principal occupation during the last five years and other information relating to the experience, attributes, and skills relevant to the Trustee's qualifications to serve as a Trustee, which led to the conclusion that the Trustee should serve as a Trustee for the fund.
Independent Trustees:
Correspondence intended for an Independent Trustee may be sent to Fidelity Investments, P.O. Box 55235, Boston, Massachusetts 02205-5235.
Name, Year of Birth; Principal Occupations and Other Relevant Experience+
Elizabeth S. Acton (1951)
Year of Election or Appointment: 2013
Trustee
Ms. Acton also serves as Trustee of other Fidelity® funds. Prior to her retirement in April 2012, Ms. Acton was Executive Vice President, Finance (2011-2012), Executive Vice President, Chief Financial Officer (2002-2011), and Treasurer (2004-2005) of Comerica Incorporated (financial services). Prior to joining Comerica, Ms. Acton held a variety of positions at Ford Motor Company (1983-2002), including Vice President and Treasurer (2000-2002) and Executive Vice President and Chief Financial Officer of Ford Motor Credit Company (1998-2000). Ms. Acton currently serves as a member of the Board of Directors and Audit and Finance Committees of Beazer Homes USA, Inc. (homebuilding, 2012-present). Previously, Ms. Acton served as a Member of the Advisory Board of certain Fidelity® funds (2013-2016).
Ann E. Dunwoody (1953)
Year of Election or Appointment: 2018
Trustee
General Dunwoody also serves as Trustee of other Fidelity® funds. General Dunwoody (United States Army, Retired) was the first woman in U.S. military history to achieve the rank of four-star general and prior to her retirement in 2012 held a variety of positions within the U.S. Army, including Commanding General, U.S. Army Material Command (2008-2012). She is the President of First to Four LLC (leadership and mentoring services, 2012-present). She also serves as a member of the Board of Directors and Nominating and Corporate Governance Committee of L3 Technologies, Inc. (communication, electronic, sensor, and aerospace systems, 2013-present), Board of Directors and Nomination and Corporate Governance Committees of Kforce Inc. (professional staffing services, 2016-present) and Board of Directors of Automattic Inc. (software engineering, 2018-present). Previously, General Dunwoody served as a Member of the Advisory Board of certain Fidelity® funds (2018), a member of the Board of Directors and Audit and Sustainability and Corporate Responsibility Committees of Republic Services, Inc. (waste collection, disposal and recycling, 2013-2016). Ms. Dunwoody also serves on several boards for non-profit organizations, including as a member of the Board of Directors, Chair of the Nomination and Governance Committee and member of the Audit Committee of Logistics Management Institute (consulting non-profit, 2012-present), a member of the Board of Directors of the Army Historical Foundation (2015-present), a member of the Council of Trustees for the Association of the United States Army (advocacy non-profit, 2013-present) and a member of the Board of Trustees of Florida Institute of Technology (2015-present) and ThanksUSA (military family education non-profit, 2014-present).
John Engler (1948)
Year of Election or Appointment: 2014
Trustee
Mr. Engler also serves as Trustee of other Fidelity® funds. He serves on the board of directors for Universal Forest Products (manufacturer and distributor of wood and wood-alternative products, 2003-present) and K12 Inc. (technology-based education company, 2012-present). Previously, Mr. Engler served as interim president of Michigan State University (2018-2019), a Member of the Advisory Board of certain Fidelity® funds (2014-2016), president of the Business Roundtable (2011-2017), a trustee of The Munder Funds (2003-2014), president and CEO of the National Association of Manufacturers (2004-2011), member of the Board of Trustees of the Annie E. Casey Foundation (2004-2015), and as governor of Michigan (1991-2003). He is a past chairman of the National Governors Association.
Robert F. Gartland (1951)
Year of Election or Appointment: 2010
Trustee
Mr. Gartland also serves as Trustee of other Fidelity® funds. Mr. Gartland is Chairman and an investor in Gartland & Mellina Group Corp. (consulting, 2009-present). Previously, Mr. Gartland served as a partner and investor of Vietnam Partners LLC (investments and consulting, 2008-2011). Prior to his retirement, Mr. Gartland held a variety of positions at Morgan Stanley (financial services, 1979-2007), including Managing Director (1987-2007), and Chase Manhattan Bank (1975-1978).
Arthur E. Johnson (1947)
Year of Election or Appointment: 2008
Trustee
Chairman of the Independent Trustees
Mr. Johnson also serves as Trustee of other Fidelity® funds. Mr. Johnson serves as a member of the Board of Directors of Eaton Corporation plc (diversified power management, 2009-present) and Booz Allen Hamilton (management consulting, 2011-present). Prior to his retirement, Mr. Johnson served as Senior Vice President of Corporate Strategic Development of Lockheed Martin Corporation (defense contractor, 1999-2009). He previously served on the Board of Directors of IKON Office Solutions, Inc. (1999-2008), AGL Resources, Inc. (holding company, 2002-2016), and Delta Airlines (2005-2007). Mr. Arthur E. Johnson is not related to Ms. Abigail P. Johnson.
Michael E. Kenneally (1954)
Year of Election or Appointment: 2009
Trustee
Vice Chairman of the Independent Trustees
Mr. Kenneally also serves as Trustee of other Fidelity® funds. Prior to his retirement, Mr. Kenneally served as Chairman and Global Chief Executive Officer of Credit Suisse Asset Management. Before joining Credit Suisse, he was an Executive Vice President and Chief Investment Officer for Bank of America Corporation. Earlier roles at Bank of America included Director of Research, Senior Portfolio Manager and Research Analyst, and Mr. Kenneally was awarded the Chartered Financial Analyst (CFA) designation in 1991.
Marie L. Knowles (1946)
Year of Election or Appointment: 2001
Trustee
Ms. Knowles also serves as Trustee of other Fidelity® funds. Prior to Ms. Knowles' retirement in June 2000, she served as Executive Vice President and Chief Financial Officer of Atlantic Richfield Company (ARCO) (diversified energy, 1996-2000). From 1993 to 1996, she was a Senior Vice President of ARCO and President of ARCO Transportation Company (pipeline and tanker operations). Ms. Knowles currently serves as a Director and Chairman of the Audit Committee of McKesson Corporation (healthcare service, since 2002). Ms. Knowles is a member of the Board of the Santa Catalina Island Company (real estate, 2009-present). Ms. Knowles is a Member of the Investment Company Institute Board of Governors and a Member of the Governing Council of the Independent Directors Council (2014-present). She also serves as a member of the Advisory Board for the School of Engineering of the University of Southern California. Previously, Ms. Knowles served as a Director of Phelps Dodge Corporation (copper mining and manufacturing, 1994-2007), URS Corporation (engineering and construction, 2000-2003) and America West (airline, 1999-2002). Ms. Knowles previously served as Chairman (2015-2018) and Vice Chairman (2012-2015) of the Independent Trustees of certain Fidelity® funds.
Mark A. Murray (1954)
Year of Election or Appointment: 2016
Trustee
Mr. Murray also serves as Trustee of other Fidelity® funds. Mr. Murray is Vice Chairman (2013-present) of Meijer, Inc. (regional retail chain). Previously, Mr. Murray served as a Member of the Advisory Board of certain Fidelity® funds (2016) and as Co-Chief Executive Officer (2013-2016) and President (2006-2013) of Meijer, Inc. Mr. Murray serves as a member of the Board of Directors and Nuclear Review and Public Policy and Responsibility Committees of DTE Energy Company (diversified energy company, 2009-present). Mr. Murray also serves as a member of the Board of Directors of Spectrum Health (not-for-profit health system, 2015-present). Mr. Murray previously served as President of Grand Valley State University (2001-2006), Treasurer for the State of Michigan (1999-2001), Vice President of Finance and Administration for Michigan State University (1998-1999), and a member of the Board of Directors and Audit Committee and Chairman of the Nominating and Corporate Governance Committee of Universal Forest Products, Inc. (manufacturer and distributor of wood and wood-alternative products, 2004-2016). Mr. Murray is also a director or trustee of many community and professional organizations.
+ The information includes the Trustee's principal occupation during the last five years and other information relating to the experience, attributes, and skills relevant to the Trustee's qualifications to serve as a Trustee, which led to the conclusion that the Trustee should serve as a Trustee for the fund.
Advisory Board Members and Officers:
Correspondence intended for an officer may be sent to Fidelity Investments, 245 Summer Street, Boston, Massachusetts 02210. Officers appear below in alphabetical order.
Name, Year of Birth; Principal Occupation
Elizabeth Paige Baumann (1968)
Year of Election or Appointment: 2017
Anti-Money Laundering (AML) Officer
Ms. Baumann also serves as AML Officer of other funds. She is Chief AML Officer (2012-present) and Senior Vice President (2014-present) of FMR LLC (diversified financial services company) and is an employee of Fidelity Investments. Previously, Ms. Baumann served as AML Officer of the funds (2012-2016), and Vice President (2007-2014) and Deputy Anti-Money Laundering Officer (2007-2012) of FMR LLC.
Craig S. Brown (1977)
Year of Election or Appointment: 2019
Assistant Treasurer
Mr. Brown also serves as Assistant Treasurer of other funds. Mr. Brown is an employee of Fidelity Investments (2013-present).
John J. Burke III (1964)
Year of Election or Appointment: 2018
Chief Financial Officer
Mr. Burke also serves as Chief Financial Officer of other funds. Mr. Burke serves as Head of Investment Operations for Fidelity Fund and Investment Operations (2018-present) and is an employee of Fidelity Investments (1998-present). Previously Mr. Burke served as head of Asset Management Investment Operations (2012-2018).
William C. Coffey (1969)
Year of Election or Appointment: 2018
Secretary and Chief Legal Officer (CLO)
Mr. Coffey also serves as Secretary and CLO of other funds. Mr. Coffey serves as CLO, Secretary, and Senior Vice President of Fidelity Management & Research Company and FMR Co., Inc. (investment adviser firms, 2018-present); Secretary of Fidelity SelectCo, LLC and Fidelity Investments Money Management, Inc. (investment adviser firms, 2018-present); and CLO of Fidelity Management & Research (Hong Kong) Limited, FMR Investment Management (UK) Limited, and Fidelity Management & Research (Japan) Limited (investment adviser firms, 2018-present). He is Senior Vice President and Deputy General Counsel of FMR LLC (diversified financial services company, 2010-present), and is an employee of Fidelity Investments. Previously, Mr. Coffey served as Assistant Secretary of certain funds (2009-2018) and as Vice President and Associate General Counsel of FMR LLC (2005-2009).
Jonathan Davis (1968)
Year of Election or Appointment: 2010
Assistant Treasurer
Mr. Davis also serves as Assistant Treasurer of other funds. Mr. Davis serves as Assistant Treasurer of FMR Capital, Inc. (2017-present) and is an employee of Fidelity Investments. Previously, Mr. Davis served as Vice President and Associate General Counsel of FMR LLC (diversified financial services company, 2003-2010).
Adrien E. Deberghes (1967)
Year of Election or Appointment: 2010
Assistant Treasurer
Mr. Deberghes also serves as an officer of other funds. He serves as Assistant Treasurer of FMR Capital, Inc. (2017-present), Executive Vice President of Fidelity Investments Money Management, Inc. (FIMM) (investment adviser firm, 2016-present), and is an employee of Fidelity Investments (2008-present). Previously, Mr. Deberghes served as President and Treasurer of certain Fidelity® funds (2013-2018). Prior to joining Fidelity Investments, Mr. Deberghes was Senior Vice President of Mutual Fund Administration at State Street Corporation (2007-2008), Senior Director of Mutual Fund Administration at Investors Bank & Trust (2005-2007), and Director of Finance for Dunkin' Brands (2000-2005). Previously, Mr. Deberghes served in other fund officer roles.
Laura M. Del Prato (1964)
Year of Election or Appointment: 2018
President and Treasurer
Ms. Del Prato also serves as an officer of other funds. Ms. Del Prato is an employee of Fidelity Investments (2017-present). Prior to joining Fidelity Investments, Ms. Del Prato served as a Managing Director and Treasurer of the JPMorgan Mutual Funds (2014-2017). Prior to JPMorgan, Ms. Del Prato served as a partner at Cohen Fund Audit Services (accounting firm, 2012-2013) and KPMG LLP (accounting firm, 2004-2012).
Colm A. Hogan (1973)
Year of Election or Appointment: 2016
Assistant Treasurer
Mr. Hogan also serves as an officer of other funds. Mr. Hogan serves as Assistant Treasurer of FMR Capital, Inc. (2017-present) and is an employee of Fidelity Investments (2005-present). Previously, Mr. Hogan served as Assistant Treasurer of certain Fidelity® funds (2016-2018).
Chris Maher (1972)
Year of Election or Appointment: 2013
Assistant Treasurer
Mr. Maher serves as Assistant Treasurer of other funds. Mr. Maher is Vice President of Valuation Oversight, serves as Assistant Treasurer of FMR Capital, Inc. (2017-present), and is an employee of Fidelity Investments. Previously, Mr. Maher served as Vice President of Asset Management Compliance (2013), Vice President of the Program Management Group of FMR (investment adviser firm, 2010-2013), and Vice President of Valuation Oversight (2008-2010).
John B. McGinty, Jr. (1962)
Year of Election or Appointment: 2016
Chief Compliance Officer
Mr. McGinty also serves as Chief Compliance Officer of other funds. Mr. McGinty is Senior Vice President of Asset Management Compliance for Fidelity Investments and is an employee of Fidelity Investments (2016-present). Mr. McGinty previously served as Vice President, Senior Attorney at Eaton Vance Management (investment management firm, 2015-2016), and prior to Eaton Vance as global CCO for all firm operations and registered investment companies at GMO LLC (investment management firm, 2009-2015). Before joining GMO LLC, Mr. McGinty served as Senior Vice President, Deputy General Counsel for Fidelity Investments (2007-2009).
Jason P. Pogorelec (1975)
Year of Election or Appointment: 2015
Assistant Secretary
Mr. Pogorelec also serves as Assistant Secretary of other funds. Mr. Pogorelec serves as Vice President, Associate General Counsel (2010-present) and is an employee of Fidelity Investments (2006-present).
Nancy D. Prior (1967)
Year of Election or Appointment: 2014
Vice President
Ms. Prior also serves as Vice President of other funds. Ms. Prior serves as President Fixed Income, High Income/Emerging Market Debt and Multi Asset Class Strategies of FIAM LLC (2018-present), President (2016-present) and Director (2014-present) of Fidelity Investments Money Management, Inc. (FIMM) (investment adviser firm), President, Fixed Income (2014-present), and is an employee of Fidelity Investments (2002-present). Previously, Ms. Prior served as Vice Chairman of FIAM LLC (investment adviser firm, 2014-2018), a Director of FMR Investment Management (UK) Limited (investment adviser firm, 2015-2018), President Multi-Asset Class Strategies of FMR's Global Asset Allocation Division (2017-2018), Vice President of Fidelity's Money Market Funds (2012-2014), President, Money Market and Short Duration Bond Group of Fidelity Management & Research (FMR) (investment adviser firm, 2013-2014), President, Money Market Group of FMR (2011-2013), Managing Director of Research (2009-2011), Senior Vice President and Deputy General Counsel (2007-2009), and Assistant Secretary of certain Fidelity® funds (2008-2009).
Stacie M. Smith (1974)
Year of Election or Appointment: 2013
Assistant Treasurer
Ms. Smith also serves as an officer of other funds. Ms. Smith serves as Assistant Treasurer of FMR Capital, Inc. (2017-present), is an employee of Fidelity Investments (2009-present), and has served in other fund officer roles. Prior to joining Fidelity Investments, Ms. Smith served as Senior Audit Manager of Ernst & Young LLP (accounting firm, 1996-2009). Previously, Ms. Smith served as Assistant Treasurer (2013-2018) and Deputy Treasurer (2013-2016) of certain Fidelity® funds.
Marc L. Spector (1972)
Year of Election or Appointment: 2016
Deputy Treasurer
Mr. Spector also serves as an officer of other funds. Mr. Spector serves as Assistant Treasurer of FMR Capital, Inc. (2017-present) and is an employee of Fidelity Investments (2016-present). Prior to joining Fidelity Investments, Mr. Spector served as Director at the Siegfried Group (accounting firm, 2013-2016), and prior to Siegfried Group as audit senior manager at Deloitte & Touche (accounting firm, 2005-2013).
Jim Wegmann (1979)
Year of Election or Appointment: 2019
Assistant Treasurer
Mr. Wegmann also serves as Assistant Treasurer of other funds. Mr. Wegmann is an employee of Fidelity Investments (2011-present).
Shareholder Expense Example
As a shareholder of the Fund, you incur two types of costs: (1) transaction costs and (2) ongoing costs, including management fees, distribution and/or service (12b-1) fees and other Fund expenses. This Example is intended to help you understand your ongoing costs (in dollars) of investing in the Fund and to compare these costs with the ongoing costs of investing in other mutual funds.
The Example is based on an investment of $1,000 invested at the beginning of the period and held for the entire period (July 1, 2018 to December 31, 2018).
Actual Expenses
The first line of the accompanying table for each class of the Fund provides information about actual account values and actual expenses. You may use the information in this line, together with the amount you invested, to estimate the expenses that you paid over the period. Simply divide your account value by $1,000.00 (for example, an $8,600 account value divided by $1,000.00 = 8.6), then multiply the result by the number in the first line for a class of the Fund under the heading entitled "Expenses Paid During Period" to estimate the expenses you paid on your account during this period. The estimate of expenses does not include any fees or other expenses of any variable annuity or variable life insurance product. If they were, the estimate of expenses you paid during the period would be higher, and your ending account value would be lower. In addition, the Fund, as a shareholder in underlying mutual funds and exchange-traded funds (ETFs)(the Underlying Funds), will indirectly bear its pro-rata share of the fees and expenses incurred by the underlying Fidelity Funds. These fees and expenses are not included in the Fund's annualized expense ratio used to calculate the expense estimate in the table below.
Hypothetical Example for Comparison Purposes
The second line of the accompanying table for each class of the Fund provides information about hypothetical account values and hypothetical expenses based on a Class' actual expense ratio and an assumed rate of return of 5% per year before expenses, which is not the Class' actual return. The hypothetical account values and expenses may not be used to estimate the actual ending account balance or expenses you paid for the period. You may use this information to compare the ongoing costs of investing in the Fund and other funds. To do so, compare this 5% hypothetical example with the 5% hypothetical examples that appear in the shareholder reports of the other funds. The estimate of expenses does not include any fees or other expenses of any variable annuity or variable life insurance product. If they were, the estimate of expenses you paid during the period would be higher, and your ending account value would be lower. In addition, the Fund, as a shareholder in underlying mutual funds and exchange-traded funds (ETFs)(the Underlying Funds), will indirectly bear its pro-rata share of the fees and expenses incurred by the underlying Fidelity Funds. These fees and expenses are not included in the Fund's annualized expense ratio used to calculate the expense estimate in the table below.
Please note that the expenses shown in the table are meant to highlight your ongoing costs only and do not reflect any transaction costs. Therefore, the second line of the table is useful in comparing ongoing costs only, and will not help you determine the relative total costs of owning different funds.
| | Annualized Expense Ratio-A | Beginning
Account Value
July 1, 2018 | Ending
Account Value
December 31, 2018 | Expenses Paid
During Period-B
July 1, 2018
to December 31, 2018 |
| Service Class | .27% | | | |
| Actual | | $1,000.00 | $936.40 | $1.32 |
| Hypothetical-C | | $1,000.00 | $1,023.84 | $1.38 |
| Service Class 2 | .42% | | | |
| Actual | | $1,000.00 | $934.60 | $2.05 |
| Hypothetical-C | | $1,000.00 | $1,023.09 | $2.14 |
A Annualized expense ratio reflects expenses net of applicable fee waivers.
B Expenses are equal to each Class' annualized expense ratio, multiplied by the average account value over the period, multiplied by 184/365 (to reflect the one-half year period).
C 5% return per year before expenses
Distributions (Unaudited)
The Board of Trustees of VIP Target Volatility Portfolio Fund voted to pay to shareholders of record at the opening of business on record date, the following distributions per share derived from capital gains realized from sales of portfolio securities:
| | Pay Date | Record Date | Capital Gains |
| VIP Target Volatility Portfolio | | | |
| Service Class | 02/15/19 | 02/15/19 | $0.271 |
| Service Class 2 | 02/15/19 | 02/15/19 | $0.271 |
The fund hereby designates as a capital gain dividend with respect to the taxable year ended December 31, 2018, $10,939,587, or, if subsequently determined to be different, the net capital gain of such year.
Service Class designates 3%, 19% and 20%; Service Class 2 designates 3%, 20% and 20% of the dividends distributed in February and December 2018, respectively during the fiscal year as qualifying for the dividends–received deduction for corporate shareholders.
The amounts per share which represent income derived from sources within, and taxes paid to, foreign countries or possessions of the United States are as follows:
| | Pay Date | Income | Taxes |
| VIP Target Volatility Portfolio | | | |
| Service Class | 12/21/18 | $0.0465 | $0.0036 |
| Service Class | 12/31/18 | $0.0000 | $0.0000 |
| Service Class 2 | 12/21/18 | $0.0428 | $0.0036 |
| Service Class 2 | 12/31/18 | $0.0000 | $0.0000 |
Board Approval of Investment Advisory Contracts and Management Fees
VIP Target Volatility Portfolio
Each year, the Board of Trustees, including the Independent Trustees (together, the Board), votes on the renewal of the management contract (the Advisory Contract) with FMR Co., Inc. (FMRC), an affiliate of Fidelity Management & Research Company (FMR), for the fund. The Board, assisted by the advice of fund counsel and Independent Trustees' counsel, requests and considers a broad range of information relevant to the renewal of the Advisory Contract the year.
The Board meets regularly and, at each of its meetings, covers an extensive agenda of topics and materials and considers factors that are relevant to its annual consideration of the renewal of the fund's Advisory Contract, including the services and support provided to the fund and its shareholders. The Board has established four standing committees (Committees) — Operations, Audit, Fair Valuation, and Governance and Nominating — each composed of and chaired by Independent Trustees with varying backgrounds, to which the Board has assigned specific subject matter responsibilities in order to enhance effective decision-making by the Board. The Operations Committee, of which all of the Independent Trustees are members, meets regularly throughout the year and considers, among other matters, information specifically related to the annual consideration of the renewal of the fund's Advisory Contract. The Board, acting directly and through its Committees, requests and receives information concerning the annual consideration of the renewal of the fund's Advisory Contract. The Board also meets as needed to review matters specifically related to the Board's annual consideration of the renewal of the Advisory Contract. Members of the Board may also meet with trustees of other Fidelity funds through joint ad hoc committees to discuss certain matters relevant to all of the Fidelity funds.
At its September 2018 meeting, the Board unanimously determined to renew the fund's Advisory Contract. In reaching its determination, the Board considered all factors it believed relevant, including (i) the nature, extent, and quality of the services to be provided to the fund and its shareholders (including the investment performance of the fund); (ii) the competitiveness of the fund's management fee and total expense ratio relative to peer funds; (iii) the total costs of the services to be provided by and the profits to be realized by Fidelity from its relationships with the fund; and (iv) the extent to which, if any, economies of scale exist and would be realized as the fund grows, and whether any economies of scale are appropriately shared with fund shareholders.
In considering whether to renew the Advisory Contract for the fund, the Board reached a determination, with the assistance of fund counsel and Independent Trustees' counsel and through the exercise of its business judgment, that the renewal of the Advisory Contract was in the best interests of the fund and its shareholders and that the compensation payable under the Advisory Contract was fair and reasonable. The Board's decision to renew the Advisory Contract was not based on any single factor, but rather was based on a comprehensive consideration of all the information provided to the Board at its meetings throughout the year. The Board, in reaching its determination to renew the Advisory Contract, was aware that shareholders of the fund have a broad range of investment choices available to them, including a wide choice among funds offered by Fidelity's competitors, and that the fund's shareholders, who have the opportunity to review and weigh the disclosure provided by the fund in its prospectus and other public disclosures, have chosen to invest in this fund, which is part of the Fidelity family of funds.
Nature, Extent, and Quality of Services Provided. The Board considered Fidelity's staffing as it relates to the fund, including the backgrounds of investment personnel of FMRC, and also considered the fund's investment objective, strategies, and related investment philosophy. The Independent Trustees also had discussions with senior management of Fidelity's investment operations and investment groups with responsibility for the underlying Fidelity funds in which the fund invests. The Board considered the structure of the investment personnel compensation program and whether this structure provides appropriate incentives to act in the best interests of the fund. Additionally, the Board considered the portfolio managers' investments, if any, in the funds that they manage.
Resources Dedicated to Investment Management and Support Services. The Board reviewed the general qualifications and capabilities of Fidelity's investment staff, including its size, education, experience, and resources, as well as Fidelity's approach to recruiting, managing, and compensating investment personnel. The Board noted that Fidelity has continued to increase the resources devoted to non-U.S. offices, including expansion of Fidelity's global investment organization. The Board also noted that Fidelity's analysts have extensive resources, tools and capabilities that allow them to conduct sophisticated quantitative and fundamental analysis, as well as credit analysis of issuers, counterparties and guarantors. Further, the Board considered that Fidelity's investment professionals have sufficient access to global information and data so as to provide competitive investment results over time, and that those professionals also have access to sophisticated tools that permit them to assess portfolio construction and risk and performance attribution characteristics continuously, as well as to transmit new information and research conclusions rapidly around the world. Additionally, in its deliberations, the Board considered Fidelity's trading, risk management, compliance, and technology and operations capabilities and resources, which are integral parts of the investment management process.
Shareholder and Administrative Services. The Board considered (i) the nature, extent, quality, and cost of advisory, administrative, and shareholder services performed by Fidelity under the Advisory Contract and under separate agreements covering transfer agency, pricing and bookkeeping, and securities lending services for the fund; (ii) the nature and extent of the supervision of third party service providers, principally custodians, subcustodians, and pricing vendors; and (iii) the resources devoted to, and the record of compliance with, the fund's compliance policies and procedures. The Board also reviewed the allocation of fund brokerage, including allocations to brokers affiliated with the investment adviser, the use of brokerage commissions to pay fund expenses, and the use of "soft" commission dollars to pay for research services.
The Board noted that the growth of fund assets over time across the complex allows Fidelity to reinvest in the development of services designed to enhance the value and convenience of the Fidelity funds as investment vehicles. These services include 24-hour access to account information and market information through telephone representatives and over the Internet, investor education materials and asset allocation tools, and the expanded availability of Fidelity Investor Centers.
Investment in a Large Fund Family. The Board considered the benefits to shareholders of investing in a Fidelity fund, including the benefits of investing in a fund that is part of a large family of funds offering a variety of investment disciplines and providing a large variety of mutual fund investor services. The Board noted that Fidelity had taken, or had made recommendations that resulted in the Fidelity funds taking, a number of actions over the previous year that benefited particular funds, including: (i) continuing to dedicate additional resources to Fidelity's investment research process, which includes meetings with management of issuers of securities in which the funds invest, and to the support of the senior management team that oversees asset management; (ii) continuing efforts to enhance Fidelity's global research capabilities; (iii) launching new funds and making other enhancements to meet client needs; (iv) launching new share classes of existing funds; (v) eliminating purchase minimums and broadening eligibility requirements for certain funds and share classes; (vi) reducing management fees and total expenses for certain growth equity funds and index funds; (vii) lowering expense caps for certain existing funds and classes, and converting certain voluntary expense caps to contractual caps, to reduce expenses borne by shareholders; (viii) eliminating short-term redemption fees for funds that had such fees; (ix) rationalizing product lines and gaining increased efficiencies from fund mergers and share class consolidations; (x) continuing to develop, acquire and implement systems and technology to improve services to the funds and shareholders, strengthen information security, and increase efficiency; and (xi) continuing to implement enhancements to further strengthen Fidelity's product line to increase investors' probability of success in achieving their investment goals, including retirement income goals.
Investment Performance. The Board considered whether the fund has operated in accordance with its investment objective, as well as its record of compliance with its investment restrictions and its performance history. The Board noted that there was a portfolio management change for the fund in January 2018.
The Board took into account discussions that occur at Board meetings throughout the year with representatives of the investment adviser about fund investment performance. In this regard the Board noted that as part of regularly scheduled fund reviews and other reports to the Board on fund performance, the Board considers annualized return information for the fund for different time periods, measured against one or more appropriate securities market indices, including a customized blended index that reflects the respective weights of the fund's asset classes (each a "benchmark index") and a peer group of funds with similar objectives ("peer group"), if any. In its evaluation of fund investment performance at meetings throughout the year, the Board gave particular attention to information indicating underperformance of certain Fidelity funds for specific time periods and discussed with the investment adviser the reasons for such underperformance.
In addition to reviewing absolute and relative fund performance, the Independent Trustees periodically consider the appropriateness of fund performance metrics in evaluating the results achieved. In general, the Independent Trustees believe that fund performance should be evaluated based on gross performance (before fees and expenses, including acquired fund fees and expenses, but after transaction costs, if any) compared to appropriate benchmark indices, over appropriate time periods that may include full market cycles, and on net performance (after fees and expenses, including acquired fund fees and expenses) compared to peer groups, as applicable, over the same periods, taking into account relevant factors including the following: general market conditions; the extent to which particular underlying funds affected performance; and fund cash flows and other factors. Depending on the circumstances, the Independent Trustees may be satisfied with a fund's performance notwithstanding that it lags its benchmark index or peer group for certain periods.
The Independent Trustees recognize that shareholders evaluate performance on a net basis over their own holding periods, for which one-, three-, and five-year periods are often used as a proxy. For this reason, the performance information reviewed by the Board also included net cumulative calendar year total return information for the fund and an appropriate benchmark index for the most recent one- and three-year periods.
Based on its review, the Board concluded that the nature, extent, and quality of services provided to the fund under the Advisory Contract should continue to benefit the shareholders of the fund.
Competitiveness of Management Fee and Total Expense Ratio. The Board considered the fund's management fee and total expense ratio compared to "mapped groups" of competitive funds and classes created for the purpose of facilitating the Trustees' competitive analysis of management fees and total expenses, and also considered that the fund bears indirectly the fees and expenses, including the management fees, paid by the underlying funds in which it invests. Fidelity creates "mapped groups" by combining similar Lipper investment objective categories that have comparable investment mandates. Combining Lipper investment objective categories aids the Board's management fee and total expense ratio comparisons by broadening the competitive group used for comparison.
Management Fee. The Board considered two proprietary management fee comparisons for the 12-month (or shorter) periods shown in basis points (BP) in the chart below. The group of Lipper funds used by the Board for management fee comparisons is referred to below as the "Total Mapped Group." The Total Mapped Group comparison focuses on a fund's standing in terms of gross management fees before expense reimbursements or caps relative to the total universe of funds with comparable investment mandates, regardless of whether their management fee structures also are comparable. Funds with comparable investment mandates offer exposure to similar types of securities. Funds with comparable management fee structures have similar management fee contractual arrangements (
e.g., flat rate charged for advisory services, all-inclusive fee rate,
etc.). "TMG %" represents the percentage of funds in the Total Mapped Group that had management fees that were lower than the fund's. For example, a hypothetical TMG % of 20% would mean that 80% of the funds in the Total Mapped Group had higher, and 20% had lower, management fees than the fund. The fund's actual TMG %s and the number of funds in the Total Mapped Group are in the chart below. The "Asset-Size Peer Group" (ASPG) comparison focuses on a fund's standing relative to a subset of non-Fidelity funds within the Total Mapped Group that are similar in size and management fee structure. For example, if a fund is in the first quartile of the ASPG, the fund's management fee ranks in the least expensive or lowest 25% of funds in the ASPG. The ASPG represents at least 15% of the funds in the Total Mapped Group with comparable asset size and management fee structures, subject to a minimum of 50 funds (or all funds in the Total Mapped Group if fewer than 50). Additional information, such as the ASPG quartile in which the fund's management fee rate ranked, is also included in the chart and was considered by the Board. Because the vast majority of competitor funds' management fees do not cover non-management expenses, in prior years, the fund was compared on the basis of a hypothetical "net management fee," which was derived by subtracting payments made by FMR for "fund-level" non-management expenses (including pricing and bookkeeping fees and fees paid to non-affiliated custodians) from the fund's management fee. Fidelity no longer calculates a hypothetical net management fee for the fund and, as a result, the chart does not include a hypothetical net management fee for 2017.
VIP Target Volatility Portfolio
The Board noted that the fund's management fee rate ranked above the median of its Total Mapped Group and above the median of its ASPG for 2017. The Board considered that the fund is more actively managed than most funds in its Total Mapped Group and ASPG.
Furthermore, the Board considered that FMRC has contractually agreed to waive 0.05% of the fund's management fee through April 30, 2019.
The Board noted that it and the boards of other Fidelity funds formed an ad hoc Committee on Group Fee, which meets periodically, to conduct an in-depth review of the "group fee" component of the management fee of funds with such management fee structures, and that while the fund does not pay a management fee with a group fee component, it indirectly bears a portion of the management fees paid by the Fidelity funds in which it invests, some of which are subject to the group fee. The Committee's focus included the mechanics of the group fee, the competitive landscape of group fee structures, Fidelity funds with no group fee component (such as the fund) and investment products not included in group fee assets. The Board also considered that, for funds subject to the group fee, FMR agreed to voluntarily waive fees over a specified period of time in amounts designed to account for assets converted from certain funds to certain collective investment trusts.
Based on its review, the Board concluded that the fund's management fee is fair and reasonable in light of the services that the fund receives and the other factors considered.
Total Expense Ratio. In its review of each class's total expense ratio, the Board considered the fund's management fee rate as well as other "fund-level" expenses, such as pricing and bookkeeping fees and custodial, legal, and audit fees, paid by FMR under the fund's management contract. The Board also considered other "class-level" expenses, such as transfer agent fees and fund-paid 12b-1 fees. The Board also noted that Fidelity may agree to waive fees and expenses from time to time, and the extent to which, if any, it has done so for the fund. As part of its review, the Board also considered the current and historical total expense ratios of each class of the fund compared to competitive fund median expenses. Each class of the fund is compared to those funds and classes in the Total Mapped Group (used by the Board for management fee comparisons) that have a similar sales load structure.
The Board noted that the total expense ratio of Service Class ranked below the competitive median for 2017 and the total expense ratio of Service Class 2 ranked above the competitive median for 2017. The Board considered that, in general, various factors can affect total expense ratios. The Board noted that the total expense ratio of Service Class 2 was above the competitive median because of its 12b-1 fees and that excluding 12b-1 fees of both the class and competitor classes, the total expense ratio of Service Class 2 ranked below the median. The Board noted that the fund offers multiple classes, each of which has a different 12b-1 fee structure, and that the multiple structures are intended to offer a range of pricing options for the intermediary market. The Board also noted that the total expense ratios of the classes vary primarily by the level of their 12b-1 fees, although differences in transfer agent fees may also cause expenses to vary from class to class.
In considering the total expense ratio of each class of the fund, the Board also considered an alternative competitive analysis that included both top level (
i.e., direct) fund fees and acquired fund fees and expenses for the fund and the other funds and classes to which it is compared. The Board noted that, under this alternative competitive analysis, the total expense ratio of Service Class ranked below the competitive median for 2017 and the total expense ratio of Service Class 2 ranked above the competitive median for 2017. The Board noted that the total expense ratio of Service Class 2 was above the competitive median because of its 12b-1 fees.
The Board further considered that FMR contractually agreed to reimburse 0.10% of "class-level" expenses for Service Class and Service Class 2 as long as these classes continue to be sold to unaffiliated insurance companies.
Fees Charged to Other Fidelity Clients. The Board also considered Fidelity fee structures and other information with respect to clients of Fidelity, such as other funds advised or subadvised by Fidelity, pension plan clients, and other institutional clients with similar mandates. The Board noted that a joint ad hoc committee created by it and the boards of other Fidelity funds periodically reviews and compares Fidelity's institutional investment advisory business with its business of providing services to the Fidelity funds and also noted the most recent findings of the committee. The Board noted that the committee's review included a consideration of the differences in services provided, fees charged, and costs incurred, as well as competition in the markets serving the different categories of clients.
Based on its review of total expense ratios and fees charged to other Fidelity clients, the Board concluded that the total expense ratio of each class of the fund was reasonable in light of the services that the fund and its shareholders receive and the other factors considered.
Costs of the Services and Profitability. The Board considered the revenues earned and the expenses incurred by Fidelity in conducting the business of developing, marketing, distributing, managing, administering and servicing the fund and servicing the fund's shareholders. The Board also considered the level of Fidelity's profits in respect of all the Fidelity funds, including the Fidelity funds in which the fund invests.
On an annual basis, Fidelity presents to the Board information about the profitability of its relationships with the fund. Fidelity calculates profitability information for each fund, as well as aggregate profitability information for groups of Fidelity funds and all Fidelity funds, using a series of detailed revenue and cost allocation methodologies which originate with the books and records of Fidelity on which Fidelity's audited financial statements are based. The Audit Committee of the Board reviews any significant changes from the prior year's methodologies.
PricewaterhouseCoopers LLP (PwC), auditor to Fidelity and certain Fidelity funds, has been engaged annually by the Board as part of the Board's assessment of Fidelity's profitability analysis. PwC's engagement includes the review and assessment of the methodologies used by Fidelity in determining the revenues and expenses attributable to Fidelity's mutual fund business, and completion of agreed-upon procedures in respect of the mathematical accuracy of the fund profitability information and its conformity to established allocation methodologies. After considering PwC's reports issued under the engagement and information provided by Fidelity, the Board concluded that while other allocation methods may also be reasonable, Fidelity's profitability methodologies are reasonable in all material respects.
The Board also reviewed Fidelity's non-fund businesses and potential indirect benefits such businesses may have received as a result of their association with Fidelity's mutual fund business (i.e., fall-out benefits) as well as cases where Fidelity's affiliates may benefit from the fund's business. The Board noted that changes to fall-out benefits year-over-year reflect business developments at Fidelity's various businesses.
The Board considered the costs of the services provided by and the profits realized by Fidelity in connection with the operation of the fund and was satisfied that the profitability was not excessive.
Economies of Scale. The Board considered whether there have been economies of scale in respect of the management of the Fidelity funds, whether the Fidelity funds (including the fund) have appropriately benefited from any such economies of scale, and whether there is potential for realization of any further economies of scale. The Board considered the extent to which the fund will benefit from economies of scale as assets grow through increased services to the fund, through waivers or reimbursements, or through fee or expense ratio reductions. The Board also noted that a committee (the Economies of Scale Committee) created by it and the boards of other Fidelity funds periodically analyzes whether Fidelity attains economies of scale in respect of the management and servicing of the Fidelity funds, whether the Fidelity funds have appropriately benefited from such economies of scale, and whether there is potential for realization of any further economies of scale.
The Board concluded, taking into account the analysis of the Economies of Scale Committee, that economies of scale, if any, are being appropriately shared between fund shareholders and Fidelity.
Additional Information Requested by the Board. In order to develop fully the factual basis for consideration of the Fidelity funds' advisory contracts, the Board requested and received additional information on certain topics, including: (i) Fidelity's fund profitability methodology, profitability trends for certain funds, the allocation of various costs to different funds, and the impact of certain factors on fund profitability results; (ii) portfolio manager changes that have occurred during the past year and the amount of the investment that each portfolio manager has made in the Fidelity fund(s) that he or she manages; (iii) Fidelity's compensation structure for portfolio managers, research analysts, and other key personnel, including its effects on fund profitability, the rationale for the compensation structure, and the extent to which current market conditions have affected retention and recruitment; (iv) the arrangements with and compensation paid to certain fund sub-advisers on behalf of the Fidelity funds and the treatment of such compensation within Fidelity's fund profitability methodology; (v) the terms of Fidelity's voluntary expense limitation agreements; (vi) the methodology with respect to competitive fund data and peer group classifications; (vii) Fidelity's transfer agent fee, expense, and service structures for different funds and classes relative to competitive trends, and the impact of the increased use of omnibus accounts; (viii) new developments in the retail and institutional marketplaces and the competitive positioning of the funds relative to other investment products and services; (ix) the impact of recent changes to the money market fund landscape, including the full implementation of money market fund reform and rising interest rates, on Fidelity's money market funds; (x) the funds' share class structures and distribution channels; and (xi) explanations regarding the relative total expense ratios of certain funds and classes, total expense competitive trends and methodologies for total expense competitive comparisons, and actions that might be taken by Fidelity to reduce total expense ratios for certain classes. In addition, the Board considered its discussions with Fidelity throughout the year regarding enhanced information security initiatives and the funds' fair valuation policies.
Based on its evaluation of all of the conclusions noted above, and after considering all factors it believed relevant, the Board concluded that the advisory fee arrangements are fair and reasonable, and that the fund's Advisory Contract should be renewed.
VIPTV-ANN-0219
1.955015.105
Fidelity® Variable Insurance Products: Bond Index Portfolio
Annual Report December 31, 2018 |
|
Beginning on January 1, 2021, as permitted by regulations adopted by the Securities and Exchange Commission, and if your insurance carrier elects to participate, you may not be receiving paper copies of the Fund’s shareholder reports from the insurance company that offers your variable insurance product unless you specifically request paper copies from your financial professional or the administrator of your variable insurance product. Instead, the reports will be made available on a website, and you will be notified by mail each time a report is posted and provided with a website link to access the report.
If you already elected to receive shareholder reports electronically, you will not be affected by this change and you need not take any action. You may elect to receive shareholder reports and other communications from the Fund electronically, by contacting your financial professional or the administrator of your variable insurance product. If you own a Fidelity-administered variable insurance product, please visit fidelity.com/mailpreferences to make your election or call 1-800-343-3548.
You may elect to receive all future reports in paper free of charge. If you wish to continue receiving paper copies of your shareholder reports, you may contact your financial professional or the administrator of your variable insurance product. If you own a Fidelity-administered variable insurance product, please visit fidelity.com/mailpreferences to make your election or call 1-800-343-3548. Your election to receive reports in paper will apply to all funds available under your variable insurance product.
Contents
To view a fund's proxy voting guidelines and proxy voting record for the 12-month period ended June 30, visit http://www.fidelity.com/proxyvotingresults or visit the Securities and Exchange Commission's (SEC) web site at http://www.sec.gov.
You may also call 1-877-208-0098 to request a free copy of the proxy voting guidelines.
Fidelity® Variable Insurance Products are separate account options which are purchased through a variable insurance contract.
Standard & Poor's, S&P and S&P 500 are registered service marks of The McGraw-Hill Companies, Inc. and have been licensed for use by Fidelity Distributors Corporation.
Other third-party marks appearing herein are the property of their respective owners.
All other marks appearing herein are registered or unregistered trademarks or service marks of FMR LLC or an affiliated company. © 2019 FMR LLC. All rights reserved.
This report and the financial statements contained herein are submitted for the general information of the shareholders of the Fund. This report is not authorized for distribution to prospective investors in the Fund unless preceded or accompanied by an effective prospectus.
A fund files its complete schedule of portfolio holdings with the SEC for the first and third quarters of each fiscal year on Form N-Q. Forms N-Q are available on the SEC’s web site at http://www.sec.gov. A fund's Forms N-Q may be reviewed and copied at the SEC’s Public Reference Room in Washington, DC. Information regarding the operation of the SEC's Public Reference Room may be obtained by calling 1-800-SEC-0330.
For a complete list of a fund's portfolio holdings, view the most recent holdings listing, semiannual report, or annual report on Fidelity's web site at http://www.fidelity.com, http://www.institutional.fidelity.com, or http://www.401k.com, as applicable.
NOT FDIC INSURED •MAY LOSE VALUE •NO BANK GUARANTEE
Neither the Fund nor Fidelity Distributors Corporation is a bank.
Performance: The Bottom Line
Average annual total return reflects the change in the value of an investment, assuming reinvestment of distributions from dividend income and capital gains (the profits earned upon the sale of securities that have grown in value, if any) and assuming a constant rate of performance each year. During periods of reimbursement by Fidelity, a fund’s total return will be greater than it would be had the reimbursement not occurred. Performance numbers are net of all underlying fund operating expenses, but do not include any insurance charges imposed by your insurance company’s separate account. If performance information included the effect of these additional charges, the total returns would have been lower. How a fund did yesterday is no guarantee of how it will do tomorrow.
Average annual total returns for VIP Bond Index Portfolio will be reported once the fund is a year old.
$10,000 Over Life of Fund
Let's say hypothetically that $10,000 was invested in VIP Bond Index Portfolio - Initial Class on April 19, 2018, when the fund started.
The chart shows how the value of your investment would have changed, and also shows how the Bloomberg Barclays U.S. Aggregate Bond Index performed over the same period.
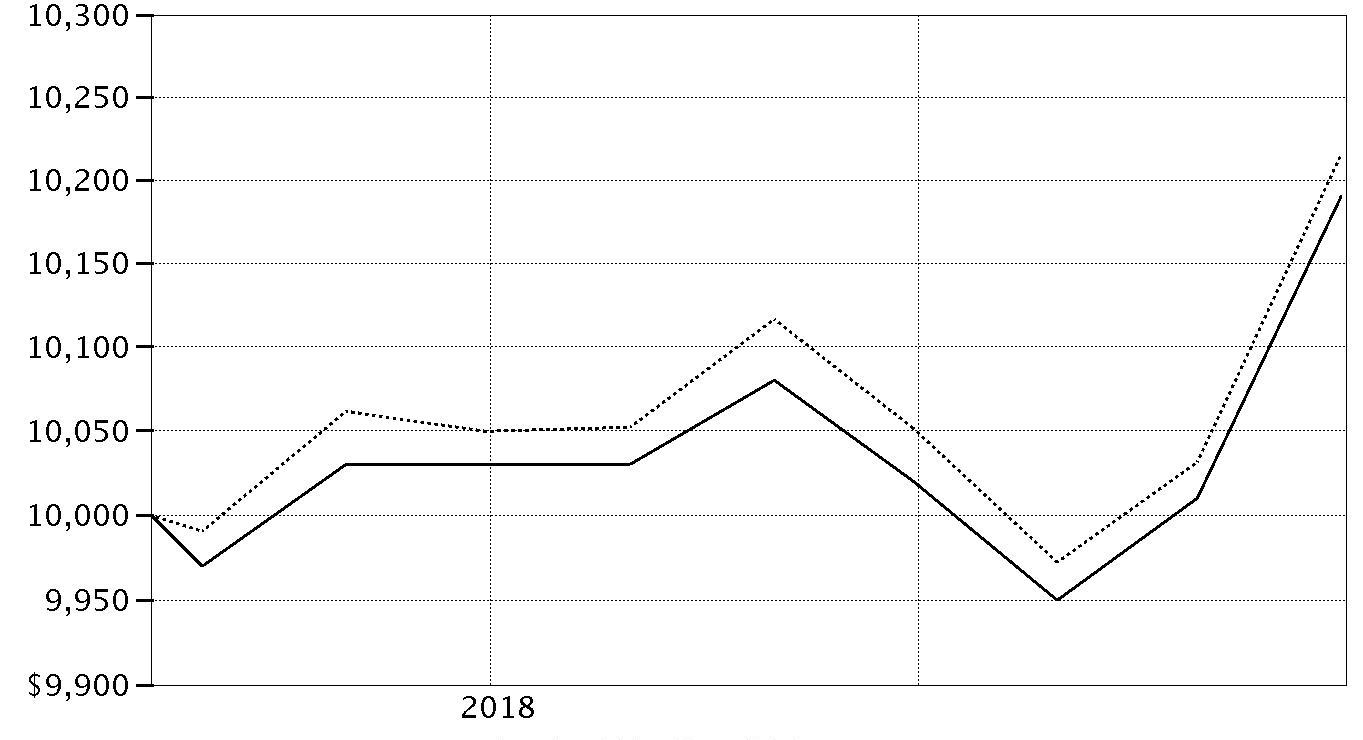
| Period Ending Values |
| $10,190 | VIP Bond Index Portfolio - Initial Class |
| $10,216 | Bloomberg Barclays U.S. Aggregate Bond Index |
Management's Discussion of Fund Performance
Market Recap: U.S. taxable investment-grade bonds roughly broke even in 2018, as yields that gained early in the year fell notably in the fourth quarter. The Bloomberg Barclays U.S. Aggregate Bond Index gained 0.01% for the year. Longer-term bond yields advanced through mid-May, driven by policy-rate hikes, plans by the U.S. Federal Reserve to gradually reduce its balance sheet and tax reform that went into effect in January. Longer-term yields moderated in the summer, with spreads between shorter-term and longer-term Treasury bonds remaining tight, partly because of escalating global trade tension. Yields rose again in September and early October, amid increased inflation expectations and hints that central banks may curtail economic stimulus. Yields then declined notably and credit spreads widened in November and December due to broad market volatility, disappointing U.S. economic data, and signs of economic weakness in China and parts of Europe. Within the Bloomberg Barclays index, U.S. Treasuries (+0.86%) topped all major market segments. Conversely, investment-grade corporates (-2.51%) performed worst. Outside the index, most non-core fixed-income segments posted a negative return, while Treasury Inflation-Protected Securities (TIPS) returned -1.26%, as inflation expectations moderated near year-end.
Comments from Co-Portfolio Managers Brandon Bettencourt and Jay Small: From inception on April 19, 2018, through December 31, 2018, the fund’s share classes gained just shy of 2%, lagging, net of fees, the 2.16% return of the Bloomberg Barclays U.S. Aggregate Bond Index. The fund's performance versus the benchmark was slightly curtailed by "pricing basis." The fund is typically priced at 4:00 p.m. Eastern Time, while the benchmark is priced at 3:00 p.m. Eastern. On December 31, 2018, the fund was priced at 4:00 p.m. Eastern, while the benchmark was priced at 1:00 p.m. Eastern due to the holiday-shortened trading hours for the U.S. bond market. This led to a reported performance differential, particularly due to a wide pricing dispersion on the last day of the period. We believe the effects of pricing basis tend to smooth out over time. Our goal is to produce monthly returns, before expenses, that closely match the benchmark return. Given the large number of securities in the index (roughly 10,000) and the significant cost and liquidity challenges associated with full replication of the index, we use “stratified sampling techniques” in constructing the portfolio. This approach involves defining and maintaining an “optimal” subset of constituent securities that, in aggregate, mirrors the chief characteristics of the index – including maturity, duration, sector allocation, credit quality and other factors.
The views expressed above reflect those of the portfolio manager(s) only through the end of the period as stated on the cover of this report and do not necessarily represent the views of Fidelity or any other person in the Fidelity organization. Any such views are subject to change at any time based upon market or other conditions and Fidelity disclaims any responsibility to update such views. These views may not be relied on as investment advice and, because investment decisions for a Fidelity fund are based on numerous factors, may not be relied on as an indication of trading intent on behalf of any Fidelity fund.
Investment Summary (Unaudited)
Quality Diversification (% of fund's net assets)
| As of December 31, 2018 |
| | U.S. Government and U.S. Government Agency Obligations | 74.2% |
| | AAA | 2.4% |
| | AA | 2.2% |
| | A | 8.9% |
| | BBB | 12.5% |
| | BB and Below | 0.1% |
| | Not Rated | 0.3% |
| | Short-Term Investments and Net Other Assets* | (0.6)% |

* Short-Term Investments and Net Other Assets (Liabilities) are not included in the pie chart
We have used ratings from Moody's Investors Service, Inc. Where Moody's® ratings are not available, we have used S&P® ratings. All ratings are as of the date indicated and do not reflect subsequent changes.
Asset Allocation (% of fund's net assets)
| As of December 31, 2018* |
| | Corporate Bonds | 22.7% |
| | U.S. Government and U.S. Government Agency Obligations | 74.2% |
| | Asset-Backed Securities | 0.2% |
| | CMOs and Other Mortgage Related Securities | 0.8% |
| | Municipal Bonds | 0.2% |
| | Other Investments | 2.5% |
| | Short-Term Investments and Net Other Assets (Liabilities)** | (0.6)% |

* Foreign investments - 7.4%
** Short-Term Investments and Net Other Assets (Liabilities) are not included in the pie chart
Percentages in the above tables are adjusted for the effect of TBA Sale Commitments.
Schedule of Investments December 31, 2018
Showing Percentage of Net Assets
| Nonconvertible Bonds - 22.7% | | | |
| | | Principal Amount | Value |
| COMMUNICATION SERVICES - 1.4% | | | |
| Diversified Telecommunication Services - 0.7% | | | |
| AT&T, Inc.: | | | |
| 4.1% 2/15/28 | | $143,000 | $137,559 |
| 4.9% 8/15/37 | | 100,000 | 93,337 |
| 5.25% 3/1/37 | | 95,000 | 93,389 |
| Verizon Communications, Inc.: | | | |
| 4.125% 8/15/46 | | 54,000 | 47,709 |
| 4.329% 9/21/28 | | 63,000 | 63,298 |
| 5.012% 8/21/54 | | 38,000 | 36,771 |
| 5.5% 3/16/47 | | 108,000 | 114,998 |
| | | | 587,061 |
| Entertainment - 0.2% | | | |
| Time Warner, Inc.: | | | |
| 3.8% 2/15/27 | | 43,000 | 40,369 |
| 4.65% 6/1/44 | | 20,000 | 17,525 |
| 4.85% 7/15/45 | | 32,000 | 28,633 |
| Walt Disney Co. 2.95% 6/15/27 | | 98,000 | 94,204 |
| | | | 180,731 |
| Media - 0.4% | | | |
| Charter Communications Operating LLC/Charter Communications Operating Capital Corp.: | | | |
| 4.2% 3/15/28 | | 48,000 | 44,975 |
| 5.375% 4/1/38 | | 42,000 | 39,143 |
| Comcast Corp.: | | | |
| 3.55% 5/1/28 | | 76,000 | 73,404 |
| 3.7% 4/15/24 | | 30,000 | 30,181 |
| 4.6% 8/15/45 | | 72,000 | 70,246 |
| 4.7% 10/15/48 | | 80,000 | 81,399 |
| 4.95% 10/15/58 | | 30,000 | 30,547 |
| Discovery Communications LLC 5.2% 9/20/47 | | 18,000 | 16,642 |
| | | | 386,537 |
| Wireless Telecommunication Services - 0.1% | | | |
| Vodafone Group PLC: | | | |
| 4.375% 5/30/28 | | 97,000 | 94,153 |
| 5.25% 5/30/48 | | 20,000 | 18,801 |
| | | | 112,954 |
|
| TOTAL COMMUNICATION SERVICES | | | 1,267,283 |
|
| CONSUMER DISCRETIONARY - 1.1% | | | |
| Automobiles - 0.2% | | | |
| Ford Motor Co. 5.291% 12/8/46 | | 30,000 | 24,658 |
| General Motors Co. 6.75% 4/1/46 | | 69,000 | 66,869 |
| General Motors Financial Co., Inc. 4.35% 4/9/25 | | 84,000 | 79,594 |
| | | | 171,121 |
| Diversified Consumer Services - 0.1% | | | |
| Ingersoll-Rand Global Holding Co. Ltd. 3.75% 8/21/28 | | 90,000 | 87,620 |
| Hotels, Restaurants & Leisure - 0.2% | | | |
| McDonald's Corp.: | | | |
| 3.8% 4/1/28 | | 84,000 | 82,519 |
| 4.7% 12/9/35 | | 39,000 | 39,211 |
| Starbucks Corp. 4% 11/15/28 | | 100,000 | 98,831 |
| | | | 220,561 |
| Household Durables - 0.1% | | | |
| Newell Brands, Inc. 3.85% 4/1/23 | | 91,000 | 89,661 |
| Internet & Direct Marketing Retail - 0.2% | | | |
| Amazon.com, Inc.: | | | |
| 2.4% 2/22/23 | | 150,000 | 145,218 |
| 4.05% 8/22/47 | | 44,000 | 43,056 |
| | | | 188,274 |
| Multiline Retail - 0.1% | | | |
| Target Corp.: | | | |
| 3.9% 11/15/47 | | 40,000 | 36,725 |
| 4% 7/1/42 | | 15,000 | 14,164 |
| | | | 50,889 |
| Specialty Retail - 0.2% | | | |
| Home Depot, Inc.: | | | |
| 2.8% 9/14/27 | | 84,000 | 78,887 |
| 3.9% 6/15/47 | | 29,000 | 27,400 |
| 4.5% 12/6/48 | | 40,000 | 41,406 |
| Lowe's Companies, Inc. 4.05% 5/3/47 | | 17,000 | 14,648 |
| | | | 162,341 |
|
| TOTAL CONSUMER DISCRETIONARY | | | 970,467 |
|
| CONSUMER STAPLES - 1.6% | | | |
| Beverages - 0.6% | | | |
| Anheuser-Busch InBev Worldwide, Inc.: | | | |
| 3.5% 1/12/24 | | 145,000 | 141,664 |
| 4% 4/13/28 | | 91,000 | 87,097 |
| 4.6% 4/15/48 | | 78,000 | 70,022 |
| Constellation Brands, Inc. 3.6% 2/15/28 | | 63,000 | 58,054 |
| Maple Escrow Subsidiary, Inc. 4.597% 5/25/28 (a) | | 36,000 | 35,750 |
| Molson Coors Brewing Co.: | | | |
| 3% 7/15/26 | | 120,000 | 106,926 |
| 4.2% 7/15/46 | | 32,000 | 26,621 |
| PepsiCo, Inc. 4% 5/2/47 | | 56,000 | 54,826 |
| | | | 580,960 |
| Food & Staples Retailing - 0.2% | | | |
| Walgreens Boots Alliance, Inc. 3.45% 6/1/26 | | 81,000 | 76,166 |
| Walmart, Inc.: | | | |
| 3.625% 12/15/47 | | 20,000 | 18,564 |
| 3.7% 6/26/28 | | 60,000 | 60,911 |
| | | | 155,641 |
| Food Products - 0.5% | | | |
| Campbell Soup Co. 4.15% 3/15/28 | | 80,000 | 74,523 |
| Conagra Brands, Inc. 4.85% 11/1/28 | | 90,000 | 88,557 |
| General Mills, Inc. 4.2% 4/17/28 | | 89,000 | 87,183 |
| H.J. Heinz Co.: | | | |
| 3% 6/1/26 | | 20,000 | 17,851 |
| 4% 6/15/23 | | 134,000 | 133,641 |
| Kellogg Co. 4.5% 4/1/46 | | 32,000 | 29,724 |
| | | | 431,479 |
| Household Products - 0.0% | | | |
| Procter & Gamble Co. 3.5% 10/25/47 | | 43,000 | 40,612 |
| Tobacco - 0.3% | | | |
| Altria Group, Inc.: | | | |
| 2.625% 9/16/26 | | 110,000 | 96,141 |
| 3.875% 9/16/46 | | 38,000 | 28,984 |
| Bat Capital Corp. 4.54% 8/15/47 | | 113,000 | 90,068 |
| Philip Morris International, Inc. 3.125% 3/2/28 | | 94,000 | 87,856 |
| | | | 303,049 |
|
| TOTAL CONSUMER STAPLES | | | 1,511,741 |
|
| ENERGY - 2.3% | | | |
| Energy Equipment & Services - 0.0% | | | |
| Baker Hughes A Ge Co. LLC 4.08% 12/15/47 | | 32,000 | 26,406 |
| Oil, Gas & Consumable Fuels - 2.3% | | | |
| Anadarko Petroleum Corp. 6.6% 3/15/46 | | 21,000 | 23,215 |
| Apache Corp. 4.375% 10/15/28 | | 112,000 | 104,684 |
| Canadian Natural Resources Ltd.: | | | |
| 3.85% 6/1/27 | | 58,000 | 54,743 |
| 4.95% 6/1/47 | | 19,000 | 18,251 |
| ConocoPhillips Co. 5.95% 3/15/46 | | 26,000 | 31,721 |
| Enbridge Energy Partners LP 5.875% 10/15/25 | | 76,000 | 82,376 |
| Enbridge, Inc. 5.5% 12/1/46 | | 60,000 | 64,450 |
| Energy Transfer Partners LP: | | | |
| 4.2% 9/15/23 | | 30,000 | 29,564 |
| 6% 6/15/48 | | 46,000 | 44,849 |
| Enterprise Products Operating LP: | | | |
| 3.95% 2/15/27 | | 85,000 | 84,670 |
| 4.25% 2/15/48 | | 35,000 | 31,067 |
| Equinor ASA 3.625% 9/10/28 | | 120,000 | 119,868 |
| Kinder Morgan, Inc.: | | | |
| 3.15% 1/15/23 | | 119,000 | 115,455 |
| 4.3% 3/1/28 | | 80,000 | 78,540 |
| 5.2% 3/1/48 | | 30,000 | 28,713 |
| Magellan Midstream Partners LP 5% 3/1/26 | | 72,000 | 75,295 |
| Marathon Petroleum Corp. 4.75% 9/15/44 | | 21,000 | 18,537 |
| MPLX LP: | | | |
| 4.5% 7/15/23 | | 82,000 | 82,816 |
| 4.5% 4/15/38 | | 73,000 | 63,824 |
| 4.7% 4/15/48 | | 28,000 | 24,293 |
| Noble Energy, Inc.: | | | |
| 3.85% 1/15/28 | | 30,000 | 27,161 |
| 4.95% 8/15/47 | | 30,000 | 25,989 |
| Occidental Petroleum Corp. 4.2% 3/15/48 | | 16,000 | 15,314 |
| ONEOK, Inc. 4.55% 7/15/28 | | 59,000 | 58,462 |
| Petroleos Mexicanos: | | | |
| 4.25% 1/15/25 | | 280,000 | 244,720 |
| 6.35% 2/12/48 | | 50,000 | 39,826 |
| Phillips 66 Co. 3.9% 3/15/28 | | 94,000 | 90,857 |
| Shell International Finance BV 4.375% 5/11/45 | | 33,000 | 33,965 |
| Spectra Energy Partners LP 3.375% 10/15/26 | | 158,000 | 147,870 |
| Suncor Energy, Inc. 4% 11/15/47 | | 19,000 | 16,983 |
| TransCanada PipeLines Ltd. 4.25% 5/15/28 | | 101,000 | 100,084 |
| Valero Energy Corp. 4.35% 6/1/28 | | 20,000 | 19,825 |
| Williams Partners LP: | | | |
| 3.75% 6/15/27 | | 35,000 | 33,184 |
| 4.85% 3/1/48 | | 83,000 | 75,568 |
| | | | 2,106,739 |
|
| TOTAL ENERGY | | | 2,133,145 |
|
| FINANCIALS - 8.0% | | | |
| Banks - 4.8% | | | |
| Bank of America Corp.: | | | |
| 3.5% 4/19/26 | | 122,000 | 117,502 |
| 3.55% 3/5/24 (b) | | 113,000 | 111,627 |
| 3.946% 1/23/49 (b) | | 23,000 | 20,516 |
| 3.97% 3/5/29 (b) | | 125,000 | 121,577 |
| 4.271% 7/23/29 (b) | | 80,000 | 79,673 |
| Barclays Bank PLC 2.65% 1/11/21 | | 200,000 | 195,819 |
| Barclays PLC 3.2% 8/10/21 | | 400,000 | 388,738 |
| Citigroup, Inc.: | | | |
| 3 month U.S. LIBOR + 1.023% 4.044% 6/1/24 (b)(c) | | 134,000 | 134,513 |
| 3 month U.S. LIBOR + 1.151% 3.52% 10/27/28 (b)(c) | | 95,000 | 88,648 |
| 3.142% 1/24/23 (b) | | 100,000 | 98,221 |
| 4.65% 7/23/48 | | 28,000 | 27,403 |
| Citizens Financial Group, Inc. 4.3% 12/3/25 | | 78,000 | 77,013 |
| Credit Suisse Group Funding Guernsey Ltd. 2.75% 3/26/20 | | 250,000 | 247,271 |
| HSBC Holdings PLC: | | | |
| 2.95% 5/25/21 | | 200,000 | 197,180 |
| 4.292% 9/12/26 (b) | | 200,000 | 197,507 |
| Japan Bank International Cooperation 3.125% 7/20/21 | | 200,000 | 201,563 |
| JPMorgan Chase & Co.: | | | |
| 2.7% 5/18/23 | | 111,000 | 106,612 |
| 2.95% 10/1/26 | | 224,000 | 206,981 |
| 4.005% 4/23/29 (b) | | 43,000 | 42,290 |
| 4.203% 7/23/29 (b) | | 30,000 | 29,927 |
| 4.95% 6/1/45 | | 65,000 | 66,005 |
| Lloyds Bank PLC 3.3% 5/7/21 | | 200,000 | 199,386 |
| Mitsubishi UFJ Financial Group, Inc. 3.777% 3/2/25 | | 84,000 | 83,963 |
| Oesterreichische Kontrollbank 2.875% 9/7/21 | | 50,000 | 50,260 |
| Rabobank Nederland New York Branch 3.125% 4/26/21 | | 250,000 | 249,076 |
| Royal Bank of Canada 4.65% 1/27/26 | | 55,000 | 56,644 |
| Royal Bank of Scotland Group PLC 3.875% 9/12/23 | | 220,000 | 210,898 |
| Santander Holdings U.S.A., Inc. 4.5% 7/17/25 | | 82,000 | 81,224 |
| Sumitomo Mitsui Financial Group, Inc.: | | | |
| 2.934% 3/9/21 | | 189,000 | 187,004 |
| 3.936% 10/16/23 | | 80,000 | 81,401 |
| The Toronto-Dominion Bank 3.5% 7/19/23 | | 100,000 | 100,682 |
| Wells Fargo & Co.: | | | |
| 2.625% 7/22/22 | | 75,000 | 72,316 |
| 3.584% 5/22/28 (b) | | 82,000 | 78,770 |
| 4.75% 12/7/46 | | 77,000 | 74,239 |
| Westpac Banking Corp. 3.65% 5/15/23 | | 130,000 | 130,774 |
| | | | 4,413,223 |
| Capital Markets - 1.1% | | | |
| Bank New York Mellon Corp. 3.85% 4/28/28 | | 27,000 | 27,243 |
| BlackRock, Inc. 3.375% 6/1/22 | | 37,000 | 37,274 |
| Brighthouse Financial, Inc. 4.7% 6/22/47 | | 28,000 | 20,872 |
| Deutsche Bank AG New York Branch 3.95% 2/27/23 | | 200,000 | 188,819 |
| Goldman Sachs Group, Inc.: | | | |
| 3.2% 2/23/23 | | 200,000 | 193,982 |
| 3.85% 1/26/27 | | 55,000 | 51,763 |
| 4.223% 5/1/29 (b) | | 60,000 | 57,778 |
| 4.75% 10/21/45 | | 28,000 | 26,732 |
| IntercontinentalExchange, Inc.: | | | |
| 2.35% 9/15/22 | | 34,000 | 32,871 |
| 3.75% 9/21/28 | | 50,000 | 49,839 |
| Morgan Stanley: | | | |
| 3 month U.S. LIBOR + 1.431% 4.457% 4/22/39 (b)(c) | | 90,000 | 87,235 |
| 3.125% 1/23/23 | | 210,000 | 204,996 |
| 4.375% 1/22/47 | | 38,000 | 36,015 |
| | | | 1,015,419 |
| Consumer Finance - 0.6% | | | |
| AerCap Ireland Capital Ltd./AerCap Global Aviation Trust 4.125% 7/3/23 | | 150,000 | 145,841 |
| American Express Credit Corp. 3.3% 5/3/27 | | 30,000 | 29,193 |
| Capital One Financial Corp.: | | | |
| 3.2% 1/30/23 | | 176,000 | 171,260 |
| 3.8% 1/31/28 | | 91,000 | 84,148 |
| Toyota Motor Credit Corp. 2.25% 10/18/23 | | 113,000 | 107,034 |
| | | | 537,476 |
| Diversified Financial Services - 1.1% | | | |
| Berkshire Hathaway, Inc. 4.5% 2/11/43 | | 33,000 | 34,333 |
| BP Capital Markets America, Inc.: | | | |
| 2.52% 9/19/22 | | 128,000 | 123,777 |
| 3.216% 11/28/23 | | 94,000 | 92,637 |
| Broadcom Corp./Broadcom Cayman LP 3.125% 1/15/25 | | 82,000 | 74,058 |
| Cigna Corp.: | | | |
| 4.125% 11/15/25 (a) | | 25,000 | 24,976 |
| 4.375% 10/15/28 (a) | | 30,000 | 30,186 |
| 4.8% 8/15/38 (a) | | 30,000 | 29,748 |
| 4.9% 12/15/48 (a) | | 30,000 | 29,392 |
| Export Development Canada 2.75% 3/15/23 | | 145,000 | 145,261 |
| KfW: | | | |
| 2.375% 12/29/22 | | 396,000 | 391,999 |
| 2.875% 4/3/28 | | 14,000 | 14,055 |
| | | | 990,422 |
| Insurance - 0.4% | | | |
| ACE INA Holdings, Inc. 2.3% 11/3/20 | | 210,000 | 206,998 |
| American International Group, Inc.: | | | |
| 4.5% 7/16/44 | | 25,000 | 22,323 |
| 4.75% 4/1/48 | | 50,000 | 45,817 |
| Marsh & McLennan Companies, Inc. 4.2% 3/1/48 | | 40,000 | 36,382 |
| MetLife, Inc. 4.05% 3/1/45 | | 18,000 | 16,685 |
| Prudential Financial, Inc.: | | | |
| 3.878% 3/27/28 | | 35,000 | 35,194 |
| 3.935% 12/7/49 | | 38,000 | 34,022 |
| The Travelers Companies, Inc. 4% 5/30/47 | | 32,000 | 30,761 |
| | | | 428,182 |
|
| TOTAL FINANCIALS | | | 7,384,722 |
|
| HEALTH CARE - 2.3% | | | |
| Biotechnology - 0.3% | | | |
| AbbVie, Inc.: | | | |
| 4.3% 5/14/36 | | 40,000 | 35,724 |
| 4.875% 11/14/48 | | 30,000 | 28,027 |
| Amgen, Inc.: | | | |
| 3.2% 11/2/27 | | 56,000 | 52,638 |
| 4.4% 5/1/45 | | 32,000 | 30,005 |
| Celgene Corp.: | | | |
| 3.9% 2/20/28 | | 45,000 | 42,234 |
| 4.55% 2/20/48 | | 53,000 | 45,991 |
| Gilead Sciences, Inc. 4% 9/1/36 | | 40,000 | 36,504 |
| | | | 271,123 |
| Health Care Equipment & Supplies - 0.1% | | | |
| Abbott Laboratories 4.9% 11/30/46 | | 20,000 | 21,023 |
| Becton, Dickinson & Co. 4.669% 6/6/47 | | 20,000 | 18,837 |
| Boston Scientific Corp. 4% 3/1/28 | | 50,000 | 48,560 |
| Medtronic, Inc. 4.625% 3/15/45 | | 28,000 | 29,396 |
| | | | 117,816 |
| Health Care Providers & Services - 0.9% | | | |
| Aetna, Inc. 2.8% 6/15/23 | | 110,000 | 104,604 |
| Anthem, Inc. 3.35% 12/1/24 | | 89,000 | 86,696 |
| Cardinal Health, Inc. 3.41% 6/15/27 | | 67,000 | 60,908 |
| Cigna Corp. 3.75% 7/15/23 (a) | | 30,000 | 29,898 |
| CVS Health Corp.: | | | |
| 4.3% 3/25/28 | | 94,000 | 92,044 |
| 5.05% 3/25/48 | | 131,000 | 127,581 |
| Express Scripts Holding Co.: | | | |
| 4.5% 2/25/26 | | 74,000 | 75,036 |
| 4.8% 7/15/46 | | 46,000 | 44,157 |
| Kaiser Foundation Hospitals 4.15% 5/1/47 | | 30,000 | 29,673 |
| UnitedHealth Group, Inc.: | | | |
| 3.5% 6/15/23 | | 182,000 | 183,558 |
| 3.75% 10/15/47 | | 30,000 | 27,496 |
| | | | 861,651 |
| Life Sciences Tools & Services - 0.1% | | | |
| Thermo Fisher Scientific, Inc. 3.2% 8/15/27 | | 82,000 | 76,252 |
| Pharmaceuticals - 0.9% | | | |
| Actavis Funding SCS 3.8% 3/15/25 | | 61,000 | 59,575 |
| AstraZeneca PLC 4.375% 11/16/45 | | 45,000 | 42,639 |
| Johnson & Johnson 3.4% 1/15/38 | | 36,000 | 33,550 |
| Merck & Co., Inc. 3.7% 2/10/45 | | 45,000 | 43,282 |
| Mylan NV 4.55% 4/15/28 (a) | | 20,000 | 18,651 |
| Novartis Capital Corp. 4% 11/20/45 | | 35,000 | 35,139 |
| Pfizer, Inc.: | | | |
| 3.2% 9/15/23 | | 200,000 | 200,776 |
| 4% 12/15/36 | | 36,000 | 35,888 |
| Shire Acquisitions Investments Ireland DAC 3.2% 9/23/26 | | 110,000 | 99,594 |
| Zoetis, Inc. 3.45% 11/13/20 | | 206,000 | 206,530 |
| | | | 775,624 |
|
| TOTAL HEALTH CARE | | | 2,102,466 |
|
| INDUSTRIALS - 1.7% | | | |
| Aerospace & Defense - 0.5% | | | |
| General Dynamics Corp. 3.375% 5/15/23 | | 81,000 | 81,556 |
| Lockheed Martin Corp. 4.7% 5/15/46 | | 28,000 | 29,245 |
| Northrop Grumman Corp.: | | | |
| 3.25% 1/15/28 | | 80,000 | 74,798 |
| 4.03% 10/15/47 | | 56,000 | 51,006 |
| United Technologies Corp.: | | | |
| 3.65% 8/16/23 | | 120,000 | 119,522 |
| 4.05% 5/4/47 | | 18,000 | 15,996 |
| 4.125% 11/16/28 | | 70,000 | 69,508 |
| | | | 441,631 |
| Air Freight & Logistics - 0.1% | | | |
| FedEx Corp. 4.05% 2/15/48 | | 35,000 | 29,359 |
| United Parcel Service, Inc. 2.8% 11/15/24 | | 88,000 | 84,383 |
| | | | 113,742 |
| Commercial Services & Supplies - 0.0% | | | |
| Republic Services, Inc. 3.95% 5/15/28 | | 28,000 | 28,035 |
| Electrical Equipment - 0.2% | | | |
| Eaton Corp. 2.75% 11/2/22 | | 133,000 | 129,348 |
| Industrial Conglomerates - 0.2% | | | |
| General Electric Co. 4.5% 3/11/44 | | 105,000 | 85,740 |
| Honeywell International, Inc. 3.812% 11/21/47 | | 20,000 | 19,015 |
| Roper Technologies, Inc. 2.8% 12/15/21 | | 108,000 | 105,800 |
| | | | 210,555 |
| Machinery - 0.3% | | | |
| Caterpillar Financial Services Corp. 3.45% 5/15/23 | | 182,000 | 183,013 |
| John Deere Capital Corp. 2.8% 3/6/23 | | 64,000 | 62,570 |
| | | | 245,583 |
| Professional Services - 0.1% | | | |
| Thomson Reuters Corp. 3.35% 5/15/26 | | 76,000 | 70,552 |
| Road & Rail - 0.2% | | | |
| Burlington Northern Santa Fe LLC 4.05% 6/15/48 | | 57,000 | 55,014 |
| CSX Corp. 4.75% 11/15/48 | | 70,000 | 71,003 |
| Norfolk Southern Corp. 4.15% 2/28/48 | | 38,000 | 35,509 |
| Union Pacific Corp. 3.6% 9/15/37 | | 38,000 | 34,001 |
| | | | 195,527 |
| Trading Companies & Distributors - 0.1% | | | |
| Air Lease Corp.: | | | |
| 3.25% 3/1/25 | | 88,000 | 81,042 |
| 3.875% 7/3/23 | | 26,000 | 25,588 |
| | | | 106,630 |
|
| TOTAL INDUSTRIALS | | | 1,541,603 |
|
| INFORMATION TECHNOLOGY - 1.3% | | | |
| Communications Equipment - 0.1% | | | |
| Cisco Systems, Inc. 2.2% 9/20/23 | | 130,000 | 124,483 |
| Electronic Equipment & Components - 0.2% | | | |
| Corning, Inc. 5.35% 11/15/48 | | 10,000 | 10,158 |
| Diamond 1 Finance Corp./Diamond 2 Finance Corp.: | | | |
| 5.45% 6/15/23 (a) | | 110,000 | 111,934 |
| 8.35% 7/15/46 (a) | | 74,000 | 80,206 |
| | | | 202,298 |
| IT Services - 0.2% | | | |
| IBM Corp. 2.5% 1/27/22 | | 104,000 | 101,252 |
| Visa, Inc. 4.15% 12/14/35 | | 38,000 | 39,342 |
| | | | 140,594 |
| Semiconductors & Semiconductor Equipment - 0.1% | | | |
| Applied Materials, Inc. 4.35% 4/1/47 | | 28,000 | 27,483 |
| Intel Corp. 3.734% 12/8/47 | | 30,000 | 27,767 |
| | | | 55,250 |
| Software - 0.4% | | | |
| Microsoft Corp.: | | | |
| 3.3% 2/6/27 | | 115,000 | 113,971 |
| 4.1% 2/6/37 | | 63,000 | 64,770 |
| 4.25% 2/6/47 | | 34,000 | 35,744 |
| Oracle Corp.: | | | |
| 3.25% 11/15/27 | | 96,000 | 92,646 |
| 3.8% 11/15/37 | | 50,000 | 46,813 |
| 4% 11/15/47 | | 57,000 | 53,120 |
| | | | 407,064 |
| Technology Hardware, Storage & Peripherals - 0.3% | | | |
| Apple, Inc.: | | | |
| 2.4% 5/3/23 | | 156,000 | 150,832 |
| 3% 11/13/27 | | 96,000 | 91,285 |
| 3.75% 11/13/47 | | 57,000 | 52,736 |
| | | | 294,853 |
|
| TOTAL INFORMATION TECHNOLOGY | | | 1,224,542 |
|
| MATERIALS - 0.7% | | | |
| Chemicals - 0.5% | | | |
| DowDuPont, Inc.: | | | |
| 4.205% 11/15/23 | | 30,000 | 30,675 |
| 4.725% 11/15/28 | | 35,000 | 36,299 |
| Eastman Chemical Co. 4.5% 12/1/28 | | 74,000 | 73,483 |
| LYB International Finance II BV 3.5% 3/2/27 | | 166,000 | 151,196 |
| Sherwin-Williams Co. 4.5% 6/1/47 | | 50,000 | 45,149 |
| The Dow Chemical Co. 3.5% 10/1/24 | | 64,000 | 61,751 |
| The Mosaic Co. 4.05% 11/15/27 | | 90,000 | 85,408 |
| | | | 483,961 |
| Containers & Packaging - 0.1% | | | |
| International Paper Co. 3% 2/15/27 | | 51,000 | 46,450 |
| Metals & Mining - 0.1% | | | |
| BHP Billiton Financial (U.S.A.) Ltd. 5% 9/30/43 | | 36,000 | 39,227 |
| Southern Copper Corp. 5.875% 4/23/45 | | 30,000 | 30,686 |
| Vale Overseas Ltd. 6.25% 8/10/26 | | 50,000 | 54,000 |
| | | | 123,913 |
|
| TOTAL MATERIALS | | | 654,324 |
|
| REAL ESTATE - 0.5% | | | |
| Equity Real Estate Investment Trusts (REITs) - 0.3% | | | |
| American Tower Corp. 3.6% 1/15/28 | | 32,000 | 29,916 |
| AvalonBay Communities, Inc. 3.2% 1/15/28 | | 63,000 | 59,787 |
| ERP Operating LP 3.5% 3/1/28 | | 61,000 | 59,343 |
| Simon Property Group LP 3.375% 12/1/27 | | 36,000 | 34,472 |
| Ventas Realty LP 4.4% 1/15/29 | | 40,000 | 39,825 |
| Welltower, Inc. 4.95% 9/1/48 | | 76,000 | 75,348 |
| | | | 298,691 |
| Real Estate Management & Development - 0.2% | | | |
| Ventas Realty LP/Ventas Capital Corp. 3.25% 8/15/22 | | 161,000 | 159,089 |
|
| TOTAL REAL ESTATE | | | 457,780 |
|
| UTILITIES - 1.8% | | | |
| Electric Utilities - 1.1% | | | |
| Appalachian Power Co. 4.45% 6/1/45 | | 18,000 | 17,567 |
| Commonwealth Edison Co. 4% 3/1/48 | | 42,000 | 40,570 |
| Duke Energy Carolinas LLC: | | | |
| 3.05% 3/15/23 | | 150,000 | 148,679 |
| 3.95% 3/15/48 | | 31,000 | 29,720 |
| Duke Energy Corp. 3.15% 8/15/27 | | 84,000 | 78,588 |
| Entergy Corp. 4% 7/15/22 | | 130,000 | 131,135 |
| Eversource Energy 3.3% 1/15/28 | | 62,000 | 58,839 |
| FirstEnergy Corp. 4.85% 7/15/47 | | 40,000 | 40,078 |
| Florida Power & Light Co. 4.125% 6/1/48 | | 26,000 | 26,105 |
| MidAmerican Energy Co. 3.65% 8/1/48 | | 30,000 | 27,656 |
| PPL Capital Funding, Inc. 4% 9/15/47 | | 20,000 | 17,849 |
| Public Service Co. of Colorado 3.7% 6/15/28 | | 87,000 | 88,115 |
| Public Service Electric & Gas Co. 3.6% 12/1/47 | | 44,000 | 40,186 |
| Puget Sound Energy, Inc. 4.223% 6/15/48 | | 45,000 | 45,069 |
| Southern Co. 3.25% 7/1/26 | | 112,000 | 104,970 |
| Tampa Electric Co. 4.45% 6/15/49 | | 50,000 | 48,815 |
| Virginia Electric & Power Co. 3.8% 9/15/47 | | 50,000 | 46,040 |
| | | | 989,981 |
| Multi-Utilities - 0.7% | | | |
| Berkshire Hathaway Energy Co. 4.45% 1/15/49 (a) | | 54,000 | 53,482 |
| CenterPoint Energy, Inc. 2.5% 9/1/22 | | 44,000 | 42,080 |
| Consolidated Edison Co. of New York, Inc. 4.65% 12/1/48 | | 50,000 | 51,994 |
| Consolidated Edison, Inc. 2% 5/15/21 | | 176,000 | 170,739 |
| Dominion Resources, Inc. 4.7% 12/1/44 | | 26,000 | 25,940 |
| DTE Energy Co. 3.7% 8/1/23 | | 46,000 | 45,675 |
| NiSource Finance Corp.: | | | |
| 2.65% 11/17/22 | | 74,000 | 70,842 |
| 3.49% 5/15/27 | | 50,000 | 47,739 |
| 3.95% 3/30/48 | | 46,000 | 40,964 |
| Sempra Energy 3.8% 2/1/38 | | 86,000 | 73,913 |
| | | | 623,368 |
|
| TOTAL UTILITIES | | | 1,613,349 |
|
| TOTAL NONCONVERTIBLE BONDS | | | |
| (Cost $21,199,406) | | | 20,861,422 |
|
| U.S. Government and Government Agency Obligations - 45.2% | | | |
| U.S. Government Agency Obligations - 1.8% | | | |
| Fannie Mae: | | | |
| 2.125% 4/24/26 | | $170,000 | $162,010 |
| 2.375% 1/19/23 | | 200,000 | 198,492 |
| Federal Home Loan Bank: | | | |
| 1.875% 11/29/21 | | 285,000 | 279,842 |
| 3% 10/12/21 | | 100,000 | 101,271 |
| Freddie Mac: | | | |
| 1.875% 11/17/20 | | 157,000 | 155,014 |
| 2.75% 6/19/23 | | 700,000 | 704,373 |
| Tennessee Valley Authority 4.25% 9/15/65 | | 30,000 | 34,198 |
|
| TOTAL U.S. GOVERNMENT AGENCY OBLIGATIONS | | | 1,635,200 |
|
| U.S. Treasury Obligations - 43.4% | | | |
| U.S. Treasury Bonds: | | | |
| 2.5% 2/15/45 | | 216,000 | 196,118 |
| 2.5% 2/15/46 | | 106,000 | 95,877 |
| 2.75% 8/15/42 | | 155,000 | 148,639 |
| 2.75% 11/15/42 | | 494,000 | 473,173 |
| 2.75% 11/15/47 | | 107,000 | 101,426 |
| 2.875% 8/15/45 | | 68,000 | 66,352 |
| 3% 11/15/44 | | 227,000 | 227,065 |
| 3% 5/15/45 | | 140,000 | 139,985 |
| 3% 11/15/45 | | 103,000 | 102,973 |
| 3% 2/15/47 | | 49,000 | 48,949 |
| 3% 5/15/47 | | 28,000 | 27,929 |
| 3% 2/15/48 | | 20,000 | 19,928 |
| 3% 8/15/48 | | 142,000 | 141,573 |
| 3.125% 11/15/41 | | 44,000 | 45,126 |
| 3.125% 2/15/42 | | 65,000 | 66,652 |
| 3.125% 2/15/43 | | 45,000 | 45,982 |
| 3.125% 8/15/44 | | 93,000 | 95,107 |
| 3.125% 5/15/48 | | 16,000 | 16,332 |
| 3.375% 5/15/44 | | 175,000 | 186,718 |
| 3.375% 11/15/48 | | 82,000 | 87,836 |
| 3.5% 2/15/39 | | 150,000 | 164,292 |
| 3.625% 8/15/43 | | 415,000 | 460,161 |
| 3.625% 2/15/44 | | 1,329,000 | 1,474,734 |
| 3.75% 8/15/41 | | 410,000 | 463,275 |
| 3.75% 11/15/43 | | 1,485,000 | 1,680,063 |
| 3.875% 8/15/40 | | 52,000 | 59,803 |
| 4.375% 2/15/38 | | 84,000 | 103,017 |
| 4.375% 11/15/39 | | 67,000 | 82,258 |
| 4.5% 2/15/36 | | 56,000 | 69,083 |
| 4.5% 5/15/38 | | 92,000 | 114,652 |
| 4.5% 8/15/39 | | 31,000 | 38,684 |
| 4.75% 2/15/41 | | 177,000 | 229,067 |
| 5.5% 8/15/28 | | 4,000 | 4,945 |
| 7.125% 2/15/23 | | 175,000 | 206,336 |
| 7.25% 8/15/22 | | 637,000 | 740,918 |
| 8.125% 8/15/19 | | 825,000 | 852,038 |
| 8.75% 8/15/20 | | 445,000 | 488,179 |
| U.S. Treasury Notes: | | | |
| 1% 10/15/19 | | 333,000 | 328,798 |
| 1.125% 2/28/21 | | 202,000 | 196,130 |
| 1.25% 3/31/21 | | 52,000 | 50,609 |
| 1.375% 9/30/19 | | 288,000 | 285,334 |
| 1.375% 4/30/20 | | 24,000 | 23,629 |
| 1.375% 9/30/20 | | 10,000 | 9,802 |
| 1.375% 10/31/20 | | 380,000 | 372,220 |
| 1.375% 4/30/21 | | 301,000 | 293,518 |
| 1.5% 10/31/19 | | 34,000 | 33,682 |
| 1.5% 8/15/26 | | 291,000 | 268,626 |
| 1.625% 10/15/20 | | 830,000 | 816,939 |
| 1.625% 8/31/22 | | 562,000 | 545,148 |
| 1.625% 2/15/26 | | 261,000 | 244,453 |
| 1.625% 5/15/26 | | 1,298,000 | 1,212,835 |
| 1.75% 11/15/20 | | 311,000 | 306,597 |
| 1.75% 2/28/22 | | 539,000 | 527,237 |
| 1.75% 6/30/22 | | 336,000 | 327,862 |
| 1.875% 12/15/20 | | 237,000 | 234,129 |
| 1.875% 5/31/22 | | 115,000 | 112,735 |
| 1.875% 7/31/22 | | 970,000 | 949,887 |
| 1.875% 9/30/22 | | 358,000 | 350,219 |
| 2% 1/15/21 | | 216,000 | 213,779 |
| 2% 2/28/21 | | 453,000 | 448,205 |
| 2% 12/31/21 | | 176,000 | 173,587 |
| 2% 10/31/22 | | 48,000 | 47,150 |
| 2% 5/31/24 | | 26,000 | 25,297 |
| 2% 2/15/25 | | 367,000 | 355,055 |
| 2% 8/15/25 | | 50,000 | 48,220 |
| 2% 11/15/26 | | 908,000 | 867,372 |
| 2.125% 6/30/22 | | 682,000 | 673,901 |
| 2.125% 12/31/22 | | 19,000 | 18,733 |
| 2.125% 5/15/25 | | 46,000 | 44,775 |
| 2.25% 2/29/20 | | 677,000 | 674,262 |
| 2.25% 3/31/20 | | 676,000 | 673,204 |
| 2.25% 10/31/24 | | 279,000 | 274,366 |
| 2.25% 12/31/24 | | 160,000 | 157,217 |
| 2.25% 2/15/27 | | 630,000 | 612,196 |
| 2.25% 8/15/27 | | 122,000 | 118,158 |
| 2.25% 11/15/27 | | 14,000 | 13,534 |
| 2.375% 4/30/20 | | 954,000 | 951,420 |
| 2.375% 3/15/21 | | 379,000 | 377,921 |
| 2.375% 4/15/21 | | 1,199,000 | 1,195,788 |
| 2.375% 1/31/23 | | 57,000 | 56,739 |
| 2.375% 5/15/27 | | 46,000 | 45,071 |
| 2.5% 5/31/20 | | 431,000 | 430,585 |
| 2.5% 6/30/20 | | 312,000 | 311,731 |
| 2.5% 8/15/23 | | 57,000 | 56,981 |
| 2.5% 1/31/25 | | 238,000 | 237,103 |
| 2.625% 7/31/20 | | 194,000 | 194,216 |
| 2.625% 8/31/20 | | 356,000 | 356,430 |
| 2.625% 5/15/21 | | 775,000 | 777,352 |
| 2.625% 6/15/21 | | 503,000 | 504,593 |
| 2.625% 7/15/21 | | 71,000 | 71,242 |
| 2.625% 2/28/23 | | 492,000 | 494,514 |
| 2.625% 6/30/23 | | 882,000 | 886,577 |
| 2.75% 11/30/20 | | 1,034,000 | 1,038,490 |
| 2.75% 8/15/21 | | 295,000 | 296,957 |
| 2.75% 9/15/21 | | 2,000 | 2,014 |
| 2.75% 4/30/23 | | 1,289,000 | 1,302,259 |
| 2.75% 5/31/23 | | 18,000 | 18,196 |
| 2.75% 7/31/23 | | 288,000 | 291,066 |
| 2.75% 8/31/23 | | 726,000 | 734,119 |
| 2.75% 6/30/25 | | 255,000 | 257,644 |
| 2.75% 2/15/28 | | 289,000 | 290,706 |
| 2.875% 10/31/20 | | 712,000 | 716,333 |
| 2.875% 10/15/21 | | 575,000 | 581,014 |
| 2.875% 11/15/21 | | 380,000 | 384,205 |
| 2.875% 10/31/23 | | 1,547,000 | 1,572,666 |
| 2.875% 11/30/23 | | 440,000 | 447,639 |
| 2.875% 11/30/25 | | 371,000 | 377,825 |
| 2.875% 5/15/28 | | 7,000 | 7,113 |
| 2.875% 8/15/28 | | 15,000 | 15,243 |
| 3% 9/30/25 | | 237,000 | 243,177 |
| 3% 10/31/25 | | 212,000 | 217,582 |
| 3.125% 11/15/28 | | 282,000 | 292,703 |
| 3.375% 11/15/19 | | 629,000 | 632,784 |
| 3.625% 2/15/20 | | 795,000 | 803,620 |
|
| TOTAL U.S. TREASURY OBLIGATIONS | | | 39,966,263 |
|
| TOTAL U.S. GOVERNMENT AND GOVERNMENT AGENCY OBLIGATIONS | | | |
| (Cost $41,171,486) | | | 41,601,463 |
|
| U.S. Government Agency - Mortgage Securities - 28.6% | | | |
| Fannie Mae - 16.0% | | | |
| 2.5% 7/1/31 to 4/1/47 | | 1,347,293 | 1,312,117 |
| 2.5% 1/1/34 (d) | | 100,000 | 97,731 |
| 2.5% 1/1/49 (d) | | 100,000 | 94,656 |
| 3% 4/1/32 to 2/1/48 | | 3,398,033 | 3,343,900 |
| 3% 1/1/34 (d) | | 100,000 | 99,817 |
| 3% 1/1/49 (d) | | 200,000 | 195,142 |
| 3% 1/1/49 (d) | | 200,000 | 195,142 |
| 3.5% 9/1/32 to 1/1/49 | | 3,376,458 | 3,397,225 |
| 3.5% 1/1/49 (d) | | 300,000 | 299,885 |
| 3.5% 1/1/49 (d) | | 200,000 | 199,924 |
| 4% 11/1/43 to 10/1/48 | | 2,433,499 | 2,490,807 |
| 4% 1/1/49 (d) | | 200,000 | 203,868 |
| 4% 1/1/49 (d) | | 200,000 | 203,868 |
| 4.5% 7/1/47 to 7/1/48 | | 1,163,673 | 1,206,103 |
| 4.5% 1/1/49 (d) | | 100,000 | 103,521 |
| 4.5% 1/1/49 (d) | | 200,000 | 207,041 |
| 5% 11/1/25 to 5/1/29 | | 186,033 | 195,090 |
| 5% 1/1/49 (d) | | 200,000 | 209,443 |
| 5% 1/1/49 (d) | | 100,000 | 104,722 |
| 5.5% 7/1/23 to 12/1/48 | | 543,012 | 576,301 |
|
| TOTAL FANNIE MAE | | | 14,736,303 |
|
| Freddie Mac - 4.2% | | | |
| 3% 10/1/43 to 1/1/48 | | 836,931 | 819,397 |
| 3% 8/1/47 | | 118,465 | 115,615 |
| 3.5% 2/1/48 to 3/1/48 | | 1,374,751 | 1,374,602 |
| 4% 6/1/46 to 10/1/48 | | 1,086,786 | 1,109,651 |
| 4% 1/1/49 (d) | | 200,000 | 203,829 |
| 4.5% 9/1/48 | | 100,000 | 103,556 |
| 5% 4/1/48 | | 90,054 | 94,352 |
|
| TOTAL FREDDIE MAC | | | 3,821,002 |
|
| Ginnie Mae - 8.4% | | | |
| 2.5% 1/1/49 (d) | | 100,000 | 95,658 |
| 3% 11/20/47 to 8/20/48 | | 1,657,901 | 1,633,806 |
| 3% 1/1/49 (d) | | 100,000 | 98,488 |
| 3% 2/1/49 (d) | | 100,000 | 98,441 |
| 3.5% 6/20/47 to 12/20/48 | | 2,534,248 | 2,553,537 |
| 3.5% 1/1/49 (d) | | 100,000 | 100,685 |
| 3.5% 1/1/49 (d) | | 100,000 | 100,685 |
| 4% 11/20/47 to 11/20/48 | | 1,350,513 | 1,384,339 |
| 4% 1/1/49 (d) | | 50,000 | 51,201 |
| 4% 1/1/49 (d) | | 50,000 | 51,201 |
| 4% 1/1/49 (d) | | 100,000 | 102,403 |
| 4% 1/1/49 (d) | | 100,000 | 102,403 |
| 4.5% 1/20/47 to 8/20/48 | | 485,096 | 502,411 |
| 4.5% 1/1/49 (d) | | 100,000 | 103,426 |
| 4.5% 1/1/49 (d) | | 100,000 | 103,426 |
| 4.5% 1/1/49 (d) | | 100,000 | 103,426 |
| 4.5% 2/1/49 (d) | | 100,000 | 103,332 |
| 4.5% 2/1/49 (d) | | 100,000 | 103,332 |
| 5% 11/20/47 to 3/20/48 | | 169,650 | 177,246 |
| 5% 1/1/49 (d) | | 100,000 | 104,017 |
| 5.5% 9/20/47 | | 91,975 | 98,565 |
|
| TOTAL GINNIE MAE | | | 7,772,028 |
|
| TOTAL U.S. GOVERNMENT AGENCY - MORTGAGE SECURITIES | | | |
| (Cost $26,076,412) | | | 26,329,333 |
|
| Asset-Backed Securities - 0.2% | | | |
| CarMax Auto Owner Trust Series 2018-3 Class A3, 3.13% 6/15/23 | | $30,000 | $30,115 |
| Citibank Credit Card Issuance Trust Series 2018-A6 Class A6, 3.21% 12/7/24 | | 100,000 | 101,023 |
| Ford Credit Floorplan Master Owner Trust Series 2018-4 Class A, 4.06% 11/15/30 | | 30,000 | 29,982 |
| TOTAL ASSET-BACKED SECURITIES | | | |
| (Cost $159,962) | | | 161,120 |
|
| Commercial Mortgage Securities - 1.2% | | | |
| Citigroup Commercial Mortgage Trust sequential payer: | | | |
| Series 2015-GC29 Class A4, 3.192% 4/10/48 | | 80,000 | 78,574 |
| Series 2016-C1 Class A4, 3.209% 5/10/49 | | 90,000 | 88,366 |
| COMM Mortgage Trust sequential payer Series 2013-CR13 Class A3, 3.928% 11/10/46 | | 50,000 | 51,403 |
| Freddie Mac: | | | |
| sequential payer: | | | |
| Series K057 Class A2, 2.57% 7/25/26 | | 159,400 | 152,991 |
| Series K080 Class A2, 3.926% 7/25/28 | | 80,000 | 83,605 |
| Series K068 Class A2, 3.244% 8/25/27 | | 130,000 | 129,447 |
| Series K079 Class A2, 3.926% 6/25/28 | | 20,000 | 20,898 |
| GS Mortgage Securities Trust sequential payer Series 2014-GC26 Class A4, 3.364% 11/10/47 | | 110,000 | 110,211 |
| JPMBB Commercial Mortgage Securities Trust: | | | |
| sequential payer Series 2014-C21 Class A5, 3.7748% 8/15/47 | | 150,000 | 152,318 |
| Series 2014-C24 Class A5, 3.6385% 11/15/47 | | 150,000 | 151,268 |
| Wells Fargo Commercial Mortgage Trust Series 2018-C48 Class A5, 4.302% 1/15/52 | | 123,000 | 128,118 |
| TOTAL COMMERCIAL MORTGAGE SECURITIES | | | |
| (Cost $1,138,668) | | | 1,147,199 |
|
| Municipal Securities - 0.2% | | | |
| American Muni. Pwr., Inc. Rev. (Combined Hydroelectric Proj.) Series 2010 B, 7.834% 2/15/41 | | 55,000 | 80,602 |
| California Gen. Oblig. Series 2009, 7.55% 4/1/39 | | 25,000 | 35,814 |
| New York Metropolitan Trans. Auth. Rev. Series 2010 A, 6.668% 11/15/39 | | 60,000 | 78,142 |
| TOTAL MUNICIPAL SECURITIES | | | |
| (Cost $190,085) | | | 194,558 |
|
| Foreign Government and Government Agency Obligations - 1.4% | | | |
| Alberta Province 3.3% 3/15/28 | | $75,000 | $75,704 |
| Canadian Government 2% 11/15/22 | | 120,000 | 117,246 |
| Colombian Republic 11.75% 2/25/20 | | 260,000 | 284,960 |
| Ontario Province 2.5% 4/27/26 | | 115,000 | 110,889 |
| Philippine Republic 3% 2/1/28 | | 200,000 | 189,238 |
| Polish Government 3.25% 4/6/26 | | 73,000 | 71,468 |
| Province of Quebec: | | | |
| 2.375% 1/31/22 | | 25,000 | 24,694 |
| 2.75% 4/12/27 | | 95,000 | 92,432 |
| United Mexican States: | | | |
| 3.75% 1/11/28 | | 200,000 | 187,202 |
| 4% 10/2/23 | | 160,000 | 159,254 |
| TOTAL FOREIGN GOVERNMENT AND GOVERNMENT AGENCY OBLIGATIONS | | | |
| (Cost $1,300,741) | | | 1,313,087 |
|
| Supranational Obligations - 0.8% | | | |
| Asian Development Bank 2.75% 3/17/23 | | 200,000 | 200,639 |
| European Investment Bank 2.875% 8/15/23 | | 260,000 | 261,921 |
| Inter-American Development Bank 4.375% 1/24/44 | | 39,000 | 46,164 |
| International Bank for Reconstruction & Development: | | | |
| 1.75% 4/19/23 | | 55,000 | 53,059 |
| 2.5% 11/22/27 | | 92,000 | 89,669 |
| International Finance Corp. 2.875% 7/31/23 | | 112,000 | 112,914 |
| TOTAL SUPRANATIONAL OBLIGATIONS | | | |
| (Cost $756,218) | | | 764,366 |
|
| Bank Notes - 0.3% | | | |
| PNC Bank NA 2.15% 4/29/21 | | | |
| (Cost $244,010) | | 250,000 | 243,563 |
| | | Shares | Value |
|
| Money Market Funds - 2.6% | | | |
| Fidelity Cash Central Fund, 2.42% (e) | | | |
| (Cost $2,374,455) | | 2,374,010 | 2,374,485 |
| TOTAL INVESTMENT IN SECURITIES - 103.2% | | | |
| (Cost $94,611,443) | | | 94,990,596 |
| NET OTHER ASSETS (LIABILITIES) - (3.2)% | | | (2,951,441) |
| NET ASSETS - 100% | | | $92,039,155 |
| TBA Sale Commitments | | |
| | Principal Amount | Value |
| Fannie Mae | | |
| 4% 1/1/49 | $(200,000) | $(203,868) |
| Ginnie Mae | | |
| 3% 1/1/49 | (100,000) | (98,488) |
| 4.5% 1/1/49 | (100,000) | (103,426) |
| 4.5% 1/1/49 | (100,000) | (103,426) |
|
| TOTAL GINNIE MAE | | (305,340) |
|
| TOTAL TBA SALE COMMITMENTS | | |
| (Proceeds $506,180) | | $(509,208) |
Legend
(a) Security exempt from registration under Rule 144A of the Securities Act of 1933. These securities may be resold in transactions exempt from registration, normally to qualified institutional buyers. At the end of the period, the value of these securities amounted to $444,223 or 0.5% of net assets.
(b) Coupon rates for floating and adjustable rate securities reflect the rates in effect at period end.
(c) Coupon is indexed to a floating interest rate which may be multiplied by a specified factor and/or subject to caps or floors.
(d) Security or a portion of the security purchased on a delayed delivery or when-issued basis.
(e) Affiliated fund that is generally available only to investment companies and other accounts managed by Fidelity Investments. The rate quoted is the annualized seven-day yield of the fund at period end. A complete unaudited listing of the fund's holdings as of its most recent quarter end is available upon request. In addition, each Fidelity Central Fund's financial statements, which are not covered by the Fund's Report of Independent Registered Public Accounting Firm, are available on the SEC's website or upon request.
Affiliated Central Funds
Information regarding fiscal year to date income earned by the Fund from investments in Fidelity Central Funds is as follows:
| Fund | Income earned |
| Fidelity Cash Central Fund | $49,927 |
| Total | $49,927 |
Amounts in the income column in the above table include any capital gain distributions from underlying funds, which are presented in the corresponding line-item in the Statement of Operations if applicable.
Investment Valuation
The following is a summary of the inputs used, as of December 31, 2018, involving the Fund's assets and liabilities carried at fair value. The inputs or methodology used for valuing securities may not be an indication of the risk associated with investing in those securities. For more information on valuation inputs, and their aggregation into the levels used below, please refer to the Investment Valuation section in the accompanying Notes to Financial Statements.
| | Valuation Inputs at Reporting Date: |
| Description | Total | Level 1 | Level 2 | Level 3 |
| Investments in Securities: | | | | |
| Corporate Bonds | $20,861,422 | $-- | $20,861,422 | $-- |
| U.S. Government and Government Agency Obligations | 41,601,463 | -- | 41,601,463 | -- |
| U.S. Government Agency - Mortgage Securities | 26,329,333 | -- | 26,329,333 | -- |
| Asset-Backed Securities | 161,120 | -- | 161,120 | -- |
| Commercial Mortgage Securities | 1,147,199 | -- | 1,147,199 | -- |
| Municipal Securities | 194,558 | -- | 194,558 | -- |
| Foreign Government and Government Agency Obligations | 1,313,087 | -- | 1,313,087 | -- |
| Supranational Obligations | 764,366 | -- | 764,366 | -- |
| Bank Notes | 243,563 | -- | 243,563 | -- |
| Money Market Funds | 2,374,485 | 2,374,485 | -- | -- |
| Total Investments in Securities: | $94,990,596 | $2,374,485 | $92,616,111 | $-- |
| Other Financial Instruments: | | | | |
| TBA Sale Commitments | $(509,208) | $-- | $(509,208) | $-- |
| Total Other Financial Instruments: | $(509,208) | $-- | $(509,208) | $-- |
See accompanying notes which are an integral part of the financial statements.
Financial Statements
Statement of Assets and Liabilities
| | | December 31, 2018 |
| Assets | | |
Investment in securities, at value — See accompanying schedule:
Unaffiliated issuers (cost $92,236,988) | $92,616,111 | |
| Fidelity Central Funds (cost $2,374,455) | 2,374,485 | |
| Total Investment in Securities (cost $94,611,443) | | $94,990,596 |
| Cash | | 52,359 |
| Receivable for investments sold | | 227,898 |
| Receivable for TBA sale commitments | | 506,180 |
| Receivable for fund shares sold | | 58,700 |
| Interest receivable | | 599,115 |
| Distributions receivable from Fidelity Central Funds | | 4,531 |
| Total assets | | 96,439,379 |
| Liabilities | | |
| Payable for investments purchased | | |
| Regular delivery | $52,489 | |
| Delayed delivery | 3,828,209 | |
| TBA sale commitments, at value | 509,208 | |
| Accrued management fee | 6,499 | |
| Distribution and service plan fees payable | 209 | |
| Other affiliated payables | 3,610 | |
| Total liabilities | | 4,400,224 |
| Net Assets | | $92,039,155 |
| Net Assets consist of: | | |
| Paid in capital | | $91,706,675 |
| Total distributable earnings (loss) | | 332,480 |
| Net Assets | | $92,039,155 |
| Net Asset Value and Maximum Offering Price | | |
| Initial Class: | | |
| Net Asset Value, offering price and redemption price per share ($91,033,030 ÷ 9,048,688 shares) | | $10.06 |
| Service Class 2: | | |
| Net Asset Value, offering price and redemption price per share ($1,006,125 ÷ 100,000 shares) | | $10.06 |
See accompanying notes which are an integral part of the financial statements.
Statement of Operations
| | | For the period
April 19, 2018 (commencement of operations) to
December 31, 2018 |
| Investment Income | | |
| Interest | | $1,222,402 |
| Income from Fidelity Central Funds | | 49,927 |
| Total income | | 1,272,329 |
| Expenses | | |
| Management fee | $36,128 | |
| Transfer agent fees | 20,071 | |
| Distribution and service plan fees | 1,746 | |
| Independent trustees' fees and expenses | 157 | |
| Total expenses before reductions | 58,102 | |
| Expense reductions | (1,850) | |
| Total expenses after reductions | | 56,252 |
| Net investment income (loss) | | 1,216,077 |
| Realized and Unrealized Gain (Loss) | | |
| Net realized gain (loss) on: | | |
| Investment securities: | | |
| Unaffiliated issuers | (141,290) | |
| Fidelity Central Funds | (286) | |
| Total net realized gain (loss) | | (141,576) |
| Change in net unrealized appreciation (depreciation) on: | | |
| Investment securities: | | |
| Unaffiliated issuers | 379,123 | |
| Fidelity Central Funds | 30 | |
| Delayed delivery commitments | (3,028) | |
| Total change in net unrealized appreciation (depreciation) | | 376,125 |
| Net gain (loss) | | 234,549 |
| Net increase (decrease) in net assets resulting from operations | | $1,450,626 |
See accompanying notes which are an integral part of the financial statements.
Statement of Changes in Net Assets
| | For the period
April 19, 2018 (commencement of operations) to
December 31, 2018 |
| Increase (Decrease) in Net Assets | |
| Operations | |
| Net investment income (loss) | $1,216,077 |
| Net realized gain (loss) | (141,576) |
| Change in net unrealized appreciation (depreciation) | 376,125 |
| Net increase (decrease) in net assets resulting from operations | 1,450,626 |
| Distributions to shareholders | (1,131,546) |
| Total distributions | (1,131,546) |
| Share transactions - net increase (decrease) | 91,720,075 |
| Total increase (decrease) in net assets | 92,039,155 |
| Net Assets | |
| Beginning of period | – |
| End of period | $92,039,155 |
See accompanying notes which are an integral part of the financial statements.
Financial Highlights
VIP Bond Index Portfolio Initial Class
| Years ended December 31, | 2018 A |
| Selected Per–Share Data | |
| Net asset value, beginning of period | $10.00 |
| Income from Investment Operations | |
| Net investment income (loss)B | .212 |
| Net realized and unrealized gain (loss) | (.022)C |
| Total from investment operations | .190 |
| Distributions from net investment income | (.130) |
| Net asset value, end of period | $10.06 |
| Total ReturnD,E,F | 1.90% |
| Ratios to Average Net AssetsG,H | |
| Expenses before reductions | .14%I |
| Expenses net of fee waivers, if any | .14%I |
| Expenses net of all reductions | .13%I |
| Net investment income (loss) | 3.01%I |
| Supplemental Data | |
| Net assets, end of period (000 omitted) | $91,033 |
| Portfolio turnover rateJ | 168%I |
A For the period April 19, 2018 (commencement of operations) to December 31, 2018.
B Calculated based on average shares outstanding during the period.
C The amount shown for a share outstanding does not correspond with the aggregate net gain (loss) on investments for the period due to the timing of sales and repurchases of shares in relation to fluctuating market values of the investments of the Fund.
D Total returns for periods of less than one year are not annualized.
E Total returns do not reflect charges attributable to your insurance company's separate account. Inclusion of these charges would reduce the total returns shown.
F Total returns would have been lower if certain expenses had not been reduced during the applicable periods shown.
G Fees and expenses of any underlying Fidelity Central Funds are not included in the Fund's expense ratio. The Fund indirectly bears its proportionate share of the expenses of any underlying Fidelity Central Funds.
H Expense ratios reflect operating expenses of the class. Expenses before reductions do not reflect amounts reimbursed by the investment adviser or reductions from expense offset arrangements and do not represent the amount paid by the class during periods when reimbursements or reductions occur. Expense ratios before reductions for start-up periods may not be representative of longer-term operating periods. Expenses net of fee waivers reflect expenses after reimbursement by the investment adviser but prior to reductions from expense offset arrangements. Expenses net of all reductions represent the net expenses paid by the class.
I Annualized
J Amount does not include the portfolio activity of any underlying Fidelity Central Funds.
See accompanying notes which are an integral part of the financial statements.
VIP Bond Index Portfolio Service Class 2
| Years ended December 31, | 2018 A |
| Selected Per–Share Data | |
| Net asset value, beginning of period | $10.00 |
| Income from Investment Operations | |
| Net investment income (loss)B | .195 |
| Net realized and unrealized gain (loss) | (.023)C |
| Total from investment operations | .172 |
| Distributions from net investment income | (.112) |
| Net asset value, end of period | $10.06 |
| Total ReturnD,E,F | 1.72% |
| Ratios to Average Net AssetsG,H | |
| Expenses before reductions | .39%I |
| Expenses net of fee waivers, if any | .39%I |
| Expenses net of all reductions | .38%I |
| Net investment income (loss) | 2.76%I |
| Supplemental Data | |
| Net assets, end of period (000 omitted) | $1,006 |
| Portfolio turnover rateJ | 168%I |
A For the period April 19, 2018 (commencement of operations) to December 31, 2018.
B Calculated based on average shares outstanding during the period.
C The amount shown for a share outstanding does not correspond with the aggregate net gain (loss) on investments for the period due to the timing of sales and repurchases of shares in relation to fluctuating market values of the investments of the Fund.
D Total returns for periods of less than one year are not annualized.
E Total returns do not reflect charges attributable to your insurance company's separate account. Inclusion of these charges would reduce the total returns shown.
F Total returns would have been lower if certain expenses had not been reduced during the applicable periods shown.
G Fees and expenses of any underlying Fidelity Central Funds are not included in the Fund's expense ratio. The Fund indirectly bears its proportionate share of the expenses of any underlying Fidelity Central Funds.
H Expense ratios reflect operating expenses of the class. Expenses before reductions do not reflect amounts reimbursed by the investment adviser or reductions from expense offset arrangements and do not represent the amount paid by the class during periods when reimbursements or reductions occur. Expense ratios before reductions for start-up periods may not be representative of longer-term operating periods. Expenses net of fee waivers reflect expenses after reimbursement by the investment adviser but prior to reductions from expense offset arrangements. Expenses net of all reductions represent the net expenses paid by the class.
I Annualized
J Amount does not include the portfolio activity of any underlying Fidelity Central Funds.
See accompanying notes which are an integral part of the financial statements.
Notes to Financial Statements
For the period ended December 31, 2018
1. Organization.
VIP Bond Index Portfolio (the Fund) is a fund of Variable Insurance Products Fund V (the Trust) and is authorized to issue an unlimited number of shares. The Trust is registered under the Investment Company Act of 1940, as amended (the 1940 Act), as an open-end management investment company organized as a Massachusetts business trust. Shares of the Fund may only be purchased by insurance companies for the purpose of funding variable annuity or variable life insurance contracts. The Fund offers the following classes of shares: Initial Class shares and Service Class 2 shares. All classes have equal rights and voting privileges, except for matters affecting a single class.
2. Investments in Fidelity Central Funds.
The Fund invests in Fidelity Central Funds, which are open-end investment companies generally available only to other investment companies and accounts managed by the investment adviser and its affiliates. The Fund's Schedule of Investments lists each of the Fidelity Central Funds held as of period end, if any, as an investment of the Fund, but does not include the underlying holdings of each Fidelity Central Fund. As an Investing Fund, the Fund indirectly bears its proportionate share of the expenses of the underlying Fidelity Central Funds.
The Money Market Central Funds seek preservation of capital and current income and are managed by Fidelity Investments Money Management, Inc. (FIMM), an affiliate of the investment adviser. Annualized expenses of the Money Market Central Funds as of their most recent shareholder report date are less than .005%.
A complete unaudited list of holdings for each Fidelity Central Fund is available upon request or at the Securities and Exchange Commission (the SEC) website at www.sec.gov. In addition, the financial statements of the Fidelity Central Funds, which are not covered by the Fund's Report of Independent Registered Public Accounting Firm, are available on the SEC website or upon request.
3. Significant Accounting Policies.
The Fund is an investment company and applies the accounting and reporting guidance of the Financial Accounting Standards Board (FASB) Accounting Standards Codification Topic 946 Financial Services – Investments Companies. The financial statements have been prepared in conformity with accounting principles generally accepted in the United States of America (GAAP), which require management to make certain estimates and assumptions at the date of the financial statements. Actual results could differ from those estimates. Subsequent events, if any, through the date that the financial statements were issued have been evaluated in the preparation of the financial statements. The following summarizes the significant accounting policies of the Fund:
Investment Valuation. Investments are valued as of 4:00 p.m. Eastern time on the last calendar day of the period. The Board of Trustees (the Board) has delegated the day to day responsibility for the valuation of the Fund's investments to the Fair Value Committee (the Committee) established by the Fund's investment adviser. In accordance with valuation policies and procedures approved by the Board, the Fund attempts to obtain prices from one or more third party pricing vendors or brokers to value its investments. When current market prices, quotations or currency exchange rates are not readily available or reliable, investments will be fair valued in good faith by the Committee, in accordance with procedures adopted by the Board. Factors used in determining fair value vary by investment type and may include market or investment specific events, changes in interest rates and credit quality. The frequency with which these procedures are used cannot be predicted and they may be utilized to a significant extent. The Committee oversees the Fund's valuation policies and procedures and reports to the Board on the Committee's activities and fair value determinations. The Board monitors the appropriateness of the procedures used in valuing the Fund's investments and ratifies the fair value determinations of the Committee.
The Fund categorizes the inputs to valuation techniques used to value its investments into a disclosure hierarchy consisting of three levels as shown below:
- Level 1 – quoted prices in active markets for identical investments
- Level 2 – other significant observable inputs (including quoted prices for similar investments, interest rates, prepayment speeds, etc.)
- Level 3 – unobservable inputs (including the Fund's own assumptions based on the best information available)
Valuation techniques used to value the Fund's investments by major category are as follows:
Debt securities, including restricted securities, are valued based on evaluated prices received from third party pricing vendors or from brokers who make markets in such securities. Corporate bonds, bank notes, foreign government and government agency obligations, municipal securities, supranational obligations and U.S. government and government agency obligations are valued by pricing vendors who utilize matrix pricing which considers yield or price of bonds of comparable quality, coupon, maturity and type or by broker-supplied prices. Asset backed securities, commercial mortgage securities and U.S. government agency mortgage securities are valued by pricing vendors who utilize matrix pricing which considers prepayment speed assumptions, attributes of the collateral, yield or price of bonds of comparable quality, coupon, maturity and type or by broker-supplied prices. When independent prices are unavailable or unreliable, debt securities may be valued utilizing pricing methodologies which consider similar factors that would be used by third party pricing vendors. Debt securities are generally categorized as Level 2 in the hierarchy but may be Level 3 depending on the circumstances.
Investments in open-end mutual funds, including the Fidelity Central Funds, are valued at their closing net asset value (NAV) each business day and are categorized as Level 1 in the hierarchy.
Changes in valuation techniques may result in transfers in or out of an assigned level within the disclosure hierarchy. The aggregate value of investments by input level as of December 31, 2018 is included at the end of the Fund's Schedule of Investments.
Investment Transactions and Income. For financial reporting purposes, the Fund's investment holdings and NAV include trades executed through the end of the last business day of the period. The NAV per share for processing shareholder transactions is calculated as of the close of business of the New York Stock Exchange (NYSE), normally 4:00 p.m. Eastern time and includes trades executed through the end of the prior business day. Gains and losses on securities sold are determined on the basis of identified cost. Income and capital gain distributions from Fidelity Central Funds, if any, are recorded on the ex-dividend date. Interest income is accrued as earned and includes coupon interest and amortization of premium and accretion of discount on debt securities as applicable. Debt obligations may be placed on non-accrual status and related interest income may be reduced by ceasing current accruals and writing off interest receivables when the collection of all or a portion of interest has become doubtful based on consistently applied procedures. A debt obligation is removed from non-accrual status when the issuer resumes interest payments or when collectability of interest is reasonably assured.
Class Allocations and Expenses. Investment income, realized and unrealized capital gains and losses, common expenses of the Fund, and certain fund-level expense reductions, if any, are allocated daily on a pro-rata basis to each class based on the relative net assets of each class to the total net assets of the Fund. Each class differs with respect to transfer agent and distribution and service plan fees incurred. Certain expense reductions may also differ by class. For the reporting period, the allocated portion of income and expenses to each class as a percent of its average net assets may vary due to the timing of recording these transactions in relation to fluctuating net assets of the classes. Expenses directly attributable to a fund are charged to that fund. Expenses attributable to more than one fund are allocated among the respective funds on the basis of relative net assets or other appropriate methods. Expense estimates are accrued in the period to which they relate and adjustments are made when actual amounts are known.
Income Tax Information and Distributions to Shareholders. Each year, the Fund intends to qualify as a regulated investment company under Subchapter M of the Internal Revenue Code, including distributing substantially all of its taxable income and realized gains. As a result, no provision for U.S. Federal income taxes is required. As of December 31, 2018, the Fund did not have any unrecognized tax benefits in the financial statements; nor is the Fund aware of any tax positions for which it is reasonably possible that the total amounts of unrecognized tax benefits will significantly change in the next twelve months. The Fund files a U.S. federal tax return, in addition to state and local tax returns as required. The Fund's federal income tax returns are subject to examination by the Internal Revenue Service (IRS) for a period of three fiscal years after they are filed. State and local tax returns may be subject to examination for an additional fiscal year depending on the jurisdiction.
Distributions are declared and recorded on the ex-dividend date. Income and capital gain distributions are declared separately for each class. Income and capital gain distributions are determined in accordance with income tax regulations, which may differ from GAAP.
Capital accounts within the financial statements are adjusted for permanent book-tax differences. These adjustments have no impact on net assets or the results of operations. Capital accounts are not adjusted for temporary book-tax differences which will reverse in a subsequent period.
Book-tax differences are primarily due to market discount, capital loss carryforwards and losses deferred due to wash sales.
As of period end, the cost and unrealized appreciation (depreciation) in securities, and derivatives if applicable, for federal income tax purposes were as follows:
| Gross unrealized appreciation | $849,986 |
| Gross unrealized depreciation | (394,726) |
| Net unrealized appreciation (depreciation) | $455,260 |
| Tax Cost | $94,532,308 |
The tax-based components of distributable earnings as of period end were as follows:
| Capital loss carryforward | $(122,780) |
| Net unrealized appreciation (depreciation) on securities and other investments | $455,260 |
Capital loss carryforwards are only available to offset future capital gains of the Fund to the extent provided by regulations and may be limited. Under the Regulated Investment Company Modernization Act of 2010 (the Act), the Fund is permitted to carry forward capital losses incurred in taxable years beginning after December 22, 2010 for an unlimited period and such capital losses are required to be used prior to any losses that expire. The capital loss carryforward information presented below, including any applicable limitation, is estimated as of fiscal period end and is subject to adjustment.
| No expiration | |
| Short-term | $(122,780) |
| Long-term | - |
| Total no expiration | $(122,780) |
| Total capital loss carryforward | $(122,780) |
The tax character of distributions paid was as follows:
| | December 31, 2018(a) |
| Ordinary Income | $1,131,546 |
| Long-term Capital Gains | - |
| Total | $1,131,546 |
(a) For the period April 19, 2018 (commencement of operations) to December 31, 2018.
Delayed Delivery Transactions and When-Issued Securities. During the period, the Fund transacted in securities on a delayed delivery or when-issued basis. Payment and delivery may take place after the customary settlement period for that security. The price of the underlying securities and the date when the securities will be delivered and paid for are fixed at the time the transaction is negotiated. The securities purchased on a delayed delivery or when-issued basis are identified as such in the Fund's Schedule of Investments. The Fund may receive compensation for interest forgone in the purchase of a delayed delivery or when-issued security. With respect to purchase commitments, the Fund identifies securities as segregated in its records with a value at least equal to the amount of the commitment. Losses may arise due to changes in the value of the underlying securities or if the counterparty does not perform under the contract's terms, or if the issuer does not issue the securities due to political, economic, or other factors.
To-Be-Announced (TBA) Securities and Mortgage Dollar Rolls. During the period, the Fund transacted in TBA securities that involved buying or selling mortgage-backed securities (MBS) on a forward commitment basis. A TBA transaction typically does not designate the actual security to be delivered and only includes an approximate principal amount; however delivered securities must meet specified terms defined by industry guidelines, including issuer, rate and current principal amount outstanding on underlying mortgage pools. The Fund may enter into a TBA transaction with the intent to take possession of or deliver the underlying MBS, or the Fund may elect to extend the settlement by entering into either a mortgage or reverse mortgage dollar roll. Mortgage dollar rolls are transactions where a fund sells TBA securities and simultaneously agrees to repurchase MBS on a later date at a lower price and with the same counterparty. Reverse mortgage dollar rolls involve the purchase and simultaneous agreement to sell TBA securities on a later date at a lower price. Transactions in mortgage dollar rolls and reverse mortgage dollar rolls are accounted for as purchases and sales and may result in an increase to the Fund's portfolio turnover rate.
Purchases and sales of TBA securities involve risks similar to those discussed above for delayed delivery and when-issued securities. Also, if the counterparty in a mortgage dollar roll or a reverse mortgage dollar roll transaction files for bankruptcy or becomes insolvent, the Fund's right to repurchase or sell securities may be limited. Additionally, when a fund sells TBA securities without already owning or having the right to obtain the deliverable securities (an uncovered forward commitment to sell), it incurs a risk of loss because it could have to purchase the securities at a price that is higher than the price at which it sold them. A fund may be unable to purchase the deliverable securities if the corresponding market is illiquid.
TBA securities subject to a forward commitment to sell at period end are included at the end of the Fund's Schedule of Investments under the caption "TBA Sale Commitments." The proceeds and value of these commitments are reflected in the Fund's Statement of Assets and Liabilities as Receivable for TBA sale commitments and TBA sale commitments, at value, respectively.
Restricted Securities. The Fund may invest in securities that are subject to legal or contractual restrictions on resale. These securities generally may be resold in transactions exempt from registration or to the public if the securities are registered. Disposal of these securities may involve time-consuming negotiations and expense, and prompt sale at an acceptable price may be difficult. Information regarding restricted securities is included at the end of the Fund's Schedule of Investments.
4. Purchases and Sales of Investments.
Purchases and sales of securities, other than short-term securities and U.S. government securities, aggregated $24,929,731 and $337,667, respectively.
5. Fees and Other Transactions with Affiliates.
Management Fee and Expense Contract. Fidelity Management & Research Company (the investment adviser) and its affiliates provide the Fund with investment management related services for which the Fund pays a monthly management fee. The management fee is based on an annual rate of .09% of the Fund's average net assets. Under the management contract, the investment adviser pays all other fund-level expenses, except the compensation of the independent Trustees and certain other expenses such as interest expense, including commitment fees.
In addition, under the expense contract, the investment adviser pays class-level expenses as necessary so that the total expenses do not exceed certain amounts of each class' average net assets on an annual basis with certain exceptions, as noted in the following table:
| Initial Class | .14% |
| Service Class 2 | .39% |
Distribution and Service Plan Fees. In accordance with Rule 12b-1 of the 1940 Act, the Fund has adopted separate 12b-1 Plans for each Service Class of shares. Each Service Class pays Fidelity Distributors Corporation (FDC), an affiliate of the investment adviser, a service fee. For the period, the service fee is based on an annual rate of.25% of Service Class 2's average net assets.
For the period, total fees, all of which were re-allowed to insurance companies for the distribution of shares and providing shareholder support services, were as follows:
Transfer Agent Fees. Fidelity Investments Institutional Operations Company, Inc. (FIIOC), an affiliate of the investment adviser, is the transfer, dividend disbursing, and shareholder servicing agent for each class. FIIOC receives asset-based fees of .07% of each class's average net assets for transfer agent services, typesetting, and printing and mailing of shareholder reports, excluding mailing of proxy statements. Under the expense contract, each class pays a portion of the transfer agent fees equal to an annual rate of .05% of class-level average net assets. For the period, transfer agent fees for each class were as follows:
| Initial Class | $ 19,722 |
| Service Class 2 | 349 |
| | $ 20,071 |
Interfund Trades. The Fund may purchase from or sell securities to other Fidelity Funds under procedures adopted by the Board. The procedures have been designed to ensure these interfund trades are executed in accordance with Rule 17a-7 of the 1940 Act. Interfund trades are included within the respective purchases and sales amounts shown in the Purchases and Sales of Investments note.
6. Expense Reductions.
Through arrangements with the Fund's custodian, credits realized as a result of certain uninvested cash balances were used to reduce the Fund's expenses. During the period, these credits reduced the Fund's expenses by $1,850.
7. Distributions to Shareholders.
Distributions to shareholders of each class were as follows:
| | Year ended
December 31, 2018(a) |
| Distributions to shareholders | |
| Initial Class | $1,120,346 |
| Service Class 2 | 11,200 |
| Total | $1,131,546 |
(a) For the period April 19, 2018 (commencement of operations) to December 31, 2018.
8. Share Transactions.
Transactions for each class of shares were as follows:
| | Shares | Dollars |
| | Year ended December 31, 2018(a) | Year ended December 31, 2018(a) |
| Initial Class | | |
| Shares sold | 9,085,681 | $91,081,846 |
| Reinvestment of distributions | 80,513 | 808,346 |
| Shares redeemed | (117,506) | (1,170,117) |
| Net increase (decrease) | 9,048,688 | $90,720,075 |
| Service Class 2 | | |
| Shares sold | 100,000 | $1,000,000 |
| Net increase (decrease) | 100,000 | $1,000,000 |
(a) For the period April 19, 2018 (commencement of operations) to December 31, 2018.
9. Other.
The Fund's organizational documents provide former and current trustees and officers with a limited indemnification against liabilities arising in connection with the performance of their duties to the Fund. In the normal course of business, the Fund may also enter into contracts that provide general indemnifications. The Fund's maximum exposure under these arrangements is unknown as this would be dependent on future claims that may be made against the Fund. The risk of material loss from such claims is considered remote.
At the end of the period, the investment adviser or its affiliates were the owners of record of approximately 99% of the total outstanding shares of the Fund.
Report of Independent Registered Public Accounting Firm
To the Trustees of Variable Insurance Products Fund V and Shareholders of VIP Bond Index Portfolio:
Opinion on the Financial Statements and Financial Highlights
We have audited the accompanying statement of assets and liabilities of VIP Bond Index Portfolio (the "Fund"), a fund of Variable Insurance Products Fund V, including the schedule of investments, as of December 31, 2018, and the related statement of operations, the statement of changes in net assets and the financial highlights for the period from April 19, 2018 (commencement of operations) to December 31, 2018, and the related notes. In our opinion, the financial statements and financial highlights present fairly, in all material respects, the financial position of the Fund as of December 31, 2018, and the results of its operations, the changes in its net assets and the financial highlights for the period from April 19, 2018 (commencement of operations) to December 31, 2018, in conformity with accounting principles generally accepted in the United States of America.
Basis for Opinion
These financial statements and financial highlights are the responsibility of the Fund's management. Our responsibility is to express an opinion on the Fund's financial statements and financial highlights based on our audit. We are a public accounting firm registered with the Public Company Accounting Oversight Board (United States) (PCAOB) and are required to be independent with respect to the Fund in accordance with the U.S. federal securities laws and the applicable rules and regulations of the Securities and Exchange Commission and the PCAOB.
We conducted our audit in accordance with the standards of the PCAOB. Those standards require that we plan and perform the audit to obtain reasonable assurance about whether the financial statements and financial highlights are free of material misstatement, whether due to error or fraud. The Fund is not required to have, nor were we engaged to perform, an audit of its internal control over financial reporting. As part of our audit we are required to obtain an understanding of internal control over financial reporting but not for the purpose of expressing an opinion on the effectiveness of the Fund’s internal control over financial reporting. Accordingly, we express no such opinion.
Our audit included performing procedures to assess the risks of material misstatement of the financial statements and financial highlights, whether due to error or fraud, and performing procedures that respond to those risks. Such procedures included examining, on a test basis, evidence regarding the amounts and disclosures in the financial statements and financial highlights. Our audit also included evaluating the accounting principles used and significant estimates made by management, as well as evaluating the overall presentation of the financial statements and financial highlights. Our procedures included confirmation of securities owned as of December 31, 2018, by correspondence with the custodians and brokers; when replies were not received from brokers, we performed other auditing procedures. We believe that our audit provides a reasonable basis for our opinion.
/s/ Deloitte & Touche LLP
Boston, Massachusetts
February 14, 2019
We have served as the auditor of one or more of the Fidelity investment companies since 1999.
Trustees and Officers
The Trustees, Members of the Advisory Board (if any), and officers of the trust and fund, as applicable, are listed below. The Board of Trustees governs the fund and is responsible for protecting the interests of shareholders. The Trustees are experienced executives who meet periodically throughout the year to oversee the fund's activities, review contractual arrangements with companies that provide services to the fund, oversee management of the risks associated with such activities and contractual arrangements, and review the fund's performance. Each of the Trustees oversees 260 funds.
The Trustees hold office without limit in time except that (a) any Trustee may resign; (b) any Trustee may be removed by written instrument, signed by at least two-thirds of the number of Trustees prior to such removal; (c) any Trustee who requests to be retired or who has become incapacitated by illness or injury may be retired by written instrument signed by a majority of the other Trustees; and (d) any Trustee may be removed at any special meeting of shareholders by a two-thirds vote of the outstanding voting securities of the trust. Each Trustee who is not an interested person (as defined in the 1940 Act) of the trust and the fund is referred to herein as an Independent Trustee. Each Independent Trustee shall retire not later than the last day of the calendar year in which his or her 75th birthday occurs. The Independent Trustees may waive this mandatory retirement age policy with respect to individual Trustees. Officers and Advisory Board Members hold office without limit in time, except that any officer or Advisory Board Member may resign or may be removed by a vote of a majority of the Trustees at any regular meeting or any special meeting of the Trustees. Except as indicated, each individual has held the office shown or other offices in the same company for the past five years.
The fund’s Statement of Additional Information (SAI) includes more information about the Trustees. To request a free copy, call Fidelity at 1-877-208-0098.
Experience, Skills, Attributes, and Qualifications of the Trustees. The Governance and Nominating Committee has adopted a statement of policy that describes the experience, qualifications, attributes, and skills that are necessary and desirable for potential Independent Trustee candidates (Statement of Policy). The Board believes that each Trustee satisfied at the time he or she was initially elected or appointed a Trustee, and continues to satisfy, the standards contemplated by the Statement of Policy. The Governance and Nominating Committee also engages professional search firms to help identify potential Independent Trustee candidates who have the experience, qualifications, attributes, and skills consistent with the Statement of Policy. From time to time, additional criteria based on the composition and skills of the current Independent Trustees, as well as experience or skills that may be appropriate in light of future changes to board composition, business conditions, and regulatory or other developments, have also been considered by the professional search firms and the Governance and Nominating Committee. In addition, the Board takes into account the Trustees' commitment and participation in Board and committee meetings, as well as their leadership of standing and ad hoc committees throughout their tenure.
In determining that a particular Trustee was and continues to be qualified to serve as a Trustee, the Board has considered a variety of criteria, none of which, in isolation, was controlling. The Board believes that, collectively, the Trustees have balanced and diverse experience, qualifications, attributes, and skills, which allow the Board to operate effectively in governing the fund and protecting the interests of shareholders. Information about the specific experience, skills, attributes, and qualifications of each Trustee, which in each case led to the Board's conclusion that the Trustee should serve (or continue to serve) as a trustee of the fund, is provided below.
Board Structure and Oversight Function. Abigail P. Johnson is an interested person and currently serves as Chairman. The Trustees have determined that an interested Chairman is appropriate and benefits shareholders because an interested Chairman has a personal and professional stake in the quality and continuity of services provided to the fund. Independent Trustees exercise their informed business judgment to appoint an individual of their choosing to serve as Chairman, regardless of whether the Trustee happens to be independent or a member of management. The Independent Trustees have determined that they can act independently and effectively without having an Independent Trustee serve as Chairman and that a key structural component for assuring that they are in a position to do so is for the Independent Trustees to constitute a substantial majority for the Board. The Independent Trustees also regularly meet in executive session. Arthur E. Johnson serves as Chairman of the Independent Trustees and as such (i) acts as a liaison between the Independent Trustees and management with respect to matters important to the Independent Trustees and (ii) with management prepares agendas for Board meetings.
Fidelity® funds are overseen by different Boards of Trustees. The fund's Board oversees Fidelity's investment-grade bond, money market, asset allocation and certain equity funds, and other Boards oversee Fidelity's high income and other equity funds. The asset allocation funds may invest in Fidelity® funds that are overseen by such other Boards. The use of separate Boards, each with its own committee structure, allows the Trustees of each group of Fidelity® funds to focus on the unique issues of the funds they oversee, including common research, investment, and operational issues. On occasion, the separate Boards establish joint committees to address issues of overlapping consequences for the Fidelity® funds overseen by each Board.
The Trustees operate using a system of committees to facilitate the timely and efficient consideration of all matters of importance to the Trustees, the fund, and fund shareholders and to facilitate compliance with legal and regulatory requirements and oversight of the fund's activities and associated risks. The Board, acting through its committees, has charged FMR and its affiliates with (i) identifying events or circumstances the occurrence of which could have demonstrably adverse effects on the fund's business and/or reputation; (ii) implementing processes and controls to lessen the possibility that such events or circumstances occur or to mitigate the effects of such events or circumstances if they do occur; and (iii) creating and maintaining a system designed to evaluate continuously business and market conditions in order to facilitate the identification and implementation processes described in (i) and (ii) above. Because the day-to-day operations and activities of the fund are carried out by or through FMR, its affiliates, and other service providers, the fund's exposure to risks is mitigated but not eliminated by the processes overseen by the Trustees. While each of the Board's committees has responsibility for overseeing different aspects of the fund's activities, oversight is exercised primarily through the Operations and Audit Committees. In addition, an ad hoc Board committee of Independent Trustees has worked with FMR to enhance the Board's oversight of investment and financial risks, legal and regulatory risks, technology risks, and operational risks, including the development of additional risk reporting to the Board. Appropriate personnel, including but not limited to the fund's Chief Compliance Officer (CCO), FMR's internal auditor, the independent accountants, the fund's Treasurer and portfolio management personnel, make periodic reports to the Board's committees, as appropriate, including an annual review of Fidelity's risk management program for the Fidelity® funds. The responsibilities of each standing committee, including their oversight responsibilities, are described further under "Standing Committees of the Trustees."
Interested Trustees*:
Correspondence intended for a Trustee who is an interested person may be sent to Fidelity Investments, 245 Summer Street, Boston, Massachusetts 02210.
Name, Year of Birth; Principal Occupations and Other Relevant Experience+
Abigail P. Johnson (1961)
Year of Election or Appointment: 2009
Trustee
Chairman of the Board of Trustees
Ms. Johnson also serves as Trustee of other Fidelity® funds. Ms. Johnson serves as Chairman (2016-present), Chief Executive Officer (2014-present), and Director (2007-present) of FMR LLC (diversified financial services company), President of Fidelity Financial Services (2012-present) and President of Personal, Workplace and Institutional Services (2005-present). Ms. Johnson is Chairman and Director of FMR Co., Inc. (investment adviser firm, 2011-present) and Chairman and Director of FMR (investment adviser firm, 2011-present). Previously, Ms. Johnson served as Vice Chairman (2007-2016) and President (2013-2016) of FMR LLC, President and a Director of FMR (2001-2005), a Trustee of other investment companies advised by FMR, Fidelity Investments Money Management, Inc. (investment adviser firm), and FMR Co., Inc. (2001-2005), Senior Vice President of the Fidelity® funds (2001-2005), and managed a number of Fidelity® funds. Ms. Abigail P. Johnson and Mr. Arthur E. Johnson are not related.
Jennifer Toolin McAuliffe (1959)
Year of Election or Appointment: 2016
Trustee
Ms. McAuliffe also serves as Trustee of other Fidelity® funds. Ms. McAuliffe previously served as a Member of the Advisory Board of certain Fidelity® funds (2016) and as Co-Head of Fixed Income of Fidelity Investments Limited (now known as FIL Limited (FIL)) (diversified financial services company). Earlier roles at FIL included Director of Research for FIL’s credit and quantitative teams in London, Hong Kong and Tokyo. Ms. McAuliffe also was the Director of Research for taxable and municipal bonds at Fidelity Investments Money Management, Inc. Ms. McAuliffe is also a director or trustee of several not-for-profit entities.
* Determined to be an “Interested Trustee” by virtue of, among other things, his or her affiliation with the trust or various entities under common control with FMR.
+ The information includes the Trustee's principal occupation during the last five years and other information relating to the experience, attributes, and skills relevant to the Trustee's qualifications to serve as a Trustee, which led to the conclusion that the Trustee should serve as a Trustee for the fund.
Independent Trustees:
Correspondence intended for an Independent Trustee may be sent to Fidelity Investments, P.O. Box 55235, Boston, Massachusetts 02205-5235.
Name, Year of Birth; Principal Occupations and Other Relevant Experience+
Elizabeth S. Acton (1951)
Year of Election or Appointment: 2013
Trustee
Ms. Acton also serves as Trustee of other Fidelity® funds. Prior to her retirement in April 2012, Ms. Acton was Executive Vice President, Finance (2011-2012), Executive Vice President, Chief Financial Officer (2002-2011), and Treasurer (2004-2005) of Comerica Incorporated (financial services). Prior to joining Comerica, Ms. Acton held a variety of positions at Ford Motor Company (1983-2002), including Vice President and Treasurer (2000-2002) and Executive Vice President and Chief Financial Officer of Ford Motor Credit Company (1998-2000). Ms. Acton currently serves as a member of the Board of Directors and Audit and Finance Committees of Beazer Homes USA, Inc. (homebuilding, 2012-present). Previously, Ms. Acton served as a Member of the Advisory Board of certain Fidelity® funds (2013-2016).
Ann E. Dunwoody (1953)
Year of Election or Appointment: 2018
Trustee
General Dunwoody also serves as Trustee of other Fidelity® funds. General Dunwoody (United States Army, Retired) was the first woman in U.S. military history to achieve the rank of four-star general and prior to her retirement in 2012 held a variety of positions within the U.S. Army, including Commanding General, U.S. Army Material Command (2008-2012). She is the President of First to Four LLC (leadership and mentoring services, 2012-present). She also serves as a member of the Board of Directors and Nominating and Corporate Governance Committee of L3 Technologies, Inc. (communication, electronic, sensor, and aerospace systems, 2013-present), Board of Directors and Nomination and Corporate Governance Committees of Kforce Inc. (professional staffing services, 2016-present) and Board of Directors of Automattic Inc. (software engineering, 2018-present). Previously, General Dunwoody served as a Member of the Advisory Board of certain Fidelity® funds (2018), a member of the Board of Directors and Audit and Sustainability and Corporate Responsibility Committees of Republic Services, Inc. (waste collection, disposal and recycling, 2013-2016). Ms. Dunwoody also serves on several boards for non-profit organizations, including as a member of the Board of Directors, Chair of the Nomination and Governance Committee and member of the Audit Committee of Logistics Management Institute (consulting non-profit, 2012-present), a member of the Board of Directors of the Army Historical Foundation (2015-present), a member of the Council of Trustees for the Association of the United States Army (advocacy non-profit, 2013-present) and a member of the Board of Trustees of Florida Institute of Technology (2015-present) and ThanksUSA (military family education non-profit, 2014-present).
John Engler (1948)
Year of Election or Appointment: 2014
Trustee
Mr. Engler also serves as Trustee of other Fidelity® funds. He serves on the board of directors for Universal Forest Products (manufacturer and distributor of wood and wood-alternative products, 2003-present) and K12 Inc. (technology-based education company, 2012-present). Previously, Mr. Engler served as interim president of Michigan State University (2018-2019), a Member of the Advisory Board of certain Fidelity® funds (2014-2016), president of the Business Roundtable (2011-2017), a trustee of The Munder Funds (2003-2014), president and CEO of the National Association of Manufacturers (2004-2011), member of the Board of Trustees of the Annie E. Casey Foundation (2004-2015), and as governor of Michigan (1991-2003). He is a past chairman of the National Governors Association.
Robert F. Gartland (1951)
Year of Election or Appointment: 2010
Trustee
Mr. Gartland also serves as Trustee of other Fidelity® funds. Mr. Gartland is Chairman and an investor in Gartland & Mellina Group Corp. (consulting, 2009-present). Previously, Mr. Gartland served as a partner and investor of Vietnam Partners LLC (investments and consulting, 2008-2011). Prior to his retirement, Mr. Gartland held a variety of positions at Morgan Stanley (financial services, 1979-2007), including Managing Director (1987-2007), and Chase Manhattan Bank (1975-1978).
Arthur E. Johnson (1947)
Year of Election or Appointment: 2008
Trustee
Chairman of the Independent Trustees
Mr. Johnson also serves as Trustee of other Fidelity® funds. Mr. Johnson serves as a member of the Board of Directors of Eaton Corporation plc (diversified power management, 2009-present) and Booz Allen Hamilton (management consulting, 2011-present). Prior to his retirement, Mr. Johnson served as Senior Vice President of Corporate Strategic Development of Lockheed Martin Corporation (defense contractor, 1999-2009). He previously served on the Board of Directors of IKON Office Solutions, Inc. (1999-2008), AGL Resources, Inc. (holding company, 2002-2016), and Delta Airlines (2005-2007). Mr. Arthur E. Johnson is not related to Ms. Abigail P. Johnson.
Michael E. Kenneally (1954)
Year of Election or Appointment: 2009
Trustee
Vice Chairman of the Independent Trustees
Mr. Kenneally also serves as Trustee of other Fidelity® funds. Prior to his retirement, Mr. Kenneally served as Chairman and Global Chief Executive Officer of Credit Suisse Asset Management. Before joining Credit Suisse, he was an Executive Vice President and Chief Investment Officer for Bank of America Corporation. Earlier roles at Bank of America included Director of Research, Senior Portfolio Manager and Research Analyst, and Mr. Kenneally was awarded the Chartered Financial Analyst (CFA) designation in 1991.
Marie L. Knowles (1946)
Year of Election or Appointment: 2001
Trustee
Ms. Knowles also serves as Trustee of other Fidelity® funds. Prior to Ms. Knowles' retirement in June 2000, she served as Executive Vice President and Chief Financial Officer of Atlantic Richfield Company (ARCO) (diversified energy, 1996-2000). From 1993 to 1996, she was a Senior Vice President of ARCO and President of ARCO Transportation Company (pipeline and tanker operations). Ms. Knowles currently serves as a Director and Chairman of the Audit Committee of McKesson Corporation (healthcare service, since 2002). Ms. Knowles is a member of the Board of the Santa Catalina Island Company (real estate, 2009-present). Ms. Knowles is a Member of the Investment Company Institute Board of Governors and a Member of the Governing Council of the Independent Directors Council (2014-present). She also serves as a member of the Advisory Board for the School of Engineering of the University of Southern California. Previously, Ms. Knowles served as a Director of Phelps Dodge Corporation (copper mining and manufacturing, 1994-2007), URS Corporation (engineering and construction, 2000-2003) and America West (airline, 1999-2002). Ms. Knowles previously served as Chairman (2015-2018) and Vice Chairman (2012-2015) of the Independent Trustees of certain Fidelity® funds.
Mark A. Murray (1954)
Year of Election or Appointment: 2016
Trustee
Mr. Murray also serves as Trustee of other Fidelity® funds. Mr. Murray is Vice Chairman (2013-present) of Meijer, Inc. (regional retail chain). Previously, Mr. Murray served as a Member of the Advisory Board of certain Fidelity® funds (2016) and as Co-Chief Executive Officer (2013-2016) and President (2006-2013) of Meijer, Inc. Mr. Murray serves as a member of the Board of Directors and Nuclear Review and Public Policy and Responsibility Committees of DTE Energy Company (diversified energy company, 2009-present). Mr. Murray also serves as a member of the Board of Directors of Spectrum Health (not-for-profit health system, 2015-present). Mr. Murray previously served as President of Grand Valley State University (2001-2006), Treasurer for the State of Michigan (1999-2001), Vice President of Finance and Administration for Michigan State University (1998-1999), and a member of the Board of Directors and Audit Committee and Chairman of the Nominating and Corporate Governance Committee of Universal Forest Products, Inc. (manufacturer and distributor of wood and wood-alternative products, 2004-2016). Mr. Murray is also a director or trustee of many community and professional organizations.
+ The information includes the Trustee's principal occupation during the last five years and other information relating to the experience, attributes, and skills relevant to the Trustee's qualifications to serve as a Trustee, which led to the conclusion that the Trustee should serve as a Trustee for the fund.
Advisory Board Members and Officers:
Correspondence intended for an officer may be sent to Fidelity Investments, 245 Summer Street, Boston, Massachusetts 02210. Officers appear below in alphabetical order.
Name, Year of Birth; Principal Occupation
Elizabeth Paige Baumann (1968)
Year of Election or Appointment: 2017
Anti-Money Laundering (AML) Officer
Ms. Baumann also serves as AML Officer of other funds. She is Chief AML Officer (2012-present) and Senior Vice President (2014-present) of FMR LLC (diversified financial services company) and is an employee of Fidelity Investments. Previously, Ms. Baumann served as AML Officer of the funds (2012-2016), and Vice President (2007-2014) and Deputy Anti-Money Laundering Officer (2007-2012) of FMR LLC.
Craig S. Brown (1977)
Year of Election or Appointment: 2019
Assistant Treasurer
Mr. Brown also serves as Assistant Treasurer of other funds. Mr. Brown is an employee of Fidelity Investments (2013-present).
John J. Burke III (1964)
Year of Election or Appointment: 2018
Chief Financial Officer
Mr. Burke also serves as Chief Financial Officer of other funds. Mr. Burke serves as Head of Investment Operations for Fidelity Fund and Investment Operations (2018-present) and is an employee of Fidelity Investments (1998-present). Previously Mr. Burke served as head of Asset Management Investment Operations (2012-2018).
William C. Coffey (1969)
Year of Election or Appointment: 2018
Secretary and Chief Legal Officer (CLO)
Mr. Coffey also serves as Secretary and CLO of other funds. Mr. Coffey serves as CLO, Secretary, and Senior Vice President of Fidelity Management & Research Company and FMR Co., Inc. (investment adviser firms, 2018-present); Secretary of Fidelity SelectCo, LLC and Fidelity Investments Money Management, Inc. (investment adviser firms, 2018-present); and CLO of Fidelity Management & Research (Hong Kong) Limited, FMR Investment Management (UK) Limited, and Fidelity Management & Research (Japan) Limited (investment adviser firms, 2018-present). He is Senior Vice President and Deputy General Counsel of FMR LLC (diversified financial services company, 2010-present), and is an employee of Fidelity Investments. Previously, Mr. Coffey served as Assistant Secretary of certain funds (2009-2018) and as Vice President and Associate General Counsel of FMR LLC (2005-2009).
Jonathan Davis (1968)
Year of Election or Appointment: 2010
Assistant Treasurer
Mr. Davis also serves as Assistant Treasurer of other funds. Mr. Davis serves as Assistant Treasurer of FMR Capital, Inc. (2017-present) and is an employee of Fidelity Investments. Previously, Mr. Davis served as Vice President and Associate General Counsel of FMR LLC (diversified financial services company, 2003-2010).
Adrien E. Deberghes (1967)
Year of Election or Appointment: 2010
Assistant Treasurer
Mr. Deberghes also serves as an officer of other funds. He serves as Assistant Treasurer of FMR Capital, Inc. (2017-present), Executive Vice President of Fidelity Investments Money Management, Inc. (FIMM) (investment adviser firm, 2016-present), and is an employee of Fidelity Investments (2008-present). Previously, Mr. Deberghes served as President and Treasurer of certain Fidelity® funds (2013-2018). Prior to joining Fidelity Investments, Mr. Deberghes was Senior Vice President of Mutual Fund Administration at State Street Corporation (2007-2008), Senior Director of Mutual Fund Administration at Investors Bank & Trust (2005-2007), and Director of Finance for Dunkin' Brands (2000-2005). Previously, Mr. Deberghes served in other fund officer roles.
Laura M. Del Prato (1964)
Year of Election or Appointment: 2018
President and Treasurer
Ms. Del Prato also serves as an officer of other funds. Ms. Del Prato is an employee of Fidelity Investments (2017-present). Prior to joining Fidelity Investments, Ms. Del Prato served as a Managing Director and Treasurer of the JPMorgan Mutual Funds (2014-2017). Prior to JPMorgan, Ms. Del Prato served as a partner at Cohen Fund Audit Services (accounting firm, 2012-2013) and KPMG LLP (accounting firm, 2004-2012).
Colm A. Hogan (1973)
Year of Election or Appointment: 2016
Assistant Treasurer
Mr. Hogan also serves as an officer of other funds. Mr. Hogan serves as Assistant Treasurer of FMR Capital, Inc. (2017-present) and is an employee of Fidelity Investments (2005-present). Previously, Mr. Hogan served as Assistant Treasurer of certain Fidelity® funds (2016-2018).
Chris Maher (1972)
Year of Election or Appointment: 2013
Assistant Treasurer
Mr. Maher serves as Assistant Treasurer of other funds. Mr. Maher is Vice President of Valuation Oversight, serves as Assistant Treasurer of FMR Capital, Inc. (2017-present), and is an employee of Fidelity Investments. Previously, Mr. Maher served as Vice President of Asset Management Compliance (2013), Vice President of the Program Management Group of FMR (investment adviser firm, 2010-2013), and Vice President of Valuation Oversight (2008-2010).
John B. McGinty, Jr. (1962)
Year of Election or Appointment: 2016
Chief Compliance Officer
Mr. McGinty also serves as Chief Compliance Officer of other funds. Mr. McGinty is Senior Vice President of Asset Management Compliance for Fidelity Investments and is an employee of Fidelity Investments (2016-present). Mr. McGinty previously served as Vice President, Senior Attorney at Eaton Vance Management (investment management firm, 2015-2016), and prior to Eaton Vance as global CCO for all firm operations and registered investment companies at GMO LLC (investment management firm, 2009-2015). Before joining GMO LLC, Mr. McGinty served as Senior Vice President, Deputy General Counsel for Fidelity Investments (2007-2009).
Jason P. Pogorelec (1975)
Year of Election or Appointment: 2015
Assistant Secretary
Mr. Pogorelec also serves as Assistant Secretary of other funds. Mr. Pogorelec serves as Vice President, Associate General Counsel (2010-present) and is an employee of Fidelity Investments (2006-present).
Nancy D. Prior (1967)
Year of Election or Appointment: 2014
Vice President
Ms. Prior also serves as Vice President of other funds. Ms. Prior serves as President Fixed Income, High Income/Emerging Market Debt and Multi Asset Class Strategies of FIAM LLC (2018-present), President (2016-present) and Director (2014-present) of Fidelity Investments Money Management, Inc. (FIMM) (investment adviser firm), President, Fixed Income (2014-present), and is an employee of Fidelity Investments (2002-present). Previously, Ms. Prior served as Vice Chairman of FIAM LLC (investment adviser firm, 2014-2018), a Director of FMR Investment Management (UK) Limited (investment adviser firm, 2015-2018), President Multi-Asset Class Strategies of FMR's Global Asset Allocation Division (2017-2018), Vice President of Fidelity's Money Market Funds (2012-2014), President, Money Market and Short Duration Bond Group of Fidelity Management & Research (FMR) (investment adviser firm, 2013-2014), President, Money Market Group of FMR (2011-2013), Managing Director of Research (2009-2011), Senior Vice President and Deputy General Counsel (2007-2009), and Assistant Secretary of certain Fidelity® funds (2008-2009).
Stacie M. Smith (1974)
Year of Election or Appointment: 2013
Assistant Treasurer
Ms. Smith also serves as an officer of other funds. Ms. Smith serves as Assistant Treasurer of FMR Capital, Inc. (2017-present), is an employee of Fidelity Investments (2009-present), and has served in other fund officer roles. Prior to joining Fidelity Investments, Ms. Smith served as Senior Audit Manager of Ernst & Young LLP (accounting firm, 1996-2009). Previously, Ms. Smith served as Assistant Treasurer (2013-2018) and Deputy Treasurer (2013-2016) of certain Fidelity® funds.
Marc L. Spector (1972)
Year of Election or Appointment: 2016
Deputy Treasurer
Mr. Spector also serves as an officer of other funds. Mr. Spector serves as Assistant Treasurer of FMR Capital, Inc. (2017-present) and is an employee of Fidelity Investments (2016-present). Prior to joining Fidelity Investments, Mr. Spector served as Director at the Siegfried Group (accounting firm, 2013-2016), and prior to Siegfried Group as audit senior manager at Deloitte & Touche (accounting firm, 2005-2013).
Jim Wegmann (1979)
Year of Election or Appointment: 2019
Assistant Treasurer
Mr. Wegmann also serves as Assistant Treasurer of other funds. Mr. Wegmann is an employee of Fidelity Investments (2011-present).
Shareholder Expense Example
As a shareholder of the Fund, you incur two types of costs: (1) transaction costs and (2) ongoing costs, including management fees, distribution and/or service (12b-1) fees and other Fund expenses. This Example is intended to help you understand your ongoing costs (in dollars) of investing in the Fund and to compare these costs with the ongoing costs of investing in other mutual funds.
The Example is based on an investment of $1,000 invested at the beginning of the period and held for the entire period (July 1, 2018 to December 31, 2018).
Actual Expenses
The first line of the accompanying table for each class of the Fund provides information about actual account values and actual expenses. You may use the information in this line, together with the amount you invested, to estimate the expenses that you paid over the period. Simply divide your account value by $1,000.00 (for example, an $8,600 account value divided by $1,000.00 = 8.6), then multiply the result by the number in the first line for a class of the Fund under the heading entitled "Expenses Paid During Period" to estimate the expenses you paid on your account during this period. The estimate of expenses does not include any fees or other expenses of any variable annuity or variable life insurance product. If they were, the estimate of expenses you paid during the period would be higher, and your ending account value would be lower. In addition, the Fund, as a shareholder in the underlying Fidelity Central Funds, will indirectly bear its pro-rata share of the fees and expenses incurred by the underlying Fidelity Central Funds. These fees and expenses are not included in the Fund's annualized expense ratio used to calculate the expense estimate in the table below.
Hypothetical Example for Comparison Purposes
The second line of the accompanying table for each class of the Fund provides information about hypothetical account values and hypothetical expenses based on a Class' actual expense ratio and an assumed rate of return of 5% per year before expenses, which is not the Class' actual return. The hypothetical account values and expenses may not be used to estimate the actual ending account balance or expenses you paid for the period. You may use this information to compare the ongoing costs of investing in the Fund and other funds. To do so, compare this 5% hypothetical example with the 5% hypothetical examples that appear in the shareholder reports of the other funds. The estimate of expenses does not include any fees or other expenses of any variable annuity or variable life insurance product. If they were, the estimate of expenses you paid during the period would be higher, and your ending account value would be lower. In addition, the Fund, as a shareholder in the underlying Fidelity Central Funds, will indirectly bear its pro-rata share of the fees and expenses incurred by the underlying Fidelity Central Funds. These fees and expenses are not included in the Fund's annualized expense ratio used to calculate the expense estimate in the table below.
Please note that the expenses shown in the table are meant to highlight your ongoing costs only and do not reflect any transaction costs. Therefore, the second line of the table is useful in comparing ongoing costs only, and will not help you determine the relative total costs of owning different funds.
| | Annualized Expense Ratio-A | Beginning
Account Value
July 1, 2018 | Ending
Account Value
December 31, 2018 | Expenses Paid
During Period-B
July 1, 2018
to December 31, 2018 |
| Initial Class | .14% | | | |
| Actual | | $1,000.00 | $1,016.00 | $.71 |
| Hypothetical-C | | $1,000.00 | $1,024.50 | $.71 |
| Service Class 2 | .39% | | | |
| Actual | | $1,000.00 | $1,014.20 | $1.98 |
| Hypothetical-C | | $1,000.00 | $1,023.24 | $1.99 |
A Annualized expense ratio reflects expenses net of applicable fee waivers.
B Expenses are equal to each Class' annualized expense ratio, multiplied by the average account value over the period, multiplied by 184/365 (to reflect the one-half year period).
C 5% return per year before expenses
Distributions (Unaudited)
A total of 38.9074% of the dividends distributed during the fiscal year was derived from interest on U.S. Government securities which is generally exempt from state income tax.
VUSB-ANN-0219
1.9887310.100
Item 2.
Code of Ethics
As of the end of the period, December 31, 2018, Variable Insurance Products Fund V (the trust) has adopted a code of ethics, as defined in Item 2 of Form N-CSR, that applies to its President and Treasurer and its Chief Financial Officer. A copy of the code of ethics is filed as an exhibit to this Form N-CSR.
Item 3.
Audit Committee Financial Expert
The Board of Trustees of the trust has determined that Elizabeth S. Acton is an audit committee financial expert, as defined in Item 3 of Form N-CSR. Ms. Acton is independent for purposes of Item 3 of Form N-CSR.
Item 4.
Principal Accountant Fees and Services
Fees and Services
The following table presents fees billed by Deloitte & Touche LLP, the member firms of Deloitte Touche Tohmatsu, and their respective affiliates (collectively, “Deloitte Entities”) in each of the last two fiscal years for services rendered to VIP Asset Manager Growth Portfolio, VIP Asset Manager Portfolio, VIP Bond Index Portfolio, VIP Freedom 2005 Portfolio, VIP Freedom 2010 Portfolio, VIP Freedom 2015 Portfolio, VIP Freedom 2020 Portfolio, VIP Freedom 2025 Portfolio, VIP Freedom 2030 Portfolio, VIP Freedom 2035 Portfolio, VIP Freedom 2040 Portfolio, VIP Freedom 2045 Portfolio, VIP Freedom 2050 Portfolio, VIP Freedom Income Portfolio, VIP Freedom Lifetime Income I Portfolio, VIP Freedom Lifetime Income II Portfolio, VIP Freedom Lifetime Income III Portfolio and VIP Investment Grade Bond Portfolio (the “Funds”):
Services Billed by Deloitte Entities
December 31, 2018 FeesA,B
| | | | |
| Audit Fees | Audit-Related Fees | Tax Fees | All Other Fees |
VIP Asset Manager Growth Portfolio | $40,000 | $100 | $5,300 | $1,100 |
VIP Asset Manager Portfolio | $42,000 | $100 | $7,700 | $1,200 |
VIP Bond Index Portfolio | $62,000 | $100 | $6,100 | $1,200 |
VIP Freedom 2005 Portfolio | $20,000 | $- | $5,000 | $600 |
VIP Freedom 2010 Portfolio | $20,000 | $- | $5,000 | $600 |
VIP Freedom 2015 Portfolio | $20,000 | $- | $5,000 | $600 |
VIP Freedom 2020 Portfolio | $20,000 | $- | $5,000 | $600 |
VIP Freedom 2025 Portfolio | $20,000 | $- | $5,000 | $600 |
VIP Freedom 2030 Portfolio | $20,000 | $- | $5,000 | $600 |
VIP Freedom 2035 Portfolio | $20,000 | $- | $5,000 | $600 |
VIP Freedom 2040 Portfolio | $20,000 | $- | $5,000 | $600 |
VIP Freedom 2045 Portfolio | $20,000 | $- | $5,000 | $600 |
VIP Freedom 2050 Portfolio | $20,000 | $- | $5,000 | $600 |
VIP Freedom Income Portfolio | $20,000 | $- | $5,000 | $600 |
VIP Freedom Lifetime Income I Portfolio | $17,000 | $- | $5,000 | $600 |
VIP Freedom Lifetime Income II Portfolio | $17,000 | $- | $5,000 | $600 |
VIP Freedom Lifetime Income III Portfolio | $17,000 | $- | $5,000 | $600 |
VIP Investment Grade Bond Portfolio | $40,000 | $100 | $6,500 | $1,200 |
December 31, 2017 FeesA,B
| | | | |
| Audit Fees | Audit-Related Fees | Tax Fees | All Other Fees |
VIP Asset Manager Growth Portfolio | $36,000 | $100 | $5,600 | $1,000 |
VIP Asset Manager Portfolio | $38,000 | $100 | $7,900 | $1,100 |
VIP Bond Index Portfolio | $- | $- | $- | $- |
VIP Freedom 2005 Portfolio | $22,000 | $- | $5,100 | $700 |
VIP Freedom 2010 Portfolio | $22,000 | $- | $5,100 | $700 |
VIP Freedom 2015 Portfolio | $22,000 | $- | $5,100 | $700 |
VIP Freedom 2020 Portfolio | $22,000 | $- | $5,100 | $700 |
VIP Freedom 2025 Portfolio | $22,000 | $- | $5,100 | $700 |
VIP Freedom 2030 Portfolio | $22,000 | $- | $5,100 | $700 |
VIP Freedom 2035 Portfolio | $22,000 | $- | $5,100 | $700 |
VIP Freedom 2040 Portfolio | $22,000 | $- | $5,100 | $700 |
VIP Freedom 2045 Portfolio | $22,000 | $- | $5,100 | $700 |
VIP Freedom 2050 Portfolio | $22,000 | $- | $5,100 | $700 |
VIP Freedom Income Portfolio | $22,000 | $- | $5,100 | $700 |
VIP Freedom Lifetime Income I Portfolio | $23,000 | $- | $5,100 | $700 |
VIP Freedom Lifetime Income II Portfolio | $23,000 | $- | $5,100 | $700 |
VIP Freedom Lifetime Income III Portfolio | $23,000 | $- | $5,100 | $700 |
VIP Investment Grade Bond Portfolio | $40,000 | $100 | $6,600 | $1,200 |
AAmounts may reflect rounding.
BVIP Bond Index Portfolio commenced operations on April 19, 2018.
The following table presents fees billed by PricewaterhouseCoopers LLP (“PwC”) in each of the last two fiscal years for services rendered to VIP FundsManager 20% Portfolio, VIP FundsManager 50% Portfolio, VIP FundsManager 60% Portfolio, VIP FundsManager 70% Portfolio, VIP FundsManager 85% Portfolio, VIP Investor Freedom 2005 Portfolio, VIP Investor Freedom 2010 Portfolio, VIP Investor Freedom 2015 Portfolio, VIP Investor Freedom 2020 Portfolio, VIP Investor Freedom 2025 Portfolio, VIP Investor Freedom 2030 Portfolio, VIP Investor Freedom Income Portfolio, VIP Strategic Income Portfolio and VIP Target Volatility Portfolio (the “Funds”):
Services Billed by PwC
December 31, 2018 FeesA
| | | | |
| Audit Fees | Audit-Related Fees | Tax Fees | All Other Fees |
VIP FundsManager 20% Portfolio | $29,000 | $2,500 | $2,600 | $1,500 |
VIP FundsManager 50% Portfolio | $29,000 | $2,500 | $2,600 | $1,500 |
VIP FundsManager 60% Portfolio | $29,000 | $2,500 | $2,600 | $1,500 |
VIP FundsManager 70% Portfolio | $29,000 | $2,500 | $2,600 | $1,500 |
VIP FundsManager 85% Portfolio | $29,000 | $2,500 | $2,600 | $1,500 |
VIP Investor Freedom 2005 Portfolio | $19,000 | $1,700 | $2,800 | $1,000 |
VIP Investor Freedom 2010 Portfolio | $19,000 | $1,700 | $2,800 | $1,000 |
VIP Investor Freedom 2015 Portfolio | $19,000 | $1,700 | $2,800 | $1,000 |
VIP Investor Freedom 2020 Portfolio | $19,000 | $1,700 | $2,800 | $1,000 |
VIP Investor Freedom 2025 Portfolio | $19,000 | $1,700 | $2,800 | $1,000 |
VIP Investor Freedom 2030 Portfolio | $19,000 | $1,700 | $2,800 | $1,000 |
VIP Investor Freedom Income Portfolio | $19,000 | $1,700 | $2,800 | $1,000 |
VIP Strategic Income Portfolio | $99,000 | $8,200 | $3,500 | $4,700 |
VIP Target Volatility Portfolio | $30,000 | $2,700 | $3,000 | $1,500 |
| | | | |
| Audit Fees | Audit-Related Fees | Tax Fees | All Other Fees |
VIP FundsManager 20% Portfolio | $28,000 | $2,600 | $2,800 | $1,300 |
VIP FundsManager 50% Portfolio | $28,000 | $2,600 | $2,800 | $1,300 |
VIP FundsManager 60% Portfolio | $28,000 | $2,600 | $2,800 | $1,300 |
VIP FundsManager 70% Portfolio | $28,000 | $2,600 | $2,800 | $1,300 |
VIP FundsManager 85% Portfolio | $28,000 | $2,600 | $2,800 | $1,300 |
VIP Investor Freedom 2005 Portfolio | $18,000 | $1,800 | $3,000 | $900 |
VIP Investor Freedom 2010 Portfolio | $18,000 | $1,800 | $3,000 | $900 |
VIP Investor Freedom 2015 Portfolio | $18,000 | $1,800 | $3,000 | $900 |
VIP Investor Freedom 2020 Portfolio | $18,000 | $1,800 | $3,000 | $900 |
VIP Investor Freedom 2025 Portfolio | $18,000 | $1,800 | $3,000 | $900 |
VIP Investor Freedom 2030 Portfolio | $18,000 | $1,800 | $3,000 | $900 |
VIP Investor Freedom Income Portfolio | $18,000 | $1,800 | $3,000 | $900 |
VIP Strategic Income Portfolio | $79,000 | $7,100 | $3,900 | $3,600 |
VIP Target Volatility Portfolio | $30,000 | $2,800 | $3,300 | $1,400 |
AAmounts may reflect rounding.
The following table presents fees billed by PwC and Deloitte Entities that were required to be approved by the Audit Committee for services that relate directly to the operations and financial reporting of the Funds and that are rendered on behalf of Fidelity Management & Research Company (“FMR”) and entities controlling, controlled by, or under common control with FMR (not including any sub-adviser whose role is primarily portfolio management and is subcontracted with or overseen by another investment adviser) that provide ongoing services to the Funds (“Fund Service Providers”):
Services Billed by Deloitte Entities
| | |
| December 31, 2018A,B | December 31, 2017A,B |
Audit-Related Fees | $290,000 | $- |
Tax Fees | $5,000 | $25,000 |
All Other Fees | $- | $- |
A Amounts may reflect rounding.
BMay include amounts billed prior to the VIP Bond Index Portfolio’s commencement of operations.
Services Billed by PwC
| | |
| December 31, 2018A | December 31, 2017A |
Audit-Related Fees | $7,930,000 | $8,470,000 |
Tax Fees | $20,000 | $160,000 |
All Other Fees | $- | $- |
A Amounts may reflect rounding.
“Audit-Related Fees” represent fees billed for assurance and related services that are reasonably related to the performance of the fund audit or the review of the fund's financial statements and that are not reported under Audit Fees.
“Tax Fees” represent fees billed for tax compliance, tax advice or tax planning that relate directly to the operations and financial reporting of the fund.
“All Other Fees” represent fees billed for services provided to the fund or Fund Service Provider, a significant portion of which are assurance related, that relate directly to the operations and financial reporting of the fund, excluding those services that are reported under Audit Fees, Audit-Related Fees or Tax Fees.
Assurance services must be performed by an independent public accountant.
* * *
The aggregate non-audit fees billed by PwC and Deloitte Entities for services rendered to the Funds, FMR (not including any sub-adviser whose role is primarily portfolio management and is subcontracted with or overseen by another investment adviser), and any Fund Service Provider for each of the last two fiscal years of the Funds are as follows:
| | |
Billed By | December 31, 2018A,B | December 31, 2017A,B |
Deloitte Entities | $865,000 | $410,000 |
PwC | $11,220,000 | $10,810,000 |
A Amounts may reflect rounding.
BMay include amounts billed prior to the VIP Bond Index Portfolio’s commencement of operations.
The trust's Audit Committee has considered non-audit services that were not pre-approved that were provided by PwC and Deloitte Entities to Fund Service Providers to be compatible with maintaining the independence of PwC and Deloitte Entities in their audits of the Funds, taking into account representations from PwC and Deloitte Entities, in accordance with Public Company Accounting Oversight Board rules, regarding their independence from the Funds and their related entities and FMR’s review of the appropriateness and permissibility under applicable law of such non-audit services prior to their provision to the Fund Service Providers.
Audit Committee Pre-Approval Policies and Procedures
The trust’s Audit Committee must pre-approve all audit and non-audit services provided by a fund’s independent registered public accounting firm relating to the operations or financial reporting of the fund. Prior to the commencement of any audit or non-audit services to a fund, the Audit Committee reviews the services to determine whether they are appropriate and permissible under applicable law.
The Audit Committee has adopted policies and procedures to, among other purposes, provide a framework for the Committee’s consideration of non-audit services by the audit firms that audit the Fidelity funds. The policies and procedures require that any non-audit service provided by a fund audit firm to a Fidelity fund and any non-audit service provided by a fund auditor to a Fund Service Provider that relates directly to the operations and financial reporting of a Fidelity fund (“Covered Service”) are subject to approval by the Audit Committee before such service is provided.
All Covered Services must be approved in advance of provision of the service either: (i) by formal resolution of the Audit Committee, or (ii) by oral or written approval of the service by the Chair of the Audit Committee (or if the Chair is unavailable, such other member of the Audit Committee as may be designated by the Chair to act in the Chair’s absence). The approval contemplated by (ii) above is permitted where the Treasurer determines that action on such an engagement is necessary before the next meeting of the Audit Committee.
Non-audit services provided by a fund audit firm to a Fund Service Provider that do not relate directly to the operations and financial reporting of a Fidelity fund are reported to the Audit Committee periodically.
Non-Audit Services Approved Pursuant to Rule 2-01(c)(7)(i)(C) and (ii) of Regulation S-X (“De Minimis Exception”)
There were no non-audit services approved or required to be approved by the Audit Committee pursuant to the De Minimis Exception during the Funds’ last two fiscal years relating to services provided to (i) the Funds or (ii) any Fund Service Provider that relate directly to the operations and financial reporting of the Funds.
Item 5.
Audit Committee of Listed Registrants
Not applicable.
Item 6.
Investments
(a)
Not applicable.
(b)
Not applicable
Item 7.
Disclosure of Proxy Voting Policies and Procedures for Closed-End Management Investment Companies
Not applicable.
Item 8.
Portfolio Managers of Closed-End Management Investment Companies
Not applicable.
Item 9.
Purchase of Equity Securities by Closed-End Management Investment Company and Affiliated Purchasers
Not applicable.
Item 10.
Submission of Matters to a Vote of Security Holders
There were no material changes to the procedures by which shareholders may recommend nominees to the trust’s Board of Trustees.
Item 11.
Controls and Procedures
(a)(i) The President and Treasurer and the Chief Financial Officer have concluded that the disclosure controls and procedures (as defined in Rule 30a-3(c) under the Investment Company Act) for each Fund provide reasonable assurances that material information relating to such Fund is made known to them by the appropriate persons, based on their evaluation of these controls and procedures as of a date within 90 days of the filing date of this report.
(a)(ii) There was no change in a Fund’s internal control over financial reporting (as defined in Rule 30a-3(d) under the Investment Company Act) that occurred during the period covered by this report that has materially affected, or is reasonably likely to materially affect, a Fund’s internal control over financial reporting.
Item 12.
Disclosure of Securities Lending Activities for Closed-End Management
Investment Companies
Not applicable.
Item 13.
Exhibits
| | |
(a) | (1) | Code of Ethics pursuant to Item 2 of Form N-CSR is filed and attached hereto as EX-99.CODE ETH. |
(a) | (2) | Certification pursuant to Rule 30a-2(a) under the Investment Company Act of 1940 (17 CFR 270.30a-2(a)) is filed and attached hereto as Exhibit 99.CERT. |
(a) | (3) | Not applicable. |
(b) | | Certification pursuant to Rule 30a-2(b) under the Investment Company Act of 1940 (17 CFR 270.30a-2(b)) is furnished and attached hereto as Exhibit 99.906CERT. |
SIGNATURES
Pursuant to the requirements of the Securities Exchange Act of 1934 and the Investment Company Act of 1940, the registrant has duly caused this report to be signed on its behalf by the undersigned, thereunto duly authorized.
Variable Insurance Products Fund V
| |
By: | /s/Laura M. Del Prato |
| Laura M. Del Prato |
| President and Treasurer |
| |
Date: | February 25, 2019 |
Pursuant to the requirements of the Securities Exchange Act of 1934 and the Investment Company Act of 1940, this report has been signed below by the following persons on behalf of the registrant and in the capacities and on the dates indicated.
| |
By: | /s/Laura M. Del Prato |
| Laura M. Del Prato |
| President and Treasurer |
| |
Date: | February 25, 2019 |
| |
By: | /s/John J. Burke III |
| John J. Burke III |
| Chief Financial Officer |
| |
Date: | February 25, 2019 |